| | | | |
| | | | OMB APPROVAL |
| | | | OMB Number: 3235-0570 Expires: July 31, 2017 Estimated average burden hours per response: 20.6 |
UNITED STATES
SECURITIES AND EXCHANGE COMMISSION
Washington, D.C. 20549
FORM N-CSR
CERTIFIED SHAREHOLDER REPORT OF REGISTERED
MANAGEMENT INVESTMENT COMPANIES
Investment Company Act file number 811-03826
AIM Sector Funds (Invesco Sector Funds)
(Exact name of registrant as specified in charter)
11 Greenway Plaza, Suite 1000 Houston, Texas 77046
(Address of principal executive offices) (Zip code)
Sheri Morris 11 Greenway Plaza, Suite 1000 Houston, Texas 77046
(Name and address of agent for service)
Registrant’s telephone number, including area code: (713) 626-1919
Date of fiscal year end: 4/30
Date of reporting period: 04/30/17
Item 1. Report to Stockholders.
| | | | |
| | |
 | | Annual Report to Shareholders | | April 30, 2017 |
| | |
| | Invesco American Value Fund |
| | Nasdaq: |
| | A: MSAVX ∎ B: MGAVX ∎ C: MSVCX ∎ R: MSARX ∎ Y: MSAIX ∎ R5: MSAJX ∎ R6: MSAFX |
|
 |
Letters to Shareholders
| | | | |

Philip Taylor | | | | Dear Shareholders: This annual report includes information about your Fund, including performance data and a complete list of its investments as of the close of the reporting period. Inside is a discussion of how your Fund was managed and the factors that affected its performance during the reporting period. The reporting period began with stock market volatility in the US and abroad, largely the result of uncertainty about global economic growth and monetary policy. Markets declined sharply following UK voters’ decision in June to leave the European Union. Relatively quickly, however, markets recovered, reaching record highs later in the summer. Demand was strong for income-producing investments, particularly those perceived to be lower risk; this benefited bonds as well as dividend-paying stocks for much of the reporting period. While economic news in the US was generally positive during the reporting period, news overseas was less upbeat. The European Central Bank and central banks in China and Japan – as well as other countries – maintained |
extraordinarily accommodative monetary policies in response to economic weakness. After months of uncertainty, the outcome of the US presidential election in November triggered a major stock market rally, with most market indexes repeatedly reaching new highs through February. As expected, the US Federal Reserve (the Fed) raised interest rates in December 2016 and again in March 2017. In its March statement, the Fed noted that the labor market has strengthened and economic activity has expanded at a moderate pace – and that it expects those trends to continue.
Short-term market volatility can prompt some investors to abandon their investment plans – and can cause others to settle for whatever returns the market has to offer. The investment professionals at Invesco, in contrast, invest with high conviction. This means that, no matter the asset class or the strategy, each investment team has a passion to exceed. We want to help investors achieve better outcomes, such as seeking higher returns, helping mitigate risk and generating income. Of course, investing with high conviction can’t guarantee a profit or ensure success; no investment strategy can. To learn more about how we invest with high conviction, visit invesco.com/HighConviction.
You, too, can invest with high conviction by maintaining a long-term investment perspective and by working with your financial adviser on a regular basis. During periods of short-term market volatility or uncertainty, your financial adviser can keep you focused on your long-term investment goals – a new home, a child’s college education or a secure retirement. He or she also can share research about the economy, the markets and individual investment options.
Visit our website for more information on your investments
Our website, invesco.com/us, offers a wide range of market insights and investment perspectives. On the website, you’ll find detailed information about our funds, including performance, holdings and portfolio manager commentaries. You can access information about your account by completing a simple, secure online registration. To do so, select “Log In” on the right side of the homepage, and then select “Register for Individual Account Access.”
In addition to the resources accessible on our website and through our mobile app, you can obtain timely updates to help you stay informed about the markets, the economy and investing by connecting with Invesco on Twitter, LinkedIn or Facebook. You can access our blog at blog.invesco.us.com. Our goal is to provide you the information you want, when and where you want it.
Finally, I’m pleased to share with you Invesco’s commitment to both the Principles for Responsible Investment and to considering environmental, social and governance issues in our robust investment process. I invite you to learn more at invesco.com/esg.
Have questions?
For questions about your account, contact an Invesco client services representative at 800 959 4246. For Invesco-related questions or comments, please email me directly at phil@invesco.com.
All of us at Invesco look forward to serving your investment management needs. Thank you for investing with us.
Sincerely,

Philip Taylor
Senior Managing Director, Invesco Ltd.
2 Invesco American Value Fund
| | | | |

Bruce Crockett | | | | Dear Fellow Shareholders: Among the many important lessons I’ve learned in more than 40 years in a variety of business endeavors is the value of a trusted advocate. As independent chair of the Invesco Funds Board, I can assure you that the members of the Board are strong advocates for the interests of investors in Invesco’s mutual funds. We work hard to represent your interests through oversight of the quality of the investment management services your funds receive and other matters important to your investment, including but not limited to: ∎ Ensuring that Invesco offers a diverse lineup of mutual funds that your financial adviser can use to strive to meet your financial needs as your investment goals change over time. ∎ Monitoring how the portfolio management teams of the Invesco funds are performing in light of changing economic and market conditions. |
| ∎ | | Assessing each portfolio management team’s investment performance within the context of the investment strategy described in the fund’s prospectus. |
| ∎ | | Monitoring for potential conflicts of interests that may impact the nature of the services that your funds receive. |
We believe one of the most important services we provide our fund shareholders is the annual review of the funds’ advisory and sub-advisory contracts with Invesco Advisers and its affiliates. This review is required by the Investment Company Act of 1940 and focuses on the nature and quality of the services Invesco provides as the adviser to the Invesco funds and the reasonableness of the fees that it charges for those services. Each year, we spend months carefully reviewing information received from Invesco and a variety of independent sources, such as performance and fee data prepared by Lipper, Inc. (a subsidiary of Broadridge Financial Solutions, Inc.), an independent, third-party firm widely recognized as a leader in its field. We also meet with our independent legal counsel and other independent advisers to review and help us assess the information that we have received. Our goal is to assure that you receive quality investment management services for a reasonable fee.
I trust the measures outlined above provide assurance that you have a worthy advocate when it comes to choosing the Invesco Funds.
As always, please contact me at bruce@brucecrockett.com with any questions or concerns you may have. On behalf of the Board, we look forward to continuing to represent your interests and serving your needs.
Sincerely,

Bruce L. Crockett
Independent Chair
Invesco Funds Board of Trustees
3 Invesco American Value Fund
Management’s Discussion of Fund Performance
| | | | |
| Performance summary | |
For the fiscal year ended April 30, 2017, Class A shares of Invesco American Value Fund (the Fund), at net asset value (NAV), underperformed the Russell Midcap Value Index, the Fund’s style-specific benchmark. Your Fund’s long-term performance appears later in this report. | |
| Fund vs. Indexes | |
Total returns, 4/30/16 to 4/30/17, at net asset value (NAV). Performance shown does not include applicable contingent deferred sales charges (CDSC) or front-end sales charges, which would have reduced performance. | |
Class A Shares | | | 14.40 | % |
Class B Shares | | | 14.41 | |
Class C Shares | | | 13.55 | |
Class R Shares | | | 14.11 | |
Class Y Shares | | | 14.66 | |
Class R5 Shares | | | 14.80 | |
Class R6 Shares | | | 14.91 | |
S&P 500 Index▼ (Broad Market Index) | | | 17.92 | |
Russell Midcap Value Index▼ (Style-Specific Index) | | | 17.52 | |
Lipper Mid-Cap Value Funds Index∎ (Peer Group Index) | | | 15.67 | |
Source(s): ▼FactSet Research Systems Inc.; ∎Lipper Inc. | | | | |
Market conditions and your Fund
During the fiscal year, the US economy continued to expand and strengthen, with unemployment declining and inflation ticking upward somewhat. Signs of an improving economy prompted the US Federal Reserve (the Fed) to raise interest rates in December 2016 and again in March 2017. Major US stock market indexes posted gains for the reporting period, with most hitting record highs following the US presidential election. Investors seemed to believe that the new administration’s plans to reduce tax rates, scale back regulations and increase infrastructure spending had the potential to stimulate economic growth.
While the US and overseas stock markets were jolted by the UK’s decision in June 2016 to leave the European Union, markets recovered relatively quickly. During the second half of 2016, small-cap stocks led the US market while large-cap stocks lagged – but that reversed in the
first quarter of 2017. Near the close of the fiscal year, headlines out of Washington, DC, suggested that enacting significant regulatory and tax reform might be somewhat more difficult than previously anticipated; this was a slight negative for investor sentiment. For the reporting period as a whole, information technology (IT) and financials were the strongest-performing sectors, while telecommunication services and energy were the weakest-performing sectors within the S&P 500 Index.
Stock selection in the energy sector was the largest contributor to the Fund’s relative performance versus its style-specific benchmark. The Fund’s holdings in the sector outperformed as oil prices recovered and inventories declined. Additionally, OPEC agreed to cut production in November, which helped further support oil prices and energy stocks. Within the sector, Baker Hughes, Devon Energy and Williams Companies were among the largest contributors to the Fund’s performance. We sold Williams
Companies during the reporting period to lock in gains as shares of the company performed well and we found better opportunities elsewhere.
The Fund’s underweight exposure to the utilities sector also strongly contributed to relative performance primarily due to the Fund’s lack of exposure to some of the weaker-performing holdings within the sector.
Stock selection in the financials sector, particularly banks, also contributed to the Fund’s performance relative to its style-specific benchmark. Within banking, Comerica, BB&T and Wintrust Financial were key contributors to Fund performance. These companies’ shares moved higher as financial stocks rallied, particularly following the US presidential election in November. Investor optimism about future interest rate increases and economic growth fueled the rally. We sold our position in BB&T during the reporting period.
Stock selection in and an overweight exposure to the health care sector was the largest detractor from the Fund’s relative performance versus its style-specific benchmark. The sector also included a number of the Fund’s largest detractors, such as Brookdale Senior Living and Universal Health Services. Assisted living operator Brookdale Senior Living reported disappointing earnings and a weak outlook as occupancy was lower than anticipated. Universal Health Services, an hospital operator, reported revenues below analysts’ expectations and increased its provisions for delinquent accounts, which led to declines in the stock price. We eliminated our position in both of these holdings during the reporting period.
Stock selection in the IT sector also detracted from the Fund’s relative performance. IT was the best-performing sector within the style-specific benchmark, and the Fund’s lack of exposure to some of
| | | | |
| Portfolio Composition | |
By sector | | | % of total net assets | |
| | | | |
| |
Financials | | | 24.4% | |
Industrials | | | 14.6 | |
Information Technology | | | 13.9 | |
Energy | | | 9.2 | |
Consumer Discretionary | | | 8.6 | |
Health Care | | | 7.5 | |
Materials | | | 6.3 | |
Real Estate | | | 6.2 | |
Utilities | | | 3.9 | |
Consumer Staples | | | 2.5 | |
Money Market Funds Plus Other Assets Less Liabilities | | | 2.9 | |
| | | | | |
| Top 10 Equity Holdings* |
| | | | % of total net assets | |
| | | | | |
1. Royal Caribbean Cruises Ltd. | | | | 4.3 | % |
| 2. Textron Inc. | | | | 3.7 | |
| 3. Comerica Inc. | | | | 3.7 | |
| 4. KeyCorp | | | | 3.7 | |
| 5. Devon Energy Corp. | | | | 3.3 | |
| 6. Willis Towers Watson PLC | | | | 3.3 | |
| 7. Eastman Chemical Co. | | | | 3.3 | |
| 8. Ciena Corp. | | | | 3.2 | |
| 9. Keysight Technologies, Inc. | | | | 3.0 | |
| 10. Zions Bancorp. | | | | 2.9 | |
| | | | | |
| Total Net Assets | | | | $1.8 billion | |
| |
| Total Number of Holdings* | | | | 42 | |
The Fund’s holdings are subject to change, and there is no assurance that the Fund will continue to hold any particular security.
*Excluding money market fund holdings.
Data presented here are as of April 30, 2017.
4 Invesco American Value Fund
the stronger holdings within the sector detracted from relative performance. However, the IT sector included a number of the Fund’s top individual contributors, such as Zebra Technologies, Keysight Technologies and Ciena.
Stock selection in the consumer discretionary sector was the largest detractor from Fund performance; however, the sector included the Fund’s top individual contributor, Royal Caribbean. The cruise operator reported solid earnings and bookings, and the company raised its outlook for 2017 as demand for cruise travel continued to increase.
The Fund underperformed its style-specific benchmark within the consumer discretionary sector primarily due to positions in Ascena Retail and TEGNA. Ladies apparel retailer Ascena Retail reported weakness in a number of its brands as declining store traffic led to declining sales and profits. Broadcast and digital media company TEGNA’s shares were volatile leading up to the November election as investors were concerned about broadcast media. We sold our positions in both Ascena Retail and TEGNA during the reporting period.
Stock selection in the materials sector also detracted from the Fund’s relative performance versus the style-specific benchmark. The sector not only held one of the Fund’s largest detractors, WR Grace, but also held one of its top contributors, Eagle Materials. WR Grace missed revenue expectations and was cautious about 2017, while Eagle Materials rallied after the election, as it is a construction materials company that has the potential to benefit from the new administration.
During the reporting period, we increased our exposure to the IT and real estate sectors and decreased our exposure to the industrials, health care and telecommunication services sectors. At the end of the reporting period, our largest overweight allocations versus the style-specific benchmark were in the financials, IT, health care and industrials sectors, while our largest underweight allocations were in the real estate, utilities and telecommunication services sectors.
Despite providing investors strong absolute Fund returns, the US equity markets experienced volatility during the reporting period as concerns about global economic growth, geopolitical events and the uncertainty regarding future interest rates weighed on investors. We believe market volatility creates opportunities to invest in companies with attractive valuations and strong fundamentals. We
believe that ultimately those valuations and fundamentals will be reflected in those companies’ stock prices.
As always, we are committed to working to achieve positive performance for the Fund’s shareholders through an entire market cycle. Thank you for your continued investment in the Invesco American Value Fund.
The views and opinions expressed in management’s discussion of Fund performance are those of Invesco Advisers, Inc. These views and opinions are subject to change at any time based on factors such as market and economic conditions. These views and opinions may not be relied upon as investment advice or recommendations, or as an offer for a particular security. The information is not a complete analysis of every aspect of any market, country, industry, security or the Fund. Statements of fact are from sources considered reliable, but Invesco Advisers, Inc. makes no representation or warranty as to their completeness or accuracy. Although historical performance is no guarantee of future results, these insights may help you understand our investment management philosophy.
See important Fund and, if applicable, index disclosures later in this report.
| | |

| | Thomas Copper Chartered Financial Analyst, Portfolio Manager, is co-lead manager of Invesco American Value Fund. |
He joined Invesco in 2010. Mr. Copper earned a BA in economics and political science from Tulane University and an MBA from Baylor University. |
| | |

| | Jeffrey Vancavage Chartered Financial Analyst, Portfolio Manager, is co-lead manager of Invesco American Value Fund. |
He joined Invesco in 2016. Mr. Vancavage earned a BS in aeronautical science from Embry-Riddle University and an MBA from the University of Florida. |
| | |
 | | Sergio Marcheli Portfolio Manager, is manager of Invesco American Value Fund. He joined Invesco in 2010. Mr. Marcheli |
earned a BBA from the University of Houston and an MBA from the University of St. Thomas. |
5 Invesco American Value Fund
Your Fund’s Long-Term Performance
Results of a $10,000 Investment – Oldest Share Class(es)
Fund and index data from 4/30/07
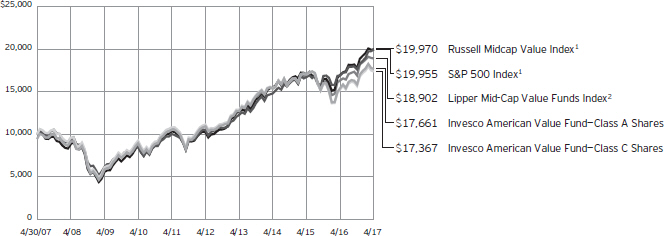
| 1 | Source: FactSet Research Systems Inc. |
Past performance cannot guarantee comparable future results.
The data shown in the chart include reinvested distributions, applicable sales charges and Fund expenses including
management fees. Index results include reinvested dividends, but they do not reflect sales charges. Performance of the peer group, if applicable, reflects fund expenses and management fees; performance
of a market index does not. Performance shown in the chart and table(s) does not reflect deduction of taxes a shareholder would pay on Fund distributions or sale of Fund shares.
continued from page 8
| | creased risk that the Fund will lose significant value if conditions adversely affect that sector or group of industries. |
| ∎ | | Small- and mid-capitalization companies risks. Small- and mid-capitalization companies tend to be more vulnerable to changing market conditions, may have little or no operating history or track record of success, and may have more limited product lines and markets, less experienced management and fewer financial resources than larger companies. These companies’ securities may be more volatile and less liquid than those of more established companies, and their returns may vary, sometimes significantly, from the overall securities market. |
| ∎ | | Value investing style risk. A value investing style subjects the Fund to the risk that the valuations never improve or that the returns on value equity securities are less than returns on other styles of investing or the overall stock market. |
About indexes used in this report
| ∎ | | The S&P 500® Index is an unmanaged index considered representative of the US stock market. |
| ∎ | | The Russell Midcap® Value Index is an unmanaged index considered representative of mid-cap value stocks. The Russell Midcap Value Index is a trademark/ service mark of the Frank Russell Co. Russell® is a trademark of the Frank Russell Co. |
| ∎ | | The Lipper Mid-Cap Value Funds Index is an unmanaged index considered representative of mid-cap value funds tracked by Lipper. |
| ∎ | | The Fund is not managed to track the performance of any particular index, including the index(es) described here, and consequently, the performance of the Fund may deviate significantly from the performance of the index(es). |
| ∎ | | A direct investment cannot be made in an index. Unless otherwise indicated, index results include reinvested dividends, and they do not reflect sales charges. Performance of the peer group, if applicable, reflects fund expenses; performance of a market index does not. |
Other information
| ∎ | | The returns shown in management’s discussion of Fund performance are based on net asset values (NAVs) calculated for shareholder transactions. Generally accepted accounting principles require adjustments to be made to the net assets of the Fund at period end for financial reporting purposes, and as such, the NAVs for shareholder transactions and the returns based on those NAVs may differ from the NAVs and returns reported in the Financial Highlights. |
| ∎ | | Industry classifications used in this report are generally according to the Global Industry Classification Standard, which was developed by and is the exclusive property and a service mark of MSCI Inc. and Standard & Poor’s. |
6 Invesco American Value Fund
| | | | | |
| Average Annual Total Returns |
As of 4/30/17, including maximum applicable
sales charges |
| |
| Class A Shares | | | | | |
| Inception (10/18/93) | | | | 9.20 | % |
| 10 Years | | | | 5.85 | |
| 5 Years | | | | 8.82 | |
| 1 Year | | | | 8.10 | |
| |
| Class B Shares | | | | | |
| Inception (8/1/95) | | | | 9.14 | % |
| 10 Years | | | | 6.37 | |
| 5 Years | | | | 9.78 | |
| 1 Year | | | | 9.41 | |
| |
| Class C Shares | | | | | |
| Inception (10/18/93) | | | | 8.67 | % |
| 10 Years | | | | 5.68 | |
| 5 Years | | | | 9.26 | |
| 1 Year | | | | 12.55 | |
| |
| Class R Shares | | | | | |
| Inception (3/20/07) | | | | 6.53 | % |
| 10 Years | | | | 6.19 | |
| 5 Years | | | | 9.79 | |
| 1 Year | | | | 14.11 | |
| |
| Class Y Shares | | | | | |
| Inception (2/7/06) | | | | 8.07 | % |
| 10 Years | | | | 6.72 | |
| 5 Years | | | | 10.33 | |
| 1 Year | | | | 14.66 | |
| |
| Class R5 Shares | | | | | |
| 10 Years | | | | 6.74 | % |
| 5 Years | | | | 10.46 | |
| 1 Year | | | | 14.80 | |
| |
| Class R6 Shares | | | | | |
| 10 Years | | | | 6.67 | % |
| 5 Years | | | | 10.51 | |
| 1 Year | | | | 14.91 | |
Effective June 1, 2010, Class A, Class B, Class C, Class I and Class R shares of the predecessor fund, Van Kampen American Value Fund, advised by Van Kampen Asset Management were reorganized into Class A, Class B, Class C, Class Y and Class R shares, respectively, of Invesco Van Kampen American Value Fund (renamed Invesco American Value Fund). Returns shown above, prior to June 1, 2010, for Class A, Class B, Class C, Class R and Class Y shares are blended returns of the predecessor fund and Invesco American Value Fund. Share class returns will differ from the predecessor fund because of different expenses.
Class R5 shares incepted on June 1, 2010. Performance shown prior to that date is that of the predecessor fund’s Class A shares and includes the 12b-1
| | | | | |
| Average Annual Total Returns |
As of 3/31/17, the most recent calendar quarter end, including maximum applicable sales charges |
| | | | | |
| |
| Class A Shares | | | | | |
| Inception (10/18/93) | | | | 9.26 | % |
| 10 Years | | | | 6.30 | |
| 5 Years | | | | 9.23 | |
| 1 Year | | | | 12.32 | |
| |
| Class B Shares | | | | | |
| Inception (8/1/95) | | | | 9.22 | % |
| 10 Years | | | | 6.81 | |
| 5 Years | | | | 10.19 | |
| 1 Year | | | | 13.84 | |
| |
| Class C Shares | | | | | |
| Inception (10/18/93) | | | | 8.74 | % |
| 10 Years | | | | 6.13 | |
| 5 Years | | | | 9.66 | |
| 1 Year | | | | 16.98 | |
| |
| Class R Shares | | | | | |
| Inception (3/20/07) | | | | 6.66 | % |
| 10 Years | | | | 6.64 | |
| 5 Years | | | | 10.19 | |
| 1 Year | | | | 18.55 | |
| |
| Class Y Shares | | | | | |
| Inception (2/7/06) | | | | 8.20 | % |
| 10 Years | | | | 7.17 | |
| 5 Years | | | | 10.74 | |
| 1 Year | | | | 19.14 | |
| |
| Class R5 Shares | | | | | |
| 10 Years | | | | 7.19 | % |
| 5 Years | | | | 10.87 | |
| 1 Year | | | | 19.25 | |
| |
| Class R6 Shares | | | | | |
| 10 Years | | | | 7.12 | % |
| 5 Years | | | | 10.92 | |
| 1 Year | | | | 19.36 | |
fees applicable to Class A shares.
Class R6 shares incepted on September 24, 2012. Performance shown prior to that date is that of the Fund’s and the predecessor fund’s Class A shares and includes the 12b-1 fees applicable to Class A shares.
The performance data quoted represent past performance and cannot guarantee comparable future results; current performance may be lower or higher. Please visit invesco.com/performance for the most recent month-end performance. Performance figures reflect reinvested distributions, changes in net asset value and the effect of the maximum sales charge unless otherwise stated. Investment return and principal value will fluctuate so that you may have a gain or loss when you sell shares.
The net annual Fund operating expense ratio set forth in the most recent Fund prospectus as of the date of this report for Class A, Class B, Class C, Class R, Class Y, Class R5 and Class R6 shares was 1.32%, 1.32%, 2.06%, 1.57%, 1.07%, 0.95% and 0.86 respectively.1 The total annual Fund operating expense ratio set forth in the most recent Fund prospectus as of the date of this report for Class A, Class B, Class C, Class R, Class Y, Class R5 and Class R6 shares was 1.33%, 1.33%, 2.07%, 1.58%, 1.08%, 0.96% and 0.87%, respectively. The expense ratios presented above may vary from the expense ratios presented in other sections of this report that are based on expenses incurred during the period covered by this report.
Class A share performance reflects the maximum 5.50% sales charge, and Class B and Class C share performance reflects the applicable contingent deferred sales charge (CDSC) for the period involved. For shares purchased prior to June 1, 2010, the CDSC on Class B shares declines from 5% at the time of purchase to 0% at the beginning of the sixth year. For shares purchased on or after June 1, 2010, the CDSC on Class B shares declines from 5% at the time of purchase to 0% at the beginning of the seventh year. The CDSC on Class C shares is 1% for the first year after purchase. Class R, Class Y, Class R5 and Class R6 shares do not have a front-end sales charge or a CDSC; therefore, performance is at net asset value.
The performance of the Fund’s share classes will differ primarily due to different sales charge structures and class expenses.
Fund performance reflects any applicable fee waivers and/or expense reimbursements. Had the adviser not waived fees and/or reimbursed expenses currently or in the past, returns would have been lower. See current prospectus for more information.
| 1 | Total annual Fund operating expenses after any contractual fee waivers and/or expense reimbursements by the adviser in effect through at least June 30, 2019. See current prospectus for more information. |
7 Invesco American Value Fund
Invesco American Value Fund’s investment objective is total return through growth of capital and current income.
| ∎ | | Unless otherwise stated, information presented in this report is as of April 30, 2017, and is based on total net assets. |
| ∎ | | Unless otherwise noted, all data provided by Invesco. |
| ∎ | | To access your Fund’s reports/prospectus, visit invesco.com/fundreports. |
About share classes
| ∎ | | Class B shares may not be purchased for new or additional investments. Please see the prospectus for more information. |
| ∎ | | Class R shares are generally available only to employer sponsored retirement and benefit plans. Please see the prospectus for more information. |
| ∎ | | Class Y shares are available only to certain investors. Please see the prospectus for more information. |
| ∎ | | Class R5 shares and Class R6 shares are available for use by retirement plans that meet certain standards and for institutional investors. Class R6 shares are also available through intermediaries that have established an agreement with Invesco Distributors, Inc. to make such shares available for use in retail omnibus accounts. Please see the prospectus for more information. |
Principal risks of investing in the Fund
| ∎ | | Depositary receipts risk. Investing in depositary receipts involves the same risks as direct investments in foreign securities. In addition, the underlying issuers of certain depositary receipts are under no obligation to distribute shareholder communications or pass through any voting rights with respect to the deposited securities to the holders of such receipts. The Fund may therefore receive less timely information or have less control than if it invested directly in the foreign issuer. |
| ∎ | | Derivatives risk. The value of a derivative instrument depends largely on (and is derived from) the value of an underlying security, currency, commodity, interest rate, index or other asset (each referred to as an underlying asset). In addition to risks relating to the underlying assets, the use of derivatives may include other, possibly greater, risks, including counterparty, leverage and liquidity risks. Counterparty risk is the risk that the counter- |
| | party to the derivative contract will default on its obligation to pay the Fund the amount owed or otherwise perform under the derivative contract. Derivatives create leverage risk because they do not require payment up front equal to the economic exposure created by owning the derivative. As a result, an adverse change in the value of the underlying asset could result in the Fund sustaining a loss that is substantially greater than the amount invested in the derivative, which may make the Fund’s returns more volatile and increase the risk of loss. Derivative instruments may also be less liquid than more traditional investments and the Fund may be unable to sell or close out its derivative positions at a desirable time or price. This risk may be more acute under adverse market conditions, during which the Fund may be most in need of liquidating its derivative positions. Derivatives may also be harder to value, less tax efficient and subject to changing government regulation that could impact the Fund’s ability to use certain derivatives or their cost. Also, derivatives used for hedging or to gain or limit exposure to a particular market segment may not provide the expected benefits, particularly during adverse market conditions. |
| ∎ | | Foreign securities risk. The Fund’s foreign investments may be adversely affected by political and social instability, changes in economic or taxation policies, difficulty in enforcing obligations, decreased liquidity or increased volatility. Foreign investments also involve the risk of the possible seizure, nationalization or expropriation of the issuer or foreign deposits (in which the Fund could lose its entire investments in a certain market) and the possible adoption of foreign governmental restrictions such as exchange controls. Unless the Fund has hedged its foreign securities risk, foreign securities risk also involves the risk of negative foreign currency rate fluctuations, which |
This report must be accompanied or preceded by a currently effective Fund prospectus, which contains more complete information, including sales charges and expenses. Investors should read it carefully before investing.
NOT FDIC INSURED | MAY LOSE VALUE | NO BANK GUARANTEE
| | may cause the value of securities denominated in such foreign currency (or other instruments through which the Fund has exposure to foreign currencies) to decline in value. Currency exchange rates may fluctuate significantly over short periods of time. Currency hedging strategies, if used, are not always successful. |
| ∎ | | Management risk. The Fund is actively managed and depends heavily on the Adviser’s judgment about markets, interest rates or the attractiveness, relative values, liquidity, or potential appreciation of particular investments made for the Fund’s portfolio. The Fund could experience losses if these judgments prove to be incorrect. Additionally, legislative, regulatory, or tax developments may adversely affect management of the Fund and, therefore, the ability of the Fund to achieve its investment objective. |
| ∎ | | Market risk. The market values of the Fund’s investments, and therefore the value of the Fund’s shares, will go up and down, sometimes rapidly or unpredictably. Market risk may affect a single issuer, industry or section of the economy, or it may affect the market as a whole. Individual stock prices tend to go up and down more dramatically than those of certain other types of investments, such as bonds. During a general downturn in the financial markets, multiple asset classes may decline in value. When markets perform well, there can be no assurance that specific investments held by the Fund will rise in value. |
| ∎ | | Real estate investment trust (REIT) risk/real estate risk. Investments in real estate related instruments may be affected by economic, legal, cultural, environmental or technological factors that affect property values, rents or occupancies of real estate related to the Fund’s holdings. Shares of real estate related companies, which tend to be small- and mid-cap companies, may be more volatile and less liquid. |
| ∎ | | Sector focus risk. The Fund may from time to time invest a significant amount of its assets (i.e. over 25%) in one market sector or group of related industries. In this event, the Fund’s performance will depend to a greater extent on the overall condition of the sector or group of industries and there is in- |
continued on page 6
8 Invesco American Value Fund
Schedule of Investments(a)
April 30, 2017
| | | | | | | | |
| | | Shares | | | Value | |
Common Stocks & Other Equity Interests–97.11% | |
| Aerospace & Defense–3.72% | | | | | | | | |
Textron Inc. | | | 1,444,513 | | | $ | 67,400,977 | |
| | |
| Application Software–0.47% | | | | | | | | |
Citrix Systems, Inc.(b) | | | 104,211 | | | | 8,434,838 | |
|
| Automotive Retail–1.92% | |
Advance Auto Parts, Inc. | | | 244,833 | | | | 34,800,563 | |
|
| Broadcasting–2.41% | |
Scripps Networks Interactive Inc.–Class A | | | 583,994 | | | | 43,636,032 | |
|
| Building Products–2.23% | |
Johnson Controls International PLC | | | 971,802 | | | | 40,397,816 | |
|
| Communications Equipment–3.93% | |
ARRIS International PLC(b) | | | 527,895 | | | | 13,719,991 | |
Ciena Corp.(b) | | | 2,512,360 | | | | 57,558,168 | |
| | | | | | | | 71,278,159 | |
|
| Construction & Engineering–2.52% | |
Fluor Corp. | | | 888,894 | | | | 45,618,040 | |
|
| Construction Materials–1.14% | |
Eagle Materials Inc. | | | 215,156 | | | | 20,648,521 | |
|
| Diversified Banks–3.69% | |
Comerica Inc. | | | 946,618 | | | | 66,925,893 | |
|
| Diversified Chemicals–3.29% | |
Eastman Chemical Co. | | | 746,665 | | | | 59,546,534 | |
|
| Diversified REIT’s–3.37% | |
Forest City Realty Trust, Inc.–Class A | | | 1,986,212 | | | | 44,888,391 | |
Liberty Property Trust | | | 400,172 | | | | 16,234,978 | |
| | | | | | | | 61,123,369 | |
|
| Electric Utilities–3.92% | |
Edison International | | | 453,432 | | | | 36,260,957 | |
FirstEnergy Corp. | | | 1,157,871 | | | | 34,666,658 | |
| | | | | | | | 70,927,615 | |
|
| Electronic Equipment & Instruments–5.36% | |
Keysight Technologies, Inc.(b) | | | 1,459,122 | | | | 54,614,937 | |
Zebra Technologies Corp.–Class A(b) | | | 451,156 | | | | 42,530,476 | |
| | | | | | | | 97,145,413 | |
|
| Environmental & Facilities Services–1.91% | |
Clean Harbors, Inc.(b) | | | 595,967 | | | | 34,631,642 | |
|
| Health Care Distributors–2.48% | |
AmerisourceBergen Corp. | | | 548,382 | | | | 44,994,743 | |
|
| Health Care Facilities–2.60% | |
HealthSouth Corp. | | | 1,005,192 | | | | 47,143,505 | |
| | | | | | | | |
| | | Shares | | | Value | |
| Heavy Electrical Equipment–0.38% | |
Babcock & Wilcox Enterprises, Inc.(b) | | | 742,099 | | | $ | 6,953,468 | |
|
| Hotels, Resorts & Cruise Lines–4.32% | |
Royal Caribbean Cruises Ltd. | | | 734,104 | | | | 78,255,486 | |
|
| Industrial Machinery–2.68% | |
Ingersoll-Rand PLC | | | 546,819 | | | | 48,530,186 | |
|
| Insurance Brokers–5.92% | |
Arthur J. Gallagher & Co. | | | 848,041 | | | | 47,329,168 | |
Willis Towers Watson PLC | | | 451,346 | | | | 59,857,507 | |
| | | | | | | | 107,186,675 | |
|
| Investment Banking & Brokerage–2.68% | |
Stifel Financial Corp.(b) | | | 993,260 | | | | 48,540,616 | |
|
| IT Consulting & Other Services–2.09% | |
Teradata Corp.(b) | | | 1,295,676 | | | | 37,807,826 | |
|
| Marine–1.14% | |
Kirby Corp.(b) | | | 291,779 | | | | 20,599,597 | |
|
| Oil & Gas Equipment & Services–3.86% | |
Baker Hughes Inc. | | | 641,036 | | | | 38,058,307 | |
TechnipFMC PLC (United Kingdom)(b) | | | 1,055,358 | | | | 31,797,937 | |
| | | | | | | | 69,856,244 | |
|
| Oil & Gas Exploration & Production–5.34% | |
Devon Energy Corp. | | | 1,528,163 | | | | 60,347,157 | |
Marathon Oil Corp. | | | 2,449,763 | | | | 36,427,976 | |
| | | | | | | | 96,775,133 | |
|
| Other Diversified Financial Services–2.61% | |
Voya Financial, Inc. | | | 1,266,416 | | | | 47,338,630 | |
|
| Packaged Foods & Meats–2.51% | |
Conagra Brands, Inc. | | | 1,170,770 | | | | 45,402,461 | |
|
| Pharmaceuticals–2.40% | |
Mylan N.V.(b) | | | 1,165,788 | | | | 43,542,182 | |
|
| Regional Banks–9.46% | |
KeyCorp | | | 3,647,159 | | | | 66,524,180 | |
Wintrust Financial Corp. | | | 726,133 | | | | 51,453,784 | |
Zions Bancorp. | | | 1,335,101 | | | | 53,444,093 | |
| | | | | | | | 171,422,057 | |
|
| Retail REIT’s–0.90% | |
Kimco Realty Corp. | | | 803,973 | | | | 16,312,612 | |
|
| Specialized REIT’s–1.91% | |
Life Storage, Inc. | | | 442,303 | | | | 34,672,132 | |
|
| Specialty Chemicals–1.90% | |
W.R. Grace & Co. | | | 493,166 | | | | 34,383,533 | |
See accompanying Notes to Financial Statements which are an integral part of the financial statements.
9 Invesco American Value Fund
| | | | | | | | |
| | | Shares | | | Value | |
| Technology Hardware, Storage & Peripherals–2.05% | |
Diebold Nixdorf, Inc. | | | 1,320,054 | | | $ | 37,225,523 | |
Total Common Stocks & Other Equity Interests
(Cost $1,475,234,338) | | | | 1,759,458,021 | |
|
Money Market Funds–1.96% | |
Government & Agency Portfolio–Institutional Class, 0.67%(c) | | | 21,325,411 | | | | 21,325,411 | |
Treasury Portfolio–Institutional Class, 0.63%(c) | | | 14,216,941 | | | | 14,216,941 | |
Total Money Market Funds
(Cost $35,542,352) | | | | | | | 35,542,352 | |
TOTAL INVESTMENTS–99.07%
(Cost $1,510,776,690) | | | | 1,795,000,373 | |
OTHER ASSETS LESS LIABILITIES–0.93% | | | | 16,873,482 | |
NET ASSETS–100.00% | | | $ | 1,811,873,855 | |
Investment Abbreviations:
| | |
| REIT | | – Real Estate Investment Trust |
Notes to Schedule of Investments:
| (a) | Industry and/or sector classifications used in this report are generally according to the Global Industry Classification Standard, which was developed by and is the exclusive property and a service mark of MSCI Inc. and Standard & Poor’s. |
| (b) | Non-income producing security. |
| (c) | The money market fund and the Fund are affiliated by having the same investment adviser. The rate shown is the 7-day SEC standardized yield as of April 30, 2017. |
See accompanying Notes to Financial Statements which are an integral part of the financial statements.
10 Invesco American Value Fund
Statement of Assets and Liabilities
April 30, 2017
| | | | |
Assets: | |
Investments, at value (Cost $1,475,234,338) | | $ | 1,759,458,021 | |
Investments in affiliated money market funds, at value and cost | | | 35,542,352 | |
Total investments, at value (Cost $1,510,776,690) | | | 1,795,000,373 | |
Foreign currencies, at value (Cost $779) | | | 787 | |
Receivable for: | | | | |
Investments sold | | | 30,078,827 | |
Fund shares sold | | | 1,817,481 | |
Dividends | | | 605,058 | |
Investment for trustee deferred compensation and retirement plans | | | 176,976 | |
Other assets | | | 63,785 | |
Total assets | | | 1,827,743,287 | |
|
Liabilities: | |
Payable for: | | | | |
Investments purchased | | | 9,254,481 | |
Fund shares reacquired | | | 4,874,363 | |
Accrued fees to affiliates | | | 1,108,138 | |
Accrued trustees’ and officers’ fees and benefits | | | 3,926 | |
Accrued other operating expenses | | | 428,125 | |
Trustee deferred compensation and retirement plans | | | 200,399 | |
Total liabilities | | | 15,869,432 | |
Net assets applicable to shares outstanding | | $ | 1,811,873,855 | |
|
Net assets consist of: | |
Shares of beneficial interest | | $ | 1,481,505,219 | |
Undistributed net investment income | | | 10,124,471 | |
Undistributed net realized gain | | | 36,020,474 | |
Net unrealized appreciation | | | 284,223,691 | |
| | | $ | 1,811,873,855 | |
| | | | |
Net Assets: | |
Class A | | $ | 1,031,599,994 | |
Class B | | $ | 7,265,068 | |
Class C | | $ | 98,095,753 | |
Class R | | $ | 46,936,738 | |
Class Y | | $ | 375,626,193 | |
Class R5 | | $ | 86,568,739 | |
Class R6 | | $ | 165,781,370 | |
|
Shares outstanding, no par value,
with an unlimited number of shares authorized: | |
Class A | | | 26,779,837 | |
Class B | | | 212,950 | |
Class C | | | 3,023,992 | |
Class R | | | 1,226,868 | |
Class Y | | | 9,681,518 | |
Class R5 | | | 2,228,619 | |
Class R6 | | | 4,263,513 | |
Class A: | | | | |
Net asset value per share | | $ | 38.52 | |
Maximum offering price per share | | | | |
(Net asset value of $38.52 ¸ 94.50%) | | $ | 40.76 | |
Class B: | | | | |
Net asset value and offering price per share | | $ | 34.12 | |
Class C: | | | | |
Net asset value and offering price per share | | $ | 32.44 | |
Class R: | | | | |
Net asset value and offering price per share | | $ | 38.26 | |
Class Y: | | | | |
Net asset value and offering price per share | | $ | 38.80 | |
Class R5: | | | | |
Net asset value and offering price per share | | $ | 38.84 | |
Class R6: | | | | |
Net asset value and offering price per share | | $ | 38.88 | |
See accompanying Notes to Financial Statements which are an integral part of the financial statements.
11 Invesco American Value Fund
Statement of Operations
For the year ended April 30, 2017
| | | | |
Investment income: | |
Dividends | | $ | 33,619,395 | |
Dividends from affiliated money market funds | | | 199,723 | |
Total investment income | | | 33,819,118 | |
| |
Expenses: | | | | |
Advisory fees | | | 13,296,172 | |
Administrative services fees | | | 431,968 | |
Custodian fees | | | 5,595 | |
Distribution fees: | | | | |
Class A | | | 2,754,016 | |
Class B | | | 27,068 | |
Class C | | | 999,562 | |
Class R | | | 275,120 | |
Transfer agent fees — A, B, C, R and Y | | | 3,481,526 | |
Transfer agent fees — R5 | | | 118,643 | |
Transfer agent fees — R6 | | | 14,452 | |
Trustees’ and officers’ fees and benefits | | | 44,889 | |
Registration and filing fees | | | 156,136 | |
Reports to shareholders | | | 567,134 | |
Professional services fees | | | 63,837 | |
Other | | | 42,305 | |
Total expenses | | | 22,278,423 | |
Less: Fees waived and expense offset arrangement(s) | | | (73,618 | ) |
Net expenses | | | 22,204,805 | |
Net investment income | | | 11,614,313 | |
| |
Realized and unrealized gain (loss) from: | | | | |
Net realized gain (loss) from: | | | | |
Investment securities | | | 59,437,478 | |
Foreign currencies | | | (64,376 | ) |
| | | | 59,373,102 | |
Change in net unrealized appreciation (depreciation) of: | | | | |
Investment securities | | | 192,198,377 | |
Foreign currencies | | | (6 | ) |
| | | | 192,198,371 | |
Net realized and unrealized gain | | | 251,571,473 | |
Net increase in net assets resulting from operations | | $ | 263,185,786 | |
See accompanying Notes to Financial Statements which are an integral part of the financial statements.
12 Invesco American Value Fund
Statement of Changes in Net Assets
For the years ended April 30, 2017 and 2016
| | | | | | | | |
| | | 2017 | | | 2016 | |
Operations: | | | | | |
Net investment income | | $ | 11,614,313 | | | $ | 6,649,648 | |
Net realized gain | | | 59,373,102 | | | | 29,113,547 | |
Change in net unrealized appreciation (depreciation) | | | 192,198,371 | | | | (263,401,831 | ) |
Net increase (decrease) in net assets resulting from operations | | | 263,185,786 | | | | (227,638,636 | ) |
| | |
Distributions to shareholders from net investment income: | | | | | | | | |
Class A | | | (2,319,652 | ) | | | (267,252 | ) |
Class B | | | (24,721 | ) | | | (4,958 | ) |
Class Y | | | (1,533,805 | ) | | | (467,049 | ) |
Class R5 | | | (661,654 | ) | | | (104,916 | ) |
Class R6 | | | (1,039,016 | ) | | | (206,950 | ) |
Total distributions from net investment income | | | (5,578,848 | ) | | | (1,051,125 | ) |
| | |
Distributions to shareholders from net realized gains: | | | | | | | | |
Class A | | | (8,946,409 | ) | | | (77,822,348 | ) |
Class B | | | (95,344 | ) | | | (1,235,547 | ) |
Class C | | | (985,289 | ) | | | (8,687,666 | ) |
Class R | | | (425,131 | ) | | | (4,617,643 | ) |
Class Y | | | (2,887,051 | ) | | | (34,116,638 | ) |
Class R5 | | | (982,717 | ) | | | (6,570,735 | ) |
Class R6 | | | (1,336,313 | ) | | | (9,743,181 | ) |
Total distributions from net realized gains | | | (15,658,254 | ) | | | (142,793,758 | ) |
| | |
Share transactions–net: | | | | | | | | |
Class A | | | (228,684,398 | ) | | | 83,722,233 | |
Class B | | | (7,361,395 | ) | | | (7,667,419 | ) |
Class C | | | (17,682,032 | ) | | | 651,894 | |
Class R | | | (26,193,995 | ) | | | 1,561,228 | |
Class Y | | | (125,547,059 | ) | | | (1,702,438 | ) |
Class R5 | | | (57,244,666 | ) | | | 47,360,783 | |
Class R6 | | | 3,147,589 | | | | 24,141,535 | |
Net increase (decrease) in net assets resulting from share transactions | | | (459,565,956 | ) | | | 148,067,816 | |
Net increase (decrease) in net assets | | | (217,617,272 | ) | | | (223,415,703 | ) |
| | |
Net assets: | | | | | | | | |
Beginning of year | | | 2,029,491,127 | | | | 2,252,906,830 | |
End of year (includes undistributed net investment income of $10,124,471 and $5,355,096, respectively) | | $ | 1,811,873,855 | | | $ | 2,029,491,127 | |
Notes to Financial Statements
April 30, 2017
NOTE 1—Significant Accounting Policies
Invesco American Value Fund (the “Fund”) is a series portfolio of AIM Sector Funds (Invesco Sector Funds) (the “Trust”). The Trust is a Delaware statutory trust registered under the Investment Company Act of 1940, as amended (the “1940 Act”), as an open-end series management investment company consisting of ten separate portfolios, each authorized to issue an unlimited number of shares of beneficial interest. The assets, liabilities and operations of each portfolio are accounted for separately. Information presented in these financial statements pertains only to the Fund. Matters affecting each portfolio or class will be voted on exclusively by the shareholders of such portfolio or class.
The Fund’s investment objective is total return through growth of capital and current income.
The Fund currently consists of seven different classes of shares: Class A, Class B, Class C, Class R, Class Y, Class R5 and Class R6. Class Y shares are available only to certain investors. Class A shares are sold with a front-end sales charge unless certain waiver criteria are met and under certain circumstances load waived shares may be subject to contingent deferred sales charges (“CDSC”). Class C shares are sold with a CDSC. Class R, Class Y, Class R5 and Class R6 shares are sold at net asset value. Effective November 30, 2010, new or additional investments in Class B shares are no longer
13 Invesco American Value Fund
permitted. Existing shareholders of Class B shares may continue to reinvest dividends and capital gains distributions in Class B shares until they convert to Class A shares. Also, shareholders in Class B shares will be able to exchange those shares for Class B shares of other Invesco Funds offering such shares until they convert to Class A shares. Generally, Class B shares will automatically convert to Class A shares on or about the month-end, which is at least eight years after the date of purchase. Redemption of Class B shares prior to the conversion date will be subject to a CDSC.
The Fund is an investment company and accordingly follows the investment company accounting and reporting guidance in accordance with Financial Accounting Standards Board Accounting Standards Codification Topic 946, Financial Services — Investment Companies.
The following is a summary of the significant accounting policies followed by the Fund in the preparation of its financial statements.
| A. | Security Valuations — Securities, including restricted securities, are valued according to the following policy. |
A security listed or traded on an exchange (except convertible securities) is valued at its last sales price or official closing price as of the close of the customary trading session on the exchange where the security is principally traded, or lacking any sales or official closing price on a particular day, the security may be valued at the closing bid price on that day. Securities traded in the over-the-counter market are valued based on prices furnished by independent pricing services or market makers. When such securities are valued by an independent pricing service they may be considered fair valued. Futures contracts are valued at the final settlement price set by an exchange on which they are principally traded. Listed options are valued at the mean between the last bid and asked prices from the exchange on which they are principally traded. Options not listed on an exchange are valued by an independent source at the mean between the last bid and asked prices. For purposes of determining net asset value (“NAV”) per share, futures and option contracts generally are valued 15 minutes after the close of the customary trading session of the New York Stock Exchange (“NYSE”).
Investments in open-end and closed-end registered investment companies that do not trade on an exchange are valued at the end-of-day net asset value per share. Investments in open-end and closed-end registered investment companies that trade on an exchange are valued at the last sales price or official closing price as of the close of the customary trading session on the exchange where the security is principally traded.
Debt obligations (including convertible securities) and unlisted equities are fair valued using an evaluated quote provided by an independent pricing service. Evaluated quotes provided by the pricing service may be determined without exclusive reliance on quoted prices, and may reflect appropriate factors such as institution-size trading in similar groups of securities, developments related to specific securities, dividend rate (for unlisted equities), yield (for debt obligations), quality, type of issue, coupon rate (for debt obligations), maturity (for debt obligations), individual trading characteristics and other market data. Debt obligations are subject to interest rate and credit risks. In addition, all debt obligations involve some risk of default with respect to interest and/or principal payments.
Foreign securities’ (including foreign exchange contracts) prices are converted into U.S. dollar amounts using the applicable exchange rates as of the close of the NYSE. If market quotations are available and reliable for foreign exchange-traded equity securities, the securities will be valued at the market quotations. Because trading hours for certain foreign securities end before the close of the NYSE, closing market quotations may become unreliable. If between the time trading ends on a particular security and the close of the customary trading session on the NYSE, events occur that the Adviser determines are significant and make the closing price unreliable, the Fund may fair value the security. If the event is likely to have affected the closing price of the security, the security will be valued at fair value in good faith using procedures approved by the Board of Trustees. Adjustments to closing prices to reflect fair value may also be based on a screening process of an independent pricing service to indicate the degree of certainty, based on historical data, that the closing price in the principal market where a foreign security trades is not the current value as of the close of the NYSE. Foreign securities’ prices meeting the approved degree of certainty that the price is not reflective of current value will be priced at the indication of fair value from the independent pricing service. Multiple factors may be considered by the independent pricing service in determining adjustments to reflect fair value and may include information relating to sector indices, American Depositary Receipts and domestic and foreign index futures. Foreign securities may have additional risks including exchange rate changes, potential for sharply devalued currencies and high inflation, political and economic upheaval, the relative lack of issuer information, relatively low market liquidity and the potential lack of strict financial and accounting controls and standards.
Securities for which market prices are not provided by any of the above methods may be valued based upon quotes furnished by independent sources. The last bid price may be used to value equity securities. The mean between the last bid and asked prices is used to value debt obligations, including corporate loans.
Securities for which market quotations are not readily available or became unreliable are valued at fair value as determined in good faith by or under the supervision of the Trust’s officers following procedures approved by the Board of Trustees. Issuer specific events, market trends, bid/asked quotes of brokers and information providers and other market data may be reviewed in the course of making a good faith determination of a security’s fair value.
The Fund may invest in securities that are subject to interest rate risk, meaning the risk that the prices will generally fall as interest rates rise and, conversely, the prices will generally rise as interest rates fall. Specific securities differ in their sensitivity to changes in interest rates depending on their individual characteristics. Changes in interest rates may result in increased market volatility, which may affect the value and/or liquidity of certain Fund investments.
Valuations change in response to many factors including the historical and prospective earnings of the issuer, the value of the issuer’s assets, general economic conditions, interest rates, investor perceptions and market liquidity. Because of the inherent uncertainties of valuation, the values reflected in the financial statements may materially differ from the value received upon actual sale of those investments.
| B. | Securities Transactions and Investment Income — Securities transactions are accounted for on a trade date basis. Realized gains or losses on sales are computed on the basis of specific identification of the securities sold. Interest income (net of withholding tax, if any) is recorded on the accrual basis from settlement date. Dividend income (net of withholding tax, if any) is recorded on the ex-dividend date. |
The Fund may periodically participate in litigation related to Fund investments. As such, the Fund may receive proceeds from litigation settlements. Any proceeds received are included in the Statement of Operations as realized gain (loss) for investments no longer held and as unrealized gain (loss) for investments still held.
Brokerage commissions and mark ups are considered transaction costs and are recorded as an increase to the cost basis of securities purchased and/or a reduction of proceeds on a sale of securities. Such transaction costs are included in the determination of net realized and unrealized gain (loss) from investment securities reported in the Statement of Operations and the Statement of Changes in Net Assets and the net realized and unrealized gains (losses) on securities per share in the Financial Highlights. Transaction costs are included in the calculation of the
14 Invesco American Value Fund
Fund’s net asset value and, accordingly, they reduce the Fund’s total returns. These transaction costs are not considered operating expenses and are not reflected in net investment income reported in the Statement of Operations and the Statement of Changes in Net Assets, or the net investment income per share and the ratios of expenses and net investment income reported in the Financial Highlights, nor are they limited by any expense limitation arrangements between the Fund and the investment adviser.
The Fund allocates income and realized and unrealized capital gains and losses to a class based on the relative net assets of each class.
| C. | Country Determination — For the purposes of making investment selection decisions and presentation in the Schedule of Investments, the investment adviser may determine the country in which an issuer is located and/or credit risk exposure based on various factors. These factors include the laws of the country under which the issuer is organized, where the issuer maintains a principal office, the country in which the issuer derives 50% or more of its total revenues and the country that has the primary market for the issuer’s securities, as well as other criteria. Among the other criteria that may be evaluated for making this determination are the country in which the issuer maintains 50% or more of its assets, the type of security, financial guarantees and enhancements, the nature of the collateral and the sponsor organization. Country of issuer and/or credit risk exposure has been determined to be the United States of America, unless otherwise noted. |
| D. | Distributions — Distributions from net investment income and net realized capital gain, if any, are generally declared and paid annually and recorded on the ex-dividend date. The Fund may elect to treat a portion of the proceeds from redemptions as distributions for federal income tax purposes. |
| E. | Federal Income Taxes — The Fund intends to comply with the requirements of Subchapter M of the Internal Revenue Code of 1986, as amended (the “Internal Revenue Code”), necessary to qualify as a regulated investment company and to distribute substantially all of the Fund’s taxable earnings to shareholders. As such, the Fund will not be subject to federal income taxes on otherwise taxable income (including net realized capital gain) that is distributed to shareholders. Therefore, no provision for federal income taxes is recorded in the financial statements. |
The Fund recognizes the tax benefits of uncertain tax positions only when the position is more likely than not to be sustained. Management has analyzed the Fund’s uncertain tax positions and concluded that no liability for unrecognized tax benefits should be recorded related to uncertain tax positions. Management is not aware of any tax positions for which it is reasonably possible that the total amounts of unrecognized tax benefits will change materially in the next 12 months.
The Fund files tax returns in the U.S. Federal jurisdiction and certain other jurisdictions. Generally, the Fund is subject to examinations by such taxing authorities for up to three years after the filing of the return for the tax period.
| F. | Expenses — Fees provided for under the Rule 12b-1 plan of a particular class of the Fund are charged to the operations of such class. Transfer agency fees and expenses and other shareholder recordkeeping fees and expenses attributable to Class R5 and Class R6 are allocated to each share class based on relative net assets. Sub-accounting fees attributable to Class R5 are charged to the operations of the class. Transfer agency fees and expenses and other shareholder recordkeeping fees and expenses relating to all other classes are allocated among those classes based on relative net assets. All other expenses are allocated among the classes based on relative net assets. |
| G. | Accounting Estimates — The preparation of financial statements in conformity with accounting principles generally accepted in the United States of America (“GAAP”) requires management to make estimates and assumptions that affect the reported amounts of assets and liabilities at the date of the financial statements and the reported amounts of revenues and expenses during the reporting period including estimates and assumptions related to taxation. Actual results could differ from those estimates by a significant amount. In addition, the Fund monitors for material events or transactions that may occur or become known after the period-end date and before the date the financial statements are released to print. |
| H. | Indemnifications — Under the Trust’s organizational documents, each Trustee, officer, employee or other agent of the Trust is indemnified against certain liabilities that may arise out of the performance of their duties to the Fund. Additionally, in the normal course of business, the Fund enters into contracts, including the Fund’s servicing agreements, that contain a variety of indemnification clauses. The Fund’s maximum exposure under these arrangements is unknown as this would involve future claims that may be made against the Fund that have not yet occurred. The risk of material loss as a result of such indemnification claims is considered remote. |
| I. | Foreign Currency Translations — Foreign currency is valued at the close of the NYSE based on quotations posted by banks and major currency dealers. Portfolio securities and other assets and liabilities denominated in foreign currencies are translated into U.S. dollar amounts at date of valuation. Purchases and sales of portfolio securities (net of foreign taxes withheld on disposition) and income items denominated in foreign currencies are translated into U.S. dollar amounts on the respective dates of such transactions. The Fund does not separately account for the portion of the results of operations resulting from changes in foreign exchange rates on investments and the fluctuations arising from changes in market prices of securities held. The combined results of changes in foreign exchange rates and the fluctuation of market prices on investments (net of estimated foreign tax withholding) are included with the net realized and unrealized gain or loss from investments in the Statement of Operations. Reported net realized foreign currency gains or losses arise from (1) sales of foreign currencies, (2) currency gains or losses realized between the trade and settlement dates on securities transactions, and (3) the difference between the amounts of dividends, interest, and foreign withholding taxes recorded on the Fund’s books and the U.S. dollar equivalent of the amounts actually received or paid. Net unrealized foreign currency gains and losses arise from changes in the fair values of assets and liabilities, other than investments in securities at fiscal period end, resulting from changes in exchange rates. |
The Fund may invest in foreign securities, which may be subject to foreign taxes on income, gains on investments or currency repatriation, a portion of which may be recoverable. Foreign taxes, if any, are recorded based on the tax regulations and rates that exist in the foreign markets in which the Fund invests and are shown in the Statement of Operations.
| J. | Forward Foreign Currency Contracts — The Fund may engage in foreign currency transactions either on a spot (i.e. for prompt delivery and settlement) basis, or through forward foreign currency contracts, to manage or minimize currency or exchange rate risk. |
The Fund may also enter into forward foreign currency contracts for the purchase or sale of a security denominated in a foreign currency in order to “lock in” the U.S. dollar price of that security, or the Fund may also enter into forward foreign currency contracts that do not provide for physical settlement of the two currencies, but instead are settled by a single cash payment calculated as the difference between the agreed upon exchange rate and the spot rate at settlement based upon an agreed upon notional amount (non-deliverable forwards). The Fund will set aside liquid assets in an amount equal to the daily mark-to-market obligation for forward foreign currency contracts.
15 Invesco American Value Fund
A forward foreign currency contract is an obligation between two parties (“Counterparties”) to purchase or sell a specific currency for an agreed-upon price at a future date. The use of forward foreign currency contracts does not eliminate fluctuations in the price of the underlying securities the Fund owns or intends to acquire but establishes a rate of exchange in advance. Fluctuations in the value of these contracts are measured by the difference in the contract date and reporting date exchange rates and are recorded as unrealized appreciation (depreciation) until the contracts are closed. When the contracts are closed, realized gains (losses) are recorded. Realized and unrealized gains (losses) on the contracts are included in the Statement of Operations. The primary risks associated with forward foreign currency contracts include failure of the Counterparty to meet the terms of the contract and the value of the foreign currency changing unfavorably. These risks may be in excess of the amounts reflected in the Statement of Assets and Liabilities.
NOTE 2—Advisory Fees and Other Fees Paid to Affiliates
The Trust has entered into a master investment advisory agreement with Invesco Advisers, Inc. (the “Adviser” or “Invesco”). Under the terms of the investment advisory agreement, the Fund pays an advisory fee to the Adviser based on the annual rate of the Fund’s average daily net assets as follows:
| | | | | | | | |
| Average Daily Net Assets | | Rate | |
First $500 million | | | 0 | .72% | | | | |
Next $535 million | | | 0 | .715% | | | | |
Next $31.965 billion | | | 0 | .65% | | | | |
Over $33 billion | | | 0 | .64% | | | | |
For the year ended April 30, 2017, the effective advisory fees incurred by the Fund was 0.69%.
Under the terms of a master sub-advisory agreement between the Adviser and each of Invesco Asset Management Deutschland GmbH, Invesco Asset Management Limited, Invesco Asset Management (Japan) Limited, Invesco Hong Kong Limited, Invesco Senior Secured Management, Inc. and Invesco Canada Ltd. (collectively, the “Affiliated Sub-Advisers”) the Adviser, not the Fund, will pay 40% of the fees paid to the Adviser to any such Affiliated Sub-Adviser(s) that provide(s) discretionary investment management services to the Fund based on the percentage of assets allocated to such Affiliated Sub-Adviser(s).
The Adviser has contractually agreed, through at least June 30, 2018, to waive advisory fees and/or reimburse expenses of all shares to the extent necessary to limit total annual fund operating expenses after fee waiver and/or expense reimbursement (excluding certain items discussed below) of Class A, Class B, Class C, Class R, Class Y, Class R5 and Class R6 shares to 2.00%, 2.75%, 2.75%, 2.25%, 1.75%, 1.75% and 1.75%, respectively, of average daily net assets (the “expense limits”). In determining the Adviser’s obligation to waive advisory fees and/or reimburse expenses, the following expenses are not taken into account, and could cause the total annual fund operating expenses after fee waiver and/or expense reimbursement to exceed the numbers reflected above: (1) interest; (2) taxes; (3) dividend expense on short sales; (4) extraordinary or non-routine items, including litigation expenses; and (5) expenses that the Fund has incurred but did not actually pay because of an expense offset arrangement. Unless Invesco continues the fee waiver agreement, it will terminate on June 30, 2018. During its term, the fee waiver agreement cannot be terminated or amended to increase the expense limits without approval of the Board of Trustees. The Adviser did not waive fees and/or reimburse expenses during the period under these expense limits.
Further, the Adviser has contractually agreed, through at least June 30, 2019, to waive the advisory fee payable by the Fund in an amount equal to 100% of the net advisory fees the Adviser receives from the affiliated money market funds on investments by the Fund of uninvested cash in such affiliated money market funds.
For the year ended April 30, 2017, the Adviser waived advisory fees of $63,443.
The Trust has entered into a master administrative services agreement with Invesco pursuant to which the Fund has agreed to pay Invesco for certain administrative costs incurred in providing accounting services to the Fund. For the year ended April 30, 2017, expenses incurred under the agreement are shown in the Statement of Operations as Administrative services fees.
The Trust has entered into a transfer agency and service agreement with Invesco Investment Services, Inc. (“IIS”) pursuant to which the Fund has agreed to pay IIS a fee for providing transfer agency and shareholder services to the Fund and reimburse IIS for certain expenses incurred by IIS in the course of providing such services. IIS may make payments to intermediaries that provide omnibus account services, sub-accounting services and/or networking services. All fees payable by IIS to intermediaries that provide omnibus account services or sub-accounting are charged back to the Fund, subject to certain limitations approved by the Trust’s Board of Trustees. For the year ended April 30, 2017, expenses incurred under the agreement are shown in the Statement of Operations as Transfer agent fees.
Shares of the Fund are distributed by Invesco Distributors, Inc. (“IDI”). The Fund has adopted a distribution plan pursuant to Rule 12b-1 under the 1940 Act, and a service plan (collectively, the “Plans”) for Class A, Class B, Class C and Class R shares to compensate IDI for the sale, distribution, shareholder servicing and maintenance of shareholder accounts for these shares. Under the Plans, the Fund will incur annual fees of up to 0.25% of Class A average daily net assets, up to 1.00% each of Class B and Class C average daily net assets and up to 0.50% of Class R average daily net assets.
With respect to Class B and Class C shares, the Fund is authorized to reimburse in future years any distribution related expenses that exceed the maximum annual reimbursement rate for such class, so long as such reimbursement does not cause the Fund to exceed the Class B and Class C maximum annual reimbursement rate, respectively. With respect to Class A shares, distribution related expenses that exceed the maximum annual reimbursement rate for such class are not carried forward to future years and the Fund will not reimburse IDI for any such expenses.
For the year ended April 30, 2017, expenses incurred under these agreements are shown in the Statement of Operations as Distribution fees.
Front-end sales commissions and CDSC (collectively, the “sales charges”) are not recorded as expenses of the Fund. Front-end sales commissions are deducted from proceeds from the sales of Fund shares prior to investment in Class A shares of the Fund. CDSC are deducted from redemption proceeds prior to remittance to the shareholder. During the year ended April 30, 2017, IDI advised the Fund that IDI retained $350,378 in front-end sales commissions from the sale of Class A shares and $25,010, $620 and $4,193 from Class A, Class B and Class C shares, respectively, for CDSC imposed on redemptions by shareholders.
16 Invesco American Value Fund
For the year ended April 30, 2017, the Fund incurred $30,055 in brokerage commissions with Invesco Capital Markets, Inc., an affiliate of the Adviser and IDI, for portfolio transactions executed on behalf of the Fund.
Certain officers and trustees of the Trust are officers and directors of the Adviser, IIS and/or IDI.
NOTE 3—Additional Valuation Information
GAAP defines fair value as the price that would be received to sell an asset or paid to transfer a liability in an orderly transaction between market participants at the measurement date, under current market conditions. GAAP establishes a hierarchy that prioritizes the inputs to valuation methods, giving the highest priority to readily available unadjusted quoted prices in an active market for identical assets (Level 1) and the lowest priority to significant unobservable inputs (Level 3), generally when market prices are not readily available or are unreliable. Based on the valuation inputs, the securities or other investments are tiered into one of three levels. Changes in valuation methods may result in transfers in or out of an investment’s assigned level:
| | Level 1 — | Prices are determined using quoted prices in an active market for identical assets. |
| | Level 2 — | Prices are determined using other significant observable inputs. Observable inputs are inputs that other market participants may use in pricing a security. These may include quoted prices for similar securities, interest rates, prepayment speeds, credit risk, yield curves, loss severities, default rates, discount rates, volatilities and others. |
| | Level 3 — | Prices are determined using significant unobservable inputs. In situations where quoted prices or observable inputs are unavailable (for example, when there is little or no market activity for an investment at the end of the period), unobservable inputs may be used. Unobservable inputs reflect the Fund’s own assumptions about the factors market participants would use in determining fair value of the securities or instruments and would be based on the best available information. |
As of April 30, 2017, all of the securities in this Fund were valued based on Level 1 inputs (see the Schedule of Investments for security categories). The level assigned to the securities valuations may not be an indication of the risk or liquidity associated with investing in those securities. Because of the inherent uncertainties of valuation, the values reflected in the financial statements may materially differ from the value received upon actual sale of those investments.
NOTE 4—Security Transactions with Affiliated Funds
The Fund is permitted to purchase or sell securities from or to certain other Invesco Funds under specified conditions outlined in procedures adopted by the Board of Trustees of the Trust. The procedures have been designed to ensure that any purchase or sale of securities by the Fund from or to another fund or portfolio that is or could be considered an affiliate by virtue of having a common investment adviser (or affiliated investment advisers), common Trustees and/or common officers complies with Rule 17a-7 of the 1940 Act. Further, as defined under the procedures, each transaction is effected at the current market price. Pursuant to these procedures, for the year ended April 30, 2017, the Fund engaged in securities purchases of $1,670,454.
NOTE 5—Expense Offset Arrangement(s)
The expense offset arrangement is comprised of transfer agency credits which result from balances in demand deposit accounts used by the transfer agent for clearing shareholder transactions. For the year ended April 30, 2017, the Fund received credits from this arrangement, which resulted in the reduction of the Fund’s total expenses of $10,175.
NOTE 6—Trustees’ and Officers’ Fees and Benefits
Trustees’ and Officers’ Fees and Benefits include amounts accrued by the Fund to pay remuneration to certain Trustees and Officers of the Fund. Trustees have the option to defer compensation payable by the Fund, and Trustees’ and Officers’ Fees and Benefits also include amounts accrued by the Fund to fund such deferred compensation amounts. Those Trustees who defer compensation have the option to select various Invesco Funds in which their deferral accounts shall be deemed to be invested. Finally, certain current Trustees were eligible to participate in a retirement plan that provided for benefits to be paid upon retirement to Trustees over a period of time based on the number of years of service. The Fund may have certain former Trustees who also participate in a retirement plan and receive benefits under such plan. Trustees’ and Officers’ Fees and Benefits include amounts accrued by the Fund to fund such retirement benefits. Obligations under the deferred compensation and retirement plans represent unsecured claims against the general assets of the Fund.
NOTE 7—Cash Balances
The Fund is permitted to temporarily carry a negative or overdrawn balance in its account with State Street Bank and Trust Company, the custodian bank. Such balances, if any at period-end, are shown in the Statement of Assets and Liabilities under the payable caption Amount due custodian. To compensate the custodian bank for such overdrafts, the overdrawn Fund may either (1) leave funds as a compensating balance in the account so the custodian bank can be compensated by earning the additional interest; or (2) compensate by paying the custodian bank at a rate agreed upon by the custodian bank and Invesco, not to exceed the contractually agreed upon rate.
17 Invesco American Value Fund
NOTE 8—Distributions to Shareholders and Tax Components of Net Assets
Tax Character of Distributions to Shareholders Paid During the Fiscal Years Ended April 30, 2017 and 2016:
| | | | | | | | |
| | | 2017 | | | 2016 | |
Ordinary income | | $ | 5,578,848 | | | $ | 4,770,373 | |
Long-term capital gain | | | 15,658,254 | | | | 139,074,510 | |
Total distributions | | $ | 21,237,102 | | | $ | 143,844,883 | |
Tax Components of Net Assets at Period-End:
| | | | |
| | | 2017 | |
Undistributed ordinary income | | $ | 10,187,559 | |
Undistributed long-term gain | | | 38,948,398 | |
Net unrealized appreciation — investments | | | 281,918,549 | |
Net unrealized appreciation — other investments | | | 8 | |
Temporary book/tax differences | | | (685,878 | ) |
Shares of beneficial interest | | | 1,481,505,219 | |
Total net assets | | $ | 1,811,873,855 | |
The difference between book-basis and tax-basis unrealized appreciation (depreciation) is due to differences in the timing of recognition of gains and losses on investments for tax and book purposes. The Fund’s net unrealized appreciation difference is attributable primarily to wash sales.
The temporary book/tax differences are a result of timing differences between book and tax recognition of income and/or expenses. The Fund’s temporary book/tax differences are the result of the trustee deferral of compensation and retirement plan benefits.
Capital loss carryforward is calculated and reported as of a specific date. Results of transactions and other activity after that date may affect the amount of capital loss carryforward actually available for the Fund to utilize. Capital losses generated in years beginning after December 22, 2010 can be carried forward for an unlimited period, whereas previous losses expire in eight tax years. Capital losses with an expiration period may not be used to offset capital gains until all net capital losses without an expiration date have been utilized. Capital loss carryforwards with no expiration date will retain their character as either short-term or long-term capital losses instead of as short-term capital losses as under prior law. The ability to utilize capital loss carryforwards in the future may be limited under the Internal Revenue Code and related regulations based on the results of future transactions.
The Fund does not have a capital loss carryforward as of April 30, 2017.
NOTE 9—Investment Securities
The aggregate amount of investment securities (other than short-term securities, U.S. Treasury obligations and money market funds, if any) purchased and sold by the Fund during the year ended April 30, 2017 was $798,348,642 and $1,271,046,400, respectively. Cost of investments on a tax basis includes the adjustments for financial reporting purposes as of the most recently completed federal income tax reporting period-end.
| | | | |
| Unrealized Appreciation (Depreciation) of Investment Securities on a Tax Basis | |
Aggregate unrealized appreciation of investment securities | | $ | 340,013,257 | |
Aggregate unrealized (depreciation) of investment securities | | | (58,094,708 | ) |
Net unrealized appreciation of investment securities | | $ | 281,918,549 | |
Cost of investments for tax purposes is $1,513,081,824.
NOTE 10—Reclassification of Permanent Differences
Primarily as a result of differing book/tax treatment of REITs, on April 30, 2017, undistributed net investment income was decreased by $1,266,090 and undistributed net realized gain was increased by $1,266,090. This reclassification had no effect on the net assets of the Fund.
18 Invesco American Value Fund
NOTE 11—Share Information
| | | | | | | | | | | | | | | | |
| | | Summary of Share Activity | |
| | | Years ended April 30, | |
| | | 2017(a) | | | 2016 | |
| | | Shares | | | Amount | | | Shares | | | Amount | |
Sold: | | | | | | | | | | | | | | | | |
Class A | | | 4,246,380 | | | $ | 155,189,564 | | | | 7,137,696 | | | $ | 258,087,074 | |
Class B | | | 6,942 | | | | 228,422 | | | | 16,426 | | | | 533,330 | |
Class C | | | 427,710 | | | | 13,138,847 | | | | 699,117 | | | | 21,849,862 | |
Class R | | | 279,191 | | | | 10,147,286 | | | | 823,663 | | | | 29,130,609 | |
Class Y | | | 4,047,064 | | | | 149,993,681 | | | | 4,256,340 | | | | 155,553,783 | |
Class R5 | | | 1,103,416 | | | | 40,082,475 | | | | 2,050,968 | | | | 72,210,351 | |
Class R6 | | | 1,421,759 | | | | 52,594,879 | | | | 1,185,460 | | | | 44,450,761 | |
| | | | |
Issued as reinvestment of dividends: | | | | | | | | | | | | | | | | |
Class A | | | 280,598 | | | | 10,794,634 | | | | 2,278,232 | | | | 74,938,723 | |
Class B | | | 3,444 | | | | 117,339 | | | | 41,391 | | | | 1,207,602 | |
Class C | | | 28,892 | | | | 938,691 | | | | 294,279 | | | | 8,222,165 | |
Class R | | | 11,112 | | | | 424,916 | | | | 141,203 | | | | 4,615,933 | |
Class Y | | | 97,911 | | | | 3,790,123 | | | | 912,244 | | | | 30,244,433 | |
Class R5 | | | 42,387 | | | | 1,642,079 | | | | 199,420 | | | | 6,618,773 | |
Class R6 | | | 61,263 | | | | 2,375,155 | | | | 299,276 | | | | 9,949,333 | |
| | | | |
Automatic conversion of Class B shares to Class A shares: | | | | | | | | | | | | | | | | |
Class A | | | 143,728 | | | | 5,309,911 | | | | 180,123 | | | | 6,522,318 | |
Class B | | | (162,201 | ) | | | (5,309,911 | ) | | | (202,032 | ) | | | (6,522,318 | ) |
| | | | |
Reacquired: | | | | | | | | | | | | | | | | |
Class A | | | (10,888,219 | ) | | | (399,978,507 | ) | | | (7,323,337 | ) | | | (255,825,882 | ) |
Class B | | | (73,863 | ) | | | (2,397,245 | ) | | | (88,825 | ) | | | (2,886,033 | ) |
Class C | | | (1,029,271 | ) | | | (31,759,570 | ) | | | (978,954 | ) | | | (29,420,133 | ) |
Class R | | | (1,022,324 | ) | | | (36,766,197 | ) | | | (906,869 | ) | | | (32,185,314 | ) |
Class Y | | | (7,682,945 | ) | | | (279,330,863 | ) | | | (5,375,982 | ) | | | (187,500,654 | ) |
Class R5 | | | (2,660,958 | ) | | | (98,969,220 | ) | | | (846,727 | ) | | | (31,468,341 | ) |
Class R6 | | | (1,386,715 | ) | | | (51,822,445 | ) | | | (855,945 | ) | | | (30,258,559 | ) |
Net increase (decrease) in share activity | | | (12,704,699 | ) | | $ | (459,565,956 | ) | | | 3,937,167 | | | $ | 148,067,816 | |
| (a) | There are entities that are record owners of more than 5% of the outstanding shares of the Fund and in the aggregate own 40% of the outstanding shares of the Fund. IDI has an agreement with these entities to sell Fund shares. The Fund, Invesco and/or Invesco affiliates may make payments to these entities, which are considered to be related to the Fund, for providing services to the Fund, Invesco and/or Invesco affiliates including but not limited to services such as securities brokerage, distribution, third party record keeping and account servicing. The Fund has no knowledge as to whether all or any portion of the shares owned of record by these entities are also owned beneficially. |
19 Invesco American Value Fund
NOTE 12—Financial Highlights
The following schedule presents financial highlights for a share of the Fund outstanding throughout the periods indicated.
| | | | | | | | | | | | | | | | | | | | | | | | | | | | | | | | | | | | | | | | | | | | | | | | | | | | | | | | |
| | | Net asset
value,
beginning
of period | | | Net
investment
income
(loss)(a) | | | Net gains
(losses)
on securities
(both
realized and
unrealized) | | | Total from
investment
operations | | | Dividends
from net
investment
income | | | Distributions
from net
realized
gains | | | Total
distributions | | | Net asset
value, end
of period | | | Total
return(b) | | | Net assets,
end of period
(000’s omitted) | | | Ratio of
expenses
to average
net assets
with fee waivers
and/or expenses
absorbed | | | Ratio of
expenses
to average net
assets without
fee waivers
and/or expenses
absorbed | | | Ratio of net
investment
income (loss)
to average
net assets | | | Portfolio
turnover(c) | |
Class A | |
Year ended 04/30/17 | | $ | 34.01 | | | $ | 0.20 | | | $ | 4.70 | | | $ | 4.90 | | | $ | (0.08 | ) | | $ | (0.31 | ) | | $ | (0.39 | ) | | $ | 38.52 | | | | 14.40 | % | | $ | 1,031,600 | | | | 1.21 | %(d) | | | 1.21 | %(d) | | | 0.53 | %(d) | | | 42 | % |
Year ended 04/30/16 | | | 40.44 | | | | 0.09 | | | | (4.06 | ) | | | (3.97 | ) | | | (0.01 | ) | | | (2.45 | ) | | | (2.46 | ) | | | 34.01 | | | | (9.62 | ) | | | 1,122,286 | | | | 1.19 | | | | 1.20 | | | | 0.26 | | | | 28 | |
Year ended 04/30/15 | | | 40.11 | | | | 0.00 | | | | 4.23 | | | | 4.23 | | | | (0.02 | ) | | | (3.88 | ) | | | (3.90 | ) | | | 40.44 | | | | 11.27 | | | | 1,242,480 | | | | 1.19 | | | | 1.20 | | | | 0.01 | | | | 34 | |
Year ended 04/30/14 | | | 35.77 | | | | 0.06 | | | | 7.14 | | | | 7.20 | | | | (0.12 | ) | | | (2.74 | ) | | | (2.86 | ) | | | 40.11 | | | | 20.62 | | | | 1,086,506 | | | | 1.19 | | | | 1.20 | | | | 0.15 | | | | 46 | |
Year ended 04/30/13 | | | 30.90 | | | | 0.17 | | | | 4.86 | | | | 5.03 | | | | (0.16 | ) | | | — | | | | (0.16 | ) | | | 35.77 | | | | 16.35 | | | | 846,516 | | | | 1.22 | | | | 1.23 | | | | 0.54 | | | | 28 | |
Class B | | | | | | | | | | | | | | | | | | | | | | | | | | | | | | | | | | | | | | | | | | | | | | | | | | | | | | | | |
Year ended 04/30/17 | | | 30.16 | | | | 0.17 | | | | 4.18 | | | | 4.35 | | | | (0.08 | ) | | | (0.31 | ) | | | (0.39 | ) | | | 34.12 | | | | 14.41 | (e) | | | 7,265 | | | | 1.21 | (d)(e) | | | 1.21 | (d)(e) | | | 0.53 | (d)(e) | | | 42 | |
Year ended 04/30/16 | | | 36.18 | | | | 0.08 | | | | (3.64 | ) | | | (3.56 | ) | | | (0.01 | ) | | | (2.45 | ) | | | (2.46 | ) | | | 30.16 | | | | (9.62 | )(e) | | | 13,230 | | | | 1.19 | (e) | | | 1.20 | (e) | | | 0.26 | (e) | | | 28 | |
Year ended 04/30/15 | | | 36.28 | | | | 0.00 | | | | 3.80 | | | | 3.80 | | | | (0.02 | ) | | | (3.88 | ) | | | (3.90 | ) | | | 36.18 | | | | 11.27 | (e) | | | 24,302 | | | | 1.19 | (e) | | | 1.20 | (e) | | | 0.01 | (e) | | | 34 | |
Year ended 04/30/14 | | | 32.58 | | | | 0.05 | | | | 6.50 | | | | 6.55 | | | | (0.11 | ) | | | (2.74 | ) | | | (2.85 | ) | | | 36.28 | | | | 20.63 | (e) | | | 32,127 | | | | 1.19 | (e) | | | 1.20 | (e) | | | 0.15 | (e) | | | 46 | |
Year ended 04/30/13 | | | 28.15 | | | | 0.16 | | | | 4.42 | | | | 4.58 | | | | (0.15 | ) | | | — | | | | (0.15 | ) | | | 32.58 | | | | 16.33 | (e) | | | 36,720 | | | | 1.22 | (e) | | | 1.23 | (e) | | | 0.54 | (e) | | | 28 | |
Class C | | | | | | | | | | | | | | | | | | | | | | | | | | | | | | | | | | | | | | | | | | | | | | | | | | | | | | | | |
Year ended 04/30/17 | | | 28.83 | | | | (0.06 | ) | | | 3.98 | | | | 3.92 | | | | — | | | | (0.31 | ) | | | (0.31 | ) | | | 32.44 | | | | 13.59 | (f) | | | 98,096 | | | | 1.94 | (d)(f) | | | 1.94 | (d)(f) | | | (0.20 | )(d)(f) | | | 42 | |
Year ended 04/30/16 | | | 34.95 | | | | (0.15 | ) | | | (3.52 | ) | | | (3.67 | ) | | | — | | | | (2.45 | ) | | | (2.45 | ) | | | 28.83 | | | | (10.28 | )(f) | | | 103,706 | | | | 1.93 | (f) | | | 1.94 | (f) | | | (0.48 | )(f) | | | 28 | |
Year ended 04/30/15 | | | 35.41 | | | | (0.26 | ) | | | 3.68 | | | | 3.42 | | | | — | | | | (3.88 | ) | | | (3.88 | ) | | | 34.95 | | | | 10.44 | (f) | | | 125,201 | | | | 1.92 | (f) | | | 1.93 | (f) | | | (0.72 | )(f) | | | 34 | |
Year ended 04/30/14 | | | 32.00 | | | | (0.20 | ) | | | 6.37 | | | | 6.17 | | | | (0.02 | ) | | | (2.74 | ) | | | (2.76 | ) | | | 35.41 | | | | 19.76 | (f) | | | 111,455 | | | | 1.91 | (f) | | | 1.92 | (f) | | | (0.57 | )(f) | | | 46 | |
Year ended 04/30/13 | | | 27.70 | | | | (0.06 | ) | | | 4.36 | | | | 4.30 | | | | — | | | | — | | | | — | | | | 32.00 | | | | 15.52 | (f) | | | 88,519 | | | | 1.97 | | | | 1.98 | | | | (0.21 | ) | | | 28 | |
Class R | | | | | | | | | | | | | | | | | | | | | | | | | | | | | | | | | | | | | | | | | | | | | | | | | | | | | | | | |
Year ended 04/30/17 | | | 33.80 | | | | 0.10 | | | | 4.67 | | | | 4.77 | | | | — | | | | (0.31 | ) | | | (0.31 | ) | | | 38.26 | | | | 14.11 | | | | 46,937 | | | | 1.46 | (d) | | | 1.46 | (d) | | | 0.28 | (d) | | | 42 | |
Year ended 04/30/16 | | | 40.29 | | | | 0.00 | | | | (4.04 | ) | | | (4.04 | ) | | | — | | | | (2.45 | ) | | | (2.45 | ) | | | 33.80 | | | | (9.82 | ) | | | 66,207 | | | | 1.44 | | | | 1.45 | | | | 0.01 | | | | 28 | |
Year ended 04/30/15 | | | 40.06 | | | | (0.10 | ) | | | 4.21 | | | | 4.11 | | | | — | | | | (3.88 | ) | | | (3.88 | ) | | | 40.29 | | | | 10.97 | | | | 76,594 | | | | 1.44 | | | | 1.45 | | | | (0.24 | ) | | | 34 | |
Year ended 04/30/14 | | | 35.74 | | | | (0.04 | ) | | | 7.15 | | | | 7.11 | | | | (0.05 | ) | | | (2.74 | ) | | | (2.79 | ) | | | 40.06 | | | | 20.34 | | | | 67,420 | | | | 1.44 | | | | 1.45 | | | | (0.10 | ) | | | 46 | |
Year ended 04/30/13 | | | 30.87 | | | | 0.10 | | | | 4.86 | | | | 4.96 | | | | (0.09 | ) | | | — | | | | (0.09 | ) | | | 35.74 | | | | 16.08 | | | | 58,086 | | | | 1.47 | | | | 1.48 | | | | 0.29 | | | | 28 | |
Class Y | | | | | | | | | | | | | | | | | | | | | | | | | | | | | | | | | | | | | | | | | | | | | | | | | | | | | | | | |
Year ended 04/30/17 | | | 34.25 | | | | 0.29 | | | | 4.73 | | | | 5.02 | | | | (0.16 | ) | | | (0.31 | ) | | | (0.47 | ) | | | 38.80 | | | | 14.66 | | | | 375,626 | | | | 0.96 | (d) | | | 0.96 | (d) | | | 0.78 | (d) | | | 42 | |
Year ended 04/30/16 | | | 40.62 | | | | 0.18 | | | | (4.07 | ) | | | (3.89 | ) | | | (0.03 | ) | | | (2.45 | ) | | | (2.48 | ) | | | 34.25 | | | | (9.36 | ) | | | 452,703 | | | | 0.94 | | | | 0.95 | | | | 0.51 | | | | 28 | |
Year ended 04/30/15 | | | 40.26 | | | | 0.11 | | | | 4.24 | | | | 4.35 | | | | (0.11 | ) | | | (3.88 | ) | | | (3.99 | ) | | | 40.62 | | | | 11.55 | | | | 545,456 | | | | 0.94 | | | | 0.95 | | | | 0.26 | | | | 34 | |
Year ended 04/30/14 | | | 35.90 | | | | 0.16 | | | | 7.16 | | | | 7.32 | | | | (0.22 | ) | | | (2.74 | ) | | | (2.96 | ) | | | 40.26 | | | | 20.91 | | | | 452,580 | | | | 0.94 | | | | 0.95 | | | | 0.40 | | | | 46 | |
Year ended 04/30/13 | | | 31.01 | | | | 0.25 | | | | 4.88 | | | | 5.13 | | | | (0.24 | ) | | | — | | | | (0.24 | ) | | | 35.90 | | | | 16.65 | | | | 285,560 | | | | 0.97 | | | | 0.98 | | | | 0.79 | | | | 28 | |
Class R5 | | | | | | | | | | | | | | | | | | | | | | | | | | | | | | | | | | | | | | | | | | | | | | | | | | | | | | | | |
Year ended 04/30/17 | | | 34.29 | | | | 0.33 | | | | 4.74 | | | | 5.07 | | | | (0.21 | ) | | | (0.31 | ) | | | (0.52 | ) | | | 38.84 | | | | 14.77 | | | | 86,569 | | | | 0.85 | (d) | | | 0.85 | (d) | | | 0.89 | (d) | | | 42 | |
Year ended 04/30/16 | | | 40.63 | | | | 0.22 | | | | (4.07 | ) | | | (3.85 | ) | | | (0.04 | ) | | | (2.45 | ) | | | (2.49 | ) | | | 34.29 | | | | (9.26 | ) | | | 128,357 | | | | 0.82 | | | | 0.83 | | | | 0.63 | | | | 28 | |
Year ended 04/30/15 | | | 40.28 | | | | 0.15 | | | | 4.24 | | | | 4.39 | | | | (0.16 | ) | | | (3.88 | ) | | | (4.04 | ) | | | 40.63 | | | | 11.66 | | | | 95,082 | | | | 0.82 | | | | 0.83 | | | | 0.38 | | | | 34 | |
Year ended 04/30/14 | | | 35.91 | | | | 0.20 | | | | 7.18 | | | | 7.38 | | | | (0.27 | ) | | | (2.74 | ) | | | (3.01 | ) | | | 40.28 | | | | 21.06 | | | | 72,753 | | | | 0.84 | | | | 0.85 | | | | 0.50 | | | | 46 | |
Year ended 04/30/13 | | | 31.02 | | | | 0.29 | | | | 4.89 | | | | 5.18 | | | | (0.29 | ) | | | — | | | | (0.29 | ) | | | 35.91 | | | | 16.81 | | | | 26,519 | | | | 0.86 | | | | 0.87 | | | | 0.90 | | | | 28 | |
Class R6 | | | | | | | | | | | | | | | | | | | | | | | | | | | | | | | | | | | | | | | | | | | | | | | | | | | | | | | | |
Year ended 04/30/17 | | | 34.32 | | | | 0.37 | | | | 4.74 | | | | 5.11 | | | | (0.24 | ) | | | (0.31 | ) | | | (0.55 | ) | | | 38.88 | | | | 14.88 | | | | 165,781 | | | | 0.76 | (d) | | | 0.76 | (d) | | | 0.98 | (d) | | | 42 | |
Year ended 04/30/16 | | | 40.64 | | | | 0.25 | | | | (4.07 | ) | | | (3.82 | ) | | | (0.05 | ) | | | (2.45 | ) | | | (2.50 | ) | | | 34.32 | | | | (9.19 | ) | | | 143,003 | | | | 0.73 | | | | 0.74 | | | | 0.72 | | | | 28 | |
Year ended 04/30/15 | | | 40.28 | | | | 0.19 | | | | 4.25 | | | | 4.44 | | | | (0.20 | ) | | | (3.88 | ) | | | (4.08 | ) | | | 40.64 | | | | 11.77 | | | | 143,793 | | | | 0.73 | | | | 0.74 | | | | 0.47 | | | | 34 | |
Year ended 04/30/14 | | | 35.90 | | | | 0.23 | | | | 7.18 | | | | 7.41 | | | | (0.29 | ) | | | (2.74 | ) | | | (3.03 | ) | | | 40.28 | | | | 21.19 | | | | 85,325 | | | | 0.75 | | | | 0.76 | | | | 0.59 | | | | 46 | |
Year ended 04/30/13(g) | | | 31.40 | | | | 0.22 | | | | 4.45 | | | | 4.67 | | | | (0.17 | ) | | | — | | | | (0.17 | ) | | | 35.90 | | | | 14.92 | | | | 53,538 | | | | 0.75 | (h) | | | 0.76 | (h) | | | 1.01 | (h) | | | 28 | |
| (a) | Calculated using average shares outstanding. |
| (b) | Includes adjustments in accordance with accounting principles generally accepted in the United States of America and as such, the net asset value for financial reporting purposes and the returns based upon those net asset values may differ from the net asset value and returns for shareholder transactions. Does not include sales charges and is not annualized for periods less than one year, if applicable. |
| (c) | Portfolio turnover is calculated at the fund level and is not annualized for periods less than one year, if applicable. |
| (d) | Ratios are based on average daily net assets (000’s omitted) of $1,101,606, $10,827, $102,728, $55,024, $388,760, $119,031 and $160,242 for Class A, Class B, Class C, Class R, Class Y, Class R5 and Class R6 shares, respectively. |
| (e) | The total return, ratio of expenses to average net assets and ratio of net investment income (loss) to average net assets reflect actual 12b-1 fees of 0.25%, 0.25%, 0.25%, 0.25% and 0.25% for the years ended April 30, 2017, 2016, 2015, 2014 and 2013, respectively. |
| (f) | The total return, ratio of expenses to average net assets and ratio of net investment income (loss) to average net assets reflect actual 12b-1 fees of 0.97%, 0.99%, 0.98% and 0.98% for the years ended April 30, 2017, 2016, 2015 and 2014, respectively. |
| (g) | Commencement date of September 24, 2012 for Class R6 shares. |
20 Invesco American Value Fund
Report of Independent Registered Public Accounting Firm
To the Board of Trustees of AIM Sector Funds (Invesco Sector Funds)
and Shareholders of the Invesco American Value Fund:
In our opinion, the accompanying statement of assets and liabilities, including the schedule of investments, and the related statements of operations and of changes in net assets and the financial highlights present fairly, in all material respects, the financial position of the Invesco American Value Fund (one of the portfolios constituting the AIM Sector Funds (Invesco Sector Funds), hereafter referred to as the “Fund”) as of April 30, 2017, the results of its operations for the year then ended, the changes in its net assets for each of the two years in the period then ended and the financial highlights for each of the five years in the period then ended, in conformity with accounting principles generally accepted in the United States of America. These financial statements and financial highlights (hereafter referred to as “financial statements”) are the responsibility of the Fund’s management. Our responsibility is to express an opinion on these financial statements based on our audits. We conducted our audits of these financial statements in accordance with the standards of the Public Company Accounting Oversight Board (United States). Those standards require that we plan and perform the audit to obtain reasonable assurance about whether the financial statements are free of material misstatement. An audit includes examining, on a test basis, evidence supporting the amounts and disclosures in the financial statements, assessing the accounting principles used and significant estimates made by management, and evaluating the overall financial statement presentation. We believe that our audits, which included confirmation of securities as of April 30, 2017 by correspondence with the custodian and brokers, provide a reasonable basis for our opinion.
PricewaterhouseCoopers LLP
Houston, TX
June 23, 2017
21 Invesco American Value Fund
Calculating your ongoing Fund expenses
Example
As a shareholder of the Fund, you incur two types of costs: (1) transaction costs, which may include sales charges (loads) on purchase payments or contingent deferred sales charges on redemptions, if any; and (2) ongoing costs, including management fees, distribution and/or service (12b-1) fees, and other Fund expenses. This example is intended to help you understand your ongoing costs (in dollars) of investing in the Fund and to compare these costs with ongoing costs of investing in other mutual funds. The example is based on an investment of $1,000 invested at the beginning of the period and held for the entire period November 1, 2016 through April 30, 2017.
Actual expenses
The table below provides information about actual account values and actual expenses. You may use the information in this table, together with the amount you invested, to estimate the expenses that you paid over the period. Simply divide your account value by $1,000 (for example, an $8,600 account value divided by $1,000 = 8.6), then multiply the result by the number in the table under the heading entitled “Actual Expenses Paid During Period” to estimate the expenses you paid on your account during this period.
Hypothetical example for comparison purposes
The table below also provides information about hypothetical account values and hypothetical expenses based on the Fund’s actual expense ratio and an assumed rate of return of 5% per year before expenses, which is not the Fund’s actual return.
The hypothetical account values and expenses may not be used to estimate the actual ending account balance or expenses you paid for the period. You may use this information to compare the ongoing costs of investing in the Fund and other funds. To do so, compare this 5% hypothetical example with the 5% hypothetical examples that appear in the shareholder reports of the other funds.
Please note that the expenses shown in the table are meant to highlight your ongoing costs only and do not reflect any transaction costs, such as sales charges (loads) on purchase payments or contingent deferred sales charges on redemptions, if any. Therefore, the hypothetical information is useful in comparing ongoing costs only, and will not help you determine the relative total costs of owning different funds. In addition, if these transaction costs were included, your costs would have been higher.
| | | | | | | | | | | | | | | | | | | | | | | | |
| Class | | Beginning
Account Value
(11/01/16) | | | ACTUAL | | | HYPOTHETICAL (5% annual return before expenses) | | | Annualized
Expense
Ratio | |
| | | Ending
Account Value
(04/30/17)1 | | | Expenses
Paid During
Period2 | | | Ending
Account Value
(04/30/17) | | | Expenses
Paid During
Period2 | | |
| A | | $ | 1,000.00 | | | $ | 1,112.90 | | | $ | 6.44 | | | $ | 1,018.70 | | | $ | 6.16 | | | | 1.23 | % |
| B | | | 1,000.00 | | | | 1,113.10 | | | | 6.44 | | | | 1,018.70 | | | | 6.16 | | | | 1.23 | |
| C | | | 1,000.00 | | | | 1,108.90 | | | | 10.25 | | | | 1,015.08 | | | | 9.79 | | | | 1.96 | |
| R | | | 1,000.00 | | | | 1,111.80 | | | | 7.75 | | | | 1,017.46 | | | | 7.40 | | | | 1.48 | |
| Y | | | 1,000.00 | | | | 1,114.40 | | | | 5.14 | | | | 1,019.93 | | | | 4.91 | | | | 0.98 | |
| R5 | | | 1,000.00 | | | | 1,115.20 | | | | 4.56 | | | | 1,020.48 | | | | 4.36 | | | | 0.87 | |
| R6 | | | 1,000.00 | | | | 1,115.60 | | | | 4.14 | | | | 1,020.88 | | | | 3.96 | | | | 0.79 | |
| 1 | The actual ending account value is based on the actual total return of the Fund for the period November 1, 2016 through April 30, 2017, after actual expenses and will differ from the hypothetical ending account value which is based on the Fund’s expense ratio and a hypothetical annual return of 5% before expenses. |
| 2 | Expenses are equal to the Fund’s annualized expense ratio as indicated above multiplied by the average account value over the period, multiplied by 181/365 to reflect the most recent fiscal half year. |
22 Invesco American Value Fund
Tax Information
Form 1099-DIV, Form 1042-S and other year-end tax information provide shareholders with actual calendar year amounts that should be included in their tax returns. Shareholders should consult their tax advisors.
The following distribution information is being provided as required by the Internal Revenue Code or to meet a specific state’s requirement.
The Fund designates the following amounts or, if subsequently determined to be different, the maximum amount allowable for its fiscal year ended April 30, 2017:
| | | | |
Federal and State Income Tax | |
Long-Term Capital Gain Distributions | | $ | 15,658,254 | |
Qualified Dividend Income* | | | 100 | % |
Corporate Dividends Received Deduction* | | | 100 | % |
U.S. Treasury Obligations* | | | 0.00 | % |
| | * | The above percentages are based on ordinary income dividends paid to shareholders during the Fund’s fiscal year. |
23 Invesco American Value Fund
Proxy Results
A Special Joint Meeting (“Meeting”) of Shareholders of Invesco American Value Fund, an investment portfolio of AIM Sector Funds (Invesco Sector Funds), a Delaware statutory trust (“Trust”), was held on March 9, 2017. The Meeting was held for the following purpose:
| (1) | Elect 15 trustees to the Board, each of whom will serve until his or her successor is elected and qualified. |
| (2) | Approve an amendment to the Trust’s Agreement and Declaration of Trust that would permit fund mergers and other significant transactions upon the Board’s approval but without shareholder approval of such transactions. |
The results of the voting on the above matters were as follows:
| | | | | | | | | | | | | | | | | | |
| | | Matters | | | | | | | | Votes For | | | Votes
Withheld | |
| (1)* | | David C. Arch | | | | 478,210,140 | | | | 13,802,825 | |
| | James T. Bunch | | | | 477,776,614 | | | | 14,236,351 | |
| | Bruce L. Crockett | | | | 477,904,863 | | | | 14,108,102 | |
| | Jack M. Fields | | | | 478,154,120 | | | | 13,858,845 | |
| | Martin L. Flanagan | | | | 478,366,284 | | | | 13,646,681 | |
| | Cynthia Hostetler | | | | 478,149,043 | | | | 13,863,922 | |
| | Dr. Eli Jones | | | | 478,281,396 | | | | 13,731,569 | |
| | Dr. Prema Mathai-Davis | | | | 477,927,603 | | | | 14,085,362 | |
| | Teresa M. Ressel | | | | 478,116,999 | | | | 13,895,966 | |
| | Dr. Larry Soll | | | | 477,671,696 | | | | 14,341,269 | |
| | Ann Barnett Stern | | | | 478,390,538 | | | | 13,622,427 | |
| | Raymond Stickel, Jr. | | | | 477,934,336 | | | | 14,078,629 | |
| | Philip A. Taylor | | | | 478,104,174 | | | | 13,908,791 | |
| | Robert C. Troccoli | | | | 478,368,464 | | | | 13,644,501 | |
| | Christopher L. Wilson | | | | 478,433,867 | | | | 13,579,098 | |
| | | | | |
| | | | | | | | | | | | | | | | | | |
| | | | | Votes For | | | Votes
Against | | | Votes Abstain | | | Broker Non-Votes | |
| (2)* | | Approve an amendment to the Trust’s Agreement and Declaration of Trust that would permit fund mergers and other significant transactions upon the Board’s approval but without shareholder approval of such transactions | | | 261,575,830 | | | | 26,621,916 | | | | 13,166,011 | | | | 190,648,808 | |
The Meeting was adjourned until April 11, 2017, with respect to the following proposals:
| (3) | Approve changing the fundamental investment restriction regarding the purchase or sale of physical commodities. |
| 4(a) | Approve an amendment to the current Master Intergroup Sub-Advisory Contract to add Invesco PowerShares Capital Management LLC. |
| 4(b) | Approve an amendment to the current Master Intergroup Sub-Advisory Contract to add Invesco Asset Management (India) Private Limited. |
Invesco American Value Fund did not receive sufficient shareholder votes to pass Proposals 3 and 4(a) - (b).
The results of the voting on the above matters were as follows:
| | | | | | | | | | | | | | | | | | |
| | | Matters | | Votes For | | | Votes Against | | | Votes Abstain | | | Broker Non-Votes | |
| (3) | | Approve changing the fundamental investment restriction regarding the purchase or sale of physical commodities | | | 13,855,338 | | | | 1,090,434 | | | | 853,366 | | | | 8,051,482 | |
| 4(a) | | Approve an amendment to the current Master Intergroup Sub-Advisory Contract to add Invesco PowerShares Capital Management LLC | | | 14,427,293 | | | | 574,972 | | | | 807,286 | | | | 8,041,069 | |
| 4(b) | | Approve an amendment to the current Master Intergroup Sub-Advisory Contract to add Invesco Asset Management (India) Private Limited | | | 14,145,515 | | | | 818,238 | | | | 842,597 | | | | 8,043,797 | |
| * | Each of proposal 1 and 2 required approval by a combined vote of all of the portfolios of AIM Sector Funds (Invesco Sector Funds). |
24 Invesco American Value Fund
Trustees and Officers
The address of each trustee and officer is AIM Sector Funds (Invesco Sector Funds) (the “Trust”), 11 Greenway Plaza, Suite 1000, Houston, Texas 77046-1173. The trustees serve for the life of the Trust, subject to their earlier death, incapacitation, resignation, retirement or removal as more specifically provided in the Trust’s organizational documents. Each officer serves for a one year term or until their successors are elected and qualified. Column two below includes length of time served with predecessor entities, if any.
| | | | | | | | |
Name, Year of Birth and
Position(s) Held with the Trust | | Trustee and/
or Officer Since | | Principal Occupation(s)
During Past 5 Years | | Number of
Funds in Fund
Complex
Overseen by
Trustee | | Other Directorship(s)
Held by Trustee During
Past 5 Years |
| Interested Persons | | | | | | | | |
| Martin L. Flanagan1 — 1960 Trustee | | 2007 | | Executive Director, Chief Executive Officer and President, Invesco Ltd. (ultimate parent of Invesco and a global investment management firm); Trustee, The Invesco Funds; Vice Chair, Investment Company Institute; and Member of Executive Board, SMU Cox School of Business Formerly: Advisor to the Board, Invesco Advisers, Inc. (formerly known as Invesco Institutional (N.A.), Inc.); Chairman and Chief Executive Officer, Invesco Advisers, Inc. (registered investment adviser); Director, Chairman, Chief Executive Officer and President, Invesco Holding Company (US), Inc. (formerly IVZ Inc.) (holding company), Invesco Group Services, Inc. (service provider) and Invesco North American Holdings, Inc. (holding company); Director, Chief Executive Officer and President, Invesco Holding Company Limited (parent of Invesco and a global investment management firm); Director, Invesco Ltd.; Chairman, Investment Company Institute and President, Co-Chief Executive Officer, Co-President, Chief Operating Officer and Chief Financial Officer, Franklin Resources, Inc. (global investment management organization) | | 144 | | None |
Philip A. Taylor2 — 1954 Trustee and Senior Vice President | | 2006 | | Head of the Americas and Senior Managing Director, Invesco Ltd.; Director, Invesco Advisers, Inc. (formerly known as Invesco Institutional (N.A.), Inc.) (registered investment adviser); Director, Chairman, Chief Executive Officer and President, Invesco Management Group, Inc. (formerly known as Invesco Aim Management Group, Inc.) (financial services holding company); Director and Chairman, Invesco Investment Services, Inc. (formerly known as Invesco Aim Investment Services, Inc.) (registered transfer agent) Chief Executive Officer, Invesco Corporate Class Inc. (corporate mutual fund company) Director, Chairman and Chief Executive Officer, Invesco Canada Ltd. (formerly known as Invesco Trimark Ltd./Invesco Trimark Ltèe) (registered investment adviser and registered transfer agent); Trustee and Senior Vice President, The Invesco Funds; Director, Invesco Investment Advisers LLC (formerly known as Van Kampen Asset Management). Formerly: Co-Chairman, Co-President and Co-Chief Executive Officer, Invesco Advisers, Inc. (formerly known as Invesco Institutional (N.A.), Inc.) (registered investment adviser); Director, Chief Executive Officer and President, Van Kampen Exchange Corp; President and Principal Executive Officer, The Invesco Funds (other than AIM Treasurer’s Series Trust (Invesco Treasurer’s Series Trust), Short-Term Investments Trust and Invesco Management Trust); Executive Vice President, The Invesco Funds (AIM Treasurer’s Series Trust (Invesco Treasurer’s Series Trust), Short-Term Investments Trust and Invesco Management Trust only); Director and President, INVESCO Funds Group, Inc. (registered investment adviser and registered transfer agent); Director and Chairman, IVZ Distributors, Inc. (formerly known as INVESCO Distributors, Inc.) (registered broker dealer); Director, President and Chairman, Invesco Inc. (holding company), Invesco Canada Holdings Inc. (holding company), Trimark Investments Ltd./Placements Trimark Ltèe and Invesco Financial Services Ltd/Services Financiers Invesco Ltèe; Chief Executive Officer, Invesco Canada Fund Inc. (corporate mutual fund company); Director and Chairman, Van Kampen Investor Services Inc.; Director, Chief Executive Officer and President, 1371 Preferred Inc. (holding company) and Van Kampen Investments Inc.; Director and President, AIM GP Canada Inc. (general partner for limited partnerships) and Van Kampen Advisors, Inc.; Director and Chief Executive Officer, Invesco Trimark Dealer Inc. (registered broker dealer); Director, Invesco Distributors, Inc. (formerly known as Invesco Aim Distributors, Inc.) (registered broker dealer); Manager, Invesco PowerShares Capital Management LLC; Director, Chief Executive Officer and President, Invesco Advisers, Inc.; Director, Chairman, Chief Executive Officer and President, Invesco Aim Capital Management, Inc.; President, Invesco Trimark Dealer Inc. and Invesco Trimark Ltd./Invesco Trimark Ltèe; Director and President, AIM Trimark Corporate Class Inc. and AIM Trimark Canada Fund Inc.; Senior Managing Director, Invesco Holding Company Limited; Director and Chairman, Fund Management Company (former registered broker dealer); President and Principal Executive Officer, The Invesco Funds (AIM Treasurer’s Series Trust (Invesco Treasurer’s Series Trust), and Short-Term Investments Trust only); President, AIM Trimark Global Fund Inc. and AIM Trimark Canada Fund Inc. | | 144 | | None |
| 1 | Mr. Flanagan is considered an interested person (within the meaning of Section 2(a)(19) of the 1940 Act) of the Trust because he is an officer of the Adviser to the Trust, and an officer and a director of Invesco Ltd., ultimate parent of the Adviser. |
| 2 | Mr. Taylor is considered an interested person (within the meaning of Section 2(a)(19) of the 1940 Act) of the Trust because he is an officer and a director of the Adviser. |
T-1 Invesco American Value Fund
Trustees and Officers—(continued)
| | | | | | | | |
Name, Year of Birth and
Position(s) Held with the Trust | | Trustee and/
or Officer Since | | Principal Occupation(s)
During Past 5 Years | | Number of
Funds in Fund
Complex
Overseen by
Trustee | | Other Directorship(s)
Held by Trustee During
Past 5 Years |
| Independent Trustees | | | | | | | | |
Bruce L. Crockett — 1944 Trustee and Chair | | 2003 | | Chairman, Crockett Technologies Associates (technology consulting company) Formerly: Director, Captaris (unified messaging provider); Director, President and Chief Executive Officer, COMSAT Corporation; Chairman, Board of Governors of INTELSAT (international communications company); ACE Limited (insurance company); Independent Directors Council and Investment Company Institute: Member of the Audit Committee, Investment Company Institute; Member of the Executive Committee and Chair of the Governance Committee, Independent Directors Council | | 144 | | Director and Chairman of the Audit Committee, ALPS (Attorneys Liability Protection Society) (insurance company); Director and Member of the Audit Committee, Ferroglobe PLC (metallurgical company) |
David C. Arch — 1945 Trustee | | 2010 | | Chairman of Blistex Inc. (consumer health care products manufacturer); Member, World Presidents’ Organization | | 144 | | Board member of the Illinois Manufacturers’ Association |
James T. Bunch — 1942 Trustee | | 2000 | | Managing Member, Grumman Hill Group LLC (family office/private equity investments) Formerly: Chairman of the Board, Denver Film Society; Chairman of the Board of Trustees, Evans Scholarship Foundation; Chairman, Board of Governors, Western Golf Association | | 144 | | Trustee, Evans Scholarship Foundation |
Jack M. Fields — 1952 Trustee | | 2003 | | Chief Executive Officer, Twenty First Century Group, Inc. (government affairs company); and Discovery Learning Alliance (non-profit) Formerly: Owner and Chief Executive Officer, Dos Angeles Ranch L.P. (cattle, hunting, corporate entertainment); Director, Insperity, Inc. (formerly known as Administaff); Chief Executive Officer, Texana Timber LP (sustainable forestry company); Director of Cross Timbers Quail Research Ranch (non-profit); and member of the U.S. House of Representatives | | 144 | | None |
Cynthia Hostetler — 1962 Trustee | | 2017 | | Non-Executive Director and Trustee of a number of public and private business corporations Formerly: Head of Investment Funds and Private Equity, Overseas Private Investment Corporation; President, First Manhattan Bancorporation, Inc.; Attorney, Simpson Thacher & Bartlett LLP | | 144 | | Vulcan Materials Company (construction materials company); Trilinc Global Impact Fund; Aberdeen Investment Funds (4 portfolios); Artio Global Investment LLC (mutual fund complex); Edgen Group, Inc. (specialized energy and infrastructure products distributor) |
Eli Jones — 1961 Trustee | | 2016 | | Professor and Dean, Mays Business School—Texas A&M University Formerly: Professor and Dean, Walton College of Business, University of Arkansas and E.J. Ourso College of Business, Louisiana State University; Director, Arvest Bank | | 144 | | Insperity, Inc. (formerly known as Administaff) (human resources provider) |
Prema Mathai-Davis — 1950 Trustee | | 2003 | | Retired. Formerly: Chief Executive Officer, YWCA of the U.S.A. | | 144 | | None |
Teresa M. Ressel — 1962 Trustee | | 2017 | | Non-Executive Director and Trustee of a number of public and private business corporations Formerly: Chief Financial Officer, Olayan America, The Olayan Group (international investor/commercial/industrial); Chief Executive Officer, UBS Securities LLC; Group Chief Operating Officer, Americas, UBS AG; Assistant Secretary for Management & Budget and CFO, US Department of the Treasury; Chief Compliance Officer, Kaiser Permanente; Program Manager, Hewlett-Packard; Nuclear Engineering, General Dynamics Corporation | | 144 | | Atlantic Power Corporation (power generation company); ON Semiconductor Corp. (semiconductor supplier) |
Larry Soll — 1942 Trustee | | 1997 | | Retired. Formerly: Chairman, Chief Executive Officer and President, Synergen Corp. (a biotechnology company) | | 144 | | None |
Ann Barnett Stern — 1957 Trustee | | 2017 | | President and Chief Executive Officer, Houston Endowment Inc. (private philanthropic institution) Formerly: Executive Vice President and General Counsel, Texas Children’s Hospital; Attorney, Beck, Redden and Secrest, LLP; Business Law Instructor, University of St. Thomas; Attorney, Andrews & Kurth LLP | | 144 | | Federal Reserve Bank of Dallas |
Raymond Stickel, Jr. — 1944 Trustee | | 2005 | | Retired. Formerly: Director, Mainstay VP Series Funds, Inc. (25 portfolios); Partner, Deloitte & Touche | | 144 | | None |
Robert C. Troccoli — 1949 Trustee | | 2016 | | Adjunct Professor, University of Denver – Daniels College of Business Formerly: Senior Partner, KPMG LLP | | 144 | | None |
Christopher L. Wilson — 1957 Trustee | | 2017 | | Managing Partner, CT2, LLC (investing and consulting firm) Formerly: President/Chief Executive Officer, Columbia Funds, Bank of America Corporation; President/Chief Executive Officer, CDC IXIS Asset Management Services, Inc.; Principal & Director of Operations, Scudder Funds, Scudder, Stevens & Clark, Inc.; Assistant Vice President, Fidelity Investments | | 144 | | TD Asset Management USA Inc. (mutual fund complex) (22 portfolios); ISO New England, Inc. (non-profit organization managing regional electricity market) |
T-2 Invesco American Value Fund
Trustees and Officers—(continued)
| | | | | | | | |
Name, Year of Birth and
Position(s) Held with the Trust | | Trustee and/
or Officer Since | | Principal Occupation(s)
During Past 5 Years | | Number of
Funds in Fund
Complex
Overseen by
Trustee | | Other Directorship(s)
Held by Trustee During
Past 5 Years |
| Other Officers | | | | | | | | |
Sheri Morris — 1964 President, Principal Executive Officer and Treasurer | | 2003 | | President, Principal Executive Officer and Treasurer, The Invesco Funds; Vice President, Invesco Advisers, Inc. (formerly known as Invesco Institutional (N.A.), Inc.) (registered investment adviser); and Vice President, PowerShares Exchange-Traded Fund Trust, PowerShares Exchange-Traded Fund Trust II, PowerShares India Exchange-Traded Fund Trust, PowerShares Actively Managed Exchange-Traded Fund Trust and PowerShares Actively Managed Exchange-Traded Commodity Fund Trust Formerly: Vice President and Principal Financial Officer, The Invesco Funds; Vice President, Invesco Aim Advisers, Inc., Invesco Aim Capital Management, Inc. and Invesco Aim Private Asset Management, Inc.; Assistant Vice President and Assistant Treasurer, The Invesco Funds and Assistant Vice President, Invesco Advisers, Inc., Invesco Aim Capital Management, Inc. and Invesco Aim Private Asset Management, Inc.; and Treasurer, PowerShares Exchange-Traded Fund Trust, PowerShares Exchange-Traded Fund Trust II, PowerShares India Exchange-Traded Fund Trust and PowerShares Actively Managed Exchange-Traded Fund Trust | | N/A | | N/A |
Russell C. Burk — 1958 Senior Vice President and Senior Officer | | 2005 | | Senior Vice President and Senior Officer, The Invesco Funds | | N/A | | N/A |
John M. Zerr — 1962 Senior Vice President, Chief Legal Officer and Secretary | | 2006 | | Director, Senior Vice President, Secretary and General Counsel, Invesco Management Group, Inc. (formerly known as Invesco AIM Management Group, Inc.); Senior Vice President, Invesco Advisers, Inc. (formerly known as Invesco Institutional (N.A.), Inc.) (registered investment adviser); Senior Vice President and Secretary, Invesco Distributors, Inc. (formerly known as Invesco AIM Distributors, Inc.); Director, Vice President and Secretary, Invesco Investment Services, Inc. (formerly known as Invesco AIM Investment Services, Inc.) Senior Vice President, Chief Legal Officer and Secretary, The Invesco Funds; Managing Director, Invesco PowerShares Capital Management LLC; Director, Secretary and General Counsel, Invesco Investment Advisers LLC (formerly known as Van Kampen Asset Management); Secretary and General Counsel, Invesco Capital Markets, Inc. (formerly known as Van Kampen Funds Inc.) and Chief Legal Officer, PowerShares Exchange-Traded Fund Trust, PowerShares Exchange-Traded Fund Trust II, PowerShares India Exchange-Traded Fund Trust, PowerShares Actively Managed Exchange-Traded Fund Trust and PowerShares Actively Managed Exchange-Traded Commodity Fund Trust; Manager and Secretary, Invesco Indexing LLC Formerly: Director, Secretary, General Counsel and Senior Vice President, Van Kampen Exchange Corp.; Director, Vice President and Secretary, IVZ Distributors, Inc. (formerly known as INVESCO Distributors, Inc.); Director and Vice President, INVESCO Funds Group, Inc.; Director and Vice President, Van Kampen Advisors Inc.; Director, Vice President, Secretary and General Counsel, Van Kampen Investor Services Inc.; Director, Invesco Distributors, Inc. (formerly known as Invesco AIM Distributors, Inc.); Director, Senior Vice President, General Counsel and Secretary, Invesco AIM Advisers, Inc. and Van Kampen Investments Inc.; Director, Vice President and Secretary, Fund Management Company; Director, Senior Vice President, Secretary, General Counsel and Vice President, Invesco AIM Capital Management, Inc.; Chief Operating Officer and General Counsel, Liberty Ridge Capital, Inc. (an investment adviser); Vice President and Secretary, PBHG Funds (an investment company) and PBHG Insurance Series Fund (an investment company); Chief Operating Officer, General Counsel and Secretary, Old Mutual Investment Partners (a broker-dealer); General Counsel and Secretary, Old Mutual Fund Services (an administrator) and Old Mutual Shareholder Services (a shareholder servicing center); Executive Vice President, General Counsel and Secretary, Old Mutual Capital, Inc. (an investment adviser); and Vice President and Secretary, Old Mutual Advisors Funds (an investment company) | | N/A | | N/A |
Gregory G. McGreevey — 1962 Senior Vice President | | 2012 | | Senior Managing Director, Invesco Ltd.; Director, Chairman, President, and Chief Executive Officer, Invesco Advisers, Inc. (formerly known as Invesco Institutional (N.A.), Inc.) (registered investment adviser); Director, Invesco Mortgage Capital, Inc. and Invesco Senior Secured Management, Inc.; and Senior Vice President, The Invesco Funds Formerly: Assistant Vice President, The Invesco Funds | | N/A | | N/A |
Kelli Gallegos — 1970 Vice President, Principal Financial Officer and Assistant Treasurer | | 2008 | | Vice President, Principal Financial Officer and Assistant Treasurer, The Invesco Funds; Assistant Treasurer, Invesco PowerShares Capital Management LLC, PowerShares Exchange-Traded Fund Trust, PowerShares Exchange-Traded Fund Trust II, PowerShares India Exchange-Traded Fund Trust, PowerShares Actively Managed Exchange-Traded Fund Trust and PowerShares Actively Managed Exchange-Traded Commodity Fund Trust Formerly: Assistant Vice President, The Invesco Funds | | N/A | | N/A |
T-3 Invesco American Value Fund
Trustees and Officers—(continued)
| | | | | | | | |
Name, Year of Birth and
Position(s) Held with the Trust | | Trustee and/
or Officer Since | | Principal Occupation(s)
During Past 5 Years | | Number of
Funds in Fund
Complex
Overseen by
Trustee | | Other Directorship(s)
Held by Trustee During
Past 5 Years |
| Other Officers—(continued) | | | | | | | | |
Tracy Sullivan — 1962 Vice President, Chief Tax Officer and Assistant Treasurer | | 2008 | | Vice President, Chief Tax Officer and Assistant Treasurer, The Invesco Funds; Assistant Treasurer, Invesco PowerShares Capital Management LLC, PowerShares Exchange-Traded Fund Trust, PowerShares Exchange-Traded Fund Trust II, PowerShares India Exchange-Traded Fund Trust, PowerShares Actively Managed Exchange-Traded Fund Trust and PowerShares Actively Managed Exchange-Traded Commodity Fund Trust Formerly: Assistant Vice President, The Invesco Funds | | N/A | | N/A |
Crissie M. Wisdom — 1969 Anti-Money Laundering Compliance Officer | | 2013 | | Anti-Money Laundering Compliance Officer, Invesco Advisers, Inc. (formerly known as Invesco Institutional (N.A.), Inc.) (registered investment adviser), Invesco Capital Markets, Inc. (formerly known as Van Kampen Funds Inc.), Invesco Distributors, Inc., Invesco Investment Services, Inc., Invesco Management Group, Inc., The Invesco Funds, and PowerShares Exchange-Traded Fund Trust, PowerShares Exchange-Traded Fund Trust II, PowerShares India Exchange-Traded Fund Trust, PowerShares Actively Managed Exchange-Traded Fund Trust and PowerShares Actively Managed Exchange-Traded Commodity Fund Trust; Anti-Money Laundering Compliance Officer and Bank Secrecy Act Officer, INVESCO National Trust Company and Invesco Trust Company; and Fraud Prevention Manager and Controls and Risk Analysis Manager for Invesco Investment Services, Inc. Formerly: Anti-Money Laundering Compliance Officer, Van Kampen Exchange Corp. | | N/A | | N/A |
Robert R. Leveille — 1969 Chief Compliance Officer | | 2016 | | Chief Compliance Officer, Invesco Advisers, Inc. (registered investment adviser); and Chief Compliance Officer, The Invesco Funds Formerly: Chief Compliance Officer, Putnam Investments and the Putnam Funds | | N/A | | N/A |
The Statement of Additional Information of the Trust includes additional information about the Fund’s Trustees and is available upon request, without charge, by calling 1.800.959.4246. Please refer to the Fund’s Statement of Additional Information for information on the Fund’s sub-advisers.
| | | | | | | | | | |
Office of the Fund 11 Greenway Plaza, Suite 1000 Houston, TX 77046-1173 | | Investment Adviser Invesco Advisers, Inc. 1555 Peachtree Street, N.E. Atlanta, GA 30309 | |
| Distributor
Invesco Distributors, Inc. 11 Greenway Plaza, Suite 1000 Houston, TX 77046-1173 |
| |
| Auditors
PricewaterhouseCoopers LLP 1000 Louisiana Street, Suite 5800 Houston, TX 77002-5678 |
|
| | | |
| | | | | | | | | | |
Counsel to the Fund Stradley Ronon Stevens & Young, LLP 2005 Market Street, Suite 2600 Philadelphia, PA 19103-7018 | | Counsel to the Independent Trustees Goodwin Procter LLP 901 New York Avenue, N.W. Washington, D.C. 20001 | |
| Transfer Agent
Invesco Investment Services, Inc. 11 Greenway Plaza, Suite 1000 Houston, TX 77046-1173 |
| |
| Custodian
State Street Bank and Trust Company 225 Franklin Street Boston, MA 02110-2801 |
|
T-4 Invesco American Value Fund
Explore High-Conviction Investing with Invesco

Go paperless with eDelivery
Visit invesco.com/edelivery to enjoy the convenience and security of anytime electronic access to your investment documents.
With eDelivery, you can elect to have any or all of the following materials delivered straight to your inbox to download, save and print from your own computer:
∎ Fund reports and prospectuses
∎ Quarterly statements
∎ Daily confirmations
∎ Tax forms
Invesco mailing information
Send general correspondence to Invesco Investment Services, Inc., P.O. Box 219078, Kansas City, MO 64121-9078.
Important notice regarding delivery of security holder documents
To reduce Fund expenses, only one copy of most shareholder documents may be mailed to shareholders with multiple accounts at the same address (Householding). Mailing of your shareholder documents may be householded indefinitely unless you instruct us otherwise. If you do not want the mailing of these documents to be combined with those for other members of your household, please contact Invesco Investment Services, Inc. at 800 959 4246 or contact your financial institution. We will begin sending you individual copies for each account within 30 days after receiving your request.
Fund holdings and proxy voting information
The Fund provides a complete list of its holdings four times in each fiscal year, at the quarter ends. For the second and fourth quarters, the lists appear in the Fund’s semiannual and annual reports to shareholders. For the first and third quarters, the Fund files the lists with the Securities and Exchange Commission (SEC) on Form N-Q. The most recent list of portfolio holdings is available at invesco.com/completeqtrholdings. Shareholders can also look up the Fund’s Forms N-Q on the SEC website at sec.gov. Copies of the Fund’s Forms N-Q may be reviewed and copied at the SEC Public Reference Room in Washington, D.C. You can obtain information on the operation of the Public Reference Room, including information about duplicating fee charges, by calling 202 551 8090 or 800 732 0330, or by electronic request at the following email address: publicinfo@sec.gov.
The SEC file numbers for the Fund are shown below.
A description of the policies and procedures that the Fund uses to determine how to vote proxies relating to portfolio securities is available without charge, upon request, from our Client Services department at 800 959 4246 or at invesco.com/proxyguidelines. The information is also available on the SEC website, sec.gov.
| | | | |
Information regarding how the Fund voted proxies related to its portfolio securities during the most recent 12-month period ended June 30 is available at invesco.com/proxysearch. The information is also available on the SEC website, sec.gov. Invesco Advisers, Inc. is an investment adviser; it provides investment advisory services to individual and institutional clients and does not sell securities. Invesco Distributors, Inc. is the US distributor for Invesco Ltd.’s retail mutual funds, exchange-traded funds and institutional money market funds. Both are wholly owned, indirect subsidiaries of Invesco Ltd. | |  | | |
SEC file numbers: 811-03826 and 002-85905 Invesco Distributors, Inc. VK-AMVA-AR-1 06092017 1139
| | | | |
| | |
 | | Annual Report to Shareholders | | April 30, 2017 |
| | |
| | Invesco Comstock Fund |
| | Nasdaq: |
| | A: ACSTX ∎ B: ACSWX ∎ C: ACSYX ∎ R: ACSRX ∎ Y: ACSDX ∎ R5: ACSHX ∎ R6: ICSFX |

Letters to Shareholders
| | | | |

Philip Taylor | | | | Dear Shareholders: This annual report includes information about your Fund, including performance data and a complete list of its investments as of the close of the reporting period. Inside is a discussion of how your Fund was managed and the factors that affected its performance during the reporting period. The reporting period began with stock market volatility in the US and abroad, largely the result of uncertainty about global economic growth and monetary policy. Markets declined sharply following UK voters’ decision in June to leave the European Union. Relatively quickly, however, markets recovered, reaching record highs later in the summer. Demand was strong for income-producing investments, particularly those perceived to be lower risk; this benefited bonds as well as dividend-paying stocks for much of the reporting period. While economic news in the US was generally positive during the reporting period, news overseas was less upbeat. The European |
Central Bank and central banks in China and Japan – as well as other countries – maintained extraordinarily accommodative monetary policies in response to economic weakness. After months of uncertainty, the outcome of the US presidential election in November triggered a major stock market rally, with most market indexes repeatedly reaching new highs through February. As expected, the US Federal Reserve (the Fed) raised interest rates in December 2016 and again in March 2017. In its March statement, the Fed noted that the labor market has strengthened and economic activity has expanded at a moderate pace – and that it expects those trends to continue.
Short-term market volatility can prompt some investors to abandon their investment plans – and can cause others to settle for whatever returns the market has to offer. The investment professionals at Invesco, in contrast, invest with high conviction. This means that, no matter the asset class or the strategy, each investment team has a passion to exceed. We want to help investors achieve better outcomes, such as seeking higher returns, helping mitigate risk and generating income. Of course, investing with high conviction can’t guarantee a profit or ensure success; no investment strategy can. To learn more about how we invest with high conviction, visit invesco.com/HighConviction.
You, too, can invest with high conviction by maintaining a long-term investment perspective and by working with your financial adviser on a regular basis. During periods of short-term market volatility or uncertainty, your financial adviser can keep you focused on your long-term investment goals – a new home, a child’s college education or a secure retirement. He or she also can share research about the economy, the markets and individual investment options.
Visit our website for more information on your investments
Our website, invesco.com/us, offers a wide range of market insights and investment perspectives. On the website, you’ll find detailed information about our funds, including performance, holdings and portfolio manager commentaries. You can access information about your account by completing a simple, secure online registration. To do so, select “Log In” on the right side of the homepage, and then select “Register for Individual Account Access.”
In addition to the resources accessible on our website and through our mobile app, you can obtain timely updates to help you stay informed about the markets, the economy and investing by connecting with Invesco on Twitter, LinkedIn or Facebook. You can access our blog at blog.invesco.us.com. Our goal is to provide you the information you want, when and where you want it.
Finally, I’m pleased to share with you Invesco’s commitment to both the Principles for Responsible Investment and to considering environmental, social and governance issues in our robust investment process. I invite you to learn more at invesco.com/esg.
Have questions?
For questions about your account, contact an Invesco client services representative at 800 959 4246. For Invesco-related questions or comments, please email me directly at phil@invesco.com.
All of us at Invesco look forward to serving your investment management needs. Thank you for investing with us.
Sincerely,

Philip Taylor
Senior Managing Director, Invesco Ltd.
2 Invesco Comstock Fund
| | | | |

Bruce Crockett | | | | Dear Fellow Shareholders: Among the many important lessons I’ve learned in more than 40 years in a variety of business endeavors is the value of a trusted advocate. As independent chair of the Invesco Funds Board, I can assure you that the members of the Board are strong advocates for the interests of investors in Invesco’s mutual funds. We work hard to represent your interests through oversight of the quality of the investment management services your funds receive and other matters important to your investment, including but not limited to: ∎ Ensuring that Invesco offers a diverse lineup of mutual funds that your financial adviser can use to strive to meet your financial needs as your investment goals change over time. ∎ Monitoring how the portfolio management teams of the Invesco funds are performing in light of changing economic and market conditions. |
| ∎ | | Assessing each portfolio management team’s investment performance within the context of the investment strategy described in the fund’s prospectus. |
| ∎ | | Monitoring for potential conflicts of interests that may impact the nature of the services that your funds receive. |
We believe one of the most important services we provide our fund shareholders is the annual review of the funds’ advisory and sub-advisory contracts with Invesco Advisers and its affiliates. This review is required by the Investment Company Act of 1940 and focuses on the nature and quality of the services Invesco provides as the adviser to the Invesco funds and the reasonableness of the fees that it charges for those services. Each year, we spend months carefully reviewing information received from Invesco and a variety of independent sources, such as performance and fee data prepared by Lipper, Inc. (a subsidiary of Broadridge Financial Solutions, Inc.), an independent, third-party firm widely recognized as a leader in its field. We also meet with our independent legal counsel and other independent advisers to review and help us assess the information that we have received. Our goal is to assure that you receive quality investment management services for a reasonable fee.
I trust the measures outlined above provide assurance that you have a worthy advocate when it comes to choosing the Invesco Funds.
As always, please contact me at bruce@brucecrockett.com with any questions or concerns you may have. On behalf of the Board, we look forward to continuing to represent your interests and serving your needs.
Sincerely,

Bruce L. Crockett
Independent Chair
Invesco Funds Board of Trustees
3 Invesco Comstock Fund
Management’s Discussion of Fund Performance
| | | | |
| Performance summary | |
For the fiscal year ended April 30, 2017, Class A shares of Invesco Comstock Fund (the Fund), at net asset value (NAV), outperformed the Fund’s style-specific benchmark, the Russell 1000 Value Index. | |
Your Fund’s long-term performance appears later in this report. | |
| Fund vs. Indexes | |
Total returns, 4/30/16 to 4/30/17, at net asset value (NAV). Performance shown does not include applicable contingent deferred sales charges (CDSC) or front-end sales charges, which would have reduced performance. | |
| Class A Shares | | | 18.56 | % |
| Class B Shares | | | 18.57 | |
| Class C Shares | | | 17.70 | |
| Class R Shares | | | 18.27 | |
| Class Y Shares | | | 18.86 | |
| Class R5 Shares | | | 18.93 | |
| Class R6 Shares | | | 19.05 | |
| S&P 500 Index▼ (Broad Market Index) | | | 17.92 | |
| Russell 1000 Value Index▼ (Style-Specific Index) | | | 16.55 | |
| Lipper Large-Cap Value Funds Index⬛ (Peer Group Index) | | | 17.38 | |
| |
Source(s): ▼FactSet Research Systems Inc.; ⬛Lipper Inc. | | | | |
Market conditions and your Fund
During the fiscal year, the US economy continued to expand and strengthen, with unemployment declining and inflation ticking upward somewhat. Signs of an improving economy prompted the US Federal Reserve (the Fed) to raise interest rates in December 2016 and again in March 2017. Major US stock market indexes posted gains for the reporting period, with most hitting record highs following the US presidential election. Investors seemed to believe that the new administration’s plans to reduce tax rates, scale back regulations and increase infrastructure spending had the potential to stimulate economic growth.
While the US and overseas stock markets were jolted by the UK’s decision in June 2016 to leave the European Union, markets recovered relatively quickly.
During the second half of 2016, small-cap stocks led the US market while large-cap stocks lagged – but that reversed in the first quarter of 2017. Near the close of the fiscal year, headlines out of Washington, DC, suggested that enacting significant regulatory and tax reform might be somewhat more difficult than previously anticipated; this was a slight negative for investor sentiment. For the reporting period as a whole, information technology (IT) and financials were the strongest-performing sectors, while telecommunication services and energy were the weakest-performing sectors.
Sector performance of the Russell 1000 Value Index ranged from returns over 20% within the IT and financials sectors to low single-digit returns within the telecommunication services and energy sectors.
On the positive side, stock selection in and an overweight exposure to the financials sector contributed to the Fund’s performance relative to its style-specific benchmark. Within banks, Citigroup, Bank of America and JPMorgan Chase significantly contributed to Fund performance. Within diversified financials, Morgan Stanley was a top performer for the reporting period, outperforming the sector and the style-specific benchmark. Financial stocks rallied after the presidential election as large banks expected a more lenient regulatory environment from the new presidential administration.
Strong stock selection in and overweight exposure to the IT sector also boosted the Fund’s relative performance versus its style-specific benchmark for the reporting period. Within software, Microsoft and Symantec were large contributors to the Fund’s relative performance. Symantec rallied after it announced a deal to buy Blue Coat (not a Fund holding), a technology and cloud access security firm. Within technology hardware, storage and peripherals, NetApp was a large contributor to Fund performance. In the second half of 2016, NetApp reported smaller-than-expected declines in its mature products area and growth in the company’s strategic solutions area. Investors also welcomed strong expense management.
Having no exposure to the real estate sector and a material underweight exposure to the utilities sector largely contributed to the Fund’s relative performance as these sectors were the bottom-performing sectors in the Fund’s style-specific benchmark. We believed these sectors were generally overvalued as investors had driven up stock prices in a quest for yield in a low interest rate environment.
| | | | |
| Portfolio Composition | |
| By sector | | | % of total net assets | |
| | | | | |
| |
| Financials | | | | 34.9 | % |
| Energy | | | | 15.1 | |
| Health Care | | | | 12.2 | |
| Information Technology | | | | 10.3 | |
| Industrials | | | | 9.8 | |
| Consumer Discretionary | | | | 9.3 | |
| Consumer Staples | | | | 2.9 | |
| Materials | | | | 1.8 | |
| Telecommunication Services | | | | 0.7 | |
| Utilities | | | | 0.6 | |
| Money Market Funds | | | | | |
| Plus Other Assets Less Liabilities | | | | 2.4 | |
| | | | | |
| Top 10 Equity Holdings* |
| | | | % of total net assets | |
| | | | | |
| |
| 1. Citigroup Inc. | | | | 5.7 | % |
| 2. Bank of America Corp. | | | | 4.5 | |
| 3. JPMorgan Chase & Co. | | | | 3.9 | |
| 4. Carnival Corp. | | | | 3.3 | |
| 5. Cisco Systems, Inc. | | | | 2.6 | |
| 6. Suncor Energy, Inc. | | | | 2.5 | |
7. PNC Financial Services Group, Inc. (The) | | | | 2.1 | |
| 8. Caterpillar Inc. | | | | 2.1 | |
| 9. Morgan Stanley | | | | 2.0 | |
| 10. Wells Fargo & Co. | | | | 2.0 | |
| | | | | |
| Total Net Assets | | | | $12.0 billion | |
| |
| Total Number of Holdings* | | | | 76 | |
The Fund’s holdings are subject to change, and there is no assurance that the Fund will continue to hold any particular security.
* Excluding money market fund holdings.
Data presented here are as of April 30, 2017.
4 Invesco Comstock Fund
On the negative side, stock selection in and an overweight exposure to the energy sector detracted from the Fund’s performance relative to its style-specific benchmark. Within oil and gas exploration and production, Hess, and within oil and gas equipment and services, Weatherford International, were among the largest detractors from Fund performance. Oil prices declined toward the end of the reporting period amid an increase in inventories and concerns that OPEC may decline to extend production cuts past the original agreement.
A material overweight allocation in consumer discretionary stocks also detracted from the Fund’s relative performance versus the style-specific benchmark. Some larger detractors were within apparel and retail, including Michael Kors and Target, and also within media, including Twenty-First Century Fox and Viacom. Michael Kors stock hit a 52-week low after reporting a larger-than-expected drop in sales in the first quarter of 2017. We eliminated our position in Michael Kors toward the end of the reporting period due to waning prospects for recovery. Later in the reporting period, we also sold long-term holding Viacom because we believed the company’s future risk-reward prospects had deteriorated. In addition, we also sold our position in Target during the reporting period.
Stock selection in the telecommunication services sector also dampened the Fund’s relative performance. Notably, Frontier Communications underperformed the style-specific benchmark for the reporting period. The company reported a loss and announced layoffs related to a restructuring effort to reduce expenses and improve operational performance. We eliminated our position in Frontier Communications as fundamentals deteriorated, not meeting our strict selection criteria and expectations.
We used forward foreign currency contracts during the reporting period for the purpose of hedging currency exposure of non-US-based companies held in the Fund. Derivatives were used solely for the purpose of hedging and not for speculative purposes or leverage. For the reporting period, forward foreign currency contracts had a positive impact on the Fund’s performance relative to the style-specific benchmark.
At the end of the reporting period, the Fund had an overweight exposure to the financials sector relative to the style-specific benchmark due to our favorable
view of large banks. We also maintained a constructive view on the long-term prospects for our energy holdings as we believe supply and demand for oil balances over time. The Fund’s exposure to the financials and energy sectors was more volatile than the style-specific benchmark. Therefore, the Fund may be more sensitive to broad moves within these sectors.
Thank you for your investment in Invesco Comstock Fund and for sharing our long-term investment horizon.
The views and opinions expressed in management’s discussion of Fund performance are those of Invesco Advisers, Inc. These views and opinions are subject to change at any time based on factors such as market and economic conditions. These views and opinions may not be relied upon as investment advice or recommendations, or as an offer for a particular security. The information is not a complete analysis of every aspect of any market, country, industry, security or the Fund. Statements of fact are from sources considered reliable, but Invesco Advisers, Inc. makes no representation or warranty as to their completeness or accuracy. Although historical performance is no guarantee of future results, these insights may help you understand our investment management philosophy.
See important Fund and, if applicable, index disclosures later in this report.
| | |
 | | Kevin Holt Chartered Financial Analyst, Portfolio Manager and Chief Investment Officer for Invesco US Value |
| Disciplines, is lead manager of Invesco Comstock Fund. He joined Invesco in 2010. Mr. Holt earned a bachelor’s degree from the University of Iowa and an MBA from the University of Chicago Graduate School of Business. |
| |
 | | Devin Armstrong Chartered Financial Analyst, Portfolio Manager, is manager of Invesco Comstock Fund. He joined |
Invesco in 2010. Mr. Armstrong earned a BS in psychology and finance from the University of Illinois and an MBA from Columbia University. |
| |
 | | Charles DyReyes Chartered Financial Analyst, Portfolio Manager, is manager of Invesco Comstock Fund. He joined |
| Invesco in 2015. Mr. DyReyes earned a BS in finance from Lehigh University. |
| | |

| | James (Jay) Warwick Portfolio Manager, is manager of Invesco Comstock Fund. He joined Invesco in 2010. Mr. Warwick |
earned a BBA from Stephen F. Austin State University and an MBA from the University of Houston. |
5 Invesco Comstock Fund
Your Fund’s Long-Term Performance
Results of a $10,000 Investment – Oldest Share Class(es)
Fund and index data from 4/30/07
1 Source: FactSet Research Systems Inc.
2 Source: Lipper Inc.
Past performance cannot guarantee comparable future results.
The data shown in the chart include reinvested distributions, applicable sales charges and Fund expenses including management fees. Index results include reinvested dividends, but they do not reflect sales charges. Performance of the
peer group, if applicable, reflects fund expenses and management fees; performance of a market index does not. Performance shown in the chart and table(s) does not reflect deduction of taxes a shareholder would pay on Fund distributions or sale of Fund shares.
6 Invesco Comstock Fund
| | | | | | |
| | | Average Annual Total Returns | |
| | As of 4/30/17, including maximum applicable sales charges | |
| | | Class A Shares | | | | |
| | | Inception (10/7/68) | | | 10.75 | % |
| | | 10 Years | | | 5.07 | |
| | | 5 Years | | | 10.89 | |
| | | 1 Year | | | 12.05 | |
| | |
| | | Class B Shares | | | | |
| | | Inception (10/19/92) | | | 9.77 | % |
| | | 10 Years | | | 5.58 | |
| | | 5 Years | | | 11.81 | |
| | | 1 Year | | | 13.57 | |
| | |
| | | Class C Shares | | | | |
| | | Inception (10/26/93) | | | 9.07 | % |
| | | 10 Years | | | 4.88 | |
| | | 5 Years | | | 11.32 | |
| | | 1 Year | | | 16.70 | |
| | |
| | | Class R Shares | | | | |
| | | Inception (10/1/02) | | | 9.10 | % |
| | | 10 Years | | | 5.41 | |
| | | 5 Years | | | 11.88 | |
| | | 1 Year | | | 18.27 | |
| | |
| | | Class Y Shares | | | | |
| | | Inception (10/29/04) | | | 7.51 | % |
| | | 10 Years | | | 5.93 | |
| | | 5 Years | | | 12.44 | |
| | | 1 Year | | | 18.86 | |
| | |
| | | Class R5 Shares | | | | |
| | | 10 Years | | | 5.93 | % |
| | | 5 Years | | | 12.54 | |
| | | 1 Year | | | 18.93 | |
| | |
| | | Class R6 Shares | | | | |
| | | 10 Years | | | 5.88 | % |
| | | 5 Years | | | 12.61 | |
| | | 1 Year | | | 19.05 | |
Effective June 1, 2010, Class A, Class B, Class C, Class I and Class R shares of the predecessor fund, Van Kampen Comstock Fund, advised by Van Kampen Asset Management were reorganized into Class A, Class B, Class C, Class Y and Class R shares, respectively, of Invesco Van Kampen Comstock Fund (renamed Invesco Comstock Fund). Returns shown above, prior to June 1, 2010, for Class A, Class B, Class C, Class R and Class Y shares are blended returns of the predecessor fund and Invesco Comstock Fund. Share class returns will differ from the predecessor fund because of different expenses.
Class R5 shares incepted on June 1, 2010. Performance shown prior to that date is that of the predecessor fund’s Class A shares and includes the 12b-1 fees applicable to Class A shares.
| | | | | | |
| | | Average Annual Total Returns | |
| | As of 3/31/17, the most recent calendar quarter end, including maximum applicable sales charges | |
| | | Class A Shares | | | | |
| | | Inception (10/7/68) | | | 10.77 | % |
| | | 10 Years | | | 5.52 | |
| | | 5 Years | | | 10.67 | |
| | | 1 Year | | | 15.70 | |
| | |
| | | Class B Shares | | | | |
| | | Inception (10/19/92) | | | 9.81 | % |
| | | 10 Years | | | 6.02 | |
| | | 5 Years | | | 11.58 | |
| | | 1 Year | | | 17.43 | |
| | |
| | | Class C Shares | | | | |
| | | Inception (10/26/93) | | | 9.11 | % |
| | | 10 Years | | | 5.33 | |
| | | 5 Years | | | 11.10 | |
| | | 1 Year | | | 20.58 | |
| | |
| | | Class R Shares | | | | |
| | | Inception (10/1/02) | | | 9.15 | % |
| | | 10 Years | | | 5.85 | |
| | | 5 Years | | | 11.65 | |
| | | 1 Year | | | 22.12 | |
| | |
| | | Class Y Shares | | | | |
| | | Inception (10/29/04) | | | 7.56 | % |
| | | 10 Years | | | 6.38 | |
| | | 5 Years | | | 12.21 | |
| | | 1 Year | | | 22.80 | |
| | |
| | | Class R5 Shares | | | | |
| | | 10 Years | | | 6.38 | % |
| | | 5 Years | | | 12.33 | |
| | | 1 Year | | | 22.92 | |
| | |
| | | Class R6 Shares | | | | |
| | | 10 Years | | | 6.33 | % |
| | | 5 Years | | | 12.38 | |
| | | 1 Year | | | 22.98 | |
Class R6 shares incepted on September 24, 2012. Performance shown prior to that date is that of the Fund’s and the predecessor fund’s Class A shares and includes the 12b-1 fees applicable to Class A shares.
The performance data quoted represent past performance and cannot guarantee comparable future results; current performance may be lower or higher. Please visit invesco.com/performance for the most recent month-end performance. Performance figures reflect reinvested distributions, changes in net asset value and the effect of the maximum sales charge unless otherwise stated. Investment return and principal value will fluctuate so that you may have a gain or loss when you sell shares.
The net annual Fund operating expense ratio set forth in the most recent Fund prospectus as of the date of this report for Class A, Class B, Class C, Class R, Class Y, Class R5 and Class R6 shares was 0.85%, 0.85%, 1.57%, 1.10%, 0.60%, 0.50% and 0.40%, respectively.1 The total annual Fund operating expense ratio set forth in the most recent Fund prospectus as of the date of this report for Class A, Class B, Class C, Class R, Class Y, Class R5 and Class R6 shares was 0.86%, 0.86%, 1.58%, 1.11%, 0.61%, 0.51% and 0.41%, respectively. The expense ratios presented above may vary from the expense ratios presented in other sections of this report that are based on expenses incurred during the period covered by this report.
Class A share performance reflects the maximum 5.50% sales charge, and Class B and Class C share performance reflects the applicable contingent deferred sales charge (CDSC) for the period involved. For shares purchased prior to June 1, 2010, the CDSC on Class B shares declines from 5% at the time of purchase to 0% at the beginning of the sixth year. For shares purchased on or after June 1, 2010, the CDSC on Class B shares declines from 5% at the time of purchase to 0% at the beginning of the seventh year. The CDSC on Class C shares is 1% for the first year after purchase. Class R, Class Y, Class R5 and Class R6 shares do not have a front-end sales charge or a CDSC; therefore, performance is at net asset value.
The performance of the Fund’s share classes will differ primarily due to different sales charge structures and class expenses.
Fund performance reflects any applicable fee waivers and/or expense reimbursements. Had the adviser not waived fees and/or reimbursed expenses currently or in the past, returns would have been lower. See current prospectus for more information.
| 1 | Total annual Fund operating expenses after any contractual fee waivers and/or expense reimbursements by the adviser in effect through at least June 30, 2019. See current prospectus for more information. |
7 Invesco Comstock Fund
Invesco Comstock Fund’s investment objective is total return through growth of capital and current income.
∎ Unless otherwise stated, information presented in this report is as of April 30, 2017, and is based on total net assets.
∎ Unless otherwise noted, all data provided by Invesco.
∎ To access your Fund’s reports/prospectus, visit invesco.com/fundreports.
About share classes
| ∎ | | Class B shares may not be purchased for new or additional investments. Please see the prospectus for more information. |
| ∎ | | Class R shares are generally available only to employer sponsored retirement and benefit plans. Please see the prospectus for more information. |
| ∎ | | Class Y shares are available only to certain investors. Please see the prospectus for more information. |
| ∎ | | Class R5 shares and Class R6 shares are available for use by retirement plans that meet certain standards and for institutional investors. Class R6 shares are also available through intermediaries that have established an agreement with Invesco Distributors, Inc. to make such shares available for use in retail omnibus accounts. Please see the prospectus for more information. |
Principal risks of investing in the Fund
| ∎ | | Depositary receipts risk. Investing in depositary receipts involves the same risks as direct investments in foreign securities. In addition, the underlying issuers of certain depositary receipts are under no obligation to distribute shareholder communications or pass through any voting rights with respect to the deposited securities to the holders of such receipts. The Fund may therefore receive less timely information or have less control than if it invested directly in the foreign issuer. |
| ∎ | | Derivatives risk. The value of a derivative instrument depends largely on (and is derived from) the value of an underlying security, currency, commodity, interest rate, index or other asset (each referred to as an underlying asset). In addition to risks relating to the underlying assets, the use of derivatives may include other, possibly greater, risks, including counterparty, leverage and liquidity risks. Counterparty risk is the risk that the |
| | counterparty to the derivative contract will default on its obligation to pay the Fund the amount owed or otherwise perform under the derivative contract. Derivatives create leverage risk because they do not require payment up front equal to the economic exposure created by owning the derivative. As a result, an adverse change in the value of the underlying asset could result in the Fund sustaining a loss that is substantially greater than the amount invested in the derivative, which may make the Fund’s returns more volatile and increase the risk of loss. Derivative instruments may also be less liquid than more traditional investments and the Fund may be unable to sell or close out its derivative positions at a desirable time or price. This risk may be more acute under adverse market conditions, during which the Fund may be most in need of liquidating its derivative positions. Derivatives may also be harder to value, less tax efficient and subject to changing government regulation that could impact the Fund’s ability to use certain derivatives or their cost. Also, derivatives used for hedging or to gain or limit exposure to a particular market segment may not provide the expected benefits, particularly during adverse market conditions. |
| ∎ | | Emerging markets securities risk. Emerging markets (also referred to as developing markets) are generally subject to greater market volatility, political, social and economic instability, uncertain trading markets and more governmental limitations on foreign investment than more developed markets. In addition, companies operating in emerging markets may be subject to lower trading volume and greater price fluctuations than companies in more developed markets. Securities law and the enforcement of systems of taxation in many emerging market countries may change quickly and unpredictably. In addition, investments in emerging markets securities may also be subject |
| | to additional transaction costs, delays in settlement procedures, and lack of timely information. |
| ∎ | | Foreign securities risk. The Fund’s foreign investments may be adversely affected by political and social instability, changes in economic or taxation policies, difficulty in enforcing obligations, decreased liquidity or increased volatility. Foreign investments also involve the risk of the possible seizure, nationalization or expropriation of the issuer or foreign deposits (in which the Fund could lose its entire investments in a certain market) and the possible adoption of foreign governmental restrictions such as exchange controls. Unless the Fund has hedged its foreign securities risk, foreign securities risk also involves the risk of negative foreign currency rate fluctuations, which may cause the value of securities denominated in such foreign currency (or other instruments through which the Fund has exposure to foreign currencies) to decline in value. Currency exchange rates may fluctuate significantly over short periods of time. Currency hedging strategies, if used, are not always successful. |
| ∎ | | Management risk. The Fund is actively managed and depends heavily on the Adviser’s judgment about markets, interest rates or the attractiveness, relative values, liquidity, or potential appreciation of particular investments made for the Fund’s portfolio. The Fund could experience losses if these judgments prove to be incorrect. Additionally, legislative, regulatory, or tax developments may adversely affect management of the Fund and, therefore, the ability of the Fund to achieve its investment objective. |
| ∎ | | Market risk. The market values of the Fund’s investments, and therefore the value of the Fund’s shares, will go up and down, sometimes rapidly or unpredictably. Market risk may affect a single issuer, industry or section of the economy, or it may affect the market as a whole. Individual stock prices tend to |
| | |
This report must be accompanied or preceded by a currently effective Fund prospectus, which contains more complete information, including sales charges and expenses. Investors should read it carefully before investing. | | |
| |
| | |
| NOT FDIC INSURED | MAY LOSE VALUE | NO BANK GUARANTEE | | |
8 Invesco Comstock Fund
| | go up and down more dramatically than those of certain other types of investments, such as bonds. During a general downturn in the financial markets, multiple asset classes may decline in value. When markets perform well, there can be no assurance that specific investments held by the Fund will rise in value. |
| ∎ | | Real estate investment trust (REIT) risk/real estate risk. Investments in real estate related instruments may be affected by economic, legal, cultural, environmental or technological factors that affect property values, rents or occupancies of real estate related to the Fund’s holdings. Shares of real estate related companies, which tend to be small- and mid-cap companies, may be more volatile and less liquid. |
| ∎ | | Sector focus risk. The Fund may from time to time invest a significant amount of its assets (i.e. over 25%) in one market sector or group of related industries. In this event, the Fund’s performance will depend to a greater extent on the overall condition of the sector or group of industries and there is increased risk that the Fund will lose significant value if conditions adversely affect that sector or group of industries. |
| ∎ | | Small- and mid-capitalization companies risks. Small- and mid-capitalization companies tend to be more vulnerable to changing market conditions, may have little or no operating history or track record of success, and may have more limited product lines and markets, less experienced management and fewer financial resources than larger companies. These companies’ securities may be more volatile and less liquid than those of more established companies, and their returns may vary, sometimes significantly, from the overall securities market. |
| ∎ | | Value investing style risk. A value investing style subjects the Fund to the risk that the valuations never improve or that the returns on value equity securities are less than returns on other styles of investing or the overall stock market. |
About indexes used in this report
| ∎ | | The S&P 500® Index is an unmanaged index considered representative of the US stock market. |
| ∎ | | The Russell 1000® Value Index is an unmanaged index considered representative of large-cap value stocks. The Russell 1000 Value Index is a trademark/service mark of the Frank Russell Co. Russell® is a trademark of the Frank Russell Co. |
| ∎ | | The Lipper Large-Cap Value Funds Index is an unmanaged index considered representative of large-cap value funds tracked by Lipper. |
| ∎ | | The Fund is not managed to track the performance of any particular index, including the index(es) described here, and consequently, the performance of the Fund may deviate significantly from the performance of the index(es). |
| ∎ | | A direct investment cannot be made in an index. Unless otherwise indicated, index results include reinvested dividends, and they do not reflect sales charges. Performance of the peer group, if applicable, reflects fund expenses; performance of a market index does not. |
Other information
| ∎ | | The returns shown in management’s discussion of Fund performance are based on net asset values (NAVs) calculated for shareholder transactions. Generally accepted accounting principles require adjustments to be made to the net assets of the Fund at period end for financial reporting purposes, and as such, the NAVs for shareholder transactions and the returns based on those NAVs may differ from the NAVs and returns reported in the Financial Highlights. |
| ∎ | | Industry classifications used in this report are generally according to the Global Industry Classification Standard, which was developed by and is the exclusive property and a service mark of MSCI Inc. and Standard & Poor’s. |
9 Invesco Comstock Fund
Schedule of Investments(a)
April 30, 2017
| | | | | | | | |
| | | Shares | | | Value | |
Common Stocks & Other Equity Interests–97.58% | |
| Aerospace & Defense–2.09% | |
Arconic Inc. | | | 3,349,514 | | | $ | 91,542,218 | |
Textron Inc. | | | 3,424,436 | | | | 159,784,184 | |
| | | | | 251,326,402 | |
|
| Aluminum–0.35% | |
Alcoa Corp. | | | 1,238,137 | | | | 41,762,361 | |
|
| Asset Management & Custody Banks–3.17% | |
Bank of New York Mellon Corp. (The) | | | 4,076,079 | | | | 191,820,278 | |
State Street Corp. | | | 2,255,048 | | | | 189,198,527 | |
| | | | | 381,018,805 | |
|
| Automobile Manufacturers–1.85% | |
General Motors Co. | | | 6,409,568 | | | | 222,027,436 | |
|
| Automotive Retail–1.03% | |
Advance Auto Parts, Inc. | | | 866,819 | | | | 123,209,653 | |
|
| Biotechnology–2.39% | |
AbbVie Inc. | | | 1,333,817 | | | | 87,951,893 | |
Biogen Inc.(b) | | | 410,008 | | | | 111,198,270 | |
Gilead Sciences, Inc. | | | 1,275,152 | | | | 87,411,669 | |
| | | | | 286,561,832 | |
|
| Broadcasting–0.64% | |
CBS Corp.–Class B | | | 1,161,770 | | | | 77,327,411 | |
|
| Building Products–1.43% | |
Johnson Controls International PLC | | | 4,140,651 | | | | 172,126,862 | |
|
| Cable & Satellite–1.38% | |
Charter Communications, Inc.–
Class A(b) | | | 193,194 | | | | 66,682,841 | |
Comcast Corp.–Class A | | | 2,523,558 | | | | 98,898,238 | |
| | | | | 165,581,079 | |
|
| Communications Equipment–2.64% | |
Cisco Systems, Inc. | | | 9,290,226 | | | | 316,518,000 | |
|
| Construction Machinery & Heavy Trucks–2.05% | |
Caterpillar Inc. | | | 2,407,093 | | | | 246,149,330 | |
|
| Consumer Finance–1.37% | |
Ally Financial Inc. | | | 8,331,182 | | | | 164,957,404 | |
|
| Data Processing & Outsourced Services–1.04% | |
PayPal Holdings, Inc.(b) | | | 2,611,222 | | | | 124,607,514 | |
|
| Diversified Banks–16.44% | |
Bank of America Corp. | | | 23,097,169 | | | | 539,087,924 | |
Citigroup Inc. | | | 11,535,339 | | | | 681,969,242 | |
JPMorgan Chase & Co. | | | 5,361,027 | | | | 466,409,349 | |
U.S. Bancorp | | | 937,124 | | | | 48,055,719 | |
Wells Fargo & Co. | | | 4,413,024 | | | | 237,597,212 | |
| | | | | 1,973,119,446 | |
| | | | | | | | |
| | | Shares | | | Value | |
| Drug Retail–0.88% | |
CVS Health Corp. | | | 1,278,935 | | | $ | 105,435,401 | |
|
| Electric Utilities–0.61% | |
FirstEnergy Corp. | | | 2,437,507 | | | | 72,978,960 | |
|
| Electrical Components & Equipment–2.37% | |
Eaton Corp. PLC | | | 2,627,583 | | | | 198,750,378 | |
Emerson Electric Co. | | | 1,422,275 | | | | 85,734,737 | |
| | | | | 284,485,115 | |
|
| Fertilizers & Agricultural Chemicals–0.59% | |
CF Industries Holdings, Inc. | | | 2,668,231 | | | | 71,348,497 | |
|
| Health Care Distributors–0.99% | |
Cardinal Health, Inc. | | | 683,684 | | | | 49,628,621 | |
McKesson Corp. | | | 497,540 | | | | 68,804,807 | |
| | | | | 118,433,428 | |
|
| Health Care Equipment–0.80% | |
Medtronic PLC | | | 1,158,293 | | | | 96,242,565 | |
|
| Hotels, Resorts & Cruise Lines–3.30% | |
Carnival Corp. | | | 6,407,664 | | | | 395,801,405 | |
|
| Hypermarkets & Super Centers–1.10% | |
Wal-Mart Stores, Inc. | | | 1,761,640 | | | | 132,440,095 | |
|
| Industrial Conglomerates–1.16% | |
General Electric Co. | | | 4,789,678 | | | | 138,852,765 | |
|
| Industrial Machinery–0.66% | |
Ingersoll-Rand PLC | | | 886,768 | | | | 78,700,660 | |
|
| Integrated Oil & Gas–8.71% | |
BP PLC–ADR (United Kingdom) | | | 5,964,718 | | | | 204,709,122 | |
Chevron Corp. | | | 1,965,259 | | | | 209,693,135 | |
Occidental Petroleum Corp. | | | 1,615,224 | | | | 99,400,885 | |
Royal Dutch Shell PLC–Class A–ADR (United Kingdom) | | | 4,539,174 | | | | 236,899,491 | |
Suncor Energy, Inc. (Canada) | | | 9,388,867 | | | | 294,434,869 | |
| | | | | 1,045,137,502 | |
|
| Internet Software & Services–1.89% | |
eBay Inc.(b) | | | 5,497,459 | | | | 183,670,105 | |
Yahoo! Inc.(b) | | | 906,931 | | | | 43,723,144 | |
| | | | | 227,393,249 | |
|
| Investment Banking & Brokerage–3.13% | |
Goldman Sachs Group, Inc. (The) | | | 595,627 | | | | 133,301,323 | |
Morgan Stanley | | | 5,603,301 | | | | 243,015,164 | |
| | | | | 376,316,487 | |
|
| IT Consulting & Other Services–0.53% | |
Cognizant Technology Solutions Corp.–
Class A(b) | | | 1,051,640 | | | | 63,340,277 | |
See accompanying Notes to Financial Statements which are an integral part of the financial statements.
10 Invesco Comstock Fund
| | | | | | | | |
| | | Shares | | | Value | |
| Life & Health Insurance–2.47% | |
Aflac, Inc. | | | 851,461 | | | $ | 63,757,400 | |
MetLife, Inc. | | | 4,482,140 | | | | 232,219,673 | |
| | | | | 295,977,073 | |
|
| Managed Health Care–1.34% | |
Anthem, Inc. | | | 902,733 | | | | 160,587,173 | |
|
| Movies & Entertainment–1.15% | |
Twenty-First Century Fox, Inc.–Class B | | | 4,613,604 | | | | 137,762,215 | |
|
| Multi-Line Insurance–1.49% | |
American International Group, Inc. | | | 2,927,359 | | | | 178,305,437 | |
|
| Oil & Gas Equipment & Services–1.11% | |
Halliburton Co. | | | 2,568,486 | | | | 117,842,138 | |
Weatherford International PLC(b) | | | 2,724,804 | | | | 15,722,119 | |
| | | | | 133,564,257 | |
|
| Oil & Gas Exploration & Production–5.29% | |
Canadian Natural Resources Ltd. (Canada) | | | 3,216,248 | | | | 102,437,434 | |
Devon Energy Corp. | | | 4,557,890 | | | | 179,991,076 | |
Hess Corp. | | | 2,979,925 | | | | 145,509,738 | |
Marathon Oil Corp. | | | 9,104,966 | | | | 135,390,845 | |
QEP Resources Inc.(b) | | | 6,066,677 | | | | 71,647,455 | |
| | | | | 634,976,548 | |
|
| Packaged Foods & Meats–0.29% | |
Mondelez International, Inc.–Class A | | | 778,308 | | | | 35,047,209 | |
|
| Paper Packaging–0.89% | |
International Paper Co. | | | 1,991,099 | | | | 107,459,613 | |
|
| Personal Products–0.66% | |
Unilever N.V.–New York Shares (United Kingdom) | | | 1,528,461 | | | | 79,846,803 | |
|
| Pharmaceuticals–6.64% | |
Merck & Co., Inc. | | | 2,325,640 | | | | 144,957,141 | |
Mylan N.V.(b) | | | 2,870,250 | | | | 107,203,838 | |
Novartis AG (Switzerland) | | | 1,384,097 | | | | 106,479,700 | |
Pfizer Inc. | | | 6,996,352 | | | | 237,316,260 | |
Sanofi–ADR (France) | | | 4,259,825 | | | | 201,489,722 | |
| | | | | 797,446,661 | |
| | | | | | | | |
| | | Shares | | | Value | |
| Property & Casualty Insurance–1.34% | |
Allstate Corp. (The) | | | 1,981,555 | | | $ | 161,080,606 | |
|
| Regional Banks–5.47% | |
Citizens Financial Group, Inc. | | | 3,991,646 | | | | 146,533,325 | |
Fifth Third Bancorp | | | 8,696,859 | | | | 212,464,266 | |
KeyCorp | | | 2,716,422 | | | | 49,547,537 | |
PNC Financial Services Group, Inc. (The) | | | 2,077,235 | | | | 248,748,891 | |
| | | | | 657,294,019 | |
|
| Semiconductors–1.20% | |
Intel Corp. | | | 3,999,253 | | | | 144,572,996 | |
|
| Systems Software–1.63% | |
Microsoft Corp. | | | 2,765,480 | | | | 189,324,761 | |
Symantec Corp. | | | 191,500 | | | | 6,057,145 | |
| | | | | 195,381,906 | |
|
| Technology Hardware, Storage & Peripherals–1.35% | |
HP Inc. | | | 256,474 | | | | 4,826,840 | |
NetApp, Inc. | | | 3,934,323 | | | | 156,782,771 | |
| | | | | 161,609,611 | |
|
| Wireless Telecommunication Services–0.67% | |
Vodafone Group PLC (United Kingdom) | | | 31,182,322 | | | | 80,391,007 | |
Total Common Stocks & Other Equity Interests
(Cost $9,142,434,971) | | | | 11,714,503,075 | |
|
Money Market Funds–2.28% | |
Government & Agency Portfolio–
Institutional Class, 0.67%(c) | | | 164,287,514 | | | | 164,287,514 | |
Treasury Portfolio–Institutional Class, 0.63%(c) | | | 109,525,009 | | | | 109,525,009 | |
Total Money Market Funds
(Cost $273,812,523) | | | | 273,812,523 | |
TOTAL INVESTMENTS–99.86%
(Cost $9,416,247,494) | | | | 11,988,315,598 | |
OTHER ASSETS LESS LIABILITIES–0.14% | | | | 17,100,756 | |
NET ASSETS–100.00% | | | $ | 12,005,416,354 | |
Investment Abbreviations:
| | |
| ADR | | – American Depositary Receipt |
Notes to Schedule of Investments:
| (a) | Industry and/or sector classifications used in this report are generally according to the Global Industry Classification Standard, which was developed by and is the exclusive property and a service mark of MSCI Inc. and Standard & Poor’s. |
| (b) | Non-income producing security. |
| (c) | The money market fund and the Fund are affiliated by having the same investment adviser. The rate shown is the 7-day SEC standardized yield as of April 30, 2017. |
See accompanying Notes to Financial Statements which are an integral part of the financial statements.
11 Invesco Comstock Fund
Statement of Assets and Liabilities
April 30, 2017
| | | | |
Assets: | |
Investments, at value (Cost $9,142,434,971) | | $ | 11,714,503,075 | |
Investments in affiliated money market funds, at value and cost | | | 273,812,523 | |
Total investments, at value (Cost $9,416,247,494) | | | 11,988,315,598 | |
Foreign currencies, at value (Cost $1,158) | | | 1,160 | |
Receivable for: | | | | |
Investments sold | | | 6,229,818 | |
Fund shares sold | | | 43,851,142 | |
Dividends | | | 15,867,392 | |
Investment for trustee deferred compensation and retirement plans | | | 878,830 | |
Unrealized appreciation on forward foreign currency contracts outstanding | | | 9,017,270 | |
Other assets | | | 113,319 | |
Total assets | | | 12,064,274,529 | |
|
Liabilities: | |
Payable for: | | | | |
Investments purchased | | | 5,541,815 | |
Fund shares reacquired | | | 25,838,056 | |
Dividends | | | 304,786 | |
Accrued fees to affiliates | | | 6,407,556 | |
Accrued trustees’ and officers’ fees and benefits | | | 16,586 | |
Accrued other operating expenses | | | 1,187,639 | |
Trustee deferred compensation and retirement plans | | | 1,027,659 | |
Unrealized depreciation on forward foreign currency contracts outstanding | | | 18,534,078 | |
Total liabilities | | | 58,858,175 | |
Net assets applicable to shares outstanding | | $ | 12,005,416,354 | |
|
Net assets consist of: | |
Shares of beneficial interest | | $ | 9,498,555,189 | |
Undistributed net investment income | | | 16,935,633 | |
Undistributed net realized gain (loss) | | | (72,501,689 | ) |
Net unrealized appreciation | | | 2,562,427,221 | |
| | | $ | 12,005,416,354 | |
| | | | |
Net Assets: | |
Class A | | $ | 6,350,463,649 | |
Class B | | $ | 39,819,986 | |
Class C | | $ | 511,920,204 | |
Class R | | $ | 324,055,385 | |
Class Y | | $ | 3,334,929,630 | |
Class R5 | | $ | 741,549,588 | |
Class R6 | | $ | 702,677,912 | |
|
Shares outstanding, no par value,
with an unlimited number of shares authorized: | |
Class A | | | 264,296,335 | |
Class B | | | 1,657,814 | |
Class C | | | 21,314,382 | |
Class R | | | 13,487,717 | |
Class Y | | | 138,800,986 | |
Class R5 | | | 30,874,215 | |
Class R6 | | | 29,262,908 | |
Class A: | | | | |
Net asset value per share | | $ | 24.03 | |
Maximum offering price per share | | | | |
(Net asset value of $24.03 ¸ 94.50%) | | $ | 25.43 | |
Class B: | | | | |
Net asset value and offering price per share | | $ | 24.02 | |
Class C: | | | | |
Net asset value and offering price per share | | $ | 24.02 | |
Class R: | | | | |
Net asset value and offering price per share | | $ | 24.03 | |
Class Y: | | | | |
Net asset value and offering price per share | | $ | 24.03 | |
Class R5: | | | | |
Net asset value and offering price per share | | $ | 24.02 | |
Class R6: | | | | |
Net asset value and offering price per share | | $ | 24.01 | |
See accompanying Notes to Financial Statements which are an integral part of the financial statements.
12 Invesco Comstock Fund
Statement of Operations
For the year ended April 30, 2017
| | | | |
Investment income: | |
Dividends (net of foreign withholding taxes of $5,823,661) | | $ | 308,480,697 | |
Dividends from affiliated money market funds | | | 933,607 | |
Total investment income | | | 309,414,304 | |
| |
Expenses: | | | | |
Advisory fees | | | 44,979,768 | |
Administrative services fees | | | 839,827 | |
Custodian fees | | | 29,376 | |
Distribution fees: | | | | |
Class A | | | 16,249,566 | |
Class B | | | 144,253 | |
Class C | | | 5,188,965 | |
Class R | | | 1,703,672 | |
Transfer agent fees — A, B, C, R and Y | | | 19,260,770 | |
Transfer agent fees — R5 | | | 785,087 | |
Transfer agent fees — R6 | | | 31,240 | |
Trustees’ and officers’ fees and benefits | | | 187,098 | |
Registration and filing fees | | | 318,688 | |
Reports to shareholders | | | 1,745,748 | |
Professional services fees | | | 108,066 | |
Other | | | 146,961 | |
Total expenses | | | 91,719,085 | |
Less: Fees waived and expense offset arrangement(s) | | | (356,323 | ) |
Net expenses | | | 91,362,762 | |
Net investment income | | | 218,051,542 | |
| |
Realized and unrealized gain (loss) from: | | | | |
Net realized gain (loss) from: | | | | |
Investment securities (includes net gains from securities sold to affiliates of $11,066,231) | | | 357,111,638 | |
Foreign currencies | | | (48,477 | ) |
Forward foreign currency contracts | | | 78,546,878 | |
| | | | 435,610,039 | |
Change in net unrealized appreciation (depreciation) of: | | | | |
Investment securities | | | 1,395,672,237 | |
Foreign currencies | | | (66,300 | ) |
Forward foreign currency contracts | | | 4,255,223 | |
| | | | 1,399,861,160 | |
Net realized and unrealized gain | | | 1,835,471,199 | |
Net increase in net assets resulting from operations | | $ | 2,053,522,741 | |
See accompanying Notes to Financial Statements which are an integral part of the financial statements.
13 Invesco Comstock Fund
Statement of Changes in Net Assets
For the years ended April 30, 2017 and 2016
| | | | | | | | |
| | | 2017 | | | 2016 | |
Operations: | | | | | | | | |
Net investment income | | $ | 218,051,542 | | | $ | 242,641,918 | |
Net realized gain | | | 435,610,039 | | | | 534,575,427 | |
Change in net unrealized appreciation (depreciation) | | | 1,399,861,160 | | | | (1,736,473,522 | ) |
Net increase (decrease) in net assets resulting from operations | | | 2,053,522,741 | | | | (959,256,177 | ) |
| | |
Distributions to shareholders from net investment income: | | | | | | | | |
Class A | | | (137,257,546 | ) | | | (105,206,606 | ) |
Class B | | | (1,214,769 | ) | | | (1,437,179 | ) |
Class C | | | (7,114,701 | ) | | | (4,505,794 | ) |
Class R | | | (6,309,643 | ) | | | (5,356,689 | ) |
Class Y | | | (73,045,536 | ) | | | (55,413,940 | ) |
Class R5 | | | (19,497,036 | ) | | | (15,019,301 | ) |
Class R6 | | | (16,753,033 | ) | | | (12,141,275 | ) |
Total distributions from net investment income | | | (261,192,264 | ) | | | (199,080,784 | ) |
| | |
Distributions to shareholders from net realized gains: | | | | | | | | |
Class A | | | (364,223,535 | ) | | | (562,668,484 | ) |
Class B | | | (3,075,750 | ) | | | (7,384,068 | ) |
Class C | | | (28,987,289 | ) | | | (46,615,384 | ) |
Class R | | | (18,690,220 | ) | | | (35,892,409 | ) |
Class Y | | | (171,623,028 | ) | | | (254,406,075 | ) |
Class R5 | | | (44,720,755 | ) | | | (65,901,013 | ) |
Class R6 | | | (38,485,677 | ) | | | (49,927,542 | ) |
Total distributions from net realized gains | | | (669,806,254 | ) | | | (1,022,794,975 | ) |
| | |
Share transactions–net: | | | | | | | | |
Class A | | | (875,486,642 | ) | | | 122,928,142 | |
Class B | | | (36,447,577 | ) | | | (39,500,740 | ) |
Class C | | | (68,663,029 | ) | | | (4,553,788 | ) |
Class R | | | (66,681,426 | ) | | | (47,437,654 | ) |
Class Y | | | 15,762,135 | | | | 150,211,762 | |
Class R5 | | | (159,101,988 | ) | | | 131,211,582 | |
Class R6 | | | 15,405,723 | | | | 127,733,563 | |
Net increase (decrease) in net assets resulting from share transactions | | | (1,175,212,804 | ) | | | 440,592,867 | |
Net increase (decrease) in net assets | | | (52,688,581 | ) | | | (1,740,539,069 | ) |
| | |
Net assets: | | | | | | | | |
Beginning of year | | | 12,058,104,935 | | | | 13,798,644,004 | |
End of year (includes undistributed net investment income of $16,935,633 and $60,237,143, respectively) | | $ | 12,005,416,354 | | | $ | 12,058,104,935 | |
Notes to Financial Statements
April 30, 2017
NOTE 1—Significant Accounting Policies
Invesco Comstock Fund (the “Fund”) is a series portfolio of AIM Sector Funds (Invesco Sector Funds) (the “Trust”). The Trust is a Delaware statutory trust registered under the Investment Company Act of 1940, as amended (the “1940 Act”), as an open-end series management investment company consisting of ten separate portfolios, each authorized to issue an unlimited number of shares of beneficial interest. The assets, liabilities and operations of each portfolio are accounted for separately. Information presented in these financial statements pertains only to the Fund. Matters affecting each portfolio or class will be voted on exclusively by the shareholders of such portfolio or class.
The Fund’s investment objective is total return through growth of capital and current income.
The Fund currently consists of seven different classes of shares: Class A, Class B, Class C, Class R, Class Y, Class R5 and Class R6. Class Y shares are available only to certain investors. Class A shares are sold with a front-end sales charge unless certain waiver criteria are met and under certain circumstances load waived shares may be subject to contingent deferred sales charges (“CDSC”). Class C shares are sold with a CDSC. Class R, Class Y,
14 Invesco Comstock Fund
Class R5 and Class R6 shares are sold at net asset value. Effective November 30, 2010, new or additional investments in Class B shares are no longer permitted. Existing shareholders of Class B shares may continue to reinvest dividends and capital gains distributions in Class B shares until they convert to Class A shares. Also, shareholders in Class B shares will be able to exchange those shares for Class B shares of other Invesco Funds offering such shares until they convert to Class A shares. Generally, Class B shares will automatically convert to Class A shares on or about the month-end, which is at least eight years after the date of purchase. Redemption of Class B shares prior to the conversion date will be subject to a CDSC.
The Fund is an investment company and accordingly follows the investment company accounting and reporting guidance in accordance with Financial Accounting Standards Board Accounting Standards Codification Topic 946, Financial Services — Investment Companies.
The following is a summary of the significant accounting policies followed by the Fund in the preparation of its financial statements.
| A. | Security Valuations — Securities, including restricted securities, are valued according to the following policy. |
A security listed or traded on an exchange (except convertible securities) is valued at its last sales price or official closing price as of the close of the customary trading session on the exchange where the security is principally traded, or lacking any sales or official closing price on a particular day, the security may be valued at the closing bid price on that day. Securities traded in the over-the-counter market are valued based on prices furnished by independent pricing services or market makers. When such securities are valued by an independent pricing service they may be considered fair valued. Futures contracts are valued at the final settlement price set by an exchange on which they are principally traded. Listed options are valued at the mean between the last bid and asked prices from the exchange on which they are principally traded. Options not listed on an exchange are valued by an independent source at the mean between the last bid and asked prices. For purposes of determining net asset value (“NAV”) per share, futures and option contracts generally are valued 15 minutes after the close of the customary trading session of the New York Stock Exchange (“NYSE”).
Investments in open-end and closed-end registered investment companies that do not trade on an exchange are valued at the end-of-day net asset value per share. Investments in open-end and closed-end registered investment companies that trade on an exchange are valued at the last sales price or official closing price as of the close of the customary trading session on the exchange where the security is principally traded.
Debt obligations (including convertible securities) and unlisted equities are fair valued using an evaluated quote provided by an independent pricing service. Evaluated quotes provided by the pricing service may be determined without exclusive reliance on quoted prices, and may reflect appropriate factors such as institution-size trading in similar groups of securities, developments related to specific securities, dividend rate (for unlisted equities), yield (for debt obligations), quality, type of issue, coupon rate (for debt obligations), maturity (for debt obligations), individual trading characteristics and other market data. Debt obligations are subject to interest rate and credit risks. In addition, all debt obligations involve some risk of default with respect to interest and/or principal payments.
Foreign securities’ (including foreign exchange contracts) prices are converted into U.S. dollar amounts using the applicable exchange rates as of the close of the NYSE. If market quotations are available and reliable for foreign exchange-traded equity securities, the securities will be valued at the market quotations. Because trading hours for certain foreign securities end before the close of the NYSE, closing market quotations may become unreliable. If between the time trading ends on a particular security and the close of the customary trading session on the NYSE, events occur that the Adviser determines are significant and make the closing price unreliable, the Fund may fair value the security. If the event is likely to have affected the closing price of the security, the security will be valued at fair value in good faith using procedures approved by the Board of Trustees. Adjustments to closing prices to reflect fair value may also be based on a screening process of an independent pricing service to indicate the degree of certainty, based on historical data, that the closing price in the principal market where a foreign security trades is not the current value as of the close of the NYSE. Foreign securities’ prices meeting the approved degree of certainty that the price is not reflective of current value will be priced at the indication of fair value from the independent pricing service. Multiple factors may be considered by the independent pricing service in determining adjustments to reflect fair value and may include information relating to sector indices, American Depositary Receipts and domestic and foreign index futures. Foreign securities may have additional risks including exchange rate changes, potential for sharply devalued currencies and high inflation, political and economic upheaval, the relative lack of issuer information, relatively low market liquidity and the potential lack of strict financial and accounting controls and standards.
Securities for which market prices are not provided by any of the above methods may be valued based upon quotes furnished by independent sources. The last bid price may be used to value equity securities. The mean between the last bid and asked prices is used to value debt obligations, including corporate loans.
Securities for which market quotations are not readily available or became unreliable are valued at fair value as determined in good faith by or under the supervision of the Trust’s officers following procedures approved by the Board of Trustees. Issuer specific events, market trends, bid/asked quotes of brokers and information providers and other market data may be reviewed in the course of making a good faith determination of a security’s fair value.
The Fund may invest in securities that are subject to interest rate risk, meaning the risk that the prices will generally fall as interest rates rise and, conversely, the prices will generally rise as interest rates fall. Specific securities differ in their sensitivity to changes in interest rates depending on their individual characteristics. Changes in interest rates may result in increased market volatility, which may affect the value and/or liquidity of certain Fund investments.
Valuations change in response to many factors including the historical and prospective earnings of the issuer, the value of the issuer’s assets, general economic conditions, interest rates, investor perceptions and market liquidity. Because of the inherent uncertainties of valuation, the values reflected in the financial statements may materially differ from the value received upon actual sale of those investments.
| B. | Securities Transactions and Investment Income — Securities transactions are accounted for on a trade date basis. Realized gains or losses on sales are computed on the basis of specific identification of the securities sold. Interest income (net of withholding tax, if any) is recorded on the accrual basis from settlement date. Dividend income (net of withholding tax, if any) is recorded on the ex-dividend date. |
The Fund may periodically participate in litigation related to Fund investments. As such, the Fund may receive proceeds from litigation settlements. Any proceeds received are included in the Statement of Operations as realized gain (loss) for investments no longer held and as unrealized gain (loss) for investments still held.
Brokerage commissions and mark ups are considered transaction costs and are recorded as an increase to the cost basis of securities purchased and/or a reduction of proceeds on a sale of securities. Such transaction costs are included in the determination of net realized and unrealized gain (loss) from investment securities reported in the Statement of Operations and the Statement of Changes in Net Assets and the net
15 Invesco Comstock Fund
realized and unrealized gains (losses) on securities per share in the Financial Highlights. Transaction costs are included in the calculation of the Fund’s net asset value and, accordingly, they reduce the Fund’s total returns. These transaction costs are not considered operating expenses and are not reflected in net investment income reported in the Statement of Operations and the Statement of Changes in Net Assets, or the net investment income per share and the ratios of expenses and net investment income reported in the Financial Highlights, nor are they limited by any expense limitation arrangements between the Fund and the investment adviser.
The Fund allocates income and realized and unrealized capital gains and losses to a class based on the relative net assets of each class.
| C. | Country Determination — For the purposes of making investment selection decisions and presentation in the Schedule of Investments, the investment adviser may determine the country in which an issuer is located and/or credit risk exposure based on various factors. These factors include the laws of the country under which the issuer is organized, where the issuer maintains a principal office, the country in which the issuer derives 50% or more of its total revenues and the country that has the primary market for the issuer’s securities, as well as other criteria. Among the other criteria that may be evaluated for making this determination are the country in which the issuer maintains 50% or more of its assets, the type of security, financial guarantees and enhancements, the nature of the collateral and the sponsor organization. Country of issuer and/or credit risk exposure has been determined to be the United States of America, unless otherwise noted. |
| D. | Distributions — Distributions from net investment income, if any, are declared and paid quarterly and are recorded on the ex-dividend date. Distributions from net realized capital gain, if any, are generally declared and paid annually and recorded on the ex-dividend date. The Fund may elect to treat a portion of the proceeds from redemptions as distributions for federal income tax purposes. |
| E. | Federal Income Taxes — The Fund intends to comply with the requirements of Subchapter M of the Internal Revenue Code of 1986, as amended (the “Internal Revenue Code”), necessary to qualify as a regulated investment company and to distribute substantially all of the Fund’s taxable earnings to shareholders. As such, the Fund will not be subject to federal income taxes on otherwise taxable income (including net realized capital gain) that is distributed to shareholders. Therefore, no provision for federal income taxes is recorded in the financial statements. |
The Fund recognizes the tax benefits of uncertain tax positions only when the position is more likely than not to be sustained. Management has analyzed the Fund’s uncertain tax positions and concluded that no liability for unrecognized tax benefits should be recorded related to uncertain tax positions. Management is not aware of any tax positions for which it is reasonably possible that the total amounts of unrecognized tax benefits will change materially in the next 12 months.
The Fund files tax returns in the U.S. Federal jurisdiction and certain other jurisdictions. Generally, the Fund is subject to examinations by such taxing authorities for up to three years after the filing of the return for the tax period.
| F. | Expenses — Fees provided for under the Rule 12b-1 plan of a particular class of the Fund are charged to the operations of such class. Transfer agency fees and expenses and other shareholder recordkeeping fees and expenses attributable to Class R5 and Class R6 are allocated to each share class based on relative net assets. Sub-accounting fees attributable to Class R5 are charged to the operations of the class. Transfer agency fees and expenses and other shareholder recordkeeping fees and expenses relating to all other classes are allocated among those classes based on relative net assets. All other expenses are allocated among the classes based on relative net assets. |
| G. | Accounting Estimates — The preparation of financial statements in conformity with accounting principles generally accepted in the United States of America (“GAAP”) requires management to make estimates and assumptions that affect the reported amounts of assets and liabilities at the date of the financial statements and the reported amounts of revenues and expenses during the reporting period including estimates and assumptions related to taxation. Actual results could differ from those estimates by a significant amount. In addition, the Fund monitors for material events or transactions that may occur or become known after the period-end date and before the date the financial statements are released to print. |
| H. | Indemnifications — Under the Trust’s organizational documents, each Trustee, officer, employee or other agent of the Trust is indemnified against certain liabilities that may arise out of the performance of their duties to the Fund. Additionally, in the normal course of business, the Fund enters into contracts, including the Fund’s servicing agreements that contain a variety of indemnification clauses. The Fund’s maximum exposure under these arrangements is unknown as this would involve future claims that may be made against the Fund that have not yet occurred. The risk of material loss as a result of such indemnification claims is considered remote. |
| I. | Foreign Currency Translations — Foreign currency is valued at the close of the NYSE based on quotations posted by banks and major currency dealers. Portfolio securities and other assets and liabilities denominated in foreign currencies are translated into U.S. dollar amounts at date of valuation. Purchases and sales of portfolio securities (net of foreign taxes withheld on disposition) and income items denominated in foreign currencies are translated into U.S. dollar amounts on the respective dates of such transactions. The Fund does not separately account for the portion of the results of operations resulting from changes in foreign exchange rates on investments and the fluctuations arising from changes in market prices of securities held. The combined results of changes in foreign exchange rates and the fluctuation of market prices on investments (net of estimated foreign tax withholding) are included with the net realized and unrealized gain or loss from investments in the Statement of Operations. Reported net realized foreign currency gains or losses arise from (1) sales of foreign currencies, (2) currency gains or losses realized between the trade and settlement dates on securities transactions, and (3) the difference between the amounts of dividends, interest, and foreign withholding taxes recorded on the Fund’s books and the U.S. dollar equivalent of the amounts actually received or paid. Net unrealized foreign currency gains and losses arise from changes in the fair values of assets and liabilities, other than investments in securities at fiscal period end, resulting from changes in exchange rates. |
The Fund may invest in foreign securities, which may be subject to foreign taxes on income, gains on investments or currency repatriation, a portion of which may be recoverable. Foreign taxes, if any, are recorded based on the tax regulations and rates that exist in the foreign markets in which the Fund invests and are shown in the Statement of Operations.
| J. | Forward Foreign Currency Contracts — The Fund may engage in foreign currency transactions either on a spot (i.e. for prompt delivery and settlement) basis, or through forward foreign currency contracts, to manage or minimize currency or exchange rate risk. |
The Fund may also enter into forward foreign currency contracts for the purchase or sale of a security denominated in a foreign currency in order to “lock in” the U.S. dollar price of that security, or the Fund may also enter into forward foreign currency contracts that do not provide for physical settlement of the two currencies, but instead are settled by a single cash payment calculated as the difference between the agreed upon exchange rate and the spot rate at settlement based upon an agreed upon notional amount (non-deliverable forwards). The Fund will set aside liquid assets in an amount equal to the daily mark-to-market obligation for forward foreign currency contracts.
16 Invesco Comstock Fund
A forward foreign currency contract is an obligation between two parties (“Counterparties”) to purchase or sell a specific currency for an agreed-upon price at a future date. The use of forward foreign currency contracts does not eliminate fluctuations in the price of the underlying securities the Fund owns or intends to acquire but establishes a rate of exchange in advance. Fluctuations in the value of these contracts are measured by the difference in the contract date and reporting date exchange rates and are recorded as unrealized appreciation (depreciation) until the contracts are closed. When the contracts are closed, realized gains (losses) are recorded. Realized and unrealized gains (losses) on the contracts are included in the Statement of Operations. The primary risks associated with forward foreign currency contracts include failure of the Counterparty to meet the terms of the contract and the value of the foreign currency changing unfavorably. These risks may be in excess of the amounts reflected in the Statement of Assets and Liabilities.
NOTE 2—Advisory Fees and Other Fees Paid to Affiliates
The Trust has entered into a master investment advisory agreement with Invesco Advisers, Inc. (the “Adviser” or “Invesco”). Under the terms of the investment advisory agreement, the Fund pays an advisory fee to the Adviser based on the annual rate of the Fund’s average daily net assets as follows:
| | | | |
| Average Daily Net Assets | | Rate | |
First $1 billion | | | 0.50% | |
Next $1 billion | | | 0.45% | |
Next $1 billion | | | 0.40% | |
Over $3 billion | | | 0.35% | |
For the year ended April 30, 2017, the effective advisory fees incurred by the Fund was 0.38%.
Under the terms of a master sub-advisory agreement between the Adviser and each of Invesco Asset Management Deutschland GmbH, Invesco Asset Management Limited, Invesco Asset Management (Japan) Limited, Invesco Hong Kong Limited, Invesco Senior Secured Management, Inc. and Invesco Canada Ltd. (collectively, the “Affiliated Sub-Advisers”) the Adviser, not the Fund, will pay 40% of the fees paid to the Adviser to any such Affiliated Sub-Adviser(s) that provide(s) discretionary investment management services to the Fund based on the percentage of assets allocated to such Affiliated Sub-Adviser(s).
The Adviser has contractually agreed, through at least June 30, 2018, to waive advisory fees and/or reimburse expenses of all shares to the extent necessary to limit total annual fund operating expenses after fee waiver and/or expense reimbursement (excluding certain items discussed below) of Class A, Class B, Class C, Class R, Class Y, Class R5 and Class R6 shares to 2.00%, 2.75%, 2.75%, 2.25%, 1.75%, 1.75% and 1.75% respectively, of average daily net assets (the “expense limits”). In determining the Adviser’s obligation to waive advisory fees and/or reimburse expenses, the following expenses are not taken into account, and could cause the total annual fund operating expenses after fee waiver and/or expense reimbursement to exceed the numbers reflected above: (1) interest; (2) taxes; (3) dividend expense on short sales; (4) extraordinary or non-routine items, including litigation expenses; and (5) expenses that the Fund has incurred but did not actually pay because of an expense offset arrangement. Unless Invesco continues the fee waiver agreement, it will terminate on June 30, 2018. During its term, the fee waiver agreement cannot be terminated or amended to increase the expense limits without approval of the Board of Trustees. The Adviser did not waive fees and/or reimburse expenses during the period under these expense limits.
Further, the Adviser has contractually agreed, through at least June 30, 2019, to waive the advisory fee payable by the Fund in an amount equal to 100% of the net advisory fees the Adviser receives from the affiliated money market funds on investments by the Fund of uninvested cash in such affiliated money market funds.
For the year ended April 30, 2017, the Adviser waived advisory fees of $324,273.
The Trust has entered into a master administrative services agreement with Invesco pursuant to which the Fund has agreed to pay Invesco for certain administrative costs incurred in providing accounting services to the Fund. For the year ended April 30, 2017, expenses incurred under the agreement are shown in the Statement of Operations as Administrative services fees.
The Trust has entered into a transfer agency and service agreement with Invesco Investment Services, Inc. (“IIS”) pursuant to which the Fund has agreed to pay IIS a fee for providing transfer agency and shareholder services to the Fund and reimburse IIS for certain expenses incurred by IIS in the course of providing such services. IIS may make payments to intermediaries that provide omnibus account services, sub-accounting services and/or networking services. All fees payable by IIS to intermediaries that provide omnibus account services or sub-accounting services are charged back to the Fund, subject to certain limitations approved by the Trust’s Board of Trustees. For the year ended April 30, 2017, expenses incurred under the agreement are shown in the Statement of Operations as Transfer agent fees.
Shares of the Fund are distributed by Invesco Distributors, Inc. (“IDI”). The Fund has adopted a distribution plan pursuant to Rule 12b-1 under the 1940 Act, and a service plan (collectively, the “Plans”) for Class A, Class B, Class C and Class R shares to compensate IDI for the sale, distribution, shareholder servicing and maintenance of shareholder accounts for these shares. Under the Plans, the Fund will incur annual fees of up to 0.25% of Class A average daily net assets, up to 1.00% each of Class B and Class C average daily net assets and up to 0.50% of Class R average daily net assets.
With respect to Class B and Class C shares, the Fund is authorized to reimburse in future years any distribution related expenses that exceed the maximum annual reimbursement rate for such class, so long as such reimbursement does not cause the Fund to exceed the Class B and Class C maximum annual reimbursement rate, respectively. With respect to Class A shares, distribution related expenses that exceed the maximum annual reimbursement rate for such class are not carried forward to future years and the Fund will not reimburse IDI for any such expenses.
For the year ended April 30, 2017, expenses incurred under these agreements are shown in the Statement of Operations as Distribution fees.
Front-end sales commissions and CDSC (collectively, the “sales charges”) are not recorded as expenses of the Fund. Front-end sales commissions are deducted from proceeds from the sales of Fund shares prior to investment in Class A shares of the Fund. CDSC are deducted from redemption proceeds prior to remittance to the shareholder. During the year ended April 30, 2017, IDI advised the Fund that IDI retained $692,178 in front-end sales commissions from the sale of Class A shares and $55,814, $2,130 and $13,266 from Class A, Class B and Class C shares, respectively, for CDSC imposed on redemptions by shareholders.
For the year ended April 30, 2017, the Fund incurred $218,026 in brokerage commissions with Invesco Capital Markets, Inc., an affiliate of the Adviser and IDI, for portfolio transactions executed on behalf of the Fund.
Certain officers and trustees of the Trust are officers and directors of the Adviser, IIS and/or IDI.
17 Invesco Comstock Fund
NOTE 3—Additional Valuation Information
GAAP defines fair value as the price that would be received to sell an asset or paid to transfer a liability in an orderly transaction between market participants at the measurement date, under current market conditions. GAAP establishes a hierarchy that prioritizes the inputs to valuation methods, giving the highest priority to readily available unadjusted quoted prices in an active market for identical assets (Level 1) and the lowest priority to significant unobservable inputs (Level 3), generally when market prices are not readily available or are unreliable. Based on the valuation inputs, the securities or other investments are tiered into one of three levels. Changes in valuation methods may result in transfers in or out of an investment’s assigned level:
| | Level 1 — | Prices are determined using quoted prices in an active market for identical assets. |
| | Level 2 — | Prices are determined using other significant observable inputs. Observable inputs are inputs that other market participants may use in pricing a security. These may include quoted prices for similar securities, interest rates, prepayment speeds, credit risk, yield curves, loss severities, default rates, discount rates, volatilities and others. |
| | Level 3 — | Prices are determined using significant unobservable inputs. In situations where quoted prices or observable inputs are unavailable (for example, when there is little or no market activity for an investment at the end of the period), unobservable inputs may be used. Unobservable inputs reflect the Fund’s own assumptions about the factors market participants would use in determining fair value of the securities or instruments and would be based on the best available information. |
The following is a summary of the tiered valuation input levels, as of April 30, 2017. The level assigned to the securities valuations may not be an indication of the risk or liquidity associated with investing in those securities. Because of the inherent uncertainties of valuation, the values reflected in the financial statements may materially differ from the value received upon actual sale of those investments.
| | | | | | | | | | | | | | | | |
| | | Level 1 | | | Level 2 | | | Level 3 | | | Total | |
Common Stocks & Other Equity Interests | | $ | 11,714,503,075 | | | $ | — | | | $ | — | | | $ | 11,714,503,075 | |
Money Market Funds | | | 273,812,523 | | | | — | | | | — | | | | 273,812,523 | |
| | | | 11,988,315,598 | | | | — | | | | — | | | | 11,988,315,598 | |
Forward Foreign Currency Contracts* | | | — | | | | (9,516,808 | ) | | | — | | | | (9,516,808 | ) |
Total Investments | | $ | 11,988,315,598 | | | $ | (9,516,808 | ) | | $ | — | | | $ | 11,978,798,790 | |
| * | Unrealized appreciation (depreciation). |
NOTE 4—Derivative Investments
The Fund may enter into an International Swaps and Derivatives Association Master Agreement (“ISDA Master Agreement”) under which a Fund may trade OTC derivatives. An OTC transaction entered into under an ISDA Master Agreement typically involves a collateral posting arrangement, payment netting provisions and close-out netting provisions. These netting provisions allow for reduction of credit risk through netting of contractual obligations. The enforceability of the netting provisions of the ISDA Master Agreement depends on the governing law of the ISDA Master Agreement, among other factors.
For financial reporting purposes, the Fund does not offset OTC derivative assets or liabilities that are subject to ISDA Master Agreements in the Statement of Assets and Liabilities.
| | | | | | | | | | | | | | | | | | | | | | | | | | |
| Open Forward Foreign Currency Contracts | |
Settlement
Date | | Counterparty | | Contract to | | | Notional
Value | | | Unrealized
Appreciation
(Depreciation) | |
| | | Deliver | | | Receive | | | |
05/19/17 | | Barclays Bank PLC | | | CAD | | | | 111,362,980 | | | | USD | | | | 83,876,613 | | | $ | 81,600,113 | | | $ | 2,276,500 | |
05/19/17 | | Barclays Bank PLC | | | CHF | | | | 21,735,087 | | | | USD | | | | 21,700,734 | | | | 21,874,449 | | | | (173,715 | ) |
05/19/17 | | Barclays Bank PLC | | | EUR | | | | 102,102,013 | | | | USD | | | | 108,840,030 | | | | 111,342,653 | | | | (2,502,623 | ) |
05/19/17 | | Barclays Bank PLC | | | GBP | | | | 48,900,049 | | | | USD | | | | 61,420,663 | | | | 63,374,709 | | | | (1,954,046 | ) |
05/19/17 | | CIBC World Markets Corp. | | | CAD | | | | 111,362,847 | | | | USD | | | | 83,839,888 | | | | 81,600,016 | | | | 2,239,872 | |
05/19/17 | | CIBC World Markets Corp. | | | CHF | | | | 21,735,087 | | | | USD | | | | 21,698,200 | | | | 21,874,449 | | | | (176,249 | ) |
05/19/17 | | CIBC World Markets Corp. | | | EUR | | | | 102,097,750 | | | | USD | | | | 108,823,950 | | | | 111,338,005 | | | | (2,514,055 | ) |
05/19/17 | | CIBC World Markets Corp. | | | GBP | | | | 48,900,049 | | | | USD | | | | 61,424,086 | | | | 63,374,708 | | | | (1,950,622 | ) |
05/19/17 | | Goldman Sachs International | | | CAD | | | | 111,362,980 | | | | USD | | | | 83,854,823 | | | | 81,600,113 | | | | 2,254,710 | |
05/19/17 | | Goldman Sachs International | | | CHF | | | | 21,736,794 | | | | USD | | | | 21,706,405 | | | | 21,876,167 | | | | (169,762 | ) |
05/19/17 | | Goldman Sachs International | | | EUR | | | | 102,097,750 | | | | USD | | | | 108,823,439 | | | | 111,338,005 | | | | (2,514,566 | ) |
05/19/17 | | Goldman Sachs International | | | GBP | | | | 48,900,049 | | | | USD | | | | 61,432,301 | | | | 63,374,708 | | | | (1,942,407 | ) |
05/19/17 | | RBC Capital Markets Corp. | | | CAD | | | | 111,362,980 | | | | USD | | | | 83,846,301 | | | | 81,600,113 | | | | 2,246,188 | |
05/19/17 | | RBC Capital Markets Corp. | | | CHF | | | | 21,735,087 | | | | USD | | | | 21,695,882 | | | | 21,874,449 | | | | (178,567 | ) |
05/19/17 | | RBC Capital Markets Corp. | | | EUR | | | | 102,097,750 | | | | USD | | | | 108,817,824 | | | | 111,338,005 | | | | (2,520,181 | ) |
05/19/17 | | RBC Capital Markets Corp. | | | GBP | | | | 48,899,108 | | | | USD | | | | 61,436,203 | | | | 63,373,488 | | | | (1,937,285 | ) |
Total Open Forward Foreign Currency Contracts — Currency Risk | | | | | | | | | | | | | | | | | | | | | | $ | (9,516,808 | ) |
Currency Abbreviations:
| | |
| CAD | | – Canadian Dollar |
| CHF | | – Swiss Franc |
| EUR | | – Euro |
| | |
| GBP | | – British Pound Sterling |
| USD | | – U.S. Dollar |
18 Invesco Comstock Fund
Value of Derivative Investments at Period-End
The table below summarizes the value of the Fund’s derivative investments, detailed by primary risk exposure, held as of April 30, 2017:
| | | | |
| | | Value | |
| Derivative Assets | | Currency
Risk | |
Unrealized appreciation on forward foreign currency contracts outstanding | | $ | 9,017,270 | |
Derivatives not subject to master netting agreements | | | — | |
Total Derivative Assets subject to master netting agreements | | $ | 9,017,270 | |
| |
| | | Value | |
| Derivative Liabilities | | Currency
Risk | |
Unrealized depreciation on forward foreign currency contracts outstanding | | $ | (18,534,078 | ) |
Derivatives not subject to master netting agreements | | | — | |
Total Derivative Liabilities subject to master netting agreements | | $ | (18,534,078 | ) |
Offsetting Assets and Liabilities
The table below reflects the Fund’s exposure to Counterparties subject to either an ISDA Master Agreement or other agreement for OTC derivative transactions as of April 30, 2017.
| | | | | | | | | | | | | | | | | | | | | | | | |
| | | Financial
Derivative
Assets | | | Financial
Derivative
Liabilities | | | | | | Collateral
(Received)/Pledged | | | | |
| Counterparty | | Forward
Foreign Currency
Contracts | | | Forward
Foreign Currency
Contracts | | | Net Value of
Derivatives | | | Non-Cash | | | Cash | | | Net
Amount | |
Barclays Bank PLC | | $ | 2,276,500 | | | $ | (4,630,384 | ) | | $ | (2,353,884 | ) | | $ | — | | | $ | — | | | $ | (2,353,884 | ) |
CIBC World Markets Corp. | | | 2,239,872 | | | | (4,640,926 | ) | | | (2,401,054 | ) | | | — | | | | — | | | | (2,401,054 | ) |
Goldman Sachs International | | | 2,254,710 | | | | (4,626,735 | ) | | | (2,372,025 | ) | | | — | | | | — | | | | (2,372,025 | ) |
RBC Capital Markets Corp. | | | 2,246,188 | | | | (4,636,033 | ) | | | (2,389,845 | ) | | | — | | | | — | | | | (2,389,845 | ) |
Total | | $ | 9,017,270 | | | $ | (18,534,078 | ) | | $ | (9,516,808 | ) | | $ | — | | | $ | — | | | $ | (9,516,808 | ) |
Effect of Derivative Investments for the year ended April 30, 2017
The table below summarizes the gains on derivative investments, detailed by primary risk exposure, recognized in earnings during the period:
| | | | |
| | | Location of Gain on
Statement of Operations | |
| | Currency
Risk | |
Realized Gain: | | | | |
Forward foreign currency contracts | | $ | 78,546,878 | |
Change in Net Unrealized Appreciation: | | | | |
Forward foreign currency contracts | | | 4,255,223 | |
Total | | $ | 82,802,101 | |
The table below summarizes the average notional value of forward foreign currency contracts outstanding during the period.
| | | | |
| | | Forward
Foreign Currency
Contracts | |
Average notional value | | $ | 1,082,175,095 | |
NOTE 5—Security Transactions with Affiliated Funds
The Fund is permitted to purchase or sell securities from or to certain other Invesco Funds under specified conditions outlined in procedures adopted by the Board of Trustees of the Trust. The procedures have been designed to ensure that any purchase or sale of securities by the Fund from or to another fund or portfolio that is or could be considered an affiliate by virtue of having a common investment adviser (or affiliated investment advisers), common Trustees and/or common officers complies with Rule 17a-7 of the 1940 Act. Further, as defined under the procedures, each transaction is effected at the current market price. Pursuant to these procedures, for the year ended April 30, 2017, the Fund engaged in securities purchases of $12,220,602 and securities sales of $21,651,299, which resulted in net realized gains of $11,066,231.
19 Invesco Comstock Fund
NOTE 6—Expense Offset Arrangement(s)
The expense offset arrangement is comprised of transfer agency credits which result from balances in demand deposit accounts used by the transfer agent for clearing shareholder transactions. For the year ended April 30, 2017, the Fund received credits from this arrangement, which resulted in the reduction of the Fund’s total expenses of $32,050.
NOTE 7—Trustees’ and Officers’ Fees and Benefits
Trustees’ and Officers’ Fees and Benefits include amounts accrued by the Fund to pay remuneration to certain Trustees and Officers of the Fund. Trustees have the option to defer compensation payable by the Fund, and Trustees’ and Officers’ Fees and Benefits also include amounts accrued by the Fund to fund such deferred compensation amounts. Those Trustees who defer compensation have the option to select various Invesco Funds in which their deferral accounts shall be deemed to be invested. Finally, certain current Trustees were eligible to participate in a retirement plan that provided for benefits to be paid upon retirement to Trustees over a period of time based on the number of years of service. The Fund may have certain former Trustees who also participate in a retirement plan and receive benefits under such plan. Trustees’ and Officers’ Fees and Benefits include amounts accrued by the Fund to fund such retirement benefits. Obligations under the deferred compensation and retirement plans represent unsecured claims against the general assets of the Fund.
NOTE 8—Cash Balances
The Fund is permitted to temporarily carry a negative or overdrawn balance in its account with State Street Bank and Trust Company, the custodian bank. Such balances, if any at period-end, are shown in the Statement of Assets and Liabilities under the payable caption Amount due custodian. To compensate the custodian bank for such overdrafts, the overdrawn Fund may either (1) leave funds as a compensating balance in the account so the custodian bank can be compensated by earning the additional interest; or (2) compensate by paying the custodian bank at a rate agreed upon by the custodian bank and Invesco, not to exceed the contractually agreed upon rate.
NOTE 9—Distributions to Shareholders and Tax Components of Net Assets
Tax Character of Distributions to Shareholders Paid During the Fiscal Years Ended April 30, 2017 and 2016:
| | | | | | | | |
| | | 2017 | | | 2016 | |
Ordinary income | | $ | 329,804,225 | | | $ | 219,145,849 | |
Long-term capital gain | | | 601,194,293 | | | | 1,002,729,910 | |
Total distributions | | $ | 930,998,518 | | | $ | 1,221,875,759 | |
Tax Components of Net Assets at Period-End:
| | | | |
| | | 2017 | |
Undistributed ordinary income | | $ | 18,089,689 | |
Net unrealized appreciation — investments | | | 2,562,031,859 | |
Net unrealized appreciation (depreciation) — other investments | | | (124,076 | ) |
Temporary book/tax differences | | | (1,001,488 | ) |
Post-October deferrals | | | (68,246,823 | ) |
Capital loss carryforward | | | (3,887,996 | ) |
Shares of beneficial interest | | | 9,498,555,189 | |
Total net assets | | $ | 12,005,416,354 | |
The difference between book-basis and tax-basis unrealized appreciation (depreciation) is due to differences in the timing of recognition of gains and losses on investments for tax and book purposes. The Fund’s net unrealized appreciation difference is attributable primarily to wash sales.
The temporary book/tax differences are a result of timing differences between book and tax recognition of income and/or expenses. The Fund’s temporary book/tax differences are the result of the trustee deferral of compensation and retirement plan benefits.
Capital loss carryforward is calculated and reported as of a specific date. Results of transactions and other activity after that date may affect the amount of capital loss carryforward actually available for the Fund to utilize. Capital losses generated in years beginning after December 22, 2010 can be carried forward for an unlimited period, whereas previous losses expire in eight tax years. Capital losses with an expiration period may not be used to offset capital gains until all net capital losses without an expiration date have been utilized. Capital loss carryforwards with no expiration date will retain their character as either short-term or long-term capital losses instead of as short-term capital losses as under prior law. The ability to utilize capital loss carryforwards in the future may be limited under the Internal Revenue Code and related regulations based on the results of future transactions.
The Fund has a capital loss carryforward as of April 30, 2017, which expires as follows:
| | | | | | | | | | | | |
| Capital Loss Carryforward* | |
| Expiration | | Short-Term | | | Long-Term | | | Total | |
April 30, 2018 | | $ | 3,887,996 | | | $ | — | | | $ | 3,887,996 | |
| * | Capital loss carryforward as of the date listed above is reduced for limitations, if any, to the extent required by the Internal Revenue Code and may be further limited depending upon a variety of factors, including the realization of net unrealized gains or losses as of the date of any reorganization. |
20 Invesco Comstock Fund
NOTE 10—Investment Securities
The aggregate amount of investment securities (other than short-term securities, U.S. Treasury obligations and money market funds, if any) purchased and sold by the Fund during the year ended April 30, 2017 was $2,087,866,584 and $3,761,895,672, respectively. Cost of investments on a tax basis includes the adjustments for financial reporting purposes as of the most recently completed federal income tax reporting period-end.
| | | | |
| Unrealized Appreciation (Depreciation) of Investment Securities on a Tax Basis | |
Aggregate unrealized appreciation of investment securities | | $ | 2,974,160,859 | |
Aggregate unrealized (depreciation) of investment securities | | | (412,129,000 | ) |
Net unrealized appreciation of investment securities | | $ | 2,562,031,859 | |
Cost of investments for tax purposes is $9,426,283,739.
NOTE 11—Reclassification of Permanent Differences
Primarily as a result of differing book/tax treatment of foreign currency transactions and income distribution reclass, on April 30, 2017, undistributed net investment income was decreased by $160,788, undistributed net realized gain (loss) was increased by $1,182,474 and shares of beneficial interest was decreased by $1,021,686. This reclassification had no effect on the net assets of the Fund.
NOTE 12—Share Information
| | | | | | | | | | | | | | | | |
| | | Summary of Share Activity | |
| | | Years ended April 30, | |
| | | 2017(a) | | | 2016 | |
| | | Shares | | | Amount | | | Shares | | | Amount | |
Sold: | | | | | | | | | | | | | | | | |
Class A | | | 22,064,638 | | | $ | 515,384,295 | | | | 32,160,583 | | | $ | 742,312,009 | |
Class B | | | 38,483 | | | | 905,789 | | | | 28,190 | | | | 661,460 | |
Class C | | | 1,386,743 | | | | 32,573,823 | | | | 2,110,453 | | | | 49,441,501 | |
Class R | | | 2,305,798 | | | | 53,302,423 | | | | 4,830,506 | | | | 112,910,807 | |
Class Y | | | 38,735,527 | | | | 910,300,914 | | | | 25,974,703 | | | | 595,989,119 | |
Class R5 | | | 5,217,848 | | | | 123,474,791 | | | | 8,083,776 | | | | 188,964,768 | |
Class R6 | | | 7,062,920 | | | | 165,460,047 | | | | 9,355,472 | | | | 215,842,096 | |
| | | | |
Issued as reinvestment of dividends: | | | | | | | | | | | | | | | | |
Class A | | | 19,918,094 | | | | 474,072,655 | | | | 29,208,783 | | | | 629,408,125 | |
Class B | | | 175,111 | | | | 4,157,118 | | | | 395,739 | | | | 8,539,004 | |
Class C | | | 1,396,158 | | | | 33,368,191 | | | | 2,196,248 | | | | 47,119,505 | |
Class R | | | 1,149,362 | | | | 27,380,666 | | | | 1,916,330 | | | | 41,248,008 | |
Class Y | | | 9,756,499 | | | | 231,636,236 | | | | 13,674,987 | | | | 295,158,296 | |
Class R5 | | | 2,589,705 | | | | 61,492,443 | | | | 3,750,536 | | | | 80,915,802 | |
Class R6 | | | 2,341,425 | | | | 55,569,573 | | | | 2,876,832 | | | | 62,068,817 | |
| | | | |
Automatic conversion of Class B shares to Class A shares: | | | | | | | | | | | | | | | | |
Class A | | | 1,333,203 | | | | 30,941,802 | | | | 1,515,806 | | | | 34,981,774 | |
Class B | | | (1,333,740 | ) | | | (30,941,802 | ) | | | (1,516,131 | ) | | | (34,981,774 | ) |
| | | | |
Reacquired: | | | | | | | | | | | | | | | | |
Class A | | | (81,564,205 | ) | | | (1,895,885,394 | ) | | | (55,976,831 | ) | | | (1,283,773,766 | ) |
Class B | | | (457,559 | ) | | | (10,568,682 | ) | | | (588,444 | ) | | | (13,719,430 | ) |
Class C | | | (5,825,721 | ) | | | (134,605,043 | ) | | | (4,443,065 | ) | | | (101,114,794 | ) |
Class R | | | (6,385,391 | ) | | | (147,364,515 | ) | | | (9,000,597 | ) | | | (201,596,469 | ) |
Class Y | | | (48,504,398 | ) | | | (1,126,175,015 | ) | | | (32,245,007 | ) | | | (740,935,653 | ) |
Class R5 | | | (14,648,992 | ) | | | (344,069,222 | ) | | | (6,019,494 | ) | | | (138,668,988 | ) |
Class R6 | | | (8,710,647 | ) | | | (205,623,897 | ) | | | (6,526,230 | ) | | | (150,177,350 | ) |
Net increase (decrease) in share activity | | | (51,959,139 | ) | | $ | (1,175,212,804 | ) | | | 21,763,145 | | | $ | 440,592,867 | |
| (a) | There are entities that are record owners of more than 5% of the outstanding shares of the Fund and in the aggregate own 40% of the outstanding shares of the Fund. IDI has an agreement with these entities to sell Fund shares. The Fund, Invesco and/or Invesco affiliates may make payments to these entities, which are considered to be related to the Fund, for providing services to the Fund, Invesco and/or Invesco affiliates including but not limited to services such as securities brokerage, distribution, third party record keeping and account servicing. The Fund has no knowledge as to whether all or any portion of the shares owned of record by these entities are also owned beneficially. |
21 Invesco Comstock Fund
NOTE 13—Financial Highlights
The following schedule presents financial highlights for a share of the Fund outstanding throughout the periods indicated.
| | | | | | | | | | | | | | | | | | | | | | | | | | | | | | | | | | | | | | | | | | | | | | | | | | | | | | | | |
| | | Net asset
value,
beginning
of period | | | Net
investment
income(a) | | | Net gains
(losses)
on securities
(both
realized and
unrealized) | | | Total from
investment
operations | | | Dividends
from net
investment
income | | | Distributions
from net
realized
gains | | | Total
distributions | | | Net asset
value, end
of period | | | Total
return(b) | | | Net assets,
end of period
(000’s omitted) | | | Ratio of
expenses
to average
net assets
with fee waivers
and/or expenses
absorbed | | | Ratio of
expenses
to average net
assets without
fee waivers
and/or expenses
absorbed | | | Ratio of net
investment
income
to average
net assets | | | Portfolio
turnover(c) | |
Class A | | | | | | | | | | | | | | | | | | | | | | | | | | | | | | | | | | | | | | | | | | | | | | | | | | | | | | | | |
Year ended 04/30/17 | | $ | 21.86 | | | $ | 0.40 | | | $ | 3.61 | | | $ | 4.01 | | | $ | (0.49 | ) | | $ | (1.35 | ) | | $ | (1.84 | ) | | $ | 24.03 | | | | 18.56 | % | | $ | 6,350,463 | | | | 0.84 | %(d) | | | 0.84 | %(d) | | | 1.75 | %(d) | | | 18 | % |
Year ended 04/30/16 | | | 26.04 | | | | 0.44 | | | | (2.29 | ) | | | (1.85 | ) | | | (0.36 | ) | | | (1.97 | ) | | | (2.33 | ) | | | 21.86 | | | | (6.90 | ) | | | 6,613,286 | | | | 0.84 | | | | 0.85 | | | | 1.87 | | | | 15 | |
Year ended 04/30/15 | | | 24.29 | | | | 0.32 | | | | 1.84 | | | | 2.16 | | | | (0.41 | ) | | | — | | | | (0.41 | ) | | | 26.04 | | | | 8.98 | | | | 7,698,790 | | | | 0.82 | | | | 0.83 | | | | 1.30 | | | | 17 | |
Year ended 04/30/14 | | | 20.25 | | | | 0.36 | | | | 3.96 | | | | 4.32 | | | | (0.28 | ) | | | — | | | | (0.28 | ) | | | 24.29 | | | | 21.47 | | | | 7,356,633 | | | | 0.81 | | | | 0.82 | | | | 1.59 | | | | 11 | |
Year ended 04/30/13 | | | 16.93 | | | | 0.27 | | | | 3.32 | | | | 3.59 | | | | (0.27 | ) | | | — | | | | (0.27 | ) | | | 20.25 | | | | 21.46 | | | | 6,034,792 | | | | 0.86 | | | | 0.86 | | | | 1.56 | | | | 12 | |
Class B | | | | | | | | | | | | | | | | | | | | | | | | | | | | | | | | | | | | | | | | | | | | | | | | | | | | | | | | |
Year ended 04/30/17 | | | 21.85 | | | | 0.40 | | | | 3.61 | | | | 4.01 | | | | (0.49 | ) | | | (1.35 | ) | | | (1.84 | ) | | | 24.02 | | | | 18.57 | (e) | | | 39,820 | | | | 0.84 | (d)(e) | | | 0.84 | (d)(e) | | | 1.75 | (d)(e) | | | 18 | |
Year ended 04/30/16 | | | 26.03 | | | | 0.44 | | | | (2.29 | ) | | | (1.85 | ) | | | (0.36 | ) | | | (1.97 | ) | | | (2.33 | ) | | | 21.85 | | | | (6.91 | )(e) | | | 70,701 | | | | 0.84 | (e) | | | 0.85 | (e) | | | 1.87 | (e) | | | 15 | |
Year ended 04/30/15 | | | 24.28 | | | | 0.32 | | | | 1.84 | | | | 2.16 | | | | (0.41 | ) | | | — | | | | (0.41 | ) | | | 26.03 | | | | 8.98 | (e) | | | 127,988 | | | | 0.82 | (e) | | | 0.83 | (e) | | | 1.30 | (e) | | | 17 | |
Year ended 04/30/14 | | | 20.23 | | | | 0.32 | | | | 3.97 | | | | 4.29 | | | | (0.24 | ) | | | — | | | | (0.24 | ) | | | 24.28 | | | | 21.31 | (e) | | | 184,409 | | | | 0.96 | (e) | | | 0.97 | (e) | | | 1.44 | (e) | | | 11 | |
Year ended 04/30/13 | | | 16.93 | | | | 0.23 | | | | 3.30 | | | | 3.53 | | | | (0.23 | ) | | | — | | | | (0.23 | ) | | | 20.23 | | | | 21.11 | | | | 248,404 | | | | 1.09 | | | | 1.61 | | | | 1.33 | | | | 12 | |
Class C | | | | | | | | | | | | | | | | | | | | | | | | | | | | | | | | | | | | | | | | | | | | | | | | | | | | | | | | |
Year ended 04/30/17 | | | 21.85 | | | | 0.23 | | | | 3.61 | | | | 3.84 | | | | (0.32 | ) | | | (1.35 | ) | | | (1.67 | ) | | | 24.02 | | | | 17.70 | | | | 511,920 | | | | 1.59 | (d) | | | 1.59 | (d) | | | 1.00 | (d) | | | 18 | |
Year ended 04/30/16 | | | 26.03 | | | | 0.27 | | | | (2.29 | ) | | | (2.02 | ) | | | (0.19 | ) | | | (1.97 | ) | | | (2.16 | ) | | | 21.85 | | | | (7.59 | )(f) | | | 532,230 | | | | 1.56 | (f) | | | 1.57 | (f) | | | 1.15 | (f) | | | 15 | |
Year ended 04/30/15 | | | 24.28 | | | | 0.13 | | | | 1.84 | | | | 1.97 | | | | (0.22 | ) | | | — | | | | (0.22 | ) | | | 26.03 | | | | 8.17 | | | | 637,579 | | | | 1.57 | | | | 1.58 | | | | 0.55 | | | | 17 | |
Year ended 04/30/14 | | | 20.24 | | | | 0.19 | | | | 3.96 | | | | 4.15 | | | | (0.11 | ) | | | — | | | | (0.11 | ) | | | 24.28 | | | | 20.57 | | | | 589,910 | | | | 1.56 | | | | 1.57 | | | | 0.84 | | | | 11 | |
Year ended 04/30/13 | | | 16.93 | | | | 0.14 | | | | 3.31 | | | | 3.45 | | | | (0.14 | ) | | | — | | | | (0.14 | ) | | | 20.24 | | | | 20.52 | | | | 469,962 | | | | 1.61 | | | | 1.61 | | | | 0.81 | | | | 12 | |
Class R | | | | | | | | | | | | | | | | | | | | | | | | | | | | | | | | | | | | | | | | | | | | | | | | | | | | | | | | |
Year ended 04/30/17 | | | 21.86 | | | | 0.35 | | | | 3.61 | | | | 3.96 | | | | (0.44 | ) | | | (1.35 | ) | | | (1.79 | ) | | | 24.03 | | | | 18.27 | | | | 324,055 | | | | 1.09 | (d) | | | 1.09 | (d) | | | 1.50 | (d) | | | 18 | |
Year ended 04/30/16 | | | 26.04 | | | | 0.38 | | | | (2.29 | ) | | | (1.91 | ) | | | (0.30 | ) | | | (1.97 | ) | | | (2.27 | ) | | | 21.86 | | | | (7.14 | ) | | | 358,835 | | | | 1.09 | | | | 1.10 | | | | 1.62 | | | | 15 | |
Year ended 04/30/15 | | | 24.29 | | | | 0.26 | | | | 1.84 | | | | 2.10 | | | | (0.35 | ) | | | — | | | | (0.35 | ) | | | 26.04 | | | | 8.71 | | | | 486,154 | | | | 1.07 | | | | 1.08 | | | | 1.05 | | | | 17 | |
Year ended 04/30/14 | | | 20.24 | | | | 0.30 | | | | 3.97 | | | | 4.27 | | | | (0.22 | ) | | | — | | | | (0.22 | ) | | | 24.29 | | | | 21.22 | | | | 335,562 | | | | 1.06 | | | | 1.07 | | | | 1.34 | | | | 11 | |
Year ended 04/30/13 | | | 16.93 | | | | 0.23 | | | | 3.31 | | | | 3.54 | | | | (0.23 | ) | | | — | | | | (0.23 | ) | | | 20.24 | | | | 21.11 | | | | 220,443 | | | | 1.11 | | | | 1.11 | | | | 1.31 | | | | 12 | |
Class Y | | | | | | | | | | | | | | | | | | | | | | | | | | | | | | | | | | | | | | | | | | | | | | | | | | | | | | | | |
Year ended 04/30/17 | | | 21.86 | | | | 0.46 | | | | 3.61 | | | | 4.07 | | | | (0.55 | ) | | | (1.35 | ) | | | (1.90 | ) | | | 24.03 | | | | 18.86 | | | | 3,334,930 | | | | 0.59 | (d) | | | 0.59 | (d) | | | 2.00 | (d) | | | 18 | |
Year ended 04/30/16 | | | 26.04 | | | | 0.49 | | | | (2.28 | ) | | | (1.79 | ) | | | (0.42 | ) | | | (1.97 | ) | | | (2.39 | ) | | | 21.86 | | | | (6.67 | ) | | | 3,034,620 | | | | 0.59 | | | | 0.60 | | | | 2.12 | | | | 15 | |
Year ended 04/30/15 | | | 24.29 | | | | 0.39 | | | | 1.84 | | | | 2.23 | | | | (0.48 | ) | | | — | | | | (0.48 | ) | | | 26.04 | | | | 9.26 | | | | 3,422,401 | | | | 0.57 | | | | 0.58 | | | | 1.55 | | | | 17 | |
Year ended 04/30/14 | | | 20.25 | | | | 0.41 | | | | 3.97 | | | | 4.38 | | | | (0.34 | ) | | | — | | | | (0.34 | ) | | | 24.29 | | | | 21.77 | | | | 2,941,152 | | | | 0.56 | | | | 0.57 | | | | 1.84 | | | | 11 | |
Year ended 04/30/13 | | | 16.93 | | | | 0.32 | | | | 3.31 | | | | 3.63 | | | | (0.31 | ) | | | — | | | | (0.31 | ) | | | 20.25 | | | | 21.76 | | | | 2,151,816 | | | | 0.61 | | | | 0.61 | | | | 1.81 | | | | 12 | |
Class R5 | | | | | | | | | | | | | | | | | | | | | | | | | | | | | | | | | | | | | | | | | | | | | | | | | | | | | | | | |
Year ended 04/30/17 | | | 21.85 | | | | 0.48 | | | | 3.62 | | | | 4.10 | | | | (0.58 | ) | | | (1.35 | ) | | | (1.93 | ) | | | 24.02 | | | | 18.98 | | | | 741,550 | | | | 0.51 | (d) | | | 0.51 | (d) | | | 2.08 | (d) | | | 18 | |
Year ended 04/30/16 | | | 26.04 | | | | 0.51 | | | | (2.29 | ) | | | (1.78 | ) | | | (0.44 | ) | | | (1.97 | ) | | | (2.41 | ) | | | 21.85 | | | | (6.61 | ) | | | 824,228 | | | | 0.49 | | | | 0.50 | | | | 2.22 | | | | 15 | |
Year ended 04/30/15 | | | 24.29 | | | | 0.41 | | | | 1.84 | | | | 2.25 | | | | (0.50 | ) | | | — | | | | (0.50 | ) | | | 26.04 | | | | 9.36 | | | | 830,574 | | | | 0.49 | | | | 0.50 | | | | 1.63 | | | | 17 | |
Year ended 04/30/14 | | | 20.24 | | | | 0.43 | | | | 3.97 | | | | 4.40 | | | | (0.35 | ) | | | — | | | | (0.35 | ) | | | 24.29 | | | | 21.92 | | | | 631,780 | | | | 0.49 | | | | 0.50 | | | | 1.91 | | | | 11 | |
Year ended 04/30/13 | | | 16.93 | | | | 0.34 | | | | 3.31 | | | | 3.65 | | | | (0.34 | ) | | | — | | | | (0.34 | ) | | | 20.24 | | | | 21.85 | | | | 398,311 | | | | 0.49 | | | | 0.49 | | | | 1.93 | | | | 12 | |
Class R6 | | | | | | | | | | | | | | | | | | | | | | | | | | | | | | | | | | | | | | | | | | | | | | | | | | | | | | | | |
Year ended 04/30/17 | | | 21.85 | | | | 0.50 | | | | 3.61 | | | | 4.11 | | | | (0.60 | ) | | | (1.35 | ) | | | (1.95 | ) | | | 24.01 | | | | 19.05 | | | | 702,678 | | | | 0.41 | (d) | | | 0.41 | (d) | | | 2.18 | (d) | | | 18 | |
Year ended 04/30/16 | | | 26.03 | | | | 0.54 | | | | (2.29 | ) | | | (1.75 | ) | | | (0.46 | ) | | | (1.97 | ) | | | (2.43 | ) | | | 21.85 | | | | (6.48 | ) | | | 624,206 | | | | 0.39 | | | | 0.40 | | | | 2.32 | | | | 15 | |
Year ended 04/30/15 | | | 24.28 | | | | 0.44 | | | | 1.83 | | | | 2.27 | | | | (0.52 | ) | | | — | | | | (0.52 | ) | | | 26.03 | | | | 9.46 | | | | 595,160 | | | | 0.39 | | | | 0.40 | | | | 1.73 | | | | 17 | |
Year ended 04/30/14 | | | 20.25 | | | | 0.45 | | | | 3.95 | | | | 4.40 | | | | (0.37 | ) | | | — | | | | (0.37 | ) | | | 24.28 | | | | 21.92 | | | | 360,178 | | | | 0.40 | | | | 0.41 | | | | 2.00 | | | | 11 | |
Year ended 04/30/13(g) | | | 17.67 | | | | 0.22 | | | | 2.54 | | | | 2.76 | | | | (0.18 | ) | | | — | | | | (0.18 | ) | | | 20.25 | | | | 15.73 | | | | 148,859 | | | | 0.41 | (h) | | | 0.41 | (h) | | | 2.01 | (h) | | | 12 | |
| (a) | Calculated using average shares outstanding. |
| (b) | Includes adjustments in accordance with accounting principles generally accepted in the United States of America and as such, the net asset value for financial reporting purposes and the returns based upon those net asset values may differ from the net asset value and returns for shareholder transactions. Does not include sales charges and is not annualized for periods less than one year, if applicable. |
| (c) | Portfolio turnover is calculated at the fund level and is not annualized for periods less than one year, if applicable. |
| (d) | Ratios are based on average daily net assets (000’s omitted) of $6,515,464, $57,701, $520,899, $340,734, $3,100,916, $798,742 and $659,762 for Class A, Class B, Class C, Class R, Class Y, Class R5 and Class R6 shares, respectively. |
| (e) | The total return, ratio of expenses to average net assets and ratio of net investment income (loss) to average net assets reflect actual 12b-1 fees of 0.25% for the years ended April 30, 2017, April 30,2016 and April 30, 2015 and 0.40% for the year ended April 30, 2014 for Class B Shares. |
| (f) | The total return, ratio of expenses to average net assets and ratio of net investment income (loss) to average net assets reflect actual 12b-1 fees of 0.97% for the year ended April 30, 2016 for Class C shares. |
| (g) | Commencement date of September 24, 2012. |
22 Invesco Comstock Fund
Report of Independent Registered Public Accounting Firm
To the Board of Trustees of AIM Sector Funds (Invesco Sector Funds)
and Shareholders of the Invesco Comstock Fund:
In our opinion, the accompanying statement of assets and liabilities, including the schedule of investments, and the related statements of operations and of changes in net assets and the financial highlights present fairly, in all material respects, the financial position of the Invesco Comstock Fund (one of the portfolios constituting the AIM Sector Funds (Invesco Sector Funds), hereafter referred to as the “Fund”) as of April 30, 2017, the results of its operations for the year then ended, the changes its net assets for each of the two years in the period then ended and the financial highlights for each of the five years in the period then ended, in conformity with accounting principles generally accepted in the United States of America. These financial statements and financial highlights (hereafter referred to as “financial statements”) are the responsibility of the Fund’s management. Our responsibility is to express an opinion on these financial statements based on our audits. We conducted our audits of these financial statements in accordance with the standards of the Public Company Accounting Oversight Board (United States). Those standards require that we plan and perform the audit to obtain reasonable assurance about whether the financial statements are free of material misstatement. An audit includes examining, on a test basis, evidence supporting the amounts and disclosures in the financial statements, assessing the accounting principles used and significant estimates made by management, and evaluating the overall financial statement presentation. We believe that our audits, which included confirmation of securities as of April 30, 2017 by correspondence with the custodian and brokers, provide a reasonable basis for our opinion.
PricewaterhouseCoopers LLP
Houston, TX
June 23, 2017
23 Invesco Comstock Fund
Calculating your ongoing Fund expenses
Example
As a shareholder of the Fund, you incur two types of costs: (1) transaction costs, which may include sales charges (loads) on purchase payments or contingent deferred sales charges on redemptions, if any; and (2) ongoing costs, including management fees, distribution and/or service (12b-1) fees, and other Fund expenses. This example is intended to help you understand your ongoing costs (in dollars) of investing in the Fund and to compare these costs with ongoing costs of investing in other mutual funds. The example is based on an investment of $1,000 invested at the beginning of the period and held for the entire period November 1, 2016 through April 30, 2017.
Actual expenses
The table below provides information about actual account values and actual expenses. You may use the information in this table, together with the amount you invested, to estimate the expenses that you paid over the period. Simply divide your account value by $1,000 (for example, an $8,600 account value divided by $1,000 = 8.6), then multiply the result by the number in the table under the heading entitled “Actual Expenses Paid During Period” to estimate the expenses you paid on your account during this period.
Hypothetical example for comparison purposes
The table below also provides information about hypothetical account values and hypothetical expenses based on the Fund’s actual expense ratio and an assumed rate of return of 5% per year before expenses, which is not the Fund’s actual return.
The hypothetical account values and expenses may not be used to estimate the actual ending account balance or expenses you paid for the period. You may use this information to compare the ongoing costs of investing in the Fund and other funds. To do so, compare this 5% hypothetical example with the 5% hypothetical examples that appear in the shareholder reports of the other funds.
Please note that the expenses shown in the table are meant to highlight your ongoing costs only and do not reflect any transaction costs, such as sales charges (loads) on purchase payments or contingent deferred sales charges on redemptions, if any. Therefore, the hypothetical information is useful in comparing ongoing costs only, and will not help you determine the relative total costs of owning different funds. In addition, if these transaction costs were included, your costs would have been higher.
| | | | | | | | | | | | | | | | | | | | | | | | |
| Class | | Beginning
Account Value
(11/01/16) | | | ACTUAL | | | HYPOTHETICAL (5% annual return before
expenses) | | | Annualized
Expense
Ratio | |
| | | Ending
Account Value
(04/30/17)1 | | | Expenses
Paid During
Period2 | | | Ending
Account Value
(04/30/17) | | | Expenses
Paid During
Period2 | | |
| A | | $ | 1,000.00 | | | $ | 1,133.40 | | | $ | 4.44 | | | $ | 1,020.63 | | | $ | 4.21 | | | | 0.84 | % |
| B | | | 1,000.00 | | | | 1,133.50 | | | | 4.44 | | | | 1,020.63 | | | | 4.21 | | | | 0.84 | |
| C | | | 1,000.00 | | | | 1,129.30 | | | | 8.45 | | | | 1,016.86 | | | | 8.00 | | | | 1.60 | |
| R | | | 1,000.00 | | | | 1,132.00 | | | | 5.76 | | | | 1,019.39 | | | | 5.46 | | | | 1.09 | |
| Y | | | 1,000.00 | | | | 1,134.90 | | | | 3.12 | | | | 1,021.87 | | | | 2.96 | | | | 0.59 | |
| R5 | | | 1,000.00 | | | | 1,135.40 | | | | 2.70 | | | | 1,022.27 | | | | 2.56 | | | | 0.51 | |
| R6 | | | 1,000.00 | | | | 1,135.60 | | | | 2.17 | | | | 1,022.76 | | | | 2.06 | | | | 0.41 | |
| 1 | The actual ending account value is based on the actual total return of the Fund for the period November 1, 2016 through April 30, 2017, after actual expenses and will differ from the hypothetical ending account value which is based on the Fund’s expense ratio and a hypothetical annual return of 5% before expenses. |
| 2 | Expenses are equal to the Fund’s annualized expense ratio as indicated above multiplied by the average account value over the period, multiplied by 181/365 to reflect the most recent fiscal half year. |
24 Invesco Comstock Fund
Tax Information
Form 1099-DIV, Form 1042-S and other year-end tax information provide shareholders with actual calendar year amounts that should be included in their tax returns. Shareholders should consult their tax advisors.
The following distribution information is being provided as required by the Internal Revenue Code or to meet a specific state’s requirement.
The Fund designates the following amounts or, if subsequently determined to be different, the maximum amount allowable for its fiscal year ended April 30, 2017:
| | | | |
Federal and State Income Tax | |
Long-Term Capital Gain Distributions | | $ | 601,194,293 | |
Qualified Dividend Income* | | | 100 | % |
Corporate Dividends Received Deduction* | | | 83.69 | % |
U.S. Treasury Obligations* | | | 0 | % |
| | * | The above percentages are based on ordinary income dividends paid to shareholders during the Fund’s fiscal year. |
| | | | |
Non-Resident Alien Shareholders | |
Qualified Short-Term Gains | | $ | 68,484,059 | |
25 Invesco Comstock Fund
Proxy Results
A Special Joint Meeting (“Meeting”) of Shareholders of Invesco Comstock Fund, an investment portfolio of AIM Sector Funds (Invesco Sector Funds), a Delaware statutory trust (“Trust”), was held on March 9, 2017. The Meeting was held for the following purpose:
| (1) | Elect 15 trustees to the Board, each of whom will serve until his or her successor is elected and qualified. |
| (2) | Approve an amendment to the Trust’s Agreement and Declaration of Trust that would permit fund mergers and other significant transactions upon the Board’s approval but without shareholder approval of such transactions. |
The results of the voting on the above matters were as follows:
| | | | | | | | | | | | | | | | | | |
| | | Matters | | | | | | | | Votes For | | | Votes Withheld | |
| (1)* | | David C. Arch | | | | 478,210,140 | | | | 13,802,825 | |
| | James T. Bunch | | | | 477,776,614 | | | | 14,236,351 | |
| | Bruce L. Crockett | | | | 477,904,863 | | | | 14,108,102 | |
| | Jack M. Fields | | | | 478,154,120 | | | | 13,858,845 | |
| | Martin L. Flanagan | | | | 478,366,284 | | | | 13,646,681 | |
| | Cynthia Hostetler | | | | 478,149,043 | | | | 13,863,922 | |
| | Dr. Eli Jones | | | | 478,281,396 | | | | 13,731,569 | |
| | Dr. Prema Mathai-Davis | | | | 477,927,603 | | | | 14,085,362 | |
| | Teresa M. Ressel | | | | 478,116,999 | | | | 13,895,966 | |
| | Dr. Larry Soll | | | | 477,671,696 | | | | 14,341,269 | |
| | Ann Barnett Stern | | | | 478,390,538 | | | | 13,622,427 | |
| | Raymond Stickel, Jr. | | | | 477,934,336 | | | | 14,078,629 | |
| | Philip A. Taylor | | | | 478,104,174 | | | | 13,908,791 | |
| | Robert C. Troccoli | | | | 478,368,464 | | | | 13,644,501 | |
| | Christopher L. Wilson | | | | 478,433,867 | | | | 13,579,098 | |
| | | | | |
| | | | | | | | | | | | | | | | | | |
| | | | | Votes For | | | Votes
Against | | | Votes
Abstain | | | Broker
Non-Votes | |
| (2)* | | Approve an amendment to the Trust’s Agreement and Declaration of Trust that would permit fund mergers and other significant transactions upon the Board’s approval but without shareholder approval of such transactions | | | 261,575,830 | | | | 26,621,916 | | | | 13,166,011 | | | | 190,648,808 | |
The Meeting was adjourned until April 11, 2017, with respect to the following proposals:
| (3) | Approve changing the fundamental investment restriction regarding the purchase or sale of physical commodities. |
| 4(a) | Approve an amendment to the current Master Intergroup Sub-Advisory Contract to add Invesco PowerShares Capital Management LLC. |
| 4(b) | Approve an amendment to the current Master Intergroup Sub-Advisory Contract to add Invesco Asset Management (India) Private Limited. |
Invesco Comstock Fund did not receive sufficient shareholder votes to pass Proposals 3 and 4(a) - (b).
The results of the voting on the above matters were as follows:
| | | | | | | | | | | | | | | | | | |
| | | Matters | | Votes For | | | Votes
Against | | | Votes
Abstain | | | Broker
Non-Votes | |
| (3) | | Approve changing the fundamental investment restriction regarding the purchase or sale of physical commodities | | | 164,116,011 | | | | 11,513,542 | | | | 10,065,767 | | | | 74,854,069 | |
| 4(a) | | Approve an amendment to the current Master Intergroup Sub-Advisory Contract to add Invesco PowerShares Capital Management LLC | | | 169,894,275 | | | | 6,024,433 | | | | 9,776,384 | | | | 74,854,297 | |
| 4(b) | | Approve an amendment to the current Master Intergroup Sub-Advisory Contract to add Invesco Asset Management (India) Private Limited | | | 167,491,706 | | | | 8,106,924 | | | | 10,096,714 | | | | 74,854,045 | |
| * | Each of proposal 1 and 2 required approval by a combined vote of all of the portfolios of AIM Sector Funds (Invesco Sector Funds). |
26 Invesco Comstock Fund
Trustees and Officers
The address of each trustee and officer is AIM Sector Funds (Invesco Sector Funds) (the “Trust”), 11 Greenway Plaza, Suite 1000, Houston, Texas 77046-1173. The trustees serve for the life of the Trust, subject to their earlier death, incapacitation, resignation, retirement or removal as more specifically provided in the Trust’s organizational documents. Each officer serves for a one year term or until their successors are elected and qualified. Column two below includes length of time served with predecessor entities, if any.
| | | | | | | | |
Name, Year of Birth and
Position(s) Held with the Trust | | Trustee and/
or Officer Since | | Principal Occupation(s)
During Past 5 Years | | Number of
Funds in Fund
Complex
Overseen by
Trustee | | Other Directorship(s)
Held by Trustee During
Past 5 Years |
| Interested Persons | | | | | | | | |
| Martin L. Flanagan1 — 1960 Trustee | | 2007 | | Executive Director, Chief Executive Officer and President, Invesco Ltd. (ultimate parent of Invesco and a global investment management firm); Trustee, The Invesco Funds; Vice Chair, Investment Company Institute; and Member of Executive Board, SMU Cox School of Business Formerly: Advisor to the Board, Invesco Advisers, Inc. (formerly known as Invesco Institutional (N.A.), Inc.); Chairman and Chief Executive Officer, Invesco Advisers, Inc. (registered investment adviser); Director, Chairman, Chief Executive Officer and President, Invesco Holding Company (US), Inc. (formerly IVZ Inc.) (holding company), Invesco Group Services, Inc. (service provider) and Invesco North American Holdings, Inc. (holding company); Director, Chief Executive Officer and President, Invesco Holding Company Limited (parent of Invesco and a global investment management firm); Director, Invesco Ltd.; Chairman, Investment Company Institute and President, Co-Chief Executive Officer, Co-President, Chief Operating Officer and Chief Financial Officer, Franklin Resources, Inc. (global investment management organization) | | 144 | | None |
Philip A. Taylor2 — 1954 Trustee and Senior Vice President | | 2006 | | Head of the Americas and Senior Managing Director, Invesco Ltd.; Director, Invesco Advisers, Inc. (formerly known as Invesco Institutional (N.A.), Inc.) (registered investment adviser); Director, Chairman, Chief Executive Officer and President, Invesco Management Group, Inc. (formerly known as Invesco Aim Management Group, Inc.) (financial services holding company); Director and Chairman, Invesco Investment Services, Inc. (formerly known as Invesco Aim Investment Services, Inc.) (registered transfer agent) Chief Executive Officer, Invesco Corporate Class Inc. (corporate mutual fund company) Director, Chairman and Chief Executive Officer, Invesco Canada Ltd. (formerly known as Invesco Trimark Ltd./Invesco Trimark Ltèe) (registered investment adviser and registered transfer agent); Trustee and Senior Vice President, The Invesco Funds; Director, Invesco Investment Advisers LLC (formerly known as Van Kampen Asset Management). Formerly: Co-Chairman, Co-President and Co-Chief Executive Officer, Invesco Advisers, Inc. (formerly known as Invesco Institutional (N.A.), Inc.) (registered investment adviser); Director, Chief Executive Officer and President, Van Kampen Exchange Corp; President and Principal Executive Officer, The Invesco Funds (other than AIM Treasurer’s Series Trust (Invesco Treasurer’s Series Trust), Short-Term Investments Trust and Invesco Management Trust); Executive Vice President, The Invesco Funds (AIM Treasurer’s Series Trust (Invesco Treasurer’s Series Trust), Short-Term Investments Trust and Invesco Management Trust only); Director and President, INVESCO Funds Group, Inc. (registered investment adviser and registered transfer agent); Director and Chairman, IVZ Distributors, Inc. (formerly known as INVESCO Distributors, Inc.) (registered broker dealer); Director, President and Chairman, Invesco Inc. (holding company), Invesco Canada Holdings Inc. (holding company), Trimark Investments Ltd./Placements Trimark Ltèe and Invesco Financial Services Ltd/Services Financiers Invesco Ltèe; Chief Executive Officer, Invesco Canada Fund Inc. (corporate mutual fund company); Director and Chairman, Van Kampen Investor Services Inc.; Director, Chief Executive Officer and President, 1371 Preferred Inc. (holding company) and Van Kampen Investments Inc.; Director and President, AIM GP Canada Inc. (general partner for limited partnerships) and Van Kampen Advisors, Inc.; Director and Chief Executive Officer, Invesco Trimark Dealer Inc. (registered broker dealer); Director, Invesco Distributors, Inc. (formerly known as Invesco Aim Distributors, Inc.) (registered broker dealer); Manager, Invesco PowerShares Capital Management LLC; Director, Chief Executive Officer and President, Invesco Advisers, Inc.; Director, Chairman, Chief Executive Officer and President, Invesco Aim Capital Management, Inc.; President, Invesco Trimark Dealer Inc. and Invesco Trimark Ltd./Invesco Trimark Ltèe; Director and President, AIM Trimark Corporate Class Inc. and AIM Trimark Canada Fund Inc.; Senior Managing Director, Invesco Holding Company Limited; Director and Chairman, Fund Management Company (former registered broker dealer); President and Principal Executive Officer, The Invesco Funds (AIM Treasurer’s Series Trust (Invesco Treasurer’s Series Trust), and Short-Term Investments Trust only); President, AIM Trimark Global Fund Inc. and AIM Trimark Canada Fund Inc. | | 144 | | None |
| 1 | Mr. Flanagan is considered an interested person (within the meaning of Section 2(a)(19) of the 1940 Act) of the Trust because he is an officer of the Adviser to the Trust, and an officer and a director of Invesco Ltd., ultimate parent of the Adviser. |
| 2 | Mr. Taylor is considered an interested person (within the meaning of Section 2(a)(19) of the 1940 Act) of the Trust because he is an officer and a director of the Adviser. |
T-1 Invesco Comstock Fund
Trustees and Officers—(continued)
| | | | | | | | |
Name, Year of Birth and
Position(s) Held with the Trust | | Trustee and/
or Officer Since | | Principal Occupation(s)
During Past 5 Years | | Number of
Funds in Fund
Complex
Overseen by
Trustee | | Other Directorship(s)
Held by Trustee During
Past 5 Years |
| Independent Trustees | | | | | | | | |
Bruce L. Crockett — 1944 Trustee and Chair | | 2003 | | Chairman, Crockett Technologies Associates (technology consulting company) Formerly: Director, Captaris (unified messaging provider); Director, President and Chief Executive Officer, COMSAT Corporation; Chairman, Board of Governors of INTELSAT (international communications company); ACE Limited (insurance company); Independent Directors Council and Investment Company Institute: Member of the Audit Committee, Investment Company Institute; Member of the Executive Committee and Chair of the Governance Committee, Independent Directors Council | | 144 | | Director and Chairman of the Audit Committee, ALPS (Attorneys Liability Protection Society) (insurance company); Director and Member of the Audit Committee, Ferroglobe PLC (metallurgical company) |
David C. Arch — 1945 Trustee | | 2010 | | Chairman of Blistex Inc. (consumer health care products manufacturer); Member, World Presidents’ Organization | | 144 | | Board member of the Illinois Manufacturers’ Association |
James T. Bunch — 1942 Trustee | | 2000 | | Managing Member, Grumman Hill Group LLC (family office/private equity investments) Formerly: Chairman of the Board, Denver Film Society; Chairman of the Board of Trustees, Evans Scholarship Foundation; Chairman, Board of Governors, Western Golf Association | | 144 | | Trustee, Evans Scholarship Foundation |
Jack M. Fields — 1952 Trustee | | 2003 | | Chief Executive Officer, Twenty First Century Group, Inc. (government affairs company); and Discovery Learning Alliance (non-profit) Formerly: Owner and Chief Executive Officer, Dos Angeles Ranch L.P. (cattle, hunting, corporate entertainment); Director, Insperity, Inc. (formerly known as Administaff); Chief Executive Officer, Texana Timber LP (sustainable forestry company); Director of Cross Timbers Quail Research Ranch (non-profit); and member of the U.S. House of Representatives | | 144 | | None |
Cynthia Hostetler — 1962 Trustee | | 2017 | | Non-Executive Director and Trustee of a number of public and private business corporations Formerly: Head of Investment Funds and Private Equity, Overseas Private Investment Corporation; President, First Manhattan Bancorporation, Inc.; Attorney, Simpson Thacher & Bartlett LLP | | 144 | | Vulcan Materials Company (construction materials company); Trilinc Global Impact Fund; Aberdeen Investment Funds (4 portfolios); Artio Global Investment LLC (mutual fund complex); Edgen Group, Inc. (specialized energy and infrastructure products distributor) |
Eli Jones — 1961 Trustee | | 2016 | | Professor and Dean, Mays Business School—Texas A&M University Formerly: Professor and Dean, Walton College of Business, University of Arkansas and E.J. Ourso College of Business, Louisiana State University; Director, Arvest Bank | | 144 | | Insperity, Inc. (formerly known as Administaff) (human resources provider) |
Prema Mathai-Davis — 1950 Trustee | | 2003 | | Retired. Formerly: Chief Executive Officer, YWCA of the U.S.A. | | 144 | | None |
Teresa M. Ressel — 1962 Trustee | | 2017 | | Non-Executive Director and Trustee of a number of public and private business corporations Formerly: Chief Financial Officer, Olayan America, The Olayan Group (international investor/commercial/industrial); Chief Executive Officer, UBS Securities LLC; Group Chief Operating Officer, Americas, UBS AG; Assistant Secretary for Management & Budget and CFO, US Department of the Treasury; Chief Compliance Officer, Kaiser Permanente; Program Manager, Hewlett-Packard; Nuclear Engineering, General Dynamics Corporation | | 144 | | Atlantic Power Corporation (power generation company); ON Semiconductor Corp. (semiconductor supplier) |
Larry Soll — 1942 Trustee | | 1997 | | Retired. Formerly: Chairman, Chief Executive Officer and President, Synergen Corp. (a biotechnology company) | | 144 | | None |
Ann Barnett Stern — 1957 Trustee | | 2017 | | President and Chief Executive Officer, Houston Endowment Inc. (private philanthropic institution) Formerly: Executive Vice President and General Counsel, Texas Children’s Hospital; Attorney, Beck, Redden and Secrest, LLP; Business Law Instructor, University of St. Thomas; Attorney, Andrews & Kurth LLP | | 144 | | Federal Reserve Bank of Dallas |
Raymond Stickel, Jr. — 1944 Trustee | | 2005 | | Retired. Formerly: Director, Mainstay VP Series Funds, Inc. (25 portfolios); Partner, Deloitte & Touche | | 144 | | None |
Robert C. Troccoli — 1949 Trustee | | 2016 | | Adjunct Professor, University of Denver – Daniels College of Business Formerly: Senior Partner, KPMG LLP | | 144 | | None |
Christopher L. Wilson — 1957 Trustee | | 2017 | | Managing Partner, CT2, LLC (investing and consulting firm) Formerly: President/Chief Executive Officer, Columbia Funds, Bank of America Corporation; President/Chief Executive Officer, CDC IXIS Asset Management Services, Inc.; Principal & Director of Operations, Scudder Funds, Scudder, Stevens & Clark, Inc.; Assistant Vice President, Fidelity Investments | | 144 | | TD Asset Management USA Inc. (mutual fund complex) (22 portfolios); ISO New England, Inc. (non-profit organization managing regional electricity market) |
T-2 Invesco Comstock Fund
Trustees and Officers—(continued)
| | | | | | | | |
Name, Year of Birth and
Position(s) Held with the Trust | | Trustee and/
or Officer Since | | Principal Occupation(s)
During Past 5 Years | | Number of
Funds in Fund
Complex
Overseen by
Trustee | | Other Directorship(s)
Held by Trustee During
Past 5 Years |
| Other Officers | | | | | | | | |
Sheri Morris — 1964 President, Principal Executive Officer and Treasurer | | 2003 | | President, Principal Executive Officer and Treasurer, The Invesco Funds; Vice President, Invesco Advisers, Inc. (formerly known as Invesco Institutional (N.A.), Inc.) (registered investment adviser); and Vice President, PowerShares Exchange-Traded Fund Trust, PowerShares Exchange-Traded Fund Trust II, PowerShares India Exchange-Traded Fund Trust, PowerShares Actively Managed Exchange-Traded Fund Trust and PowerShares Actively Managed Exchange-Traded Commodity Fund Trust Formerly: Vice President and Principal Financial Officer, The Invesco Funds; Vice President, Invesco Aim Advisers, Inc., Invesco Aim Capital Management, Inc. and Invesco Aim Private Asset Management, Inc.; Assistant Vice President and Assistant Treasurer, The Invesco Funds and Assistant Vice President, Invesco Advisers, Inc., Invesco Aim Capital Management, Inc. and Invesco Aim Private Asset Management, Inc.; and Treasurer, PowerShares Exchange-Traded Fund Trust, PowerShares Exchange-Traded Fund Trust II, PowerShares India Exchange-Traded Fund Trust and PowerShares Actively Managed Exchange-Traded Fund Trust | | N/A | | N/A |
Russell C. Burk — 1958 Senior Vice President and Senior Officer | | 2005 | | Senior Vice President and Senior Officer, The Invesco Funds | | N/A | | N/A |
John M. Zerr — 1962 Senior Vice President, Chief Legal Officer and Secretary | | 2006 | | Director, Senior Vice President, Secretary and General Counsel, Invesco Management Group, Inc. (formerly known as Invesco AIM Management Group, Inc.); Senior Vice President, Invesco Advisers, Inc. (formerly known as Invesco Institutional (N.A.), Inc.) (registered investment adviser); Senior Vice President and Secretary, Invesco Distributors, Inc. (formerly known as Invesco AIM Distributors, Inc.); Director, Vice President and Secretary, Invesco Investment Services, Inc. (formerly known as Invesco AIM Investment Services, Inc.) Senior Vice President, Chief Legal Officer and Secretary, The Invesco Funds; Managing Director, Invesco PowerShares Capital Management LLC; Director, Secretary and General Counsel, Invesco Investment Advisers LLC (formerly known as Van Kampen Asset Management); Secretary and General Counsel, Invesco Capital Markets, Inc. (formerly known as Van Kampen Funds Inc.) and Chief Legal Officer, PowerShares Exchange-Traded Fund Trust, PowerShares Exchange-Traded Fund Trust II, PowerShares India Exchange-Traded Fund Trust, PowerShares Actively Managed Exchange-Traded Fund Trust and PowerShares Actively Managed Exchange-Traded Commodity Fund Trust; Manager and Secretary, Invesco Indexing LLC Formerly: Director, Secretary, General Counsel and Senior Vice President, Van Kampen Exchange Corp.; Director, Vice President and Secretary, IVZ Distributors, Inc. (formerly known as INVESCO Distributors, Inc.); Director and Vice President, INVESCO Funds Group, Inc.; Director and Vice President, Van Kampen Advisors Inc.; Director, Vice President, Secretary and General Counsel, Van Kampen Investor Services Inc.; Director, Invesco Distributors, Inc. (formerly known as Invesco AIM Distributors, Inc.); Director, Senior Vice President, General Counsel and Secretary, Invesco AIM Advisers, Inc. and Van Kampen Investments Inc.; Director, Vice President and Secretary, Fund Management Company; Director, Senior Vice President, Secretary, General Counsel and Vice President, Invesco AIM Capital Management, Inc.; Chief Operating Officer and General Counsel, Liberty Ridge Capital, Inc. (an investment adviser); Vice President and Secretary, PBHG Funds (an investment company) and PBHG Insurance Series Fund (an investment company); Chief Operating Officer, General Counsel and Secretary, Old Mutual Investment Partners (a broker-dealer); General Counsel and Secretary, Old Mutual Fund Services (an administrator) and Old Mutual Shareholder Services (a shareholder servicing center); Executive Vice President, General Counsel and Secretary, Old Mutual Capital, Inc. (an investment adviser); and Vice President and Secretary, Old Mutual Advisors Funds (an investment company) | | N/A | | N/A |
Gregory G. McGreevey — 1962 Senior Vice President | | 2012 | | Senior Managing Director, Invesco Ltd.; Director, Chairman, President, and Chief Executive Officer, Invesco Advisers, Inc. (formerly known as Invesco Institutional (N.A.), Inc.) (registered investment adviser); Director, Invesco Mortgage Capital, Inc. and Invesco Senior Secured Management, Inc.; and Senior Vice President, The Invesco Funds Formerly: Assistant Vice President, The Invesco Funds | | N/A | | N/A |
Kelli Gallegos — 1970 Vice President, Principal Financial Officer and Assistant Treasurer | | 2008 | | Vice President, Principal Financial Officer and Assistant Treasurer, The Invesco Funds; Assistant Treasurer, Invesco PowerShares Capital Management LLC, PowerShares Exchange-Traded Fund Trust, PowerShares Exchange-Traded Fund Trust II, PowerShares India Exchange-Traded Fund Trust, PowerShares Actively Managed Exchange-Traded Fund Trust and PowerShares Actively Managed Exchange-Traded Commodity Fund Trust Formerly: Assistant Vice President, The Invesco Funds | | N/A | | N/A |
T-3 Invesco Comstock Fund
Trustees and Officers—(continued)
| | | | | | | | |
Name, Year of Birth and
Position(s) Held with the Trust | | Trustee and/
or Officer Since | | Principal Occupation(s)
During Past 5 Years | | Number of
Funds in Fund
Complex
Overseen by
Trustee | | Other Directorship(s)
Held by Trustee During
Past 5 Years |
| Other Officers—(continued) | | | | | | | | |
Tracy Sullivan — 1962 Vice President, Chief Tax Officer and Assistant Treasurer | | 2008 | | Vice President, Chief Tax Officer and Assistant Treasurer, The Invesco Funds; Assistant Treasurer, Invesco PowerShares Capital Management LLC, PowerShares Exchange-Traded Fund Trust, PowerShares Exchange-Traded Fund Trust II, PowerShares India Exchange-Traded Fund Trust, PowerShares Actively Managed Exchange-Traded Fund Trust and PowerShares Actively Managed Exchange-Traded Commodity Fund Trust Formerly: Assistant Vice President, The Invesco Funds | | N/A | | N/A |
Crissie M. Wisdom — 1969 Anti-Money Laundering Compliance Officer | | 2013 | | Anti-Money Laundering Compliance Officer, Invesco Advisers, Inc. (formerly known as Invesco Institutional (N.A.), Inc.) (registered investment adviser), Invesco Capital Markets, Inc. (formerly known as Van Kampen Funds Inc.), Invesco Distributors, Inc., Invesco Investment Services, Inc., Invesco Management Group, Inc., The Invesco Funds, and PowerShares Exchange-Traded Fund Trust, PowerShares Exchange-Traded Fund Trust II, PowerShares India Exchange-Traded Fund Trust, PowerShares Actively Managed Exchange-Traded Fund Trust and PowerShares Actively Managed Exchange-Traded Commodity Fund Trust; Anti-Money Laundering Compliance Officer and Bank Secrecy Act Officer, INVESCO National Trust Company and Invesco Trust Company; and Fraud Prevention Manager and Controls and Risk Analysis Manager for Invesco Investment Services, Inc. Formerly: Anti-Money Laundering Compliance Officer, Van Kampen Exchange Corp. | | N/A | | N/A |
Robert R. Leveille — 1969 Chief Compliance Officer | | 2016 | | Chief Compliance Officer, Invesco Advisers, Inc. (registered investment adviser); and Chief Compliance Officer, The Invesco Funds Formerly: Chief Compliance Officer, Putnam Investments and the Putnam Funds | | N/A | | N/A |
The Statement of Additional Information of the Trust includes additional information about the Fund’s Trustees and is available upon request, without charge, by calling 1.800.959.4246. Please refer to the Fund’s Statement of Additional Information for information on the Fund’s sub-advisers.
| | | | | | | | | | |
Office of the Fund 11 Greenway Plaza, Suite 1000 Houston, TX 77046-1173 | | Investment Adviser Invesco Advisers, Inc. 1555 Peachtree Street, N.E. Atlanta, GA 30309 | |
| Distributor
Invesco Distributors, Inc. 11 Greenway Plaza, Suite 1000 Houston, TX 77046-1173 |
| |
| Auditors
PricewaterhouseCoopers LLP 1000 Louisiana Street, Suite 5800 Houston, TX 77002-5678 |
|
| | | |
| | | | | | | | | | |
Counsel to the Fund Stradley Ronon Stevens & Young, LLP 2005 Market Street, Suite 2600 Philadelphia, PA 19103-7018 | | Counsel to the Independent Trustees Goodwin Procter LLP 901 New York Avenue, N.W. Washington, D.C. 20001 | |
| Transfer Agent
Invesco Investment Services, Inc. 11 Greenway Plaza, Suite 1000 Houston, TX 77046-1173 |
| |
| Custodian
State Street Bank and Trust Company 225 Franklin Street Boston, MA 02110-2801 |
|
T-4 Invesco Comstock Fund
Explore High-Conviction Investing with Invesco

Go paperless with eDelivery
Visit invesco.com/edelivery to enjoy the convenience and security of anytime electronic access to your investment documents.
With eDelivery, you can elect to have any or all of the following materials delivered straight to your inbox to download, save and print from your own computer:
∎ Fund reports and prospectuses
∎ Quarterly statements
∎ Daily confirmations
∎ Tax forms
Invesco mailing information
Send general correspondence to Invesco Investment Services, Inc., P.O. Box 219078, Kansas City, MO 64121-9078.
Important notice regarding delivery of security holder documents
To reduce Fund expenses, only one copy of most shareholder documents may be mailed to shareholders with multiple accounts at the same address (Householding). Mailing of your shareholder documents may be householded indefinitely unless you instruct us otherwise. If you do not want the mailing of these documents to be combined with those for other members of your household, please contact Invesco Investment Services, Inc. at 800 959 4246 or contact your financial institution. We will begin sending you individual copies for each account within 30 days after receiving your request.
Fund holdings and proxy voting information
The Fund provides a complete list of its holdings four times in each fiscal year, at the quarter ends. For the second and fourth quarters, the lists appear in the Fund’s semiannual and annual reports to shareholders. For the first and third quarters, the Fund files the lists with the Securities and Exchange Commission (SEC) on Form N-Q. The most recent list of portfolio holdings is available at invesco.com/completeqtrholdings. Shareholders can also look up the Fund’s Forms N-Q on the SEC website at sec.gov. Copies of the Fund’s Forms N-Q may be reviewed and copied at the SEC Public Reference Room in Washington, D.C. You can obtain information on the operation of the Public Reference Room, including information about duplicating fee charges, by calling 202 551 8090 or 800 732 0330, or by electronic request at the following email address: publicinfo@sec.gov.
The SEC file numbers for the Fund are shown below.
A description of the policies and procedures that the Fund uses to determine how to vote proxies relating to portfolio securities is available without charge, upon request, from our Client Services department at 800 959 4246 or at invesco.com/proxyguidelines. The information is also available on the SEC website, sec.gov.
| | |
Information regarding how the Fund voted proxies related to its portfolio securities during the most recent 12-month period ended June 30 is available at invesco.com/proxysearch. The information is also available on the SEC website, sec.gov. Invesco Advisers, Inc. is an investment adviser; it provides investment advisory services to individual and institutional clients and does not sell securities. Invesco Distributors, Inc. is the US distributor for Invesco Ltd.’s retail mutual funds, exchange-traded funds and institutional money market funds. Both are wholly owned, indirect subsidiaries of Invesco Ltd. | |  |
SEC file numbers: 811-03826 and 002-85905 Invesco Distributors, Inc. VK-COM-AR-1 06092017 1038
| | | | |
| | |
 | | Annual Report to Shareholders | | April 30, 2017 |
| | |
| | Invesco Dividend Income Fund |
| | Nasdaq: |
| | A: IAUTX ∎ B: IBUTX ∎ C: IUTCX ∎ Y: IAUYX ∎ Investor: FSTUX ∎ R5: FSIUX ∎ R6: IFUTX |

Letters to Shareholders
| | | | |

Philip Taylor | | | | Dear Shareholders: This annual report includes information about your Fund, including performance data and a complete list of its investments as of the close of the reporting period. Inside is a discussion of how your Fund was managed and the factors that affected its performance during the reporting period. The reporting period began with stock market volatility in the US and abroad, largely the result of uncertainty about global economic growth and monetary policy. Markets declined sharply following UK voters’ decision in June to leave the European Union. Relatively quickly, however, markets recovered, reaching record highs later in the summer. Demand was strong for income-producing investments, particularly those perceived to be lower risk; this benefited bonds as well as dividend-paying stocks for much of the reporting period. While economic news in the US was generally positive during the reporting period, news overseas was less upbeat. The European |
Central Bank and central banks in China and Japan – as well as other countries – maintained extraordinarily accommodative monetary policies in response to economic weakness. After months of uncertainty, the outcome of the US presidential election in November triggered a major stock market rally, with most market indexes repeatedly reaching new highs through February. As expected, the US Federal Reserve (the Fed) raised interest rates in December 2016 and again in March 2017. In its March statement, the Fed noted that the labor market has strengthened and economic activity has expanded at a moderate pace – and that it expects those trends to continue.
Short-term market volatility can prompt some investors to abandon their investment plans – and can cause others to settle for whatever returns the market has to offer. The investment professionals at Invesco, in contrast, invest with high conviction. This means that, no matter the asset class or the strategy, each investment team has a passion to exceed. We want to help investors achieve better outcomes, such as seeking higher returns, helping mitigate risk and generating income. Of course, investing with high conviction can’t guarantee a profit or ensure success; no investment strategy can. To learn more about how we invest with high conviction, visit invesco.com/HighConviction.
You, too, can invest with high conviction by maintaining a long-term investment perspective and by working with your financial adviser on a regular basis. During periods of short-term market volatility or uncertainty, your financial adviser can keep you focused on your long-term investment goals – a new home, a child’s college education or a secure retirement. He or she also can share research about the economy, the markets and individual investment options.
Visit our website for more information on your investments
Our website, invesco.com/us, offers a wide range of market insights and investment perspectives. On the website, you’ll find detailed information about our funds, including performance, holdings and portfolio manager commentaries. You can access information about your account by completing a simple, secure online registration. To do so, select “Log In” on the right side of the homepage, and then select “Register for Individual Account Access.”
In addition to the resources accessible on our website and through our mobile app, you can obtain timely updates to help you stay informed about the markets, the economy and investing by connecting with Invesco on Twitter, LinkedIn or Facebook. You can access our blog at blog.invesco.us.com. Our goal is to provide you the information you want, when and where you want it.
Finally, I’m pleased to share with you Invesco’s commitment to both the Principles for Responsible Investment and to considering environmental, social and governance issues in our robust investment process. I invite you to learn more at invesco.com/esg.
Have questions?
For questions about your account, contact an Invesco client services representative at 800 959 4246. For Invesco-related questions or comments, please email me directly at phil@invesco.com.
All of us at Invesco look forward to serving your investment management needs. Thank you for investing with us.
Sincerely,

Philip Taylor
Senior Managing Director, Invesco Ltd.
2 Invesco Dividend Income Fund
| | | | |

Bruce Crockett | | | | Dear Fellow Shareholders: Among the many important lessons I’ve learned in more than 40 years in a variety of business endeavors is the value of a trusted advocate. As independent chair of the Invesco Funds Board, I can assure you that the members of the Board are strong advocates for the interests of investors in Invesco’s mutual funds. We work hard to represent your interests through oversight of the quality of the investment management services your funds receive and other matters important to your investment, including but not limited to: ∎ Ensuring that Invesco offers a diverse lineup of mutual funds that your financial adviser can use to strive to meet your financial needs as your investment goals change over time. ∎ Monitoring how the portfolio management teams of the Invesco funds are performing in light of changing economic and market conditions. |
| ∎ | | Assessing each portfolio management team’s investment performance within the context of the investment strategy described in the fund’s prospectus. |
| ∎ | | Monitoring for potential conflicts of interests that may impact the nature of the services that your funds receive. |
We believe one of the most important services we provide our fund shareholders is the annual review of the funds’ advisory and sub-advisory contracts with Invesco Advisers and its affiliates. This review is required by the Investment Company Act of 1940 and focuses on the nature and quality of the services Invesco provides as the adviser to the Invesco funds and the reasonableness of the fees that it charges for those services. Each year, we spend months carefully reviewing information received from Invesco and a variety of independent sources, such as performance and fee data prepared by Lipper, Inc. (a subsidiary of Broadridge Financial Solutions, Inc.), an independent, third-party firm widely recognized as a leader in its field. We also meet with our independent legal counsel and other independent advisers to review and help us assess the information that we have received. Our goal is to assure that you receive quality investment management services for a reasonable fee.
I trust the measures outlined above provide assurance that you have a worthy advocate when it comes to choosing the Invesco Funds.
As always, please contact me at bruce@brucecrockett.com with any questions or concerns you may have. On behalf of the Board, we look forward to continuing to represent your interests and serving your needs.
Sincerely,

Bruce L. Crockett
Independent Chair
Invesco Funds Board of Trustees
3 Invesco Dividend Income Fund
Management’s Discussion of Fund Performance
| | | | |
Performance summary | |
For the fiscal year ended April 30, 2017, Class A shares of Invesco Dividend Income Fund (the Fund), at net asset value (NAV), underperformed the Dow Jones U.S. Select Dividend Index. Your Fund’s long-term performance appears later in this report. | |
Fund vs. Indexes | |
Total returns, 4/30/16 to 4/30/17, at net asset value (NAV). Performance shown does not include applicable contingent deferred sales charges (CDSC) or front-end sales charges, which would have reduced performance. | |
Class A Shares | | | 10.00 | % |
Class B Shares | | | 9.15 | |
Class C Shares | | | 9.16 | |
Class Y Shares | | | 10.28 | |
Investor Class Shares | | | 10.01 | |
| Class R5 Shares | | | 10.32 | |
| Class R6 Shares | | | 10.47 | |
S&P 500 Index▼ (Broad Market Index) | | | 17.92 | |
Dow Jones U.S. Select Dividend Index▼ (Style-Specific Index) | | | 15.60 | |
Russell 1000 Value Index▼ (Style-Specific Index) | | | 16.55 | |
| Lipper Equity Income Funds Index∎ (Peer Group Index) | | | 15.18 | |
| |
Source(s): ▼FactSet Research Systems Inc.; ∎Lipper Inc. | | | | |
Market conditions and your Fund
During the fiscal year ended April 30, 2017, the US economy continued to strengthen as the unemployment rate declined, wages increased and inflation rose modestly. Signs of an improving economy prompted the US Federal Reserve to raise interest rates in December 2016 and again in March 2017. Major US stock market indexes posted gains for the reporting period, with most hitting record highs following the US presidential election. Investors saw the potential for changes in policy around taxation, regulations and infrastructure spending to stimulate economic growth. This optimism was more muted at the close of the fiscal year given the difficulties in enacting these significant changes.
The Fund continued to prioritize current income and long-term growth of capital by investing in above-market-yielding stocks that may
help investors earn income, preserve assets and build capital. We believe that dividend-paying stocks may provide a conservative foundation for investors’ portfolios, and we seek to enhance the value of dividend investing by identifying above-market-yielding stocks with consistent and defensible dividends. Through fundamental research, we measure the strength and sustainability of a company’s dividend by analyzing its free cash flow potential over the next two to three years. We construct a portfolio that we believe provides above-average dividend income and the potential to build capital over the long term. We seek to manage portfolio risk utilizing careful stock selection, maintaining exposure to multiple sectors and employing a rigorous buy-and-sell discipline.
During the reporting period, 10 of 11 sectors were positive contributors to Fund results. The utilities and
financials sectors contributed the most to overall Fund performance. Regulated gas utility company WGL Holdings was among the largest contributors to Fund results during the fiscal year. The company’s performance was driven by several competing offers that led to its proposed acquisition by Alta Gas (not a Fund holding). Regional bank M&T Bank was also a top contributor to overall Fund performance. The company reported modest loan growth during the reporting period. In addition, expectations for further net interest margin expansion as a result of increases to the federal funds rate were reflected in the company’s positive price response.
Within the industrials sector, Kennametal was one of the largest contributors to Fund performance. The company reported higher-than-expected earnings with strong operating leverage and an improvement in industrial organic order growth. Management also increased expected expense savings and increased forward full-year earnings guidance.
Telecommunication services company BT Group was the largest detractor from Fund performance during the fiscal year. The company was negatively impacted by uncertainty surrounding the UK’s vote to leave the European Union, weakness in its UK public sector business and an accounting restatement in its Italian operations. Consumer discretionary holdings Target and Marks and Spencer were also detractors from overall Fund performance. Both companies were impacted by a highly competitive environment, particularly as consumers shift more toward spending online. Target also pre-announced disappointing fourth quarter earnings and unveiled a $1 billion investment plan that increases spending on its supply chain, remodels, small-format
| | | | | |
Portfolio Composition | |
By sector | | | | % of total net assets | |
| | | | | |
| |
Utilities | | | | 21.1 | % |
Consumer Staples | | | | 16.6 | |
Financials | | | | 7.9 | |
Telecommunication Services | | | | 7.7 | |
Health Care | | | | 7.1 | |
Energy | | | | 6.8 | |
Industrials | | | | 5.9 | |
Consumer Discretionary | | | | 5.7 | |
Information Technology | | | | 2.4 | |
Materials | | | | 2.3 | |
Real Estate | | | | 1.9 | |
Money Market Funds Plus Other Assets Less Liabilities | | | | 14.6 | |
| | | | | |
| Top 10 Equity Holdings* |
| | | | % of total net assets | |
| | | | |
| | |
1. | | WGL Holdings Inc. | | 3.2% |
2. | | M&T Bank Corp. | | 3.2 |
3. | | Procter & Gamble Co. (The) | | 2.9 |
4. | | Coca-Cola Co. (The) | | 2.8 |
5. | | Public Service Enterprise Group Inc. | | 2.8 |
6. | | Dominion Resources, Inc. | | 2.7 |
7. | | Suncor Energy, Inc. | | 2.7 |
8. | | AT&T Inc. | | 2.5 |
9. | | McDonald’s Corp. | | 2.5 |
10. | | Merck & Co., Inc. | | 2.2 |
| | | | | |
Total Net Assets | | $2.5 billion |
| | | | | |
| |
Total Number of Holdings* | | | | 60 | |
The Fund’s holdings are subject to change, and there is no assurance that the Fund will continue to hold any particular security.
*Excluding money market fund holdings.
Data presented here are as of April 30, 2017.
4 Invesco Dividend Income Fund
stores and price investments. We sold our position in Marks and Spencer before the close of the reporting period.
Within the Dow Jones U.S. Select Dividend Index, the information technology, materials and financials sectors were the best-performing sectors while the energy, telecommunication services and real estate sectors lagged. The Fund’s overweight position in the telecommunication services sector detracted from performance versus the Dow Jones U.S. Select Dividend Index. The Fund’s higher cash position also detracted from relative performance in a rising market environment. Strong stock selection in the industrials sector contributed to Fund performance relative to the Dow Jones U.S. Select Dividend Index during the fiscal year. The Fund’s underweight position in the energy sector also benefited the Fund’s relative results, as the energy sector was one of the worst-performing sectors during the reporting period.
This profit cycle has seen the largest profit margin expansion in over 50 years, despite a weaker-than-normal gross domestic product recovery from the recessionary lows.1 A key question for us is how much of this margin expansion is structural, due to factors like better supply chain management, and how much was derived from cyclical benefits, due to factors like lower funding costs given historically low interest rates. Our expectations for continued profit growth are more conservative given an unprecedented period of globally coordinated monetary easing, both of which have helped drive market valuations higher. This cycle is also one of the longest expansions on record with one of the longest bull markets, despite a historically low recovery in revenue versus previous cycle troughs.2 Given these considerations, we continue to rigorously analyze each investment’s risk-reward profile.
At the close of the reporting period, the Fund remained focused on companies that we believed were reasonably valued, had sustainable cash flows and offered defensible dividends over the next two to three years. We believe the dividend income strategy is a valuable part of a portfolio, potentially helping investors earn income, preserve assets and build capital over the long-term.
It has been our privilege to manage Invesco Dividend Income Fund, and we thank you for your investment.
| 1 | Source: Sanford C. Bernstein & Co., LLC |
| 2 | Source: National Bureau of Economic Research, Ned Davis Research and FactSet Research Systems Inc. |
The views and opinions expressed in management’s discussion of Fund performance are those of Invesco Advisers, Inc. These views and opinions are subject to change at any time based on factors such as market and economic conditions. These views and opinions may not be relied upon as investment advice or recommendations, or as an offer for a particular security. The information is not a complete analysis of every aspect of any market, country, industry, security or the Fund. Statements of fact are from sources considered reliable, but Invesco Advisers, Inc. makes no representation or warranty as to their completeness or accuracy. Although historical performance is no guarantee of future results, these insights may help you understand our investment management philosophy.
See important Fund and, if applicable, index disclosures later in this report.
| | |

| | Meggan Walsh Chartered Financial Analyst, Portfolio Manager and Head of Invesco’s Dividend Value Team, is lead |
| manager of Invesco Dividend Income Fund. She joined Invesco in 1991. Ms. Walsh earned a BS in finance from the University of Maryland and an MBA from Loyola University Maryland. |
| | |

| | Robert Botard Chartered Financial Analyst, Portfolio Manager, is manager of Invesco Dividend Income Fund. He joined |
| Invesco in 1993. Mr. Botard earned a BBA in finance and a BBA in international business from The University of Texas at Austin. He also earned a Master of International Management degree from the Thunderbird School of Global Management. |
5 Invesco Dividend Income Fund
Your Fund’s Long-Term Performance
Results of a $10,000 Investment – Oldest Share Class(es)
Fund and index data from 4/30/07
| 1 | Source: FactSet Research Systems Inc. |
| 2 | It is Invesco’s policy to chart the Fund’s oldest share class(es). Because Investor Class shares do not have a sales charge, we also show the oldest share class with a sales charge, Class C shares. |
Past performance cannot guarantee comparable future results.
The data shown in the chart include reinvested distributions, applicable sales charges and Fund expenses including
management fees. Index results include reinvested dividends, but they do not reflect sales charges. Performance of the peer group, if applicable, reflects fund expenses and management fees;
performance of a market index does not. Performance shown in the chart and table(s) does not reflect deduction of taxes a shareholder would pay on Fund distributions or sale of Fund shares.
6 Invesco Dividend Income Fund
| | | | |
Average Annual Total Returns As of 4/30/17, including maximum applicable sales charges | |
Class A Shares | | | | |
Inception (3/28/02) | | | 8.49 | % |
10 Years | | | 5.40 | |
5 Years | | | 10.95 | |
1 Year | | | 3.94 | |
| |
Class B Shares | | | | |
Inception (3/28/02) | | | 8.47 | % |
10 Years | | | 5.36 | |
5 Years | | | 11.11 | |
1 Year | | | 4.15 | |
| |
Class C Shares | | | | |
Inception (2/14/00) | | | 3.60 | % |
10 Years | | | 5.21 | |
5 Years | | | 11.38 | |
1 Year | | | 8.16 | |
| |
Class Y Shares | | | | |
10 Years | | | 6.22 | % |
5 Years | | | 12.51 | |
1 Year | | | 10.28 | |
| |
Investor Class Shares | | | | |
Inception (6/2/86) | | | 8.72 | % |
10 Years | | | 5.99 | |
5 Years | | | 12.21 | |
1 Year | | | 10.01 | |
| |
Class R5 Shares | | | | |
Inception (10/25/05) | | | 9.05 | % |
10 Years | | | 6.42 | |
5 Years | | | 12.56 | |
1 Year | | | 10.32 | |
| |
Class R6 Shares | | | | |
10 Years | | | 6.16 | % |
5 Years | | | 12.58 | |
1 Year | | | 10.47 | |
Class Y shares incepted on October 3, 2008. Performance shown prior to that date is that of Investor Class shares and includes the 12b-1 fees applicable to Investor Class shares.
Class R6 shares incepted on September 24, 2012. Performance shown prior to that date is that of Class A shares and includes the 12b-1 fees applicable to Class A shares.
The performance data quoted represent past performance and cannot guarantee comparable future results; current performance may be lower or higher. Please visit invesco.com/performance for the most recent month-end performance. Performance figures reflect reinvested distributions, changes in net asset value and the effect of the maximum sales charge unless otherwise stated. Investment return and
| | | | |
Average Annual Total Returns As of 3/31/17, the most recent calendar quarter end, including maximum applicable sales charges | |
Class A Shares | | | | |
Inception (3/28/02) | | | 8.51 | % |
10 Years | | | 5.82 | |
5 Years | | | 11.37 | |
1 Year | | | 4.58 | |
| |
Class B Shares | | | | |
Inception (3/28/02) | | | 8.49 | % |
10 Years | | | 5.78 | |
5 Years | | | 11.53 | |
1 Year | | | 4.87 | |
| |
Class C Shares | | | | |
Inception (2/14/00) | | | 3.60 | % |
10 Years | | | 5.63 | |
5 Years | | | 11.78 | |
1 Year | | | 8.83 | |
| |
Class Y Shares | | | | |
10 Years | | | 6.65 | % |
5 Years | | | 12.92 | |
1 Year | | | 10.91 | |
| |
Investor Class Shares | | | | |
Inception (6/2/86) | | | 8.73 | % |
10 Years | | | 6.42 | |
5 Years | | | 12.63 | |
1 Year | | | 10.69 | |
| |
Class R5 Shares | | | | |
Inception (10/25/05) | | | 9.08 | % |
10 Years | | | 6.84 | |
5 Years | | | 12.96 | |
1 Year | | | 11.01 | |
| |
Class R6 Shares | | | | |
10 Years | | | 6.58 | % |
5 Years | | | 12.98 | |
1 Year | | | 11.10 | |
principal value will fluctuate so that you may have a gain or loss when you sell shares.
The net annual Fund operating expense ratio set forth in the most recent Fund prospectus as of the date of this report for Class A, Class B, Class C, Class Y, Investor Class, Class R5 and Class R6 shares was 1.18%, 1.93%, 1.93%, 0.93%, 1.18%, 0.86% and 0.76%, respectively.1 The total annual Fund operating expense ratio set forth in the most recent Fund prospectus as of the date of this report for Class A, Class B, Class C, Class Y, Investor Class, Class R5 and Class R6 shares was 1.19%, 1.94%, 1.94%, 0.94%, 1.19%, 0.87% and 0.77%, respectively. The expense ratios presented above may vary from the expense ratios presented in other sections of this report
that are based on expenses incurred during the period covered by this report.
Class A share performance reflects the maximum 5.50% sales charge, and Class B and Class C share performance reflects the applicable contingent deferred sales charge (CDSC) for the period involved. The CDSC on Class B shares declines from 5% beginning at the time of purchase to 0% at the beginning of the seventh year. The CDSC on Class C shares is 1% for the first year after purchase. Class Y, Investor Class, Class R5 and Class R6 shares do not have a front-end sales charge or a CDSC; therefore, performance is at net asset value.
The performance of the Fund’s share classes will differ primarily due to different sales charge structures and class expenses.
Fund performance reflects any applicable fee waivers and/or expense reimbursements. Had the adviser not waived fees and/or reimbursed expenses currently or in the past, returns would have been lower. See current prospectus for more information.
| 1 | Total annual Fund operating expenses after any contractual fee waivers and/or expense reimbursements by the adviser in effect through at least June 30, 2019. See current prospectus for more information. |
7 Invesco Dividend Income Fund
Invesco Dividend Income Fund’s investment objective is current income and long-term growth of capital.
| ∎ | | Unless otherwise stated, information presented in this report is as of April 30, 2017, and is based on total net assets. |
| ∎ | | Unless otherwise noted, all data provided by Invesco. |
| ∎ | | To access your Fund’s reports/prospectus, visit invesco.com/fundreports. |
About share classes
| ∎ | | Class B shares may not be purchased for new or additional investments. Please see the prospectus for more information. |
| ∎ | | Class Y shares and Investor Class shares are available only to certain investors. Please see the prospectus for more information. |
| ∎ | | Class R5 shares and Class R6 shares are available for use by retirement plans that meet certain standards and for institutional investors. Class R6 shares are also available through intermediaries that have established an agreement with Invesco Distributors, Inc. to make such shares available for use in retail omnibus accounts. See the prospectus for more information. |
Principal risks of investing in the Fund
| ∎ | | Foreign securities risk. The Fund’s foreign investments may be adversely affected by political and social instability, changes in economic or taxation policies, difficulty in enforcing obligations, decreased liquidity or increased volatility. Foreign investments also involve the risk of the possible seizure, nationalization or expropriation of the issuer or foreign deposits (in which the Fund could lose its entire investments in a certain market) and the possible adoption of foreign governmental restrictions such as exchange controls. Unless the Fund has hedged its foreign securities risk, foreign securities risk also involves the risk of negative foreign currency rate fluctuations, which may cause the value of securities denominated in such foreign currency (or other instruments through which the Fund has exposure to foreign currencies) to decline in value. Currency exchange rates may fluctuate significantly over short periods of time. Currency hedging strategies, if used, are not always successful. |
| ∎ | | Management risk. The Fund is actively managed and depends heavily on the Adviser’s judgment about markets, interest rates or the attractiveness, relative values, liquidity, or potential appreciation of particular investments made for the Fund’s portfolio. The Fund could experience losses if these judgments prove to be incorrect. Additionally, legislative, regulatory, or tax developments may adversely affect management of the Fund and, therefore, the ability of the Fund to achieve its investment objective. |
| ∎ | | Market risk. The market values of the Fund’s investments, and therefore the value of the Fund’s shares, will go up and down, sometimes rapidly or unpredictably. Market risk may affect a single issuer, industry or section of the economy, or it may affect the market as a whole. Individual stock prices tend to go up and down more dramatically than those of certain other types of investments, such as bonds. During a general downturn in the financial markets, multiple asset classes may decline in value. When markets perform well, there can be no assurance that specific investments held by the Fund will rise in value. |
| ∎ | | Small- and mid-capitalization companies risks. Small- and mid-capitalization companies tend to be more vulnerable to changing market conditions, may have little or no operating history or track record of success, and may have more limited product lines and markets, less experienced management and fewer financial resources than larger companies. These companies’ securities may be more volatile and less liquid than those of more established companies, and their returns may vary, sometimes significantly, from the overall securities market. |
About indexes used in this report
| ∎ | | The S&P 500® Index is an unmanaged index considered representative of the US stock market. |
| ∎ | | The Dow Jones U.S. Select Dividend™ Index represent the country’s leading stocks by dividend yield. |
| ∎ | | The Russell 1000® Value Index is an unmanaged index considered representative of large-cap value stocks. The Russell 1000 Value Index is a trademark/service mark of the Frank Russell Co. Russell® is a trademark of the Frank Russell Co. |
| ∎ | | The Lipper Equity Income Funds Index is an unmanaged index considered representative of equity income funds tracked by Lipper. |
| ∎ | | The Fund is not managed to track the performance of any particular index, including the index(es) described here, and consequently, the performance of the Fund may deviate significantly from the performance of the index(es). |
| ∎ | | A direct investment cannot be made in an index. Unless otherwise indicated, index results include reinvested dividends, and they do not reflect sales charges. Performance of the peer group, if applicable, reflects fund expenses; performance of a market index does not. |
Other information
| ∎ | | The returns shown in management’s discussion of Fund performance are based on net asset values (NAVs) calculated for shareholder transactions. Generally accepted accounting principles require adjustments to be made to the net assets of the Fund at period end for financial reporting purposes, and as such, the NAVs for shareholder transactions and the returns based on those NAVs may differ from the NAVs and returns reported in the Financial Highlights. |
| ∎ | | Industry classifications used in this report are generally according to the Global Industry Classification Standard, which was developed by and is the exclusive property and a service mark of MSCI Inc. and Standard & Poor’s. |
|
This report must be accompanied or preceded by a currently effective Fund prospectus, which contains more complete information, including sales charges and expenses. Investors should read it carefully before investing. |
|
|
|
| NOT FDIC INSURED | MAY LOSE VALUE | NO BANK GUARANTEE |
8 Invesco Dividend Income Fund
Schedule of Investments(a)
April 30, 2017
| | | | | | | | |
| | | Shares | | | Value | |
Common Stocks & Other Equity Interests–85.37% | |
| Aerospace & Defense–1.43% | |
General Dynamics Corp. | | | 72,170 | | | $ | 13,985,824 | |
Lockheed Martin Corp. | | | 80,517 | | | | 21,695,306 | |
| | | | | | | | 35,681,130 | |
|
| Air Freight & Logistics–0.19% | |
United Parcel Service, Inc.–Class B | | | 44,278 | | | | 4,758,114 | |
|
| Asset Management & Custody Banks–1.74% | |
Federated Investors, Inc.–Class B | | | 503,644 | | | | 13,507,732 | |
Waddell & Reed Financial, Inc.–Class A | | | 1,674,877 | | | | 30,131,037 | |
| | | | | | | | 43,638,769 | |
|
| Drug Retail–0.68% | |
Walgreens Boots Alliance, Inc. | | | 195,878 | | | | 16,951,282 | |
| | |
| Electric Utilities–6.79% | | | | | | | | |
American Electric Power Co., Inc. | | | 271,936 | | | | 18,445,419 | |
Duke Energy Corp. | | | 421,071 | | | | 34,738,357 | |
Exelon Corp. | | | 1,424,909 | | | | 49,344,599 | |
Pinnacle West Capital Corp. | | | 269,418 | | | | 22,924,778 | |
Portland General Electric Co. | | | 632,963 | | | | 28,698,542 | |
Xcel Energy, Inc. | | | 348,717 | | | | 15,709,701 | |
| | | | | | | | 169,861,396 | |
|
| Electrical Components & Equipment–2.46% | |
ABB Ltd. (Switzerland) | | | 967,012 | | | | 23,654,232 | |
Emerson Electric Co. | | | 629,666 | | | | 37,956,266 | |
| | | | | | | | 61,610,498 | |
|
| Food Distributors–0.65% | |
Sysco Corp. | | | 309,768 | | | | 16,377,434 | |
| | |
| Gas Utilities–5.47% | | | | | | | | |
National Fuel Gas Co. | | | 623,838 | | | | 34,548,149 | |
Southwest Gas Holdings, Inc. | | | 262,591 | | | | 21,994,622 | |
WGL Holdings Inc. | | | 975,007 | | | | 80,399,077 | |
| | | | | | | | 136,941,848 | |
|
| General Merchandise Stores–1.53% | |
Target Corp. | | | 685,017 | | | | 38,258,199 | |
| | |
| Household Products–4.10% | | | | | | | | |
Kimberly-Clark Corp. | | | 241,427 | | | | 31,325,153 | |
Procter & Gamble Co. (The) | | | 814,982 | | | | 71,172,378 | |
| | | | | | | | 102,497,531 | |
|
| Industrial Machinery–1.84% | |
Kennametal Inc. | | | 1,106,671 | | | | 46,015,380 | |
| | |
| Integrated Oil & Gas–6.80% | | | | | | | | |
Exxon Mobil Corp. | | | 463,743 | | | | 37,864,616 | |
Royal Dutch Shell PLC -Class B (United Kingdom) | | | 650,810 | | | | 17,328,906 | |
Suncor Energy, Inc. (Canada) | | | 2,132,063 | | | | 66,812,918 | |
TOTAL S.A. (France) | | | 937,361 | | | | 48,046,612 | |
| | | | | | | | 170,053,052 | |
| | | | | | | | |
| | | Shares | | | Value | |
| Integrated Telecommunication Services–7.69% | |
AT&T Inc. | | | 1,561,106 | | | $ | 61,866,631 | |
BT Group PLC (United Kingdom) | | | 9,859,963 | | | | 38,918,477 | |
CenturyLink Inc. | | | 544,531 | | | | 13,978,111 | |
Deutsche Telekom AG (Germany) | | | 2,044,269 | | | | 35,851,838 | |
Verizon Communications Inc. | | | 910,650 | | | | 41,807,941 | |
| | | | | | | | 192,422,998 | |
|
| Motorcycle Manufacturers–1.12% | |
Harley-Davidson, Inc. | | | 491,347 | | | | 27,913,423 | |
| | |
| Multi-Utilities–8.86% | | | | | | | | |
CMS Energy Corp. | | | 366,826 | | | | 16,653,901 | |
Dominion Resources, Inc. | | | 881,566 | | | | 68,259,655 | |
DTE Energy Co. | | | 122,703 | | | | 12,833,507 | |
National Grid PLC (United Kingdom) | | | 1,786,108 | | | | 23,133,671 | |
Public Service Enterprise Group Inc. | | | 1,584,046 | | | | 69,777,226 | |
Sempra Energy | | | 274,901 | | | | 31,069,311 | |
| | | | | | | | 221,727,271 | |
|
| Packaged Foods & Meats–5.55% | |
Campbell Soup Co. | | | 395,948 | | | | 22,782,848 | |
General Mills, Inc. | | | 840,187 | | | | 48,319,154 | |
Kraft Heinz Co. (The) | | | 438,403 | | | | 39,627,247 | |
Nestle S.A. (Switzerland) | | | 365,705 | | | | 28,170,733 | |
| | | | | | | | 138,899,982 | |
|
| Paper Packaging–2.25% | |
International Paper Co. | | | 717,143 | | | | 38,704,208 | |
Sonoco Products Co. | | | 338,344 | | | | 17,698,774 | |
| | | | | | | | 56,402,982 | |
|
| Pharmaceuticals–7.09% | |
Bristol-Myers Squibb Co. | | | 884,260 | | | | 49,562,773 | |
Eli Lilly and Co. | | | 600,661 | | | | 49,290,242 | |
Johnson & Johnson | | | 200,151 | | | | 24,712,644 | |
Merck & Co., Inc. | | | 863,212 | | | | 53,804,004 | |
| | | | | | | | 177,369,663 | |
|
| Property & Casualty Insurance–1.01% | |
Travelers Cos., Inc. (The) | | | 208,031 | | | | 25,309,051 | |
| | |
| Regional Banks–5.15% | | | | | | | | |
Cullen/Frost Bankers, Inc. | | | 304,079 | | | | 28,702,017 | |
M&T Bank Corp. | | | 513,806 | | | | 79,850,590 | |
Prosperity Bancshares, Inc. | | | 302,335 | | | | 20,316,912 | |
| | | | | | | | 128,869,519 | |
|
| Restaurants–3.03% | |
Darden Restaurants, Inc. | | | 167,669 | | | | 14,283,722 | |
McDonald’s Corp. | | | 439,989 | | | | 61,567,661 | |
| | | | | | | | 75,851,383 | |
See accompanying Notes to Financial Statements which are an integral part of the financial statements.
9 Invesco Dividend Income Fund
| | | | | | | | |
| | | Shares | | | Value | |
| Semiconductors–2.35% | |
Analog Devices, Inc. | | | 121,879 | | | $ | 9,287,180 | |
Microchip Technology Inc. | | | 654,657 | | | | 49,478,976 | |
| | | | | | | | 58,766,156 | |
|
| Soft Drinks–2.80% | |
Coca-Cola Co. (The) | | | 1,624,404 | | | | 70,093,033 | |
|
| Specialized REIT’s–1.94% | |
Weyerhaeuser Co. | | | 1,434,742 | | | | 48,594,712 | |
|
| Tobacco–2.85% | |
Altria Group, Inc. | | | 396,480 | | | | 28,459,334 | |
Philip Morris International Inc. | | | 387,885 | | | | 42,993,175 | |
| | | | | | | | 71,452,509 | |
Total Common Stocks & Other Equity Interests
(Cost $1,798,485,371) | | | | 2,136,317,315 | |
| | | | | | | | |
| | | Shares | | | Value | |
Money Market Funds–14.87% | |
Government & Agency Portfolio–Institutional Class, 0.67%(b) | | | 223,315,397 | | | $ | 223,315,397 | |
Treasury Portfolio–Institutional Class, 0.63%(b) | | | 148,876,932 | | | | 148,876,932 | |
Total Money Market Funds
(Cost $372,192,329) | | | | 372,192,329 | |
TOTAL INVESTMENTS–100.24%
(Cost $2,170,677,700) | | | | | | | 2,508,509,644 | |
OTHER ASSETS LESS LIABILITIES–(0.24)% | | | | (6,093,280 | ) |
NET ASSETS–100.00% | | | | | | $ | 2,502,416,364 | |
Investment Abbreviations:
| | |
| REIT | | – Real Estate Investment Trust |
Notes to Schedule of Investments:
| (a) | Industry and/or sector classifications used in this report are generally according to the Global Industry Classification Standard, which was developed by and is the exclusive property and a service mark of MSCI Inc. and Standard & Poor’s. |
| (b) | The money market fund and the Fund are affiliated by having the same investment adviser. The rate shown is the 7-day SEC standardized yield as of April 30, 2017. |
See accompanying Notes to Financial Statements which are an integral part of the financial statements.
10 Invesco Dividend Income Fund
Statement of Assets and Liabilities
April 30, 2017
| | | | |
Assets: | |
Investments, at value (Cost $1,798,485,371) | | $ | 2,136,317,315 | |
Investments in affiliated money market funds, at value and cost | | | 372,192,329 | |
Total investments, at value (Cost $2,170,677,700) | | | 2,508,509,644 | |
Foreign currencies, at value (Cost $1,418,221) | | | 1,434,005 | |
Receivable for: | | | | |
Investments sold | | | 2,167,681 | |
Fund shares sold | | | 7,893,891 | |
Dividends | | | 4,786,745 | |
Investment for trustee deferred compensation and retirement plans | | | 130,147 | |
Unrealized appreciation on forward foreign currency contracts outstanding | | | 758,737 | |
Other assets | | | 88,217 | |
Total assets | | | 2,525,769,067 | |
|
Liabilities: | |
Payable for: | | | | |
Investments purchased | | | 9,312,049 | |
Fund shares reacquired | | | 11,912,365 | |
Accrued fees to affiliates | | | 1,231,002 | |
Accrued trustees’ and officers’ fees and benefits | | | 5,707 | |
Accrued other operating expenses | | | 376,902 | |
Trustee deferred compensation and retirement plans | | | 146,256 | |
Unrealized depreciation on forward foreign currency contracts outstanding | | | 368,422 | |
Total liabilities | | | 23,352,703 | |
Net assets applicable to shares outstanding | | $ | 2,502,416,364 | |
|
Net assets consist of: | |
Shares of beneficial interest | | $ | 2,138,977,820 | |
Undistributed net investment income | | | (23,371 | ) |
Undistributed net realized gain | | | 25,225,891 | |
Net unrealized appreciation | | | 338,236,024 | |
| | | $ | 2,502,416,364 | |
| | | | |
Net Assets: | |
Class A | | $ | 1,143,945,930 | |
Class B | | $ | 4,215,848 | |
Class C | | $ | 311,194,250 | |
Class Y | | $ | 860,104,888 | |
Investor Class | | $ | 97,227,512 | |
Class R5 | | $ | 2,375,770 | |
Class R6 | | $ | 83,352,166 | |
|
Shares outstanding, no par value,
with an unlimited number of shares authorized: | |
Class A | | | 47,744,890 | |
Class B | | | 175,441 | |
Class C | | | 12,828,679 | |
Class Y | | | 35,560,681 | |
Investor Class | | | 4,020,938 | |
Class R5 | | | 99,124 | |
Class R6 | | | 3,475,226 | |
Class A: | | | | |
Net asset value per share | | $ | 23.96 | |
Maximum offering price per share | | | | |
(Net asset value of $23.96 ¸ 94.50%) | | $ | 25.35 | |
Class B: | | | | |
Net asset value and offering price per share | | $ | 24.03 | |
Class C: | | | | |
Net asset value and offering price per share | | $ | 24.26 | |
Class Y: | | | | |
Net asset value and offering price per share | | $ | 24.19 | |
Investor Class: | | | | |
Net asset value and offering price per share | | $ | 24.18 | |
Class R5: | | | | |
Net asset value and offering price per share | | $ | 23.97 | |
Class R6: | | | | |
Net asset value and offering price per share | | $ | 23.98 | |
See accompanying Notes to Financial Statements which are an integral part of the financial statements.
11 Invesco Dividend Income Fund
Statement of Operations
For the year ended April 30, 2017
| | | | |
Investment income: | |
Dividends (net of foreign withholding taxes of $790,114) | | $ | 59,508,314 | |
Dividends from affiliated money market funds | | | 1,485,831 | |
Total investment income | | | 60,994,145 | |
| |
Expenses: | | | | |
Advisory fees | | | 12,944,329 | |
Administrative services fees | | | 465,836 | |
Custodian fees | | | 34,228 | |
Distribution fees: | | | | |
Class A | | | 2,960,619 | |
Class B | | | 57,778 | |
Class C | | | 2,620,028 | |
Investor Class | | | 241,478 | |
Transfer agent fees — A, B, C, Y and Investor | | | 3,183,018 | |
Transfer agent fees — R5 | | | 1,374 | |
Transfer agent fees — R6 | | | 3,143 | |
Trustees’ and officers’ fees and benefits | | | 46,991 | |
Registration and filing fees | | | 314,628 | |
Reports to shareholders | | | 437,937 | |
Professional services fees | | | 60,445 | |
Other | | | 34,505 | |
Total expenses | | | 23,406,337 | |
Less: Fees waived and expense offset arrangement(s) | | | (471,210 | ) |
Net expenses | | | 22,935,127 | |
Net investment income | | | 38,059,018 | |
| |
Realized and unrealized gain from: | | | | |
Net realized gain from: | | | | |
Investment securities | | | 33,644,024 | |
Foreign currencies | | | 39,901 | |
Forward foreign currency contracts | | | 2,335,440 | |
| | | | 36,019,365 | |
Change in net unrealized appreciation of: | | | | |
Investment securities | | | 131,473,976 | |
Foreign currencies | | | 25,172 | |
Forward foreign currency contracts | | | 1,665,236 | |
| | | | 133,164,384 | |
Net realized and unrealized gain | | | 169,183,749 | |
Net increase in net assets resulting from operations | | $ | 207,242,767 | |
See accompanying Notes to Financial Statements which are an integral part of the financial statements.
12 Invesco Dividend Income Fund
Statement of Changes in Net Assets
For the years ended April 30, 2017 and 2016
| | | | | | | | |
| | | 2017 | | | 2016 | |
Operations: | | | | | |
Net investment income | | $ | 38,059,018 | | | $ | 15,181,047 | |
Net realized gain | | | 36,019,365 | | | | 18,543,217 | |
Change in net unrealized appreciation | | | 133,164,384 | | | | 66,618,887 | |
Net increase in net assets resulting from operations | | | 207,242,767 | | | | 100,343,151 | |
| | |
Distributions to shareholders from net investment income: | | | | | | | | |
Class A | | | (20,803,893 | ) | | | (10,154,258 | ) |
Class B | | | (58,708 | ) | | | (98,189 | ) |
Class C | | | (2,640,699 | ) | | | (927,378 | ) |
Class Y | | | (11,477,833 | ) | | | (1,672,559 | ) |
Investor Class | | | (1,696,977 | ) | | | (1,470,492 | ) |
Class R5 | | | (32,280 | ) | | | (4,711 | ) |
Class R6 | | | (1,710,270 | ) | | | (1,345,105 | ) |
Total distributions from net investment income | | | (38,420,660 | ) | | | (15,672,692 | ) |
| | |
Distributions to shareholders from net realized gains: | | | | | | | | |
Class A | | | (8,645,516 | ) | | | (10,853,763 | ) |
Class B | | | (37,684 | ) | | | (165,093 | ) |
Class C | | | (1,943,560 | ) | | | (1,501,782 | ) |
Class Y | | | (4,209,998 | ) | | | (1,035,782 | ) |
Investor Class | | | (666,199 | ) | | | (1,626,499 | ) |
Class R5 | | | (13,114 | ) | | | (5,856 | ) |
Class R6 | | | (567,224 | ) | | | (1,329,498 | ) |
Total distributions from net realized gains | | | (16,083,295 | ) | | | (16,518,273 | ) |
| | |
Share transactions–net: | | | | | | | | |
Class A | | | 193,246,031 | | | | 411,511,840 | |
Class B | | | (2,923,746 | ) | | | (3,246,373 | ) |
Class C | | | 138,121,491 | | | | 86,032,465 | |
Class Y | | | 572,507,893 | | | | 185,172,547 | |
Investor Class | | | 1,610,402 | | | | 9,115,847 | |
Class R5 | | | 1,707,072 | | | | 503,726 | |
Class R6 | | | 14,614,408 | | | | 8,323,035 | |
Net increase in net assets resulting from share transactions | | | 918,883,551 | | | | 697,413,087 | |
Net increase in net assets | | | 1,071,622,363 | | | | 765,565,273 | |
| | |
Net assets: | | | | | | | | |
Beginning of year | | | 1,430,794,001 | | | | 665,228,728 | |
End of year (includes undistributed net investment income of $(23,371) and $290,527, respectively) | | $ | 2,502,416,364 | | | $ | 1,430,794,001 | |
Notes to Financial Statements
April 30, 2017
NOTE 1—Significant Accounting Policies
Invesco Dividend Income Fund (the “Fund”) is a series portfolio of AIM Sector Funds (Invesco Sector Funds) (the “Trust”). The Trust is a Delaware statutory trust registered under the Investment Company Act of 1940, as amended (the “1940 Act”), as an open-end series management investment company consisting of ten separate portfolios, each authorized to issue an unlimited number of shares of beneficial interest. The assets, liabilities and operations of each portfolio are accounted for separately. Information presented in these financial statements pertains only to the Fund. Matters affecting each portfolio or class will be voted on exclusively by the shareholders of such portfolio or class.
The Fund’s investment objective is current income and long-term growth of capital.
The Fund currently consists of seven different classes of shares: Class A, Class B, Class C, Class Y, Investor Class, Class R5 and Class R6. Class Y and Investor Class shares are available only to certain investors. Class A shares are sold with a front-end sales charge unless certain waiver criteria
13 Invesco Dividend Income Fund
are met and under certain circumstances load waived shares may be subject to contingent deferred sales charges (“CDSC”). Class C shares are sold with a CDSC. Class Y, Investor Class, Class R5 and Class R6 shares are sold at net asset value. Effective November 30, 2010, new or additional investments in Class B shares are no longer permitted. Existing shareholders of Class B shares may continue to reinvest dividends and capital gains distributions in Class B shares until they convert to Class A shares. Also, shareholders in Class B shares will be able to exchange those shares for Class B shares of other Invesco Funds offering such shares until they convert to Class A shares. Generally, Class B shares will automatically convert to Class A shares on or about the month-end, which is at least eight years after the date of purchase. Redemption of Class B shares prior to the conversion date will be subject to a CDSC.
The Fund is an investment company and accordingly follows the investment company accounting and reporting guidance in accordance with Financial Accounting Standards Board Accounting Standards Codification Topic 946, Financial Services — Investment Companies.
The following is a summary of the significant accounting policies followed by the Fund in the preparation of its financial statements.
| A. | Security Valuations — Securities, including restricted securities, are valued according to the following policy. |
A security listed or traded on an exchange (except convertible securities) is valued at its last sales price or official closing price as of the close of the customary trading session on the exchange where the security is principally traded, or lacking any sales or official closing price on a particular day, the security may be valued at the closing bid price on that day. Securities traded in the over-the-counter market are valued based on prices furnished by independent pricing services or market makers. When such securities are valued by an independent pricing service they may be considered fair valued. Futures contracts are valued at the final settlement price set by an exchange on which they are principally traded. Listed options are valued at the mean between the last bid and asked prices from the exchange on which they are principally traded. Options not listed on an exchange are valued by an independent source at the mean between the last bid and asked prices. For purposes of determining net asset value (“NAV”) per share, futures and option contracts generally are valued 15 minutes after the close of the customary trading session of the New York Stock Exchange (“NYSE”).
Investments in open-end and closed-end registered investment companies that do not trade on an exchange are valued at the end-of-day net asset value per share. Investments in open-end and closed-end registered investment companies that trade on an exchange are valued at the last sales price or official closing price as of the close of the customary trading session on the exchange where the security is principally traded.
Debt obligations (including convertible securities) and unlisted equities are fair valued using an evaluated quote provided by an independent pricing service. Evaluated quotes provided by the pricing service may be determined without exclusive reliance on quoted prices, and may reflect appropriate factors such as institution-size trading in similar groups of securities, developments related to specific securities, dividend rate (for unlisted equities), yield (for debt obligations), quality, type of issue, coupon rate (for debt obligations), maturity (for debt obligations), individual trading characteristics and other market data. Debt obligations are subject to interest rate and credit risks. In addition, all debt obligations involve some risk of default with respect to interest and/or principal payments.
Foreign securities’ (including foreign exchange contracts) prices are converted into U.S. dollar amounts using the applicable exchange rates as of the close of the NYSE. If market quotations are available and reliable for foreign exchange-traded equity securities, the securities will be valued at the market quotations. Because trading hours for certain foreign securities end before the close of the NYSE, closing market quotations may become unreliable. If between the time trading ends on a particular security and the close of the customary trading session on the NYSE, events occur that the Adviser determines are significant and make the closing price unreliable, the Fund may fair value the security. If the event is likely to have affected the closing price of the security, the security will be valued at fair value in good faith using procedures approved by the Board of Trustees. Adjustments to closing prices to reflect fair value may also be based on a screening process of an independent pricing service to indicate the degree of certainty, based on historical data, that the closing price in the principal market where a foreign security trades is not the current value as of the close of the NYSE. Foreign securities’ prices meeting the approved degree of certainty that the price is not reflective of current value will be priced at the indication of fair value from the independent pricing service. Multiple factors may be considered by the independent pricing service in determining adjustments to reflect fair value and may include information relating to sector indices, American Depositary Receipts and domestic and foreign index futures. Foreign securities may have additional risks including exchange rate changes, potential for sharply devalued currencies and high inflation, political and economic upheaval, the relative lack of issuer information, relatively low market liquidity and the potential lack of strict financial and accounting controls and standards.
Securities for which market prices are not provided by any of the above methods may be valued based upon quotes furnished by independent sources. The last bid price may be used to value equity securities. The mean between the last bid and asked prices is used to value debt obligations, including corporate loans.
Securities for which market quotations are not readily available or became unreliable are valued at fair value as determined in good faith by or under the supervision of the Trust’s officers following procedures approved by the Board of Trustees. Issuer specific events, market trends, bid/asked quotes of brokers and information providers and other market data may be reviewed in the course of making a good faith determination of a security’s fair value.
The Fund may invest in securities that are subject to interest rate risk, meaning the risk that the prices will generally fall as interest rates rise and, conversely, the prices will generally rise as interest rates fall. Specific securities differ in their sensitivity to changes in interest rates depending on their individual characteristics. Changes in interest rates may result in increased market volatility, which may affect the value and/or liquidity of certain Fund investments.
Valuations change in response to many factors including the historical and prospective earnings of the issuer, the value of the issuer’s assets, general economic conditions, interest rates, investor perceptions and market liquidity. Because of the inherent uncertainties of valuation, the values reflected in the financial statements may materially differ from the value received upon actual sale of those investments.
| B. | Securities Transactions and Investment Income — Securities transactions are accounted for on a trade date basis. Realized gains or losses on sales are computed on the basis of specific identification of the securities sold. Interest income (net of withholding tax, if any) is recorded on the accrual basis from settlement date. Dividend income (net of withholding tax, if any) is recorded on the ex-dividend date. |
The Fund may periodically participate in litigation related to Fund investments. As such, the Fund may receive proceeds from litigation settlements. Any proceeds received are included in the Statement of Operations as realized gain (loss) for investments no longer held and as unrealized gain (loss) for investments still held.
Brokerage commissions and mark ups are considered transaction costs and are recorded as an increase to the cost basis of securities purchased and/or a reduction of proceeds on a sale of securities. Such transaction costs are included in the determination of net realized and
14 Invesco Dividend Income Fund
unrealized gain (loss) from investment securities reported in the Statement of Operations and the Statement of Changes in Net Assets and the net realized and unrealized gains (losses) on securities per share in the Financial Highlights. Transaction costs are included in the calculation of the Fund’s net asset value and, accordingly, they reduce the Fund’s total returns. These transaction costs are not considered operating expenses and are not reflected in net investment income reported in the Statement of Operations and the Statement of Changes in Net Assets, or the net investment income per share and the ratios of expenses and net investment income reported in the Financial Highlights, nor are they limited by any expense limitation arrangements between the Fund and the investment adviser.
The Fund allocates income and realized and unrealized capital gains and losses to a class based on the relative net assets of each class.
| C. | Country Determination — For the purposes of making investment selection decisions and presentation in the Schedule of Investments, the investment adviser may determine the country in which an issuer is located and/or credit risk exposure based on various factors. These factors include the laws of the country under which the issuer is organized, where the issuer maintains a principal office, the country in which the issuer derives 50% or more of its total revenues and the country that has the primary market for the issuer’s securities, as well as other criteria. Among the other criteria that may be evaluated for making this determination are the country in which the issuer maintains 50% or more of its assets, the type of security, financial guarantees and enhancements, the nature of the collateral and the sponsor organization. Country of issuer and/or credit risk exposure has been determined to be the United States of America, unless otherwise noted. |
| D. | Distributions — Distributions from net investment income, if any, are declared and paid monthly. Distributions from net realized capital gain, if any, are generally declared and paid annually and recorded on the ex-dividend date. The Fund may elect to treat a portion of the proceeds from redemptions as distributions for federal income tax purposes. |
| E. | Federal Income Taxes — The Fund intends to comply with the requirements of Subchapter M of the Internal Revenue Code of 1986, as amended (the “Internal Revenue Code”), necessary to qualify as a regulated investment company and to distribute substantially all of the Fund’s taxable earnings to shareholders. As such, the Fund will not be subject to federal income taxes on otherwise taxable income (including net realized capital gain) that is distributed to shareholders. Therefore, no provision for federal income taxes is recorded in the financial statements. |
The Fund recognizes the tax benefits of uncertain tax positions only when the position is more likely than not to be sustained. Management has analyzed the Fund’s uncertain tax positions and concluded that no liability for unrecognized tax benefits should be recorded related to uncertain tax positions. Management is not aware of any tax positions for which it is reasonably possible that the total amounts of unrecognized tax benefits will change materially in the next 12 months.
The Fund files tax returns in the U.S. Federal jurisdiction and certain other jurisdictions. Generally, the Fund is subject to examinations by such taxing authorities for up to three years after the filing of the return for the tax period.
| F. | Expenses — Fees provided for under the Rule 12b-1 plan of a particular class of the Fund are charged to the operations of such class. Transfer agency fees and expenses and other shareholder recordkeeping fees and expenses attributable to Class R5 and Class R6 are allocated to each share class based on relative net assets. Sub-accounting fees attributable to Class R5 are charged to the operations of the class. Transfer agency fees and expenses and other shareholder recordkeeping fees and expenses relating to all other classes are allocated among those classes based on relative net assets. All other expenses are allocated among the classes based on relative net assets. |
| G. | Accounting Estimates — The preparation of financial statements in conformity with accounting principles generally accepted in the United States of America (“GAAP”) requires management to make estimates and assumptions that affect the reported amounts of assets and liabilities at the date of the financial statements and the reported amounts of revenues and expenses during the reporting period including estimates and assumptions related to taxation. Actual results could differ from those estimates by a significant amount. In addition, the Fund monitors for material events or transactions that may occur or become known after the period-end date and before the date the financial statements are released to print. |
| H. | Indemnifications — Under the Trust’s organizational documents, each Trustee, officer, employee or other agent of the Trust is indemnified against certain liabilities that may arise out of the performance of their duties to the Fund. Additionally, in the normal course of business, the Fund enters into contracts, including the Fund’s servicing agreements, that contain a variety of indemnification clauses. The Fund’s maximum exposure under these arrangements is unknown as this would involve future claims that may be made against the Fund that have not yet occurred. The risk of material loss as a result of such indemnification claims is considered remote. |
| I. | Foreign Currency Translations — Foreign currency is valued at the close of the NYSE based on quotations posted by banks and major currency dealers. Portfolio securities and other assets and liabilities denominated in foreign currencies are translated into U.S. dollar amounts at date of valuation. Purchases and sales of portfolio securities (net of foreign taxes withheld on disposition) and income items denominated in foreign currencies are translated into U.S. dollar amounts on the respective dates of such transactions. The Fund does not separately account for the portion of the results of operations resulting from changes in foreign exchange rates on investments and the fluctuations arising from changes in market prices of securities held. The combined results of changes in foreign exchange rates and the fluctuation of market prices on investments (net of estimated foreign tax withholding) are included with the net realized and unrealized gain or loss from investments in the Statement of Operations. Reported net realized foreign currency gains or losses arise from (1) sales of foreign currencies, (2) currency gains or losses realized between the trade and settlement dates on securities transactions, and (3) the difference between the amounts of dividends, interest, and foreign withholding taxes recorded on the Fund’s books and the U.S. dollar equivalent of the amounts actually received or paid. Net unrealized foreign currency gains and losses arise from changes in the fair values of assets and liabilities, other than investments in securities at fiscal period end, resulting from changes in exchange rates. |
The Fund may invest in foreign securities, which may be subject to foreign taxes on income, gains on investments or currency repatriation, a portion of which may be recoverable. Foreign taxes, if any, are recorded based on the tax regulations and rates that exist in the foreign markets in which the Fund invests and are shown in the Statement of Operations.
| J. | Forward Foreign Currency Contracts — The Fund may engage in foreign currency transactions either on a spot (i.e. for prompt delivery and settlement) basis, or through forward foreign currency contracts, to manage or minimize currency or exchange rate risk. |
The Fund may also enter into forward foreign currency contracts for the purchase or sale of a security denominated in a foreign currency in order to “lock in” the U.S. dollar price of that security, or the Fund may also enter into forward foreign currency contracts that do not provide for physical settlement of the two currencies, but instead are settled by a single cash payment calculated as the difference between the agreed upon exchange rate and the spot rate at settlement based upon an agreed upon notional amount (non-deliverable forwards). The Fund will set aside liquid assets in an amount equal to the daily mark-to-market obligation for forward foreign currency contracts.
15 Invesco Dividend Income Fund
A forward foreign currency contract is an obligation between two parties (“Counterparties”) to purchase or sell a specific currency for an agreed-upon price at a future date. The use of forward foreign currency contracts does not eliminate fluctuations in the price of the underlying securities the Fund owns or intends to acquire but establishes a rate of exchange in advance. Fluctuations in the value of these contracts are measured by the difference in the contract date and reporting date exchange rates and are recorded as unrealized appreciation (depreciation) until the contracts are closed. When the contracts are closed, realized gains (losses) are recorded. Realized and unrealized gains (losses) on the contracts are included in the Statement of Operations. The primary risks associated with forward foreign currency contracts include failure of the Counterparty to meet the terms of the contract and the value of the foreign currency changing unfavorably. These risks may be in excess of the amounts reflected in the Statement of Assets and Liabilities.
NOTE 2—Advisory Fees and Other Fees Paid to Affiliates
The Trust has entered into a master investment advisory agreement with Invesco Advisers, Inc. (the “Adviser” or “Invesco”). Under the terms of the investment advisory agreement, the Fund pays an advisory fee to the Adviser based on the annual rate of the Fund’s average daily net assets as follows:
| | | | | | | | |
| Average Daily Net Assets | | Rate | |
First $350 million | | | 0 | .75% | | | | |
Next $350 million | | | 0 | .65% | | | | |
Next $1.3 billion | | | 0 | .55% | | | | |
Next $2 billion | | | 0 | .45% | | | | |
Next $2 billion | | | 0 | .40% | | | | |
Next $2 billion | | | 0 | .375% | | | | |
Over $8 billion | | | 0 | .35% | | | | |
For the year ended April 30, 2017, the effective advisory fees incurred by the Fund was 0.59%.
Under the terms of a master sub-advisory agreement between the Adviser and each of Invesco Asset Management Deutschland GmbH, Invesco Asset Management Limited, Invesco Asset Management (Japan) Limited, Invesco Hong Kong Limited, Invesco Senior Secured Management, Inc. and Invesco Canada Ltd. (collectively, the “Affiliated Sub-Advisers”) the Adviser, not the Fund, will pay 40% of the fees paid to the Adviser to any such Affiliated Sub-Adviser(s) that provide(s) discretionary investment management services to the Fund based on the percentage of assets allocated to such Affiliated Sub-Adviser(s).
The Adviser has contractually agreed, through at least June 30, 2018, to waive advisory fees and/or reimburse expenses of all shares to the extent necessary to limit total annual fund operating expenses after fee waiver and/or expense reimbursement (excluding certain items discussed below) of Class A, Class B, Class C, Class Y, Investor Class, Class R5 and Class R6 shares to 2.00%, 2.75%, 2.75%, 1.75%, 2.00%, 1.75% and 1.75%, respectively, of average daily net assets (the “expense limits”). In determining the Adviser’s obligation to waive advisory fees and/or reimburse expenses, the following expenses are not taken into account, and could cause the total annual fund operating expenses after fee waivers and/or expense reimbursement to exceed the numbers reflected above: (1) interest; (2) taxes; (3) dividend expense on short sales; (4) extraordinary or non-routine items, including litigation expenses; and (5) expenses that the Fund has incurred but did not actually pay because of an expense offset arrangement. Unless Invesco continues the fee waiver agreement, it will terminate on June 30, 2018. During its term, the fee waiver agreement cannot be terminated or amended to increase the expense limits without approval of the Board of Trustees. The Adviser did not waive fees and/or reimburse expenses during the period under these expense limits.
Further, the Adviser has contractually agreed, through at least June 30, 2019, to waive the advisory fee payable by the Fund in an amount equal to 100% of the net advisory fees the Adviser receives from the affiliated money market funds on investments by the Fund of uninvested cash in such affiliated money market funds.
For the year ended April 30, 2017, the Adviser waived advisory fees of $459,270.
The Trust has entered into a master administrative services agreement with Invesco pursuant to which the Fund has agreed to pay Invesco for certain administrative costs incurred in providing accounting services to the Fund. For the year ended April 30, 2017, expenses incurred under the agreement are shown in the Statement of Operations as Administrative services fees.
The Trust has entered into a transfer agency and service agreement with Invesco Investment Services, Inc. (“IIS”) pursuant to which the Fund has agreed to pay IIS a fee for providing transfer agency and shareholder services to the Fund and reimburse IIS for certain expenses incurred by IIS in the course of providing such services. IIS may make payments to intermediaries that provide omnibus account services, sub-accounting services and/or networking services. All fees payable by IIS to intermediaries that provide omnibus account services or sub-accounting are charged back to the Fund, subject to certain limitations approved by the Trust’s Board of Trustees. For the year ended April 30, 2017, expenses incurred under the agreement are shown in the Statement of Operations as Transfer agent fees.
The Trust has entered into master distribution agreements with Invesco Distributors, Inc. (“IDI”) to serve as the distributor for the Class A, Class B, Class C, Class Y, Investor Class, Class R5 and Class R6 shares of the Fund. The Trust has adopted plans pursuant to Rule 12b-1 under the 1940 Act with respect to the Fund’s Class A, Class B, Class C and Investor Class shares (collectively, the “Plans”). The Fund, pursuant to the Plans, pays IDI compensation at the annual rate of 0.25% of the Fund’s average daily net assets of Class A shares, 1.00% of the average daily net assets of Class B and Class C shares and 0.25% of the average daily net assets of Investor Class shares. Of the Plan payments, up to 0.25% of the average daily net assets of each class of shares may be paid to furnish continuing personal shareholder services to customers who purchase and own shares of such classes. Any amounts not paid as a service fee under the Plans would constitute an asset-based sales charge. Rules of the Financial Industry Regulatory Authority (“FINRA”) impose a cap on the total sales charges, including asset-based sales charges, that may be paid by any class of shares of the Fund. For the year ended April 30, 2017, expenses incurred under the Plan are shown in the Statement of Operations as Distribution fees.
Front-end sales commissions and CDSC (collectively, the “sales charges”) are not recorded as expenses of the Fund. Front-end sales commissions are deducted from proceeds from the sales of Fund shares prior to investment in Class A shares of the Fund. CDSC are deducted from redemption proceeds prior to remittance to the shareholder. During the year ended April 30, 2017, IDI advised the Fund that IDI retained $753,440 in front-end
16 Invesco Dividend Income Fund
sales commissions from the sale of Class A shares and $35,805, $357 and $68,627 from Class A, Class B and Class C shares, respectively, for CDSC imposed on redemptions by shareholders.
Certain officers and trustees of the Trust are officers and directors of the Adviser, IIS and/or IDI.
NOTE 3—Additional Valuation Information
GAAP defines fair value as the price that would be received to sell an asset or paid to transfer a liability in an orderly transaction between market participants at the measurement date, under current market conditions. GAAP establishes a hierarchy that prioritizes the inputs to valuation methods, giving the highest priority to readily available unadjusted quoted prices in an active market for identical assets (Level 1) and the lowest priority to significant unobservable inputs (Level 3), generally when market prices are not readily available or are unreliable. Based on the valuation inputs, the securities or other investments are tiered into one of three levels. Changes in valuation methods may result in transfers in or out of an investment’s assigned level:
| | Level 1 — | Prices are determined using quoted prices in an active market for identical assets. |
| | Level 2 — | Prices are determined using other significant observable inputs. Observable inputs are inputs that other market participants may use in pricing a security. These may include quoted prices for similar securities, interest rates, prepayment speeds, credit risk, yield curves, loss severities, default rates, discount rates, volatilities and others. |
| | Level 3 — | Prices are determined using significant unobservable inputs. In situations where quoted prices or observable inputs are unavailable (for example, when there is little or no market activity for an investment at the end of the period), unobservable inputs may be used. Unobservable inputs reflect the Fund’s own assumptions about the factors market participants would use in determining fair value of the securities or instruments and would be based on the best available information. |
The following is a summary of the tiered valuation input levels, as of April 30, 2017. The level assigned to the securities valuations may not be an indication of the risk or liquidity associated with investing in those securities. Because of the inherent uncertainties of valuation, the values reflected in the financial statements may materially differ from the value received upon actual sale of those investments.
During the year ended April 30, 2017, there were transfers from Level 1 to Level 2 of $23,654,232 and from Level 2 to Level 1 of $62,052,148, due to foreign fair value adjustments.
| | | | | | | | | | | | | | | | |
| | | Level 1 | | | Level 2 | | | Level 3 | | | Total | |
Common Stocks & Other Equity Interests | | $ | 2,047,287,565 | | | $ | 89,029,750 | | | $ | — | | | $ | 2,136,317,315 | |
Money Market Funds | | | 372,192,329 | | | | — | | | | — | | | | 372,192,329 | |
| | | | 2,419,479,894 | | | | 89,029,750 | | | | — | | | | 2,508,509,644 | |
Forward Foreign Currency Contracts* | | | — | | | | 390,315 | | | | — | | | | 390,315 | |
Total Investments | | $ | 2,419,479,894 | | | $ | 89,420,065 | | | $ | — | | | $ | 2,508,899,959 | |
| * | Unrealized appreciation. |
NOTE 4—Derivative Investments
The Fund may enter into an International Swaps and Derivatives Association Master Agreement (“ISDA Master Agreement”) under which a Fund may trade OTC derivatives. An OTC transaction entered into under an ISDA Master Agreement typically involves a collateral posting arrangement, payment netting provisions and close-out netting provisions. These netting provisions allow for reduction of credit risk through netting of contractual obligations. The enforceability of the netting provisions of the ISDA Master Agreement depends on the governing law of the ISDA Master Agreement, among other factors.
For financial reporting purposes, the Fund does not offset OTC derivative assets or liabilities that are subject to ISDA Master Agreements in the Statement of Assets and Liabilities.
| | | | | | | | | | | | | | | | | | | | | | | | | | |
Open Forward Foreign Currency Contracts | |
Settlement Date | | Counterparty | | Contract to | | | Notional Value | | | Unrealized
Appreciation (Depreciation) | |
| | | | | | Deliver | | | | | | Receive | | | |
05/24/17 | | Citigroup Global Markets Inc. | | | CAD | | | | 14,596,490 | | | | USD | | | | 10,947,806 | | | $ | 10,696,197 | | | $ | 251,609 | |
05/24/17 | | Citigroup Global Markets Inc. | | | EUR | | | | 12,574,507 | | | | USD | | | | 13,596,688 | | | | 13,716,154 | | | | (119,466 | ) |
05/24/17 | | Citigroup Global Markets Inc. | | | USD | | | | 211,634 | | | | CAD | | | | 288,006 | | | | 211,049 | | | | (585 | ) |
05/24/17 | | Goldman Sachs International | | | CAD | | | | 14,951,380 | | | | USD | | | | 11,218,177 | | | | 10,956,257 | | | | 261,920 | |
05/24/17 | | Goldman Sachs International | | | EUR | | | | 12,870,538 | | | | USD | | | | 13,914,418 | | | | 14,039,063 | | | | (124,645 | ) |
05/24/17 | | Goldman Sachs International | | | USD | | | | 235,593 | | | | CAD | | | | 315,588 | | | | 231,261 | | | | (4,332 | ) |
05/24/17 | | Merrill Lynch International | | | CAD | | | | 14,596,490 | | | | USD | | | | 10,941,405 | | | | 10,696,197 | | | | 245,208 | |
05/24/17 | | Merrill Lynch International | | | EUR | | | | 12,574,549 | | | | USD | | | | 13,599,815 | | | | 13,716,201 | | | | (116,386 | ) |
05/24/17 | | Merrill Lynch International | | | USD | | | | 127,717 | | | | CAD | | | | 170,184 | | | | 124,709 | | | | (3,008 | ) |
Total forward foreign currency contracts — currency risk | | | | | | | | | | | | | | | | | | | | | | $ | 390,315 | |
Currency Abbreviations:
17 Invesco Dividend Income Fund
Value of Derivative Investments at Period-End
The table below summarizes the value of the Fund’s derivative investments, detailed by primary risk exposure, held as of April 30, 2017:
| | | | |
| | | Value | |
| Derivative Assets | | Currency Risk | |
Unrealized appreciation on forward foreign currency contracts outstanding | | $ | 758,737 | |
Derivatives not subject to master netting agreements | | | — | |
Total Derivative Assets subject to master netting agreements | | $ | 758,737 | |
| |
| Derivative Liabilities | | | |
Unrealized depreciation on forward foreign currency contracts outstanding | | $ | (368,422 | ) |
Derivatives not subject to master netting agreements | | | — | |
Total Derivative Liabilities subject to master netting agreements | | $ | (368,422 | ) |
Offsetting Assets and Liabilities
The table below reflects the Fund’s exposure to Counterparties subject to either an ISDA Master Agreement or other agreement for OTC derivative transactions as of April 30, 2017.
| | | | | | | | | | | | | | | | | | | | | | | | |
| | | Financial
Derivative Assets | | | Financial
Derivative Liabilities | | | Net Value of
Derivatives | | | Collateral
(Received)/Pledged | | | | |
| Counterparty | | Forward
Foreign Currency
Contracts | | | Forward
Foreign Currency
Contracts | | | | Non-Cash | | | Cash | | | Net Amount | |
Citigroup Global Markets Inc. | | $ | 251,609 | | | $ | (120,051 | ) | | $ | 131,558 | | | $ | — | | | $ | — | | | $ | 131,558 | |
Goldman Sachs International | | | 261,920 | | | | (128,977 | ) | | | 132,943 | | | | — | | | | — | | | | 132,943 | |
Merrill Lynch International | | | 245,208 | | | | (119,394 | ) | | | 125,814 | | | | — | | | | — | | | | 125,814 | |
Total | | $ | 758,737 | | | $ | (368,422 | ) | | $ | 390,315 | | | $ | — | | | $ | — | | | $ | 390,315 | |
Effect of Derivative Investments for the year ended April 30, 2017
The table below summarizes the gains on derivative investments, detailed by primary risk exposure, recognized in earnings during the period:
| | | | |
| | | Location of Gain on
Statement of Operations | |
| | | Currency Risk | |
Realized Gain: | | | | |
Forward foreign currency contracts | | $ | 2,335,440 | |
Change in Net Unrealized Appreciation: | | | | |
Forward foreign currency contracts | | | 1,665,236 | |
Total | | $ | 4,000,676 | |
The table below summarizes the average notional value of forward foreign currency contracts outstanding during the period.
| | | | |
| | | Forward Foreign Currency
Contracts | |
Average notional value | | $ | 66,187,277 | |
NOTE 5—Expense Offset Arrangement(s)
The expense offset arrangement is comprised of transfer agency credits which result from balances in demand deposit accounts used by the transfer agent for clearing shareholder transactions. For the year ended April 30, 2017, the Fund received credits from this arrangement, which resulted in the reduction of the Fund’s total expenses of $11,940.
NOTE 6—Trustees’ and Officers’ Fees and Benefits
Trustees’ and Officers’ Fees and Benefits include amounts accrued by the Fund to pay remuneration to certain Trustees and Officers of the Fund. Trustees have the option to defer compensation payable by the Fund, and Trustees’ and Officers’ Fees and Benefits also include amounts accrued by the Fund to fund such deferred compensation amounts. Those Trustees who defer compensation have the option to select various Invesco Funds in which their deferral accounts shall be deemed to be invested. Finally, certain current Trustees were eligible to participate in a retirement plan that provided for benefits to be paid upon retirement to Trustees over a period of time based on the number of years of service. The Fund may have certain former Trustees who also participate in a retirement plan and receive benefits under such plan. Trustees’ and Officers’ Fees and Benefits include amounts accrued by the Fund to fund such retirement benefits. Obligations under the deferred compensation and retirement plans represent unsecured claims against the general assets of the Fund.
18 Invesco Dividend Income Fund
NOTE 7—Cash Balances
The Fund is permitted to temporarily carry a negative or overdrawn balance in its account with State Street Bank and Trust Company, the custodian bank. Such balances, if any at period-end, are shown in the Statement of Assets and Liabilities under the payable caption Amount due custodian. To compensate the custodian bank for such overdrafts, the overdrawn Fund may either (1) leave funds as a compensating balance in the account so the custodian bank can be compensated by earning the additional interest; or (2) compensate by paying the custodian bank at a rate agreed upon by the custodian bank and Invesco, not to exceed the contractually agreed upon rate.
NOTE 8—Distributions to Shareholders and Tax Components of Net Assets
Tax Character of Distributions to Shareholders Paid During the Fiscal Years Ended April 30, 2017 and 2016:
| | | | | | | | |
| | | 2017 | | | 2016 | |
Ordinary income | | $ | 39,163,997 | | | $ | 15,103,903 | |
Long-term capital gain | | | 15,339,958 | | | | 17,087,062 | |
Total distributions | | $ | 54,503,955 | | | $ | 32,190,965 | |
Tax Components of Net Assets at Period-End:
| | | | |
| | | 2017 | |
Undistributed ordinary income | | $ | 8,921,170 | |
Undistributed long-term gain | | | 16,838,066 | |
Net unrealized appreciation — investments | | | 337,806,090 | |
Net unrealized appreciation — other investments | | | 13,765 | |
Temporary book/tax differences | | | (140,547 | ) |
Shares of beneficial interest | | | 2,138,977,820 | |
Total net assets | | $ | 2,502,416,364 | |
The difference between book-basis and tax-basis unrealized appreciation (depreciation) is due to differences in the timing of recognition of gains and losses on investments for tax and book purposes. The Fund’s net unrealized appreciation difference is attributable primarily to wash sales.
The temporary book/tax differences are a result of timing differences between book and tax recognition of income and/or expenses. The Fund’s temporary book/tax differences are the result of the trustee deferral of compensation and retirement plan benefits.
Capital loss carryforward is calculated and reported as of a specific date. Results of transactions and other activity after that date may affect the amount of capital loss carryforward actually available for the Fund to utilize. Capital losses generated in years beginning after December 22, 2010 can be carried forward for an unlimited period, whereas previous losses expire in eight tax years. Capital losses with an expiration period may not be used to offset capital gains until all net capital losses without an expiration date have been utilized. Capital loss carryforwards with no expiration date will retain their character as either short-term or long-term capital losses instead of as short-term capital losses as under prior law. The ability to utilize capital loss carryforwards in the future may be limited under the Internal Revenue Code and related regulations based on the results of future transactions.
The Fund does not have a capital loss carryforward as of April 30, 2017.
NOTE 9—Investment Securities
The aggregate amount of investment securities (other than short-term securities, U.S. Treasury obligations and money market funds, if any) purchased and sold by the Fund during the year ended April 30, 2017 was $934,481,871 and $112,444,346, respectively. Cost of investments on a tax basis includes the adjustments for financial reporting purposes as of the most recently completed federal income tax reporting period-end.
| | | | |
| Unrealized Appreciation (Depreciation) of Investment Securities on a Tax Basis | |
Aggregate unrealized appreciation of investment securities | | $ | 374,286,626 | |
Aggregate unrealized (depreciation) of investment securities | | | (36,480,536 | ) |
Net unrealized appreciation of investment securities | | $ | 337,806,090 | |
Cost of investments for tax purposes is $2,170,703,554.
NOTE 10—Reclassification of Permanent Differences
Primarily as a result of differing book/tax treatment of foreign currency transactions and fair fund settlements, on April 30, 2017, undistributed net investment income was increased by $47,744 and undistributed net realized gain was decreased by $47,744. This reclassification had no effect on the net assets of the Fund.
19 Invesco Dividend Income Fund
NOTE 11—Share Information
| | | | | | | | | | | | | | | | |
| | | Summary of Share Activity | |
| | | Years ended April 30, | |
| | | 2017(a) | | | 2016 | |
| | | Shares | | | Amount | | | Shares | | | Amount | |
Sold: | | | | | | | | | | | | | | | | |
Class A | | | 32,872,145 | | | $ | 752,580,540 | | | | 23,155,095 | | | $ | 495,255,985 | |
Class B | | | 58,719 | | | | 1,355,499 | | | | 45,769 | | | | 985,278 | |
Class C | | | 8,065,437 | | | | 187,099,792 | | | | 4,575,659 | | | | 99,778,343 | |
Class Y | | | 35,600,689 | | | | 833,032,697 | | | | 10,201,141 | | | | 221,042,787 | |
Investor Class | | | 1,106,288 | | | | 25,418,112 | | | | 833,236 | | | | 18,217,582 | |
Class R5 | | | 88,742 | | | | 2,042,332 | | | | 25,368 | | | | 541,396 | |
Class R6 | | | 1,231,702 | | | | 28,325,692 | | | | 537,995 | | | | 11,376,017 | |
| | | | |
Issued as reinvestment of dividends: | | | | | | | | | | | | | | | | |
Class A | | | 1,160,417 | | | | 26,940,241 | | | | 899,704 | | | | 18,705,560 | |
Class B | | | 3,851 | | | | 89,617 | | | | 11,767 | | | | 244,100 | |
Class C | | | 173,487 | | | | 4,093,920 | | | | 101,394 | | | | 2,127,305 | |
Class Y | | | 574,471 | | | | 13,514,267 | | | | 107,947 | | | | 2,287,463 | |
Investor Class | | | 95,621 | | | | 2,238,180 | | | | 139,764 | | | | 2,928,943 | |
Class R5 | | | 1,934 | | | | 45,145 | | | | 505 | | | | 10,487 | |
Class R6 | | | 98,044 | | | | 2,277,494 | | | | 128,598 | | | | 2,674,602 | |
| | | | |
Automatic conversion of Class B shares to Class A shares: | | | | | | | | | | | | | | | | |
Class A | | | 121,190 | | | | 2,802,975 | | | | 151,581 | | | | 3,226,925 | |
Class B | | | (120,829 | ) | | | (2,802,975 | ) | | | (151,126 | ) | | | (3,226,925 | ) |
| | | | |
Reacquired: | | | | | | | | | | | | | | | | |
Class A | | | (25,280,882 | ) | | | (589,077,725 | ) | | | (5,016,182 | ) | | | (105,676,630 | ) |
Class B | | | (67,699 | ) | | | (1,565,887 | ) | | | (59,164 | ) | | | (1,248,826 | ) |
Class C | | | (2,251,720 | ) | | | (53,072,221 | ) | | | (740,023 | ) | | | (15,873,183 | ) |
Class Y | | | (11,694,780 | ) | | | (274,039,071 | ) | | | (1,767,891 | ) | | | (38,157,703 | ) |
Investor Class | | | (1,118,748 | ) | | | (26,045,890 | ) | | | (567,954 | ) | | | (12,030,678 | ) |
Class R5 | | | (16,213 | ) | | | (380,405 | ) | | | (2,232 | ) | | | (48,157 | ) |
Class R6 | | | (674,403 | ) | | | (15,988,778 | ) | | | (273,544 | ) | | | (5,727,584 | ) |
Net increase in share activity | | | 40,027,463 | | | $ | 918,883,551 | | | | 32,337,407 | | | $ | 697,413,087 | |
| (a) | There are entities that are record owners of more than 5% of the outstanding shares of the Fund and in the aggregate own 50% of the outstanding shares of the Fund. IDI has an agreement with these entities to sell Fund shares. The Fund, Invesco and/or Invesco affiliates may make payments to these entities, which are considered to be related to the Fund, for providing services to the Fund, Invesco and/or Invesco affiliates including but not limited to services such as securities brokerage, distribution, third party record keeping and account servicing. The Fund has no knowledge as to whether all or any portion of the shares owned of record by these entities are also owned beneficially. |
20 Invesco Dividend Income Fund
NOTE 12—Financial Highlights
The following schedule presents financial highlights for a share of the Fund outstanding throughout the periods indicated.
| | | | | | | | | | | | | | | | | | | | | | | | | | | | | | | | | | | | | | | | | | | | | | | | | | | | | | | | |
| | | Net asset
value,
beginning
of period | | | Net
investment
income(a) | | | Net gains
on securities
(both
realized and
unrealized) | | | Total from
investment
operations | | | Dividends
from net
investment
income | | | Distributions
from net
realized
gains | | | Total
distributions | | | Net asset
value, end
of period | | | Total
return(b) | | | Net assets,
end of period
(000’s omitted) | | | Ratio of
expenses
to average net assets
with fee waivers
and/or expenses
absorbed | | | Ratio of
expenses
to average net
assets without
fee waivers
and/or expenses
absorbed | | | Ratio of net
investment
income to average
net assets | | | Portfolio
turnover(c) | |
Class A | |
Year ended 04/30/17 | | $ | 22.32 | | | $ | 0.41 | | | $ | 1.80 | | | $ | 2.21 | | | $ | (0.41 | ) | | $ | (0.16 | ) | | $ | (0.57 | ) | | $ | 23.96 | | | | 10.00 | % | | $ | 1,143,946 | | | | 1.03 | %(d) | | | 1.05 | %(d) | | | 1.74 | %(d) | | | 6 | % |
Year ended 04/30/16 | | | 21.03 | | | | 0.40 | | | | 1.77 | | | | 2.17 | | | | (0.41 | ) | | | (0.47 | ) | | | (0.88 | ) | | | 22.32 | | | | 10.72 | | | | 867,596 | | | | 1.13 | | | | 1.17 | | | | 1.91 | | | | 9 | |
Year ended 04/30/15 | | | 19.88 | | | | 0.41 | | | | 1.37 | | | | 1.78 | | | | (0.42 | ) | | | (0.21 | ) | | | (0.63 | ) | | | 21.03 | | | | 9.07 | | | | 413,896 | | | | 1.12 | | | | 1.22 | | | | 1.99 | | | | 4 | |
Year ended 04/30/14 | | | 18.02 | | | | 0.41 | | | | 2.16 | | | | 2.57 | | | | (0.48 | ) | | | (0.23 | ) | | | (0.71 | ) | | | 19.88 | | | | 14.66 | | | | 335,837 | | | | 1.09 | | | | 1.29 | | | | 2.22 | | | | 4 | |
Year ended 04/30/13 | | | 16.93 | | | | 0.50 | | | | 2.21 | | | | 2.71 | | | | (0.52 | ) | | | (1.10 | ) | | | (1.62 | ) | | | 18.02 | | | | 16.83 | | | | 262,332 | | | | 1.26 | | | | 1.34 | | | | 2.87 | | | | 66 | |
Class B | |
Year ended 04/30/17 | | | 22.38 | | | | 0.23 | | | | 1.81 | | | | 2.04 | | | | (0.23 | ) | | | (0.16 | ) | | | (0.39 | ) | | | 24.03 | | | | 9.20 | | | | 4,216 | | | | 1.78 | (d) | | | 1.80 | (d) | | | 0.99 | (d) | | | 6 | |
Year ended 04/30/16 | | | 21.09 | | | | 0.25 | | | | 1.77 | | | | 2.02 | | | | (0.26 | ) | | | (0.47 | ) | | | (0.73 | ) | | | 22.38 | | | | 9.87 | | | | 6,746 | | | | 1.88 | | | | 1.92 | | | | 1.16 | | | | 9 | |
Year ended 04/30/15 | | | 19.93 | | | | 0.25 | | | | 1.38 | | | | 1.63 | | | | (0.26 | ) | | | (0.21 | ) | | | (0.47 | ) | | | 21.09 | | | | 8.30 | | | | 9,578 | | | | 1.87 | | | | 1.97 | | | | 1.24 | | | | 4 | |
Year ended 04/30/14 | | | 18.07 | | | | 0.27 | | | | 2.16 | | | | 2.43 | | | | (0.34 | ) | | | (0.23 | ) | | | (0.57 | ) | | | 19.93 | | | | 13.76 | | | | 12,479 | | | | 1.84 | | | | 2.04 | | | | 1.47 | | | | 4 | |
Year ended 04/30/13 | | | 16.97 | | | | 0.37 | | | | 2.21 | | | | 2.58 | | | | (0.38 | ) | | | (1.10 | ) | | | (1.48 | ) | | | 18.07 | | | | 15.92 | | | | 15,099 | | | | 2.01 | | | | 2.09 | | | | 2.12 | | | | 66 | |
Class C | |
Year ended 04/30/17 | | | 22.60 | | | | 0.24 | | | | 1.82 | | | | 2.06 | | | | (0.24 | ) | | | (0.16 | ) | | | (0.40 | ) | | | 24.26 | | | | 9.16 | | | | 311,194 | | | | 1.78 | (d) | | | 1.80 | (d) | | | 0.99 | (d) | | | 6 | |
Year ended 04/30/16 | | | 21.28 | | | | 0.25 | | | | 1.80 | | | | 2.05 | | | | (0.26 | ) | | | (0.47 | ) | | | (0.73 | ) | | | 22.60 | | | | 9.94 | | | | 154,584 | | | | 1.88 | | | | 1.92 | | | | 1.16 | | | | 9 | |
Year ended 04/30/15 | | | 20.11 | | | | 0.26 | | | | 1.39 | | | | 1.65 | | | | (0.27 | ) | | | (0.21 | ) | | | (0.48 | ) | | | 21.28 | | | | 8.29 | | | | 61,818 | | | | 1.87 | | | | 1.97 | | | | 1.24 | | | | 4 | |
Year ended 04/30/14 | | | 18.24 | | | | 0.27 | | | | 2.17 | | | | 2.44 | | | | (0.34 | ) | | | (0.23 | ) | | | (0.57 | ) | | | 20.11 | | | | 13.71 | | | | 42,150 | | | | 1.84 | | | | 2.04 | | | | 1.47 | | | | 4 | |
Year ended 04/30/13 | | | 17.11 | | | | 0.37 | | | | 2.24 | | | | 2.61 | | | | (0.38 | ) | | | (1.10 | ) | | | (1.48 | ) | | | 18.24 | | | | 15.99 | | | | 27,793 | | | | 2.01 | | | | 2.09 | | | | 2.12 | | | | 66 | |
Class Y | |
Year ended 04/30/17 | | | 22.53 | | | | 0.47 | | | | 1.82 | | | | 2.29 | | | | (0.47 | ) | | | (0.16 | ) | | | (0.63 | ) | | | 24.19 | | | | 10.28 | | | | 860,105 | | | | 0.78 | (d) | | | 0.80 | (d) | | | 1.99 | (d) | | | 6 | |
Year ended 04/30/16 | | | 21.22 | | | | 0.47 | | | | 1.78 | | | | 2.25 | | | | (0.47 | ) | | | (0.47 | ) | | | (0.94 | ) | | | 22.53 | | | | 11.01 | | | | 249,625 | | | | 0.88 | | | | 0.92 | | | | 2.16 | | | | 9 | |
Year ended 04/30/15 | | | 20.06 | | | | 0.47 | | | | 1.37 | | | | 1.84 | | | | (0.47 | ) | | | (0.21 | ) | | | (0.68 | ) | | | 21.22 | | | | 9.34 | | | | 53,878 | | | | 0.87 | | | | 0.97 | | | | 2.24 | | | | 4 | |
Year ended 04/30/14 | | | 18.18 | | | | 0.46 | | | | 2.17 | | | | 2.63 | | | | (0.52 | ) | | | (0.23 | ) | | | (0.75 | ) | | | 20.06 | | | | 14.95 | | | | 22,690 | | | | 0.84 | | | | 1.04 | | | | 2.47 | | | | 4 | |
Year ended 04/30/13 | | | 17.07 | | | | 0.54 | | | | 2.24 | | | | 2.78 | | | | (0.57 | ) | | | (1.10 | ) | | | (1.67 | ) | | | 18.18 | | | | 17.16 | | | | 5,146 | | | | 1.01 | | | | 1.09 | | | | 3.12 | | | | 66 | |
Investor Class | | | | | | | | | | | | | | | | | | | | | | | | | | | | | | | | | | | | | | | | | | | | | | | | | | | | | | | | |
Year ended 04/30/17 | | | 22.52 | | | | 0.41 | | | | 1.82 | | | | 2.23 | | | | (0.41 | ) | | | (0.16 | ) | | | (0.57 | ) | | | 24.18 | | | | 10.01 | | | | 97,228 | | | | 1.03 | (d) | | | 1.05 | (d) | | | 1.74 | (d) | | | 6 | |
Year ended 04/30/16 | | | 21.22 | | | | 0.41 | | | | 1.78 | | | | 2.19 | | | | (0.42 | ) | | | (0.47 | ) | | | (0.89 | ) | | | 22.52 | | | | 10.69 | | | | 88,691 | | | | 1.13 | | | | 1.17 | | | | 1.91 | | | | 9 | |
Year ended 04/30/15 | | | 20.05 | | | | 0.41 | | | | 1.39 | | | | 1.80 | | | | (0.42 | ) | | | (0.21 | ) | | | (0.63 | ) | | | 21.22 | | | | 9.11 | | | | 74,957 | | | | 1.12 | | | | 1.22 | | | | 1.99 | | | | 4 | |
Year ended 04/30/14 | | | 18.18 | | | | 0.41 | | | | 2.17 | | | | 2.58 | | | | (0.48 | ) | | | (0.23 | ) | | | (0.71 | ) | | | 20.05 | | | | 14.61 | | | | 70,853 | | | | 1.09 | | | | 1.29 | | | | 2.22 | | | | 4 | |
Year ended 04/30/13 | | | 17.07 | | | | 0.50 | | | | 2.23 | | | | 2.73 | | | | (0.52 | ) | | | (1.10 | ) | | | (1.62 | ) | | | 18.18 | | | | 16.84 | | | | 67,130 | | | | 1.26 | | | | 1.34 | | | | 2.87 | | | | 66 | |
Class R5 | |
Year ended 04/30/17 | | | 22.32 | | | | 0.48 | | | | 1.81 | | | | 2.29 | | | | (0.48 | ) | | | (0.16 | ) | | | (0.64 | ) | | | 23.97 | | | | 10.38 | | | | 2,376 | | | | 0.72 | (d) | | | 0.74 | (d) | | | 2.05 | (d) | | | 6 | |
Year ended 04/30/16 | | | 21.04 | | | | 0.47 | | | | 1.75 | | | | 2.22 | | | | (0.47 | ) | | | (0.47 | ) | | | (0.94 | ) | | | 22.32 | | | | 10.98 | | | | 551 | | | | 0.84 | | | | 0.85 | | | | 2.20 | | | | 9 | |
Year ended 04/30/15 | | | 19.88 | | | | 0.46 | | | | 1.39 | | | | 1.85 | | | | (0.48 | ) | | | (0.21 | ) | | | (0.69 | ) | | | 21.04 | | | | 9.44 | | | | 21 | | | | 0.82 | | | | 0.83 | | | | 2.29 | | | | 4 | |
Year ended 04/30/14 | | | 18.03 | | | | 0.45 | | | | 2.15 | | | | 2.60 | | | | (0.52 | ) | | | (0.23 | ) | | | (0.75 | ) | | | 19.88 | | | | 14.87 | | | | 671 | | | | 0.84 | | | | 0.87 | | | | 2.47 | | | | 4 | |
Year ended 04/30/13 | | | 16.94 | | | | 0.56 | | | | 2.22 | | | | 2.78 | | | | (0.59 | ) | | | (1.10 | ) | | | (1.69 | ) | | | 18.03 | | | | 17.32 | | | | 680 | | | | 0.87 | | | | 0.88 | | | | 3.26 | | | | 66 | |
Class R6 | |
Year ended 04/30/17 | | | 22.34 | | | | 0.50 | | | | 1.80 | | | | 2.30 | | | | (0.50 | ) | | | (0.16 | ) | | | (0.66 | ) | | | 23.98 | | | | 10.42 | | | | 83,352 | | | | 0.64 | (d) | | | 0.66 | (d) | | | 2.13 | (d) | | | 6 | |
Year ended 04/30/16 | | | 21.05 | | | | 0.49 | | | | 1.77 | | | | 2.26 | | | | (0.50 | ) | | | (0.47 | ) | | | (0.97 | ) | | | 22.34 | | | | 11.13 | | | | 63,000 | | | | 0.74 | | | | 0.75 | | | | 2.30 | | | | 9 | |
Year ended 04/30/15 | | | 19.89 | | | | 0.48 | | | | 1.38 | | | | 1.86 | | | | (0.49 | ) | | | (0.21 | ) | | | (0.70 | ) | | | 21.05 | | | | 9.49 | | | | 51,080 | | | | 0.78 | | | | 0.79 | | | | 2.33 | | | | 4 | |
Year ended 04/30/14 | | | 18.04 | | | | 0.46 | | | | 2.15 | | | | 2.61 | | | | (0.53 | ) | | | (0.23 | ) | | | (0.76 | ) | | | 19.89 | | | | 14.89 | | | | 33,762 | | | | 0.82 | | | | 0.83 | | | | 2.49 | | | | 4 | |
Year ended 04/30/13(e) | | | 17.55 | | | | 0.34 | | | | 1.58 | | | | 1.92 | | | | (0.33 | ) | | | (1.10 | ) | | | (1.43 | ) | | | 18.04 | | | | 11.58 | | | | 21,141 | | | | 0.89 | (f) | | | 0.89 | (f) | | | 3.24 | (f) | | | 66 | |
| (a) | Calculated using average shares outstanding. |
| (b) | Includes adjustments in accordance with accounting principles generally accepted in the United States of America and as such, the net asset value for financial reporting purposes and the returns based upon those net asset values may differ from the net asset value and returns for shareholder transactions. Does not include sales charges and is not annualized for periods less than one year, if applicable. |
| (c) | Portfolio turnover is calculated at the fund level and is not annualized for periods less than one year, if applicable. |
| (d) | Ratios are based on average daily net assets (000’s omitted) of $1,184,248, $5,778, $262,003, $569,076, $96,591, $1,557 and $79,488 for Class A, Class B, Class C, Class Y, Investor Class, Class R5 and Class R6 shares, respectively. |
| (e) | Commencement date of September 24, 2012. |
21 Invesco Dividend Income Fund
Report of Independent Registered Public Accounting Firm
To the Board of Trustees of AIM Sector Funds (Invesco Sector Funds)
and Shareholders of the Invesco Dividend Income Fund:
In our opinion, the accompanying statement of assets and liabilities, including the schedule of investments, and the related statements of operations and of changes in net assets and the financial highlights present fairly, in all material respects, the financial position of the Invesco Dividend Income Fund (one of the portfolios constituting the AIM Sector Funds (Invesco Sector Funds), hereafter referred to as the “Fund”) as of April 30, 2017, the results of its operations for the year then ended, the changes in its net assets for each of the two years in the period then ended and the financial highlights for each of the five years in the period then ended, in conformity with accounting principles generally accepted in the United States of America. These financial statements and financial highlights (hereafter referred to as “financial statements”) are the responsibility of the Fund’s management. Our responsibility is to express an opinion on these financial statements based on our audits. We conducted our audits of these financial statements in accordance with the standards of the Public Company Accounting Oversight Board (United States). Those standards require that we plan and perform the audit to obtain reasonable assurance about whether the financial statements are free of material misstatement. An audit includes examining, on a test basis, evidence supporting the amounts and disclosures in the financial statements, assessing the accounting principles used and significant estimates made by management, and evaluating the overall financial statement presentation. We believe that our audits, which included confirmation of securities as of April 30, 2017 by correspondence with the custodian and brokers, provide a reasonable basis for our opinion.
PricewaterhouseCoopers LLP
Houston, TX
June 23, 2017
22 Invesco Dividend Income Fund
Calculating your ongoing Fund expenses
Example
As a shareholder of the Fund, you incur two types of costs: (1) transaction costs, which may include sales charges (loads) on purchase payments or contingent deferred sales charges on redemptions, if any; and (2) ongoing costs, including management fees, distribution and/or service (12b-1) fees, and other Fund expenses. This example is intended to help you understand your ongoing costs (in dollars) of investing in the Fund and to compare these costs with ongoing costs of investing in other mutual funds. The example is based on an investment of $1,000 invested at the beginning of the period and held for the entire period November 1, 2016 through April 30, 2017.
Actual expenses
The table below provides information about actual account values and actual expenses. You may use the information in this table, together with the amount you invested, to estimate the expenses that you paid over the period. Simply divide your account value by $1,000 (for example, an $8,600 account value divided by $1,000 = 8.6), then multiply the result by the number in the table under the heading entitled “Actual Expenses Paid During Period” to estimate the expenses you paid on your account during this period.
Hypothetical example for comparison purposes
The table below also provides information about hypothetical account values and hypothetical expenses based on the Fund’s actual expense ratio and an assumed rate of return of 5% per year before expenses, which is not the Fund’s actual return.
The hypothetical account values and expenses may not be used to estimate the actual ending account balance or expenses you paid for the period. You may use this information to compare the ongoing costs of investing in the Fund and other funds. To do so, compare this 5% hypothetical example with the 5% hypothetical examples that appear in the shareholder reports of the other funds.
Please note that the expenses shown in the table are meant to highlight your ongoing costs only and do not reflect any transaction costs, such as sales charges (loads) on purchase payments or contingent deferred sales charges on redemptions, if any. Therefore, the hypothetical information is useful in comparing ongoing costs only, and will not help you determine the relative total costs of owning different funds. In addition, if these transaction costs were included, your costs would have been higher.
| | | | | | | | | | | | | | | | | | | | | | | | |
| Class | | Beginning
Account Value
(11/01/16) | | | ACTUAL | | | HYPOTHETICAL (5% annual return before expenses) | | | Annualized
Expense
Ratio | |
| | | Ending
Account Value
(04/30/17)1 | | | Expenses
Paid During
Period2 | | | Ending
Account Value
(04/30/17) | | | Expenses
Paid During
Period2 | | |
| A | | $ | 1,000.00 | | | $ | 1,086.70 | | | $ | 5.38 | | | $ | 1,019.64 | | | $ | 5.21 | | | | 1.04 | % |
| B | | | 1,000.00 | | | | 1,082.90 | | | | 9.24 | | | | 1,015.92 | | | | 8.95 | | | | 1.79 | |
| C | | | 1,000.00 | | | | 1,083.10 | | | | 9.25 | | | | 1,015.92 | | | | 8.95 | | | | 1.79 | |
| Y | | | 1,000.00 | | | | 1,088.20 | | | | 4.09 | | | | 1,020.88 | | | | 3.96 | | | | 0.79 | |
| Investor | | | 1,000.00 | | | | 1,086.90 | | | | 5.38 | | | | 1,019.64 | | | | 5.21 | | | | 1.04 | |
| R5 | | | 1,000.00 | | | | 1,088.90 | | | | 3.73 | | | | 1,021.22 | | | | 3.61 | | | | 0.72 | |
| R6 | | | 1,000.00 | | | | 1,089.30 | | | | 3.32 | | | | 1,021.62 | | | | 3.21 | | | | 0.64 | |
| 1 | The actual ending account value is based on the actual total return of the Fund for the period November 1, 2016 through April 30, 2017, after actual expenses and will differ from the hypothetical ending account value which is based on the Fund’s expense ratio and a hypothetical annual return of 5% before expenses. |
| 2 | Expenses are equal to the Fund’s annualized expense ratio as indicated above multiplied by the average account value over the period, multiplied by 181/365 to reflect the most recent fiscal half year. |
23 Invesco Dividend Income Fund
Tax Information
Form 1099-DIV, Form 1042-S and other year-end tax information provide shareholders with actual calendar year amounts that should be included in their tax returns. Shareholders should consult their tax advisors.
The following distribution information is being provided as required by the Internal Revenue Code or to meet a specific state’s requirement.
The Fund designates the following amounts or, if subsequently determined to be different, the maximum amount allowable for its fiscal year ended April 30, 2017:
| | | | |
Federal and State Income Tax | |
Long-Term Capital Gain Distributions | | $ | 15,339,958 | |
Qualified Dividend Income* | | | 100 | % |
Corporate Dividends Received Deduction* | | | 100 | % |
U.S. Treasury Obligations* | | | 0 | % |
| | * | The above percentages are based on ordinary income dividends paid to shareholders during the Fund’s fiscal year. |
| | | | |
Non-Resident Alien Shareholders | |
Qualified Short-Term Gains | | $ | 743,337 | |
24 Invesco Dividend Income Fund
Proxy Results
A Special Joint Meeting (“Meeting”) of Shareholders of Invesco Dividend Income Fund, an investment portfolio of AIM Sector Funds (Invesco Sector Funds), a Delaware statutory trust (“Trust”), was held on March 9, 2017. The Meeting was held for the following purpose:
| (1) | Elect 15 trustees to the Board, each of whom will serve until his or her successor is elected and qualified. |
| (2) | Approve an amendment to the Trust’s Agreement and Declaration of Trust that would permit fund mergers and other significant transactions upon the Board’s approval but without shareholder approval of such transactions. |
The results of the voting on the above matters were as follows:
| | | | | | | | | | | | | | | | | | |
| | | Matters | | | | | | | | Votes For | | | Votes Withheld | |
| (1)* | | David C. Arch | | | | 478,210,140 | | | | 13,802,825 | |
| | James T. Bunch | | | | 477,776,614 | | | | 14,236,351 | |
| | Bruce L. Crockett | | | | 477,904,863 | | | | 14,108,102 | |
| | Jack M. Fields | | | | 478,154,120 | | | | 13,858,845 | |
| | Martin L. Flanagan | | | | 478,366,284 | | | | 13,646,681 | |
| | Cynthia Hostetler | | | | 478,149,043 | | | | 13,863,922 | |
| | Dr. Eli Jones | | | | 478,281,396 | | | | 13,731,569 | |
| | Dr. Prema Mathai-Davis | | | | 477,927,603 | | | | 14,085,362 | |
| | Teresa M. Ressel | | | | 478,116,999 | | | | 13,895,966 | |
| | Dr. Larry Soll | | | | 477,671,696 | | | | 14,341,269 | |
| | Ann Barnett Stern | | | | 478,390,538 | | | | 13,622,427 | |
| | Raymond Stickel, Jr. | | | | 477,934,336 | | | | 14,078,629 | |
| | Philip A. Taylor | | | | 478,104,174 | | | | 13,908,791 | |
| | Robert C. Troccoli | | | | 478,368,464 | | | | 13,644,501 | |
| | Christopher L. Wilson | | | | 478,433,867 | | | | 13,579,098 | |
| | | | | |
| | | | | | | | | | | | | | | | | | |
| | | | | Votes For | | | Votes
Against | | | Votes
Abstain | | | Broker
Non-Votes | |
| (2)* | | Approve an amendment to the Trust’s Agreement and Declaration of Trust that would permit fund mergers and other significant transactions upon the Board’s approval but without shareholder approval of such transactions | | | 261,575,830 | | | | 26,621,916 | | | | 13,166,011 | | | | 190,648,808 | |
The Meeting was adjourned until April 11, 2017, with respect to the following proposals:
| (3) | Approve changing the fundamental investment restriction regarding the purchase or sale of physical commodities. |
| 4(a) | Approve an amendment to the current Master Intergroup Sub-Advisory Contract to add Invesco PowerShares Capital Management LLC. |
| 4(b) | Approve an amendment to the current Master Intergroup Sub-Advisory Contract to add Invesco Asset Management (India) Private Limited. |
Invesco Dividend Income Fund did not receive sufficient shareholder votes to pass Proposals 3 and 4(a) - (b).
The results of the voting on the above matters were as follows:
| | | | | | | | | | | | | | | | | | |
| | | Matters | | Votes For | | | Votes
Against | | | Votes
Abstain | | | Broker
Non-Votes | |
| (3) | | Approve changing the fundamental investment restriction regarding the purchase or sale of physical commodities | | | 37,203,115 | | | | 3,310,138 | | | | 2,125,257 | | | | 17,703,904 | |
| 4(a) | | Approve an amendment to the current Master Intergroup Sub-Advisory Contract to add Invesco PowerShares Capital Management LLC | | | 38,706,707 | | | | 1,799,941 | | | | 2,131,904 | | | | 17,703,862 | |
| 4(b) | | Approve an amendment to the current Master Intergroup Sub-Advisory Contract to add Invesco Asset Management (India) Private Limited | | | 38,058,487 | | | | 2,352,580 | | | | 2,227,464 | | | | 17,703,883 | |
| * | Each of proposal 1 and 2 required approval by a combined vote of all of the portfolios of AIM Sector Funds (Invesco Sector Funds). |
25 Invesco Dividend Income Fund
Trustees and Officers
The address of each trustee and officer is AIM Sector Funds (Invesco Sector Funds) (the “Trust”), 11 Greenway Plaza, Suite 1000, Houston, Texas 77046-1173. The trustees serve for the life of the Trust, subject to their earlier death, incapacitation, resignation, retirement or removal as more specifically provided in the Trust’s organizational documents. Each officer serves for a one year term or until their successors are elected and qualified. Column two below includes length of time served with predecessor entities, if any.
| | | | | | | | |
Name, Year of Birth and
Position(s) Held with the Trust | | Trustee and/
or Officer Since | | Principal Occupation(s)
During Past 5 Years | | Number of
Funds in Fund
Complex
Overseen by
Trustee | | Other Directorship(s)
Held by Trustee During
Past 5 Years |
| Interested Persons | | | | | | | | |
| Martin L. Flanagan1 — 1960 Trustee | | 2007 | | Executive Director, Chief Executive Officer and President, Invesco Ltd. (ultimate parent of Invesco and a global investment management firm); Trustee, The Invesco Funds; Vice Chair, Investment Company Institute; and Member of Executive Board, SMU Cox School of Business Formerly: Advisor to the Board, Invesco Advisers, Inc. (formerly known as Invesco Institutional (N.A.), Inc.); Chairman and Chief Executive Officer, Invesco Advisers, Inc. (registered investment adviser); Director, Chairman, Chief Executive Officer and President, Invesco Holding Company (US), Inc. (formerly IVZ Inc.) (holding company), Invesco Group Services, Inc. (service provider) and Invesco North American Holdings, Inc. (holding company); Director, Chief Executive Officer and President, Invesco Holding Company Limited (parent of Invesco and a global investment management firm); Director, Invesco Ltd.; Chairman, Investment Company Institute and President, Co-Chief Executive Officer, Co-President, Chief Operating Officer and Chief Financial Officer, Franklin Resources, Inc. (global investment management organization) | | 144 | | None |
Philip A. Taylor2 — 1954 Trustee and Senior Vice President | | 2006 | | Head of the Americas and Senior Managing Director, Invesco Ltd.; Director, Invesco Advisers, Inc. (formerly known as Invesco Institutional (N.A.), Inc.) (registered investment adviser); Director, Chairman, Chief Executive Officer and President, Invesco Management Group, Inc. (formerly known as Invesco Aim Management Group, Inc.) (financial services holding company); Director and Chairman, Invesco Investment Services, Inc. (formerly known as Invesco Aim Investment Services, Inc.) (registered transfer agent) Chief Executive Officer, Invesco Corporate Class Inc. (corporate mutual fund company) Director, Chairman and Chief Executive Officer, Invesco Canada Ltd. (formerly known as Invesco Trimark Ltd./Invesco Trimark Ltèe) (registered investment adviser and registered transfer agent); Trustee and Senior Vice President, The Invesco Funds; Director, Invesco Investment Advisers LLC (formerly known as Van Kampen Asset Management). Formerly: Co-Chairman, Co-President and Co-Chief Executive Officer, Invesco Advisers, Inc. (formerly known as Invesco Institutional (N.A.), Inc.) (registered investment adviser); Director, Chief Executive Officer and President, Van Kampen Exchange Corp; President and Principal Executive Officer, The Invesco Funds (other than AIM Treasurer’s Series Trust (Invesco Treasurer’s Series Trust), Short-Term Investments Trust and Invesco Management Trust); Executive Vice President, The Invesco Funds (AIM Treasurer’s Series Trust (Invesco Treasurer’s Series Trust), Short-Term Investments Trust and Invesco Management Trust only); Director and President, INVESCO Funds Group, Inc. (registered investment adviser and registered transfer agent); Director and Chairman, IVZ Distributors, Inc. (formerly known as INVESCO Distributors, Inc.) (registered broker dealer); Director, President and Chairman, Invesco Inc. (holding company), Invesco Canada Holdings Inc. (holding company), Trimark Investments Ltd./Placements Trimark Ltèe and Invesco Financial Services Ltd/Services Financiers Invesco Ltèe; Chief Executive Officer, Invesco Canada Fund Inc. (corporate mutual fund company); Director and Chairman, Van Kampen Investor Services Inc.; Director, Chief Executive Officer and President, 1371 Preferred Inc. (holding company) and Van Kampen Investments Inc.; Director and President, AIM GP Canada Inc. (general partner for limited partnerships) and Van Kampen Advisors, Inc.; Director and Chief Executive Officer, Invesco Trimark Dealer Inc. (registered broker dealer); Director, Invesco Distributors, Inc. (formerly known as Invesco Aim Distributors, Inc.) (registered broker dealer); Manager, Invesco PowerShares Capital Management LLC; Director, Chief Executive Officer and President, Invesco Advisers, Inc.; Director, Chairman, Chief Executive Officer and President, Invesco Aim Capital Management, Inc.; President, Invesco Trimark Dealer Inc. and Invesco Trimark Ltd./Invesco Trimark Ltèe; Director and President, AIM Trimark Corporate Class Inc. and AIM Trimark Canada Fund Inc.; Senior Managing Director, Invesco Holding Company Limited; Director and Chairman, Fund Management Company (former registered broker dealer); President and Principal Executive Officer, The Invesco Funds (AIM Treasurer’s Series Trust (Invesco Treasurer’s Series Trust), and Short-Term Investments Trust only); President, AIM Trimark Global Fund Inc. and AIM Trimark Canada Fund Inc. | | 144 | | None |
| 1 | Mr. Flanagan is considered an interested person (within the meaning of Section 2(a)(19) of the 1940 Act) of the Trust because he is an officer of the Adviser to the Trust, and an officer and a director of Invesco Ltd., ultimate parent of the Adviser. |
| 2 | Mr. Taylor is considered an interested person (within the meaning of Section 2(a)(19) of the 1940 Act) of the Trust because he is an officer and a director of the Adviser. |
T-1 Invesco Dividend Income Fund
Trustees and Officers—(continued)
| | | | | | | | |
Name, Year of Birth and
Position(s) Held with the Trust | | Trustee and/
or Officer Since | | Principal Occupation(s)
During Past 5 Years | | Number of
Funds in Fund
Complex
Overseen by
Trustee | | Other Directorship(s)
Held by Trustee During
Past 5 Years |
| Independent Trustees | | | | | | | | |
Bruce L. Crockett — 1944 Trustee and Chair | | 2003 | | Chairman, Crockett Technologies Associates (technology consulting company) Formerly: Director, Captaris (unified messaging provider); Director, President and Chief Executive Officer, COMSAT Corporation; Chairman, Board of Governors of INTELSAT (international communications company); ACE Limited (insurance company); Independent Directors Council and Investment Company Institute: Member of the Audit Committee, Investment Company Institute; Member of the Executive Committee and Chair of the Governance Committee, Independent Directors Council | | 144 | | Director and Chairman of the Audit Committee, ALPS (Attorneys Liability Protection Society) (insurance company); Director and Member of the Audit Committee, Ferroglobe PLC (metallurgical company) |
David C. Arch — 1945 Trustee | | 2010 | | Chairman of Blistex Inc. (consumer health care products manufacturer); Member, World Presidents’ Organization | | 144 | | Board member of the Illinois Manufacturers’ Association |
James T. Bunch — 1942 Trustee | | 2000 | | Managing Member, Grumman Hill Group LLC (family office/private equity investments) Formerly: Chairman of the Board, Denver Film Society; Chairman of the Board of Trustees, Evans Scholarship Foundation; Chairman, Board of Governors, Western Golf Association | | 144 | | Trustee, Evans Scholarship Foundation |
Jack M. Fields — 1952 Trustee | | 2003 | | Chief Executive Officer, Twenty First Century Group, Inc. (government affairs company); and Discovery Learning Alliance (non-profit) Formerly: Owner and Chief Executive Officer, Dos Angeles Ranch L.P. (cattle, hunting, corporate entertainment); Director, Insperity, Inc. (formerly known as Administaff); Chief Executive Officer, Texana Timber LP (sustainable forestry company); Director of Cross Timbers Quail Research Ranch (non-profit); and member of the U.S. House of Representatives | | 144 | | None |
Cynthia Hostetler — 1962 Trustee | | 2017 | | Non-Executive Director and Trustee of a number of public and private business corporations Formerly: Head of Investment Funds and Private Equity, Overseas Private Investment Corporation; President, First Manhattan Bancorporation, Inc.; Attorney, Simpson Thacher & Bartlett LLP | | 144 | | Vulcan Materials Company (construction materials company); Trilinc Global Impact Fund; Aberdeen Investment Funds (4 portfolios); Artio Global Investment LLC (mutual fund complex); Edgen Group, Inc. (specialized energy and infrastructure products distributor) |
Eli Jones — 1961 Trustee | | 2016 | | Professor and Dean, Mays Business School—Texas A&M University Formerly: Professor and Dean, Walton College of Business, University of Arkansas and E.J. Ourso College of Business, Louisiana State University; Director, Arvest Bank | | 144 | | Insperity, Inc. (formerly known as Administaff) (human resources provider) |
Prema Mathai-Davis — 1950 Trustee | | 2003 | | Retired. Formerly: Chief Executive Officer, YWCA of the U.S.A. | | 144 | | None |
Teresa M. Ressel — 1962 Trustee | | 2017 | | Non-Executive Director and Trustee of a number of public and private business corporations Formerly: Chief Financial Officer, Olayan America, The Olayan Group (international investor/commercial/industrial); Chief Executive Officer, UBS Securities LLC; Group Chief Operating Officer, Americas, UBS AG; Assistant Secretary for Management & Budget and CFO, US Department of the Treasury; Chief Compliance Officer, Kaiser Permanente; Program Manager, Hewlett-Packard; Nuclear Engineering, General Dynamics Corporation | | 144 | | Atlantic Power Corporation (power generation company); ON Semiconductor Corp. (semiconductor supplier) |
Larry Soll — 1942 Trustee | | 1997 | | Retired. Formerly: Chairman, Chief Executive Officer and President, Synergen Corp. (a biotechnology company) | | 144 | | None |
Ann Barnett Stern — 1957 Trustee | | 2017 | | President and Chief Executive Officer, Houston Endowment Inc. (private philanthropic institution) Formerly: Executive Vice President and General Counsel, Texas Children’s Hospital; Attorney, Beck, Redden and Secrest, LLP; Business Law Instructor, University of St. Thomas; Attorney, Andrews & Kurth LLP | | 144 | | Federal Reserve Bank of Dallas |
Raymond Stickel, Jr. — 1944 Trustee | | 2005 | | Retired. Formerly: Director, Mainstay VP Series Funds, Inc. (25 portfolios); Partner, Deloitte & Touche | | 144 | | None |
Robert C. Troccoli — 1949 Trustee | | 2016 | | Adjunct Professor, University of Denver – Daniels College of Business Formerly: Senior Partner, KPMG LLP | | 144 | | None |
Christopher L. Wilson — 1957 Trustee | | 2017 | | Managing Partner, CT2, LLC (investing and consulting firm) Formerly: President/Chief Executive Officer, Columbia Funds, Bank of America Corporation; President/Chief Executive Officer, CDC IXIS Asset Management Services, Inc.; Principal & Director of Operations, Scudder Funds, Scudder, Stevens & Clark, Inc.; Assistant Vice President, Fidelity Investments | | 144 | | TD Asset Management USA Inc. (mutual fund complex) (22 portfolios); ISO New England, Inc. (non-profit organization managing regional electricity market) |
T-2 Invesco Dividend Income Fund
Trustees and Officers—(continued)
| | | | | | | | |
Name, Year of Birth and
Position(s) Held with the Trust | | Trustee and/
or Officer Since | | Principal Occupation(s)
During Past 5 Years | | Number of
Funds in Fund
Complex
Overseen by
Trustee | | Other Directorship(s)
Held by Trustee During
Past 5 Years |
| Other Officers | | | | | | | | |
Sheri Morris — 1964 President, Principal Executive Officer and Treasurer | | 2003 | | President, Principal Executive Officer and Treasurer, The Invesco Funds; Vice President, Invesco Advisers, Inc. (formerly known as Invesco Institutional (N.A.), Inc.) (registered investment adviser); and Vice President, PowerShares Exchange-Traded Fund Trust, PowerShares Exchange-Traded Fund Trust II, PowerShares India Exchange-Traded Fund Trust, PowerShares Actively Managed Exchange-Traded Fund Trust and PowerShares Actively Managed Exchange-Traded Commodity Fund Trust Formerly: Vice President and Principal Financial Officer, The Invesco Funds; Vice President, Invesco Aim Advisers, Inc., Invesco Aim Capital Management, Inc. and Invesco Aim Private Asset Management, Inc.; Assistant Vice President and Assistant Treasurer, The Invesco Funds and Assistant Vice President, Invesco Advisers, Inc., Invesco Aim Capital Management, Inc. and Invesco Aim Private Asset Management, Inc.; and Treasurer, PowerShares Exchange-Traded Fund Trust, PowerShares Exchange-Traded Fund Trust II, PowerShares India Exchange-Traded Fund Trust and PowerShares Actively Managed Exchange-Traded Fund Trust | | N/A | | N/A |
Russell C. Burk — 1958 Senior Vice President and Senior Officer | | 2005 | | Senior Vice President and Senior Officer, The Invesco Funds | | N/A | | N/A |
John M. Zerr — 1962 Senior Vice President, Chief Legal Officer and Secretary | | 2006 | | Director, Senior Vice President, Secretary and General Counsel, Invesco Management Group, Inc. (formerly known as Invesco AIM Management Group, Inc.); Senior Vice President, Invesco Advisers, Inc. (formerly known as Invesco Institutional (N.A.), Inc.) (registered investment adviser); Senior Vice President and Secretary, Invesco Distributors, Inc. (formerly known as Invesco AIM Distributors, Inc.); Director, Vice President and Secretary, Invesco Investment Services, Inc. (formerly known as Invesco AIM Investment Services, Inc.) Senior Vice President, Chief Legal Officer and Secretary, The Invesco Funds; Managing Director, Invesco PowerShares Capital Management LLC; Director, Secretary and General Counsel, Invesco Investment Advisers LLC (formerly known as Van Kampen Asset Management); Secretary and General Counsel, Invesco Capital Markets, Inc. (formerly known as Van Kampen Funds Inc.) and Chief Legal Officer, PowerShares Exchange-Traded Fund Trust, PowerShares Exchange-Traded Fund Trust II, PowerShares India Exchange-Traded Fund Trust, PowerShares Actively Managed Exchange-Traded Fund Trust and PowerShares Actively Managed Exchange-Traded Commodity Fund Trust; Manager and Secretary, Invesco Indexing LLC Formerly: Director, Secretary, General Counsel and Senior Vice President, Van Kampen Exchange Corp.; Director, Vice President and Secretary, IVZ Distributors, Inc. (formerly known as INVESCO Distributors, Inc.); Director and Vice President, INVESCO Funds Group, Inc.; Director and Vice President, Van Kampen Advisors Inc.; Director, Vice President, Secretary and General Counsel, Van Kampen Investor Services Inc.; Director, Invesco Distributors, Inc. (formerly known as Invesco AIM Distributors, Inc.); Director, Senior Vice President, General Counsel and Secretary, Invesco AIM Advisers, Inc. and Van Kampen Investments Inc.; Director, Vice President and Secretary, Fund Management Company; Director, Senior Vice President, Secretary, General Counsel and Vice President, Invesco AIM Capital Management, Inc.; Chief Operating Officer and General Counsel, Liberty Ridge Capital, Inc. (an investment adviser); Vice President and Secretary, PBHG Funds (an investment company) and PBHG Insurance Series Fund (an investment company); Chief Operating Officer, General Counsel and Secretary, Old Mutual Investment Partners (a broker-dealer); General Counsel and Secretary, Old Mutual Fund Services (an administrator) and Old Mutual Shareholder Services (a shareholder servicing center); Executive Vice President, General Counsel and Secretary, Old Mutual Capital, Inc. (an investment adviser); and Vice President and Secretary, Old Mutual Advisors Funds (an investment company) | | N/A | | N/A |
Gregory G. McGreevey — 1962 Senior Vice President | | 2012 | | Senior Managing Director, Invesco Ltd.; Director, Chairman, President, and Chief Executive Officer, Invesco Advisers, Inc. (formerly known as Invesco Institutional (N.A.), Inc.) (registered investment adviser); Director, Invesco Mortgage Capital, Inc. and Invesco Senior Secured Management, Inc.; and Senior Vice President, The Invesco Funds Formerly: Assistant Vice President, The Invesco Funds | | N/A | | N/A |
Kelli Gallegos — 1970 Vice President, Principal Financial Officer and Assistant Treasurer | | 2008 | | Vice President, Principal Financial Officer and Assistant Treasurer, The Invesco Funds; Assistant Treasurer, Invesco PowerShares Capital Management LLC, PowerShares Exchange-Traded Fund Trust, PowerShares Exchange-Traded Fund Trust II, PowerShares India Exchange-Traded Fund Trust, PowerShares Actively Managed Exchange-Traded Fund Trust and PowerShares Actively Managed Exchange-Traded Commodity Fund Trust Formerly: Assistant Vice President, The Invesco Funds | | N/A | | N/A |
T-3 Invesco Dividend Income Fund
Trustees and Officers—(continued)
| | | | | | | | |
Name, Year of Birth and
Position(s) Held with the Trust | | Trustee and/
or Officer Since | | Principal Occupation(s)
During Past 5 Years | | Number of
Funds in Fund
Complex
Overseen by
Trustee | | Other Directorship(s)
Held by Trustee During
Past 5 Years |
| Other Officers—(continued) | | | | | | | | |
Tracy Sullivan — 1962 Vice President, Chief Tax Officer and Assistant Treasurer | | 2008 | | Vice President, Chief Tax Officer and Assistant Treasurer, The Invesco Funds; Assistant Treasurer, Invesco PowerShares Capital Management LLC, PowerShares Exchange-Traded Fund Trust, PowerShares Exchange-Traded Fund Trust II, PowerShares India Exchange-Traded Fund Trust, PowerShares Actively Managed Exchange-Traded Fund Trust and PowerShares Actively Managed Exchange-Traded Commodity Fund Trust Formerly: Assistant Vice President, The Invesco Funds | | N/A | | N/A |
Crissie M. Wisdom — 1969 Anti-Money Laundering Compliance Officer | | 2013 | | Anti-Money Laundering Compliance Officer, Invesco Advisers, Inc. (formerly known as Invesco Institutional (N.A.), Inc.) (registered investment adviser), Invesco Capital Markets, Inc. (formerly known as Van Kampen Funds Inc.), Invesco Distributors, Inc., Invesco Investment Services, Inc., Invesco Management Group, Inc., The Invesco Funds, and PowerShares Exchange-Traded Fund Trust, PowerShares Exchange-Traded Fund Trust II, PowerShares India Exchange-Traded Fund Trust, PowerShares Actively Managed Exchange-Traded Fund Trust and PowerShares Actively Managed Exchange-Traded Commodity Fund Trust; Anti-Money Laundering Compliance Officer and Bank Secrecy Act Officer, INVESCO National Trust Company and Invesco Trust Company; and Fraud Prevention Manager and Controls and Risk Analysis Manager for Invesco Investment Services, Inc. Formerly: Anti-Money Laundering Compliance Officer, Van Kampen Exchange Corp. | | N/A | | N/A |
Robert R. Leveille — 1969 Chief Compliance Officer | | 2016 | | Chief Compliance Officer, Invesco Advisers, Inc. (registered investment adviser); and Chief Compliance Officer, The Invesco Funds Formerly: Chief Compliance Officer, Putnam Investments and the Putnam Funds | | N/A | | N/A |
The Statement of Additional Information of the Trust includes additional information about the Fund’s Trustees and is available upon request, without charge, by calling 1.800.959.4246. Please refer to the Fund’s Statement of Additional Information for information on the Fund’s sub-advisers.
| | | | | | | | | | |
Office of the Fund 11 Greenway Plaza, Suite 1000 Houston, TX 77046-1173 | | Investment Adviser Invesco Advisers, Inc. 1555 Peachtree Street, N.E. Atlanta, GA 30309 | |
| Distributor
Invesco Distributors, Inc. 11 Greenway Plaza, Suite 1000 Houston, TX 77046-1173 |
| |
| Auditors
PricewaterhouseCoopers LLP 1000 Louisiana Street, Suite 5800 Houston, TX 77002-5678 |
|
| | | |
| | | | | | | | | | |
Counsel to the Fund Stradley Ronon Stevens & Young, LLP 2005 Market Street, Suite 2600 Philadelphia, PA 19103-7018 | | Counsel to the Independent Trustees Goodwin Procter LLP 901 New York Avenue, N.W. Washington, D.C. 20001 | |
| Transfer Agent
Invesco Investment Services, Inc. 11 Greenway Plaza, Suite 1000 Houston, TX 77046-1173 |
| |
| Custodian
State Street Bank and Trust Company 225 Franklin Street Boston, MA 02110-2801 |
|
T-4 Invesco Dividend Income Fund
Explore High-Conviction Investing with Invesco

Go paperless with eDelivery
Visit invesco.com/edelivery to enjoy the convenience and security of anytime electronic access to your investment documents.
With eDelivery, you can elect to have any or all of the following materials delivered straight to your inbox to download, save and print from your own computer:
∎ Fund reports and prospectuses
∎ Quarterly statements
∎ Daily confirmations
∎ Tax forms
Invesco mailing information
Send general correspondence to Invesco Investment Services, Inc., P.O. Box 219078, Kansas City, MO 64121-9078.
Important notice regarding delivery of security holder documents
To reduce Fund expenses, only one copy of most shareholder documents may be mailed to shareholders with multiple accounts at the same address (Householding). Mailing of your shareholder documents may be householded indefinitely unless you instruct us otherwise. If you do not want the mailing of these documents to be combined with those for other members of your household, please contact Invesco Investment Services, Inc. at 800 959 4246 or contact your financial institution. We will begin sending you individual copies for each account within 30 days after receiving your request.
Fund holdings and proxy voting information
The Fund provides a complete list of its holdings four times in each fiscal year, at the quarter ends. For the second and fourth quarters, the lists appear in the Fund’s semiannual and annual reports to shareholders. For the first and third quarters, the Fund files the lists with the Securities and Exchange Commission (SEC) on Form N-Q. The most recent list of portfolio holdings is available at invesco.com/completeqtrholdings. Shareholders can also look up the Fund’s Forms N-Q on the SEC website at sec.gov. Copies of the Fund’s Forms N-Q may be reviewed and copied at the SEC Public Reference Room in Washington, D.C. You can obtain information on the operation of the Public Reference Room, including information about duplicating fee charges, by calling 202 551 8090 or 800 732 0330, or by electronic request at the following email address: publicinfo@sec.gov.
The SEC file numbers for the Fund are shown below.
A description of the policies and procedures that the Fund uses to determine how to vote proxies relating to portfolio securities is available without charge, upon request, from our Client Services department at 800 959 4246 or at invesco.com/proxyguidelines. The information is also available on the SEC website, sec.gov.
| | |
Information regarding how the Fund voted proxies related to its portfolio securities during the most recent 12-month period ended June 30 is available at invesco.com/proxysearch. The information is also available on the SEC website, sec.gov. Invesco Advisers, Inc. is an investment adviser; it provides investment advisory services to individual and institutional clients and does not sell securities. Invesco Distributors, Inc. is the US distributor for Invesco Ltd.’s retail mutual funds, exchange-traded funds and institutional money market funds. Both are wholly owned, indirect subsidiaries of Invesco Ltd. | |  |
SEC file numbers: 811-03826 and 002-85905 Invesco Distributors, Inc. I-DIVI-AR-1 06092017 1016
| | | | |
| | |
 | | Annual Report to Shareholders | | April 30, 2017 |
| | |
| | Invesco Energy Fund |
| | Nasdaq: |
| | A: IENAX ∎ B: IENBX ∎ C: IEFCX ∎ Y: IENYX ∎ Investor: FSTEX ∎ R5: IENIX ∎ R6: IENSX |
|
 |
Letters to Shareholders
| | | | |

Philip Taylor | | | | Dear Shareholders: This annual report includes information about your Fund, including performance data and a complete list of its investments as of the close of the reporting period. Inside is a discussion of how your Fund was managed and the factors that affected its performance during the reporting period. The reporting period began with stock market volatility in the US and abroad, largely the result of uncertainty about global economic growth and monetary policy. Markets declined sharply following UK voters’ decision in June to leave the European Union. Relatively quickly, however, markets recovered, reaching record highs later in the summer. Demand was strong for income-producing investments, particularly those perceived to be lower risk; this benefited bonds as well as dividend-paying stocks for much of the reporting period. While economic news in the US was generally positive during the reporting period, news overseas was less upbeat. The European Central Bank and central banks in China and Japan – as well as other countries – maintained |
extraordinarily accommodative monetary policies in response to economic weakness. After months of uncertainty, the outcome of the US presidential election in November triggered a major stock market rally, with most market indexes repeatedly reaching new highs through February. As expected, the US Federal Reserve (the Fed) raised interest rates in December 2016 and again in March 2017. In its March statement, the Fed noted that the labor market has strengthened and economic activity has expanded at a moderate pace – and that it expects those trends to continue.
Short-term market volatility can prompt some investors to abandon their investment plans – and can cause others to settle for whatever returns the market has to offer. The investment professionals at Invesco, in contrast, invest with high conviction. This means that, no matter the asset class or the strategy, each investment team has a passion to exceed. We want to help investors achieve better outcomes, such as seeking higher returns, helping mitigate risk and generating income. Of course, investing with high conviction can’t guarantee a profit or ensure success; no investment strategy can. To learn more about how we invest with high conviction, visit invesco.com/HighConviction.
You, too, can invest with high conviction by maintaining a long-term investment perspective and by working with your financial adviser on a regular basis. During periods of short-term market volatility or uncertainty, your financial adviser can keep you focused on your long-term investment goals – a new home, a child’s college education or a secure retirement. He or she also can share research about the economy, the markets and individual investment options.
Visit our website for more information on your investments
Our website, invesco.com/us, offers a wide range of market insights and investment perspectives. On the website, you’ll find detailed information about our funds, including performance, holdings and portfolio manager commentaries. You can access information about your account by completing a simple, secure online registration. To do so, select “Log In” on the right side of the homepage, and then select “Register for Individual Account Access.”
In addition to the resources accessible on our website and through our mobile app, you can obtain timely updates to help you stay informed about the markets, the economy and investing by connecting with Invesco on Twitter, LinkedIn or Facebook. You can access our blog at blog.invesco.us.com. Our goal is to provide you the information you want, when and where you want it.
Finally, I’m pleased to share with you Invesco’s commitment to both the Principles for Responsible Investment and to considering environmental, social and governance issues in our robust investment process. I invite you to learn more at invesco.com/esg.
Have questions?
For questions about your account, contact an Invesco client services representative at 800 959 4246. For Invesco-related questions or comments, please email me directly at phil@invesco.com.
All of us at Invesco look forward to serving your investment management needs. Thank you for investing with us.
Sincerely,

Philip Taylor
Senior Managing Director, Invesco Ltd.
2 Invesco Energy Fund
| | | | |

Bruce Crockett | | | | Dear Fellow Shareholders: Among the many important lessons I’ve learned in more than 40 years in a variety of business endeavors is the value of a trusted advocate. As independent chair of the Invesco Funds Board, I can assure you that the members of the Board are strong advocates for the interests of investors in Invesco’s mutual funds. We work hard to represent your interests through oversight of the quality of the investment management services your funds receive and other matters important to your investment, including but not limited to: ∎ Ensuring that Invesco offers a diverse lineup of mutual funds that your financial adviser can use to strive to meet your financial needs as your investment goals change over time. ∎ Monitoring how the portfolio management teams of the Invesco funds are performing in light of changing economic and market conditions. |
| ∎ | | Assessing each portfolio management team’s investment performance within the context of the investment strategy described in the fund’s prospectus. |
| ∎ | | Monitoring for potential conflicts of interests that may impact the nature of the services that your funds receive. |
We believe one of the most important services we provide our fund shareholders is the annual review of the funds’ advisory and sub-advisory contracts with Invesco Advisers and its affiliates. This review is required by the Investment Company Act of 1940 and focuses on the nature and quality of the services Invesco provides as the adviser to the Invesco funds and the reasonableness of the fees that it charges for those services. Each year, we spend months carefully reviewing information received from Invesco and a variety of independent sources, such as performance and fee data prepared by Lipper, Inc. (a subsidiary of Broadridge Financial Solutions, Inc.), an independent, third-party firm widely recognized as a leader in its field. We also meet with our independent legal counsel and other independent advisers to review and help us assess the information that we have received. Our goal is to assure that you receive quality investment management services for a reasonable fee.
I trust the measures outlined above provide assurance that you have a worthy advocate when it comes to choosing the Invesco Funds.
As always, please contact me at bruce@brucecrockett.com with any questions or concerns you may have. On behalf of the Board, we look forward to continuing to represent your interests and serving your needs.
Sincerely,

Bruce L. Crockett
Independent Chair
Invesco Funds Board of Trustees
3 Invesco Energy Fund
Management’s Discussion of Fund Performance
| | | | |
| Performance summary | |
For the fiscal year ended April 30, 2017, Class A shares of Invesco Energy Fund (the Fund), at net asset value (NAV), underperformed the Fund’s style-specific benchmark, the MCSI World Energy Index. Your Fund’s long-term performance appears later in this report. | |
| Fund vs. Indexes | |
Total returns, 4/30/16 to 4/30/17, at net asset value (NAV). Performance shown does not include applicable contingent deferred sales charges (CDSC) or front-end sales charges, which would have reduced performance. | |
Class A Shares | | | -8.29 | % |
Class B Shares | | | -8.96 | |
Class C Share | | | -8.97 | |
Class Y Shares | | | -8.03 | |
Investor Class Shares | | | -8.29 | |
Class R5 Shares | | | -7.88 | |
Class R6 Shares* | | | -8.22 | |
S&P 500 Index▼ (Broad Market Index) | | | 17.92 | |
MSCI World Energy Index▼ (Style-Specific Index) | | | 3.07 | |
Lipper Natural Resource Funds Index∎ (Peer Group Index) | | | 3.66 | |
Source(s): ▼FactSet Research Systems Inc.; ∎Lipper Inc. *Class R6 shares incepted on April 4, 2017. See page 7 for more information. | | | | |
Market conditions and your Fund
The fiscal year ended April 30, 2017, saw a series of momentous political events which impacted the investment environment, as well as the outlook for economic growth and political stability.
In June, the decision by UK voters to leave the European Union caused global markets to decline sharply, but only briefly. Stocks in economically sensitive sectors, including energy and financials, were hardest hit as investors flocked to the perceived safety of US Treasuries and more defensive, dividend-paying equities. Following the outcome of the November US presidential election, US stocks surged. The rally was led by the health care and financials sectors, which could potentially benefit from reduced regulation. Non-US equities, particularly emerging market equities, traded lower due to currency weakness and the potential for a less favorable trade environment. Also in November, OPEC agreed to cut production
for the first time in eight years; the agreement helped support higher oil prices and energy stocks.
As expected, the US Federal Reserve (the Fed) raised interest rates in December 2016 and again in March 2017. Toward the end of the reporting period uncertain global political outcomes continued to drive swings in capital market sentiment. Corporate earnings reports for the 2016 year-end showed better growth trends and corporate profits. Inflation also rose during the reporting period, driven primarily by energy prices, and was expected to be a dominant theme for central banks.
For the reporting period as a whole, US equities outperformed non-US equites. Emerging markets, supported by the Fed’s delayed interest rate increases and a rally in commodities, outperformed their developed-market counterparts (excluding the US) – a reversal from previous years.
At the sector level, energy stocks, in general, experienced some respite during the fiscal year as a result of action by OPEC to limit crude oil production and intermittent periods of commodity price recovery. While OPEC effectively capped its production, rising inventories and increased production from the US caused a decline in energy prices and related stocks since January. Crude oil prices rose from $48 per barrel to a high of $57 per barrel in January, before declining back to $52 per barrel at the close of the reporting period.1 Natural gas prices were weak given a relatively warm winter, averaging $2.92 per thousand cubic feet for the fiscal year.1
For the reporting period, the Fund underperformed the MSCI World Energy Index as a result of security selection and overweight exposures in the oil and gas exploration and production (E&P) industry and the oil and gas equipment and services industry. Additionally, security selection in the integrated oil and gas industry and overweight exposure in the oil and gas drilling industry detracted from performance versus the Fund’s style-specific benchmark for the reporting period. Conversely, a lack of holdings in the coal and consumable fuels industry contributed to relative Fund performance.
Top individual contributors to the Fund’s absolute performance for the reporting period included Devon Energy and EOG Resources. Devon Energy is one of the largest independent E&P companies in North America. During the fiscal year, the company completed its asset divestiture program with proceeds totaling $3.2 billion (above the planned target) by selling non-core assets in favor of high-returning, oil-growth properties in areas such as the Eagle Ford gas-shale formation and Permian Basins. This allowed the company to meaningfully reduce its debt and operating expenses while simultaneously raising its production in 2016. In fact, Devon
| | | | |
| Portfolio Composition | |
By industry | | | % of total net assets | |
| | | | |
| |
Oil & Gas Exploration & Production | | | 47.3% | |
Integrated Oil & Gas | | | 27.5 | |
Oil & Gas Equipment & Services | | | 15.9 | |
Oil & Gas Refining & Marketing | | | 4.5 | |
Oil & Gas Drilling | | | 4.1 | |
Money Market Funds Plus Other Assets Less Liabilities | | | 0.7 | |
| | | | | |
| Top 10 Equity Holdings* |
| | | | % of total net assets | |
| | | | | |
1. Suncor Energy, Inc. | | | | 5.8 | % |
2. Canadian Natural Resources Ltd. | | | | 5.2 | |
| 3. Noble Energy, Inc. | | | | 5.0 | |
| 4. BP PLC-ADR | | | | 5.0 | |
| 5. Devon Energy Corp. | | | | 4.6 | |
| 6. Chevron Corp. | | | | 4.6 | |
7. Royal Dutch Shell PLC Class A-ADR | | | | 4.5 | |
| 8. PrairieSky Royalty Ltd. | | | | 4.0 | |
| 9. Hess Corp. | | | | 3.9 | |
| 10. Core Laboratories N.V. | | | | 3.5 | |
| | | | | |
| Total Net Assets | | | | $750.1 million | |
| |
| Total Number of Holdings* | | | | 34 | |
The Fund’s holdings are subject to change, and there is no assurance that the Fund will continue to hold any particular security.
*Excluding money market fund holdings.
Data presented here are as of April 30, 2017.
4 Invesco Energy Fund
Energy was able to achieve its best drilling results in the company’s 45-year history. EOG Resources, an oil and gas producer focused primarily on US shale plays, benefited from higher crude prices and coordination by OPEC to limit crude production during the fiscal year. Further, the company has been able to reduce well costs and add more rigs to its lineup.
Top individual detractors from the Fund’s absolute performance during the reporting period included Cobalt International Energy and Range Resources. Cobalt is an independent E&P company that has suffered from uncertainty related to the unexpected resignation of its chairman and chief executive officer early in the fiscal year. In addition, the prolonged delay in the sale of its $1.8 billion Angolan asset has weighed on the company, particularly since the buyer, Sonangol (not a Fund holding), has not upheld its side of the agreement. Cobalt has taken full impairment charges related to the asset and submitted a Notice of Dispute with plans to move forward with arbitration if Sonangol does not take action to resolve. Range Resources, an independent E&P company, is among the lowest cost producers of natural gas and natural gas liquids in the US given its position in the prolific Marcellus Shale. During the reporting period, Range Resources purchased Memorial Resources Development (not a Fund holding) for access to northern Louisiana’s natural gas. The company has traded lower on lackluster natural gas prices.
At the end of the fiscal year, the Fund had overweight exposure in independent E&P companies, oilfield equipment and service companies, and drilling companies relative to the Fund’s style-specific index. This positioning reflects our opinion of the areas with the best upside potential. Conversely, the Fund had significant underweight exposure to the integrated oil and gas industry, and no exposure to the coal and consumable fuels or the oil and gas storage and transportation industries. The MSCI World Energy Index is a market capitalization weighted index, which causes the largest integrated oil and gas companies to have a more significant weight in the index as compared to the Fund. Further, we believed the integrated companies were structurally unable to compete effectively in today’s unconventional oil and gas business, which we believe requires flexibility and lean manufacturing capabilities. At the end of the reporting period, integrated companies continued to struggle in these two areas.
Though it is too early to know the impact of the Trump administration, we believe it may usher in less regulation, which bodes well for the energy sector. Our marginal cost of production analysis shows that $70 per barrel of crude oil is required to support reinvestment in the industry for energy growth globally. At the end of the reporting period, we continued to focus on energy fundamentals and positioned the Fund for a turnaround in the commodity, using market volatility to increase the Fund’s core positions.
We believe bottom-up fundamental analysis is key in generating long-term investment returns. Based on years of experience, we also believe that using a normalized commodity price based on the cost of marginal supply cancels out the “cloud of noise” associated with volatile commodity prices. We believe this allows us to effectively analyze a company’s NAV and cash flow generating capabilities – tangible aspects of a company that we believe create shareholder value.
While oil prices may be headline news, the Fund should be considered a long-term investment. As always, thank you for your continued investment in Invesco Energy Fund.
1 Source: Bloomberg L.P.
The views and opinions expressed in management’s discussion of Fund performance are those of Invesco Advisers, Inc. These views and opinions are subject to change at any time based on factors such as market and economic conditions. These views and opinions may not be relied upon as investment advice or recommendations, or as an offer for a particular security. The information is not a complete analysis of every aspect of any market, country, industry, security or the Fund. Statements of fact are from sources considered reliable, but Invesco Advisers, Inc. makes no representation or warranty as to their completeness or accuracy. Although historical performance is no guarantee of future results, these insights may help you understand our investment management philosophy.
See important Fund and, if applicable, index disclosures later in this report.
| | |

| | Norman MacDonald Chartered Financial Analyst, Portfolio Manager, is manager of Invesco Energy Fund. |
He joined Invesco in 2008. Mr. MacDonald earned a Bachelor of Commerce from the University of Windsor. |
5 Invesco Energy Fund
Your Fund’s Long-Term Performance
Results of a $10,000 Investment – Oldest Share Class(es)
Fund and index data from 4/30/07
| 1 | Source: FactSet Research Systems Inc. |
| 3 | It is Invesco’s policy to chart the Fund’s oldest share class(es). Because Investor Class shares do not have a sales charge, |
| | we also show the oldest share class with a sales charge, Class C shares. |
Past performance cannot guarantee comparable future results.
The data shown in the chart include reinvested distributions, applicable sales charges and Fund expenses
including management fees. Index results include reinvested dividends, but they do not reflect sales charges. Performance of the peer group, if applicable, reflects fund expenses and management fees;
performance of a market index does not. Performance shown in the chart and table(s) does not reflect deduction of taxes a shareholder would pay on Fund distributions or sale of Fund shares.
continued from page 8
| ∎ | | Small- and mid-capitalization companies risks. Small- and mid-capitalization companies tend to be more vulnerable to changing market conditions, may have little or no operating history or track record of success, and may have more limited product lines and markets, less experienced management and fewer financial resources than larger companies. These companies’ securities may be more volatile and less liquid than those of more established companies, and their returns may vary, sometimes significantly, from the overall securities market. |
About indexes used in this report
| ∎ | | The S&P 500® Index is an unmanaged index considered representative of the US stock market. |
| ∎ | | The MSCI World Energy Index is designed to capture the performance of energy stocks across developed market countries. The index is computed using the net return, which withholds applicable taxes for non-resident investors. |
| ∎ | | The Lipper Natural Resource Funds Index is an unmanaged index considered representative of natural resource funds tracked by Lipper. |
| ∎ | | The Fund is not managed to track the performance of any particular index, including the index(es) described here, and consequently, the performance of the Fund may deviate significantly from the performance of the index(es). |
| ∎ | | A direct investment cannot be made in an index. Unless otherwise indicated, index results include reinvested dividends, and they do not reflect sales charges. Performance of the peer group, if applicable, reflects fund expenses; performance of a market index does not. |
Other information
| ∎ | | The returns shown in management’s discussion of Fund performance are based on net asset values (NAVs) calculated for shareholder transactions. Generally accepted accounting principles require adjustments to be made to the net assets of the Fund at period end for financial reporting purposes, and as such, the NAVs for shareholder transactions and the returns based on those NAVs may differ from the NAVs and returns reported in the Financial Highlights. |
| ∎ | | Industry classifications used in this report are generally according to the Global Industry Classification Standard, which was developed by and is the exclusive property and a service mark of MSCI Inc. and Standard & Poor’s. |
6 Invesco Energy Fund
| | | | | |
| Average Annual Total Returns |
As of 4/30/17, including maximum applicable sales charges | |
| |
Class A Shares | | | | | |
Inception (3/28/02) | | | | 5.44 | % |
10 Years | | | | -2.20 | |
5 Years | | | | -6.72 | |
1 Year | | | | -13.32 | |
| |
Class B Shares | | | | | |
Inception (3/28/02) | | | | 5.42 | % |
10 Years | | | | -2.23 | |
5 Years | | | | -6.68 | |
1 Year | | | | -13.49 | |
| |
Class C Shares | | | | | |
Inception (2/14/00) | | | | 6.63 | % |
10 Years | | | | -2.38 | |
5 Years | | | | -6.36 | |
1 Year | | | | -9.88 | |
| |
Class Y Shares | | | | | |
10 Years | | | | -1.43 | % |
5 Years | | | | -5.42 | |
1 Year | | | | -8.03 | |
| |
Investor Class Shares | | | | | |
Inception (1/19/84) | | | | 7.32 | % |
10 Years | | | | -1.64 | |
5 Years | | | | -5.66 | |
1 Year | | | | -8.29 | |
| |
Class R5 Shares | | | | | |
Inception (1/31/06) | | | | -0.31 | % |
10 Years | | | | -1.24 | |
5 Years | | | | -5.29 | |
1 Year | | | | -7.88 | |
| |
Class R6 Shares | | | | | |
10 Years | | | | -1.63 | % |
5 Years | | | | -5.65 | |
1 Year | | | | -8.22 | |
Performance includes litigation proceeds. Had these proceeds not been received, total returns would have been lower. | |
Class Y shares incepted on October 3, 2008. Performance shown prior to that date is that of Investor Class shares and includes the 12b-1 fees applicable to Investor Class shares.
Class R6 shares incepted on April 4, 2017. Performance shown prior to that date is that of Class A shares and includes the 12b-1 fees applicable to Class A shares.
The performance data quoted represent past performance and cannot guarantee comparable future results; current performance may be lower or higher. Please visit invesco.com/performance for the most recent month-end performance. Performance figures reflect reinvested distributions, changes
| | | | | |
| Average Annual Total Returns |
As of 3/31/17, the most recent calendar quarter end, including maximum applicable sales charges |
| | | | | |
| |
Class A Shares | | | | | |
Inception (3/28/02) | | | | 5.74 | % |
10 Years | | | | -1.24 | |
5 Years | | | | -6.23 | |
1 Year | | | | 3.40 | |
| |
Class B Shares | | | | | |
Inception (3/28/02) | | | | 5.73 | % |
10 Years | | | | -1.27 | |
5 Years | | | | -6.20 | |
1 Year | | | | 3.58 | |
| |
Class C Shares | | | | | |
Inception (2/14/00) | | | | 6.91 | % |
10 Years | | | | -1.42 | |
5 Years | | | | -5.87 | |
1 Year | | | | 7.59 | |
| |
Class Y Shares | | | | | |
10 Years | | | | -0.47 | % |
5 Years | | | | -4.93 | |
1 Year | | | | 9.67 | |
| |
Investor Class Shares | | | | | |
Inception (1/19/84) | | | | 7.47 | % |
10 Years | | | | -0.68 | |
5 Years | | | | -5.17 | |
1 Year | | | | 9.41 | |
| |
Class R5 Shares | | | | | |
Inception (1/31/06) | | | | 0.03 | % |
10 Years | | | | -0.28 | |
5 Years | | | | -4.80 | |
1 Year | | | | 9.86 | |
Performance includes litigation proceeds. Had these proceeds not been received, total returns would have been lower. | |
in net asset value and the effect of the maximum sales charge unless otherwise stated. Investment return and principal value will fluctuate so that you may have a gain or loss when you sell shares.
The net annual Fund operating expense ratio set forth in the most recent Fund prospectus as of the date of this report for Class A, Class B, Class C, Class Y, Investor Class, Class R5 and Class R6 shares was 1.27%, 2.02%, 2.02%, 1.02%, 1.27%, 0.85% and 0.80%, respectively.1 The total annual Fund operating expense ratio set forth in the most recent Fund prospectus as of the date of this report for Class A, Class B, Class C, Class Y, Investor Class, Class R5 and Class R6 shares was 1.28%, 2.03%, 2.03%, 1.03%, 1.28%, 0.86% and 0.81%, respectively. The expense ratios presented above
may vary from the expense ratios presented in other sections of this report that are based on expenses incurred during the period covered by this report.
Class A share performance reflects the maximum 5.50% sales charge, and Class B and Class C share performance reflects the applicable contingent deferred sales charge (CDSC) for the period involved. The CDSC on Class B shares declines from 5% beginning at the time of purchase to 0% at the beginning of the seventh year. The CDSC on Class C shares is 1% for the first year after purchase. Class Y, Investor Class, Class R5 and Class R6 shares do not have a front-end sales charge or a CDSC; therefore, performance is at net asset value.
The performance of the Fund’s share classes will differ primarily due to different sales charge structures and class expenses.
Fund performance reflects any applicable fee waivers and/or expense reimbursements. Had the adviser not waived fees and/or reimbursed expenses currently or in the past, returns would have been lower. See current prospectus for more information.
| 1 | Total annual Fund operating expenses after any contractual fee waivers and/or expense reimbursements by the adviser in effect through at least June 30, 2019. See current prospectus for more information. |
7 Invesco Energy Fund
Invesco Energy Fund’s investment objective is long-term growth of capital.
| ∎ | | Unless otherwise stated, information presented in this report is as of April 30, 2017, and is based on total net assets. |
| ∎ | | Unless otherwise noted, all data provided by Invesco. |
| ∎ | | To access your Fund’s reports/prospectus, visit invesco.com/fundreports. |
About share classes
| ∎ | | Class B shares may not be purchased for new or additional investments. Please see the prospectus for more information. |
| ∎ | | Class Y and Investor Class shares are available only to certain investors. Please see the prospectus for more information. |
| ∎ | | Class R5 shares and Class R6 shares are available for use by retirement plans that meet certain standards and for institutional investors. Class R6 shares are also available through intermediaries that have established an agreement with Invesco Distributors, Inc. to make such shares available for use in retail omnibus accounts. See the prospectus for more information. |
Principal risks of investing in the Fund
| ∎ | | Derivatives risk. The value of a derivative instrument depends largely on (and is derived from) the value of an underlying security, currency, commodity, interest rate, index or other asset (each referred to as an underlying asset). In addition to risks relating to the underlying assets, the use of derivatives may include other, possibly greater, risks, including counterparty, leverage and liquidity risks. Counter-party risk is the risk that the counter-party to the derivative contract will default on its obligation to pay the Fund the amount owed or otherwise perform under the derivative contract. Derivatives create leverage risk because they do not require payment up front equal to the economic exposure created by owning the derivative. As a result, an adverse change in the value of the underlying asset could result in the Fund sustaining a loss that is substantially greater than the amount invested in the derivative, which may make the Fund’s returns more volatile and increase the risk of loss. Derivative instruments may also be less liquid than more traditional investments and the Fund may be unable to sell or close out |
| | its derivative positions at a desirable time or price. This risk may be more acute under adverse market conditions, during which the Fund may be most in need of liquidating its derivative positions. Derivatives may also be harder to value, less tax efficient and subject to changing government regulation that could impact the Fund’s ability to use certain derivatives or their cost. Also, derivatives used for hedging or to gain or limit exposure to a particular market segment may not provide the expected benefits, particularly during adverse market conditions. |
| ∎ | | Emerging markets securities risk. Emerging markets (also referred to as developing markets) are generally subject to greater market volatility, political, social and economic instability, uncertain trading markets and more governmental limitations on foreign investment than more developed markets. In addition, companies operating in emerging markets may be subject to lower trading volume and greater price fluctuations than companies in more developed markets. Securities law and the enforcement of systems of taxation in many emerging market countries may change quickly and unpredictably. In addition, investments in emerging markets securities may also be subject to additional transaction costs, delays in settlement procedures, and lack of timely information. |
| ∎ | | Energy sector risk. The Fund will concentrate its investments in the securities of issuers engaged primarily in energy-related industries. Changes in worldwide energy prices, exploration and production spending, government regulation, world events, economic conditions, exchange rates, transportation and storage costs and labor relations can affect companies in the energy sector. In addition, these companies are at an increased risk of civil liability and environmental damage claims, and are also subject to the risk of loss from terrorism and natural disasters. |
This report must be accompanied or preceded by a currently effective Fund prospectus, which contains more complete information, including sales charges and expenses. Investors should read it carefully before investing.
NOT FDIC INSURED | MAY LOSE VALUE | NO BANK GUARANTEE
| ∎ | | Foreign securities risk. The Fund’s foreign investments may be adversely affected by political and social instability, changes in economic or taxation policies, difficulty in enforcing obligations, decreased liquidity or increased volatility. Foreign investments also involve the risk of the possible seizure, nationalization or expropriation of the issuer or foreign deposits (in which the Fund could lose its entire investments in a certain market) and the possible adoption of foreign governmental restrictions such as exchange controls. Unless the Fund has hedged its foreign securities risk, foreign securities risk also involves the risk of negative foreign currency rate fluctuations, which may cause the value of securities denominated in such foreign currency (or other instruments through which the Fund has exposure to foreign currencies) to decline in value. Currency exchange rates may fluctuate significantly over short periods of time. Currency hedging strategies, if used, are not always successful. |
| ∎ | | Management risk. The Fund is actively managed and depends heavily on the Adviser’s judgment about markets, interest rates or the attractiveness, relative values, liquidity, or potential appreciation of particular investments made for the Fund’s portfolio. The Fund could experience losses if these judgments prove to be incorrect. Additionally, legislative, regulatory, or tax developments may adversely affect management of the Fund and, therefore, the ability of the Fund to achieve its investment objective. |
| ∎ | | Market risk. The market values of the Fund’s investments, and therefore the value of the Fund’s shares, will go up and down, sometimes rapidly or unpredictably. Market risk may affect a single issuer, industry or section of the economy, or it may affect the market as a whole. Individual stock prices tend to go up and down more dramatically than those of certain other types of investments, such as bonds. During a general downturn in the financial markets, multiple asset classes may decline in value. When markets perform well, there can be no assurance that specific investments held by the Fund will rise in value. |
continued on page 6
8 Invesco Energy Fund
Schedule of Investments(a)
April 30, 2017
| | | | | | | | |
| | | Shares | | | Value | |
Common Stocks & Other Equity Interests–98.63% | |
| Integrated Oil & Gas–27.47% | | | | | | | | |
BP PLC–ADR (United Kingdom) | | | 1,086,347 | | | $ | 37,283,429 | |
Cenovus Energy Inc. (Canada) | | | 1,875,799 | | | | 18,700,967 | |
Chevron Corp. | | | 319,429 | | | | 34,083,074 | |
Exxon Mobil Corp. | | | 193,014 | | | | 15,759,593 | |
Occidental Petroleum Corp. | | | 367,747 | | | | 22,631,150 | |
Royal Dutch Shell PLC–Class A–ADR (United Kingdom) | | | 648,443 | | | | 33,842,240 | |
Suncor Energy, Inc. (Canada) | | | 1,395,533 | | | | 43,732,119 | |
| | | | | 206,032,572 | |
|
| Oil & Gas Drilling–4.15% | |
Ensco PLC–Class A | | | 1,192,529 | | | | 9,409,054 | |
Helmerich & Payne, Inc. | | | 358,787 | | | | 21,756,844 | |
| | | | | 31,165,898 | |
|
| Oil & Gas Equipment & Services–15.88% | |
Baker Hughes Inc. | | | 280,275 | | | | 16,639,927 | |
Core Laboratories N.V. | | | 235,591 | | | | 26,108,195 | |
Halliburton Co. | | | 349,555 | | | | 16,037,583 | |
Oceaneering International, Inc. | | | 368,296 | | | | 9,719,331 | |
Schlumberger Ltd. | | | 325,758 | | | | 23,646,773 | |
Superior Energy Services, Inc.(b) | | | 1,263,460 | | | | 15,262,597 | |
Tidewater Inc.(b) | | | 478,960 | | | | 419,808 | |
Weatherford International PLC(b) | | | 1,956,197 | | | | 11,287,257 | |
| | | | | 119,121,471 | |
|
| Oil & Gas Exploration & Production–46.58% | |
Anadarko Petroleum Corp. | | | 440,656 | | | | 25,126,205 | |
Apache Corp. | | | 492,579 | | | | 23,959,043 | |
Cabot Oil & Gas Corp. | | | 1,109,192 | | | | 25,777,622 | |
Canadian Natural Resources Ltd. (Canada) | | | 1,225,895 | | | | 39,044,731 | |
Cobalt International Energy, Inc.(b) | | | 9,080,972 | | | | 3,551,568 | |
Concho Resources Inc.(b) | | | 186,155 | | | | 23,578,392 | |
Devon Energy Corp. | | | 876,032 | | | | 34,594,504 | |
| | | | | | | | |
| | | Shares | | | Value | |
| Oil & Gas Exploration & Production–(continued) | |
EOG Resources, Inc. | | | 250,621 | | | $ | 23,182,443 | |
Hess Corp. | | | 598,505 | | | | 29,224,999 | |
Noble Energy, Inc. | | | 1,154,216 | | | | 37,315,803 | |
PrairieSky Royalty Ltd. (Canada) | | | 1,390,792 | | | | 30,308,805 | |
Range Resources Corp. | | | 771,898 | | | | 20,447,578 | |
Tullow Oil PLC (United Kingdom)(b) | | | 4,758,756 | | | | 12,937,272 | |
Whiting Petroleum Corp.(b) | | | 2,450,944 | | | | 20,342,835 | |
| | | | | 349,391,800 | |
|
| Oil & Gas Refining & Marketing–4.55% | |
Caltex Australia Ltd. (Australia) | | | 751,847 | | | | 16,817,426 | |
Phillips 66 | | | 217,393 | | | | 17,295,787 | |
| | | | | 34,113,213 | |
Total Common Stocks & Other Equity Interests
(Cost $868,170,126) | | | | 739,824,954 | |
| | |
| | | Principal
Amount | | | | |
Bonds & Notes–0.68% | |
| Oil & Gas Exploration & Production–0.68% | |
Cobalt International Energy Inc., Sr. Unsec. Conv. Notes, 3.13%, 05/15/2024
(Cost $7,369,508) | | $ | 17,188,000 | | | | 5,117,442 | |
| | |
| | | Shares | | | | |
|
Money Market Funds–1.56% | |
Government & Agency Portfolio–Institutional Class, 0.67%(c) | | | 6,994,701 | | | | 6,994,701 | |
Treasury Portfolio–Institutional Class, 0.63%(c) | | | 4,663,134 | | | | 4,663,134 | |
Total Money Market Funds
(Cost $11,657,835) | | | | | | | 11,657,835 | |
TOTAL INVESTMENTS–100.87%
(Cost $887,197,469) | | | | 756,600,231 | |
OTHER ASSETS LESS LIABILITIES–(0.87)% | | | | (6,514,817 | ) |
NET ASSETS–100.00% | | | $ | 750,085,414 | |
Investment Abbreviations:
| | |
| ADR | | – American Depositary Receipt |
| Conv. | | – Convertible |
| Sr. | | – Senior |
| Unsec. | | – Unsecured |
Notes to Schedule of Investments:
| (a) | Industry and/or sector classifications used in this report are generally according to the Global Industry Classification Standard, which was developed by and is the exclusive property and a service mark of MSCI Inc. and Standard & Poor’s. |
| (b) | Non-income producing security. |
| (c) | The money market fund and the Fund are affiliated by having the same investment adviser. The rate shown is the 7-day SEC standardized yield as of April 30, 2017. |
See accompanying Notes to Financial Statements which are an integral part of the financial statements.
9 Invesco Energy Fund
Statement of Assets and Liabilities
April 30, 2017
| | | | |
Assets: | | | | |
Investments, at value (Cost $875,539,634) | | $ | 744,942,396 | |
Investments in affiliated money market funds, at value and cost | | | 11,657,835 | |
Total investments, at value (Cost $887,197,469) | | | 756,600,231 | |
Foreign currencies, at value (Cost $145,246) | | | 145,728 | |
Receivable for: | | | | |
Investments sold | | | 921,202 | |
Fund shares sold | | | 562,759 | |
Dividends and interest | | | 574,128 | |
Investment for trustee deferred compensation and retirement plans | | | 251,184 | |
Other assets | | | 53,590 | |
Total assets | | | 759,108,822 | |
| |
Liabilities: | | | | |
Payable for: | | | | |
Investments purchased | | | 5,246,292 | |
Fund shares reacquired | | | 2,472,279 | |
Accrued fees to affiliates | | | 697,671 | |
Accrued trustees’ and officers’ fees and benefits | | | 3,258 | |
Accrued other operating expenses | | | 317,315 | |
Trustee deferred compensation and retirement plans | | | 286,593 | |
Total liabilities | | | 9,023,408 | |
Net assets applicable to shares outstanding | | $ | 750,085,414 | |
| |
Net assets consist of: | | | | |
Shares of beneficial interest | | $ | 1,018,299,899 | |
Undistributed net investment income | | | 4,679,234 | |
Undistributed net realized gain (loss) | | | (142,289,253 | ) |
Net unrealized appreciation (depreciation) | | | (130,604,466 | ) |
| | | $ | 750,085,414 | |
| | | | |
Net Assets: | | | | |
Class A | | $ | 393,997,788 | |
Class B | | $ | 3,299,273 | |
Class C | | $ | 120,722,354 | |
Class Y | | $ | 63,783,164 | |
Investor Class | | $ | 159,401,729 | |
Class R5 | | $ | 8,871,419 | |
Class R6 | | $ | 9,687 | |
|
Shares outstanding, no par value,
with an unlimited number of shares authorized: | |
Class A | | | 16,054,394 | |
Class B | | | 153,454 | |
Class C | | | 5,781,270 | |
Class Y | | | 2,590,135 | |
Investor Class | | | 6,522,623 | |
Class R5 | | | 351,680 | |
Class R6 | | | 384 | |
Class A: | | | | |
Net asset value per share | | $ | 24.54 | |
Maximum offering price per share | | | | |
(Net asset value of $24.54 ¸ 94.50%) | | $ | 25.97 | |
Class B: | | | | |
Net asset value and offering price per share | | $ | 21.50 | |
Class C: | | | | |
Net asset value and offering price per share | | $ | 20.88 | |
Class Y: | | | | |
Net asset value and offering price per share | | $ | 24.63 | |
Investor Class: | | | | |
Net asset value and offering price per share | | $ | 24.44 | |
Class R5: | | | | |
Net asset value and offering price per share | | $ | 25.23 | |
Class R6: | | | | |
Net asset value and offering price per share | | $ | 25.23 | |
See accompanying Notes to Financial Statements which are an integral part of the financial statements.
10 Invesco Energy Fund
Statement of Operations
For the year ended April 30, 2017
| | | | |
Investment income: | |
Dividends (net of foreign withholding taxes of $1,016,527) | | $ | 17,969,901 | |
Dividends from affiliated money market funds | | | 87,884 | |
Interest | | | 937,272 | |
Total investment income | | | 18,995,057 | |
| |
Expenses: | | | | |
Advisory fees | | | 5,996,045 | |
Administrative services fees | | | 232,204 | |
Custodian fees | | | 47,395 | |
Distribution fees: | | | | |
Class A | | | 1,221,652 | |
Class B | | | 60,030 | |
Class C | | | 1,432,926 | |
Investor Class | | | 474,026 | |
Transfer agent fees — A, B, C, Y and Investor | | | 2,303,796 | |
Transfer agent fees — R5 | | | 20,565 | |
Trustees’ and officers’ fees and benefits | | | 35,490 | |
Registration and filing fees | | | 118,520 | |
Reports to shareholders | | | 328,038 | |
Professional services fees | | | 56,315 | |
Other | | | 22,599 | |
Total expenses | | | 12,349,601 | |
Less: Fees waived and expense offset arrangement(s) | | | (46,671 | ) |
Net expenses | | | 12,302,930 | |
Net investment income | | | 6,692,127 | |
| |
Realized and unrealized gain (loss) from: | | | | |
Net realized gain (loss) from: | | | | |
Investment securities | | | (131,299,987 | ) |
Foreign currencies | | | (120,771 | ) |
| | | | (131,420,758 | ) |
Change in net unrealized appreciation (depreciation) of: | | | | |
Investment securities | | | 50,613,251 | |
Foreign currencies | | | (2,483 | ) |
| | | | 50,610,768 | |
Net realized and unrealized gain (loss) | | | (80,809,990 | ) |
Net increase (decrease) in net assets resulting from operations | | $ | (74,117,863 | ) |
See accompanying Notes to Financial Statements which are an integral part of the financial statements.
11 Invesco Energy Fund
Statement of Changes in Net Assets
For the years ended April 30, 2017 and 2016
| | | | | | | | |
| | | 2017 | | | 2016 | |
Operations: | | | | | | | | |
Net investment income | | $ | 6,692,127 | | | $ | 8,543,425 | |
Net realized gain (loss) | | | (131,420,758 | ) | | | 3,895,476 | |
Change in net unrealized appreciation (depreciation) | | | 50,610,768 | | | | (284,807,170 | ) |
Net increase (decrease) in net assets resulting from operations | | | (74,117,863 | ) | | | (272,368,269 | ) |
| | |
Distributions to shareholders from net investment income: | | | | | | | | |
Class A | | | (5,633,187 | ) | | | (2,628,816 | ) |
Class B | | | (29,516 | ) | | | (33,895 | ) |
Class C | | | (761,740 | ) | | | (503,592 | ) |
Class Y | | | (666,811 | ) | | | (282,334 | ) |
Investor Class | | | (2,202,011 | ) | | | (1,144,790 | ) |
Class R5 | | | (320,856 | ) | | | (103,029 | ) |
Total distributions from net investment income | | | (9,614,121 | ) | | | (4,696,456 | ) |
| | |
Distributions to shareholders from net realized gains: | | | | | | | | |
Class A | | | — | | | | (3,869,101 | ) |
Class B | | | — | | | | (93,593 | ) |
Class C | | | — | | | | (1,390,565 | ) |
Class Y | | | — | | | | (362,445 | ) |
Investor Class | | | — | | | | (1,684,898 | ) |
Class R5 | | | — | | | | (124,425 | ) |
Total distributions from net realized gains | | | — | | | | (7,525,027 | ) |
| | |
Share transactions–net: | | | | | | | | |
Class A | | | (84,110,052 | ) | | | 36,888,020 | |
Class B | | | (4,516,179 | ) | | | (5,996,349 | ) |
Class C | | | (22,962,986 | ) | | | 8,239,159 | |
Class Y | | | 19,354,104 | | | | (12,300,352 | ) |
Investor Class | | | (32,928,074 | ) | | | (15,355,448 | ) |
Class R5 | | | (11,621,315 | ) | | | (4,409,440 | ) |
Class R6 | | | 10,000 | | | | — | |
Net increase (decrease) in net assets resulting from share transactions | | | (136,774,502 | ) | | | 7,065,590 | |
Net increase (decrease) in net assets | | | (220,506,486 | ) | | | (277,524,162 | ) |
| | |
Net assets: | | | | | | | | |
Beginning of year | | | 970,591,900 | | | | 1,248,116,062 | |
End of year (includes undistributed net investment income of $4,679,234 and $7,721,997, respectively) | | $ | 750,085,414 | | | $ | 970,591,900 | |
Notes to Financial Statements
April 30, 2017
NOTE 1—Significant Accounting Policies
Invesco Energy Fund (the “Fund”) is a series portfolio of AIM Sector Funds (Invesco Sector Funds) (the “Trust”). The Trust is a Delaware statutory trust registered under the Investment Company Act of 1940, as amended (the “1940 Act”), as an open-end series management investment company consisting of ten separate portfolios, each authorized to issue an unlimited number of shares of beneficial interest. The assets, liabilities and operations of each portfolio are accounted for separately. Information presented in these financial statements pertains only to the Fund. Matters affecting each portfolio or class will be voted on exclusively by the shareholders of such portfolio or class.
The Fund’s investment objective is long-term growth of capital.
The Fund currently consists of seven different classes of shares: Class A, Class B, Class C, Class Y, Investor Class, Class R5 and Class R6. On April 4, 2017, the Fund began offering Class R6 shares. Class Y and Investor Class shares are available only to certain investors. Class A shares are sold with a front-end sales charge unless certain waiver criteria are met and under certain circumstances load waived shares may be subject to contingent deferred sales charges (“CDSC”). Class C shares are sold with a CDSC. Class Y, Investor Class, Class R5 and Class R6 shares are sold at net asset value. Effective November 30, 2010, new or additional investments in Class B shares are no longer permitted. Existing shareholders of Class B
12 Invesco Energy Fund
shares may continue to reinvest dividends and capital gains distributions in Class B shares until they convert to Class A shares. Also, shareholders in Class B shares will be able to exchange those shares for Class B shares of other Invesco Funds offering such shares until they convert to Class A shares. Generally, Class B shares will automatically convert to Class A shares on or about the month-end, which is at least eight years after the date of purchase. Redemption of Class B shares prior to the conversion date will be subject to a CDSC.
The Fund is an investment company and accordingly follows the investment company accounting and reporting guidance in accordance with Financial Accounting Standards Board Accounting Standards Codification Topic 946, Financial Services — Investment Companies.
The following is a summary of the significant accounting policies followed by the Fund in the preparation of its financial statements.
| A. | Security Valuations — Securities, including restricted securities, are valued according to the following policy. |
A security listed or traded on an exchange (except convertible securities) is valued at its last sales price or official closing price as of the close of the customary trading session on the exchange where the security is principally traded, or lacking any sales or official closing price on a particular day, the security may be valued at the closing bid price on that day. Securities traded in the over-the-counter market are valued based on prices furnished by independent pricing services or market makers. When such securities are valued by an independent pricing service they may be considered fair valued. Futures contracts are valued at the final settlement price set by an exchange on which they are principally traded. Listed options are valued at the mean between the last bid and asked prices from the exchange on which they are principally traded. Options not listed on an exchange are valued by an independent source at the mean between the last bid and asked prices. For purposes of determining net asset value (“NAV”) per share, futures and option contracts generally are valued 15 minutes after the close of the customary trading session of the New York Stock Exchange (“NYSE”).
Investments in open-end and closed-end registered investment companies that do not trade on an exchange are valued at the end-of-day net asset value per share. Investments in open-end and closed-end registered investment companies that trade on an exchange are valued at the last sales price or official closing price as of the close of the customary trading session on the exchange where the security is principally traded.
Debt obligations (including convertible securities) and unlisted equities are fair valued using an evaluated quote provided by an independent pricing service. Evaluated quotes provided by the pricing service may be determined without exclusive reliance on quoted prices, and may reflect appropriate factors such as institution-size trading in similar groups of securities, developments related to specific securities, dividend rate (for unlisted equities), yield (for debt obligations), quality, type of issue, coupon rate (for debt obligations), maturity (for debt obligations), individual trading characteristics and other market data. Debt obligations are subject to interest rate and credit risks. In addition, all debt obligations involve some risk of default with respect to interest and/or principal payments.
Foreign securities’ (including foreign exchange contracts) prices are converted into U.S. dollar amounts using the applicable exchange rates as of the close of the NYSE. If market quotations are available and reliable for foreign exchange-traded equity securities, the securities will be valued at the market quotations. Because trading hours for certain foreign securities end before the close of the NYSE, closing market quotations may become unreliable. If between the time trading ends on a particular security and the close of the customary trading session on the NYSE, events occur that the Adviser determines are significant and make the closing price unreliable, the Fund may fair value the security. If the event is likely to have affected the closing price of the security, the security will be valued at fair value in good faith using procedures approved by the Board of Trustees. Adjustments to closing prices to reflect fair value may also be based on a screening process of an independent pricing service to indicate the degree of certainty, based on historical data, that the closing price in the principal market where a foreign security trades is not the current value as of the close of the NYSE. Foreign securities’ prices meeting the approved degree of certainty that the price is not reflective of current value will be priced at the indication of fair value from the independent pricing service. Multiple factors may be considered by the independent pricing service in determining adjustments to reflect fair value and may include information relating to sector indices, American Depositary Receipts and domestic and foreign index futures. Foreign securities may have additional risks including exchange rate changes, potential for sharply devalued currencies and high inflation, political and economic upheaval, the relative lack of issuer information, relatively low market liquidity and the potential lack of strict financial and accounting controls and standards.
Securities for which market prices are not provided by any of the above methods may be valued based upon quotes furnished by independent sources. The last bid price may be used to value equity securities. The mean between the last bid and asked prices is used to value debt obligations, including corporate loans.
Securities for which market quotations are not readily available or became unreliable are valued at fair value as determined in good faith by or under the supervision of the Trust’s officers following procedures approved by the Board of Trustees. Issuer specific events, market trends, bid/asked quotes of brokers and information providers and other market data may be reviewed in the course of making a good faith determination of a security’s fair value.
The Fund may invest in securities that are subject to interest rate risk, meaning the risk that the prices will generally fall as interest rates rise and, conversely, the prices will generally rise as interest rates fall. Specific securities differ in their sensitivity to changes in interest rates depending on their individual characteristics. Changes in interest rates may result in increased market volatility, which may affect the value and/or liquidity of certain Fund investments.
Valuations change in response to many factors including the historical and prospective earnings of the issuer, the value of the issuer’s assets, general economic conditions, interest rates, investor perceptions and market liquidity. Because of the inherent uncertainties of valuation, the values reflected in the financial statements may materially differ from the value received upon actual sale of those investments.
| B. | Securities Transactions and Investment Income — Securities transactions are accounted for on a trade date basis. Realized gains or losses on sales are computed on the basis of specific identification of the securities sold. Interest income (net of withholding tax, if any) is recorded on the accrual basis from settlement date. Dividend income (net of withholding tax, if any) is recorded on the ex-dividend date. |
The Fund may periodically participate in litigation related to Fund investments. As such, the Fund may receive proceeds from litigation settlements. Any proceeds received are included in the Statement of Operations as realized gain (loss) for investments no longer held and as unrealized gain (loss) for investments still held.
Brokerage commissions and mark ups are considered transaction costs and are recorded as an increase to the cost basis of securities purchased and/or a reduction of proceeds on a sale of securities. Such transaction costs are included in the determination of net realized and unrealized gain (loss) from investment securities reported in the Statement of Operations and the Statement of Changes in Net Assets and the net realized and unrealized gains (losses) on securities per share in the Financial Highlights. Transaction costs are included in the calculation of the
13 Invesco Energy Fund
Fund’s net asset value and, accordingly, they reduce the Fund’s total returns. These transaction costs are not considered operating expenses and are not reflected in net investment income reported in the Statement of Operations and the Statement of Changes in Net Assets, or the net investment income per share and the ratios of expenses and net investment income reported in the Financial Highlights, nor are they limited by any expense limitation arrangements between the Fund and the investment adviser.
The Fund allocates income and realized and unrealized capital gains and losses to a class based on the relative net assets of each class.
| C. | Country Determination — For the purposes of making investment selection decisions and presentation in the Schedule of Investments, the investment adviser may determine the country in which an issuer is located and/or credit risk exposure based on various factors. These factors include the laws of the country under which the issuer is organized, where the issuer maintains a principal office, the country in which the issuer derives 50% or more of its total revenues and the country that has the primary market for the issuer’s securities, as well as other criteria. Among the other criteria that may be evaluated for making this determination are the country in which the issuer maintains 50% or more of its assets, the type of security, financial guarantees and enhancements, the nature of the collateral and the sponsor organization. Country of issuer and/or credit risk exposure has been determined to be the United States of America, unless otherwise noted. |
| D. | Distributions — Distributions from net investment income and net realized capital gain, if any, are generally declared and paid annually and recorded on the ex-dividend date. The Fund may elect to treat a portion of the proceeds from redemptions as distributions for federal income tax purposes. |
| E. | Federal Income Taxes — The Fund intends to comply with the requirements of Subchapter M of the Internal Revenue Code of 1986, as amended (the “Internal Revenue Code”), necessary to qualify as a regulated investment company and to distribute substantially all of the Fund’s taxable earnings to shareholders. As such, the Fund will not be subject to federal income taxes on otherwise taxable income (including net realized capital gain) that is distributed to shareholders. Therefore, no provision for federal income taxes is recorded in the financial statements. |
The Fund recognizes the tax benefits of uncertain tax positions only when the position is more likely than not to be sustained. Management has analyzed the Fund’s uncertain tax positions and concluded that no liability for unrecognized tax benefits should be recorded related to uncertain tax positions. Management is not aware of any tax positions for which it is reasonably possible that the total amounts of unrecognized tax benefits will change materially in the next 12 months.
The Fund files tax returns in the U.S. Federal jurisdiction and certain other jurisdictions. Generally, the Fund is subject to examinations by such taxing authorities for up to three years after the filing of the return for the tax period.
| F. | Expenses — Fees provided for under the Rule 12b-1 plan of a particular class of the Fund are charged to the operations of such class. Transfer agency fees and expenses and other shareholder recordkeeping fees and expenses attributable to Class R5 and Class R6 are allocated to each share class based on relative net assets. Sub-accounting fees attributable to Class R5 are charged to the operations of the class. Transfer agency fees and expenses and other shareholder recordkeeping fees and expenses relating to all other classes are allocated among those classes based on relative net assets. All other expenses are allocated among the classes based on relative net assets. |
| G. | Accounting Estimates — The preparation of financial statements in conformity with accounting principles generally accepted in the United States of America (“GAAP”) requires management to make estimates and assumptions that affect the reported amounts of assets and liabilities at the date of the financial statements and the reported amounts of revenues and expenses during the reporting period including estimates and assumptions related to taxation. Actual results could differ from those estimates by a significant amount. In addition, the Fund monitors for material events or transactions that may occur or become known after the period-end date and before the date the financial statements are released to print. |
| H. | Indemnifications — Under the Trust’s organizational documents, each Trustee, officer, employee or other agent of the Trust is indemnified against certain liabilities that may arise out of the performance of their duties to the Fund. Additionally, in the normal course of business, the Fund enters into contracts, including the Fund’s servicing agreements, that contain a variety of indemnification clauses. The Fund’s maximum exposure under these arrangements is unknown as this would involve future claims that may be made against the Fund that have not yet occurred. The risk of material loss as a result of such indemnification claims is considered remote. |
| I. | Foreign Currency Translations — Foreign currency is valued at the close of the NYSE based on quotations posted by banks and major currency dealers. Portfolio securities and other assets and liabilities denominated in foreign currencies are translated into U.S. dollar amounts at date of valuation. Purchases and sales of portfolio securities (net of foreign taxes withheld on disposition) and income items denominated in foreign currencies are translated into U.S. dollar amounts on the respective dates of such transactions. The Fund does not separately account for the portion of the results of operations resulting from changes in foreign exchange rates on investments and the fluctuations arising from changes in market prices of securities held. The combined results of changes in foreign exchange rates and the fluctuation of market prices on investments (net of estimated foreign tax withholding) are included with the net realized and unrealized gain or loss from investments in the Statement of Operations. Reported net realized foreign currency gains or losses arise from (1) sales of foreign currencies, (2) currency gains or losses realized between the trade and settlement dates on securities transactions, and (3) the difference between the amounts of dividends, interest, and foreign withholding taxes recorded on the Fund’s books and the U.S. dollar equivalent of the amounts actually received or paid. Net unrealized foreign currency gains and losses arise from changes in the fair values of assets and liabilities, other than investments in securities at fiscal period end, resulting from changes in exchange rates. |
The Fund may invest in foreign securities, which may be subject to foreign taxes on income, gains on investments or currency repatriation, a portion of which may be recoverable. Foreign taxes, if any, are recorded based on the tax regulations and rates that exist in the foreign markets in which the Fund invests and are shown in the Statement of Operations.
| J. | Forward Foreign Currency Contracts — The Fund may engage in foreign currency transactions either on a spot (i.e. for prompt delivery and settlement) basis, or through forward foreign currency contracts, to manage or minimize currency or exchange rate risk. |
The Fund may also enter into forward foreign currency contracts for the purchase or sale of a security denominated in a foreign currency in order to “lock in” the U.S. dollar price of that security, or the Fund may also enter into forward foreign currency contracts that do not provide for physical settlement of the two currencies, but instead are settled by a single cash payment calculated as the difference between the agreed upon exchange rate and the spot rate at settlement based upon an agreed upon notional amount (non-deliverable forwards). The Fund will set aside liquid assets in an amount equal to the daily mark-to-market obligation for forward foreign currency contracts.
14 Invesco Energy Fund
A forward foreign currency contract is an obligation between two parties (“Counterparties”) to purchase or sell a specific currency for an agreed-upon price at a future date. The use of forward foreign currency contracts does not eliminate fluctuations in the price of the underlying securities the Fund owns or intends to acquire but establishes a rate of exchange in advance. Fluctuations in the value of these contracts are measured by the difference in the contract date and reporting date exchange rates and are recorded as unrealized appreciation (depreciation) until the contracts are closed. When the contracts are closed, realized gains (losses) are recorded. Realized and unrealized gains (losses) on the contracts are included in the Statement of Operations. The primary risks associated with forward foreign currency contracts include failure of the Counterparty to meet the terms of the contract and the value of the foreign currency changing unfavorably. These risks may be in excess of the amounts reflected in the Statement of Assets and Liabilities.
| K. | Other Risks — The Fund’s investments are concentrated in a comparatively narrow segment of the economy, which may make the Fund more volatile. |
The businesses in which the Fund invests may be adversely affected by foreign, federal or state regulations governing energy production, distribution and sale. Although individual security selection drives the performance of the Fund, short-term fluctuations in commodity prices may cause price fluctuations in its shares.
NOTE 2—Advisory Fees and Other Fees Paid to Affiliates
The Trust has entered into a master investment advisory agreement with Invesco Advisers, Inc. (the “Adviser” or “Invesco”). Under the terms of the investment advisory agreement, the Fund pays an advisory fee to the Adviser based on the annual rate of the Fund’s average daily net assets as follows:
| | | | | | | | |
| Average Daily Net Assets | | Rate | |
First $350 million | | | 0 | .75% | | | | |
Next $350 million | | | 0 | .65% | | | | |
Next $1.3 billion | | | 0 | .55% | | | | |
Next $2 billion | | | 0 | .45% | | | | |
Next $2 billion | | | 0 | .40% | | | | |
Next $2 billion | | | 0 | .375% | | | | |
Over $8 billion | | | 0 | .35% | | | | |
For the year ended April 30, 2017, the effective advisory fees incurred by the Fund was 0.67%.
Under the terms of a master sub-advisory agreement between the Adviser and each of Invesco Asset Management Deutschland GmbH, Invesco Asset Management Limited, Invesco Asset Management (Japan) Limited, Invesco Hong Kong Limited, Invesco Senior Secured Management, Inc. and Invesco Canada Ltd. (collectively, the “Affiliated Sub-Advisers”) the Adviser, not the Fund, will pay 40% of the fees paid to the Adviser to any such Affiliated Sub-Adviser(s) that provide(s) discretionary investment management services to the Fund based on the percentage of assets allocated to such Affiliated Sub-Adviser(s).
The Adviser has contractually agreed, through at least June 30, 2018, to waive advisory fees and/or reimburse expenses of all shares to the extent necessary to limit total annual fund operating expenses after fee waiver and/or expense reimbursement (excluding certain items discussed below) of Class A, Class B, Class C, Class Y, Investor Class, Class R5 and Class R6 shares to 2.00%, 2.75%, 2.75%, 1.75%, 2.00%, 1.75% and 1.75%, respectively, of average daily net assets (the “expense limits”). In determining the Adviser’s obligation to waive advisory fees and/or reimburse expenses, the following expenses are not taken into account, and could cause the total annual fund operating expenses after fee waivers and/or expense reimbursement to exceed the numbers reflected above: (1) interest; (2) taxes; (3) dividend expense on short sales; (4) extraordinary or non-routine items, including litigation expenses; and (5) expenses that the Fund has incurred but did not actually pay because of an expense offset arrangement. Unless Invesco continues the fee waiver agreement, it will terminate on June 30, 2018. During its term, the fee waiver agreement cannot be terminated or amended to increase the expense limits without approval of the Board of Trustees. The Adviser did not waive fees and/or reimburse expenses during the period under these expense limits.
Further, the Adviser has contractually agreed, through at least June 30, 2019, to waive the advisory fee payable by the Fund in an amount equal to 100% of the net advisory fees the Adviser receives from the affiliated money market funds on investments by the Fund of uninvested cash in such affiliated money market funds.
For the year ended April 30, 2017, the Adviser waived advisory fees of $32,132.
The Trust has entered into a master administrative services agreement with Invesco pursuant to which the Fund has agreed to pay Invesco for certain administrative costs incurred in providing accounting services to the Fund. For the year ended April 30, 2017, expenses incurred under the agreement are shown in the Statement of Operations as Administrative services fees.
The Trust has entered into a transfer agency and service agreement with Invesco Investment Services, Inc. (“IIS”) pursuant to which the Fund has agreed to pay IIS a fee for providing transfer agency and shareholder services to the Fund and reimburse IIS for certain expenses incurred by IIS in the course of providing such services. IIS may make payments to intermediaries that provide omnibus account services, sub-accounting services and/or networking services. All fees payable by IIS to intermediaries that provide omnibus account services or sub-accounting are charged back to the Fund, subject to certain limitations approved by the Trust’s Board of Trustees. For the year ended April 30, 2017, expenses incurred under the agreement are shown in the Statement of Operations as Transfer agent fees.
The Trust has entered into master distribution agreements with Invesco Distributors, Inc. (“IDI”) to serve as the distributor for the Class A, Class B, Class C, Class Y, Investor Class, Class R5 and Class R6 shares of the Fund. The Trust has adopted plans pursuant to Rule 12b-1 under the 1940 Act with respect to the Fund’s Class A, Class B, Class C and Investor Class shares (collectively, the “Plans”). The Fund, pursuant to the Plans, pays IDI compensation at the annual rate of 0.25% of the Fund’s average daily net assets of Class A shares, 1.00% of the average daily net assets of Class B and Class C shares and 0.25% of the average daily net assets of Investor Class shares. Of the Plan payments, up to 0.25% of the average daily net assets of each class of shares may be paid to furnish continuing personal shareholder services to customers who purchase and own shares of such
15 Invesco Energy Fund
classes. Any amounts not paid as a service fee under the Plans would constitute an asset-based sales charge. Rules of the Financial Industry Regulatory Authority (“FINRA”) impose a cap on the total sales charges, including asset-based sales charges, that may be paid by any class of shares of the Fund. For the year ended April 30, 2017, expenses incurred under the Plan are shown in the Statement of Operations as Distribution fees.
Front-end sales commissions and CDSC (collectively, the “sales charges”) are not recorded as expenses of the Fund. Front-end sales commissions are deducted from proceeds from the sales of Fund shares prior to investment in Class A shares of the Fund. CDSC are deducted from redemption proceeds prior to remittance to the shareholder. During the year ended April 30, 2017, IDI advised the Fund that IDI retained $148,172 in front-end sales commissions from the sale of Class A shares and $9,570, $1,312 and $8,491 from Class A, Class B and Class C shares, respectively, for CDSC imposed on redemptions by shareholders.
For the year ended April 30, 2017, the Fund incurred $2,516 in brokerage commissions with Invesco Capital Markets, Inc., an affiliate of the Adviser and IDI, for portfolio transactions executed on behalf of the Fund.
Certain officers and trustees of the Trust are officers and directors of the Adviser, IIS and/or IDI.
NOTE 3—Additional Valuation Information
GAAP defines fair value as the price that would be received to sell an asset or paid to transfer a liability in an orderly transaction between market participants at the measurement date, under current market conditions. GAAP establishes a hierarchy that prioritizes the inputs to valuation methods, giving the highest priority to readily available unadjusted quoted prices in an active market for identical assets (Level 1) and the lowest priority to significant unobservable inputs (Level 3), generally when market prices are not readily available or are unreliable. Based on the valuation inputs, the securities or other investments are tiered into one of three levels. Changes in valuation methods may result in transfers in or out of an investment’s assigned level:
| | Level 1 — | Prices are determined using quoted prices in an active market for identical assets. |
| | Level 2 — | Prices are determined using other significant observable inputs. Observable inputs are inputs that other market participants may use in pricing a security. These may include quoted prices for similar securities, interest rates, prepayment speeds, credit risk, yield curves, loss severities, default rates, discount rates, volatilities and others. |
| | Level 3 — | Prices are determined using significant unobservable inputs. In situations where quoted prices or observable inputs are unavailable (for example, when there is little or no market activity for an investment at the end of the period), unobservable inputs may be used. Unobservable inputs reflect the Fund’s own assumptions about the factors market participants would use in determining fair value of the securities or instruments and would be based on the best available information. |
The following is a summary of the tiered valuation input levels, as of April 30, 2017. The level assigned to the securities valuations may not be an indication of the risk or liquidity associated with investing in those securities. Because of the inherent uncertainties of valuation, the values reflected in the financial statements may materially differ from the value received upon actual sale of those investments.
| | | | | | | | | | | | | | | | |
| | | Level 1 | | | Level 2 | | | Level 3 | | | Total | |
Common Stocks & Other Equity Interests | | $ | 739,824,954 | | | $ | — | | | $ | — | | | $ | 739,824,954 | |
Bonds & Notes | | | — | | | | 5,117,442 | | | | — | | | | 5,117,442 | |
Money Market Funds | | | 11,657,835 | | | | — | | | | — | | | | 11,657,835 | |
Total Investments | | $ | 751,482,789 | | | $ | 5,117,442 | | | $ | — | | | $ | 756,600,231 | |
NOTE 4—Expense Offset Arrangement(s)
The expense offset arrangement is comprised of transfer agency credits which result from balances in demand deposit accounts used by the transfer agent for clearing shareholder transactions. For the year ended April 30, 2017, the Fund received credits from this arrangement, which resulted in the reduction of the Fund’s total expenses of $14,539.
NOTE 5—Trustees’ and Officers’ Fees and Benefits
Trustees’ and Officers’ Fees and Benefits include amounts accrued by the Fund to pay remuneration to certain Trustees and Officers of the Fund. Trustees have the option to defer compensation payable by the Fund, and Trustees’ and Officers’ Fees and Benefits also include amounts accrued by the Fund to fund such deferred compensation amounts. Those Trustees who defer compensation have the option to select various Invesco Funds in which their deferral accounts shall be deemed to be invested. Finally, certain current Trustees were eligible to participate in a retirement plan that provided for benefits to be paid upon retirement to Trustees over a period of time based on the number of years of service. The Fund may have certain former Trustees who also participate in a retirement plan and receive benefits under such plan. Trustees’ and Officers’ Fees and Benefits include amounts accrued by the Fund to fund such retirement benefits. Obligations under the deferred compensation and retirement plans represent unsecured claims against the general assets of the Fund.
NOTE 6—Cash Balances
The Fund is permitted to temporarily carry a negative or overdrawn balance in its account with State Street Bank and Trust Company, the custodian bank. Such balances, if any at period-end, are shown in the Statement of Assets and Liabilities under the payable caption Amount due custodian. To compensate the custodian bank for such overdrafts, the overdrawn Fund may either (1) leave funds as a compensating balance in the account so the custodian bank can be compensated by earning the additional interest; or (2) compensate by paying the custodian bank at a rate agreed upon by the custodian bank and Invesco, not to exceed the contractually agreed upon rate.
16 Invesco Energy Fund
NOTE 7—Distributions to Shareholders and Tax Components of Net Assets
Tax Character of Distributions to Shareholders Paid During the Fiscal Years Ended April 30, 2017 and 2016:
| | | | | | | | |
| | | 2017 | | | 2016 | |
Ordinary income | | $ | 9,614,121 | | | $ | 4,726,512 | |
Long-term capital gain | | | — | | | | 7,494,971 | |
Total distributions | | $ | 9,614,121 | | | $ | 12,221,483 | |
Tax Components of Net Assets at Period-End:
| | | | |
| | | 2017 | |
Undistributed ordinary income | | $ | 7,563,559 | |
Net unrealized appreciation (depreciation) — investments | | | (142,578,916 | ) |
Net unrealized appreciation (depreciation) — other investments | | | (7,228 | ) |
Temporary book/tax differences | | | (278,390 | ) |
Capital loss carryforward | | | (132,913,510 | ) |
Shares of beneficial interest | | | 1,018,299,899 | |
Total net assets | | $ | 750,085,414 | |
The difference between book-basis and tax-basis unrealized appreciation (depreciation) is due to differences in the timing of recognition of gains and losses on investments for tax and book purposes. The Fund’s net unrealized appreciation (depreciation) difference is attributable primarily to wash sales and passive foreign investment companies.
The temporary book/tax differences are a result of timing differences between book and tax recognition of income and/or expenses. The Fund’s temporary book/tax differences are the result of the trustee deferral of compensation and retirement plan benefits.
Capital loss carryforward is calculated and reported as of a specific date. Results of transactions and other activity after that date may affect the amount of capital loss carryforward actually available for the Fund to utilize. Capital losses generated in years beginning after December 22, 2010 can be carried forward for an unlimited period, whereas previous losses expire in eight tax years. Capital losses with an expiration period may not be used to offset capital gains until all net capital losses without an expiration date have been utilized. Capital loss carryforwards with no expiration date will retain their character as either short-term or long-term capital losses instead of as short-term capital losses as under prior law. The ability to utilize capital loss carryforwards in the future may be limited under the Internal Revenue Code and related regulations based on the results of future transactions.
The Fund has a capital loss carryforward as of April 30, 2017, which expires as follows:
| | | | | | | | | | | | |
| Capital Loss Carryforward* | |
| Expiration | | Short-Term | | | Long-Term | | | Total | |
Not subject to expiration | | $ | 11,569,163 | | | $ | 121,344,347 | | | $ | 132,913,510 | |
| * | Capital loss carryforward as of the date listed above is reduced for limitations, if any, to the extent required by the Internal Revenue Code and may be further limited depending upon a variety of factors, including the realization of net unrealized gains or losses as of the date of any reorganization. |
NOTE 8—Investment Securities
The aggregate amount of investment securities (other than short-term securities, U.S. Treasury obligations and money market funds, if any) purchased and sold by the Fund during the year ended April 30, 2017 was $191,159,799 and $309,174,623, respectively. Cost of investments on a tax basis includes the adjustments for financial reporting purposes as of the most recently completed federal income tax reporting period-end.
| | | | |
| Unrealized Appreciation (Depreciation) of Investment Securities on a Tax Basis | |
Aggregate unrealized appreciation of investment securities | | $ | 74,239,961 | |
Aggregate unrealized (depreciation) of investment securities | | | (216,818,877 | ) |
Net unrealized appreciation (depreciation) of investment securities | | $ | (142,578,916 | ) |
Cost of investments for tax purposes is $899,179,147.
NOTE 9—Reclassification of Permanent Differences
Primarily as a result of differing book/tax treatment of foreign currency transactions, on April 30, 2017, undistributed net investment income was decreased by $120,769 and undistributed net realized gain (loss) was increased by $120,769. This reclassification had no effect on the net assets of the Fund.
17 Invesco Energy Fund
NOTE 10—Share Information
| | | | | | | | | | | | | | | | |
| | | Summary of Share Activity | |
| | | Years ended April 30, | |
| | | 2017(a) | | | 2016 | |
| | | Shares | | | Amount | | | Shares | | | Amount | |
Sold: | | | | | | | | | | | | | | | | |
Class A | | | 4,127,022 | | | $ | 109,294,080 | | | | 6,894,091 | | | $ | 176,267,338 | |
Class B | | | 10,798 | | | | 252,897 | | | | 21,584 | | | | 477,610 | |
Class C | | | 805,712 | | | | 18,191,637 | | | | 2,203,746 | | | | 48,361,914 | |
Class Y | | | 1,826,182 | | | | 48,044,192 | | | | 1,296,407 | | | | 32,163,137 | |
Investor Class | | | 1,343,277 | | | | 35,876,212 | | | | 1,637,230 | | | | 42,164,528 | |
Class R5 | | | 274,247 | | | | 7,469,371 | | | | 618,487 | | | | 15,480,249 | |
Class R6(b) | | | 384 | | | | 10,000 | | | | — | | | | — | |
| | | | |
Issued as reinvestment of dividends: | | | | | | | | | | | | | | | | |
Class A | | | 180,720 | | | | 5,287,869 | | | | 262,886 | | | | 6,062,150 | |
Class B | | | 1,085 | | | | 27,889 | | | | 5,755 | | | | 116,832 | |
Class C | | | 28,289 | | | | 706,088 | | | | 90,762 | | | | 1,789,822 | |
Class Y | | | 18,549 | | | | 544,029 | | | | 23,589 | | | | 545,147 | |
Investor Class | | | 73,100 | | | | 2,129,412 | | | | 119,305 | | | | 2,740,428 | |
Class R5 | | | 10,664 | | | | 320,122 | | | | 9,584 | | | | 226,565 | |
| | | | |
Automatic conversion of Class B shares to Class A shares: | | | | | | | | | | | | | | | | |
Class A | | | 120,555 | | | | 3,129,003 | | | | 127,309 | | | | 3,366,261 | |
Class B | | | (137,564 | ) | | | (3,129,003 | ) | | | (144,636 | ) | | | (3,366,261 | ) |
| | | | |
Reacquired: | | | | | | | | | | | | | | | | |
Class A | | | (7,676,448 | ) | | | (201,821,004 | ) | | | (5,728,346 | ) | | | (148,807,729 | ) |
Class B | | | (72,334 | ) | | | (1,667,962 | ) | | | (136,763 | ) | | | (3,224,530 | ) |
Class C | | | (1,862,323 | ) | | | (41,860,711 | ) | | | (1,897,549 | ) | | | (41,912,577 | ) |
Class Y | | | (1,123,993 | ) | | | (29,234,117 | ) | | | (1,663,347 | ) | | | (45,008,636 | ) |
Investor Class | | | (2,706,747 | ) | | | (70,933,698 | ) | | | (2,317,117 | ) | | | (60,260,404 | ) |
Class R5 | | | (736,228 | ) | | | (19,410,808 | ) | | | (709,269 | ) | | | (20,116,254 | ) |
Net increase (decrease) in share activity | | | (5,495,053 | ) | | $ | (136,774,502 | ) | | | 713,708 | | | $ | 7,065,590 | |
| (a) | There are entities that are record owners of more than 5% of the outstanding shares of the Fund and in the aggregate own 29% of the outstanding shares of the Fund. IDI has an agreement with these entities to sell Fund shares. The Fund, Invesco and/or Invesco affiliates may make payments to these entities, which are considered to be related to the Fund, for providing services to the Fund, Invesco and/or Invesco affiliates including but not limited to services such as securities brokerage, distribution, third party record keeping and account servicing. The Fund has no knowledge as to whether all or any portion of the shares owned of record by these entities are also owned beneficially. |
| (b) | Commencement date of April 4, 2017. |
18 Invesco Energy Fund
NOTE 11—Financial Highlights
The following schedule presents financial highlights for a share of the Fund outstanding throughout the periods indicated.
| | | | | | | | | | | | | | | | | | | | | | | | | | | | | | | | | | | | | | | | | | | | | | | | | | | | | | | | |
| | | Net asset
value,
beginning
of period | | | Net
investment
income
(loss)(a) | | | Net gains
(losses)
on securities
(both
realized and
unrealized) | | | Total from
investment
operations | | | Dividends
from net
investment
income | | | Distributions
from net
realized
gains | | | Total
distributions | | | Net asset
value, end
of period | | | Total
return(b) | | | Net assets,
end of period
(000’s omitted) | | | Ratio of
expenses
to average
net assets
with fee waivers
and/or expenses
absorbed | | | Ratio of
expenses
to average net
assets without
fee waivers
and/or expenses
absorbed | | | Ratio of net
investment
income (loss)
to average
net assets | | | Portfolio
turnover(c) | |
Class A | | | | | | | | | | | | | | | | | | | | | | | | | | | | | | | | | | | | | | | | | |
Year ended 04/30/17 | | $ | 27.04 | | | $ | 0.22 | | | $ | (2.41 | ) | | $ | (2.19 | ) | | $ | (0.31 | ) | | $ | — | | | $ | (0.31 | ) | | $ | 24.54 | | | | (8.29 | )% | | $ | 393,998 | | | | 1.27 | %(d) | | | 1.27 | %(d) | | | 0.84 | %(d) | | | 22 | % |
Year ended 04/30/16 | | | 35.41 | | | | 0.27 | | | | (8.28 | )(e) | | | (8.01 | ) | | | (0.15 | ) | | | (0.21 | ) | | | (0.36 | ) | | | 27.04 | | | | (22.45 | )(e) | | | 521,910 | | | | 1.26 | | | | 1.27 | | | | 1.05 | | | | 22 | |
Year ended 04/30/15 | | | 49.87 | | | | 0.29 | | | | (10.33 | ) | | | (10.04 | ) | | | (0.13 | ) | | | (4.29 | ) | | | (4.42 | ) | | | 35.41 | | | | (18.60 | ) | | | 628,443 | | | | 1.16 | | | | 1.17 | | | | 0.69 | | | | 27 | |
Year ended 04/30/14 | | | 40.52 | | | | 0.19 | | | | 9.57 | | | | 9.76 | | | | (0.20 | ) | | | (0.21 | ) | | | (0.41 | ) | | | 49.87 | | | | 24.23 | | | | 662,813 | | | | 1.15 | | | | 1.15 | | | | 0.43 | | | | 14 | |
Year ended 04/30/13 | | | 39.00 | | | | 0.14 | | | | 1.38 | | | | 1.52 | | | | — | | | | — | | | | — | | | | 40.52 | | | | 3.90 | | | | 619,826 | | | | 1.15 | | | | 1.16 | | | | 0.37 | | | | 56 | |
Class B | | | | | | | | | | | | | | | | | | | | | | | | | | | | | | | | | | | | | | | | | |
Year ended 04/30/17 | | | 23.73 | | | | 0.02 | | | | (2.13 | ) | | | (2.11 | ) | | | (0.12 | ) | | | — | | | | (0.12 | ) | | | 21.50 | | | | (8.96 | ) | | | 3,299 | | | | 2.02 | (d) | | | 2.02 | (d) | | | 0.09 | (d) | | | 22 | |
Year ended 04/30/16 | | | 31.28 | | | | 0.07 | | | | (7.33 | )(e) | | | (7.26 | ) | | | (0.08 | ) | | | (0.21 | ) | | | (0.29 | ) | | | 23.73 | | | | (23.05 | )(e) | | | 8,341 | | | | 2.01 | | | | 2.02 | | | | 0.30 | | | | 22 | |
Year ended 04/30/15 | | | 44.93 | | | | (0.02 | ) | | | (9.34 | ) | | | (9.36 | ) | | | — | | | | (4.29 | ) | | | (4.29 | ) | | | 31.28 | | | | (19.20 | ) | | | 18,940 | | | | 1.91 | | | | 1.92 | | | | (0.06 | ) | | | 27 | |
Year ended 04/30/14 | | | 36.63 | | | | (0.13 | ) | | | 8.64 | | | | 8.51 | | | | — | | | | (0.21 | ) | | | (0.21 | ) | | | 44.93 | | | | 23.31 | | | | 37,293 | | | | 1.90 | | | | 1.90 | | | | (0.32 | ) | | | 14 | |
Year ended 04/30/13 | | | 35.52 | | | | (0.13 | ) | | | 1.24 | | | | 1.11 | | | | — | | | | — | | | | — | | | | 36.63 | | | | 3.12 | | | | 50,241 | | | | 1.90 | | | | 1.91 | | | | (0.38 | ) | | | 56 | |
Class C | | | | | | | | | | | | | | | | | | | | | | | | | | | | | | | | | | | | | | | | | |
Year ended 04/30/17 | | | 23.05 | | | | 0.02 | | | | (2.07 | ) | | | (2.05 | ) | | | (0.12 | ) | | | — | | | | (0.12 | ) | | | 20.88 | | | | (8.97 | ) | | | 120,722 | | | | 2.02 | (d) | | | 2.02 | (d) | | | 0.09 | (d) | | | 22 | |
Year ended 04/30/16 | | | 30.39 | | | | 0.06 | | | | (7.11 | )(e) | | | (7.05 | ) | | | (0.08 | ) | | | (0.21 | ) | | | (0.29 | ) | | | 23.05 | | | | (23.03 | )(e) | | | 156,964 | | | | 2.01 | | | | 2.02 | | | | 0.30 | | | | 22 | |
Year ended 04/30/15 | | | 43.83 | | | | (0.02 | ) | | | (9.13 | ) | | | (9.15 | ) | | | — | | | | (4.29 | ) | | | (4.29 | ) | | | 30.39 | | | | (19.21 | ) | | | 194,893 | | | | 1.91 | | | | 1.92 | | | | (0.06 | ) | | | 27 | |
Year ended 04/30/14 | | | 35.74 | | | | (0.13 | ) | | | 8.43 | | | | 8.30 | | | | — | | | | (0.21 | ) | | | (0.21 | ) | | | 43.83 | | | | 23.31 | | | | 177,502 | | | | 1.90 | | | | 1.90 | | | | (0.32 | ) | | | 14 | |
Year ended 04/30/13 | | | 34.66 | | | | (0.13 | ) | | | 1.21 | | | | 1.08 | | | | — | | | | — | | | | — | | | | 35.74 | | | | 3.12 | | | | 164,978 | | | | 1.90 | | | | 1.91 | | | | (0.38 | ) | | | 56 | |
Class Y | | | | | | | | | | | | | | | | | | | | | | | | | | | | | | | | | | | | | | | | | |
Year ended 04/30/17 | | | 27.12 | | | | 0.29 | | | | (2.41 | ) | | | (2.12 | ) | | | (0.37 | ) | | | — | | | | (0.37 | ) | | | 24.63 | | | | (8.03 | ) | | | 63,783 | | | | 1.02 | (d) | | | 1.02 | (d) | | | 1.09 | (d) | | | 22 | |
Year ended 04/30/16 | | | 35.47 | | | | 0.34 | | | | (8.31 | )(e) | | | (7.97 | ) | | | (0.17 | ) | | | (0.21 | ) | | | (0.38 | ) | | | 27.12 | | | | (22.28 | )(e) | | | 50,706 | | | | 1.01 | | | | 1.02 | | | | 1.30 | | | | 22 | |
Year ended 04/30/15 | | | 50.00 | | | | 0.38 | | | | (10.37 | ) | | | (9.99 | ) | | | (0.25 | ) | | | (4.29 | ) | | | (4.54 | ) | | | 35.47 | | | | (18.38 | ) | | | 78,476 | | | | 0.91 | | | | 0.92 | | | | 0.94 | | | | 27 | |
Year ended 04/30/14 | | | 40.70 | | | | 0.30 | | | | 9.60 | | | | 9.90 | | | | (0.39 | ) | | | (0.21 | ) | | | (0.60 | ) | | | 50.00 | | | | 24.54 | | | | 65,123 | | | | 0.90 | | | | 0.90 | | | | 0.68 | | | | 14 | |
Year ended 04/30/13 | | | 39.07 | | | | 0.23 | | | | 1.40 | | | | 1.63 | | | | — | | | | — | | | | — | | | | 40.70 | | | | 4.17 | | | | 55,196 | | | | 0.90 | | | | 0.91 | | | | 0.62 | | | | 56 | |
Investor Class | | | | | | | | | | | | | | | | | | | | | | | | | | | | | | | | | | | | | | | | | | | | | | | | | | | | | | | | |
Year ended 04/30/17 | | | 26.93 | | | | 0.22 | | | | (2.40 | ) | | | (2.18 | ) | | | (0.31 | ) | | | — | | | | (0.31 | ) | | | 24.44 | | | | (8.29 | ) | | | 159,402 | | | | 1.27 | (d) | | | 1.27 | (d) | | | 0.84 | (d) | | | 22 | |
Year ended 04/30/16 | | | 35.27 | | | | 0.27 | | | | (8.25 | )(e) | | | (7.98 | ) | | | (0.15 | ) | | | (0.21 | ) | | | (0.36 | ) | | | 26.93 | | | | (22.45 | )(e) | | | 210,374 | | | | 1.26 | | | | 1.27 | | | | 1.05 | | | | 22 | |
Year ended 04/30/15 | | | 49.69 | | | | 0.29 | | | | (10.29 | ) | | | (10.00 | ) | | | (0.13 | ) | | | (4.29 | ) | | | (4.42 | ) | | | 35.27 | | | | (18.59 | ) | | | 295,318 | | | | 1.16 | | | | 1.17 | | | | 0.69 | | | | 27 | |
Year ended 04/30/14 | | | 40.38 | | | | 0.19 | | | | 9.53 | | | | 9.72 | | | | (0.20 | ) | | | (0.21 | ) | | | (0.41 | ) | | | 49.69 | | | | 24.22 | | | | 419,142 | | | | 1.15 | | | | 1.15 | | | | 0.43 | | | | 14 | |
Year ended 04/30/13 | | | 38.86 | | | | 0.14 | | | | 1.38 | | | | 1.52 | | | | — | | | | — | | | | — | | | | 40.38 | | | | 3.91 | | | | 363,981 | | | | 1.15 | | | | 1.16 | | | | 0.37 | | | | 56 | |
Class R5 | | | | | | | | | | | | | | | | | | | | | | | | | | | | | | | | | | | | | | | | | |
Year ended 04/30/17 | | | 27.77 | | | | 0.34 | | | | (2.46 | ) | | | (2.12 | ) | | | (0.42 | ) | | | — | | | | (0.42 | ) | | | 25.23 | | | | (7.88 | ) | | | 8,871 | | | | 0.86 | (d) | | | 0.86 | (d) | | | 1.25 | (d) | | | 22 | |
Year ended 04/30/16 | | | 36.24 | | | | 0.40 | | | | (8.48 | )(e) | | | (8.08 | ) | | | (0.18 | ) | | | (0.21 | ) | | | (0.39 | ) | | | 27.77 | | | | (22.10 | )(e) | | | 22,298 | | | | 0.84 | | | | 0.85 | | | | 1.47 | | | | 22 | |
Year ended 04/30/15 | | | 50.97 | | | | 0.44 | | | | (10.57 | ) | | | (10.13 | ) | | | (0.31 | ) | | | (4.29 | ) | | | (4.60 | ) | | | 36.24 | | | | (18.30 | ) | | | 32,046 | | | | 0.79 | | | | 0.80 | | | | 1.06 | | | | 27 | |
Year ended 04/30/14 | | | 41.51 | | | | 0.35 | | | | 9.80 | | | | 10.15 | | | | (0.48 | ) | | | (0.21 | ) | | | (0.69 | ) | | | 50.97 | | | | 24.68 | | | | 31,942 | | | | 0.79 | | | | 0.79 | | | | 0.79 | | | | 14 | |
Year ended 04/30/13 | | | 39.81 | | | | 0.29 | | | | 1.41 | | | | 1.70 | | | | — | | | | — | | | | — | | | | 41.51 | | | | 4.27 | | | | 24,693 | | | | 0.78 | | | | 0.79 | | | | 0.74 | | | | 56 | |
Class R6 | | | | | | | | | | | | | | | | | | | | | | | | | | | | | | | | | | | | | | | | | |
Year ended 04/30/17(f) | | | 26.31 | | | | 0.03 | | | | (1.11 | ) | | | (1.08 | ) | | | — | | | | — | | | | — | | | | 25.23 | | | | (4.11 | ) | | | 10 | | | | 0.81 | (d)(g) | | | 0.81 | (d)(g) | | | 1.30 | (d)(g) | | | 22 | |
| (a) | Calculated using average shares outstanding. |
| (b) | Includes adjustments in accordance with accounting principles generally accepted in the United States of America and as such, the net asset value for financial reporting purposes and the returns based upon those net asset values may differ from the net asset value and returns for shareholder transactions. Does not include sales charges and is not annualized for periods less than one year, if applicable. |
| (c) | Portfolio turnover is calculated at the fund level and is not annualized for periods less than one year, if applicable. |
| (d) | Ratios are based on average daily net assets (000’s omitted) of $488,661, $6,003, $143,293, $51,151, $189,610, $20,563 and $10 for Class A, Class B, Class C, Class Y, Investor Class, Class R5 and Class R6 shares, respectively. |
| (e) | Includes litigation proceeds received during the period. Had these litigation proceeds not been received, Net gains (losses) on securities (both realized and unrealized) per share would have been $(8.21), $(7.26), $(7.04), $(8.24), $(8.18) and $(8.41). Total returns would have been lower. |
| (f) | Commencement date of April 4, 2017 for Class R6 shares. |
19 Invesco Energy Fund
Report of Independent Registered Public Accounting Firm
To the Board of Trustees of AIM Sector Funds (Invesco Sector Funds)
and Shareholders of the Invesco Energy Fund:
In our opinion, the accompanying statement of assets and liabilities, including the schedule of investments, and the related statements of operations and of changes in net assets and the financial highlights present fairly, in all material respects, the financial position of the Invesco Energy Fund (one of the portfolios constituting the AIM Sector Funds (Invesco Sector Funds), hereafter referred to as the “Fund”) as of April 30, 2017, the results of its operations for the year then ended, the changes its net assets for each of the two years in the period then ended and the financial highlights for each of the five years in the period then ended, in conformity with accounting principles generally accepted in the United States of America. These financial statements and financial highlights (hereafter referred to as “financial statements”) are the responsibility of the Fund’s management. Our responsibility is to express an opinion on these financial statements based on our audits. We conducted our audits of these financial statements in accordance with the standards of the Public Company Accounting Oversight Board (United States). Those standards require that we plan and perform the audit to obtain reasonable assurance about whether the financial statements are free of material misstatement. An audit includes examining, on a test basis, evidence supporting the amounts and disclosures in the financial statements, assessing the accounting principles used and significant estimates made by management, and evaluating the overall financial statement presentation. We believe that our audits, which included confirmation of securities as of April 30, 2017 by correspondence with the custodian and brokers, provide a reasonable basis for our opinion.
PricewaterhouseCoopers LLP
Houston, TX
June 23, 2017
20 Invesco Energy Fund
Calculating your ongoing Fund expenses
Example
As a shareholder of the Fund, you incur two types of costs: (1) transaction costs, which may include sales charges (loads) on purchase payments or contingent deferred sales charges on redemptions, if any; and (2) ongoing costs, including management fees, distribution and/or service (12b-1) fees, and other Fund expenses. This example is intended to help you understand your ongoing costs (in dollars) of investing in the Fund and to compare these costs with ongoing costs of investing in other mutual funds. With the exception of the actual ending account value and expenses of the Class R6 shares, the example is based on an investment of $1,000 invested at the beginning of the period and held for the entire period November 1, 2016 through April 30, 2017. The actual ending account value and expenses of the Class R6 shares in the example below are based on an investment of $1,000 invested as of close of business April 4, 2017 (commencement date) and held through April 30, 2017.
Actual expenses
The table below provides information about actual account values and actual expenses. You may use the information in this table, together with the amount you invested, to estimate the expenses that you paid over the period. Simply divide your account value by $1,000 (for example, an $8,600 account value divided by $1,000 = 8.6), then multiply the result by the number in the table under the heading entitled “Actual Expenses Paid During Period” to estimate the expenses you paid on your account during this period (as of close of business April 4, 2017 through April 30, 2017 for the Class R6 shares). Because the actual ending account value and expense information in the example is not based upon a six month period for the Class R6 shares, the ending account value and expense information may not provide a meaningful comparison to mutual funds that provide such information for a full six month period.
Hypothetical example for comparison purposes
The table below also provides information about hypothetical account values and hypothetical expenses based on the Fund’s actual expense ratio and an assumed rate of return of 5% per year before expenses, which is not the Fund’s actual return.
The hypothetical account values and expenses may not be used to estimate the actual ending account balance or expenses you paid for the period. You may use this information to compare the ongoing costs of investing in the Fund and other funds. To do so, compare this 5% hypothetical example with the 5% hypothetical examples that appear in the shareholder reports of the other funds.
Please note that the expenses shown in the table are meant to highlight your ongoing costs only and do not reflect any transaction costs, such as sales charges (loads) on purchase payments or contingent deferred sales charges on redemptions, if any. Therefore, the hypothetical information is useful in comparing ongoing costs only, and will not help you determine the relative total costs of owning different funds. In addition, if these transaction costs were included, your costs would have been higher.
| | | | | | | | | | | | | | | | | | | | | | | | |
| Class | | Beginning
Account Value
(11/01/16) | | | ACTUAL | | | HYPOTHETICAL
(5% annual return before expenses) | | | Annualized
Expense
Ratio | |
| | | Ending
Account Value
(04/30/17)1 | | | Expenses
Paid During
Period2 | | | Ending
Account Value
(04/30/17) | | | Expenses
Paid During
Period3 | | |
| A | | $ | 1,000.00 | | | $ | 975.10 | | | $ | 6.46 | | | $ | 1,018.25 | | | $ | 6.61 | | | | 1.32 | % |
| B | | | 1,000.00 | | | | 971.30 | | | | 10.12 | | | | 1,014.53 | | | | 10.34 | | | | 2.07 | |
| C | | | 1,000.00 | | | | 971.40 | | | | 10.12 | | | | 1,014.53 | | | | 10.34 | | | | 2.07 | |
| Y | | | 1,000.00 | | | | 976.30 | | | | 5.24 | | | | 1,019.49 | | | | 5.36 | | | | 1.07 | |
| Investor | | | 1,000.00 | | | | 975.00 | | | | 6.46 | | | | 1,018.25 | | | | 6.61 | | | | 1.32 | |
| R5 | | | 1,000.00 | | | | 977.50 | | | | 4.41 | | | | 1,020.33 | | | | 4.51 | | | | 0.90 | |
| R6 | | | 1,000.00 | | | | 958.90 | | | | 0.59 | | | | 1,020.78 | | | | 4.06 | | | | 0.81 | |
| 1 | The actual ending account value is based on the actual total return of the Fund for the period November 1, 2016 through April 30, 2017 (as of close of business April 4, 2017 through April 30, 2017 for the Class R6 shares), after actual expenses and will differ from the hypothetical ending account value which is based on the Fund’s expense ratio and a hypothetical annual return of 5% before expenses. |
| 2 | Actual expenses are equal to the Fund’s annualized expense ratio as indicated above multiplied by the average account value over the period, multiplied by 181/365 to reflect the most recent fiscal half year. For the Class R6 shares actual expenses are equal to the annualized expense ratio indicated above multiplied by the average account value over the period, multiplied by 27 (as of close of business April 4, 2017 through April 30, 2017)/365. Because the Class R6 shares have not been in existence for a full six month period, the actual ending account value and expense information shown may not provide a meaningful comparison to fund expense information of classes that show such data for a full six month period and, because the actual ending account value and expense information in the expense example covers a short time period, return and expense data may not be indicative of return and expense data for longer time periods. |
| 3 | Hypothetical expenses are equal to the annualized expense ratio indicated above multiplied by the average account value over the period, multiplied by 181/365 to reflect a one-half year period. The hypothetical ending account value and expenses may be used to compare ongoing costs of investing in Class R6 shares of the Fund and other funds because such data is based on a full six month period. |
21 Invesco Energy Fund
Tax Information
Form 1099-DIV, Form 1042-S and other year-end tax information provide shareholders with actual calendar year amounts that should be included in their tax returns. Shareholders should consult their tax advisors.
The following distribution information is being provided as required by the Internal Revenue Code or to meet a specific state’s requirement.
The Fund designates the following amounts or, if subsequently determined to be different, the maximum amount allowable for its fiscal year ended April 30, 2017:
| | | | |
Federal and State Income Tax | |
Qualified Dividend Income* | | | 100 | % |
Corporate Dividends Received Deduction* | | | 100 | % |
U.S. Treasury Obligations* | | | 0 | % |
| | * | The above percentages are based on ordinary income dividends paid to shareholders during the Fund’s fiscal year. |
22 Invesco Energy Fund
Proxy Results
A Special Joint Meeting (“Meeting”) of Shareholders of Invesco Energy Fund, an investment portfolio of AIM Sector Funds (Invesco Sector Funds), a Delaware statutory trust (“Trust”), was held on March 9, 2017. The Meeting was held for the following purpose:
| (1) | Elect 15 trustees to the Board, each of whom will serve until his or her successor is elected and qualified. |
| (2) | Approve an amendment to the Trust’s Agreement and Declaration of Trust that would permit fund mergers and other significant transactions upon the Board’s approval but without shareholder approval of such transactions. |
The results of the voting on the above matters were as follows:
| | | | | | | | | | | | | | | | | | |
| | | Matters | | | | | | | | Votes For | | | Votes Withheld | |
| (1)* | | David C. Arch | | | | 478,210,140 | | | | 13,802,825 | |
| | James T. Bunch | | | | 477,776,614 | | | | 14,236,351 | |
| | Bruce L. Crockett | | | | 477,904,863 | | | | 14,108,102 | |
| | Jack M. Fields | | | | 478,154,120 | | | | 13,858,845 | |
| | Martin L. Flanagan | | | | 478,366,284 | | | | 13,646,681 | |
| | Cynthia Hostetler | | | | 478,149,043 | | | | 13,863,922 | |
| | Dr. Eli Jones | | | | 478,281,396 | | | | 13,731,569 | |
| | Dr. Prema Mathai-Davis | | | | 477,927,603 | | | | 14,085,362 | |
| | Teresa M. Ressel | | | | 478,116,999 | | | | 13,895,966 | |
| | Dr. Larry Soll | | | | 477,671,696 | | | | 14,341,269 | |
| | Ann Barnett Stern | | | | 478,390,538 | | | | 13,622,427 | |
| | Raymond Stickel, Jr. | | | | 477,934,336 | | | | 14,078,629 | |
| | Philip A. Taylor | | | | 478,104,174 | | | | 13,908,791 | |
| | Robert C. Troccoli | | | | 478,368,464 | | | | 13,644,501 | |
| | Christopher L. Wilson | | | | 478,433,867 | | | | 13,579,098 | |
| | | | | |
| | | | | | | | | | | | | | | | | | |
| | | | | Votes For | | | Votes Against | | | Votes Abstain | | | Broker Non-Votes | |
| (2)* | | Approve an amendment to the Trust’s Agreement and Declaration of Trust that would permit fund mergers and other significant transactions upon the Board’s approval but without shareholder approval of such transactions | | | 261,575,830 | | | | 26,621,916 | | | | 13,166,011 | | | | 190,648,808 | |
The Meeting was adjourned until April 11, 2017, with respect to the following proposals:
| (3) | Approve changing the fundamental investment restriction regarding the purchase or sale of physical commodities. |
| 4(a) | Approve an amendment to the current Master Intergroup Sub-Advisory Contract to add Invesco PowerShares Capital Management LLC. |
| 4(b) | Approve an amendment to the current Master Intergroup Sub-Advisory Contract to add Invesco Asset Management (India) Private Limited. |
Invesco Energy Fund did not receive sufficient shareholder votes to pass Proposals 3 and 4(a) - (b).
The results of the voting on the above matters were as follows:
| | | | | | | | | | | | | | | | | | |
| | | Matters | | Votes For | | | Votes Against | | | Votes Abstain | | | Broker Non-Votes | |
| (3) | | Approve changing the fundamental investment restriction regarding the purchase or sale of physical commodities | | | 9,325,292 | | | | 1,195,022 | | | | 674,453 | | | | 6,727,474 | |
| 4(a) | | Approve an amendment to the current Master Intergroup Sub-Advisory Contract to add Invesco PowerShares Capital Management LLC | | | 9,774,026 | | | | 756,536 | | | | 664,209 | | | | 6,727,470 | |
| 4(b) | | Approve an amendment to the current Master Intergroup Sub-Advisory Contract to add Invesco Asset Management (India) Private Limited | | | 9,527,118 | | | | 969,228 | | | | 698,404 | | | | 6,727,491 | |
| * | Each of proposal 1 and 2 required approval by a combined vote of all of the portfolios of AIM Sector Funds (Invesco Sector Funds). |
23 Invesco Energy Fund
Trustees and Officers
The address of each trustee and officer is AIM Sector Funds (Invesco Sector Funds) (the “Trust”), 11 Greenway Plaza, Suite 1000, Houston, Texas 77046-1173. The trustees serve for the life of the Trust, subject to their earlier death, incapacitation, resignation, retirement or removal as more specifically provided in the Trust’s organizational documents. Each officer serves for a one year term or until their successors are elected and qualified. Column two below includes length of time served with predecessor entities, if any.
| | | | | | | | |
Name, Year of Birth and
Position(s) Held with the Trust | | Trustee and/
or Officer Since | | Principal Occupation(s)
During Past 5 Years | | Number of
Funds in Fund
Complex
Overseen by
Trustee | | Other Directorship(s)
Held by Trustee During
Past 5 Years |
| Interested Persons | | | | | | | | |
| Martin L. Flanagan1 — 1960 Trustee | | 2007 | | Executive Director, Chief Executive Officer and President, Invesco Ltd. (ultimate parent of Invesco and a global investment management firm); Trustee, The Invesco Funds; Vice Chair, Investment Company Institute; and Member of Executive Board, SMU Cox School of Business Formerly: Advisor to the Board, Invesco Advisers, Inc. (formerly known as Invesco Institutional (N.A.), Inc.); Chairman and Chief Executive Officer, Invesco Advisers, Inc. (registered investment adviser); Director, Chairman, Chief Executive Officer and President, Invesco Holding Company (US), Inc. (formerly IVZ Inc.) (holding company), Invesco Group Services, Inc. (service provider) and Invesco North American Holdings, Inc. (holding company); Director, Chief Executive Officer and President, Invesco Holding Company Limited (parent of Invesco and a global investment management firm); Director, Invesco Ltd.; Chairman, Investment Company Institute and President, Co-Chief Executive Officer, Co-President, Chief Operating Officer and Chief Financial Officer, Franklin Resources, Inc. (global investment management organization) | | 144 | | None |
Philip A. Taylor2 — 1954 Trustee and Senior Vice President | | 2006 | | Head of the Americas and Senior Managing Director, Invesco Ltd.; Director, Invesco Advisers, Inc. (formerly known as Invesco Institutional (N.A.), Inc.) (registered investment adviser); Director, Chairman, Chief Executive Officer and President, Invesco Management Group, Inc. (formerly known as Invesco Aim Management Group, Inc.) (financial services holding company); Director and Chairman, Invesco Investment Services, Inc. (formerly known as Invesco Aim Investment Services, Inc.) (registered transfer agent) Chief Executive Officer, Invesco Corporate Class Inc. (corporate mutual fund company) Director, Chairman and Chief Executive Officer, Invesco Canada Ltd. (formerly known as Invesco Trimark Ltd./Invesco Trimark Ltèe) (registered investment adviser and registered transfer agent); Trustee and Senior Vice President, The Invesco Funds; Director, Invesco Investment Advisers LLC (formerly known as Van Kampen Asset Management). Formerly: Co-Chairman, Co-President and Co-Chief Executive Officer, Invesco Advisers, Inc. (formerly known as Invesco Institutional (N.A.), Inc.) (registered investment adviser); Director, Chief Executive Officer and President, Van Kampen Exchange Corp; President and Principal Executive Officer, The Invesco Funds (other than AIM Treasurer’s Series Trust (Invesco Treasurer’s Series Trust), Short-Term Investments Trust and Invesco Management Trust); Executive Vice President, The Invesco Funds (AIM Treasurer’s Series Trust (Invesco Treasurer’s Series Trust), Short-Term Investments Trust and Invesco Management Trust only); Director and President, INVESCO Funds Group, Inc. (registered investment adviser and registered transfer agent); Director and Chairman, IVZ Distributors, Inc. (formerly known as INVESCO Distributors, Inc.) (registered broker dealer); Director, President and Chairman, Invesco Inc. (holding company), Invesco Canada Holdings Inc. (holding company), Trimark Investments Ltd./Placements Trimark Ltèe and Invesco Financial Services Ltd/Services Financiers Invesco Ltèe; Chief Executive Officer, Invesco Canada Fund Inc. (corporate mutual fund company); Director and Chairman, Van Kampen Investor Services Inc.; Director, Chief Executive Officer and President, 1371 Preferred Inc. (holding company) and Van Kampen Investments Inc.; Director and President, AIM GP Canada Inc. (general partner for limited partnerships) and Van Kampen Advisors, Inc.; Director and Chief Executive Officer, Invesco Trimark Dealer Inc. (registered broker dealer); Director, Invesco Distributors, Inc. (formerly known as Invesco Aim Distributors, Inc.) (registered broker dealer); Manager, Invesco PowerShares Capital Management LLC; Director, Chief Executive Officer and President, Invesco Advisers, Inc.; Director, Chairman, Chief Executive Officer and President, Invesco Aim Capital Management, Inc.; President, Invesco Trimark Dealer Inc. and Invesco Trimark Ltd./Invesco Trimark Ltèe; Director and President, AIM Trimark Corporate Class Inc. and AIM Trimark Canada Fund Inc.; Senior Managing Director, Invesco Holding Company Limited; Director and Chairman, Fund Management Company (former registered broker dealer); President and Principal Executive Officer, The Invesco Funds (AIM Treasurer’s Series Trust (Invesco Treasurer’s Series Trust), and Short-Term Investments Trust only); President, AIM Trimark Global Fund Inc. and AIM Trimark Canada Fund Inc. | | 144 | | None |
| 1 | Mr. Flanagan is considered an interested person (within the meaning of Section 2(a)(19) of the 1940 Act) of the Trust because he is an officer of the Adviser to the Trust, and an officer and a director of Invesco Ltd., ultimate parent of the Adviser. |
| 2 | Mr. Taylor is considered an interested person (within the meaning of Section 2(a)(19) of the 1940 Act) of the Trust because he is an officer and a director of the Adviser. |
T-1 Invesco Energy Fund
Trustees and Officers—(continued)
| | | | | | | | |
Name, Year of Birth and
Position(s) Held with the Trust | | Trustee and/
or Officer Since | | Principal Occupation(s)
During Past 5 Years | | Number of
Funds in Fund
Complex
Overseen by
Trustee | | Other Directorship(s)
Held by Trustee During
Past 5 Years |
| Independent Trustees | | | | | | | | |
Bruce L. Crockett — 1944 Trustee and Chair | | 2003 | | Chairman, Crockett Technologies Associates (technology consulting company) Formerly: Director, Captaris (unified messaging provider); Director, President and Chief Executive Officer, COMSAT Corporation; Chairman, Board of Governors of INTELSAT (international communications company); ACE Limited (insurance company); Independent Directors Council and Investment Company Institute: Member of the Audit Committee, Investment Company Institute; Member of the Executive Committee and Chair of the Governance Committee, Independent Directors Council | | 144 | | Director and Chairman of the Audit Committee, ALPS (Attorneys Liability Protection Society) (insurance company); Director and Member of the Audit Committee, Ferroglobe PLC (metallurgical company) |
David C. Arch — 1945 Trustee | | 2010 | | Chairman of Blistex Inc. (consumer health care products manufacturer); Member, World Presidents’ Organization | | 144 | | Board member of the Illinois Manufacturers’ Association |
James T. Bunch — 1942 Trustee | | 2000 | | Managing Member, Grumman Hill Group LLC (family office/private equity investments) Formerly: Chairman of the Board, Denver Film Society; Chairman of the Board of Trustees, Evans Scholarship Foundation; Chairman, Board of Governors, Western Golf Association | | 144 | | Trustee, Evans Scholarship Foundation |
Jack M. Fields — 1952 Trustee | | 2003 | | Chief Executive Officer, Twenty First Century Group, Inc. (government affairs company); and Discovery Learning Alliance (non-profit) Formerly: Owner and Chief Executive Officer, Dos Angeles Ranch L.P. (cattle, hunting, corporate entertainment); Director, Insperity, Inc. (formerly known as Administaff); Chief Executive Officer, Texana Timber LP (sustainable forestry company); Director of Cross Timbers Quail Research Ranch (non-profit); and member of the U.S. House of Representatives | | 144 | | None |
Cynthia Hostetler — 1962 Trustee | | 2017 | | Non-Executive Director and Trustee of a number of public and private business corporations Formerly: Head of Investment Funds and Private Equity, Overseas Private Investment Corporation; President, First Manhattan Bancorporation, Inc.; Attorney, Simpson Thacher & Bartlett LLP | | 144 | | Vulcan Materials Company (construction materials company); Trilinc Global Impact Fund; Aberdeen Investment Funds (4 portfolios); Artio Global Investment LLC (mutual fund complex); Edgen Group, Inc. (specialized energy and infrastructure products distributor) |
Eli Jones — 1961 Trustee | | 2016 | | Professor and Dean, Mays Business School—Texas A&M University Formerly: Professor and Dean, Walton College of Business, University of Arkansas and E.J. Ourso College of Business, Louisiana State University; Director, Arvest Bank | | 144 | | Insperity, Inc. (formerly known as Administaff) (human resources provider) |
Prema Mathai-Davis — 1950 Trustee | | 2003 | | Retired. Formerly: Chief Executive Officer, YWCA of the U.S.A. | | 144 | | None |
Teresa M. Ressel — 1962 Trustee | | 2017 | | Non-Executive Director and Trustee of a number of public and private business corporations Formerly: Chief Financial Officer, Olayan America, The Olayan Group (international investor/commercial/industrial); Chief Executive Officer, UBS Securities LLC; Group Chief Operating Officer, Americas, UBS AG; Assistant Secretary for Management & Budget and CFO, US Department of the Treasury; Chief Compliance Officer, Kaiser Permanente; Program Manager, Hewlett-Packard; Nuclear Engineering, General Dynamics Corporation | | 144 | | Atlantic Power Corporation (power generation company); ON Semiconductor Corp. (semiconductor supplier) |
Larry Soll — 1942 Trustee | | 1997 | | Retired. Formerly: Chairman, Chief Executive Officer and President, Synergen Corp. (a biotechnology company) | | 144 | | None |
Ann Barnett Stern — 1957 Trustee | | 2017 | | President and Chief Executive Officer, Houston Endowment Inc. (private philanthropic institution) Formerly: Executive Vice President and General Counsel, Texas Children’s Hospital; Attorney, Beck, Redden and Secrest, LLP; Business Law Instructor, University of St. Thomas; Attorney, Andrews & Kurth LLP | | 144 | | Federal Reserve Bank of Dallas |
Raymond Stickel, Jr. — 1944 Trustee | | 2005 | | Retired. Formerly: Director, Mainstay VP Series Funds, Inc. (25 portfolios); Partner, Deloitte & Touche | | 144 | | None |
Robert C. Troccoli — 1949 Trustee | | 2016 | | Adjunct Professor, University of Denver – Daniels College of Business Formerly: Senior Partner, KPMG LLP | | 144 | | None |
Christopher L. Wilson — 1957 Trustee | | 2017 | | Managing Partner, CT2, LLC (investing and consulting firm) Formerly: President/Chief Executive Officer, Columbia Funds, Bank of America Corporation; President/Chief Executive Officer, CDC IXIS Asset Management Services, Inc.; Principal & Director of Operations, Scudder Funds, Scudder, Stevens & Clark, Inc.; Assistant Vice President, Fidelity Investments | | 144 | | TD Asset Management USA Inc. (mutual fund complex) (22 portfolios); ISO New England, Inc. (non-profit organization managing regional electricity market) |
T-2 Invesco Energy Fund
Trustees and Officers—(continued)
| | | | | | | | |
Name, Year of Birth and
Position(s) Held with the Trust | | Trustee and/
or Officer Since | | Principal Occupation(s)
During Past 5 Years | | Number of
Funds in Fund
Complex
Overseen by
Trustee | | Other Directorship(s)
Held by Trustee During
Past 5 Years |
| Other Officers | | | | | | | | |
Sheri Morris — 1964 President, Principal Executive Officer and Treasurer | | 2003 | | President, Principal Executive Officer and Treasurer, The Invesco Funds; Vice President, Invesco Advisers, Inc. (formerly known as Invesco Institutional (N.A.), Inc.) (registered investment adviser); and Vice President, PowerShares Exchange-Traded Fund Trust, PowerShares Exchange-Traded Fund Trust II, PowerShares India Exchange-Traded Fund Trust, PowerShares Actively Managed Exchange-Traded Fund Trust and PowerShares Actively Managed Exchange-Traded Commodity Fund Trust Formerly: Vice President and Principal Financial Officer, The Invesco Funds; Vice President, Invesco Aim Advisers, Inc., Invesco Aim Capital Management, Inc. and Invesco Aim Private Asset Management, Inc.; Assistant Vice President and Assistant Treasurer, The Invesco Funds and Assistant Vice President, Invesco Advisers, Inc., Invesco Aim Capital Management, Inc. and Invesco Aim Private Asset Management, Inc.; and Treasurer, PowerShares Exchange-Traded Fund Trust, PowerShares Exchange-Traded Fund Trust II, PowerShares India Exchange-Traded Fund Trust and PowerShares Actively Managed Exchange-Traded Fund Trust | | N/A | | N/A |
Russell C. Burk — 1958 Senior Vice President and Senior Officer | | 2005 | | Senior Vice President and Senior Officer, The Invesco Funds | | N/A | | N/A |
John M. Zerr — 1962 Senior Vice President, Chief Legal Officer and Secretary | | 2006 | | Director, Senior Vice President, Secretary and General Counsel, Invesco Management Group, Inc. (formerly known as Invesco AIM Management Group, Inc.); Senior Vice President, Invesco Advisers, Inc. (formerly known as Invesco Institutional (N.A.), Inc.) (registered investment adviser); Senior Vice President and Secretary, Invesco Distributors, Inc. (formerly known as Invesco AIM Distributors, Inc.); Director, Vice President and Secretary, Invesco Investment Services, Inc. (formerly known as Invesco AIM Investment Services, Inc.) Senior Vice President, Chief Legal Officer and Secretary, The Invesco Funds; Managing Director, Invesco PowerShares Capital Management LLC; Director, Secretary and General Counsel, Invesco Investment Advisers LLC (formerly known as Van Kampen Asset Management); Secretary and General Counsel, Invesco Capital Markets, Inc. (formerly known as Van Kampen Funds Inc.) and Chief Legal Officer, PowerShares Exchange-Traded Fund Trust, PowerShares Exchange-Traded Fund Trust II, PowerShares India Exchange-Traded Fund Trust, PowerShares Actively Managed Exchange-Traded Fund Trust and PowerShares Actively Managed Exchange-Traded Commodity Fund Trust; Manager and Secretary, Invesco Indexing LLC Formerly: Director, Secretary, General Counsel and Senior Vice President, Van Kampen Exchange Corp.; Director, Vice President and Secretary, IVZ Distributors, Inc. (formerly known as INVESCO Distributors, Inc.); Director and Vice President, INVESCO Funds Group, Inc.; Director and Vice President, Van Kampen Advisors Inc.; Director, Vice President, Secretary and General Counsel, Van Kampen Investor Services Inc.; Director, Invesco Distributors, Inc. (formerly known as Invesco AIM Distributors, Inc.); Director, Senior Vice President, General Counsel and Secretary, Invesco AIM Advisers, Inc. and Van Kampen Investments Inc.; Director, Vice President and Secretary, Fund Management Company; Director, Senior Vice President, Secretary, General Counsel and Vice President, Invesco AIM Capital Management, Inc.; Chief Operating Officer and General Counsel, Liberty Ridge Capital, Inc. (an investment adviser); Vice President and Secretary, PBHG Funds (an investment company) and PBHG Insurance Series Fund (an investment company); Chief Operating Officer, General Counsel and Secretary, Old Mutual Investment Partners (a broker-dealer); General Counsel and Secretary, Old Mutual Fund Services (an administrator) and Old Mutual Shareholder Services (a shareholder servicing center); Executive Vice President, General Counsel and Secretary, Old Mutual Capital, Inc. (an investment adviser); and Vice President and Secretary, Old Mutual Advisors Funds (an investment company) | | N/A | | N/A |
Gregory G. McGreevey — 1962 Senior Vice President | | 2012 | | Senior Managing Director, Invesco Ltd.; Director, Chairman, President, and Chief Executive Officer, Invesco Advisers, Inc. (formerly known as Invesco Institutional (N.A.), Inc.) (registered investment adviser); Director, Invesco Mortgage Capital, Inc. and Invesco Senior Secured Management, Inc.; and Senior Vice President, The Invesco Funds Formerly: Assistant Vice President, The Invesco Funds | | N/A | | N/A |
Kelli Gallegos — 1970 Vice President, Principal Financial Officer and Assistant Treasurer | | 2008 | | Vice President, Principal Financial Officer and Assistant Treasurer, The Invesco Funds; Assistant Treasurer, Invesco PowerShares Capital Management LLC, PowerShares Exchange-Traded Fund Trust, PowerShares Exchange-Traded Fund Trust II, PowerShares India Exchange-Traded Fund Trust, PowerShares Actively Managed Exchange-Traded Fund Trust and PowerShares Actively Managed Exchange-Traded Commodity Fund Trust Formerly: Assistant Vice President, The Invesco Funds | | N/A | | N/A |
T-3 Invesco Energy Fund
Trustees and Officers—(continued)
| | | | | | | | |
Name, Year of Birth and
Position(s) Held with the Trust | | Trustee and/
or Officer Since | | Principal Occupation(s)
During Past 5 Years | | Number of
Funds in Fund
Complex
Overseen by
Trustee | | Other Directorship(s)
Held by Trustee During
Past 5 Years |
| Other Officers—(continued) | | | | | | | | |
Tracy Sullivan — 1962 Vice President, Chief Tax Officer and Assistant Treasurer | | 2008 | | Vice President, Chief Tax Officer and Assistant Treasurer, The Invesco Funds; Assistant Treasurer, Invesco PowerShares Capital Management LLC, PowerShares Exchange-Traded Fund Trust, PowerShares Exchange-Traded Fund Trust II, PowerShares India Exchange-Traded Fund Trust, PowerShares Actively Managed Exchange-Traded Fund Trust and PowerShares Actively Managed Exchange-Traded Commodity Fund Trust Formerly: Assistant Vice President, The Invesco Funds | | N/A | | N/A |
Crissie M. Wisdom — 1969 Anti-Money Laundering Compliance Officer | | 2013 | | Anti-Money Laundering Compliance Officer, Invesco Advisers, Inc. (formerly known as Invesco Institutional (N.A.), Inc.) (registered investment adviser), Invesco Capital Markets, Inc. (formerly known as Van Kampen Funds Inc.), Invesco Distributors, Inc., Invesco Investment Services, Inc., Invesco Management Group, Inc., The Invesco Funds, and PowerShares Exchange-Traded Fund Trust, PowerShares Exchange-Traded Fund Trust II, PowerShares India Exchange-Traded Fund Trust, PowerShares Actively Managed Exchange-Traded Fund Trust and PowerShares Actively Managed Exchange-Traded Commodity Fund Trust; Anti-Money Laundering Compliance Officer and Bank Secrecy Act Officer, INVESCO National Trust Company and Invesco Trust Company; and Fraud Prevention Manager and Controls and Risk Analysis Manager for Invesco Investment Services, Inc. Formerly: Anti-Money Laundering Compliance Officer, Van Kampen Exchange Corp. | | N/A | | N/A |
Robert R. Leveille — 1969 Chief Compliance Officer | | 2016 | | Chief Compliance Officer, Invesco Advisers, Inc. (registered investment adviser); and Chief Compliance Officer, The Invesco Funds Formerly: Chief Compliance Officer, Putnam Investments and the Putnam Funds | | N/A | | N/A |
The Statement of Additional Information of the Trust includes additional information about the Fund’s Trustees and is available upon request, without charge, by calling 1.800.959.4246. Please refer to the Fund’s Statement of Additional Information for information on the Fund’s sub-advisers.
| | | | | | | | | | |
Office of the Fund 11 Greenway Plaza, Suite 1000 Houston, TX 77046-1173 | | Investment Adviser Invesco Advisers, Inc. 1555 Peachtree Street, N.E. Atlanta, GA 30309 | |
| Distributor
Invesco Distributors, Inc. 11 Greenway Plaza, Suite 1000 Houston, TX 77046-1173 |
| |
| Auditors
PricewaterhouseCoopers LLP 1000 Louisiana Street, Suite 5800 Houston, TX 77002-5678 |
|
| | | |
| | | | | | | | | | |
Counsel to the Fund Stradley Ronon Stevens & Young, LLP 2005 Market Street, Suite 2600 Philadelphia, PA 19103-7018 | | Counsel to the Independent Trustees Goodwin Procter LLP 901 New York Avenue, N.W. Washington, D.C. 20001 | |
| Transfer Agent
Invesco Investment Services, Inc. 11 Greenway Plaza, Suite 1000 Houston, TX 77046-1173 |
| |
| Custodian
State Street Bank and Trust Company 225 Franklin Street Boston, MA 02110-2801 |
|
T-4 Invesco Energy Fund
Explore High-Conviction Investing with Invesco

Go paperless with eDelivery
Visit invesco.com/edelivery to enjoy the convenience and security of anytime electronic access to your investment documents.
With eDelivery, you can elect to have any or all of the following materials delivered straight to your inbox to download, save and print from your own computer:
∎ Fund reports and prospectuses
∎ Quarterly statements
∎ Daily confirmations
∎ Tax forms
Invesco mailing information
Send general correspondence to Invesco Investment Services, Inc., P.O. Box 219078, Kansas City, MO 64121-9078.
Important notice regarding delivery of security holder documents
To reduce Fund expenses, only one copy of most shareholder documents may be mailed to shareholders with multiple accounts at the same address (Householding). Mailing of your shareholder documents may be householded indefinitely unless you instruct us otherwise. If you do not want the mailing of these documents to be combined with those for other members of your household, please contact Invesco Investment Services, Inc. at 800 959 4246 or contact your financial institution. We will begin sending you individual copies for each account within 30 days after receiving your request.
Fund holdings and proxy voting information
The Fund provides a complete list of its holdings four times in each fiscal year, at the quarter ends. For the second and fourth quarters, the lists appear in the Fund’s semiannual and annual reports to shareholders. For the first and third quarters, the Fund files the lists with the Securities and Exchange Commission (SEC) on Form N-Q. The most recent list of portfolio holdings is available at invesco.com/completeqtrholdings. Shareholders can also look up the Fund’s Forms N-Q on the SEC website at sec.gov. Copies of the Fund’s Forms N-Q may be reviewed and copied at the SEC Public Reference Room in Washington, D.C. You can obtain information on the operation of the Public Reference Room, including information about duplicating fee charges, by calling 202 551 8090 or 800 732 0330, or by electronic request at the following email address: publicinfo@sec.gov.
The SEC file numbers for the Fund are shown below.
A description of the policies and procedures that the Fund uses to determine how to vote proxies relating to portfolio securities is available without charge, upon request, from our Client Services department at 800 959 4246 or at invesco.com/proxyguidelines. The information is also available on the SEC website, sec.gov.
| | | | |
Information regarding how the Fund voted proxies related to its portfolio securities during the most recent 12-month period ended June 30 is available at invesco.com/proxysearch. The information is also available on the SEC website, sec.gov. Invesco Advisers, Inc. is an investment adviser; it provides investment advisory services to individual and institutional clients and does not sell securities. Invesco Distributors, Inc. is the US distributor for Invesco Ltd.’s retail mutual funds, exchange-traded funds and institutional money market funds. Both are wholly owned, indirect subsidiaries of Invesco Ltd. | |  | | |
SEC file numbers: 811-03826 and 002-85905 Invesco Distributors, Inc. I-ENE-AR-1 06202017 0806
| | | | |
| | |
 | | Annual Report to Shareholders | | April 30, 2017 |
| | |
| | Invesco Gold & Precious Metals Fund |
| | Nasdaq: |
| | A: IGDAX ∎ B: IGDBX ∎ C: IGDCX ∎ Y: IGDYX ∎ Investor: FGLDX ∎ R6: IGDSX |

Letters to Shareholders
| | | | |

Philip Taylor | | | | Dear Shareholders: This annual report includes information about your Fund, including performance data and a complete list of its investments as of the close of the reporting period. Inside is a discussion of how your Fund was managed and the factors that affected its performance during the reporting period. The reporting period began with stock market volatility in the US and abroad, largely the result of uncertainty about global economic growth and monetary policy. Markets declined sharply following UK voters’ decision in June to leave the European Union. Relatively quickly, however, markets recovered, reaching record highs later in the summer. Demand was strong for income-producing investments, particularly those perceived to be lower risk; this benefited bonds as well as dividend-paying stocks for much of the reporting period. While economic news in the US was generally positive during the reporting period, news overseas was less upbeat. The European |
Central Bank and central banks in China and Japan – as well as other countries – maintained extraordinarily accommodative monetary policies in response to economic weakness. After months of uncertainty, the outcome of the US presidential election in November triggered a major stock market rally, with most market indexes repeatedly reaching new highs through February. As expected, the US Federal Reserve (the Fed) raised interest rates in December 2016 and again in March 2017. In its March statement, the Fed noted that the labor market has strengthened and economic activity has expanded at a moderate pace – and that it expects those trends to continue.
Short-term market volatility can prompt some investors to abandon their investment plans – and can cause others to settle for whatever returns the market has to offer. The investment professionals at Invesco, in contrast, invest with high conviction. This means that, no matter the asset class or the strategy, each investment team has a passion to exceed. We want to help investors achieve better outcomes, such as seeking higher returns, helping mitigate risk and generating income. Of course, investing with high conviction can’t guarantee a profit or ensure success; no investment strategy can. To learn more about how we invest with high conviction, visit invesco.com/HighConviction.
You, too, can invest with high conviction by maintaining a long-term investment perspective and by working with your financial adviser on a regular basis. During periods of short-term market volatility or uncertainty, your financial adviser can keep you focused on your long-term investment goals – a new home, a child’s college education or a secure retirement. He or she also can share research about the economy, the markets and individual investment options.
Visit our website for more information on your investments
Our website, invesco.com/us, offers a wide range of market insights and investment perspectives. On the website, you’ll find detailed information about our funds, including performance, holdings and portfolio manager commentaries. You can access information about your account by completing a simple, secure online registration. To do so, select “Log In” on the right side of the homepage, and then select “Register for Individual Account Access.”
In addition to the resources accessible on our website and through our mobile app, you can obtain timely updates to help you stay informed about the markets, the economy and investing by connecting with Invesco on Twitter, LinkedIn or Facebook. You can access our blog at blog.invesco.us.com. Our goal is to provide you the information you want, when and where you want it.
Finally, I’m pleased to share with you Invesco’s commitment to both the Principles for Responsible Investment and to considering environmental, social and governance issues in our robust investment process. I invite you to learn more at invesco.com/esg.
Have questions?
For questions about your account, contact an Invesco client services representative at 800 959 4246. For Invesco-related questions or comments, please email me directly at phil@invesco.com.
All of us at Invesco look forward to serving your investment management needs. Thank you for investing with us.
Sincerely,

Philip Taylor
Senior Managing Director, Invesco Ltd.
2 Invesco Gold & Precious Metals Fund
| | | | |

Bruce Crockett | | | | Dear Fellow Shareholders: Among the many important lessons I’ve learned in more than 40 years in a variety of business endeavors is the value of a trusted advocate. As independent chair of the Invesco Funds Board, I can assure you that the members of the Board are strong advocates for the interests of investors in Invesco’s mutual funds. We work hard to represent your interests through oversight of the quality of the investment management services your funds receive and other matters important to your investment, including but not limited to: ∎ Ensuring that Invesco offers a diverse lineup of mutual funds that your financial adviser can use to strive to meet your financial needs as your investment goals change over time. ∎ Monitoring how the portfolio management teams of the Invesco funds are performing in light of changing economic and market conditions. |
| ∎ | | Assessing each portfolio management team’s investment performance within the context of the investment strategy described in the fund’s prospectus. |
| ∎ | | Monitoring for potential conflicts of interests that may impact the nature of the services that your funds receive. |
We believe one of the most important services we provide our fund shareholders is the annual review of the funds’ advisory and sub-advisory contracts with Invesco Advisers and its affiliates. This review is required by the Investment Company Act of 1940 and focuses on the nature and quality of the services Invesco provides as the adviser to the Invesco funds and the reasonableness of the fees that it charges for those services. Each year, we spend months carefully reviewing information received from Invesco and a variety of independent sources, such as performance and fee data prepared by Lipper, Inc. (a subsidiary of Broadridge Financial Solutions, Inc.), an independent, third-party firm widely recognized as a leader in its field. We also meet with our independent legal counsel and other independent advisers to review and help us assess the information that we have received. Our goal is to assure that you receive quality investment management services for a reasonable fee.
I trust the measures outlined above provide assurance that you have a worthy advocate when it comes to choosing the Invesco Funds.
As always, please contact me at bruce@brucecrockett.com with any questions or concerns you may have. On behalf of the Board, we look forward to continuing to represent your interests and serving your needs.
Sincerely,

Bruce L. Crockett
Independent Chair
Invesco Funds Board of Trustees
3 Invesco Gold & Precious Metals Fund
Management’s Discussion of Fund Performance
| | | | |
Performance summary | |
For the fiscal year ended April 30, 2017, Class A shares of Invesco Gold & Precious Metals Fund (the Fund), at net asset value (NAV), outperformed the Fund’s style-specific benchmark, the Philadelphia Gold & Silver Index (price only). Your Fund’s long-term performance appears later in this report. | |
Fund vs. Indexes | |
Total returns, 4/30/16 to 4/30/17, at net asset value (NAV). Performance shown does not include applicable contingent deferred sales charges (CDSC) or front-end sales charges, which would have reduced performance. | |
Class A Shares | | | -9.90 | % |
Class B Shares | | | -10.60 | |
Class C Shares | | | -10.53 | |
Class Y Shares | | | -9.75 | |
Investor Class Shares | | | -9.84 | |
Class R6 Shares* | | | -9.76 | |
S&P 500 Index▼ (Broad Market Index) | | | 17.92 | |
| Philadelphia Gold & Silver Index (price only)▼ (Style-Specific Index) | | | -10.49 | |
| Lipper Precious Metals Equity Funds Index∎ (Peer Group Index) | | | -9.77 | |
| |
Source(s): ▼FactSet Research Systems Inc.; ∎Lipper Inc. *Class R6 shares incepted on April 4, 2017. See page 7 for more information. | | | | |
Market conditions and your Fund
The fiscal year ended April 30, 2017, saw a series of momentous political events which impacted the investment environment, as well as the outlook for economic growth and political stability.
In June, the decision by UK voters to leave the European Union caused global markets to decline sharply, but only briefly. Stocks in economically sensitive sectors, including energy and financials, were hardest hit as investors flocked to the perceived safety of US Treasuries and more defensive, dividend-paying equities. Following the outcome of the November US presidential election, US stocks surged. The rally was led by the health care and financials sectors, which could potentially benefit from reduced regulation. Non-US equities, particularly emerging market equities, traded lower due to currency weakness and the potential for a less favorable trade environment. Also in November, OPEC agreed to cut production for the first time in eight years; the agreement helped support higher oil prices and energy stocks.
As expected, the US Federal Reserve (the Fed) raised interest rates in December 2016 and again in March 2017. Toward the end of the reporting period, uncertain global political outcomes continued to drive swings in capital market sentiment. Corporate earnings reports for the 2016 year-end showed better growth trends and corporate profits. Inflation also rose during the reporting period, driven primarily by energy prices.
For the reporting period as a whole, US equities generally outperformed non-US equites. Emerging markets, supported by the Fed’s delayed interest rate increases and a rally in commodities, outperformed their developed-market counterparts (excluding the US) – a reversal from previous years.
The US dollar was elevated following the US presidential election and, in general, volatility averaged lower than the previous fiscal year. Gold bullion prices reached a high for the reporting period of $1,366 a troy ounce in the summer of 2016, before trending lower.1 Bullion
prices were approximately 2% lower for the fiscal year as a whole, ending the reporting period at $1,268 a troy ounce.1
For the reporting period, the Fund, at NAV, outperformed its style-specific benchmark. The Fund’s relative performance was driven primarily by superior stock selection in select holdings where the style-specific index was either underweight or had no exposure. Additionally, a minor allocation to ancillary cash and gold bullion – exposure the Fund achieved through liquid, cost-effective exchange-traded funds (ETFs) – contributed to relative returns. During the reporting period, underweight exposure to silver mining equities, as well as poor performance of select equities, detracted from relative Fund performance.
The top individual contributor to Fund performance during the reporting period was Ivanhoe Mines, a company focused on exploration in the Central African Copperbelt and Bushveld Complex. Ivanhoe Mines benefited from the release of positive drilling results for its Kamoa-Kakula Copper Project during the fiscal year.
Conversely, New Gold was the largest individual detractor from Fund performance during the fiscal year. News of a three-month delay and capital outlay increases at New Gold’s Rainy River Project in Ontario, Canada, resulted in a sharp price decline for the stock in January.
At the close of the reporting period, we believed uncertainty about interest rates may cause further volatility in gold and precious metals prices. Based on our marginal cost analysis, we continued to see more upside potential in gold equities compared to gold bullion. We maintained our discipline of selling stocks when they hit our target price and redeploying cash proceeds to fund new investments, but finding new investments has proven more difficult given valuations. However, we continue to focus on top-tier companies that we believe have good management teams. This has led us to seek
| | |
Portfolio Composition |
By industry | | % of total net assets |
| | | | | |
| |
Gold | | | | 73.2 | % |
Diversified Metals & Mining | | | | 9.0 | |
Investment Companies – Exchange Traded Funds | | | | 6.1 | |
Silver | | | | 4.5 | |
Precious Metals & Minerals | | | | 3.1 | |
Copper | | | | 1.1 | |
Construction & Engineering | | | | 0.1 | |
Money Market Funds Plus Other Assets Less Liabilities | | | | 2.9 | |
| | | | | |
| Top 10 Equity Holdings* |
| | | | % of total net assets | |
| | | | |
| | |
1. | | Turquoise Hill Resources Ltd. | | 5.1% |
2. | | Torex Gold Resources Inc. | | 5.1 |
3. | | Franco-Nevada Corp. | | 5.0 |
4. | | Newmont Mining Corp. | | 5.0 |
5. | | Kinross Gold Corp. | | 4.9 |
6. | | Silver Wheaton Corp. | | 4.5 |
7. | | Goldcorp, Inc. | | 4.5 |
8. | | Agnico Eagle Mines Ltd. | | 4.1 |
9. | | Ivanhoe Mines Ltd.-Class A | | 3.7 |
10. | | Lundin Gold Inc. | | 3.5 |
| | | | | |
Total Net Assets | | $303.3 million |
| | | | | |
| |
Total Number of Holdings* | | | | 40 | |
The Fund’s holdings are subject to change, and there is no assurance that the Fund will continue to hold any particular security.
*Excluding money market fund holdings.
Data presented here are as of April 30, 2017.
4 Invesco Gold & Precious Metals Fund
better opportunities in mid- and small-cap companies compared to their large-cap competitors. Consistent with our marginal cost analysis, we believed copper fundamentals were leaning toward a higher price for the commodity long term. The Fund’s copper exposure was geared toward companies with assets in the lowest cost quartile and led by, in our view, excellent management teams.
At the close of the reporting period, compared to the Philadelphia Gold & Silver Index, the Fund had an overweight allocation to gold mining equities. Additionally, the Fund had exposure to gold bullion ETFs, as well as the diversified metals and mining industry and the construction and engineering industry – exposures the Fund’s style-specific index lacked. Conversely, the Fund had underweight exposure to silver mining, copper mining and precious metals and minerals equities, relative to the style-specific index.
As always, thank you for your continued investment in Invesco Gold & Precious Metals Fund.
1 Source: Bloomberg L.P.
The views and opinions expressed in management’s discussion of Fund performance are those of Invesco Advisers, Inc. These views and opinions are subject to change at any time based on factors such as market and economic conditions. These views and opinions may not be relied upon as investment advice or recommendations, or as an offer for a particular security. The information is not a complete analysis of every aspect of any market, country, industry, security or the Fund. Statements of fact are from sources considered reliable, but Invesco Advisers, Inc. makes no representation or warranty as to their completeness or accuracy. Although historical performance is no guarantee of future results, these insights may help you understand our investment management philosophy.
See important Fund and, if applicable, index disclosures later in this report.
| | |
 | | Norman MacDonald Chartered Financial Analyst, Portfolio Manager, is manager of Invesco Gold & Precious Metals Fund. He joined Invesco in |
| 2008. Mr. MacDonald earned a Bachelor of Commerce from the University of Windsor. |
5 Invesco Gold & Precious Metals Fund
Your Fund’s Long-Term Performance
Results of a $10,000 Investment – Oldest Share Class(es)
Fund and index data from 4/30/07
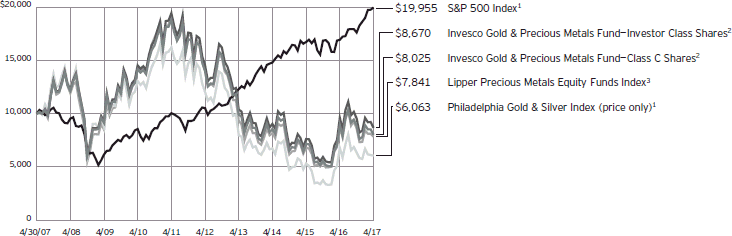
| 1 | Source: FactSet Research Systems Inc. |
| 2 | It is Invesco’s policy to chart the Fund’s oldest share class(es). Because Investor Class shares do not have a sales charge, |
| | we also show the oldest share class with a sales charge, Class C shares. |
Past performance cannot guarantee comparable future results.
The data shown in the chart include reinvested distributions, applicable sales charges and Fund expenses
including management fees. Index results include reinvested dividends, but they do not reflect sales charges. Performance of the peer group, if applicable, reflects fund expenses and management fees;
performance of a market index does not. Performance shown in the chart and table(s) does not reflect deduction of taxes a shareholder would pay on Fund distributions or sale of Fund shares.
continued from page 8
| | whole. Individual stock prices tend to go up and down more dramatically than those of certain other types of investments, such as bonds. During a general downturn in the financial markets, multiple asset classes may decline in value. When markets perform well, there can be no assurance that specific investments held by the Fund will rise in value. |
| ∎ | | Small- and mid-capitalization companies risks. Small- and mid-capitalization companies tend to be more vulnerable to changing market conditions, may have little or no operating history or track record of success, and may have more limited product lines and markets, less experienced management and fewer financial resources than larger companies. These companies’ securities may be more volatile and less liquid than those of more established companies, and their returns may vary, sometimes significantly, from the overall securities market. |
About indexes used in this report
| ∎ | | The S&P 500® Index is an unmanaged index considered representative of the US stock market. |
| ∎ | | The Philadelphia Gold & Silver Index (price only) is a capitalization-weighted, price-only index on the Philadelphia Stock Exchange that includes the leading companies involved in mining gold and silver. |
| ∎ | | The Lipper Precious Metals Equity Funds Index is an unmanaged index considered representative of precious metals funds tracked by Lipper. |
| ∎ | | The Fund is not managed to track the performance of any particular index, including the index(es) described here, and consequently, the performance of the Fund may deviate significantly from the performance of the index(es). |
| ∎ | | A direct investment cannot be made in an index. Unless otherwise indicated, index results include reinvested dividends, and they do not reflect sales charges. Performance of the peer |
| | | group, if applicable, reflects fund expenses; performance of a market index does not. |
Other information
| ∎ | | The returns shown in management’s discussion of Fund performance are based on net asset values (NAVs) calculated for shareholder transactions. Generally accepted accounting principles require adjustments to be made to the net assets of the Fund at period end for financial reporting purposes, and as such, the NAVs for shareholder transactions and the returns based on those NAVs may differ from the NAVs and returns reported in the Financial Highlights. |
| ∎ | | Industry classifications used in this report are generally according to the Global Industry Classification Standard, which was developed by and is the exclusive property and a service mark of MSCI Inc. and Standard & Poor’s. |
6 Invesco Gold & Precious Metals Fund
| | | | | |
| Average Annual Total Returns |
As of 4/30/17, including maximum applicable sales charges | |
| |
Class A Shares | | | | | |
Inception (3/28/02) | | | | 5.82 | % |
10 Years | | | | -1.97 | |
5 Years | | | | -10.82 | |
1 Year | | | | -14.79 | |
| |
Class B Shares | | | | | |
Inception (3/28/02) | | | | 5.90 | % |
10 Years | | | | -2.01 | |
5 Years | | | | -10.80 | |
1 Year | | | | -14.71 | |
| |
Class C Shares | | | | | |
Inception (2/14/00) | | | | 6.93 | % |
10 Years | | | | -2.18 | |
5 Years | | | | -10.49 | |
1 Year | | | | -11.35 | |
| |
Class Y Shares | | | | | |
10 Years | | | | -1.23 | % |
5 Years | | | | -9.61 | |
1 Year | | | | -9.75 | |
| |
Investor Class Shares | | | | | |
Inception (1/19/84) | | | | 0.40 | % |
10 Years | | | | -1.42 | |
5 Years | | | | -9.81 | |
1 Year | | | | -9.84 | |
| |
Class R6 Shares | | | | | |
10 Years | | | | -1.39 | % |
5 Years | | | | -9.78 | |
1 Year | | | | -9.76 | |
Class Y shares incepted on October 3, 2008. Performance shown prior to that date is that of Investor Class shares and includes the 12b-1 fees applicable to Investor Class shares.
Class R6 shares incepted on April 4, 2017. Performance shown prior to that date is that of Class A shares and includes the 12b-1 fees applicable to Class A shares.
The performance data quoted represent past performance and cannot guarantee comparable future results; current performance may be lower or higher. Please visit invesco.com/performance for the most recent month-end performance. Performance figures reflect reinvested distributions, changes in net asset value and the effect of the maximum sales charge unless otherwise stated. Investment return and principal value will fluctuate so that you may have a gain or loss when you sell shares.
| | | | | |
| Average Annual Total Returns |
As of 3/31/17, the most recent calendar quarter end, including maximum applicable sales charges |
| | | | | |
| |
Class A Shares | | | | | |
Inception (3/28/02) | | | | 6.28 | % |
10 Years | | | | -1.36 | |
5 Years | | | | -10.73 | |
1 Year | | | | 15.65 | |
| |
Class B Shares | | | | | |
Inception (3/28/02) | | | | 6.36 | % |
10 Years | | | | -1.39 | |
5 Years | | | | -10.75 | |
1 Year | | | | 16.49 | |
| |
Class C Shares | | | | | |
Inception (2/14/00) | | | | 7.34 | % |
10 Years | | | | -1.57 | |
5 Years | | | | -10.43 | |
1 Year | | | | 20.34 | |
| |
Class Y Shares | | | | | |
10 Years | | | | -0.60 | % |
5 Years | | | | -9.50 | |
1 Year | | | | 22.67 | |
| |
Investor Class Shares | | | | | |
Inception (1/19/84) | | | | 0.58 | % |
10 Years | | | | -0.81 | |
5 Years | | | | -9.73 | |
1 Year | | | | 22.52 | |
The total annual Fund operating expense ratio set forth in the most recent Fund prospectus as of the date of this report for Class A, Class B, Class C, Class Y, Investor Class and Class R6 shares was 1.57%, 2.32%, 2.32%, 1.32%, 1.57% and 0.98%, respectively. The expense ratios presented above may vary from the expense ratios presented in other sections of this report that are based on expenses incurred during the period covered by this report.
Class A share performance reflects the maximum 5.50% sales charge, and Class B and Class C share performance reflects the applicable contingent deferred sales charge (CDSC) for the period involved. The CDSC on Class B shares declines from 5% beginning at the time of purchase to 0% at the beginning of the seventh year. The CDSC on Class C shares is 1% for the first year after purchase. Class Y, Investor Class and Class R6 shares do not have a front-end sales charge or a CDSC; therefore, performance is at net asset value.
The performance of the Fund’s share classes will differ primarily due to different sales charge structures and class expenses.
Fund performance reflects any applicable fee waivers and/or expense reimbursements. Had the adviser not waived fees and/or reimbursed expenses currently or in the past, returns would have been lower. See current prospectus for more information.
7 Invesco Gold & Precious Metals Fund
Invesco Gold & Precious Metals Fund’s investment objective is long-term growth of capital.
| ∎ | | Unless otherwise stated, information presented in this report is as of April 30, 2017, and is based on total net assets. |
| ∎ | | Unless otherwise noted, all data provided by Invesco. |
| ∎ | | To access your Fund’s reports/prospectus, visit invesco.com/fundreports. |
About share classes
| ∎ | | Class B shares may not be purchased for new or additional investments. Please see the prospectus for more information. |
| ∎ | | Class Y and Investor Class shares are available only to certain investors. Please see the prospectus for more information. |
| ∎ | | Class R6 shares are available for use by retirement plans that meet certain standards and for institutional investors. Class R6 shares are also available through intermediaries that have established an agreement with Invesco Distributors, Inc. to make such shares available for use in retail omnibus accounts. Please see the prospectus for more information. |
Principal risks of investing in the Fund
| ∎ | | Derivatives risk. The value of a derivative instrument depends largely on (and is derived from) the value of an underlying security, currency, commodity, interest rate, index or other asset (each referred to as an underlying asset). In addition to risks relating to the underlying assets, the use of derivatives may include other, possibly greater, risks, including counterparty, leverage and liquidity risks. Counterparty risk is the risk that the counterparty to the derivative contract will default on its obligation to pay the Fund the amount owed or otherwise perform under the derivative contract. Derivatives create leverage risk because they do not require payment up front equal to the economic exposure created by owning the derivative. As a result, an adverse change in the value of the underlying asset could result in the Fund sustaining a loss that is substantially greater than the amount invested in the derivative, which may make the Fund’s returns more volatile and increase the risk of loss. Derivative instruments may also be less liquid than more traditional investments and the Fund may be unable to sell or close out its derivative positions at a desirable time or price. This risk |
| | | may be more acute under adverse market conditions, during which the Fund may be most in need of liquidating its derivative positions. Derivatives may also be harder to value, less tax efficient and subject to changing government regulation that could impact the Fund’s ability to use certain derivatives or their cost. Also, derivatives used for hedging or to gain or limit exposure to a particular market segment may not provide the expected benefits, particularly during adverse market conditions. |
| ∎ | | Emerging markets securities risk. Emerging markets (also referred to as developing markets) are generally subject to greater market volatility, political, social and economic instability, uncertain trading markets and more governmental limitations on foreign investment than more developed markets. In addition, companies operating in emerging markets may be subject to lower trading volume and greater price fluctuations than companies in more developed markets. Securities law and the enforcement of systems of taxation in many emerging market countries may change quickly and unpredictably. In addition, investments in emerging markets securities may also be subject to additional transaction costs, delays in settlement procedures, and lack of timely information. |
| ∎ | | Foreign securities risk. The Fund’s foreign investments may be adversely affected by political and social instability, changes in economic or taxation policies, difficulty in enforcing obligations, decreased liquidity or increased volatility. Foreign investments also involve the risk of the possible seizure, nationalization or expropriation of the issuer or foreign deposits (in which the Fund could lose its entire investments in a certain market) and the possible adoption of foreign governmental restrictions such as exchange controls. Unless the Fund has hedged its foreign securities risk, foreign securities risk also involves the risk of negative foreign currency rate fluctuations, which may cause the value of securities denominated |
This report must be accompanied or preceded by a currently effective Fund prospectus, which contains more complete information, including sales charges and expenses. Investors should read it carefully before investing.
NOT FDIC INSURED | MAY LOSE VALUE | NO BANK GUARANTEE
| | | in such foreign currency (or other instruments through which the Fund has exposure to foreign currencies) to decline in value. Currency exchange rates may fluctuate significantly over short periods of time. Currency hedging strategies, if used, are not always successful. |
| ∎ | | Gold bullion risk. To the extent the Fund invests in gold bullion, it will earn no income from such investment. Appreciation in the market price of gold is the sole manner in which the Fund can realize gains on gold bullion, and such investments may incur higher storage and custody costs as compared to purchasing, holding and selling more traditional investments. |
| ∎ | | Gold and precious metals sector risk. The Fund will concentrate its investments in the securities of issuers primarily engaged in gold and precious metals-related industries. Fluctuations in the price of gold and precious metals resulting from supply and demand imbalances, increased mining, transportation or storage costs or other market forces will have a significant impact on the profitability of companies in the gold and precious metals sector. The price of gold and precious metals may also be affected by changes in political or economic conditions of countries where gold and precious metals companies are located. |
| ∎ | | Management risk. The Fund is actively managed and depends heavily on the Adviser’s judgment about markets, interest rates or the attractiveness, relative values, liquidity, or potential appreciation of particular investments made for the Fund’s portfolio. The Fund could experience losses if these judgments prove to be incorrect. Additionally, legislative, regulatory, or tax developments may adversely affect management of the Fund and, therefore, the ability of the Fund to achieve its investment objective. |
| ∎ | | Market risk. The market values of the Fund’s investments, and therefore the value of the Fund’s shares, will go up and down, sometimes rapidly or unpredictably. Market risk may affect a single issuer, industry or section of the economy, or it may affect the market as a |
continued on page 6
8 Invesco Gold & Precious Metals Fund
Schedule of Investments
April 30, 2017
| | | | | | | | |
| | | Shares | | | Value | |
Common Stocks & Other Equity Interests–97.08% | |
| Australia–0.59% | |
Gold Road Resources Ltd.(a) | | | 3,621,092 | | | $ | 1,788,418 | |
|
| Brazil–1.69% | |
Yamana Gold Inc. | | | 1,897,681 | | | | 5,123,739 | |
|
| Canada–70.08% | |
Agnico Eagle Mines Ltd. | | | 259,253 | | | | 12,400,072 | |
Alamos Gold Inc.–Class A | | | 1,131,553 | | | | 8,098,211 | |
Atlantic Gold Corp.(a) | | | 1,428,669 | | | | 1,527,932 | |
B2Gold Corp.(a) | | | 3,421,977 | | | | 8,597,869 | |
Barrick Gold Corp. | | | 601,890 | | | | 10,063,601 | |
Belo Sun Mining Corp.(a) | | | 11,500,647 | | | | 5,433,775 | |
Chesapeake Gold Corp.(a) | | | 394,451 | | | | 1,138,437 | |
Continental Gold Inc.(a) | | | 3,909,680 | | | | 8,820,873 | |
Detour Gold Corp.(a) | | | 735,672 | | | | 9,295,932 | |
Franco-Nevada Corp. | | | 224,581 | | | | 15,273,120 | |
Goldcorp, Inc. | | | 981,051 | | | | 13,695,472 | |
INV Metals Inc.(a) | | | 460,514 | | | | 313,722 | |
Ivanhoe Mines Ltd.–Class A(a) | | | 3,228,123 | | | | 11,326,747 | |
Kinross Gold Corp.(a) | | | 4,235,184 | | | | 14,736,200 | |
Lundin Gold Inc.(a) | | | 2,457,228 | | | | 10,619,818 | |
Mandalay Resources Corp. | | | 1,484,856 | | | | 619,982 | |
Nevsun Resources Ltd. | | | 1,511,863 | | | | 3,355,635 | |
New Gold Inc.(a) | | | 3,011,287 | | | | 8,536,557 | |
Premier Gold Mines Ltd.(a) | | | 1,485,751 | | | | 3,003,826 | |
Pretium Resources Inc.(a) | | | 797,724 | | | | 7,906,242 | |
Primero Mining Corp.(a) | | | 2,426,736 | | | | 1,137,685 | |
Sandstorm Gold Ltd.(a) | | | 1,171,654 | | | | 4,059,571 | |
SEMAFO Inc.(a) | | | 2,831,203 | | | | 6,512,088 | |
Silver Wheaton Corp. | | | 689,120 | | | | 13,761,726 | |
TMAC Resources Inc.–REGS(a)(b) | | | 98,111 | | | | 1,118,989 | |
Torex Gold Resources Inc.(a) | | | 918,396 | | | | 15,553,833 | |
Turquoise Hill Resources Ltd.(a) | | | 5,727,595 | | | | 15,607,555 | |
| | | | | 212,515,470 | |
| | | | | | | | |
| | | Shares | | | Value | |
| Mali–2.12% | |
Randgold Resources Ltd.–ADR | | | 73,101 | | | $ | 6,432,157 | |
|
| Mexico–2.50% | |
Fresnillo PLC | | | 403,673 | | | | 7,571,646 | |
|
| Monaco–1.50% | |
Endeavour Mining Corp.(a) | | | 276,511 | | | | 4,561,424 | |
|
| South Africa–1.10% | |
Gold Fields Ltd.–ADR | | | 1,025,845 | | | | 3,333,996 | |
|
| Tanzania–1.78% | |
Acacia Mining PLC | | | 1,054,809 | | | | 5,404,642 | |
|
| United States–15.72% | |
Argonaut Gold, Inc.(a) | | | 2,321,842 | | | | 3,741,752 | |
Boart Longyear Ltd.(a) | | | 8,083,336 | | | | 266,341 | |
iShares® Gold Trust–ETF(a) | | | 671,900 | | | | 8,203,899 | |
Newmont Mining Corp. | | | 448,770 | | | | 15,172,914 | |
SPDR® Gold Trust–ETF(a) | | | 83,900 | | | | 10,132,603 | |
Tahoe Resources Inc. | | | 1,255,424 | | | | 10,171,036 | |
| | | | | 47,688,545 | |
Total Common Stocks & Other Equity Interests
(Cost $305,771,023) | | | | 294,420,037 | |
|
Money Market Funds–3.58% | |
Government & Agency Portfolio– Institutional Class, 0.67%(c) | | | 6,510,468 | | | | 6,510,468 | |
Treasury Portfolio–Institutional Class, 0.63%(c) | | | 4,340,312 | | | | 4,340,312 | |
Total Money Market Funds
(Cost $10,850,780) | | | | 10,850,780 | |
TOTAL INVESTMENTS–100.66%
(Cost $316,621,803) | | | | 305,270,817 | |
OTHER ASSETS LESS LIABILITIES–(0.66)% | | | | (2,003,410 | ) |
NET ASSETS–100.00% | | | $ | 303,267,407 | |
Investment Abbreviations:
| | |
| ADR | | – American Depositary Receipt |
| ETF | | – Exchange-Traded Fund |
| REGS | | – Regulation S |
| SPDR | | – Standard & Poor’s Depositary Receipt |
Notes to Schedule of Investments:
| (a) | Non-income producing security. |
| (b) | Security purchased or received in transaction exempt from registration under the Securities Act of 1933, as amended (the “1933 Act”). The security may be resold pursuant to an exemption from registration under the 1933 Act, typically to qualified institutional buyers. The value of this security at April 30, 2017 represented less than 1% of the Fund’s Net Assets. |
| (c) | The money market fund and the Fund are affiliated by having the same investment adviser. The rate shown is the 7-day SEC standardized yield as of April 30, 2017. |
See accompanying Notes to Financial Statements which are an integral part of the financial statements.
9 Invesco Gold & Precious Metals Fund
Statement of Assets and Liabilities
April 30, 2017
| | | | |
Assets: | |
Investments, at value (Cost $305,771,023) | | $ | 294,420,037 | |
Investments in affiliated money market funds, at value and cost | | | 10,850,780 | |
Total investments, at value (Cost $316,621,803) | | | 305,270,817 | |
Receivable for: | | | | |
Investments sold | | | 40,381 | |
Fund shares sold | | | 388,588 | |
Dividends | | | 191,482 | |
Investment for trustee deferred compensation and retirement plans | | | 98,714 | |
Other assets | | | 44,813 | |
Total assets | | | 306,034,795 | |
|
Liabilities: | |
Payable for: | | | | |
Investments purchased | | | 1,090,163 | |
Fund shares reacquired | | | 1,079,553 | |
Accrued fees to affiliates | | | 262,543 | |
Accrued trustees’ and officers’ fees and benefits | | | 2,401 | |
Accrued other operating expenses | | | 221,816 | |
Trustee deferred compensation and retirement plans | | | 110,912 | |
Total liabilities | | | 2,767,388 | |
Net assets applicable to shares outstanding | | $ | 303,267,407 | |
|
Net assets consist of: | |
Shares of beneficial interest | | $ | 526,683,847 | |
Undistributed net investment income (loss) | | | (25,606,653 | ) |
Undistributed net realized gain (loss) | | | (186,466,874 | ) |
Net unrealized appreciation (depreciation) | | | (11,342,913 | ) |
| | | $ | 303,267,407 | |
| | | | |
Net Assets: | |
Class A | | $ | 145,269,076 | |
Class B | | $ | 1,926,606 | |
Class C | | $ | 31,562,525 | |
Class Y | | $ | 45,796,721 | |
Investor Class | | $ | 78,703,126 | |
Class R6 | | $ | 9,353 | |
|
Shares outstanding, no par value,
with an unlimited number of shares authorized: | |
Class A | | | 34,905,218 | |
Class B | | | 493,201 | |
Class C | | | 7,517,620 | |
Class Y | | | 10,789,897 | |
Investor Class | | | 18,796,998 | |
Class R6 | | | 2,203 | |
Class A: | | | | |
Net asset value per share | | $ | 4.16 | |
Maximum offering price per share | | | | |
(Net asset value of $4.16 ¸ 94.50%) | | $ | 4.40 | |
Class B: | | | | |
Net asset value and offering price per share | | $ | 3.91 | |
Class C: | | | | |
Net asset value and offering price per share | | $ | 4.20 | |
Class Y: | | | | |
Net asset value and offering price per share | | $ | 4.24 | |
Investor Class: | | | | |
Net asset value and offering price per share | | $ | 4.19 | |
Class R6: | | | | |
Net asset value and offering price per share | | $ | 4.25 | |
See accompanying Notes to Financial Statements which are an integral part of the financial statements.
10 Invesco Gold & Precious Metals Fund
Statement of Operations
For the year ended April 30, 2017
| | | | |
Investment income: | |
Dividends (net of foreign withholding taxes of $188,600) | | $ | 1,321,702 | |
Dividends from affiliated money market funds | | | 77,303 | |
Total investment income | | | 1,399,005 | |
| |
Expenses: | | | | |
Advisory fees | | | 2,586,358 | |
Administrative services fees | | | 99,685 | |
Custodian fees | | | 63,001 | |
Distribution fees: | | | | |
Class A | | | 418,016 | |
Class B | | | 33,065 | |
Class C | | | 364,653 | |
Investor Class | | | 226,739 | |
Transfer agent fees | | | 933,413 | |
Trustees’ and officers’ fees and benefits | | | 24,099 | |
Registration and filing fees | | | 87,645 | |
Reports to shareholders | | | 136,511 | |
Professional services fees | | | 56,700 | |
Taxes | | | 49,105 | |
Other | | | 13,632 | |
Total expenses | | | 5,092,622 | |
Less: Fees waived and expense offset arrangement(s) | | | (33,712 | ) |
Net expenses | | | 5,058,910 | |
Net investment income (loss) | | | (3,659,905 | ) |
| |
Realized and unrealized gain (loss) from: | | | | |
Net realized gain (loss) from: | | | | |
Investment securities | | | (1,013,024 | ) |
Foreign currencies | | | 65,707 | |
| | | | (947,317 | ) |
Change in net unrealized appreciation (depreciation) of: | | | | |
Investment securities | | | (35,841,141 | ) |
Foreign currencies | | | 14,877 | |
| | | | (35,826,264 | ) |
Net realized and unrealized gain (loss) | | | (36,773,581 | ) |
Net increase (decrease) in net assets resulting from operations | | $ | (40,433,486 | ) |
See accompanying Notes to Financial Statements which are an integral part of the financial statements.
11 Invesco Gold & Precious Metals Fund
Statement of Changes in Net Assets
For the years ended April 30, 2017 and 2016
| | | | | | | | |
| | | 2017 | | | 2016 | |
Operations: | | | | | | | | |
Net investment income (loss) | | $ | (3,659,905 | ) | | $ | (2,092,674 | ) |
Net realized gain (loss) | | | (947,317 | ) | | | (17,693,783 | ) |
Change in net unrealized appreciation (depreciation) | | | (35,826,264 | ) | | | 92,332,389 | |
Net increase (decrease) in net assets resulting from operations | | | (40,433,486 | ) | | | 72,545,932 | |
| | |
Distributions to shareholders from net investment income: | | | | | | | | |
Class A | | | (12,452,356 | ) | | | — | |
Class B | | | (209,541 | ) | | | — | |
Class C | | | (2,441,566 | ) | | | — | |
Class Y | | | (3,722,353 | ) | | | — | |
Investor Class | | | (6,766,877 | ) | | | — | |
Total distributions from net investment income | | | (25,592,693 | ) | | | — | |
| | |
Share transactions–net: | | | | | | | | |
Class A | | | 17,416,050 | | | | 11,477,672 | |
Class B | | | (1,842,792 | ) | | | (1,644,915 | ) |
Class C | | | 1,984,777 | | | | 1,727,455 | |
Class Y | | | 13,926,443 | | | | 12,595,354 | |
Investor Class | | | (3,265,984 | ) | | | (4,178,893 | ) |
Class R6 | | | 10,000 | | | | — | |
Net increase in net assets resulting from share transactions | | | 28,228,494 | | | | 19,976,673 | |
Net increase (decrease) in net assets | | | (37,797,685 | ) | | | 92,522,605 | |
| | |
Net assets: | | | | | | | | |
Beginning of year | | | 341,065,092 | | | | 248,542,487 | |
End of year (includes undistributed net investment income (loss) of $(25,606,653) and $(10,824,790), respectively) | | $ | 303,267,407 | | | $ | 341,065,092 | |
Notes to Financial Statements
April 30, 2017
NOTE 1—Significant Accounting Policies
Invesco Gold & Precious Metals Fund (the “Fund”) is a series portfolio of AIM Sector Funds (Invesco Sector Funds) (the “Trust”). The Trust is a Delaware statutory trust registered under the Investment Company Act of 1940, as amended (the “1940 Act”), as an open-end series management investment company consisting of ten separate portfolios, each authorized to issue an unlimited number of shares of beneficial interest. The assets, liabilities and operations of each portfolio are accounted for separately. Information presented in these financial statements pertains only to the Fund. Matters affecting each portfolio or class will be voted on exclusively by the shareholders of such portfolio or class.
The Fund’s investment objective is long-term growth of capital.
The Fund currently consists of six different classes of shares: Class A, Class B, Class C, Class Y, Investor Class, and Class R6. On April 4, 2017, the Fund began offering Class R6 shares. Class Y and Investor Class shares are available only to certain investors. Class A shares are sold with a front-end sales charge unless certain waiver criteria are met and under certain circumstances load waived shares may be subject to contingent deferred sales charges (“CDSC”). Class C shares are sold with a CDSC. Class Y, Investor Class and Class R6 shares are sold at net asset value. Effective November 30, 2010, new or additional investments in Class B shares are no longer permitted. Existing shareholders of Class B shares may continue to reinvest dividends and capital gains distributions in Class B shares until they convert to Class A shares. Also, shareholders in Class B shares will be able to exchange those shares for Class B shares of other Invesco Funds offering such shares until they convert to Class A shares. Generally, Class B shares will automatically convert to Class A shares on or about the month-end, which is at least eight years after the date of purchase. Redemption of Class B shares prior to the conversion date will be subject to a CDSC.
The Fund is an investment company and accordingly follows the investment company accounting and reporting guidance in accordance with Financial Accounting Standards Board Accounting Standards Codification Topic 946, Financial Services – Investment Companies.
The following is a summary of the significant accounting policies followed by the Fund in the preparation of its financial statements.
| A. | Security Valuations — Securities, including restricted securities, are valued according to the following policy. |
A security listed or traded on an exchange (except convertible securities) is valued at its last sales price or official closing price as of the close of the customary trading session on the exchange where the security is principally traded, or lacking any sales or official closing price on a particular day, the security may be valued at the closing bid price on that day. Securities traded in the over-the-counter market are valued based on prices furnished by independent pricing services or market makers. When such securities are valued by an independent pricing service they
12 Invesco Gold & Precious Metals Fund
may be considered fair valued. Futures contracts are valued at the final settlement price set by an exchange on which they are principally traded. Listed options are valued at the mean between the last bid and asked prices from the exchange on which they are principally traded. Options not listed on an exchange are valued by an independent source at the mean between the last bid and asked prices. For purposes of determining net asset value (“NAV”) per share, futures and option contracts generally are valued 15 minutes after the close of the customary trading session of the New York Stock Exchange (“NYSE”).
Investments in open-end and closed-end registered investment companies that do not trade on an exchange are valued at the end-of-day net asset value per share. Investments in open-end and closed-end registered investment companies that trade on an exchange are valued at the last sales price or official closing price as of the close of the customary trading session on the exchange where the security is principally traded.
Debt obligations (including convertible securities) and unlisted equities are fair valued using an evaluated quote provided by an independent pricing service. Evaluated quotes provided by the pricing service may be determined without exclusive reliance on quoted prices, and may reflect appropriate factors such as institution-size trading in similar groups of securities, developments related to specific securities, dividend rate (for unlisted equities), yield (for debt obligations), quality, type of issue, coupon rate (for debt obligations), maturity (for debt obligations), individual trading characteristics and other market data. Debt obligations are subject to interest rate and credit risks. In addition, all debt obligations involve some risk of default with respect to interest and/or principal payments.
Foreign securities’ (including foreign exchange contracts) prices are converted into U.S. dollar amounts using the applicable exchange rates as of the close of the NYSE. If market quotations are available and reliable for foreign exchange-traded equity securities, the securities will be valued at the market quotations. Because trading hours for certain foreign securities end before the close of the NYSE, closing market quotations may become unreliable. If between the time trading ends on a particular security and the close of the customary trading session on the NYSE, events occur that the Adviser determines are significant and make the closing price unreliable, the Fund may fair value the security. If the event is likely to have affected the closing price of the security, the security will be valued at fair value in good faith using procedures approved by the Board of Trustees. Adjustments to closing prices to reflect fair value may also be based on a screening process of an independent pricing service to indicate the degree of certainty, based on historical data, that the closing price in the principal market where a foreign security trades is not the current value as of the close of the NYSE. Foreign securities’ prices meeting the approved degree of certainty that the price is not reflective of current value will be priced at the indication of fair value from the independent pricing service. Multiple factors may be considered by the independent pricing service in determining adjustments to reflect fair value and may include information relating to sector indices, American Depositary Receipts and domestic and foreign index futures. Foreign securities may have additional risks including exchange rate changes, potential for sharply devalued currencies and high inflation, political and economic upheaval, the relative lack of issuer information, relatively low market liquidity and the potential lack of strict financial and accounting controls and standards.
Securities for which market prices are not provided by any of the above methods may be valued based upon quotes furnished by independent sources. The last bid price may be used to value equity securities. The mean between the last bid and asked prices is used to value debt obligations, including corporate loans.
Securities for which market quotations are not readily available or became unreliable are valued at fair value as determined in good faith by or under the supervision of the Trust’s officers following procedures approved by the Board of Trustees. Issuer specific events, market trends, bid/asked quotes of brokers and information providers and other market data may be reviewed in the course of making a good faith determination of a security’s fair value.
The Fund may invest in securities that are subject to interest rate risk, meaning the risk that the prices will generally fall as interest rates rise and, conversely, the prices will generally rise as interest rates fall. Specific securities differ in their sensitivity to changes in interest rates depending on their individual characteristics. Changes in interest rates may result in increased market volatility, which may affect the value and/or liquidity of certain Fund investments.
Valuations change in response to many factors including the historical and prospective earnings of the issuer, the value of the issuer’s assets, general economic conditions, interest rates, investor perceptions and market liquidity. Because of the inherent uncertainties of valuation, the values reflected in the financial statements may materially differ from the value received upon actual sale of those investments.
| B. | Securities Transactions and Investment Income — Securities transactions are accounted for on a trade date basis. Realized gains or losses on sales are computed on the basis of specific identification of the securities sold. Interest income (net of withholding tax, if any) is recorded on the accrual basis from settlement date. Dividend income (net of withholding tax, if any) is recorded on the ex-dividend date. |
The Fund may periodically participate in litigation related to Fund investments. As such, the Fund may receive proceeds from litigation settlements. Any proceeds received are included in the Statement of Operations as realized gain (loss) for investments no longer held and as unrealized gain (loss) for investments still held.
Brokerage commissions and mark ups are considered transaction costs and are recorded as an increase to the cost basis of securities purchased and/or a reduction of proceeds on a sale of securities. Such transaction costs are included in the determination of net realized and unrealized gain (loss) from investment securities reported in the Statement of Operations and the Statement of Changes in Net Assets and the net realized and unrealized gains (losses) on securities per share in the Financial Highlights. Transaction costs are included in the calculation of the Fund’s net asset value and, accordingly, they reduce the Fund’s total returns. These transaction costs are not considered operating expenses and are not reflected in net investment income reported in the Statement of Operations and the Statement of Changes in Net Assets, or the net investment income per share and the ratios of expenses and net investment income reported in the Financial Highlights, nor are they limited by any expense limitation arrangements between the Fund and the investment adviser.
The Fund allocates income and realized and unrealized capital gains and losses to a class based on the relative net assets of each class.
| C. | Country Determination — For the purposes of making investment selection decisions and presentation in the Schedule of Investments, the investment adviser may determine the country in which an issuer is located and/or credit risk exposure based on various factors. These factors include the laws of the country under which the issuer is organized, where the issuer maintains a principal office, the country in which the issuer derives 50% or more of its total revenues and the country that has the primary market for the issuer’s securities, as well as other criteria. Among the other criteria that may be evaluated for making this determination are the country in which the issuer maintains 50% or more of its assets, the type of security, financial guarantees and enhancements, the nature of the collateral and the sponsor organization. Country of issuer and/or credit risk exposure has been determined to be the United States of America, unless otherwise noted. |
13 Invesco Gold & Precious Metals Fund
| D. | Distributions — Distributions from net investment income and net realized capital gain, if any, are generally declared and paid annually and recorded on the ex-dividend date. The Fund may elect to treat a portion of the proceeds from redemptions as distributions for federal income tax purposes. |
| E. | Federal Income Taxes — The Fund intends to comply with the requirements of Subchapter M of the Internal Revenue Code of 1986, as amended (the “Internal Revenue Code”), necessary to qualify as a regulated investment company and to distribute substantially all of the Fund’s taxable earnings to shareholders. As such, the Fund will not be subject to federal income taxes on otherwise taxable income (including net realized capital gain) that is distributed to shareholders. Therefore, no provision for federal income taxes is recorded in the financial statements. |
The Fund recognizes the tax benefits of uncertain tax positions only when the position is more likely than not to be sustained. Management has analyzed the Fund’s uncertain tax positions and concluded that no liability for unrecognized tax benefits should be recorded related to uncertain tax positions. Management is not aware of any tax positions for which it is reasonably possible that the total amounts of unrecognized tax benefits will change materially in the next 12 months.
The Fund files tax returns in the U.S. Federal jurisdiction and certain other jurisdictions. Generally, the Fund is subject to examinations by such taxing authorities for up to three years after the filing of the return for the tax period.
| F. | Expenses — Fees provided for under the Rule 12b-1 plan of a particular class of the Fund are charged to the operations of such class. Transfer agency fees and expenses and other shareholder recordkeeping fees and expenses attributable to Class R6 are charged to such class. Transfer agency fees and expenses and other shareholder recordkeeping fees and expenses relating to all other classes are allocated among those classes based on relative net assets. All other expenses are allocated among the classes based on relative net assets. |
| G. | Accounting Estimates — The preparation of financial statements in conformity with accounting principles generally accepted in the United States of America (“GAAP”) requires management to make estimates and assumptions that affect the reported amounts of assets and liabilities at the date of the financial statements and the reported amounts of revenues and expenses during the reporting period including estimates and assumptions related to taxation. Actual results could differ from those estimates by a significant amount. In addition, the Fund monitors for material events or transactions that may occur or become known after the period-end date and before the date the financial statements are released to print. |
| H. | Indemnifications — Under the Trust’s organizational documents, each Trustee, officer, employee or other agent of the Trust is indemnified against certain liabilities that may arise out of the performance of their duties to the Fund. Additionally, in the normal course of business, the Fund enters into contracts, including the Fund’s servicing agreements, that contain a variety of indemnification clauses. The Fund’s maximum exposure under these arrangements is unknown as this would involve future claims that may be made against the Fund that have not yet occurred. The risk of material loss as a result of such indemnification claims is considered remote. |
| I. | Foreign Currency Translations — Foreign currency is valued at the close of the NYSE based on quotations posted by banks and major currency dealers. Portfolio securities and other assets and liabilities denominated in foreign currencies are translated into U.S. dollar amounts at date of valuation. Purchases and sales of portfolio securities (net of foreign taxes withheld on disposition) and income items denominated in foreign currencies are translated into U.S. dollar amounts on the respective dates of such transactions. The Fund does not separately account for the portion of the results of operations resulting from changes in foreign exchange rates on investments and the fluctuations arising from changes in market prices of securities held. The combined results of changes in foreign exchange rates and the fluctuation of market prices on investments (net of estimated foreign tax withholding) are included with the net realized and unrealized gain or loss from investments in the Statement of Operations. Reported net realized foreign currency gains or losses arise from (1) sales of foreign currencies, (2) currency gains or losses realized between the trade and settlement dates on securities transactions, and (3) the difference between the amounts of dividends, interest, and foreign withholding taxes recorded on the Fund’s books and the U.S. dollar equivalent of the amounts actually received or paid. Net unrealized foreign currency gains and losses arise from changes in the fair values of assets and liabilities, other than investments in securities at fiscal period end, resulting from changes in exchange rates. |
The Fund may invest in foreign securities, which may be subject to foreign taxes on income, gains on investments or currency repatriation, a portion of which may be recoverable. Foreign taxes, if any, are recorded based on the tax regulations and rates that exist in the foreign markets in which the Fund invests and are shown in the Statement of Operations.
| J. | Forward Foreign Currency Contracts — The Fund may engage in foreign currency transactions either on a spot (i.e. for prompt delivery and settlement) basis, or through forward foreign currency contracts, to manage or minimize currency or exchange rate risk. |
The Fund may also enter into forward foreign currency contracts for the purchase or sale of a security denominated in a foreign currency in order to “lock in” the U.S. dollar price of that security, or the Fund may also enter into forward foreign currency contracts that do not provide for physical settlement of the two currencies, but instead are settled by a single cash payment calculated as the difference between the agreed upon exchange rate and the spot rate at settlement based upon an agreed upon notional amount (non-deliverable forwards). The Fund will set aside liquid assets in an amount equal to the daily mark-to-market obligation for forward foreign currency contracts.
A forward foreign currency contract is an obligation between two parties (“Counterparties”) to purchase or sell a specific currency for an agreed-upon price at a future date. The use of forward foreign currency contracts does not eliminate fluctuations in the price of the underlying securities the Fund owns or intends to acquire but establishes a rate of exchange in advance. Fluctuations in the value of these contracts are measured by the difference in the contract date and reporting date exchange rates and are recorded as unrealized appreciation (depreciation) until the contracts are closed. When the contracts are closed, realized gains (losses) are recorded. Realized and unrealized gains (losses) on the contracts are included in the Statement of Operations. The primary risks associated with forward foreign currency contracts include failure of the Counterparty to meet the terms of the contract and the value of the foreign currency changing unfavorably. These risks may be in excess of the amounts reflected in the Statement of Assets and Liabilities.
| K. | Other Risks — The Fund’s investments are concentrated in a comparatively narrow segment of the economy, which may make the Fund more volatile. |
The Fund may invest a large percentage of its assets in a limited number of securities or other instruments, which could negatively affect the value of the Fund.
Fluctuations in the price of gold and precious metals may affect the profitability of companies in the gold and precious metals sector. Changes in the political or economic conditions of countries where companies in the gold and precious metals sector are located may have a direct effect on the price of gold and precious metals.
14 Invesco Gold & Precious Metals Fund
NOTE 2—Advisory Fees and Other Fees Paid to Affiliates
The Trust has entered into a master investment advisory agreement with Invesco Advisers, Inc. (the “Adviser” or “Invesco”). Under the terms of the investment advisory agreement, the Fund pays an advisory fee to the Adviser based on the annual rate of the Fund’s average daily net assets as follows:
| | | | | | | | |
| Average Daily Net Assets | | Rate | |
First $350 million | | | 0 | .75% | | | | |
Next $350 million | | | 0 | .65% | | | | |
Next $1.3 billion | | | 0 | .55% | | | | |
Next $2 billion | | | 0 | .45% | | | | |
Next $2 billion | | | 0 | .40% | | | | |
Next $2 billion | | | 0 | .375% | | | | |
Over $8 billion | | | 0 | .35% | | | | |
For the year ended April 30, 2017, the effective advisory fees incurred by the Fund was 0.75%.
Under the terms of a master sub-advisory agreement between the Adviser and each of Invesco Asset Management Deutschland GmbH, Invesco Asset Management Limited, Invesco Asset Management (Japan) Limited, Invesco Hong Kong Limited, Invesco Senior Secured Management, Inc. and Invesco Canada Ltd. (collectively, the “Affiliated Sub-Advisers”) the Adviser, not the Fund, will pay 40% of the fees paid to the Adviser to any such Affiliated Sub-Adviser(s) that provide(s) discretionary investment management services to the Fund based on the percentage of assets allocated to such Affiliated Sub-Adviser(s).
The Adviser has contractually agreed, through at least June 30, 2018, to waive advisory fees and/or reimburse expenses of all shares to the extent necessary to limit total annual fund operating expenses after fee waiver and/or expense reimbursement (excluding certain items discussed below) of Class A, Class B, Class C, Class Y, Investor Class and Class R6 shares to 2.00%, 2.75%, 2.75%, 1.75%, 2.00% and 1.75%, respectively, of average daily net assets (the “expense limits”). In determining the Adviser’s obligation to waive advisory fees and/or reimburse expenses, the following expenses are not taken into account, and could cause the total annual fund operating expenses after fee waivers and/or expense reimbursement to exceed the numbers reflected above: (1) interest; (2) taxes; (3) dividend expense on short sales; (4) extraordinary or non-routine items, including litigation expenses; and (5) expenses that the Fund has incurred but did not actually pay because of an expense offset arrangement. Unless Invesco continues the fee waiver agreement, it will terminate on June 30, 2018. During its term, the fee waiver agreement cannot be terminated or amended to increase the expense limits without approval of the Board of Trustees. The Adviser did not waive fees and/or reimburse expenses during the period under these expense limits.
Further, the Adviser has contractually agreed, through at least June 30, 2019, to waive the advisory fee payable by the Fund in an amount equal to 100% of the net advisory fees the Adviser receives from the affiliated money market funds on investments by the Fund of uninvested cash (excluding investments of cash collateral from securities lending) in such affiliated money market funds.
For the year ended April 30, 2017, the Adviser waived advisory fees of $25,847.
The Trust has entered into a master administrative services agreement with Invesco pursuant to which the Fund has agreed to pay Invesco for certain administrative costs incurred in providing accounting services to the Fund. For the year ended April 30, 2017, expenses incurred under the agreement are shown in the Statement of Operations as Administrative services fees.
The Trust has entered into a transfer agency and service agreement with Invesco Investment Services, Inc. (“IIS”) pursuant to which the Fund has agreed to pay IIS a fee for providing transfer agency and shareholder services to the Fund and reimburse IIS for certain expenses incurred by IIS in the course of providing such services. IIS may make payments to intermediaries that provide omnibus account services, sub-accounting services and/or networking services. All fees payable by IIS to intermediaries that provide omnibus account services or sub-accounting are charged back to the Fund, subject to certain limitations approved by the Trust’s Board of Trustees. For the year ended April 30, 2017, expenses incurred under the agreement are shown in the Statement of Operations as Transfer agent fees.
The Trust has entered into master distribution agreements with Invesco Distributors, Inc. (“IDI”) to serve as the distributor for the Class A, Class B, Class C, Class Y, Investor Class and Class R6 shares of the Fund. The Trust has adopted plans pursuant to Rule 12b-1 under the 1940 Act with respect to the Fund’s Class A, Class B, Class C and Investor Class shares (collectively, the “Plans”). The Fund, pursuant to the Plans, pays IDI compensation at the annual rate of 0.25% of the Fund’s average daily net assets of Class A shares, 1.00% of the average daily net assets of Class B and Class C shares and 0.25% of the average daily net assets of Investor Class shares. Of the Plan payments, up to 0.25% of the average daily net assets of each class of shares may be paid to furnish continuing personal shareholder services to customers who purchase and own shares of such classes. Any amounts not paid as a service fee under the Plans would constitute an asset-based sales charge. Rules of the Financial Industry Regulatory Authority (“FINRA”) impose a cap on the total sales charges, including asset-based sales charges, that may be paid by any class of shares of the Fund. For the year ended April 30, 2017, expenses incurred under the Plans are shown in the Statement of Operations as Distribution fees.
Front-end sales commissions and CDSC (collectively, the “sales charges”) are not recorded as expenses of the Fund. Front-end sales commissions are deducted from proceeds from the sales of Fund shares prior to investment in Class A shares of the Fund. CDSC are deducted from redemption proceeds prior to remittance to the shareholder. During the year ended April 30, 2017, IDI advised the Fund that IDI retained $83,162 in front-end sales commissions from the sale of Class A shares and $1,520, $140 and $5,919 from Class A, Class B and Class C shares, respectively, for CDSC imposed on redemptions by shareholders.
Certain officers and trustees of the Trust are officers and directors of the Adviser, IIS and/or IDI.
15 Invesco Gold & Precious Metals Fund
NOTE 3—Additional Valuation Information
GAAP defines fair value as the price that would be received to sell an asset or paid to transfer a liability in an orderly transaction between market participants at the measurement date, under current market conditions. GAAP establishes a hierarchy that prioritizes the inputs to valuation methods, giving the highest priority to readily available unadjusted quoted prices in an active market for identical assets (Level 1) and the lowest priority to significant unobservable inputs (Level 3), generally when market prices are not readily available or are unreliable. Based on the valuation inputs, the securities or other investments are tiered into one of three levels. Changes in valuation methods may result in transfers in or out of an investment’s assigned level:
| | Level 1 — | Prices are determined using quoted prices in an active market for identical assets. |
| | Level 2 — | Prices are determined using other significant observable inputs. Observable inputs are inputs that other market participants may use in pricing a security. These may include quoted prices for similar securities, interest rates, prepayment speeds, credit risk, yield curves, loss severities, default rates, discount rates, volatilities and others. |
| | Level 3 — | Prices are determined using significant unobservable inputs. In situations where quoted prices or observable inputs are unavailable (for example, when there is little or no market activity for an investment at the end of the period), unobservable inputs may be used. Unobservable inputs reflect the Fund’s own assumptions about the factors market participants would use in determining fair value of the securities or instruments and would be based on the best available information. |
The following is a summary of the tiered valuation input levels, as of April 30, 2017. The level assigned to the securities valuations may not be an indication of the risk or liquidity associated with investing in those securities. Because of the inherent uncertainties of valuation, the values reflected in the financial statements may materially differ from the value received upon actual sale of those investments.
| | | | | | | | | | | | | | | | |
| | | Level 1 | | | Level 2 | | | Level 3 | | | Total | |
Australia | | $ | — | | | $ | 1,788,418 | | | $ | — | | | $ | 1,788,418 | |
Brazil | | | 5,123,739 | | | | — | | | | — | | | | 5,123,739 | |
Canada | | | 212,515,470 | | | | — | | | | — | | | | 212,515,470 | |
Mali | | | 6,432,157 | | | | — | | | | — | | | | 6,432,157 | |
Mexico | | | — | | | | 7,571,646 | | | | — | | | | 7,571,646 | |
Monaco | | | 4,561,424 | | | | — | | | | — | | | | 4,561,424 | |
South Africa | | | 3,333,996 | | | | — | | | | — | | | | 3,333,996 | |
Tanzania | | | 5,404,642 | | | | — | | | | — | | | | 5,404,642 | |
United States | | | 47,688,545 | | | | — | | | | — | | | | 47,688,545 | |
Money Market Funds | | | 10,850,780 | | | | — | | | | — | | | | 10,850,780 | |
Total Investments | | $ | 295,910,753 | | | $ | 9,360,064 | | | $ | — | | | $ | 305,270,817 | |
NOTE 4—Expense Offset Arrangement(s)
The expense offset arrangement is comprised of transfer agency credits which result from balances in demand deposit accounts used by the transfer agent for clearing shareholder transactions. For the year ended April 30, 2017, the Fund received credits from this arrangement, which resulted in the reduction of the Fund’s total expenses of $7,865.
NOTE 5—Trustees’ and Officers’ Fees and Benefits
Trustees’ and Officers’ Fees and Benefits include amounts accrued by the Fund to pay remuneration to certain Trustees and Officers of the Fund. Trustees have the option to defer compensation payable by the Fund, and Trustees’ and Officers’ Fees and Benefits also include amounts accrued by the Fund to fund such deferred compensation amounts. Those Trustees who defer compensation have the option to select various Invesco Funds in which their deferral accounts shall be deemed to be invested. Finally, certain current Trustees were eligible to participate in a retirement plan that provided for benefits to be paid upon retirement to Trustees over a period of time based on the number of years of service. The Fund may have certain former Trustees who also participate in a retirement plan and receive benefits under such plan. Trustees’ and Officers’ Fees and Benefits include amounts accrued by the Fund to fund such retirement benefits. Obligations under the deferred compensation and retirement plans represent unsecured claims against the general assets of the Fund.
NOTE 6—Cash Balances
The Fund is permitted to temporarily carry a negative or overdrawn balance in its account with State Street Bank and Trust Company, the custodian bank. Such balances, if any at period-end, are shown in the Statement of Assets and Liabilities under the payable caption Amount due custodian. To compensate the custodian bank for such overdrafts, the overdrawn Fund may either (1) leave funds as a compensating balance in the account so the custodian bank can be compensated by earning the additional interest; or (2) compensate by paying the custodian bank at a rate agreed upon by the custodian bank and Invesco, not to exceed the contractually agreed upon rate.
16 Invesco Gold & Precious Metals Fund
NOTE 7—Distributions to Shareholders and Tax Components of Net Assets
Tax Character of Distributions to Shareholders Paid During the Fiscal Years Ended April 30, 2017 and 2016:
| | | | | | | | |
| | | 2017 | | | 2016 | |
Ordinary income | | $ | 25,592,693 | | | | — | |
Tax Components of Net Assets at Period-End:
| | | | |
| | | 2017 | |
Undistributed ordinary income | | $ | 4,943,692 | |
Net unrealized appreciation (depreciation) — investments | | | (57,729,787 | ) |
Net unrealized appreciation — other investments | | | 8,073 | |
Temporary book/tax differences | | | (106,926 | ) |
Capital loss carryforward | | | (170,531,492 | ) |
Shares of beneficial interest | | | 526,683,847 | |
Total net assets | | $ | 303,267,407 | |
The difference between book-basis and tax-basis unrealized appreciation (depreciation) is due to differences in the timing of recognition of gains and losses on investments for tax and book purposes. The Fund’s net unrealized appreciation (depreciation) difference is attributable primarily to wash sales and passive foreign investment companies.
The temporary book/tax differences are a result of timing differences between book and tax recognition of income and/or expenses. The Fund’s temporary book/tax differences are the result of the trustee deferral of compensation and retirement plan benefits.
Capital loss carryforward is calculated and reported as of a specific date. Results of transactions and other activity after that date may affect the amount of capital loss carryforward actually available for the Fund to utilize. Capital losses generated in years beginning after December 22, 2010 can be carried forward for an unlimited period, whereas previous losses expire in eight tax years. Capital losses with an expiration period may not be used to offset capital gains until all net capital losses without an expiration date have been utilized. Capital loss carryforwards with no expiration date will retain their character as either short-term or long-term capital losses instead of as short-term capital losses as under prior law. The ability to utilize capital loss carryforwards in the future may be limited under the Internal Revenue Code and related regulations based on the results of future transactions.
The Fund has a capital loss carryforward as of April 30, 2017, which expires as follows:
| | | | | | | | | | | | |
| Capital Loss Carryforward* | |
| Expiration | | Short-Term | | | Long-Term | | | Total | |
Not subject to expiration | | $ | 6,513,707 | | | $ | 164,017,785 | | | $ | 170,531,492 | |
| * | Capital loss carryforward as of the date listed above is reduced for limitations, if any, to the extent required by the Internal Revenue Code and may be further limited depending upon a variety of factors, including the realization of net unrealized gains or losses as of the date of any reorganization. |
NOTE 8—Investment Securities
The aggregate amount of investment securities (other than short-term securities, U.S. Treasury obligations and money market funds, if any) purchased and sold by the Fund during the year ended April 30, 2017 was $102,419,115 and $89,922,898, respectively. Cost of investments on a tax basis includes the adjustments for financial reporting purposes as of the most recently completed federal income tax reporting period-end.
| | | | |
| Unrealized Appreciation (Depreciation) of Investment Securities on a Tax Basis | |
Aggregate unrealized appreciation of investment securities | | $ | 51,167,847 | |
Aggregate unrealized (depreciation) of investment securities | | | (108,897,634 | ) |
Net unrealized appreciation (depreciation) of investment securities | | $ | (57,729,787 | ) |
Cost of investments for tax purposes is $363,000,604.
NOTE 9—Reclassification of Permanent Differences
Primarily as a result of differing book/tax treatment of passive foreign investment companies. On April 30, 2017, undistributed net investment income (loss) was increased by $14,470,735, undistributed net realized gain (loss) was decreased by $15,075,316 and shares of beneficial interest was increased by $604,581. This reclassification had no effect on the net assets of the Fund.
17 Invesco Gold & Precious Metals Fund
NOTE 10—Share Information
| | | | | | | | | | | | | | | | |
| | | Summary of Share Activity | |
| | | Years ended April 30, | |
| | | 2017(a) | | | 2016 | |
| | | Shares | | | Amount | | | Shares | | | Amount | |
Sold: | | | | | | | | | | | | | | | | |
Class A | | | 19,718,951 | | | $ | 97,351,520 | | | | 14,133,878 | | | $ | 48,723,945 | |
Class B | | | 78,128 | | | | 375,403 | | | | 77,565 | | | | 247,146 | |
Class C | | | 2,578,981 | | | | 12,721,828 | | | | 2,689,631 | | | | 9,463,131 | |
Class Y | | | 9,692,337 | | | | 47,909,341 | | | | 7,119,077 | | | | 25,614,495 | |
Investor Class | | | 2,540,527 | | | | 12,496,093 | | | | 3,342,494 | | | | 11,422,719 | |
Class R6(b) | | | 2,203 | | | | 10,000 | | | | — | | | | — | |
| | | | |
Issued as reinvestment of dividends: | | | | | | | | | | | | | | | | |
Class A | | | 2,907,957 | | | | 11,893,545 | | | | — | | | | — | |
Class B | | | 51,361 | | | | 197,740 | | | | — | | | | — | |
Class C | | | 542,112 | | | | 2,244,344 | | | | — | | | | — | |
Class Y | | | 773,739 | | | | 3,226,492 | | | | — | | | | — | |
Investor Class | | | 1,559,764 | | | | 6,426,229 | | | | — | | | | — | |
| | | | |
Automatic conversion of Class B shares to Class A shares: | | | | | | | | | | | | | | | | |
Class A | | | 277,706 | | | | 1,322,921 | | | | 268,752 | | | | 958,771 | |
Class B | | | (296,055 | ) | | | (1,322,921 | ) | | | (285,280 | ) | | | (958,771 | ) |
| | | | |
Reacquired: | | | | | | | | | | | | | | | | |
Class A | | | (19,757,561 | ) | | | (93,151,936 | ) | | | (11,106,343 | ) | | | (38,205,044 | ) |
Class B | | | (244,108 | ) | | | (1,093,014 | ) | | | (292,125 | ) | | | (933,290 | ) |
Class C | | | (2,732,163 | ) | | | (12,981,395 | ) | | | (2,321,893 | ) | | | (7,735,676 | ) |
Class Y | | | (7,914,829 | ) | | | (37,209,390 | ) | | | (3,680,711 | ) | | | (13,019,141 | ) |
Investor Class | | | (4,527,271 | ) | | | (22,188,306 | ) | | | (4,625,611 | ) | | | (15,601,612 | ) |
Net increase in share activity | | | 5,251,779 | | | $ | 28,228,494 | | | | 5,319,434 | | | $ | 19,976,673 | |
| (a) | There are entities that are record owners of more than 5% of the outstanding shares of the Fund and in the aggregate own 21% of the outstanding shares of the Fund. IDI has an agreement with these entities to sell Fund shares. The Fund, Invesco and/or Invesco affiliates may make payments to these entities, which are considered to be related to the Fund, for providing services to the Fund, Invesco and/or Invesco affiliates including but not limited to services such as securities brokerage, distribution, third party record keeping and account servicing. The Fund has no knowledge as to whether all or any portion of the shares owned of record by these entities are also owned beneficially. |
| (b) | Commencement date of April 4, 2017. |
18 Invesco Gold & Precious Metals Fund
NOTE 11—Financial Highlights
The following schedule presents financial highlights for a share of the Fund outstanding throughout the periods indicated.
| | | | | | | | | | | | | | | | | | | | | | | | | | | | | | | | | | | | | | | | | | | | | | | | | | | | | | | | |
| | | Net asset
value,
beginning
of period | | | Net
investment
income
(loss)(a) | | | Net gains
(losses)
on securities
(both
realized and
unrealized) | | | Total from
investment
operations | | | Dividends
from net
investment
income | | | Distributions
from net
realized
gains | | | Total
distributions | | | Net asset
value, end
of period | | | Total
return(b) | | | Net assets,
end of period
(000’s omitted) | | | Ratio of
expenses
to average
net assets
with fee waivers
and/or expenses
absorbed | | | Ratio of
expenses
to average net
assets without
fee waivers
and/or expenses
absorbed | | | Ratio of net
investment
income (loss)
to average
net assets | | | Portfolio
turnover(c) | |
Class A | | | | | | | | | | | | | | | | | | | | | | | | | | | | | | | | | | | | | | | | | | | | | | | | | | | | | | | | |
Year ended 04/30/17 | | $ | 5.05 | | | $ | (0.05 | ) | | $ | (0.46 | ) | | $ | (0.51 | ) | | $ | (0.38 | ) | | $ | — | | | $ | (0.38 | ) | | $ | 4.16 | | | | (9.90 | )% | | $ | 145,269 | | | | 1.41 | %(d) | | | 1.42 | %(d) | | | (1.00 | )%(d) | | | 28 | % |
Year ended 04/30/16 | | | 4.00 | | | | (0.03 | ) | | | 1.08 | | | | 1.05 | | | | — | | | | — | | | | — | | | | 5.05 | | | | 26.25 | | | | 160,494 | | | | 1.54 | | | | 1.54 | | | | (0.90 | ) | | | 23 | |
Year ended 04/30/15 | | | 4.75 | | | | (0.04 | ) | | | (0.71 | ) | | | (0.75 | ) | | | — | | | | — | | | | — | | | | 4.00 | | | | (15.79 | ) | | | 113,862 | | | | 1.45 | | | | 1.46 | | | | (0.89 | ) | | | 35 | |
Year ended 04/30/14 | | | 5.44 | | | | (0.02 | ) | | | (0.67 | ) | | | (0.69 | ) | | | — | | | | — | | | | — | | | | 4.75 | | | | (12.68 | ) | | | 141,237 | | | | 1.45 | | | | 1.46 | | | | (0.47 | ) | | | 18 | |
Year ended 04/30/13 | | | 7.78 | | | | (0.02 | ) | | | (2.17 | ) | | | (2.19 | ) | | | — | | | | (0.15 | ) | | | (0.15 | ) | | | 5.44 | | | | (28.65 | ) | | | 131,605 | | | | 1.32 | | | | 1.32 | | | | (0.21 | ) | | | 25 | |
Class B | | | | | | | | | | | | | | | | | | | | | | | | | | | | | | | | | | | | | | | | | | | | | | | | | | | | | | | | |
Year ended 04/30/17 | | | 4.75 | | | | (0.08 | ) | | | (0.43 | ) | | | (0.51 | ) | | | (0.33 | ) | | | — | | | | (0.33 | ) | | | 3.91 | | | | (10.60 | ) | | | 1,927 | | | | 2.16 | (d) | | | 2.17 | (d) | | | (1.75 | )(d) | | | 28 | |
Year ended 04/30/16 | | | 3.79 | | | | (0.05 | ) | | | 1.01 | | | | 0.96 | | | | — | | | | — | | | | — | | | | 4.75 | | | | 25.33 | | | | 4,289 | | | | 2.29 | | | | 2.29 | | | | (1.65 | ) | | | 23 | |
Year ended 04/30/15 | | | 4.52 | | | | (0.07 | ) | | | (0.66 | ) | | | (0.73 | ) | | | — | | | | — | | | | — | | | | 3.79 | | | | (16.15 | ) | | | 5,314 | | | | 2.20 | | | | 2.21 | | | | (1.64 | ) | | | 35 | |
Year ended 04/30/14 | | | 5.24 | | | | (0.06 | ) | | | (0.66 | ) | | | (0.72 | ) | | | — | | | | — | | | | — | | | | 4.52 | | | | (13.74 | ) | | | 9,733 | | | | 2.20 | | | | 2.21 | | | | (1.22 | ) | | | 18 | |
Year ended 04/30/13 | | | 7.54 | | | | (0.07 | ) | | | (2.08 | ) | | | (2.15 | ) | | | — | | | | (0.15 | ) | | | (0.15 | ) | | | 5.24 | | | | (29.03 | ) | | | 16,834 | | | | 2.07 | | | | 2.07 | | | | (0.96 | ) | | | 25 | |
Class C | | | | | | | | | | | | | | | | | | | | | | | | | | | | | | | | | | | | | | | | | | | | | | | | | | | | | | | | |
Year ended 04/30/17 | | | 5.07 | | | | (0.09 | ) | | | (0.45 | ) | | | (0.54 | ) | | | (0.33 | ) | | | — | | | | (0.33 | ) | | | 4.20 | | | | (10.53 | ) | | | 31,563 | | | | 2.16 | (d) | | | 2.17 | (d) | | | (1.75 | )(d) | | | 28 | |
Year ended 04/30/16 | | | 4.05 | | | | (0.06 | ) | | | 1.08 | | | | 1.02 | | | | — | | | | — | | | | — | | | | 5.07 | | | | 25.19 | | | | 36,157 | | | | 2.29 | | | | 2.29 | | | | (1.65 | ) | | | 23 | |
Year ended 04/30/15 | | | 4.84 | | | | (0.07 | ) | | | (0.72 | ) | | | (0.79 | ) | | | — | | | | — | | | | — | | | | 4.05 | | | | (16.32 | ) | | | 27,351 | | | | 2.20 | | | | 2.21 | | | | (1.64 | ) | | | 35 | |
Year ended 04/30/14 | | | 5.60 | | | | (0.06 | ) | | | (0.70 | ) | | | (0.76 | ) | | | — | | | | — | | | | — | | | | 4.84 | | | | (13.57 | ) | | | 32,640 | | | | 2.20 | | | | 2.21 | | | | (1.22 | ) | | | 18 | |
Year ended 04/30/13 | | | 8.05 | | | | (0.07 | ) | | | (2.23 | ) | | | (2.30 | ) | | | — | | | | (0.15 | ) | | | (0.15 | ) | | | 5.60 | | | | (29.05 | ) | | | 34,820 | | | | 2.07 | | | | 2.07 | | | | (0.96 | ) | | | 25 | |
Class Y | | | | | | | | | | | | | | | | | | | | | | | | | | | | | | | | | | | | | | | | | | | | | | | | | | | | | | | | |
Year ended 04/30/17 | | | 5.15 | | | | (0.04 | ) | | | (0.47 | ) | | | (0.51 | ) | | | (0.40 | ) | | | — | | | | (0.40 | ) | | | 4.24 | | | | (9.75 | ) | | | 45,797 | | | | 1.16 | (d) | | | 1.17 | (d) | | | (0.75 | )(d) | | | 28 | |
Year ended 04/30/16 | | | 4.07 | | | | (0.02 | ) | | | 1.10 | | | | 1.08 | | | | — | | | | — | | | | — | | | | 5.15 | | | | 26.54 | | | | 42,446 | | | | 1.29 | | | | 1.29 | | | | (0.65 | ) | | | 23 | |
Year ended 04/30/15 | | | 4.82 | | | | (0.03 | ) | | | (0.72 | ) | | | (0.75 | ) | | | — | | | | — | | | | — | | | | 4.07 | | | | (15.56 | ) | | | 19,530 | | | | 1.20 | | | | 1.21 | | | | (0.64 | ) | | | 35 | |
Year ended 04/30/14 | | | 5.52 | | | | (0.01 | ) | | | (0.69 | ) | | | (0.70 | ) | | | — | | | | — | | | | — | | | | 4.82 | | | | (12.68 | ) | | | 36,328 | | | | 1.20 | | | | 1.21 | | | | (0.22 | ) | | | 18 | |
Year ended 04/30/13 | | | 7.86 | | | | (0.00 | ) | | | (2.19 | ) | | | (2.19 | ) | | | — | | | | (0.15 | ) | | | (0.15 | ) | | | 5.52 | | | | (28.35 | ) | | | 17,777 | | | | 1.07 | | | | 1.07 | | | | 0.04 | | | | 25 | |
Investor Class | | | | | | | | | | | | | | | | | | | | | | | | | | | | | | | | | | | | | | | | | | | | | | | | | | | | | | | | |
Year ended 04/30/17 | | | 5.08 | | | | (0.05 | ) | | | (0.46 | ) | | | (0.51 | ) | | | (0.38 | ) | | | — | | | | (0.38 | ) | | | 4.19 | | | | (9.84 | ) | | | 78,703 | | | | 1.41 | (d) | | | 1.42 | (d) | | | (1.00 | )(d) | | | 28 | |
Year ended 04/30/16 | | | 4.02 | | | | (0.03 | ) | | | 1.09 | | | | 1.06 | | | | — | | | | — | | | | — | | | | 5.08 | | | | 26.37 | | | | 97,678 | | | | 1.54 | | | | 1.54 | | | | (0.90 | ) | | | 23 | |
Year ended 04/30/15 | | | 4.77 | | | | (0.04 | ) | | | (0.71 | ) | | | (0.75 | ) | | | — | | | | — | | | | — | | | | 4.02 | | | | (15.72 | ) | | | 82,486 | | | | 1.45 | | | | 1.46 | | | | (0.89 | ) | | | 35 | |
Year ended 04/30/14 | | | 5.48 | | | | (0.02 | ) | | | (0.69 | ) | | | (0.71 | ) | | | — | | | | — | | | | — | | | | 4.77 | | | | (12.96 | ) | | | 101,153 | | | | 1.45 | | | | 1.46 | | | | (0.47 | ) | | | 18 | |
Year ended 04/30/13 | | | 7.83 | | | | (0.02 | ) | | | (2.18 | ) | | | (2.20 | ) | | | — | | | | (0.15 | ) | | | (0.15 | ) | | | 5.48 | | | | (28.59 | ) | | | 124,703 | | | | 1.32 | | | | 1.32 | | | | (0.21 | ) | | | 25 | |
Class R6 | | | | | | | | | | | | | | | | | | | | | | | | | | | | | | | | | | | | | | | | | | | | | | | | | | | | | | | | |
Year ended 04/30/17(e) | | | 4.57 | | | | (0.00 | ) | | | (0.32 | ) | | | (0.32 | ) | | | — | | | | — | | | | — | | | | 4.25 | | | | (7.00 | ) | | | 9 | | | | 0.97 | (d)(f) | | | 0.97 | (d)(f) | | | (0.56 | )(d)(f) | | | 28 | |
| (a) | Calculated using average shares outstanding. |
| (b) | Includes adjustments in accordance with accounting principles generally accepted in the United States of America and as such, the net asset value for financial reporting purposes and the returns based upon those net asset values may differ from the net asset value and returns for shareholder transactions. Does not include sales charges and is not annualized for periods less than one year, if applicable. |
| (c) | Portfolio turnover is calculated at the fund level and is not annualized for periods less than one year, if applicable. |
| (d) | Ratios are based on average daily net assets (000’s omitted) of $167,207, $3,307, $36,465, $47,173, $90,696 and $10 for Class A, Class B, Class C, Class Y, Investor Class and Class R6 shares, respectively. |
| (e) | Commencement date of April 4, 2017 for Class R6 shares. |
19 Invesco Gold & Precious Metals Fund
Report of Independent Registered Public Accounting Firm
To the Board of Trustees of AIM Sector Funds (Invesco Sector Funds)
and Shareholders of the Invesco Gold & Precious Metals Fund:
In our opinion, the accompanying statement of assets and liabilities, including the schedule of investments, and the related statements of operations and of changes in net assets and the financial highlights present fairly, in all material respects, the financial position of the Invesco Gold & Precious Metals Fund (one of the portfolios constituting the AIM Sector Funds (Invesco Sector Funds), hereafter referred to as the “Fund”) as of April 30, 2017, the results of its operations for the year then ended, the changes in its net assets for each of the two years in the period then ended and the financial highlights for each of the five years in the period then ended, in conformity with accounting principles generally accepted in the United States of America. These financial statements and financial highlights (hereafter referred to as “financial statements”) are the responsibility of the Fund’s management. Our responsibility is to express an opinion on these financial statements based on our audits. We conducted our audits of these financial statements in accordance with the standards of the Public Company Accounting Oversight Board (United States). Those standards require that we plan and perform the audit to obtain reasonable assurance about whether the financial statements are free of material misstatement. An audit includes examining, on a test basis, evidence supporting the amounts and disclosures in the financial statements, assessing the accounting principles used and significant estimates made by management, and evaluating the overall financial statement presentation. We believe that our audits, which included confirmation of securities as of April 30, 2017 by correspondence with the custodian and brokers, provide a reasonable basis for our opinion.
PricewaterhouseCoopers LLP
Houston, TX
June 23, 2017
20 Invesco Gold & Precious Metals Fund
Calculating your ongoing Fund expenses
Example
As a shareholder of the Fund, you incur two types of costs: (1) transaction costs, which may include sales charges (loads) on purchase payments or contingent deferred sales charges on redemptions, if any; and (2) ongoing costs, including management fees, distribution and/or service (12b-1) fees, and other Fund expenses. This example is intended to help you understand your ongoing costs (in dollars) of investing in the Fund and to compare these costs with ongoing costs of investing in other mutual funds. With the exception of the actual ending account value and expenses of the Class R6 shares, the example is based on an investment of $1,000 invested at the beginning of the period and held for the entire period November 1, 2016 through April 30, 2017. The actual ending account value and expenses of the Class R6 shares in the example below are based on an investment of $1,000 invested as of close of business April 4, 2017 (commencement date) and held through April 30, 2017.
Actual expenses
The table below provides information about actual account values and actual expenses. You may use the information in this table, together with the amount you invested, to estimate the expenses that you paid over the period. Simply divide your account value by $1,000 (for example, an $8,600 account value divided by $1,000 = 8.6), then multiply the result by the number in the table under the heading entitled “Actual Expenses Paid During Period” to estimate the expenses you paid on your account during this period (as of close of business April 4, 2017 through April 30, 2017 for the Class R6 shares). Because the actual ending account value and expense information in the example is not based upon a six month period for the Class R6 shares, the ending account value and expense information may not provide a meaningful comparison to mutual funds that provide such information for a full six month period.
Hypothetical example for comparison purposes
The table below also provides information about hypothetical account values and hypothetical expenses based on the Fund’s actual expense ratio and an assumed rate of return of 5% per year before expenses, which is not the Fund’s actual return.
The hypothetical account values and expenses may not be used to estimate the actual ending account balance or expenses you paid for the period. You may use this information to compare the ongoing costs of investing in the Fund and other funds. To do so, compare this 5% hypothetical example with the 5% hypothetical examples that appear in the shareholder reports of the other funds.
Please note that the expenses shown in the table are meant to highlight your ongoing costs only and do not reflect any transaction costs, such as sales charges (loads) on purchase payments or contingent deferred sales charges on redemptions, if any. Therefore, the hypothetical information is useful in comparing ongoing costs only, and will not help you determine the relative total costs of owning different funds. In addition, if these transaction costs were included, your costs would have been higher.
| | | | | | | | | | | | | | | | | | | | | | | | |
| Class | | Beginning
Account Value
(11/01/16) | | | ACTUAL | | | HYPOTHETICAL (5% annual return before expenses) | | | Annualized
Expense
Ratio | |
| | | Ending
Account Value
(04/30/17)1 | | | Expenses
Paid During
Period2 | | | Ending
Account Value
(04/30/17) | | | Expenses
Paid
During
Period3 | | |
| A | | $ | 1,000.00 | | | $ | 908.20 | | | $ | 7.24 | | | $ | 1,017.21 | | | $ | 7.65 | | | | 1.53 | % |
| B | | | 1,000.00 | | | | 905.50 | | | | 10.77 | | | | 1,013.49 | | | | 11.38 | | | | 2.28 | |
| C | | | 1,000.00 | | | | 905.50 | | | | 10.77 | | | | 1,013.49 | | | | 11.38 | | | | 2.28 | |
| Y | | | 1,000.00 | | | | 907.70 | | | | 6.05 | | | | 1,018.45 | | | | 6.41 | | | | 1.28 | |
| Investor | | | 1,000.00 | | | | 908.70 | | | | 7.24 | | | | 1,017.21 | | | | 7.65 | | | | 1.53 | |
| R6 | | | 1,000.00 | | | | 930.00 | | | | 0.69 | | | | 1,019.98 | | | | 4.86 | | | | 0.97 | |
| 1 | The actual ending account value is based on the actual total return of the Fund for the period November 1, 2016 through April 30, 2017 (as of close of business April 4, 2017 through April 30, 2017 for the Class R6 shares), after actual expenses and will differ from the hypothetical ending account value which is based on the Fund’s expense ratio and a hypothetical annual return of 5% before expenses. |
| 2 | Actual expenses are equal to the Fund’s annualized expense ratio as indicated above multiplied by the average account value over the period, multiplied by 181/365 to reflect the most recent fiscal half year. For the Class R6 shares actual expenses are equal to the annualized expense ratio indicated above multiplied by the average account value over the period, multiplied by 27 (as of close of business April 4, 2017 through April 30, 2017 for the Class R6 shares)/365. Because the Class R6 shares have not been in existence for a full six month period, the actual ending account value and expense information shown may not provide a meaningful comparison to fund expense information of classes that show such data for a full six month period and, because the actual ending account value and expense information in the expense example covers a short time period, return and expense data may not be indicative of return and expense data for longer time periods. |
| 3 | Hypothetical expenses are equal to the annualized expense ratio indicated above multiplied by the average account value over the period, multiplied by 181/365 to reflect a one-half year period. The hypothetical ending account value and expenses may be used to compare ongoing costs of investing in Class R6 shares of the Fund and other funds because such data is based on a full six month period. |
21 Invesco Gold & Precious Metals Fund
Tax Information
Form 1099-DIV, Form 1042-S and other year-end tax information provide shareholders with actual calendar year amounts that should be included in their tax returns. Shareholders should consult their tax advisors.
The following distribution information is being provided as required by the Internal Revenue Code or to meet a specific state’s requirement.
The Fund designates the following amounts or, if subsequently determined to be different, the maximum amount allowable for its fiscal year ended April 30, 2017:
| | | | |
Federal and State Income Tax | |
Qualified Dividend Income* | | | 8.47 | % |
Corporate Dividends Received Deduction* | | | 0.26 | % |
U.S. Treasury Obligations* | | | 0 | % |
| | * | The above percentages are based on ordinary income dividends paid to shareholders during the Fund’s fiscal year. |
22 Invesco Gold & Precious Metals Fund
Proxy Results
A Special Joint Meeting (“Meeting”) of Shareholders of Invesco Gold & Precious Metals Fund, an investment portfolio of AIM Sector Funds (Invesco Sector Funds), a Delaware statutory trust (“Trust”), was held on March 9, 2017. The Meeting was held for the following purpose:
| (1) | Elect 15 trustees to the Board, each of whom will serve until his or her successor is elected and qualified. |
| (2) | Approve an amendment to the Trust’s Agreement and Declaration of Trust that would permit fund mergers and other significant transactions upon the Board’s approval but without shareholder approval of such transactions. |
The results of the voting on the above matters were as follows:
| | | | | | | | | | | | | | | | | | |
| | | Matters | | | | | | | | Votes For | | | Votes Withheld | |
| (1)* | | David C. Arch | | | | 478,210,140 | | | | 13,802,825 | |
| | James T. Bunch | | | | 477,776,614 | | | | 14,236,351 | |
| | Bruce L. Crockett | | | | 477,904,863 | | |
| 14,108,102
|
|
| | Jack M. Fields | | | | 478,154,120 | | | | 13,858,845 | |
| | Martin L. Flanagan | | | | 478,366,284 | | | | 13,646,681 | |
| | Cynthia Hostetler | | | | 478,149,043 | | | | 13,863,922 | |
| | Dr. Eli Jones | | | | 478,281,396 | | | | 13,731,569 | |
| | Dr. Prema Mathai-Davis | | | | 477,927,603 | | | | 14,085,362 | |
| | Teresa M. Ressel | | | | 478,116,999 | | | | 13,895,966 | |
| | Dr. Larry Soll | | | | 477,671,696 | | | | 14,341,269 | |
| | Ann Barnett Stern | | | | 478,390,538 | | | | 13,622,427 | |
| | Raymond Stickel, Jr. | | | | 477,934,336 | | | | 14,078,629 | |
| | Philip A. Taylor | | | | 478,104,174 | | | | 13,908,791 | |
| | Robert C. Troccoli | | | | 478,368,464 | | | | 13,644,501 | |
| | Christopher L. Wilson | | | | 478,433,867 | | | | 13,579,098 | |
| | | | | |
| | | | | | | | | | | | | | | | | | |
| | | | | Votes For | | | Votes Against | | | Votes Abstain | | | Broker Non-Votes | |
| (2)* | | Approve an amendment to the Trust’s Agreement and Declaration of Trust that would permit fund mergers and other significant transactions upon the Board’s approval but without shareholder approval of such transactions | | | 261,575,830 | | | | 26,621,916 | | | | 13,166,011 | | | | 190,648,808 | |
The Meeting was adjourned until April 11, 2017, with respect to the following proposals:
| (3) | Approve changing the fundamental investment restriction regarding the purchase or sale of physical commodities. |
| 4(a) | Approve an amendment to the current Master Intergroup Sub-Advisory Contract to add Invesco PowerShares Capital Management LLC. |
| 4(b) | Approve an amendment to the current Master Intergroup Sub-Advisory Contract to add Invesco Asset Management (India) Private Limited. |
Invesco Gold & Precious Metals Fund did not receive sufficient shareholder votes to pass Proposals 3 and 4(a) - (b).
The results of the voting on the above matters were as follows:
| | | | | | | | | | | | | | | | | | |
| | | Matters | | Votes For | | | Votes Against | | | Votes Abstain | | | Broker Non-Votes | |
| (3) | | Approve changing the fundamental investment restriction regarding the purchase or sale of physical commodities | | | 21,252,095 | | | | 1,613,705 | | | | 1,309,533 | | | | 13,214,310 | |
| 4(a) | | Approve an amendment to the current Master Intergroup Sub-Advisory Contract to add Invesco PowerShares Capital Management LLC | | | 21,339,288 | | | | 1,468,912 | | | | 1,367,132 | | | | 13,214,311 | |
| 4(b) | | Approve an amendment to the current Master Intergroup Sub-Advisory Contract to add Invesco Asset Management (India) Private Limited | | | 20,949,927 | | | | 1,869,419 | | | | 1,355,984 | | | | 13,214,313 | |
| * | Each of proposal 1 and 2 required approval by a combined vote of all of the portfolios of AIM Sector Funds (Invesco Sector Funds). |
23 Invesco Gold & Precious Metals Fund
Trustees and Officers
The address of each trustee and officer is AIM Sector Funds (Invesco Sector Funds) (the “Trust”), 11 Greenway Plaza, Suite 1000, Houston, Texas 77046-1173. The trustees serve for the life of the Trust, subject to their earlier death, incapacitation, resignation, retirement or removal as more specifically provided in the Trust’s organizational documents. Each officer serves for a one year term or until their successors are elected and qualified. Column two below includes length of time served with predecessor entities, if any.
| | | | | | | | |
Name, Year of Birth and
Position(s) Held with the Trust | | Trustee and/
or Officer Since | | Principal Occupation(s)
During Past 5 Years | | Number of
Funds in Fund
Complex
Overseen by
Trustee | | Other Directorship(s)
Held by Trustee During
Past 5 Years |
| Interested Persons | | | | | | | | |
| Martin L. Flanagan1 — 1960 Trustee | | 2007 | | Executive Director, Chief Executive Officer and President, Invesco Ltd. (ultimate parent of Invesco and a global investment management firm); Trustee, The Invesco Funds; Vice Chair, Investment Company Institute; and Member of Executive Board, SMU Cox School of Business Formerly: Advisor to the Board, Invesco Advisers, Inc. (formerly known as Invesco Institutional (N.A.), Inc.); Chairman and Chief Executive Officer, Invesco Advisers, Inc. (registered investment adviser); Director, Chairman, Chief Executive Officer and President, Invesco Holding Company (US), Inc. (formerly IVZ Inc.) (holding company), Invesco Group Services, Inc. (service provider) and Invesco North American Holdings, Inc. (holding company); Director, Chief Executive Officer and President, Invesco Holding Company Limited (parent of Invesco and a global investment management firm); Director, Invesco Ltd.; Chairman, Investment Company Institute and President, Co-Chief Executive Officer, Co-President, Chief Operating Officer and Chief Financial Officer, Franklin Resources, Inc. (global investment management organization) | | 144 | | None |
Philip A. Taylor2 — 1954 Trustee and Senior Vice President | | 2006 | | Head of the Americas and Senior Managing Director, Invesco Ltd.; Director, Invesco Advisers, Inc. (formerly known as Invesco Institutional (N.A.), Inc.) (registered investment adviser); Director, Chairman, Chief Executive Officer and President, Invesco Management Group, Inc. (formerly known as Invesco Aim Management Group, Inc.) (financial services holding company); Director and Chairman, Invesco Investment Services, Inc. (formerly known as Invesco Aim Investment Services, Inc.) (registered transfer agent) Chief Executive Officer, Invesco Corporate Class Inc. (corporate mutual fund company) Director, Chairman and Chief Executive Officer, Invesco Canada Ltd. (formerly known as Invesco Trimark Ltd./Invesco Trimark Ltèe) (registered investment adviser and registered transfer agent); Trustee and Senior Vice President, The Invesco Funds; Director, Invesco Investment Advisers LLC (formerly known as Van Kampen Asset Management). Formerly: Co-Chairman, Co-President and Co-Chief Executive Officer, Invesco Advisers, Inc. (formerly known as Invesco Institutional (N.A.), Inc.) (registered investment adviser); Director, Chief Executive Officer and President, Van Kampen Exchange Corp; President and Principal Executive Officer, The Invesco Funds (other than AIM Treasurer’s Series Trust (Invesco Treasurer’s Series Trust), Short-Term Investments Trust and Invesco Management Trust); Executive Vice President, The Invesco Funds (AIM Treasurer’s Series Trust (Invesco Treasurer’s Series Trust), Short-Term Investments Trust and Invesco Management Trust only); Director and President, INVESCO Funds Group, Inc. (registered investment adviser and registered transfer agent); Director and Chairman, IVZ Distributors, Inc. (formerly known as INVESCO Distributors, Inc.) (registered broker dealer); Director, President and Chairman, Invesco Inc. (holding company), Invesco Canada Holdings Inc. (holding company), Trimark Investments Ltd./Placements Trimark Ltèe and Invesco Financial Services Ltd/Services Financiers Invesco Ltèe; Chief Executive Officer, Invesco Canada Fund Inc. (corporate mutual fund company); Director and Chairman, Van Kampen Investor Services Inc.; Director, Chief Executive Officer and President, 1371 Preferred Inc. (holding company) and Van Kampen Investments Inc.; Director and President, AIM GP Canada Inc. (general partner for limited partnerships) and Van Kampen Advisors, Inc.; Director and Chief Executive Officer, Invesco Trimark Dealer Inc. (registered broker dealer); Director, Invesco Distributors, Inc. (formerly known as Invesco Aim Distributors, Inc.) (registered broker dealer); Manager, Invesco PowerShares Capital Management LLC; Director, Chief Executive Officer and President, Invesco Advisers, Inc.; Director, Chairman, Chief Executive Officer and President, Invesco Aim Capital Management, Inc.; President, Invesco Trimark Dealer Inc. and Invesco Trimark Ltd./Invesco Trimark Ltèe; Director and President, AIM Trimark Corporate Class Inc. and AIM Trimark Canada Fund Inc.; Senior Managing Director, Invesco Holding Company Limited; Director and Chairman, Fund Management Company (former registered broker dealer); President and Principal Executive Officer, The Invesco Funds (AIM Treasurer’s Series Trust (Invesco Treasurer’s Series Trust), and Short-Term Investments Trust only); President, AIM Trimark Global Fund Inc. and AIM Trimark Canada Fund Inc. | | 144 | | None |
| 1 | Mr. Flanagan is considered an interested person (within the meaning of Section 2(a)(19) of the 1940 Act) of the Trust because he is an officer of the Adviser to the Trust, and an officer and a director of Invesco Ltd., ultimate parent of the Adviser. |
| 2 | Mr. Taylor is considered an interested person (within the meaning of Section 2(a)(19) of the 1940 Act) of the Trust because he is an officer and a director of the Adviser. |
T-1 Invesco Gold & Precious Metals Fund
Trustees and Officers—(continued)
| | | | | | | | |
Name, Year of Birth and
Position(s) Held with the Trust | | Trustee and/
or Officer Since | | Principal Occupation(s)
During Past 5 Years | | Number of
Funds in Fund
Complex
Overseen by
Trustee | | Other Directorship(s)
Held by Trustee During
Past 5 Years |
| Independent Trustees | | | | | | | | |
Bruce L. Crockett — 1944 Trustee and Chair | | 2003 | | Chairman, Crockett Technologies Associates (technology consulting company) Formerly: Director, Captaris (unified messaging provider); Director, President and Chief Executive Officer, COMSAT Corporation; Chairman, Board of Governors of INTELSAT (international communications company); ACE Limited (insurance company); Independent Directors Council and Investment Company Institute: Member of the Audit Committee, Investment Company Institute; Member of the Executive Committee and Chair of the Governance Committee, Independent Directors Council | | 144 | | Director and Chairman of the Audit Committee, ALPS (Attorneys Liability Protection Society) (insurance company); Director and Member of the Audit Committee, Ferroglobe PLC (metallurgical company) |
David C. Arch — 1945 Trustee | | 2010 | | Chairman of Blistex Inc. (consumer health care products manufacturer); Member, World Presidents’ Organization | | 144 | | Board member of the Illinois Manufacturers’ Association |
James T. Bunch — 1942 Trustee | | 2000 | | Managing Member, Grumman Hill Group LLC (family office/private equity investments) Formerly: Chairman of the Board, Denver Film Society; Chairman of the Board of Trustees, Evans Scholarship Foundation; Chairman, Board of Governors, Western Golf Association | | 144 | | Trustee, Evans Scholarship Foundation |
Jack M. Fields — 1952 Trustee | | 2003 | | Chief Executive Officer, Twenty First Century Group, Inc. (government affairs company); and Discovery Learning Alliance (non-profit) Formerly: Owner and Chief Executive Officer, Dos Angeles Ranch L.P. (cattle, hunting, corporate entertainment); Director, Insperity, Inc. (formerly known as Administaff); Chief Executive Officer, Texana Timber LP (sustainable forestry company); Director of Cross Timbers Quail Research Ranch (non-profit); and member of the U.S. House of Representatives | | 144 | | None |
Cynthia Hostetler — 1962 Trustee | | 2017 | | Non-Executive Director and Trustee of a number of public and private business corporations Formerly: Head of Investment Funds and Private Equity, Overseas Private Investment Corporation; President, First Manhattan Bancorporation, Inc.; Attorney, Simpson Thacher & Bartlett LLP | | 144 | | Vulcan Materials Company (construction materials company); Trilinc Global Impact Fund; Aberdeen Investment Funds (4 portfolios); Artio Global Investment LLC (mutual fund complex); Edgen Group, Inc. (specialized energy and infrastructure products distributor) |
Eli Jones — 1961 Trustee | | 2016 | | Professor and Dean, Mays Business School—Texas A&M University Formerly: Professor and Dean, Walton College of Business, University of Arkansas and E.J. Ourso College of Business, Louisiana State University; Director, Arvest Bank | | 144 | | Insperity, Inc. (formerly known as Administaff) (human resources provider) |
Prema Mathai-Davis — 1950 Trustee | | 2003 | | Retired. Formerly: Chief Executive Officer, YWCA of the U.S.A. | | 144 | | None |
Teresa M. Ressel — 1962 Trustee | | 2017 | | Non-Executive Director and Trustee of a number of public and private business corporations Formerly: Chief Financial Officer, Olayan America, The Olayan Group (international investor/commercial/industrial); Chief Executive Officer, UBS Securities LLC; Group Chief Operating Officer, Americas, UBS AG; Assistant Secretary for Management & Budget and CFO, US Department of the Treasury; Chief Compliance Officer, Kaiser Permanente; Program Manager, Hewlett-Packard; Nuclear Engineering, General Dynamics Corporation | | 144 | | Atlantic Power Corporation (power generation company); ON Semiconductor Corp. (semiconductor supplier) |
Larry Soll — 1942 Trustee | | 1997 | | Retired. Formerly: Chairman, Chief Executive Officer and President, Synergen Corp. (a biotechnology company) | | 144 | | None |
Ann Barnett Stern — 1957 Trustee | | 2017 | | President and Chief Executive Officer, Houston Endowment Inc. (private philanthropic institution) Formerly: Executive Vice President and General Counsel, Texas Children’s Hospital; Attorney, Beck, Redden and Secrest, LLP; Business Law Instructor, University of St. Thomas; Attorney, Andrews & Kurth LLP | | 144 | | Federal Reserve Bank of Dallas |
Raymond Stickel, Jr. — 1944 Trustee | | 2005 | | Retired. Formerly: Director, Mainstay VP Series Funds, Inc. (25 portfolios); Partner, Deloitte & Touche | | 144 | | None |
Robert C. Troccoli — 1949 Trustee | | 2016 | | Adjunct Professor, University of Denver – Daniels College of Business Formerly: Senior Partner, KPMG LLP | | 144 | | None |
Christopher L. Wilson — 1957 Trustee | | 2017 | | Managing Partner, CT2, LLC (investing and consulting firm) Formerly: President/Chief Executive Officer, Columbia Funds, Bank of America Corporation; President/Chief Executive Officer, CDC IXIS Asset Management Services, Inc.; Principal & Director of Operations, Scudder Funds, Scudder, Stevens & Clark, Inc.; Assistant Vice President, Fidelity Investments | | 144 | | TD Asset Management USA Inc. (mutual fund complex) (22 portfolios); ISO New England, Inc. (non-profit organization managing regional electricity market) |
T-2 Invesco Gold & Precious Metals Fund
Trustees and Officers—(continued)
| | | | | | | | |
Name, Year of Birth and
Position(s) Held with the Trust | | Trustee and/
or Officer Since | | Principal Occupation(s)
During Past 5 Years | | Number of
Funds in Fund
Complex
Overseen by
Trustee | | Other Directorship(s)
Held by Trustee During
Past 5 Years |
| Other Officers | | | | | | | | |
Sheri Morris — 1964 President, Principal Executive Officer and Treasurer | | 2003 | | President, Principal Executive Officer and Treasurer, The Invesco Funds; Vice President, Invesco Advisers, Inc. (formerly known as Invesco Institutional (N.A.), Inc.) (registered investment adviser); and Vice President, PowerShares Exchange-Traded Fund Trust, PowerShares Exchange-Traded Fund Trust II, PowerShares India Exchange-Traded Fund Trust, PowerShares Actively Managed Exchange-Traded Fund Trust and PowerShares Actively Managed Exchange-Traded Commodity Fund Trust Formerly: Vice President and Principal Financial Officer, The Invesco Funds; Vice President, Invesco Aim Advisers, Inc., Invesco Aim Capital Management, Inc. and Invesco Aim Private Asset Management, Inc.; Assistant Vice President and Assistant Treasurer, The Invesco Funds and Assistant Vice President, Invesco Advisers, Inc., Invesco Aim Capital Management, Inc. and Invesco Aim Private Asset Management, Inc.; and Treasurer, PowerShares Exchange-Traded Fund Trust, PowerShares Exchange-Traded Fund Trust II, PowerShares India Exchange-Traded Fund Trust and PowerShares Actively Managed Exchange-Traded Fund Trust | | N/A | | N/A |
Russell C. Burk — 1958 Senior Vice President and Senior Officer | | 2005 | | Senior Vice President and Senior Officer, The Invesco Funds | | N/A | | N/A |
John M. Zerr — 1962 Senior Vice President, Chief Legal Officer and Secretary | | 2006 | | Director, Senior Vice President, Secretary and General Counsel, Invesco Management Group, Inc. (formerly known as Invesco AIM Management Group, Inc.); Senior Vice President, Invesco Advisers, Inc. (formerly known as Invesco Institutional (N.A.), Inc.) (registered investment adviser); Senior Vice President and Secretary, Invesco Distributors, Inc. (formerly known as Invesco AIM Distributors, Inc.); Director, Vice President and Secretary, Invesco Investment Services, Inc. (formerly known as Invesco AIM Investment Services, Inc.) Senior Vice President, Chief Legal Officer and Secretary, The Invesco Funds; Managing Director, Invesco PowerShares Capital Management LLC; Director, Secretary and General Counsel, Invesco Investment Advisers LLC (formerly known as Van Kampen Asset Management); Secretary and General Counsel, Invesco Capital Markets, Inc. (formerly known as Van Kampen Funds Inc.) and Chief Legal Officer, PowerShares Exchange-Traded Fund Trust, PowerShares Exchange-Traded Fund Trust II, PowerShares India Exchange-Traded Fund Trust, PowerShares Actively Managed Exchange-Traded Fund Trust and PowerShares Actively Managed Exchange-Traded Commodity Fund Trust; Manager and Secretary, Invesco Indexing LLC Formerly: Director, Secretary, General Counsel and Senior Vice President, Van Kampen Exchange Corp.; Director, Vice President and Secretary, IVZ Distributors, Inc. (formerly known as INVESCO Distributors, Inc.); Director and Vice President, INVESCO Funds Group, Inc.; Director and Vice President, Van Kampen Advisors Inc.; Director, Vice President, Secretary and General Counsel, Van Kampen Investor Services Inc.; Director, Invesco Distributors, Inc. (formerly known as Invesco AIM Distributors, Inc.); Director, Senior Vice President, General Counsel and Secretary, Invesco AIM Advisers, Inc. and Van Kampen Investments Inc.; Director, Vice President and Secretary, Fund Management Company; Director, Senior Vice President, Secretary, General Counsel and Vice President, Invesco AIM Capital Management, Inc.; Chief Operating Officer and General Counsel, Liberty Ridge Capital, Inc. (an investment adviser); Vice President and Secretary, PBHG Funds (an investment company) and PBHG Insurance Series Fund (an investment company); Chief Operating Officer, General Counsel and Secretary, Old Mutual Investment Partners (a broker-dealer); General Counsel and Secretary, Old Mutual Fund Services (an administrator) and Old Mutual Shareholder Services (a shareholder servicing center); Executive Vice President, General Counsel and Secretary, Old Mutual Capital, Inc. (an investment adviser); and Vice President and Secretary, Old Mutual Advisors Funds (an investment company) | | N/A | | N/A |
Gregory G. McGreevey — 1962 Senior Vice President | | 2012 | | Senior Managing Director, Invesco Ltd.; Director, Chairman, President, and Chief Executive Officer, Invesco Advisers, Inc. (formerly known as Invesco Institutional (N.A.), Inc.) (registered investment adviser); Director, Invesco Mortgage Capital, Inc. and Invesco Senior Secured Management, Inc.; and Senior Vice President, The Invesco Funds Formerly: Assistant Vice President, The Invesco Funds | | N/A | | N/A |
Kelli Gallegos — 1970 Vice President, Principal Financial Officer and Assistant Treasurer | | 2008 | | Vice President, Principal Financial Officer and Assistant Treasurer, The Invesco Funds; Assistant Treasurer, Invesco PowerShares Capital Management LLC, PowerShares Exchange-Traded Fund Trust, PowerShares Exchange-Traded Fund Trust II, PowerShares India Exchange-Traded Fund Trust, PowerShares Actively Managed Exchange-Traded Fund Trust and PowerShares Actively Managed Exchange-Traded Commodity Fund Trust Formerly: Assistant Vice President, The Invesco Funds | | N/A | | N/A |
T-3 Invesco Gold & Precious Metals Fund
Trustees and Officers—(continued)
| | | | | | | | |
Name, Year of Birth and
Position(s) Held with the Trust | | Trustee and/
or Officer Since | | Principal Occupation(s)
During Past 5 Years | | Number of
Funds in Fund
Complex
Overseen by
Trustee | | Other Directorship(s)
Held by Trustee During
Past 5 Years |
| Other Officers—(continued) | | | | | | | | |
Tracy Sullivan — 1962 Vice President, Chief Tax Officer and Assistant Treasurer | | 2008 | | Vice President, Chief Tax Officer and Assistant Treasurer, The Invesco Funds; Assistant Treasurer, Invesco PowerShares Capital Management LLC, PowerShares Exchange-Traded Fund Trust, PowerShares Exchange-Traded Fund Trust II, PowerShares India Exchange-Traded Fund Trust, PowerShares Actively Managed Exchange-Traded Fund Trust and PowerShares Actively Managed Exchange-Traded Commodity Fund Trust Formerly: Assistant Vice President, The Invesco Funds | | N/A | | N/A |
Crissie M. Wisdom — 1969 Anti-Money Laundering Compliance Officer | | 2013 | | Anti-Money Laundering Compliance Officer, Invesco Advisers, Inc. (formerly known as Invesco Institutional (N.A.), Inc.) (registered investment adviser), Invesco Capital Markets, Inc. (formerly known as Van Kampen Funds Inc.), Invesco Distributors, Inc., Invesco Investment Services, Inc., Invesco Management Group, Inc., The Invesco Funds, and PowerShares Exchange-Traded Fund Trust, PowerShares Exchange-Traded Fund Trust II, PowerShares India Exchange-Traded Fund Trust, PowerShares Actively Managed Exchange-Traded Fund Trust and PowerShares Actively Managed Exchange-Traded Commodity Fund Trust; Anti-Money Laundering Compliance Officer and Bank Secrecy Act Officer, INVESCO National Trust Company and Invesco Trust Company; and Fraud Prevention Manager and Controls and Risk Analysis Manager for Invesco Investment Services, Inc. Formerly: Anti-Money Laundering Compliance Officer, Van Kampen Exchange Corp. | | N/A | | N/A |
Robert R. Leveille — 1969 Chief Compliance Officer | | 2016 | | Chief Compliance Officer, Invesco Advisers, Inc. (registered investment adviser); and Chief Compliance Officer, The Invesco Funds Formerly: Chief Compliance Officer, Putnam Investments and the Putnam Funds | | N/A | | N/A |
The Statement of Additional Information of the Trust includes additional information about the Fund’s Trustees and is available upon request, without charge, by calling 1.800.959.4246. Please refer to the Fund’s Statement of Additional Information for information on the Fund’s sub-advisers.
| | | | | | | | | | |
Office of the Fund 11 Greenway Plaza, Suite 1000 Houston, TX 77046-1173 | | Investment Adviser Invesco Advisers, Inc. 1555 Peachtree Street, N.E. Atlanta, GA 30309 | |
| Distributor
Invesco Distributors, Inc. 11 Greenway Plaza, Suite 1000 Houston, TX 77046-1173 |
| |
| Auditors
PricewaterhouseCoopers LLP 1000 Louisiana Street, Suite 5800 Houston, TX 77002-5678 |
|
| | | |
| | | | | | | | | | |
Counsel to the Fund Stradley Ronon Stevens & Young, LLP 2005 Market Street, Suite 2600 Philadelphia, PA 19103-7018 | | Counsel to the Independent Trustees Goodwin Procter LLP 901 New York Avenue, N.W. Washington, D.C. 20001 | |
| Transfer Agent
Invesco Investment Services, Inc. 11 Greenway Plaza, Suite 1000 Houston, TX 77046-1173 |
| |
| Custodian
State Street Bank and Trust Company 225 Franklin Street Boston, MA 02110-2801 |
|
T-4 Invesco Gold & Precious Metals Fund
Explore High-Conviction Investing with Invesco

Go paperless with eDelivery
Visit invesco.com/edelivery to enjoy the convenience and security of anytime electronic access to your investment documents.
With eDelivery, you can elect to have any or all of the following materials delivered straight to your inbox to download, save and print from your own computer:
∎ Fund reports and prospectuses
∎ Quarterly statements
∎ Daily confirmations
∎ Tax forms
Invesco mailing information
Send general correspondence to Invesco Investment Services, Inc., P.O. Box 219078, Kansas City, MO 64121-9078.
Important notice regarding delivery of security holder documents
To reduce Fund expenses, only one copy of most shareholder documents may be mailed to shareholders with multiple accounts at the same address (Householding). Mailing of your shareholder documents may be householded indefinitely unless you instruct us otherwise. If you do not want the mailing of these documents to be combined with those for other members of your household, please contact Invesco Investment Services, Inc. at 800 959 4246 or contact your financial institution. We will begin sending you individual copies for each account within 30 days after receiving your request.
Fund holdings and proxy voting information
The Fund provides a complete list of its holdings four times in each fiscal year, at the quarter ends. For the second and fourth quarters, the lists appear in the Fund’s semiannual and annual reports to shareholders. For the first and third quarters, the Fund files the lists with the Securities and Exchange Commission (SEC) on Form N-Q. The most recent list of portfolio holdings is available at invesco.com/completeqtrholdings. Shareholders can also look up the Fund’s Forms N-Q on the SEC website at sec.gov. Copies of the Fund’s Forms N-Q may be reviewed and copied at the SEC Public Reference Room in Washington, D.C. You can obtain information on the operation of the Public Reference Room, including information about duplicating fee charges, by calling 202 551 8090 or 800 732 0330, or by electronic request at the following email address: publicinfo@sec.gov.
The SEC file numbers for the Fund are shown below.
A description of the policies and procedures that the Fund uses to determine how to vote proxies relating to portfolio securities is available without charge, upon request, from our Client Services department at 800 959 4246 or at invesco.com/proxyguidelines. The information is also available on the SEC website, sec.gov.
| | | | |
Information regarding how the Fund voted proxies related to its portfolio securities during the most recent 12-month period ended June 30 is available at invesco.com/proxysearch. The information is also available on the SEC website, sec.gov. Invesco Advisers, Inc. is an investment adviser; it provides investment advisory services to individual and institutional clients and does not sell securities. Invesco Distributors, Inc. is the US distributor for Invesco Ltd.’s retail mutual funds, exchange-traded funds and institutional money market funds. Both are wholly owned, indirect subsidiaries of Invesco Ltd. | |  | | |
| |
| SEC file numbers: 811-03826 and 002-85905 Invesco Distributors, Inc. I-GPM-AR-1 06122017 1558 | | |
| | | | |
| | |
 | | Annual Report to Shareholders | | April 30, 2017 |
| | |
| | Invesco Mid Cap Growth Fund |
| | Nasdaq: |
| | A: VGRAX ∎ B: VGRBX ∎ C: VGRCX ∎ R: VGRRX ∎ Y: VGRDX ∎ R5: VGRJX ∎ R6: VGRFX |
|
 |
Letters to Shareholders
| | | | |

Philip Taylor | | | | Dear Shareholders: This annual report includes information about your Fund, including performance data and a complete list of its investments as of the close of the reporting period. Inside is a discussion of how your Fund was managed and the factors that affected its performance during the reporting period. The reporting period began with stock market volatility in the US and abroad, largely the result of uncertainty about global economic growth and monetary policy. Markets declined sharply following UK voters’ decision in June to leave the European Union. Relatively quickly, however, markets recovered, reaching record highs later in the summer. Demand was strong for income-producing investments, particularly those perceived to be lower risk; this benefited bonds as well as dividend-paying stocks for much of the reporting period. While economic news in the US was generally positive during the reporting period, news overseas was less upbeat. The European Central Bank and central banks in China and Japan – as well as other countries – maintained |
extraordinarily accommodative monetary policies in response to economic weakness. After months of uncertainty, the outcome of the US presidential election in November triggered a major stock market rally, with most market indexes repeatedly reaching new highs through February. As expected, the US Federal Reserve (the Fed) raised interest rates in December 2016 and again in March 2017. In its March statement, the Fed noted that the labor market has strengthened and economic activity has expanded at a moderate pace – and that it expects those trends to continue.
Short-term market volatility can prompt some investors to abandon their investment plans – and can cause others to settle for whatever returns the market has to offer. The investment professionals at Invesco, in contrast, invest with high conviction. This means that, no matter the asset class or the strategy, each investment team has a passion to exceed. We want to help investors achieve better outcomes, such as seeking higher returns, helping mitigate risk and generating income. Of course, investing with high conviction can’t guarantee a profit or ensure success; no investment strategy can. To learn more about how we invest with high conviction, visit invesco.com/HighConviction.
You, too, can invest with high conviction by maintaining a long-term investment perspective and by working with your financial adviser on a regular basis. During periods of short-term market volatility or uncertainty, your financial adviser can keep you focused on your long-term investment goals – a new home, a child’s college education or a secure retirement. He or she also can share research about the economy, the markets and individual investment options.
Visit our website for more information on your investments
Our website, invesco.com/us, offers a wide range of market insights and investment perspectives. On the website, you’ll find detailed information about our funds, including performance, holdings and portfolio manager commentaries. You can access information about your account by completing a simple, secure online registration. To do so, select “Log In” on the right side of the homepage, and then select “Register for Individual Account Access.”
In addition to the resources accessible on our website and through our mobile app, you can obtain timely updates to help you stay informed about the markets, the economy and investing by connecting with Invesco on Twitter, LinkedIn or Facebook. You can access our blog at blog.invesco.us.com. Our goal is to provide you the information you want, when and where you want it.
Finally, I’m pleased to share with you Invesco’s commitment to both the Principles for Responsible Investment and to considering environmental, social and governance issues in our robust investment process. I invite you to learn more at invesco.com/esg.
Have questions?
For questions about your account, contact an Invesco client services representative at 800 959 4246. For Invesco-related questions or comments, please email me directly at phil@invesco.com.
All of us at Invesco look forward to serving your investment management needs. Thank you for investing with us.
Sincerely,

Philip Taylor
Senior Managing Director, Invesco Ltd.
2 Invesco Mid Cap Growth Fund
| | | | |

Bruce Crockett | | | | Dear Fellow Shareholders: Among the many important lessons I’ve learned in more than 40 years in a variety of business endeavors is the value of a trusted advocate. As independent chair of the Invesco Funds Board, I can assure you that the members of the Board are strong advocates for the interests of investors in Invesco’s mutual funds. We work hard to represent your interests through oversight of the quality of the investment management services your funds receive and other matters important to your investment, including but not limited to: ∎ Ensuring that Invesco offers a diverse lineup of mutual funds that your financial adviser can use to strive to meet your financial needs as your investment goals change over time. ∎ Monitoring how the portfolio management teams of the Invesco funds are performing in light of changing economic and market conditions. |
| ∎ | | Assessing each portfolio management team’s investment performance within the context of the investment strategy described in the fund’s prospectus. |
| ∎ | | Monitoring for potential conflicts of interests that may impact the nature of the services that your funds receive. |
We believe one of the most important services we provide our fund shareholders is the annual review of the funds’ advisory and sub-advisory contracts with Invesco Advisers and its affiliates. This review is required by the Investment Company Act of 1940 and focuses on the nature and quality of the services Invesco provides as the adviser to the Invesco funds and the reasonableness of the fees that it charges for those services. Each year, we spend months carefully reviewing information received from Invesco and a variety of independent sources, such as performance and fee data prepared by Lipper, Inc. (a subsidiary of Broadridge Financial Solutions, Inc.), an independent, third-party firm widely recognized as a leader in its field. We also meet with our independent legal counsel and other independent advisers to review and help us assess the information that we have received. Our goal is to assure that you receive quality investment management services for a reasonable fee.
I trust the measures outlined above provide assurance that you have a worthy advocate when it comes to choosing the Invesco Funds.
As always, please contact me at bruce@brucecrockett.com with any questions or concerns you may have. On behalf of the Board, we look forward to continuing to represent your interests and serving your needs.
Sincerely,

Bruce L. Crockett
Independent Chair
Invesco Funds Board of Trustees
3 Invesco Mid Cap Growth Fund
Management’s Discussion of Fund Performance
| | | | |
| Performance summary | |
For the fiscal year ended April 30, 2017, Class A shares of Invesco Mid Cap Growth Fund (the Fund), at net asset value (NAV), underperformed the Fund’s style-specific benchmark, the Russell Midcap Growth Index. Your Fund’s long-term performance appears later in this report. | |
| Fund vs. Indexes | |
Total returns, 4/30/16 to 4/30/17, at net asset value (NAV). Performance shown does not include applicable contingent deferred sales charges (CDSC) or front-end sales charges, which would have reduced performance. | |
Class A Shares | | | 14.94 | % |
Class B Shares | | | 14.98 | |
Class C Shares | | | 14.11 | |
Class R Shares | | | 14.67 | |
Class Y Shares | | | 15.24 | |
Class R5 Shares | | | 15.39 | |
Class R6 Shares | | | 15.50 | |
S&P 500 Index▼ (Broad Market Index) | | | 17.92 | |
Russell Midcap Growth Index▼ (Style-Specific Index) | | | 15.83 | |
Lipper Mid-Cap Growth Funds Index∎ (Peer Group Index) | | | 18.20 | |
Source(s): ▼FactSet Research Systems Inc.; ∎Lipper Inc. | | | | |
Market conditions and your Fund
During the fiscal year ended April 30, 2017, the US economy continued its multiyear recovery, the result of a goldilocks economy featuring moderate economic growth, continued improvement in unemployment and muted inflation. Economic indicators improved modestly but steadily during the reporting period; the declining unemployment rate combined with signs of inflation on the horizon prompted the US Federal Reserve (the Fed) to raise interest rates in December 2016 and again in March 2017. Major US stock market indexes posted gains for the reporting period, with most hitting record highs following the US presidential election. Investors hoped that the new administration’s stated goals of reducing corporate tax rates, scaling back regulations and increasing infrastructure spending, if achieved, could lead to increased economic growth.
While US and overseas stock markets were surprised by the UK’s unexpected decision in June 2016 to leave the European Union, they recovered relatively quickly. During the second half of 2016, small-cap stocks led the US market higher, outperforming large-cap stocks. However, large-cap stocks were able to regain their leadership in the first quarter of 2017. As the fiscal year came to a close, it became clear that enacting major legislative initiatives likely to affect the stock market, including tax reform and health care, were going to be more complicated and time-consuming than anticipated. The resulting uncertainty resulted in a slight increase in market volatility at the end of the fiscal year. For the reporting period as a whole, the information technology (IT) and financials sectors outperformed the broad market; more defensive sectors such as consumer staples and utilities underperformed the broad market.
In this environment, the Fund at NAV produced a positive return but slightly trailed its style-specific index, the Russell Midcap Growth Index. Overall, solid stock selection was the primary driver of Fund performance. Most notably, stock selection in the consumer discretionary, consumer staples, health care and industrials sectors contributed to relative Fund performance. Underweight exposure to the consumer discretionary and consumer staples sectors also benefited relative Fund performance. However, the Fund was negatively impacted by relative underperformance in both the IT and financials sectors. Lastly, the Fund’s cash holdings negatively affected performance during this period of strong market performance, as did the Fund’s overweight exposure to energy, a sector we believed was undervalued.
The consumer discretionary sector was the leading contributor to the Fund’s performance relative to the style-specific index; this was due to the Fund’s positive stock selection in, and underweight exposure to, the sector versus the style-specific index. The leading contributor to Fund performance in the sector was US retailer Burlington Stores. Burlington has been transforming both its image and operations, causing the company to post double-digit returns for the reporting period. This was driven primarily by improving margins, increased customer traffic and the addition of new and better brands, which helped drive revenue growth. Domino’s Pizza also was a notable contributor as the company continued to increase its already dominant market share in the pizza category – primarily due to a new smartphone app and web ordering platform. This new technology, which has significantly increased the ease and speed of ordering online, has won the support of its customers.
| | | | |
| Portfolio Composition | |
By sector | | | % of total net assets | |
| | | | |
| |
Information Technology | | | 26.1% | |
Consumer Discretionary | | | 15.8 | |
Health Care | | | 15.6 | |
Industrials | | | 13.7 | |
Financials | | | 9.5 | |
Energy | | | 5.8 | |
Consumer Staples | | | 3.5 | |
Materials | | | 3.4 | |
Telecommunication Services | | | 2.9 | |
Real Estate | | | 1.7 | |
Money Market Funds Plus Other Assets Less Liabilities | | | 2.0 | |
| | | | | |
| Top 10 Equity Holdings* |
| | | | % of total net assets | |
| | | | | |
1. ServiceNow, Inc. | | | | 2.3 | % |
| 2. E*TRADE Financial Corp. | | | | 2.1 | |
| 3. Constellation Brands, Inc.- Class A | | | | 1.9 | |
| 4. Fidelity National Information Services, Inc. | | | | 1.9 | |
| 5. Electronic Arts Inc. | | | | 1.9 | |
| 6. Amphenol Corp.-Class A | | | | 1.8 | |
| 7. Hologic, Inc. | | | | 1.8 | |
| 8. SBA Communications Corp.-Class A | | | | 1.8 | |
| 9. Diamondback Energy Inc. | | | | 1.7 | |
| 10. BioMarin Pharmaceutical Inc. | | | | 1.7 | |
| | | | | |
| Total Net Assets | | | | $2.7 billion | |
| |
| Total Number of Holdings* | | | | 8.2 | |
The Fund’s holdings are subject to change, and there is no assurance that the Fund will continue to hold any particular security.
*Excluding money market fund holdings.
Data presented here are as of April 30, 2017.
4 Invesco Mid Cap Growth Fund
Stock selection in and underweight exposure to the consumer staples sector also contributed to the Fund’s performance relative to the style-specific index. Overall, the Fund was underweight this sector due to stretched valuations and a lack of growth opportunities. Food and beverage holding WhiteWave Foods was the leading contributor to Fund performance within the sector. We sold our position in WhiteWave Foods before the close of the reporting period.
The health care sector also drove Fund performance through good stock selection. A notable contributor was medical equipment manufacturer Penumbra. The company was boosted by better-than-expected market penetration for the company’s treatment of peripheral thrombosis and the introduction of a new standard of care for the treatment of stroke. Two of the Fund’s holdings in the health care sector – VCA and Medivation – were acquired at significant premiums during the reporting period, thereby contributing to the Fund’s relative performance. VCA, the largest provider of animal care, was acquired by Mars (not a Fund holding) in January, and Medivation, a developer and marketer of cancer drugs, was acquired by Pfizer (not a Fund holding) in August.
However, stock selection in the IT sector was a detractor from Fund performance relative to the style-specific index. Ironically, the largest negative impact was from not owning visual computing company NVIDIA, which performed well during the reporting period and which accounted for a large weighting in the style-specific index. IT security company Palo Alto Networks also detracted from relative Fund performance as the company has been going through a business transition that impacted the timing of revenue recognition as it shifts from a hardware-driven company to a software and services company. Investors opted to step to the sidelines during the transition. We sold our position in Palo Alto Networks before the close of the reporting period. Semiconductor provider Cavium detracted from Fund performance due to a slowdown in its core business with Amazon.com (not a Fund holding). The company also made a very large acquisition during the reporting period – one that we did not believe was in line with our original investment thesis. As a result, we sold our position in the stock before the close of the reporting period.
Fund holdings in the financials sector also detracted from Fund performance relative to the style-specific index. Diversified financials firm SVB Financial Group was a detractor within the sector. The company was negatively affected early in the reporting period by market concerns about lower interest rates and potential weakness in its IT sector end market. We sold the holding before the close of the reporting period. Commercial bank Signature Bank was a notable detractor from Fund performance. The company faced headwinds during the reporting period due to lower credit trends and losses from its taxi medallion business. We eliminated the stock from the Fund before the close of the reporting period.
Despite significantly outperforming the style-specific index on an absolute basis in the energy sector, the Fund’s overweight exposure to the sector was a detractor on a relative basis. The energy sector faced several headwinds during the reporting period as crude prices declined on concerns over increasing US energy supplies and fears that the OPEC cuts enacted in November 2016 would not be continued after June 2017. Independent oil and gas company Concho Resources was the most significant detractor within the energy sector, as the company was negatively affected by the macro environment surrounding the sector. As of the close of the reporting period, we still owned the company due to its high quality footprint within the Delaware Basin and its opportunity for resource improvement over the course of 2017.
During the reporting period, the Fund’s exposure to the IT and energy sectors increased, while its consumer discretionary and consumer staples sector exposure decreased. At the end of the reporting period, the financials, energy and IT sectors were the Fund’s largest overweight allocations relative to the style-specific index. The Fund was most underweight relative to the index in the consumer discretionary, consumer staples and real estate sectors. Near-term economic growth seems to be decelerating despite strong US consumer and business confidence. Given this, we seek to identify companies that are taking market share within their respective industries. Though we anticipate a possible slowdown in the economy, we continue to prudently balance the Fund’s holdings between dynamic growth opportunities and more durable growth opportunities.
We thank you for your commitment to Invesco Mid Cap Growth Fund.
The views and opinions expressed in management’s discussion of Fund performance are those of Invesco Advisers, Inc. These views and opinions are subject to change at any time based on factors such as market and economic conditions. These views and opinions may not be relied upon as investment advice or recommendations, or as an offer for a particular security. The information is not a complete analysis of every aspect of any market, country, industry, security or the Fund. Statements of fact are from sources considered reliable, but Invesco Advisers, Inc. makes no representation or warranty as to their completeness or accuracy. Although historical performance is no guarantee of future results, these insights may help you understand our investment management philosophy.
See important Fund and, if applicable, index disclosures later in this report.
| | |

| | Jim Leach Chartered Financial Analyst, Portfolio Manager, is lead manager of Invesco Mid Cap Growth Fund. He |
| joined Invesco in 2011. Mr. Leach earned a BS in mechanical engineering from the University of California and an MBA from New York University Stern School of Business. |
| | |

| | Elizabeth Bernstein Portfolio Manager, is manager of Invesco Mid Cap Growth Fund. She joined Invesco in 2012. Ms. Bernstein earned a |
| BA degree in history, cum laude, from the University of Pennsylvania and an MBA from the University of Michigan – Ross School of Business with an emphasis in strategy and finance. |
5 Invesco Mid Cap Growth Fund
Your Fund’s Long-Term Performance
Results of a $10,000 Investment – Oldest Share Class(es)
Fund and index data from 4/30/07

| 1 | Source: FactSet Research Systems Inc. |
Past performance cannot guarantee comparable future results.
The data shown in the chart include reinvested distributions, applicable sales charges and Fund expenses including management fees. Results for Class B shares are calculated as if a hypothetical shareholder had liquidated his entire investment in the Fund at the close of the reporting period and paid the contingent deferred sales charges, if applicable.
Index results include reinvested dividends, but they do not reflect sales charges. Performance of the peer group, if applicable, reflects fund expenses and management fees; performance of a market index does not. Performance shown in the chart and table(s) does not reflect deduction of taxes a shareholder would pay on Fund distributions or sale of Fund shares.
6 Invesco Mid Cap Growth Fund
| | | | | |
| Average Annual Total Returns |
As of 4/30/17, including maximum applicable
sales charges |
| |
| Class A Shares | | | | | |
| Inception (12/27/95) | | | | 11.19 | % |
| 10 Years | | | | 6.60 | |
| 5 Years | | | | 9.33 | |
| 1 Year | | | | 8.61 | |
| |
| Class B Shares | | | | | |
| Inception (12/27/95) | | | | 11.20 | % |
| 10 Years | | | | 7.07 | |
| 5 Years | | | | 10.31 | |
| 1 Year | | | | 9.98 | |
| |
| Class C Shares | | | | | |
| Inception (12/27/95) | | | | 10.69 | % |
| 10 Years | | | | 6.42 | |
| 5 Years | | | | 9.78 | |
| 1 Year | | | | 13.11 | |
| |
| Class R Shares | | | | | |
| Inception (7/11/08) | | | | 8.55 | % |
| 5 Years | | | | 10.30 | |
| 1 Year | | | | 14.67 | |
| |
| Class Y Shares | | | | | |
| Inception (8/12/05) | | | | 8.52 | % |
| 10 Years | | | | 7.47 | |
| 5 Years | | | | 10.85 | |
| 1 Year | | | | 15.24 | |
| |
| Class R5 Shares | | | | | |
| 10 Years | | | | 7.47 | % |
| 5 Years | | | | 11.00 | |
| 1 Year | | | | 15.39 | |
| |
| Class R6 Shares | | | | | |
| 10 Years | | | | 7.38 | % |
| 5 Years | | | | 10.95 | |
| 1 Year | | | | 15.50 | |
Effective June 1, 2010, Class A, Class B, Class C, Class R and Class I shares of the predecessor fund, Van Kampen Mid Cap Growth Fund, advised by Van Kampen Asset Management were reorganized into Class A, Class B, Class C, Class R and Class Y shares, respectively, of Invesco Van Kampen Mid Cap Growth Fund (renamed Invesco Mid Cap Growth). Returns shown above, prior to June 1, 2010, for Class A, Class B, Class C, Class R and Class Y shares are blended returns of the predecessor fund and Invesco Mid Cap Growth Fund. Share class returns will differ from the predecessor fund because of different expenses.
Class R5 shares incepted on June 1, 2010. Performance shown prior to that date is that of the predecessor fund’s Class A shares and includes the 12b-1 fees applicable to Class A shares.
| | | | | |
| Average Annual Total Returns |
As of 3/31/17, the most recent calendar quarter end, including maximum applicable sales charges |
| | | | | |
| |
| Class A Shares | | | | | |
| Inception (12/27/95) | | | | 11.17 | % |
| 10 Years | | | | 6.97 | |
| 5 Years | | | | 8.77 | |
| 1 Year | | | | 8.35 | |
| |
| Class B Shares | | | | | |
| Inception (12/27/95) | | | | 11.17 | % |
| 10 Years | | | | 7.45 | |
| 5 Years | | | | 9.73 | |
| 1 Year | | | | 9.69 | |
| |
| Class C Shares | | | | | |
| Inception (12/27/95) | | | | 10.66 | % |
| 10 Years | | | | 6.79 | |
| 5 Years | | | | 9.21 | |
| 1 Year | | | | 12.86 | |
| |
| Class R Shares | | | | | |
| Inception (7/11/08) | | | | 8.47 | % |
| 5 Years | | | | 9.73 | |
| 1 Year | | | | 14.38 | |
| |
| Class Y Shares | | | | | |
| Inception (8/12/05) | | | | 8.46 | % |
| 10 Years | | | | 7.85 | |
| 5 Years | | | | 10.28 | |
| 1 Year | | | | 14.96 | |
| |
| Class R5 Shares | | | | | |
| 10 Years | | | | 7.84 | % |
| 5 Years | | | | 10.42 | |
| 1 Year | | | | 15.09 | |
| |
| Class R6 Shares | | | | | |
| 10 Years | | | | 7.76 | % |
| 5 Years | | | | 10.37 | |
| 1 Year | | | | 15.20 | |
Class R6 shares incepted on July 15, 2013. Performance shown prior to that date is that of the Fund’s and the predecessor fund’s Class A shares and includes the 12b-1 fees applicable to Class A shares.
The performance data quoted represent past performance and cannot guarantee comparable future results; current performance may be lower or higher. Please visit invesco.com/performance for the most recent month-end performance. Performance figures reflect reinvested distributions, changes in net asset value and the effect of the maximum sales charge unless otherwise stated. Investment return and principal value will fluctuate so that you may have a gain or loss when you sell shares.
The total annual Fund operating expense ratio set forth in the most recent Fund prospectus as of the date of this report for Class A, Class B, Class C, Class R, Class Y, Class R5 and Class R6 shares was 1.21%, 1.21%, 1.93%, 1.46%, 0.96%, 0.82% and 0.73%, respectively. The expense ratios presented above may vary from the expense ratios presented in other sections of this report that are based on expenses incurred during the period covered by this report.
Class A share performance reflects the maximum 5.50% sales charge, and Class B and Class C share performance reflects the applicable contingent deferred sales charge (CDSC) for the period involved. For shares purchased prior to June 1, 2010, the CDSC on Class B shares declines from 5% at the time of purchase to 0% at the beginning of the sixth year. For shares purchased on or after June 1, 2010, the CDSC on Class B shares declines from 5% at the time of purchase to 0% at the beginning of the seventh year. The CDSC on Class C shares is 1% for the first year after purchase. Class R, Class Y, Class R5 and Class R6 shares do not have a front-end sales charge or a CDSC; therefore, performance is at net asset value.
The performance of the Fund’s share classes will differ primarily due to different sales charge structures and class expenses.
Fund performance reflects any applicable fee waivers and/or expense reimbursements. Had the adviser not waived fees and/or reimbursed expenses currently or in the past, returns would have been lower. See current prospectus for more information.
7 Invesco Mid Cap Growth Fund
Invesco Mid Cap Growth Fund’s investment objective is to seek capital growth.
| ∎ | | Unless otherwise stated, information presented in this report is as of April 30, 2017, and is based on total net assets. |
| ∎ | | Unless otherwise noted, all data provided by Invesco. |
| ∎ | | To access your Fund’s reports/prospectus, visit invesco.com/fundreports. |
About share classes
| ∎ | | Class B shares may not be purchased for new or additional investments. Please see the prospectus for more information. |
| ∎ | | Class R shares are generally available only to employer sponsored retirement and benefit plans. Please see the prospectus for more information. |
| ∎ | | Class Y shares are available only to certain investors. Please see the prospectus for more information. |
| ∎ | | Class R5 shares and Class R6 shares are available for use by retirement plans that meet certain standards and for institutional investors. Class R6 shares are also available through intermediaries that have established an agreement with Invesco Distributors, Inc. to make such shares available for use in retail omnibus accounts. See the prospectus for more information. |
Principal risks of investing in the Fund
| ∎ | | Foreign securities risk. The Fund’s foreign investments may be adversely affected by political and social instability, changes in economic or taxation policies, difficulty in enforcing obligations, decreased liquidity or increased volatility. Foreign investments also involve the risk of the possible seizure, nationalization or expropriation of the issuer or foreign deposits (in which the Fund could lose its entire investments in a certain market) and the possible adoption of foreign governmental restrictions such as exchange controls. Unless the Fund has hedged its foreign securities risk, foreign securities risk also involves the risk of negative foreign currency rate fluctuations, which may cause the value of securities denominated in such foreign currency (or other instruments through which the Fund has exposure to foreign currencies) to decline in value. Currency exchange rates may fluctuate significantly over short periods of time. Currency hedging strategies, if used, are not always successful. |
| ∎ | | Growth investing risk. Growth stocks tend to be more expensive relative to the issuing company’s earnings or assets compared with other types of stock. As a result, they tend to be more sensitive to changes in, or investors’ expectations of, the issuing company’s earnings and can be more volatile. |
| ∎ | | Management risk. The Fund is actively managed and depends heavily on the Adviser’s judgment about markets, interest rates or the attractiveness, relative values, liquidity, or potential appreciation of particular investments made for the Fund’s portfolio. The Fund could experience losses if these judgments prove to be incorrect. Additionally, legislative, regulatory, or tax developments may adversely affect management of the Fund and, therefore, the ability of the Fund to achieve its investment objective. |
| ∎ | | Market risk. The market values of the Fund’s investments, and therefore the value of the Fund’s shares, will go up and down, sometimes rapidly or unpredictably. Market risk may affect a single issuer, industry or section of the economy, or it may affect the market as a whole. Individual stock prices tend to go up and down more dramatically than those of certain other types of investments, such as bonds. During a general downturn in the financial markets, multiple asset classes may decline in value. When markets perform well, there can be no assurance that specific investments held by the Fund will rise in value. |
| ∎ | | Mid-capitalization companies risk. Mid-capitalization companies tend to be more vulnerable to changing market conditions and may have more limited product lines and markets, less experienced management and fewer financial resources than larger companies. These companies’ securities may be more volatile and less liquid than those of more established companies, and their returns may vary, sometimes significantly, from the overall securities market. |
This report must be accompanied or preceded by a currently effective Fund prospectus, which contains more complete information, including sales charges and expenses. Investors should read it carefully before investing.
NOT FDIC INSURED | MAY LOSE VALUE | NO BANK GUARANTEE
About indexes used in this report
| ∎ | | The S&P 500® Index is an unmanaged index considered representative of the US stock market. |
| ∎ | | The Russell Midcap® Growth Index is an unmanaged index considered representative of mid-cap growth stocks. The Russell Midcap Growth Index is a trademark/service mark of the Frank Russell Co. Russell® is a trademark of the Frank Russell Co. |
| ∎ | | The Lipper Mid-Cap Growth Funds Index is an unmanaged index considered representative of mid-cap growth funds tracked by Lipper. |
| ∎ | | The Fund is not managed to track the performance of any particular index, including the index(es) described here, and consequently, the performance of the Fund may deviate significantly from the performance of the index(es). |
| ∎ | | A direct investment cannot be made in an index. Unless otherwise indicated, index results include reinvested dividends, and they do not reflect sales charges. Performance of the peer group, if applicable, reflects fund expenses; performance of a market index does not. |
Other information
| ∎ | | The returns shown in management’s discussion of Fund performance are based on net asset values (NAVs) calculated for shareholder transactions. Generally accepted accounting principles require adjustments to be made to the net assets of the Fund at period end for financial reporting purposes, and as such, the NAVs for shareholder transactions and the returns based on those NAVs may differ from the NAVs and returns reported in the Financial Highlights. |
| ∎ | | Industry classifications used in this report are generally according to the Global Industry Classification Standard, which was developed by and is the exclusive property and a service mark of MSCI Inc. and Standard & Poor’s. |
8 Invesco Mid Cap Growth Fund
Schedule of Investments(a)
April 30, 2017
| | | | | | | | |
| | | Shares | | | Value | |
Common Stocks & Other Equity Interests–98.04% | |
| Aerospace & Defense–1.26% | |
Raytheon Co. | | | 220,563 | | | $ | 34,233,583 | |
|
| Airlines–0.54% | |
Alaska Air Group, Inc. | | | 170,914 | | | | 14,543,072 | |
|
| Alternative Carriers–1.20% | |
Zayo Group Holdings, Inc.(b) | | | 926,041 | | | | 32,476,258 | |
|
| Apparel Retail–2.52% | |
Burlington Stores, Inc.(b) | | | 440,216 | | | | 43,546,167 | |
Foot Locker, Inc. | | | 318,474 | | | | 24,630,779 | |
| | | | | 68,176,946 | |
|
| Application Software–5.25% | |
Cadence Design Systems, Inc.(b) | | | 1,066,264 | | | | 34,728,218 | |
Guidewire Software Inc.(b) | | | 308,748 | | | | 18,984,915 | |
Mobileye N.V.(b) | | | 249,348 | | | | 15,439,628 | |
SS&C Technologies Holdings, Inc. | | | 983,357 | | | | 36,128,536 | |
Tyler Technologies, Inc.(b) | | | 224,910 | | | | 36,793,027 | |
| | | | | 142,074,324 | |
|
| Asset Management & Custody Banks–1.01% | |
Affiliated Managers Group, Inc. | | | 164,806 | | | | 27,290,226 | |
|
| Auto Parts & Equipment–0.82% | |
Delphi Automotive PLC | | | 274,867 | | | | 22,099,307 | |
|
| Automotive Retail–2.29% | |
Advance Auto Parts, Inc. | | | 143,636 | | | | 20,416,421 | |
O’Reilly Automotive, Inc.(b) | | | 167,937 | | | | 41,673,567 | |
| | | | | 62,089,988 | |
|
| Biotechnology–2.87% | |
BioMarin Pharmaceutical Inc.(b) | | | 471,154 | | | | 45,155,399 | |
Neurocrine Biosciences, Inc.(b) | | | 608,872 | | | | 32,513,765 | |
| | | | | 77,669,164 | |
|
| Building Products–4.44% | |
A.O. Smith Corp. | | | 551,035 | | | | 29,689,766 | |
Allegion PLC | | | 393,697 | | | | 30,960,332 | |
Masco Corp. | | | 889,796 | | | | 32,940,248 | |
Owens Corning | | | 436,734 | | | | 26,575,264 | |
| | | | | 120,165,610 | |
|
| Casinos & Gaming–1.34% | |
Wynn Resorts Ltd. | | | 294,495 | | | | 36,225,830 | |
|
| Communications Equipment–1.10% | |
F5 Networks, Inc.(b) | | | 230,439 | | | | 29,756,588 | |
|
| Construction Machinery & Heavy Trucks–0.53% | |
WABCO Holdings Inc.(b) | | | 120,700 | | | | 14,347,609 | |
|
| Construction Materials–1.04% | |
Summit Materials, Inc.–Class A(b) | | | 1,100,145 | | | | 28,229,721 | |
| | | | | | | | |
| | | Shares | | | Value | |
| Data Processing & Outsourced Services–4.31% | |
Broadridge Financial Solutions, Inc. | | | 444,275 | | | $ | 31,072,594 | |
Fidelity National Information Services, Inc. | | | 606,122 | | | | 51,029,411 | |
Vantiv, Inc.–Class A(b) | | | 558,025 | | | | 34,619,871 | |
| | | | | 116,721,876 | |
| | |
| Distillers & Vintners–1.92% | | | | | | | | |
Constellation Brands, Inc.–Class A | | | 300,692 | | | | 51,881,398 | |
|
| Diversified Support Services–1.29% | |
KAR Auction Services, Inc. | | | 800,141 | | | | 34,902,150 | |
|
| Electrical Components & Equipment–0.83% | |
Acuity Brands, Inc. | | | 127,890 | | | | 22,521,429 | |
| | |
| Electronic Components–1.84% | | | | | | | | |
Amphenol Corp.–Class A | | | 688,330 | | | | 49,773,142 | |
| |
| Electronic Manufacturing Services–0.80% | | | | | |
Flex Ltd.(b) | | | 1,410,498 | | | | 21,806,299 | |
|
| Environmental & Facilities Services–0.90% | |
Republic Services, Inc. | | | 385,359 | | | | 24,273,764 | |
|
| Financial Exchanges & Data–4.48% | |
CBOE Holdings Inc. | | | 324,122 | | | | 26,710,894 | |
Intercontinental Exchange, Inc. | | | 576,473 | | | | 34,703,674 | |
Nasdaq, Inc. | | | 384,818 | | | | 26,502,416 | |
S&P Global Inc. | | | 248,595 | | | | 33,358,963 | |
| | | | | 121,275,947 | |
|
| General Merchandise Stores–0.88% | |
Dollar Tree, Inc.(b) | | | 289,592 | | | | 23,969,530 | |
| | |
| Health Care Distributors–1.22% | | | | | | | | |
Henry Schein, Inc.(b) | | | 189,846 | | | | 32,995,235 | |
| | |
| Health Care Equipment–6.20% | | | | | | | | |
Boston Scientific Corp.(b) | | | 1,521,954 | | | | 40,149,146 | |
DexCom Inc.(b) | | | 444,954 | | | | 34,688,614 | |
Hologic, Inc.(b) | | | 1,085,086 | | | | 48,991,633 | |
Penumbra, Inc.(b) | | | 514,471 | | | | 43,961,547 | |
| | | | | 167,790,940 | |
|
| Home Entertainment Software–1.86% | |
Electronic Arts Inc.(b) | | | 532,399 | | | | 50,482,073 | |
| | |
| Homebuilding–0.54% | | | | | | | | |
D.R. Horton, Inc. | | | 446,464 | | | | 14,684,201 | |
| | |
| Housewares & Specialties–1.29% | | | | | | | | |
Newell Brands, Inc. | | | 730,363 | | | | 34,867,530 | |
|
| Human Resource & Employment Services–0.94% | |
Robert Half International, Inc. | | | 550,531 | | | | 25,351,953 | |
| | |
| Industrial Machinery–1.53% | | | | | | | | |
Stanley Black & Decker Inc. | | | 304,648 | | | | 41,477,825 | |
See accompanying Notes to Financial Statements which are an integral part of the financial statements.
9 Invesco Mid Cap Growth Fund
| | | | | | | | |
| | | Shares | | | Value | |
| Internet Software & Services–1.61% | |
CoStar Group Inc.(b) | | | 180,966 | | | $ | 43,592,900 | |
LogMeIn, Inc. | | | 1,190 | | | | 134,470 | |
| | | | | 43,727,370 | |
|
| Investment Banking & Brokerage–3.14% | |
E*TRADE Financial Corp.(b) | | | 1,655,975 | | | | 57,213,936 | |
TD Ameritrade Holding Corp. | | | 725,595 | | | | 27,768,521 | |
| | | | | 84,982,457 | |
|
| IT Consulting & Other Services–1.18% | |
Gartner, Inc.(b) | | | 280,979 | | | | 32,056,894 | |
| | |
| Leisure Products–1.09% | | | | | | | | |
Brunswick Corp. | | | 518,887 | | | | 29,446,837 | |
|
| Life Sciences Tools & Services–2.16% | |
INC Research Holdings, Inc.–Class A(b) | | | 733,053 | | | | 32,987,385 | |
Patheon N.V.(b) | | | 952,523 | | | | 25,632,394 | |
| | | | | 58,619,779 | |
| | |
| Managed Health Care–2.42% | | | | | | | | |
Centene Corp.(b) | | | 496,403 | | | | 36,932,383 | |
Humana Inc. | | | 129,266 | | | | 28,694,467 | |
| | | | | 65,626,850 | |
| | |
| Metal & Glass Containers–0.99% | | | | | | | | |
Berry Global Group, Inc.(b) | | | 536,653 | | | | 26,832,650 | |
| | |
| Movies & Entertainment–1.54% | | | | | | | | |
Cinemark Holdings, Inc. | | | 967,751 | | | | 41,806,843 | |
|
| Oil & Gas Equipment & Services–0.73% | |
Halliburton Co. | | | 429,508 | | | | 19,705,827 | |
|
| Oil & Gas Exploration & Production–4.02% | |
Concho Resources Inc.(b) | | | 274,360 | | | | 34,750,438 | |
Diamondback Energy Inc.(b) | | | 457,048 | | | | 45,631,672 | |
Pioneer Natural Resources Co. | | | 164,895 | | | | 28,525,186 | |
| | | | | 108,907,296 | |
|
| Oil & Gas Storage & Transportation–1.05% | |
Cheniere Energy, Inc.(b) | | | 624,807 | | | | 28,334,997 | |
|
| Packaged Foods & Meats–1.58% | |
Pinnacle Foods Inc. | | | 733,611 | | | | 42,659,480 | |
| | |
| Pharmaceuticals–0.71% | | | | | | | | |
Pacira Pharmaceuticals, Inc.(b) | | | 395,550 | | | | 19,203,952 | |
| | | | | | | | |
| | | Shares | | | Value | |
| Railroads–1.01% | | | | | | | | |
Genesee & Wyoming Inc.–Class A(b) | | | 403,005 | | | $ | 27,307,619 | |
|
| Regional Banks–0.89% | |
Zions Bancorp. | | | 605,522 | | | | 24,239,046 | |
| | |
| Restaurants–2.33% | | | | | | | | |
Chipotle Mexican Grill, Inc.(b) | | | 58,202 | | | | 27,615,103 | |
Domino’s Pizza, Inc. | | | 196,355 | | | | 35,616,833 | |
| | | | | 63,231,936 | |
| | |
| Semiconductors–5.83% | | | | | | | | |
Cirrus Logic, Inc.(b) | | | 310,265 | | | | 19,965,553 | |
Microchip Technology Inc. | | | 473,407 | | | | 35,780,101 | |
Microsemi Corp. (b) | | | 677,114 | | | | 31,783,731 | |
NXP Semiconductors N.V. (Netherlands)(b) | | | 335,657 | | | | 35,495,728 | |
Qorvo, Inc.(b) | | | 512,675 | | | | 34,877,280 | |
| | | | | 157,902,393 | |
| | |
| Specialized REIT’s–3.42% | | | | | | | | |
Equinix, Inc. | | | 107,820 | | | | 45,036,414 | |
SBA Communications Corp.
–Class A(b) | | | 375,943 | | | | 47,553,030 | |
| | | | | 92,589,444 | |
| | |
| Specialty Chemicals–1.41% | | | | | | | | |
Sherwin-Williams Co. (The) | | | 114,282 | | | | 38,247,900 | |
| | |
| Specialty Stores–1.13% | | | | | | | | |
Ulta Beauty, Inc.(b) | | | 108,379 | | | | 30,502,186 | |
| | |
| Systems Software–2.32% | | | | | | | | |
ServiceNow, Inc.(b) | | | 663,767 | | | | 62,712,705 | |
|
| Trading Companies & Distributors–0.44% | |
Fastenal Co. | | | 269,309 | | | | 12,032,726 | |
Total Common Stocks & Other Equity Interests
(Cost $2,141,157,954) | | | | 2,654,830,705 | |
|
Money Market Funds–1.92% | |
Government & Agency Portfolio–Institutional Class, 0.67%(c) | | | 31,156,152 | | | | 31,156,152 | |
Treasury Portfolio–Institutional Class, 0.63%(c) | | | 20,770,768 | | | | 20,770,768 | |
Total Money Market Funds
(Cost $51,926,920) | | | | | | | 51,926,920 | |
TOTAL INVESTMENTS–99.96%
(Cost $2,193,084,874) | | | | 2,706,757,625 | |
OTHER ASSETS LESS LIABILITIES–0.04% | | | | 1,032,259 | |
NET ASSETS–100.00% | | | | | | $ | 2,707,789,884 | |
Investment Abbreviations:
| | |
| REIT | | – Real Estate Investment Trust |
Notes to Schedule of Investments:
| (a) | Industry and/or sector classifications used in this report are generally according to the Global Industry Classification Standard, which was developed by and is the exclusive property and a service mark of MSCI Inc. and Standard & Poor’s. |
| (b) | Non-income producing security. |
| (c) | The money market fund and the Fund are affiliated by having the same investment adviser. The rate shown is the 7-day SEC standardized yield as of April 30, 2017. |
See accompanying Notes to Financial Statements which are an integral part of the financial statements.
10 Invesco Mid Cap Growth Fund
Statement of Assets and Liabilities
April 30, 2017
| | | | |
Assets: | | | | |
Investments, at value (Cost $2,141,157,954) | | $ | 2,654,830,705 | |
Investments in affiliated money market funds, at value and cost | | | 51,926,920 | |
Total investments, at value (Cost $2,193,084,874) | | | 2,706,757,625 | |
Receivable for: | | | | |
Investments sold | | | 28,544,557 | |
Fund shares sold | | | 2,500,657 | |
Dividends | | | 601,467 | |
Investment for trustee deferred compensation and retirement plans | | | 639,335 | |
Other assets | | | 132,038 | |
Total assets | | | 2,739,175,679 | |
|
Liabilities: | |
Payable for: | | | | |
Investments purchased | | | 25,621,606 | |
Fund shares reacquired | | | 2,661,526 | |
Accrued fees to affiliates | | | 1,730,904 | |
Accrued trustees’ and officers’ fees and benefits | | | 5,241 | |
Accrued other operating expenses | | | 639,819 | |
Trustee deferred compensation and retirement plans | | | 726,699 | |
Total liabilities | | | 31,385,795 | |
Net assets applicable to shares outstanding | | $ | 2,707,789,884 | |
|
Net assets consist of: | |
Shares of beneficial interest | | $ | 2,065,286,149 | |
Undistributed net investment income (loss) | | | (5,867,181 | ) |
Undistributed net realized gain | | | 134,698,165 | |
Net unrealized appreciation | | | 513,672,751 | |
| | | $ | 2,707,789,884 | |
| | | | |
Net Assets: | |
Class A | | $ | 2,221,949,292 | |
Class B | | $ | 24,199,564 | |
Class C | | $ | 139,949,884 | |
Class R | | $ | 27,974,743 | |
Class Y | | $ | 132,925,108 | |
Class R5 | | $ | 106,223,043 | |
Class R6 | | $ | 54,568,250 | |
|
Shares outstanding, no par value,
with an unlimited number of shares authorized: | |
Class A | | | 59,856,361 | |
Class B | | | 779,439 | |
Class C | | | 4,877,773 | |
Class R | | | 773,889 | |
Class Y | | | 3,445,638 | |
Class R5 | | | 2,729,325 | |
Class R6 | | | 1,397,064 | |
Class A: | | | | |
Net asset value per share | | $ | 37.12 | |
Maximum offering price per share | | | | |
(Net asset value of $37.12 ¸ 94.50%) | | $ | 39.28 | |
Class B: | | | | |
Net asset value and offering price per share | | $ | 31.05 | |
Class C: | | | | |
Net asset value and offering price per share | | $ | 28.69 | |
Class R: | | | | |
Net asset value and offering price per share | | $ | 36.15 | |
Class Y: | | | | |
Net asset value and offering price per share | | $ | 38.58 | |
Class R5: | | | | |
Net asset value and offering price per share | | $ | 38.92 | |
Class R6: | | | | |
Net asset value and offering price per share | | $ | 39.06 | |
See accompanying Notes to Financial Statements which are an integral part of the financial statements.
11 Invesco Mid Cap Growth Fund
Statement of Operations
For the year ended April 30, 2017
| | | | |
Investment income: | |
Dividends | | $ | 16,106,473 | |
Dividends from affiliated money market funds (includes securities lending income of $330,140) | | | 556,800 | |
Other income | | | 118,132 | |
Total investment income | | | 16,781,405 | |
| |
Expenses: | | | | |
Advisory fees | | | 17,880,738 | |
Administrative services fees | | | 522,615 | |
Distribution fees: | | | | |
Class A | | | 5,473,599 | |
Class B | | | 87,390 | |
Class C | | | 1,391,356 | |
Class R | | | 141,501 | |
Transfer agent fees — A, B, C, R and Y | | | 5,602,002 | |
Transfer agent fees — R5 | | | 90,889 | |
Transfer agent fees — R6 | | | 4,174 | |
Trustees’ and officers’ fees and benefits | | | 66,050 | |
Registration and filing fees | | | 151,867 | |
Reports to shareholders | | | 737,316 | |
Professional services fees | | | 69,521 | |
Other | | | 58,962 | |
Total expenses | | | 32,277,980 | |
Less: Fees waived and expense offset arrangement(s) | | | (114,068 | ) |
Net expenses | | | 32,163,912 | |
Net investment income (loss) | | | (15,382,507 | ) |
| |
Realized and unrealized gain from: | | | | |
Net realized gain from investment securities (includes net gains (losses) from securities sold to affiliates of $(245,038)) | | | 239,884,176 | |
Change in net unrealized appreciation of investment securities | | | 142,192,233 | |
Net realized and unrealized gain | | | 382,076,409 | |
Net increase in net assets resulting from operations | | $ | 366,693,902 | |
See accompanying Notes to Financial Statements which are an integral part of the financial statements.
12 Invesco Mid Cap Growth Fund
Statement of Changes in Net Assets
For the years ended April 30, 2017 and 2016
| | | | | | | | |
| | | 2017 | | | 2016 | |
Operations: | | | | | |
Net investment income (loss) | | $ | (15,382,507 | ) | | $ | (14,146,796 | ) |
Net realized gain | | | 239,884,176 | | | | 113,017,507 | |
Change in net unrealized appreciation (depreciation) | | | 142,192,233 | | | | (321,151,557 | ) |
Net increase (decrease) in net assets resulting from operations | | | 366,693,902 | | | | (222,280,846 | ) |
| | |
Distributions to shareholders from net realized gains: | | | | | | | | |
Class A | | | (56,441,548 | ) | | | (171,450,054 | ) |
Class B | | | (1,006,268 | ) | | | (4,921,422 | ) |
Class C | | | (4,672,062 | ) | | | (15,142,609 | ) |
Class R | | | (739,806 | ) | | | (2,437,421 | ) |
Class Y | | | (2,235,160 | ) | | | (5,895,511 | ) |
Class R5 | | | (2,347,242 | ) | | | (6,484,545 | ) |
Class R6 | | | (1,247,157 | ) | | | (3,672,306 | ) |
Total distributions from net realized gains | | | (68,689,243 | ) | | | (210,003,868 | ) |
| | |
Share transactions–net: | | | | | | | | |
Class A | | | (204,235,092 | ) | | | 49,575,046 | |
Class B | | | (22,850,663 | ) | | | (21,326,268 | ) |
Class C | | �� | (23,071,312 | ) | | | 2,196,193 | |
Class R | | | (4,689,588 | ) | | | (349,819 | ) |
Class Y | | | 45,784,786 | | | | 7,660,539 | |
Class R5 | | | 3,056,173 | | | | 18,682,817 | |
Class R6 | | | (1,046,850 | ) | | | (3,350,161 | ) |
Net increase (decrease) in net assets resulting from share transactions | | | (207,052,546 | ) | | | 53,088,347 | |
Net increase (decrease) in net assets | | | 90,952,113 | | | | (379,196,367 | ) |
| | |
Net assets: | | | | | | | | |
Beginning of year | | | 2,616,837,771 | | | | 2,996,034,138 | |
End of year (includes undistributed net investment income (loss) of $(5,867,181) and $(6,294,946), respectively) | | $ | 2,707,789,884 | | | $ | 2,616,837,771 | |
Notes to Financial Statements
April 30, 2017
NOTE 1—Significant Accounting Policies
Invesco Mid Cap Growth Fund (the “Fund”) is a series portfolio of AIM Sector Funds (Invesco Sector Funds) (the “Trust”). The Trust is a Delaware statutory trust registered under the Investment Company Act of 1940, as amended (the “1940 Act”), as an open-end series management investment company consisting of ten separate portfolios, each authorized to issue an unlimited number of shares of beneficial interest. The assets, liabilities and operations of each portfolio are accounted for separately. Information presented in these financial statements pertains only to the Fund. Matters affecting each portfolio or class will be voted on exclusively by the shareholders of such portfolio or class.
The Fund’s investment objective is to seek capital growth.
The Fund currently consists of seven different classes of shares: Class A, Class B, Class C, Class R, Class Y, Class R5 and Class R6. Class Y shares are available only to certain investors. Class A shares are sold with a front-end sales charge unless certain waiver criteria are met and under certain circumstances load waived shares may be subject to contingent deferred sales charges (“CDSC”). Class C shares are sold with a CDSC. Class R, Class Y, Class R5 and Class R6 shares are sold at net asset value. Effective November 30, 2010, new or additional investments in Class B shares are no longer permitted. Existing shareholders of Class B shares may continue to reinvest dividends and capital gains distributions in Class B shares until they convert to Class A shares. Also, shareholders in Class B shares will be able to exchange those shares for Class B shares of other Invesco Funds offering such shares until they convert to Class A shares. Generally, Class B shares will automatically convert to Class A shares on or about the month-end, which is at least eight years after the date of purchase. Redemption of Class B shares prior to the conversion date will be subject to a CDSC.
The Fund is an investment company and accordingly follows the investment company accounting and reporting guidance in accordance with Financial Accounting Standards Board Accounting Standards Codification Topic 946, Financial Services – Investment Companies.
13 Invesco Mid Cap Growth Fund
The following is a summary of the significant accounting policies followed by the Fund in the preparation of its financial statements.
| A. | Security Valuations — Securities, including restricted securities, are valued according to the following policy. |
A security listed or traded on an exchange (except convertible securities) is valued at its last sales price or official closing price as of the close of the customary trading session on the exchange where the security is principally traded, or lacking any sales or official closing price on a particular day, the security may be valued at the closing bid price on that day. Securities traded in the over-the-counter market are valued based on prices furnished by independent pricing services or market makers. When such securities are valued by an independent pricing service they may be considered fair valued. Futures contracts are valued at the final settlement price set by an exchange on which they are principally traded. Listed options are valued at the mean between the last bid and asked prices from the exchange on which they are principally traded. Options not listed on an exchange are valued by an independent source at the mean between the last bid and asked prices. For purposes of determining net asset value (“NAV”) per share, futures and option contracts generally are valued 15 minutes after the close of the customary trading session of the New York Stock Exchange (“NYSE”).
Investments in open-end and closed-end registered investment companies that do not trade on an exchange are valued at the end-of-day net asset value per share. Investments in open-end and closed-end registered investment companies that trade on an exchange are valued at the last sales price or official closing price as of the close of the customary trading session on the exchange where the security is principally traded.
Debt obligations (including convertible securities) and unlisted equities are fair valued using an evaluated quote provided by an independent pricing service. Evaluated quotes provided by the pricing service may be determined without exclusive reliance on quoted prices, and may reflect appropriate factors such as institution-size trading in similar groups of securities, developments related to specific securities, dividend rate (for unlisted equities), yield (for debt obligations), quality, type of issue, coupon rate (for debt obligations), maturity (for debt obligations), individual trading characteristics and other market data. Debt obligations are subject to interest rate and credit risks. In addition, all debt obligations involve some risk of default with respect to interest and/or principal payments.
Foreign securities’ (including foreign exchange contracts) prices are converted into U.S. dollar amounts using the applicable exchange rates as of the close of the NYSE. If market quotations are available and reliable for foreign exchange-traded equity securities, the securities will be valued at the market quotations. Because trading hours for certain foreign securities end before the close of the NYSE, closing market quotations may become unreliable. If between the time trading ends on a particular security and the close of the customary trading session on the NYSE, events occur that the Adviser determines are significant and make the closing price unreliable, the Fund may fair value the security. If the event is likely to have affected the closing price of the security, the security will be valued at fair value in good faith using procedures approved by the Board of Trustees. Adjustments to closing prices to reflect fair value may also be based on a screening process of an independent pricing service to indicate the degree of certainty, based on historical data, that the closing price in the principal market where a foreign security trades is not the current value as of the close of the NYSE. Foreign securities’ prices meeting the approved degree of certainty that the price is not reflective of current value will be priced at the indication of fair value from the independent pricing service. Multiple factors may be considered by the independent pricing service in determining adjustments to reflect fair value and may include information relating to sector indices, American Depositary Receipts and domestic and foreign index futures. Foreign securities may have additional risks including exchange rate changes, potential for sharply devalued currencies and high inflation, political and economic upheaval, the relative lack of issuer information, relatively low market liquidity and the potential lack of strict financial and accounting controls and standards.
Securities for which market prices are not provided by any of the above methods may be valued based upon quotes furnished by independent sources. The last bid price may be used to value equity securities. The mean between the last bid and asked prices is used to value debt obligations, including corporate loans.
Securities for which market quotations are not readily available or became unreliable are valued at fair value as determined in good faith by or under the supervision of the Trust’s officers following procedures approved by the Board of Trustees. Issuer specific events, market trends, bid/asked quotes of brokers and information providers and other market data may be reviewed in the course of making a good faith determination of a security’s fair value.
The Fund may invest in securities that are subject to interest rate risk, meaning the risk that the prices will generally fall as interest rates rise and, conversely, the prices will generally rise as interest rates fall. Specific securities differ in their sensitivity to changes in interest rates depending on their individual characteristics. Changes in interest rates may result in increased market volatility, which may affect the value and/or liquidity of certain Fund investments.
Valuations change in response to many factors including the historical and prospective earnings of the issuer, the value of the issuer’s assets, general economic conditions, interest rates, investor perceptions and market liquidity. Because of the inherent uncertainties of valuation, the values reflected in the financial statements may materially differ from the value received upon actual sale of those investments.
| B. | Securities Transactions and Investment Income — Securities transactions are accounted for on a trade date basis. Realized gains or losses on sales are computed on the basis of specific identification of the securities sold. Interest income (net of withholding tax, if any) is recorded on the accrual basis from settlement date. Dividend income (net of withholding tax, if any) is recorded on the ex-dividend date. |
The Fund may periodically participate in litigation related to Fund investments. As such, the Fund may receive proceeds from litigation settlements. Any proceeds received are included in the Statement of Operations as realized gain (loss) for investments no longer held and as unrealized gain (loss) for investments still held.
Brokerage commissions and mark ups are considered transaction costs and are recorded as an increase to the cost basis of securities purchased and/or a reduction of proceeds on a sale of securities. Such transaction costs are included in the determination of net realized and unrealized gain (loss) from investment securities reported in the Statement of Operations and the Statement of Changes in Net Assets and the net realized and unrealized gains (losses) on securities per share in the Financial Highlights. Transaction costs are included in the calculation of the Fund’s net asset value and, accordingly, they reduce the Fund’s total returns. These transaction costs are not considered operating expenses and are not reflected in net investment income reported in the Statement of Operations and the Statement of Changes in Net Assets, or the net investment income per share and the ratios of expenses and net investment income reported in the Financial Highlights, nor are they limited by any expense limitation arrangements between the Fund and the investment adviser.
The Fund allocates income and realized and unrealized capital gains and losses to a class based on the relative net assets of each class.
14 Invesco Mid Cap Growth Fund
| C. | Country Determination — For the purposes of making investment selection decisions and presentation in the Schedule of Investments, the investment adviser may determine the country in which an issuer is located and/or credit risk exposure based on various factors. These factors include the laws of the country under which the issuer is organized, where the issuer maintains a principal office, the country in which the issuer derives 50% or more of its total revenues and the country that has the primary market for the issuer’s securities, as well as other criteria. Among the other criteria that may be evaluated for making this determination are the country in which the issuer maintains 50% or more of its assets, the type of security, financial guarantees and enhancements, the nature of the collateral and the sponsor organization. Country of issuer and/or credit risk exposure has been determined to be the United States of America, unless otherwise noted. |
| D. | Distributions — Distributions from net investment income and net realized capital gain, if any, are generally declared and paid annually and recorded on the ex-dividend date. The Fund may elect to treat a portion of the proceeds from redemptions as distributions for federal income tax purposes. |
| E. | Federal Income Taxes — The Fund intends to comply with the requirements of Subchapter M of the Internal Revenue Code of 1986, as amended (the “Internal Revenue Code”), necessary to qualify as a regulated investment company and to distribute substantially all of the Fund’s taxable earnings to shareholders. As such, the Fund will not be subject to federal income taxes on otherwise taxable income (including net realized capital gain) that is distributed to shareholders. Therefore, no provision for federal income taxes is recorded in the financial statements. |
The Fund recognizes the tax benefits of uncertain tax positions only when the position is more likely than not to be sustained. Management has analyzed the Fund’s uncertain tax positions and concluded that no liability for unrecognized tax benefits should be recorded related to uncertain tax positions. Management is not aware of any tax positions for which it is reasonably possible that the total amounts of unrecognized tax benefits will change materially in the next 12 months.
The Fund files tax returns in the U.S. Federal jurisdiction and certain other jurisdictions. Generally, the Fund is subject to examinations by such taxing authorities for up to three years after the filing of the return for the tax period.
| F. | Expenses — Fees provided for under the Rule 12b-1 plan of a particular class of the Fund are charged to the operations of such class. Transfer agency fees and expenses and other shareholder recordkeeping fees and expenses attributable to Class R5 and Class R6 are allocated to each share class based on relative net assets. Sub-accounting fees attributable to Class R5 are charged to the operations of the class. Transfer agency fees and expenses and other shareholder recordkeeping fees and expenses relating to all other classes are allocated among those classes based on relative net assets. All other expenses are allocated among the classes based on relative net assets. |
| G. | Accounting Estimates — The preparation of financial statements in conformity with accounting principles generally accepted in the United States of America (“GAAP”) requires management to make estimates and assumptions that affect the reported amounts of assets and liabilities at the date of the financial statements and the reported amounts of revenues and expenses during the reporting period including estimates and assumptions related to taxation. Actual results could differ from those estimates by a significant amount. In addition, the Fund monitors for material events or transactions that may occur or become known after the period-end date and before the date the financial statements are released to print. |
| H. | Indemnifications — Under the Trust’s organizational documents, each Trustee, officer, employee or other agent of the Trust is indemnified against certain liabilities that may arise out of the performance of their duties to the Fund. Additionally, in the normal course of business, the Fund enters into contracts, including the Fund’s servicing agreements, that contain a variety of indemnification clauses. The Fund’s maximum exposure under these arrangements is unknown as this would involve future claims that may be made against the Fund that have not yet occurred. The risk of material loss as a result of such indemnification claims is considered remote. |
| I. | Securities Lending — The Fund may lend portfolio securities having a market value up to one-third of the Fund’s total assets. Such loans are secured by collateral equal to no less than the market value of the loaned securities determined daily by the securities lending provider. Such collateral will be cash or debt securities issued or guaranteed by the U.S. Government or any of its sponsored agencies. Cash collateral received in connection with these loans is invested in short-term money market instruments or affiliated money market funds and is shown as such on the Schedule of Investments. The Fund bears the risk of loss with respect to the investment of collateral. It is the Fund’s policy to obtain additional collateral from or return excess collateral to the borrower by the end of the next business day, following the valuation date of the securities loaned. Therefore, the value of the collateral held may be temporarily less than the value of the securities on loan. When loaning securities, the Fund retains certain benefits of owning the securities, including the economic equivalent of dividends or interest generated by the security. Lending securities entails a risk of loss to the Fund if, and to the extent that, the market value of the securities loaned were to increase and the borrower did not increase the collateral accordingly, and the borrower failed to return the securities. The securities loaned are subject to termination at the option of the borrower or the Fund. Upon termination, the borrower will return to the Fund the securities loaned and the Fund will return the collateral. Upon the failure of the borrower to return the securities, collateral may be liquidated and the securities may be purchased on the open market to replace the loaned securities. The Fund could experience delays and costs in gaining access to the collateral and the securities may lose value during the delay which could result in potential losses to the Fund. Some of these losses may be indemnified by the lending agent. The Fund bears the risk of any deficiency in the amount of the collateral available for return to the borrower due to any loss on the collateral invested. Dividends received on cash collateral investments for securities lending transactions, which are net of compensation to counterparties, are included in Dividends from affiliated money market funds on the Statement of Operations. The aggregate value of securities out on loan, if any, is shown as a footnote on the Statement of Assets and Liabilities. |
NOTE 2—Advisory Fees and Other Fees Paid to Affiliates
The Trust has entered into a master investment advisory agreement with Invesco Advisers, Inc. (the “Adviser” or “Invesco”). Under the terms of the investment advisory agreement, the Fund pays an advisory fee to the Adviser based on the annual rate of the Fund’s average daily net assets as follows:
| | | | |
| Average Daily Net Assets | | Rate | |
First $500 million | | | 0.75% | |
Next $500 million | | | 0.70% | |
Over $1 billion | | | 0.65% | |
15 Invesco Mid Cap Growth Fund
For the year ended April 30, 2017, the effective advisory fees incurred by the Fund was 0.68%.
Under the terms of a master sub-advisory agreement between the Adviser and each of Invesco Asset Management Deutschland GmbH, Invesco Asset Management Limited, Invesco Asset Management (Japan) Limited, Invesco Hong Kong Limited, Invesco Senior Secured Management, Inc. and Invesco Canada Ltd. (collectively, the “Affiliated Sub-Advisers”) the Adviser, not the Fund, will pay 40% of the fees paid to the Adviser to any such Affiliated Sub-Adviser(s) that provide(s) discretionary investment management services to the Fund based on the percentage of assets allocated to such Affiliated Sub-Adviser(s).
The Adviser has contractually agreed, through at least June 30, 2018, to waive advisory fees and/or reimburse expenses of all shares to the extent necessary to limit total annual fund operating expenses after fee waiver and/or expense reimbursement (excluding certain items discussed above) of Class A, Class B, Class C, Class R, Class Y, Class R5 and Class R6 shares to 2.00%, 2.75%, 2.75%, 2.25%, 1.75%, 1.75% and 1.75%, respectively, of average daily net assets (the “expense limits”). In determining the Adviser’s obligation to waive advisory fees and/or reimburse expenses, the following expenses are not taken into account, and could cause the total annual fund operating expenses after fee waiver and/or expense reimbursement to exceed the numbers reflected above: (1) interest; (2) taxes; (3) dividend expense on short sales; (4) extraordinary or non-routine items, including litigation expenses; and (5) expenses that the Fund has incurred but did not actually pay because of an expense offset arrangement. Unless Invesco continues the fee waiver agreement, it will terminate on June 30, 2018. During its term, the fee waiver agreement cannot be terminated or amended to increase the expense limits without approval of the Board of Trustees. The Adviser did not waive fees and/or reimburse expenses during the period under these expense limits.
Further, the Adviser has contractually agreed, through at least June 30, 2019, to waive the advisory fee payable by the Fund in an amount equal to 100% of the net advisory fees the Adviser receives from the affiliated money market funds on investments by the Fund of uninvested cash (excluding investments of cash collateral from securities lending) in such affiliated money market funds.
For the year ended April 30, 2017, the Adviser waived advisory fees of $72,706.
The Trust has entered into a master administrative services agreement with Invesco pursuant to which the Fund has agreed to pay Invesco for certain administrative costs incurred in providing accounting services to the Fund. For the year ended April 30, 2017, expenses incurred under the agreement are shown in the Statement of Operations as Administrative services fees.
The Trust has entered into a transfer agency and service agreement with Invesco Investment Services, Inc. (“IIS”) pursuant to which the Fund has agreed to pay IIS a fee for providing transfer agency and shareholder services to the Fund and reimburse IIS for certain expenses incurred by IIS in the course of providing such services. IIS may make payments to intermediaries that provide omnibus account services, sub-accounting services and/or networking services. All fees payable by IIS to intermediaries that provide omnibus account services or sub-accounting are charged back to the Fund, subject to certain limitations approved by the Trust’s Board of Trustees. For the year ended April 30, 2017, expenses incurred under the agreement are shown in the Statement of Operations as Transfer agent fees.
Shares of the Fund are distributed by Invesco Distributors, Inc. (“IDI”). The Fund has adopted a distribution plan pursuant to Rule 12b-1 under the 1940 Act, and a service plan (collectively, the “Plans”) for Class A, Class B, Class C and Class R shares to compensate IDI for the sale, distribution, shareholder servicing and maintenance of shareholder accounts for these shares. Under the Plans, the Fund will incur annual fees of up to 0.25% of Class A average daily net assets, up to 1.00% each of Class B and Class C average daily net assets and up to 0.50% of Class R average daily net assets.
With respect to Class B and Class C shares, the Fund is authorized to reimburse in future years any distribution related expenses that exceed the maximum annual reimbursement rate for such class, so long as such reimbursement does not cause the Fund to exceed the Class B and Class C maximum annual reimbursement rate, respectively. With respect to Class A shares, distribution related expenses that exceed the maximum annual reimbursement rate for such class are not carried forward to future years and the Fund will not reimburse IDI for any such expenses.
For the year ended April 30, 2017, expenses incurred under these agreements are shown in the Statement of Operations as Distribution fees.
Front-end sales commissions and CDSC (collectively, the “sales charges”) are not recorded as expenses of the Fund. Front-end sales commissions are deducted from proceeds from the sales of Fund shares prior to investment in Class A shares of the Fund. CDSC are deducted from redemption proceeds prior to remittance to the shareholder. During the year ended April 30, 2017, IDI advised the Fund that IDI retained $300,265 in front-end sales commissions from the sale of Class A shares and $10,369, $1,746 and $4,819 from Class A, Class B and Class C shares, respectively, for CDSC imposed on redemptions by shareholders.
For the year ended April 30, 2017, the Fund incurred $13,302 in brokerage commissions with Invesco Capital Markets, Inc., an affiliate of the Adviser and IDI, for portfolio transactions executed on behalf of the Fund.
Certain officers and trustees of the Trust are officers and directors of the Adviser, IIS and/or IDI.
NOTE 3—Additional Valuation Information
GAAP defines fair value as the price that would be received to sell an asset or paid to transfer a liability in an orderly transaction between market participants at the measurement date, under current market conditions. GAAP establishes a hierarchy that prioritizes the inputs to valuation methods, giving the highest priority to readily available unadjusted quoted prices in an active market for identical assets (Level 1) and the lowest priority to significant unobservable inputs (Level 3), generally when market prices are not readily available or are unreliable. Based on the valuation inputs, the securities or other investments are tiered into one of three levels. Changes in valuation methods may result in transfers in or out of an investment’s assigned level:
| | Level 1 — | Prices are determined using quoted prices in an active market for identical assets. |
| | Level 2 — | Prices are determined using other significant observable inputs. Observable inputs are inputs that other market participants may use in pricing a security. These may include quoted prices for similar securities, interest rates, prepayment speeds, credit risk, yield curves, loss severities, default rates, discount rates, volatilities and others. |
| | Level 3 — | Prices are determined using significant unobservable inputs. In situations where quoted prices or observable inputs are unavailable (for example, when there is little or no market activity for an investment at the end of the period), unobservable inputs may be used. Unobservable inputs reflect the Fund’s own assumptions about the factors market participants would use in determining fair value of the securities or instruments and would be based on the best available information. |
16 Invesco Mid Cap Growth Fund
As of April 30, 2017, all of the securities in this Fund were valued based on Level 1 inputs (see the Schedule of Investments for security categories). The level assigned to the securities valuations may not be an indication of the risk or liquidity associated with investing in those securities. Because of the inherent uncertainties of valuation, the values reflected in the financial statements may materially differ from the value received upon actual sale of those investments.
NOTE 4—Security Transactions with Affiliated Funds
The Fund is permitted to purchase or sell securities from or to certain other Invesco Funds under specified conditions outlined in procedures adopted by the Board of Trustees of the Trust. The procedures have been designed to ensure that any purchase or sale of securities by the Fund from or to another fund or portfolio that is or could be considered an affiliate by virtue of having a common investment adviser (or affiliated investment advisers), common Trustees and/or common officers complies with Rule 17a-7 of the 1940 Act. Further, as defined under the procedures, each transaction is effected at the current market price. Pursuant to these procedures, for the year ended April 30, 2017, the Fund engaged in securities sales of $4,249,501, which resulted in net realized gains (losses) of $(245,038).
NOTE 5—Expense Offset Arrangement(s)
The expense offset arrangement is comprised of transfer agency credits which result from balances in demand deposit accounts used by the transfer agent for clearing shareholder transactions. For the year ended April 30, 2017, the Fund received credits from this arrangement, which resulted in the reduction of the Fund’s total expenses of $41,362.
NOTE 6—Trustees’ and Officers’ Fees and Benefits
Trustees’ and Officers’ Fees and Benefits include amounts accrued by the Fund to pay remuneration to certain Trustees and Officers of the Fund. Trustees have the option to defer compensation payable by the Fund, and Trustees’ and Officers’ Fees and Benefits also include amounts accrued by the Fund to fund such deferred compensation amounts. Those Trustees who defer compensation have the option to select various Invesco Funds in which their deferral accounts shall be deemed to be invested. Finally, certain current Trustees were eligible to participate in a retirement plan that provided for benefits to be paid upon retirement to Trustees over a period of time based on the number of years of service. The Fund may have certain former Trustees who also participate in a retirement plan and receive benefits under such plan. Trustees’ and Officers’ Fees and Benefits include amounts accrued by the Fund to fund such retirement benefits. Obligations under the deferred compensation and retirement plans represent unsecured claims against the general assets of the Fund.
NOTE 7—Cash Balances
The Fund is permitted to temporarily carry a negative or overdrawn balance in its account with State Street Bank and Trust Company, the custodian bank. Such balances, if any at period-end, are shown in the Statement of Assets and Liabilities under the payable caption Amount due custodian. To compensate the custodian bank for such overdrafts, the overdrawn Fund may either (1) leave funds as a compensating balance in the account so the custodian bank can be compensated by earning the additional interest; or (2) compensate by paying the custodian bank at a rate agreed upon by the custodian bank and Invesco, not to exceed the contractually agreed upon rate.
NOTE 8—Distributions to Shareholders and Tax Components of Net Assets
Tax Character of Distributions to Shareholders Paid During the Fiscal Years Ended April 30, 2017 and 2016:
| | | | | | | | |
| | | 2017 | | | 2016 | |
Long-term capital gain | | $ | 68,689,243 | | | $ | 210,003,868 | |
Tax Components of Net Assets at Period-End:
| | | | |
| | | 2017 | |
Undistributed long-term gain | | $ | 138,988,839 | |
Net unrealized appreciation — investments | | | 509,382,077 | |
Temporary book/tax differences | | | (700,969 | ) |
Late-year ordinary loss deferral | | | (5,166,212 | ) |
Shares of beneficial interest | | | 2,065,286,149 | |
Total net assets | | $ | 2,707,789,884 | |
The difference between book-basis and tax-basis unrealized appreciation (depreciation) is due to differences in the timing of recognition of gains and losses on investments for tax and book purposes. The Fund’s net unrealized appreciation difference is attributable primarily to wash sales.
The temporary book/tax differences are a result of timing differences between book and tax recognition of income and/or expenses. The Fund’s temporary book/tax differences are the result of the trustee deferral of compensation and retirement plan benefits.
17 Invesco Mid Cap Growth Fund
Capital loss carryforward is calculated and reported as of a specific date. Results of transactions and other activity after that date may affect the amount of capital loss carryforward actually available for the Fund to utilize. Capital losses generated in years beginning after December 22, 2010 can be carried forward for an unlimited period, whereas previous losses expire in eight tax years. Capital losses with an expiration period may not be used to offset capital gains until all net capital losses without an expiration date have been utilized. Capital loss carryforwards with no expiration date will retain their character as either short-term or long-term capital losses instead of as short-term capital losses as under prior law. The ability to utilize capital loss carryforwards in the future may be limited under the Internal Revenue Code and related regulations based on the results of future transactions.
The Fund does not have a capital loss carryforward as of April 30, 2017.
NOTE 9—Investment Securities
The aggregate amount of investment securities (other than short-term securities, U.S. Treasury obligations and money market funds, if any) purchased and sold by the Fund during the year ended April 30, 2017 was $1,382,032,065 and $1,646,207,680, respectively. Cost of investments on a tax basis includes the adjustments for financial reporting purposes as of the most recently completed federal income tax reporting period-end.
| | | | |
| Unrealized Appreciation (Depreciation) of Investment Securities on a Tax Basis | |
Aggregate unrealized appreciation of investment securities | | $ | 551,382,938 | |
Aggregate unrealized (depreciation) of investment securities | | | (42,000,861 | ) |
Net unrealized appreciation of investment securities | | $ | 509,382,077 | |
Cost of investments for tax purposes is $2,197,375,548.
NOTE 10—Reclassification of Permanent Differences
Primarily as a result of differing book/tax treatment of expired capital loss carryforward and net operating losses, on April 30, 2017, undistributed net investment income (loss) was increased by $15,810,272, undistributed net realized gain was increased by $13,831,772 and shares of beneficial interest was decreased by $29,642,044. This reclassification had no effect on the net assets of the Fund.
18 Invesco Mid Cap Growth Fund
NOTE 11—Share Information
| | | | | | | | | | | | | | | | |
| | | Summary of Share Activity | |
| | | Years ended April 30, | |
| | | 2017(a) | | | 2016 | |
| | | Shares | | | Amount | | | Shares | | | Amount | |
Sold: | | | | | | | | | | | | | | | | |
Class A | | | 4,275,316 | | | $ | 149,557,638 | | | | 5,892,996 | | | $ | 209,757,836 | |
Class B | | | 16,188 | | | | 476,078 | | | | 27,849 | | | | 854,005 | |
Class C | | | 441,266 | | | | 12,013,328 | | | | 783,132 | | | | 22,663,540 | |
Class R | | | 212,030 | | | | 7,225,541 | | | | 225,301 | | | | 7,971,324 | |
Class Y | | | 2,347,936 | | | | 86,563,379 | | | | 621,771 | | | | 23,246,797 | |
Class R5 | | | 602,144 | | | | 22,126,658 | | | | 707,552 | | | �� | 26,431,020 | |
Class R6 | | | 149,230 | | | | 5,474,270 | | | | 168,238 | | | | 6,339,325 | |
| | | | |
Issued as reinvestment of dividends: | | | | | | | | | | | | | | | | |
Class A | | | 1,573,593 | | | | 54,131,590 | | | | 4,849,844 | | | | 163,342,799 | |
Class B | | | 34,452 | | | | 991,172 | | | | 170,151 | | | | 4,816,968 | |
Class C | | | 167,205 | | | | 4,457,690 | | | | 540,776 | | | | 14,325,141 | |
Class R | | | 22,058 | | | | 739,591 | | | | 73,999 | | | | 2,436,780 | |
Class Y | | | 53,697 | | | | 1,917,497 | | | | 144,326 | | | | 5,029,788 | |
Class R5 | | | 65,040 | | | | 2,342,104 | | | | 184,366 | | | | 6,467,555 | |
Class R6 | | | 34,506 | | | | 1,246,690 | | | | 104,418 | | | | 3,671,357 | |
| | | | |
Automatic conversion of Class B shares to Class A shares: | | | | | | | | | | | | | | | | |
Class A | | | 530,416 | | | | 18,590,804 | | | | 560,593 | | | | 19,924,603 | |
Class B | | | (632,453 | ) | | | (18,590,804 | ) | | | (662,016 | ) | | | (19,924,603 | ) |
| | | | |
Reacquired: | | | | | | | | | | | | | | | | |
Class A | | | (12,192,349 | ) | | | (426,515,124 | ) | | | (9,705,298 | ) | | | (343,450,192 | ) |
Class B | | | (195,853 | ) | | | (5,727,109 | ) | | | (233,040 | ) | | | (7,072,638 | ) |
Class C | | | (1,455,354 | ) | | | (39,542,330 | ) | | | (1,248,083 | ) | | | (34,792,488 | ) |
Class R | | | (372,339 | ) | | | (12,654,720 | ) | | | (306,528 | ) | | | (10,757,923 | ) |
Class Y | | | (1,177,551 | ) | | | (42,696,090 | ) | | | (566,796 | ) | | | (20,616,046 | ) |
Class R5 | | | (588,692 | ) | | | (21,412,589 | ) | | | (385,584 | ) | | | (14,215,758 | ) |
Class R6 | | | (213,395 | ) | | | (7,767,810 | ) | | | (363,803 | ) | | | (13,360,843 | ) |
Net increase (decrease) in share activity | | | (6,302,909 | ) | | $ | (207,052,546 | ) | | | 1,584,164 | | | $ | 53,088,347 | |
| (a) | There are entities that are record owners of more than 5% of the outstanding shares of the Fund and in the aggregate own 33% of the outstanding shares of the Fund. IDI has an agreement with these entities to sell Fund shares. The Fund, Invesco and/or Invesco affiliates may make payments to these entities, which are considered to be related to the Fund, for providing services to the Fund, Invesco and/or Invesco affiliates including but not limited to services such as securities brokerage, distribution, third party record keeping and account servicing. The Fund has no knowledge as to whether all or any portion of the shares owned of record by these entities are also owned beneficially. |
19 Invesco Mid Cap Growth Fund
NOTE 12—Financial Highlights
The following schedule presents financial highlights for a share of the Fund outstanding throughout the periods indicated.
| | | | | | | | | | | | | | | | | | | | | | | | | | | | | | | | | | | | | | | | | | | | | | | | |
| | | Net asset
value,
beginning
of period | | | Net
investment
income
(loss)(a) | | | Net gains
(losses) on securities (both
realized and
unrealized) | | | Total from
investment
operations | | | Distributions
from net
realized
gains | | | Net asset
value, end of period | | | Total
return(b) | | | Net assets,
end of period
(000’s omitted) | | | Ratio of
expenses
to average
net assets
with fee waivers
and/or expenses
absorbed | | | Ratio of
expenses
to average net
assets without
fee waivers
and/or expenses
absorbed | | | Ratio of net
investment
income (loss)
to average
net assets | | | Portfolio
turnover(c) | |
Class A | | | | | | | | | | | | | | | | | | | | | | | | | | | | | | | | | | | | | | | | | | | | | | | | |
Year ended 04/30/17 | | $ | 33.16 | | | $ | (0.20 | ) | | $ | 5.08 | | | $ | 4.88 | | | $ | (0.92 | ) | | $ | 37.12 | | | | 14.94 | % | | $ | 2,221,949 | | | | 1.21 | %(d) | | | 1.21 | %(d) | | | (0.57 | )%(d) | | | 53 | % |
Year ended 04/30/16 | | | 38.74 | | | | (0.18 | ) | | | (2.66 | ) | | | (2.84 | ) | | | (2.74 | ) | | | 33.16 | | | | (7.43 | ) | | | 2,177,520 | | | | 1.20 | | | | 1.21 | | | | (0.49 | ) | | | 60 | |
Year ended 04/30/15 | | | 37.30 | | | | (0.15 | ) | | | 5.18 | | | | 5.03 | | | | (3.59 | ) | | | 38.74 | | | | 14.39 | | | | 2,482,328 | | | | 1.14 | | | | 1.19 | | | | (0.38 | ) | | | 61 | |
Year ended 04/30/14 | | | 31.09 | | | | (0.16 | ) | | | 7.27 | | | | 7.11 | | | | (0.90 | ) | | | 37.30 | | | | 22.99 | | | | 2,384,362 | | | | 1.16 | | | | 1.21 | | | | (0.44 | ) | | | 95 | |
Year ended 04/30/13 | | | 28.15 | | | | (0.03 | )(e) | | | 2.97 | | | | 2.94 | | | | — | | | | 31.09 | | | | 10.44 | | | | 1,491,997 | | | | 1.29 | | | | 1.29 | | | | (0.11 | )(e) | | | 88 | |
Class B | | | | | | | | | | | | | | | | | | | | | | | | | | | | | | | | | | | | | | | | | | | | | | | | |
Year ended 04/30/17 | | | 27.87 | | | | (0.17 | ) | | | 4.27 | | | | 4.10 | | | | (0.92 | ) | | | 31.05 | | | | 14.98 | (f) | | | 24,200 | | | | 1.21 | (d)(f) | | | 1.21 | (d)(f) | | | (0.57 | )(d)(f) | | | 53 | |
Year ended 04/30/16 | | | 33.03 | | | | (0.15 | ) | | | (2.27 | ) | | | (2.42 | ) | | | (2.74 | ) | | | 27.87 | | | | (7.44 | )(f) | | | 43,403 | | | | 1.20 | (f) | | | 1.21 | (f) | | | (0.49 | )(f) | | | 60 | |
Year ended 04/30/15 | | | 32.30 | | | | (0.13 | ) | | | 4.45 | | | | 4.32 | | | | (3.59 | ) | | | 33.03 | | | | 14.42 | (f) | | | 74,463 | | | | 1.14 | (f) | | | 1.19 | (f) | | | (0.38 | )(f) | | | 61 | |
Year ended 04/30/14 | | | 27.03 | | | | (0.14 | ) | | | 6.31 | | | | 6.17 | | | | (0.90 | ) | | | 32.30 | | | | 22.96 | (f) | | | 97,068 | | | | 1.16 | (f) | | | 1.21 | (f) | | | (0.44 | )(f) | | | 95 | |
Year ended 04/30/13 | | | 24.47 | | | | (0.03 | )(e) | | | 2.59 | | | | 2.56 | | | | — | | | | 27.03 | | | | 10.46 | (f) | | | 106,586 | | | | 1.29 | (f) | | | 1.29 | (f) | | | (0.11 | )(e)(f) | | | 88 | |
Class C | | | | | | | | | | | | | | | | | | | | | | | | | | | | | | | | | | | | | | | | | | | | | | | | |
Year ended 04/30/17 | | | 26.01 | | | | (0.35 | ) | | | 3.95 | | | | 3.60 | | | | (0.92 | ) | | | 28.69 | | | | 14.11 | (g) | | | 139,950 | | | | 1.93 | (d)(g) | | | 1.93 | (d)(g) | | | (1.29 | )(d)(g) | | | 53 | |
Year ended 04/30/16 | | | 31.24 | | | | (0.35 | ) | | | (2.14 | ) | | | (2.49 | ) | | | (2.74 | ) | | | 26.01 | | | | (8.12 | )(g) | | | 148,892 | | | | 1.92 | (g) | | | 1.93 | (g) | | | (1.21 | )(g) | | | 60 | |
Year ended 04/30/15 | | | 30.95 | | | | (0.35 | ) | | | 4.23 | | | | 3.88 | | | | (3.59 | ) | | | 31.24 | | | | 13.59 | (g) | | | 176,447 | | | | 1.86 | (g) | | | 1.91 | (g) | | | (1.10 | )(g) | | | 61 | |
Year ended 04/30/14 | | | 26.11 | | | | (0.34 | ) | | | 6.08 | | | | 5.74 | | | | (0.90 | ) | | | 30.95 | | | | 22.12 | (g) | | | 170,355 | | | | 1.88 | (g) | | | 1.93 | (g) | | | (1.16 | )(g) | | | 95 | |
Year ended 04/30/13 | | | 23.82 | | | | (0.20 | )(e) | | | 2.49 | | | | 2.29 | | | | — | | | | 26.11 | | | | 9.62 | | | | 134,484 | | | | 2.04 | | | | 2.04 | | | | (0.86 | )(e) | | | 88 | |
Class R | | | | | | | | | | | | | | | | | | | | | | | | | | | | | | | | | | | | | | | | | | | | | | | | |
Year ended 04/30/17 | | | 32.39 | | | | (0.28 | ) | | | 4.96 | | | | 4.68 | | | | (0.92 | ) | | | 36.15 | | | | 14.67 | | | | 27,975 | | | | 1.46 | (d) | | | 1.46 | (d) | | | (0.82 | )(d) | | | 53 | |
Year ended 04/30/16 | | | 38.01 | | | | (0.26 | ) | | | (2.62 | ) | | | (2.88 | ) | | | (2.74 | ) | | | 32.39 | | | | (7.69 | ) | | | 29,547 | | | | 1.45 | | | | 1.46 | | | | (0.74 | ) | | | 60 | |
Year ended 04/30/15 | | | 36.74 | | | | (0.24 | ) | | | 5.10 | | | | 4.86 | | | | (3.59 | ) | | | 38.01 | | | | 14.14 | | | | 34,942 | | | | 1.39 | | | | 1.44 | | | | (0.63 | ) | | | 61 | |
Year ended 04/30/14 | | | 30.72 | | | | (0.24 | ) | | | 7.16 | | | | 6.92 | | | | (0.90 | ) | | | 36.74 | | | | 22.64 | | | | 36,184 | | | | 1.41 | | | | 1.46 | | | | (0.69 | ) | | | 95 | |
Year ended 04/30/13 | | | 27.88 | | | | (0.10 | )(e) | | | 2.94 | | | | 2.84 | | | | — | | | | 30.72 | | | | 10.19 | | | | 31,410 | | | | 1.54 | | | | 1.54 | | | | (0.36 | )(e) | | | 88 | |
Class Y | | | | | | | | | | | | | | | | | | | | | | | | | | | | | | | | | | | | | | | | | | | | | | | | |
Year ended 04/30/17 | | | 34.34 | | | | (0.12 | ) | | | 5.28 | | | | 5.16 | | | | (0.92 | ) | | | 38.58 | | | | 15.24 | | | | 132,925 | | | | 0.96 | (d) | | | 0.96 | (d) | | | (0.32 | )(d) | | | 53 | |
Year ended 04/30/16 | | | 39.92 | | | | (0.09 | ) | | | (2.75 | ) | | | (2.84 | ) | | | (2.74 | ) | | | 34.34 | | | | (7.21 | ) | | | 76,291 | | | | 0.95 | | | | 0.96 | | | | (0.24 | ) | | | 60 | |
Year ended 04/30/15 | | | 38.23 | | | | (0.05 | ) | | | 5.33 | | | | 5.28 | | | | (3.59 | ) | | | 39.92 | | | | 14.70 | | | | 80,736 | | | | 0.89 | | | | 0.94 | | | | (0.13 | ) | | | 61 | |
Year ended 04/30/14 | | | 31.78 | | | | (0.07 | ) | | | 7.42 | | | | 7.35 | | | | (0.90 | ) | | | 38.23 | | | | 23.24 | | | | 62,398 | | | | 0.91 | | | | 0.96 | | | | (0.19 | ) | | | 95 | |
Year ended 04/30/13 | | | 28.70 | | | | 0.04 | (e) | | | 3.04 | | | | 3.08 | | | | — | | | | 31.78 | | | | 10.73 | | | | 48,115 | | | | 1.04 | | | | 1.04 | | | | 0.14 | (e) | | | 88 | |
Class R5 | | | | | | | | | | | | | | | | | | | | | | | | | | | | | | | | | | | | | | | | | | | | | | | | |
Year ended 04/30/17 | | | 34.59 | | | | (0.07 | ) | | | 5.32 | | | | 5.25 | | | | (0.92 | ) | | | 38.92 | | | | 15.39 | | | | 106,223 | | | | 0.83 | (d) | | | 0.83 | (d) | | | (0.19 | )(d) | | | 53 | |
Year ended 04/30/16 | | | 40.14 | | | | (0.04 | ) | | | (2.77 | ) | | | (2.81 | ) | | | (2.74 | ) | | | 34.59 | | | | (7.08 | ) | | | 91,700 | | | | 0.82 | | | | 0.82 | | | | (0.11 | ) | | | 60 | |
Year ended 04/30/15 | | | 38.39 | | | | (0.02 | ) | | | 5.36 | | | | 5.34 | | | | (3.59 | ) | | | 40.14 | | | | 14.80 | | | | 86,090 | | | | 0.81 | | | | 0.81 | | | | (0.05 | ) | | | 61 | |
Year ended 04/30/14 | | | 31.87 | | | | (0.04 | ) | | | 7.46 | | | | 7.42 | | | | (0.90 | ) | | | 38.39 | | | | 23.40 | | | | 79,584 | | | | 0.83 | | | | 0.83 | | | | (0.11 | ) | | | 95 | |
Year ended 04/30/13 | | | 28.73 | | | | 0.10 | (e) | | | 3.04 | | | | 3.14 | | | | — | | | | 31.87 | | | | 10.93 | | | | 19,881 | | | | 0.84 | | | | 0.84 | | | | 0.34 | (e) | | | 88 | |
Class R6 | | | | | | | | | | | | | | | | | | | | | | | | | | | | | | | | | | | | | | | | | | | | | | | | |
Year ended 04/30/17 | | | 34.68 | | | | (0.04 | ) | | | 5.34 | | | | 5.30 | | | | (0.92 | ) | | | 39.06 | | | | 15.50 | | | | 54,568 | | | | 0.75 | (d) | | | 0.75 | (d) | | | (0.11 | )(d) | | | 53 | |
Year ended 04/30/16 | | | 40.21 | | | | (0.01 | ) | | | (2.78 | ) | | | (2.79 | ) | | | (2.74 | ) | | | 34.68 | | | | (7.02 | ) | | | 49,485 | | | | 0.73 | | | | 0.73 | | | | (0.02 | ) | | | 60 | |
Year ended 04/30/15 | | | 38.41 | | | | 0.02 | | | | 5.37 | | | | 5.39 | | | | (3.59 | ) | | | 40.21 | | | | 14.93 | | | | 61,029 | | | | 0.72 | | | | 0.72 | | | | 0.04 | | | | 61 | |
Year ended 04/30/14(h) | | | 34.50 | | | | (0.01 | ) | | | 4.82 | | | | 4.81 | | | | (0.90 | ) | | | 38.41 | | | | 14.05 | | | | 77,395 | | | | 0.73 | (i) | | | 0.73 | (i) | | | (0.01 | )(i) | | | 95 | |
| (a) | Calculated using average shares outstanding. |
| (b) | Includes adjustments in accordance with accounting principles generally accepted in the United States of America and as such, the net asset value for financial reporting purposes and the returns based upon those net asset values may differ from the net asset value and returns for shareholder transactions. Does not include sales charges and is not annualized for periods less than one year, if applicable. |
| (c) | Portfolio turnover is calculated at the fund level and is not annualized for periods less than one year, if applicable. |
| (d) | Ratios are based on average daily net assets (000’s omitted) of $2,189,440, $34,956, $143,648, $28,300, $91,804, $96,358 and $50,993 for Class A, Class B, Class C, Class R, Class Y, Class R5 and Class R6 shares, respectively. |
| (e) | Net investment income (loss) per share and the ratio of net investment income (loss) to average net assets include significant dividends received during the period. Net investment income (loss) per share and the ratio of net investment income (loss) to average net assets excluding the significant dividends are $(0.18) and (0.63)%, $(0.15) and (0.63)%, $(0.32) and (1.38)%, $(0.24) and (0.88)%, $(0.11) and (0.38)% and $(0.05) and (0.18)% for Class A, Class B, Class C, Class R, Class Y and Class R5 shares, respectively. |
| (f) | The Total return, Ratio of expenses to average net assets and Ratio of net investment income (loss) to average net assets reflect actual 12b-1 fees of 0.25%, 0.25%, 0.25%, 0.25% and 0.25% for the years ended April 30, 2017, 2016, 2015, 2014 and 2013, respectively. |
| (g) | The Total return, Ratio of expenses to average net assets and Ratio of net investment income (loss) to average net assets reflect actual 12b-1 fees of 0.97%, 0.98%, 0.97% and 0.96% for the years ended April 30, 2017, 2016, 2015 and 2014, respectively. |
| (h) | Commencement date of July 15, 2013. |
20 Invesco Mid Cap Growth Fund
Report of Independent Registered Public Accounting Firm
To the Board of Trustees of AIM Sector Funds (Invesco Sector Funds)
and Shareholders of the Invesco Mid Cap Growth Fund:
In our opinion, the accompanying statement of assets and liabilities, including the schedule of investments, and the related statements of operations and of changes in net assets and the financial highlights present fairly, in all material respects, the financial position of the Invesco Mid Cap Growth Fund (one of the portfolios constituting the AIM Sector Funds (Invesco Sector Funds), hereafter referred to as the “Fund”) as of April 30, 2017, the results of its operations for the year then ended, the changes in its net assets for each of the two years in the period then ended and the financial highlights for each of the five years in the period then ended, in conformity with accounting principles generally accepted in the United States of America. These financial statements and financial highlights (hereafter referred to as “financial statements”) are the responsibility of the Fund’s management. Our responsibility is to express an opinion on these financial statements based on our audits. We conducted our audits of these financial statements in accordance with the standards of the Public Company Accounting Oversight Board (United States). Those standards require that we plan and perform the audit to obtain reasonable assurance about whether the financial statements are free of material misstatement. An audit includes examining, on a test basis, evidence supporting the amounts and disclosures in the financial statements, assessing the accounting principles used and significant estimates made by management, and evaluating the overall financial statement presentation. We believe that our audits, which included confirmation of securities as of April 30, 2017 by correspondence with the custodian and brokers, provide a reasonable basis for our opinion.
PricewaterhouseCoopers LLP
Houston, TX
June 23, 2017
21 Invesco Mid Cap Growth Fund
Calculating your ongoing Fund expenses
Example
As a shareholder of the Fund, you incur two types of costs: (1) transaction costs, which may include sales charges (loads) on purchase payments or contingent deferred sales charges on redemptions, if any; and (2) ongoing costs, including management fees, distribution and/or service (12b-1) fees, and other Fund expenses. This example is intended to help you understand your ongoing costs (in dollars) of investing in the Fund and to compare these costs with ongoing costs of investing in other mutual funds. The example is based on an investment of $1,000 invested at the beginning of the period and held for the entire period November 1, 2016 through April 30, 2017.
Actual expenses
The table below provides information about actual account values and actual expenses. You may use the information in this table, together with the amount you invested, to estimate the expenses that you paid over the period. Simply divide your account value by $1,000 (for example, an $8,600 account value divided by $1,000 = 8.6), then multiply the result by the number in the table under the heading entitled “Actual Expenses Paid During Period” to estimate the expenses you paid on your account during this period.
Hypothetical example for comparison purposes
The table below also provides information about hypothetical account values and hypothetical expenses based on the Fund’s actual expense ratio and an assumed rate of return of 5% per year before expenses, which is not the Fund’s actual return.
The hypothetical account values and expenses may not be used to estimate the actual ending account balance or expenses you paid for the period. You may use this information to compare the ongoing costs of investing in the Fund and other funds. To do so, compare this 5% hypothetical example with the 5% hypothetical examples that appear in the shareholder reports of the other funds.
Please note that the expenses shown in the table are meant to highlight your ongoing costs only and do not reflect any transaction costs, such as sales charges (loads) on purchase payments or contingent deferred sales charges on redemptions, if any. Therefore, the hypothetical information is useful in comparing ongoing costs only, and will not help you determine the relative total costs of owning different funds. In addition, if these transaction costs were included, your costs would have been higher.
| | | | | | | | | | | | | | | | | | | | | | | | |
| Class | | Beginning
Account Value
(11/01/16) | | | ACTUAL | | | HYPOTHETICAL (5% annual return before expenses) | | | Annualized
Expense
Ratio | |
| | | Ending
Account Value
(04/30/17)1 | | | Expenses
Paid During
Period2 | | | Ending
Account Value
(04/30/17) | | | Expenses
Paid During
Period2 | | |
| A | | $ | 1,000.00 | | | $ | 1,125.30 | | | $ | 6.48 | | | $ | 1,018.70 | | | $ | 6.16 | | | | 1.23 | % |
| B | | | 1,000.00 | | | | 1,125.10 | | | | 6.48 | | | | 1,018.70 | | | | 6.16 | | | | 1.23 | |
| C | | | 1,000.00 | | | | 1,120.80 | | | | 10.36 | | | | 1,015.03 | | | | 9.84 | | | | 1.97 | |
| R | | | 1,000.00 | | | | 1,123.80 | | | | 7.79 | | | | 1,017.46 | | | | 7.40 | | | | 1.48 | |
| Y | | | 1,000.00 | | | | 1,126.50 | | | | 5.17 | | | | 1,019.93 | | | | 4.91 | | | | 0.98 | |
| R5 | | | 1,000.00 | | | | 1,127.20 | | | | 4.54 | | | | 1,020.53 | | | | 4.31 | | | | 0.86 | |
| R6 | | | 1,000.00 | | | | 1,127.70 | | | | 4.01 | | | | 1,021.03 | | | | 3.81 | | | | 0.76 | |
| 1 | The actual ending account value is based on the actual total return of the Fund for the period November 1, 2016 through April 30, 2017, after actual expenses and will differ from the hypothetical ending account value which is based on the Fund’s expense ratio and a hypothetical annual return of 5% before expenses. |
| 2 | Expenses are equal to the Fund’s annualized expense ratio as indicated above multiplied by the average account value over the period, multiplied by 181/365 to reflect the most recent fiscal half year. |
22 Invesco Mid Cap Growth Fund
Tax Information
Form 1099-DIV, Form 1042-S and other year-end tax information provide shareholders with actual calendar year amounts that should be included in their tax returns. Shareholders should consult their tax advisors.
The following distribution information is being provided as required by the Internal Revenue Code or to meet a specific state’s requirement.
The Fund designates the following amounts or, if subsequently determined to be different, the maximum amount allowable for its fiscal year ended April 30, 2017:
| | | | |
Federal and State Income Tax | |
Long-Term Capital Gain Distributions | | $ | 68,689,243 | |
Qualified Dividend Income* | | | 0 | % |
Corporate Dividends Received Deduction* | | | 0 | % |
U.S. Treasury Obligations* | | | 0 | % |
| | * | The above percentages are based on ordinary income dividends paid to shareholders during the Fund’s fiscal year. |
23 Invesco Mid Cap Growth Fund
Proxy Results
A Special Joint Meeting (“Meeting”) of Shareholders of Invesco Mid Cap Growth Fund, an investment portfolio of AIM Sector Funds (Invesco Sector Funds), a Delaware statutory trust (“Trust”), was held on March 9, 2017. The Meeting was held for the following purpose:
| (1) | Elect 15 trustees to the Board, each of whom will serve until his or her successor is elected and qualified. |
| (2) | Approve an amendment to the Trust’s Agreement and Declaration of Trust that would permit fund mergers and other significant transactions upon the Board’s approval but without shareholder approval of such transactions. |
The results of the voting on the above matters were as follows:
| | | | | | | | | | | | | | | | | | |
| | | Matters | | | | | | | | Votes For | | | Votes Withheld | |
| (1)* | | David C. Arch | | | | 478,210,140 | | | | 13,802,825 | |
| | James T. Bunch | | | | 477,776,614 | | | | 14,236,351 | |
| | Bruce L. Crockett | | | | 477,904,863 | | | | 14,108,102 | |
| | Jack M. Fields | | | | 478,154,120 | | | | 13,858,845 | |
| | Martin L. Flanagan | | | | 478,366,284 | | | | 13,646,681 | |
| | Cynthia Hostetler | | | | 478,149,043 | | | | 13,863,922 | |
| | Dr. Eli Jones | | | | 478,281,396 | | | | 13,731,569 | |
| | Dr. Prema Mathai-Davis | | | | 477,927,603 | | | | 14,085,362 | |
| | Teresa M. Ressel | | | | 478,116,999 | | | | 13,895,966 | |
| | Dr. Larry Soll | | | | 477,671,696 | | | | 14,341,269 | |
| | Ann Barnett Stern | | | | 478,390,538 | | | | 13,622,427 | |
| | Raymond Stickel, Jr | | | | 477,934,336 | | | | 14,078,629 | |
| | Philip A. Taylor | | | | 478,104,174 | | | | 13,908,791 | |
| | Robert C. Troccoli | | | | 478,368,464 | | | | 13,644,501 | |
| | Christopher L. Wilson | | | | 478,433,867 | | | | 13,579,098 | |
| | | | | |
| | | | | | | | | | | | | | | | | | |
| | | | | Votes For | | | Votes
Against | | | Votes
Abstain | | | Broker
Non-Votes | |
| (2)* | | Approve an amendment to the Trust’s Agreement and Declaration of Trust that would permit fund mergers and other significant transactions upon the Board’s approval but without shareholder approval of such transactions | | | 261,575,830 | | | | 26,621,916 | | | | 13,166,011 | | | | 190,648,808 | |
The Meeting was adjourned until April 11, 2017, with respect to the following proposals:
| (3) | Approve changing the fundamental investment restriction regarding the purchase or sale of physical commodities. |
| 4(a) | Approve an amendment to the current Master Intergroup Sub-Advisory Contract to add Invesco PowerShares Capital Management LLC. |
| 4(b) | Approve an amendment to the current Master Intergroup Sub-Advisory Contract to add Invesco Asset Management (India) Private Limited. |
Invesco Mid Cap Growth Fund did not receive sufficient shareholder votes to pass Proposals 3 and 4(a) - (b).
The results of the voting on the above matters were as follows:
| | | | | | | | | | | | | | | | | | |
| | | Matters | | Votes For | | | Votes
Against | | | Votes
Abstain | | | Broker
Non-Votes | |
| (3) | | Approve changing the fundamental investment restriction regarding the purchase or sale of physical commodities | | | 20,615,396 | | | | 2,215,086 | | | | 1,406,110 | | | | 15,286,290 | |
| 4(a) | | Approve an amendment to the current Master Intergroup Sub-Advisory Contract to add Invesco PowerShares Capital Management LLC | | | 21,440,770 | | | | 1,376,067 | | | | 1,419,766 | | | | 15,286,279 | |
| 4(b) | | Approve an amendment to the current Master Intergroup Sub-Advisory Contract to add Invesco Asset Management (India) Private Limited | | | 21,028,812 | | | | 1,754,057 | | | | 1,453,728 | | | | 15,286,285 | |
| * | Each of proposal 1 and 2 required approval by a combined vote of all of the portfolios of AIM Sector Funds (Invesco Sector Funds). |
24 Invesco Mid Cap Growth Fund
Trustees and Officers
The address of each trustee and officer is AIM Sector Funds (Invesco Sector Funds) (the “Trust”), 11 Greenway Plaza, Suite 1000, Houston, Texas 77046-1173. The trustees serve for the life of the Trust, subject to their earlier death, incapacitation, resignation, retirement or removal as more specifically provided in the Trust’s organizational documents. Each officer serves for a one year term or until their successors are elected and qualified. Column two below includes length of time served with predecessor entities, if any.
| | | | | | | | |
Name, Year of Birth and
Position(s) Held with the Trust | | Trustee and/
or Officer Since | | Principal Occupation(s)
During Past 5 Years | | Number of
Funds in Fund
Complex
Overseen by
Trustee | | Other Directorship(s)
Held by Trustee During
Past 5 Years |
| Interested Persons | | | | | | | | |
| Martin L. Flanagan1 — 1960 Trustee | | 2007 | | Executive Director, Chief Executive Officer and President, Invesco Ltd. (ultimate parent of Invesco and a global investment management firm); Trustee, The Invesco Funds; Vice Chair, Investment Company Institute; and Member of Executive Board, SMU Cox School of Business Formerly: Advisor to the Board, Invesco Advisers, Inc. (formerly known as Invesco Institutional (N.A.), Inc.); Chairman and Chief Executive Officer, Invesco Advisers, Inc. (registered investment adviser); Director, Chairman, Chief Executive Officer and President, Invesco Holding Company (US), Inc. (formerly IVZ Inc.) (holding company), Invesco Group Services, Inc. (service provider) and Invesco North American Holdings, Inc. (holding company); Director, Chief Executive Officer and President, Invesco Holding Company Limited (parent of Invesco and a global investment management firm); Director, Invesco Ltd.; Chairman, Investment Company Institute and President, Co-Chief Executive Officer, Co-President, Chief Operating Officer and Chief Financial Officer, Franklin Resources, Inc. (global investment management organization) | | 144 | | None |
Philip A. Taylor2 — 1954 Trustee and Senior Vice President | | 2006 | | Head of the Americas and Senior Managing Director, Invesco Ltd.; Director, Invesco Advisers, Inc. (formerly known as Invesco Institutional (N.A.), Inc.) (registered investment adviser); Director, Chairman, Chief Executive Officer and President, Invesco Management Group, Inc. (formerly known as Invesco Aim Management Group, Inc.) (financial services holding company); Director and Chairman, Invesco Investment Services, Inc. (formerly known as Invesco Aim Investment Services, Inc.) (registered transfer agent) Chief Executive Officer, Invesco Corporate Class Inc. (corporate mutual fund company) Director, Chairman and Chief Executive Officer, Invesco Canada Ltd. (formerly known as Invesco Trimark Ltd./Invesco Trimark Ltèe) (registered investment adviser and registered transfer agent); Trustee and Senior Vice President, The Invesco Funds; Director, Invesco Investment Advisers LLC (formerly known as Van Kampen Asset Management). Formerly: Co-Chairman, Co-President and Co-Chief Executive Officer, Invesco Advisers, Inc. (formerly known as Invesco Institutional (N.A.), Inc.) (registered investment adviser); Director, Chief Executive Officer and President, Van Kampen Exchange Corp; President and Principal Executive Officer, The Invesco Funds (other than AIM Treasurer’s Series Trust (Invesco Treasurer’s Series Trust), Short-Term Investments Trust and Invesco Management Trust); Executive Vice President, The Invesco Funds (AIM Treasurer’s Series Trust (Invesco Treasurer’s Series Trust), Short-Term Investments Trust and Invesco Management Trust only); Director and President, INVESCO Funds Group, Inc. (registered investment adviser and registered transfer agent); Director and Chairman, IVZ Distributors, Inc. (formerly known as INVESCO Distributors, Inc.) (registered broker dealer); Director, President and Chairman, Invesco Inc. (holding company), Invesco Canada Holdings Inc. (holding company), Trimark Investments Ltd./Placements Trimark Ltèe and Invesco Financial Services Ltd/Services Financiers Invesco Ltèe; Chief Executive Officer, Invesco Canada Fund Inc. (corporate mutual fund company); Director and Chairman, Van Kampen Investor Services Inc.; Director, Chief Executive Officer and President, 1371 Preferred Inc. (holding company) and Van Kampen Investments Inc.; Director and President, AIM GP Canada Inc. (general partner for limited partnerships) and Van Kampen Advisors, Inc.; Director and Chief Executive Officer, Invesco Trimark Dealer Inc. (registered broker dealer); Director, Invesco Distributors, Inc. (formerly known as Invesco Aim Distributors, Inc.) (registered broker dealer); Manager, Invesco PowerShares Capital Management LLC; Director, Chief Executive Officer and President, Invesco Advisers, Inc.; Director, Chairman, Chief Executive Officer and President, Invesco Aim Capital Management, Inc.; President, Invesco Trimark Dealer Inc. and Invesco Trimark Ltd./Invesco Trimark Ltèe; Director and President, AIM Trimark Corporate Class Inc. and AIM Trimark Canada Fund Inc.; Senior Managing Director, Invesco Holding Company Limited; Director and Chairman, Fund Management Company (former registered broker dealer); President and Principal Executive Officer, The Invesco Funds (AIM Treasurer’s Series Trust (Invesco Treasurer’s Series Trust), and Short-Term Investments Trust only); President, AIM Trimark Global Fund Inc. and AIM Trimark Canada Fund Inc. | | 144 | | None |
| 1 | Mr. Flanagan is considered an interested person (within the meaning of Section 2(a)(19) of the 1940 Act) of the Trust because he is an officer of the Adviser to the Trust, and an officer and a director of Invesco Ltd., ultimate parent of the Adviser. |
| 2 | Mr. Taylor is considered an interested person (within the meaning of Section 2(a)(19) of the 1940 Act) of the Trust because he is an officer and a director of the Adviser. |
T-1 Invesco Mid Cap Growth Fund
Trustees and Officers—(continued)
| | | | | | | | |
Name, Year of Birth and
Position(s) Held with the Trust | | Trustee and/
or Officer Since | | Principal Occupation(s)
During Past 5 Years | | Number of
Funds in Fund
Complex
Overseen by
Trustee | | Other Directorship(s)
Held by Trustee During
Past 5 Years |
| Independent Trustees | | | | | | | | |
Bruce L. Crockett — 1944 Trustee and Chair | | 2003 | | Chairman, Crockett Technologies Associates (technology consulting company) Formerly: Director, Captaris (unified messaging provider); Director, President and Chief Executive Officer, COMSAT Corporation; Chairman, Board of Governors of INTELSAT (international communications company); ACE Limited (insurance company); Independent Directors Council and Investment Company Institute: Member of the Audit Committee, Investment Company Institute; Member of the Executive Committee and Chair of the Governance Committee, Independent Directors Council | | 144 | | Director and Chairman of the Audit Committee, ALPS (Attorneys Liability Protection Society) (insurance company); Director and Member of the Audit Committee, Ferroglobe PLC (metallurgical company) |
David C. Arch — 1945 Trustee | | 2010 | | Chairman of Blistex Inc. (consumer health care products manufacturer); Member, World Presidents’ Organization | | 144 | | Board member of the Illinois Manufacturers’ Association |
James T. Bunch — 1942 Trustee | | 2000 | | Managing Member, Grumman Hill Group LLC (family office/private equity investments) Formerly: Chairman of the Board, Denver Film Society; Chairman of the Board of Trustees, Evans Scholarship Foundation; Chairman, Board of Governors, Western Golf Association | | 144 | | Trustee, Evans Scholarship Foundation |
Jack M. Fields — 1952 Trustee | | 2003 | | Chief Executive Officer, Twenty First Century Group, Inc. (government affairs company); and Discovery Learning Alliance (non-profit) Formerly: Owner and Chief Executive Officer, Dos Angeles Ranch L.P. (cattle, hunting, corporate entertainment); Director, Insperity, Inc. (formerly known as Administaff); Chief Executive Officer, Texana Timber LP (sustainable forestry company); Director of Cross Timbers Quail Research Ranch (non-profit); and member of the U.S. House of Representatives | | 144 | | None |
Cynthia Hostetler — 1962 Trustee | | 2017 | | Non-Executive Director and Trustee of a number of public and private business corporations Formerly: Head of Investment Funds and Private Equity, Overseas Private Investment Corporation; President, First Manhattan Bancorporation, Inc.; Attorney, Simpson Thacher & Bartlett LLP | | 144 | | Vulcan Materials Company (construction materials company); Trilinc Global Impact Fund; Aberdeen Investment Funds (4 portfolios); Artio Global Investment LLC (mutual fund complex); Edgen Group, Inc. (specialized energy and infrastructure products distributor) |
Eli Jones — 1961 Trustee | | 2016 | | Professor and Dean, Mays Business School—Texas A&M University Formerly: Professor and Dean, Walton College of Business, University of Arkansas and E.J. Ourso College of Business, Louisiana State University; Director, Arvest Bank | | 144 | | Insperity, Inc. (formerly known as Administaff) (human resources provider) |
Prema Mathai-Davis — 1950 Trustee | | 2003 | | Retired. Formerly: Chief Executive Officer, YWCA of the U.S.A. | | 144 | | None |
Teresa M. Ressel — 1962 Trustee | | 2017 | | Non-Executive Director and Trustee of a number of public and private business corporations Formerly: Chief Financial Officer, Olayan America, The Olayan Group (international investor/commercial/industrial); Chief Executive Officer, UBS Securities LLC; Group Chief Operating Officer, Americas, UBS AG; Assistant Secretary for Management & Budget and CFO, US Department of the Treasury; Chief Compliance Officer, Kaiser Permanente; Program Manager, Hewlett-Packard; Nuclear Engineering, General Dynamics Corporation | | 144 | | Atlantic Power Corporation (power generation company); ON Semiconductor Corp. (semiconductor supplier) |
Larry Soll — 1942 Trustee | | 1997 | | Retired. Formerly: Chairman, Chief Executive Officer and President, Synergen Corp. (a biotechnology company) | | 144 | | None |
Ann Barnett Stern — 1957 Trustee | | 2017 | | President and Chief Executive Officer, Houston Endowment Inc. (private philanthropic institution) Formerly: Executive Vice President and General Counsel, Texas Children’s Hospital; Attorney, Beck, Redden and Secrest, LLP; Business Law Instructor, University of St. Thomas; Attorney, Andrews & Kurth LLP | | 144 | | Federal Reserve Bank of Dallas |
Raymond Stickel, Jr. — 1944 Trustee | | 2005 | | Retired. Formerly: Director, Mainstay VP Series Funds, Inc. (25 portfolios); Partner, Deloitte & Touche | | 144 | | None |
Robert C. Troccoli — 1949 Trustee | | 2016 | | Adjunct Professor, University of Denver – Daniels College of Business Formerly: Senior Partner, KPMG LLP | | 144 | | None |
Christopher L. Wilson — 1957 Trustee | | 2017 | | Managing Partner, CT2, LLC (investing and consulting firm) Formerly: President/Chief Executive Officer, Columbia Funds, Bank of America Corporation; President/Chief Executive Officer, CDC IXIS Asset Management Services, Inc.; Principal & Director of Operations, Scudder Funds, Scudder, Stevens & Clark, Inc.; Assistant Vice President, Fidelity Investments | | 144 | | TD Asset Management USA Inc. (mutual fund complex) (22 portfolios); ISO New England, Inc. (non-profit organization managing regional electricity market) |
T-2 Invesco Mid Cap Growth Fund
Trustees and Officers—(continued)
| | | | | | | | |
Name, Year of Birth and
Position(s) Held with the Trust | | Trustee and/
or Officer Since | | Principal Occupation(s)
During Past 5 Years | | Number of
Funds in Fund
Complex
Overseen by
Trustee | | Other Directorship(s)
Held by Trustee During
Past 5 Years |
| Other Officers | | | | | | | | |
Sheri Morris — 1964 President, Principal Executive Officer and Treasurer | | 2003 | | President, Principal Executive Officer and Treasurer, The Invesco Funds; Vice President, Invesco Advisers, Inc. (formerly known as Invesco Institutional (N.A.), Inc.) (registered investment adviser); and Vice President, PowerShares Exchange-Traded Fund Trust, PowerShares Exchange-Traded Fund Trust II, PowerShares India Exchange-Traded Fund Trust, PowerShares Actively Managed Exchange-Traded Fund Trust and PowerShares Actively Managed Exchange-Traded Commodity Fund Trust Formerly: Vice President and Principal Financial Officer, The Invesco Funds; Vice President, Invesco Aim Advisers, Inc., Invesco Aim Capital Management, Inc. and Invesco Aim Private Asset Management, Inc.; Assistant Vice President and Assistant Treasurer, The Invesco Funds and Assistant Vice President, Invesco Advisers, Inc., Invesco Aim Capital Management, Inc. and Invesco Aim Private Asset Management, Inc.; and Treasurer, PowerShares Exchange-Traded Fund Trust, PowerShares Exchange-Traded Fund Trust II, PowerShares India Exchange-Traded Fund Trust and PowerShares Actively Managed Exchange-Traded Fund Trust | | N/A | | N/A |
Russell C. Burk — 1958 Senior Vice President and Senior Officer | | 2005 | | Senior Vice President and Senior Officer, The Invesco Funds | | N/A | | N/A |
John M. Zerr — 1962 Senior Vice President, Chief Legal Officer and Secretary | | 2006 | | Director, Senior Vice President, Secretary and General Counsel, Invesco Management Group, Inc. (formerly known as Invesco AIM Management Group, Inc.); Senior Vice President, Invesco Advisers, Inc. (formerly known as Invesco Institutional (N.A.), Inc.) (registered investment adviser); Senior Vice President and Secretary, Invesco Distributors, Inc. (formerly known as Invesco AIM Distributors, Inc.); Director, Vice President and Secretary, Invesco Investment Services, Inc. (formerly known as Invesco AIM Investment Services, Inc.) Senior Vice President, Chief Legal Officer and Secretary, The Invesco Funds; Managing Director, Invesco PowerShares Capital Management LLC; Director, Secretary and General Counsel, Invesco Investment Advisers LLC (formerly known as Van Kampen Asset Management); Secretary and General Counsel, Invesco Capital Markets, Inc. (formerly known as Van Kampen Funds Inc.) and Chief Legal Officer, PowerShares Exchange-Traded Fund Trust, PowerShares Exchange-Traded Fund Trust II, PowerShares India Exchange-Traded Fund Trust, PowerShares Actively Managed Exchange-Traded Fund Trust and PowerShares Actively Managed Exchange-Traded Commodity Fund Trust; Manager and Secretary, Invesco Indexing LLC Formerly: Director, Secretary, General Counsel and Senior Vice President, Van Kampen Exchange Corp.; Director, Vice President and Secretary, IVZ Distributors, Inc. (formerly known as INVESCO Distributors, Inc.); Director and Vice President, INVESCO Funds Group, Inc.; Director and Vice President, Van Kampen Advisors Inc.; Director, Vice President, Secretary and General Counsel, Van Kampen Investor Services Inc.; Director, Invesco Distributors, Inc. (formerly known as Invesco AIM Distributors, Inc.); Director, Senior Vice President, General Counsel and Secretary, Invesco AIM Advisers, Inc. and Van Kampen Investments Inc.; Director, Vice President and Secretary, Fund Management Company; Director, Senior Vice President, Secretary, General Counsel and Vice President, Invesco AIM Capital Management, Inc.; Chief Operating Officer and General Counsel, Liberty Ridge Capital, Inc. (an investment adviser); Vice President and Secretary, PBHG Funds (an investment company) and PBHG Insurance Series Fund (an investment company); Chief Operating Officer, General Counsel and Secretary, Old Mutual Investment Partners (a broker-dealer); General Counsel and Secretary, Old Mutual Fund Services (an administrator) and Old Mutual Shareholder Services (a shareholder servicing center); Executive Vice President, General Counsel and Secretary, Old Mutual Capital, Inc. (an investment adviser); and Vice President and Secretary, Old Mutual Advisors Funds (an investment company) | | N/A | | N/A |
Gregory G. McGreevey — 1962 Senior Vice President | | 2012 | | Senior Managing Director, Invesco Ltd.; Director, Chairman, President, and Chief Executive Officer, Invesco Advisers, Inc. (formerly known as Invesco Institutional (N.A.), Inc.) (registered investment adviser); Director, Invesco Mortgage Capital, Inc. and Invesco Senior Secured Management, Inc.; and Senior Vice President, The Invesco Funds Formerly: Assistant Vice President, The Invesco Funds | | N/A | | N/A |
Kelli Gallegos — 1970 Vice President, Principal Financial Officer and Assistant Treasurer | | 2008 | | Vice President, Principal Financial Officer and Assistant Treasurer, The Invesco Funds; Assistant Treasurer, Invesco PowerShares Capital Management LLC, PowerShares Exchange-Traded Fund Trust, PowerShares Exchange-Traded Fund Trust II, PowerShares India Exchange-Traded Fund Trust, PowerShares Actively Managed Exchange-Traded Fund Trust and PowerShares Actively Managed Exchange-Traded Commodity Fund Trust Formerly: Assistant Vice President, The Invesco Funds | | N/A | | N/A |
T-3 Invesco Mid Cap Growth Fund
Trustees and Officers—(continued)
| | | | | | | | |
Name, Year of Birth and
Position(s) Held with the Trust | | Trustee and/
or Officer Since | | Principal Occupation(s)
During Past 5 Years | | Number of
Funds in Fund
Complex
Overseen by
Trustee | | Other Directorship(s)
Held by Trustee During
Past 5 Years |
| Other Officers—(continued) | | | | | | | | |
Tracy Sullivan — 1962 Vice President, Chief Tax Officer and Assistant Treasurer | | 2008 | | Vice President, Chief Tax Officer and Assistant Treasurer, The Invesco Funds; Assistant Treasurer, Invesco PowerShares Capital Management LLC, PowerShares Exchange-Traded Fund Trust, PowerShares Exchange-Traded Fund Trust II, PowerShares India Exchange-Traded Fund Trust, PowerShares Actively Managed Exchange-Traded Fund Trust and PowerShares Actively Managed Exchange-Traded Commodity Fund Trust Formerly: Assistant Vice President, The Invesco Funds | | N/A | | N/A |
Crissie M. Wisdom — 1969 Anti-Money Laundering Compliance Officer | | 2013 | | Anti-Money Laundering Compliance Officer, Invesco Advisers, Inc. (formerly known as Invesco Institutional (N.A.), Inc.) (registered investment adviser), Invesco Capital Markets, Inc. (formerly known as Van Kampen Funds Inc.), Invesco Distributors, Inc., Invesco Investment Services, Inc., Invesco Management Group, Inc., The Invesco Funds, and PowerShares Exchange-Traded Fund Trust, PowerShares Exchange-Traded Fund Trust II, PowerShares India Exchange-Traded Fund Trust, PowerShares Actively Managed Exchange-Traded Fund Trust and PowerShares Actively Managed Exchange-Traded Commodity Fund Trust; Anti-Money Laundering Compliance Officer and Bank Secrecy Act Officer, INVESCO National Trust Company and Invesco Trust Company; and Fraud Prevention Manager and Controls and Risk Analysis Manager for Invesco Investment Services, Inc. Formerly: Anti-Money Laundering Compliance Officer, Van Kampen Exchange Corp. | | N/A | | N/A |
Robert R. Leveille — 1969 Chief Compliance Officer | | 2016 | | Chief Compliance Officer, Invesco Advisers, Inc. (registered investment adviser); and Chief Compliance Officer, The Invesco Funds Formerly: Chief Compliance Officer, Putnam Investments and the Putnam Funds | | N/A | | N/A |
The Statement of Additional Information of the Trust includes additional information about the Fund’s Trustees and is available upon request, without charge, by calling 1.800.959.4246. Please refer to the Fund’s Statement of Additional Information for information on the Fund’s sub-advisers.
| | | | | | | | | | |
Office of the Fund 11 Greenway Plaza, Suite 1000 Houston, TX 77046-1173 | | Investment Adviser Invesco Advisers, Inc. 1555 Peachtree Street, N.E. Atlanta, GA 30309 | |
| Distributor
Invesco Distributors, Inc. 11 Greenway Plaza, Suite 1000 Houston, TX 77046-1173 |
| |
| Auditors
PricewaterhouseCoopers LLP 1000 Louisiana Street, Suite 5800 Houston, TX 77002-5678 |
|
| | | |
| | | | | | | | | | |
Counsel to the Fund Stradley Ronon Stevens & Young, LLP 2005 Market Street, Suite 2600 Philadelphia, PA 19103-7018 | | Counsel to the Independent Trustees Goodwin Procter LLP 901 New York Avenue, N.W. Washington, D.C. 20001 | |
| Transfer Agent
Invesco Investment Services, Inc. 11 Greenway Plaza, Suite 1000 Houston, TX 77046-1173 |
| |
| Custodian
State Street Bank and Trust Company 225 Franklin Street Boston, MA 02110-2801 |
|
T-4 Invesco Mid Cap Growth Fund
Explore High-Conviction Investing with Invesco

Go paperless with eDelivery
Visit invesco.com/edelivery to enjoy the convenience and security of anytime electronic access to your investment documents.
With eDelivery, you can elect to have any or all of the following materials delivered straight to your inbox to download, save and print from your own computer:
∎ Fund reports and prospectuses
∎ Quarterly statements
∎ Daily confirmations
∎ Tax forms
Invesco mailing information
Send general correspondence to Invesco Investment Services, Inc., P.O. Box 219078, Kansas City, MO 64121-9078.
Important notice regarding delivery of security holder documents
To reduce Fund expenses, only one copy of most shareholder documents may be mailed to shareholders with multiple accounts at the same address (Householding). Mailing of your shareholder documents may be householded indefinitely unless you instruct us otherwise. If you do not want the mailing of these documents to be combined with those for other members of your household, please contact Invesco Investment Services, Inc. at 800 959 4246 or contact your financial institution. We will begin sending you individual copies for each account within 30 days after receiving your request.
Fund holdings and proxy voting information
The Fund provides a complete list of its holdings four times in each fiscal year, at the quarter ends. For the second and fourth quarters, the lists appear in the Fund’s semiannual and annual reports to shareholders. For the first and third quarters, the Fund files the lists with the Securities and Exchange Commission (SEC) on Form N-Q. The most recent list of portfolio holdings is available at invesco.com/completeqtrholdings. Shareholders can also look up the Fund’s Forms N-Q on the SEC website at sec.gov. Copies of the Fund’s Forms N-Q may be reviewed and copied at the SEC Public Reference Room in Washington, D.C. You can obtain information on the operation of the Public Reference Room, including information about duplicating fee charges, by calling 202 551 8090 or 800 732 0330, or by electronic request at the following email address: publicinfo@sec.gov.
The SEC file numbers for the Fund are shown below.
A description of the policies and procedures that the Fund uses to determine how to vote proxies relating to portfolio securities is available without charge, upon request, from our Client Services department at 800 959 4246 or at invesco.com/proxyguidelines. The information is also available on the SEC website, sec.gov.
| | | | |
Information regarding how the Fund voted proxies related to its portfolio securities during the most recent 12-month period ended June 30 is available at invesco.com/proxysearch. The information is also available on the SEC website, sec.gov. Invesco Advisers, Inc. is an investment adviser; it provides investment advisory services to individual and institutional clients and does not sell securities. Invesco Distributors, Inc. is the US distributor for Invesco Ltd.’s retail mutual funds, exchange-traded funds and institutional money market funds. Both are wholly owned, indirect subsidiaries of Invesco Ltd. | |  | | |
SEC file numbers: 811-03826 and 002-85905 Invesco Distributors, Inc. VK-MCG-AR-1 06122017 0953
| | | | |
| | |
 | | Annual Report to Shareholders | | April 30, 2017 |
| | |
| | Invesco Small Cap Value Fund |
| | Nasdaq: |
| | A: VSCAX ∎ B: VSMBX ∎ C: VSMCX ∎ Y: VSMIX ∎ R6: SMVSX |

Letters to Shareholders
| | | | |

Philip Taylor | | | | Dear Shareholders: This annual report includes information about your Fund, including performance data and a complete list of its investments as of the close of the reporting period. Inside is a discussion of how your Fund was managed and the factors that affected its performance during the reporting period. The reporting period began with stock market volatility in the US and abroad, largely the result of uncertainty about global economic growth and monetary policy. Markets declined sharply following UK voters’ decision in June to leave the European Union. Relatively quickly, however, markets recovered, reaching record highs later in the summer. Demand was strong for income-producing investments, particularly those perceived to be lower risk; this benefited bonds as well as dividend-paying stocks for much of the reporting period. While economic news in the US was generally positive during the reporting period, news overseas was less upbeat. The European |
Central Bank and central banks in China and Japan – as well as other countries – maintained extraordinarily accommodative monetary policies in response to economic weakness. After months of uncertainty, the outcome of the US presidential election in November triggered a major stock market rally, with most market indexes repeatedly reaching new highs through February. As expected, the US Federal Reserve (the Fed) raised interest rates in December 2016 and again in March 2017. In its March statement, the Fed noted that the labor market has strengthened and economic activity has expanded at a moderate pace – and that it expects those trends to continue.
Short-term market volatility can prompt some investors to abandon their investment plans – and can cause others to settle for whatever returns the market has to offer. The investment professionals at Invesco, in contrast, invest with high conviction. This means that, no matter the asset class or the strategy, each investment team has a passion to exceed. We want to help investors achieve better outcomes, such as seeking higher returns, helping mitigate risk and generating income. Of course, investing with high conviction can’t guarantee a profit or ensure success; no investment strategy can. To learn more about how we invest with high conviction, visit invesco.com/HighConviction.
You, too, can invest with high conviction by maintaining a long-term investment perspective and by working with your financial adviser on a regular basis. During periods of short-term market volatility or uncertainty, your financial adviser can keep you focused on your long-term investment goals – a new home, a child’s college education or a secure retirement. He or she also can share research about the economy, the markets and individual investment options.
Visit our website for more information on your investments
Our website, invesco.com/us, offers a wide range of market insights and investment perspectives. On the website, you’ll find detailed information about our funds, including performance, holdings and portfolio manager commentaries. You can access information about your account by completing a simple, secure online registration. To do so, select “Log In” on the right side of the homepage, and then select “Register for Individual Account Access.”
In addition to the resources accessible on our website and through our mobile app, you can obtain timely updates to help you stay informed about the markets, the economy and investing by connecting with Invesco on Twitter, LinkedIn or Facebook. You can access our blog at blog.invesco.us.com. Our goal is to provide you the information you want, when and where you want it.
Finally, I’m pleased to share with you Invesco’s commitment to both the Principles for Responsible Investment and to considering environmental, social and governance issues in our robust investment process. I invite you to learn more at invesco.com/esg.
Have questions?
For questions about your account, contact an Invesco client services representative at 800 959 4246. For Invesco-related questions or comments, please email me directly at phil@invesco.com.
All of us at Invesco look forward to serving your investment management needs. Thank you for investing with us.
Sincerely,

Philip Taylor
Senior Managing Director, Invesco Ltd.
2 Invesco Small Cap Value Fund
| | | | |

Bruce Crockett | | | | Dear Fellow Shareholders: Among the many important lessons I’ve learned in more than 40 years in a variety of business endeavors is the value of a trusted advocate. As independent chair of the Invesco Funds Board, I can assure you that the members of the Board are strong advocates for the interests of investors in Invesco’s mutual funds. We work hard to represent your interests through oversight of the quality of the investment management services your funds receive and other matters important to your investment, including but not limited to: ∎ Ensuring that Invesco offers a diverse lineup of mutual funds that your financial adviser can use to strive to meet your financial needs as your investment goals change over time. ∎ Monitoring how the portfolio management teams of the Invesco funds are performing in light of changing economic and market conditions. |
| ∎ | | Assessing each portfolio management team’s investment performance within the context of the investment strategy described in the fund’s prospectus. |
| ∎ | | Monitoring for potential conflicts of interests that may impact the nature of the services that your funds receive. |
We believe one of the most important services we provide our fund shareholders is the annual review of the funds’ advisory and sub-advisory contracts with Invesco Advisers and its affiliates. This review is required by the Investment Company Act of 1940 and focuses on the nature and quality of the services Invesco provides as the adviser to the Invesco funds and the reasonableness of the fees that it charges for those services. Each year, we spend months carefully reviewing information received from Invesco and a variety of independent sources, such as performance and fee data prepared by Lipper, Inc. (a subsidiary of Broadridge Financial Solutions, Inc.), an independent, third-party firm widely recognized as a leader in its field. We also meet with our independent legal counsel and other independent advisers to review and help us assess the information that we have received. Our goal is to assure that you receive quality investment management services for a reasonable fee.
I trust the measures outlined above provide assurance that you have a worthy advocate when it comes to choosing the Invesco Funds.
As always, please contact me at bruce@brucecrockett.com with any questions or concerns you may have. On behalf of the Board, we look forward to continuing to represent your interests and serving your needs.
Sincerely,

Bruce L. Crockett
Independent Chair
Invesco Funds Board of Trustees
3 Invesco Small Cap Value Fund
Management’s Discussion of Fund Performance
| | | | |
Performance summary | |
For the fiscal year ended April 30, 2017, Class A shares of Invesco Small Cap Value Fund (the Fund), at net asset value (NAV), underperformed the Russell 2000 Value Index, the Fund’s style-specific benchmark. Your Fund’s long-term performance appears later in this report. | |
Fund vs. Indexes | |
Total returns, 4/30/16 to 4/30/17, at net asset value (NAV). Performance shown does not include applicable contingent deferred sales charges (CDSC) or front-end sales charges, which would have reduced performance. | |
Class A Shares | | | 22.14 | % |
Class B Shares | | | 21.20 | |
Class C Shares | | | 21.31 | |
Class Y Shares | | | 22.45 | |
Class R6 Shares* | | | 22.23 | |
S&P 500 Index▼ (Broad Market Index) | | | 17.92 | |
Russell 2000 Value Index▼ (Style-Specific Index) | | | 27.18 | |
| Lipper Small-Cap Value Funds Index∎ (Peer Group Index) | | | 22.91 | |
| |
Source(s): ▼FactSet Research Systems Inc.; ∎Lipper Inc. *Class R6 shares incepted on February 7, 2017. See page 7 for more information. | | | | |
Market conditions and your Fund
During the fiscal year ended April 30, 2017, the US economy continued to expand and strengthen, with unemployment declining and inflation ticking upward. Signs of an improving economy prompted the US Federal Reserve (the Fed) to raise interest rates in December 2016 and again in March 2017. Major US stock market indexes posted gains for the reporting period, with most hitting record highs following the US presidential election. Investors seemed to believe that the new administration’s plans to reduce tax rates, scale back regulations and increase infrastructure spending had the potential to stimulate economic growth.
While US and overseas stock markets were jolted by the UK’s decision in June 2016 to leave the European Union, markets recovered relatively quickly. During the second half of 2016, small-cap stocks led the US market while large-cap stocks lagged – but that reversed in the first quarter of 2017. Near the close of the fiscal year, headlines out of Washington, DC, suggested that enacting significant
regulatory and tax reform might be more difficult than previously anticipated, which had a slightly negative impact on investor sentiment. For the reporting period as a whole, information technology and financials were the strongest-performing sectors, while telecommunication services and energy were the weakest-performing sectors in the US markets.
During the fiscal year, we continued to use our intrinsic value strategy, seeking to create wealth by maintaining a long-term investment horizon and investing in companies selling at a significant discount to our estimate of their intrinsic value. We believe intrinsic value represents the fair economic worth of a business. Since our application of this strategy is highly disciplined and relatively unique, it is important to understand the benefits and limitations of our process. First, the investment strategy is intended to preserve capital while growing it at above-market rates over the long term. Second, our investments have little in common with popular stock market indexes and most of our peers. And third, the Fund’s short-term relative performance will
naturally be different from stock market indexes and peers and have little information value since we typically structure the portfolio significantly differently than these benchmarks.
Drivers of Fund performance were mainly stock-specific during the reporting period. Financial services companies LPL Financial, SLM and E*TRADE Financial were among the largest contributors to overall Fund performance. Shares of these companies rose along with the financials sector in general during the fiscal year. Industrials sector holding Meritor was also a top contributor to Fund performance. Meritor is a leading equipment supplier to industrial trucking original equipment manufacturers worldwide. Shares of Meritor rose because the company made progress on achieving its long-term targets and because evidence suggested the heavy trucking cycle had bottomed.
Consumer discretionary holding MDC Partners was the largest detractor from the Fund’s performance relative to its style-specific benchmark. Shares of the marketing services company fell after it reported disappointing financial results and lowered its sales outlook. Oil services company Weatherford International was also a significant detractor from the Fund’s relative results. Shares of the company declined after missing expectations for free cash flow during the fiscal year. Within the financials sector, AmTrust Financial Services was also a large detractor from Fund performance. AmTrust’s stock price declined after a new auditor asked the company to restate historical financials and it reported a charge to increase its liability for future insurance claims. We believe investors overreacted to these issues and, therefore, added to our position in this stock.
We believe the single most important indicator of how the Fund is positioned for potential future success is not our recent investment results nor popular
| | |
Portfolio Composition |
By sector | | % of total net assets |
| | | | | |
| |
Financials | | | | 32.6 | % |
Industrials | | | | 18.5 | |
Consumer Discretionary | | | | 14.5 | |
Health Care | | | | 11.0 | |
Information Technology | | | | 7.4 | |
Materials | | | | 7.0 | |
Energy | | | | 3.8 | |
Real Estate | | | | 2.9 | |
Money Market Funds Plus Other Assets Less Liabilities | | | | 2.3 | |
| | | | | |
| Top 10 Equity Holdings* |
| | | | % of total net assets | |
| | | | |
| | |
1. | | AECOM | | 3.5% |
2. | | Affiliated Managers Group, Inc. | | 3.3 |
3. | | SLM Corp. | | 3.3 |
4. | | LPL Financial Holdings, Inc. | | 3.2 |
5. | | Dana Inc. | | 3.1 |
6. | | AmTrust Financial Services, Inc. | | 3.0 |
7. | | E*TRADE Financial Corp. | | 3.0 |
8. | | Carpenter Technology Corp. | | 3.0 |
9. | | Realogy Holdings Corp. | | 3.0 |
10. | | ManpowerGroup Inc. | | 2.9 |
| | | | | |
Total Net Assets | | $2.6 billion |
| | | | | |
| |
Total Number of Holdings* | | | | 66 | |
The Fund’s holdings are subject to change, and there is no assurance that the Fund will continue to hold any particular security.
*Excluding money market fund holdings.
Data presented here are as of April 30, 2017.
4 Invesco Small Cap Value Fund
statistical measures, but rather the difference between current market price and the Fund’s estimated intrinsic value – the aggregate business value of the portfolio based on our estimate of intrinsic value for each individual holding.
At the end of the fiscal year, the difference between the market price and the estimated intrinsic value of the Fund remained attractive, according to our estimation. While there is no assurance that market value will ever reflect our estimate of the Fund’s intrinsic value, we believe the gap between price and estimated intrinsic value may provide above-average capital appreciation. We will continue to work hard to protect and grow the Fund’s estimated intrinsic value.
We thank you for your investment and for sharing our long-term investment perspective.
The views and opinions expressed in management’s discussion of Fund performance are those of Invesco Advisers, Inc. These views and opinions are subject to change at any time based on factors such as market and economic conditions. These views and opinions may not be relied upon as investment advice or recommendations, or as an offer for a particular security. The information is not a complete analysis of every aspect of any market, country, industry, security or the Fund. Statements of fact are from sources considered reliable, but Invesco Advisers, Inc. makes no representation or warranty as to their completeness or accuracy. Although historical performance is no guarantee of future results, these insights may help you understand our investment management philosophy.
See important Fund and, if applicable, index disclosures later in this report.
| | |
 | | R. Canon Coleman II Chartered Financial Analyst, Portfolio Manager, is lead manager of Invesco Small Cap Value |
| Fund. He joined Invesco in 1999. Mr. Coleman earned a BS and an MS in accounting from the University of Florida. He also earned an MBA from the Wharton School of the University of Pennsylvania. |
| | |
 | | Jonathan Edwards Chartered Financial Analyst, Portfolio Manager, is manager of Invesco Small Cap Value Fund. He |
| joined Invesco in 2001. Mr. Edwards earned a BS in economics from Texas A&M University and an MBA from The University of Texas at Austin. |
| | |
 | | Jonathan Mueller Chartered Financial Analyst, Portfolio Manager, is manager of Invesco Small Cap Value Fund. He |
| joined Invesco in 2001. Mr. Mueller earned a BBA in accounting from Texas Christian University and an MBA in finance from The University of Texas at Austin. He is also a Certified Public Accountant. |
5 Invesco Small Cap Value Fund
Your Fund’s Long-Term Performance
Results of a $10,000 Investment – Oldest Share Class(es)
Fund and index data from 4/30/07
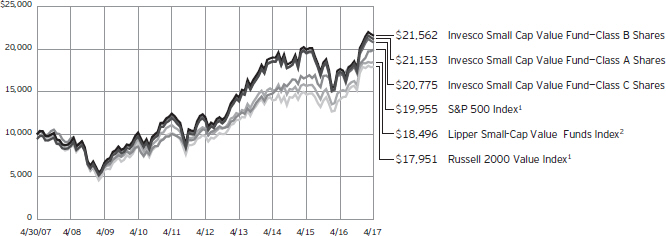
| 1 | Source: FactSet Research Systems Inc. |
Past performance cannot guarantee comparable future results.
The data shown in the chart include reinvested distributions, applicable sales charges and Fund expenses including management fees. Results for Class B shares are calculated as if a hypothetical
shareholder had liquidated his entire investment in the Fund at the close of the reporting period and paid the contingent deferred sales charges, if applicable. Index results include reinvested dividends, but they do not reflect sales charges. Performance of the peer group,
if applicable, reflects fund expenses and management fees; performance of a market index does not. Performance shown in the chart and table(s) does not reflect deduction of taxes a shareholder would pay on Fund distributions or sale of Fund shares.
continued from page 8
| | sector or group of related industries. In this event, the Fund’s performance will depend to a greater extent on the overall condition of the sector or group of industries and there is increased risk that the Fund will lose significant value if conditions adversely affect that sector or group of industries. |
| ∎ | | Small- and mid-capitalization companies risks. Small- and mid-capitalization companies tend to be more vulnerable to changing market conditions, may have little or no operating history or track record of success, and may have more limited product lines and markets, less experienced management and fewer financial resources than larger companies. These companies’ securities may be more volatile and less liquid than those of more established companies, and their returns may vary, sometimes significantly, from the over-all securities market. |
| ∎ | | Value investing style risk. A value investing style subjects the Fund to the risk that the valuations never improve or that the returns on value equity securities are less than returns on other styles of investing or the overall stock market. |
About indexes used in this report
| ∎ | | The S&P 500® Index is an unmanaged index considered representative of the US stock market. |
| ∎ | | The Russell 2000® Value Index is an unmanaged index considered representative of small-cap value stocks. The Russell 2000 Value Index is a trademark/service mark of the Frank Russell Co. Russell® is a trademark of the Frank Russell Co. |
| ∎ | | The Lipper Small-Cap Value Funds Index is an unmanaged index considered representative of small-cap value funds tracked by Lipper. |
| ∎ | | The Fund is not managed to track the performance of any particular index, including the index(es) described here, and consequently, the performance of the Fund may deviate significantly from the performance of the index(es). |
| ∎ | | A direct investment cannot be made in an index. Unless otherwise indicated, index results include reinvested dividends, and they do not reflect sales charges. Performance of the peer group, if applicable, reflects fund expenses; performance of a market index does not. |
Other information
| ∎ | | CPA® and Certified Public Accountant® are trademarks owned by the American Institute of Certified Public Accountants. |
| ∎ | | The returns shown in management’s discussion of Fund performance are based on net asset values (NAVs) calculated for shareholder transactions. Generally accepted accounting principles require adjustments to be made to the net assets of the Fund at period end for financial reporting purposes, and as such, the NAVs for shareholder transactions and the returns based on those NAVs may differ from the NAVs and returns reported in the Financial Highlights. |
| ∎ | | Industry classifications used in this report are generally according to the Global Industry Classification Standard, which was developed by and is the exclusive property and a service mark of MSCI Inc. and Standard & Poor’s. |
6 Invesco Small Cap Value Fund
| | | | | |
| Average Annual Total Returns |
As of 4/30/17, including maximum applicable sales charges | |
| |
Class A Shares | | | | | |
Inception (6/21/99) | | | | 10.40 | % |
10 Years | | | | 7.78 | |
5 Years | | | | 11.67 | |
1 Year | | | | 15.44 | |
| |
Class B Shares | | | | | |
Inception (6/21/99) | | | | 10.37 | % |
10 Years | | | | 7.99 | |
5 Years | | | | 11.87 | |
1 Year | | | | 16.20 | |
| |
Class C Shares | | | | | |
Inception (6/21/99) | | | | 9.93 | % |
10 Years | | | | 7.59 | |
5 Years | | | | 12.11 | |
1 Year | | | | 20.31 | |
| |
Class Y Shares | | | | | |
Inception (8/12/05) | | | | 10.14 | % |
10 Years | | | | 8.66 | |
5 Years | | | | 13.22 | |
1 Year | | | | 22.45 | |
| |
Class R6 Shares | | | | | |
10 Years | | | | 8.40 | |
5 Years | | | | 12.96 | |
1 Year | | | | 22.23 | |
Effective June 1, 2010, Class A, Class B, Class C and Class I shares of the predecessor fund, Van Kampen Small Cap Value Fund, advised by Van Kampen Asset Management were reorganized into Class A, Class B, Class C and Class Y shares, respectively, of Invesco Van Kampen Small Cap Value Fund (renamed Invesco Small Cap Value Fund). Returns shown above, prior to June 1, 2010, for Class A, Class B, Class C and Class Y shares are blended returns of the predecessor fund and Invesco Small Cap Value Fund. Share class returns will differ from the predecessor fund because of different expenses.
Class R6 shares incepted on February 7, 2017. Performance shown prior to that date is that of the Fund’s and the predecessor fund’s Class A shares and includes the 12b-1 fees applicable to Class A shares.
The performance data quoted represent past performance and cannot guarantee comparable future results; current performance may be lower or higher. Please visit invesco.com/performance for the most recent month-end performance. Performance figures reflect reinvested distributions, changes
| | | | | |
| Average Annual Total Returns |
As of 3/31/17, the most recent calendar quarter end, including maximum applicable sales charges |
| | | | | |
| |
Class A Shares | | | | | |
Inception (6/21/99) | | | | 10.50 | % |
10 Years | | | | 8.17 | |
5 Years | | | | 11.21 | |
1 Year | | | | 17.76 | |
| |
Class B Shares | | | | | |
Inception (6/21/99) | | | | 10.48 | % �� |
10 Years | | | | 8.37 | |
5 Years | | | | 11.41 | |
1 Year | | | | 18.63 | |
| |
Class C Shares | | | | | |
Inception (6/21/99) | | | | 10.03 | % |
10 Years | | | | 7.97 | |
5 Years | | | | 11.64 | |
1 Year | | | | 22.66 | |
| |
Class Y Shares | | | | | |
Inception (8/12/05) | | | | 10.29 | % |
10 Years | | | | 9.05 | |
5 Years | | | | 12.76 | |
1 Year | | | | 24.89 | |
| |
Class R6 Shares | | | | | |
10 Years | | | | 8.78 | |
5 Years | | | | 12.49 | |
1 Year | | | | 24.64 | |
in net asset value and the effect of the maximum sales charge unless otherwise stated. Investment return and principal value will fluctuate so that you may have a gain or loss when you sell shares.
The total annual Fund operating expense ratio set forth in the most recent Fund prospectus as of the date of this report for Class A, Class B, Class C, Class Y and Class R6 shares was 1.12%, 1.87%, 1.87%, 0.87% and 0.73%, respectively. The expense ratios presented above may vary from the expense ratios presented in other sections of this report that are based on expenses incurred during the period covered by this report.
Class A share performance reflects the maximum 5.50% sales charge, and Class B and Class C share performance reflects the applicable contingent deferred sales charge (CDSC) for the period involved. For shares purchased prior to June 1, 2010, the CDSC on Class B shares declines from 5% at the time of purchase to 0% at the beginning of the sixth year. For shares purchased on or after June 1, 2010, the CDSC on Class B shares declines from
5% at the time of purchase to 0% at the beginning of the seventh year. The CDSC on Class C shares is 1% for the first year after purchase. Class Y and Class R6 shares do not have a front-end sales charge or a CDSC; therefore, performance is at net asset value.
The performance of the Fund’s share classes will differ primarily due to different sales charge structures and class expenses.
Fund performance reflects any applicable fee waivers and/or expense reimbursements. Had the adviser not waived fees and/or reimbursed expenses currently or in the past, returns would have been lower. See current prospectus for more information.
7 Invesco Small Cap Value Fund
Invesco Small Cap Value Fund’s investment objective is long-term growth of capital.
| ∎ | | Unless otherwise stated, information presented in this report is as of April 30, 2017, and is based on total net assets. |
| ∎ | | Unless otherwise noted, all data provided by Invesco. |
| ∎ | | To access your Fund’s reports/prospectus, visit invesco.com/fundreports. |
About share classes
| ∎ | | Class B shares may not be purchased for new or additional investments. Please see the prospectus for more information. |
| ∎ | | Class Y shares are available to only certain investors. Please see the prospectus for more information. |
| ∎ | | Class R6 shares are available for use by retirement plans that meet certain standards and for institutional investors. Class R6 shares are also available through intermediaries that have established an agreement with Invesco Distributors, Inc. to make such shares available for use in retail omnibus accounts. Please see the prospectus for more information. |
Principal risks of investing in the Fund
| ∎ | | Depositary receipts risk. Investing in depositary receipts involves the same risks as direct investments in foreign securities. In addition, the underlying issuers of certain depositary receipts are under no obligation to distribute shareholder communications or pass through any voting rights with respect to the deposited securities to the holders of such receipts. The Fund may therefore receive less timely information or have less control than if it invested directly in the foreign issuer. |
| ∎ | | Derivatives risk. The value of a derivative instrument depends largely on (and is derived from) the value of an underlying security, currency, commodity, interest rate, index or other asset (each referred to as an underlying asset). In addition to risks relating to the underlying assets, the use of derivatives may include other, possibly greater, risks, including counterparty, leverage and liquidity risks. Counterparty risk is the risk that the counterparty to the derivative contract will default on its obligation to pay the Fund the amount owed or otherwise perform under the derivative contract. Derivatives create leverage risk because they do not require payment up front equal to the economic exposure created by owning the derivative. As a result, an adverse change in the value of |
| | the underlying asset could result in the Fund sustaining a loss that is substantially greater than the amount invested in the derivative, which may make the Fund’s returns more volatile and increase the risk of loss. Derivative instruments may also be less liquid than more traditional investments and the Fund may be unable to sell or close out its derivative positions at a desirable time or price. This risk may be more acute under adverse market conditions, during which the Fund may be most in need of liquidating its derivative positions. Derivatives may also be harder to value, less tax efficient and subject to changing government regulation that could impact the Fund’s ability to use certain derivatives or their cost. Also, derivatives used for hedging or to gain or limit exposure to a particular market segment may not provide the expected benefits, particularly during adverse market conditions. |
| ∎ | | Emerging markets securities risk. Emerging markets (also referred to as developing markets) are generally subject to greater market volatility, political, social and economic instability, uncertain trading markets and more governmental limitations on foreign investment than more developed markets. In addition, companies operating in emerging markets may be subject to lower trading volume and greater price fluctuations than companies in more developed markets. Securities law and the enforcement of systems of taxation in many emerging market countries may change quickly and unpredictably. In addition, investments in emerging markets securities may also be subject to additional transaction costs, delays in settlement procedures, and lack of timely information. |
| ∎ | | Foreign securities risk. The Fund’s foreign investments may be adversely affected by political and social instability, changes in economic or taxation policies, difficulty in enforcing obligations, decreased liquidity or increased volatility. Foreign investments also involve the risk of the possible seizure, nationalization or expropriation of the issuer or foreign deposits (in which the Fund could lose its entire investments in |
This report must be accompanied or preceded by a currently effective Fund prospectus, which contains more complete information, including sales charges and expenses. Investors should read it carefully before investing.
NOT FDIC INSURED | MAY LOSE VALUE | NO BANK GUARANTEE
| | | a certain market) and the possible adoption of foreign governmental restrictions such as exchange controls. Unless the Fund has hedged its foreign securities risk, foreign securities risk also involves the risk of negative foreign currency rate fluctuations, which may cause the value of securities denominated in such foreign currency (or other instruments through which the Fund has exposure to foreign currencies) to decline in value. Currency exchange rates may fluctuate significantly over short periods of time. Currency hedging strategies, if used, are not always successful. |
| ∎ | | Management risk. The Fund is actively managed and depends heavily on the Adviser’s judgment about markets, interest rates or the attractiveness, relative values, liquidity, or potential appreciation of particular investments made for the Fund’s portfolio. The Fund could experience losses if these judgments prove to be incorrect. Additionally, legislative, regulatory, or tax developments may adversely affect management of the Fund and, therefore, the ability of the Fund to achieve its investment objective. |
| ∎ | | Market risk. The market values of the Fund’s investments, and therefore the value of the Fund’s shares, will go up and down, sometimes rapidly or unpredictably. Market risk may affect a single issuer, industry or section of the economy, or it may affect the market as a whole. Individual stock prices tend to go up and down more dramatically than those of certain other types of investments, such as bonds. During a general downturn in the financial markets, multiple asset classes may decline in value. When markets perform well, there can be no assurance that specific investments held by the Fund will rise in value. |
| ∎ | | Real estate investment trust (REIT) risk/real estate risk. Investments in real estate related instruments may be affected by economic, legal, cultural, environmental or technological factors that affect property values, rents or occupancies of real estate related to the Fund’s holdings. Shares of real estate related companies, which tend to be small- and mid-cap companies, may be more volatile and less liquid. |
| ∎ | | Sector focus risk. The Fund may from time to time invest a significant amount of its assets (i.e. over 25%) in one market |
continued on page 6
8 Invesco Small Cap Value Fund
Schedule of Investments(a)
April 30, 2017
| | | | | | | | |
| | | Shares | | | Value | |
Common Stocks–97.73% | |
| Advertising–1.54% | |
MDC Partners Inc.–Class A(b) | | | 4,547,879 | | | $ | 40,703,517 | |
|
| Agricultural & Farm Machinery–0.37% | |
AGCO Corp. | | | 152,094 | | | | 9,732,495 | |
|
| Asset Management & Custody Banks–4.41% | |
Affiliated Managers Group, Inc. | | | 529,100 | | | | 87,613,669 | |
SEI Investments Co. | | | 569,200 | | | | 28,864,132 | |
| | | | | | | | 116,477,801 | |
|
| Auto Parts & Equipment–4.01% | |
Dana Inc. | | | 4,265,835 | | | | 82,842,516 | |
Modine Manufacturing Co.(c) | | | 1,909,333 | | | | 23,102,929 | |
| | | | | | | | 105,945,445 | |
|
| Automobile Manufacturers–1.17% | |
Winnebago Industries, Inc. | | | 1,082,459 | | | | 31,066,573 | |
|
| Building Products–1.41% | |
Builders FirstSource, Inc.(c) | | | 1,048,917 | | | | 16,793,161 | |
Ply Gem Holdings Inc.(c) | | | 1,058,860 | | | | 20,383,055 | |
| | | | | | | | 37,176,216 | |
|
| Construction & Engineering–3.45% | |
AECOM(c) | | | 2,666,699 | | | | 91,227,773 | |
|
| Construction Machinery & Heavy Trucks–2.78% | |
Meritor, Inc.(c) | | | 3,381,898 | | | | 60,231,603 | |
Terex Corp. | | | 381,700 | | | | 13,351,866 | |
| | | | | | | | 73,583,469 | |
|
| Consumer Finance–4.90% | |
SLM Corp.(c) | | | 6,928,900 | | | | 86,888,406 | |
Synchrony Financial | | | 1,531,800 | | | | 42,584,040 | |
| | | | | | | | 129,472,446 | |
|
| Diversified Metals & Mining–0.44% | |
Ferroglobe PLC | | | 1,203,948 | | | | 11,618,098 | |
Ferroglobe Representation & Warranty Insurance Trust(c) | | | 1,203,948 | | | | 0 | |
| | | | | | | | 11,618,098 | |
|
| Electronic Components–3.76% | |
Belden Inc. | | | 875,368 | | | | 61,013,150 | |
Vishay Intertechnology, Inc. | | | 2,351,900 | | | | 38,453,565 | |
| | | | | | | | 99,466,715 | |
|
| Electronic Equipment & Instruments–2.08% | |
FLIR Systems, Inc. | | | 1,498,159 | | | | 55,027,380 | |
|
| Electronic Manufacturing Services–0.64% | |
Flex Ltd.(c) | | | 1,094,839 | | | | 16,926,211 | |
|
| Environmental & Facilities Services–0.48% | |
Team, Inc.(c) | | | 471,709 | | | | 12,688,972 | |
| | | | | | | | |
| | | Shares | | | Value | |
| Health Care Distributors–2.60% | |
Cardinal Health, Inc. | | | 569,800 | | | $ | 41,361,782 | |
McKesson Corp. | | | 198,900 | | | | 27,505,881 | |
| | | | | | | | 68,867,663 | |
|
| Health Care Facilities–5.83% | |
Acadia Healthcare Co., Inc.(c) | | | 1,025,700 | | | | 44,700,006 | |
Brookdale Senior Living Inc.(c) | | | 3,666,503 | | | | 47,627,874 | |
Hanger, Inc.(b)(c) | | | 4,723,233 | | | | 61,827,120 | |
| | | | | | | | 154,155,000 | |
|
| Health Care Supplies–2.54% | |
Alere, Inc.(c) | | | 1,366,987 | | | | 67,214,751 | |
|
| Home Furnishings–0.50% | |
Ethan Allen Interiors Inc. | | | 445,500 | | | | 13,275,900 | |
|
| Homebuilding–2.20% | |
CalAtlantic Group, Inc. | | | 404,100 | | | | 14,636,502 | |
Installed Building Products Inc.(c) | | | 171,579 | | | | 9,153,740 | |
LGI Homes, Inc.(c) | | | 623,518 | | | | 19,846,578 | |
TRI Pointe Group, Inc.(c) | | | 1,172,900 | | | | 14,602,605 | |
| | | | | | | | 58,239,425 | |
|
| Hotels, Resorts & Cruise Lines–2.85% | |
Norwegian Cruise Line Holdings Ltd.(c) | | | 1,396,600 | | | | 75,318,638 | |
|
| Human Resource & Employment Services–5.56% | |
Kelly Services, Inc.–Class A | | | 764,462 | | | | 17,062,792 | |
Kforce Inc.(b) | | | 2,071,490 | | | | 47,022,823 | |
ManpowerGroup Inc. | | | 757,933 | | | | 76,536,074 | |
TrueBlue, Inc.(c) | | | 234,243 | | | | 6,406,546 | |
| | | | | | | | 147,028,235 | |
|
| Industrial Machinery–1.83% | |
Chart Industries, Inc.(c) | | | 78,600 | | | | 2,869,686 | |
ITT Inc. | | | 1,082,800 | | | | 45,618,364 | |
| | | | | | | | 48,488,050 | |
|
| Investment Banking & Brokerage–6.93% | |
E*TRADE Financial Corp.(c) | | | 2,282,400 | | | | 78,856,920 | |
LPL Financial Holdings, Inc. | | | 2,004,819 | | | | 84,282,591 | |
TD Ameritrade Holding Corp. | | | 522,600 | | | | 19,999,902 | |
| | | | | | | | 183,139,413 | |
|
| Leisure Products–2.20% | |
American Outdoor Brands Corp.(c) | | | 2,100,200 | | | | 46,519,430 | |
Sturm, Ruger & Co, Inc. | | | 193,807 | | | | 11,715,633 | |
| | | | | | | | 58,235,063 | |
|
| Life & Health Insurance–1.78% | |
CNO Financial Group, Inc. | | | 2,236,718 | | | | 47,127,648 | |
See accompanying Notes to Financial Statements which are an integral part of the financial statements.
9 Invesco Small Cap Value Fund
| | | | | | | | |
| | | Shares | | | Value | |
| Oil & Gas Equipment & Services–3.78% | |
Forum Energy Technologies Inc.(c) | | | 1,665,500 | | | $ | 28,146,950 | |
Helix Energy Solutions Group Inc.(c) | | | 3,004,500 | | | | 18,387,540 | |
Weatherford International PLC(c) | | | 9,240,909 | | | | 53,320,045 | |
| | | | | | | | 99,854,535 | |
|
| Property & Casualty Insurance–3.04% | |
AmTrust Financial Services, Inc. | | | 5,005,750 | | | | 80,342,288 | |
|
| Real Estate Services–2.95% | |
Realogy Holdings Corp. | | | 2,554,696 | | | | 78,045,963 | |
|
| Regional Banks–5.01% | |
First Horizon National Corp. | | | 2,447,367 | | | | 44,909,184 | |
SVB Financial Group(c) | | | 355,900 | | | | 62,617,046 | |
Zions Bancorp. | | | 620,300 | | | | 24,830,609 | |
| | | | | | | | 132,356,839 | |
|
| Reinsurance–1.44% | |
Reinsurance Group of America, Inc. | | | 304,094 | | | | 38,023,914 | |
|
| Research & Consulting Services–1.69% | |
Huron Consulting Group Inc.(c) | | | 49,755 | | | | 2,214,098 | |
Navigant Consulting, Inc.(c) | | | 1,062,053 | | | | 25,457,410 | |
Resources Connection Inc. | | | 1,215,948 | | | | 16,901,677 | |
| | | | | | | | 44,573,185 | |
|
| Semiconductors–0.97% | |
ON Semiconductor Corp.(c) | | | 1,805,300 | | | | 25,599,154 | |
|
| Specialty Chemicals–1.72% | |
Flotek Industries, Inc.(c) | | | 2,380,500 | | | | 28,589,805 | |
Kraton Corp.(c) | | | 514,107 | | | | 16,816,440 | |
| | | | | | | | 45,406,245 | |
| | | | | | | | |
| | | Shares | | | Value | |
| Steel–4.84% | |
Allegheny Technologies, Inc. | | | 2,682,500 | | | $ | 49,223,875 | |
Carpenter Technology Corp. | | | 1,939,078 | | | | 78,726,567 | |
| | | | | | | | 127,950,442 | |
|
| Thrifts & Mortgage Finance–5.14% | |
BofI Holding, Inc.(c) | | | 2,454,412 | | | | 58,635,902 | |
MGIC Investment Corp.(c) | | | 3,391,113 | | | | 35,742,331 | |
Radian Group Inc. | | | 2,459,486 | | | | 41,516,124 | |
| | | | | | | | 135,894,357 | |
|
| Trading Companies & Distributors–0.89% | |
DXP Enterprises, Inc.(c) | | | 644,500 | | | | 23,511,360 | |
Total Common Stocks
(Cost $2,167,052,514) | | | | | | | 2,583,761,179 | |
| | |
Money Market Funds–2.92% | | | | | | | | |
Government & Agency Portfolio–Institutional Class, 0.67%(d) | | | 46,266,913 | | | | 46,266,913 | |
Treasury Portfolio–Institutional Class, 0.63%(d) | | | 30,844,608 | | | | 30,844,608 | |
Total Money Market Funds
(Cost $77,111,521) | | | | | | | 77,111,521 | |
TOTAL INVESTMENTS–100.65%
(Cost $2,244,164,035) | | | | 2,660,872,700 | |
OTHER ASSETS LESS LIABILITIES–(0.65)% | | | | (17,225,069 | ) |
NET ASSETS–100.00% | | | $ | 2,643,647,631 | |
| | | | | | | | |
Notes to Schedule of Investments:
| (a) | Industry and/or sector classifications used in this report are generally according to the Global Industry Classification Standard, which was developed by and is the exclusive property and a service mark of MSCI Inc. and Standard & Poor’s. |
| (b) | Affiliated company during the period. The Investment Company Act of 1940 defines an “affiliated person” as an issuance in which a fund holds 5% or more of the outstanding voting securities. The Fund has not owned enough of the outstanding voting securities of the issuer to have control (as defined in the Investment Company Act of 1940) of that issuer. The aggregate value of these securities as of April 30, 2017 was $149,553,460, which represented 5.66% of the Fund’s Net Assets. See Note 4. |
| (c) | Non-income producing security. |
| (d) | The money market fund and the Fund are affiliated by having the same investment adviser. The rate shown is the 7-day SEC standardized yield as of April 30, 2017. |
See accompanying Notes to Financial Statements which are an integral part of the financial statements.
10 Invesco Small Cap Value Fund
Statement of Assets and Liabilities
April 30, 2017
| | | | |
Assets: | |
Investments, at value (Cost $1,937,593,656) | | $ | 2,434,207,719 | |
Investments in affiliates, at value (Cost $306,570,379) | | | 226,664,981 | |
Total investments, at value (Cost $2,244,164,035) | | | 2,660,872,700 | |
Receivable for: | | | | |
Investments sold | | | 22,999,008 | |
Fund shares sold | | | 3,595,209 | |
Dividends | | | 473,326 | |
Investment for trustee deferred compensation and retirement plans | | | 246,768 | |
Other assets | | | 53,318 | |
Total assets | | | 2,688,240,329 | |
|
Liabilities: | |
Payable for: | | | | |
Investments purchased | | | 23,649,498 | |
Fund shares reacquired | | | 18,792,608 | |
Accrued fees to affiliates | | | 1,679,334 | |
Accrued trustees’ and officers’ fees and benefits | | | 5,227 | |
Accrued other operating expenses | | | 182,013 | |
Trustee deferred compensation and retirement plans | | | 284,018 | |
Total liabilities | | | 44,592,698 | |
Net assets applicable to shares outstanding | | $ | 2,643,647,631 | |
|
Net assets consist of: | |
Shares of beneficial interest | | $ | 2,016,358,757 | |
Undistributed net investment income (loss) | | | (3,928,707 | ) |
Undistributed net realized gain | | | 214,508,916 | |
Net unrealized appreciation | | | 416,708,665 | |
| | | $ | 2,643,647,631 | |
| | | | |
Net Assets: | |
Class A | | $ | 1,094,070,198 | |
Class B | | $ | 8,164,929 | |
Class C | | $ | 95,892,354 | |
Class Y | | $ | 1,445,050,804 | |
Class R6 | | $ | 469,346 | |
|
Shares outstanding, no par value,
with an unlimited number of shares authorized: | |
Class A | | | 56,280,418 | |
Class B | | | 529,592 | |
Class C | | | 6,464,344 | |
Class Y | | | 71,710,328 | |
Class R6 | | | 23,284 | |
Class A: | | | | |
Net asset value per share | | $ | 19.44 | |
Maximum offering price per share | | | | |
(Net asset value of $19.44 ¸ 94.50%) | | $ | 20.57 | |
Class B: | | | | |
Net asset value and offering price per share | | $ | 15.42 | |
Class C: | | | | |
Net asset value and offering price per share | | $ | 14.83 | |
Class Y: | | | | |
Net asset value and offering price per share | | $ | 20.15 | |
Class R6: | | | | |
Net asset value and offering price per share | | $ | 20.16 | |
See accompanying Notes to Financial Statements which are an integral part of the financial statements.
11 Invesco Small Cap Value Fund
Statement of Operations
For the year ended April 30, 2017
| | | | |
Investment income: | |
Dividends (net of foreign withholding taxes of $297,532) | | $ | 22,843,269 | |
Dividends from affiliates | | | 3,266,245 | |
Total investment income | | | 26,109,514 | |
| |
Expenses: | | | | |
Advisory fees | | | 16,885,226 | |
Administrative services fees | | | 512,319 | |
Distribution fees: | | | | |
Class A | | | 3,041,891 | |
Class B | | | 101,727 | |
Class C | | | 993,670 | |
Transfer agent fees — A, B, C and Y | | | 5,035,063 | |
Transfer agent fees — R6 | | | 13 | |
Trustees’ and officers’ fees and benefits | | | 54,695 | |
Registration and filing fees | | | 129,356 | |
Reports to shareholders | | | 308,236 | |
Professional services fees | | | 17,042 | |
Other | | | 15,272 | |
Total expenses | | | 27,094,510 | |
Less: Fees waived and expense offset arrangement(s) | | | (167,291 | ) |
Net expenses | | | 26,927,219 | |
Net investment income (loss) | | | (817,705 | ) |
| |
Realized and unrealized gain from: | | | | |
Net realized gain from investment securities (includes net gains from securities sold to affiliates of $1,905,994) | | | 274,831,166 | |
Change in net unrealized appreciation of investment securities | | | 254,431,859 | |
Net realized and unrealized gain | | | 529,263,025 | |
Net increase in net assets resulting from operations | | $ | 528,445,320 | |
See accompanying Notes to Financial Statements which are an integral part of the financial statements.
12 Invesco Small Cap Value Fund
Statement of Changes in Net Assets
For the years ended April 30, 2017 and 2016
| | | | | | | | |
| | | 2017 | | | 2016 | |
Operations: | | | | | |
Net investment income (loss) | | $ | (817,705 | ) | | $ | 10,034,073 | |
Net realized gain | | | 274,831,166 | | | | 113,416,715 | |
Change in net unrealized appreciation (depreciation) | | | 254,431,859 | | | | (534,397,359 | ) |
Net increase (decrease) in net assets resulting from operations | | | 528,445,320 | | | | (410,946,571 | ) |
| | |
Distributions to shareholders from net investment income: | | | | | | | | |
Class A | | | (2,214,011 | ) | | | (687,810 | ) |
Class Y | | | (5,817,686 | ) | | | (3,335,002 | ) |
Total distributions from net investment income | | | (8,031,697 | ) | | | (4,022,812 | ) |
| | |
Distributions to shareholders from net realized gains: | | | | | | | | |
Class A | | | (21,102,499 | ) | | | (140,503,127 | ) |
Class B | | | (206,650 | ) | | | (1,924,940 | ) |
Class C | | | (2,268,194 | ) | | | (15,046,944 | ) |
Class Y | | | (22,380,567 | ) | | | (137,836,409 | ) |
Total distributions from net realized gains | | | (45,957,910 | ) | | | (295,311,420 | ) |
| | |
Share transactions–net: | | | | | | | | |
Class A | | | (447,285,910 | ) | | | (92,017,771 | ) |
Class B | | | (6,420,721 | ) | | | (5,071,758 | ) |
Class C | | | (28,524,210 | ) | | | (10,410,051 | ) |
Class Y | | | (120,093,107 | ) | | | 49,882,360 | |
Class R6 | | | 464,061 | | | | — | |
Net increase (decrease) in net assets resulting from share transactions | | | (601,859,887 | ) | | | (57,617,220 | ) |
Net increase (decrease) in net assets | | | (127,404,174 | ) | | | (767,898,023 | ) |
| | |
Net assets: | | | | | | | | |
Beginning of year | | | 2,771,051,805 | | | | 3,538,949,828 | |
End of year (includes undistributed net investment income (loss) of $(3,928,707) and $4,920,695, respectively) | | $ | 2,643,647,631 | | | $ | 2,771,051,805 | |
Notes to Financial Statements
April 30, 2017
NOTE 1—Significant Accounting Policies
Invesco Small Cap Value Fund (the “Fund”) is a series portfolio of AIM Sector Funds (Invesco Sector Funds) (the “Trust”). The Trust is a Delaware statutory trust registered under the Investment Company Act of 1940, as amended (the “1940 Act”), as an open-end series management investment company consisting of ten separate portfolios, each authorized to issue an unlimited number of shares of beneficial interest. The assets, liabilities and operations of each portfolio are accounted for separately. Information presented in these financial statements pertains only to the Fund. Matters affecting each portfolio or class will be voted on exclusively by the shareholders of such portfolio or class.
The Fund’s investment objective is long-term growth of capital.
The Fund currently consists of five different classes of shares: Class A, Class B, Class C, Class Y and Class R6. On February 7, 2017, the Fund began offering Class R6 shares. Class Y shares are available only to certain investors. Class A shares are sold with a front-end sales charge unless certain waiver criteria are met and under certain circumstances load waived shares may be subject to contingent deferred sales charges (“CDSC”). Class C shares are sold with a CDSC. Class Y and Class R6 shares are sold at net asset value. Effective November 30, 2010, new or additional investments in Class B shares are no longer permitted. Existing shareholders of Class B shares may continue to reinvest dividends and capital gains distributions in Class B shares until they convert to Class A shares. Also, shareholders in Class B shares will be able to exchange those shares for Class B shares of other Invesco Funds offering such shares until they convert to Class A shares. Generally, Class B shares will automatically convert to Class A shares on or about the month-end, which is at least eight years after the date of purchase. Redemption of Class B shares prior to the conversion date will be subject to a CDSC.
The Fund is an investment company and accordingly follows the investment company accounting and reporting guidance in accordance with Financial Accounting Standards Board Accounting Standards Codification Topic 946, Financial Services — Investment Companies.
13 Invesco Small Cap Value Fund
The following is a summary of the significant accounting policies followed by the Fund in the preparation of its financial statements.
| A. | Security Valuations — Securities, including restricted securities, are valued according to the following policy. |
A security listed or traded on an exchange (except convertible securities) is valued at its last sales price or official closing price as of the close of the customary trading session on the exchange where the security is principally traded, or lacking any sales or official closing price on a particular day, the security may be valued at the closing bid price on that day. Securities traded in the over-the-counter market are valued based on prices furnished by independent pricing services or market makers. When such securities are valued by an independent pricing service they may be considered fair valued. Futures contracts are valued at the final settlement price set by an exchange on which they are principally traded. Listed options are valued at the mean between the last bid and asked prices from the exchange on which they are principally traded. Options not listed on an exchange are valued by an independent source at the mean between the last bid and asked prices. For purposes of determining net asset value (“NAV”) per share, futures and option contracts generally are valued 15 minutes after the close of the customary trading session of the New York Stock Exchange (“NYSE”).
Investments in open-end and closed-end registered investment companies that do not trade on an exchange are valued at the end-of-day net asset value per share. Investments in open-end and closed-end registered investment companies that trade on an exchange are valued at the last sales price or official closing price as of the close of the customary trading session on the exchange where the security is principally traded.
Debt obligations (including convertible securities) and unlisted equities are fair valued using an evaluated quote provided by an independent pricing service. Evaluated quotes provided by the pricing service may be determined without exclusive reliance on quoted prices, and may reflect appropriate factors such as institution-size trading in similar groups of securities, developments related to specific securities, dividend rate (for unlisted equities), yield (for debt obligations), quality, type of issue, coupon rate (for debt obligations), maturity (for debt obligations), individual trading characteristics and other market data. Debt obligations are subject to interest rate and credit risks. In addition, all debt obligations involve some risk of default with respect to interest and/or principal payments.
Foreign securities’ (including foreign exchange contracts) prices are converted into U.S. dollar amounts using the applicable exchange rates as of the close of the NYSE. If market quotations are available and reliable for foreign exchange-traded equity securities, the securities will be valued at the market quotations. Because trading hours for certain foreign securities end before the close of the NYSE, closing market quotations may become unreliable. If between the time trading ends on a particular security and the close of the customary trading session on the NYSE, events occur that the Adviser determines are significant and make the closing price unreliable, the Fund may fair value the security. If the event is likely to have affected the closing price of the security, the security will be valued at fair value in good faith using procedures approved by the Board of Trustees. Adjustments to closing prices to reflect fair value may also be based on a screening process of an independent pricing service to indicate the degree of certainty, based on historical data, that the closing price in the principal market where a foreign security trades is not the current value as of the close of the NYSE. Foreign securities’ prices meeting the approved degree of certainty that the price is not reflective of current value will be priced at the indication of fair value from the independent pricing service. Multiple factors may be considered by the independent pricing service in determining adjustments to reflect fair value and may include information relating to sector indices, American Depositary Receipts and domestic and foreign index futures. Foreign securities may have additional risks including exchange rate changes, potential for sharply devalued currencies and high inflation, political and economic upheaval, the relative lack of issuer information, relatively low market liquidity and the potential lack of strict financial and accounting controls and standards.
Securities for which market prices are not provided by any of the above methods may be valued based upon quotes furnished by independent sources. The last bid price may be used to value equity securities. The mean between the last bid and asked prices is used to value debt obligations, including corporate loans.
Securities for which market quotations are not readily available or became unreliable are valued at fair value as determined in good faith by or under the supervision of the Trust’s officers following procedures approved by the Board of Trustees. Issuer specific events, market trends, bid/asked quotes of brokers and information providers and other market data may be reviewed in the course of making a good faith determination of a security’s fair value.
The Fund may invest in securities that are subject to interest rate risk, meaning the risk that the prices will generally fall as interest rates rise and, conversely, the prices will generally rise as interest rates fall. Specific securities differ in their sensitivity to changes in interest rates depending on their individual characteristics. Changes in interest rates may result in increased market volatility, which may affect the value and/or liquidity of certain Fund investments.
Valuations change in response to many factors including the historical and prospective earnings of the issuer, the value of the issuer’s assets, general economic conditions, interest rates, investor perceptions and market liquidity. Because of the inherent uncertainties of valuation, the values reflected in the financial statements may materially differ from the value received upon actual sale of those investments.
| B. | Securities Transactions and Investment Income — Securities transactions are accounted for on a trade date basis. Realized gains or losses on sales are computed on the basis of specific identification of the securities sold. Interest income (net of withholding tax, if any) is recorded on the accrual basis from settlement date. Dividend income (net of withholding tax, if any) is recorded on the ex-dividend date. |
The Fund may periodically participate in litigation related to Fund investments. As such, the Fund may receive proceeds from litigation settlements. Any proceeds received are included in the Statement of Operations as realized gain (loss) for investments no longer held and as unrealized gain (loss) for investments still held.
Brokerage commissions and mark ups are considered transaction costs and are recorded as an increase to the cost basis of securities purchased and/or a reduction of proceeds on a sale of securities. Such transaction costs are included in the determination of net realized and unrealized gain (loss) from investment securities reported in the Statement of Operations and the Statement of Changes in Net Assets and the net realized and unrealized gains (losses) on securities per share in the Financial Highlights. Transaction costs are included in the calculation of the Fund’s net asset value and, accordingly, they reduce the Fund’s total returns. These transaction costs are not considered operating expenses and are not reflected in net investment income reported in the Statement of Operations and the Statement of Changes in Net Assets, or the net investment income per share and the ratios of expenses and net investment income reported in the Financial Highlights, nor are they limited by any expense limitation arrangements between the Fund and the investment adviser.
The Fund allocates income and realized and unrealized capital gains and losses to a class based on the relative net assets of each class.
14 Invesco Small Cap Value Fund
| C. | Country Determination — For the purposes of making investment selection decisions and presentation in the Schedule of Investments, the investment adviser may determine the country in which an issuer is located and/or credit risk exposure based on various factors. These factors include the laws of the country under which the issuer is organized, where the issuer maintains a principal office, the country in which the issuer derives 50% or more of its total revenues and the country that has the primary market for the issuer’s securities, as well as other criteria. Among the other criteria that may be evaluated for making this determination are the country in which the issuer maintains 50% or more of its assets, the type of security, financial guarantees and enhancements, the nature of the collateral and the sponsor organization. Country of issuer and/or credit risk exposure has been determined to be the United States of America, unless otherwise noted. |
| D. | Distributions — Distributions from net investment income and net realized capital gain, if any, are generally declared and paid annually and recorded on the ex-dividend date. The Fund may elect to treat a portion of the proceeds from redemptions as distributions for federal income tax purposes. |
| E. | Federal Income Taxes — The Fund intends to comply with the requirements of Subchapter M of the Internal Revenue Code of 1986, as amended (the “Internal Revenue Code”), necessary to qualify as a regulated investment company and to distribute substantially all of the Fund’s taxable earnings to shareholders. As such, the Fund will not be subject to federal income taxes on otherwise taxable income (including net realized capital gain) that is distributed to shareholders. Therefore, no provision for federal income taxes is recorded in the financial statements. |
The Fund recognizes the tax benefits of uncertain tax positions only when the position is more likely than not to be sustained. Management has analyzed the Fund’s uncertain tax positions and concluded that no liability for unrecognized tax benefits should be recorded related to uncertain tax positions. Management is not aware of any tax positions for which it is reasonably possible that the total amounts of unrecognized tax benefits will change materially in the next 12 months.
The Fund files tax returns in the U.S. Federal jurisdiction and certain other jurisdictions. Generally, the Fund is subject to examinations by such taxing authorities for up to three years after the filing of the return for the tax period.
| F. | Expenses — Fees provided for under the Rule 12b-1 plan of a particular class of the Fund are charged to the operations of such class. Transfer agency fees and expenses and other shareholder recordkeeping fees and expenses attributable to Class R6 are charged to such class. Transfer agency fees and expenses and other shareholder recordkeeping fees and expenses relating to all other classes are allocated among those classes based on relative net assets. All other expenses are allocated among the classes based on relative net assets. |
| G. | Accounting Estimates — The preparation of financial statements in conformity with accounting principles generally accepted in the United States of America (“GAAP”) requires management to make estimates and assumptions that affect the reported amounts of assets and liabilities at the date of the financial statements and the reported amounts of revenues and expenses during the reporting period including estimates and assumptions related to taxation. Actual results could differ from those estimates by a significant amount. In addition, the Fund monitors for material events or transactions that may occur or become known after the period-end date and before the date the financial statements are released to print. |
| H. | Indemnifications — Under the Trust’s organizational documents, each Trustee, officer, employee or other agent of the Trust is indemnified against certain liabilities that may arise out of the performance of their duties to the Fund. Additionally, in the normal course of business, the Fund enters into contracts, including the Fund’s servicing agreements, that contain a variety of indemnification clauses. The Fund’s maximum exposure under these arrangements is unknown as this would involve future claims that may be made against the Fund that have not yet occurred. The risk of material loss as a result of such indemnification claims is considered remote. |
| I. | Foreign Currency Translations — Foreign currency is valued at the close of the NYSE based on quotations posted by banks and major currency dealers. Portfolio securities and other assets and liabilities denominated in foreign currencies are translated into U.S. dollar amounts at date of valuation. Purchases and sales of portfolio securities (net of foreign taxes withheld on disposition) and income items denominated in foreign currencies are translated into U.S. dollar amounts on the respective dates of such transactions. The Fund does not separately account for the portion of the results of operations resulting from changes in foreign exchange rates on investments and the fluctuations arising from changes in market prices of securities held. The combined results of changes in foreign exchange rates and the fluctuation of market prices on investments (net of estimated foreign tax withholding) are included with the net realized and unrealized gain or loss from investments in the Statement of Operations. Reported net realized foreign currency gains or losses arise from (1) sales of foreign currencies, (2) currency gains or losses realized between the trade and settlement dates on securities transactions, and (3) the difference between the amounts of dividends, interest, and foreign withholding taxes recorded on the Fund’s books and the U.S. dollar equivalent of the amounts actually received or paid. Net unrealized foreign currency gains and losses arise from changes in the fair values of assets and liabilities, other than investments in securities at fiscal period end, resulting from changes in exchange rates. |
The Fund may invest in foreign securities, which may be subject to foreign taxes on income, gains on investments or currency repatriation, a portion of which may be recoverable. Foreign taxes, if any, are recorded based on the tax regulations and rates that exist in the foreign markets in which the Fund invests and are shown in the Statement of Operations.
| J. | Forward Foreign Currency Contracts — The Fund may engage in foreign currency transactions either on a spot (i.e. for prompt delivery and settlement) basis, or through forward foreign currency contracts, to manage or minimize currency or exchange rate risk. |
The Fund may also enter into forward foreign currency contracts for the purchase or sale of a security denominated in a foreign currency in order to “lock in” the U.S. dollar price of that security, or the Fund may also enter into forward foreign currency contracts that do not provide for physical settlement of the two currencies, but instead are settled by a single cash payment calculated as the difference between the agreed upon exchange rate and the spot rate at settlement based upon an agreed upon notional amount (non-deliverable forwards). The Fund will set aside liquid assets in an amount equal to the daily mark-to-market obligation for forward foreign currency contracts.
A forward foreign currency contract is an obligation between two parties (“Counterparties”) to purchase or sell a specific currency for an agreed-upon price at a future date. The use of forward foreign currency contracts does not eliminate fluctuations in the price of the underlying securities the Fund owns or intends to acquire but establishes a rate of exchange in advance. Fluctuations in the value of these contracts are measured by the difference in the contract date and reporting date exchange rates and are recorded as unrealized appreciation (depreciation) until the contracts are closed. When the contracts are closed, realized gains (losses) are recorded. Realized and unrealized gains (losses) on the contracts are included in the Statement of Operations. The primary risks associated with forward foreign currency contracts include failure of the Counterparty to meet the terms of the contract and the value of the foreign currency changing unfavorably. These risks may be in excess of the amounts reflected in the Statement of Assets and Liabilities.
15 Invesco Small Cap Value Fund
NOTE 2—Advisory Fees and Other Fees Paid to Affiliates
The Trust has entered into a master investment advisory agreement with Invesco Advisers, Inc. (the “Adviser” or “Invesco”). Under the terms of the investment advisory agreement, the Fund pays an advisory fee to the Adviser based on the annual rate of the Fund’s average daily net assets as follows:
| | | | | | | | |
| Average Daily Net Assets | | Rate | |
First $500 million | | | 0 | .67% | | | | |
Next $500 million | | | 0 | .645% | | | | |
Over $1 billion | | | 0 | .62% | | | | |
For the year ended April 30, 2017, the effective advisory fees incurred by the Fund was 0.63%.
Under the terms of a master sub-advisory agreement between the Adviser and each of Invesco Asset Management Deutschland GmbH, Invesco Asset Management Limited, Invesco Asset Management (Japan) Limited, Invesco Hong Kong Limited, Invesco Senior Secured Management, Inc. and Invesco Canada Ltd. (collectively, the “Affiliated Sub-Advisers��) the Adviser, not the Fund, will pay 40% of the fees paid to the Adviser to any such Affiliated Sub-Adviser(s) that provide(s) discretionary investment management services to the Fund based on the percentage of assets allocated to such Affiliated Sub-Adviser(s).
The Adviser has contractually agreed, through at least June 30, 2018, to waive advisory fees and/or reimburse expenses of all shares to the extent necessary to limit total annual fund operating expenses after fee waivers and/or expense reimbursements (excluding certain items discussed below) of Class A, Class B, Class C, Class Y and Class R6 shares to 2.00%, 2.75%, 2.75%, 1.75% and 1.75%, respectively, of average daily net assets (the “expense limts”). In determining the Adviser’s obligation to waive advisory fees and/or reimburse expenses, the following expenses are not taken into account, and could cause the total annual fund operating expenses after fee waiver and/or expense reimbursement to exceed the numbers reflected above: (1) interest; (2) taxes; (3) dividend expense on short sales; (4) extraordinary or non-routine items, including litigation expenses; and (5) expenses that the Fund has incurred but did not actually pay because of an expense offset arrangement. Unless Invesco continues the fee waiver agreement, it will terminate on June 30, 2018. During its term, the fee waiver agreement cannot be terminated or amended to increase the expense limits without approval of the Board of Trustees. The Adviser did not waive fees and/or reimburse expenses during the period under these expense limits.
Further, the Adviser has contractually agreed, through at least June 30, 2019, to waive the advisory fee payable by the Fund in an amount equal to 100% of the net advisory fees the Adviser receives from the affiliated money market funds on investments by the Fund of uninvested cash in such affiliated money market funds.
For the year ended April 30, 2017, the Adviser waived advisory fees of $163,452.
The Trust has entered into a master administrative services agreement with Invesco pursuant to which the Fund has agreed to pay Invesco for certain administrative costs incurred in providing accounting services to the Fund. For the year ended April 30, 2017, expenses incurred under the agreement are shown in the Statement of Operations as Administrative services fees.
The Trust has entered into a transfer agency and service agreement with Invesco Investment Services, Inc. (“IIS”) pursuant to which the Fund has agreed to pay IIS a fee for providing transfer agency and shareholder services to the Fund and reimburse IIS for certain expenses incurred by IIS in the course of providing such services. IIS may make payments to intermediaries that provide omnibus account services, sub-accounting services and/or networking services. All fees payable by IIS to intermediaries that provide omnibus account services or sub-accounting are charged back to the Fund, subject to certain limitations approved by the Trust’s Board of Trustees. For the year ended April 30, 2017, expenses incurred under the agreement are shown in the Statement of Operations as Transfer agent fees.
Shares of the Fund are distributed by Invesco Distributors, Inc. (“IDI”). The Fund has adopted a distribution plan pursuant to Rule 12b-1 under the 1940 Act, and a service plan (collectively, the “Plans”) for Class A shares, Class B shares and Class C shares to compensate IDI for the sale, distribution, shareholder servicing and maintenance of shareholder accounts for these shares. Under the Plans, the Fund will incur annual fees of up to 0.25% of Class A average daily net assets and up to 1.00% each of Class B and Class C average daily net assets.
With respect to Class B and Class C shares, the Fund is authorized to reimburse in future years any distribution related expenses that exceed the maximum annual reimbursement rate for such class, so long as such reimbursement does not cause the Fund to exceed the Class B and Class C maximum annual reimbursement rate, respectively. With respect to Class A shares, distribution related expenses that exceed the maximum annual reimbursement rate for such class are not carried forward to future years and the Fund will not reimburse IDI for any such expenses.
For the year ended April 30, 2017, expenses incurred under these arrangements are shown in the Statement of Operations as Distribution fees.
Front-end sales commissions and CDSC (collectively, the “sales charges”) are not recorded as expenses of the Fund. Front-end sales commissions are deducted from proceeds from the sales of Fund shares prior to investment in Class A shares of the Fund. CDSC are deducted from redemption proceeds prior to remittance to the shareholder. During the year ended April 30, 2017, IDI advised the Fund that IDI retained $24,102 in front-end sales commissions from the sale of Class A shares and $173, $817 and $957 from Class A, Class B and Class C shares, respectively, for CDSC imposed on redemptions by shareholders.
For the year ended April 30, 2017, the Fund incurred $99,043 in brokerage commissions with Invesco Capital Markets, Inc., an affiliate of the Adviser and IDI, for portfolio transactions executed on behalf of the Fund.
Certain officers and trustees of the Trust are officers and directors of the Adviser, IIS and/or IDI.
NOTE 3—Additional Valuation Information
GAAP defines fair value as the price that would be received to sell an asset or paid to transfer a liability in an orderly transaction between market participants at the measurement date, under current market conditions. GAAP establishes a hierarchy that prioritizes the inputs to valuation methods, giving the highest priority to readily available unadjusted quoted prices in an active market for identical assets (Level 1) and the lowest priority to significant unobservable inputs (Level 3), generally when market prices are not readily available or are unreliable. Based on the valuation inputs, the securities or other investments are tiered into one of three levels. Changes in valuation methods may result in transfers in or out of an investment’s assigned level:
| | Level 1 — | Prices are determined using quoted prices in an active market for identical assets. |
16 Invesco Small Cap Value Fund
| | Level 2 — | Prices are determined using other significant observable inputs. Observable inputs are inputs that other market participants may use in pricing a security. These may include quoted prices for similar securities, interest rates, prepayment speeds, credit risk, yield curves, loss severities, default rates, discount rates, volatilities and others. |
| | Level 3 — | Prices are determined using significant unobservable inputs. In situations where quoted prices or observable inputs are unavailable (for example, when there is little or no market activity for an investment at the end of the period), unobservable inputs may be used. Unobservable inputs reflect the Fund’s own assumptions about the factors market participants would use in determining fair value of the securities or instruments and would be based on the best available information. |
The following is a summary of the tiered valuation input levels, as of April 30, 2017. The level assigned to the securities valuations may not be an indication of the risk or liquidity associated with investing in those securities. Because of the inherent uncertainties of valuation, the values reflected in the financial statements may materially differ from the value received upon actual sale of those investments.
| | | | | | | | | | | | | | | | |
| | | Level 1 | | | Level 2 | | | Level 3 | | | Total | |
Common Stocks & Other Equity Interests | | $ | 2,583,761,179 | | | $ | — | | | $ | 0 | | | $ | 2,583,761,179 | |
Money Market Funds | | | 77,111,521 | | | | — | | | | — | | | | 77,111,521 | |
Total Investments | | $ | 2,660,872,700 | | | $ | — | | | $ | 0 | | | $ | 2,660,872,700 | |
NOTE 4—Investments in Other Affiliates
The 1940 Act defines an “affiliated person” as an issuance in which a fund holds 5% or more of the outstanding voting securities. The Fund has not owned enough of the outstanding voting securities of the issuer to have control (as defined in the 1940 Act) of that issuer. The following is a summary of the investments in other affiliates for the year ended April 30, 2017.
| | | | | | | | | | | | | | | | | | | | | | | | | | | | |
| | | Value 04/30/16 | | | Purchases at Cost | | | Proceeds
from Sales | | | Change in
Unrealized
Appreciation
(Depreciation) | | | Realized
Gain (Loss) | | | Value 04/30/17 | | | Dividend Income | |
Arctic Cat Inc.(a) | | $ | 34,845,870 | | | $ | — | | | $ | (38,764,197 | ) | | $ | 12,076,083 | | | $ | (8,157,756 | ) | | $ | — | | | $ | — | |
Belden Inc.(a) | | | 143,132,003 | | | | 1,541,242 | | | | (101,361,851 | ) | | | (29,314,304 | ) | | | 47,016,060 | | | | 61,013,150 | | | | 287,191 | |
Ciber, Inc.(a) | | | 15,796,084 | | | | — | | | | (502,467 | ) | | | 8,230,168 | | | | (23,523,785 | ) | | | — | | | | — | |
Elizabeth Arden, Inc.(a) | | | 54,853,475 | | | | — | | | | (73,661,118 | ) | | | 57,932,455 | | | | (39,124,812 | ) | | | — | | | | — | |
Hanger, Inc. | | | 32,543,075 | | | | — | | | | — | | | | 29,284,045 | | | | — | | | | 61,827,120 | | | | — | |
Kelly Services, Inc. — Class A(a) | | | 51,752,550 | | | | — | | | | (39,890,341 | ) | | | (3,495,285 | ) | | | 8,695,868 | | | | 17,062,792 | | | | 475,996 | |
KEMET Corp.(a) | | | 8,686,317 | | | | — | | | | (19,994,990 | ) | | | 8,013,813 | | | | 3,294,860 | | | | — | | | | — | |
Kforce Inc. | | | 46,281,442 | | | | 457,113 | | | | (9,825,772 | ) | | | 9,609,724 | | | | 500,316 | | | | 47,022,823 | | | | 1,135,774 | |
MDC Partners Inc. — Class A | | | 99,126,999 | | | | — | | | | (6,270,229 | ) | | | (51,790,902 | ) | | | (362,351 | ) | | | 40,703,517 | | | | 1,686,014 | |
Modine Manufacturing Co.(a) | | | 26,336,684 | | | | — | | | | (7,645,335 | ) | | | 2,955,347 | | | | 1,456,233 | | | | 23,102,929 | | | | — | |
Resources Connection Inc.(a) | | | 50,908,793 | | | | 150,572 | | | | (35,389,732 | ) | | | (3,050,851 | ) | | | 4,282,895 | | | | 16,901,677 | | | | 927,405 | |
Tailored Brands, Inc.(a) | | | 44,707,664 | | | | — | | | | (51,801,760 | ) | | | (8,712,476 | ) | | | 15,806,572 | | | | — | | | | 1,115,727 | |
Winnebago Industries, Inc.(a) | | | 49,362,160 | | | | 281,929 | | | | (29,417,362 | ) | | | 7,174,745 | | | | 3,665,101 | | | | 31,066,573 | | | | 482,027 | |
Total | | $ | 658,333,116 | | | $ | 2,430,856 | | | $ | (414,525,154 | ) | | $ | 38,912,562 | | | $ | 13,549,201 | | | $ | 298,700,581 | | | $ | 6,110,134 | |
| (a) | At April 30, 2017, this security was not considered to be an affiliate of the Fund. |
NOTE 5—Security Transactions with Affiliated Funds
The Fund is permitted to purchase or sell securities from or to certain other Invesco Funds under specified conditions outlined in procedures adopted by the Board of Trustees of the Trust. The procedures have been designed to ensure that any purchase or sale of securities by the Fund from or to another fund or portfolio that is or could be considered an affiliate by virtue of having a common investment adviser (or affiliated investment advisers), common Trustees and/or common officers complies with Rule 17a-7 of the 1940 Act. Further, as defined under the procedures, each transaction is effected at the current market price. Pursuant to these procedures, for the year ended April 30, 2017, the Fund engaged in securities sales of $4,289,339, which resulted in net realized gains of $1,905,994.
NOTE 6—Expense Offset Arrangement(s)
The expense offset arrangement is comprised of transfer agency credits which result from balances in demand deposit accounts used by the transfer agent for clearing shareholder transactions. For the year ended April 30, 2017, the Fund received credits from this arrangement, which resulted in the reduction of the Fund’s total expenses of $3,839.
17 Invesco Small Cap Value Fund
NOTE 7—Trustees’ and Officers’ Fees and Benefits
Trustees’ and Officers’ Fees and Benefits include amounts accrued by the Fund to pay remuneration to certain Trustees and Officers of the Fund. Trustees have the option to defer compensation payable by the Fund, and Trustees’ and Officers’ Fees and Benefits also include amounts accrued by the Fund to fund such deferred compensation amounts. Those Trustees who defer compensation have the option to select various Invesco Funds in which their deferral accounts shall be deemed to be invested. Finally, certain current Trustees were eligible to participate in a retirement plan that provided for benefits to be paid upon retirement to Trustees over a period of time based on the number of years of service. The Fund may have certain former Trustees who also participate in a retirement plan and receive benefits under such plan. Trustees’ and Officers’ Fees and Benefits include amounts accrued by the Fund to fund such retirement benefits. Obligations under the deferred compensation and retirement plans represent unsecured claims against the general assets of the Fund.
NOTE 8—Cash Balances
The Fund is permitted to temporarily carry a negative or overdrawn balance in its account with State Street Bank and Trust Company, the custodian bank. Such balances, if any at period-end, are shown in the Statement of Assets and Liabilities under the payable caption Amount due custodian. To compensate the custodian bank for such overdrafts, the overdrawn Fund may either (1) leave funds as a compensating balance in the account so the custodian bank can be compensated by earning the additional interest; or (2) compensate by paying the custodian bank at a rate agreed upon by the custodian bank and Invesco, not to exceed the contractually agreed upon rate.
NOTE 9—Distributions to Shareholders and Tax Components of Net Assets
Tax Character of Distributions to Shareholders Paid During the Fiscal Years Ended April 30, 2017 and 2016:
| | | | | | | | |
| | | 2017 | | | 2016 | |
Ordinary income | | $ | 8,031,697 | | | $ | 4,080,288 | |
Long-term capital gain | | | 45,957,910 | | | | 295,253,944 | |
Total distributions | | $ | 53,989,607 | | | $ | 299,334,232 | |
Tax Components of Net Assets at Period-End:
| | | | |
| | | 2017 | |
Undistributed ordinary income | | $ | 370 | |
Undistributed long-term gain | | | 216,399,830 | |
Net unrealized appreciation — investments | | | 414,817,751 | |
Temporary book/tax differences | | | (276,077 | ) |
Late-Year Ordinary Loss Deferral | | | (3,653,000 | ) |
Shares of beneficial interest | | | 2,016,358,757 | |
Total net assets | | | $2,643,647,631 | |
The difference between book-basis and tax-basis unrealized appreciation (depreciation) is due to differences in the timing of recognition of gains and losses on investments for tax and book purposes. The Fund’s net unrealized appreciation difference is attributable primarily to wash sales.
The temporary book/tax differences are a result of timing differences between book and tax recognition of income and/or expenses. The Fund’s temporary book/tax differences are the result of the trustee deferral of compensation and retirement plan benefits.
Capital loss carryforward is calculated and reported as of a specific date. Results of transactions and other activity after that date may affect the amount of capital loss carryforward actually available for the Fund to utilize. Capital losses generated in years beginning after December 22, 2010 can be carried forward for an unlimited period, whereas previous losses expire in eight tax years. Capital losses with an expiration period may not be used to offset capital gains until all net capital losses without an expiration date have been utilized. Capital loss carryforwards with no expiration date will retain their character as either short-term or long-term capital losses instead of as short-term capital losses as under prior law. The ability to utilize capital loss carryforwards in the future may be limited under the Internal Revenue Code and related regulations based on the results of future transactions.
The Fund does not have a capital loss carryforward as of April 30, 2017.
NOTE 10—Investment Securities
The aggregate amount of investment securities (other than short-term securities, U.S. Treasury obligations and money market funds, if any) purchased and sold by the Fund during the year ended April 30, 2017 was $809,690,207 and $1,432,805,704, respectively. Cost of investments on a tax basis includes the adjustments for financial reporting purposes as of the most recently completed federal income tax reporting period-end.
| | | | |
| Unrealized Appreciation (Depreciation) of Investment Securities on a Tax Basis | |
Aggregate unrealized appreciation of investment securities | | $ | 603,990,057 | |
Aggregate unrealized (depreciation) of investment securities | | | (189,172,306 | ) |
Net unrealized appreciation of investment securities | | $ | 414,817,751 | |
Cost of investments for tax purposes is $2,246,054,949.
18 Invesco Small Cap Value Fund
NOTE 11—Reclassification of Permanent Differences
Primarily as a result of differing book/tax treatment of prior year adjustments, on April 30, 2017, undistributed net realized gain was decreased by $2,004 and shares of beneficial interest was increased by $2,004. This reclassification had no effect on the net assets of the Fund.
NOTE 12—Share Information
| | | | | | | | | | | | | | | | |
| | | Summary of Share Activity | |
| | | Years ended April 30, | |
| | | 2017(a) | | | 2016 | |
| | | Shares | | | Amount | | | Shares | | | Amount | |
Sold: | | | | | | | | | | | | | | | | |
Class A | | | 8,983,386 | | | $ | 160,028,834 | | | | 14,380,494 | | | $ | 254,657,811 | |
Class B | | | 3,867 | | | | 59,118 | | | | 10,504 | | | | 161,454 | |
Class C | | | 168,821 | | | | 2,312,075 | | | | 333,290 | | | | 4,532,878 | |
Class Y | | | 21,667,607 | | | | 409,744,089 | | | | 25,707,776 | | | | 465,855,012 | |
Class R6(b) | | | 23,284 | | | | 464,061 | | | | — | | | | — | |
| | | | |
Issued as reinvestment of dividends: | | | | | | | | | | | | | | | | |
Class A | | | 1,175,208 | | | | 22,481,723 | | | | 8,199,536 | | | | 132,094,525 | |
Class B | | | 13,180 | | | | 200,596 | | | | 142,891 | | | | 1,849,010 | |
Class C | | | 147,803 | | | | 2,163,830 | | | | 1,145,564 | | | | 14,273,723 | |
Class Y | | | 1,286,010 | | | | 25,475,865 | | | | 7,620,047 | | | | 127,026,183 | |
| | | | |
Automatic conversion of Class B shares to Class A shares: | | | | | | | | | | | | | | | | |
Class A | | | 215,144 | | | | 3,771,588 | | | | 213,251 | | | | 3,730,270 | |
Class B | | | (269,795 | ) | | | (3,771,588 | ) | | | (262,060 | ) | | | (3,730,270 | ) |
| | | | |
Reacquired: | | | | | | | | | | | | | | | | |
Class A | | | (35,572,287 | ) | | | (633,568,055 | ) | | | (27,452,832 | ) | | | (482,500,377 | ) |
Class B | | | (214,280 | ) | | | (2,908,847 | ) | | | (235,675 | ) | | | (3,351,952 | ) |
Class C | | | (2,461,893 | ) | | | (33,000,115 | ) | | | (2,173,846 | ) | | | (29,216,652 | ) |
Class Y | | | (30,424,548 | ) | | | (555,313,061 | ) | | | (31,103,588 | ) | | | (542,998,835 | ) |
Net increase (decrease) in share activity | | | (35,258,493 | ) | | $ | (601,859,887 | ) | | | (3,474,648 | ) | | $ | (57,617,220 | ) |
| (a) | There are entities that are record owners of more than 5% of the outstanding shares of the Fund and in the aggregate own 27% of the outstanding shares of the Fund. IDI has an agreement with these entities to sell Fund shares. The Fund, Invesco and/or Invesco affiliates may make payments to these entities, which are considered to be related to the Fund, for providing services to the Fund, Invesco and/or Invesco affiliates including but not limited to services such as securities brokerage, distribution, third party record keeping and account servicing. The Fund has no knowledge as to whether all or any portion of the shares owned of record by these entities are also owned beneficially. |
| (b) | Commencement date of February 7, 2017 |
19 Invesco Small Cap Value Fund
NOTE 13—Financial Highlights
The following schedule presents financial highlights for a share of the Fund outstanding throughout the periods indicated.
| | | | | | | | | | | | | | | | | | | | | | | | | | | | | | | | | | | | | | | | | | | | | | | | | | | | | | | | |
| | | Net asset
value,
beginning
of period | | | Net
Investment
income
(loss)(a) | | | Net gains
(losses)
on securities
(both
realized and
unrealized) | | | Total from
investment
operations | | | Dividends
from net
investment
income | | | Distributions
from net
realized
gains | | | Total
distributions | | | Net asset
value, end
of period | | | Total
return(b) | | | Net assets,
end of period
(000’s omitted) | | | Ratio of
expenses
to average
net assets
with fee waivers
and/or expenses
absorbed | | | Ratio of
expenses
to average net
assets without
fee waivers
and/or expenses
absorbed | | | Ratio of net
investment
income (loss)
to average
net assets | | | Portfolio
turnover(c) | |
Class A | |
Year ended 04/30/17 | | $ | 16.21 | | | $ | (0.02 | ) | | $ | 3.60 | | | $ | 3.58 | | | $ | (0.03 | ) | | $ | (0.32 | ) | | $ | (0.35 | ) | | $ | 19.44 | | | | 22.14 | % | | $ | 1,094,070 | | | | 1.10 | %(d) | | | 1.11 | %(d) | | | (0.12 | )%(d) | | | 32 | % |
Year ended 04/30/16 | | | 20.33 | | | | 0.04 | | | | (2.37 | ) | | | (2.33 | ) | | | (0.01 | ) | | | (1.78 | ) | | | (1.79 | ) | | | 16.21 | | | | (11.43 | ) | | | 1,320,826 | | | | 1.11 | | | | 1.11 | | | | 0.24 | | | | 45 | |
Year ended 04/30/15 | | | 22.75 | | | | (0.00 | ) | | | 0.95 | | | | 0.95 | | | | — | | | | (3.37 | ) | | | (3.37 | ) | | | 20.33 | | | | 5.59 | | | | 1,751,109 | | | | 1.13 | | | | 1.13 | | | | (0.02 | ) | | | 44 | |
Year ended 04/30/14 | | | 18.53 | | | | (0.06 | ) | | | 6.11 | | | | 6.05 | | | | — | | | | (1.83 | ) | | | (1.83 | ) | | | 22.75 | | | | 33.78 | | | | 1,909,149 | | | | 1.11 | | | | 1.11 | | | | (0.29 | ) | | | 33 | |
Year ended 04/30/13 | | | 17.80 | | | | (0.02 | )(e) | | | 3.17 | | | | 3.15 | | | | — | | | | (2.42 | ) | | | (2.42 | ) | | | 18.53 | | | | 20.27 | | | | 1,454,001 | | | | 1.12 | | | | 1.15 | | | | (0.13 | )(e) | | | 35 | |
Class B | |
Year ended 04/30/17 | | | 12.99 | | | | (0.12 | ) | | | 2.87 | | | | 2.75 | | | | — | | | | (0.32 | ) | | | (0.32 | ) | | | 15.42 | | | | 21.20 | | | | 8,165 | | | | 1.85 | (d) | | | 1.86 | (d) | | | (0.87 | )(d) | | | 32 | |
Year ended 04/30/16 | | | 16.80 | | | | (0.07 | ) | | | (1.96 | ) | | | (2.03 | ) | | | — | | | | (1.78 | ) | | | (1.78 | ) | | | 12.99 | | | | (12.06 | ) | | | 12,942 | | | | 1.86 | | | | 1.86 | | | | (0.51 | ) | | | 45 | |
Year ended 04/30/15 | | | 19.54 | | | | (0.14 | ) | | | 0.77 | | | | 0.63 | | | | — | | | | (3.37 | ) | | | (3.37 | ) | | | 16.80 | | | | 4.81 | | | | 22,527 | | | | 1.88 | | | | 1.88 | | | | (0.77 | ) | | | 44 | |
Year ended 04/30/14 | | | 16.25 | | | | (0.19 | ) | | | 5.31 | | | | 5.12 | | | | — | | | | (1.83 | ) | | | (1.83 | ) | | | 19.54 | | | | 32.75 | | | | 29,312 | | | | 1.86 | | | | 1.86 | | | | (1.04 | ) | | | 33 | |
Year ended 04/30/13 | | | 16.01 | | | | (0.13 | )(e) | | | 2.79 | | | | 2.66 | | | | — | | | | (2.42 | ) | | | (2.42 | ) | | | 16.25 | | | | 19.44 | | | | 28,408 | | | | 1.81 | | | | 1.90 | | | | (0.82 | )(e) | | | 35 | |
Class C | |
Year ended 04/30/17 | | | 12.50 | | | | (0.12 | ) | | | 2.76 | | | | 2.65 | | | | — | | | | (0.32 | ) | | | (0.32 | ) | | | 14.83 | | | | 21.23 | (f) | | | 95,892 | | | | 1.84 | (d)(f) | | | 1.85 | (d)(f) | | | (0.86 | )(d)(f) | | | 32 | |
Year ended 04/30/16 | | | 16.25 | | | | (0.07 | ) | | | (1.90 | ) | | | (1.97 | ) | | | — | | | | (1.78 | ) | | | (1.78 | ) | | | 12.50 | | | | (12.11 | ) | | | 107,647 | | | | 1.86 | | | | 1.86 | | | | (0.51 | ) | | | 45 | |
Year ended 04/30/15 | | | 19.02 | | | | (0.13 | ) | | | 0.73 | | | | 0.60 | | | | — | | | | (3.37 | ) | | | (3.37 | ) | | | 16.25 | | | | 4.80 | (f) | | | 151,196 | | | | 1.86 | (f) | | | 1.86 | (f) | | | (0.75 | )(f) | | | 44 | |
Year ended 04/30/14 | | | 15.86 | | | | (0.19 | ) | | | 5.18 | | | | 4.99 | | | | — | | | | (1.83 | ) | | | (1.83 | ) | | | 19.02 | | | | 32.75 | | | | 165,438 | | | | 1.86 | | | | 1.86 | | | | (1.04 | ) | | | 33 | |
Year ended 04/30/13 | | | 15.69 | | | | (0.13 | )(e) | | | 2.72 | | | | 2.59 | | | | — | | | | (2.42 | ) | | | (2.42 | ) | | | 15.86 | | | | 19.39 | | | | 138,382 | | | | 1.87 | | | | 1.90 | | | | (0.88 | )(e) | | | 35 | |
Class Y | |
Year ended 04/30/17 | | | 16.79 | | | | 0.02 | | | | 3.74 | | | | 3.76 | | | | (0.08 | ) | | | (0.32 | ) | | | (0.40 | ) | | | 20.15 | | | | 22.45 | | | | 1,445,051 | | | | 0.85 | (d) | | | 0.86 | (d) | | | 0.13 | (d) | | | 32 | |
Year ended 04/30/16 | | | 20.97 | | | | 0.09 | | | | (2.45 | ) | | | (2.36 | ) | | | (0.04 | ) | | | (1.78 | ) | | | (1.82 | ) | | | 16.79 | | | | (11.19 | ) | | | 1,329,637 | | | | 0.86 | | | | 0.86 | | | | 0.49 | | | | 45 | |
Year ended 04/30/15 | | | 23.31 | | | | 0.05 | | | | 0.98 | | | | 1.03 | | | | — | | | | (3.37 | ) | | | (3.37 | ) | | | 20.97 | | | | 5.81 | | | | 1,614,118 | | | | 0.88 | | | | 0.88 | | | | 0.23 | | | | 44 | |
Year ended 04/30/14 | | | 18.90 | | | | (0.01 | ) | | | 6.25 | | | | 6.24 | | | | — | | | | (1.83 | ) | | | (1.83 | ) | | | 23.31 | | | | 34.13 | | | | 1,385,718 | | | | 0.86 | | | | 0.86 | | | | (0.04 | ) | | | 33 | |
Year ended 04/30/13 | | | 18.07 | | | | 0.02 | (e) | | | 3.23 | | | | 3.25 | | | | — | | | | (2.42 | ) | | | (2.42 | ) | | | 18.90 | | | | 20.54 | | | | 885,327 | | | | 0.87 | | | | 0.90 | | | | 0.12 | (f) | | | 35 | |
Class R6 | |
Year ended 04/30/17(g) | | | 20.29 | | | | 0.01 | | | | (0.14 | ) | | | (0.13 | ) | | | — | | | | — | | | | — | | | | 20.16 | | | | (0.64 | ) | | | 469 | | | | 0.72 | (d)(h) | | | 0.72 | (d)(h) | | | 0.26 | (d)(h) | | | 32 | |
| (a) | Calculated using average shares outstanding. |
| (b) | Includes adjustments in accordance with accounting principles generally accepted in the United States of America and as such, the net asset value for financial reporting purposes and the returns based upon those net asset values may differ from the net asset value and returns for shareholder transactions. Does not include sales charges and is not annualized for periods less than one year, if applicable. |
| (c) | Portfolio turnover is calculated at the fund level and is not annualized for periods less than one year, if applicable. |
| (d) | Ratios are based on average daily net assets (000’s omitted) of $1,216,757, $10,173, $100,266, $1,335,718 and $26 for Class A, Class B, Class C, Class Y, and Class R6 shares, respectively. |
| (e) | Net investment income (loss) per share and the ratio of net investment income (loss) to average net assets includes significant dividends received during the period. Net investment income (loss) per share and the ratio of net investment income (loss) to average net assets excluding the significant dividends are $(0.06) and (0.35)%, $(0.17) and (1.04)%,$(0.17) and (1.10)% and $(0.02) and (0.10)% for Class A, Class B, Class C and Class Y shares, respectively. |
| (f) | The total return, ratio of expenses to average net assets and ratio of net investment income (loss) to average net assets reflect actual 12b-1 fees of 0.99% for the years ended April 30, 2017 and April 30, 2015, respectively. |
| (g) | Commencement date February 7, 2017. |
20 Invesco Small Cap Value Fund
Report of Independent Registered Public Accounting Firm
To the Board of Trustees of AIM Sector Funds (Invesco Sector Funds)
and Shareholders of the Invesco Small Cap Value Fund:
In our opinion, the accompanying statement of assets and liabilities, including the schedule of investments, and the related statements of operations and of changes in net assets and the financial highlights present fairly, in all material respects, the financial position of the Invesco Small Cap Value Fund (one of the portfolios constituting the AIM Sector Funds (Invesco Sector Funds), hereafter referred to as the “Fund”) as of April 30, 2017, the results of its operations for the year then ended, the changes in its net assets for each of the two years in the period then ended and the financial highlights for each of the five years in the period then ended, in conformity with accounting principles generally accepted in the United States of America. These financial statements and financial highlights (hereafter referred to as “financial statements”) are the responsibility of the Fund’s management. Our responsibility is to express an opinion on these financial statements based on our audits. We conducted our audits of these financial statements in accordance with the standards of the Public Company Accounting Oversight Board (United States). Those standards require that we plan and perform the audit to obtain reasonable assurance about whether the financial statements are free of material misstatement. An audit includes examining, on a test basis, evidence supporting the amounts and disclosures in the financial statements, assessing the accounting principles used and significant estimates made by management, and evaluating the overall financial statement presentation. We believe that our audits, which included confirmation of securities as of April 30, 2017 by correspondence with the custodian and brokers, provide a reasonable basis for our opinion.
PricewaterhouseCoopers LLP
Houston, TX
June 23, 2017
21 Invesco Small Cap Value Fund
Calculating your ongoing Fund expenses
Example
As a shareholder of the Fund, you incur two types of costs: (1) transaction costs, which may include sales charges (loads) on purchase payments or contingent deferred sales charges on redemptions, if any; and (2) ongoing costs, including management fees, distribution and/or service (12b-1) fees, and other Fund expenses. This example is intended to help you understand your ongoing costs (in dollars) of investing in the Fund and to compare these costs with ongoing costs of investing in other mutual funds. With the exception of the actual ending account value and expenses of the Class R6 shares, the example is based on an investment of $1,000 invested at the beginning of the period and held for the entire period November 1, 2016 through April 30, 2017. The actual ending account value and expenses of the Class R6 shares in the example below are based on an investment of $1,000 invested as of close of business February 7, 2017 (commencement date) and held through April 30, 2017.
Actual expenses
The table below provides information about actual account values and actual expenses. You may use the information in this table, together with the amount you invested, to estimate the expenses that you paid over the period. Simply divide your account value by $1,000 (for example, an $8,600 account value divided by $1,000 = 8.6), then multiply the result by the number in the table under the heading entitled “Actual Expenses Paid During Period” to estimate the expenses you paid on your account during this period, (as of close of business February 7, 2017 through April 30, 2017 for the Class R6 shares). Because the actual ending account value and expense information in the example is not based upon a six-month period for the Class R6 shares, the ending account value and expense information may not provide a meaningful comparison to the mutual funds that provide such information for a full six-month period.
Hypothetical example for comparison purposes
The table below also provides information about hypothetical account values and hypothetical expenses based on the Fund’s actual expense ratio and an assumed rate of return of 5% per year before expenses, which is not the Fund’s actual return.
The hypothetical account values and expenses may not be used to estimate the actual ending account balance or expenses you paid for the period. You may use this information to compare the ongoing costs of investing in the Fund and other funds. To do so, compare this 5% hypothetical example with the 5% hypothetical examples that appear in the shareholder reports of the other funds.
Please note that the expenses shown in the table are meant to highlight your ongoing costs only and do not reflect any transaction costs, such as sales charges (loads) on purchase payments or contingent deferred sales charges on redemptions, if any. Therefore, the hypothetical information is useful in comparing ongoing costs only, and will not help you determine the relative total costs of owning different funds. In addition, if these transaction costs were included, your costs would have been higher.
| | | | | | | | | | | | | | | | | | | | | | | | |
| Class | | Beginning
Account Value
(11/01/16) | | | ACTUAL | | | HYPOTHETICAL (5% annual return before
expenses) | | | Annualized
Expense
Ratio | |
| | | Ending
Account Value
(04/30/17)1 | | | Expenses
Paid During
Period2 | | | Ending
Account Value
(04/30/17) | | | Expenses
Paid During
Period3 | | |
| A | | $ | 1,000.00 | | | $ | 1,213.20 | | | $ | 6.20 | | | $ | 1,019.19 | | | $ | 5.66 | | | | 1.13 | % |
| B | | | 1,000.00 | | | | 1,209.20 | | | | 10.30 | | | | 1,015.47 | | | | 9.39 | | | | 1.88 | |
| C | | | 1,000.00 | | | | 1,209.20 | | | | 10.24 | | | | 1,015.52 | | | | 9.35 | | | | 1.87 | |
| Y | | | 1,000.00 | | | | 1,214.40 | | | | 4.83 | | | | 1,020.43 | | | | 4.41 | | | | 0.88 | |
| R6 | | | 1,000.00 | | | | 993.60 | | | | 1.63 | | | | 1,021.22 | | | | 3.61 | | | | 0.72 | |
| 1 | The actual ending account value is based on the actual total return of the Fund for the period November 1, 2016 through April 30, 2017 (as of close of business February 7, 2017 through April 30, 2017, for the Class R6 Shares), after actual expenses and will differ from the hypothetical ending account value which is based on the Fund’s expense ratio and a hypothetical annual return of 5% before expenses. |
| 2 | Actual expenses are equal to the Fund’s annualized expense ratio as indicated above, multiplied by the average account value over the period, multiplied by 181/365 to reflect the most recent fiscal half year. Class R6 shares, actual expenses are equal to the annualized expense ratio indicated above, multiplied by the average account value over the period, multiplied by 80 (from the close of business February 7, 2017 through April 30, 2017)/365. Because the Class R6 shares have not been in existence for a full six-month period, the actual ending account value and expense information shown may not provide a meaningful comparison to fund expense information of classes that show such data for a full six-month period and, because the actual ending account value and expense information in the expense example covers a short time period, return and expense data may not be indicative of return and expense data for longer time periods. |
| 3 | Hypothetical expenses are equal to the annualized expense ratio indicated above multiplied by the average account value over the period, multiplied by 181/365 to reflect a one-half year period. The hypothetical ending account value and expenses may be used to compare ongoing costs of investing in Class R6 shares of the Fund and other funds because such data is based on a full six-month period. |
22 Invesco Small Cap Value Fund
Tax Information
Form 1099-DIV, Form 1042-S and other year-end tax information provide shareholders with actual calendar year amounts that should be included in their tax returns. Shareholders should consult their tax advisors.
The following distribution information is being provided as required by the Internal Revenue Code or to meet a specific state’s requirement.
The Fund designates the following amounts or, if subsequently determined to be different, the maximum amount allowable for its fiscal year ended April 30, 2017:
| | | | |
Federal and State Income Tax | |
Long-Term Capital Gain Distributions | | $ | 45,957,910 | |
Qualified Dividend Income* | | | 100 | % |
Corporate Dividends Received Deduction* | | | 100 | % |
U.S. Treasury Obligations* | | | 0 | % |
| | * | The above percentages are based on ordinary income dividends paid to shareholders during the Fund’s fiscal year. |
23 Invesco Small Cap Value Fund
Proxy Results
A Special Joint Meeting (“Meeting”) of Shareholders of Invesco Small Cap Value Fund, an investment portfolio of AIM Sector Funds (Invesco Sector Funds), a Delaware statutory trust (“Trust”), was held on March 9, 2017. The Meeting was held for the following purpose:
| (1) | Elect 15 trustees to the Board, each of whom will serve until his or her successor is elected and qualified. |
| (2) | Approve an amendment to the Trust’s Agreement and Declaration of Trust that would permit fund mergers and other significant transactions upon the Board’s approval but without shareholder approval of such transactions. |
The results of the voting on the above matters were as follows:
| | | | | | | | | | | | | | | | | | |
| | | Matters | | | | | | | | Votes For | | | Votes Withheld | |
| (1)* | | David C. Arch | | | | 478,210,140 | | | | 13,802,825 | |
| | James T. Bunch | | | | 477,776,614 | | | | 14,236,351 | |
| | Bruce L. Crockett | | | | 477,904,863 | | | | 14,108,102 | |
| | Jack M. Fields | | | | 478,154,120 | | | | 13,858,845 | |
| | Martin L. Flanagan | | | | 478,366,284 | | | | 13,646,681 | |
| | Cynthia Hostetler | | | | 478,149,043 | | | | 13,863,922 | |
| | Dr. Eli Jones | | | | 478,281,396 | | | | 13,731,569 | |
| | Dr. Prema Mathai-Davis | | | | 477,927,603 | | | | 14,085,362 | |
| | Teresa M. Ressel | | | | 478,116,999 | | | | 13,895,966 | |
| | Dr. Larry Soll | | | | 477,671,696 | | | | 14,341,269 | |
| | Ann Barnett Stern | | | | 478,390,538 | | | | 13,622,427 | |
| | Raymond Stickel, Jr. | | | | 477,934,336 | | | | 14,078,629 | |
| | Philip A. Taylor | | | | 478,104,174 | | | | 13,908,791 | |
| | Robert C. Troccoli | | | | 478,368,464 | | | | 13,644,501 | |
| | Christopher L. Wilson | | | | 478,433,867 | | | | 13,579,098 | |
| | | | | |
| | | | | | | | | | | | | | | | | | |
| | | | | Votes For | | | Votes
Against | | | Votes Abstain | | | Broker Non-Votes | |
| (2)* | | Approve an amendment to the Trust’s Agreement and Declaration of Trust that would permit fund mergers and other significant transactions upon the Board’s approval but without shareholder approval of such transactions | | | 261,575,830 | | | | 26,621,916 | | | | 13,166,011 | | | | 190,648,808 | |
The Meeting was adjourned until April 11, 2017, with respect to the following proposals:
| (3) | Approve changing the fundamental investment restriction regarding the purchase or sale of physical commodities. |
| 4(a) | Approve an amendment to the current Master Intergroup Sub-Advisory Contract to add Invesco PowerShares Capital Management LLC. |
| 4(b) | Approve an amendment to the current Master Intergroup Sub-Advisory Contract to add Invesco Asset Management (India) Private Limited. |
Invesco Small Cap Value Fund did not receive sufficient shareholder votes to pass Proposals 3 and 4(a) - (b).
The results of the voting on the above matters were as follows:
| | | | | | | | | | | | | | | | | | |
| | | Matters | | Votes For | | | Votes
Against | | | Votes Abstain | | | Broker Non-Votes | |
| (3) | | Approve changing the fundamental investment restriction regarding the purchase or sale of physical commodities | | | 44,218,153 | | | | 2,681,597 | | | | 2,558,897 | | | | 22,936,663 | |
| 4(a) | | Approve an amendment to the current Master Intergroup Sub-Advisory Contract to add Invesco PowerShares Capital Management LLC | | | 45,543,359 | | | | 1,431,872 | | | | 2,124,458 | | | | 23,295,621 | |
| 4(b) | | Approve an amendment to the current Master Intergroup Sub-Advisory Contract to add Invesco Asset Management (India) Private Limited | | | 45,114,308 | | | | 1,900,890 | | | | 2,083,183 | | | | 23,296,929 | |
| * | Each of proposal 1 and 2 required approval by a combined vote of all of the portfolios of AIM Sector Funds (Invesco Sector Funds). |
24 Invesco Small Cap Value Fund
Trustees and Officers
The address of each trustee and officer is AIM Sector Funds (Invesco Sector Funds) (the “Trust”), 11 Greenway Plaza, Suite 1000, Houston, Texas 77046-1173. The trustees serve for the life of the Trust, subject to their earlier death, incapacitation, resignation, retirement or removal as more specifically provided in the Trust’s organizational documents. Each officer serves for a one year term or until their successors are elected and qualified. Column two below includes length of time served with predecessor entities, if any.
| | | | | | | | |
Name, Year of Birth and
Position(s) Held with the Trust | | Trustee and/
or Officer Since | | Principal Occupation(s)
During Past 5 Years | | Number of
Funds in Fund
Complex
Overseen by
Trustee | | Other Directorship(s)
Held by Trustee During
Past 5 Years |
| Interested Persons | | | | | | | | |
| Martin L. Flanagan1 — 1960 Trustee | | 2007 | | Executive Director, Chief Executive Officer and President, Invesco Ltd. (ultimate parent of Invesco and a global investment management firm); Trustee, The Invesco Funds; Vice Chair, Investment Company Institute; and Member of Executive Board, SMU Cox School of Business Formerly: Advisor to the Board, Invesco Advisers, Inc. (formerly known as Invesco Institutional (N.A.), Inc.); Chairman and Chief Executive Officer, Invesco Advisers, Inc. (registered investment adviser); Director, Chairman, Chief Executive Officer and President, Invesco Holding Company (US), Inc. (formerly IVZ Inc.) (holding company), Invesco Group Services, Inc. (service provider) and Invesco North American Holdings, Inc. (holding company); Director, Chief Executive Officer and President, Invesco Holding Company Limited (parent of Invesco and a global investment management firm); Director, Invesco Ltd.; Chairman, Investment Company Institute and President, Co-Chief Executive Officer, Co-President, Chief Operating Officer and Chief Financial Officer, Franklin Resources, Inc. (global investment management organization) | | 144 | | None |
Philip A. Taylor2 — 1954 Trustee and Senior Vice President | | 2006 | | Head of the Americas and Senior Managing Director, Invesco Ltd.; Director, Invesco Advisers, Inc. (formerly known as Invesco Institutional (N.A.), Inc.) (registered investment adviser); Director, Chairman, Chief Executive Officer and President, Invesco Management Group, Inc. (formerly known as Invesco Aim Management Group, Inc.) (financial services holding company); Director and Chairman, Invesco Investment Services, Inc. (formerly known as Invesco Aim Investment Services, Inc.) (registered transfer agent) Chief Executive Officer, Invesco Corporate Class Inc. (corporate mutual fund company) Director, Chairman and Chief Executive Officer, Invesco Canada Ltd. (formerly known as Invesco Trimark Ltd./Invesco Trimark Ltèe) (registered investment adviser and registered transfer agent); Trustee and Senior Vice President, The Invesco Funds; Director, Invesco Investment Advisers LLC (formerly known as Van Kampen Asset Management). Formerly: Co-Chairman, Co-President and Co-Chief Executive Officer, Invesco Advisers, Inc. (formerly known as Invesco Institutional (N.A.), Inc.) (registered investment adviser); Director, Chief Executive Officer and President, Van Kampen Exchange Corp; President and Principal Executive Officer, The Invesco Funds (other than AIM Treasurer’s Series Trust (Invesco Treasurer’s Series Trust), Short-Term Investments Trust and Invesco Management Trust); Executive Vice President, The Invesco Funds (AIM Treasurer’s Series Trust (Invesco Treasurer’s Series Trust), Short-Term Investments Trust and Invesco Management Trust only); Director and President, INVESCO Funds Group, Inc. (registered investment adviser and registered transfer agent); Director and Chairman, IVZ Distributors, Inc. (formerly known as INVESCO Distributors, Inc.) (registered broker dealer); Director, President and Chairman, Invesco Inc. (holding company), Invesco Canada Holdings Inc. (holding company), Trimark Investments Ltd./Placements Trimark Ltèe and Invesco Financial Services Ltd/Services Financiers Invesco Ltèe; Chief Executive Officer, Invesco Canada Fund Inc. (corporate mutual fund company); Director and Chairman, Van Kampen Investor Services Inc.; Director, Chief Executive Officer and President, 1371 Preferred Inc. (holding company) and Van Kampen Investments Inc.; Director and President, AIM GP Canada Inc. (general partner for limited partnerships) and Van Kampen Advisors, Inc.; Director and Chief Executive Officer, Invesco Trimark Dealer Inc. (registered broker dealer); Director, Invesco Distributors, Inc. (formerly known as Invesco Aim Distributors, Inc.) (registered broker dealer); Manager, Invesco PowerShares Capital Management LLC; Director, Chief Executive Officer and President, Invesco Advisers, Inc.; Director, Chairman, Chief Executive Officer and President, Invesco Aim Capital Management, Inc.; President, Invesco Trimark Dealer Inc. and Invesco Trimark Ltd./Invesco Trimark Ltèe; Director and President, AIM Trimark Corporate Class Inc. and AIM Trimark Canada Fund Inc.; Senior Managing Director, Invesco Holding Company Limited; Director and Chairman, Fund Management Company (former registered broker dealer); President and Principal Executive Officer, The Invesco Funds (AIM Treasurer’s Series Trust (Invesco Treasurer’s Series Trust), and Short-Term Investments Trust only); President, AIM Trimark Global Fund Inc. and AIM Trimark Canada Fund Inc. | | 144 | | None |
| 1 | Mr. Flanagan is considered an interested person (within the meaning of Section 2(a)(19) of the 1940 Act) of the Trust because he is an officer of the Adviser to the Trust, and an officer and a director of Invesco Ltd., ultimate parent of the Adviser. |
| 2 | Mr. Taylor is considered an interested person (within the meaning of Section 2(a)(19) of the 1940 Act) of the Trust because he is an officer and a director of the Adviser. |
T-1 Invesco Small Cap Value Fund
Trustees and Officers—(continued)
| | | | | | | | |
Name, Year of Birth and
Position(s) Held with the Trust | | Trustee and/
or Officer Since | | Principal Occupation(s)
During Past 5 Years | | Number of
Funds in Fund
Complex
Overseen by
Trustee | | Other Directorship(s)
Held by Trustee During
Past 5 Years |
| Independent Trustees | | | | | | | | |
Bruce L. Crockett — 1944 Trustee and Chair | | 2003 | | Chairman, Crockett Technologies Associates (technology consulting company) Formerly: Director, Captaris (unified messaging provider); Director, President and Chief Executive Officer, COMSAT Corporation; Chairman, Board of Governors of INTELSAT (international communications company); ACE Limited (insurance company); Independent Directors Council and Investment Company Institute: Member of the Audit Committee, Investment Company Institute; Member of the Executive Committee and Chair of the Governance Committee, Independent Directors Council | | 144 | | Director and Chairman of the Audit Committee, ALPS (Attorneys Liability Protection Society) (insurance company); Director and Member of the Audit Committee, Ferroglobe PLC (metallurgical company) |
David C. Arch — 1945 Trustee | | 2010 | | Chairman of Blistex Inc. (consumer health care products manufacturer); Member, World Presidents’ Organization | | 144 | | Board member of the Illinois Manufacturers’ Association |
James T. Bunch — 1942 Trustee | | 2000 | | Managing Member, Grumman Hill Group LLC (family office/private equity investments) Formerly: Chairman of the Board, Denver Film Society; Chairman of the Board of Trustees, Evans Scholarship Foundation; Chairman, Board of Governors, Western Golf Association | | 144 | | Trustee, Evans Scholarship Foundation |
Jack M. Fields — 1952 Trustee | | 2003 | | Chief Executive Officer, Twenty First Century Group, Inc. (government affairs company); and Discovery Learning Alliance (non-profit) Formerly: Owner and Chief Executive Officer, Dos Angeles Ranch L.P. (cattle, hunting, corporate entertainment); Director, Insperity, Inc. (formerly known as Administaff); Chief Executive Officer, Texana Timber LP (sustainable forestry company); Director of Cross Timbers Quail Research Ranch (non-profit); and member of the U.S. House of Representatives | | 144 | | None |
Cynthia Hostetler — 1962 Trustee | | 2017 | | Non-Executive Director and Trustee of a number of public and private business corporations Formerly: Head of Investment Funds and Private Equity, Overseas Private Investment Corporation; President, First Manhattan Bancorporation, Inc.; Attorney, Simpson Thacher & Bartlett LLP | | 144 | | Vulcan Materials Company (construction materials company); Trilinc Global Impact Fund; Aberdeen Investment Funds (4 portfolios); Artio Global Investment LLC (mutual fund complex); Edgen Group, Inc. (specialized energy and infrastructure products distributor) |
Eli Jones — 1961 Trustee | | 2016 | | Professor and Dean, Mays Business School—Texas A&M University Formerly: Professor and Dean, Walton College of Business, University of Arkansas and E.J. Ourso College of Business, Louisiana State University; Director, Arvest Bank | | 144 | | Insperity, Inc. (formerly known as Administaff) (human resources provider) |
Prema Mathai-Davis — 1950 Trustee | | 2003 | | Retired. Formerly: Chief Executive Officer, YWCA of the U.S.A. | | 144 | | None |
Teresa M. Ressel — 1962 Trustee | | 2017 | | Non-Executive Director and Trustee of a number of public and private business corporations Formerly: Chief Financial Officer, Olayan America, The Olayan Group (international investor/commercial/industrial); Chief Executive Officer, UBS Securities LLC; Group Chief Operating Officer, Americas, UBS AG; Assistant Secretary for Management & Budget and CFO, US Department of the Treasury; Chief Compliance Officer, Kaiser Permanente; Program Manager, Hewlett-Packard; Nuclear Engineering, General Dynamics Corporation | | 144 | | Atlantic Power Corporation (power generation company); ON Semiconductor Corp. (semiconductor supplier) |
Larry Soll — 1942 Trustee | | 1997 | | Retired. Formerly: Chairman, Chief Executive Officer and President, Synergen Corp. (a biotechnology company) | | 144 | | None |
Ann Barnett Stern — 1957 Trustee | | 2017 | | President and Chief Executive Officer, Houston Endowment Inc. (private philanthropic institution) Formerly: Executive Vice President and General Counsel, Texas Children’s Hospital; Attorney, Beck, Redden and Secrest, LLP; Business Law Instructor, University of St. Thomas; Attorney, Andrews & Kurth LLP | | 144 | | Federal Reserve Bank of Dallas |
Raymond Stickel, Jr. — 1944 Trustee | | 2005 | | Retired. Formerly: Director, Mainstay VP Series Funds, Inc. (25 portfolios); Partner, Deloitte & Touche | | 144 | | None |
Robert C. Troccoli — 1949 Trustee | | 2016 | | Adjunct Professor, University of Denver – Daniels College of Business Formerly: Senior Partner, KPMG LLP | | 144 | | None |
Christopher L. Wilson — 1957 Trustee | | 2017 | | Managing Partner, CT2, LLC (investing and consulting firm) Formerly: President/Chief Executive Officer, Columbia Funds, Bank of America Corporation; President/Chief Executive Officer, CDC IXIS Asset Management Services, Inc.; Principal & Director of Operations, Scudder Funds, Scudder, Stevens & Clark, Inc.; Assistant Vice President, Fidelity Investments | | 144 | | TD Asset Management USA Inc. (mutual fund complex) (22 portfolios); ISO New England, Inc. (non-profit organization managing regional electricity market) |
T-2 Invesco Small Cap Value Fund
Trustees and Officers—(continued)
| | | | | | | | |
Name, Year of Birth and
Position(s) Held with the Trust | | Trustee and/
or Officer Since | | Principal Occupation(s)
During Past 5 Years | | Number of
Funds in Fund
Complex
Overseen by
Trustee | | Other Directorship(s)
Held by Trustee During
Past 5 Years |
| Other Officers | | | | | | | | |
Sheri Morris — 1964 President, Principal Executive Officer and Treasurer | | 2003 | | President, Principal Executive Officer and Treasurer, The Invesco Funds; Vice President, Invesco Advisers, Inc. (formerly known as Invesco Institutional (N.A.), Inc.) (registered investment adviser); and Vice President, PowerShares Exchange-Traded Fund Trust, PowerShares Exchange-Traded Fund Trust II, PowerShares India Exchange-Traded Fund Trust, PowerShares Actively Managed Exchange-Traded Fund Trust and PowerShares Actively Managed Exchange-Traded Commodity Fund Trust Formerly: Vice President and Principal Financial Officer, The Invesco Funds; Vice President, Invesco Aim Advisers, Inc., Invesco Aim Capital Management, Inc. and Invesco Aim Private Asset Management, Inc.; Assistant Vice President and Assistant Treasurer, The Invesco Funds and Assistant Vice President, Invesco Advisers, Inc., Invesco Aim Capital Management, Inc. and Invesco Aim Private Asset Management, Inc.; and Treasurer, PowerShares Exchange-Traded Fund Trust, PowerShares Exchange-Traded Fund Trust II, PowerShares India Exchange-Traded Fund Trust and PowerShares Actively Managed Exchange-Traded Fund Trust | | N/A | | N/A |
Russell C. Burk — 1958 Senior Vice President and Senior Officer | | 2005 | | Senior Vice President and Senior Officer, The Invesco Funds | | N/A | | N/A |
John M. Zerr — 1962 Senior Vice President, Chief Legal Officer and Secretary | | 2006 | | Director, Senior Vice President, Secretary and General Counsel, Invesco Management Group, Inc. (formerly known as Invesco AIM Management Group, Inc.); Senior Vice President, Invesco Advisers, Inc. (formerly known as Invesco Institutional (N.A.), Inc.) (registered investment adviser); Senior Vice President and Secretary, Invesco Distributors, Inc. (formerly known as Invesco AIM Distributors, Inc.); Director, Vice President and Secretary, Invesco Investment Services, Inc. (formerly known as Invesco AIM Investment Services, Inc.) Senior Vice President, Chief Legal Officer and Secretary, The Invesco Funds; Managing Director, Invesco PowerShares Capital Management LLC; Director, Secretary and General Counsel, Invesco Investment Advisers LLC (formerly known as Van Kampen Asset Management); Secretary and General Counsel, Invesco Capital Markets, Inc. (formerly known as Van Kampen Funds Inc.) and Chief Legal Officer, PowerShares Exchange-Traded Fund Trust, PowerShares Exchange-Traded Fund Trust II, PowerShares India Exchange-Traded Fund Trust, PowerShares Actively Managed Exchange-Traded Fund Trust and PowerShares Actively Managed Exchange-Traded Commodity Fund Trust; Manager and Secretary, Invesco Indexing LLC Formerly: Director, Secretary, General Counsel and Senior Vice President, Van Kampen Exchange Corp.; Director, Vice President and Secretary, IVZ Distributors, Inc. (formerly known as INVESCO Distributors, Inc.); Director and Vice President, INVESCO Funds Group, Inc.; Director and Vice President, Van Kampen Advisors Inc.; Director, Vice President, Secretary and General Counsel, Van Kampen Investor Services Inc.; Director, Invesco Distributors, Inc. (formerly known as Invesco AIM Distributors, Inc.); Director, Senior Vice President, General Counsel and Secretary, Invesco AIM Advisers, Inc. and Van Kampen Investments Inc.; Director, Vice President and Secretary, Fund Management Company; Director, Senior Vice President, Secretary, General Counsel and Vice President, Invesco AIM Capital Management, Inc.; Chief Operating Officer and General Counsel, Liberty Ridge Capital, Inc. (an investment adviser); Vice President and Secretary, PBHG Funds (an investment company) and PBHG Insurance Series Fund (an investment company); Chief Operating Officer, General Counsel and Secretary, Old Mutual Investment Partners (a broker-dealer); General Counsel and Secretary, Old Mutual Fund Services (an administrator) and Old Mutual Shareholder Services (a shareholder servicing center); Executive Vice President, General Counsel and Secretary, Old Mutual Capital, Inc. (an investment adviser); and Vice President and Secretary, Old Mutual Advisors Funds (an investment company) | | N/A | | N/A |
Gregory G. McGreevey — 1962 Senior Vice President | | 2012 | | Senior Managing Director, Invesco Ltd.; Director, Chairman, President, and Chief Executive Officer, Invesco Advisers, Inc. (formerly known as Invesco Institutional (N.A.), Inc.) (registered investment adviser); Director, Invesco Mortgage Capital, Inc. and Invesco Senior Secured Management, Inc.; and Senior Vice President, The Invesco Funds Formerly: Assistant Vice President, The Invesco Funds | | N/A | | N/A |
Kelli Gallegos — 1970 Vice President, Principal Financial Officer and Assistant Treasurer | | 2008 | | Vice President, Principal Financial Officer and Assistant Treasurer, The Invesco Funds; Assistant Treasurer, Invesco PowerShares Capital Management LLC, PowerShares Exchange-Traded Fund Trust, PowerShares Exchange-Traded Fund Trust II, PowerShares India Exchange-Traded Fund Trust, PowerShares Actively Managed Exchange-Traded Fund Trust and PowerShares Actively Managed Exchange-Traded Commodity Fund Trust Formerly: Assistant Vice President, The Invesco Funds | | N/A | | N/A |
T-3 Invesco Small Cap Value Fund
Trustees and Officers—(continued)
| | | | | | | | |
Name, Year of Birth and
Position(s) Held with the Trust | | Trustee and/
or Officer Since | | Principal Occupation(s)
During Past 5 Years | | Number of
Funds in Fund
Complex
Overseen by
Trustee | | Other Directorship(s)
Held by Trustee During
Past 5 Years |
| Other Officers—(continued) | | | | | | | | |
Tracy Sullivan — 1962 Vice President, Chief Tax Officer and Assistant Treasurer | | 2008 | | Vice President, Chief Tax Officer and Assistant Treasurer, The Invesco Funds; Assistant Treasurer, Invesco PowerShares Capital Management LLC, PowerShares Exchange-Traded Fund Trust, PowerShares Exchange-Traded Fund Trust II, PowerShares India Exchange-Traded Fund Trust, PowerShares Actively Managed Exchange-Traded Fund Trust and PowerShares Actively Managed Exchange-Traded Commodity Fund Trust Formerly: Assistant Vice President, The Invesco Funds | | N/A | | N/A |
Crissie M. Wisdom — 1969 Anti-Money Laundering Compliance Officer | | 2013 | | Anti-Money Laundering Compliance Officer, Invesco Advisers, Inc. (formerly known as Invesco Institutional (N.A.), Inc.) (registered investment adviser), Invesco Capital Markets, Inc. (formerly known as Van Kampen Funds Inc.), Invesco Distributors, Inc., Invesco Investment Services, Inc., Invesco Management Group, Inc., The Invesco Funds, and PowerShares Exchange-Traded Fund Trust, PowerShares Exchange-Traded Fund Trust II, PowerShares India Exchange-Traded Fund Trust, PowerShares Actively Managed Exchange-Traded Fund Trust and PowerShares Actively Managed Exchange-Traded Commodity Fund Trust; Anti-Money Laundering Compliance Officer and Bank Secrecy Act Officer, INVESCO National Trust Company and Invesco Trust Company; and Fraud Prevention Manager and Controls and Risk Analysis Manager for Invesco Investment Services, Inc. Formerly: Anti-Money Laundering Compliance Officer, Van Kampen Exchange Corp. | | N/A | | N/A |
Robert R. Leveille — 1969 Chief Compliance Officer | | 2016 | | Chief Compliance Officer, Invesco Advisers, Inc. (registered investment adviser); and Chief Compliance Officer, The Invesco Funds Formerly: Chief Compliance Officer, Putnam Investments and the Putnam Funds | | N/A | | N/A |
The Statement of Additional Information of the Trust includes additional information about the Fund’s Trustees and is available upon request, without charge, by calling 1.800.959.4246. Please refer to the Fund’s Statement of Additional Information for information on the Fund’s sub-advisers.
| | | | | | | | | | |
Office of the Fund 11 Greenway Plaza, Suite 1000 Houston, TX 77046-1173 | | Investment Adviser Invesco Advisers, Inc. 1555 Peachtree Street, N.E. Atlanta, GA 30309 | |
| Distributor
Invesco Distributors, Inc. 11 Greenway Plaza, Suite 1000 Houston, TX 77046-1173 |
| |
| Auditors
PricewaterhouseCoopers LLP 1000 Louisiana Street, Suite 5800 Houston, TX 77002-5678 |
|
| | | |
| | | | | | | | | | |
Counsel to the Fund Stradley Ronon Stevens & Young, LLP 2005 Market Street, Suite 2600 Philadelphia, PA 19103-7018 | | Counsel to the Independent Trustees Goodwin Procter LLP 901 New York Avenue, N.W. Washington, D.C. 20001 | |
| Transfer Agent
Invesco Investment Services, Inc. 11 Greenway Plaza, Suite 1000 Houston, TX 77046-1173 |
| |
| Custodian
State Street Bank and Trust Company 225 Franklin Street Boston, MA 02110-2801 |
|
T-4 Invesco Small Cap Value Fund
Explore High-Conviction Investing with Invesco

Go paperless with eDelivery
Visit invesco.com/edelivery to enjoy the convenience and security of anytime electronic access to your investment documents.
With eDelivery, you can elect to have any or all of the following materials delivered straight to your inbox to download, save and print from your own computer:
∎ Fund reports and prospectuses
∎ Quarterly statements
∎ Daily confirmations
∎ Tax forms
Invesco mailing information
Send general correspondence to Invesco Investment Services, Inc., P.O. Box 219078, Kansas City, MO 64121-9078.
Important notice regarding delivery of security holder documents
To reduce Fund expenses, only one copy of most shareholder documents may be mailed to shareholders with multiple accounts at the same address (Householding). Mailing of your shareholder documents may be householded indefinitely unless you instruct us otherwise. If you do not want the mailing of these documents to be combined with those for other members of your household, please contact Invesco Investment Services, Inc. at 800 959 4246 or contact your financial institution. We will begin sending you individual copies for each account within 30 days after receiving your request.
Fund holdings and proxy voting information
The Fund provides a complete list of its holdings four times in each fiscal year, at the quarter ends. For the second and fourth quarters, the lists appear in the Fund’s semiannual and annual reports to shareholders. For the first and third quarters, the Fund files the lists with the Securities and Exchange Commission (SEC) on Form N-Q. The most recent list of portfolio holdings is available at invesco.com/completeqtrholdings. Shareholders can also look up the Fund’s Forms N-Q on the SEC website at sec.gov. Copies of the Fund’s Forms N-Q may be reviewed and copied at the SEC Public Reference Room in Washington, D.C. You can obtain information on the operation of the Public Reference Room, including information about duplicating fee charges, by calling 202 551 8090 or 800 732 0330, or by electronic request at the following email address: publicinfo@sec.gov.
The SEC file numbers for the Fund are shown below.
A description of the policies and procedures that the Fund uses to determine how to vote proxies relating to portfolio securities is available without charge, upon request, from our Client Services department at 800 959 4246 or at invesco.com/proxyguidelines. The information is also available on the SEC website, sec.gov.
| | | | |
Information regarding how the Fund voted proxies related to its portfolio securities during the most recent 12-month period ended June 30 is available at invesco.com/proxysearch. The information is also available on the SEC website, sec.gov. Invesco Advisers, Inc. is an investment adviser; it provides investment advisory services to individual and institutional clients and does not sell securities. Invesco Distributors, Inc. is the US distributor for Invesco Ltd.’s retail mutual funds, exchange-traded funds and institutional money market funds. Both are wholly owned, indirect subsidiaries of Invesco Ltd. | |  | | |
| |
| SEC file numbers: 811-03826 and 002-85905 Invesco Distributors, Inc. VK-SCV-AR-1 06122017 0806 | | |
| | | | |
| | |
 | | Annual Report to Shareholders | | April 30, 2017 |
| | |
| | Invesco Technology Fund |
| | Nasdaq: | | |
| | A: ITYAX ∎ B: ITYBX ∎ C: ITHCX ∎ Y: ITYYX ∎ Investor: FTCHX ∎ R5: FTPIX ∎ R6: FTPSX |

Letters to Shareholders
| | |

Philip Taylor | | Dear Shareholders: This annual report includes information about your Fund, including performance data and a complete list of its investments as of the close of the reporting period. Inside is a discussion of how your Fund was managed and the factors that affected its performance during the reporting period. The reporting period began with stock market volatility in the US and abroad, largely the result of uncertainty about global economic growth and monetary policy. Markets declined sharply following UK voters’ decision in June to leave the European Union. Relatively quickly, however, markets recovered, reaching record highs later in the summer. Demand was strong for income-producing investments, particularly those perceived to be lower risk; this benefited bonds as well as dividend-paying stocks for much of the reporting period. While economic news in the US was |
generally positive during the reporting period, news overseas was less upbeat. The European Central Bank and central banks in China and Japan – as well as other countries – maintained extraordinarily accommodative monetary policies in response to economic weakness. After months of uncertainty, the outcome of the US presidential election in November triggered a major stock market rally, with most market indexes repeatedly reaching new highs through February. As expected, the US Federal Reserve (the Fed) raised interest rates in December 2016 and again in March 2017. In its March statement, the Fed noted that the labor market has strengthened and economic activity has expanded at a moderate pace – and that it expects those trends to continue.
Short-term market volatility can prompt some investors to abandon their investment plans – and can cause others to settle for whatever returns the market has to offer. The investment professionals at Invesco, in contrast, invest with high conviction. This means that, no matter the asset class or the strategy, each investment team has a passion to exceed. We want to help investors achieve better outcomes, such as seeking higher returns, helping mitigate risk and generating income. Of course, investing with high conviction can’t guarantee a profit or ensure success; no investment strategy can. To learn more about how we invest with high conviction, visit invesco.com/HighConviction.
You, too, can invest with high conviction by maintaining a long-term investment perspective and by working with your financial adviser on a regular basis. During periods of short-term market volatility or uncertainty, your financial adviser can keep you focused on your long-term investment goals – a new home, a child’s college education or a secure retirement. He or she also can share research about the economy, the markets and individual investment options.
Visit our website for more information on your investments
Our website, invesco.com/us, offers a wide range of market insights and investment perspectives. On the website, you’ll find detailed information about our funds, including performance, holdings and portfolio manager commentaries. You can access information about your account by completing a simple, secure online registration. To do so, select “Log In” on the right side of the homepage, and then select “Register for Individual Account Access.”
In addition to the resources accessible on our website and through our mobile app, you can obtain timely updates to help you stay informed about the markets, the economy and investing by connecting with Invesco on Twitter, LinkedIn or Facebook. You can access our blog at blog.invesco.us.com. Our goal is to provide you the information you want, when and where you want it.
Finally, I’m pleased to share with you Invesco’s commitment to both the Principles for Responsible Investment and to considering environmental, social and governance issues in our robust investment process. I invite you to learn more at invesco.com/esg.
Have questions?
For questions about your account, contact an Invesco client services representative at 800 959 4246. For Invesco-related questions or comments, please email me directly at phil@invesco.com.
All of us at Invesco look forward to serving your investment management needs. Thank you for investing with us.
Sincerely,

Philip Taylor
Senior Managing Director, Invesco Ltd.
2 Invesco Technology Fund
| | |

Bruce Crockett | | Dear Fellow Shareholders: Among the many important lessons I’ve learned in more than 40 years in a variety of business endeavors is the value of a trusted advocate. As independent chair of the Invesco Funds Board, I can assure you that the members of the Board are strong advocates for the interests of investors in Invesco’s mutual funds. We work hard to represent your interests through oversight of the quality of the investment management services your funds receive and other matters important to your investment, including but not limited to: |
| |
| | ∎ Ensuring that Invesco offers a diverse lineup of mutual funds that your financial adviser can use to strive to meet your financial needs as your investment goals change over time. |
| | ∎ Monitoring how the portfolio management teams of the Invesco funds are performing in light of changing economic and market conditions. |
| ∎ | | Assessing each portfolio management team’s investment performance within the context of the investment strategy described in the fund’s prospectus. |
| ∎ | | Monitoring for potential conflicts of interests that may impact the nature of the services that your funds receive. |
We believe one of the most important services we provide our fund shareholders is the annual review of the funds’ advisory and sub-advisory contracts with Invesco Advisers and its affiliates. This review is required by the Investment Company Act of 1940 and focuses on the nature and quality of the services Invesco provides as the adviser to the Invesco funds and the reasonableness of the fees that it charges for those services. Each year, we spend months carefully reviewing information received from Invesco and a variety of independent sources, such as performance and fee data prepared by Lipper, Inc. (a subsidiary of Broadridge Financial Solutions, Inc.), an independent, third-party firm widely recognized as a leader in its field. We also meet with our independent legal counsel and other independent advisers to review and help us assess the information that we have received. Our goal is to assure that you receive quality investment management services for a reasonable fee.
I trust the measures outlined above provide assurance that you have a worthy advocate when it comes to choosing the Invesco Funds.
As always, please contact me at bruce@brucecrockett.com with any questions or concerns you may have. On behalf of the Board, we look forward to continuing to represent your interests and serving your needs.
Sincerely,

Bruce L. Crockett
Independent Chair
Invesco Funds Board of Trustees
3 Invesco Technology Fund
Management’s Discussion of Fund Performance
|
Performance summary |
For the fiscal year ended April 30, 2017, Class A shares of Invesco Technology Fund (the Fund), at net asset value (NAV), outperformed the Fund’s broad market/style-specific benchmark, the NASDAQ Composite Index. Your Fund’s long-term performance appears later in this report. |
| | | | | |
Fund vs. Indexes Total returns, 4/30/16 to 4/30/17, at net asset value (NAV). Performance shown does not include applicable contingent deferred sales charges (CDSC) or front-end sales charges, which would have reduced performance. |
| | | | | |
Class A Shares | | | | 28.83 | % |
Class B Shares | | | | 27.86 | |
Class C Shares | | | | 27.85 | |
Class Y Shares | | | | 29.13 | |
Investor Class Shares | | | | 28.89 | |
Class R5 Shares | | | | 29.45 | |
Class R6 Shares* | | | | 28.89 | |
NASDAQ Composite Index▼ (Broad Market/Style-Specific Index) | | | | 28.18 | |
Lipper Science & Technology Funds Index⬛ (Peer Group Index) | | | | 32.03 | |
| | | | | |
Source(s): ▼FactSet Research Systems Inc.; ⬛Lipper Inc. *Class R6 shares incepted on April 4, 2017. See page 7 for more information. | | | | | |
Market conditions and your Fund
During the fiscal year ended April 30, 2017, the US economy continued its multiyear recovery, the result of a goldilocks economy featuring moderate economic growth, continued improvement in unemployment and muted inflation. Economic indicators improved modestly but steadily during the reporting period; the declining unemployment rate combined with signs of inflation on the horizon prompted the US Federal Reserve (the Fed) to raise interest rates in December 2016 and again in March 2017. Major US stock market indexes posted gains for the reporting period, with most hitting record highs following the US presidential election. Investors hoped that the new administration’s stated goals of reducing corporate tax rates, scaling back regulations and increasing infrastructure spending, if achieved, could lead to increased economic growth.
While US and overseas stock markets were surprised by the UK’s unexpected decision in June 2016 to leave the European Union, they recovered relatively quickly. During the second half of 2016, small-cap stocks led the US market higher, outperforming large-cap stocks. However, large-cap stocks were able to regain their leadership in the first quarter of 2017. As the fiscal year came to a close, it became clear that enacting major legislative initiatives likely to affect the stock market, including tax reform and health care, were going to be more complicated and time-consuming than anticipated. The resulting uncertainty resulted in a slight increase in market volatility at the end of the fiscal year. For the reporting period as a whole, the information technology (IT) and financials sectors outperformed the broad market; more defensive sectors such as consumer staples and utilities underperformed the broad market.
For the reporting period, the IT sector posted a strong positive return and led all sectors of the broad US stock market. The Fund’s Class A shares, at NAV, posted a double-digit positive return and outperformed the Fund’s broad market/style-specific benchmark, the NASDAQ Composite Index.
For the reporting period, Fund holdings in the software and IT services industries were the strongest performers in traditional technology. Additionally, the Fund’s investments in the wireless telecommunication services industry added value versus the broad market/style-specific benchmark. However, some of these contributions were offset by holdings in the semiconductors and semiconductor equipment industry and the pharmaceuticals industry.
At the individual security level, Sprint was the leading contributor to Fund performance relative to the broad market/style-specific index. Following the November presidential election, the telecommunication services sector rallied due to investor expectations of less regulation and the possibility of corporate tax cuts. Sprint outpaced the sector on renewed hope that a possible merger with T-Mobile (not a Fund holding) would be more likely to be approved. Japanese entertainment software developer and marketer Nintendo was a notable contributor to Fund performance for the reporting period. We added the company as a holding in the first quarter of 2016 just as it prepared to introduce its proprietary games on mobile gaming platforms. Nintendo shares rallied in the second quarter after the release of the company’s hit mobile game Pokémon Go. Broadcom, a designer, developer and provider of semiconductors for wireless and broadband equipment, also helped relative Fund performance. Company shares rose in the first quarter of 2017 after Apple
| | |
Portfolio Composition |
By sector | | % of total net assets |
| | | | | |
| |
Information Technology | | | | 58.8 | % |
Consumer Discretionary | | | | 16.9 | |
Health Care | | | | 15.5 | |
Telecommunication Services | | | | 3.1 | |
Industrials | | | | 2.7 | |
Financials | | | | 1.2 | |
Consumer Staples | | | | 1.1 | |
Money Market Funds Plus Other Assets Less Liabilities | | | | 0.7 | |
| | | | | | | |
Top 10 Equity Holdings* |
| % of total net assets |
| | | | |
| | |
1. | | Apple Inc. | | 8.2% |
2. | | Amazon.com, Inc. | | 7.9 |
3. | | Alphabet Inc.-Class A | | 6.1 |
4. | | Facebook, Inc.-Class A | | 4.9 |
5. | | Microsoft Corp. | | 4.2 |
6. | | Broadcom Ltd. | | 4.0 |
7. | | DISH Network Corp.-Class A | | 3.8 |
8. | | Alibaba Group Holding Ltd.-ADR | | 3.7 |
9. | | Sony Corp. | | 3.6 |
10. | | Visa Inc.-Class A | | 3.4 |
| | | | | |
Total Net Assets | | $745.4 million |
| | | | | |
| |
Total Number of Holdings* | | | | 41 | |
The Fund’s holdings are subject to change, and there is no assurance that the Fund will continue to hold any particular security.
*Excluding money market fund holdings.
Data presented here are as of April 30, 2017.
4 Invesco Technology Fund
and Samsung (not a Fund holding) reported strong revenue and earnings results. Those companies’ strong quarterly results helped fuel investor expectations for Broadcom, as the company provides a number of chips to both Apple and Samsung.
The Fund’s performance relative to the broad market/style-specific index was dampened by some underperforming names, however. QUALCOMM, a semiconductor developer, was the leading detractor from relative Fund performance for the reporting period. The stock came under pressure in the first quarter of 2017 following an unexpected lawsuit from the company’s largest customer, Apple. We subsequently reduced our exposure to the company. Bristol-Myers Squibb, a biopharmaceutical developer, manufacturer and distributor, announced disappointing results from a clinical trial in the fourth quarter of 2016 for the company’s lung cancer drug, Opdivo. The failed clinical trial was a major setback for the company, in our view, and we sold our position before the close of the reporting period. Another biopharmaceutical company, Gilead Sciences, also detracted from Fund performance after its hepatitis C drug came under pressure in the second quarter of 2016 due to concerns about pricing and the durability of the treatment. We sold our position in the company.
At the close of the reporting period, the Fund was biased toward growth technology, including biopharmaceuticals, and away from mature technology. It emphasized innovation, transformative technology and opportunities which we expect to take market share from mature companies, including the game-changing technologies of mobile, security, cloud and biopharmaceuticals. We remain optimistic about technology spending given strong corporate balance sheets and companies’ need to invest in more robust security solutions and for future growth. In our opinion, the increased pace of health care innovation is likely to continue to produce attractive long-term growth rates due to successful mapping of the human genome and recent productivity improvements, both of which have fostered faster and more effective targeting of promising therapeutics. We attempt to harness multiyear secular trends, which may benefit long-term investors regardless of near-term economic conditions.
As we’ve discussed, stocks were volatile during the fiscal year, and we caution investors against making investment decisions based on short-term performance.
We thank you for your commitment to Invesco Technology Fund.
The views and opinions expressed in management’s discussion of Fund performance are those of Invesco Advisers, Inc. These views and opinions are subject to change at any time based on factors such as market and economic conditions. These views and opinions may not be relied upon as investment advice or recommendations, or as an offer for a particular security. The information is not a complete analysis of every aspect of any market, country, industry, security or the Fund. Statements of fact are from sources considered reliable, but Invesco Advisers, Inc. makes no representation or warranty as to their completeness or accuracy. Although historical performance is no guarantee of future results, these insights may help you understand our investment management philosophy.
See important Fund and, if applicable, index disclosures later in this report.
| | |
 | | Erik Voss Chartered Financial Analyst, Portfolio Manager, is lead manager of Invesco |
| Technology Fund. He joined Invesco in 2010. Mr. Voss earned a BS in mathematics and an MS in finance from the University of Wisconsin. |
| |
 | | Janet Luby Chartered Financial Analyst, Portfolio Manager, is manager of Invesco Technology |
| Fund. She joined Invesco in 2011. Ms. Luby earned a BBA in finance from Texas A&M University. She is also a Certified Public Accountant. |
Assisted by Invesco’s Large/Multi-Cap Growth Team
5 Invesco Technology Fund
Your Fund’s Long-Term Performance
Results of a $10,000 Investment – Oldest Share Class(es)
Fund and index data from 4/30/07
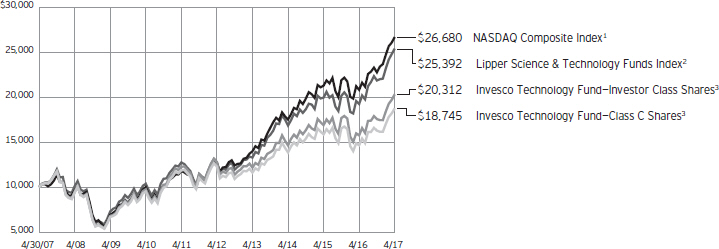
| 1 | Source: FactSet Research Systems Inc. |
| 3 | It is Invesco’s policy to chart the Fund’s oldest share class(es). Because Investor Class shares do not have a sales charge, we also show the oldest share class with a sales charge, Class C shares. |
Past performance cannot guarantee comparable future results.
The data shown in the chart include reinvested distributions, applicable sales charges and Fund expenses including management fees. Index results include reinvested dividends, but they do not reflect sales charges. Performance of the
peer group, if applicable, reflects fund expenses and management fees; performance of a market index does not. Performance shown in the chart and table(s) does not reflect deduction of taxes a shareholder would pay on Fund distributions or sale of Fund shares.
6 Invesco Technology Fund
| | | | | | |
| | | Average Annual Total Returns As of 4/30/17, including maximum applicable sales charges | |
| | | Class A Shares | | | | |
| | | Inception (3/28/02) | | | 4.12 | % |
| | | 10 Years | | | 6.67 | |
| | | 5 Years | | | 8.42 | |
| | | 1 Year | | | 21.75 | |
| | |
| | | Class B Shares | | | | |
| | | Inception (3/28/02) | | | 4.09 | % |
| | | 10 Years | | | 6.65 | |
| | | 5 Years | | | 8.55 | |
| | | 1 Year | | | 22.86 | |
| | |
| | | Class C Shares | | | | |
| | | Inception (2/14/00) | | | -3.29 | % |
| | | 10 Years | | | 6.48 | |
| | | 5 Years | | | 8.84 | |
| | | 1 Year | | | 26.85 | |
| | |
| | | Class Y Shares | | | | |
| | | 10 Years | | | 7.50 | % |
| | | 5 Years | | | 9.92 | |
| | | 1 Year | | | 29.13 | |
| | |
| | | Investor Class Shares | | | | |
| | | Inception (1/19/84) | | | 9.88 | % |
| | | 10 Years | | | 7.34 | |
| | | 5 Years | | | 9.74 | |
| | | 1 Year | | | 28.89 | |
| | |
| | | Class R5 Shares | | | | |
| | | Inception (12/21/98) | | | 4.30 | % |
| | | 10 Years | | | 7.94 | |
| | | 5 Years | | | 10.26 | |
| | | 1 Year | | | 29.45 | |
| | |
| | | Class R6 Shares | | | | |
| | | 10 Years | | | 7.28 | % |
| | | 5 Years | | | 9.66 | |
| | | 1 Year | | | 28.89 | |
| | | Performance includes litigation proceeds. Had these proceeds not been received, total returns would have been lower. | |
Class Y shares incepted on October 3, 2008. Performance shown prior to that date is that of Investor Class shares and includes the 12b-1 fees applicable to Investor Class shares.
Class R6 shares incepted on April 4, 2017. Performance shown prior to that date is that of Class A shares and includes the 12b-1 fees applicable to Class A shares.
The performance data quoted represent past performance and cannot guarantee comparable future results; current performance may be lower or higher. Please visit invesco.com/performance for the most recent month-end performance. Performance figures reflect reinvested distributions, changes in net asset
| | | | | | |
| | | Average Annual Total Returns | |
| | As of 3/31/17, the most recent calendar quarter end, including maximum applicable sales charges | |
| | | Class A Shares | | | | |
| | | Inception (3/28/02) | | | 3.94 | % |
| | | 10 Years | | | 6.66 | |
| | | 5 Years | | | 7.13 | |
| | | 1 Year | | | 16.50 | |
| | |
| | | Class B Shares | | | | |
| | | Inception (3/28/02) | | | 3.91 | % |
| | | 10 Years | | | 6.63 | |
| | | 5 Years | | | 7.26 | |
| | | 1 Year | | | 17.38 | |
| | |
| | | Class C Shares | | | | |
| | | Inception (2/14/00) | | | -3.47 | % |
| | | 10 Years | | | 6.47 | |
| | | 5 Years | | | 7.54 | |
| | | 1 Year | | | 21.39 | |
| | |
| | | Class Y Shares | | | | |
| | | 10 Years | | | 7.49 | % |
| | | 5 Years | | | 8.62 | |
| | | 1 Year | | | 23.60 | |
| | |
| | | Investor Class Shares | | | | |
| | | Inception (1/19/84) | | | 9.81 | % |
| | | 10 Years | | | 7.32 | |
| | | 5 Years | | | 8.43 | |
| | | 1 Year | | | 23.39 | |
| | |
| | | Class R5 Shares | | | | |
| | | Inception (12/21/98) | | | 4.15 | % |
| | | 10 Years | | | 7.93 | |
| | | 5 Years | | | 8.95 | |
| | | 1 Year | | | 23.91 | |
| | | Performance includes litigation proceeds. Had these proceeds not been received, total returns would have been lower. | |
value and the effect of the maximum sales charge unless otherwise stated. Investment return and principal value will fluctuate so that you may have a gain or loss when you sell shares.
The total annual Fund operating expense ratio set forth in the most recent Fund prospectus as of the date of this report for Class A, Class B, Class C, Class Y, Investor Class, Class R5 and Class R6 shares was 1.39%, 2.14%, 2.14%, 1.14%, 1.30%, 0.87% and 0.82%, respectively. The expense ratios presented above may vary from the expense ratios presented in other sections of this report that are based on expenses incurred during the period covered by this report.
Class A share performance reflects the maximum 5.50% sales charge, and Class B and Class C share performance reflects the applicable contingent deferred sales charge (CDSC) for the
period involved. The CDSC on Class B shares declines from 5% beginning at the time of purchase to 0% at the beginning of the seventh year. The CDSC on Class C shares is 1% for the first year after purchase. Class Y, Investor Class, Class R5 and Class R6 shares do not have a front-end sales charge or a CDSC; therefore, performance is at net asset value.
The performance of the Fund’s share classes will differ primarily due to different sales charge structures and class expenses.
Fund performance reflects any applicable fee waivers and/or expense reimbursements. Had the adviser not waived fees and/or reimbursed expenses currently or in the past, returns would have been lower. See current prospectus for more information.
7 Invesco Technology Fund
Invesco Technology Fund’s investment objective is long-term growth of capital.
| ∎ | | Unless otherwise stated, information presented in this report is as of April 30, 2017, and is based on total net assets. |
| ∎ | | Unless otherwise noted, all data provided by Invesco. |
| ∎ | | To access your Fund’s reports/prospectus, visit invesco.com/fundreports. |
About share classes
| ∎ | | Class B shares may not be purchased for new or additional investments. Please see the prospectus for more information. |
| ∎ | | Class Y shares and Investor Class shares are available only to certain investors. Please see the prospectus for more information. |
| ∎ | | Class R5 shares and Class R6 shares are available for use by retirement plans that meet certain standards and for institutional investors. Class R6 shares are also available through intermediaries that have established an agreement with Invesco Distributors, Inc. to make such shares available for use in retail omnibus accounts. See the prospectus for more information. |
Principal risks of investing
in the Fund
| ∎ | | Depositary receipts risk. Investing in depositary receipts involves the same risks as direct investments in foreign securities. In addition, the underlying issuers of certain depositary receipts are under no obligation to distribute shareholder communications or pass through any voting rights with respect to the deposited securities to the holders of such receipts. The Fund may therefore receive less timely information or have less control than if it invested directly in the foreign issuer. |
| ∎ | | Derivatives risk. The value of a derivative instrument depends largely on (and is derived from) the value of an underlying security, currency, commodity, interest rate, index or other asset (each referred to as an underlying asset). In addition to risks relating to the underlying assets, the use of derivatives may include other, possibly greater, risks, including counterparty, leverage and liquidity risks. Counterparty risk is the risk that the counterparty to the derivative contract will default on its obligation to pay the Fund the amount owed or otherwise perform under the derivative contract. Derivatives |
| | create leverage risk because they do not require payment up front equal to the economic exposure created by owning the derivative. As a result, an adverse change in the value of the underlying asset could result in the Fund sustaining a loss that is substantially greater than the amount invested in the derivative, which may make the Fund’s returns more volatile and increase the risk of loss. Derivative instruments may also be less liquid than more traditional investments and the Fund may be unable to sell or close out its derivative positions at a desirable time or price. This risk may be more acute under adverse market conditions, during which the Fund may be most in need of liquidating its derivative positions. Derivatives may also be harder to value, less tax efficient and subject to changing government regulation that could impact the Fund’s ability to use certain derivatives or their cost. Also, derivatives used for hedging or to gain or limit exposure to a particular market segment may not provide the expected benefits, particularly during adverse market conditions. |
| ∎ | | Emerging markets securities risk. Emerging markets (also referred to as developing markets) are generally subject to greater market volatility, political, social and economic instability, uncertain trading markets and more governmental limitations on foreign investment than more developed markets. In addition, companies operating in emerging markets may be subject to lower trading volume and greater price fluctuations than companies in more developed markets. Securities law and the enforcement of systems of taxation in many emerging market countries may change quickly and unpredictably. In addition, investments in emerging markets securities may also be subject to additional transaction costs, delays in settlement procedures, and lack of timely information. |
| | | | | |
| | This report must be accompanied or preceded by a currently effective Fund prospectus, which contains more complete information, including sales charges and expenses. Investors should read it carefully before investing. |
|
NOT FDIC INSURED | MAY LOSE VALUE | NO BANK GUARANTEE |
| ∎ | | Foreign securities risk. The Fund’s foreign investments may be adversely affected by political and social instability, changes in economic or taxation policies, difficulty in enforcing obligations, decreased liquidity or increased volatility. Foreign investments also involve the risk of the possible seizure, nationalization or expropriation of the issuer or foreign deposits (in which the Fund could lose its entire investments in a certain market) and the possible adoption of foreign governmental restrictions such as exchange controls. Unless the Fund has hedged its foreign securities risk, foreign securities risk also involves the risk of negative foreign currency rate fluctuations, which may cause the value of securities denominated in such foreign currency (or other instruments through which the Fund has exposure to foreign currencies) to decline in value. Currency exchange rates may fluctuate significantly over short periods of time. Currency hedging strategies, if used, are not always successful. |
| ∎ | | Growth investing risk. Growth stocks tend to be more expensive relative to the issuing company’s earnings or assets compared with other types of stock. As a result, they tend to be more sensitive to changes in, or investors’ expectations of, the issuing company’s earnings and can be more volatile. |
| ∎ | | Management risk. The Fund is actively managed and depends heavily on the Adviser’s judgment about markets, interest rates or the attractiveness, relative values, liquidity, or potential appreciation of particular investments made for the Fund’s portfolio. The Fund could experience losses if these judgments prove to be incorrect. Additionally, legislative, regulatory, or tax developments may adversely affect management of the Fund and, therefore, the ability of the Fund to achieve its investment objective. |
| ∎ | | Market risk. The market values of the Fund’s investments, and therefore the value of the Fund’s shares, will go up and down, sometimes rapidly or unpredictably. Market risk may affect a single issuer, industry or section of the economy, or it may affect the market as a |
8 Invesco Technology Fund
| | whole. Individual stock prices tend to go up and down more dramatically than those of certain other types of investments, such as bonds. During a general downturn in the financial markets, multiple asset classes may decline in value. When markets perform well, there can be no assurance that specific investments held by the Fund will rise in value. |
| ∎ | | Mid-capitalization companies risk. Mid-capitalization companies tend to be more vulnerable to changing market conditions and may have more limited product lines and markets, less experienced management and fewer financial resources than larger companies. These companies’ securities may be more volatile and less liquid than those of more established companies, and their returns may vary, sometimes significantly, from the overall securities market. |
| ∎ | | Technology sector risk. The Fund will concentrate its investments in the securities of issuers engaged primarily in technology-related industries. Technology companies are subject to intense competition, rapid obsolescence of their products, issues with obtaining financing or regulatory approvals, product incompatibility, changing consumer preferences, high required corporate capital expenditure for research and development or infrastructure and development of new products, each of which make the prices of securities issued by these companies more volatile. |
About indexes used in this report
| ∎ | | The NASDAQ Composite Index is a broad-based market index of the common stocks and similar securities listed on the Nasdaq stock market. |
| ∎ | | The Lipper Science & Technology Funds Index is an unmanaged index considered representative of science and technology funds tracked by Lipper. |
| ∎ | | The Fund is not managed to track the performance of any particular index, including the index(es) described here, and consequently, the performance of the Fund may deviate significantly from the performance of the index(es). |
| ∎ | | A direct investment cannot be made in an index. Unless otherwise indicated, index results include reinvested dividends, and they do not reflect sales charges. Performance of the peer group, if applicable, reflects fund expenses; performance of a market index does not. |
Other information
| ∎ | | CPA® and Certified Public Accountant® are trademarks owned by the American Institute of Certified Public Accountants. |
| ∎ | | The returns shown in management’s discussion of Fund performance are based on net asset values (NAVs) calculated for shareholder transactions. Generally accepted accounting principles require adjustments to be made to the net assets of the Fund at period end for financial reporting purposes, and as such, the NAVs for shareholder transactions and the returns based on those NAVs may differ from the NAVs and returns reported in the Financial Highlights. |
| ∎ | | Industry classifications used in this report are generally according to the Global Industry Classification Standard, which was developed by and is the exclusive property and a service mark of MSCI Inc. and Standard & Poor’s. |
9 Invesco Technology Fund
Schedule of Investments(a)
April 30, 2017
| | | | | | | | |
| | | Shares | | | Value | |
Common Stocks & Other Equity Interests–99.33% | |
| Aerospace & Defense–2.72% | |
Raytheon Co. | | | 130,887 | | | $ | 20,314,971 | |
|
| Application Software–2.52% | |
salesforce.com, inc.(b) | | | 217,808 | | | | 18,757,625 | |
|
| Biotechnology–8.95% | |
Alexion Pharmaceuticals, Inc.(b) | | | 110,320 | | | | 14,096,690 | |
Amgen Inc. | | | 67,427 | | | | 11,012,178 | |
Biogen Inc.(b) | | | 13,178 | | | | 3,574,005 | |
BioMarin Pharmaceutical Inc.(b) | | | 73,247 | | | | 7,019,992 | |
Celgene Corp.(b) | | | 179,238 | | | | 22,234,474 | |
Incyte Corp.(b) | | | 70,800 | | | | 8,799,024 | |
| | | | | 66,736,363 | |
|
| Cable & Satellite–3.75% | |
DISH Network Corp.–Class A(b) | | | 434,389 | | | | 27,992,027 | |
|
| Consumer Electronics–3.64% | |
Sony Corp. (Japan) | | | 804,100 | | | | 27,114,706 | |
|
| Data Processing & Outsourced Services–6.56% | |
First Data Corp.–Class A(b) | | | 622,453 | | | | 9,722,716 | |
Mastercard Inc.–Class A | | | 120,115 | | | | 13,971,777 | |
Visa Inc.–Class A | | | 276,051 | | | | 25,181,372 | |
| | | | | 48,875,865 | |
|
| Health Care Equipment–0.35% | |
Stryker Corp. | | | 19,092 | | | | 2,603,576 | |
|
| Home Entertainment Software–11.30% | |
Activision Blizzard, Inc. | | | 325,298 | | | | 16,996,820 | |
Electronic Arts Inc.(b) | | | 154,297 | | | | 14,630,441 | |
Nintendo Co., Ltd. (Japan)(c) | | | 96,600 | | | | 24,349,539 | |
Take-Two Interactive Software, Inc.(b) | | | 242,580 | | | | 15,246,153 | |
UbiSoft Entertainment S.A. (France)(b) | | | 274,936 | | | | 13,027,719 | |
| | | | | 84,250,672 | |
|
| Internet & Direct Marketing Retail–9.50% | |
Amazon.com, Inc.(b) | | | 63,781 | | | | 58,996,787 | |
Priceline Group Inc. (The)(b) | | | 6,415 | | | | 11,847,351 | |
| | | | | 70,844,138 | |
|
| Internet Software & Services–15.94% | |
Alibaba Group Holding Ltd.–ADR (China)(b) | | | 237,589 | | | | 27,441,529 | |
Alphabet Inc.–Class A(b) | | | 48,926 | | | | 45,233,066 | |
Alphabet Inc.–Class C(b) | | | 10,294 | | | | 9,325,952 | |
Facebook, Inc.–Class A(b) | | | 244,876 | | | | 36,792,619 | |
| | | | | 118,793,166 | |
|
| Life Sciences Tools & Services–1.20% | |
Thermo Fisher Scientific, Inc. | | | 54,037 | | | | 8,933,937 | |
| | | | | | | | |
| | | Shares | | | Value | |
| Managed Health Care–1.43% | |
UnitedHealth Group Inc. | | | 61,081 | | | $ | 10,681,845 | |
|
| Pharmaceuticals–3.52% | |
Allergan PLC | | | 50,754 | | | | 12,376,871 | |
Eli Lilly and Co. | | | 90,063 | | | | 7,390,570 | |
Merck & Co., Inc. | | | 103,322 | | | | 6,440,060 | |
| | | | | 26,207,501 | |
|
| Regional Banks–1.22% | |
SVB Financial Group(b) | | | 51,518 | | | | 9,064,077 | |
|
| Semiconductor Equipment–1.10% | |
Applied Materials, Inc. | | | 201,155 | | | | 8,168,905 | |
|
| Semiconductors–8.37% | |
Broadcom Ltd. | | | 135,212 | | | | 29,856,162 | |
Integrated Device Technology, Inc.(b) | | | 585,519 | | | | 14,046,601 | |
NVIDIA Corp. | | | 97,641 | | | | 10,183,956 | |
QUALCOMM, Inc. | | | 155,139 | | | | 8,337,170 | |
| | | | | 62,423,889 | |
|
| Systems Software–4.89% | |
Microsoft Corp. | | | 457,367 | | | | 31,311,345 | |
ServiceNow, Inc.(b) | | | 54,232 | | | | 5,123,839 | |
| | | | | 36,435,184 | |
|
| Technology Hardware, Storage & Peripherals–8.17% | |
Apple Inc. | | | 423,737 | | | | 60,869,820 | |
|
| Tobacco–1.09% | |
Philip Morris International Inc. | | | 73,619 | | | | 8,159,930 | |
|
| Wireless Telecommunication Services–3.11% | |
Sprint Corp.(b) | | | 2,570,351 | | | | 23,210,270 | |
Total Common Stocks & Other Equity Interests
(Cost $442,101,520) | | | | 740,438,467 | |
|
Money Market Funds–0.99% | |
Government & Agency Portfolio–Institutional Class, 0.67%(d) | | | 4,403,897 | | | | 4,403,897 | |
Treasury Portfolio–Institutional Class, 0.63%(d) | | | 2,935,931 | | | | 2,935,931 | |
Total Money Market Funds
(Cost $7,339,828) | | | | 7,339,828 | |
TOTAL INVESTMENTS (excluding investments purchased with cash collateral from securities on loan)–100.32% (Cost $449,441,348) | | | | 747,778,295 | |
See accompanying Notes to Financial Statements which are an integral part of the financial statements.
10 Invesco Technology Fund
| | | | | | | | |
| | | Shares | | | Value | |
Investments Purchased with Cash
Collateral from Securities on Loan | |
Money Market Fund–0.52% | |
Government & Agency Portfolio–Institutional Class, 0.67%
(Cost $3,884,250)(d)(e) | | | 3,884,250 | | | $ | 3,884,250 | |
TOTAL INVESTMENTS–100.84%
(Cost $453,325,598) | | | | 751,662,545 | |
OTHER ASSETS LESS LIABILITIES–(0.84)% | | | | (6,261,212 | ) |
NET ASSETS–100.00% | | | $ | 745,401,333 | |
Investment Abbreviations:
| | |
| ADR | | – American Depositary Receipt |
Notes to Schedule of Investments:
| (a) | Industry and/or sector classifications used in this report are generally according to the Global Industry Classification Standard, which was developed by and is the exclusive property and a service mark of MSCI Inc. and Standard & Poor’s. |
| (b) | Non-income producing security. |
| (c) | All or a portion of this security was out on loan at April 30, 2017. |
| (d) | The money market fund and the Fund are affiliated by having the same investment adviser. The rate shown is the 7-day SEC standardized yield as of April 30, 2017. |
| (e) | The security has been segregated to satisfy the commitment to return the cash collateral received in securities lending transactions upon the borrower’s return of the securities loaned. See Note 1I. |
See accompanying Notes to Financial Statements which are an integral part of the financial statements.
11 Invesco Technology Fund
Statement of Assets and Liabilities
April 30, 2017
| | | | |
Assets: | | | | |
Investments, at value (Cost $442,101,520)* | | $ | 740,438,467 | |
Investments in affiliated money market funds, at value and cost | | | 11,224,078 | |
Total investments, at value (Cost $453,325,598) | | | 751,662,545 | |
Foreign currencies, at value (Cost $19,084) | | | 19,680 | |
Receivable for: | | | | |
Investments sold | | | 6,034,008 | |
Fund shares sold | | | 502,254 | |
Dividends | | | 603,497 | |
Investment for trustee deferred compensation and retirement plans | | | 217,029 | |
Other assets | | | 47,960 | |
Total assets | | | 759,086,973 | |
| |
Liabilities: | | | | |
Payable for: | | | | |
Investments purchased | | | 8,025,124 | |
Fund shares reacquired | | | 572,298 | |
Collateral upon return of securities loaned | | | 3,884,250 | |
Accrued fees to affiliates | | | 583,199 | |
Accrued trustees’ and officers’ fees and benefits | | | 3,756 | |
Accrued other operating expenses | | | 371,837 | |
Trustee deferred compensation and retirement plans | | | 245,176 | |
Total liabilities | | | 13,685,640 | |
Net assets applicable to shares outstanding | | $ | 745,401,333 | |
| |
Net assets consist of: | | | | |
Shares of beneficial interest | | $ | 433,163,293 | |
Undistributed net investment income (loss) | | | (1,889,777 | ) |
Undistributed net realized gain | | | 15,783,815 | |
Net unrealized appreciation | | | 298,344,002 | |
| | | $ | 745,401,333 | |
| | | | |
Net Assets: | | | | |
Class A | | $ | 310,505,418 | |
Class B | | $ | 3,335,233 | |
Class C | | $ | 29,930,133 | |
Class Y | | $ | 17,205,328 | |
Investor Class | | $ | 384,282,558 | |
Class R5 | | $ | 132,374 | |
Class R6 | | $ | 10,289 | |
|
Shares outstanding, no par value,
with an unlimited number of shares authorized: | |
Class A | | | 7,804,958 | |
Class B | | | 97,349 | |
Class C | | | 911,329 | |
Class Y | | | 427,908 | |
Investor Class | | | 9,720,066 | |
Class R5 | | | 2,869 | |
Class R6 | | | 223 | |
Class A: | | | | |
Net asset value per share | | $ | 39.78 | |
Maximum offering price per share | | | | |
(Net asset value of $39.78 ¸ 94.50%) | | $ | 42.10 | |
Class B: | | | | |
Net asset value and offering price per share | | $ | 34.26 | |
Class C: | | | | |
Net asset value and offering price per share | | $ | 32.84 | |
Class Y: | | | | |
Net asset value and offering price per share | | $ | 40.21 | |
Investor Class: | | | | |
Net asset value and offering price per share | | $ | 39.53 | |
Class R5: | | | | |
Net asset value and offering price per share | | $ | 46.14 | |
Class R6: | | | | |
Net asset value and offering price per share | | $ | 46.14 | |
| * | At April 30, 2017, securities with an aggregate value of $3,776,820 were on loan to brokers. |
See accompanying Notes to Financial Statements which are an integral part of the financial statements.
12 Invesco Technology Fund
Statement of Operations
For the year ended April 30, 2017
| | | | |
Investment income: | |
Dividends (net of foreign withholding taxes of $45,410) | | $ | 5,278,275 | |
Dividends from affiliated money market funds (includes securities lending income of $1,801) | | | 40,237 | |
Other income | | | 59,875 | |
Total investment income | | | 5,378,387 | |
| |
Expenses: | | | | |
Advisory fees | | | 4,807,955 | |
Administrative services fees | | | 183,113 | |
Distribution fees: | | | | |
Class A | | | 718,848 | |
Class B | | | 47,854 | |
Class C | | | 282,142 | |
Investor Class | | | 632,777 | |
Transfer agent fees — A, B, C, Y and Investor | | | 2,477,969 | |
Transfer agent fees — R5 | | | 194 | |
Trustees’ and officers’ fees and benefits | | | 32,362 | |
Registration and filing fees | | | 93,138 | |
Reports to shareholders | | | 397,101 | |
Professional services fees | | | 80,373 | |
Other | | | 25,324 | |
Total expenses | | | 9,779,150 | |
Less: Fees waived and expense offset arrangement(s) | | | (46,103 | ) |
Net expenses | | | 9,733,047 | |
Net investment income (loss) | | | (4,354,660 | ) |
| |
Realized and unrealized gain from: | | | | |
Net realized gain from: | | | | |
Investment securities | | | 65,543,530 | |
Foreign currencies | | | 55,636 | |
| | | | 65,599,166 | |
Change in net unrealized appreciation of: | | | | |
Investment securities | | | 112,800,651 | |
Foreign currencies | | | 17,560 | |
| | | | 112,818,211 | |
Net realized and unrealized gain | | | 178,417,377 | |
Net increase in net assets resulting from operations | | $ | 174,062,717 | |
See accompanying Notes to Financial Statements which are an integral part of the financial statements.
13 Invesco Technology Fund
Statement of Changes in Net Assets
For the years ended April 30, 2017 and 2016
| | | | | | | | |
| | | 2017 | | | 2016 | |
Operations: | | | | | | | | |
Net investment income (loss) | | $ | (4,354,660 | ) | | $ | (4,961,403 | ) |
Net realized gain (loss) | | | 65,599,166 | | | | (4,591,346 | ) |
Change in net unrealized appreciation (depreciation) | | | 112,818,211 | | | | (41,284,425 | ) |
Net increase (decrease) in net assets resulting from operations | | | 174,062,717 | | | | (50,837,174 | ) |
| | |
Distributions to shareholders from net realized gains: | | | | | | | | |
Class A | | | (18,169,506 | ) | | | (21,588,723 | ) |
Class B | | | (321,417 | ) | | | (565,799 | ) |
Class C | | | (2,092,883 | ) | | | (2,439,662 | ) |
Class Y | | | (641,439 | ) | | | (632,960 | ) |
Investor Class | | | (22,522,576 | ) | | | (24,548,720 | ) |
Class R5 | | | (6,905 | ) | | | (26,205 | ) |
Total distributions from net realized gains | | | (43,754,726 | ) | | | (49,802,069 | ) |
| | |
Share transactions–net: | | | | | | | | |
Class A | | | (23,530,131 | ) | | | 12,277,080 | |
Class B | | | (3,157,349 | ) | | | (2,785,580 | ) |
Class C | | | (2,822,995 | ) | | | 2,094,880 | |
Class Y | | | 5,692,376 | | | | 1,543,377 | |
Investor Class | | | (13,545,304 | ) | | | (4,667,465 | ) |
Class R5 | | | (366,913 | ) | | | (516,716 | ) |
Class R6 | | | 10,000 | | | | — | |
Net increase (decrease) in net assets resulting from share transactions | | | (37,720,316 | ) | | | 7,945,576 | |
Net increase (decrease) in net assets | | | 92,587,675 | | | | (92,693,667 | ) |
| | |
Net assets: | | | | | | | | |
Beginning of year | | | 652,813,658 | | | | 745,507,325 | |
End of year (includes undistributed net investment income (loss) of $(1,889,777) and $(1,494,841), respectively) | | $ | 745,401,333 | | | $ | 652,813,658 | |
Notes to Financial Statements
April 30, 2017
NOTE 1—Significant Accounting Policies
Invesco Technology Fund (the “Fund”) is a series portfolio of AIM Sector Funds (Invesco Sector Funds) (the “Trust”). The Trust is a Delaware statutory trust registered under the Investment Company Act of 1940, as amended (the “1940 Act”), as an open-end series management investment company consisting of ten separate portfolios, each authorized to issue an unlimited number of shares of beneficial interest. The assets, liabilities and operations of each portfolio are accounted for separately. Information presented in these financial statements pertains only to the Fund. Matters affecting each portfolio or class will be voted on exclusively by the shareholders of such portfolio or class.
The Fund’s investment objective is long-term growth of capital.
The Fund currently consists of seven different classes of shares: Class A, Class B, Class C, Class Y, Investor Class, Class R5 and Class R6. On April 4, 2017, the Fund began offering Class R6 shares. Class Y and Investor Class shares are available only to certain investors. Class A shares are sold with a front-end sales charge unless certain waiver criteria are met and under certain circumstances load waived shares may be subject to contingent deferred sales charges (“CDSC”). Class C shares are sold with a CDSC. Class Y, Investor Class, Class R5 and Class R6 shares are sold at net asset value. Effective November 30, 2010, new or additional investments in Class B shares are no longer permitted. Existing shareholders of Class B shares may continue to reinvest dividends and capital gains distributions in Class B shares until they convert to Class A shares. Also, shareholders in Class B shares will be able to exchange those shares for Class B shares of other Invesco Funds offering such shares until they convert to Class A shares. Generally, Class B shares will automatically convert to Class A shares on or about the month-end, which is at least eight years after the date of purchase. Redemption of Class B shares prior to the conversion date will be subject to a CDSC.
The Fund is an investment company and accordingly follows the investment company accounting and reporting guidance in accordance with Financial Accounting Standards Board Accounting Standards Codification Topic 946, Financial Services — Investment Companies.
The following is a summary of the significant accounting policies followed by the Fund in the preparation of its financial statements.
| A. | Security Valuations — Securities, including restricted securities, are valued according to the following policy. |
A security listed or traded on an exchange (except convertible securities) is valued at its last sales price or official closing price as of the close of the customary trading session on the exchange where the security is principally traded, or lacking any sales or official closing price on a
14 Invesco Technology Fund
particular day, the security may be valued at the closing bid price on that day. Securities traded in the over-the-counter market are valued based on prices furnished by independent pricing services or market makers. When such securities are valued by an independent pricing service they may be considered fair valued. Futures contracts are valued at the final settlement price set by an exchange on which they are principally traded. Listed options are valued at the mean between the last bid and asked prices from the exchange on which they are principally traded. Options not listed on an exchange are valued by an independent source at the mean between the last bid and asked prices. For purposes of determining net asset value (“NAV”) per share, futures and option contracts generally are valued 15 minutes after the close of the customary trading session of the New York Stock Exchange (“NYSE”).
Investments in open-end and closed-end registered investment companies that do not trade on an exchange are valued at the end-of-day net asset value per share. Investments in open-end and closed-end registered investment companies that trade on an exchange are valued at the last sales price or official closing price as of the close of the customary trading session on the exchange where the security is principally traded.
Debt obligations (including convertible securities) and unlisted equities are fair valued using an evaluated quote provided by an independent pricing service. Evaluated quotes provided by the pricing service may be determined without exclusive reliance on quoted prices, and may reflect appropriate factors such as institution-size trading in similar groups of securities, developments related to specific securities, dividend rate (for unlisted equities), yield (for debt obligations), quality, type of issue, coupon rate (for debt obligations), maturity (for debt obligations), individual trading characteristics and other market data. Debt obligations are subject to interest rate and credit risks. In addition, all debt obligations involve some risk of default with respect to interest and/or principal payments.
Foreign securities’ (including foreign exchange contracts) prices are converted into U.S. dollar amounts using the applicable exchange rates as of the close of the NYSE. If market quotations are available and reliable for foreign exchange-traded equity securities, the securities will be valued at the market quotations. Because trading hours for certain foreign securities end before the close of the NYSE, closing market quotations may become unreliable. If between the time trading ends on a particular security and the close of the customary trading session on the NYSE, events occur that the Adviser determines are significant and make the closing price unreliable, the Fund may fair value the security. If the event is likely to have affected the closing price of the security, the security will be valued at fair value in good faith using procedures approved by the Board of Trustees. Adjustments to closing prices to reflect fair value may also be based on a screening process of an independent pricing service to indicate the degree of certainty, based on historical data, that the closing price in the principal market where a foreign security trades is not the current value as of the close of the NYSE. Foreign securities’ prices meeting the approved degree of certainty that the price is not reflective of current value will be priced at the indication of fair value from the independent pricing service. Multiple factors may be considered by the independent pricing service in determining adjustments to reflect fair value and may include information relating to sector indices, American Depositary Receipts and domestic and foreign index futures. Foreign securities may have additional risks including exchange rate changes, potential for sharply devalued currencies and high inflation, political and economic upheaval, the relative lack of issuer information, relatively low market liquidity and the potential lack of strict financial and accounting controls and standards.
Securities for which market prices are not provided by any of the above methods may be valued based upon quotes furnished by independent sources. The last bid price may be used to value equity securities. The mean between the last bid and asked prices is used to value debt obligations, including corporate loans.
Securities for which market quotations are not readily available or became unreliable are valued at fair value as determined in good faith by or under the supervision of the Trust’s officers following procedures approved by the Board of Trustees. Issuer specific events, market trends, bid/asked quotes of brokers and information providers and other market data may be reviewed in the course of making a good faith determination of a security’s fair value.
The Fund may invest in securities that are subject to interest rate risk, meaning the risk that the prices will generally fall as interest rates rise and, conversely, the prices will generally rise as interest rates fall. Specific securities differ in their sensitivity to changes in interest rates depending on their individual characteristics. Changes in interest rates may result in increased market volatility, which may affect the value and/or liquidity of certain Fund investments.
Valuations change in response to many factors including the historical and prospective earnings of the issuer, the value of the issuer’s assets, general economic conditions, interest rates, investor perceptions and market liquidity. Because of the inherent uncertainties of valuation, the values reflected in the financial statements may materially differ from the value received upon actual sale of those investments.
| B. | Securities Transactions and Investment Income — Securities transactions are accounted for on a trade date basis. Realized gains or losses on sales are computed on the basis of specific identification of the securities sold. Interest income (net of withholding tax, if any) is recorded on the accrual basis from settlement date. Dividend income (net of withholding tax, if any) is recorded on the ex-dividend date. |
The Fund may periodically participate in litigation related to Fund investments. As such, the Fund may receive proceeds from litigation settlements. Any proceeds received are included in the Statement of Operations as realized gain (loss) for investments no longer held and as unrealized gain (loss) for investments still held.
Brokerage commissions and mark ups are considered transaction costs and are recorded as an increase to the cost basis of securities purchased and/or a reduction of proceeds on a sale of securities. Such transaction costs are included in the determination of net realized and unrealized gain (loss) from investment securities reported in the Statement of Operations and the Statement of Changes in Net Assets and the net realized and unrealized gains (losses) on securities per share in the Financial Highlights. Transaction costs are included in the calculation of the Fund’s net asset value and, accordingly, they reduce the Fund’s total returns. These transaction costs are not considered operating expenses and are not reflected in net investment income reported in the Statement of Operations and the Statement of Changes in Net Assets, or the net investment income per share and the ratios of expenses and net investment income reported in the Financial Highlights, nor are they limited by any expense limitation arrangements between the Fund and the investment adviser.
The Fund allocates income and realized and unrealized capital gains and losses to a class based on the relative net assets of each class.
| C. | Country Determination — For the purposes of making investment selection decisions and presentation in the Schedule of Investments, the investment adviser may determine the country in which an issuer is located and/or credit risk exposure based on various factors. These factors include the laws of the country under which the issuer is organized, where the issuer maintains a principal office, the country in which the issuer derives 50% or more of its total revenues and the country that has the primary market for the issuer’s securities, as well as other criteria. Among the other criteria that may be evaluated for making this determination are the country in which the issuer maintains 50% or more of its assets, |
15 Invesco Technology Fund
| | the type of security, financial guarantees and enhancements, the nature of the collateral and the sponsor organization. Country of issuer and/or credit risk exposure has been determined to be the United States of America, unless otherwise noted. |
| D. | Distributions — Distributions from net investment income and net realized capital gain, if any, are generally declared and paid annually and recorded on the ex-dividend date. The Fund may elect to treat a portion of the proceeds from redemptions as distributions for federal income tax purposes. |
| E. | Federal Income Taxes — The Fund intends to comply with the requirements of Subchapter M of the Internal Revenue Code of 1986, as amended (the “Internal Revenue Code”), necessary to qualify as a regulated investment company and to distribute substantially all of the Fund’s taxable earnings to shareholders. As such, the Fund will not be subject to federal income taxes on otherwise taxable income (including net realized capital gain) that is distributed to shareholders. Therefore, no provision for federal income taxes is recorded in the financial statements. |
The Fund recognizes the tax benefits of uncertain tax positions only when the position is more likely than not to be sustained. Management has analyzed the Fund’s uncertain tax positions and concluded that no liability for unrecognized tax benefits should be recorded related to uncertain tax positions. Management is not aware of any tax positions for which it is reasonably possible that the total amounts of unrecognized tax benefits will change materially in the next 12 months.
The Fund files tax returns in the U.S. Federal jurisdiction and certain other jurisdictions. Generally, the Fund is subject to examinations by such taxing authorities for up to three years after the filing of the return for the tax period.
| F. | Expenses — Fees provided for under the Rule 12b-1 plan of a particular class of the Fund are charged to the operations of such class. Transfer agency fees and expenses and other shareholder recordkeeping fees and expenses attributable to Class R5 and Class R6 are allocated to each share class based on relative net assets. Sub-accounting fees attributable to Class R5 are charged to the operations of the class. Transfer agency fees and expenses and other shareholder recordkeeping fees and expenses relating to all other classes are allocated among those classes based on relative net assets. All other expenses are allocated among the classes based on relative net assets. |
| G. | Accounting Estimates — The preparation of financial statements in conformity with accounting principles generally accepted in the United States of America (“GAAP”) requires management to make estimates and assumptions that affect the reported amounts of assets and liabilities at the date of the financial statements and the reported amounts of revenues and expenses during the reporting period including estimates and assumptions related to taxation. Actual results could differ from those estimates by a significant amount. In addition, the Fund monitors for material events or transactions that may occur or become known after the period-end date and before the date the financial statements are released to print. |
| H. | Indemnifications — Under the Trust’s organizational documents, each Trustee, officer, employee or other agent of the Trust is indemnified against certain liabilities that may arise out of the performance of their duties to the Fund. Additionally, in the normal course of business, the Fund enters into contracts, including the Fund’s servicing agreements, that contain a variety of indemnification clauses. The Fund’s maximum exposure under these arrangements is unknown as this would involve future claims that may be made against the Fund that have not yet occurred. The risk of material loss as a result of such indemnification claims is considered remote. |
| I. | Securities Lending — The Fund may lend portfolio securities having a market value up to one-third of the Fund’s total assets. Such loans are secured by collateral equal to no less than the market value of the loaned securities determined daily by the securities lending provider. Such collateral will be cash or debt securities issued or guaranteed by the U.S. Government or any of its sponsored agencies. Cash collateral received in connection with these loans is invested in short-term money market instruments or affiliated money market funds and is shown as such on the Schedule of Investments. The Fund bears the risk of loss with respect to the investment of collateral. It is the Fund’s policy to obtain additional collateral from or return excess collateral to the borrower by the end of the next business day, following the valuation date of the securities loaned. Therefore, the value of the collateral held may be temporarily less than the value of the securities on loan. When loaning securities, the Fund retains certain benefits of owning the securities, including the economic equivalent of dividends or interest generated by the security. Lending securities entails a risk of loss to the Fund if, and to the extent that, the market value of the securities loaned were to increase and the borrower did not increase the collateral accordingly, and the borrower failed to return the securities. The securities loaned are subject to termination at the option of the borrower or the Fund. Upon termination, the borrower will return to the Fund the securities loaned and the Fund will return the collateral. Upon the failure of the borrower to return the securities, collateral may be liquidated and the securities may be purchased on the open market to replace the loaned securities. The Fund could experience delays and costs in gaining access to the collateral and the securities may lose value during the delay which could result in potential losses to the Fund. Some of these losses may be indemnified by the lending agent. The Fund bears the risk of any deficiency in the amount of the collateral available for return to the borrower due to any loss on the collateral invested. Dividends received on cash collateral investments for securities lending transactions, which are net of compensation to counterparties, are included in Dividends from affiliated money market funds on the Statement of Operations. The aggregate value of securities out on loan, if any, is shown as a footnote on the Statement of Assets and Liabilities. |
| J. | Foreign Currency Translations — Foreign currency is valued at the close of the NYSE based on quotations posted by banks and major currency dealers. Portfolio securities and other assets and liabilities denominated in foreign currencies are translated into U.S. dollar amounts at date of valuation. Purchases and sales of portfolio securities (net of foreign taxes withheld on disposition) and income items denominated in foreign currencies are translated into U.S. dollar amounts on the respective dates of such transactions. The Fund does not separately account for the portion of the results of operations resulting from changes in foreign exchange rates on investments and the fluctuations arising from changes in market prices of securities held. The combined results of changes in foreign exchange rates and the fluctuation of market prices on investments (net of estimated foreign tax withholding) are included with the net realized and unrealized gain or loss from investments in the Statement of Operations. Reported net realized foreign currency gains or losses arise from (1) sales of foreign currencies, (2) currency gains or losses realized between the trade and settlement dates on securities transactions, and (3) the difference between the amounts of dividends, interest, and foreign withholding taxes recorded on the Fund’s books and the U.S. dollar equivalent of the amounts actually received or paid. Net unrealized foreign currency gains and losses arise from changes in the fair values of assets and liabilities, other than investments in securities at fiscal period end, resulting from changes in exchange rates. |
The Fund may invest in foreign securities, which may be subject to foreign taxes on income, gains on investments or currency repatriation, a portion of which may be recoverable. Foreign taxes, if any, are recorded based on the tax regulations and rates that exist in the foreign markets in which the Fund invests and are shown in the Statement of Operations.
16 Invesco Technology Fund
| K. | Forward Foreign Currency Contracts — The Fund may engage in foreign currency transactions either on a spot (i.e. for prompt delivery and settlement) basis, or through forward foreign currency contracts, to manage or minimize currency or exchange rate risk. |
The Fund may also enter into forward foreign currency contracts for the purchase or sale of a security denominated in a foreign currency in order to “lock in” the U.S. dollar price of that security, or the Fund may also enter into forward foreign currency contracts that do not provide for physical settlement of the two currencies, but instead are settled by a single cash payment calculated as the difference between the agreed upon exchange rate and the spot rate at settlement based upon an agreed upon notional amount (non-deliverable forwards). The Fund will set aside liquid assets in an amount equal to the daily mark-to-market obligation for forward foreign currency contracts.
A forward foreign currency contract is an obligation between two parties (“Counterparties”) to purchase or sell a specific currency for an agreed-upon price at a future date. The use of forward foreign currency contracts does not eliminate fluctuations in the price of the underlying securities the Fund owns or intends to acquire but establishes a rate of exchange in advance. Fluctuations in the value of these contracts are measured by the difference in the contract date and reporting date exchange rates and are recorded as unrealized appreciation (depreciation) until the contracts are closed. When the contracts are closed, realized gains (losses) are recorded. Realized and unrealized gains (losses) on the contracts are included in the Statement of Operations. The primary risks associated with forward foreign currency contracts include failure of the Counterparty to meet the terms of the contract and the value of the foreign currency changing unfavorably. These risks may be in excess of the amounts reflected in the Statement of Assets and Liabilities.
| L. | Other Risks — The Fund’s investments are concentrated in a comparatively narrow segment of the economy, which may make the Fund more volatile. |
Many products and services offered in technology-related industries are subject to rapid obsolescence, which may lower the value of the issuers in this sector.
NOTE 2—Advisory Fees and Other Fees Paid to Affiliates
The Trust has entered into a master investment advisory agreement with Invesco Advisers, Inc. (the “Adviser” or “Invesco”). Under the terms of the investment advisory agreement, the Fund pays an advisory fee to the Adviser based on the annual rate of the Fund’s average daily net assets as follows:
| | | | | | | | |
| Average Daily Net Assets | | Rate | |
First $350 million | | | 0 | .75% | | | | |
Next $350 million | | | 0 | .65% | | | | |
Next $1.3 billion | | | 0 | .55% | | | | |
Next $2 billion | | | 0 | .45% | | | | |
Next $2 billion | | | 0 | .40% | | | | |
Next $2 billion | | | 0 | .375% | | | | |
Over $8 billion | | | 0 | .35% | | | | |
For the year ended April 30, 2017, the effective advisory fees incurred by the Fund was 0.70%.
Under the terms of a master sub-advisory agreement between the Adviser and each of Invesco Asset Management Deutschland GmbH, Invesco Asset Management Limited, Invesco Asset Management (Japan) Limited, Invesco Hong Kong Limited, Invesco Senior Secured Management, Inc. and Invesco Canada Ltd. (collectively, the “Affiliated Sub-Advisers”) the Adviser, not the Fund, will pay 40% of the fees paid to the Adviser to any such Affiliated Sub-Adviser(s) that provide(s) discretionary investment management services to the Fund based on the percentage of assets allocated to such Affiliated Sub-Adviser(s).
The Adviser has contractually agreed, through at least June 30, 2018, to waive advisory fees and/or reimburse expenses of all shares to the extent necessary to limit total annual fund operating expenses after fee waiver and/or expense reimbursement (excluding certain items discussed above) of Class A, Class B, Class C, Class Y, Investor Class, Class R5 and Class R6 shares to 2.00%, 2.75%, 2.75%, 1.75%, 2.00%, 1.75% and 1.75%, respectively, of average daily net assets (the “expense limits”). In determining the Adviser’s obligation to waive advisory fees and/or reimburse expenses, the following expenses are not taken into account, and could cause the total annual fund operating expenses after fee waiver and/or expense reimbursement to exceed the numbers reflected above: (1) interest; (2) taxes; (3) dividend expense on short sales; (4) extraordinary or non-routine items, including litigation expenses; and (5) expenses that the Fund has incurred but did not actually pay because of an expense offset arrangement. Unless Invesco continues the fee waiver agreement, it will terminate on June 30, 2018. During its term, the fee waiver agreement cannot be terminated or amended to increase the expense limits without approval of the Board of Trustees. The Adviser did not waive fees and/or reimburse expenses during the period under these expense limits.
Further, the Adviser has contractually agreed, through at least June 30, 2019, to waive the advisory fee payable by the Fund in an amount equal to 100% of the net advisory fees the Adviser receives from the affiliated money market funds on investments by the Fund of uninvested cash (excluding investments of cash collateral from securities lending) in such affiliated money market funds.
For the year ended April 30, 2017, the Adviser waived advisory fees of $14,211.
The Trust has entered into a master administrative services agreement with Invesco pursuant to which the Fund has agreed to pay Invesco for certain administrative costs incurred in providing accounting services to the Fund. For the year ended April 30, 2017, expenses incurred under the agreement are shown in the Statement of Operations as Administrative services fees.
The Trust has entered into a transfer agency and service agreement with Invesco Investment Services, Inc. (“IIS”) pursuant to which the Fund has agreed to pay IIS a fee for providing transfer agency and shareholder services to the Fund and reimburse IIS for certain expenses incurred by IIS in the course of providing such services. IIS may make payments to intermediaries that provide omnibus account services, sub-accounting services and/or networking services. All fees payable by IIS to intermediaries that provide omnibus account services or sub-accounting are charged back to the Fund, subject to certain limitations approved by the Trust’s Board of Trustees. For the year ended April 30, 2017, expenses incurred under the agreement are shown in the Statement of Operations as Transfer agent fees.
17 Invesco Technology Fund
The Trust has entered into master distribution agreements with Invesco Distributors, Inc. (“IDI”) to serve as the distributor for the Class A, Class B, Class C, Class Y, Investor Class, Class R5 and Class R6 shares of the Fund. The Trust has adopted plans pursuant to Rule 12b-1 under the 1940 Act with respect to the Fund’s Class A, Class B, Class C and Investor Class shares (collectively, the “Plans”). The Fund, pursuant to the Plans, pays IDI compensation at the annual rate of 0.25% of the Fund’s average daily net assets of Class A shares, 1.00% of the average daily net assets of Class B and Class C shares. The Fund, pursuant to the Investor Class Plan, reimburses IDI for its allocated share of expenses incurred pursuant to the Investor Class Plan for the period, up to a maximum annual rate of 0.25% of the average daily net assets of Investor Class shares. Of the Plan payments, up to 0.25% of the average daily net assets of each class of shares may be paid to furnish continuing personal shareholder services to customers who purchase and own shares of such classes. Any amounts not paid as a service fee under the Plans would constitute an asset-based sales charge. Rules of the Financial Industry Regulatory Authority (“FINRA”) impose a cap on the total sales charges, including asset-based sales charges, that may be paid by any class of shares of the Fund. For the year ended April 30, 2017, expenses incurred under the Plans are shown in the Statement of Operations as Distribution fees.
Front-end sales commissions and CDSC (collectively, the “sales charges”) are not recorded as expenses of the Fund. Front-end sales commissions are deducted from proceeds from the sales of Fund shares prior to investment in Class A shares of the Fund. CDSC are deducted from redemption proceeds prior to remittance to the shareholder. During the year ended April 30, 2017, IDI advised the Fund that IDI retained $36,926 in front-end sales commissions from the sale of Class A shares and $3,008, $142 and $3,022 from Class A, Class B and Class C shares, respectively, for CDSC imposed on redemptions by shareholders.
For the year ended April 30, 2017, the Fund incurred $2,564 in brokerage commissions with Invesco Capital Markets, Inc., an affiliate of the Adviser and IDI, for portfolio transactions executed on behalf of the Fund.
Certain officers and trustees of the Trust are officers and directors of the Adviser, IIS and/or IDI.
NOTE 3—Additional Valuation Information
GAAP defines fair value as the price that would be received to sell an asset or paid to transfer a liability in an orderly transaction between market participants at the measurement date, under current market conditions. GAAP establishes a hierarchy that prioritizes the inputs to valuation methods, giving the highest priority to readily available unadjusted quoted prices in an active market for identical assets (Level 1) and the lowest priority to significant unobservable inputs (Level 3), generally when market prices are not readily available or are unreliable. Based on the valuation inputs, the securities or other investments are tiered into one of three levels. Changes in valuation methods may result in transfers in or out of an investment’s assigned level:
| | Level 1 — | Prices are determined using quoted prices in an active market for identical assets. |
| | Level 2 — | Prices are determined using other significant observable inputs. Observable inputs are inputs that other market participants may use in pricing a security. These may include quoted prices for similar securities, interest rates, prepayment speeds, credit risk, yield curves, loss severities, default rates, discount rates, volatilities and others. |
| | Level 3 — | Prices are determined using significant unobservable inputs. In situations where quoted prices or observable inputs are unavailable (for example, when there is little or no market activity for an investment at the end of the period), unobservable inputs may be used. Unobservable inputs reflect the Fund’s own assumptions about the factors market participants would use in determining fair value of the securities or instruments and would be based on the best available information. |
The following is a summary of the tiered valuation input levels, as of April 30, 2017. The level assigned to the securities valuations may not be an indication of the risk or liquidity associated with investing in those securities. Because of the inherent uncertainties of valuation, the values reflected in the financial statements may materially differ from the value received upon actual sale of those investments.
During the year ended April 30, 2017, there were transfers from Level 2 to Level 1 of $27,114,706, due to foreign fair value adjustments.
| | | | | | | | | | | | | | | | |
| | | Level 1 | | | Level 2 | | | Level 3 | | | Total | |
Common Stocks and Other Equity Interests | | $ | 716,088,928 | | | $ | 24,349,539 | | | $ | — | | | $ | 740,438,467 | |
Money Market Funds | | | 11,224,078 | | | | — | | | | — | | | | 11,224,078 | |
Total Investments | | $ | 727,313,006 | | | $ | 24,349,539 | | | $ | — | | | $ | 751,662,545 | |
NOTE 4—Security Transactions with Affiliated Funds
The Fund is permitted to purchase or sell securities from or to certain other Invesco Funds under specified conditions outlined in procedures adopted by the Board of Trustees of the Trust. The procedures have been designed to ensure that any purchase or sale of securities by the Fund from or to another fund or portfolio that is or could be considered an affiliate by virtue of having a common investment adviser (or affiliated investment advisers), common Trustees and/or common officers complies with Rule 17a-7 of the 1940 Act. Further, as defined under the procedures, each transaction is effected at the current market price. Pursuant to these procedures, for the year ended April 30, 2017, the Fund engaged in securities purchases of $35,938.
NOTE 5—Expense Offset Arrangement(s)
The expense offset arrangement is comprised of transfer agency credits which result from balances in demand deposit accounts used by the transfer agent for clearing shareholder transactions. For the year ended April 30, 2017, the Fund received credits from this arrangement, which resulted in the reduction of the Fund’s total expenses of $31,892.
18 Invesco Technology Fund
NOTE 6—Trustees’ and Officers’ Fees and Benefits
Trustees’ and Officers’ Fees and Benefits include amounts accrued by the Fund to pay remuneration to certain Trustees and Officers of the Fund. Trustees have the option to defer compensation payable by the Fund, and Trustees’ and Officers’ Fees and Benefits also include amounts accrued by the Fund to fund such deferred compensation amounts. Those Trustees who defer compensation have the option to select various Invesco Funds in which their deferral accounts shall be deemed to be invested. Finally, certain current Trustees were eligible to participate in a retirement plan that provided for benefits to be paid upon retirement to Trustees over a period of time based on the number of years of service. The Fund may have certain former Trustees who also participate in a retirement plan and receive benefits under such plan. Trustees’ and Officers’ Fees and Benefits include amounts accrued by the Fund to fund such retirement benefits. Obligations under the deferred compensation and retirement plans represent unsecured claims against the general assets of the Fund.
NOTE 7—Cash Balances
The Fund is permitted to temporarily carry a negative or overdrawn balance in its account with State Street Bank and Trust Company, the custodian bank. Such balances, if any at period-end, are shown in the Statement of Assets and Liabilities under the payable caption Amount due custodian. To compensate the custodian bank for such overdrafts, the overdrawn Fund may either (1) leave funds as a compensating balance in the account so the custodian bank can be compensated by earning the additional interest; or (2) compensate by paying the custodian bank at a rate agreed upon by the custodian bank and Invesco, not to exceed the contractually agreed upon rate.
NOTE 8—Distributions to Shareholders and Tax Components of Net Assets
Tax Character of Distributions to Shareholders Paid During the Fiscal Years Ended April 30, 2017 and 2016:
| | | | | | | | |
| | | 2017 | | | 2016 | |
Long-term capital gain | | $ | 43,754,726 | | | $ | 49,802,069 | |
Tax Components of Net Assets at Period-End:
| | | | |
| | | 2017 | |
Undistributed long-term gain | | $ | 18,412,274 | |
Net unrealized appreciation — investments | | | 295,708,489 | |
Net unrealized appreciation — other investments | | | 7,055 | |
Temporary book/tax differences | | | (231,933 | ) |
Last-Year ordinary loss deferral | | | (1,657,845 | ) |
Shares of beneficial interest | | | 433,163,293 | |
Total net assets | | $ | 745,401,333 | |
The difference between book-basis and tax-basis unrealized appreciation (depreciation) is due to differences in the timing of recognition of gains and losses on investments for tax and book purposes. The Fund’s net unrealized appreciation difference is attributable primarily to wash sales.
The temporary book/tax differences are a result of timing differences between book and tax recognition of income and/or expenses. The Fund’s temporary book/tax differences are the result of the trustee deferral of compensation and retirement plan benefits.
Capital loss carryforward is calculated and reported as of a specific date. Results of transactions and other activity after that date may affect the amount of capital loss carryforward actually available for the Fund to utilize. Capital losses generated in years beginning after December 22, 2010 can be carried forward for an unlimited period, whereas previous losses expire in eight tax years. Capital losses with an expiration period may not be used to offset capital gains until all net capital losses without an expiration date have been utilized. Capital loss carryforwards with no expiration date will retain their character as either short-term or long-term capital losses instead of as short-term capital losses as under prior law. The ability to utilize capital loss carryforwards in the future may be limited under the Internal Revenue Code and related regulations based on the results of future transactions.
The Fund does not have a capital loss carryforward as of April 30, 2017.
NOTE 9—Investment Securities
The aggregate amount of investment securities (other than short-term securities, U.S. Treasury obligations and money market funds, if any) purchased and sold by the Fund during the year ended April 30, 2017 was $328,333,997 and $395,683,166, respectively. Cost of investments on a tax basis includes the adjustments for financial reporting purposes as of the most recently completed federal income tax reporting period-end.
| | | | |
| Unrealized Appreciation (Depreciation) of Investment Securities on a Tax Basis | |
Aggregate unrealized appreciation of investment securities | | $ | 298,959,057 | |
Aggregate unrealized (depreciation) of investment securities | | | (3,250,568 | ) |
Net unrealized appreciation of investment securities | | $ | 295,708,489 | |
Cost of investments for tax purposes is $455,954,056.
19 Invesco Technology Fund
NOTE 10—Reclassification of Permanent Differences
Primarily as a result of differing book/tax treatment of net operating losses, on April 30, 2017, undistributed net investment income (loss) was increased by $3,959,724, undistributed net realized gain was decreased by $55,637 and shares of beneficial interest was decreased by $3,904,087. This reclassification had no effect on the net assets of the Fund.
NOTE 11—Share Information
| | | | | | | | | | | | | | | | |
| | | Summary of Share Activity | |
| | | Years ended April 30, | |
| | | 2017(a) | | | 2016 | |
| | | Shares | | | Amount | | | Shares | | | Amount | |
Sold: | | | | | | | | | | | | | | | | |
Class A | | | 760,132 | | | $ | 27,857,063 | | | | 1,926,254 | | | $ | 71,790,658 | |
Class B | | | 2,916 | | | | 90,996 | | | | 3,377 | | | | 109,483 | |
Class C | | | 126,166 | | | | 3,864,997 | | | | 208,493 | | | | 6,550,960 | |
Class Y | | | 269,690 | | | | 10,186,631 | | | | 98,908 | | | | 3,634,390 | |
Investor Class | | | 382,943 | | | | 14,005,053 | | | | 389,157 | | | | 14,076,824 | |
Class R5 | | | 1,190 | | | | 48,282 | | | | 32,371 | | | | 1,385,677 | |
Class R6(b) | | | 223 | | | | 10,000 | | | | — | | | | — | |
| | | | |
Issued as reinvestment of dividends: | | | | | | | | | | | | | | | | |
Class A | | | 500,939 | | | | 17,437,672 | | | | 555,305 | | | | 20,218,651 | |
Class B | | | 10,589 | | | | 318,291 | | | | 17,341 | | | | 554,904 | |
Class C | | | 69,302 | | | | 1,997,280 | | | | 72,954 | | | | 2,244,796 | |
Class Y | | | 16,689 | | | | 586,608 | | | | 13,633 | | | | 499,641 | |
Investor Class | | | 625,393 | | | | 21,632,324 | | | | 651,719 | | | | 23,559,648 | |
Class R5 | | | 152 | | | | 6,144 | | | | 611 | | | | 25,396 | |
| | | | |
Automatic conversion of Class B shares to Class A shares: | | | | | | | | | | | | | | | | |
Class A | | | 78,207 | | | | 2,874,037 | | | | 67,911 | | | | 2,461,415 | |
Class B | | | (90,077 | ) | | | (2,874,037 | ) | | | (76,874 | ) | | | (2,461,415 | ) |
| | | | |
Reacquired: | | | | | | | | | | | | | | | | |
Class A | | | (1,998,129 | ) | | | (71,698,903 | ) | | | (2,317,080 | ) | | | (82,193,644 | ) |
Class B | | | (21,928 | ) | | | (692,599 | ) | | | (30,258 | ) | | | (988,552 | ) |
Class C | | | (287,520 | ) | | | (8,685,272 | ) | | | (220,054 | ) | | | (6,700,876 | ) |
Class Y | | | (136,910 | ) | | | (5,080,863 | ) | | | (71,023 | ) | | | (2,590,654 | ) |
Investor Class | | | (1,365,830 | ) | | | (49,182,681 | ) | | | (1,167,108 | ) | | | (42,303,937 | ) |
Class R5 | | | (10,788 | ) | | | (421,339 | ) | | | (43,236 | ) | | | (1,927,789 | ) |
Net increase (decrease) in share activity | | | (1,066,651 | ) | | $ | (37,720,316 | ) | | | 112,401 | | | $ | 7,945,576 | |
| (a) | There are entities that are record owners of more than 5% of the outstanding shares of the Fund and in the aggregate own 14% of the outstanding shares of the Fund. IDI has an agreement with these entities to sell Fund shares. The Fund, Invesco and/or Invesco affiliates may make payments to these entities, which are considered to be related to the Fund, for providing services to the Fund, Invesco and/or Invesco affiliates including but not limited to services such as securities brokerage, distribution, third party record keeping and account servicing. The Fund has no knowledge as to whether all or any portion of the shares owned of record by these entities are also owned beneficially. |
| (b) | Commencement date of April 4, 2017. |
20 Invesco Technology Fund
NOTE 12—Financial Highlights
The following schedule presents financial highlights for a share of the Fund outstanding throughout the periods indicated.
| | | | | | | | | | | | | | | | | | | | | | | | | | | | | | | | | | | | | | | | | | | | | | | | | | | | | | | | |
| | | Net asset
value,
beginning
of period | | | Net
investment
income
(loss)(a) | | | Net gains
(losses)
on securities
(both
realized and
unrealized) | | | Total from
investment
operations | | | Dividends
from net
investment
income | | | Distributions
from net
realized
gains | | | Total
distributions | | | Net asset
value,��end
of period | | | Total
return(b) | | | Net assets,
end of period
(000’s omitted) | | | Ratio of
expenses
to average
net assets
with fee waivers
and/or expenses
absorbed | | | Ratio of
expenses
to average net
assets without
fee waivers
and/or expenses
absorbed | | | Ratio of net
investment
income (loss)
to average
net assets | | | Portfolio
turnover(c) | |
Class A | | | | | | | | | | | | | | | | | |
Year ended 04/30/17 | | $ | 32.99 | | | $ | (0.23 | ) | | $ | 9.39 | | | $ | 9.16 | | | $ | — | | | $ | (2.37 | ) | | $ | (2.37 | ) | | $ | 39.78 | | | | 28.80 | % | | $ | 310,505 | | | | 1.43 | %(d) | | | 1.43 | %(d) | | | (0.65 | )%(d) | | | 49 | % |
Year ended 04/30/16 | | | 37.86 | | | | (0.26 | ) | | | (2.09 | ) | | | (2.35 | ) | | | — | | | | (2.52 | ) | | | (2.52 | ) | | | 32.99 | | | | (6.83 | ) | | | 279,234 | | | | 1.39 | | | | 1.39 | | | | (0.70 | ) | | | 46 | |
Year ended 04/30/15 | | | 37.61 | | | | (0.35 | ) | | | 5.88 | | | | 5.53 | | | | — | | | | (5.28 | ) | | | (5.28 | ) | | | 37.86 | | | | 15.27 | | | | 311,682 | | | | 1.40 | | | | 1.40 | | | | (0.89 | ) | | | 67 | |
Year ended 04/30/14 | | | 34.19 | | | | (0.30 | ) | | | 7.07 | | | | 6.77 | | | | — | | | | (3.35 | ) | | | (3.35 | ) | | | 37.61 | | | | 20.22 | | | | 287,236 | | | | 1.45 | | | | 1.45 | | | | (0.80 | ) | | | 69 | |
Year ended 04/30/13 | | | 37.33 | | | | (0.24 | )(e) | | | (1.57 | )(f) | | | (1.81 | ) | | | (0.27 | ) | | | (1.06 | ) | | | (1.33 | ) | | | 34.19 | | | | (4.70 | )(f) | | | 253,013 | | | | 1.52 | | | | 1.52 | | | | (0.70 | )(e) | | | 41 | |
Class B | | | | | | | | | | | | | | | | | |
Year ended 04/30/17 | | | 28.91 | | | | (0.44 | ) | | | 8.16 | | | | 7.72 | | | | — | | | | (2.37 | ) | | | (2.37 | ) | | | 34.26 | | | | 27.86 | | | | 3,335 | | | | 2.18 | (d) | | | 2.18 | (d) | | | (1.40 | )(d) | | | 49 | |
Year ended 04/30/16 | | | 33.73 | | | | (0.47 | ) | | | (1.83 | ) | | | (2.30 | ) | | | — | | | | (2.52 | ) | | | (2.52 | ) | | | 28.91 | | | | (7.53 | ) | | | 5,663 | | | | 2.14 | | | | 2.14 | | | | (1.45 | ) | | | 46 | |
Year ended 04/30/15 | | | 34.27 | | | | (0.58 | ) | | | 5.32 | | | | 4.74 | | | | — | | | | (5.28 | ) | | | (5.28 | ) | | | 33.73 | | | | 14.41 | | | | 9,521 | | | | 2.15 | | | | 2.15 | | | | (1.64 | ) | | | 67 | |
Year ended 04/30/14 | | | 31.64 | | | | (0.54 | ) | | | 6.52 | | | | 5.98 | | | | — | | | | (3.35 | ) | | | (3.35 | ) | | | 34.27 | | | | 19.32 | | | | 12,567 | | | | 2.20 | | | | 2.20 | | | | (1.55 | ) | | | 69 | |
Year ended 04/30/13 | | | 34.61 | | | | (0.46 | )(e) | | | (1.45 | )(f) | | | (1.91 | ) | | | — | | | | (1.06 | ) | | | (1.06 | ) | | | 31.64 | | | | (5.39 | )(f) | | | 14,979 | | | | 2.27 | | | | 2.27 | | | | (1.45 | )(e) | | | 41 | |
Class C | | | | | | | | | | | | | | | | | |
Year ended 04/30/17 | | | 27.80 | | | | (0.42 | ) | | | 7.83 | | | | 7.41 | | | | — | | | | (2.37 | ) | | | (2.37 | ) | | | 32.84 | | | | 27.85 | | | | 29,930 | | | | 2.18 | (d) | | | 2.18 | (d) | | | (1.40 | )(d) | | | 49 | |
Year ended 04/30/16 | | | 32.53 | | | | (0.45 | ) | | | (1.76 | ) | | | (2.21 | ) | | | — | | | | (2.52 | ) | | | (2.52 | ) | | | 27.80 | | | | (7.53 | ) | | | 27,898 | | | | 2.14 | | | | 2.14 | | | | (1.45 | ) | | | 46 | |
Year ended 04/30/15 | | | 33.22 | | | | (0.56 | ) | | | 5.15 | | | | 4.59 | | | | — | | | | (5.28 | ) | | | (5.28 | ) | | | 32.53 | | | | 14.40 | | | | 30,645 | | | | 2.15 | | | | 2.15 | | | | (1.64 | ) | | | 67 | |
Year ended 04/30/14 | | | 30.76 | | | | (0.53 | ) | | | 6.34 | | | | 5.81 | | | | — | | | | (3.35 | ) | | | (3.35 | ) | | | 33.22 | | | | 19.32 | | | | 27,846 | | | | 2.20 | | | | 2.20 | | | | (1.55 | ) | | | 69 | |
Year ended 04/30/13 | | | 33.68 | | | | (0.45 | )(e) | | | (1.41 | )(f) | | | (1.86 | ) | | | — | | | | (1.06 | ) | | | (1.06 | ) | | | 30.76 | | | | (5.39 | )(f) | | | 24,716 | | | | 2.27 | | | | 2.27 | | | | (1.45 | )(e) | | | 41 | |
Class Y | | | | | | | | | | | | | | | | | |
Year ended 04/30/17 | | | 33.24 | | | | (0.14 | ) | | | 9.48 | | | | 9.34 | | | | — | | | | (2.37 | ) | | | (2.37 | ) | | | 40.21 | | | | 29.13 | | | | 17,205 | | | | 1.18 | (d) | | | 1.18 | (d) | | | (0.40 | )(d) | | | 49 | |
Year ended 04/30/16 | | | 38.04 | | | | (0.17 | ) | | | (2.11 | ) | | | (2.28 | ) | | | — | | | | (2.52 | ) | | | (2.52 | ) | | | 33.24 | | | | (6.61 | ) | | | 9,256 | | | | 1.14 | | | | 1.14 | | | | (0.45 | ) | | | 46 | |
Year ended 04/30/15 | | | 37.67 | | | | (0.25 | ) | | | 5.90 | | | | 5.65 | | | | — | | | | (5.28 | ) | | | (5.28 | ) | | | 38.04 | | | | 15.58 | | | | 9,013 | | | | 1.15 | | | | 1.15 | | | | (0.64 | ) | | | 67 | |
Year ended 04/30/14 | | | 34.16 | | | | (0.21 | ) | | | 7.07 | | | | 6.86 | | | | — | | | | (3.35 | ) | | | (3.35 | ) | | | 37.67 | | | | 20.51 | | | | 5,850 | | | | 1.20 | | | | 1.20 | | | | (0.55 | ) | | | 69 | |
Year ended 04/30/13 | | | 37.31 | | | | (0.16 | )(e) | | | (1.57 | )(f) | | | (1.73 | ) | | | (0.36 | ) | | | (1.06 | ) | | | (1.42 | ) | | | 34.16 | | | | (4.46 | )(f) | | | 3,716 | | | | 1.27 | | | | 1.27 | | | | (0.45 | )(e) | | | 41 | |
Investor Class | | | | | | | | | | | | | | | | | |
Year ended 04/30/17 | | | 32.78 | | | | (0.21 | ) | | | 9.33 | | | | 9.12 | | | | — | | | | (2.37 | ) | | | (2.37 | ) | | | 39.53 | | | | 28.86 | (g) | | | 384,283 | | | | 1.35 | (d)(g) | | | 1.35 | (d)(g) | | | (0.57 | )(d)(g) | | | 49 | |
Year ended 04/30/16 | | | 37.60 | | | | (0.22 | ) | | | (2.08 | ) | | | (2.30 | ) | | | — | | | | (2.52 | ) | | | (2.52 | ) | | | 32.78 | | | | (6.73 | )(g) | | | 330,298 | | | | 1.30 | (g) | | | 1.30 | (g) | | | (0.61 | )(g) | | | 46 | |
Year ended 04/30/15 | | | 37.34 | | | | (0.31 | ) | | | 5.85 | | | | 5.54 | | | | — | | | | (5.28 | ) | | | (5.28 | ) | | | 37.60 | | | | 15.41 | (g) | | | 383,681 | | | | 1.30 | (g) | | | 1.30 | (g) | | | (0.79 | )(g) | | | 67 | |
Year ended 04/30/14 | | | 33.94 | | | | (0.27 | ) | | | 7.02 | | | | 6.75 | | | | — | | | | (3.35 | ) | | | (3.35 | ) | | | 37.34 | | | | 20.31 | (g) | | | 366,054 | | | | 1.36 | (g) | | | 1.36 | (g) | | | (0.71 | )(g) | | | 69 | |
Year ended 04/30/13 | | | 37.06 | | | | (0.22 | )(e) | | | (1.56 | )(f) | | | (1.78 | ) | | | (0.28 | ) | | | (1.06 | ) | | | (1.34 | ) | | | 33.94 | | | | (4.64 | )(f)(g) | | | 342,287 | | | | 1.48 | (g) | | | 1.48 | (g) | | | (0.66 | )(e)(g) | | | 41 | |
Class R5 | | | | | | | | | | | | | | | | | |
Year ended 04/30/17 | | | 37.74 | | | | (0.05 | ) | | | 10.82 | | | | 10.77 | | | | — | | | | (2.37 | ) | | | (2.37 | ) | | | 46.14 | | | | 29.45 | | | | 132 | | | �� | 0.92 | (d) | | | 0.92 | (d) | | | (0.14 | )(d) | | | 49 | |
Year ended 04/30/16 | | | 42.75 | | | | (0.08 | ) | | | (2.41 | ) | | | (2.49 | ) | | | — | | | | (2.52 | ) | | | (2.52 | ) | | | 37.74 | | | | (6.36 | ) | | | 465 | | | | 0.87 | | | | 0.87 | | | | (0.18 | ) | | | 46 | |
Year ended 04/30/15 | | | 41.63 | | | | (0.16 | ) | | | 6.56 | | | | 6.40 | | | | — | | | | (5.28 | ) | | | (5.28 | ) | | | 42.75 | | | | 15.91 | | | | 965 | | | | 0.87 | | | | 0.87 | | | | (0.36 | ) | | | 67 | |
Year ended 04/30/14 | | | 37.33 | | | | (0.10 | ) | | | 7.75 | | | | 7.65 | | | | — | | | | (3.35 | ) | | | (3.35 | ) | | | 41.63 | | | | 20.89 | | | | 1,457 | | | | 0.89 | | | | 0.89 | | | | (0.24 | ) | | | 69 | |
Year ended 04/30/13 | | | 40.64 | | | | (0.03 | )(e) | | | (1.70 | )(f) | | | (1.73 | ) | | | (0.52 | ) | | | (1.06 | ) | | | (1.58 | ) | | | 37.33 | | | | (4.08 | )(f) | | | 1,194 | | | | 0.89 | | | | 0.89 | | | | (0.07 | )(e) | | | 41 | |
Class R6 | | | | | | | | | | | | | | | | | |
Year ended 04/30/17(h) | | | 44.75 | | | | (0.00 | ) | | | 1.39 | | | | 1.39 | | | | — | | | | — | | | | — | | | | 46.14 | | | | 3.10 | | | | 10 | | | | 0.89 | (d)(i) | | | 0.89 | (d)(i) | | | (0.11 | )(d)(i) | | | 49 | |
| (a) | Calculated using average shares outstanding. |
| (b) | Includes adjustments in accordance with accounting principles generally accepted in the United States of America and as such, the net asset value for financial reporting purposes and the returns based upon those net asset values may differ from the net asset value and returns for shareholder transactions. Does not include sales charges and is not annualized for periods less than one year, if applicable. |
| (c) | Portfolio turnover is calculated at the fund level and is not annualized for periods less than one year, if applicable. |
| (d) | Ratios are based on average daily net assets (000’s omitted) of $287,539, $4,785, $28,214, $11,145, $353,962, $193 and $10 for Class A, Class B, Class C, Class Y, Investor Class, Class R5 and Class R6 shares, respectively. |
| (e) | Net investment income (loss) per share and the ratio of net investment income (loss) to average net assets includes significant dividends received during the period. Net investment income (loss) per share and the ratio of net investment income (loss) to average net assets excluding the significant dividends are $(0.34) and (1.00)%, $(0.56) and (1.75)%, $(0.54) and (1.75)%, $(0.26) and (0.75)%, $(0.33) and (0.96)% and $(0.14) and (0.37)% for Class A, Class B, Class C, Class Y, Investor Class and Class R5 shares, respectively. |
| (f) | Includes litigation proceeds received during the period. Had the litigation proceeds not been received net gains (losses) on securities (both realized and unrealized) per share for the year ended April 30, 2013 would have been $(1.74), $(1.62), $(1.58), $(1.74), $(1.73) and $(1.87) for Class A, Class B, Class C, Class Y, Investor Class and Class R5 shares, respectively, and total returns would have been lower. |
| (g) | The total return, ratio of expenses to average net assets and ratio of net investment income (loss) to average net assets reflect actual 12b-1 fees of 0.17%, 0.16%, 0.15%, 0.16% and 0.20% for the years ended April 30, 2017, April 30, 2016, April 30, 2015, April 30, 2014 and April 30, 2013, respectively. |
| (h) | Commencement date of April 4, 2017. |
21 Invesco Technology Fund
Report of Independent Registered Public Accounting Firm
To the Board of Trustees of AIM Sector Funds (Invesco Sector Funds)
and Shareholders of the Invesco Technology Fund:
In our opinion, the accompanying statement of assets and liabilities, including the schedule of investments, and the related statements of operations and of changes in net assets and the financial highlights present fairly, in all material respects, the financial position of the Invesco Technology Fund (one of the portfolios constituting the AIM Sector Funds (Invesco Sector Funds), hereafter referred to as the “Fund”) as of April 30, 2017, the results of its operations for the year then ended, the changes in its net assets for each of the two years in the period then ended and the financial highlights for each of the five years in the period then ended, in conformity with accounting principles generally accepted in the United States of America. These financial statements and financial highlights (hereafter referred to as “financial statements”) are the responsibility of the Fund’s management. Our responsibility is to express an opinion on these financial statements based on our audits. We conducted our audits of these financial statements in accordance with the standards of the Public Company Accounting Oversight Board (United States). Those standards require that we plan and perform the audit to obtain reasonable assurance about whether the financial statements are free of material misstatement. An audit includes examining, on a test basis, evidence supporting the amounts and disclosures in the financial statements, assessing the accounting principles used and significant estimates made by management, and evaluating the overall financial statement presentation. We believe that our audits, which included confirmation of securities as of April 30, 2017 by correspondence with the custodian and brokers, provide a reasonable basis for our opinion.
PricewaterhouseCoopers LLP
Houston, TX
June 23, 2017
22 Invesco Technology Fund
Calculating your ongoing Fund expenses
Example
As a shareholder of the Fund, you incur two types of costs: (1) transaction costs, which may include sales charges (loads) on purchase payments or contingent deferred sales charges on redemptions, if any; and (2) ongoing costs, including management fees, distribution and/or service (12b-1) fees, and other Fund expenses. This example is intended to help you understand your ongoing costs (in dollars) of investing in the Fund and to compare these costs with ongoing costs of investing in other mutual funds. With the exception of the actual ending account value and expenses of the Class R6 shares, the example is based on an investment of $1,000 invested at the beginning of the period and held for the entire period November 1, 2016 through April 30, 2017. The actual ending account value and expenses of the Class R6 shares in the example below are based on an investment of $1,000 invested as of close of business April 4, 2017 and held through April 30, 2017.
Actual expenses
The table below provides information about actual account values and actual expenses. You may use the information in this table, together with the amount you invested, to estimate the expenses that you paid over the period. Simply divide your account value by $1,000 (for example, an $8,600 account value divided by $1,000 = 8.6), then multiply the result by the number in the table under the heading entitled “Actual Expenses Paid During Period” to estimate the expenses you paid on your account during this period (as of close of business April 4, 2017 through April 30, 2017 for the Class R6 shares). Because the actual ending account value and expense information in the example is not based upon a six month period for the Class R6 shares, the ending account value and expense information may not provide a meaningful comparison to mutual funds that provide such information for a full six month period.
Hypothetical example for comparison purposes
The table below also provides information about hypothetical account values and hypothetical expenses based on the Fund’s actual expense ratio and an assumed rate of return of 5% per year before expenses, which is not the Fund’s actual return.
The hypothetical account values and expenses may not be used to estimate the actual ending account balance or expenses you paid for the period. You may use this information to compare the ongoing costs of investing in the Fund and other funds. To do so, compare this 5% hypothetical example with the 5% hypothetical examples that appear in the shareholder reports of the other funds.
Please note that the expenses shown in the table are meant to highlight your ongoing costs only and do not reflect any transaction costs, such as sales charges (loads) on purchase payments or contingent deferred sales charges on redemptions, if any. Therefore, the hypothetical information is useful in comparing ongoing costs only, and will not help you determine the relative total costs of owning different funds. In addition, if these transaction costs were included, your costs would have been higher.
| | | | | | | | | | | | | | | | | | | | | | | | |
| Class | | Beginning
Account Value
(11/01/16) | | | ACTUAL | | | HYPOTHETICAL
(5% annual return before expenses) | | | Annualized
Expense
Ratio | |
| | | Ending
Account Value
(04/30/17)1 | | | Expenses
Paid During
Period2 | | | Ending
Account Value
(04/30/17) | | | Expenses
Paid During
Period2 | | |
| A | | $ | 1,000.00 | | | $ | 1,155.60 | | | $ | 7.70 | | | $ | 1,017.65 | | | $ | 7.20 | | | | 1.44 | % |
| B | | | 1,000.00 | | | | 1,151.20 | | | | 11.68 | | | | 1,013.93 | | | | 10.94 | | | | 2.19 | |
| C | | | 1,000.00 | | | | 1,151.40 | | | | 11.68 | | | | 1,013.93 | | | | 10.94 | | | | 2.19 | |
| Y | | | 1,000.00 | | | | 1,157.00 | | | | 6.36 | | | | 1,018.89 | | | | 5.96 | | | | 1.19 | |
| Investor | | | 1,000.00 | | | | 1,156.00 | | | | 7.32 | | | | 1,018.00 | | | | 6.85 | | | | 1.37 | |
| R5 | | | 1,000.00 | | | | 1,158.00 | | | | 5.08 | | | | 1,020.08 | | | | 4.76 | | | | 0.95 | |
| R6 | | | 1,000.00 | | | | 1,031.30 | | | | 0.67 | | | | 1,020.38 | | | | 4.46 | | | | 0.89 | |
| 1 | The actual ending account value is based on the actual total return of the Fund for the period November 1, 2016 through April 30, 2017 (as of close of business April 4, 2017 through April 30, 2017 for the Class R6 shares), after actual expenses and will differ from the hypothetical ending account value which is based on the Fund’s expense ratio and a hypothetical annual return of 5% before expenses. |
| 2 | Actual expenses are equal to the Fund’s annualized expense ratio as indicated above multiplied by the average account value over the period, multiplied by 181/365 to reflect the most recent fiscal half year. For the Class R6 shares actual expenses are equal to the annualized expense ratio indicated above multiplied by the average account value over the period, multiplied by 27 (as of close of business April 4, 2017 through April 30, 2017)/365. Because the Class R6 shares have not been in existence for a full six month period, the actual ending account value and expense information shown may not provide a meaningful comparison to fund expense information of classes that show such data for a full six month period and, because the actual ending account value and expense information in the expense example covers a short time period, return and expense data may not be indicative of return and expense data for longer time periods. |
| 3 | Hypothetical expenses are equal to the annualized expense ratio indicated above multiplied by the average account value over the period, multiplied by 181/365 to reflect a one-half year period. The hypothetical ending account value and expenses may be used to compare ongoing costs of investing in Class R6 shares of the Fund and other funds because such data is based on a full six month period. |
23 Invesco Technology Fund
Tax Information
Form 1099-DIV, Form 1042-S and other year-end tax information provide shareholders with actual calendar year amounts that should be included in their tax returns. Shareholders should consult their tax advisors.
The following distribution information is being provided as required by the Internal Revenue Code or to meet a specific state’s requirement.
The Fund designates the following amounts or, if subsequently determined to be different, the maximum amount allowable for its fiscal year ended April 30, 2017:
| | | | |
Federal and State Income Tax | |
Long-Term Capital Gain Distributions | | $ | 43,754,727 | |
Qualified Dividend Income* | | | 0 | % |
Corporate Dividends Received Deduction* | | | 0 | % |
U.S. Treasury Obligations* | | | 0 | % |
| | * | The above percentages are based on ordinary income dividends paid to shareholders during the Fund’s fiscal year. |
24 Invesco Technology Fund
Proxy Results
A Special Joint Meeting (“Meeting”) of Shareholders of Invesco Technology Fund, an investment portfolio of AIM Sector Funds (Invesco Sector Funds), a Delaware statutory trust (“Trust”), was held on March 9, 2017. The Meeting was held for the following purpose:
| (1) | Elect 15 trustees to the Board, each of whom will serve until his or her successor is elected and qualified. |
| (2) | Approve an amendment to the Trust’s Agreement and Declaration of Trust that would permit fund mergers and other significant transactions upon the Board’s approval but without shareholder approval of such transactions. |
The results of the voting on the above matters were as follows:
| | | | | | | | | | | | | | | | | | |
| | | Matters | | | | | | | | Votes For | | | Votes Withheld | |
| (1)* | | David C. Arch | | | | 478,210,140 | | | | 13,802,825 | |
| | James T. Bunch | | | | 477,776,614 | | | | 14,236,351 | |
| | Bruce L. Crockett | | | | 477,904,863 | | | | 14,108,102 | |
| | Jack M. Fields | | | | 478,154,120 | | | | 13,858,845 | |
| | Martin L. Flanagan | | | | 478,366,284 | | | | 13,646,681 | |
| | Cynthia Hostetler | | | | 478,149,043 | | | | 13,863,922 | |
| | Dr. Eli Jones | | | | 478,281,396 | | | | 13,731,569 | |
| | Dr. Prema Mathai-Davis | | | | 477,927,603 | | | | 14,085,362 | |
| | Teresa M. Ressel | | | | 478,116,999 | | | | 13,895,966 | |
| | Dr. Larry Soll | | | | 477,671,696 | | | | 14,341,269 | |
| | Ann Barnett Stern | | | | 478,390,538 | | | | 13,622,427 | |
| | Raymond Stickel, Jr. | | | | 477,934,336 | | | | 14,078,629 | |
| | Philip A. Taylor | | | | 478,104,174 | | | | 13,908,791 | |
| | Robert C. Troccoli | | | | 478,368,464 | | | | 13,644,501 | |
| | Christopher L. Wilson | | | | 478,433,867 | | | | 13,579,098 | |
| | | | | |
| | | | | | | | | | | | | | | | | | |
| | | | | Votes For | | | Votes
Against | | | Votes Abstain | | | Broker Non-Votes | |
| (2)* | | Approve an amendment to the Trust’s Agreement and Declaration of Trust that would permit fund mergers and other significant transactions upon the Board’s approval but without shareholder approval of such transactions | | | 261,575,830 | | | | 26,621,916 | | | | 13,166,011 | | | | 190,648,808 | |
The Meeting was adjourned until April 11, 2017, with respect to the following proposals:
| (3) | Approve changing the fundamental investment restriction regarding the purchase or sale of physical commodities. |
| 4(a) | Approve an amendment to the current Master Intergroup Sub-Advisory Contract to add Invesco PowerShares Capital Management LLC. |
| 4(b) | Approve an amendment to the current Master Intergroup Sub-Advisory Contract to add Invesco Asset Management (India) Private Limited. |
Invesco Technology Fund did not receive sufficient shareholder votes to pass Proposals 3 and 4(a) - (b).
The results of the voting on the above matters were as follows:
| | | | | | | | | | | | | | | | | | |
| | | Matters | | Votes For | | | Votes
Against | | | Votes Abstain | | | Broker Non-Votes | |
| (3) | | Approve changing the fundamental investment restriction regarding the purchase or sale of physical commodities | | | 4,465,993 | | | | 740,085 | | | | 406,828 | | | | 3,394,665 | |
| 4(a) | | Approve an amendment to the current Master Intergroup Sub-Advisory Contract to add Invesco PowerShares Capital Management LLC | | | 4,720,609 | | | | 464,305 | | | | 428,002 | | | | 3,394,655 | |
| 4(b) | | Approve an amendment to the current Master Intergroup Sub-Advisory Contract to add Invesco Asset Management (India) Private Limited | | | 4,617,173 | | | | 561,978 | | | | 433,752 | | | | 3,394,668 | |
| * | Each of proposal 1 and 2 required approval by a combined vote of all of the portfolios of AIM Sector Funds (Invesco Sector Funds). |
25 Invesco Technology Fund
Trustees and Officers
The address of each trustee and officer is AIM Sector Funds (Invesco Sector Funds) (the “Trust”), 11 Greenway Plaza, Suite 1000, Houston, Texas 77046-1173. The trustees serve for the life of the Trust, subject to their earlier death, incapacitation, resignation, retirement or removal as more specifically provided in the Trust’s organizational documents. Each officer serves for a one year term or until their successors are elected and qualified. Column two below includes length of time served with predecessor entities, if any.
| | | | | | | | |
Name, Year of Birth and
Position(s) Held with the Trust | | Trustee and/
or Officer Since | | Principal Occupation(s)
During Past 5 Years | | Number of
Funds in Fund
Complex
Overseen by
Trustee | | Other Directorship(s)
Held by Trustee During
Past 5 Years |
| Interested Persons | | | | | | | | |
| Martin L. Flanagan1 — 1960 Trustee | | 2007 | | Executive Director, Chief Executive Officer and President, Invesco Ltd. (ultimate parent of Invesco and a global investment management firm); Trustee, The Invesco Funds; Vice Chair, Investment Company Institute; and Member of Executive Board, SMU Cox School of Business Formerly: Advisor to the Board, Invesco Advisers, Inc. (formerly known as Invesco Institutional (N.A.), Inc.); Chairman and Chief Executive Officer, Invesco Advisers, Inc. (registered investment adviser); Director, Chairman, Chief Executive Officer and President, Invesco Holding Company (US), Inc. (formerly IVZ Inc.) (holding company), Invesco Group Services, Inc. (service provider) and Invesco North American Holdings, Inc. (holding company); Director, Chief Executive Officer and President, Invesco Holding Company Limited (parent of Invesco and a global investment management firm); Director, Invesco Ltd.; Chairman, Investment Company Institute and President, Co-Chief Executive Officer, Co-President, Chief Operating Officer and Chief Financial Officer, Franklin Resources, Inc. (global investment management organization) | | 144 | | None |
Philip A. Taylor2 — 1954 Trustee and Senior Vice President | | 2006 | | Head of the Americas and Senior Managing Director, Invesco Ltd.; Director, Invesco Advisers, Inc. (formerly known as Invesco Institutional (N.A.), Inc.) (registered investment adviser); Director, Chairman, Chief Executive Officer and President, Invesco Management Group, Inc. (formerly known as Invesco Aim Management Group, Inc.) (financial services holding company); Director and Chairman, Invesco Investment Services, Inc. (formerly known as Invesco Aim Investment Services, Inc.) (registered transfer agent) Chief Executive Officer, Invesco Corporate Class Inc. (corporate mutual fund company) Director, Chairman and Chief Executive Officer, Invesco Canada Ltd. (formerly known as Invesco Trimark Ltd./Invesco Trimark Ltèe) (registered investment adviser and registered transfer agent); Trustee and Senior Vice President, The Invesco Funds; Director, Invesco Investment Advisers LLC (formerly known as Van Kampen Asset Management). Formerly: Co-Chairman, Co-President and Co-Chief Executive Officer, Invesco Advisers, Inc. (formerly known as Invesco Institutional (N.A.), Inc.) (registered investment adviser); Director, Chief Executive Officer and President, Van Kampen Exchange Corp; President and Principal Executive Officer, The Invesco Funds (other than AIM Treasurer’s Series Trust (Invesco Treasurer’s Series Trust), Short-Term Investments Trust and Invesco Management Trust); Executive Vice President, The Invesco Funds (AIM Treasurer’s Series Trust (Invesco Treasurer’s Series Trust), Short-Term Investments Trust and Invesco Management Trust only); Director and President, INVESCO Funds Group, Inc. (registered investment adviser and registered transfer agent); Director and Chairman, IVZ Distributors, Inc. (formerly known as INVESCO Distributors, Inc.) (registered broker dealer); Director, President and Chairman, Invesco Inc. (holding company), Invesco Canada Holdings Inc. (holding company), Trimark Investments Ltd./Placements Trimark Ltèe and Invesco Financial Services Ltd/Services Financiers Invesco Ltèe; Chief Executive Officer, Invesco Canada Fund Inc. (corporate mutual fund company); Director and Chairman, Van Kampen Investor Services Inc.; Director, Chief Executive Officer and President, 1371 Preferred Inc. (holding company) and Van Kampen Investments Inc.; Director and President, AIM GP Canada Inc. (general partner for limited partnerships) and Van Kampen Advisors, Inc.; Director and Chief Executive Officer, Invesco Trimark Dealer Inc. (registered broker dealer); Director, Invesco Distributors, Inc. (formerly known as Invesco Aim Distributors, Inc.) (registered broker dealer); Manager, Invesco PowerShares Capital Management LLC; Director, Chief Executive Officer and President, Invesco Advisers, Inc.; Director, Chairman, Chief Executive Officer and President, Invesco Aim Capital Management, Inc.; President, Invesco Trimark Dealer Inc. and Invesco Trimark Ltd./Invesco Trimark Ltèe; Director and President, AIM Trimark Corporate Class Inc. and AIM Trimark Canada Fund Inc.; Senior Managing Director, Invesco Holding Company Limited; Director and Chairman, Fund Management Company (former registered broker dealer); President and Principal Executive Officer, The Invesco Funds (AIM Treasurer’s Series Trust (Invesco Treasurer’s Series Trust), and Short-Term Investments Trust only); President, AIM Trimark Global Fund Inc. and AIM Trimark Canada Fund Inc. | | 144 | | None |
| 1 | Mr. Flanagan is considered an interested person (within the meaning of Section 2(a)(19) of the 1940 Act) of the Trust because he is an officer of the Adviser to the Trust, and an officer and a director of Invesco Ltd., ultimate parent of the Adviser. |
| 2 | Mr. Taylor is considered an interested person (within the meaning of Section 2(a)(19) of the 1940 Act) of the Trust because he is an officer and a director of the Adviser. |
T-1 Invesco Technology Fund
Trustees and Officers—(continued)
| | | | | | | | |
Name, Year of Birth and
Position(s) Held with the Trust | | Trustee and/
or Officer Since | | Principal Occupation(s)
During Past 5 Years | | Number of
Funds in Fund
Complex
Overseen by
Trustee | | Other Directorship(s)
Held by Trustee During
Past 5 Years |
| Independent Trustees | | | | | | | | |
Bruce L. Crockett — 1944 Trustee and Chair | | 2003 | | Chairman, Crockett Technologies Associates (technology consulting company) Formerly: Director, Captaris (unified messaging provider); Director, President and Chief Executive Officer, COMSAT Corporation; Chairman, Board of Governors of INTELSAT (international communications company); ACE Limited (insurance company); Independent Directors Council and Investment Company Institute: Member of the Audit Committee, Investment Company Institute; Member of the Executive Committee and Chair of the Governance Committee, Independent Directors Council | | 144 | | Director and Chairman of the Audit Committee, ALPS (Attorneys Liability Protection Society) (insurance company); Director and Member of the Audit Committee, Ferroglobe PLC (metallurgical company) |
David C. Arch — 1945 Trustee | | 2010 | | Chairman of Blistex Inc. (consumer health care products manufacturer); Member, World Presidents’ Organization | | 144 | | Board member of the Illinois Manufacturers’ Association |
James T. Bunch — 1942 Trustee | | 2000 | | Managing Member, Grumman Hill Group LLC (family office/private equity investments) Formerly: Chairman of the Board, Denver Film Society; Chairman of the Board of Trustees, Evans Scholarship Foundation; Chairman, Board of Governors, Western Golf Association | | 144 | | Trustee, Evans Scholarship Foundation |
Jack M. Fields — 1952 Trustee | | 2003 | | Chief Executive Officer, Twenty First Century Group, Inc. (government affairs company); and Discovery Learning Alliance (non-profit) Formerly: Owner and Chief Executive Officer, Dos Angeles Ranch L.P. (cattle, hunting, corporate entertainment); Director, Insperity, Inc. (formerly known as Administaff); Chief Executive Officer, Texana Timber LP (sustainable forestry company); Director of Cross Timbers Quail Research Ranch (non-profit); and member of the U.S. House of Representatives | | 144 | | None |
Cynthia Hostetler — 1962 Trustee | | 2017 | | Non-Executive Director and Trustee of a number of public and private business corporations Formerly: Head of Investment Funds and Private Equity, Overseas Private Investment Corporation; President, First Manhattan Bancorporation, Inc.; Attorney, Simpson Thacher & Bartlett LLP | | 144 | | Vulcan Materials Company (construction materials company); Trilinc Global Impact Fund; Aberdeen Investment Funds (4 portfolios); Artio Global Investment LLC (mutual fund complex); Edgen Group, Inc. (specialized energy and infrastructure products distributor) |
Eli Jones — 1961 Trustee | | 2016 | | Professor and Dean, Mays Business School—Texas A&M University Formerly: Professor and Dean, Walton College of Business, University of Arkansas and E.J. Ourso College of Business, Louisiana State University; Director, Arvest Bank | | 144 | | Insperity, Inc. (formerly known as Administaff) (human resources provider) |
Prema Mathai-Davis — 1950 Trustee | | 2003 | | Retired. Formerly: Chief Executive Officer, YWCA of the U.S.A. | | 144 | | None |
Teresa M. Ressel — 1962 Trustee | | 2017 | | Non-Executive Director and Trustee of a number of public and private business corporations Formerly: Chief Financial Officer, Olayan America, The Olayan Group (international investor/commercial/industrial); Chief Executive Officer, UBS Securities LLC; Group Chief Operating Officer, Americas, UBS AG; Assistant Secretary for Management & Budget and CFO, US Department of the Treasury; Chief Compliance Officer, Kaiser Permanente; Program Manager, Hewlett-Packard; Nuclear Engineering, General Dynamics Corporation | | 144 | | Atlantic Power Corporation (power generation company); ON Semiconductor Corp. (semiconductor supplier) |
Larry Soll — 1942 Trustee | | 1997 | | Retired. Formerly: Chairman, Chief Executive Officer and President, Synergen Corp. (a biotechnology company) | | 144 | | None |
Ann Barnett Stern — 1957 Trustee | | 2017 | | President and Chief Executive Officer, Houston Endowment Inc. (private philanthropic institution) Formerly: Executive Vice President and General Counsel, Texas Children’s Hospital; Attorney, Beck, Redden and Secrest, LLP; Business Law Instructor, University of St. Thomas; Attorney, Andrews & Kurth LLP | | 144 | | Federal Reserve Bank of Dallas |
Raymond Stickel, Jr. — 1944 Trustee | | 2005 | | Retired. Formerly: Director, Mainstay VP Series Funds, Inc. (25 portfolios); Partner, Deloitte & Touche | | 144 | | None |
Robert C. Troccoli — 1949 Trustee | | 2016 | | Adjunct Professor, University of Denver – Daniels College of Business Formerly: Senior Partner, KPMG LLP | | 144 | | None |
Christopher L. Wilson — 1957 Trustee | | 2017 | | Managing Partner, CT2, LLC (investing and consulting firm) Formerly: President/Chief Executive Officer, Columbia Funds, Bank of America Corporation; President/Chief Executive Officer, CDC IXIS Asset Management Services, Inc.; Principal & Director of Operations, Scudder Funds, Scudder, Stevens & Clark, Inc.; Assistant Vice President, Fidelity Investments | | 144 | | TD Asset Management USA Inc. (mutual fund complex) (22 portfolios); ISO New England, Inc. (non-profit organization managing regional electricity market) |
T-2 Invesco Technology Fund
Trustees and Officers—(continued)
| | | | | | | | |
Name, Year of Birth and
Position(s) Held with the Trust | | Trustee and/
or Officer Since | | Principal Occupation(s)
During Past 5 Years | | Number of
Funds in Fund
Complex
Overseen by
Trustee | | Other Directorship(s)
Held by Trustee During
Past 5 Years |
| Other Officers | | | | | | | | |
Sheri Morris — 1964 President, Principal Executive Officer and Treasurer | | 2003 | | President, Principal Executive Officer and Treasurer, The Invesco Funds; Vice President, Invesco Advisers, Inc. (formerly known as Invesco Institutional (N.A.), Inc.) (registered investment adviser); and Vice President, PowerShares Exchange-Traded Fund Trust, PowerShares Exchange-Traded Fund Trust II, PowerShares India Exchange-Traded Fund Trust, PowerShares Actively Managed Exchange-Traded Fund Trust and PowerShares Actively Managed Exchange-Traded Commodity Fund Trust Formerly: Vice President and Principal Financial Officer, The Invesco Funds; Vice President, Invesco Aim Advisers, Inc., Invesco Aim Capital Management, Inc. and Invesco Aim Private Asset Management, Inc.; Assistant Vice President and Assistant Treasurer, The Invesco Funds and Assistant Vice President, Invesco Advisers, Inc., Invesco Aim Capital Management, Inc. and Invesco Aim Private Asset Management, Inc.; and Treasurer, PowerShares Exchange-Traded Fund Trust, PowerShares Exchange-Traded Fund Trust II, PowerShares India Exchange-Traded Fund Trust and PowerShares Actively Managed Exchange-Traded Fund Trust | | N/A | | N/A |
Russell C. Burk — 1958 Senior Vice President and Senior Officer | | 2005 | | Senior Vice President and Senior Officer, The Invesco Funds | | N/A | | N/A |
John M. Zerr — 1962 Senior Vice President, Chief Legal Officer and Secretary | | 2006 | | Director, Senior Vice President, Secretary and General Counsel, Invesco Management Group, Inc. (formerly known as Invesco AIM Management Group, Inc.); Senior Vice President, Invesco Advisers, Inc. (formerly known as Invesco Institutional (N.A.), Inc.) (registered investment adviser); Senior Vice President and Secretary, Invesco Distributors, Inc. (formerly known as Invesco AIM Distributors, Inc.); Director, Vice President and Secretary, Invesco Investment Services, Inc. (formerly known as Invesco AIM Investment Services, Inc.) Senior Vice President, Chief Legal Officer and Secretary, The Invesco Funds; Managing Director, Invesco PowerShares Capital Management LLC; Director, Secretary and General Counsel, Invesco Investment Advisers LLC (formerly known as Van Kampen Asset Management); Secretary and General Counsel, Invesco Capital Markets, Inc. (formerly known as Van Kampen Funds Inc.) and Chief Legal Officer, PowerShares Exchange-Traded Fund Trust, PowerShares Exchange-Traded Fund Trust II, PowerShares India Exchange-Traded Fund Trust, PowerShares Actively Managed Exchange-Traded Fund Trust and PowerShares Actively Managed Exchange-Traded Commodity Fund Trust; Manager and Secretary, Invesco Indexing LLC Formerly: Director, Secretary, General Counsel and Senior Vice President, Van Kampen Exchange Corp.; Director, Vice President and Secretary, IVZ Distributors, Inc. (formerly known as INVESCO Distributors, Inc.); Director and Vice President, INVESCO Funds Group, Inc.; Director and Vice President, Van Kampen Advisors Inc.; Director, Vice President, Secretary and General Counsel, Van Kampen Investor Services Inc.; Director, Invesco Distributors, Inc. (formerly known as Invesco AIM Distributors, Inc.); Director, Senior Vice President, General Counsel and Secretary, Invesco AIM Advisers, Inc. and Van Kampen Investments Inc.; Director, Vice President and Secretary, Fund Management Company; Director, Senior Vice President, Secretary, General Counsel and Vice President, Invesco AIM Capital Management, Inc.; Chief Operating Officer and General Counsel, Liberty Ridge Capital, Inc. (an investment adviser); Vice President and Secretary, PBHG Funds (an investment company) and PBHG Insurance Series Fund (an investment company); Chief Operating Officer, General Counsel and Secretary, Old Mutual Investment Partners (a broker-dealer); General Counsel and Secretary, Old Mutual Fund Services (an administrator) and Old Mutual Shareholder Services (a shareholder servicing center); Executive Vice President, General Counsel and Secretary, Old Mutual Capital, Inc. (an investment adviser); and Vice President and Secretary, Old Mutual Advisors Funds (an investment company) | | N/A | | N/A |
Gregory G. McGreevey — 1962 Senior Vice President | | 2012 | | Senior Managing Director, Invesco Ltd.; Director, Chairman, President, and Chief Executive Officer, Invesco Advisers, Inc. (formerly known as Invesco Institutional (N.A.), Inc.) (registered investment adviser); Director, Invesco Mortgage Capital, Inc. and Invesco Senior Secured Management, Inc.; and Senior Vice President, The Invesco Funds Formerly: Assistant Vice President, The Invesco Funds | | N/A | | N/A |
Kelli Gallegos — 1970 Vice President, Principal Financial Officer and Assistant Treasurer | | 2008 | | Vice President, Principal Financial Officer and Assistant Treasurer, The Invesco Funds; Assistant Treasurer, Invesco PowerShares Capital Management LLC, PowerShares Exchange-Traded Fund Trust, PowerShares Exchange-Traded Fund Trust II, PowerShares India Exchange-Traded Fund Trust, PowerShares Actively Managed Exchange-Traded Fund Trust and PowerShares Actively Managed Exchange-Traded Commodity Fund Trust Formerly: Assistant Vice President, The Invesco Funds | | N/A | | N/A |
T-3 Invesco Technology Fund
Trustees and Officers—(continued)
| | | | | | | | |
Name, Year of Birth and
Position(s) Held with the Trust | | Trustee and/
or Officer Since | | Principal Occupation(s)
During Past 5 Years | | Number of
Funds in Fund
Complex
Overseen by
Trustee | | Other Directorship(s)
Held by Trustee During
Past 5 Years |
| Other Officers—(continued) | | | | | | | | |
Tracy Sullivan — 1962 Vice President, Chief Tax Officer and Assistant Treasurer | | 2008 | | Vice President, Chief Tax Officer and Assistant Treasurer, The Invesco Funds; Assistant Treasurer, Invesco PowerShares Capital Management LLC, PowerShares Exchange-Traded Fund Trust, PowerShares Exchange-Traded Fund Trust II, PowerShares India Exchange-Traded Fund Trust, PowerShares Actively Managed Exchange-Traded Fund Trust and PowerShares Actively Managed Exchange-Traded Commodity Fund Trust Formerly: Assistant Vice President, The Invesco Funds | | N/A | | N/A |
Crissie M. Wisdom — 1969 Anti-Money Laundering Compliance Officer | | 2013 | | Anti-Money Laundering Compliance Officer, Invesco Advisers, Inc. (formerly known as Invesco Institutional (N.A.), Inc.) (registered investment adviser), Invesco Capital Markets, Inc. (formerly known as Van Kampen Funds Inc.), Invesco Distributors, Inc., Invesco Investment Services, Inc., Invesco Management Group, Inc., The Invesco Funds, and PowerShares Exchange-Traded Fund Trust, PowerShares Exchange-Traded Fund Trust II, PowerShares India Exchange-Traded Fund Trust, PowerShares Actively Managed Exchange-Traded Fund Trust and PowerShares Actively Managed Exchange-Traded Commodity Fund Trust; Anti-Money Laundering Compliance Officer and Bank Secrecy Act Officer, INVESCO National Trust Company and Invesco Trust Company; and Fraud Prevention Manager and Controls and Risk Analysis Manager for Invesco Investment Services, Inc. Formerly: Anti-Money Laundering Compliance Officer, Van Kampen Exchange Corp. | | N/A | | N/A |
Robert R. Leveille — 1969 Chief Compliance Officer | | 2016 | | Chief Compliance Officer, Invesco Advisers, Inc. (registered investment adviser); and Chief Compliance Officer, The Invesco Funds Formerly: Chief Compliance Officer, Putnam Investments and the Putnam Funds | | N/A | | N/A |
The Statement of Additional Information of the Trust includes additional information about the Fund’s Trustees and is available upon request, without charge, by calling 1.800.959.4246. Please refer to the Fund’s Statement of Additional Information for information on the Fund’s sub-advisers.
| | | | | | | | | | |
Office of the Fund 11 Greenway Plaza, Suite 1000 Houston, TX 77046-1173 | | Investment Adviser Invesco Advisers, Inc. 1555 Peachtree Street, N.E. Atlanta, GA 30309 | |
| Distributor
Invesco Distributors, Inc. 11 Greenway Plaza, Suite 1000 Houston, TX 77046-1173 |
| |
| Auditors
PricewaterhouseCoopers LLP 1000 Louisiana Street, Suite 5800 Houston, TX 77002-5678 |
|
| | | |
| | | | | | | | | | |
Counsel to the Fund Stradley Ronon Stevens & Young, LLP 2005 Market Street, Suite 2600 Philadelphia, PA 19103-7018 | | Counsel to the Independent Trustees Goodwin Procter LLP 901 New York Avenue, N.W. Washington, D.C. 20001 | |
| Transfer Agent
Invesco Investment Services, Inc. 11 Greenway Plaza, Suite 1000 Houston, TX 77046-1173 |
| |
| Custodian
State Street Bank and Trust Company 225 Franklin Street Boston, MA 02110-2801 |
|
T-4 Invesco Technology Fund
Explore High-Conviction Investing with Invesco

Go paperless with eDelivery
Visit invesco.com/edelivery to enjoy the convenience and security of anytime electronic access to your investment documents.
With eDelivery, you can elect to have any or all of the following materials delivered straight to your inbox to download, save and print from your own computer:
∎ Fund reports and prospectuses
∎ Quarterly statements
∎ Daily confirmations
∎ Tax forms
Invesco mailing information
Send general correspondence to Invesco Investment Services, Inc., P.O. Box 219078, Kansas City, MO 64121-9078.
Important notice regarding delivery of security holder documents
To reduce Fund expenses, only one copy of most shareholder documents may be mailed to shareholders with multiple accounts at the same address (Householding). Mailing of your shareholder documents may be householded indefinitely unless you instruct us otherwise. If you do not want the mailing of these documents to be combined with those for other members of your household, please contact Invesco Investment Services, Inc. at 800 959 4246 or contact your financial institution. We will begin sending you individual copies for each account within 30 days after receiving your request.
Fund holdings and proxy voting information
The Fund provides a complete list of its holdings four times in each fiscal year, at the quarter ends. For the second and fourth quarters, the lists appear in the Fund’s semiannual and annual reports to shareholders. For the first and third quarters, the Fund files the lists with the Securities and Exchange Commission (SEC) on Form N-Q. The most recent list of portfolio holdings is available at invesco.com/completeqtrholdings. Shareholders can also look up the Fund’s Forms N-Q on the SEC website at sec.gov. Copies of the Fund’s Forms N-Q may be reviewed and copied at the SEC Public Reference Room in Washington, D.C. You can obtain information on the operation of the Public Reference Room, including information about duplicating fee charges, by calling 202 551 8090 or 800 732 0330, or by electronic request at the following email address: publicinfo@sec.gov.
The SEC file numbers for the Fund are shown below.
A description of the policies and procedures that the Fund uses to determine how to vote proxies relating to portfolio securities is available without charge, upon request, from our Client Services department at 800 959 4246 or at invesco.com/proxyguidelines. The information is also available on the SEC website, sec.gov.
| | | | |
Information regarding how the Fund voted proxies related to its portfolio securities during the most recent 12-month period ended June 30 is available at invesco.com/proxysearch. The information is also available on the SEC website, sec.gov. Invesco Advisers, Inc. is an investment adviser; it provides investment advisory services to individual and institutional clients and does not sell securities. Invesco Distributors, Inc. is the US distributor for Invesco Ltd.’s retail mutual funds, exchange-traded funds and institutional money market funds. Both are wholly owned, indirect subsidiaries of Invesco Ltd. | |  | | |
SEC file numbers: 811-03826 and 002-85905 Invesco Distributors, Inc. I-TEC-AR-1 06132017 1519
| | | | |
| | |

| | Annual Report to Shareholders | | April 30, 2017 |
| | |
| | Invesco Technology Sector Fund |
| | Nasdaq: | | |
| | A: IFOAX ∎ B: IFOBX ∎ C: IFOCX ∎ Y: IFODX |

Letters to Shareholders
| | |

Philip Taylor | | Dear Shareholders: This annual report includes information about your Fund, including performance data and a complete list of its investments as of the close of the reporting period. Inside is a discussion of how your Fund was managed and the factors that affected its performance during the reporting period. The reporting period began with stock market volatility in the US and abroad, largely the result of uncertainty about global economic growth and monetary policy. Markets declined sharply following UK voters’ decision in June to leave the European Union. Relatively quickly, however, markets recovered, reaching record highs later in the summer. Demand was strong for income-producing investments, particularly those perceived to be lower risk; this benefited bonds as well as dividend-paying stocks for much of the reporting period. While economic news in the US was generally positive during the reporting period, news overseas was less |
upbeat. The European Central Bank and central banks in China and Japan – as well as other countries – maintained extraordinarily accommodative monetary policies in response to economic weakness. After months of uncertainty, the outcome of the US presidential election in November triggered a major stock market rally, with most market indexes repeatedly reaching new highs through February. As expected, the US Federal Reserve (the Fed) raised interest rates in December 2016 and again in March 2017. In its March statement, the Fed noted that the labor market has strengthened and economic activity has expanded at a moderate pace – and that it expects those trends to continue.
Short-term market volatility can prompt some investors to abandon their investment plans – and can cause others to settle for whatever returns the market has to offer. The investment professionals at Invesco, in contrast, invest with high conviction. This means that, no matter the asset class or the strategy, each investment team has a passion to exceed. We want to help investors achieve better outcomes, such as seeking higher returns, helping mitigate risk and generating income. Of course, investing with high conviction can’t guarantee a profit or ensure success; no investment strategy can. To learn more about how we invest with high conviction, visit invesco.com/HighConviction.
You, too, can invest with high conviction by maintaining a long-term investment perspective and by working with your financial adviser on a regular basis. During periods of short-term market volatility or uncertainty, your financial adviser can keep you focused on your long-term investment goals – a new home, a child’s college education or a secure retirement. He or she also can share research about the economy, the markets and individual investment options.
Visit our website for more information on your investments
Our website, invesco.com/us, offers a wide range of market insights and investment perspectives. On the website, you’ll find detailed information about our funds, including performance, holdings and portfolio manager commentaries. You can access information about your account by completing a simple, secure online registration. To do so, select “Log In” on the right side of the homepage, and then select “Register for Individual Account Access.”
In addition to the resources accessible on our website and through our mobile app, you can obtain timely updates to help you stay informed about the markets, the economy and investing by connecting with Invesco on Twitter, LinkedIn or Facebook. You can access our blog at blog.invesco.us.com. Our goal is to provide you the information you want, when and where you want it.
Finally, I’m pleased to share with you Invesco’s commitment to both the Principles for Responsible Investment and to considering environmental, social and governance issues in our robust investment process. I invite you to learn more at invesco.com/esg.
Have questions?
For questions about your account, contact an Invesco client services representative at 800 959 4246. For Invesco-related questions or comments, please email me directly at phil@invesco.com.
All of us at Invesco look forward to serving your investment management needs. Thank you for investing with us.
Sincerely,

Philip Taylor
Senior Managing Director, Invesco Ltd.
2 Invesco Technology Sector Fund
| | |

Bruce Crockett | | Dear Fellow Shareholders: Among the many important lessons I’ve learned in more than 40 years in a variety of business endeavors is the value of a trusted advocate. As independent chair of the Invesco Funds Board, I can assure you that the members of the Board are strong advocates for the interests of investors in Invesco’s mutual funds. We work hard to represent your interests through oversight of the quality of the investment management services your funds receive and other matters important to your investment, including but not limited to: ∎ Ensuring that Invesco offers a diverse lineup of mutual funds that your financial adviser can use to strive to meet your financial needs as your investment goals change over time. ∎ Monitoring how the portfolio management teams of the Invesco funds are performing in light of changing economic and market conditions. |
| ∎ | | Assessing each portfolio management team’s investment performance within the context of the investment strategy described in the fund’s prospectus. |
| ∎ | | Monitoring for potential conflicts of interests that may impact the nature of the services that your funds receive. |
We believe one of the most important services we provide our fund shareholders is the annual review of the funds’ advisory and sub-advisory contracts with Invesco Advisers and its affiliates. This review is required by the Investment Company Act of 1940 and focuses on the nature and quality of the services Invesco provides as the adviser to the Invesco funds and the reasonableness of the fees that it charges for those services. Each year, we spend months carefully reviewing information received from Invesco and a variety of independent sources, such as performance and fee data prepared by Lipper, Inc. (a subsidiary of Broadridge Financial Solutions, Inc.), an independent, third-party firm widely recognized as a leader in its field. We also meet with our independent legal counsel and other independent advisers to review and help us assess the information that we have received. Our goal is to assure that you receive quality investment management services for a reasonable fee.
I trust the measures outlined above provide assurance that you have a worthy advocate when it comes to choosing the Invesco Funds.
As always, please contact me at bruce@brucecrockett.com with any questions or concerns you may have. On behalf of the Board, we look forward to continuing to represent your interests and serving your needs.
Sincerely,

Bruce L. Crockett
Independent Chair
Invesco Funds Board of Trustees
3 Invesco Technology Sector Fund
Management’s Discussion of Fund Performance
|
Performance summary |
For the fiscal year ended April 30, 2017, Class A shares of Invesco Technology Sector Fund (the Fund), at net asset value (NAV), outperformed the Fund’s broad market/style-specific benchmark, the NASDAQ Composite Index. Your Fund’s long-term performance appears later in this report. |
|
Fund vs. Indexes |
Total returns, 4/30/16 to 4/30/17, at net asset value (NAV). Performance shown does not include applicable contingent deferred sales charges (CDSC) or front-end sales charges, which would have reduced performance. |
| | | | | |
Class A Shares | | | | 28.52 | % |
Class B Shares | | | | 27.58 | |
Class C Shares | | | | 27.66 | |
Class Y Shares | | | | 28.82 | |
NASDAQ Composite Index▼ (Broad Market/Style-Specific Index) | | | | 28.18 | |
Lipper Science & Technology Funds Index⬛ (Peer Group Index) | | | | 32.03 | |
| | | | | |
Source(s): ▼FactSet Research Systems Inc.; ⬛Lipper Inc. | | | | | |
Market conditions and your Fund
During the fiscal year ended April 30, 2017, the US economy continued its multiyear recovery, the result of a goldilocks economy featuring moderate economic growth, continued improvement in unemployment and muted inflation. Economic indicators improved modestly but steadily during the reporting period; the declining unemployment rate combined with signs of inflation on the horizon prompted the US Federal Reserve (the Fed) to raise interest rates in December 2016 and again in March 2017. Major US stock market indexes posted gains for the reporting period, with most hitting record highs following the US presidential election. Investors hoped that the new administration’s stated goals of reducing corporate tax rates, scaling back regulations and increasing infrastructure spending, if achieved, could lead to increased economic growth.
While US and overseas stock markets were surprised by the UK’s unexpected decision in June 2016 to leave the European Union, they recovered relatively quickly. During the second half of 2016,
small-cap stocks led the US market higher, outperforming large-cap stocks. However, large-cap stocks were able to regain their leadership in the first quarter of 2017. As the fiscal year came to a close, it became clear that enacting major legislative initiatives likely to affect the stock market, including tax reform and health care, were going to be more complicated and time-consuming than anticipated. The resulting uncertainty resulted in a slight increase in market volatility at the end of the fiscal year. For the reporting period as a whole, the information technology (IT) and financials sectors outperformed the broad market; more defensive sectors such as consumer staples and utilities underperformed the broad market.
For the reporting period, the IT sector posted a strong positive return and led all sectors of the broad US stock market. The Fund’s Class A shares, at NAV, posted a double-digit positive return and outperformed the Fund’s broad market/style-specific benchmark, the NASDAQ Composite Index.
For the reporting period, Fund holdings in the software and IT services industries
were the strongest performers in traditional technology. Additionally, the Fund’s investments in the wireless telecommunication services industry added value versus the broad market/style-specific benchmark. However, some of these contributions were offset by holdings in the semiconductors and semiconductor equipment industry and the pharmaceuticals industry.
At the individual security level, Sprint was the leading contributor to Fund performance relative to the broad market/ style-specific index. Following the November presidential election, the telecommunication services sector rallied due to investor expectations of less regulation and the possibility of corporate tax cuts. Sprint outpaced the sector on renewed hope that a possible merger with T-Mobile (not a Fund holding) would be more likely to be approved. Japanese entertainment software developer and marketer Nintendo was a notable contributor to Fund performance for the reporting period. We added the company as a holding in the first quarter of 2016 just as it prepared to introduce its proprietary games on mobile gaming platforms. Nintendo shares rallied in the second quarter after the release of the company’s hit mobile game Pokémon Go. Broadcom, a designer, developer and provider of semiconductors for wireless and broadband equipment, also helped relative Fund performance. Company shares rose in the first quarter of 2017 after Apple and Samsung (not a Fund holding) reported strong revenue and earnings results. Those companies’ strong quarterly results helped fuel investor expectations for Broadcom, as the company provides a number of chips to both Apple and Samsung.
The Fund’s performance relative to the broad market/style-specific index was dampened by some underperforming names, however. QUALCOMM, a semi-
| | |
Portfolio Composition |
By sector | | % of total net assets |
| | |
| |
Information Technology | | 59.1% |
Consumer Discretionary | | 17.0 |
Health Care | | 15.5 |
Telecommunication Services | | 3.1 |
Industrials | | 2.7 |
Financials | | 1.2 |
Consumer Staples | | 1.1 |
Money Market Funds Plus Other Assets Less Liabilities | | 0.3 |
| | | | |
Top 10 Equity Holdings* |
| % of total net assets |
| | |
1. | | Apple Inc. | | 8.2% |
2. | | Amazon.com, Inc. | | 7.9 |
3. | | Alphabet Inc.-Class A | | 6.1 |
4. | | Facebook, Inc.-Class A | | 5.0 |
5. | | Microsoft Corp. | | 4.2 |
6. | | Broadcom Ltd. | | 4.0 |
7. | | DISH Network Corp.-Class A | | 3.8 |
8. | | Alibaba Group Holding Ltd.-
ADR | | 3.7 |
9. | | Sony Corp. | | 3.7 |
10. | | Visa Inc.-Class A | | 3.4 |
| | | | | |
Total Net Assets | | $88.3 million |
| | | | | |
| |
Total Number of Holdings* | | | | 41 | |
The Fund’s holdings are subject to change, and there is no assurance that the Fund will continue to hold any particular security.
*Excluding money market fund holdings.
Data presented here are as of April 30, 2017.
4 Invesco Technology Sector Fund
conductor developer, was the leading detractor from relative Fund performance for the reporting period. The stock came under pressure in the first quarter of 2017 following an unexpected lawsuit from the company’s largest customer, Apple. We subsequently reduced our exposure to the company. Bristol-Myers Squibb, a biopharmaceutical developer, manufacturer and distributor, announced disappointing results from a clinical trial in the fourth quarter of 2016 for the company’s lung cancer drug, Opdivo. The failed clinical trial was a major setback for the company, in our view, and we sold our position before the close of the reporting period. Another biopharmaceutical company, Gilead Sciences, also detracted from Fund performance after its hepatitis C drug came under pressure in the second quarter of 2016 due to concerns about pricing and the durability of the treatment. We sold our position in the company.
At the close of the reporting period, the Fund was biased toward growth technology, including biopharmaceuticals, and away from mature technology. It emphasized innovation, transformative technology and opportunities which we expect to take market share from mature companies, including the game-changing technologies of mobile, security, cloud and biopharmaceuticals. We remain optimistic about technology spending given strong corporate balance sheets and companies’ need to invest in more robust security solutions and for future growth. In our opinion, the increased pace of health care innovation is likely to continue to produce attractive long-term growth rates due to successful mapping of the human genome and recent productivity improvements, both of which have fostered faster and more effective targeting of promising therapeutics. We attempt to harness multiyear secular trends, which may benefit long-term investors regardless of near-term economic conditions.
As we’ve discussed, stocks were volatile during the fiscal year, and we caution investors against making investment decisions based on short-term performance.
We thank you for your commitment to Invesco Technology Sector Fund.
The views and opinions expressed in management’s discussion of Fund performance are those of Invesco Advisers, Inc. These views and opinions are subject to change at any time based on factors such as market and economic conditions. These views and opinions may not be relied upon as investment advice or recommendations, or as an offer for a particular security. The information is not a complete analysis of every aspect of any market, country, industry, security or the Fund. Statements of fact are from sources considered reliable, but Invesco Advisers, Inc. makes no representation or warranty as to their completeness or accuracy. Although historical performance is no guarantee of future results, these insights may help you understand our investment management philosophy.
See important Fund and, if applicable, index disclosures later in this report.
| | |

| | Erik Voss Chartered Financial Analyst, Portfolio Manager, is lead manager of Invesco |
Technology Sector Fund. He joined Invesco in 2010. Mr. Voss earned a BS in mathematics and an MS in finance from the University of Wisconsin. |

| | Janet Luby Chartered Financial Analyst, Portfolio Manager, is manager of Invesco Technology |
| Sector Fund. She joined Invesco in 2011. Ms. Luby earned a BBA in finance from Texas A&M University. She is also a Certified Public Accountant. |
Assisted by Invesco’s Large/Multi-Cap Growth Team
5 Invesco Technology Sector Fund
Your Fund’s Long-Term Performance
Results of a $10,000 Investment – Oldest Share Class(es)
Fund and index data from 4/30/07
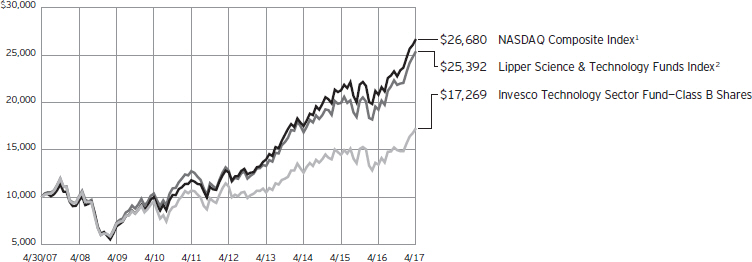
| 1 | Source: FactSet Research Systems Inc. |
Past performance cannot guarantee comparable future results.
The data shown in the chart include reinvested distributions, applicable sales charges and Fund expenses including management fees. Results for Class B shares are calculated as if a hypothetical shareholder had liquidated his entire investment in the Fund at the close of the reporting period and paid the contingent deferred sales charges, if applicable.
Index results include reinvested dividends, but they do not reflect sales charges. Performance of the peer group, if applicable, reflects fund expenses and management fees; performance of a market index does not. Performance shown in the chart and table(s) does not reflect deduction of taxes a shareholder would pay on Fund distributions or sale of Fund shares.
6 Invesco Technology Sector Fund
| | | | | | | |
| | | Average Annual Total Returns As of 4/30/17, including maximum applicable sales charges | |
| |
| | | Class A Shares | |
| | | Inception (7/28/97) | | | | 4.90 | % |
| | | 10 Years | | | | 5.65 | |
| | | 5 Years | | | | 8.49 | |
| | | 1 Year | | | | 21.42 | |
| |
| | | Class B Shares | |
| | | Inception (11/28/95) | | | | 5.22 | % |
| | | 10 Years | | | | 5.62 | |
| | | 5 Years | | | | 8.61 | |
| | | 1 Year | | | | 22.58 | |
| |
| | | Class C Shares | |
| | | Inception (7/28/97) | | | | 4.42 | % |
| | | 10 Years | | | | 5.47 | |
| | | 5 Years | | | | 8.91 | |
| | | 1 Year | | | | 26.66 | |
| |
| | | Class Y Shares | |
| | | Inception (7/28/97) | | | | 5.45 | % |
| | | 10 Years | | | | 6.52 | |
| | | 5 Years | | | | 9.99 | |
| | | 1 Year | | | | 28.82 | |
| |
| | | Performance includes litigation proceeds. Had these proceeds not been received, total returns would have been lower. | |
Effective June 1, 2010, Class A, Class B, Class C and Class I shares of the predecessor fund, Morgan Stanley Technology Fund, advised by Morgan Stanley Investment Advisors Inc. were reorganized into Class A, Class B, Class C and Class Y shares, respectively, of Invesco Technology Sector Fund. Returns shown above, prior to June 1, 2010, for Class A, Class B, Class C and Class Y shares are blended returns of the predecessor fund and Invesco Technology Sector Fund. Share class returns will differ from the predecessor fund because of different expenses.
The performance data quoted represent past performance and cannot guarantee comparable future results; current performance may be lower or higher. Please visit invesco.com/performance for the most recent month-end performance. Performance figures reflect reinvested distributions, changes in net asset value and the effect of the maximum sales charge unless otherwise stated. Investment return and principal value will fluctuate so that you may have a gain or loss when you sell shares.
| | | | | | | |
| | | Average Annual Total Returns As of 3/31/17, the most recent calendar quarter end, including maximum applicable sales charges | |
| |
| | | Class A Shares | |
| | | Inception (7/28/97) | | | | 4.77 | % |
| | | 10 Years | | | | 5.83 | |
| | | 5 Years | | | | 7.22 | |
| | | 1 Year | | | | 16.26 | |
| |
| | | Class B Shares | |
| | | Inception (11/28/95) | | | | 5.10 | % |
| | | 10 Years | | | | 5.79 | |
| | | 5 Years | | | | 7.32 | |
| | | 1 Year | | | | 17.08 | |
| |
| | | Class C Shares | |
| | | Inception (7/28/97) | | | | 4.29 | % |
| | | 10 Years | | | | 5.65 | |
| | | 5 Years | | | | 7.63 | |
| | | 1 Year | | | | 21.15 | |
| |
| | | Class Y Shares | |
| | | Inception (7/28/97) | | | | 5.32 | % |
| | | 10 Years | | | | 6.70 | |
| | | 5 Years | | | | 8.70 | |
| | | 1 Year | | | | 23.32 | |
| |
| | | Performance includes litigation proceeds. Had these proceeds not been received, total returns would have been lower. | |
The total annual Fund operating expense ratio set forth in the most recent Fund prospectus as of the date of this report for Class A, Class B, Class C and Class Y shares was 1.58%, 2.33%, 2.33% and 1.33%, respectively. The expense ratios presented above may vary from the expense ratios presented in other sections of this report that are based on expenses incurred during the period covered by this report.
Class A share performance reflects the maximum 5.50% sales charge, and Class B and Class C share performance reflects the applicable contingent deferred sales charge (CDSC) for the period involved. The CDSC on Class B shares declines from 5% beginning at the time of purchase to 0% at the beginning of the seventh year. The CDSC on Class C shares is 1% for the first year after purchase. Class Y shares do not have a front-end sales charge or a CDSC; therefore, performance is at net asset value.
The performance of the Fund’s share classes will differ primarily due to different sales charge structures and class expenses.
Fund performance reflects any applicable fee waivers and/or expense reimbursements. Had the adviser not waived fees and/or reimbursed expenses currently or in the past, returns would have been lower. See current prospectus for more information.
7 Invesco Technology Sector Fund
Invesco Technology Sector Fund’s investment objective is long-term growth of capital.
| ∎ | | Unless otherwise stated, information presented in this report is as of April 30, 2017, and is based on total net assets. |
| ∎ | | Unless otherwise noted, all data provided by Invesco. |
| ∎ | | To access your Fund’s reports/prospectus, visit invesco.com/fundreports. |
About share classes
| ∎ | | Class B shares may not be purchased for new or additional investments. Please see the prospectus for more information. |
| ∎ | | Class Y shares are available only to certain investors. Please see the prospectus for more information. |
Principal risks of investing in the Fund
| ∎ | | Depositary receipts risk. Investing in depositary receipts involves the same risks as direct investments in foreign securities. In addition, the underlying issuers of certain depositary receipts are under no obligation to distribute shareholder communications or pass through any voting rights with respect to the deposited securities to the holders of such receipts. The Fund may therefore receive less timely information or have less control than if it invested directly in the foreign issuer. |
| ∎ | | Derivatives risk. The value of a derivative instrument depends largely on (and is derived from) the value of an underlying security, currency, commodity, interest rate, index or other asset (each referred to as an underlying asset). In addition to risks relating to the underlying assets, the use of derivatives may include other, possibly greater, risks, including counterparty, leverage and liquidity risks. Counterparty risk is the risk that the counterparty to the derivative contract will default on its obligation to pay the Fund the amount owed or otherwise perform under the derivative contract. Derivatives create leverage risk because they do not require payment up front equal to the economic exposure created by owning the derivative. As a result, an adverse change in the value of the underlying asset could result in the Fund sustaining a loss that is substantially greater than the amount invested in the derivative, which may make the Fund’s returns more volatile and increase the risk of loss. Derivative |
| | instruments may also be less liquid than more traditional investments and the Fund may be unable to sell or close out its derivative positions at a desirable time or price. This risk may be more acute under adverse market conditions, during which the Fund may be most in need of liquidating its derivative positions. Derivatives may also be harder to value, less tax efficient and subject to changing government regulation that could impact the Fund’s ability to use certain derivatives or their cost. Also, derivatives used for hedging or to gain or limit exposure to a particular market segment may not provide the expected benefits, particularly during adverse market conditions. |
| ∎ | | Emerging markets securities risk. Emerging markets (also referred to as developing markets) are generally subject to greater market volatility, political, social and economic instability, uncertain trading markets and more governmental limitations on foreign investment than more developed markets. In addition, companies operating in emerging markets may be subject to lower trading volume and greater price fluctuations than companies in more developed markets. Securities law and the enforcement of systems of taxation in many emerging market countries may change quickly and unpredictably. In addition, investments in emerging markets securities may also be subject to additional transaction costs, delays in settlement procedures, and lack of timely information. |
| ∎ | | Foreign securities risk. The Fund’s foreign investments may be adversely affected by political and social instability, changes in economic or taxation policies, difficulty in enforcing obligations, decreased liquidity or increased volatility. Foreign investments also involve the risk of the possible seizure, nationalization or expropriation of the issuer or foreign deposits (in which the Fund could lose its entire investments in a certain market) and the possible |
| | | | | |
| |
| | This report must be accompanied or preceded by a currently effective Fund prospectus, which contains more complete information, including sales charges and expenses. Investors should read it carefully before investing. |
|
NOT FDIC INSURED | MAY LOSE VALUE | NO BANK GUARANTEE |
| | adoption of foreign governmental restrictions such as exchange controls. Unless the Fund has hedged its foreign securities risk, foreign securities risk also involves the risk of negative foreign currency rate fluctuations, which may cause the value of securities denominated in such foreign currency (or other instruments through which the Fund has exposure to foreign currencies) to decline in value. Currency exchange rates may fluctuate significantly over short periods of time. Currency hedging strategies, if used, are not always successful. |
| ∎ | | Growth investing risk. Growth stocks tend to be more expensive relative to the issuing company’s earnings or assets compared with other types of stock. As a result, they tend to be more sensitive to changes in, or investors’ expectations of, the issuing company’s earnings and can be more volatile. |
| ∎ | | Management risk. The Fund is actively managed and depends heavily on the Adviser’s judgment about markets, interest rates or the attractiveness, relative values, liquidity, or potential appreciation of particular investments made for the Fund’s portfolio. The Fund could experience losses if these judgments prove to be incorrect. Additionally, legislative, regulatory, or tax developments may adversely affect management of the Fund and, therefore, the ability of the Fund to achieve its investment objective. |
| ∎ | | Market risk. The market values of the Fund’s investments, and therefore the value of the Fund’s shares, will go up and down, sometimes rapidly or unpredictably. Market risk may affect a single issuer, industry or section of the economy, or it may affect the market as a whole. Individual stock prices tend to go up and down more dramatically than those of certain other types of investments, such as bonds. During a general downturn in the financial markets, multiple asset classes may decline in value. When markets perform well, there can be no assurance that specific investments held by the Fund will rise in value. |
8 Invesco Technology Sector Fund
| ∎ | | Mid-capitalization companies risk. Mid-capitalization companies tend to be more vulnerable to changing market conditions and may have more limited product lines and markets, less experienced management and fewer financial resources than larger companies. These companies’ securities may be more volatile and less liquid than those of more established companies, and their returns may vary, sometimes significantly, from the overall securities market. |
| ∎ | | Technology sector risk. The Fund will concentrate its investments in the securities of issuers engaged primarily in the communications and information industry. Technology companies are subject to intense competition, rapid obsolescence of their products, issues with obtaining financing or regulatory approvals, product incompatibility, changing consumer preferences, high required corporate capital expenditure for research and development or infrastructure and development of new products, each of which make the prices of securities issued by these companies more volatile. |
About indexes used in this report
| ∎ | | The NASDAQ Composite Index is a broad-based market index of the common stocks and similar securities listed on the Nasdaq stock market. |
| ∎ | | The Lipper Science & Technology Funds Index is an unmanaged index considered representative of science and technology funds tracked by Lipper. |
| ∎ | | The Fund is not managed to track the performance of any particular index, including the index(es) described here, and consequently, the performance of the Fund may deviate significantly from the performance of the index(es). |
| ∎ | | A direct investment cannot be made in an index. Unless otherwise indicated, index results include reinvested dividends, and they do not reflect sales charges. Performance of the peer group, if applicable, reflects fund expenses; performance of a market index does not. |
Other information
| ∎ | | CPA® and Certified Public Accountant® are trademarks owned by the American Institute of Certified Public Accountants. |
| ∎ | | The returns shown in management’s discussion of Fund performance are based on net asset values (NAVs) calculated for shareholder transactions. Generally accepted accounting principles require adjustments to be made to the net assets of the Fund at period end for financial reporting purposes, and as such, the NAVs for shareholder transactions and the returns based on those NAVs may differ from the NAVs and returns reported in the Financial Highlights. |
| ∎ | | Industry classifications used in this report are generally according to the Global Industry Classification Standard, which was developed by and is the exclusive property and a service mark of MSCI Inc. and Standard & Poor’s. |
9 Invesco Technology Sector Fund
Schedule of Investments(a)
April 30, 2017
| | | | | | | | |
| | | Shares | | | Value | |
Common Stocks & Other Equity Interests–99.66% | |
| Aerospace & Defense–2.73% | |
Raytheon Co. | | | 15,516 | | | $ | 2,408,238 | |
| | |
| Application Software–2.52% | | | | | | | | |
salesforce.com, inc.(b) | | | 25,841 | | | | 2,225,427 | |
|
| Biotechnology–8.99% | |
Alexion Pharmaceuticals, Inc.(b) | | | 13,108 | | | | 1,674,940 | |
Amgen Inc. | | | 8,011 | | | | 1,308,357 | |
Biogen Inc.(b) | | | 1,562 | | | | 423,630 | |
BioMarin Pharmaceutical Inc.(b) | | | 8,749 | | | | 838,504 | |
Celgene Corp.(b) | | | 21,338 | | | | 2,646,979 | |
Incyte Corp.(b) | | | 8,412 | | | | 1,045,443 | |
| | | | | | | | 7,937,853 | |
|
| Cable & Satellite–3.76% | |
DISH Network Corp.–Class A(b) | | | 51,587 | | | | 3,324,266 | |
|
| Consumer Electronics–3.65% | |
Sony Corp. (Japan) | | | 95,600 | | | | 3,223,686 | |
|
| Data Processing & Outsourced Services–6.61% | |
First Data Corp.–Class A(b) | | | 74,283 | | | | 1,160,301 | |
Mastercard Inc.–Class A | | | 14,285 | | | | 1,661,631 | |
Visa Inc.–Class A | | | 33,049 | | | | 3,014,730 | |
| | | | | | | | 5,836,662 | |
|
| Health Care Equipment–0.35% | |
Stryker Corp. | | | 2,270 | | | | 309,560 | |
|
| Home Entertainment Software–11.35% | |
Activision Blizzard, Inc. | | | 38,900 | | | | 2,032,525 | |
Electronic Arts Inc.(b) | | | 18,279 | | | | 1,733,215 | |
Nintendo Co., Ltd. (Japan) | | | 11,500 | | | | 2,898,755 | |
Take-Two Interactive Software, Inc.(b) | | | 28,808 | | | | 1,810,583 | |
UbiSoft Entertainment S.A. (France)(b) | | | 32,728 | | | | 1,550,801 | |
| | | | | | | | 10,025,879 | |
|
| Internet & Direct Marketing Retail–9.53% | |
Amazon.com, Inc.(b) | | | 7,575 | | | | 7,006,799 | |
Priceline Group Inc. (The)(b) | | | 765 | | | | 1,412,818 | |
| | | | | | | | 8,419,617 | |
|
| Internet Software & Services–15.97% | |
Alibaba Group Holding Ltd.–ADR (China)(b) | | | 28,239 | | | | 3,261,605 | |
Alphabet Inc.–Class A(b) | | | 5,800 | | | | 5,362,216 | |
Alphabet Inc.–Class C(b) | | | 1,223 | | | | 1,107,989 | |
Facebook, Inc.–Class A(b) | | | 29,114 | | | | 4,374,378 | |
| | | | | | | | 14,106,188 | |
|
| Life Sciences Tools & Services–1.21% | |
Thermo Fisher Scientific, Inc. | | | 6,457 | | | | 1,067,536 | |
| | | | | | | | |
| | | Shares | | | Value | |
| Managed Health Care–1.44% | | | | | | | | |
UnitedHealth Group Inc. | | | 7,263 | | | $ | 1,270,153 | |
|
| Pharmaceuticals–3.54% | |
Allergan PLC | | | 6,055 | | | | 1,476,572 | |
Eli Lilly and Co. | | | 10,758 | | | | 882,802 | |
Merck & Co., Inc. | | | 12,287 | | | | 765,849 | |
| | | | | | | | 3,125,223 | |
|
| Regional Banks–1.22% | |
SVB Financial Group(b) | | | 6,132 | | | | 1,078,864 | |
|
| Semiconductor Equipment–1.10% | |
Applied Materials, Inc. | | | 23,833 | | | | 967,858 | |
|
| Semiconductors–8.41% | |
Broadcom Ltd. | | | 16,057 | | | | 3,545,546 | |
Integrated Device Technology, Inc.(b) | | | 69,852 | | | | 1,675,749 | |
NVIDIA Corp. | | | 11,617 | | | | 1,211,653 | |
QUALCOMM, Inc. | | | 18,467 | | | | 992,417 | |
| | | | | | | | 7,425,365 | |
|
| Systems Software–4.90% | |
Microsoft Corp. | | | 54,377 | | | | 3,722,650 | |
ServiceNow, Inc.(b) | | | 6,436 | | | | 608,073 | |
| | | | | | | | 4,330,723 | |
|
| Technology Hardware, Storage & Peripherals–8.18% | |
Apple Inc. | | | 50,328 | | | | 7,229,617 | |
|
| Tobacco–1.09% | |
Philip Morris International Inc. | | | 8,671 | | | | 961,094 | |
|
| Wireless Telecommunication Services–3.11% | |
Sprint Corp.(b) | | | 304,045 | | | | 2,745,526 | |
Total Common Stocks & Other Equity Interests
(Cost $63,647,109) | | | | 88,019,335 | |
| | |
Money Market Funds–0.91% | | | | | | | | |
Government & Agency Portfolio–Institutional Class, 0.67%(c) | | | 482,523 | | | | 482,523 | |
Treasury Portfolio–Institutional Class, 0.63%(c) | | | 321,682 | | | | 321,682 | |
Total Money Market Funds
(Cost $804,205) | | | | | | | 804,205 | |
TOTAL INVESTMENTS–100.57%
(Cost $64,451,314) | | | | 88,823,540 | |
OTHER ASSETS LESS LIABILITIES–(0.57)% | | | | (502,482 | ) |
NET ASSETS–100.00% | | | $ | 88,321,058 | |
Investment Abbreviations:
| | |
| ADR | | – American Depositary Receipt |
Notes to Schedule of Investments:
| (a) | Industry and/or sector classifications used in this report are generally according to the Global Industry Classification Standard, which was developed by and is the exclusive property and a service mark of MSCI Inc. and Standard & Poor’s. |
| (b) | Non-income producing security. |
| (c) | The money market fund and the Fund are affiliated by having the same investment adviser. The rate shown is the 7-day SEC standardized yield as of April 30, 2017. |
See accompanying Notes to Financial Statements which are an integral part of the financial statements.
10 Invesco Technology Sector Fund
Statement of Assets and Liabilities
April 30, 2017
| | | | |
Assets: | | | | |
Investments, at value (Cost $63,647,109) | | $ | 88,019,335 | |
Investments in affiliated money market funds, at value and cost | | | 804,205 | |
Total investments, at value (Cost $64,451,314) | | | 88,823,540 | |
Foreign currencies, at value (Cost $560) | | | 546 | |
Receivable for: | | | | |
Investments sold | | | 730,919 | |
Fund shares sold | | | 17,412 | |
Dividends | | | 71,926 | |
Investment for trustee deferred compensation and retirement plans | | | 31,043 | |
Other assets | | | 19,669 | |
Total assets | | | 89,695,055 | |
|
Liabilities: | |
Payable for: | | | | |
Investments purchased | | | 979,796 | |
Fund shares reacquired | | | 126,543 | |
Accrued fees to affiliates | | | 122,979 | |
Accrued trustees’ and officers’ fees and benefits | | | 2,297 | |
Accrued other operating expenses | | | 108,906 | |
Trustee deferred compensation and retirement plans | | | 33,476 | |
Total liabilities | | | 1,373,997 | |
Net assets applicable to shares outstanding | | $ | 88,321,058 | |
|
Net assets consist of: | |
Shares of beneficial interest | | $ | 64,053,270 | |
Undistributed net investment income (loss) | | | (320,425 | ) |
Undistributed net realized gain | | | 215,115 | |
Net unrealized appreciation | | | 24,373,098 | |
| | | $ | 88,321,058 | |
| | | | |
Net Assets: | |
Class A | | $ | 78,058,415 | |
Class B | | $ | 336,509 | |
Class C | | $ | 7,634,832 | |
Class Y | | $ | 2,291,302 | |
|
Shares outstanding, no par value,
with an unlimited number of shares authorized: | |
Class A | | | 3,995,851 | |
Class B | | | 20,237 | |
Class C | | | 458,930 | |
Class Y | | | 111,581 | |
Class A: | | | | |
Net asset value per share | | $ | 19.53 | |
Maximum offering price per share | | | | |
(Net asset value of $19.53 ¸ 94.50%) | | $ | 20.67 | |
Class B: | | | | |
Net asset value and offering price per share | | $ | 16.63 | |
Class C: | | | | |
Net asset value and offering price per share | | $ | 16.64 | |
Class Y: | | | | |
Net asset value and offering price per share | | $ | 20.53 | |
See accompanying Notes to Financial Statements which are an integral part of the financial statements.
11 Invesco Technology Sector Fund
Statement of Operations
For the year ended April 30, 2017
| | | | |
Investment income: | |
Dividends (net of foreign withholding taxes of $5,451) | | $ | 632,432 | |
Dividends from affiliated money market funds (includes securities lending income of $120) | | | 4,467 | |
Total investment income | | | 636,899 | |
| |
Expenses: | | | | |
Advisory fees | | | 556,247 | |
Administrative services fees | | | 50,000 | |
Custodian fees | | | 8,827 | |
Distribution fees: | | | | |
Class A | | | 184,351 | |
Class B | | | 4,835 | |
Class C | | | 69,755 | |
Transfer agent fees | | | 345,692 | |
Trustees’ and officers’ fees and benefits | | | 19,283 | |
Registration and filing fees | | | 51,857 | |
Reports to shareholders | | | 88,827 | |
Professional services fees | | | 50,644 | |
Other | | | 7,610 | |
Total expenses | | | 1,437,928 | |
Less: Fees waived and expense offset arrangement(s) | | | (2,287 | ) |
Net expenses | | | 1,435,641 | |
Net investment income (loss) | | | (798,742 | ) |
| |
Realized and unrealized gain from: | | | | |
Net realized gain from: | | | | |
Investment securities | | | 4,043,850 | |
Foreign currencies | | | 6,459 | |
| | | | 4,050,309 | |
Change in net unrealized appreciation of: | | | | |
Investment securities | | | 17,587,088 | |
Foreign currencies | | | 1,876 | |
| | | | 17,588,964 | |
Net realized and unrealized gain | | | 21,639,273 | |
Net increase in net assets resulting from operations | | $ | 20,840,531 | |
See accompanying Notes to Financial Statements which are an integral part of the financial statements.
12 Invesco Technology Sector Fund
Statement of Changes in Net Assets
For the years ended April 30, 2017 and 2016
| | | | | | | | |
| | | 2017 | | | 2016 | |
Operations: | | | | | |
Net investment income (loss) | | $ | (798,742 | ) | | $ | (849,700 | ) |
Net realized gain | | | 4,050,309 | | | | 6,302,009 | |
Change in net unrealized appreciation (depreciation) | | | 17,588,964 | | | | (11,368,674 | ) |
Net increase (decrease) in net assets resulting from operations | | | 20,840,531 | | | | (5,916,365 | ) |
| | |
Distributions to shareholders from net realized gains: | | | | | | | | |
Class A | | | (1,787,949 | ) | | | — | |
Class B | | | (12,037 | ) | | | — | |
Class C | | | (203,576 | ) | | | — | |
Class Y | | | (37,959 | ) | | | — | |
Total distributions from net realized gains | | | (2,041,521 | ) | | | — | |
| | |
Share transactions–net: | | | | | | | | |
Class A | | | (8,954,867 | ) | | | (10,956,691 | ) |
Class B | | | (411,733 | ) | | | (581,865 | ) |
Class C | | | (674,151 | ) | | | (774,023 | ) |
Class Y | | | 605,411 | | | | 452,285 | |
Net increase (depreciation) in net assets resulting from share transactions | | | (9,435,340 | ) | | | (11,860,294 | ) |
Net increase (depreciation) in net assets | | | 9,363,670 | | | | (17,776,659 | ) |
| | |
Net assets: | | | | | | | | |
Beginning of year | | | 78,957,388 | | | | 96,734,047 | |
End of year (includes undistributed net investment income (loss) of $(320,425) and $(274,063), respectively) | | $ | 88,321,058 | | | $ | 78,957,388 | |
Notes to Financial Statements
April 30, 2017
NOTE 1—Significant Accounting Policies
Invesco Technology Sector Fund (the “Fund”) is a series portfolio of AIM Sector Funds (Invesco Sector Funds) (the “Trust”). The Trust is a Delaware statutory trust registered under the Investment Company Act of 1940, as amended (the “1940 Act”), as an open-end series management investment company consisting of ten separate portfolios, each authorized to issue an unlimited number of shares of beneficial interest. The assets, liabilities and operations of each portfolio are accounted for separately. Information presented in these financial statements pertains only to the Fund. Matters affecting each portfolio or class will be voted on exclusively by the shareholders of such portfolio or class.
The Fund’s investment objective is long-term growth of capital.
The Fund currently consists of four different classes of shares: Class A, Class B, Class C and Class Y. Class Y shares are available only to certain investors. Class A shares are sold with a front-end sales charge unless certain waiver criteria are met and under certain circumstances load waived shares may be subject to contingent deferred sales charges (“CDSC”). Class C shares are sold with a CDSC. Class Y shares are sold at net asset value. Effective November 30, 2010, new or additional investments in Class B shares are no longer permitted. Existing shareholders of Class B shares may continue to reinvest dividends and capital gains distributions in Class B shares until they convert to Class A shares. Also, shareholders in Class B shares will be able to exchange those shares for Class B shares of other Invesco Funds offering such shares until they convert to Class A shares. Generally, Class B shares will automatically convert to Class A shares on or about the month-end, which is at least eight years after the date of purchase. Redemption of Class B shares prior to the conversion date will be subject to a CDSC.
The Fund is an investment company and accordingly follows the investment company accounting and reporting guidance in accordance with Financial Accounting Standards Board Accounting Standards Codification Topic 946, Financial Services — Investment Companies.
The following is a summary of the significant accounting policies followed by the Fund in the preparation of its financial statements.
| A. | Security Valuations — Securities, including restricted securities, are valued according to the following policy. |
A security listed or traded on an exchange (except convertible securities) is valued at its last sales price or official closing price as of the close of the customary trading session on the exchange where the security is principally traded, or lacking any sales or official closing price on a particular day, the security may be valued at the closing bid price on that day. Securities traded in the over-the-counter market are valued based on prices furnished by independent pricing services or market makers. When such securities are valued by an independent pricing service they may be considered fair valued. Futures contracts are valued at the final settlement price set by an exchange on which they are principally traded. Listed options are valued at the mean between the last bid and asked prices from the exchange on which they are principally traded. Options not listed on an exchange are valued by an independent source at the mean between the last bid and asked prices. For purposes of determining net
13 Invesco Technology Sector Fund
asset value (“NAV”) per share, futures and option contracts generally are valued 15 minutes after the close of the customary trading session of the New York Stock Exchange (“NYSE”).
Investments in open-end and closed-end registered investment companies that do not trade on an exchange are valued at the end-of-day net asset value per share. Investments in open-end and closed-end registered investment companies that trade on an exchange are valued at the last sales price or official closing price as of the close of the customary trading session on the exchange where the security is principally traded.
Debt obligations (including convertible securities) and unlisted equities are fair valued using an evaluated quote provided by an independent pricing service. Evaluated quotes provided by the pricing service may be determined without exclusive reliance on quoted prices, and may reflect appropriate factors such as institution-size trading in similar groups of securities, developments related to specific securities, dividend rate (for unlisted equities), yield (for debt obligations), quality, type of issue, coupon rate (for debt obligations), maturity (for debt obligations), individual trading characteristics and other market data. Debt obligations are subject to interest rate and credit risks. In addition, all debt obligations involve some risk of default with respect to interest and/or principal payments.
Foreign securities’ (including foreign exchange contracts) prices are converted into U.S. dollar amounts using the applicable exchange rates as of the close of the NYSE. If market quotations are available and reliable for foreign exchange-traded equity securities, the securities will be valued at the market quotations. Because trading hours for certain foreign securities end before the close of the NYSE, closing market quotations may become unreliable. If between the time trading ends on a particular security and the close of the customary trading session on the NYSE, events occur that the Adviser determines are significant and make the closing price unreliable, the Fund may fair value the security. If the event is likely to have affected the closing price of the security, the security will be valued at fair value in good faith using procedures approved by the Board of Trustees. Adjustments to closing prices to reflect fair value may also be based on a screening process of an independent pricing service to indicate the degree of certainty, based on historical data, that the closing price in the principal market where a foreign security trades is not the current value as of the close of the NYSE. Foreign securities’ prices meeting the approved degree of certainty that the price is not reflective of current value will be priced at the indication of fair value from the independent pricing service. Multiple factors may be considered by the independent pricing service in determining adjustments to reflect fair value and may include information relating to sector indices, American Depositary Receipts and domestic and foreign index futures. Foreign securities may have additional risks including exchange rate changes, potential for sharply devalued currencies and high inflation, political and economic upheaval, the relative lack of issuer information, relatively low market liquidity and the potential lack of strict financial and accounting controls and standards.
Securities for which market prices are not provided by any of the above methods may be valued based upon quotes furnished by independent sources. The last bid price may be used to value equity securities. The mean between the last bid and asked prices is used to value debt obligations, including corporate loans.
Securities for which market quotations are not readily available or became unreliable are valued at fair value as determined in good faith by or under the supervision of the Trust’s officers following procedures approved by the Board of Trustees. Issuer specific events, market trends, bid/asked quotes of brokers and information providers and other market data may be reviewed in the course of making a good faith determination of a security’s fair value.
The Fund may invest in securities that are subject to interest rate risk, meaning the risk that the prices will generally fall as interest rates rise and, conversely, the prices will generally rise as interest rates fall. Specific securities differ in their sensitivity to changes in interest rates depending on their individual characteristics. Changes in interest rates may result in increased market volatility, which may affect the value and/or liquidity of certain Fund investments.
Valuations change in response to many factors including the historical and prospective earnings of the issuer, the value of the issuer’s assets, general economic conditions, interest rates, investor perceptions and market liquidity. Because of the inherent uncertainties of valuation, the values reflected in the financial statements may materially differ from the value received upon actual sale of those investments.
| B. | Securities Transactions and Investment Income — Securities transactions are accounted for on a trade date basis. Realized gains or losses on sales are computed on the basis of specific identification of the securities sold. Interest income (net of withholding tax, if any) is recorded on the accrual basis from settlement date. Dividend income (net of withholding tax, if any) is recorded on the ex-dividend date. |
The Fund may periodically participate in litigation related to Fund investments. As such, the Fund may receive proceeds from litigation settlements. Any proceeds received are included in the Statement of Operations as realized gain (loss) for investments no longer held and as unrealized gain (loss) for investments still held.
Brokerage commissions and mark ups are considered transaction costs and are recorded as an increase to the cost basis of securities purchased and/or a reduction of proceeds on a sale of securities. Such transaction costs are included in the determination of net realized and unrealized gain (loss) from investment securities reported in the Statement of Operations and the Statement of Changes in Net Assets and the net realized and unrealized gains (losses) on securities per share in the Financial Highlights. Transaction costs are included in the calculation of the Fund’s net asset value and, accordingly, they reduce the Fund’s total returns. These transaction costs are not considered operating expenses and are not reflected in net investment income reported in the Statement of Operations and the Statement of Changes in Net Assets, or the net investment income per share and the ratios of expenses and net investment income reported in the Financial Highlights, nor are they limited by any expense limitation arrangements between the Fund and the investment adviser.
The Fund allocates income and realized and unrealized capital gains and losses to a class based on the relative net assets of each class.
| C. | Country Determination — For the purposes of making investment selection decisions and presentation in the Schedule of Investments, the investment adviser may determine the country in which an issuer is located and/or credit risk exposure based on various factors. These factors include the laws of the country under which the issuer is organized, where the issuer maintains a principal office, the country in which the issuer derives 50% or more of its total revenues and the country that has the primary market for the issuer’s securities, as well as other criteria. Among the other criteria that may be evaluated for making this determination are the country in which the issuer maintains 50% or more of its assets, the type of security, financial guarantees and enhancements, the nature of the collateral and the sponsor organization. Country of issuer and/or credit risk exposure has been determined to be the United States of America, unless otherwise noted. |
| D. | Distributions — Distributions from net investment income and net realized capital gain, if any, are generally declared and paid annually and recorded on the ex-dividend date. The Fund may elect to treat a portion of the proceeds from redemptions as distributions for federal income tax purposes. |
14 Invesco Technology Sector Fund
| E. | Federal Income Taxes — The Fund intends to comply with the requirements of Subchapter M of the Internal Revenue Code of 1986, as amended (the “Internal Revenue Code”), necessary to qualify as a regulated investment company and to distribute substantially all of the Fund’s taxable earnings to shareholders. As such, the Fund will not be subject to federal income taxes on otherwise taxable income (including net realized capital gain) that is distributed to shareholders. Therefore, no provision for federal income taxes is recorded in the financial statements. |
The Fund recognizes the tax benefits of uncertain tax positions only when the position is more likely than not to be sustained. Management has analyzed the Fund’s uncertain tax positions and concluded that no liability for unrecognized tax benefits should be recorded related to uncertain tax positions. Management is not aware of any tax positions for which it is reasonably possible that the total amounts of unrecognized tax benefits will change materially in the next 12 months.
The Fund files tax returns in the U.S. Federal jurisdiction and certain other jurisdictions. Generally, the Fund is subject to examinations by such taxing authorities for up to three years after the filing of the return for the tax period.
| F. | Expenses — Fees provided for under the Rule 12b-1 plan of a particular class of the Fund and which are directly attributable to that class are charged to the operations of such class. All other expenses are allocated among the classes based on relative net assets. |
| G. | Accounting Estimates — The preparation of financial statements in conformity with accounting principles generally accepted in the United States of America (“GAAP”) requires management to make estimates and assumptions that affect the reported amounts of assets and liabilities at the date of the financial statements and the reported amounts of revenues and expenses during the reporting period including estimates and assumptions related to taxation. Actual results could differ from those estimates by a significant amount. In addition, the Fund monitors for material events or transactions that may occur or become known after the period-end date and before the date the financial statements are released to print. |
| H. | Indemnifications — Under the Trust’s organizational documents, each Trustee, officer, employee or other agent of the Trust is indemnified against certain liabilities that may arise out of the performance of their duties to the Fund. Additionally, in the normal course of business, the Fund enters into contracts, including the Fund’s servicing agreements that contain a variety of indemnification clauses. The Fund’s maximum exposure under these arrangements is unknown as this would involve future claims that may be made against the Fund that have not yet occurred. The risk of material loss as a result of such indemnification claims is considered remote. |
| I. | Securities Lending — The Fund may lend portfolio securities having a market value up to one-third of the Fund’s total assets. Such loans are secured by collateral equal to no less than the market value of the loaned securities determined daily by the securities lending provider. Such collateral will be cash or debt securities issued or guaranteed by the U.S. Government or any of its sponsored agencies. Cash collateral received in connection with these loans is invested in short-term money market instruments or affiliated money market funds and is shown as such on the Schedule of Investments. The Fund bears the risk of loss with respect to the investment of collateral. It is the Fund’s policy to obtain additional collateral from or return excess collateral to the borrower by the end of the next business day, following the valuation date of the securities loaned. Therefore, the value of the collateral held may be temporarily less than the value of the securities on loan. When loaning securities, the Fund retains certain benefits of owning the securities, including the economic equivalent of dividends or interest generated by the security. Lending securities entails a risk of loss to the Fund if, and to the extent that, the market value of the securities loaned were to increase and the borrower did not increase the collateral accordingly, and the borrower failed to return the securities. The securities loaned are subject to termination at the option of the borrower or the Fund. Upon termination, the borrower will return to the Fund the securities loaned and the Fund will return the collateral. Upon the failure of the borrower to return the securities, collateral may be liquidated and the securities may be purchased on the open market to replace the loaned securities. The Fund could experience delays and costs in gaining access to the collateral and the securities may lose value during the delay which could result in potential losses to the Fund. Some of these losses may be indemnified by the lending agent. The Fund bears the risk of any deficiency in the amount of the collateral available for return to the borrower due to any loss on the collateral invested. Dividends received on cash collateral investments for securities lending transactions, which are net of compensation to counterparties, are included in Dividends from affiliated money market funds on the Statement of Operations. The aggregate value of securities out on loan, if any, is shown as a footnote on the Statement of Assets and Liabilities. |
| J. | Foreign Currency Translations — Foreign currency is valued at the close of the NYSE based on quotations posted by banks and major currency dealers. Portfolio securities and other assets and liabilities denominated in foreign currencies are translated into U.S. dollar amounts at date of valuation. Purchases and sales of portfolio securities (net of foreign taxes withheld on disposition) and income items denominated in foreign currencies are translated into U.S. dollar amounts on the respective dates of such transactions. The Fund does not separately account for the portion of the results of operations resulting from changes in foreign exchange rates on investments and the fluctuations arising from changes in market prices of securities held. The combined results of changes in foreign exchange rates and the fluctuation of market prices on investments (net of estimated foreign tax withholding) are included with the net realized and unrealized gain or loss from investments in the Statement of Operations. Reported net realized foreign currency gains or losses arise from (1) sales of foreign currencies, (2) currency gains or losses realized between the trade and settlement dates on securities transactions, and (3) the difference between the amounts of dividends, interest, and foreign withholding taxes recorded on the Fund’s books and the U.S. dollar equivalent of the amounts actually received or paid. Net unrealized foreign currency gains and losses arise from changes in the fair values of assets and liabilities, other than investments in securities at fiscal period end, resulting from changes in exchange rates. |
The Fund may invest in foreign securities, which may be subject to foreign taxes on income, gains on investments or currency repatriation, a portion of which may be recoverable. Foreign taxes, if any, are recorded based on the tax regulations and rates that exist in the foreign markets in which the Fund invests and are shown in the Statement of Operations.
| K. | Forward Foreign Currency Contracts — The Fund may engage in foreign currency transactions either on a spot (i.e. for prompt delivery and settlement) basis, or through forward foreign currency contracts, to manage or minimize currency or exchange rate risk. |
The Fund may also enter into forward foreign currency contracts for the purchase or sale of a security denominated in a foreign currency in order to “lock in” the U.S. dollar price of that security, or the Fund may also enter into forward foreign currency contracts that do not provide for physical settlement of the two currencies, but instead are settled by a single cash payment calculated as the difference between the agreed upon exchange rate and the spot rate at settlement based upon an agreed upon notional amount (non-deliverable forwards). The Fund will set aside liquid assets in an amount equal to the daily mark-to-market obligation for forward foreign currency contracts.
15 Invesco Technology Sector Fund
A forward foreign currency contract is an obligation between two parties (“Counterparties”) to purchase or sell a specific currency for an agreed-upon price at a future date. The use of forward foreign currency contracts does not eliminate fluctuations in the price of the underlying securities the Fund owns or intends to acquire but establishes a rate of exchange in advance. Fluctuations in the value of these contracts are measured by the difference in the contract date and reporting date exchange rates and are recorded as unrealized appreciation (depreciation) until the contracts are closed. When the contracts are closed, realized gains (losses) are recorded. Realized and unrealized gains (losses) on the contracts are included in the Statement of Operations. The primary risks associated with forward foreign currency contracts include failure of the Counterparty to meet the terms of the contract and the value of the foreign currency changing unfavorably. These risks may be in excess of the amounts reflected in the Statement of Assets and Liabilities.
| L. | Other Risks — The Fund’s investments are concentrated in a comparatively narrow segment of the economy, which may make the Fund more volatile. |
Many products and services offered in technology-related industries are subject to rapid obsolescence, which may lower the value of the issuers in this sector.
NOTE 2—Advisory Fees and Other Fees Paid to Affiliates
The Trust has entered into a master investment advisory agreement with Invesco Advisers, Inc. (the “Adviser” or “Invesco”). Under the terms of the investment advisory agreement, the Fund pays an advisory fee to the Adviser based on the annual rate of the Fund’s average daily net assets as follows:
| | | | | | | | |
| Average Daily Net Assets | | Rate | |
First $500 million | | | 0 | .67% | | | | |
Next $2.5 billion | | | 0 | .645% | | | | |
Over $3 billion | | | 0 | .62% | | | | |
For the year ended April 30, 2017, the effective advisory fees incurred by the Fund was 0.67%.
Under the terms of a master sub-advisory agreement between the Adviser and each of Invesco Asset Management Deutschland GmbH, Invesco Asset Management Limited, Invesco Asset Management (Japan) Limited, Invesco Hong Kong Limited, Invesco Senior Secured Management, Inc. and Invesco Canada Ltd. (collectively, the “Affiliated Sub-Advisers”) the Adviser, not the Fund, will pay 40% of the fees paid to the Adviser to any such Affiliated Sub-Adviser(s) that provide(s) discretionary investment management services to the Fund based on the percentage of assets allocated to such Affiliated Sub-Adviser(s).
The Adviser has contractually agreed, through at least June 30, 2018, to waive advisory fees and/or reimburse expenses of all shares to the extent necessary to limit total annual fund operating expenses after fee waiver and/or expense reimbursement (excluding certain items discussed below) of Class A, Class B, Class C, and Class Y shares to 2.00%, 2.75%, 2.75%, and 1.75%, respectively, of average daily net assets (the “expense limits”). In determining the Adviser’s obligation to waive advisory fees and/or reimburse expenses, the following expenses are not taken into account, and could cause the total annual fund operating expenses after fee waiver and/or expense reimbursement to exceed the numbers reflected above: (1) interest; (2) taxes; (3) dividend expense on short sales; (4) extraordinary or non-routine items, including litigation expenses; and (5) expenses that the Fund has incurred but did not actually pay because of an expense offset arrangement. Unless Invesco continues the fee waiver agreement, it will terminate on June 30, 2018. During its term, the fee waiver agreement cannot be terminated or amended to increase the expense limits without approval of the Board of Trustees. The Adviser did not waive fees and/or reimburse expenses during the period under these expense limits.
Further, the Adviser has contractually agreed, through at least June 30, 2019, to waive the advisory fee payable by the Fund in an amount equal to 100% of the net advisory fees the Adviser receives from the affiliated money market funds on investments by the Fund of uninvested cash (excluding investments of cash collateral from securities lending) in such affiliated money market funds.
For the year ended April 30, 2017, the Adviser waived advisory fees of $1,633.
The Trust has entered into a master administrative services agreement with Invesco pursuant to which the Fund has agreed to pay Invesco for certain administrative costs incurred in providing accounting services to the Fund. For the year ended April 30, 2017, expenses incurred under the agreement are shown in the Statement of Operations as Administrative services fees.
The Trust has entered into a transfer agency and service agreement with Invesco Investment Services, Inc. (“IIS”) pursuant to which the Fund has agreed to pay IIS a fee for providing transfer agency and shareholder services to the Fund and reimburse IIS for certain expenses incurred by IIS in the course of providing such services. IIS may make payments to intermediaries that provide omnibus account services, sub-accounting services and/or networking services. All fees payable by IIS to intermediaries that provide omnibus account services or sub-accounting are charged back to the Fund, subject to certain limitations approved by the Trust’s Board of Trustees. For the year ended April 30, 2017, the expenses incurred under the agreement are shown in the Statement of Operations as Transfer agent fees.
Shares of the Fund are distributed by Invesco Distributors, Inc. (“IDI”), an affiliate of the Adviser. The Fund has adopted a Plan of Distribution (the “Plan”) pursuant to Rule 12b-1 under the 1940 Act. The Plan provides that the Fund will reimburse IDI for distribution related expenses that IDI incurs up to a maximum of the following annual rates: (1) Class A — up to 0.25% of the average daily net assets of Class A shares; (2) Class B — up to 1.00% of the average daily net assets of Class B shares; and (3) Class C — up to 1.00% of the average daily net assets of Class C shares.
In the case of Class B shares, provided that the Plan continues in effect, any cumulative expenses incurred by IDI, but not yet reimbursed to IDI, may be recovered through the payment of future distribution fees from the Fund pursuant to the Plan and contingent deferred sales charges paid by investors upon redemption of Class B shares.
For the year ended April 30, 2017, expenses incurred under these agreements are shown in the Statement of Operations as Distribution fees.
Front-end sales commissions and CDSC (collectively, the “sales charges”) are not recorded as expenses of the Fund. Front-end sales commissions are deducted from proceeds from the sales of Fund shares prior to investment in Class A shares of the Fund. CDSC are deducted from redemption proceeds prior to remittance to the shareholder. During the year ended April 30, 2017, IDI advised the Fund that IDI retained $13,138 in front-end sales commissions from the sale of Class A shares and $30 and $31 from Class B and Class C shares, respectively, for CDSC imposed on redemptions by shareholders.
16 Invesco Technology Sector Fund
For the year ended April 30, 2017, the Fund incurred $311 in brokerage commissions with Invesco Capital Markets, Inc., an affiliate of the Adviser and IDI, for portfolio transactions executed on behalf of the Fund.
Certain officers and trustees of the Trust are officers and directors of the Adviser, IIS and/or IDI.
NOTE 3—Additional Valuation Information
GAAP defines fair value as the price that would be received to sell an asset or paid to transfer a liability in an orderly transaction between market participants at the measurement date, under current market conditions. GAAP establishes a hierarchy that prioritizes the inputs to valuation methods, giving the highest priority to readily available unadjusted quoted prices in an active market for identical assets (Level 1) and the lowest priority to significant unobservable inputs (Level 3), generally when market prices are not readily available or are unreliable. Based on the valuation inputs, the securities or other investments are tiered into one of three levels. Changes in valuation methods may result in transfers in or out of an investment’s assigned level:
| | Level 1 — | Prices are determined using quoted prices in an active market for identical assets. |
| | Level 2 — | Prices are determined using other significant observable inputs. Observable inputs are inputs that other market participants may use in pricing a security. These may include quoted prices for similar securities, interest rates, prepayment speeds, credit risk, yield curves, loss severities, default rates, discount rates, volatilities and others. |
| | Level 3 — | Prices are determined using significant unobservable inputs. In situations where quoted prices or observable inputs are unavailable (for example, when there is little or no market activity for an investment at the end of the period), unobservable inputs may be used. Unobservable inputs reflect the Fund’s own assumptions about the factors market participants would use in determining fair value of the securities or instruments and would be based on the best available information. |
The following is a summary of the tiered valuation input levels, as of April 30, 2017. The level assigned to the securities valuations may not be an indication of the risk or liquidity associated with investing in those securities. Because of the inherent uncertainties of valuation, the values reflected in the financial statements may materially differ from the value received upon actual sale of those investments.
During the year ended April 30, 2017, there were transfers from level 2 to level 1 of $3,223,686 due to foreign fair value adjustments.
| | | | | | | | | | | | | | | | |
| | | Level 1 | | | Level 2 | | | Level 3 | | | Total | |
Common Stocks & Other Equity Interests | | $ | 85,120,580 | | | $ | 2,898,755 | | | $ | — | | | $ | 88,019,335 | |
Money Market Funds | | | 804,205 | | | | — | | | | — | | | | 804,205 | |
Total Investments | | $ | 85,924,785 | | | $ | 2,898,755 | | | $ | — | | | $ | 88,823,540 | |
NOTE 4—Security Transactions with Affiliated Funds
The Fund is permitted to purchase or sell securities from or to certain other Invesco Funds under specified conditions outlined in procedures adopted by the Board of Trustees of the Trust. The procedures have been designed to ensure that any purchase or sale of securities by the Fund from or to another fund or portfolio that is or could be considered an affiliate by virtue of having a common investment adviser (or affiliated investment advisers), common Trustees and/or common officers complies with Rule 17a-7 of the 1940 Act. Further, as defined under the procedures, each transaction is effected at the current market price. Pursuant to these procedures, for the year ended April 30, 2017, the Fund engaged in securities purchases of $4,415.
NOTE 5—Expense Offset Arrangement(s)
The expense offset arrangement is comprised of transfer agency credits which result from balances in demand deposit accounts used by the transfer agent for clearing shareholder transactions. For the year ended April 30, 2017, the Fund received credits from this arrangement, which resulted in the reduction of the Fund’s total expenses of $654.
NOTE 6—Trustees’ and Officers’ Fees and Benefits
Trustees’ and Officers’ Fees and Benefits include amounts accrued by the Fund to pay remuneration to certain Trustees and Officers of the Fund. Trustees have the option to defer compensation payable by the Fund, and Trustees’ and Officers’ Fees and Benefits also include amounts accrued by the Fund to fund such deferred compensation amounts. Those Trustees who defer compensation have the option to select various Invesco Funds in which their deferral accounts shall be deemed to be invested. Finally, certain current Trustees were eligible to participate in a retirement plan that provided for benefits to be paid upon retirement to Trustees over a period of time based on the number of years of service. The Fund may have certain former Trustees who also participate in a retirement plan and receive benefits under such plan. Trustees’ and Officers’ Fees and Benefits include amounts accrued by the Fund to fund such retirement benefits. Obligations under the deferred compensation and retirement plans represent unsecured claims against the general assets of the Fund.
NOTE 7—Cash Balances
The Fund is permitted to temporarily carry a negative or overdrawn balance in its account with State Street Bank and Trust Company, the custodian bank. Such balances, if any at period-end, are shown in the Statement of Assets and Liabilities under the payable caption Amount due custodian. To compensate the custodian bank for such overdrafts, the overdrawn Fund may either (1) leave funds as a compensating balance in the account so the custodian bank can be compensated by earning the additional interest; or (2) compensate by paying the custodian bank at a rate agreed upon by the custodian bank and Invesco, not to exceed the contractually agreed upon rate.
17 Invesco Technology Sector Fund
NOTE 8—Distributions to Shareholders and Tax Components of Net Assets
Tax Character of Distributions to Shareholders Paid During the Fiscal Years Ended April 30, 2017 and 2016:
| | | | | | | | |
| | | 2017 | | | 2016 | |
Long-Term Capital Gain | | $ | 2,041,521 | | | $ | — | |
Tax Components of Net Assets at Period-End:
| | | | |
| | | 2017 | |
Undistributed long-term gain | | $ | 574,620 | |
Net unrealized appreciation — investments | | | 24,012,721 | |
Net unrealized appreciation — other investments | | | 872 | |
Temporary book/tax differences | | | (31,903 | ) |
Late-Year Ordinary Loss Deferral | | | (288,522 | ) |
Shares of beneficial interest | | | 64,053,270 | |
Total net assets | | $ | 88,321,058 | |
The difference between book-basis and tax-basis unrealized appreciation (depreciation) is due to differences in the timing of recognition of gains and losses on investments for tax and book purposes. The Fund’s net unrealized appreciation difference is attributable primarily to wash sales.
The temporary book/tax differences are a result of timing differences between book and tax recognition of income and/or expenses. The Fund’s temporary book/tax differences are the result of the trustee deferral of compensation and retirement plan benefits.
Capital loss carryforward is calculated and reported as of a specific date. Results of transactions and other activity after that date may affect the amount of capital loss carryforward actually available for the Fund to utilize. Capital losses generated in years beginning after December 22, 2010 can be carried forward for an unlimited period, whereas previous losses expire in eight tax years. Capital losses with an expiration period may not be used to offset capital gains until all net capital losses without an expiration date have been utilized. Capital loss carryforwards with no expiration date will retain their character as either short-term or long-term capital losses instead of as short-term capital losses as under prior law. The ability to utilize capital loss carryforwards in the future may be limited under the Internal Revenue Code and related regulations based on the results of future transactions.
The Fund does not have a capital loss carryforward as of April 30, 2017.
NOTE 9—Investment Securities
The aggregate amount of investment securities (other than short-term securities, U.S. Treasury obligations and money market funds, if any) purchased and sold by the Fund during the year ended April 30, 2017 was $39,898,791 and $49,794,857, respectively. Cost of investments on a tax basis includes the adjustments for financial reporting purposes as of the most recently completed federal income tax reporting period-end.
| | | | |
| Unrealized Appreciation (Depreciation) of Investment Securities on a Tax Basis | |
Aggregate unrealized appreciation of investment securities | | $ | 24,457,506 | |
Aggregate unrealized (depreciation) of investment securities | | | (444,785 | ) |
Net unrealized appreciation of investment securities | | $ | 24,012,721 | |
Cost of investments for tax purposes is $64,810,819.
NOTE 10—Reclassification of Permanent Differences
Primarily as a result of differing book/tax treatment of net operating losses, on April 30, 2017, undistributed net investment income (loss) was increased by $752,380, undistributed net realized gain was decreased by $6,458 and shares of beneficial interest was decreased by $745,922. This reclassification had no effect on the net assets of the Fund.
18 Invesco Technology Sector Fund
NOTE 11—Share Information
| | | | | | | | | | | | | | | | |
| | | Summary of Share Activity | |
| | | Years ended April 30, | |
| | | 2017(a) | | | 2016 | |
| | | Shares | | | Amount | | | Shares | | | Amount | |
Sold: | | | | | | | | | | | | | | | | |
Class A | | | 50,408 | | | $ | 874,994 | | | | 110,280 | | | $ | 1,836,154 | |
Class B | | | 14 | | | | 210 | | | | — | | | | — | |
Class C | | | 2,849 | | | | 42,470 | | | | 16,864 | | | | 234,225 | |
Class Y | | | 61,875 | | | | 1,143,028 | | | | 46,583 | | | | 775,751 | |
| | | | |
Issued as reinvestment of dividends: | | | | | | | | | | | | | | | | |
Class A | | | 94,434 | | | | 1,615,765 | | | | — | | | | — | |
Class B | | | 751 | | | | 10,971 | | | | — | | | | — | |
Class C | | | 12,510 | | | | 182,767 | | | | — | | | | — | |
Class Y | | | 1,653 | | | | 29,691 | | | | — | | | | — | |
| | | | |
Automatic conversion of Class B shares to Class A shares: | | | | | | | | | | | | | | | | |
Class A | | | 18,705 | | | | 326,584 | | | | 25,960 | | | | 427,834 | |
Class B | | | (21,834 | ) | | | (326,584 | ) | | | (30,033 | ) | | | (427,834 | ) |
| | | | |
Reacquired: | | | | | | | | | | | | | | | | |
Class A | | | (676,853 | ) | | | (11,772,210 | ) | | | (794,117 | ) | | | (13,220,679 | ) |
Class B | | | (6,679 | ) | | | (96,330 | ) | | | (10,672 | ) | | | (154,031 | ) |
Class C | | | (60,006 | ) | | | (899,388 | ) | | | (70,174 | ) | | | (1,008,248 | ) |
Class Y | | | (31,556 | ) | | | (567,308 | ) | | | (18,943 | ) | | | (323,466 | ) |
Net increase (decrease) in share activity | | | (553,729 | ) | | $ | (9,435,340 | ) | | | (724,252 | ) | | $ | (11,860,294 | ) |
| (a) | There are entities that are record owners of more than 5% of the outstanding shares of the Fund and in the aggregate own 71% of the outstanding shares of the Fund. IDI has an agreement with these entities to sell Fund shares. The Fund, Invesco and/or Invesco affiliates may make payments to these entities, which are considered to be related to the Fund, for providing services to the Fund, Invesco and/or Invesco affiliates including but not limited to services such as securities brokerage, distribution, third party record keeping and account servicing. The Fund has no knowledge as to whether all or any portion of the shares owned of record by these entities are also owned beneficially. |
19 Invesco Technology Sector Fund
NOTE 12—Financial Highlights
The following schedule presents financial highlights for a share of the Fund outstanding throughout the periods indicated.
| | | | | | | | | | | | | | | | | | | | | | | | | | | | | | | | | | | | | | | | | | | | | | | | |
| | | Net asset
value,
beginning
of period | | | Net
investment
income
(loss)(a) | | | Net gains
(losses)
on securities
(both
realized and
unrealized) | | | Total from
investment
operations | | | Distributions
from net
realized
gains | | | Net asset
value, end
of period | | | Total
return(b) | | | Net assets,
end of period
(000’s omitted) | | | Ratio of
expenses
to average
net assets
with fee waivers
and/or expenses
absorbed | | | Ratio of
expenses
to average net
assets without
fee waivers
and/or expenses
absorbed | | | Ratio of net
investment
income (loss)
to average
net assets | | | Portfolio
turnover(c) | |
Class A | | | | | | | | | | | | | | | | | | | | | | | | | | | | | | | | | | | | | | | | | | | | | | | | |
Year ended 04/30/17 | | $ | 15.58 | | | $ | (0.16 | ) | | $ | 4.54 | | | $ | 4.38 | | | $ | (0.43 | ) | | $ | 19.53 | | | | 28.52 | % | | $ | 78,058 | | | | 1.67 | %(d) | | | 1.67 | %(d) | | | (0.90 | )%(d) | | | 49 | % |
Year ended 04/30/16 | | | 16.73 | | | | (0.15 | ) | | | (1.00 | ) | | | (1.15 | ) | | | — | | | | 15.58 | | | | (6.87 | ) | | | 70,256 | | | | 1.58 | | | | 1.58 | | | | (0.89 | ) | | | 44 | |
Year ended 04/30/15 | | | 14.49 | | | | (0.17 | ) | | | 2.41 | | | | 2.24 | | | | — | | | | 16.73 | | | | 15.46 | | | | 86,451 | | | | 1.58 | | | | 1.58 | | | | (1.07 | ) | | | 66 | |
Year ended 04/30/14 | | | 12.01 | | | | (0.14 | ) | | | 2.62 | | | | 2.48 | | | | — | | | | 14.49 | | | | 20.65 | | | | 83,926 | | | | 1.68 | | | | 1.68 | | | | (1.02 | ) | | | 69 | |
Year ended 04/30/13 | | | 12.59 | | | | (0.12 | )(e) | | | (0.46 | )(f) | | | (0.58 | ) | | | — | | | | 12.01 | | | | (4.61 | )(f) | | | 80,866 | | | | 1.82 | | | | 1.83 | | | | (1.00 | )(e) | | | 43 | |
Class B | | | | | | | | | | | | | | | | | | | | | | | | | | | | | | | | | | | | | | | | | | | | | | | | |
Year ended 04/30/17 | | | 13.42 | | | | (0.24 | ) | | | 3.88 | | | | 3.64 | | | | (0.43 | ) | | | 16.63 | | | | 27.58 | | | | 337 | | | | 2.42 | (d) | | | 2.42 | (d) | | | (1.65 | )(d) | | | 49 | |
Year ended 04/30/16 | | | 14.52 | | | | (0.24 | ) | | | (0.86 | ) | | | (1.10 | ) | | | — | | | | 13.42 | | | | (7.58 | ) | | | 644 | | | | 2.33 | | | | 2.33 | | | | (1.64 | ) | | | 44 | |
Year ended 04/30/15 | | | 12.66 | | | | (0.25 | ) | | | 2.11 | | | | 1.86 | | | | — | | | | 14.52 | | | | 14.69 | | | | 1,287 | | | | 2.33 | | | | 2.33 | | | | (1.82 | ) | | | 66 | |
Year ended 04/30/14 | | | 10.58 | | | | (0.21 | ) | | | 2.29 | | | | 2.08 | | | | — | | | | 12.66 | | | | 19.66 | | | | 1,692 | | | | 2.43 | | | | 2.43 | | | | (1.77 | ) | | | 69 | |
Year ended 04/30/13 | | | 11.18 | | | | (0.18 | )(e) | | | (0.42 | )(f) | | | (0.60 | ) | | | — | | | | 10.58 | | | | (5.37 | )(f) | | | 2,408 | | | | 2.57 | | | | 2.58 | | | | (1.75 | )(e) | | | 43 | |
Class C | | | | | | | | | | | | | | | | | | | | | | | | | | | | | | | | | | | | | | | | | | | | | | | | |
Year ended 04/30/17 | | | 13.42 | | | | (0.24 | ) | | | 3.89 | | | | 3.65 | | | | (0.43 | ) | | | 16.64 | | | | 27.66 | (g) | | | 7,635 | | | | 2.39 | (d)(g) | | | 2.39 | (d)(g) | | | (1.62 | )(d)(g) | | | 49 | |
Year ended 04/30/16 | | | 14.52 | | | | (0.24 | ) | | | (0.86 | ) | | | (1.10 | ) | | | — | | | | 13.42 | | | | (7.58 | ) | | | 6,759 | | | | 2.33 | | | | 2.33 | | | | (1.64 | ) | | | 44 | |
Year ended 04/30/15 | | | 12.67 | | | | (0.25 | ) | | | 2.10 | | | | 1.85 | | | | — | | | | 14.52 | | | | 14.60 | (g) | | | 8,087 | | | | 2.32 | (g) | | | 2.32 | (g) | | | (1.81 | )(g) | | | 66 | |
Year ended 04/30/14 | | | 10.58 | | | | (0.21 | ) | | | 2.30 | | | | 2.09 | | | | — | | | | 12.67 | | | | 19.75 | (g) | | | 7,976 | | | | 2.41 | (g) | | | 2.41 | (g) | | | (1.75 | )(g) | | | 69 | |
Year ended 04/30/13 | | | 11.18 | | | | (0.18 | )(e) | | | (0.42 | )(f) | | | (0.60 | ) | | | — | | | | 10.58 | | | | (5.37 | )(f) | | | 7,841 | | | | 2.57 | | | | 2.58 | | | | (1.75 | )(e) | | | 43 | |
Class Y | | | | | | | | | | | | | | | | | | | | | | | | | | | | | | | | | | | | | | | | | | | | | | | | |
Year ended 04/30/17 | | | 16.32 | | | | (0.12 | ) | | | 4.76 | | | | 4.64 | | | | (0.43 | ) | | | 20.53 | | | | 28.82 | | | | 2,291 | | | | 1.42 | (d) | | | 1.42 | (d) | | | (0.65 | )(d) | | | 49 | |
Year ended 04/30/16 | | | 17.49 | | | | (0.11 | ) | | | (1.06 | ) | | | (1.17 | ) | | | — | | | | 16.32 | | | | (6.69 | ) | | | 1,299 | | | | 1.33 | | | | 1.33 | | | | (0.64 | ) | | | 44 | |
Year ended 04/30/15 | | | 15.10 | | | | (0.14 | ) | | | 2.53 | | | | 2.39 | | | | — | | | | 17.49 | | | | 15.83 | | | | 909 | | | | 1.33 | | | | 1.33 | | | | (0.82 | ) | | | 66 | |
Year ended 04/30/14 | | | 12.49 | | | | (0.11 | ) | | | 2.72 | | | | 2.61 | | | | — | | | | 15.10 | | | | 20.90 | | | | 647 | | | | 1.43 | | | | 1.43 | | | | (0.77 | ) | | | 69 | |
Year ended 04/30/13 | | | 13.06 | | | | (0.09 | )(e) | | | (0.48 | )(f) | | | (0.57 | ) | | | — | | | | 12.49 | | | | (4.36 | )(f) | | | 630 | | | | 1.57 | | | | 1.58 | | | | (0.75 | )(e) | | | 43 | |
| (a) | Calculated using average shares outstanding. |
| (b) | Includes adjustments in accordance with accounting principles generally accepted in the United States of America and as such, the net asset value for financial reporting purposes and the returns based upon those net asset values may differ from the net asset value and returns for shareholder transactions. Does not include sales charges and is not annualized for periods less than one year, if applicable. |
| (c) | Portfolio turnover is calculated at the fund level and is not annualized for periods less than one year, if applicable. |
| (d) | Ratios are based on average daily net assets (000’s omitted) of $73,740, $484, $7,161 and $1,637 for Class A, Class B, Class C and Class Y shares, respectively. |
| (e) | Net investment income (loss) per share and the ratio of net investment income (loss) to average net assets, for the year ended April 30, 2013 includes significant dividends received during the period. Net investment income (loss) per share and the ratio of net investment income (loss) to average net assets excluding the significant dividends are $(0.15) and (1.30)%, $(0.21) and (2.05)%, $(0.21) and (2.05)% and $(0.13) and (1.05)% for Class A, Class B, Class C and Class Y shares, respectively. |
| (f) | Includes litigation proceeds received during the period. Had the litigation proceeds not been received Net gains on securities (both realized and unrealized) per share for the year ended April 30, 2013 would have been $(0.55), $(0.51), $(0.51) and $(0.57) for Class A, Class B, Class C and Class Y shares, respectively and total returns would have been lower. |
| (g) | The total return, ratio of expenses to average net assets and ratio of net investment income (loss) to average net assets, for Class C Shares, reflect actual 12b-1 fees of 0.97%, 0.99% and 0.98% for the years ended April 30, 2017, 2015 and 2014, respectively. |
20 Invesco Technology Sector Fund
Report of Independent Registered Public Accounting Firm
To the Board of Trustees of AIM Sector Funds (Invesco Sector Funds)
and Shareholders of the Invesco Technology Sector Fund:
In our opinion, the accompanying statement of assets and liabilities, including the schedule of investments, and the related statements of operations and of changes in net assets and the financial highlights present fairly, in all material respects, the financial position of the Invesco Technology Sector Fund (one of the portfolios constituting the AIM Sector Funds (Invesco Sector Funds), hereafter referred to as the “Fund”) as of April 30, 2017, the results of its operations for the year then ended, the changes in its net assets for each of the two years in the period then ended and the financial highlights for each of the five years in the period then ended, in conformity with accounting principles generally accepted in the United States of America. These financial statements and financial highlights (hereafter referred to as “financial statements”) are the responsibility of the Fund’s management. Our responsibility is to express an opinion on these financial statements based on our audits. We conducted our audits of these financial statements in accordance with the standards of the Public Company Accounting Oversight Board (United States). Those standards require that we plan and perform the audit to obtain reasonable assurance about whether the financial statements are free of material misstatement. An audit includes examining, on a test basis, evidence supporting the amounts and disclosures in the financial statements, assessing the accounting principles used and significant estimates made by management, and evaluating the overall financial statement presentation. We believe that our audits, which included confirmation of securities as of April 30, 2017 by correspondence with the custodian and brokers, provide a reasonable basis for our opinion.
PricewaterhouseCoopers LLP
Houston, TX
June 23, 2017
21 Invesco Technology Sector Fund
Calculating your ongoing Fund expenses
Example
As a shareholder of the Fund, you incur two types of costs: (1) transaction costs, which may include sales charges (loads) on purchase payments or contingent deferred sales charges on redemptions, if any; and (2) ongoing costs, including management fees, distribution and/or service (12b-1) fees, and other Fund expenses. This example is intended to help you understand your ongoing costs (in dollars) of investing in the Fund and to compare these costs with ongoing costs of investing in other mutual funds. The example is based on an investment of $1,000 invested at the beginning of the period and held for the entire period November 1, 2016 through April 30, 2017.
Actual expenses
The table below provides information about actual account values and actual expenses. You may use the information in this table, together with the amount you invested, to estimate the expenses that you paid over the period. Simply divide your account value by $1,000 (for example, an $8,600 account value divided by $1,000 = 8.6), then multiply the result by the number in the table under the heading entitled “Actual Expenses Paid During Period” to estimate the expenses you paid on your account during this period.
Hypothetical example for comparison purposes
The table below also provides information about hypothetical account values and hypothetical expenses based on the Fund’s actual expense ratio and an assumed rate of return of 5% per year before expenses, which is not the Fund’s actual return.
The hypothetical account values and expenses may not be used to estimate the actual ending account balance or expenses you paid for the period. You may use this information to compare the ongoing costs of investing in the Fund and other funds. To do so, compare this 5% hypothetical example with the 5% hypothetical examples that appear in the shareholder reports of the other funds.
Please note that the expenses shown in the table are meant to highlight your ongoing costs only and do not reflect any transaction costs, such as sales charges (loads) on purchase payments or contingent deferred sales charges on redemptions, if any. Therefore, the hypothetical information is useful in comparing ongoing costs only, and will not help you determine the relative total costs of owning different funds. In addition, if these transaction costs were included, your costs would have been higher.
| | | | | | | | | | | | | | | | | | | | | | | | |
| Class | | Beginning
Account Value
(11/01/16) | | | ACTUAL | | | HYPOTHETICAL (5% annual return before
expenses) | | | Annualized
Expense
Ratio | |
| | | Ending
Account Value
(04/30/17)1 | | | Expenses
Paid During
Period2 | | | Ending
Account Value
(04/30/17) | | | Expenses
Paid During
Period2 | | |
| A | | $ | 1,000.00 | | | $ | 1,154.00 | | | $ | 9.13 | | | $ | 1,016.31 | | | $ | 8.55 | | | | 1.71 | % |
| B | | | 1,000.00 | | | | 1,149.90 | | | | 13.11 | | | | 1,012.60 | | | | 12.28 | | | | 2.46 | |
| C | | | 1,000.00 | | | | 1,150.50 | | | | 13.01 | | | | 1,012.69 | | | | 12.18 | | | | 2.44 | |
| Y | | | 1,000.00 | | | | 1,155.80 | | | | 7.80 | | | | 1,017.55 | | | | 7.30 | | | | 1.46 | |
| 1 | The actual ending account value is based on the actual total return of the Fund for the period November 1, 2016 through April 30, 2017, after actual expenses and will differ from the hypothetical ending account value which is based on the Fund’s expense ratio and a hypothetical annual return of 5% before expenses. |
| 2 | Expenses are equal to the Fund’s annualized expense ratio as indicated above multiplied by the average account value over the period, multiplied by 181/365 to reflect the most recent fiscal half year. |
22 Invesco Technology Sector Fund
Tax Information
Form 1099-DIV, Form 1042-S and other year-end tax information provide shareholders with actual calendar year amounts that should be included in their tax returns. Shareholders should consult their tax advisors.
The following distribution information is being provided as required by the Internal Revenue Code or to meet a specific state’s requirement.
The Fund designates the following amounts or, if subsequently determined to be different, the maximum amount allowable for its fiscal year ended April 30, 2017:
| | | | |
Federal and State Income Tax | |
Long-Term Capital Gain Distributions | | $ | 2,041,521 | |
Qualified Dividend Income* | | | 0 | % |
Corporate Dividends Received Deduction* | | | 0 | % |
U.S. Treasury Obligations* | | | 0 | % |
| | * | The above percentages are based on ordinary income dividends paid to shareholders during the Fund’s fiscal year. |
23 Invesco Technology Sector Fund
Proxy Results
A Special Joint Meeting (“Meeting”) of Shareholders of Invesco Technology Sector Fund, an investment portfolio of AIM Sector Funds (Invesco Sector Funds), a Delaware statutory trust (“Trust”), was held on March 9, 2017. The Meeting was held for the following purpose:
| (1) | Elect 15 trustees to the Board, each of whom will serve until his or her successor is elected and qualified. |
| (2) | Approve an amendment to the Trust’s Agreement and Declaration of Trust that would permit fund mergers and other significant transactions upon the Board’s approval but without shareholder approval of such transactions. |
The results of the voting on the above matters were as follows:
| | | | | | | | | | | | | | | | | | |
| | | Matters | | | | | | | | Votes For | | | Votes Withheld | |
| (1)* | | David C. Arch | | | | 478,210,140 | | | | 13,802,825 | |
| | James T. Bunch | | | | 477,776,614 | | | | 14,236,351 | |
| | Bruce L. Crockett | | | | 477,904,863 | | | | 14,108,102 | |
| | Jack M. Fields | | | | 478,154,120 | | | | 13,858,845 | |
| | Martin L. Flanagan | | | | 478,366,284 | | | | 13,646,681 | |
| | Cynthia Hostetler | | | | 478,149,043 | | | | 13,863,922 | |
| | Dr. Eli Jones | | | | 478,281,396 | | | | 13,731,569 | |
| | Dr. Prema Mathai-Davis | | | | 477,927,603 | | | | 14,085,362 | |
| | Teresa M. Ressel | | | | 478,116,999 | | | | 13,895,966 | |
| | Dr. Larry Soll | | | | 477,671,696 | | | | 14,341,269 | |
| | Ann Barnett Stern | | | | 478,390,538 | | | | 13,622,427 | |
| | Raymond Stickel, Jr. | | | | 477,934,336 | | | | 14,078,629 | |
| | Philip A. Taylor | | | | 478,104,174 | | | | 13,908,791 | |
| | Robert C. Troccoli | | | | 478,368,464 | | | | 13,644,501 | |
| | Christopher L. Wilson | | | | 478,433,867 | | | | 13,579,098 | |
| | | | | |
| | | | | | | | | | | | | | | | | | |
| | | | | Votes For | | | Votes Against | | | Votes Abstain | | | Broker Non-Votes | |
| (2)* | | Approve an amendment to the Trust’s Agreement and Declaration of Trust that would permit fund mergers and other significant transactions upon the Board’s approval but without shareholder approval of such transactions | | | 261,575,830 | | | | 26,621,916 | | | | 13,166,011 | | | | 190,648,808 | |
The Meeting was adjourned until April 11, 2017, with respect to the following proposals:
| (3) | Approve changing the fundamental investment restriction regarding the purchase or sale of physical commodities. |
| 4(a) | Approve an amendment to the current Master Intergroup Sub-Advisory Contract to add Invesco PowerShares Capital Management LLC. |
| 4(b) | Approve an amendment to the current Master Intergroup Sub-Advisory Contract to add Invesco Asset Management (India) Private Limited. |
Invesco Technology Sector Fund did not receive sufficient shareholder votes to pass Proposals 3 and 4(a) - (b).
The results of the voting on the above matters were as follows:
| | | | | | | | | | | | | | | | | | |
| | | Matters | | Votes For | | | Votes Against | | | Votes Abstain | | | Broker Non-Votes | |
| (3) | | Approve changing the fundamental investment restriction regarding the purchase or sale of physical commodities | | | 938,296 | | | | 126,805 | | | | 72,932 | | | | 634,073 | |
| 4(a) | | Approve an amendment to the current Master Intergroup Sub-Advisory Contract to add Invesco PowerShares Capital Management LLC | | | 989,435 | | | | 77,688 | | | | 70,914 | | | | 634,069 | |
| 4(b) | | Approve an amendment to the current Master Intergroup Sub-Advisory Contract to add Invesco Asset Management (India) Private Limited | | | 965,772 | | | | 96,982 | | | | 75,282 | | | | 634,070 | |
| * | Each of proposal 1 and 2 required approval by a combined vote of all of the portfolios of AIM Sector Funds (Invesco Sector Funds). |
24 Invesco Technology Sector Fund
Trustees and Officers
The address of each trustee and officer is AIM Sector Funds (Invesco Sector Funds) (the “Trust”), 11 Greenway Plaza, Suite 1000, Houston, Texas 77046-1173. The trustees serve for the life of the Trust, subject to their earlier death, incapacitation, resignation, retirement or removal as more specifically provided in the Trust’s organizational documents. Each officer serves for a one year term or until their successors are elected and qualified. Column two below includes length of time served with predecessor entities, if any.
| | | | | | | | |
Name, Year of Birth and
Position(s) Held with the Trust | | Trustee and/
or Officer Since | | Principal Occupation(s)
During Past 5 Years | | Number of
Funds in Fund
Complex
Overseen by
Trustee | | Other Directorship(s)
Held by Trustee During
Past 5 Years |
| Interested Persons | | | | | | | | |
| Martin L. Flanagan1 — 1960 Trustee | | 2007 | | Executive Director, Chief Executive Officer and President, Invesco Ltd. (ultimate parent of Invesco and a global investment management firm); Trustee, The Invesco Funds; Vice Chair, Investment Company Institute; and Member of Executive Board, SMU Cox School of Business Formerly: Advisor to the Board, Invesco Advisers, Inc. (formerly known as Invesco Institutional (N.A.), Inc.); Chairman and Chief Executive Officer, Invesco Advisers, Inc. (registered investment adviser); Director, Chairman, Chief Executive Officer and President, Invesco Holding Company (US), Inc. (formerly IVZ Inc.) (holding company), Invesco Group Services, Inc. (service provider) and Invesco North American Holdings, Inc. (holding company); Director, Chief Executive Officer and President, Invesco Holding Company Limited (parent of Invesco and a global investment management firm); Director, Invesco Ltd.; Chairman, Investment Company Institute and President, Co-Chief Executive Officer, Co-President, Chief Operating Officer and Chief Financial Officer, Franklin Resources, Inc. (global investment management organization) | | 144 | | None |
Philip A. Taylor2 — 1954 Trustee and Senior Vice President | | 2006 | | Head of the Americas and Senior Managing Director, Invesco Ltd.; Director, Invesco Advisers, Inc. (formerly known as Invesco Institutional (N.A.), Inc.) (registered investment adviser); Director, Chairman, Chief Executive Officer and President, Invesco Management Group, Inc. (formerly known as Invesco Aim Management Group, Inc.) (financial services holding company); Director and Chairman, Invesco Investment Services, Inc. (formerly known as Invesco Aim Investment Services, Inc.) (registered transfer agent) Chief Executive Officer, Invesco Corporate Class Inc. (corporate mutual fund company) Director, Chairman and Chief Executive Officer, Invesco Canada Ltd. (formerly known as Invesco Trimark Ltd./Invesco Trimark Ltèe) (registered investment adviser and registered transfer agent); Trustee and Senior Vice President, The Invesco Funds; Director, Invesco Investment Advisers LLC (formerly known as Van Kampen Asset Management). Formerly: Co-Chairman, Co-President and Co-Chief Executive Officer, Invesco Advisers, Inc. (formerly known as Invesco Institutional (N.A.), Inc.) (registered investment adviser); Director, Chief Executive Officer and President, Van Kampen Exchange Corp; President and Principal Executive Officer, The Invesco Funds (other than AIM Treasurer’s Series Trust (Invesco Treasurer’s Series Trust), Short-Term Investments Trust and Invesco Management Trust); Executive Vice President, The Invesco Funds (AIM Treasurer’s Series Trust (Invesco Treasurer’s Series Trust), Short-Term Investments Trust and Invesco Management Trust only); Director and President, INVESCO Funds Group, Inc. (registered investment adviser and registered transfer agent); Director and Chairman, IVZ Distributors, Inc. (formerly known as INVESCO Distributors, Inc.) (registered broker dealer); Director, President and Chairman, Invesco Inc. (holding company), Invesco Canada Holdings Inc. (holding company), Trimark Investments Ltd./Placements Trimark Ltèe and Invesco Financial Services Ltd/Services Financiers Invesco Ltèe; Chief Executive Officer, Invesco Canada Fund Inc. (corporate mutual fund company); Director and Chairman, Van Kampen Investor Services Inc.; Director, Chief Executive Officer and President, 1371 Preferred Inc. (holding company) and Van Kampen Investments Inc.; Director and President, AIM GP Canada Inc. (general partner for limited partnerships) and Van Kampen Advisors, Inc.; Director and Chief Executive Officer, Invesco Trimark Dealer Inc. (registered broker dealer); Director, Invesco Distributors, Inc. (formerly known as Invesco Aim Distributors, Inc.) (registered broker dealer); Manager, Invesco PowerShares Capital Management LLC; Director, Chief Executive Officer and President, Invesco Advisers, Inc.; Director, Chairman, Chief Executive Officer and President, Invesco Aim Capital Management, Inc.; President, Invesco Trimark Dealer Inc. and Invesco Trimark Ltd./Invesco Trimark Ltèe; Director and President, AIM Trimark Corporate Class Inc. and AIM Trimark Canada Fund Inc.; Senior Managing Director, Invesco Holding Company Limited; Director and Chairman, Fund Management Company (former registered broker dealer); President and Principal Executive Officer, The Invesco Funds (AIM Treasurer’s Series Trust (Invesco Treasurer’s Series Trust), and Short-Term Investments Trust only); President, AIM Trimark Global Fund Inc. and AIM Trimark Canada Fund Inc. | | 144 | | None |
| 1 | Mr. Flanagan is considered an interested person (within the meaning of Section 2(a)(19) of the 1940 Act) of the Trust because he is an officer of the Adviser to the Trust, and an officer and a director of Invesco Ltd., ultimate parent of the Adviser. |
| 2 | Mr. Taylor is considered an interested person (within the meaning of Section 2(a)(19) of the 1940 Act) of the Trust because he is an officer and a director of the Adviser. |
T-1 Invesco Technology Sector Fund
Trustees and Officers—(continued)
| | | | | | | | |
Name, Year of Birth and
Position(s) Held with the Trust | | Trustee and/
or Officer Since | | Principal Occupation(s)
During Past 5 Years | | Number of
Funds in Fund
Complex
Overseen by
Trustee | | Other Directorship(s)
Held by Trustee During
Past 5 Years |
| Independent Trustees | | | | | | | | |
Bruce L. Crockett — 1944 Trustee and Chair | | 2003 | | Chairman, Crockett Technologies Associates (technology consulting company) Formerly: Director, Captaris (unified messaging provider); Director, President and Chief Executive Officer, COMSAT Corporation; Chairman, Board of Governors of INTELSAT (international communications company); ACE Limited (insurance company); Independent Directors Council and Investment Company Institute: Member of the Audit Committee, Investment Company Institute; Member of the Executive Committee and Chair of the Governance Committee, Independent Directors Council | | 144 | | Director and Chairman of the Audit Committee, ALPS (Attorneys Liability Protection Society) (insurance company); Director and Member of the Audit Committee, Ferroglobe PLC (metallurgical company) |
David C. Arch — 1945 Trustee | | 2010 | | Chairman of Blistex Inc. (consumer health care products manufacturer); Member, World Presidents’ Organization | | 144 | | Board member of the Illinois Manufacturers’ Association |
James T. Bunch — 1942 Trustee | | 2000 | | Managing Member, Grumman Hill Group LLC (family office/private equity investments) Formerly: Chairman of the Board, Denver Film Society; Chairman of the Board of Trustees, Evans Scholarship Foundation; Chairman, Board of Governors, Western Golf Association | | 144 | | Trustee, Evans Scholarship Foundation |
Jack M. Fields — 1952 Trustee | | 2003 | | Chief Executive Officer, Twenty First Century Group, Inc. (government affairs company); and Discovery Learning Alliance (non-profit) Formerly: Owner and Chief Executive Officer, Dos Angeles Ranch L.P. (cattle, hunting, corporate entertainment); Director, Insperity, Inc. (formerly known as Administaff); Chief Executive Officer, Texana Timber LP (sustainable forestry company); Director of Cross Timbers Quail Research Ranch (non-profit); and member of the U.S. House of Representatives | | 144 | | None |
Cynthia Hostetler — 1962 Trustee | | 2017 | | Non-Executive Director and Trustee of a number of public and private business corporations Formerly: Head of Investment Funds and Private Equity, Overseas Private Investment Corporation; President, First Manhattan Bancorporation, Inc.; Attorney, Simpson Thacher & Bartlett LLP | | 144 | | Vulcan Materials Company (construction materials company); Trilinc Global Impact Fund; Aberdeen Investment Funds (4 portfolios); Artio Global Investment LLC (mutual fund complex); Edgen Group, Inc. (specialized energy and infrastructure products distributor) |
Eli Jones — 1961 Trustee | | 2016 | | Professor and Dean, Mays Business School—Texas A&M University Formerly: Professor and Dean, Walton College of Business, University of Arkansas and E.J. Ourso College of Business, Louisiana State University; Director, Arvest Bank | | 144 | | Insperity, Inc. (formerly known as Administaff) (human resources provider) |
Prema Mathai-Davis — 1950 Trustee | | 2003 | | Retired. Formerly: Chief Executive Officer, YWCA of the U.S.A. | | 144 | | None |
Teresa M. Ressel — 1962 Trustee | | 2017 | | Non-Executive Director and Trustee of a number of public and private business corporations Formerly: Chief Financial Officer, Olayan America, The Olayan Group (international investor/commercial/industrial); Chief Executive Officer, UBS Securities LLC; Group Chief Operating Officer, Americas, UBS AG; Assistant Secretary for Management & Budget and CFO, US Department of the Treasury; Chief Compliance Officer, Kaiser Permanente; Program Manager, Hewlett-Packard; Nuclear Engineering, General Dynamics Corporation | | 144 | | Atlantic Power Corporation (power generation company); ON Semiconductor Corp. (semiconductor supplier) |
Larry Soll — 1942 Trustee | | 1997 | | Retired. Formerly: Chairman, Chief Executive Officer and President, Synergen Corp. (a biotechnology company) | | 144 | | None |
Ann Barnett Stern — 1957 Trustee | | 2017 | | President and Chief Executive Officer, Houston Endowment Inc. (private philanthropic institution) Formerly: Executive Vice President and General Counsel, Texas Children’s Hospital; Attorney, Beck, Redden and Secrest, LLP; Business Law Instructor, University of St. Thomas; Attorney, Andrews & Kurth LLP | | 144 | | Federal Reserve Bank of Dallas |
Raymond Stickel, Jr. — 1944 Trustee | | 2005 | | Retired. Formerly: Director, Mainstay VP Series Funds, Inc. (25 portfolios); Partner, Deloitte & Touche | | 144 | | None |
Robert C. Troccoli — 1949 Trustee | | 2016 | | Adjunct Professor, University of Denver – Daniels College of Business Formerly: Senior Partner, KPMG LLP | | 144 | | None |
Christopher L. Wilson — 1957 Trustee | | 2017 | | Managing Partner, CT2, LLC (investing and consulting firm) Formerly: President/Chief Executive Officer, Columbia Funds, Bank of America Corporation; President/Chief Executive Officer, CDC IXIS Asset Management Services, Inc.; Principal & Director of Operations, Scudder Funds, Scudder, Stevens & Clark, Inc.; Assistant Vice President, Fidelity Investments | | 144 | | TD Asset Management USA Inc. (mutual fund complex) (22 portfolios); ISO New England, Inc. (non-profit organization managing regional electricity market) |
T-2 Invesco Technology Sector Fund
Trustees and Officers—(continued)
| | | | | | | | |
Name, Year of Birth and
Position(s) Held with the Trust | | Trustee and/
or Officer Since | | Principal Occupation(s)
During Past 5 Years | | Number of
Funds in Fund
Complex
Overseen by
Trustee | | Other Directorship(s)
Held by Trustee During
Past 5 Years |
| Other Officers | | | | | | | | |
Sheri Morris — 1964 President, Principal Executive Officer and Treasurer | | 2003 | | President, Principal Executive Officer and Treasurer, The Invesco Funds; Vice President, Invesco Advisers, Inc. (formerly known as Invesco Institutional (N.A.), Inc.) (registered investment adviser); and Vice President, PowerShares Exchange-Traded Fund Trust, PowerShares Exchange-Traded Fund Trust II, PowerShares India Exchange-Traded Fund Trust, PowerShares Actively Managed Exchange-Traded Fund Trust and PowerShares Actively Managed Exchange-Traded Commodity Fund Trust Formerly: Vice President and Principal Financial Officer, The Invesco Funds; Vice President, Invesco Aim Advisers, Inc., Invesco Aim Capital Management, Inc. and Invesco Aim Private Asset Management, Inc.; Assistant Vice President and Assistant Treasurer, The Invesco Funds and Assistant Vice President, Invesco Advisers, Inc., Invesco Aim Capital Management, Inc. and Invesco Aim Private Asset Management, Inc.; and Treasurer, PowerShares Exchange-Traded Fund Trust, PowerShares Exchange-Traded Fund Trust II, PowerShares India Exchange-Traded Fund Trust and PowerShares Actively Managed Exchange-Traded Fund Trust | | N/A | | N/A |
Russell C. Burk — 1958 Senior Vice President and Senior Officer | | 2005 | | Senior Vice President and Senior Officer, The Invesco Funds | | N/A | | N/A |
John M. Zerr — 1962 Senior Vice President, Chief Legal Officer and Secretary | | 2006 | | Director, Senior Vice President, Secretary and General Counsel, Invesco Management Group, Inc. (formerly known as Invesco AIM Management Group, Inc.); Senior Vice President, Invesco Advisers, Inc. (formerly known as Invesco Institutional (N.A.), Inc.) (registered investment adviser); Senior Vice President and Secretary, Invesco Distributors, Inc. (formerly known as Invesco AIM Distributors, Inc.); Director, Vice President and Secretary, Invesco Investment Services, Inc. (formerly known as Invesco AIM Investment Services, Inc.) Senior Vice President, Chief Legal Officer and Secretary, The Invesco Funds; Managing Director, Invesco PowerShares Capital Management LLC; Director, Secretary and General Counsel, Invesco Investment Advisers LLC (formerly known as Van Kampen Asset Management); Secretary and General Counsel, Invesco Capital Markets, Inc. (formerly known as Van Kampen Funds Inc.) and Chief Legal Officer, PowerShares Exchange-Traded Fund Trust, PowerShares Exchange-Traded Fund Trust II, PowerShares India Exchange-Traded Fund Trust, PowerShares Actively Managed Exchange-Traded Fund Trust and PowerShares Actively Managed Exchange-Traded Commodity Fund Trust; Manager and Secretary, Invesco Indexing LLC Formerly: Director, Secretary, General Counsel and Senior Vice President, Van Kampen Exchange Corp.; Director, Vice President and Secretary, IVZ Distributors, Inc. (formerly known as INVESCO Distributors, Inc.); Director and Vice President, INVESCO Funds Group, Inc.; Director and Vice President, Van Kampen Advisors Inc.; Director, Vice President, Secretary and General Counsel, Van Kampen Investor Services Inc.; Director, Invesco Distributors, Inc. (formerly known as Invesco AIM Distributors, Inc.); Director, Senior Vice President, General Counsel and Secretary, Invesco AIM Advisers, Inc. and Van Kampen Investments Inc.; Director, Vice President and Secretary, Fund Management Company; Director, Senior Vice President, Secretary, General Counsel and Vice President, Invesco AIM Capital Management, Inc.; Chief Operating Officer and General Counsel, Liberty Ridge Capital, Inc. (an investment adviser); Vice President and Secretary, PBHG Funds (an investment company) and PBHG Insurance Series Fund (an investment company); Chief Operating Officer, General Counsel and Secretary, Old Mutual Investment Partners (a broker-dealer); General Counsel and Secretary, Old Mutual Fund Services (an administrator) and Old Mutual Shareholder Services (a shareholder servicing center); Executive Vice President, General Counsel and Secretary, Old Mutual Capital, Inc. (an investment adviser); and Vice President and Secretary, Old Mutual Advisors Funds (an investment company) | | N/A | | N/A |
Gregory G. McGreevey — 1962 Senior Vice President | | 2012 | | Senior Managing Director, Invesco Ltd.; Director, Chairman, President, and Chief Executive Officer, Invesco Advisers, Inc. (formerly known as Invesco Institutional (N.A.), Inc.) (registered investment adviser); Director, Invesco Mortgage Capital, Inc. and Invesco Senior Secured Management, Inc.; and Senior Vice President, The Invesco Funds Formerly: Assistant Vice President, The Invesco Funds | | N/A | | N/A |
Kelli Gallegos — 1970 Vice President, Principal Financial Officer and Assistant Treasurer | | 2008 | | Vice President, Principal Financial Officer and Assistant Treasurer, The Invesco Funds; Assistant Treasurer, Invesco PowerShares Capital Management LLC, PowerShares Exchange-Traded Fund Trust, PowerShares Exchange-Traded Fund Trust II, PowerShares India Exchange-Traded Fund Trust, PowerShares Actively Managed Exchange-Traded Fund Trust and PowerShares Actively Managed Exchange-Traded Commodity Fund Trust Formerly: Assistant Vice President, The Invesco Funds | | N/A | | N/A |
T-3 Invesco Technology Sector Fund
Trustees and Officers—(continued)
| | | | | | | | |
Name, Year of Birth and
Position(s) Held with the Trust | | Trustee and/
or Officer Since | | Principal Occupation(s)
During Past 5 Years | | Number of
Funds in Fund
Complex
Overseen by
Trustee | | Other Directorship(s)
Held by Trustee During
Past 5 Years |
| Other Officers—(continued) | | | | | | | | |
Tracy Sullivan — 1962 Vice President, Chief Tax Officer and Assistant Treasurer | | 2008 | | Vice President, Chief Tax Officer and Assistant Treasurer, The Invesco Funds; Assistant Treasurer, Invesco PowerShares Capital Management LLC, PowerShares Exchange-Traded Fund Trust, PowerShares Exchange-Traded Fund Trust II, PowerShares India Exchange-Traded Fund Trust, PowerShares Actively Managed Exchange-Traded Fund Trust and PowerShares Actively Managed Exchange-Traded Commodity Fund Trust Formerly: Assistant Vice President, The Invesco Funds | | N/A | | N/A |
Crissie M. Wisdom — 1969 Anti-Money Laundering Compliance Officer | | 2013 | | Anti-Money Laundering Compliance Officer, Invesco Advisers, Inc. (formerly known as Invesco Institutional (N.A.), Inc.) (registered investment adviser), Invesco Capital Markets, Inc. (formerly known as Van Kampen Funds Inc.), Invesco Distributors, Inc., Invesco Investment Services, Inc., Invesco Management Group, Inc., The Invesco Funds, and PowerShares Exchange-Traded Fund Trust, PowerShares Exchange-Traded Fund Trust II, PowerShares India Exchange-Traded Fund Trust, PowerShares Actively Managed Exchange-Traded Fund Trust and PowerShares Actively Managed Exchange-Traded Commodity Fund Trust; Anti-Money Laundering Compliance Officer and Bank Secrecy Act Officer, INVESCO National Trust Company and Invesco Trust Company; and Fraud Prevention Manager and Controls and Risk Analysis Manager for Invesco Investment Services, Inc. Formerly: Anti-Money Laundering Compliance Officer, Van Kampen Exchange Corp. | | N/A | | N/A |
Robert R. Leveille — 1969 Chief Compliance Officer | | 2016 | | Chief Compliance Officer, Invesco Advisers, Inc. (registered investment adviser); and Chief Compliance Officer, The Invesco Funds Formerly: Chief Compliance Officer, Putnam Investments and the Putnam Funds | | N/A | | N/A |
The Statement of Additional Information of the Trust includes additional information about the Fund’s Trustees and is available upon request, without charge, by calling 1.800.959.4246. Please refer to the Fund’s Statement of Additional Information for information on the Fund’s sub-advisers.
| | | | | | | | | | |
Office of the Fund 11 Greenway Plaza, Suite 1000 Houston, TX 77046-1173 | | Investment Adviser Invesco Advisers, Inc. 1555 Peachtree Street, N.E. Atlanta, GA 30309 | |
| Distributor
Invesco Distributors, Inc. 11 Greenway Plaza, Suite 1000 Houston, TX 77046-1173 |
| |
| Auditors
PricewaterhouseCoopers LLP 1000 Louisiana Street, Suite 5800 Houston, TX 77002-5678 |
|
| | | |
| | | | | | | | | | |
Counsel to the Fund Stradley Ronon Stevens & Young, LLP 2005 Market Street, Suite 2600 Philadelphia, PA 19103-7018 | | Counsel to the Independent Trustees Goodwin Procter LLP 901 New York Avenue, N.W. Washington, D.C. 20001 | |
| Transfer Agent
Invesco Investment Services, Inc. 11 Greenway Plaza, Suite 1000 Houston, TX 77046-1173 |
| |
| Custodian
State Street Bank and Trust Company 225 Franklin Street Boston, MA 02110-2801 |
|
T-4 Invesco Technology Sector Fund
Explore High-Conviction Investing with Invesco

Go paperless with eDelivery
Visit invesco.com/edelivery to enjoy the convenience and security of anytime electronic access to your investment documents.
With eDelivery, you can elect to have any or all of the following materials delivered straight to your inbox to download, save and print from your own computer:
∎ Fund reports and prospectuses
∎ Quarterly statements
∎ Daily confirmations
∎ Tax forms
Invesco mailing information
Send general correspondence to Invesco Investment Services, Inc., P.O. Box 219078, Kansas City, MO 64121-9078.
Important notice regarding delivery of security holder documents
To reduce Fund expenses, only one copy of most shareholder documents may be mailed to shareholders with multiple accounts at the same address (Householding). Mailing of your shareholder documents may be householded indefinitely unless you instruct us otherwise. If you do not want the mailing of these documents to be combined with those for other members of your household, please contact Invesco Investment Services, Inc. at 800 959 4246 or contact your financial institution. We will begin sending you individual copies for each account within 30 days after receiving your request.
Fund holdings and proxy voting information
The Fund provides a complete list of its holdings four times in each fiscal year, at the quarter ends. For the second and fourth quarters, the lists appear in the Fund’s semiannual and annual reports to shareholders. For the first and third quarters, the Fund files the lists with the Securities and Exchange Commission (SEC) on Form N-Q. The most recent list of portfolio holdings is available at invesco.com/completeqtrholdings. Shareholders can also look up the Fund’s Forms N-Q on the SEC website at sec.gov. Copies of the Fund’s Forms N-Q may be reviewed and copied at the SEC Public Reference Room in Washington, D.C. You can obtain information on the operation of the Public Reference Room, including information about duplicating fee charges, by calling 202 551 8090 or 800 732 0330, or by electronic request at the following email address: publicinfo@sec.gov.
The SEC file numbers for the Fund are shown below.
A description of the policies and procedures that the Fund uses to determine how to vote proxies relating to portfolio securities is available without charge, upon request, from our Client Services department at 800 959 4246 or at invesco.com/proxyguidelines. The information is also available on the SEC website, sec.gov.
| | |
Information regarding how the Fund voted proxies related to its portfolio securities during the most
recent 12-month period ended June 30 is available at invesco.com/proxysearch. The information is
also available on the SEC website, sec.gov. Invesco Advisers, Inc. is an investment adviser; it provides investment advisory services to
individual and institutional clients and does not sell securities. Invesco Distributors, Inc. is the US
distributor for Invesco Ltd.’s retail mutual funds, exchange-traded funds and institutional money
market funds. Both are wholly owned, indirect subsidiaries of Invesco Ltd. | |  |
SEC file numbers: 811-03826 and 002-85905 Invesco Distributors, Inc. MS-TECH-AR-1 06132017 1541
| | | | |
| | |
 | | Annual Report to Shareholders | | April 30, 2017 |
| | |
| | Invesco Value Opportunities Fund |
| | Nasdaq: |
| | A: VVOAX ∎ B: VVOBX ∎ C: VVOCX ∎ R: VVORX ∎ Y: VVOIX ∎ R5: VVONX ∎ R6: VVOSX |

Letters to Shareholders
| | |

Philip Taylor | | Dear Shareholders: This annual report includes information about your Fund, including performance data and a complete list of its investments as of the close of the reporting period. Inside is a discussion of how your Fund was managed and the factors that affected its performance during the reporting period. The reporting period began with stock market volatility in the US and abroad, largely the result of uncertainty about global economic growth and monetary policy. Markets declined sharply following UK voters’ decision in June to leave the European Union. Relatively quickly, however, markets recovered, reaching record highs later in the summer. Demand was strong for income-producing investments, particularly those perceived to be lower risk; this benefited bonds as well as dividend-paying stocks for much of the reporting period. While economic news |
| |
| |
| |
| |
| |
| |
| |
| |
| |
| |
in the US was generally positive during the reporting period, news overseas was less upbeat. The European Central Bank and central banks in China and Japan – as well as other countries – maintained extraordinarily accommodative monetary policies in response to economic weakness. After months of uncertainty, the outcome of the US presidential election in November triggered a major stock market rally, with most market indexes repeatedly reaching new highs through February. As expected, the US Federal Reserve (the Fed) raised interest rates in December 2016 and again in March 2017. In its March statement, the Fed noted that the labor market has strengthened and economic activity has expanded at a moderate pace – and that it expects those trends to continue.
Short-term market volatility can prompt some investors to abandon their investment plans – and can cause others to settle for whatever returns the market has to offer. The investment professionals at Invesco, in contrast, invest with high conviction. This means that, no matter the asset class or the strategy, each investment team has a passion to exceed. We want to help investors achieve better outcomes, such as seeking higher returns, helping mitigate risk and generating income. Of course, investing with high conviction can’t guarantee a profit or ensure success; no investment strategy can. To learn more about how we invest with high conviction, visit invesco.com/HighConviction.
You, too, can invest with high conviction by maintaining a long-term investment perspective and by working with your financial adviser on a regular basis. During periods of short-term market volatility or uncertainty, your financial adviser can keep you focused on your long-term investment goals – a new home, a child’s college education or a secure retirement. He or she also can share research about the economy, the markets and individual investment options.
Visit our website for more information on your investments
Our website, invesco.com/us, offers a wide range of market insights and investment perspectives. On the website, you’ll find detailed information about our funds, including performance, holdings and portfolio manager commentaries. You can access information about your account by completing a simple, secure online registration. To do so, select “Log In” on the right side of the homepage, and then select “Register for Individual Account Access.”
In addition to the resources accessible on our website and through our mobile app, you can obtain timely updates to help you stay informed about the markets, the economy and investing by connecting with Invesco on Twitter, LinkedIn or Facebook. You can access our blog at blog.invesco.us.com. Our goal is to provide you the information you want, when and where you want it.
Finally, I’m pleased to share with you Invesco’s commitment to both the Principles for Responsible Investment and to considering environmental, social and governance issues in our robust investment process. I invite you to learn more at invesco.com/esg.
Have questions?
For questions about your account, contact an Invesco client services representative at 800 959 4246. For Invesco-related questions or comments, please email me directly at phil@invesco.com.
All of us at Invesco look forward to serving your investment management needs. Thank you for investing with us.
Sincerely,

Philip Taylor
Senior Managing Director, Invesco Ltd.
2 Invesco Value Opportunities Fund
| | |

Bruce Crockett | | Dear Fellow Shareholders: Among the many important lessons I’ve learned in more than 40 years in a variety of business endeavors is the value of a trusted advocate. As independent chair of the Invesco Funds Board, I can assure you that the members of the Board are strong advocates for the interests of investors in Invesco’s mutual funds. We work hard to represent your interests through oversight of the quality of the investment management services your funds receive and other matters important to your investment, including but not limited to: |
| | ∎ Ensuring that Invesco offers a diverse lineup of mutual funds that your financial adviser can use to strive to meet your financial needs as your investment goals change over time. |
| | ∎ Monitoring how the portfolio management teams of the Invesco funds are performing in light of changing economic and market conditions. |
| ∎ | | Assessing each portfolio management team’s investment performance within the context of the investment strategy described in the fund’s prospectus. |
| ∎ | | Monitoring for potential conflicts of interests that may impact the nature of the services that your funds receive. |
We believe one of the most important services we provide our fund shareholders is the annual review of the funds’ advisory and sub-advisory contracts with Invesco Advisers and its affiliates. This review is required by the Investment Company Act of 1940 and focuses on the nature and quality of the services Invesco provides as the adviser to the Invesco funds and the reasonableness of the fees that it charges for those services. Each year, we spend months carefully reviewing information received from Invesco and a variety of independent sources, such as performance and fee data prepared by Lipper, Inc. (a subsidiary of Broadridge Financial Solutions, Inc.), an independent, third-party firm widely recognized as a leader in its field. We also meet with our independent legal counsel and other independent advisers to review and help us assess the information that we have received. Our goal is to assure that you receive quality investment management services for a reasonable fee.
I trust the measures outlined above provide assurance that you have a worthy advocate when it comes to choosing the Invesco Funds.
As always, please contact me at bruce@brucecrockett.com with any questions or concerns you may have. On behalf of the Board, we look forward to continuing to represent your interests and serving your needs.
Sincerely,

Bruce L. Crockett
Independent Chair
Invesco Funds Board of Trustees
3 Invesco Value Opportunities Fund
Management’s Discussion of Fund Performance
| | | | | | | |
| | | Performance summary | |
| | For the fiscal year ended April 30, 2017, Class A shares of Invesco Value Opportunities Fund (the Fund), at net asset value (NAV), outperformed the S&P 1500 Value Index, the Fund’s style-specific benchmark. Your Fund’s long-term performance appears later in this report. | |
| | | Fund vs. Indexes | |
| | Total returns, 4/30/16 to 4/30/17, at net asset value (NAV). Performance shown does not include applicable contingent deferred sales charges (CDSC) or front-end sales charges, which would have reduced performance. | |
| | | Class A Shares | | | | 17.81 | % |
| | | Class B Shares | | | | 17.85 | |
| | | Class C Shares | | | | 17.00 | |
| | | Class R Shares | | | | 17.53 | |
| | | Class Y Shares | | | | 18.17 | |
| | | Class R5 Shares | | | | 18.30 | |
| | | Class R6 Shares* | | | | 17.81 | |
| | | S&P 500 Index▼ (Broad Market Index) | | | | 17.92 | |
| | | S&P 1500 Value Index▼ (Style-Specific Index) | | | | 16.62 | |
| | | Lipper Multi-Cap Value Funds Index⬛ (Peer Group Index) | | | | 16.46 | |
| | |
| | | Source(s): ▼FactSet Research Systems Inc.; ⬛Lipper Inc. *Class R6 shares incepted on April 4, 2017. See page 7 for more information. | | | | | |
Market conditions and your Fund
During the fiscal year ended April 30, 2017, the US economy continued to expand and strengthen, with unemployment declining and inflation ticking upward. Signs of an improving economy prompted the US Federal Reserve to raise interest rates in December 2016 and again in March 2017. Major US stock market indexes posted gains for the reporting period, with most hitting record highs following the US presidential election. Investors seemed to believe that the new administration’s plans to reduce tax rates, scale back regulations and increase infrastructure spending had the potential to stimulate economic growth.
While US and overseas stock markets were jolted by the UK’s decision in June 2016 to leave the European Union, markets recovered relatively quickly. During the second
half of 2016, small-cap stocks led the US market while large-cap stocks lagged – but that reversed in the first quarter of 2017. Near the close of the fiscal year, headlines out of Washington, DC, suggested that enacting significant regulatory and tax reform might be more difficult than previously anticipated, which had a slightly negative impact on investor sentiment. For the reporting period as a whole, information technology and financials were the strongest-performing sectors, while telecommunication services and energy were the weakest-performing sectors in the US markets.
During the fiscal year, we continued to use our intrinsic value strategy, seeking to create wealth by maintaining a long-term investment horizon and investing in companies selling at a significant discount to our estimate of their intrinsic value. We believe intrinsic value represents
the fair economic worth of a business. Since our application of this strategy is highly disciplined and relatively unique, it is important to understand the benefits and limitations of our process. First, the investment strategy is intended to preserve your capital while growing it at above-market rates over the long term. Second, our investments have little in common with popular stock market indexes and most of our peers. And third, the Fund’s short-term relative performance will naturally be different from stock market indexes and peers and have little information value since we typically structure the portfolio significantly differently than these benchmarks.
Drivers of Fund performance were mainly stock-specific during the reporting period. Financial services companies Bank of America, JP Morgan Chase, and LPL Financial were among the largest contributors to overall Fund performance. Shares of these companies rose along with the financials sector in general during the fiscal year. Auto parts company Dana also contributed to the Fund’s performance relative to its style-specific benchmark. Dana is a world leader in providing highly engineered solutions for passenger vehicles, commercial trucks and off-highway markets. Shares of the company rose after it reported strong financial results during the fiscal year.
AmTrust Financial Services was the largest detractor from the Fund’s performance relative to its style-specific benchmark. AmTrust’s stock price declined after a new auditor asked the company to restate historical financials and it reported a charge to increase its liability for future insurance claims. We believe investors overreacted to these issues and, therefore, added to our position in this stock. Oil services company Weatherford
| | | | | | | |
| | | Portfolio Composition | |
| | By sector | | | | % of total net assets | |
| | | | | | | |
| | |
| | | Financials | | | | 41.3 | % |
| | | Health Care | | | | 15.7 | |
| | | Consumer Discretionary | | | | 11.3 | |
| | | Information Technology | | | | 9.3 | |
| | | Industrials | | | | 8.7 | |
| | | Energy | | | | 3.4 | |
| | | Real Estate | | | | 2.8 | |
| | | Materials | | | | 2.3 | |
| | Money Market Funds Plus Other Assets Less Liabilities | | | | 5.2 | |
| | | | |
| Top 10 Equity Holdings* |
| | % of total net assets |
| | |
1. | | JP Morgan Chase & Co. | | 4.5% |
2. | | Affiliated Managers Group, Inc. | | 4.4 |
3. | | AECOM | | 4.3 |
4. | | AmTrust Financial Services, Inc. | | 4.2 |
5. | | Dana Inc. | | 3.5 |
6. | | Bank of America Corp. | | 3.5 |
7. | | Cardinal Health, Inc. | | 3.5 |
8. | | Citigroup Inc. | | 3.4 |
9. | | Synchrony Financial | | 3.4 |
10. | | LPL Financial Holdings, Inc. | | 2.9 |
| | | | |
| Total Net Assets | | $ | 799.2 million | |
| | | | |
| |
| Total Number of Holdings* | | | 44 | |
The Fund’s holdings are subject to change, and there is no assurance that the Fund will continue to hold any particular security.
*Excluding money market fund holdings.
Data presented here are as of April 30, 2017.
4 Invesco Value Opportunities Fund
International was also a significant detractor from Fund performance. Shares of the company declined after missing expectations for free cash flow during the fiscal year. Health care sector holdings Endo International, a drug manufacturer, and Brookdale Senior Living, a long-term care facility, were detractors from overall Fund performance, as well. Shares of Endo International fell after reporting disappointing financial results, and shares of Brookdale Senior Living declined after the company lowered its 2016 guidance. We sold our position in Endo International before the close of the reporting period.
We believe the single most important indicator of how the Fund is positioned for potential future success is not our recent investment results or popular statistical measures, but rather the difference between current market prices and the Fund’s estimated intrinsic value – the aggregate business value of the portfolio based on our estimate of intrinsic value for each individual holding.
At the end of the fiscal year, the difference between the market price and the estimated intrinsic value of the Fund was attractive, according to our estimation. While there is no assurance that market value will ever reflect our estimate of the Fund’s intrinsic value, we believe the gap between price and estimated intrinsic value may provide above-average capital appreciation.
We will continue to work hard to protect and grow the Fund’s estimated intrinsic value. We thank you for your investment and for sharing our long-term investment perspective.
The views and opinions expressed in management’s discussion of Fund performance are those of Invesco Advisers, Inc. These views and opinions are subject to change at any time based on factors such as market and economic conditions. These views and opinions may not be relied upon as investment advice or recommendations, or as an offer for a particular security. The information is not a complete analysis of every aspect of any market, country, industry, security or the Fund. Statements of fact are from sources considered reliable, but Invesco Advisers, Inc. makes no representation or warranty as to their completeness or accuracy. Although historical performance is no guarantee of future results, these insights may help you understand our investment management philosophy.
See important Fund and, if applicable, index disclosures later in this report.
| | |
 | | R. Canon Coleman II Chartered Financial Analyst, Portfolio Manager, is lead manager of Invesco Value Opportunities |
Fund. He joined Invesco in 1999. Mr. Coleman earned a BS and an MS in accounting from the University of Florida. He also earned an MBA from the Wharton School of the University of Pennsylvania. |
| | |
 | | Jonathan Edwards Chartered Financial Analyst, Portfolio Manager, is manager of Invesco Value Opportunities Fund. He |
joined Invesco in 2001. Mr. Edwards earned a BS in economics from Texas A&M University and an MBA from The University of Texas at Austin. |
| | |
 | | Jonathan Mueller Chartered Financial Analyst, Portfolio Manager, is manager of Invesco Value Opportunities Fund. He |
| joined Invesco in 2001. Mr. Mueller earned a BBA in accounting from Texas Christian University and an MBA in finance from The University of Texas at Austin. He is also a Certified Public Accountant. |
5 Invesco Value Opportunities Fund
Your Fund’s Long-Term Performance
Results of a $10,000 Investment – Oldest Share Class(es)
Fund and index data from 4/30/07
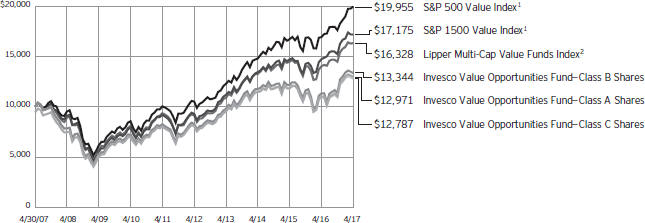
| 1 | Source: FactSet Research Systems Inc. |
Past performance cannot guarantee comparable future results.
The data shown in the chart include reinvested distributions, applicable sales charges and Fund expenses including management fees. Results for Class B shares are calculated as if a hypothetical shareholder had liquidated his entire investment in the Fund at the close of the reporting period and paid the contingent deferred sales charges, if applicable.
Index results include reinvested dividends, but they do not reflect sales charges. Performance of the peer group, if applicable, reflects fund expenses and management fees; performance of a market index does not. Performance shown in the chart and table(s) does not reflect deduction of taxes a shareholder would pay on Fund distributions or sale of Fund shares.
6 Invesco Value Opportunities Fund
| | | | | |
| Average Annual Total Returns |
| As of 4/30/17, including maximum applicable sales charges | |
| |
Class A Shares | | | | | |
| Inception (6/25/01) | | | | 4.95 | % |
| 10 Years | | | | 2.64 | |
| 5 Years | | | | 8.73 | |
| 1 Year | | | | 11.28 | |
| |
| Class B Shares | | | | | |
| Inception (6/25/01) | | | | 4.92 | % |
| 10 Years | | | | 2.93 | |
| 5 Years | | | | 9.72 | |
| 1 Year | | | | 12.85 | |
| |
| Class C Shares | | | | | |
| Inception (6/25/01) | | | | 4.56 | % |
| 10 Years | | | | 2.49 | |
| 5 Years | | | | 9.19 | |
| 1 Year | | | | 16.00 | |
| |
| Class R Shares | | | | | |
| 10 Years | | | | 2.96 | % |
| 5 Years | | | | 9.70 | |
| 1 Year | | | | 17.53 | |
| |
| Class Y Shares | | | | | |
| Inception (3/23/05) | | | | 5.30 | % |
| 10 Years | | | | 3.47 | |
| 5 Years | | | | 10.25 | |
| 1 Year | | | | 18.17 | |
| |
| Class R5 Shares | | | | | |
| 10 Years | | | | 3.51 | % |
| 5 Years | | | | 10.46 | |
| 1 Year | | | | 18.30 | |
| |
| Class R6 Shares | | | | | |
| 10 Years | | | | 3.22 | % |
| 5 Years | | | | 9.97 | |
| 1 Year | | | | 17.81 | |
Effective June 1, 2010, Class A, Class B, Class C and Class I shares of the predecessor fund, Van Kampen Value Opportunities Fund, advised by Van Kampen Asset Management were reorganized into Class A, Class B, Class C and Class Y shares, respectively, of Invesco Van Kampen Value Opportunities Fund (renamed Invesco Value Opportunities Fund). Returns shown above, prior to June 1, 2010, for Class A, Class B, Class C and Class Y shares are blended returns of the predecessor fund and Invesco Value Opportunities Fund. Share class returns will differ from the predecessor fund because of different expenses.
| | | | | |
| Average Annual Total Returns |
| As of 3/31/17, the most recent calendar quarter end, including maximum applicable sales charges | |
| |
| Class A Shares | | | | | |
| Inception (6/25/01) | | | | 5.04 | % |
| 10 Years | | | | 3.13 | |
| 5 Years | | | | 8.67 | |
| 1 Year | | | | 14.87 | |
| |
| Class B Shares | | | | | |
| Inception (6/25/01) | | | | 5.02 | % |
| 10 Years | | | | 3.41 | |
| 5 Years | | | | 9.62 | |
| 1 Year | | | | 16.55 | |
| |
| Class C Shares | | | | | |
| Inception (6/25/01) | | | | 4.66 | % |
| 10 Years | | | | 2.98 | |
| 5 Years | | | | 9.10 | |
| 1 Year | | | | 19.64 | |
| |
| Class R Shares | | | | | |
| 10 Years | | | | 3.45 | % |
| 5 Years | | | | 9.61 | |
| 1 Year | | | | 21.17 | |
| |
| Class Y Shares | | | | | |
| Inception (3/23/05) | | | | 5.43 | % |
| 10 Years | | | | 3.96 | |
| 5 Years | | | | 10.18 | |
| 1 Year | | | | 21.82 | |
| |
| Class R5 Shares | | | | | |
| 10 Years | | | | 4.00 | % |
| 5 Years | | | | 10.39 | |
| 1 Year | | | | 22.05 | |
Class R shares incepted on May 23, 2011. Performance shown prior to that date is that of the Fund’s and the predecessor fund’s Class A shares, restated to reflect the higher 12b-1 fees applicable to Class R shares.
Class R5 shares incepted on May 23, 2011. Performance shown prior to that date is that of the Fund’s and the predecessor fund’s Class A shares and includes the 12b-1 fees applicable to Class A shares.
Class R6 shares incepted on April 4, 2017. Performance shown prior to that date is that of the Fund’s and the predecessor fund’s Class A shares and includes the 12b-1 fees applicable to Class A shares.
The performance data quoted represent past performance and cannot guarantee comparable future results; current performance may
be lower or higher. Please visit invesco.com/performance for the most recent month-end performance. Performance figures reflect reinvested distributions, changes in net asset value and the effect of the maximum sales charge unless otherwise stated. Investment return and principal value will fluctuate so that you may have a gain or loss when you sell shares.
The total annual Fund operating expense ratio set forth in the most recent Fund prospectus as of the date of this report for Class A, Class B, Class C, Class R, Class Y, Class R5 and Class R6 shares was 1.26%, 1.26%, 1.98%, 1.51%, 1.01%, 0.85% and 0.80%, respectively. The expense ratios presented above may vary from the expense ratios presented in other sections of this report that are based on expenses incurred during the period covered by this report.
Class A share performance reflects the maximum 5.50% sales charge, and Class B and Class C share performance reflects the applicable contingent deferred sales charge (CDSC) for the period involved. For shares purchased prior to June 1, 2010, the CDSC on Class B shares declines from 5% at the time of purchase to 0% at the beginning of the sixth year. For shares purchased on or after June 1, 2010, the CDSC on Class B shares declines from 5% at the time of purchase to 0% at the beginning of the seventh year. The CDSC on Class C shares is 1% for the first year after purchase. Class R, Class Y, Class R5 and Class R6 shares do not have a front-end sales charge or a CDSC; therefore, performance is at net asset value.
The performance of the Fund’s share classes will differ primarily due to different sales charge structures and class expenses.
Fund performance reflects any applicable fee waivers and/or expense reimbursements. Had the adviser not waived fees and/or reimbursed expenses currently or in the past, returns would have been lower. See current prospectus for more information.
7 Invesco Value Opportunities Fund
Invesco Value Opportunities Fund’s investment objective is total return through growth of capital and current income.
| ∎ | | Unless otherwise stated, information presented in this report is as of April 30, 2017, and is based on total net assets. |
| ∎ | | Unless otherwise noted, all data provided by Invesco. |
| ∎ | | To access your Fund’s reports/prospectus, visit invesco.com/fundreports. |
About share classes
| ∎ | | Class B shares may not be purchased for new or additional investments. Please see the prospectus for more information. |
| ∎ | | Class R shares are generally available only to employer sponsored retirement and benefit plans. Please see the prospectus for more information. |
| ∎ | | Class Y shares are available only to certain investors. Please see the prospectus for more information. |
| ∎ | | Class R5 shares and Class R6 shares are available for use by retirement plans that meet certain standards and for institutional investors. Class R6 shares are also available through intermediaries that have established an agreement with Invesco Distributors, Inc. to make such shares available for use in retail omnibus accounts. Please see the prospectus for more information. |
Principal risks of investing in the Fund
| ∎ | | Convertible securities risk. The market values of convertible securities are affected by market interest rates, the risk of actual issuer default on interest or principal payments and the value of the underlying common stock into which the convertible security may be converted. Additionally, a convertible security is subject to the same types of market and issuer risks as apply to the underlying common stock. In addition, certain convertible securities are subject to involuntary conversions and may undergo principal write-downs upon the occurrence of certain triggering events, and, as a result, are subject to an increased risk of loss. |
| ∎ | | Depositary receipts risk. Investing in depositary receipts involves the same risks as direct investments in foreign securities. In addition, the underlying issuers of certain depositary receipts are under no obligation to distribute shareholder communications or pass through any voting rights with respect |
| | to the deposited securities to the holders of such receipts. The Fund may therefore receive less timely information or have less control than if it invested directly in the foreign issuer. |
| ∎ | | Derivatives risk. The value of a derivative instrument depends largely on (and is derived from) the value of an underlying security, currency, commodity, interest rate, index or other asset (each referred to as an underlying asset). In addition to risks relating to the underlying assets, the use of derivatives may include other, possibly greater, risks, including counterparty, leverage and liquidity risks. Counterparty risk is the risk that the counterparty to the derivative contract will default on its obligation to pay the Fund the amount owed or otherwise perform under the derivative contract. Derivatives create leverage risk because they do not require payment up front equal to the economic exposure created by owning the derivative. As a result, an adverse change in the value of the underlying asset could result in the Fund sustaining a loss that is substantially greater than the amount invested in the derivative, which may make the Fund’s returns more volatile and increase the risk of loss. Derivative instruments may also be less liquid than more traditional investments and the Fund may be unable to sell or close out its derivative positions at a desirable time or price. This risk may be more acute under adverse market conditions, during which the Fund may be most in need of liquidating its derivative positions. Derivatives may also be harder to value, less tax efficient and subject to changing government regulation that could impact the Fund’s ability to use certain derivatives or their cost. Also, derivatives used for hedging or to gain or limit exposure to a particular market segment may not provide the expected benefits, particularly during adverse market conditions. |
This report must be accompanied or preceded by a currently effective Fund prospectus, which contains more complete information, including sales charges and expenses. Investors should read it carefully before investing.
NOT FDIC INSURED | MAY LOSE VALUE | NO BANK GUARANTEE
| ∎ | | Emerging markets securities risk. Emerging markets (also referred to as developing markets) are generally subject to greater market volatility, political, social and economic instability, uncertain trading markets and more governmental limitations on foreign investment than more developed markets. In addition, companies operating in emerging markets may be subject to lower trading volume and greater price fluctuations than companies in more developed markets. Securities law and the enforcement of systems of taxation in many emerging market countries may change quickly and unpredictably. In addition, investments in emerging markets securities may also be subject to additional transaction costs, delays in settlement procedures, and lack of timely information. |
| ∎ | | Foreign securities risk. The Fund’s foreign investments may be adversely affected by political and social instability, changes in economic or taxation policies, difficulty in enforcing obligations, decreased liquidity or increased volatility. Foreign investments also involve the risk of the possible seizure, nationalization or expropriation of the issuer or foreign deposits (in which the Fund could lose its entire investments in a certain market) and the possible adoption of foreign governmental restrictions such as exchange controls. Unless the Fund has hedged its foreign securities risk, foreign securities risk also involves the risk of negative foreign currency rate fluctuations, which may cause the value of securities denominated in such foreign currency (or other instruments through which the Fund has exposure to foreign currencies) to decline in value. Currency exchange rates may fluctuate significantly over short periods of time. Currency hedging strategies, if used, are not always successful. |
| ∎ | | Initial public offerings (IPO) risk. The prices of IPO securities often fluctuate more than prices of securities of companies with longer trading histories and sometimes experience significant price drops shortly after their initial issuance. In addition, companies offering securities in IPOs may have less experienced management or limited operating histories. |
8 Invesco Value Opportunities Fund
| ∎ | | Management risk. The Fund is actively managed and depends heavily on the Adviser’s judgment about markets, interest rates or the attractiveness, relative values, liquidity, or potential appreciation of particular investments made for the Fund’s portfolio. The Fund could experience losses if these judgments prove to be incorrect. Additionally, legislative, regulatory, or tax developments may adversely affect management of the Fund and, therefore, the ability of the Fund to achieve its investment objective. |
| ∎ | | Market risk. The market values of the Fund’s investments, and therefore the value of the Fund’s shares, will go up and down, sometimes rapidly or unpredictably. Market risk may affect a single issuer, industry or section of the economy, or it may affect the market as a whole. Individual stock prices tend to go up and down more dramatically than those of certain other types of investments, such as bonds. During a general downturn in the financial markets, multiple asset classes may decline in value. When markets perform well, there can be no assurance that specific investments held by the Fund will rise in value. |
| ∎ | | Preferred securities risk. Preferred securities are subject to issuer-specific and market risks applicable generally to equity securities. Preferred securities also may be subordinated to bonds or other debt instruments, subjecting them to a greater risk of non-payment, may be less liquid than many other securities, such as common stocks, and generally offer no voting rights with respect to the issuer. |
| ∎ | | Real estate investment trust (REIT) risk/real estate risk. Investments in real estate related instruments may be affected by economic, legal, cultural, environmental or technological factors that affect property values, rents or occupancies of real estate related to the Fund’s holdings. Shares of real estate related companies, which tend to be small- and mid-cap companies, may be more volatile and less liquid. |
| ∎ | | Sector focus risk. The Fund may from time to time invest a significant amount of its assets (i.e. over 25%) in one market sector or group of related industries. In this event, the Fund’s performance will depend to a greater extent |
| | | on the overall condition of the sector or group of industries and there is increased risk that the Fund will lose significant value if conditions adversely affect that sector or group of industries. |
| ∎ | | Small- and mid-capitalization companies risks. Small- and mid-capitalization companies tend to be more vulnerable to changing market conditions, may have little or no operating history or track record of success, and may have more limited product lines and markets, less experienced management and fewer financial resources than larger companies. These companies’ securities may be more volatile and less liquid than those of more established companies, and their returns may vary, sometimes significantly, from the overall securities market. |
| ∎ | | Unseasoned issuer risk. Investments in unseasoned companies or companies with special circumstances often involve much greater risks than are inherent in other types of investments and securities of such companies may be more likely to experience fluctuations in price. In addition, investments made in anticipation of future events may, if the events are delayed or never achieved, cause stock prices to fall. |
| ∎ | | Value investing style risk. A value investing style subjects the Fund to the risk that the valuations never improve or that the returns on value equity securities are less than returns on other styles of investing or the overall stock market. |
About indexes used in this report
| ∎ | | The S&P 500® Index is an unmanaged index considered representative of the US stock market. |
| ∎ | | The S&P 1500® Value Index combines the value stocks of the S&P 500, S&P MidCap 400 and the S&P SmallCap 600 indexes. |
| ∎ | | The Lipper Multi-Cap Value Funds Index is an unmanaged index considered representative of multi-cap value funds tracked by Lipper. |
| ∎ | | The S&P MidCap 400® Index is an unmanaged index considered representative of mid-sized US companies. |
| ∎ | | The S&P SmallCap 600® Index is a market-value weighted index considered representative of small-cap US stocks. |
| ∎ | | The Fund is not managed to track the performance of any particular index, including the index(es) described here, and consequently, the performance of the Fund may deviate significantly from the performance of the index(es). |
| ∎ | | A direct investment cannot be made in an index. Unless otherwise indicated, index results include reinvested dividends, and they do not reflect sales charges. Performance of the peer group, if applicable, reflects fund expenses; performance of a market index does not. |
Other information
| ∎ | | CPA® and Certified Public Accountant® are trademarks owned by the American Institute of Certified Public Accountants. |
| ∎ | | The returns shown in management’s discussion of Fund performance are based on net asset values (NAVs) calculated for shareholder transactions. Generally accepted accounting principles require adjustments to be made to the net assets of the Fund at period end for financial reporting purposes, and as such, the NAVs for shareholder transactions and the returns based on those NAVs may differ from the NAVs and returns reported in the Financial Highlights. |
| ∎ | | Industry classifications used in this report are generally according to the Global Industry Classification Standard, which was developed by and is the exclusive property and a service mark of MSCI Inc. and Standard & Poor’s. |
9 Invesco Value Opportunities Fund
Schedule of Investments(a)
April 30, 2017
| | | | | | | | |
| | | Shares | | | Value | |
Common Stocks–94.84% | |
| Advertising–1.58% | |
Omnicom Group Inc. | | | 153,955 | | | $ | 12,642,785 | |
|
| Agricultural & Farm Machinery–0.51% | |
AGCO Corp. | | | 63,304 | | | | 4,050,823 | |
|
| Asset Management & Custody Banks–5.42% | |
Affiliated Managers Group, Inc. | | | 211,400 | | | | 35,005,726 | |
SEI Investments Co. | | | 164,500 | | | | 8,341,795 | |
| | | | | | | | 43,347,521 | |
|
| Auto Parts & Equipment–3.54% | |
Dana Inc. | | | 1,455,100 | | | | 28,258,042 | |
|
| Construction & Engineering–4.25% | |
AECOM(b) | | | 993,790 | | | | 33,997,556 | |
|
| Consumer Finance–4.55% | |
SLM Corp.(b) | | | 732,200 | | | | 9,181,788 | |
Synchrony Financial | | | 976,900 | | | | 27,157,820 | |
| | | | | | | | 36,339,608 | |
|
| Diversified Banks–11.65% | |
Bank of America Corp. | | | 1,208,066 | | | | 28,196,260 | |
Citigroup Inc. | | | 464,521 | | | | 27,462,482 | |
JPMorgan Chase & Co. | | | 411,064 | | | | 35,762,568 | |
Wells Fargo & Co. | | | 31,625 | | | | 1,702,690 | |
| | | | | | | | 93,124,000 | |
|
| Electronic Components–2.60% | |
Belden Inc. | | | 298,392 | | | | 20,797,922 | |
|
| Electronic Equipment & Instruments–2.38% | |
FLIR Systems, Inc. | | | 516,900 | | | | 18,985,737 | |
|
| Electronic Manufacturing Services–0.64% | |
Flex Ltd.(b) | | | 331,380 | | | | 5,123,135 | |
|
| Health Care Distributors–5.53% | |
Cardinal Health, Inc. | | | 383,300 | | | | 27,823,747 | |
McKesson Corp. | | | 118,400 | | | | 16,373,536 | |
| | | | | | | | 44,197,283 | |
|
| Health Care Facilities–2.43% | |
Acadia Healthcare Co., Inc.(b) | | | 114,800 | | | | 5,002,984 | |
Brookdale Senior Living Inc.(b) | | | 1,110,467 | | | | 14,424,966 | |
| | | | | | | | 19,427,950 | |
|
| Health Care Supplies–2.63% | |
Alere, Inc.(b) | | | 428,100 | | | | 21,049,677 | |
|
| Homebuilding–1.41% | |
CalAtlantic Group, Inc. | | | 119,900 | | | | 4,342,778 | |
D.R. Horton, Inc. | | | 211,100 | | | | 6,943,079 | |
| | | | | | | | 11,285,857 | |
| | | | | | | | |
| | | Shares | | | Value | |
| Hotels, Resorts & Cruise Lines–4.76% | |
Carnival Corp. | | | 239,400 | | | $ | 14,787,738 | |
Norwegian Cruise Line Holdings Ltd.(b) | | | 430,600 | | | | 23,222,258 | |
| | | | | | | | 38,009,996 | |
|
| Human Resource & Employment Services–1.86% | |
ManpowerGroup Inc. | | | 147,100 | | | | 14,854,158 | |
|
| Industrial Machinery–2.09% | |
ITT Inc. | | | 396,900 | | | | 16,721,397 | |
|
| Investment Banking & Brokerage–7.20% | |
E*TRADE Financial Corp.(b) | | | 373,500 | | | | 12,904,425 | |
LPL Financial Holdings, Inc. | | | 554,266 | | | | 23,301,343 | |
TD Ameritrade Holding Corp. | | | 557,600 | | | | 21,339,352 | |
| | | | | | | | 57,545,120 | |
|
| Life & Health Insurance–3.73% | |
Aflac, Inc. | | | 102,700 | | | | 7,690,176 | |
MetLife, Inc. | | | 426,800 | | | | 22,112,508 | |
| | | | | | | | 29,802,684 | |
|
| Managed Health Care–3.84% | |
Anthem, Inc. | | | 121,100 | | | | 21,542,479 | |
Cigna Corp. | | | 58,400 | | | | 9,132,008 | |
| | | | | | | | 30,674,487 | |
|
| Oil & Gas Equipment & Services–2.07% | |
Weatherford International PLC(b) | | | 2,870,073 | | | | 16,560,321 | |
|
| Oil & Gas Exploration & Production–1.35% | |
Apache Corp. | | | 221,900 | | | | 10,793,216 | |
|
| Pharmaceuticals–1.26% | |
Novartis AG (Switzerland) | | | 131,100 | | | | 10,085,629 | |
|
| Property & Casualty Insurance–4.21% | |
AmTrust Financial Services, Inc. | | | 2,094,045 | | | | 33,609,422 | |
|
| Real Estate Services–2.81% | |
Realogy Holdings Corp. | | | 734,050 | | | | 22,425,227 | |
|
| Regional Banks–1.66% | |
SVB Financial Group(b) | | | 75,300 | | | | 13,248,282 | |
|
| Semiconductors–0.96% | |
ON Semiconductor Corp.(b) | | | 543,400 | | | | 7,705,412 | |
|
| Steel–2.32% | |
Allegheny Technologies, Inc. | | | 1,009,300 | | | | 18,520,655 | |
|
| Systems Software–2.74% | |
Oracle Corp. | | | 487,900 | | | | 21,935,984 | |
See accompanying Notes to Financial Statements which are an integral part of the financial statements.
10 Invesco Value Opportunities Fund
| | | | | | | | |
| | | Shares | | | Value | |
| Thrifts & Mortgage Finance–2.86% | |
MGIC Investment Corp.(b) | | | 1,004,516 | | | $ | 10,587,599 | |
Radian Group Inc. | | | 728,549 | | | | 12,297,907 | |
| | | | | | | | 22,885,506 | |
Total Common Stocks
(Cost $713,086,378) | | | | | | | 758,005,392 | |
|
Money Market Funds–4.73% | |
Government & Agency Portfolio–Institutional Class, 0.67%(c) | | | 22,679,992 | | | | 22,679,992 | |
Treasury Portfolio–Institutional Class, 0.63%(c) | | | 15,119,994 | | | | 15,119,994 | |
Total Money Market Funds
(Cost $37,799,986) | | | | | | | 37,799,986 | |
TOTAL INVESTMENTS–99.57%
(Cost $750,886,364) | | | | | | | 795,805,378 | |
OTHER ASSETS LESS LIABILITIES–0.43% | | | | | | | 3,421,598 | |
NET ASSETS–100.00% | | | $ | 799,226,976 | |
Notes to Schedule of Investments:
| (a) | Industry and/or sector classifications used in this report are generally according to the Global Industry Classification Standard, which was developed by and is the exclusive property and a service mark of MSCI Inc. and Standard & Poor’s. |
| (b) | Non-income producing security. |
| (c) | The money market fund and the Fund are affiliated by having the same investment adviser. The rate shown is the 7-day SEC standardized yield as of April 30, 2017. |
See accompanying Notes to Financial Statements which are an integral part of the financial statements.
11 Invesco Value Opportunities Fund
Statement of Assets and Liabilities
April 30, 2017
| | | | |
Assets: | |
Investments, at value (Cost $713,086,378) | | $ | 758,005,392 | |
Investments in affiliated money market funds, at value and cost | | | 37,799,986 | |
Total investments, at value (Cost $750,886,364) | | | 795,805,378 | |
Foreign currencies, at value (Cost $786) | | | 820 | |
Receivable for: | | | | |
Investments sold | | | 3,833,119 | |
Fund shares sold | | | 821,882 | |
Dividends | | | 810,039 | |
Investment for trustee deferred compensation and retirement plans | | | 492,184 | |
Other assets | | | 67,694 | |
Total assets | | | 801,831,116 | |
|
Liabilities: | |
Payable for: | | | | |
Fund shares reacquired | | | 1,190,680 | |
Accrued fees to affiliates | | | 573,763 | |
Accrued trustees’ and officers’ fees and benefits | | | 3,747 | |
Accrued other operating expenses | | | 281,433 | |
Trustee deferred compensation and retirement plans | | | 554,517 | |
Total liabilities | | | 2,604,140 | |
Net assets applicable to shares outstanding | | $ | 799,226,976 | |
|
Net assets consist of: | |
Shares of beneficial interest | | $ | 720,453,402 | |
Undistributed net investment income (loss) | | | (540,337 | ) |
Undistributed net realized gain | | | 34,410,769 | |
Net unrealized appreciation | | | 44,903,142 | |
| | | $ | 799,226,976 | |
| | | | |
Net Assets: | |
Class A | | $ | 645,215,870 | |
Class B | | $ | 8,714,896 | |
Class C | | $ | 82,590,368 | |
Class R | | $ | 14,135,247 | |
Class Y | | $ | 46,105,066 | |
Class R5 | | $ | 2,455,522 | |
Class R6 | | $ | 10,007 | |
|
Shares outstanding, no par value,
with an unlimited number of shares authorized: | |
Class A | | | 47,784,955 | |
Class B | | | 656,635 | |
Class C | | | 6,371,898 | |
Class R | | | 1,052,320 | |
Class Y | | | 3,424,883 | |
Class R5 | | | 181,854 | |
Class R6 | | | 741 | |
Class A: | | | | |
Net asset value per share | | $ | 13.50 | |
Maximum offering price per share | | | | |
(Net asset value of $13.50 ¸ 94.50%) | | $ | 14.29 | |
Class B: | | | | |
Net asset value and offering price per share | | $ | 13.27 | |
Class C: | | | | |
Net asset value and offering price per share | | $ | 12.96 | |
Class R: | | | | |
Net asset value and offering price per share | | $ | 13.43 | |
Class Y: | | | | |
Net asset value and offering price per share | | $ | 13.46 | |
Class R5: | | | | |
Net asset value and offering price per share | | $ | 13.50 | |
Class R6: | | | | |
Net asset value and offering price per share | | $ | 13.50 | |
See accompanying Notes to Financial Statements which are an integral part of the financial statements.
12 Invesco Value Opportunities Fund
Statement of Operations
For the year ended April 30, 2017
| | | | |
Investment income: | |
Dividends (net of foreign withholding taxes of $53,599) | | $ | 9,931,766 | |
Dividends from affiliated money market funds | | | 126,958 | |
Other income | | | 41,146 | |
Total investment income | | | 10,099,870 | |
| |
Expenses: | | | | |
Advisory fees | | | 5,101,048 | |
Administrative services fees | | | 200,582 | |
Distribution fees: | | | | |
Class A | | | 1,555,624 | |
Class B | | | 34,363 | |
Class C | | | 761,032 | |
Class R | | | 76,816 | |
Transfer agent Fees — A, B, C and Y | | | 1,955,044 | |
Transfer agent fees — R5 | | | 2,340 | |
Trustees’ and officers’ fees and benefits | | | 38,045 | |
Registration and filing fees | | | 92,227 | |
Reports to shareholders | | | 302,313 | |
Professional services fees | | | 54,270 | |
Other | | | 29,750 | |
Total expenses | | | 10,203,454 | |
Less: Fees waived and expense offset arrangement(s) | | | (60,277 | ) |
Net expenses | | | 10,143,177 | |
Net investment income (loss) | | | (43,307 | ) |
| |
Realized and unrealized gain from: | | | | |
Net realized gain (loss) from: | | | | |
Investment securities | | | 50,204,128 | |
Foreign currencies | | | (319 | ) |
| | | | 50,203,809 | |
Change in net unrealized appreciation (depreciation) of: | | | | |
Investment securities | | | 72,903,350 | |
Foreign currencies | | | (9,269 | ) |
| | | | 72,894,081 | |
Net realized and unrealized gain | | | 123,097,890 | |
Net increase in net assets resulting from operations | | $ | 123,054,583 | |
See accompanying Notes to Financial Statements which are an integral part of the financial statements.
13 Invesco Value Opportunities Fund
Statement of Changes in Net Assets
For the years ended April 30, 2017 and 2016
| | | | | | | | |
| | | 2017 | | | 2016 | |
Operations: | | | | | |
Net investment income (loss) | | $ | (43,307 | ) | | $ | 857,483 | |
Net realized gain | | | 50,203,809 | | | | 63,907,754 | |
Change in net unrealized appreciation (depreciation) | | | 72,894,081 | | | | (130,123,587 | ) |
Net increase (decrease) in net assets resulting from operations | | | 123,054,583 | | | | (65,358,350 | ) |
| | |
Distributions to shareholders from net investment income: | | | | | | | | |
Class A | | | (1,008,434 | ) | | | (6,374,595 | ) |
Class B | | | (22,002 | ) | | | (214,433 | ) |
Class C | | | — | | | | (604,296 | ) |
Class R | | | — | | | | (149,900 | ) |
Class Y | | | (117,556 | ) | | | (221,282 | ) |
Class R5 | | | (12,536 | ) | | | (28,190 | ) |
Total distributions from net investment income | | | (1,160,528 | ) | | | (7,592,696 | ) |
| | |
Distributions to shareholders from net realized gains: | | | | | | | | |
Class A | | | (7,048,742 | ) | | | (81,588,078 | ) |
Class B | | | (153,801 | ) | | | (2,744,475 | ) |
Class C | | | (903,774 | ) | | | (10,999,237 | ) |
Class R | | | (166,277 | ) | | | (2,137,815 | ) |
Class Y | | | (307,783 | ) | | | (2,566,931 | ) |
Class R5 | | | (23,505 | ) | | | (309,704 | ) |
Total distributions from net realized gains | | | (8,603,882 | ) | | | (100,346,240 | ) |
| | |
Share transactions–net: | | | | | | | | |
Class A | | | (70,491,157 | ) | | | 8,474,743 | |
Class B | | | (10,485,562 | ) | | | (6,773,271 | ) |
Class C | | | (8,054,076 | ) | | | (1,170,332 | ) |
Class R | | | (4,363,006 | ) | | | (806,697 | ) |
Class Y | | | 21,357,646 | | | | 2,873,928 | |
Class R5 | | | (690,040 | ) | | | 418,686 | |
Class R6 | | | 10,000 | | | | — | |
Net increase (decrease) in net assets resulting from share transactions | | | (72,716,195 | ) | | | 3,017,057 | |
Net increase (decrease) in net assets | | | 40,573,978 | | | | (170,280,229 | ) |
| | |
Net assets: | | | | | | | | |
Beginning of year | | | 758,652,998 | | | | 928,933,227 | |
End of year (includes undistributed net investment income (loss) of $(540,337) and $546,017, respectively) | | $ | 799,226,976 | | | $ | 758,652,998 | |
Notes to Financial Statements
April 30, 2017
NOTE 1—Significant Accounting Policies
Invesco Value Opportunities Fund (the “Fund”) is a series portfolio of AIM Sector Funds (Invesco Sector Funds) (the “Trust”). The Trust is a Delaware statutory trust registered under the Investment Company Act of 1940, as amended (the “1940 Act”), as an open-end series management investment company consisting of ten separate portfolios, each authorized to issue an unlimited number of shares of beneficial interest. The assets, liabilities and operations of each portfolio are accounted for separately. Information presented in these financial statements pertains only to the Fund. Matters affecting each portfolio or class will be voted on exclusively by the shareholders of such portfolio or class.
The Fund’s investment objective is total return through growth of capital and current income.
The Fund currently consists of seven different classes of shares: Class A, Class B, Class C, Class R, Class Y, Class R5 and Class R6. On April 4, 2017, the Fund began offering Class R6 shares. Class Y shares are available only to certain investors. Class A shares are sold with a front-end sales charge unless certain waiver criteria are met and under certain circumstances load waived shares may be subject to contingent deferred sales charges (“CDSC”). Class C shares are sold with a CDSC. Class R, Class Y, Class R5 and Class R6 shares are sold at net asset value. Effective
14 Invesco Value Opportunities Fund
November 30, 2010, new or additional investments in Class B shares are no longer permitted. Existing shareholders of Class B shares may continue to reinvest dividends and capital gains distributions in Class B shares until they convert to Class A shares. Also, shareholders in Class B shares will be able to exchange those shares for Class B shares of other Invesco Funds offering such shares until they convert to Class A shares. Generally, Class B shares will automatically convert to Class A shares on or about the month-end, which is at least eight years after the date of purchase. Redemption of Class B shares prior to the conversion date will be subject to a CDSC.
The Fund is an investment company and accordingly follows the investment company accounting and reporting guidance in accordance with Financial Accounting Standards Board Accounting Standards Codification Topic 946, Financial Services — Investment Companies.
The following is a summary of the significant accounting policies followed by the Fund in the preparation of its financial statements.
| A. | Security Valuations — Securities, including restricted securities, are valued according to the following policy. |
A security listed or traded on an exchange (except convertible securities) is valued at its last sales price or official closing price as of the close of the customary trading session on the exchange where the security is principally traded, or lacking any sales or official closing price on a particular day, the security may be valued at the closing bid price on that day. Securities traded in the over-the-counter market are valued based on prices furnished by independent pricing services or market makers. When such securities are valued by an independent pricing service they may be considered fair valued. Futures contracts are valued at the final settlement price set by an exchange on which they are principally traded. Listed options are valued at the mean between the last bid and asked prices from the exchange on which they are principally traded. Options not listed on an exchange are valued by an independent source at the mean between the last bid and asked prices. For purposes of determining net asset value (“NAV”) per share, futures and option contracts generally are valued 15 minutes after the close of the customary trading session of the New York Stock Exchange (“NYSE”).
Investments in open-end and closed-end registered investment companies that do not trade on an exchange are valued at the end-of-day net asset value per share. Investments in open-end and closed-end registered investment companies that trade on an exchange are valued at the last sales price or official closing price as of the close of the customary trading session on the exchange where the security is principally traded.
Debt obligations (including convertible securities) and unlisted equities are fair valued using an evaluated quote provided by an independent pricing service. Evaluated quotes provided by the pricing service may be determined without exclusive reliance on quoted prices, and may reflect appropriate factors such as institution-size trading in similar groups of securities, developments related to specific securities, dividend rate (for unlisted equities), yield (for debt obligations), quality, type of issue, coupon rate (for debt obligations), maturity (for debt obligations), individual trading characteristics and other market data. Debt obligations are subject to interest rate and credit risks. In addition, all debt obligations involve some risk of default with respect to interest and/or principal payments.
Foreign securities’ (including foreign exchange contracts) prices are converted into U.S. dollar amounts using the applicable exchange rates as of the close of the NYSE. If market quotations are available and reliable for foreign exchange-traded equity securities, the securities will be valued at the market quotations. Because trading hours for certain foreign securities end before the close of the NYSE, closing market quotations may become unreliable. If between the time trading ends on a particular security and the close of the customary trading session on the NYSE, events occur that the Adviser determines are significant and make the closing price unreliable, the Fund may fair value the security. If the event is likely to have affected the closing price of the security, the security will be valued at fair value in good faith using procedures approved by the Board of Trustees. Adjustments to closing prices to reflect fair value may also be based on a screening process of an independent pricing service to indicate the degree of certainty, based on historical data, that the closing price in the principal market where a foreign security trades is not the current value as of the close of the NYSE. Foreign securities’ prices meeting the approved degree of certainty that the price is not reflective of current value will be priced at the indication of fair value from the independent pricing service. Multiple factors may be considered by the independent pricing service in determining adjustments to reflect fair value and may include information relating to sector indices, American Depositary Receipts and domestic and foreign index futures. Foreign securities may have additional risks including exchange rate changes, potential for sharply devalued currencies and high inflation, political and economic upheaval, the relative lack of issuer information, relatively low market liquidity and the potential lack of strict financial and accounting controls and standards.
Securities for which market prices are not provided by any of the above methods may be valued based upon quotes furnished by independent sources. The last bid price may be used to value equity securities. The mean between the last bid and asked prices is used to value debt obligations, including corporate loans.
Securities for which market quotations are not readily available or became unreliable are valued at fair value as determined in good faith by or under the supervision of the Trust’s officers following procedures approved by the Board of Trustees. Issuer specific events, market trends, bid/asked quotes of brokers and information providers and other market data may be reviewed in the course of making a good faith determination of a security’s fair value.
The Fund may invest in securities that are subject to interest rate risk, meaning the risk that the prices will generally fall as interest rates rise and, conversely, the prices will generally rise as interest rates fall. Specific securities differ in their sensitivity to changes in interest rates depending on their individual characteristics. Changes in interest rates may result in increased market volatility, which may affect the value and/or liquidity of certain Fund investments.
Valuations change in response to many factors including the historical and prospective earnings of the issuer, the value of the issuer’s assets, general economic conditions, interest rates, investor perceptions and market liquidity. Because of the inherent uncertainties of valuation, the values reflected in the financial statements may materially differ from the value received upon actual sale of those investments.
| B. | Securities Transactions and Investment Income — Securities transactions are accounted for on a trade date basis. Realized gains or losses on sales are computed on the basis of specific identification of the securities sold. Interest income (net of withholding tax, if any) is recorded on the accrual basis from settlement date. Dividend income (net of withholding tax, if any) is recorded on the ex-dividend date. |
The Fund may periodically participate in litigation related to Fund investments. As such, the Fund may receive proceeds from litigation settlements. Any proceeds received are included in the Statement of Operations as realized gain (loss) for investments no longer held and as unrealized gain (loss) for investments still held.
Brokerage commissions and mark ups are considered transaction costs and are recorded as an increase to the cost basis of securities purchased and/or a reduction of proceeds on a sale of securities. Such transaction costs are included in the determination of net realized and unrealized gain (loss) from investment securities reported in the Statement of Operations and the Statement of Changes in Net Assets and the net
15 Invesco Value Opportunities Fund
realized and unrealized gains (losses) on securities per share in the Financial Highlights. Transaction costs are included in the calculation of the Fund’s net asset value and, accordingly, they reduce the Fund’s total returns. These transaction costs are not considered operating expenses and are not reflected in net investment income reported in the Statement of Operations and the Statement of Changes in Net Assets, or the net investment income per share and the ratios of expenses and net investment income reported in the Financial Highlights, nor are they limited by any expense limitation arrangements between the Fund and the investment adviser.
The Fund allocates income and realized and unrealized capital gains and losses to a class based on the relative net assets of each class.
| C. | Country Determination — For the purposes of making investment selection decisions and presentation in the Schedule of Investments, the investment adviser may determine the country in which an issuer is located and/or credit risk exposure based on various factors. These factors include the laws of the country under which the issuer is organized, where the issuer maintains a principal office, the country in which the issuer derives 50% or more of its total revenues and the country that has the primary market for the issuer’s securities, as well as other criteria. Among the other criteria that may be evaluated for making this determination are the country in which the issuer maintains 50% or more of its assets, the type of security, financial guarantees and enhancements, the nature of the collateral and the sponsor organization. Country of issuer and/or credit risk exposure has been determined to be the United States of America, unless otherwise noted. |
| D. | Distributions — Distributions from net investment income and net realized capital gain, if any, are generally declared and paid annually and recorded on the ex-dividend date. The Fund may elect to treat a portion of the proceeds from redemptions as distributions for federal income tax purposes. |
| E. | Federal Income Taxes — The Fund intends to comply with the requirements of Subchapter M of the Internal Revenue Code of 1986, as amended (the “Internal Revenue Code”), necessary to qualify as a regulated investment company and to distribute substantially all of the Fund’s taxable earnings to shareholders. As such, the Fund will not be subject to federal income taxes on otherwise taxable income (including net realized capital gain) that is distributed to shareholders. Therefore, no provision for federal income taxes is recorded in the financial statements. |
The Fund recognizes the tax benefits of uncertain tax positions only when the position is more likely than not to be sustained. Management has analyzed the Fund’s uncertain tax positions and concluded that no liability for unrecognized tax benefits should be recorded related to uncertain tax positions. Management is not aware of any tax positions for which it is reasonably possible that the total amounts of unrecognized tax benefits will change materially in the next 12 months.
The Fund files tax returns in the U.S. Federal jurisdiction and certain other jurisdictions. Generally, the Fund is subject to examinations by such taxing authorities for up to three years after the filing of the return for the tax period.
| F. | Expenses — Fees provided for under the Rule 12b-1 plan of a particular class of the Fund are charged to the operations of such class. Transfer agency fees and expenses and other shareholder recordkeeping fees and expenses attributable to Class R5 and Class R6 are allocated to each share class based on relative net assets. Sub-accounting fees attributable to Class R5 are charged to the operations of the class. Transfer agency fees and expenses and other shareholder recordkeeping fees and expenses relating to all other classes are allocated among those classes based on relative net assets. All other expenses are allocated among the classes based on relative net assets. |
| G. | Accounting Estimates — The preparation of financial statements in conformity with accounting principles generally accepted in the United States of America (“GAAP”) requires management to make estimates and assumptions that affect the reported amounts of assets and liabilities at the date of the financial statements and the reported amounts of revenues and expenses during the reporting period including estimates and assumptions related to taxation. Actual results could differ from those estimates by a significant amount. In addition, the Fund monitors for material events or transactions that may occur or become known after the period-end date and before the date the financial statements are released to print. |
| H. | Indemnifications — Under the Trust’s organizational documents, each Trustee, officer, employee or other agent of the Trust is indemnified against certain liabilities that may arise out of the performance of their duties to the Fund. Additionally, in the normal course of business, the Fund enters into contracts, including the Fund’s servicing agreements, that contain a variety of indemnification clauses. The Fund’s maximum exposure under these arrangements is unknown as this would involve future claims that may be made against the Fund that have not yet occurred. The risk of material loss as a result of such indemnification claims is considered remote. |
| I. | Foreign Currency Translations — Foreign currency is valued at the close of the NYSE based on quotations posted by banks and major currency dealers. Portfolio securities and other assets and liabilities denominated in foreign currencies are translated into U.S. dollar amounts at date of valuation. Purchases and sales of portfolio securities (net of foreign taxes withheld on disposition) and income items denominated in foreign currencies are translated into U.S. dollar amounts on the respective dates of such transactions. The Fund does not separately account for the portion of the results of operations resulting from changes in foreign exchange rates on investments and the fluctuations arising from changes in market prices of securities held. The combined results of changes in foreign exchange rates and the fluctuation of market prices on investments (net of estimated foreign tax withholding) are included with the net realized and unrealized gain or loss from investments in the Statement of Operations. Reported net realized foreign currency gains or losses arise from (1) sales of foreign currencies, (2) currency gains or losses realized between the trade and settlement dates on securities transactions, and (3) the difference between the amounts of dividends, interest, and foreign withholding taxes recorded on the Fund’s books and the U.S. dollar equivalent of the amounts actually received or paid. Net unrealized foreign currency gains and losses arise from changes in the fair values of assets and liabilities, other than investments in securities at fiscal period end, resulting from changes in exchange rates. |
The Fund may invest in foreign securities, which may be subject to foreign taxes on income, gains on investments or currency repatriation, a portion of which may be recoverable. Foreign taxes, if any, are recorded based on the tax regulations and rates that exist in the foreign markets in which the Fund invests and are shown in the Statement of Operations.
| J. | Forward Foreign Currency Contracts — The Fund may engage in foreign currency transactions either on a spot (i.e. for prompt delivery and settlement) basis, or through forward foreign currency contracts, to manage or minimize currency or exchange rate risk. |
The Fund may also enter into forward foreign currency contracts for the purchase or sale of a security denominated in a foreign currency in order to “lock in” the U.S. dollar price of that security, or the Fund may also enter into forward foreign currency contracts that do not provide for physical settlement of the two currencies, but instead are settled by a single cash payment calculated as the difference between the agreed upon exchange rate and the spot rate at settlement based upon an agreed upon notional amount (non-deliverable forwards). The Fund will set aside liquid assets in an amount equal to the daily mark-to-market obligation for forward foreign currency contracts.
16 Invesco Value Opportunities Fund
A forward foreign currency contract is an obligation between two parties (“Counterparties”) to purchase or sell a specific currency for an agreed-upon price at a future date. The use of forward foreign currency contracts does not eliminate fluctuations in the price of the underlying securities the Fund owns or intends to acquire but establishes a rate of exchange in advance. Fluctuations in the value of these contracts are measured by the difference in the contract date and reporting date exchange rates and are recorded as unrealized appreciation (depreciation) until the contracts are closed. When the contracts are closed, realized gains (losses) are recorded. Realized and unrealized gains (losses) on the contracts are included in the Statement of Operations. The primary risks associated with forward foreign currency contracts include failure of the Counterparty to meet the terms of the contract and the value of the foreign currency changing unfavorably. These risks may be in excess of the amounts reflected in the Statement of Assets and Liabilities.
NOTE 2—Advisory Fees and Other Fees Paid to Affiliates
The Trust has entered into a master investment advisory agreement with Invesco Advisers, Inc. (the “Adviser” or “Invesco”). Under the terms of the investment advisory agreement, the Fund pays an advisory fee to the Adviser based on the annual rate of the Fund’s average daily net assets as follows:
| | | | | | | | |
| Average Daily Net Assets | | Rate | |
First $250 million | | | 0 | .695% | | | | |
Next $250 million | | | 0 | .67% | | | | |
Next $500 million | | | 0 | .645% | | | | |
Next $1.5 billion | | | 0 | .62% | | | | |
Next $2.5 billion | | | 0 | .595% | | | | |
Next $2.5 billion | | | 0 | .57% | | | | |
Next $2.5 billion | | | 0 | .545% | | | | |
Over $10 billion | | | 0 | .52% | | | | |
For the year ended April 30, 2017, the effective advisory fees incurred by the Fund was 0.67%.
Under the terms of a master sub-advisory agreement between the Adviser and each of Invesco Asset Management Deutschland GmbH, Invesco Asset Management Limited, Invesco Asset Management (Japan) Limited, Invesco Hong Kong Limited, Invesco Senior Secured Management, Inc. and Invesco Canada Ltd. (collectively, the “Affiliated Sub-Advisers”) the Adviser, not the Fund, will pay 40% of the fees paid to the Adviser to any such Affiliated Sub-Adviser(s) that provide(s) discretionary investment management services to the Fund based on the percentage of assets allocated to such Affiliated Sub-Adviser(s).
The Adviser has contractually agreed, through at least June 30, 2018, to waive advisory fees and/or reimburse expenses of all shares to the extent necessary to limit total annual fund operating expenses after fee waiver and/or expense reimbursement (excluding certain items discussed above) of Class A, Class B, Class C, Class R, Class Y, Class R5 and Class R6 shares to 2.00%, 2.75%, 2.75%, 2.25%, 1.75%, 1.75% and 1.75%, respectively, of average daily net assets (the “expense limits”). In determining the Adviser’s obligation to waive advisory fees and/or reimburse expenses, the following expenses are not taken into account, and could cause the total annual fund operating expenses after fee waiver and/or expense reimbursement to exceed the numbers reflected above: (1) interest; (2) taxes; (3) dividend expense on short sales; (4) extraordinary or non-routine items, including litigation expenses; and (5) expenses that the Fund has incurred but did not actually pay because of an expense offset arrangement. Unless Invesco continues the fee waiver agreement, it will terminate on June 30, 2018. During its term, the fee waiver agreement cannot be terminated or amended to increase the expense limits without approval of the Board of Trustees. The Adviser did not waive fees and/or reimburse expenses during the period under these expense limits.
Further, the Adviser has contractually agreed, through at least June 30, 2019, to waive the advisory fee payable by the Fund in an amount equal to 100% of the net advisory fees the Adviser receives from the affiliated money market funds on investments by the Fund of uninvested cash (excluding investments of cash collateral from securities lending) in such affiliated money market funds.
For the year ended April 30, 2017, the Adviser waived advisory fees of $39,972.
The Trust has entered into a master administrative services agreement with Invesco pursuant to which the Fund has agreed to pay Invesco for certain administrative costs incurred in providing accounting services to the Fund. For the year ended April 30, 2017, expenses incurred under the agreement are shown in the Statement of Operations as Administrative services fees.
The Trust has entered into a transfer agency and service agreement with Invesco Investment Services, Inc. (“IIS”) pursuant to which the Fund has agreed to pay IIS a fee for providing transfer agency and shareholder services to the Fund and reimburse IIS for certain expenses incurred by IIS in the course of providing such services. IIS may make payments to intermediaries that provide omnibus account services, sub-accounting services and/or networking services. All fees payable by IIS to intermediaries that provide omnibus account services or sub-accounting are charged back to the Fund, subject to certain limitations approved by the Trust’s Board of Trustees. For the year ended April 30, 2017, expenses incurred under the agreement are shown in the Statement of Operations as Transfer agent fees.
Shares of the Fund are distributed by Invesco Distributors, Inc. (“IDI”). The Fund has adopted a distribution plan pursuant to Rule 12b-1 under the 1940 Act, and a service plan (collectively, the “Plans”) for Class A, Class B, Class C and Class R shares to compensate IDI for the sale, distribution, shareholder servicing and maintenance of shareholder accounts for these shares. Under the Plans, the Fund will incur annual fees of up to 0.25% of Class A average daily net assets, up to 1.00% each of Class B and Class C average daily net assets and up to 0.50% of Class R average daily net assets.
With respect to Class B and Class C shares, the Fund is authorized to reimburse in future years any distribution related expenses that exceed the maximum annual reimbursement rate for such class, so long as such reimbursement does not cause the Fund to exceed the Class B and Class C maximum annual reimbursement rate, respectively. With respect to Class A shares, distribution related expenses that exceed the maximum annual reimbursement rate for such class are not carried forward to future years and the Fund will not reimburse IDI for any such expenses.
For the year ended April 30, 2017, expenses incurred under these agreements are shown in the Statement of Operations as Distribution fees.
17 Invesco Value Opportunities Fund
Front-end sales commissions and CDSC (collectively, the “sales charges”) are not recorded as expenses of the Fund. Front-end sales commissions are deducted from proceeds from the sales of Fund shares prior to investment in Class A shares of the Fund. CDSC are deducted from redemption proceeds prior to remittance to the shareholder. During the year ended April 30, 2017, IDI advised the Fund that IDI retained $73,852 in front-end sales commissions from the sale of Class A shares and $3,096, $854 and $578 from Class A, Class B and Class C shares, respectively, for CDSC imposed on redemptions by shareholders.
For the year ended April 30, 2017, the Fund incurred $20,101 in brokerage commissions with Invesco Capital Markets, Inc., an affiliate of the Adviser and IDI, for portfolio transactions executed on behalf of the Fund.
Certain officers and trustees of the Trust are officers and directors of the Adviser, IIS and/or IDI.
NOTE 3—Additional Valuation Information
GAAP defines fair value as the price that would be received to sell an asset or paid to transfer a liability in an orderly transaction between market participants at the measurement date, under current market conditions. GAAP establishes a hierarchy that prioritizes the inputs to valuation methods, giving the highest priority to readily available unadjusted quoted prices in an active market for identical assets (Level 1) and the lowest priority to significant unobservable inputs (Level 3), generally when market prices are not readily available or are unreliable. Based on the valuation inputs, the securities or other investments are tiered into one of three levels. Changes in valuation methods may result in transfers in or out of an investment’s assigned level:
| | Level 1 — | Prices are determined using quoted prices in an active market for identical assets. |
| | Level 2 — | Prices are determined using other significant observable inputs. Observable inputs are inputs that other market participants may use in pricing a security. These may include quoted prices for similar securities, interest rates, prepayment speeds, credit risk, yield curves, loss severities, default rates, discount rates, volatilities and others. |
| | Level 3 — | Prices are determined using significant unobservable inputs. In situations where quoted prices or observable inputs are unavailable (for example, when there is little or no market activity for an investment at the end of the period), unobservable inputs may be used. Unobservable inputs reflect the Fund’s own assumptions about the factors market participants would use in determining fair value of the securities or instruments and would be based on the best available information. |
As of April 30, 2017, all of the securities in this Fund were valued based on Level 1 inputs (see the Schedule of Investments for security categories). The level assigned to the securities valuations may not be an indication of the risk or liquidity associated with investing in those securities. Because of the inherent uncertainties of valuation, the values reflected in the financial statements may materially differ from the value received upon actual sale of those investments.
NOTE 4—Expense Offset Arrangement(s)
The expense offset arrangement is comprised of transfer agency credits which result from balances in demand deposit accounts used by the transfer agent for clearing shareholder transactions. For the year ended April 30, 2017, the Fund received credits from this arrangement, which resulted in the reduction of the Fund’s total expenses of $20,305.
NOTE 5—Trustees’ and Officers’ Fees and Benefits
Trustees’ and Officers’ Fees and Benefits include amounts accrued by the Fund to pay remuneration to certain Trustees and Officers of the Fund. Trustees have the option to defer compensation payable by the Fund, and Trustees’ and Officers’ Fees and Benefits also include amounts accrued by the Fund to fund such deferred compensation amounts. Those Trustees who defer compensation have the option to select various Invesco Funds in which their deferral accounts shall be deemed to be invested. Finally, certain current Trustees were eligible to participate in a retirement plan that provided for benefits to be paid upon retirement to Trustees over a period of time based on the number of years of service. The Fund may have certain former Trustees who also participate in a retirement plan and receive benefits under such plan. Trustees’ and Officers’ Fees and Benefits include amounts accrued by the Fund to fund such retirement benefits. Obligations under the deferred compensation and retirement plans represent unsecured claims against the general assets of the Fund.
NOTE 6—Cash Balances
The Fund is permitted to temporarily carry a negative or overdrawn balance in its account with State Street Bank and Trust Company, the custodian bank. Such balances, if any at period-end, are shown in the Statement of Assets and Liabilities under the payable caption Amount due custodian. To compensate the custodian bank for such overdrafts, the overdrawn Fund may either (1) leave funds as a compensating balance in the account so the custodian bank can be compensated by earning the additional interest; or (2) compensate by paying the custodian bank at a rate agreed upon by the custodian bank and Invesco, not to exceed the contractually agreed upon rate.
18 Invesco Value Opportunities Fund
NOTE 7—Distributions to Shareholders and Tax Components of Net Assets
Tax Character of Distributions to Shareholders Paid During the Fiscal Years Ended April 30, 2017 and 2016:
| | | | | | | | |
| | | 2017 | | | 2016 | |
Ordinary income | | $ | 1,099,629 | | | $ | 12,428,409 | |
Long-term capital gain | | | 8,664,781 | | | | 95,510,527 | |
Total distributions | | $ | 9,764,410 | | | $ | 107,938,936 | |
Tax Components of Net Assets at Period-End:
| | | | |
| | | 2017 | |
Undistributed ordinary income | | $ | 11,917,464 | |
Undistributed long-term gain | | | 28,683,491 | |
Net unrealized appreciation — investments | | | 38,728,828 | |
Net unrealized appreciation (depreciation) — other investments | | | (15,872 | ) |
Temporary book/tax differences | | | (540,337 | ) |
Shares of beneficial interest | | | 720,453,402 | |
Total net assets | | $ | 799,226,976 | |
The difference between book-basis and tax-basis unrealized appreciation (depreciation) is due to differences in the timing of recognition of gains and losses on investments for tax and book purposes. The Fund’s net unrealized appreciation difference is attributable primarily to wash sales.
The temporary book/tax differences are a result of timing differences between book and tax recognition of income and/or expenses. The Fund’s temporary book/tax differences are the result of the trustee deferral of compensation and retirement plan benefits.
Capital loss carryforward is calculated and reported as of a specific date. Results of transactions and other activity after that date may affect the amount of capital loss carryforward actually available for the Fund to utilize. Capital losses generated in years beginning after December 22, 2010 can be carried forward for an unlimited period, whereas previous losses expire in eight tax years. Capital losses with an expiration period may not be used to offset capital gains until all net capital losses without an expiration date have been utilized. Capital loss carryforwards with no expiration date will retain their character as either short-term or long-term capital losses instead of as short-term capital losses as under prior law. The ability to utilize capital loss carryforwards in the future may be limited under the Internal Revenue Code and related regulations based on the results of future transactions.
The Fund does not have a capital loss carryforward as of April 30, 2017.
NOTE 8—Investment Securities
The aggregate amount of investment securities (other than short-term securities, U.S. Treasury obligations and money market funds, if any) purchased and sold by the Fund during the year ended April 30, 2017 was $243,509,995 and $340,774,870, respectively. Cost of investments on a tax basis includes the adjustments for financial reporting purposes as of the most recently completed federal income tax reporting period-end.
| | | | |
| Unrealized Appreciation (Depreciation) of Investment Securities on a Tax Basis | |
Aggregate unrealized appreciation of investment securities | | $ | 94,737,555 | |
Aggregate unrealized (depreciation) of investment securities | | | (56,008,727 | ) |
Net unrealized appreciation of investment securities | | $ | 38,728,828 | |
Cost of investments for tax purposes is $757,076,550.
NOTE 9—Reclassification of Permanent Differences
Primarily as a result of differing book/tax treatment of distributions and net operating losses, on April 30, 2017, undistributed net investment income (loss) was increased by $117,481 and undistributed net realized gain was decreased by $117,481. This reclassification had no effect on the net assets of the Fund.
19 Invesco Value Opportunities Fund
NOTE 10—Share Information
| | | | | | | | | | | | | | | | |
| | | Summary of Share Activity | |
| | | Years ended April 30, | |
| | | 2017(a) | | | 2016 | |
| | | Shares | | | Amount | | | Shares | | | Amount | |
Sold: | | | | | | | | | | | | | | | | |
Class A | | | 3,372,961 | | | $ | 43,369,006 | | | | 2,354,104 | | | $ | 29,329,291 | |
Class B | | | 41,355 | | | | 514,431 | | | | 38,022 | | | | 469,743 | |
Class C | | | 692,587 | | | | 8,747,852 | | | | 337,380 | | | | 4,092,825 | |
Class R | | | 208,482 | | | | 2,588,734 | | | | 143,054 | | | | 1,807,758 | |
Class Y | | | 2,844,156 | | | | 37,046,927 | | | | 471,386 | | | | 5,672,449 | |
Class R5 | | | 20,606 | | | | 273,658 | | | | 46,312 | | | | 533,045 | |
Class R6(b) | | | 741 | | | | 10,000 | | | | — | | | | — | |
| | | | |
Issued as reinvestment of dividends: | | | | | | | | | | | | | | | | |
Class A | | | 574,431 | | | | 7,714,849 | | | | 7,433,854 | | | | 83,482,158 | |
Class B | | | 13,121 | | | | 173,203 | | | | 262,715 | | | | 2,900,373 | |
Class C | | | 65,490 | | | | 846,781 | | | | 984,865 | | | | 10,705,485 | |
Class R | | | 12,434 | | | | 166,244 | | | | 204,428 | | | | 2,287,553 | |
Class Y | | | 29,026 | | | | 388,364 | | | | 226,316 | | | | 2,530,214 | |
Class R5 | | | 2,681 | | | | 35,949 | | | | 30,075 | | | | 337,140 | |
| | | | |
Automatic conversion of Class B shares to Class A shares: | | | | | | | | | | | | | | | | |
Class A | | | 648,485 | | | | 8,259,385 | | | | 538,406 | | | | 6,646,266 | |
Class B | | | (659,568 | ) | | | (8,259,385 | ) | | | (547,070 | ) | | | (6,646,266 | ) |
| | | | |
Reacquired: | | | | | | | | | | | | | | | | |
Class A | | | (10,445,896 | ) | | | (129,834,397 | ) | | | (8,893,592 | ) | | | (110,982,972 | ) |
Class B | | | (238,430 | ) | | | (2,913,811 | ) | | | (284,478 | ) | | | (3,497,121 | ) |
Class C | | | (1,487,624 | ) | | | (17,648,709 | ) | | | (1,326,216 | ) | | | (15,968,642 | ) |
Class R | | | (564,253 | ) | | | (7,117,984 | ) | | | (387,712 | ) | | | (4,902,008 | ) |
Class Y | | | (1,265,689 | ) | | | (16,077,645 | ) | | | (429,510 | ) | | | (5,328,735 | ) |
Class R5 | | | (87,094 | ) | | | (999,647 | ) | | | (35,493 | ) | | | (451,499 | ) |
Net increase (decrease) in share activity | | | (6,221,998 | ) | | $ | (72,716,195 | ) | | | 1,166,846 | | | $ | 3,017,057 | |
| (a) | There are entities that are record owners of more than 5% of the outstanding shares of the Fund and in the aggregate own 30% of the outstanding shares of the Fund. IDI has an agreement with these entities to sell Fund shares. The Fund, Invesco and/or Invesco affiliates may make payments to these entities, which are considered to be related to the Fund, for providing services to the Fund, Invesco and/or Invesco affiliates including but not limited to services such as securities brokerage, distribution, third party record keeping and account servicing. The Fund has no knowledge as to whether all or any portion of the shares owned of record by these entities are also owned beneficially. |
| (b) | Commencement date of April 4, 2017. |
20 Invesco Value Opportunities Fund
NOTE 11—Financial Highlights
The following schedule presents financial highlights for a share of the Fund outstanding throughout the periods indicated.
| | | | | | | | | | | | | | | | | | | | | | | | | | | | | | | | | | | | | | | | | | | | | | | | | | | | | | | | |
| | | Net asset
value,
beginning
of period | | | Net
investment
income
(loss)(a) | | | Net gains
(losses)
on securities
(both
realized and
unrealized) | | | Total from
investment
operations | | | Dividends
from net
investment
income | | | Distributions
from net
realized
gains | | |
Total
distributions | | | Net asset
value, end
of period | | | Total
return(b) | | | Net assets,
end of period
(000’s omitted) | | | Ratio of
expenses
to average
net assets
with fee waivers
and/or expenses
absorbed | | | Ratio of
expenses
to average net
assets without
fee waivers
and/or expenses
absorbed | | | Ratio of net
investment
income (loss)
to average
net assets | | | Portfolio
turnover(c) | |
Class A | |
Year ended 04/30/17 | | $ | 11.60 | | | $ | 0.01 | | | $ | 2.05 | | | $ | 2.06 | | | $ | (0.02 | ) | | $ | (0.14 | ) | | $ | (0.16 | ) | | $ | 13.50 | | | | 17.81 | % | | $ | 645,216 | | | | 1.26 | %(d) | | | 1.27 | %(d) | | | 0.07 | %(d) | | | 33 | % |
Year ended 04/30/16 | | | 14.45 | | | | 0.02 | | | | (1.08 | ) | | | (1.06 | ) | | | (0.13 | ) | | | (1.66 | ) | | | (1.79 | ) | | | 11.60 | | | | (6.93 | ) | | | 622,026 | | | | 1.25 | | | | 1.25 | | | | 0.17 | | | | 38 | |
Year ended 04/30/15 | | | 14.24 | | | | 0.13 | | | | 0.33 | | | | 0.46 | | | | (0.25 | ) | | | — | | | | (0.25 | ) | | | 14.45 | | | | 3.29 | | | | 754,084 | | | | 1.22 | | | | 1.23 | | | | 0.88 | | | | 64 | |
Year ended 04/30/14 | | | 11.97 | | | | 0.23 | (e) | | | 2.18 | | | | 2.41 | | | | (0.14 | ) | | | — | | | | (0.14 | ) | | | 14.24 | | | | 20.21 | | | | 809,243 | | | | 1.23 | | | | 1.24 | | | | 1.71 | (e) | | | 16 | |
Year ended 04/30/13 | | | 10.24 | | | | 0.12 | | | | 1.72 | | | | 1.84 | | | | (0.10 | ) | | | (0.01 | ) | | | (0.11 | ) | | | 11.97 | | | | 18.15 | | | | 749,819 | | | | 1.26 | | | | 1.27 | | | | 1.14 | | | | 15 | |
Class B | | | | | | | | | | | | | | | | | | | | | | | | | | | | | | | | | | | | | | | | | | | | | | | | | | | | | | | | |
Year ended 04/30/17 | | | 11.40 | | | | 0.01 | | | | 2.02 | | | | 2.03 | | | | (0.02 | ) | | | (0.14 | ) | | | (0.16 | ) | | | 13.27 | | | | 17.85 | (f) | | | 8,715 | | | | 1.26 | (d)(f) | | | 1.27 | (d)(f) | | | 0.07 | (d)(f) | | | 33 | |
Year ended 04/30/16 | | | 14.24 | | | | 0.02 | | | | (1.07 | ) | | | (1.05 | ) | | | (0.13 | ) | | | (1.66 | ) | | | (1.79 | ) | | | 11.40 | | | | (6.97 | )(f) | | | 17,105 | | | | 1.25 | (f) | | | 1.25 | (f) | | | 0.17 | (f) | | | 38 | |
Year ended 04/30/15 | | | 14.03 | | | | 0.13 | | | | 0.33 | | | | 0.46 | | | | (0.25 | ) | | | — | | | | (0.25 | ) | | | 14.24 | | | | 3.34 | (f) | | | 28,912 | | | | 1.22 | (f) | | | 1.23 | (f) | | | 0.88 | (f) | | | 64 | |
Year ended 04/30/14 | | | 11.80 | | | | 0.22 | (e) | | | 2.15 | | | | 2.37 | | | | (0.14 | ) | | | — | | | | (0.14 | ) | | | 14.03 | | | | 20.16 | (f) | | | 41,084 | | | | 1.23 | (f) | | | 1.24 | (f) | | | 1.71 | (e)(f) | | | 16 | |
Year ended 04/30/13 | | | 10.09 | | | | 0.12 | | | | 1.70 | | | | 1.82 | | | | (0.10 | ) | | | (0.01 | ) | | | (0.11 | ) | | | 11.80 | | | | 18.25 | (f) | | | 50,968 | | | | 1.26 | (f) | | | 1.27 | (f) | | | 1.14 | (f) | | | 15 | |
Class C | | | | | | | | | | | | | | | | | | | | | | | | | | | | | | | | | | | | | | | | | | | | | | | | | | | | | | | | |
Year ended 04/30/17 | | | 11.20 | | | | (0.08 | ) | | | 1.98 | | | | 1.90 | | | | — | | | | (0.14 | ) | | | (0.14 | ) | | | 12.96 | | | | 17.00 | (g) | | | 82,590 | | | | 1.97 | (d)(g) | | | 1.98 | (d)(g) | | | (0.64 | )(d)(g) | | | 33 | |
Year ended 04/30/16 | | | 14.07 | | | | (0.07 | ) | | | (1.05 | ) | | | (1.12 | ) | | | (0.09 | ) | | | (1.66 | ) | | | (1.75 | ) | | | 11.20 | | | | (7.57 | )(g) | | | 79,538 | | | | 1.97 | (g) | | | 1.97 | (g) | | | (0.55 | )(g) | | | 38 | |
Year ended 04/30/15 | | | 13.87 | | | | 0.02 | | | | 0.33 | | | | 0.35 | | | | (0.15 | ) | | | — | | | | (0.15 | ) | | | 14.07 | | | | 2.53 | (g) | | | 99,994 | | | | 1.95 | (g) | | | 1.96 | (g) | | | 0.15 | (g) | | | 64 | |
Year ended 04/30/14 | | | 11.67 | | | | 0.13 | (e) | | | 2.13 | | | | 2.26 | | | | (0.06 | ) | | | — | | | | (0.06 | ) | | | 13.87 | | | | 19.38 | (g) | | | 107,754 | | | | 1.94 | (g) | | | 1.95 | (g) | | | 1.00 | (e)(g) | | | 16 | |
Year ended 04/30/13 | | | 9.99 | | | | 0.05 | | | | 1.67 | | | | 1.72 | | | | (0.03 | ) | | | (0.01 | ) | | | (0.04 | ) | | | 11.67 | | | | 17.26 | (g) | | | 101,772 | | | | 1.96 | (g) | | | 1.97 | (g) | | | 0.44 | (g) | | | 15 | |
Class R | | | | | | | | | | | | | | | | | | | | | | | | | | | | | | | | | | | | | | | | | | | | | | | | | | | | | | | | |
Year ended 04/30/17 | | | 11.55 | | | | (0.02 | ) | | | 2.04 | | | | 2.02 | | | | — | | | | (0.14 | ) | | | (0.14 | ) | | | 13.43 | | | | 17.53 | | | | 14,135 | | | | 1.51 | (d) | | | 1.52 | (d) | | | (0.18 | )(d) | | | 33 | |
Year ended 04/30/16 | | | 14.41 | | | | (0.01 | ) | | | (1.07 | ) | | | (1.08 | ) | | | (0.12 | ) | | | (1.66 | ) | | | (1.78 | ) | | | 11.55 | | | | (7.12 | ) | | | 16,119 | | | | 1.50 | | | | 1.50 | | | | (0.08 | ) | | | 38 | |
Year ended 04/30/15 | | | 14.20 | | | | 0.09 | | | | 0.33 | | | | 0.42 | | | | (0.21 | ) | | | — | | | | (0.21 | ) | | | 14.41 | | | | 3.03 | | | | 20,696 | | | | 1.47 | | | | 1.48 | | | | 0.63 | | | | 64 | |
Year ended 04/30/14 | | | 11.94 | | | | 0.19 | (e) | | | 2.18 | | | | 2.37 | | | | (0.11 | ) | | | — | | | | (0.11 | ) | | | 14.20 | | | | 19.91 | | | | 23,247 | | | | 1.48 | | | | 1.49 | | | | 1.46 | (e) | | | 16 | |
Year ended 04/30/13 | | | 10.22 | | | | 0.09 | | | | 1.72 | | | | 1.81 | | | | (0.08 | ) | | | (0.01 | ) | | | (0.09 | ) | | | 11.94 | | | | 17.80 | | | | 20,272 | | | | 1.51 | | | | 1.52 | | | | 0.89 | | | | 15 | |
Class Y | | | | | | | | | | | | | | | | | | | | | | | | | | | | | | | | | | | | | | | | | | | | | | | | | | | | | | | | |
Year ended 04/30/17 | | | 11.56 | | | | 0.04 | | | | 2.06 | | | | 2.10 | | | | (0.06 | ) | | | (0.14 | ) | | | (0.20 | ) | | | 13.46 | | | | 18.17 | | | | 46,105 | | | | 1.01 | (d) | | | 1.02 | (d) | | | 0.32 | (d) | | | 33 | |
Year ended 04/30/16 | | | 14.39 | | | | 0.05 | | | | (1.08 | ) | | | (1.03 | ) | | | (0.14 | ) | | | (1.66 | ) | | | (1.80 | ) | | | 11.56 | | | | (6.71 | ) | | | 21,016 | | | | 1.00 | | | | 1.00 | | | | 0.42 | | | | 38 | |
Year ended 04/30/15 | | | 14.21 | | | | 0.16 | | | | 0.33 | | | | 0.49 | | | | (0.31 | ) | | | — | | | | (0.31 | ) | | | 14.39 | | | | 3.55 | | | | 22,295 | | | | 0.97 | | | | 0.98 | | | | 1.13 | | | | 64 | |
Year ended 04/30/14 | | | 11.94 | | | | 0.26 | (e) | | | 2.18 | | | | 2.44 | | | | (0.17 | ) | | | — | | | | (0.17 | ) | | | 14.21 | | | | 20.53 | | | | 16,266 | | | | 0.98 | | | | 0.99 | | | | 1.96 | (e) | | | 16 | |
Year ended 04/30/13 | | | 10.22 | | | | 0.15 | | | | 1.71 | | | | 1.86 | | | | (0.13 | ) | | | (0.01 | ) | | | (0.14 | ) | | | 11.94 | | | | 18.39 | | | | 12,799 | | | | 1.01 | | | | 1.02 | | | | 1.39 | | | | 15 | |
Class R5 | | | | | | | | | | | | | | | | | | | | | | | | | | | | | | | | | | | | | | | | | | | | | | | | | | | | | | | | |
Year ended 04/30/17 | | | 11.60 | | | | 0.06 | | | | 2.06 | | | | 2.12 | | | | (0.08 | ) | | | (0.14 | ) | | | (0.22 | ) | | | 13.50 | | | | 18.30 | | | | 2,456 | | | | 0.85 | (d) | | | 0.86 | (d) | | | 0.48 | (d) | | | 33 | |
Year ended 04/30/16 | | | 14.42 | | | | 0.08 | | | | (1.09 | ) | | | (1.01 | ) | | | (0.15 | ) | | | (1.66 | ) | | | (1.81 | ) | | | 11.60 | | | | (6.56 | ) | | | 2,850 | | | | 0.84 | | | | 0.84 | | | | 0.58 | | | | 38 | |
Year ended 04/30/15 | | | 14.25 | | | | 0.19 | | | | 0.33 | | | | 0.52 | | | | (0.35 | ) | | | — | | | | (0.35 | ) | | | 14.42 | | | | 3.76 | | | | 2,952 | | | | 0.82 | | | | 0.83 | | | | 1.28 | | | | 64 | |
Year ended 04/30/14 | | | 11.99 | | | | 0.28 | (e) | | | 2.18 | | | | 2.46 | | | | (0.20 | ) | | | — | | | | (0.20 | ) | | | 14.25 | | | | 20.67 | | | | 2,225 | | | | 0.81 | | | | 0.82 | | | | 2.13 | (e) | | | 16 | |
Year ended 04/30/13 | | | 10.26 | | | | 0.18 | | | | 1.73 | | | | 1.91 | | | | (0.17 | ) | | | (0.01 | ) | | | (0.18 | ) | | | 11.99 | | | | 18.82 | | | | 2,029 | | | | 0.73 | | | | 0.74 | | | | 1.67 | | | | 15 | |
Class R6 | | | | | | | | | | | | | | | | | | | | | | | | | | | | | | | | | | | | | | | | | | | | | | | | | | | | | | | | |
Year ended 04/30/17(h) | | | 13.60 | | | | 0.01 | | | | (0.11 | ) | | | (0.10 | ) | | | — | | | | — | | | | — | | | | 13.50 | | | | (0.74 | ) | | | 10 | | | | 0.76 | (d)(i) | | | 0.76 | (d)(i) | | | 0.57 | (d)(i) | | | 33 | |
| (a) | Calculated using average shares outstanding. |
| (b) | Includes adjustments in accordance with accounting principles generally accepted in the United States of America and as such, the net asset value for financial reporting purposes and the returns based upon those net asset values may differ from the net asset value and returns for shareholder transactions. Does not include sales charges and is not annualized for periods less than one year, if applicable. |
| (c) | Portfolio turnover is calculated at the fund level and is not annualized for periods less than one year, if applicable. |
| (d) | Ratios are based on average daily net assets (000’s omitted) of $622,250, $13,745, $78,798, $15,363, $29,292, $2,341 and $10 for Class A, Class B, Class C, Class R, Class Y, Class R5 and Class R6 shares, respectively. |
| (e) | Net investment income (loss) per share and the ratio of net investment income (loss) to average net assets includes significant dividends received during the period. Net investment income (loss) per share and the ratio of net investment income (loss) to average net assets excluding the significant dividends are $0.15 and 1.07%, $0.14 and 1.07%, $0.05 and 0.36%, $0.11 and 0.82%, $0.18 and 1.32% and $0.20 and 1.49% for Class A, Class B, Class C, Class R, Class Y and Class R5 shares, respectively. |
| (f) | The total return, ratio of expenses to average net assets and ratio of net investment income (loss) to average net assets reflect actual 12b-1 fees of 0.25%, 0.25%, 0.25%, 0.25% and 0.25% for the years ended April 30, 2017, 2016, 2015, 2014 and 2013, respectively. |
| (g) | The total return, ratio of expenses to average net assets and ratio of net investment income (loss) to average net assets reflect actual 12b-1 fees of 0.97%, 0.97%, 0.98%, 0.96% and 0.95% for the years ended April 30, 2017, 2016, 2015, 2014 and 2013, respectively. |
| (h) | Commencement date of April 4, 2017 for Class R6 shares. |
21 Invesco Value Opportunities Fund
Report of Independent Registered Public Accounting Firm
To the Board of Trustees of AIM Sector Funds (Invesco Sector Funds)
and Shareholders of the Invesco Value Opportunities Fund:
In our opinion, the accompanying statement of assets and liabilities, including the schedule of investments, and the related statements of operations and of changes in net assets and the financial highlights present fairly, in all material respects, the financial position of the Invesco Value Opportunities Fund (one of the portfolios constituting the AIM Sector Funds (Invesco Sector Funds), hereafter referred to as the “Fund”) as of April 30, 2017, the results of its operations for the year then ended, the changes in its net assets for each of the two years in the period then ended and the financial highlights for each of the five years in the period then ended, in conformity with accounting principles generally accepted in the United States of America. These financial statements and financial highlights (hereafter referred to as “financial statements”) are the responsibility of the Fund’s management. Our responsibility is to express an opinion on these financial statements based on our audits. We conducted our audits of these financial statements in accordance with the standards of the Public Company Accounting Oversight Board (United States). Those standards require that we plan and perform the audit to obtain reasonable assurance about whether the financial statements are free of material misstatement. An audit includes examining, on a test basis, evidence supporting the amounts and disclosures in the financial statements, assessing the accounting principles used and significant estimates made by management, and evaluating the overall financial statement presentation. We believe that our audits, which included confirmation of securities as of April 30, 2017 by correspondence with the custodian, provide a reasonable basis for our opinion.
PricewaterhouseCoopers LLP
June 23, 2017
Houston, TX
22 Invesco Value Opportunities Fund
Calculating your ongoing Fund expenses
Example
As a shareholder of the Fund, you incur two types of costs: (1) transaction costs, which may include sales charges (loads) on purchase payments or contingent deferred sales charges on redemptions, if any; and (2) ongoing costs, including management fees, distribution and/or service (12b-1) fees, and other Fund expenses. This example is intended to help you understand your ongoing costs (in dollars) of investing in the Fund and to compare these costs with ongoing costs of investing in other mutual funds. With the exception of the actual ending account value and expenses of the Class R6 shares, the example is based on an investment of $1,000 invested at the beginning of the period and held for the entire period November 1, 2016 through April 30, 2017. The actual ending account value and expenses of the Class R6 shares in the example below are based on an investment of $1,000 invested as of close of business April 4, 2017 (commencement date) and held through April 30, 2017.
Actual expenses
The table below provides information about actual account values and actual expenses. You may use the information in this table, together with the amount you invested, to estimate the expenses that you paid over the period. Simply divide your account value by $1,000 (for example, an $8,600 account value divided by $1,000 = 8.6), then multiply the result by the number in the table under the heading entitled “Actual Expenses Paid During Period” to estimate the expenses you paid on your account during this period (as of close of business April 4, 2017 through April 30, 2017 for the Class R6 shares). Because the actual ending account value and expense information in the example is not based upon a six month period for the Class R6 shares, the ending account value and expense information may not provide a meaningful comparison to mutual funds that provide such information for a full six month period.
Hypothetical example for comparison purposes
The table below also provides information about hypothetical account values and hypothetical expenses based on the Fund’s actual expense ratio and an assumed rate of return of 5% per year before expenses, which is not the Fund’s actual return.
The hypothetical account values and expenses may not be used to estimate the actual ending account balance or expenses you paid for the period. You may use this information to compare the ongoing costs of investing in the Fund and other funds. To do so, compare this 5% hypothetical example with the 5% hypothetical examples that appear in the shareholder reports of the other funds.
Please note that the expenses shown in the table are meant to highlight your ongoing costs only and do not reflect any transaction costs, such as sales charges (loads) on purchase payments or contingent deferred sales charges on redemptions, if any. Therefore, the hypothetical information is useful in comparing ongoing costs only, and will not help you determine the relative total costs of owning different funds. In addition, if these transaction costs were included, your costs would have been higher.
| | | | | | | | | | | | | | | | | | | | | | | | |
| Class | | Beginning
Account Value
(11/01/16) | | | ACTUAL | | | HYPOTHETICAL (5% annual return before
expenses) | | | Annualized
Expense
Ratio | |
| | | Ending
Account Value
(04/30/17)1 | | | Expenses
Paid During
Period2 | | | Ending
Account Value
(04/30/17) | | | Expenses
Paid During
Period3 | | |
| A | | $ | 1,000.00 | | | $ | 1,174.00 | | | $ | 6.90 | | | $ | 1,018.45 | | | $ | 6.41 | | | | 1.28 | % |
| B | | | 1,000.00 | | | | 1,174.40 | | | | 6.90 | | | | 1,018.45 | | | | 6.41 | | | | 1.28 | |
| C | | | 1,000.00 | | | | 1,170.00 | | | | 10.71 | | | | 1,014.93 | | | | 9.94 | | | | 1.99 | |
| R | | | 1,000.00 | | | | 1,173.30 | | | | 8.24 | | | | 1,017.21 | | | | 7.65 | | | | 1.53 | |
| Y | | | 1,000.00 | | | | 1,175.60 | | | | 5.56 | | | | 1,019.69 | | | | 5.16 | | | | 1.03 | |
| R5 | | | 1,000.00 | | | | 1,176.90 | | | | 4.75 | | | | 1,020.43 | | | | 4.41 | | | | 0.88 | |
| R6 | | | 1,000.00 | | | | 992.60 | | | | 0.56 | | | | 1,021.03 | | | | 3.81 | | | | 0.76 | |
| 1 | The actual ending account value is based on the actual total return of the Fund for the period November 1, 2016 through April 30, 2017 (as of close of business April 4, 2017 through April 30, 2017 for the Class R6 shares), after actual expenses and will differ from the hypothetical ending account value which is based on the Fund’s expense ratio and a hypothetical annual return of 5% before expenses. |
| 2 | Actual expenses are equal to the Fund’s annualized expense ratio as indicated above multiplied by the average account value over the period, multiplied by 181/365 to reflect the most recent fiscal half year. For the Class R6 shares actual expenses are equal to the annualized expense ratio indicated above multiplied by the average account value over the period, multiplied by 27 (as of close of business April 4, 2017 through April 30, 2017 for the Class R6 shares)/365. Because the Class R6 shares have not been in existence for a full six month period, the actual ending account value and expense information shown may not provide a meaningful comparison to fund expense information of classes that show such data for a full six month period and, because the actual ending account value and expense information in the expense example covers a short time period, return and expense data may not be indicative of return and expense data for longer time periods. |
| 3 | Hypothetical expenses are equal to the annualized expense ratio indicated above multiplied by the average account value over the period, multiplied by 181/365 to reflect a one-half year period. The hypothetical ending account value and expenses may be used to compare ongoing costs of investing in Class R6 shares of the Fund and other funds because such data is based on a full six month period. |
23 Invesco Value Opportunities Fund
Tax Information
Form 1099-DIV, Form 1042-S and other year–end tax information provide shareholders with actual calendar year amounts that should be included in their tax returns. Shareholders should consult their tax advisors.
The following distribution information is being provided as required by the Internal Revenue Code or to meet a specific state’s requirement.
The Fund designates the following amounts or, if subsequently determined to be different, the maximum amount allowable for its fiscal year ended April 30, 2017:
| | | | | | |
| | | Federal and State Income Tax | | | |
| | Long-Term Capital Gain Distributions | | $ | 8,664,781 | |
| | Qualified Dividend Income * | | | 100 | % |
| | Corporate Dividends Received Deduction * | | | 100 | % |
| | U.S. Treasury Obligations * | | | 0 | % |
| | * | The above percentages are based on ordinary income dividends paid to shareholders during the Fund’s fiscal year. |
24 Invesco Value Opportunities Fund
Proxy Results
A Special Joint Meeting (“Meeting”) of Shareholders of Invesco Value Opportunities Fund, an investment portfolio of AIM Sector Funds (Invesco Sector Funds), a Delaware statutory trust (“Trust”), was held on March 9, 2017. The Meeting was held for the following purpose:
| (1) | Elect 15 trustees to the Board, each of whom will serve until his or her successor is elected and qualified. |
| (2) | Approve an amendment to the Trust’s Agreement and Declaration of Trust that would permit fund mergers and other significant transactions upon the Board’s approval but without shareholder approval of such transactions. |
The results of the voting on the above matters were as follows:
| | | | | | | | | | | | | | | | | | |
| | | Matters | | | | | | | | Votes For | | | Votes Withheld | |
| (1)* | | David C. Arch | | | | 478,210,140 | | | | 13,802,825 | |
| | James T. Bunch | | | | 477,776,614 | | | | 14,236,351 | |
| | Bruce L. Crockett | | | | 477,904,863 | | | | 14,108,102 | |
| | Jack M. Fields | | | | 478,154,120 | | | | 13,858,845 | |
| | Martin L. Flanagan | | | | 478,366,284 | | | | 13,646,681 | |
| | Cynthia Hostetler | | | | 478,149,043 | | | | 13,863,922 | |
| | Dr. Eli Jones | | | | 478,281,396 | | | | 13,731,569 | |
| | Dr. Prema Mathai-Davis | | | | 477,927,603 | | | | 14,085,362 | |
| | Teresa M. Ressel | | | | 478,116,999 | | | | 13,895,966 | |
| | Dr. Larry Soll | | | | 477,671,696 | | | | 14,341,269 | |
| | Ann Barnett Stern | | | | 478,390,538 | | | | 13,622,427 | |
| | Raymond Stickel, Jr. | | | | 477,934,336 | | | | 14,078,629 | |
| | Philip A. Taylor | | | | 478,104,174 | | | | 13,908,791 | |
| | Robert C. Troccoli | | | | 478,368,464 | | | | 13,644,501 | |
| | Christopher L. Wilson | | | | 478,433,867 | | | | 13,579,098 | |
| | | | | |
| | | | | | | | | | | | | | | | | | |
| | | | | Votes For | | | Votes
Against | | | Votes Abstain | | | Broker Non-Votes | |
| (2)* | | Approve an amendment to the Trust’s Agreement and Declaration of Trust that would permit fund mergers and other significant transactions upon the Board’s approval but without shareholder approval of such transactions | | | 261,575,830 | | | | 26,621,916 | | | | 13,166,011 | | | | 190,648,808 | |
The Meeting was adjourned until April 11, 2017, with respect to the following proposals:
| (3) | Approve changing the fundamental investment restriction regarding the purchase or sale of physical commodities. |
| 4(a) | Approve an amendment to the current Master Intergroup Sub-Advisory Contract to add Invesco PowerShares Capital Management LLC. |
| 4(b) | Approve an amendment to the current Master Intergroup Sub-Advisory Contract to add Invesco Asset Management (India) Private Limited. |
Invesco Value Opportunities Fund did not receive sufficient shareholder votes to pass Proposals 3 and 4(a) - (b).
The results of the voting on the above matters were as follows:
| | | | | | | | | | | | | | | | | | |
| | | Matters | | Votes For | | | Votes Against | | | Votes Abstain | | | Broker Non-Votes | |
| (3) | | Approve changing the fundamental investment restriction regarding the purchase or sale of physical commodities | | | 15,523,298 | | | | 1,575,457 | | | | 1,298,209 | | | | 11,081,823 | |
| 4(a) | | Approve an amendment to the current Master Intergroup Sub-Advisory Contract to add Invesco PowerShares Capital Management LLC | | | 16,165,246 | | | | 940,069 | | | | 1,291,660 | | | | 11,081,812 | |
| 4(b) | | Approve an amendment to the current Master Intergroup Sub-Advisory Contract to add Invesco Asset Management (India) Private Limited | | | 15,888,622 | | | | 1,208,153 | | | | 1,300,191 | | | | 11,081,821 | |
| * | Each of proposal 1 and 2 required approval by a combined vote of all of the portfolios of AIM Sector Funds (Invesco Sector Funds). |
25 Invesco Value Opportunities Fund
Trustees and Officers
The address of each trustee and officer is AIM Sector Funds (Invesco Sector Funds) (the “Trust”), 11 Greenway Plaza, Suite 1000, Houston, Texas 77046-1173. The trustees serve for the life of the Trust, subject to their earlier death, incapacitation, resignation, retirement or removal as more specifically provided in the Trust’s organizational documents. Each officer serves for a one year term or until their successors are elected and qualified. Column two below includes length of time served with predecessor entities, if any.
| | | | | | | | |
Name, Year of Birth and
Position(s) Held with the Trust | | Trustee and/
or Officer Since | | Principal Occupation(s)
During Past 5 Years | | Number of
Funds in Fund
Complex
Overseen by
Trustee | | Other Directorship(s)
Held by Trustee During
Past 5 Years |
| Interested Persons | | | | | | | | |
| Martin L. Flanagan1 — 1960 Trustee | | 2007 | | Executive Director, Chief Executive Officer and President, Invesco Ltd. (ultimate parent of Invesco and a global investment management firm); Trustee, The Invesco Funds; Vice Chair, Investment Company Institute; and Member of Executive Board, SMU Cox School of Business Formerly: Advisor to the Board, Invesco Advisers, Inc. (formerly known as Invesco Institutional (N.A.), Inc.); Chairman and Chief Executive Officer, Invesco Advisers, Inc. (registered investment adviser); Director, Chairman, Chief Executive Officer and President, Invesco Holding Company (US), Inc. (formerly IVZ Inc.) (holding company), Invesco Group Services, Inc. (service provider) and Invesco North American Holdings, Inc. (holding company); Director, Chief Executive Officer and President, Invesco Holding Company Limited (parent of Invesco and a global investment management firm); Director, Invesco Ltd.; Chairman, Investment Company Institute and President, Co-Chief Executive Officer, Co-President, Chief Operating Officer and Chief Financial Officer, Franklin Resources, Inc. (global investment management organization) | | 144 | | None |
Philip A. Taylor2 — 1954 Trustee and Senior Vice President | | 2006 | | Head of the Americas and Senior Managing Director, Invesco Ltd.; Director, Invesco Advisers, Inc. (formerly known as Invesco Institutional (N.A.), Inc.) (registered investment adviser); Director, Chairman, Chief Executive Officer and President, Invesco Management Group, Inc. (formerly known as Invesco Aim Management Group, Inc.) (financial services holding company); Director and Chairman, Invesco Investment Services, Inc. (formerly known as Invesco Aim Investment Services, Inc.) (registered transfer agent) Chief Executive Officer, Invesco Corporate Class Inc. (corporate mutual fund company) Director, Chairman and Chief Executive Officer, Invesco Canada Ltd. (formerly known as Invesco Trimark Ltd./Invesco Trimark Ltèe) (registered investment adviser and registered transfer agent); Trustee and Senior Vice President, The Invesco Funds; Director, Invesco Investment Advisers LLC (formerly known as Van Kampen Asset Management). Formerly: Co-Chairman, Co-President and Co-Chief Executive Officer, Invesco Advisers, Inc. (formerly known as Invesco Institutional (N.A.), Inc.) (registered investment adviser); Director, Chief Executive Officer and President, Van Kampen Exchange Corp; President and Principal Executive Officer, The Invesco Funds (other than AIM Treasurer’s Series Trust (Invesco Treasurer’s Series Trust), Short-Term Investments Trust and Invesco Management Trust); Executive Vice President, The Invesco Funds (AIM Treasurer’s Series Trust (Invesco Treasurer’s Series Trust), Short-Term Investments Trust and Invesco Management Trust only); Director and President, INVESCO Funds Group, Inc. (registered investment adviser and registered transfer agent); Director and Chairman, IVZ Distributors, Inc. (formerly known as INVESCO Distributors, Inc.) (registered broker dealer); Director, President and Chairman, Invesco Inc. (holding company), Invesco Canada Holdings Inc. (holding company), Trimark Investments Ltd./Placements Trimark Ltèe and Invesco Financial Services Ltd/Services Financiers Invesco Ltèe; Chief Executive Officer, Invesco Canada Fund Inc. (corporate mutual fund company); Director and Chairman, Van Kampen Investor Services Inc.; Director, Chief Executive Officer and President, 1371 Preferred Inc. (holding company) and Van Kampen Investments Inc.; Director and President, AIM GP Canada Inc. (general partner for limited partnerships) and Van Kampen Advisors, Inc.; Director and Chief Executive Officer, Invesco Trimark Dealer Inc. (registered broker dealer); Director, Invesco Distributors, Inc. (formerly known as Invesco Aim Distributors, Inc.) (registered broker dealer); Manager, Invesco PowerShares Capital Management LLC; Director, Chief Executive Officer and President, Invesco Advisers, Inc.; Director, Chairman, Chief Executive Officer and President, Invesco Aim Capital Management, Inc.; President, Invesco Trimark Dealer Inc. and Invesco Trimark Ltd./Invesco Trimark Ltèe; Director and President, AIM Trimark Corporate Class Inc. and AIM Trimark Canada Fund Inc.; Senior Managing Director, Invesco Holding Company Limited; Director and Chairman, Fund Management Company (former registered broker dealer); President and Principal Executive Officer, The Invesco Funds (AIM Treasurer’s Series Trust (Invesco Treasurer’s Series Trust), and Short-Term Investments Trust only); President, AIM Trimark Global Fund Inc. and AIM Trimark Canada Fund Inc. | | 144 | | None |
| 1 | Mr. Flanagan is considered an interested person (within the meaning of Section 2(a)(19) of the 1940 Act) of the Trust because he is an officer of the Adviser to the Trust, and an officer and a director of Invesco Ltd., ultimate parent of the Adviser. |
| 2 | Mr. Taylor is considered an interested person (within the meaning of Section 2(a)(19) of the 1940 Act) of the Trust because he is an officer and a director of the Adviser. |
T-1 Invesco Value Opportunities Fund
Trustees and Officers—(continued)
| | | | | | | | |
Name, Year of Birth and
Position(s) Held with the Trust | | Trustee and/
or Officer Since | | Principal Occupation(s)
During Past 5 Years | | Number of
Funds in Fund
Complex
Overseen by
Trustee | | Other Directorship(s)
Held by Trustee During
Past 5 Years |
| Independent Trustees | | | | | | | | |
Bruce L. Crockett — 1944 Trustee and Chair | | 2003 | | Chairman, Crockett Technologies Associates (technology consulting company) Formerly: Director, Captaris (unified messaging provider); Director, President and Chief Executive Officer, COMSAT Corporation; Chairman, Board of Governors of INTELSAT (international communications company); ACE Limited (insurance company); Independent Directors Council and Investment Company Institute: Member of the Audit Committee, Investment Company Institute; Member of the Executive Committee and Chair of the Governance Committee, Independent Directors Council | | 144 | | Director and Chairman of the Audit Committee, ALPS (Attorneys Liability Protection Society) (insurance company); Director and Member of the Audit Committee, Ferroglobe PLC (metallurgical company) |
David C. Arch — 1945 Trustee | | 2010 | | Chairman of Blistex Inc. (consumer health care products manufacturer); Member, World Presidents’ Organization | | 144 | | Board member of the Illinois Manufacturers’ Association |
James T. Bunch — 1942 Trustee | | 2000 | | Managing Member, Grumman Hill Group LLC (family office/private equity investments) Formerly: Chairman of the Board, Denver Film Society; Chairman of the Board of Trustees, Evans Scholarship Foundation; Chairman, Board of Governors, Western Golf Association | | 144 | | Trustee, Evans Scholarship Foundation |
Jack M. Fields — 1952 Trustee | | 2003 | | Chief Executive Officer, Twenty First Century Group, Inc. (government affairs company); and Discovery Learning Alliance (non-profit) Formerly: Owner and Chief Executive Officer, Dos Angeles Ranch L.P. (cattle, hunting, corporate entertainment); Director, Insperity, Inc. (formerly known as Administaff); Chief Executive Officer, Texana Timber LP (sustainable forestry company); Director of Cross Timbers Quail Research Ranch (non-profit); and member of the U.S. House of Representatives | | 144 | | None |
Cynthia Hostetler — 1962 Trustee | | 2017 | | Non-Executive Director and Trustee of a number of public and private business corporations Formerly: Head of Investment Funds and Private Equity, Overseas Private Investment Corporation; President, First Manhattan Bancorporation, Inc.; Attorney, Simpson Thacher & Bartlett LLP | | 144 | | Vulcan Materials Company (construction materials company); Trilinc Global Impact Fund; Aberdeen Investment Funds (4 portfolios); Artio Global Investment LLC (mutual fund complex); Edgen Group, Inc. (specialized energy and infrastructure products distributor) |
Eli Jones — 1961 Trustee | | 2016 | | Professor and Dean, Mays Business School—Texas A&M University Formerly: Professor and Dean, Walton College of Business, University of Arkansas and E.J. Ourso College of Business, Louisiana State University; Director, Arvest Bank | | 144 | | Insperity, Inc. (formerly known as Administaff) (human resources provider) |
Prema Mathai-Davis — 1950 Trustee | | 2003 | | Retired. Formerly: Chief Executive Officer, YWCA of the U.S.A. | | 144 | | None |
Teresa M. Ressel — 1962 Trustee | | 2017 | | Non-Executive Director and Trustee of a number of public and private business corporations Formerly: Chief Financial Officer, Olayan America, The Olayan Group (international investor/commercial/industrial); Chief Executive Officer, UBS Securities LLC; Group Chief Operating Officer, Americas, UBS AG; Assistant Secretary for Management & Budget and CFO, US Department of the Treasury; Chief Compliance Officer, Kaiser Permanente; Program Manager, Hewlett-Packard; Nuclear Engineering, General Dynamics Corporation | | 144 | | Atlantic Power Corporation (power generation company); ON Semiconductor Corp. (semiconductor supplier) |
Larry Soll — 1942 Trustee | | 1997 | | Retired. Formerly: Chairman, Chief Executive Officer and President, Synergen Corp. (a biotechnology company) | | 144 | | None |
Ann Barnett Stern — 1957 Trustee | | 2017 | | President and Chief Executive Officer, Houston Endowment Inc. (private philanthropic institution) Formerly: Executive Vice President and General Counsel, Texas Children’s Hospital; Attorney, Beck, Redden and Secrest, LLP; Business Law Instructor, University of St. Thomas; Attorney, Andrews & Kurth LLP | | 144 | | Federal Reserve Bank of Dallas |
Raymond Stickel, Jr. — 1944 Trustee | | 2005 | | Retired. Formerly: Director, Mainstay VP Series Funds, Inc. (25 portfolios); Partner, Deloitte & Touche | | 144 | | None |
Robert C. Troccoli — 1949 Trustee | | 2016 | | Adjunct Professor, University of Denver – Daniels College of Business Formerly: Senior Partner, KPMG LLP | | 144 | | None |
Christopher L. Wilson — 1957 Trustee | | 2017 | | Managing Partner, CT2, LLC (investing and consulting firm) Formerly: President/Chief Executive Officer, Columbia Funds, Bank of America Corporation; President/Chief Executive Officer, CDC IXIS Asset Management Services, Inc.; Principal & Director of Operations, Scudder Funds, Scudder, Stevens & Clark, Inc.; Assistant Vice President, Fidelity Investments | | 144 | | TD Asset Management USA Inc. (mutual fund complex) (22 portfolios); ISO New England, Inc. (non-profit organization managing regional electricity market) |
T-2 Invesco Value Opportunities Fund
Trustees and Officers—(continued)
| | | | | | | | |
Name, Year of Birth and
Position(s) Held with the Trust | | Trustee and/
or Officer Since | | Principal Occupation(s)
During Past 5 Years | | Number of
Funds in Fund
Complex
Overseen by
Trustee | | Other Directorship(s)
Held by Trustee During
Past 5 Years |
| Other Officers | | | | | | | | |
Sheri Morris — 1964 President, Principal Executive Officer and Treasurer | | 2003 | | President, Principal Executive Officer and Treasurer, The Invesco Funds; Vice President, Invesco Advisers, Inc. (formerly known as Invesco Institutional (N.A.), Inc.) (registered investment adviser); and Vice President, PowerShares Exchange-Traded Fund Trust, PowerShares Exchange-Traded Fund Trust II, PowerShares India Exchange-Traded Fund Trust, PowerShares Actively Managed Exchange-Traded Fund Trust and PowerShares Actively Managed Exchange-Traded Commodity Fund Trust Formerly: Vice President and Principal Financial Officer, The Invesco Funds; Vice President, Invesco Aim Advisers, Inc., Invesco Aim Capital Management, Inc. and Invesco Aim Private Asset Management, Inc.; Assistant Vice President and Assistant Treasurer, The Invesco Funds and Assistant Vice President, Invesco Advisers, Inc., Invesco Aim Capital Management, Inc. and Invesco Aim Private Asset Management, Inc.; and Treasurer, PowerShares Exchange-Traded Fund Trust, PowerShares Exchange-Traded Fund Trust II, PowerShares India Exchange-Traded Fund Trust and PowerShares Actively Managed Exchange-Traded Fund Trust | | N/A | | N/A |
Russell C. Burk — 1958 Senior Vice President and Senior Officer | | 2005 | | Senior Vice President and Senior Officer, The Invesco Funds | | N/A | | N/A |
John M. Zerr — 1962 Senior Vice President, Chief Legal Officer and Secretary | | 2006 | | Director, Senior Vice President, Secretary and General Counsel, Invesco Management Group, Inc. (formerly known as Invesco AIM Management Group, Inc.); Senior Vice President, Invesco Advisers, Inc. (formerly known as Invesco Institutional (N.A.), Inc.) (registered investment adviser); Senior Vice President and Secretary, Invesco Distributors, Inc. (formerly known as Invesco AIM Distributors, Inc.); Director, Vice President and Secretary, Invesco Investment Services, Inc. (formerly known as Invesco AIM Investment Services, Inc.) Senior Vice President, Chief Legal Officer and Secretary, The Invesco Funds; Managing Director, Invesco PowerShares Capital Management LLC; Director, Secretary and General Counsel, Invesco Investment Advisers LLC (formerly known as Van Kampen Asset Management); Secretary and General Counsel, Invesco Capital Markets, Inc. (formerly known as Van Kampen Funds Inc.) and Chief Legal Officer, PowerShares Exchange-Traded Fund Trust, PowerShares Exchange-Traded Fund Trust II, PowerShares India Exchange-Traded Fund Trust, PowerShares Actively Managed Exchange-Traded Fund Trust and PowerShares Actively Managed Exchange-Traded Commodity Fund Trust; Manager and Secretary, Invesco Indexing LLC Formerly: Director, Secretary, General Counsel and Senior Vice President, Van Kampen Exchange Corp.; Director, Vice President and Secretary, IVZ Distributors, Inc. (formerly known as INVESCO Distributors, Inc.); Director and Vice President, INVESCO Funds Group, Inc.; Director and Vice President, Van Kampen Advisors Inc.; Director, Vice President, Secretary and General Counsel, Van Kampen Investor Services Inc.; Director, Invesco Distributors, Inc. (formerly known as Invesco AIM Distributors, Inc.); Director, Senior Vice President, General Counsel and Secretary, Invesco AIM Advisers, Inc. and Van Kampen Investments Inc.; Director, Vice President and Secretary, Fund Management Company; Director, Senior Vice President, Secretary, General Counsel and Vice President, Invesco AIM Capital Management, Inc.; Chief Operating Officer and General Counsel, Liberty Ridge Capital, Inc. (an investment adviser); Vice President and Secretary, PBHG Funds (an investment company) and PBHG Insurance Series Fund (an investment company); Chief Operating Officer, General Counsel and Secretary, Old Mutual Investment Partners (a broker-dealer); General Counsel and Secretary, Old Mutual Fund Services (an administrator) and Old Mutual Shareholder Services (a shareholder servicing center); Executive Vice President, General Counsel and Secretary, Old Mutual Capital, Inc. (an investment adviser); and Vice President and Secretary, Old Mutual Advisors Funds (an investment company) | | N/A | | N/A |
Gregory G. McGreevey — 1962 Senior Vice President | | 2012 | | Senior Managing Director, Invesco Ltd.; Director, Chairman, President, and Chief Executive Officer, Invesco Advisers, Inc. (formerly known as Invesco Institutional (N.A.), Inc.) (registered investment adviser); Director, Invesco Mortgage Capital, Inc. and Invesco Senior Secured Management, Inc.; and Senior Vice President, The Invesco Funds Formerly: Assistant Vice President, The Invesco Funds | | N/A | | N/A |
Kelli Gallegos — 1970 Vice President, Principal Financial Officer and Assistant Treasurer | | 2008 | | Vice President, Principal Financial Officer and Assistant Treasurer, The Invesco Funds; Assistant Treasurer, Invesco PowerShares Capital Management LLC, PowerShares Exchange-Traded Fund Trust, PowerShares Exchange-Traded Fund Trust II, PowerShares India Exchange-Traded Fund Trust, PowerShares Actively Managed Exchange-Traded Fund Trust and PowerShares Actively Managed Exchange-Traded Commodity Fund Trust Formerly: Assistant Vice President, The Invesco Funds | | N/A | | N/A |
T-3 Invesco Value Opportunities Fund
Trustees and Officers—(continued)
| | | | | | | | |
Name, Year of Birth and
Position(s) Held with the Trust | | Trustee and/
or Officer Since | | Principal Occupation(s)
During Past 5 Years | | Number of
Funds in Fund
Complex
Overseen by
Trustee | | Other Directorship(s)
Held by Trustee During
Past 5 Years |
| Other Officers—(continued) | | | | | | | | |
Tracy Sullivan — 1962 Vice President, Chief Tax Officer and Assistant Treasurer | | 2008 | | Vice President, Chief Tax Officer and Assistant Treasurer, The Invesco Funds; Assistant Treasurer, Invesco PowerShares Capital Management LLC, PowerShares Exchange-Traded Fund Trust, PowerShares Exchange-Traded Fund Trust II, PowerShares India Exchange-Traded Fund Trust, PowerShares Actively Managed Exchange-Traded Fund Trust and PowerShares Actively Managed Exchange-Traded Commodity Fund Trust Formerly: Assistant Vice President, The Invesco Funds | | N/A | | N/A |
Crissie M. Wisdom — 1969 Anti-Money Laundering Compliance Officer | | 2013 | | Anti-Money Laundering Compliance Officer, Invesco Advisers, Inc. (formerly known as Invesco Institutional (N.A.), Inc.) (registered investment adviser), Invesco Capital Markets, Inc. (formerly known as Van Kampen Funds Inc.), Invesco Distributors, Inc., Invesco Investment Services, Inc., Invesco Management Group, Inc., The Invesco Funds, and PowerShares Exchange-Traded Fund Trust, PowerShares Exchange-Traded Fund Trust II, PowerShares India Exchange-Traded Fund Trust, PowerShares Actively Managed Exchange-Traded Fund Trust and PowerShares Actively Managed Exchange-Traded Commodity Fund Trust; Anti-Money Laundering Compliance Officer and Bank Secrecy Act Officer, INVESCO National Trust Company and Invesco Trust Company; and Fraud Prevention Manager and Controls and Risk Analysis Manager for Invesco Investment Services, Inc. Formerly: Anti-Money Laundering Compliance Officer, Van Kampen Exchange Corp. | | N/A | | N/A |
Robert R. Leveille — 1969 Chief Compliance Officer | | 2016 | | Chief Compliance Officer, Invesco Advisers, Inc. (registered investment adviser); and Chief Compliance Officer, The Invesco Funds Formerly: Chief Compliance Officer, Putnam Investments and the Putnam Funds | | N/A | | N/A |
The Statement of Additional Information of the Trust includes additional information about the Fund’s Trustees and is available upon request, without charge, by calling 1.800.959.4246. Please refer to the Fund’s Statement of Additional Information for information on the Fund’s sub-advisers.
| | | | | | | | | | |
Office of the Fund 11 Greenway Plaza, Suite 1000 Houston, TX 77046-1173 | | Investment Adviser Invesco Advisers, Inc. 1555 Peachtree Street, N.E. Atlanta, GA 30309 | |
| Distributor
Invesco Distributors, Inc. 11 Greenway Plaza, Suite 1000 Houston, TX 77046-1173 |
| |
| Auditors
PricewaterhouseCoopers LLP 1000 Louisiana Street, Suite 5800 Houston, TX 77002-5678 |
|
| | | |
| | | | | | | | | | |
Counsel to the Fund Stradley Ronon Stevens & Young, LLP 2005 Market Street, Suite 2600 Philadelphia, PA 19103-7018 | | Counsel to the Independent Trustees Goodwin Procter LLP 901 New York Avenue, N.W. Washington, D.C. 20001 | |
| Transfer Agent
Invesco Investment Services, Inc. 11 Greenway Plaza, Suite 1000 Houston, TX 77046-1173 |
| |
| Custodian
State Street Bank and Trust Company 225 Franklin Street Boston, MA 02110-2801 |
|
T-4 Invesco Value Opportunities Fund
Explore High-Conviction Investing with Invesco

Go paperless with eDelivery
Visit invesco.com/edelivery to enjoy the convenience and security of anytime electronic access to your investment documents.
With eDelivery, you can elect to have any or all of the following materials delivered straight to your inbox to download, save and print from your own computer:
∎ Fund reports and prospectuses
∎ Quarterly statements
∎ Daily confirmations
∎ Tax forms
Invesco mailing information
Send general correspondence to Invesco Investment Services, Inc., P.O. Box 219078, Kansas City, MO 64121-9078.
Important notice regarding delivery of security holder documents
To reduce Fund expenses, only one copy of most shareholder documents may be mailed to shareholders with multiple accounts at the same address (Householding). Mailing of your shareholder documents may be householded indefinitely unless you instruct us otherwise. If you do not want the mailing of these documents to be combined with those for other members of your household, please contact Invesco Investment Services, Inc. at 800 959 4246 or contact your financial institution. We will begin sending you individual copies for each account within 30 days after receiving your request.
Fund holdings and proxy voting information
The Fund provides a complete list of its holdings four times in each fiscal year, at the quarter ends. For the second and fourth quarters, the lists appear in the Fund’s semiannual and annual reports to shareholders. For the first and third quarters, the Fund files the lists with the Securities and Exchange Commission (SEC) on Form N-Q. The most recent list of portfolio holdings is available at invesco.com/completeqtrholdings. Shareholders can also look up the Fund’s Forms N-Q on the SEC website at sec.gov. Copies of the Fund’s Forms N-Q may be reviewed and copied at the SEC Public Reference Room in Washington, D.C. You can obtain information on the operation of the Public Reference Room, including information about duplicating fee charges, by calling 202 551 8090 or 800 732 0330, or by electronic request at the following email address: publicinfo@sec.gov.
The SEC file numbers for the Fund are shown below.
A description of the policies and procedures that the Fund uses to determine how to vote proxies relating to portfolio securities is available without charge, upon request, from our Client Services department at 800 959 4246 or at invesco.com/proxyguidelines. The information is also available on the SEC website, sec.gov.
| | |
Information regarding how the Fund voted proxies related to its portfolio securities during the most recent 12-month period ended June 30 is available at invesco.com/proxysearch. The information is also available on the SEC website, sec.gov. Invesco Advisers, Inc. is an investment adviser; it provides investment advisory services to individual and institutional clients and does not sell securities. Invesco Distributors, Inc. is the US distributor for Invesco Ltd.’s retail mutual funds, exchange-traded funds and institutional money market funds. Both are wholly owned, indirect subsidiaries of Invesco Ltd. | |  |
SEC file numbers: 811-03826 and 002-85905 Invesco Distributors, Inc. VK-VOPP-AR-1 06082017 1430
There were no amendments to the Code of Ethics (the “Code”) that applies to the Registrant’s Principal Executive Officer (“PEO”) and Principal Financial Officer (“PFO”) during the period covered by the report. The Registrant did not grant any waivers, including implicit waivers, from any provisions of the Code to the PEO or PFO during the period covered by this report.
| ITEM 3. | AUDIT COMMITTEE FINANCIAL EXPERT. |
The Board of Trustees has determined that the Registrant has at least one audit committee financial expert serving on its Audit Committee. The Audit Committee financial expert is Raymond Stickel, Jr. Mr. Stickel is “independent” within the meaning of that term as used in Form N-CSR.
| ITEM 4. | PRINCIPAL ACCOUNTANT FEES AND SERVICES. |
PricewaterhouseCoopers LLP informed the Trust that it has identified an issue related to its independence under Rule 2-01(c)(1)(ii)(A) of Regulation S-X (referred to as the Loan Rule). The Loan Rule prohibits accounting firms, such as PricewaterhouseCoopers LLP, from being deemed independent if they have certain financial relationships with their audit clients or certain affiliates of those clients. The Trust is required under various securities laws to have its financial statements audited by an independent accounting firm.
The Loan Rule specifically provides that an accounting firm would not be independent if it or certain affiliates and covered persons receives a loan from a lender that is a record or beneficial owner of more than ten percent of an audit client’s equity securities (referred to as a “more than ten percent owner”). For purposes of the Loan Rule, audit clients include the Funds as well as all registered investment companies advised by the Adviser and its affiliates, including other subsidiaries of the Adviser’s parent company, Invesco Ltd. (collectively, the Invesco Fund Complex). PricewaterhouseCoopers LLP informed the Trust it and certain affiliates and covered persons have relationships with lenders who hold, as record owner, more than ten percent of the shares of certain funds within the Invesco Fund Complex, which may implicate the Loan Rule.
On June 20, 2016, the SEC Staff issued a “no-action” letter to another mutual fund complex (see Fidelity Management & Research Company et al., No-Action Letter) related to the audit independence issue described above. In that letter, the SEC confirmed that it would not recommend enforcement action against a fund that relied on audit services performed by an audit firm that was not in compliance with the Loan Rule in certain specified circumstances. In connection with prior independence determinations, PricewaterhouseCoopers LLP communicated, as contemplated by the no-action letter, that it believes that it remains objective and impartial and that a reasonable investor possessing all the facts would conclude that PricewaterhouseCoopers LLP is able to exhibit the requisite objectivity and impartiality to report on the Funds’ financial statements as the independent registered public accounting firm. PricewaterhouseCoopers LLP also represented that it has complied with PCAOB Rule 3526(b)(1) and (2), which are conditions to the Funds relying on the no action letter, and affirmed that it is an independent accountant within the meaning of PCAOB Rule 3520. Therefore, the Adviser, the Funds and PricewaterhouseCoopers LLP concluded that PricewaterhouseCoopers LLP could continue as the Funds’ independent registered public accounting firm. The Invesco Fund Complex relied upon the no-action letter in reaching this conclusion.
If in the future the independence of PricewaterhouseCoopers LLP is called into question under the Loan Rule by circumstances that are not addressed in the SEC’s no-action letter, the Funds will need to take other action in order for the Funds’ filings with the SEC containing financial statements to be deemed compliant with applicable securities laws. Such additional actions could result in additional costs, impair the ability of the Funds to issue new shares or have other material adverse effects on the Funds. In addition, the SEC has indicated that the no-action relief will expire 18 months from its issuance after which the Invesco Funds will no longer be able to rely on the letter unless its term is extended or made permanent by the SEC Staff.
(a) to (d)
Item 4. Principal Accountant Fees and Services
Fees Billed by PWC Related to the Registrant
PWC billed the Registrant aggregate fees for services rendered to the Registrant for the last two fiscal years as follows:
| | | | | | | | |
| | | Fees Billed for
Services
Rendered to the
Registrant for
fiscal year end
2017 | | | Fees Billed for
Services Rendered
to the Registrant
for fiscal year end
2016 | |
Audit Fees | | $ | 280,550 | | | $ | 280,550 | |
Audit-Related Fees(1) | | $ | 23,500 | | | $ | 0 | |
Tax Fees(2) | | $ | 69,075 | | | $ | 81,825 | |
All Other Fees | | $ | 0 | | | $ | 0 | |
| | | | | | | | |
Total Fees | | $ | 373,125 | | | $ | 362,375 | |
(g) PWC billed the Registrant aggregate non-audit fees of $92,575 for the fiscal year ended 2017, and $81,825 for the fiscal year ended 2016, for non-audit services rendered to the Registrant.
| (1) | Audit-Related fees for the fiscal year end 2017 include fees billed for agreed upon procedures for regulatory filings. |
| (2) | Tax fees for the fiscal year end April 30, 2017 includes fees billed for reviewing tax returns and/or services related to tax compliance. Tax fees for fiscal year end April 30, 2016 includes fees billed for reviewing tax returns and/or services related to tax compliance. |
Fees Billed by PWC Related to Invesco and Invesco Affiliates
PWC billed Invesco Advisers, Inc. (“Invesco”), the Registrant’s adviser, and any entity controlling, controlled by or under common control with Invesco that provides ongoing services to the Registrant (“Invesco Affiliates”) aggregate fees for pre-approved non-audit services rendered to Invesco and Invesco Affiliates for the last two fiscal years as follows:
| | | | | | | | |
| | | Fees Billed for
Non-Audit
Services Rendered
to Invesco and
Invesco Affiliates
for fiscal year end
2017 That Were
Required
to be Pre-
Approved
by the Registrant’s
Audit Committee | | | Fees Billed for
Non-Audit
Services Rendered
to Invesco and
Invesco Affiliates
for fiscal year end
2016 That Were
Required
to be Pre-
Approved
by the Registrant’s
Audit Committee | |
Audit-Related Fees | | $ | 635,000 | | | $ | 634,963 | |
Tax Fees | | $ | 0 | | | $ | 0 | |
All Other Fees | | $ | 2,827,000 | | | $ | 3,750,000 | |
| | | | | | | | |
Total Fees(1) | | $ | 3,462,000 | | | $ | 4,384,963 | |
| (1) | Audit-Related fees for the year end 2017 include fees billed related to reviewing controls at a service organization. Audit-Related fees for the year end 2016 include fees billed related to reviewing controls at a service organization. |
All other fees for the year end 2017 include fees billed related to the identification of structural and organizational alternatives, informed by industry practices, for certain of the company’s administrative activities and functions. All other fees for the year end 2016 include fees billed related to reviewing the operating effectiveness of strategic projects.
(e)(2) There were no amounts that were pre-approved by the Audit Committee pursuant to the de minimis exception under Rule 2-01 of Regulation S-X.
(g) Including the fees for services not required to be pre-approved by the registrant’s audit committee, PWC billed Invesco and Invesco Affiliates aggregate non-audit fees of $6,075,000 for the fiscal year ended April 30, 2017, and $8,160,000 for the fiscal year ended April 30, 2016, for non-audit services rendered to Invesco and Invesco Affiliates.
PWC provided audit services to the Investment Company complex of approximately $22 million.
(h) The Audit Committee also has considered whether the provision of non-audit services that were rendered to Invesco and Invesco Affiliates that were not required to be pre-approved pursuant to SEC regulations, if any, is compatible with maintaining PWC’s independence.
(f) Not applicable.
(e)(1)
PRE-APPROVAL OF AUDIT AND NON-AUDIT SERVICES
POLICIES AND PROCEDURES
As adopted by the Audit Committees
of the Invesco Funds (the “Funds”)
Last Amended May 4, 2016
| | I. | Statement of Principles |
The Audit Committees (the “Audit Committee”) of the Boards of Trustees of the Funds (the “Board”) have adopted these policies and procedures (the “Procedures”) with respect to the pre-approval of audit and non-audit services to be provided by the Funds’ independent auditor (the “Auditor”) to the Funds, and to the Funds’ investment adviser(s) and any entity controlling, controlled by, or under common control with the investment adviser(s) that provides ongoing services to the Funds (collectively, “Service Affiliates”).
Under Section 202 of the Sarbanes-Oxley Act of 2002, all audit and non-audit services provided to the Funds by the Auditor must be preapproved by the Audit Committee. Rule 2-01 of Regulation S-X requires that the Audit Committee also pre-approve a Service Affiliate’s engagement of the Auditor for non-audit services if the engagement relates directly to the operations and financial reporting of the Funds (a “Service Affiliate’s Covered Engagement”).
These Procedures set forth the procedures and the conditions pursuant to which the Audit Committee may pre-approve audit and non-audit services for the Funds and a Service Affiliate’s Covered Engagement pursuant to rules and regulations of the Securities and Exchange Commission (“SEC”) and other organizations and regulatory bodies applicable to the Funds (“Applicable Rules”).1 They address both general pre-approvals without consideration of specific case-by-case services (“general pre-approvals”) and pre-approvals on a case-by-case basis (“specific pre-approvals”). Any services requiring pre-approval that are not within the scope of general pre-approvals hereunder are subject to specific pre-approval. These Procedures also address the delegation by the Audit Committee of pre-approval authority to the Audit Committee Chair or Vice Chair.
| | II. | Pre-Approval of Fund Audit Services |
The annual Fund audit services engagement, including terms and fees, is subject to specific pre-approval by the Audit Committee. Audit services include the annual financial statement audit and other procedures required to be performed by an independent auditor to be able to form an opinion on the Funds’ financial statements. The Audit Committee will receive, review and consider sufficient information concerning a proposed Fund audit engagement to make a reasonable evaluation of the Auditor’s qualifications and independence. The Audit Committee will oversee the Fund audit services engagement as necessary, including approving any changes in terms, audit scope, conditions and fees.
In addition to approving the Fund audit services engagement at least annually and specifically approving any changes, the Audit Committee may generally or specifically pre-approve engagements for other audit services, which are those services that only an independent auditor reasonably can provide. Other audit services may include services associated with SEC registration statements, periodic reports and other documents filed with the SEC.
| 1 | Applicable Rules include, for example, New York Stock Exchange (“NYSE”) rules applicable to closed-end funds managed by Invesco and listed on NYSE. |
| | III. | General and Specific Pre-Approval of Non-Audit Fund Services |
The Audit Committee will consider, at least annually, the list of General Pre-Approved Non-Audit Services which list may be terminated or modified at any time by the Audit Committee. To inform the Audit Committee’s review and approval of General Pre-Approved Non-Audit Services, the Funds’ Treasurer (or his or her designee) and Auditor shall provide such information regarding independence or other matters as the Audit Committee may request.
Any services or fee ranges that are not within the scope of General Pre-Approved Non-Audit Services have not received general pre-approval and require specific pre-approval. Each request for specific pre-approval by the Audit Committee for services to be provided by the Auditor to the Funds must be submitted to the Audit Committee by the Funds’ Treasurer (or his or her designee) and must include detailed information about the services to be provided, the fees or fee ranges to be charged, and other relevant information sufficient to allow the Audit Committee to consider whether to pre-approve such engagement, including evaluating whether the provision of such services will impair the independence of the Auditor and is otherwise consistent with Applicable Rules.
| | IV. | Non-Audit Service Types |
The Audit Committee may provide either general or specific pre-approval of audit-related, tax or other services, each as described in more detail below.
“Audit-related services” are assurance and related services that are reasonably related to the performance of the audit or review of the Fund’s financial statements or that are traditionally performed by an independent auditor. Audit-related services include, among others, accounting consultations related to accounting, financial reporting or disclosure matters not classified as “Audit services”; assistance with understanding and implementing new accounting and financial reporting guidance from rulemaking authorities; services related to mergers, acquisitions or dispositions; compliance with ratings agency requirements and interfund lending activities; and assistance with internal control reporting requirements.
“Tax services” include, but are not limited to, the review and signing of the Funds’ federal tax returns, the review of required distributions by the Funds and consultations regarding tax matters such as the tax treatment of new investments or the impact of new regulations. The Audit Committee will not approve proposed services of the Auditor which the Audit Committee believes are to be provided in connection with a service or transaction initially recommended by the Auditor, the sole business purpose of which may be tax avoidance and the tax treatment of which may not be supported in the Internal Revenue Code and related regulations. The Audit Committee will consult with the Funds’ Treasurer (or his or her designee) and may consult with outside counsel or advisers as necessary to ensure the consistency of tax services rendered by the Auditor with the foregoing policy. The Auditor shall not represent any Fund or any Service Affiliate before a tax court, district court or federal court of claims.
Each request to provide tax services under either the general or specific pre-approval of the Audit Committee will include a description from the Auditor in writing of (i) the scope of the service, the fee structure for the engagement, and any side letter or other amendment to the engagement letter, or any other agreement (whether oral, written, or otherwise) between the Auditor and the Funds, relating to the service; and (ii) any compensation arrangement or other agreement, such as a referral agreement, a referral fee or fee-sharing arrangement, between the Auditor (or an affiliate of the Auditor) and any person (other than the Funds or Service Affiliates receiving the services) with respect to the promoting, marketing, or recommending of a transaction covered by the service. The Auditor will also discuss with
the Audit Committee the potential effects of the services on the independence of the Auditor, and document the substance of its discussion with the Audit Committee.
The Audit Committee may pre-approve other non-audit services so long as the Audit Committee believes that the service will not impair the independence of the Auditor. Appendix I includes a list of services that the Auditor is prohibited from performing by the SEC rules. Appendix I also includes a list of services that would impair the Auditor’s independence unless the Audit Committee reasonably concludes that the results of the services will not be subject to audit procedures during an audit of the Funds’ financial statements.
| | V. | Pre-Approval of Service Affiliate’s Covered Engagements |
Rule 2-01 of Regulation S-X requires that the Audit Committee pre-approve a Service Affiliate’s engagement of the Auditor for non-audit services if the engagement relates directly to the operations and financial reporting of the Funds, defined above as a “Service Affiliate’s Covered Engagement”.
The Audit Committee may provide either general or specific pre-approval of any Service Affiliate’s Covered Engagement, including for audit-related, tax or other services, as described above, if the Audit Committee believes that the provision of the services to a Service Affiliate will not impair the independence of the Auditor with respect to the Funds. Any Service Affiliate’s Covered Engagements that are not within the scope of General Pre-Approved Non-Audit Services have not received general pre-approval and require specific pre-approval.
Each request for specific pre-approval by the Audit Committee of a Service Affiliate’s Covered Engagement must be submitted to the Audit Committee by the Funds’ Treasurer (or his or her designee) and must include detailed information about the services to be provided, the fees or fee ranges to be charged, a description of the current status of the pre-approval process involving other audit committees in the Invesco investment company complex (as defined in Rule 2-201 of Regulation S-X) with respect to the proposed engagement, and other relevant information sufficient to allow the Audit Committee to consider whether the provision of such services will impair the independence of the Auditor from the Funds. Additionally, the Funds’ Treasurer (or his or her designee) and the Auditor will provide the Audit Committee with a statement that the proposed engagement requires pre-approval by the Audit Committee, the proposed engagement, in their view, will not impair the independence of the Auditor and is consistent with Applicable Rules, and the description of the proposed engagement provided to the Audit Committee is consistent with that presented to or approved by the Invesco audit committee.
Information about all Service Affiliate engagements of the Auditor for non-audit services, whether or not subject to pre-approval by the Audit Committee, shall be provided to the Audit Committee at least quarterly, to allow the Audit Committee to consider whether the provision of such services is compatible with maintaining the Auditor’s independence from the Funds. The Funds’ Treasurer and Auditor shall provide the Audit Committee with sufficiently detailed information about the scope of services provided and the fees for such services, to ensure that the Audit Committee can adequately consider whether the provision of such services is compatible with maintaining the Auditor’s independence from the Funds.
| | VI. | Pre-Approved Fee Levels or Established Amounts |
Pre-approved fee levels or ranges for audit and non-audit services to be provided by the Auditor to the Funds, and for a Service Affiliate’s Covered Engagement, under general pre-approval or specific pre-approval will be set periodically by the Audit Committee. Any proposed fees exceeding 110% of the maximum pre-approved fee levels or ranges for such services or engagements will be promptly presented
to the Audit Committee and will require specific pre-approval by the Audit Committee before payment of any additional fees is made.
The Audit Committee may from time to time delegate specific pre-approval authority to its Chair and/or Vice Chair, so that the Chair or, in his or her absence, Vice Chair may grant specific pre-approval for audit and non-audit services by the Auditor to the Funds and/or a Service Affiliate’s Covered Engagement between Audit Committee meetings. Any such delegation shall be reflected in resolutions adopted by the Audit Committee and may include such limitations as to dollar amount(s) and/or scope of service(s) as the Audit Committee may choose to impose. Any such delegation shall not preclude the Chair or Vice Chair from declining, on a case by case basis, to exercise his or her delegated authority and instead convening the Audit Committee to consider and pre-approve any proposed services or engagements.
Notwithstanding the foregoing, any non-audit services to be provided to the Funds for which the fees are estimated to exceed $500,000 and any Service Affiliate’s Covered Engagement for which the fees are estimated to exceed $500,000 must be pre-approved by the Audit Committee and may not be delegated to the Chair or Vice Chair.
| | VIII. | Compliance with Procedures |
Notwithstanding anything herein to the contrary, failure to pre-approve any services or engagements that are not required to be pre-approved pursuant to the de minimis exception provided for in Rule 2-01(c)(7)(i)(C) of Regulation S-X shall not constitute a violation of these Procedures. The Audit Committee has designated the Funds’ Treasurer to ensure services and engagements are pre-approved in compliance with these Procedures. The Funds’ Treasurer will immediately report to the Chair of the Audit Committee, or the Vice Chair in his or her absence, any breach of these Procedures that comes to the attention of the Funds’ Treasurer or any services or engagements that are not required to be pre-approved pursuant to the de minimis exception provided for in Rule 2-01(c)(7)(i)(C) of Regulation S-X.
On at least an annual basis, the Auditor will provide the Audit Committee with a summary of all non-audit services provided to any entity in the investment company complex (as defined in section 2-01(f)(14) of Regulation S-X, including the Funds and Service Affiliates) that were not pre-approved, including the nature of services provided and the associated fees.
| | IX. | Amendments to Procedures |
All material amendments to these Procedures must be approved in advance by the Audit Committee. Non-material amendments to these Procedures may be made by the Legal and Compliance Departments and will be reported to the Audit Committee at the next regularly scheduled meeting of the Audit Committee.
Appendix I
Non-Audit Services That May Impair the Auditor’s Independence
The Auditor is not independent if, at any point during the audit and professional engagement, the Auditor provides the following non-audit services:
| | • | | Broker-dealer, investment adviser, or investment banking services; |
| | • | | Expert services unrelated to the audit; |
| | • | | Any service or product provided for a contingent fee or a commission; |
| | • | | Services related to marketing, planning, or opining in favor of the tax treatment of confidential transactions or aggressive tax position transactions, a significant purpose of which is tax avoidance; |
| | • | | Tax services for persons in financial reporting oversight roles at the Fund; and |
| | • | | Any other service that the Public Company Oversight Board determines by regulation is impermissible. |
An Auditor is not independent if, at any point during the audit and professional engagement, the Auditor provides the following non-audit services unless it is reasonable to conclude that the results of the services will not be subject to audit procedures during an audit of the Funds’ financial statements:
| | • | | Bookkeeping or other services related to the accounting records or financial statements of the audit client; |
| | • | | Financial information systems design and implementation; |
| | • | | Appraisal or valuation services, fairness opinions, or contribution-in-kind reports; |
| | • | | Actuarial services; and |
| | • | | Internal audit outsourcing services. |
| ITEM 5. | AUDIT COMMITTEE OF LISTED REGISTRANTS. |
Not applicable.
| ITEM 6. | SCHEDULE OF INVESTMENTS. |
Investments in securities of unaffiliated issuers is included as part of the reports to stockholders filed under Item 1 of this Form.
| ITEM 7. | DISCLOSURE OF PROXY VOTING POLICIES AND PROCEDURES FOR CLOSED-END MANAGEMENT INVESTMENT COMPANIES. |
Not applicable.
| ITEM 8. | PORTFOLIO MANAGERS OF CLOSED-END MANAGEMENT COMPANIES. |
Not applicable.
| ITEM 9. | PURCHASES OF EQUITY SECURITIES BY CLOSED-END MANAGEMENT INVESTMENT COMPANY AND AFFILIATED PURCHASERS. |
Not applicable.
| ITEM 10. | SUBMISSION OF MATTERS TO A VOTE OF SECURITY HOLDERS. |
None
| ITEM 11. | CONTROLS AND PROCEDURES. |
| (a) | As of May 19, 2017, an evaluation was performed under the supervision and with the participation of the officers of the Registrant, including the PEO and PFO, to assess the effectiveness of the Registrant’s disclosure controls and procedures, as that term is defined in Rule 30a-3(c) under the Investment Company Act of 1940 (the “Act”), as amended. Based on that evaluation, the Registrant’s officers, including the PEO and PFO, concluded that, as of May 19, 2017, the Registrant’s disclosure controls and procedures were reasonably designed to ensure: (1) that information required to be disclosed by the Registrant on Form N-CSR is recorded, processed, summarized and reported within the time periods specified by the rules and forms of the Securities and Exchange Commission; and (2) that material information relating to the Registrant is made known to the PEO and PFO as appropriate to allow timely decisions regarding required disclosure. |
| (b) | There have been no changes in the Registrant’s internal control over financial reporting (as defined in Rule 30a-3(d) under the Act) that occurred during the second fiscal quarter of the period covered by this report that have materially affected, or are reasonably likely to materially affect, the Registrant’s internal control over financial reporting. |
| | |
| 12(a) (1) | | Code of Ethics. |
| |
| 12(a) (2) | | Certifications of principal executive officer and principal financial officer as required by Rule 30a-2(a) under the Investment Company Act of 1940. |
| |
| 12(a) (3) | | Not applicable. |
| |
| 12(b) | | Certifications of principal executive officer and principal financial officer as required by Rule 30a-2(b) under the Investment Company Act of 1940. |
SIGNATURES
Pursuant to the requirements of the Securities Exchange Act of 1934 and the Investment Company Act of 1940, the Registrant has duly caused this report to be signed on its behalf by the undersigned, thereunto duly authorized.
Registrant: AIM Sector Funds (Invesco Sector Funds)
| | |
| By: | | /s/ Sheri Morris |
| | Sheri Morris |
| | Principal Executive Officer |
| |
| Date: | | July 7, 2017 |
Pursuant to the requirements of the Securities and Exchange Act of 1934 and the Investment Company Act of 1940, this report has been signed below by the following persons on behalf of the Registrant and in the capacities and on the dates indicated.
| | |
| By: | | /s/ Sheri Morris |
| | Sheri Morris |
| | Principal Executive Officer |
| |
| Date: | | July 7, 2017 |
| | |
| By: | | /s/ Kelli Gallegos |
| | Kelli Gallegos |
| | Principal Financial Officer |
| |
| Date: | | July 7, 2017 |
EXHIBIT INDEX
| | |
| 12(a) (1) | | Code of Ethics. |
| |
| 12(a) (2) | | Certifications of principal executive officer and principal financial officer as required by Rule 30a-2(a) under the Investment Company Act of 1940. |
| |
| 12(a) (3) | | Not applicable. |
| |
| 12(b) | | Certifications of principal executive officer and principal financial officer as required by Rule 30a-2(b) under the Investment Company Act of 1940. |