UNITED STATES
SECURITIES AND EXCHANGE COMMISSION
Washington, D.C. 20549
FORMN-CSR
CERTIFIED SHAREHOLDER REPORT OF REGISTERED
MANAGEMENT INVESTMENT COMPANIES
Investment Company Act file number811-03826
AIM Sector Funds (Invesco Sector Funds)
(Exact name of registrant as specified in charter)
11 Greenway Plaza, Suite 1000 Houston, Texas 77046
(Address of principal executive offices) (Zip code)
Sheri Morris 11 Greenway Plaza, Suite 1000 Houston, Texas 77046
(Name and address of agent for service)
Registrant’s telephone number, including area code: (713)626-1919
Date of fiscal year end: 04/30
Date of reporting period: 04/30/19
Item 1. Report to Stockholders.
| Annual Report to Shareholders | April 30, 2019 |
Invesco American Value Fund
Nasdaq:
A: MSAVX ■ C: MSVCX ■ R: MSARX ■ Y: MSAIX ■ R5: MSAJX ■ R6: MSAFX

Beginning on January 1, 2021, as permitted by regulations adopted by the Securities and Exchange Commission, paper copies of the Fund’s shareholder reports will no longer be sent by mail, unless you specifically request paper copies of the reports from the Fund or from your financial intermediary, such as a broker-dealer or bank. Instead, the reports will be made available on the Fund’s website, and you will be notified by mail each time a report is posted and provided with a website link to access the report.
If you already elected to receive shareholder reports electronically, you will not be affected by this change and you need not take any action. You may elect to receive shareholder reports and other communications from the Fund electronically by contacting your financial intermediary (such as a broker-dealer or bank) or, if you are a direct investor, by enrolling at invesco.com/edelivery.
You may elect to receive all future reports in paper free of charge. If you invest through a financial intermediary, you can contact your financial intermediary to request that you continue to receive paper copies of your shareholder reports. If you invest directly with the Fund, you can call (800) 959-4246 to let the Fund know you wish to continue receiving paper copies of your shareholder reports. Your election to receive reports in paper will apply to all funds held with your financial intermediary or all funds held with the fund complex if you invest directly with the Fund.
Dear Shareholders:
This annual report includes information about your Fund, including performance data and a complete list of its investments as of the close of the reporting period. Inside is a discussion of how your Fund was managed and the factors that affected its performance during the reporting period.
Philip Taylor, whose messages to shareholders have appeared here for the last 13 years, transitioned to a senior advisory role on March 1, prior to his retirement at the end of the year, and I assumed his role as Head of the Americas and Senior Managing Director, Invesco Ltd. All of us at Invesco are indebted to Phil for his many years of dedicated service to the company and to its funds’ shareholders. I’m excited about this new opportunity, and I look forward to communicating with fund shareholders going forward.
Investor sentiment during the reporting period ranged from elation to fear, notably in the fourth quarter of 2018. Amid corporate tax cuts and improving global growth, several US equity indexes redefined highs during the first half of the reporting period. The exuberance, however, ended in October as global equities, in particular US stocks, sold off, with the sharpest decline in December of 2018. The catalyst for the sell-off was a combination of ongoing trade concerns between the US and China, fears of a global economic slowdown and lower oil prices from a supply glut. Gains posted earlier in the year for global equities were erased, while US Treasury bonds, along with government and municipal bonds, rallied as investors fled to “safe haven” assets. The reporting period ended on a positive note, however, as global equities bounced back strongly at the outset of 2019, with the US stock market reaching new highs by the period end. Given the strong economy during the reporting period, the US Federal Reserve (the Fed) raised the federal funds rate three times. At its December 2018 meeting, however, the Fed delivered a more “dovish stance” by simultaneously raising rates while reducing guidance for 2019 rate increases. As the fiscal year ended, the Fed had thus far left rates unchanged in 2019. As 2019 unfolds, we’ll see how the interplay of interest rates, economic data, geopolitics and a host of other factors affect US and overseas equity and fixed income markets.
Investor uncertainty and market volatility, such as we witnessed during the reporting period, are unfortunate facts of life when it comes to investing. That’s why Invesco encourages investors to work with a professional financial adviser who can stress the importance of starting to save and invest early and the importance of adhering to a disciplined investment plan. A financial adviser who knows your unique financial situation, investment goals and risk tolerance can be an invaluable partner as you seek to achieve your financial goals. He or she can offer a long-term perspective when markets are volatile and time-tested advice and guidance when your financial situation or investment goals change.
Visit our website for more information on your investments
Our website, invesco.com/us, offers a wide range of market insights and investment perspectives. On the website, you’ll find detailed information about our funds, including performance, holdings and portfolio manager commentaries. You can access information about your account by completing a simple, secure online registration. To do so, select “Log In” on the right side of the homepage, and then select “Register for Individual Account Access.”
In addition to the resources accessible on our website and through our mobile app, you can obtain timely updates to help you stay informed about the markets and the economy by connecting with Invesco on Twitter, LinkedIn or Facebook. You can access our blog at blog.invesco.us.com. Our goal is to provide you the information you want, when and where you want it.
Finally, I’m pleased to share with you Invesco’s commitment to both the Principles for Responsible Investment and to considering environmental, social and governance issues in our robust investment process. I invite you to learn more at invesco.com/esg.
Have questions?
For questions about your account, contact an Invesco client services representative at 800 959 4246.
All of us at Invesco look forward to serving your investment management needs. Thank you for investing with us.
Sincerely,
Andrew Schlossberg
Head of the Americas,
Senior Managing Director, Invesco Ltd.
| 2 | Invesco American Value Fund |
Dear Shareholders:
Among the many important lessons I’ve learned in more than 40 years in a variety of business endeavors is the value of a trusted advocate.
As independent chair of the Invesco Funds Board, I can assure you that the members of the Board are strong advocates for the interests of investors in Invesco’s mutual funds. We work hard to represent your interests through oversight of the quality of the investment management services your funds receive and other matters important to your investment, including but not limited to:
| ■ | Ensuring that Invesco offers a diverse lineup of mutual funds that your financial adviser can use to strive to meet your financial needs as your investment goals change over time. |
| ■ | Monitoring how the portfolio management teams of the Invesco funds are performing in light of changing economic and market conditions. |
| ■ | Assessing each portfolio management team’s investment performance within the context of the investment strategy described in the fund’s prospectus. |
| ■ | Monitoring for potential conflicts of interests that may impact the nature of the services that your funds receive. |
We believe one of the most important services we provide our fund shareholders is the annual review of the funds’ advisory and sub-advisory contracts with Invesco Advisers and its affiliates. This review is required by the Investment Company Act of 1940 and focuses on the nature and quality of the services Invesco provides as the adviser to the Invesco funds and the reasonableness of the fees that it charges for those services. Each year, we spend months carefully reviewing information received from Invesco and a variety of independent sources, such as performance and fee data prepared by Lipper, Inc. (a subsidiary of Broadridge Financial Solutions, Inc.), an independent, third-party firm widely recognized as a leader in its field. We also meet with our independent legal counsel and other independent advisers to review and help us assess the information that we have received. Our goal is to assure that you receive quality investment management services for a reasonable fee.
I trust the measures outlined above provide assurance that you have a worthy advocate when it comes to choosing the Invesco Funds.
As always, please contact me at bruce@brucecrockett.com with any questions or concerns you may have. On behalf of the Board, we look forward to continuing to represent your interests and serving your needs.
Sincerely,
Bruce L. Crockett
Independent Chair
Invesco Funds Board of Trustees
| 3 | Invesco American Value Fund |
Management’s Discussion of Fund Performance
Performance summary
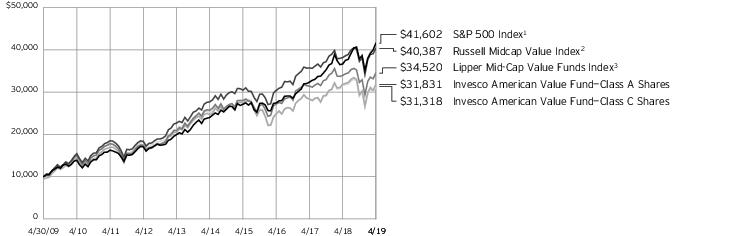
For the fiscal year ended April 30, 2019, Class A shares of Invesco American Value Fund (the Fund), at net asset value (NAV), underperformed the Russell Midcap Value Index, the Fund’s style-specific benchmark.
Your Fund’s long-term performance appears later in this report.
Fund vs. Indexes
Total returns, April 30, 2018 to April 30, 2019, at net asset value (NAV). Performance shown does not include applicable contingent deferred sales charges (CDSC) or front-end sales charges, which would have reduced performance.
| Class A Shares | –0.03% |
| Class C Shares | –0.77 |
| Class R Shares | –0.28 |
| Class Y Shares | 0.21 |
| Class R5 Shares | 0.27 |
| Class R6 Shares | 0.37 |
| S&P 500 Index▼ (Broad Market Index) | 13.49 |
Russell Midcap Value Index■
(Style-Specific Index) | 5.76 |
Lipper Mid-Cap Value Funds Index♦
(Peer Group Index) | 1.69 |
| Source(s):▼FactSet Research Systems Inc.;■ RIMES Technologies Corp.;♦ Lipper Inc. |
monetary policy. The Fed’s more accommodative stance provided a supportive environment for equities and fixed income, even as US economic data were mixed and overseas growth appeared to be slowing. By the end of the fiscal year, the US equity market generally recovered the losses from fourth quarter 2018, backed by improving investor sentiment, low unemployment and a growing economy.
Within the Russell Midcap Value Index, eight out of 11 sectors had positive returns for the fiscal year, with utilities and real estate leading the way. Energy was the worst-performing sector in the Fund’s style-specific benchmark with a decline of approximately 15%. The materials and consumer discretionary sectors also had losses during the fiscal year.
Security selection in the health care sector was the largest detractor from the Fund’s performance relative to the style-specific benchmark. Key detractors within the sector includedMylan,DaVita andCentene. Along with other generic and specialty pharmaceutical companies, Mylan faced negative headlines regarding potential drug pricing legislation and investigations into drug price collusion. A number of company-specific headwinds also impacted Mylan, including delays in approval for its generic asthma treatment and an FDA warning letter for one of its manufacturing facilities, resulting in remediation expenses and production delays. DaVita’s shares came under pressure due to weaker-than-anticipated organic growth. In addition, the company’s sale of its medical group business to United Healthcare (not a Fund holding), while positive in our view, was renegotiated lower, adding to DaVita’s share price weakness. Managed care provider
Market conditions and your Fund
The fiscal year proved to be an increasingly volatile time for US equities. Throughout the summer, US equities moved higher as corporate profits surged amid the benefit of corporate tax cuts and improving global economic growth. Several US equity indexes reached new highs despite potential headwinds, including trade tensions, tariff announcements and contagion concerns over a Turkish currency crisis. After a relatively quiet summer, market volatility noticeably rose in October 2018, as US equity markets suffered a sharp sell-off through year-end 2018, amid ongoing trade concerns between the US and China, fears of a global economic slowdown and lower oil prices from a supply glut, with oil prices plummeting from near $75 per barrel in early October 2018 to around $45 per barrel
| Portfolio Composition |
| By sector | % of total net assets |
| Financials | 25.54% |
| Industrials | 11.85 |
| Consumer Discretionary | 11.35 |
| Information Technology | 10.42 |
| Health Care | 9.72 |
| Energy | 8.20 |
| Real Estate | 6.40 |
| Materials | 6.06 |
| Utilities | 4.15 |
| Consumer Staples | 2.85 |
| Communication Services | 1.56 |
| Money Market Funds Plus Other Assets Less Liabilities | 1.90 |
in late December 2018.1 In this environment, investors fled to US Treasuries and defensive areas of the markets, such as health care and utilities.
Given signs of a strong economy, the US Federal Reserve (the Fed) raised interest rates three times during the fiscal year: in June, September and December 2018. Following December’s Fed meeting, the Fed raised interest rates by 25 basis points to a targeted range of 2.25% to 2.50%, which signaled a slightly more dovish stance than expected.2 In contrast, the European Central Bank and central banks in several other countries maintained extraordinarily accommodative monetary policies.
Equity markets rebounded at the start of 2019, fueled by optimism about a potential US-China trade deal and the Fed’s indication that there would be no interest rate hikes in 2019, a surprising shift in
| Top 10 Equity Holdings* |
| % of total net assets |
| 1. | Royal Caribbean Cruises Ltd. | 3.37% |
| 2. | Centene Corp. | 2.87 |
| 3. | Willis Towers Watson PLC | 2.85 |
| 4. | Arthur J. Gallagher & Co. | 2.80 |
| 5. | Zions Bancorp. N.A. | 2.78 |
| 6. | Johnson Controls International PLC | 2.64 |
| 7. | FirstEnergy Corp. | 2.58 |
| 8. | Encompass Health Corp. | 2.56 |
| 9. | Teradata Corp. | 2.53 |
| 10. | Voya Financial, Inc. | 2.53 |
| Total Net Assets | $1.2 billion |
| Total Number of Holdings* | 46 |
| The Fund’s holdings are subject to change, and there is no assurance that the Fund will continue to hold any particular security. |
| *Excluding money market fund holdings. |
| Data presented here are as of April 30, 2019. |
| 4 | Invesco American Value Fund |
Centene faced headwinds related to continued uncertainty about the Affordable Care Act. In addition, the company’s stock traded lower following the March announcement of its acquisition of WellCare Health Plans (not a Fund holding) for approximately $17 billion, a significant premium. We continued to hold these stocks at the end of the fiscal year.
Security selection in and overweight allocation to the energy sector was another key detractor from the Fund’s performance relative to the style-specific benchmark during the fiscal year. Oil prices were volatile during the fiscal year, reaching multiyear highs in October and declining sharply by the end of December, only to recover again in 2019. Energy stock prices mirrored this volatility with a number of the Fund’s largest detractors, such asNoble Energy andTechnipFMC, coming from this sector.
Security selection in the industrials sector also detracted from the Fund’s performance relative to the style-specific benchmark during the fiscal year due in large part toTextron, an industrial conglomerate primarily focused on aerospace and defense related business lines, including Cessna jets and Bell helicopters. Shares of the company fell sharply in October after it reported revenue declines across a number of its business units. We maintained our position in Textron at the end of the fiscal year as we believe that continued recovery in business jet demand should drive margin expansion within the company’s largest business segment.
The Fund’s material underweight exposure to defensive areas, namely utilities and real estate, also detracted from the Fund’s returns relative to the style-specific benchmark as these were the best-performing sectors within Russell Midcap Value Index for the fiscal year.
Stock selection in the information technology sector was the largest contributor to the Fund’s performance relative to the style-specific benchmark. Within the sector, hardware and equipment companiesCiena,Keysight Technologies andARRIS International were top contributors. Both Ciena and Keysight reported stronger-than-expected earnings throughout the fiscal year, which boosted shares. In November, CommScope (not a Fund holding) announced it was acquiring ARRIS for a roughly 30% premium to the company’s share price. We sold the stock following the announcement.
Stock selection in the consumer discretionary sector was another contributor to
the Fund’s performance relative to the style-specific benchmark for the fiscal year. A strong contributor within the sector wasAdvance Auto Parts. The company’s turnaround initiatives resulted in stronger-than-expected earnings for much of the fiscal year and we trimmed our position in the company based on strength in the stock.
Security selection in the communication services sector also contributed to the Fund’s performance relative to the style-specific benchmark for the fiscal year due toDun & Bradstreet. In August 2018, the company entered into an acquisition deal with a group of investors to take the company private. The deal represented a premium to the company’s shares and was finalized in February 2019.
During the fiscal year, we increased our exposure to the consumer staples, utilities and communication services sectors and decreased our exposure to the energy and financials sectors. At the end of the fiscal year, the Fund’s largest overweight allocations relative to the style-specific benchmark were in the financials and health care sectors, while the largest underweight allocations were in the utilities and real estate sectors.
Market volatility increased significantly during the fiscal year, and we believe it may continue given the potential for slowing economic growth and uncertainty around US imposed tariffs on trade. We believe market volatility creates opportunities to invest in companies with attractive valuations and strong fundamentals. We believe that ultimately those valuations and fundamentals will be reflected in those companies’ stock prices.
As always, we are committed to working to achieve positive returns for the Fund’s shareholders through an entire market cycle. Thank you for your continued investment in Invesco American Value Fund.
1 Source: Bloomberg
2 Source: US Federal Reserve
The views and opinions expressed in management’s discussion of Fund performance are those of Invesco Advisers, Inc. These views and opinions are subject to change at any time based on factors such as market and economic conditions. These views and opinions may not be relied upon as investment advice or recommendations, or as an offer for a particular security. The information is not a complete analysis of every aspect of any market, country, industry, security or the Fund. Statements of fact are from sources considered reliable, but Invesco Advisers, Inc. makes no representation or warranty as to their completeness or accuracy. Although historical
performance is no guarantee of future results, these insights may help you understand our investment management philosophy.
See important Fund and, if applicable, index disclosures later in this report.
Jeffrey Vancavage
Chartered Financial Analyst, Portfolio Manager, is lead manager of Invesco American Value Fund. He joined Invesco in 2016. Mr. Vancavage earned a BS in aeronautical science from Embry-Riddle Aeronautical University and an MBA from the University of Florida.
| 5 | Invesco American Value Fund |
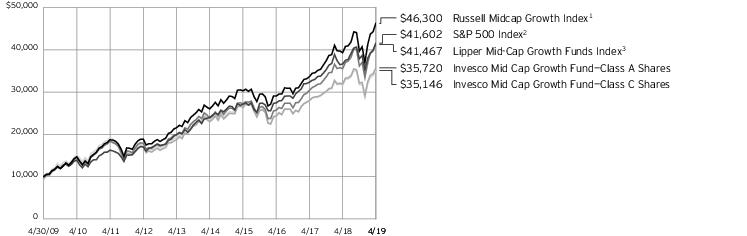
Your Fund’s Long-Term Performance
Results of a $10,000 Investment — Oldest Share Class(es)
Fund and index data from 4/30/09
| 1 | Source: FactSet Research Systems Inc. |
| 2 | Source: RIMES Technologies Corp. |
| 3 | Source: Lipper Inc. |
Past performance cannot guarantee comparable future results.
The data shown in the chart include reinvested distributions, applicable sales charges and Fund expenses including
management fees. Index results include reinvested dividends, but they do not reflect sales charges. Performance of the peer group, if applicable, reflects fund expenses and management fees; perfor-
mance of a market index does not. Performance shown in the chart and table(s) does not reflect deduction of taxes a shareholder would pay on Fund distributions or sale of Fund shares.
| 6 | Invesco American Value Fund |
| Average Annual Total Returns |
| As of 4/30/19, including maximum applicable sales charges |
| Class A Shares | |
| Inception (10/18/93) | 8.93% |
| 10 Years | 12.28 |
| 5 Years | 4.03 |
| 1 Year | –5.53 |
| Class C Shares | |
| Inception (10/18/93) | 8.87% |
| 10 Years | 12.09 |
| 5 Years | 4.45 |
| 1 Year | –1.63 |
| Class R Shares | |
| Inception (3/20/07) | 6.37% |
| 10 Years | 12.63 |
| 5 Years | 4.95 |
| 1 Year | –0.28 |
| Class Y Shares | |
| Inception (2/7/06) | 7.78% |
| 10 Years | 13.19 |
| 5 Years | 5.47 |
| 1 Year | 0.21 |
| Class R5 Shares | |
| 10 Years | 13.29% |
| 5 Years | 5.58 |
| 1 Year | 0.27 |
| Class R6 Shares | |
| 10 Years | 13.24% |
| 5 Years | 5.67 |
| 1 Year | 0.37 |
Effective June 1, 2010, Class A, Class C, Class I and Class R shares of the predecessor fund, Van Kampen American Value Fund, advised by Van Kampen Asset Management were reorganized into Class A, Class C, Class Y and Class R shares, respectively, of Invesco Van Kampen American Value Fund (renamed Invesco American Value Fund). Returns shown above, prior to June 1, 2010, for Class A, Class C, Class R and Class Y shares are blended returns of the predecessor fund and Invesco American Value Fund. Share class returns will differ from the predecessor fund because of different expenses. Class R5 shares incepted on June 1, 2010. Performance shown prior to that date is that of the predecessor fund’s Class A shares and includes the 12b-1 fees applicable to Class A shares.
Class R5 shares incepted on June 1, 2010. Performance shown prior to that date is that of the predecessor fund’s Class A shares and includes the 12b-1 fees applicable to Class A shares.
| Average Annual Total Returns |
| As of 3/31/19, the most recent calendar quarter end, including maximum applicable sales charges |
| Class A Shares | |
| Inception (10/18/93) | 8.77% |
| 10 Years | 13.32 |
| 5 Years | 2.89 |
| 1 Year | –7.58 |
| Class C Shares | |
| Inception (10/18/93) | 8.71% |
| 10 Years | 13.13 |
| 5 Years | 3.30 |
| 1 Year | –3.74 |
| Class R Shares | |
| Inception (3/20/07) | 6.03% |
| 10 Years | 13.68 |
| 5 Years | 3.80 |
| 1 Year | –2.42 |
| Class Y Shares | |
| Inception (2/7/06) | 7.46% |
| 10 Years | 14.24 |
| 5 Years | 4.31 |
| 1 Year | –1.95 |
| Class R5 Shares | |
| 10 Years | 14.34% |
| 5 Years | 4.43 |
| 1 Year | –1.86 |
| Class R6 Shares | |
| 10 Years | 14.29% |
| 5 Years | 4.52 |
| 1 Year | –1.77 |
Class R6 shares incepted on September 24, 2012. Performance shown prior to that date is that of the Fund’s and the predecessor fund’s Class A shares and includes the 12b-1 fees applicable to Class A shares.
The performance data quoted represent past performance and cannot guarantee comparable future results; current performance may be lower or higher. Please visit invesco.com/performance for the most recent month-end performance. Performance figures reflect reinvested distributions, changes in net asset value and the effect of the maximum sales charge unless otherwise stated. Investment return and principal value will fluctuate so that you may have a gain or loss when you sell shares.
The total annual Fund operating expense ratio set forth in the most recent Fund prospectus as of the date of this report for Class A, Class C, Class R, Class Y, Class R5 and Class R6 shares was 1.19%, 1.92%, 1.44%, 0.94%, 0.86% and 0.77%, re-
spectively. The expense ratios presented above may vary from the expense ratios presented in other sections of this report that are based on expenses incurred during the period covered by this report.
Class A share performance reflects the maximum 5.50% sales charge, and Class C share performance reflects the applicable contingent deferred sales charge (CDSC) for the period involved. The CDSC on Class C shares is 1% for the first year after purchase. Class R, Class Y, Class R5 and Class R6 shares do not have a front-end sales charge or a CDSC; therefore, performance is at net asset value.
The performance of the Fund’s share classes will differ primarily due to different sales charge structures and class expenses.
Fund performance reflects any applicable fee waivers and/or expense reimbursements. Had the adviser not waived fees and/or reimbursed expenses currently or in the past, returns would have been lower. See current prospectus for more information.
| 7 | Invesco American Value Fund |
Invesco American Value Fund’s investment objective is total return through growth of capital and current income.
| ■ | Unless otherwise stated, information presented in this report is as of April 30, 2019, and is based on total net assets. |
| ■ | Unless otherwise noted, all data provided by Invesco. |
| ■ | To access your Fund’s reports/prospectus, visit invesco.com/fundreports. |
About share classes
| ■ | Class R sharesare generally available only to employer sponsored retirement and benefit plans. Please see the prospectus for more information. |
| ■ | Class Y shares are available only to certain investors. Please see the prospectus for more information. |
| ■ | Class R5 shares andClass R6 shares are available for use by retirement plans that meet certain standards and for institutional investors. Class R6 shares are also available through intermediaries that have established an agreement with Invesco Distributors, Inc. to make such shares available for use in retail omnibus accounts. Please see the prospectus for more information. |
Principal Risks of Investing in the Fund
| ■ | Depositary receipts risk. Investing in depositary receipts involves the same risks as direct investments in foreign securities. In addition, the underlying issuers of certain depositary receipts are under no obligation to distribute shareholder communications or pass through any voting rights with respect to the deposited securities to the holders of such receipts. The Fund may therefore receive less timely information or have less control than if it invested directly in the foreign issuer. |
| ■ | Derivatives risk. The value of a derivative instrument depends largely on (and is derived from) the value of an underlying security, currency, commodity, interest rate, index or other asset (each referred to as an underlying asset). In addition to risks relating to the underlying assets, the use of derivatives may include other, possibly greater, risks, including counterparty, leverage and liquidity risks. Counterparty risk is the risk that the counterparty to the derivative contract will default on its obligation to pay the Fund the amount owed or |
| | otherwise perform under the derivative contract. Derivatives create leverage risk because they do not require payment up front equal to the economic exposure created by holding a position in the derivative. As a result, an adverse change in the value of the underlying asset could result in the Fund sustaining a loss that is substantially greater than the amount invested in the derivative or the anticipated value of the underlying asset, which may make the Fund’s returns more volatile and increase the risk of loss. Derivative instruments may also be less liquid than more traditional investments and the Fund may be unable to sell or close out its derivative positions at a desirable time or price. This risk may be more acute under adverse market conditions, during which the Fund may be most in need of liquidating its derivative positions. Derivatives may also be harder to value, less tax efficient and subject to changing government regulation that could impact the Fund’s ability to use certain derivatives or their cost. Derivatives strategies may not always be successful. For example, derivatives used for hedging or to gain or limit exposure to a particular market segment may not provide the expected benefits, particularly during adverse market conditions. |
| ■ | Foreign securities risk. The Fund’s foreign investments may be adversely affected by political and social instability, changes in economic or taxation policies, difficulty in enforcing obligations, decreased liquidity or increased volatility. Foreign investments also involve the risk of the possible seizure, nationalization or expropriation of the issuer or foreign deposits (in which the Fund could lose its entire investments in a certain market) and the possible adoption of foreign governmental restrictions such as exchange controls. Unless the Fund has hedged its foreign securities risk, for- |
| | eign securities risk also involves the risk of negative foreign currency rate fluctuations, which may cause the value of securities denominated in such foreign currency (or other instruments through which the Fund has exposure to foreign currencies) to decline in value. Currency exchange rates may fluctuate significantly over short periods of time. Currency hedging strategies, if used, are not always successful. |
| ■ | Management risk. The Fund is actively managed and depends heavily on the Adviser’s judgment about markets, interest rates or the attractiveness, relative values, liquidity, or potential appreciation of particular investments made for the Fund’s portfolio. The Fund could experience losses if these judgments prove to be incorrect. Additionally, legislative, regulatory, or tax developments may adversely affect management of the Fund and, therefore, the ability of the Fund to achieve its investment objective. |
| ■ | Market risk. The market values of the Fund’s investments, and therefore the value of the Fund’s shares, will go up and down, sometimes rapidly or unpredictably. Market risk may affect a single issuer, industry or section of the economy, or it may affect the market as a whole. Individual stock prices tend to go up and down more dramatically than those of certain other types of investments, such as bonds. During a general downturn in the financial markets, multiple asset classes may decline in value. When markets perform well, there can be no assurance that specific investments held by the Fund will rise in value. |
| ■ | REIT risk/real estate risk. Investments in real estate related instruments may be affected by economic, legal, cultural, environmental or technological factors that affect property values, rents or occupancies of real estate related to the Fund’s holdings. Shares of real estate related companies, |
This report must be accompanied or preceded by a currently effective Fund prospectus, which contains more complete information, including sales charges and expenses. Investors should read it carefully before investing.
NOT FDIC INSURED | MAY LOSE VALUE | NO BANK GUARANTEE
| 8 | Invesco American Value Fund |
| | which tend to be small- and mid-cap companies, may be more volatile and less liquid. |
| ■ | Sector focus risk. The Fund may from time to time invest a significant amount of its assets (i.e. over 25%) in one market sector or group of related industries. In this event, the Fund’s performance will depend to a greater extent on the overall condition of the sector or group of industries and there is increased risk that the Fund will lose significant value if conditions adversely affect that sector or group of industries. |
| ■ | Small- and mid-capitalization companies risks. Small- and mid-capitalization companies tend to be more vulnerable to changing market conditions, may have little or no operating history or track record of success, and may have more limited product lines and markets, less experienced management and fewer financial resources than larger companies. These companies’ securities may be more volatile and less liquid than those of more established companies, and their returns may vary, sometimes significantly, from the overall securities market. |
| ■ | Value investing style risk. A value investing style subjects the Fund to the risk that the valuations never improve or that the returns on value equity securities are less than returns on other styles of investing or the overall stock market. |
About indexes used in this report
| ■ | The S&P 500® Index is an unmanaged index considered representative of the US stock market. |
| ■ | TheRussell Midcap® Value Index is an unmanaged index considered representative of mid-cap value stocks. The Russell Midcap Value Index is a trademark/service mark of the Frank Russell Co. Russell® is a trademark of the Frank Russell Co. |
| ■ | TheLipper Mid-Cap Value Funds Index is an unmanaged index considered representative of mid-cap value funds tracked by Lipper. |
| ■ | The Fund is not managed to track the performance of any particular index, including the index(es) described here, and consequently, the performance of the Fund may deviate significantly from the performance of the index(es). |
| ■ | A direct investment cannot be made in an index. Unless otherwise indicated, index results include reinvested |
dividends, and they do not reflect sales charges. Performance of the peer group, if applicable, reflects fund expenses; performance of a market index does not.
Other information
| ■ | The returns shown in management’s discussion of Fund performance are based on net asset values (NAVs) calculated for shareholder transactions. Generally accepted accounting principles require adjustments to be made to the net assets of the Fund at period end for financial reporting purposes, and as such, the NAVs for shareholder transactions and the returns based on those NAVs may differ from the NAVs and returns reported in the Financial Highlights. |
| ■ | Industry classifications used in this report are generally according to the Global Industry Classification Standard, which was developed by and is the exclusive property and a service mark of MSCI Inc. and Standard & Poor’s. |
| 9 | Invesco American Value Fund |
Schedule of Investments(a)
April 30, 2019
| | Shares | Value |
| Common Stocks & Other Equity Interests–98.10% |
| Aerospace & Defense–2.23% |
| Textron, Inc. | 492,408 | $26,097,624 |
| Apparel, Accessories & Luxury Goods–2.05% |
| Tapestry, Inc. | 746,484 | 24,089,039 |
| Automotive Retail–1.40% |
| Advance Auto Parts, Inc. | 98,679 | 16,412,291 |
| Biotechnology–1.02% |
| Myriad Genetics, Inc.(b) | 380,551 | 11,979,746 |
| Building Products–2.64% |
| Johnson Controls International PLC | 826,991 | 31,012,163 |
| Communications Equipment–1.46% |
| Ciena Corp.(b) | 445,495 | 17,089,188 |
| Consumer Finance–1.90% |
| Santander Consumer USA Holdings, Inc. | 1,043,934 | 22,287,991 |
| Copper–1.75% |
| Freeport-McMoRan, Inc. | 1,664,353 | 20,488,185 |
| Distributors–2.18% |
| LKQ Corp.(b) | 847,555 | 25,511,406 |
| Diversified Chemicals–1.98% |
| Eastman Chemical Co. | 294,348 | 23,218,170 |
| Diversified REITs–2.46% |
| Liberty Property Trust | 582,205 | 28,900,656 |
| Electric Utilities–4.15% |
| Evergy, Inc. | 317,800 | 18,375,196 |
| FirstEnergy Corp. | 719,798 | 30,253,110 |
| | | | 48,628,306 |
| Electronic Equipment & Instruments–2.42% |
| Keysight Technologies, Inc.(b) | 325,643 | 28,340,710 |
| Food Distributors–0.88% |
| Performance Food Group Co.(b) | 251,728 | 10,308,262 |
| Food Retail–1.97% |
| Kroger Co. (The) | 895,627 | 23,089,264 |
| Health Care Facilities–2.56% |
| Encompass Health Corp. | 465,658 | 30,011,658 |
| Health Care Services–2.13% |
| DaVita, Inc.(b) | 451,210 | 24,924,840 |
| Hotels, Resorts & Cruise Lines–5.71% |
| Norwegian Cruise Line Holdings Ltd.(b) | 486,165 | 27,414,845 |
| | Shares | Value |
| Hotels, Resorts & Cruise Lines–(continued) |
| Royal Caribbean Cruises Ltd. | 327,247 | $39,577,252 |
| | | | 66,992,097 |
| Industrial Machinery–2.24% |
| Kennametal, Inc. | 644,056 | 26,213,079 |
| Insurance Brokers–5.65% |
| Arthur J. Gallagher & Co. | 391,817 | 32,763,738 |
| Willis Towers Watson PLC | 181,427 | 33,444,253 |
| | | | 66,207,991 |
| Interactive Home Entertainment–1.56% |
| Take-Two Interactive Software, Inc.(b) | 188,726 | 18,274,339 |
| Investment Banking & Brokerage–2.12% |
| Stifel Financial Corp. | 417,540 | 24,914,612 |
| IT Consulting & Other Services–1.95% |
| DXC Technology Co. | 347,524 | 22,846,228 |
| Life & Health Insurance–2.01% |
| Athene Holding Ltd., Class A(b) | 523,059 | 23,621,344 |
| Managed Health Care–2.87% |
| Centene Corp.(b) | 652,284 | 33,631,763 |
| Marine–2.32% |
| Kirby Corp.(b) | 332,312 | 27,156,537 |
| Office REITs–2.32% |
| Hudson Pacific Properties, Inc. | 781,687 | 27,249,609 |
| Oil & Gas Equipment & Services–1.90% |
| TechnipFMC PLC (United Kingdom) | 903,894 | 22,226,753 |
| Oil & Gas Exploration & Production–6.31% |
| Devon Energy Corp. | 744,760 | 23,936,586 |
| Marathon Oil Corp. | 1,397,099 | 23,806,567 |
| Noble Energy, Inc. | 967,400 | 26,177,844 |
| | | | 73,920,997 |
| Other Diversified Financial Services–2.53% |
| Voya Financial, Inc. | 539,388 | 29,607,007 |
| Pharmaceuticals–1.14% |
| Mylan N.V.(b) | 497,456 | 13,426,337 |
| Regional Banks–11.33% |
| Chemical Financial Corp. | 530,350 | 23,298,275 |
| Comerica, Inc. | 342,365 | 26,906,465 |
| KeyCorp | 1,497,376 | 26,278,949 |
| Wintrust Financial Corp. | 311,499 | 23,736,224 |
| Zions Bancorp. N.A. | 660,348 | 32,574,967 |
| | | | 132,794,880 |
See accompanying Notes to Financial Statements which are an integral part of the financial statements.
| 10 | Invesco American Value Fund |
| | Shares | Value |
| Semiconductor Equipment–2.07% |
| KLA-Tencor Corp. | 190,156 | $24,241,087 |
| Specialized REITs–1.61% |
| Life Storage, Inc. | 198,194 | 18,885,906 |
| Specialty Chemicals–2.33% |
| W.R. Grace & Co. | 361,607 | 27,330,257 |
| Systems Software–2.53% |
| Teradata Corp.(b) | 653,034 | 29,693,456 |
| Trucking–2.42% |
| Knight-Swift Transportation Holdings, Inc. | 851,508 | 28,397,792 |
| Total Common Stocks & Other Equity Interests (Cost $961,004,994) | 1,150,021,570 |
| | Shares | Value |
|
| Money Market Funds–2.15% |
| Invesco Government & Agency Portfolio, Institutional Class, 2.34%(c) | 8,828,959 | $8,828,959 |
| Invesco Liquid Assets Portfolio, Institutional Class, 2.48%(c) | 6,304,722 | 6,306,613 |
| Invesco Treasury Portfolio, Institutional Class, 2.32%(c) | 10,090,239 | 10,090,239 |
| Total Money Market Funds (Cost $25,224,319) | 25,225,811 |
| TOTAL INVESTMENTS IN SECURITIES–100.25% (Cost $986,229,313) | 1,175,247,381 |
| OTHER ASSETS LESS LIABILITIES–(0.25)% | (2,947,351) |
| NET ASSETS–100.00% | $1,172,300,030 |
Investment Abbreviations:
| REIT | – Real Estate Investment Trust |
Notes to Schedule of Investments:
| (a) | Industry and/or sector classifications used in this report are generally according to the Global Industry Classification Standard, which was developed by and is the exclusive property and a service mark of MSCI Inc. and Standard & Poor’s. |
| (b) | Non-income producing security. |
| (c) | The money market fund and the Fund are affiliated by having the same investment adviser. The rate shown is the 7-day SEC standardized yield as of April 30, 2019. |
See accompanying Notes to Financial Statements which are an integral part of the financial statements.
| 11 | Invesco American Value Fund |
Statement of Assets and Liabilities
April 30, 2019
| Assets: | |
Investments in securities, at value
(Cost $961,004,994) | $1,150,021,570 |
| Investments in affiliated money market funds, at value (Cost $25,224,319) | 25,225,811 |
| Receivable for: | |
| Investments sold | 2,839,493 |
| Fund shares sold | 361,025 |
| Dividends | 139,265 |
| Investment for trustee deferred compensation and retirement plans | 184,992 |
| Other assets | 50,861 |
| Total assets | 1,178,823,017 |
| Liabilities: | |
| Payable for: | |
| Investments purchased | 2,642,656 |
| Fund shares reacquired | 2,145,504 |
| Amount due custodian | 687,988 |
| Accrued fees to affiliates | 652,262 |
| Accrued trustees’ and officers’ fees and benefits | 2,783 |
| Accrued other operating expenses | 188,157 |
| Trustee deferred compensation and retirement plans | 203,637 |
| Total liabilities | 6,522,987 |
| Net assets applicable to shares outstanding | $1,172,300,030 |
| Net assets consist of: | |
| Shares of beneficial interest | $969,816,513 |
| Distributable earnings | 202,483,517 |
| | $1,172,300,030 |
| Net Assets: |
| Class A | $871,219,903 |
| Class C | $29,562,370 |
| Class R | $19,979,389 |
| Class Y | $155,238,209 |
| Class R5 | $27,732,324 |
| Class R6 | $68,567,835 |
| Shares outstanding, no par value, with an unlimited number of shares authorized: |
| Class A | 25,612,118 |
| Class C | 1,088,673 |
| Class R | 590,080 |
| Class Y | 4,528,674 |
| Class R5 | 808,554 |
| Class R6 | 1,998,724 |
| Class A: | |
| Net asset value per share | $34.02 |
Maximum offering price per share
(Net asset value of $34.02 ÷ 94.50%) | $36.00 |
| Class C: | |
| Net asset value and offering price per share | $27.15 |
| Class R: | |
| Net asset value and offering price per share | $33.86 |
| Class Y: | |
| Net asset value and offering price per share | $34.28 |
| Class R5: | |
| Net asset value and offering price per share | $34.30 |
| Class R6: | |
| Net asset value and offering price per share | $34.31 |
See accompanying Notes to Financial Statements which are an integral part of the financial statements.
| 12 | Invesco American Value Fund |
Statement of Operations
For the year ended April 30, 2019
| Investment income: | |
| Dividends | $19,236,170 |
| Dividends from affiliated money market funds | 573,922 |
| Total investment income | 19,810,092 |
| Expenses: | |
| Advisory fees | 8,941,847 |
| Administrative services fees | 275,307 |
| Custodian fees | 20,773 |
| Distribution fees: | |
| Class A | 2,204,864 |
| Class C | 610,013 |
| Class R | 108,706 |
| Transfer agent fees — A, C, R and Y | 2,070,775 |
| Transfer agent fees — R5 | 35,697 |
| Transfer agent fees — R6 | 19,039 |
| Trustees’ and officers’ fees and benefits | 40,439 |
| Registration and filing fees | 115,069 |
| Reports to shareholders | 173,782 |
| Professional services fees | 61,630 |
| Other | 35,146 |
| Total expenses | 14,713,087 |
| Less: Fees waived and expense offset arrangement(s) | (40,221) |
| Net expenses | 14,672,866 |
| Net investment income | 5,137,226 |
| Realized and unrealized gain (loss) from: | |
| Net realized gain from Investment securities | 71,007,064 |
| Change in net unrealized appreciation (depreciation) of Investment securities | (80,784,485) |
| Net realized and unrealized gain (loss) | (9,777,421) |
| Net increase (decrease) in net assets resulting from operations | $(4,640,195) |
See accompanying Notes to Financial Statements which are an integral part of the financial statements.
| 13 | Invesco American Value Fund |
Statement of Changes in Net Assets
For the years ended April 30, 2019 and 2018
| | 2019 | 2018 |
| Operations: | | |
| Net investment income | $5,137,226 | $3,779,013 |
| Net realized gain | 71,007,064 | 187,950,224 |
| Change in net unrealized appreciation (depreciation) | (80,784,485) | (14,421,138) |
| Net increase (decrease) in net assets resulting from operations | (4,640,195) | 177,308,099 |
| Distributions to shareholders from distributable earnings(1): | | |
| Class A | (89,083,319) | (104,909,344) |
| Class B | — | (570,656) |
| Class C | (8,383,288) | (10,422,833) |
| Class R | (2,150,588) | (3,682,670) |
| Class Y | (18,637,935) | (28,848,115) |
| Class R5 | (3,019,574) | (7,376,840) |
| Class R6 | (7,656,836) | (15,811,346) |
| Total distributions to shareholders from distributable earnings | (128,931,540) | (171,621,804) |
| Share transactions–net: | | |
| Class A | 23,943,978 | (97,132,259) |
| Class B | — | (7,372,637) |
| Class C | (40,803,017) | (14,413,588) |
| Class R | (3,016,181) | (21,759,552) |
| Class Y | (31,945,480) | (168,629,296) |
| Class R5 | (32,686,919) | (24,514,856) |
| Class R6 | (66,839,564) | (26,519,014) |
| Net increase (decrease) in net assets resulting from share transactions | (151,347,183) | (360,341,202) |
| Net increase (decrease) in net assets | (284,918,918) | (354,654,907) |
| Net assets: | | |
| Beginning of year | 1,457,218,948 | 1,811,873,855 |
| End of year | $1,172,300,030 | $1,457,218,948 |
| (1) | For the year ended April 30, 2018, distributions to shareholders from distributable earnings consisted of distributions from net investment income and distributions from net realized gains. The Securities and Exchange Commission eliminated the requirement to disclose the distribution components separately, except for tax return of capital. For the year ended April 30, 2018, distributions from net investment income were $5,663,325, $30,806, $68,686, $2,267,084, $661,230 and $1,560,385 for Class A, Class B, Class R, Class Y, Class R5 and Class R6, respectively and distributions from net realized gains were $99,246,019, $539,850, $10,422,833, $3,613,984, $26,581,031, $6,715,610 and $14,250,961 for Class A, Class B, Class C, Class R, Class Y, Class R5 and Class R6 shares, respectively. |
See accompanying Notes to Financial Statements which are an integral part of the financial statements.
| 14 | Invesco American Value Fund |
Financial Highlights
April 30, 2019
The following schedule presents financial highlights for a share of the Fund outstanding throughout the periods indicated.
| | Net asset
value,
beginning
of period | Net
investment
income
(loss)(a) | Net gains
(losses)
on securities
(both
realized and
unrealized) | Total from
investment
operations | Dividends
from net
investment
income | Distributions
from net
realized
gains | Total
distributions | Net asset
value, end
of period | Total
return(b) | Net assets,
end of period
(000’s omitted) | Ratio of
expenses
to average
net assets
with fee waivers
and/or expenses
absorbed | Ratio of
expenses
to average net
assets without
fee waivers
and/or expenses
absorbed | Ratio of net
investment
income
(loss)
to average
net assets | Portfolio
turnover(c) |
| Class A |
| Year ended 04/30/19 | $38.47 | $0.13 | $(0.69) | $(0.56) | $(0.14) | $(3.75) | $(3.89) | $34.02 | (0.03)% | $871,220 | 1.19%(d) | 1.19%(d) | 0.37%(d) | 38% |
| Year ended 04/30/18 | 38.52 | 0.07 | 4.37 | 4.44 | (0.24) | (4.25) | (4.49) | 38.47 | 12.11 | 938,346 | 1.19 | 1.19 | 0.19 | 44 |
| Year ended 04/30/17 | 34.01 | 0.20 | 4.70 | 4.90 | (0.08) | (0.31) | (0.39) | 38.52 | 14.40 | 1,031,600 | 1.21 | 1.21 | 0.53 | 42 |
| Year ended 04/30/16 | 40.44 | 0.09 | (4.06) | (3.97) | (0.01) | (2.45) | (2.46) | 34.01 | (9.62) | 1,122,286 | 1.19 | 1.20 | 0.26 | 28 |
| Year ended 04/30/15 | 40.11 | 0.00 | 4.23 | 4.23 | (0.02) | (3.88) | (3.90) | 40.44 | 11.27 | 1,242,480 | 1.19 | 1.20 | 0.01 | 34 |
| Class C |
| Year ended 04/30/19 | 31.66 | (0.11) | (0.65) | (0.76) | — | (3.75) | (3.75) | 27.15 | (0.77)(e) | 29,562 | 1.91(d)(e) | 1.91(d)(e) | (0.35)(d)(e) | 38 |
| Year ended 04/30/18 | 32.44 | (0.17) | 3.64 | 3.47 | — | (4.25) | (4.25) | 31.66 | 11.30(e) | 82,217 | 1.92(e) | 1.92(e) | (0.54)(e) | 44 |
| Year ended 04/30/17 | 28.83 | (0.06) | 3.98 | 3.92 | — | (0.31) | (0.31) | 32.44 | 13.59(e) | 98,096 | 1.94(e) | 1.94(e) | (0.20)(e) | 42 |
| Year ended 04/30/16 | 34.95 | (0.15) | (3.52) | (3.67) | — | (2.45) | (2.45) | 28.83 | (10.28)(e) | 103,706 | 1.93(e) | 1.94(e) | (0.48)(e) | 28 |
| Year ended 04/30/15 | 35.41 | (0.26) | 3.68 | 3.42 | — | (3.88) | (3.88) | 34.95 | 10.44(e) | 125,201 | 1.92(e) | 1.93(e) | (0.72)(e) | 34 |
| Class R |
| Year ended 04/30/19 | 38.24 | 0.04 | (0.67) | (0.63) | — | (3.75) | (3.75) | 33.86 | (0.28) | 19,979 | 1.44(d) | 1.44(d) | 0.12(d) | 38 |
| Year ended 04/30/18 | 38.26 | (0.02) | 4.33 | 4.31 | (0.08) | (4.25) | (4.33) | 38.24 | 11.81 | 25,189 | 1.44 | 1.44 | (0.06) | 44 |
| Year ended 04/30/17 | 33.80 | 0.10 | 4.67 | 4.77 | — | (0.31) | (0.31) | 38.26 | 14.11 | 46,937 | 1.46 | 1.46 | 0.28 | 42 |
| Year ended 04/30/16 | 40.29 | 0.00 | (4.04) | (4.04) | — | (2.45) | (2.45) | 33.80 | (9.82) | 66,207 | 1.44 | 1.45 | 0.01 | 28 |
| Year ended 04/30/15 | 40.06 | (0.10) | 4.21 | 4.11 | — | (3.88) | (3.88) | 40.29 | 10.97 | 76,594 | 1.44 | 1.45 | (0.24) | 34 |
| Class Y |
| Year ended 04/30/19 | 38.76 | 0.23 | (0.71) | (0.48) | (0.25) | (3.75) | (4.00) | 34.28 | 0.21 | 155,238 | 0.94(d) | 0.94(d) | 0.62(d) | 38 |
| Year ended 04/30/18 | 38.80 | 0.17 | 4.40 | 4.57 | (0.36) | (4.25) | (4.61) | 38.76 | 12.38 | 208,223 | 0.94 | 0.94 | 0.44 | 44 |
| Year ended 04/30/17 | 34.25 | 0.29 | 4.73 | 5.02 | (0.16) | (0.31) | (0.47) | 38.80 | 14.66 | 375,626 | 0.96 | 0.96 | 0.78 | 42 |
| Year ended 04/30/16 | 40.62 | 0.18 | (4.07) | (3.89) | (0.03) | (2.45) | (2.48) | 34.25 | (9.36) | 452,703 | 0.94 | 0.95 | 0.51 | 28 |
| Year ended 04/30/15 | 40.26 | 0.11 | 4.24 | 4.35 | (0.11) | (3.88) | (3.99) | 40.62 | 11.55 | 545,456 | 0.94 | 0.95 | 0.26 | 34 |
| Class R5 |
| Year ended 04/30/19 | 38.80 | 0.26 | (0.73) | (0.47) | (0.28) | (3.75) | (4.03) | 34.30 | 0.27 | 27,732 | 0.86(d) | 0.86(d) | 0.70(d) | 38 |
| Year ended 04/30/18 | 38.84 | 0.20 | 4.43 | 4.63 | (0.42) | (4.25) | (4.67) | 38.80 | 12.53 | 62,354 | 0.86 | 0.86 | 0.52 | 44 |
| Year ended 04/30/17 | 34.29 | 0.33 | 4.74 | 5.07 | (0.21) | (0.31) | (0.52) | 38.84 | 14.77 | 86,569 | 0.85 | 0.85 | 0.89 | 42 |
| Year ended 04/30/16 | 40.63 | 0.22 | (4.07) | (3.85) | (0.04) | (2.45) | (2.49) | 34.29 | (9.26) | 128,357 | 0.82 | 0.83 | 0.63 | 28 |
| Year ended 04/30/15 | 40.28 | 0.15 | 4.24 | 4.39 | (0.16) | (3.88) | (4.04) | 40.63 | 11.66 | 95,082 | 0.82 | 0.83 | 0.38 | 34 |
| Class R6 |
| Year ended 04/30/19 | 38.82 | 0.29 | (0.73) | (0.44) | (0.32) | (3.75) | (4.07) | 34.31 | 0.37 | 68,568 | 0.78(d) | 0.78(d) | 0.78(d) | 38 |
| Year ended 04/30/18 | 38.88 | 0.24 | 4.42 | 4.66 | (0.47) | (4.25) | (4.72) | 38.82 | 12.59 | 140,889 | 0.77 | 0.77 | 0.61 | 44 |
| Year ended 04/30/17 | 34.32 | 0.37 | 4.74 | 5.11 | (0.24) | (0.31) | (0.55) | 38.88 | 14.88 | 165,781 | 0.76 | 0.76 | 0.98 | 42 |
| Year ended 04/30/16 | 40.64 | 0.25 | (4.07) | (3.82) | (0.05) | (2.45) | (2.50) | 34.32 | (9.19) | 143,003 | 0.73 | 0.74 | 0.72 | 28 |
| Year ended 04/30/15 | 40.28 | 0.19 | 4.25 | 4.44 | (0.20) | (3.88) | (4.08) | 40.64 | 11.77 | 143,793 | 0.73 | 0.74 | 0.47 | 34 |
| (a) | Calculated using average shares outstanding. |
| (b) | Includes adjustments in accordance with accounting principles generally accepted in the United States of America and as such, the net asset value for financial reporting purposes and the returns based upon those net asset values may differ from the net asset value and returns for shareholder transactions. Does not include sales charges and is not annualized for periods less than one year, if applicable. |
| (c) | Portfolio turnover is calculated at the fund level and is not annualized for periods less than one year, if applicable. |
| (d) | Ratios are based on average daily net assets (000’s omitted) of $881,946, $62,601, $21,741, $181,438, $35,672 and $84,925 for Class A, Class C, Class R, Class Y, Class R5 and Class R6 shares, respectively. |
| (e) | The total return, ratio of expenses to average net assets and ratio of net investment income (loss) to average net assets reflect actual 12b-1 fees of 0.97%, 0.97%, 0.97%, 0.99% and 0.98% for the years ended April 30, 2019, 2018, 2017, 2016 and 2015, respectively. |
See accompanying Notes to Financial Statements which are an integral part of the financial statements.
| 15 | Invesco American Value Fund |
Notes to Financial Statements
April 30, 2019
NOTE 1—Significant Accounting Policies
Invesco American Value Fund (the “Fund”) is a series portfolio of AIM Sector Funds (Invesco Sector Funds) (the “Trust”). The Trust is a Delaware statutory trust registered under the Investment Company Act of 1940, as amended (the “1940 Act”), as an open-end series management investment company authorized to issue an unlimited number of shares of beneficial interest. Information presented in these financial statements pertains only to the Fund. Matters affecting the Fund or each class will be voted on exclusively by the shareholders of the Fund or each class.
The Fund’s investment objective is total return through growth of capital and current income.
The Fund currently consists of six different classes of shares: Class A, Class C, Class R, Class Y, Class R5 and Class R6. Class Y shares are available only to certain investors. Class A shares are sold with a front-end sales charge unless certain waiver criteria are met. Under certain circumstances, load waived shares may be subject to contingent deferred sales charges ("CDSC"). Class C shares are sold with a CDSC. Class R, Class Y, Class R5 and Class R6 shares are sold at net asset value. Class C shares held for ten years after purchase are eligible for automatic conversion into Class A shares of the same Fund (the "Conversion Feature"). The automatic conversion pursuant to the Conversion Feature will generally occur at the end of the month following the tenth anniversary after a purchase of Class C shares.
The Fund is an investment company and accordingly follows the investment company accounting and reporting guidance in accordance with Financial Accounting Standards Board Accounting Standards Codification Topic 946,Financial Services – Investment Companies.
The following is a summary of the significant accounting policies followed by the Fund in the preparation of its financial statements.
| A. | Security Valuations — Securities, including restricted securities, are valued according to the following policy. |
A security listed or traded on an exchange (except convertible securities) is valued at its last sales price or official closing price as of the close of the customary trading session on the exchange where the security is principally traded, or lacking any sales or official closing price on a particular day, the security may be valued at the closing bid price on that day. Securities traded in the over-the-counter market are valued based on prices furnished by independent pricing services or market makers. When such securities are valued by an independent pricing service they may be considered fair valued. Futures contracts are valued at the final settlement price set by an exchange on which they are principally traded. Listed options are valued at the mean between the last bid and asked prices from the exchange on which they are principally traded. Options not listed on an exchange are valued by an independent source at the mean between the last bid and asked prices. For purposes of determining net asset value (“NAV”) per share, futures and option contracts generally are valued 15 minutes after the close of the customary trading session of the New York Stock Exchange (“NYSE”).
Investments in open-end and closed-end registered investment companies that do not trade on an exchange are valued at the end-of-day net asset value per share. Investments in open-end and closed-end registered investment companies that trade on an exchange are valued at the last sales price or official closing price as of the close of the customary trading session on the exchange where the security is principally traded.
Debt obligations (including convertible securities) and unlisted equities are fair valued using an evaluated quote provided by an independent pricing service. Evaluated quotes provided by the pricing service may be determined without exclusive reliance on quoted prices, and may reflect appropriate factors such as institution-size trading in similar groups of securities, developments related to specific securities, dividend rate (for unlisted equities), yield (for debt obligations), quality, type of issue, coupon rate (for debt obligations), maturity (for debt obligations), individual trading characteristics and other market data. Pricing services generally value debt obligations assuming orderly transactions of institutional round lot size, but a fund may hold or transact in the same securities in smaller, odd lot sizes. Odd lots often trade at lower prices than institutional round lots. Debt obligations are subject to interest rate and credit risks. In addition, all debt obligations involve some risk of default with respect to interest and/or principal payments.
Foreign securities’ (including foreign exchange contracts) prices are converted into U.S. dollar amounts using the applicable exchange rates as of the close of the NYSE. If market quotations are available and reliable for foreign exchange-traded equity securities, the securities will be valued at the market quotations. Because trading hours for certain foreign securities end before the close of the NYSE, closing market quotations may become unreliable. If between the time trading ends on a particular security and the close of the customary trading session on the NYSE, events occur that the investment adviser determines are significant and make the closing price unreliable, the Fund may fair value the security. If the event is likely to have affected the closing price of the security, the security will be valued at fair value in good faith using procedures approved by the Board of Trustees. Adjustments to closing prices to reflect fair value may also be based on a screening process of an independent pricing service to indicate the degree of certainty, based on historical data, that the closing price in the principal market where a foreign security trades is not the current value as of the close of the NYSE. Foreign securities’ prices meeting the approved degree of certainty that the price is not reflective of current value will be priced at the indication of fair value from the independent pricing service. Multiple factors may be considered by the independent pricing service in determining adjustments to reflect fair value and may include information relating to sector indices, American Depositary Receipts and domestic and foreign index futures. Foreign securities may have additional risks including exchange rate changes, potential for sharply devalued currencies and high inflation, political and economic upheaval, the relative lack of issuer information, relatively low market liquidity and the potential lack of strict financial and accounting controls and standards.
Securities for which market prices are not provided by any of the above methods may be valued based upon quotes furnished by independent sources. The last bid price may be used to value equity securities. The mean between the last bid and asked prices is used to value debt obligations, including corporate loans.
Securities for which market quotations are not readily available or became unreliable are valued at fair value as determined in good faith by or under the supervision of the Trust’s officers following procedures approved by the Board of Trustees. Issuer specific events, market trends, bid/asked quotes of brokers and information providers and other market data may be reviewed in the course of making a good faith determination of a security’s fair value.
The Fund may invest in securities that are subject to interest rate risk, meaning the risk that the prices will generally fall as interest rates rise and, conversely, the prices will generally rise as interest rates fall. Specific securities differ in their sensitivity to changes in interest rates depending on their individual characteristics. Changes in interest rates may result in increased market volatility, which may affect the value and/or liquidity of certain Fund investments.
| 16 | Invesco American Value Fund |
Valuations change in response to many factors including the historical and prospective earnings of the issuer, the value of the issuer’s assets, general economic conditions, interest rates, investor perceptions and market liquidity. Because of the inherent uncertainties of valuation, the values reflected in the financial statements may materially differ from the value received upon actual sale of those investments.
| B. | Securities Transactions and Investment Income — Securities transactions are accounted for on a trade date basis. Realized gains or losses on sales are computed on the basis of specific identification of the securities sold. Interest income (net of withholding tax, if any) is recorded on the accrual basis from settlement date. Dividend income (net of withholding tax, if any) is recorded on the ex-dividend date. |
The Fund may periodically participate in litigation related to Fund investments. As such, the Fund may receive proceeds from litigation settlements. Any proceeds received are included in the Statement of Operations as realized gain (loss) for investments no longer held and as unrealized gain (loss) for investments still held.
Brokerage commissions and mark ups are considered transaction costs and are recorded as an increase to the cost basis of securities purchased and/or a reduction of proceeds on a sale of securities. Such transaction costs are included in the determination of net realized and unrealized gain (loss) from investment securities reported in the Statement of Operations and the Statement of Changes in Net Assets and the net realized and unrealized gains (losses) on securities per share in the Financial Highlights. Transaction costs are included in the calculation of the Fund’s net asset value and, accordingly, they reduce the Fund’s total returns. These transaction costs are not considered operating expenses and are not reflected in net investment income reported in the Statement of Operations and the Statement of Changes in Net Assets, or the net investment income per share and the ratios of expenses and net investment income reported in the Financial Highlights, nor are they limited by any expense limitation arrangements between the Fund and the investment adviser.
The Fund allocates income and realized and unrealized capital gains and losses to a class based on the relative net assets of each class.
| C. | Country Determination – For the purposes of making investment selection decisions and presentation in the Schedule of Investments, the investment adviser may determine the country in which an issuer is located and/or credit risk exposure based on various factors. These factors include the laws of the country under which the issuer is organized, where the issuer maintains a principal office, the country in which the issuer derives 50% or more of its total revenues and the country that has the primary market for the issuer’s securities, as well as other criteria. Among the other criteria that may be evaluated for making this determination are the country in which the issuer maintains 50% or more of its assets, the type of security, financial guarantees and enhancements, the nature of the collateral and the sponsor organization. Country of issuer and/or credit risk exposure has been determined to be the United States of America, unless otherwise noted. |
| D. | Distributions– Distributions from net investment income and net realized capital gain, if any, are generally declared and paid annually and recorded on the ex-dividend date. The Fund may elect to treat a portion of the proceeds from redemptions as distributions for federal income tax purposes. |
| E. | Federal Income Taxes – The Fund intends to comply with the requirements of Subchapter M of the Internal Revenue Code of 1986, as amended (the “Internal Revenue Code”), necessary to qualify as a regulated investment company and to distribute substantially all of the Fund’s taxable earnings to shareholders. As such, the Fund will not be subject to federal income taxes on otherwise taxable income (including net realized capital gain) that is distributed to shareholders. Therefore, no provision for federal income taxes is recorded in the financial statements. |
The Fund recognizes the tax benefits of uncertain tax positions only when the position is more likely than not to be sustained. Management has analyzed the Fund’s uncertain tax positions and concluded that no liability for unrecognized tax benefits should be recorded related to uncertain tax positions. Management is not aware of any tax positions for which it is reasonably possible that the total amounts of unrecognized tax benefits will change materially in the next 12 months.
The Fund files tax returns in the U.S. Federal jurisdiction and certain other jurisdictions. Generally, the Fund is subject to examinations by such taxing authorities for up to three years after the filing of the return for the tax period.
| F. | Expenses – Fees provided for under the Rule 12b-1 plan of a particular class of the Fund are charged to the operations of such class. Transfer agency fees and expenses and other shareholder recordkeeping fees and expenses attributable to Class R5 and Class R6 are allocated to each share class based on relative net assets. Sub-accounting fees attributable to Class R5 are charged to the operations of the class. Transfer agency fees and expenses and other shareholder recordkeeping fees and expenses relating to all other classes are allocated among those classes based on relative net assets. All other expenses are allocated among the classes based on relative net assets. |
| G. | Accounting Estimates – The preparation of financial statements in conformity with accounting principles generally accepted in the United States of America (“GAAP”) requires management to make estimates and assumptions that affect the reported amounts of assets and liabilities at the date of the financial statements and the reported amounts of revenues and expenses during the reporting period including estimates and assumptions related to taxation. Actual results could differ from those estimates by a significant amount. In addition, the Fund monitors for material events or transactions that may occur or become known after the period-end date and before the date the financial statements are released to print. |
| H. | Indemnifications – Under the Trust’s organizational documents, each Trustee, officer, employee or other agent of the Trust is indemnified against certain liabilities that may arise out of the performance of their duties to the Fund. Additionally, in the normal course of business, the Fund enters into contracts, including the Fund’s servicing agreements, that contain a variety of indemnification clauses. The Fund’s maximum exposure under these arrangements is unknown as this would involve future claims that may be made against the Fund that have not yet occurred. The risk of material loss as a result of such indemnification claims is considered remote. |
| 17 | Invesco American Value Fund |
NOTE 2—Advisory Fees and Other Fees Paid to Affiliates
The Trust has entered into a master investment advisory agreement with Invesco Advisers, Inc. (the "Adviser" or "Invesco"). Under the terms of the investment advisory agreement, the Fund accrues daily and pays monthly an advisory fee to the Adviser based on the annual rate of the Fund’s average daily net assets as follows:
| Average Daily Net Assets | Rate |
| First $500 million | 0.72% |
| Next $535 million | 0.715% |
| Next $31.965 billion | 0.65% |
| Over $33 billion | 0.64% |
For the year ended April 30, 2019, the effective advisory fees incurred by the Fund was 0.71%.
Under the terms of a master sub-advisory agreement between the Adviser and each of Invesco Asset Management Deutschland GmbH, Invesco Asset Management Limited, Invesco Asset Management (Japan) Limited, Invesco Hong Kong Limited, Invesco Senior Secured Management, Inc. and Invesco Canada Ltd. (collectively, the "Affiliated Sub-Advisers") the Adviser, not the Fund, will pay 40% of the fees paid to the Adviser to any such Affiliated Sub-Adviser(s) that provide(s) discretionary investment management services to the Fund based on the percentage of assets allocated to such Affiliated Sub-Adviser(s).
The Adviser has contractually agreed, through at least June 30, 2020, to waive advisory fees and/or reimburse expenses of all shares to the extent necessary to limit total annual fund operating expenses after fee waiver and/or expense reimbursement (excluding certain items discussed below) of Class A, Class C, Class R, Class Y, Class R5 and Class R6 shares to 2.00%, 2.75%, 2.25%, 1.75%, 1.75% and 1.75%, respectively, of average daily net assets (the "expense limits"). In determining the Adviser’s obligation to waive advisory fees and/or reimburse expenses, the following expenses are not taken into account, and could cause the total annual fund operating expenses after fee waiver and/or expense reimbursement to exceed the numbers reflected above: (1) interest; (2) taxes; (3) dividend expense on short sales; (4) extraordinary or non-routine items, including litigation expenses; and (5) expenses that the Fund has incurred but did not actually pay because of an expense offset arrangement. Unless Invesco continues the fee waiver agreement, it will terminate on June 30, 2020. During its term, the fee waiver agreement cannot be terminated or amended to increase the expense limits or reduce the advisory fee waiver without approval of the Board of Trustees. The Adviser did not waive fees and/or reimburse expenses during the period under these expense limits.
The Adviser has contractually agreed, through at least June 30, 2021, to waive the advisory fee payable by the Fund in an amount equal to 100% of the net advisory fees the Adviser receives from the affiliated money market funds on investments by the Fund of uninvested cash in such affiliated money market funds.
For the year ended April 30, 2019, the Adviser waived advisory fees of $31,348.
The Trust has entered into a master administrative services agreement with Invesco pursuant to which the Fund has agreed to pay Invesco for certain administrative costs incurred in providing accounting services to the Fund. For the year ended April 30, 2019, expenses incurred under the agreement are shown in the Statement of Operations asAdministrative services fees. Also, Invesco has entered into a sub-administration agreement whereby State Street Bank and Trust Company (“SSB”) serves as custodian and fund accountant and provides certain administrative services to the Fund.
The Trust has entered into a transfer agency and service agreement with Invesco Investment Services, Inc. (“IIS”) pursuant to which the Fund has agreed to pay IIS a fee for providing transfer agency and shareholder services to the Fund and reimburse IIS for certain expenses incurred by IIS in the course of providing such services. IIS may make payments to intermediaries that provide omnibus account services, sub-accounting services and/or networking services. All fees payable by IIS to intermediaries that provide omnibus account services or sub-accounting services are charged back to the Fund, subject to certain limitations approved by the Trust’s Board of Trustees. For the year ended April 30, 2019, expenses incurred under the agreement are shown in the Statement of Operations asTransfer agent fees.
Shares of the Fund are distributed by Invesco Distributors, Inc. (“IDI”). The Fund has adopted a distribution plan pursuant to Rule 12b-1 under the 1940 Act, and a service plan (collectively, the “Plans”) for Class A, Class C and Class R shares to compensate IDI for the sale, distribution, shareholder servicing and maintenance of shareholder accounts for these shares. Under the Plans, the Fund will incur annual fees of up to 0.25% of Class A average daily net assets, up to 1.00% of Class C average daily net assets and up to 0.50% of Class R average daily net assets. The fees are accrued daily and paid monthly.
With respect to Class C shares, the Fund is authorized to reimburse in future years any distribution related expenses that exceed the maximum annual reimbursement rate for such class, so long as such reimbursement does not cause the Fund to exceed the Class C maximum annual reimbursement rate, respectively. With respect to Class A shares, distribution related expenses that exceed the maximum annual reimbursement rate for such class are not carried forward to future years and the Fund will not reimburse IDI for any such expenses.
For the year ended April 30, 2019, expenses incurred under these agreements are shown in the Statement of Operations asDistribution fees.
Front-end sales commissions and CDSC (collectively, the “sales charges”) are not recorded as expenses of the Fund. Front-end sales commissions are deducted from proceeds from the sales of Fund shares prior to investment in Class A shares of the Fund. CDSC are deducted from redemption proceeds prior to remittance to the shareholder. During the year ended April 30, 2019, IDI advised the Fund that IDI retained $148,474 in front-end sales commissions from the sale of Class A shares and $5,907 and $1,526 from Class A and Class C shares, respectively, for CDSC imposed upon redemptions by shareholders.
For the year ended April 30, 2019, the Fund incurred $19,710 in brokerage commissions with Invesco Capital Markets, Inc., an affiliate of the Adviser and IDI, for portfolio transactions executed on behalf of the Fund.
Certain officers and trustees of the Trust are officers and directors of the Adviser, IIS and/or IDI.
NOTE 3—Additional Valuation Information
GAAP defines fair value as the price that would be received to sell an asset or paid to transfer a liability in an orderly transaction between market participants at the measurement date, under current market conditions. GAAP establishes a hierarchy that prioritizes the inputs to valuation methods, giving the highest priority to readily available unadjusted quoted prices in an active market for identical assets (Level 1) and the lowest priority to
| 18 | Invesco American Value Fund |
significant unobservable inputs (Level 3), generally when market prices are not readily available or are unreliable. Based on the valuation inputs, the securities or other investments are tiered into one of three levels. Changes in valuation methods may result in transfers in or out of an investment’s assigned level:
Level 1 — Prices are determined using quoted prices in an active market for identical assets.
Level 2 — Prices are determined using other significant observable inputs. Observable inputs are inputs that other market participants may use in pricing a security. These may include quoted prices for similar securities, interest rates, prepayment speeds, credit risk, yield curves, loss severities, default rates, discount rates, volatilities and others.
Level 3 — Prices are determined using significant unobservable inputs. In situations where quoted prices or observable inputs are unavailable (for example, when there is little or no market activity for an investment at the end of the period), unobservable inputs may be used. Unobservable inputs reflect the Fund’s own assumptions about the factors market participants would use in determining fair value of the securities or instruments and would be based on the best available information.
As of April 30, 2019, all of the securities in this Fund were valued based on Level 1 inputs (see the Schedule of Investments for security categories). The level assigned to the securities valuations may not be an indication of the risk or liquidity associated with investing in those securities. Because of the inherent uncertainties of valuation, the values reflected in the financial statements may materially differ from the value received upon actual sale of those investments.
NOTE 4—Expense Offset Arrangement(s)
The expense offset arrangement is comprised of transfer agency credits which result from balances in demand deposit accounts used by the transfer agent for clearing shareholder transactions. For the year ended April 30, 2019, the Fund received credits from this arrangement, which resulted in the reduction of the Fund’s total expenses of $8,873.
NOTE 5—Trustees’ and Officers’ Fees and Benefits
Trustees’ and Officers’ Fees and Benefits include amounts accrued by the Fund to pay remuneration to certain Trustees and Officers of the Fund. Trustees have the option to defer compensation payable by the Fund, and Trustees’ and Officers’ Fees and Benefits also include amounts accrued by the Fund to fund such deferred compensation amounts. Those Trustees who defer compensation have the option to select various Invesco Funds in which their deferral accounts shall be deemed to be invested. Finally, certain current Trustees were eligible to participate in a retirement plan that provided for benefits to be paid upon retirement to Trustees over a period of time based on the number of years of service. The Fund may have certain former Trustees who also participate in a retirement plan and receive benefits under such plan.Trustees’ and Officers’ Fees and Benefits include amounts accrued by the Fund to fund such retirement benefits. Obligations under the deferred compensation and retirement plans represent unsecured claims against the general assets of the Fund.
NOTE 6—Cash Balances
The Fund is permitted to temporarily carry a negative or overdrawn balance in its account with SSB, the custodian bank. Such balances, if any at period-end, are shown in the Statement of Assets and Liabilities under the payable captionAmount due custodian. To compensate the custodian bank for such overdrafts, the overdrawn Fund may either (1) leave funds as a compensating balance in the account so the custodian bank can be compensated by earning the additional interest; or (2) compensate by paying the custodian bank at a rate agreed upon by the custodian bank and Invesco, not to exceed the contractually agreed upon rate.
NOTE 7—Distributions to Shareholders and Tax Components of Net Assets
| Tax Character of Distributions to Shareholders Paid During the Fiscal Years Ended April 30, 2019 and 2018 |
| | 2019 | 2018 |
| Ordinary income | $16,405,908 | $21,008,619 |
| Long-term capital gain | 112,525,632 | 150,613,185 |
| Total distributions | $128,931,540 | $171,621,804 |
| Tax Components of Net Assets at Period-End: |
| | 2019 |
| Undistributed ordinary income | $655,944 |
| Undistributed long-term capital gain | 19,925,528 |
| Net unrealized appreciation — investments | 182,074,861 |
| Temporary book/tax differences | (172,816) |
| Shares of beneficial interest | 969,816,513 |
| Total net assets | $1,172,300,030 |
The difference between book-basis and tax-basis unrealized appreciation (depreciation) is due to differences in the timing of recognition of gains and losses on investments for tax and book purposes. The Fund’s net unrealized appreciation difference is attributable primarily to wash sales.
The temporary book/tax differences are a result of timing differences between book and tax recognition of income and/or expenses. The Fund’s temporary book/tax differences are the result of the trustee deferral of compensation and retirement plan benefits.
Capital loss carryforward is calculated and reported as of a specific date. Results of transactions and other activity after that date may affect the amount of capital loss carryforward actually available for the Fund to utilize. Capital losses generated in years beginning after December 22, 2010
| 19 | Invesco American Value Fund |
can be carried forward for an unlimited period, whereas previous losses expire in eight tax years. Capital losses with an expiration period may not be used to offset capital gains until all net capital losses without an expiration date have been utilized. Capital loss carryforwards with no expiration date will retain their character as either short-term or long-term capital losses instead of as short-term capital losses as under prior law. The ability to utilize capital loss carryforwards in the future may be limited under the Internal Revenue Code and related regulations based on the results of future transactions.
The Fund does not have a capital loss carryforward as of April 30, 2019.
NOTE 8—Investment Transactions
The aggregate amount of investment securities (other than short-term securities, U.S. Treasury obligations and money market funds, if any) purchased and sold by the Fund during the year ended April 30, 2019 was $465,441,499 and $728,600,579, respectively. Cost of investments, including any derivatives, on a tax basis includes the adjustments for financial reporting purposes as of the most recently completed federal income tax reporting period-end.
| Unrealized Appreciation (Depreciation) of Investments on a Tax Basis |
| Aggregate unrealized appreciation of investments | $231,340,025 |
| Aggregate unrealized (depreciation) of investments | (49,265,164) |
| Net unrealized appreciation of investments | $182,074,861 |
Cost of investments for tax purposes is $993,172,520.
NOTE 9—Reclassification of Permanent Differences
Primarily as a result of differing book/tax treatment of distributions, on April 30, 2019, undistributed net investment income was decreased by $4,306,758 and undistributed net realized gain was increased by $4,306,758. This reclassification had no effect on the net assets or the distributable earnings of the Fund.
| 20 | Invesco American Value Fund |
NOTE 10—Share Information
| | Summary of Share Activity |
| | Years ended April 30, |
| | 2019(a) | | 2018 |
| | Shares | Amount | | Shares | Amount |
| Sold: | | | | | |
| Class A | 2,374,194 | $84,237,878 | | 2,004,048 | $77,137,757 |
| Class B(b) | — | — | | 506 | 17,460 |
| Class C | 143,531 | 4,246,582 | | 233,383 | 7,489,760 |
| Class R | 146,104 | 5,203,373 | | 159,352 | 6,084,636 |
| Class Y | 888,661 | 32,058,634 | | 1,405,732 | 54,537,338 |
| Class R5 | 170,349 | 6,146,454 | | 297,685 | 11,567,453 |
| Class R6 | 489,656 | 18,018,069 | | 2,174,774 | 84,930,953 |
| Issued as reinvestment of dividends: | | | | | |
| Class A | 2,825,470 | 84,340,635 | | 2,733,728 | 100,273,142 |
| Class B(b) | — | — | | 17,455 | 558,196 |
| Class C | 330,584 | 7,897,661 | | 327,537 | 9,914,559 |
| Class R | 72,283 | 2,149,682 | | 100,866 | 3,681,624 |
| Class Y | 488,901 | 14,691,467 | | 614,701 | 22,700,901 |
| Class R5 | 99,659 | 2,995,763 | | 198,624 | 7,337,161 |
| Class R6 | 248,801 | 7,478,944 | | 423,926 | 15,668,308 |
| Conversion of Class B shares to Class A shares:(c) | | | | | |
| Class A | — | — | | 115,057 | 4,583,874 |
| Class B | — | — | | (132,629) | (4,583,874) |
| Automatic conversion of Class C shares to Class A shares: | | | | | |
| Class A | 1,046,064 | 33,068,721 | | - | - |
| Class C | (1,308,333) | (33,068,721) | | - | - |
| Reacquired: | | | | | |
| Class A | (5,025,225) | (177,703,256) | | (7,241,055) | (279,127,032) |
| Class B(b) | — | — | | (98,282) | (3,364,419) |
| Class C | (674,289) | (19,878,539) | | (987,732) | (31,817,907) |
| Class R | (287,002) | (10,369,236) | | (828,391) | (31,525,812) |
| Class Y | (2,220,865) | (78,695,581) | | (6,329,974) | (245,867,535) |
| Class R5 | (1,068,701) | (41,829,136) | | (1,117,681) | (43,419,470) |
| Class R6 | (2,369,083) | (92,336,577) | | (3,232,863) | (127,118,275) |
| Net increase (decrease) in share activity | (3,629,241) | $(151,347,183) | | (9,161,233) | $(360,341,202) |
| (a) | There are entities that are record owners of more than 5% of the outstanding shares of the Fund and in the aggregate own 52% of the outstanding shares of the Fund. IDI has an agreement with these entities to sell Fund shares. The Fund, Invesco and/or Invesco affiliates may make payments to these entities, which are considered to be related to the Fund, for providing services to the Fund, Invesco and/or Invesco affiliates including but not limited to services such as securities brokerage, distribution, third party record keeping and account servicing. The Fund has no knowledge as to whether all or any portion of the shares owned of record by these entities are also owned beneficially. |
| (b) | Class B shares activity for the period May 1, 2017 through January 26, 2018 (date of conversion). |
| (c) | Effective as of the close of business on January 26, 2018, all outstanding Class B shares were converted to Class A shares. |
| 21 | Invesco American Value Fund |
Report of Independent Registered Public Accounting Firm
To the Board of Trustees of AIM Sector Funds (Invesco Sector Funds) and Shareholders of Invesco American Value Fund:
Opinion on the Financial Statements
We have audited the accompanying statement of assets and liabilities, including the schedule of investments, of Invesco American Value Fund (one of the funds constituting AIM Sector Funds (Invesco Sector Funds), hereafter referred to as the “Fund”) as of April 30, 2019, the related statement of operations for the year ended April 30, 2019, the statement of changes in net assets for each of the two years in the period ended April 30, 2019, including the related notes, and the financial highlights for each of the five years in the period ended April 30, 2019 (collectively referred to as the “financial statements”). In our opinion, the financial statements present fairly, in all material respects, the financial position of the Fund as of April 30, 2019, the results of its operations for the year then ended, the changes in its net assets for each of the two years in the period ended April 30, 2019 and the financial highlights for each of the five years in the period ended April 30, 2019 in conformity with accounting principles generally accepted in the United States of America.
Basis for Opinion
These financial statements are the responsibility of the Fund’s management. Our responsibility is to express an opinion on the Fund’s financial statements based on our audits. We are a public accounting firm registered with the Public Company Accounting Oversight Board (United States) (“PCAOB”) and are required to be independent with respect to the Fund in accordance with the U.S. federal securities laws and the applicable rules and regulations of the Securities and Exchange Commission and the PCAOB.
We conducted our audits of these financial statements in accordance with the standards of the PCAOB. Those standards require that we plan and perform the audit to obtain reasonable assurance about whether the financial statements are free of material misstatement, whether due to error or fraud.
Our audits included performing procedures to assess the risks of material misstatement of the financial statements, whether due to error or fraud, and performing procedures that respond to those risks. Such procedures included examining, on a test basis, evidence regarding the amounts and disclosures in the financial statements. Our audits also included evaluating the accounting principles used and significant estimates made by management, as well as evaluating the overall presentation of the financial statements. Our procedures included confirmation of securities owned as of April 30, 2019 by correspondence with the custodian, transfer agent and brokers; when replies were not received from brokers, we performed other auditing procedures. We believe that our audits provide a reasonable basis for our opinion.
PricewaterhouseCoopers LLP
Houston, TX
June 26, 2019
We have served as the auditor of one or more of the investment companies in the Invesco group of investment companies since at least 1995. We have not been able to determine the specific year we began serving as auditor.
| 22 | Invesco American Value Fund |
Calculating your ongoing Fund expenses
Example
As a shareholder of the Fund, you incur two types of costs: (1) transaction costs, which may include sales charges (loads) on purchase payments or contingent deferred sales charges on redemptions, if any; and (2) ongoing costs, including management fees, distribution and/or service (12b-1) fees, and other Fund expenses. This example is intended to help you understand your ongoing costs (in dollars) of investing in the Fund and to compare these costs with ongoing costs of investing in other mutual funds. The example is based on an investment of $1,000 invested at the beginning of the period and held for the entire period November 1, 2018 through April 30, 2019.
Actual expenses
The table below provides information about actual account values and actual expenses. You may use the information in this table, together with the amount you invested, to estimate the expenses that you paid over the period. Simply divide your account value by $1,000 (for example, an $8,600 account value divided by $1,000 = 8.6), then multiply the result by the number in the table under the heading entitled “Actual Expenses Paid During Period” to estimate the expenses you paid on your account during this period.
Hypothetical example for comparison purposes
The table below also provides information about hypothetical account values and hypothetical expenses based on the Fund’s actual expense ratio and an assumed rate of return of 5% per year before expenses, which is not the Fund’s actual return.
The hypothetical account values and expenses may not be used to estimate the actual ending account balance or expenses you paid for the period. You may use this information to compare the ongoing costs of investing in the Fund and other funds. To do so, compare this 5% hypothetical example with the 5% hypothetical examples that appear in the shareholder reports of the other funds.
Please note that the expenses shown in the table are meant to highlight your ongoing costs only and do not reflect any transaction costs, such as sales charges (loads) on purchase payments or contingent deferred sales charges on redemptions, if any. Therefore, the hypothetical information is useful in comparing ongoing costs only, and will not help you determine the relative total costs of owning different funds. In addition, if these transaction costs were included, your costs would have been higher.
| | Beginning
Account Value (11/01/18) | ACTUAL | HYPOTHETICAL
(5% annual return before
expenses) | Annualized
Expense
Ratio |
Ending
Account Value
(04/30/19)1 | Expenses
Paid During
Period2 | Ending
Account Value
(04/30/19) | Expenses
Paid During
Period2 |
| Class A | $1,000.00 | $1,083.00 | $6.30 | $1,018.74 | $6.11 | 1.22% |
| Class C | 1,000.00 | 1,079.20 | 10.05 | 1,015.12 | 9.74 | 1.95 |
| Class R | 1,000.00 | 1,081.80 | 7.59 | 1,017.50 | 7.35 | 1.47 |
| Class Y | 1,000.00 | 1,084.30 | 5.01 | 1,019.98 | 4.86 | 0.97 |
| Class R5 | 1,000.00 | 1,084.90 | 4.50 | 1,020.48 | 4.36 | 0.87 |
| Class R6 | 1,000.00 | 1,085.30 | 4.08 | 1,020.88 | 3.96 | 0.79 |
| 1 | The actual ending account value is based on the actual total return of the Fund for the period November 1, 2018 through April 30, 2019, after actual expenses and will differ from the hypothetical ending account value which is based on the Fund’s expense ratio and a hypothetical annual return of 5% before expenses. |
| 2 | Expenses are equal to the Fund’s annualized expense ratio as indicated above multiplied by the average account value over the period, multiplied by 181/365 to reflect the most recent fiscal half year. |
| 23 | Invesco American Value Fund |
Tax Information
Form 1099-DIV, Form 1042-S and other year–end tax information provide shareholders with actual calendar year amounts that should be included in their tax returns. Shareholders should consult their tax advisers.
The following distribution information is being provided as required by the Internal Revenue Code or to meet a specific state’s requirement.
The Fund designates the following amounts or, if subsequently determined to be different, the maximum amount allowable for its fiscal year ended April 30, 2019:
| Federal and State Income Tax | |
| Long-Term Capital Gain Distributions | $112,525,632 |
| Qualified Dividend Income* | 77.88% |
| Corporate Dividends Received Deduction* | 78.63% |
| Qualified Business Income | 2.52% |
| U.S. Treasury Obligations* | 0.00% |
| * | The above percentages are based on ordinary income dividends paid to shareholders during the Fund’s fiscal year. |
| | |
| Non-Resident Alien Shareholders | |
| Qualified Short-Term Gains | $11,204,552 |
| 24 | Invesco American Value Fund |
Trustees and Officers
The address of each trustee and officer is AIM Sector Funds (Invesco Sector Funds) (the “Trust”), 11 Greenway Plaza, Suite 1000, Houston, Texas 77046-1173. The trustees serve for the life of the Trust, subject to their earlier death, incapacitation, resignation, retirement or removal as more specifically provided in the Trust’s organizational documents. Each officer serves for a one year term or until their successors are elected and qualified. Column two below includes length of time served with predecessor entities, if any.
| | | | | | | | |
Name, Year of Birth and
Position(s) Held with the Trust | | Trustee and/
or Officer Since | | Principal Occupation(s)
During Past 5 Years | | Number of Funds in Fund
Complex
Overseen by
Trustee | | Other Directorship(s)
Held by Trustee During
Past 5 Years |
| Interested Persons | | | | | | | | |
Martin L. Flanagan1 — 1960 Trustee and Vice Chair | | 2007 | | Executive Director, Chief Executive Officer and President, Invesco Ltd. (ultimate parent of Invesco and a global investment management firm); Trustee and Vice Chair, The Invesco Funds; Vice Chair, Investment Company Institute; and Member of Executive Board, SMU Cox School of Business Formerly: Advisor to the Board, Invesco Advisers, Inc. (formerly known as Invesco Institutional (N.A.), Inc.); Chairman and Chief Executive Officer, Invesco Advisers, Inc. (registered investment adviser); Director, Chairman, Chief Executive Officer and President, Invesco Holding Company (US), Inc. (formerly IVZ Inc.) (holding company), Invesco Group Services, Inc. (service provider) and Invesco North American Holdings, Inc. (holding company); Director, Chief Executive Officer and President, Invesco Holding Company Limited (parent of Invesco and a global investment management firm); Director, Invesco Ltd.; Chairman, Investment Company Institute and President,Co-Chief Executive Officer,Co-President, Chief Operating Officer and Chief Financial Officer, Franklin Resources, Inc. (global investment management organization) | | 241 | | None |
Philip A. Taylor2 — 1954 Trustee | | 2006 | | Vice Chair, Invesco Ltd.; Director, Invesco Canada Ltd. (formerly known as Invesco Trimark Ltd./Invesco Trimark Ltèe) (registered investment adviser and registered transfer agent); Trustee, The Invesco Funds Formerly: Head of the Americas and Senior Managing Director, Invesco Ltd.; Director, Invesco Advisers, Inc. (formerly known as Invesco Institutional (N.A.), Inc.) (registered investment adviser); Director and Chairman, Invesco Investment Services, Inc. (formerly known as Invesco AIM Investment Services, Inc.) (registered transfer agent); Chief Executive Officer, Invesco Corporate Class Inc. (corporate mutual fund company); Chairman and Chief Executive Officer, Invesco Canada Ltd. (formerly known as Invesco Trimark Ltd./Invesco Trimark Ltèe) (registered investment adviser and registered transfer agent); Senior Vice President, The Invesco Funds; Director, Invesco Investment Advisers LLC (formerly known as Van Kampen Asset Management); Director, Chairman, Chief Executive Officer and President, Invesco Management Group, Inc. (formerly known as Invesco AIM Management Group, Inc.) (financial services holding company);Co-Chairman,Co-President andCo-Chief Executive Officer, Invesco Advisers, Inc. (formerly known as Invesco Institutional (N.A.), Inc.) (registered investment adviser); Director, Chief Executive Officer and President, Van Kampen Exchange Corp; President and Principal Executive Officer, The Invesco Funds (other than AIM Treasurer’s Series Trust (Invesco Treasurer’s Series Trust), Short-Term Investments Trust and Invesco Management Trust); Executive Vice President, The Invesco Funds (AIM Treasurer’s Series Trust (Invesco Treasurer’s Series Trust), Short-Term Investments Trust and Invesco Management Trust only); Director and President, INVESCO Funds Group, Inc. (registered investment adviser and registered transfer agent); Director and Chairman, IVZ Distributors, Inc. (formerly known as INVESCO Distributors, Inc.) (registered broker dealer); Director, President and Chairman, Invesco Inc. (holding company), Invesco Canada Holdings Inc. (holding company), Trimark Investments Ltd./Placements Trimark Ltèe and Invesco Financial Services Ltd/Services Financiers Invesco Ltèe; Chief Executive Officer, Invesco Canada Fund Inc. (corporate mutual fund company); Director and Chairman, Van Kampen Investor Services Inc.; Director, Chief Executive Officer and President, 1371 Preferred Inc. (holding company) and Van Kampen Investments Inc.; Director and President, AIM GP Canada Inc. (general partner for limited partnerships) and Van Kampen Advisors, Inc.; Director and Chief Executive Officer, Invesco Trimark Dealer Inc. (registered broker dealer); Director, Invesco Distributors, Inc. (formerly known as Invesco AIM Distributors, Inc.) (registered broker dealer); Manager, Invesco Capital Management LLC; Director, Chief Executive Officer and President, Invesco Advisers, Inc.; Director, Chairman, Chief Executive Officer and President, Invesco AIM Capital Management, Inc.; President, Invesco Trimark Dealer Inc. and Invesco Trimark Ltd./Invesco Trimark Ltèe; Director and President, AIM Trimark Corporate Class Inc. and AIM Trimark Canada Fund Inc.; Senior Managing Director, Invesco Holding Company Limited; Director and Chairman, Fund Management Company (former registered broker dealer); President and Principal Executive Officer, The Invesco Funds (AIM Treasurer’s Series Trust (Invesco Treasurer’s Series Trust), and Short-Term Investments Trust only); President, AIM Trimark Global Fund Inc. and AIM Trimark Canada Fund Inc. | | 241 | | None |
| 1 | Mr. Flanagan is considered an interested person (within the meaning of Section 2(a)(19) of the 1940 Act) of the Trust because he is an officer of the Adviser to the Trust, and an officer and a director of Invesco Ltd., ultimate parent of the Adviser. |
| 2 | Mr. Taylor is considered an interested person (within the meaning of Section 2(a)(19) of the 1940 Act) of the Trust because he is an officer of Invesco Ltd., ultimate parent of the Adviser. |
T-1 Invesco American Value Fund
Trustees and Officers—(continued)
| | | | | | | | |
Name, Year of Birth and
Position(s) Held with the Trust | | Trustee and/
or Officer Since | | Principal Occupation(s)
During Past 5 Years | | Number of Funds in Fund
Complex
Overseen by
Trustee | | Other Directorship(s)
Held by Trustee During
Past 5 Years |
| Independent Trustees | | | | | | | | |
Bruce L. Crockett — 1944 Trustee and Chair | | 2003 | | Chairman, Crockett Technologies Associates (technology consulting company) Formerly: Director, Captaris (unified messaging provider); Director, President and Chief Executive Officer, COMSAT Corporation; Chairman, Board of Governors of INTELSAT (international communications company); ACE Limited (insurance company); Independent Directors Council and Investment Company Institute: Member of the Audit Committee, Investment Company Institute; Member of the Executive Committee and Chair of the Governance Committee, Independent Directors Council | | 241 | | Director and Chairman of the Audit Committee, ALPS (Attorneys Liability Protection Society) (insurance company); Director and Member of the Audit Committee and Compensation Committee, Ferroglobe PLC (metallurgical company) |
David C. Arch — 1945 Trustee | | 2010 | | Chairman of Blistex Inc. (consumer health care products manufacturer); Member, World Presidents’ Organization | | 241 | | Board member of the Illinois Manufacturers’ Association |
Beth Ann Brown3 — 1968 Trustee | | 2019 | | Independent Consultant Formerly: Head of Intermediary Distribution, Managing Director, Strategic Relations, Managing Director, Head of National Accounts, Senior Vice President, National Account Manager and Senior Vice President, Key Account Manager, Columbia Management Investment Advisers LLC; Vice President, Key Account Manager, Liberty Funds Distributor, Inc.; and Trustee of certain Oppenheimer Funds | | 225 | | Director, Board of Directors of Caron Engineering Inc.; Advisor, Board of Advisors of Caron Engineering Inc.; President and Director, Acton Shapleigh Youth Conservation Corps (non -profit); and Vice President and Director of Grahamtastic Connection(non-profit) |
Jack M. Fields — 1952 Trustee | | 2003 | | Chief Executive Officer, Twenty First Century Group, Inc. (government affairs company); and Chairman, Discovery Learning Alliance(non-profit) Formerly: Owner and Chief Executive Officer, Dos Angeles Ranch L.P. (cattle, hunting, corporate entertainment); Director, Insperity, Inc. (formerly known as Administaff) (human resources provider); Chief Executive Officer, Texana Timber LP (sustainable forestry company); Director of Cross Timbers Quail Research Ranch(non-profit); and member of the U.S. House of Representatives | | 241 | | None |
Cynthia Hostetler — 1962 Trustee | | 2017 | | Non-Executive Director and Trustee of a number of public and private business corporations Formerly: Director, Aberdeen Investment Funds (4 portfolios); Head of Investment Funds and Private Equity, Overseas Private Investment Corporation; President, First Manhattan Bancorporation, Inc.; Attorney, Simpson Thacher & Bartlett LLP | | 241 | | Vulcan Materials Company (construction materials company); Trilinc Global Impact Fund; Genesee & Wyoming, Inc. (railroads); Artio Global Investment LLC (mutual fund complex); Edgen Group, Inc. (specialized energy and infrastructure products distributor); Investment Company Institute (professional organization); Independent Directors Council (professional organization) |
Eli Jones — 1961 Trustee | | 2016 | | Professor and Dean, Mays Business School — Texas A&M University Formerly: Professor and Dean, Walton College of Business, University of Arkansas and E.J. Ourso College of Business, Louisiana State University; Director, Arvest Bank | | 241 | | Insperity, Inc. (formerly known as Administaff) (human resources provider) |
Elizabeth Krentzman3 — 1959 Trustee | | 2019 | | Formerly: Principal and Chief Regulatory Advisor for Asset Management Services and U.S. Mutual Fund Leader of Deloitte & Touche LLP; General Counsel of the Investment Company Institute (trade association); National Director of the Investment Management Regulatory Consulting Practice, Principal, Director and Senior Manager of Deloitte & Touche LLP; Assistant Director of the Division of Investment Management — Office of Disclosure and Investment Adviser Regulation of the U.S. Securities and Exchange Commission and various positions with the Division of Investment Management — Office of Regulatory Policy of the U.S. Securities and Exchange Commission; Associate at Ropes & Gray LLP; Advisory Board Member of the Securities and Exchange Commission Historical Society; and Trustee of certain Oppenheimer Funds | | 225 | | Trustee of the University of Florida National Board Foundation and Audit Committee Member; Member of the Cartica Funds Board of Directors (private investment funds); Member of the University of Florida Law Center Association, Inc. Board of Trustees and Audit Committee Member |
Anthony J. LaCava, Jr. — 1956 Trustee | | 2019 | | Formerly: Director and Member of the Audit Committee, Blue Hills Bank (publicly traded financial institution) and Managing Partner, KPMG LLP | | 241 | | Blue Hills Bank; Chairman, Bentley University; Member, Business School Advisory Council; and Nominating Committee, KPMG LLP |
Prema Mathai-Davis — 1950 Trustee | | 2003 | | Retired Co-Owner & Partner of Quantalytics Research, LLC, (a FinTech Investment Research Platform for the Self-Directed Investor) | | 241 | | None |
| 3 | Mss. Brown and Krentzman and Messrs. Motley, Vandivort and Vaughn were appointed as Trustees of the Trust effective June 10, 2019. |
T-2 Invesco American Value Fund
Trustees and Officers—(continued)
| | | | | | | | |
Name, Year of Birth and
Position(s) Held with the Trust | | Trustee and/
or Officer Since | | Principal Occupation(s)
During Past 5 Years | | Number of Funds in Fund
Complex
Overseen by
Trustee | | Other Directorship(s)
Held by Trustee During
Past 5 Years |
| Independent Trustees—(continued) |
Joel W. Motley3 — 1952 Trustee | | 2019 | | Director of Office of Finance, Federal Home Loan Bank; Member of the Vestry of Trinity Wall Street; Managing Director of Carmona Motley Inc. (privately held financial advisor); Member of the Finance and Budget Committee of the Council on Foreign Relations, Member of the Investment Committee and Board of Human Rights Watch and Member of the Investment Committee and Board of Historic Hudson Valley(non-profit cultural organization) Formerly: Managing Director of Public Capital Advisors, LLC (privately held financial advisor); Managing Director of Carmona Motley Hoffman, Inc. (privately held financial advisor); Trustee of certain Oppenheimer Funds; and Director of Columbia Equity Financial Corp. (privately held financial advisor) | | 225 | | Director of Greenwall Foundation (bioethics research foundation); Member of Board and Investment Committee of The Greenwall Foundation; Director of Southern Africa Legal Services Foundation; Board Member and Investment Committee Member of Pulitzer Center for Crisis Reporting(non-profit journalism) |
Teresa M. Ressel — 1962 Trustee | | 2017 | | Non-executive director and trustee of a number of public and private business corporations Formerly: Chief Financial Officer, Olayan America, The Olayan Group (international investor/commercial/industrial); Chief Executive Officer, UBS Securities LLC; Group Chief Operating Officer, Americas, UBS AG; Assistant Secretary for Management & Budget and CFO, US Department of the Treasury | | 241 | | Atlantic Power Corporation (power generation company); ON Semiconductor Corp. (semiconductor supplier) |
Ann Barnett Stern — 1957 Trustee | | 2017 | | President and Chief Executive Officer, Houston Endowment Inc. (private philanthropic institution) Formerly: Executive Vice President and General Counsel, Texas Children’s Hospital; Attorney, Beck, Redden and Secrest, LLP; Business Law Instructor, University of St. Thomas; Attorney, Andrews & Kurth LLP | | 241 | | Federal Reserve Bank of Dallas |
Raymond Stickel, Jr. — 1944 Trustee | | 2005 | | Retired Formerly: Director, Mainstay VP Series Funds, Inc. (25 portfolios); Partner, Deloitte & Touche | | 241 | | None |
Robert C. Troccoli — 1949 Trustee | | 2016 | | Adjunct Professor, University of Denver — Daniels College of Business Formerly: Senior Partner, KPMG LLP | | 241 | | None |
Daniel S. Vandivort3 — 1954 Trustee | | 2019 | | Treasurer, Chairman of the Audit and Finance Committee, and Trustee, Board of Trustees, Huntington Disease Foundation of America; and President, Flyway Advisory Services LLC (consulting and property management) Formerly: Trustee and Governance Chair, of certain Oppenheimer Funds | | 225 | | Chairman and Lead Independent Director, Chairman of the Audit Committee, and Director, Board of Directors, Value Line Funds |
James D. Vaughn3 — 1945 Trustee | | 2019 | | Retired Formerly: Managing Partner, Deloitte & Touche LLP; Trustee and Chairman of the Audit Committee, Schroder Funds; Board Member, Mile High United Way, Boys and Girls Clubs, Boy Scouts, Colorado Business Committee for the Arts, Economic Club of Colorado and Metro Denver Network (economic development corporation); and Trustee of certain Oppenheimer Funds | | 225 | | Board member and Chairman of Audit Committee of AMG National Trust Bank; Trustee and Investment Committee member, University of South Dakota Foundation; Board member, Audit Committee Member and past Board Chair, Junior Achievement(non-profit) |
Christopher L. Wilson — 1957 Trustee and Vice Chair | | 2017 | | Non-executive director and trustee of a number of public and private business corporations Formerly: Director, TD Asset Management USA Inc. (mutual fund complex) (22 portfolios); Managing Partner, CT2, LLC (investing and consulting firm); President/Chief Executive Officer, Columbia Funds, Bank of America Corporation; President/Chief Executive Officer, CDC IXIS Asset Management Services, Inc.; Principal & Director of Operations, Scudder Funds, Scudder, Stevens & Clark, Inc.; Assistant Vice President, Fidelity Investments | | 241 | | ISO New England, Inc.(non-profit organization managing regional electricity market) |
| Other Officers | | | | | | | | |
Sheri Morris — 1964 President, Principal Executive Officer and Treasurer | | 2003 | | President, Principal Executive Officer and Treasurer, The Invesco Funds; Vice President, Invesco Advisers, Inc. (formerly known as Invesco Institutional (N.A.), Inc.) (registered investment adviser); and Vice President, Invesco Exchange-Traded Fund Trust, Invesco Exchange-Traded Fund Trust II, Invesco India Exchange-Traded Fund Trust, Invesco Actively Managed Exchange-Traded Fund Trust, Invesco Actively Managed Exchange-Traded Commodity Fund Trust and Invesco Exchange-Traded Self-Indexed Fund Trust Formerly: Vice President and Principal Financial Officer, The Invesco Funds; Vice President, Invesco AIM Advisers, Inc., Invesco AIM Capital Management, Inc. and Invesco AIM Private Asset Management, Inc.; Assistant Vice President and Assistant Treasurer, The Invesco Funds and Assistant Vice President, Invesco Advisers, Inc., Invesco AIM Capital Management, Inc. and Invesco AIM Private Asset Management, Inc.; and Treasurer, Invesco Exchange-Traded Fund Trust, Invesco Exchange-Traded Fund Trust II, Invesco India Exchange-Traded Fund Trust and Invesco Actively Managed Exchange-Traded Fund Trust | | N/A | | N/A |
Russell C. Burk — 1958 Senior Vice President and Senior Officer | | 2005 | | Senior Vice President and Senior Officer, The Invesco Funds | | N/A | | N/A |
| 3 | Mss. Brown and Krentzman and Messrs. Motley, Vandivort and Vaughn were appointed as Trustees of the Trust effective June 10, 2019. |
T-3 Invesco American Value Fund
Trustees and Officers—(continued)
| | | | | | | | |
Name, Year of Birth and
Position(s) Held with the Trust | | Trustee and/
or Officer Since | | Principal Occupation(s)
During Past 5 Years | | Number of Funds in Fund
Complex
Overseen by
Trustee | | Other Directorship(s)
Held by Trustee During
Past 5 Years |
| Other Officers—(continued) | | | | | | | | |
Jeffrey H. Kupor — 1968 Senior Vice President, Chief Legal Officer and Secretary | | 2018 | | Head of Legal of the Americas, Invesco Ltd.; Senior Vice President and Secretary, Invesco Advisers, Inc. (formerly known as Invesco Institutional (N.A.), Inc.) (registered investment adviser); Senior Vice President and Secretary, Invesco Distributors, Inc. (formerly known as Invesco AIM Distributors, Inc.); Vice President and Secretary, Invesco Investment Services, Inc. (formerly known as Invesco AIM Investment Services, Inc.) Senior Vice President, Chief Legal Officer and Secretary, The Invesco Funds; Secretary and General Counsel, Invesco Investment Advisers LLC (formerly known as Van Kampen Asset Management); Secretary and General Counsel, Invesco Capital Markets, Inc. (formerly known as Van Kampen Funds Inc.) and Chief Legal Officer, Invesco Exchange-Traded Fund Trust, Invesco Exchange-Traded Fund Trust II, Invesco India Exchange-Traded Fund Trust, Invesco Actively Managed Exchange-Traded Fund Trust, Invesco Actively Managed Exchange-Traded Commodity Fund Trust and Invesco Exchange-Traded Self-Indexed Fund Trust; Secretary, Invesco Indexing LLC; Secretary, W.L. Ross & Co., LLC; Secretary and Vice President, Jemstep, Inc. Formerly: Head of Legal, Worldwide Institutional, Invesco Ltd.; Secretary and General Counsel, INVESCO Private Capital Investments, Inc.; Senior Vice President, Secretary and General Counsel, Invesco Management Group, Inc. (formerly known as Invesco AIM Management Group, Inc.); Assistant Secretary, INVESCO Asset Management (Bermuda) Ltd.; Secretary and General Counsel, Invesco Private Capital, Inc.; Assistant Secretary and General Counsel, INVESCO Realty, Inc.; Secretary and General Counsel, Invesco Senior Secured Management, Inc.; and Secretary, Sovereign G./P. Holdings Inc. | | N/A | | N/A |
Andrew R. Schlossberg — 1974 Senior Vice President | | 2019 | | Head of the Americas and Senior Managing Director, Invesco Ltd.; Director and Senior Vice President, Invesco Advisers, Inc. (formerly known as Invesco Institutional (N.A.), Inc.) (registered investment adviser); Director and Chairman, Invesco Investment Services, Inc. (formerly known as Invesco AIM Investment Services, Inc.) (registered transfer agent); Senior Vice President, The Invesco Funds; Director, Invesco Investment Advisers LLC (formerly known as Van Kampen Asset Management) and Invesco UK Limited; Director, President and Chairman, Invesco Insurance Agency, Inc.; Director and Chief Executive, Invesco Asset Management Limited and Invesco Fund Managers Limited Formerly: Assistant Vice President, The Invesco Funds; Senior Vice President, Invesco Advisers, Inc. (formerly known as Invesco Institutional (N.A.), Inc.) (registered investment adviser); Director and Chief Executive, Invesco Administration Services Limited and Invesco Global Investment Funds Limited; Director, Invesco Distributors, Inc.; Head of EMEA, Invesco Ltd.; President, Invesco Actively Managed Exchange-Traded Commodity Fund Trust, Invesco Actively Managed Exchange-Traded Fund Trust, Invesco Exchange-Traded Fund Trust, Invesco Exchange-Traded Fund Trust II and Invesco India Exchange-Traded Fund Trust; Managing Director and Principal Executive Officer, Invesco Capital Management LLC | | N/A | | N/A |
John M. Zerr — 1962 Senior Vice President | | 2006 | | Chief Operating Officer of the Americas; Senior Vice President, Invesco Advisers, Inc. (formerly known as Invesco Institutional (N.A.), Inc.) (registered investment adviser); Senior Vice President, Invesco Distributors, Inc. (formerly known as Invesco AIM Distributors, Inc.); Director and Vice President, Invesco Investment Services, Inc. (formerly known as Invesco AIM Investment Services, Inc.) Senior Vice President, The Invesco Funds; Managing Director, Invesco Capital Management LLC; Director, Invesco Investment Advisers LLC (formerly known as Van Kampen Asset Management); Senior Vice President, Invesco Capital Markets, Inc. (formerly known as Van Kampen Funds Inc.); Manager, Invesco Indexing LLC; Director and Senior Vice President, Invesco Insurance Agency, Inc.; Invesco Canada Funds Advisory Board Member; Director, President Chief Executive Officer, Invesco Corporate Class Inc. (corporate mutual fund company); and Director, Chairman, President and Chief Executive Officer, Invesco Canada Ltd. (formerly known as Invesco Trimark Ltd./Invesco Trimark Ltèe) (registered investment adviser and registered transfer agent) Formerly: Director and Senior Vice President, Invesco Management Group, Inc. (formerly known as Invesco AIM Management Group, Inc.); Secretary and General Counsel, Invesco Management Group, Inc. (formerly known as Invesco AIM Management Group, Inc.); Secretary, Invesco Investment Services, Inc. (formerly known as Invesco AIM Investment Services, Inc.); Chief Legal Officer and Secretary, The Invesco Funds; Secretary and General Counsel, Invesco Investment Advisers LLC (formerly known as Van Kampen Asset Management); Secretary and General Counsel, Invesco Capital Markets, Inc. (formerly known as Van Kampen Funds Inc.); Chief Legal Officer, Invesco Exchange-Traded Fund Trust, Invesco Exchange-Traded Fund Trust II, Invesco India Exchange-Traded Fund Trust, Invesco Actively Managed Exchange-Traded Fund Trust, Invesco Actively Managed Exchange-Traded Commodity Fund Trust and Invesco Exchange-Traded Self-Indexed Fund Trust; Secretary, Invesco Indexing LLC; Director, Secretary, General Counsel and Senior Vice President, Van Kampen Exchange Corp.; Director, Vice President and Secretary, IVZ Distributors, Inc. (formerly known as INVESCO Distributors, Inc.); Director and Vice President, INVESCO Funds Group, Inc.; Director and Vice President, Van Kampen Advisors Inc.; Director, Vice President, Secretary and General Counsel, Van Kampen Investor Services Inc.; Director and Secretary, Invesco Distributors, Inc. (formerly known as Invesco AIM Distributors, Inc.); Director, Senior Vice President, General Counsel and Secretary, Invesco AIM Advisers, Inc. and Van Kampen Investments Inc.; Director, Vice President and Secretary, Fund Management Company; Director, Senior Vice President, Secretary, General Counsel and Vice President, Invesco AIM Capital Management, Inc.; Chief Operating Officer and General Counsel, Liberty Ridge Capital, Inc. (an investment adviser) | | N/A | | N/A |
T-4 Invesco American Value Fund
Trustees and Officers—(continued)
| | | | | | | | |
Name, Year of Birth and
Position(s) Held with the Trust | | Trustee and/
or Officer Since | | Principal Occupation(s)
During Past 5 Years | | Number of Funds in Fund
Complex
Overseen by
Trustee | | Other Directorship(s)
Held by Trustee During
Past 5 Years |
| Other Officers—(continued) | | | | | | | | |
Gregory G. McGreevey — 1962 Senior Vice President | | 2012 | | Senior Managing Director, Invesco Ltd.; Director, Chairman, President, and Chief Executive Officer, Invesco Advisers, Inc. (formerly known as Invesco Institutional (N.A.), Inc.) (registered investment adviser); Director, Invesco Mortgage Capital, Inc. and Invesco Senior Secured Management, Inc.; and Senior Vice President, The Invesco Funds Formerly: Senior Vice President, Invesco Management Group, Inc. and Invesco Advisers, Inc.; Assistant Vice President, The Invesco Funds | | N/A | | N/A |
Kelli Gallegos — 1970 Vice President, Principal Financial Officer and Assistant Treasurer | | 2008 | | Assistant Treasurer, Invesco Specialized Products, LLC; Vice President, Principal Financial Officer and Assistant Treasurer, The Invesco Funds; Principal Financial and Accounting Officer — Pooled Investments, Invesco Capital Management LLC; Vice President and Treasurer, Invesco Exchange-Traded Fund Trust, Invesco Exchange-Traded Fund Trust II, Invesco India Exchange-Traded Fund Trust, Invesco Actively Managed Exchange-Traded Fund Trust, Invesco Actively Managed Exchange-Traded Commodity Fund Trust and Invesco Exchange-Traded Self-Indexed Fund Trust Formerly: Assistant Treasurer, Invesco Exchange-Traded Fund Trust, Invesco Exchange-Traded Fund Trust II, Invesco India Exchange-Traded Fund Trust, Invesco Actively Managed Exchange-Traded Fund Trust, Invesco Actively Managed Exchange-Traded Commodity Fund Trust and Invesco Exchange-Traded Self-Indexed Fund Trust; Assistant Treasurer, Invesco Capital Management LLC; Assistant Vice President, The Invesco Funds | | N/A | | N/A |
Crissie M. Wisdom — 1969 Anti-Money Laundering Compliance Officer | | 2013 | | Anti-Money Laundering Compliance Officer, Invesco Advisers, Inc. (formerly known as Invesco Institutional (N.A.), Inc.) (registered investment adviser), Invesco Capital Markets, Inc. (formerly known as Van Kampen Funds Inc.), Invesco Distributors, Inc., Invesco Investment Services, Inc., The Invesco Funds, and Invesco Exchange-Traded Fund Trust, Invesco Exchange-Traded Fund Trust II, Invesco India Exchange-Traded Fund Trust, Invesco Actively Managed Exchange-Traded Fund Trust, Invesco Actively Managed Exchange-Traded Commodity Fund Trust and Invesco Exchange-Traded Self-Indexed Fund Trust; Anti-Money Laundering Compliance Officer and Bank Secrecy Act Officer, INVESCO National Trust Company and Invesco Trust Company; and Fraud Prevention Manager and Controls and Risk Analysis Manager for Invesco Investment Services, Inc. Formerly: Anti-Money Laundering Compliance Officer, Van Kampen Exchange Corp. and Invesco Management Group, Inc. | | N/A | | N/A |
Robert R. Leveille — 1969 Chief Compliance Officer | | 2016 | | Chief Compliance Officer, Invesco Advisers, Inc. (registered investment adviser); and Chief Compliance Officer, The Invesco Funds Formerly: Chief Compliance Officer, Putnam Investments and the Putnam Funds | | N/A | | N/A |
The Statement of Additional Information of the Trust includes additional information about the Fund’s Trustees and is available upon request, without charge, by calling 1.800.959.4246. Please refer to the Fund’s Statement of Additional Information for information on the Fund’ssub-advisers.
| | | | | | |
Office of the Fund 11 Greenway Plaza, Suite 1000 Houston, TX 77046-1173 | | Investment Adviser Invesco Advisers, Inc. 1555 Peachtree Street, N.E. Atlanta, GA 30309 | | Distributor Invesco Distributors, Inc. 11 Greenway Plaza, Suite 1000 Houston, TX 77046-1173 | | Auditors PricewaterhouseCoopers LLP 1000 Louisiana Street, Suite 5800 Houston, TX 77002-5021 |
| | | |
| | | | | | |
Counsel to the Fund Stradley Ronon Stevens & Young, LLP 2005 Market Street, Suite 2600 Philadelphia, PA 19103-7018 | | Counsel to the Independent Trustees Goodwin Procter LLP 901 New York Avenue, N.W. Washington, D.C. 20001 | | Transfer Agent Invesco Investment Services, Inc. 11 Greenway Plaza, Suite 1000 Houston, TX 77046-1173 | | Custodian State Street Bank and Trust Company 225 Franklin Street Boston, MA 02110-2801 |
T-5 Invesco American Value Fund
(This page intentionally left blank)
(This page intentionally left blank)
Go paperless with eDelivery
Visit invesco.com/edelivery to enjoy the convenience and security of anytime electronic access to your investment documents.
With eDelivery, you can elect to have any or all of the following materials delivered straight to your inbox to download, save and print from your own computer:
| • | Fund reports and prospectuses |
| • | Quarterly statements |
| • | Daily confirmations |
| • | Tax forms |
Invesco mailing information
Send general correspondence to Invesco Investment Services, Inc., P.O. Box 219078, Kansas City, MO 64121-9078.
Important notice regarding delivery of security holder documents
To reduce Fund expenses, only one copy of most shareholder documents may be mailed to shareholders with multiple accounts at the same address (Householding). Mailing of your shareholder documents may be householded indefinitely unless you instruct us otherwise. If you do not want the mailing of these documents to be combined with those for other members of your household, please contact Invesco Investment Services, Inc. at 800 959 4246 or contact your financial institution. We will begin sending you individual copies for each account within 30 days after receiving your request.
Fund holdings and proxy voting information
The Fund provides a complete list of its holdings four times in each fiscal year, at the quarter-ends. For the second and fourth quarters, the list appears in the Fund’s semiannual and annual reports to shareholders. For the first and third quarters, the Fund files the lists with the Securities and Exchange Commission (SEC) on Form N-Q (or any successor Form). The most recent list of portfolio holdings is available at invesco.com/completeqtrholdings. Shareholders can also look up the Fund’s Form N-Q (or any successor Form) filings on the SEC website, sec.gov. The SEC file numbers for the Fund are shown below.
A description of the policies and procedures that the Fund uses to determine how to vote proxies relating to portfolio securities is available without charge, upon request, from our Client Services department at 800 959 4246, or at invesco.com/proxyguidelines. The information is also available on the SEC website, sec.gov.
Information regarding how the Fund voted proxies related to its portfolio securities during the most recent 12-month period ended June 30 is available at invesco.com/proxysearch. This information is also available on the SEC website, sec.gov.
Invesco Advisers, Inc. is an investment adviser; it provides investment advisory services to individual and institutional clients and does not sell securities. Invesco Distributors, Inc. is the US distributor for Invesco Ltd.’s retail mutual funds, exchange-traded funds and institutional money market funds. Both are wholly owned, indirect subsidiaries of Invesco Ltd.
| SEC file numbers: 811-03826 and 002-85905 | Invesco Distributors, Inc. | VK-AMVA-AR-1 |
| Annual Report to Shareholders | April 30, 2019 |
Invesco Comstock Fund
Nasdaq:
A: ACSTX ■ C: ACSYX ■ R: ACSRX ■ Y: ACSDX ■ R5: ACSHX ■ R6: ICSFX

Beginning on January 1, 2021, as permitted by regulations adopted by the Securities and Exchange Commission, paper copies of the Fund’s shareholder reports will no longer be sent by mail, unless you specifically request paper copies of the reports from the Fund or from your financial intermediary, such as a broker-dealer or bank. Instead, the reports will be made available on the Fund’s website, and you will be notified by mail each time a report is posted and provided with a website link to access the report.
If you already elected to receive shareholder reports electronically, you will not be affected by this change and you need not take any action. You may elect to receive shareholder reports and other communications from the Fund electronically by contacting your financial intermediary (such as a broker-dealer or bank) or, if you are a direct investor, by enrolling at invesco.com/edelivery.
You may elect to receive all future reports in paper free of charge. If you invest through a financial intermediary, you can contact your financial intermediary to request that you continue to receive paper copies of your shareholder reports. If you invest directly with the Fund, you can call (800) 959-4246 to let the Fund know you wish to continue receiving paper copies of your shareholder reports. Your election to receive reports in paper will apply to all funds held with your financial intermediary or all funds held with the fund complex if you invest directly with the Fund.
Dear Shareholders:
This annual report includes information about your Fund, including performance data and a complete list of its investments as of the close of the reporting period. Inside is a discussion of how your Fund was managed and the factors that affected its performance during the reporting period.
Philip Taylor, whose messages to shareholders have appeared here for the last 13 years, transitioned to a senior advisory role on March 1, prior to his retirement at the end of the year, and I assumed his role as Head of the Americas and Senior Managing Director, Invesco Ltd. All of us at Invesco are indebted to Phil for his many years of dedicated service to the company and to its funds’ shareholders. I’m excited about this new opportunity, and I look forward to communicating with fund shareholders going forward.
Investor sentiment during the reporting period ranged from elation to fear, notably in the fourth quarter of 2018. Amid corporate tax cuts and improving global growth, several US equity indexes redefined highs during the first half of the reporting period. The exuberance, however, ended in October as global equities, in particular US stocks, sold off, with the sharpest decline in December of 2018. The catalyst for the sell-off was a combination of ongoing trade concerns between the US and China, fears of a global economic slowdown and lower oil prices from a supply glut. Gains posted earlier in the year for global equities were erased, while US Treasury bonds, along with government and municipal bonds, rallied as investors fled to “safe haven” assets. The reporting period ended on a positive note, however, as global equities bounced back strongly at the outset of 2019, with the US stock market reaching new highs by the period end. Given the strong economy during the reporting period, the US Federal Reserve (the Fed) raised the federal funds rate three times. At its December 2018 meeting, however, the Fed delivered a more “dovish stance” by simultaneously raising rates while reducing guidance for 2019 rate increases. As the fiscal year ended, the Fed had thus far left rates unchanged in 2019. As 2019 unfolds, we’ll see how the interplay of interest rates, economic data, geopolitics and a host of other factors affect US and overseas equity and fixed income markets.
Investor uncertainty and market volatility, such as we witnessed during the reporting period, are unfortunate facts of life when it comes to investing. That’s why Invesco encourages investors to work with a professional financial adviser who can stress the importance of starting to save and invest early and the importance of adhering to a disciplined investment plan. A financial adviser who knows your unique financial situation, investment goals and risk tolerance can be an invaluable partner as you seek to achieve your financial goals. He or she can offer a long-term perspective when markets are volatile and time-tested advice and guidance when your financial situation or investment goals change.
Visit our website for more information on your investments
Our website, invesco.com/us, offers a wide range of market insights and investment perspectives. On the website, you’ll find detailed information about our funds, including performance, holdings and portfolio manager commentaries. You can access information about your account by completing a simple, secure online registration. To do so, select “Log In” on the right side of the homepage, and then select “Register for Individual Account Access.”
In addition to the resources accessible on our website and through our mobile app, you can obtain timely updates to help you stay informed about the markets and the economy by connecting with Invesco on Twitter, LinkedIn or Facebook. You can access our blog at blog.invesco.us.com. Our goal is to provide you the information you want, when and where you want it.
Finally, I’m pleased to share with you Invesco’s commitment to both the Principles for Responsible Investment and to considering environmental, social and governance issues in our robust investment process. I invite you to learn more at invesco.com/esg.
Have questions?
For questions about your account, contact an Invesco client services representative at 800 959 4246.
All of us at Invesco look forward to serving your investment management needs. Thank you for investing with us.
Sincerely,
Andrew Schlossberg
Head of the Americas,
Senior Managing Director, Invesco Ltd.
Dear Shareholders:
Among the many important lessons I’ve learned in more than 40 years in a variety of business endeavors is the value of a trusted advocate.
As independent chair of the Invesco Funds Board, I can assure you that the members of the Board are strong advocates for the interests of investors in Invesco’s mutual funds. We work hard to represent your interests through oversight of the quality of the investment management services your funds receive and other matters important to your investment, including but not limited to:
| ■ | Ensuring that Invesco offers a diverse lineup of mutual funds that your financial adviser can use to strive to meet your financial needs as your investment goals change over time. |
| ■ | Monitoring how the portfolio management teams of the Invesco funds are performing in light of changing economic and market conditions. |
| ■ | Assessing each portfolio management team’s investment performance within the context of the investment strategy described in the fund’s prospectus. |
| ■ | Monitoring for potential conflicts of interests that may impact the nature of the services that your funds receive. |
We believe one of the most important services we provide our fund shareholders is the annual review of the funds’ advisory and sub-advisory contracts with Invesco Advisers and its affiliates. This review is required by the Investment Company Act of 1940 and focuses on the nature and quality of the services Invesco provides as the adviser to the Invesco funds and the reasonableness of the fees that it charges for those services. Each year, we spend months carefully reviewing information received from Invesco and a variety of independent sources, such as performance and fee data prepared by Lipper, Inc. (a subsidiary of Broadridge Financial Solutions, Inc.), an independent, third-party firm widely recognized as a leader in its field. We also meet with our independent legal counsel and other independent advisers to review and help us assess the information that we have received. Our goal is to assure that you receive quality investment management services for a reasonable fee.
I trust the measures outlined above provide assurance that you have a worthy advocate when it comes to choosing the Invesco Funds.
As always, please contact me at bruce@brucecrockett.com with any questions or concerns you may have. On behalf of the Board, we look forward to continuing to represent your interests and serving your needs.
Sincerely,
Bruce L. Crockett
Independent Chair
Invesco Funds Board of Trustees
Management’s Discussion of Fund Performance
Performance summary
For the fiscal year ended April 30, 2019, Class A shares of Invesco Comstock Fund (the Fund), at net asset value (NAV), underperformed the Russell 1000 Value Index, the Fund’s style-specific benchmark.
Your Fund’s long-term performance appears later in this report.
Fund vs. Indexes
Total returns, April 30, 2018 to April 30, 2019, at net asset value (NAV). Performance shown does not include applicable contingent deferred sales charges (CDSC) or front-end sales charges, which would have reduced performance.
| Class A Shares | 3.51% |
| Class C Shares | 2.68 |
| Class R Shares | 3.20 |
| Class Y Shares | 3.73 |
| Class R5 Shares | 3.80 |
| Class R6 Shares | 3.94 |
| S&P 500 Index▼ (Broad Market Index) | 13.49 |
Russell 1000 Value Index■
(Style-Specific Index) | 9.06 |
Lipper Large-Cap Value Funds Index♦
(Peer Group Index) | 9.17 |
| Source(s):▼FactSet Research Systems Inc.;■ RIMES Technologies Corp.;♦ Lipper Inc. |
rate hikes in 2019, a surprising shift in monetary policy. The Fed’s more accommodative stance provided a supportive environment for equities and fixed income, even as US economic data were mixed and overseas growth appeared to be slowing. By the end of the fiscal year, the US equity market generally recovered the losses from fourth quarter 2018, backed by improving investor sentiment, low unemployment and a growing economy.
During the fiscal year, nine of the 11 sectors within the Russell 1000 Value Index posted positive returns. The energy and materials sectors were the weakest-performing sectors, posting single-digit losses, while communication services and information technology (IT) were the strongest performing sectors.
On the positive side, stock selection in the IT sector was the largest driver of the Fund’s performance relative to the style-specific benchmark for the fiscal year. Most notably,QUALCOMM andMicrosoftwere top performers for the sector. Microsoft also contributed to relative performance after the company reported earnings in multiple quarters that beat expectations and provided strong guidance. The market capitalization of the firm reached the $1 trillion mark in late April 2019, as the stock hit new highs.
Stock selection in the consumer discretionary sector also boosted relative performance during the fiscal year.Advance Auto Parts was a large contributor within the sector, posting returns over 45% for the fiscal year. The company consistently beat earnings and revenue estimates throughout the fiscal year based on strong sales growth and improving industry economics.
Market conditions and your Fund
The fiscal year proved to be an increasingly volatile time for US equities. Throughout the summer, US equities moved higher as corporate profits surged amid the benefit of corporate tax cuts and improving global economic growth. Several US equity indexes reached new highs despite potential headwinds, including trade tensions, tariff announcements and contagion concerns over a Turkish currency crisis. After a relatively quiet summer, market volatility noticeably rose in October 2018, as US equity markets suffered a sharp sell-off through year-end 2018, amid ongoing trade concerns between the US and China, fears of a global economic slowdown and lower oil prices from a supply glut, with oil prices plummeting from near $75 per barrel in early October 2018 to around $45 per barrel
| Portfolio Composition |
|
| By sector | % of total net assets |
| Financials | 29.20% |
| Energy | 16.94 |
| Health Care | 11.75 |
| Information Technology | 8.34 |
| Consumer Staples | 7.29 |
| Industrials | 6.70 |
| Consumer Discretionary | 6.68 |
| Communication Services | 4.17 |
| Materials | 2.09 |
| Other Sectors, Each Less than 2% of Net Assets | 0.33 |
| Money Market Funds Plus Other Assets Less Liabilities | 6.51 |
in late December 2018.1 In this environment, there was a flight to safety, as investors fled to defensive areas of the markets, such as health care, utilities and US Treasuries.
Given signs of a strong economy, the US Federal Reserve (the Fed) raised interest rates three times during the fiscal year: in June, September and December 2018. Following December’s Fed meeting, the Fed raised interest rates by 25 basis points to a targeted range of 2.25% to 2.50%, which signaled a slightly more dovish stance than expected.2 In contrast, the European Central Bank and central banks in several other countries maintained extraordinarily accommodative monetary policies.
Equity markets rebounded at the start of 2019, fueled by optimism about a potential US-China trade deal and the Fed’s indication that there would be no interest
| Top 10 Equity Holdings* |
% of total net assets | | 1. | Citigroup, Inc. | 5.20% |
| 2. | Bank of America Corp. | 4.58 |
| 3. | JPMorgan Chase & Co. | 3.73 |
| 4. | American International Group, Inc. | 2.34 |
| 5. | Royal Dutch Shell PLC, Class A, ADR | 2.16 |
| 6. | Cisco Systems, Inc. | 2.10 |
| 7. | Suncor Energy, Inc. | 2.03 |
| 8. | General Motors Co. | 1.99 |
| 9. | BP PLC, ADR | 1.96 |
| 10. | Chevron Corp. | 1.88 |
| Total Net Assets | $12.1 billion |
| Total Number of Holdings* | 94 |
| The Fund’s holdings are subject to change, and there is no assurance that the Fund will continue to hold any particular security. |
| *Excluding money market fund holdings. |
| Data presented here are as of April 30, 2019. |
Stock selection in and underweight exposure to the materials sector also helped relative performance for the fiscal year mainly from not owning DowDuPont, which is included in the Fund’s style-specific benchmark. The stock was down single-digits for the fiscal year after reporting disappointing financials.
On the negative side, stock selection in the health care sector was a large detractor from relative performance during the fiscal year.Mylan,McKessonandCardinal Health were large detractors for the sector, underperforming the sector and the Fund’s style-specific benchmark. In May 2018, Cardinal Health’s stock hit a three-year low after reporting a more than 30% drop in earnings from the prior year due to a higher-than-expected tax rate on its medical devices division, with most business derived from outside the US. In our long-term view, the company’s valuations and fundamentals still remain attractive.
Another large driver of underperformance relative to the Fund’s style-specific benchmark was stock selection in and overweight exposure to the energy sector.Halliburton,Suncor EnergyandEncanawere the largest detractors on a relative and absolute basis. During the fourth quarter of 2018, oil prices deteriorated amid weaker inventory data and concerns over global demand destruction caused by a potential trade war. As noted earlier, oil prices dropped significantly during the fourth quarter of 2018. However, oil prices recovered during the first quarter of 2019 and energy stocks rebounded from their 2018 lows. Absent a meaningful decrease in demand, we still believe energy equities represent compelling value and are poised for recovery.
Stock selection in the financials sector was also a large detractor from the Fund’s performance relative to the style-specific benchmark for the fiscal year. Within banks, insurance and diversified financials,American International Group (AIG),Citizens,Fifth Third Bancorp andState Street were the largest relative detractors. During late 2018, many of the large banks and interest rate-sensitive financial stocks were down due to concerns over a flattening yield curve, possibly signaling a recession. In our view, financials have not performed as expected, given a normalizing rate environment and posting positive earnings and guidance. However, during the first quarter of 2019, banks have recovered from their lows in fourth quarter 2018. We believe that financials are still
attractively valued, with valuations at historically low levels.
We used currency forward contracts during the fiscal year for the purpose of hedging currency exposure of non-US-based companies held in the Fund. Derivatives were used solely for the purpose of hedging and not for speculative purposes or leverage. The use of currency forward contracts had a positive impact on the Fund’s performance relative to the Russell 1000 Value Index for the year.
At the end of the fiscal year, the Fund’s financials and energy positions were larger than the respective positions in the style-specific benchmark because we have a favorable view of large banks within financials and a positive outlook for the long-term prospects of the Fund’s energy holdings. Consequently, the Fund should be more sensitive to broad moves within these sectors for the foreseeable future. Conversely, given the team’s emphasis on finding the most attractively valued stocks, the Fund was materially underweight in communication services and had no exposure to utilities and real estate because we believe these areas are overvalued.
Thank you for your investment in Invesco Comstock Fund and for sharing our long-term investment horizon.
1 Source: Bloomberg
2 Source: US Federal Reserve
The views and opinions expressed in management’s discussion of Fund performance are those of Invesco Advisers, Inc. These views and opinions are subject to change at any time based on factors such as market and economic conditions. These views and opinions may not be relied upon as investment advice or recommendations, or as an offer for a particular security. The information is not a complete analysis of every aspect of any market, country, industry, security or the Fund. Statements of fact are from sources considered reliable, but Invesco Advisers, Inc. makes no representation or warranty as to their completeness or accuracy. Although historical performance is no guarantee of future results, these insights may help you understand our investment management philosophy.
See important Fund and, if applicable, index disclosures later in this report.
Devin Armstrong
Chartered Financial Analyst, Portfolio Manager, is co-lead manager of Invesco Comstock Fund. He joined Invesco in 2010. Mr. Armstrong earned a BS in psychology and finance from the University of Illinois and an MBA from Columbia University.
Kevin Holt
Chartered Financial Analyst, Portfolio Manager and Chief Investment Officer for Invesco US Value Equities, is co-lead manager of Invesco Comstock Fund. He joined Invesco in 2010. Mr. Holt earned a bachelor’s degree from the University of Iowa and an MBA from the University of Chicago Graduate School of Business.
Charles DyReyes
Chartered Financial Analyst, Portfolio Manager, is manager of Invesco Comstock Fund. He joined Invesco in 2015. Mr. DyReyes earned a BS in finance from Lehigh University.
James (Jay) Warwick
Portfolio Manager, is manager of Invesco Comstock Fund. He joined Invesco in 2010. Mr. Warwick earned a BBA from Stephen F. Austin State University and an MBA from the University of Houston.
Your Fund’s Long-Term Performance
Results of a $10,000 Investment — Oldest Share Class(es)
Fund and index data from 4/30/09
| 1 | Source: FactSet Research Systems Inc. |
| 2 | Source: RIMES Technologies Corp. |
| 3 | Source: Lipper Inc. |
Past performance cannot guarantee comparable future results.
The data shown in the chart include reinvested distributions, applicable sales charges and Fund expenses including
management fees. Index results include reinvested dividends, but they do not reflect sales charges. Performance of the peer group, if applicable, reflects fund expenses and management fees; perfor-
mance of a market index does not. Performance shown in the chart and table(s) does not reflect deduction of taxes a shareholder would pay on Fund distributions or sale of Fund shares.
| Average Annual Total Returns |
| As of 4/30/19, including maximum applicable sales charges |
| Class A Shares | |
| Inception (10/7/68) | 10.69% |
| 10 Years | 12.93 |
| 5 Years | 6.26 |
| 1 Year | –2.18 |
| Class C Shares | |
| Inception (10/26/93) | 9.52% |
| 10 Years | 12.72 |
| 5 Years | 6.66 |
| 1 Year | 1.73 |
| Class R Shares | |
| Inception (10/1/02) | 9.07% |
| 10 Years | 13.28 |
| 5 Years | 7.18 |
| 1 Year | 3.20 |
| Class Y Shares | |
| Inception (10/29/04) | 7.77% |
| 10 Years | 13.85 |
| 5 Years | 7.73 |
| 1 Year | 3.73 |
| Class R5 Shares | |
| 10 Years | 13.92% |
| 5 Years | 7.81 |
| 1 Year | 3.80 |
| Class R6 Shares | |
| 10 Years | 13.89% |
| 5 Years | 7.92 |
| 1 Year | 3.94 |
Effective June 1, 2010, Class A, Class C, Class I and Class R shares of the predecessor fund, Van Kampen Comstock Fund, advised by Van Kampen Asset Management were reorganized into Class A, Class C, Class Y and Class R shares, respectively, of Invesco Van Kampen Comstock Fund (renamed Invesco Comstock Fund). Returns shown above, prior to June 1, 2010, for Class A, Class C, Class R and Class Y shares are blended returns of the predecessor fund and Invesco Comstock Fund. Share class returns will differ from the predecessor fund because of different expenses.
Class R5 shares incepted on June 1, 2010. Performance shown prior to that date is that of the predecessor fund’s Class A shares and includes the 12b-1 fees applicable to Class A shares.
Class R6 shares incepted on September 24, 2012. Performance shown prior to that date is that of the Fund’s and the predecessor fund’s Class A
| Average Annual Total Returns |
| As of 3/31/19, the most recent calendar quarter end, including maximum applicable sales charges |
| Class A Shares | |
| Inception (10/7/68) | 10.60% |
| 10 Years | 13.55 |
| 5 Years | 5.37 |
| 1 Year | –4.81 |
| Class C Shares | |
| Inception (10/26/93) | 9.34% |
| 10 Years | 13.34 |
| 5 Years | 5.78 |
| 1 Year | –0.95 |
| Class R Shares | |
| Inception (10/1/02) | 8.80% |
| 10 Years | 13.92 |
| 5 Years | 6.31 |
| 1 Year | 0.51 |
| Class Y Shares | |
| Inception (10/29/04) | 7.45% |
| 10 Years | 14.48 |
| 5 Years | 6.83 |
| 1 Year | 0.98 |
| Class R5 Shares | |
| 10 Years | 14.55% |
| 5 Years | 6.92 |
| 1 Year | 1.05 |
| Class R6 Shares | |
| 10 Years | 14.52% |
| 5 Years | 7.02 |
| 1 Year | 1.18 |
shares and includes the 12b-1 fees applicable to Class A shares.
The performance data quoted represent past performance and cannot guarantee comparable future results; current performance may be lower or higher. Please visit invesco.com/performance for the most recent month-end performance. Performance figures reflect reinvested distributions, changes in net asset value and the effect of the maximum sales charge unless otherwise stated. Investment return and principal value will fluctuate so that you may have a gain or loss when you sell shares.
The total annual Fund operating expense ratio set forth in the most recent Fund prospectus as of the date of this report for Class A, Class C, Class R, Class Y, Class R5 and Class R6 shares was 0.82%, 1.56%, 1.07%, 0.57%, 0.51% and 0.42%, respectively. The expense ratios presented above may vary from the expense ratios presented in other sections of this report that are based
on expenses incurred during the period covered by this report.
Class A share performance reflects the maximum 5.50% sales charge, and Class C share performance reflects the applicable contingent deferred sales charge (CDSC) for the period involved. The CDSC on Class C shares is 1% for the first year after purchase. Class R, Class Y, Class R5 and Class R6 shares do not have a front-end sales charge or a CDSC; therefore, performance is at net asset value.
The performance of the Fund’s share classes will differ primarily due to different sales charge structures and class expenses.
Fund performance reflects any applicable fee waivers and/or expense reimbursements. Had the adviser not waived fees and/or reimbursed expenses currently or in the past, returns would have been lower. See current prospectus for more information.
Invesco Comstock Fund’s investment objective is total return through growth of capital and current income.
| ■ | Unless otherwise stated, information presented in this report is as of April 30, 2019, and is based on total net assets. |
| ■ | Unless otherwise noted, all data provided by Invesco. |
| ■ | To access your Fund’s reports/prospectus, visit invesco.com/fundreports. |
About share classes
| ■ | Class R sharesare generally available only to employer sponsored retirement and benefit plans. Please see the prospectus for more information. |
| ■ | Class Y sharesare available only to certain investors. Please see the prospectus for more information. |
| ■ | Class R5 shares andClass R6 shares are available for use by retirement plans that meet certain standards and for institutional investors. Class R6 shares are also available through intermediaries that have established an agreement with Invesco Distributors, Inc. to make such shares available for use in retail omnibus accounts. Please see the prospectus for more information. |
Principal risks of investing in the Fund
| ■ | Depositary receipts risk. Investing in depositary receipts involves the same risks as direct investments in foreign securities. In addition, the underlying issuers of certain depositary receipts are under no obligation to distribute shareholder communications or pass through any voting rights with respect to the deposited securities to the holders of such receipts. The Fund may therefore receive less timely information or have less control than if it invested directly in the foreign issuer. |
| ■ | Derivatives risk. The value of a derivative instrument depends largely on (and is derived from) the value of an underlying security, currency, commodity, interest rate, index or other asset (each referred to as an underlying asset). In addition to risks relating to the underlying assets, the use of derivatives may include other, possibly greater, risks, including counterparty, leverage and liquidity risks. Counterparty risk is the risk that the counterparty to the derivative contract will default on its obligation to pay the Fund the amount owed or |
| | otherwise perform under the derivative contract. Derivatives create leverage risk because they do not require payment up front equal to the economic exposure created by holding a position in the derivative. As a result, an adverse change in the value of the underlying asset could result in the Fund sustaining a loss that is substantially greater than the amount invested in the derivative or the anticipated value of the underlying asset, which may make the Fund’s returns more volatile and increase the risk of loss. Derivative instruments may also be less liquid than more traditional investments and the Fund may be unable to sell or close out its derivative positions at a desirable time or price. This risk may be more acute under adverse market conditions, during which the Fund may be most in need of liquidating its derivative positions. Derivatives may also be harder to value, less tax efficient and subject to changing government regulation that could impact the Fund’s ability to use certain derivatives or their cost. Derivatives strategies may not always be successful. For example, derivatives used for hedging or to gain or limit exposure to a particular market segment may not provide the expected benefits, particularly during adverse market conditions. |
| ■ | Emerging markets securities risk. Emerging markets (also referred to as developing markets) are generally subject to greater market volatility, political, social and economic instability, uncertain trading markets and more governmental limitations on foreign investment than more developed markets. In addition, companies operating in emerging markets may be subject to lower trading volume and greater price fluctuations than companies in more developed markets. Securities law and the enforcement of systems of taxation in many emerging market countries may change quickly |
| | and unpredictably. In addition, investments in emerging markets securities may also be subject to additional transaction costs, delays in settlement procedures, and lack of timely information. |
| ■ | Foreign securities risk. The Fund’s foreign investments may be adversely affected by political and social instability, changes in economic or taxation policies, difficulty in enforcing obligations, decreased liquidity or increased volatility. Foreign investments also involve the risk of the possible seizure, nationalization or expropriation of the issuer or foreign deposits (in which the Fund could lose its entire investments in a certain market) and the possible adoption of foreign governmental restrictions such as exchange controls. Unless the Fund has hedged its foreign securities risk, foreign securities risk also involves the risk of negative foreign currency rate fluctuations, which may cause the value of securities denominated in such foreign currency (or other instruments through which the Fund has exposure to foreign currencies) to decline in value. Currency exchange rates may fluctuate significantly over short periods of time. Currency hedging strategies, if used, are not always successful. |
| ■ | Management risk. The Fund is actively managed and depends heavily on the Adviser’s judgment about markets, interest rates or the attractiveness, relative values, liquidity, or potential appreciation of particular investments made for the Fund’s portfolio. The Fund could experience losses if these judgments prove to be incorrect. Additionally, legislative, regulatory, or tax developments may adversely affect management of the Fund and, therefore, the ability of the Fund to achieve its investment objective. |
| ■ | Market risk. The market values of the Fund’s investments, and therefore the value of the Fund’s shares, will go up |
This report must be accompanied or preceded by a currently effective Fund prospectus, which contains more complete information, including sales charges and expenses. Investors should read it carefully before investing.
NOT FDIC INSURED | MAY LOSE VALUE | NO BANK GUARANTEE
| | and down, sometimes rapidly or unpredictably. Market risk may affect a single issuer, industry or section of the economy, or it may affect the market as a whole. Individual stock prices tend to go up and down more dramatically than those of certain other types of investments, such as bonds. During a general downturn in the financial markets, multiple asset classes may decline in value. When markets perform well, there can be no assurance that specific investments held by the Fund will rise in value. |
| ■ | REIT risk/real estate risk. Investments in real estate related instruments may be affected by economic, legal, cultural, environmental or technological factors that affect property values, rents or occupancies of real estate related to the Fund’s holdings. Shares of real estate related companies, which tend to be small- and mid-cap companies, may be more volatile and less liquid. |
| ■ | Sector focus risk. The Fund may from time to time invest a significant amount of its assets (i.e. over 25%) in one market sector or group of related industries. In this event, the Fund’s performance will depend to a greater extent on the overall condition of the sector or group of industries and there is increased risk that the Fund will lose significant value if conditions adversely affect that sector or group of industries. |
| ■ | Small- and mid-capitalization companies risks. Small- and mid-capitalization companies tend to be more vulnerable to changing market conditions, may have little or no operating history or track record of success, and may have more limited product lines and markets, less experienced management and fewer financial resources than larger companies. These companies’ securities may be more volatile and less liquid than those of more established companies, and their returns may vary, sometimes significantly, from the overall securities market. |
| ■ | Value investing style risk. A value investing style subjects the Fund to the risk that the valuations never improve or that the returns on value equity securities are less than returns on other styles of investing or the overall stock market. |
About indexes used in this report
| ■ | TheS&P 500® Index is an unmanaged index considered representative of the US stock market. |
| ■ | TheRussell 1000® Value Index is an unmanaged index considered representative of large-cap value stocks. The Russell 1000 Value Index is a trademark/service mark of the Frank Russell Co. Russell® is a trademark of the Frank Russell Co. |
| ■ | TheLipper Large-Cap Value Funds Index is an unmanaged index considered representative of large-cap value funds tracked by Lipper. |
| ■ | The Fund is not managed to track the performance of any particular index, including the index(es) described here, and consequently, the performance of the Fund may deviate significantly from the performance of the index(es). |
| ■ | A direct investment cannot be made in an index. Unless otherwise indicated, index results include reinvested dividends, and they do not reflect sales charges. Performance of the peer group, if applicable, reflects fund expenses; performance of a market index does not. |
Other information
| ■ | The returns shown in management’s discussion of Fund performance are based on net asset values (NAVs) calculated for shareholder transactions. Generally accepted accounting principles require adjustments to be made to the net assets of the Fund at period end for financial reporting purposes, and as such, the NAVs for shareholder transactions and the returns based on those NAVs may differ from the NAVs and returns reported in the Financial Highlights. |
| ■ | Industry classifications used in this report are generally according to the Global Industry Classification Standard, which was developed by and is the exclusive property and a service mark of MSCI Inc. and Standard & Poor’s. |
Schedule of Investments(a)
April 30, 2019
| | Shares | Value |
| Common Stocks & Other Equity Interests–93.49% |
| Aerospace & Defense–1.37% |
| Arconic, Inc. | 3,413,139 | $73,314,226 |
| Textron, Inc. | 1,746,339 | 92,555,967 |
| | | | 165,870,193 |
| Agricultural Products–1.19% |
| Archer-Daniels-Midland Co. | 2,169,876 | 96,776,469 |
| Bunge Ltd. | 897,197 | 47,022,095 |
| | | | 143,798,564 |
| Apparel Retail–0.60% |
| Gap, Inc. (The) | 2,813,273 | 73,370,160 |
| Asset Management & Custody Banks–2.53% |
| Bank of New York Mellon Corp. (The) | 2,861,231 | 142,088,732 |
| State Street Corp. | 2,430,020 | 164,415,153 |
| | | | 306,503,885 |
| Automobile Manufacturers–1.99% |
| General Motors Co. | 6,201,120 | 241,533,624 |
| Automotive Retail–0.30% |
| Advance Auto Parts, Inc. | 219,005 | 36,424,912 |
| Biotechnology–1.08% |
| Gilead Sciences, Inc. | 2,004,453 | 130,369,623 |
| Broadcasting–0.73% |
| CBS Corp. Class B | 1,728,852 | 88,638,242 |
| Building Products–1.75% |
| Johnson Controls International PLC | 5,649,921 | 211,872,037 |
| Cable & Satellite–2.13% |
| Charter Communications, Inc., Class A(b) | 345,990 | 128,428,028 |
| Comcast Corp., Class A | 2,973,066 | 129,417,563 |
| | | | 257,845,591 |
| Communications Equipment–2.10% |
| Cisco Systems, Inc. | 4,554,059 | 254,799,601 |
| Construction Machinery & Heavy Trucks–0.46% |
| Caterpillar, Inc. | 396,307 | 55,253,122 |
| Consumer Finance–0.75% |
| Ally Financial, Inc. | 3,064,938 | 91,059,308 |
| Diversified Banks–14.88% |
| Bank of America Corp. | 18,143,551 | 554,829,789 |
| Citigroup, Inc. | 8,910,828 | 629,995,540 |
| JPMorgan Chase & Co. | 3,895,121 | 452,028,792 |
| Wells Fargo & Co. | 3,414,613 | 165,301,415 |
| | | | 1,802,155,536 |
| | Shares | Value |
| Electric Utilities–0.33% |
| PG&E Corp.(b) | 1,762,128 | $39,683,122 |
| Electrical Components & Equipment–1.99% |
| Eaton Corp. PLC | 1,881,316 | 155,810,591 |
| Emerson Electric Co. | 1,208,439 | 85,787,085 |
| | | | 241,597,676 |
| Fertilizers & Agricultural Chemicals–0.69% |
| CF Industries Holdings, Inc. | 1,855,128 | 83,072,632 |
| Health Care Distributors–1.41% |
| Cardinal Health, Inc. | 1,821,023 | 88,702,030 |
| McKesson Corp. | 694,365 | 82,803,026 |
| | | | 171,505,056 |
| Health Care Equipment–0.96% |
| Medtronic PLC | 1,307,241 | 116,096,073 |
| Health Care Services–0.68% |
| CVS Health Corp. | 1,513,416 | 82,299,562 |
| Hotels, Resorts & Cruise Lines–1.88% |
| Carnival Corp. | 4,143,792 | 227,328,429 |
| Household Products–2.52% |
| Kimberly-Clark Corp. | 1,416,887 | 181,899,953 |
| Reckitt Benckiser Group PLC (United Kingdom) | 1,522,959 | 123,390,092 |
| | | | 305,290,045 |
| Industrial Conglomerates–0.35% |
| General Electric Co. | 4,205,739 | 42,772,366 |
| Industrial Machinery–0.78% |
| Ingersoll-Rand PLC | 772,613 | 94,730,080 |
| Integrated Oil & Gas–8.91% |
| BP PLC ADR (United Kingdom) | 5,423,289 | 237,160,428 |
| Chevron Corp. | 1,897,022 | 227,756,462 |
| Exxon Mobil Corp. | 389,226 | 31,247,063 |
| Occidental Petroleum Corp. | 1,282,915 | 75,538,035 |
| Royal Dutch Shell PLC Class A, ADR (United Kingdom) | 4,127,145 | 262,197,522 |
| Suncor Energy, Inc. (Canada) | 7,437,825 | 245,448,225 |
| | | | 1,079,347,735 |
| Integrated Telecommunication Services–0.78% |
| AT&T, Inc. | 3,056,846 | 94,639,953 |
| Internet & Direct Marketing Retail–1.91% |
| Altaba, Inc.(b) | 647,331 | 48,802,284 |
| eBay, Inc. | 4,703,357 | 182,255,084 |
| | | | 231,057,368 |
See accompanying Notes to Financial Statements which are an integral part of the financial statements.
| | Shares | Value |
| Investment Banking & Brokerage–2.88% |
| Goldman Sachs Group, Inc. (The) | 619,060 | $127,476,835 |
| Morgan Stanley | 4,580,393 | 221,003,962 |
| | | | 348,480,797 |
| IT Consulting & Other Services–1.07% |
| Cognizant Technology Solutions Corp., Class A | 1,774,134 | 129,440,817 |
| Life & Health Insurance–1.15% |
| MetLife, Inc. | 3,016,752 | 139,162,770 |
| Managed Health Care–1.72% |
| Anthem, Inc. | 792,685 | 208,499,935 |
| Multi-line Insurance–2.34% |
| American International Group, Inc. | 5,953,560 | 283,210,849 |
| Oil & Gas Equipment & Services–0.55% |
| Halliburton Co. | 2,335,340 | 66,160,182 |
| Oil & Gas Exploration & Production–7.48% |
| Canadian Natural Resources Ltd. (Canada) | 4,039,146 | 121,261,814 |
| Devon Energy Corp. | 5,641,560 | 181,319,739 |
| Encana Corp. (Canada) | 14,269,255 | 98,885,937 |
| Hess Corp. | 2,828,306 | 181,350,981 |
| Marathon Oil Corp. | 12,400,156 | 211,298,658 |
| Noble Energy, Inc. | 4,150,253 | 112,305,846 |
| | | | 906,422,975 |
| Packaged Foods & Meats–0.87% |
| Danone S.A. (France) | 1,311,307 | 106,012,574 |
| Paper Packaging–1.41% |
| International Paper Co. | 3,641,093 | 170,439,563 |
| Pharmaceuticals–5.90% |
| Allergan PLC | 1,224,090 | 179,941,230 |
| Bristol-Myers Squibb Co. | 2,050,282 | 95,194,593 |
| Merck & Co., Inc. | 461,465 | 36,321,910 |
| Mylan N.V.(b) | 3,469,429 | 93,639,889 |
| Novartis AG (Switzerland) | 1,215,356 | 99,249,004 |
| Pfizer, Inc. | 1,169,454 | 47,491,527 |
| Sanofi ADR (France) | 3,740,491 | 163,571,672 |
| | | | 715,409,825 |
| | Shares | Value |
| Property & Casualty Insurance–0.97% |
| Allstate Corp. (The) | 1,187,344 | $117,618,297 |
| Regional Banks–3.71% |
| Citizens Financial Group, Inc. | 3,824,825 | 138,458,665 |
| Fifth Third Bancorp | 5,927,100 | 170,819,022 |
| PNC Financial Services Group, Inc. (The) | 1,022,931 | 140,069,942 |
| | | | 449,347,629 |
| Semiconductors–3.30% |
| Intel Corp. | 3,587,007 | 183,080,837 |
| QUALCOMM, Inc. | 2,511,181 | 216,288,020 |
| | | | 399,368,857 |
| Systems Software–1.66% |
| Microsoft Corp. | 1,544,246 | 201,678,527 |
| Technology Hardware, Storage & Peripherals–0.20% |
| NetApp, Inc. | 338,214 | 24,638,890 |
| Tobacco–2.71% |
| Altria Group, Inc. | 2,701,655 | 146,780,916 |
| Philip Morris International, Inc. | 2,091,696 | 181,057,206 |
| | | | 327,838,122 |
| Wireless Telecommunication Services–0.52% |
| Vodafone Group PLC (United Kingdom) | 34,291,345 | 63,556,083 |
| Total Common Stocks & Other Equity Interests (Cost $8,547,258,872) | 11,326,201,187 |
|
| Money Market Funds–6.38% |
| Invesco Government & Agency Portfolio, Institutional Class, 2.34%(c) | 270,614,086 | 270,614,086 |
| Invesco Liquid Assets Portfolio, Institutional Class, 2.48%(c) | 193,266,003 | 193,323,983 |
| Invesco Treasury Portfolio, Institutional Class, 2.32%(c) | 309,273,240 | 309,273,240 |
| Total Money Market Funds (Cost $773,188,036) | 773,211,309 |
| TOTAL INVESTMENTS IN SECURITIES–99.87% (Cost $9,320,446,908) | 12,099,412,496 |
| OTHER ASSETS LESS LIABILITIES–0.13% | 15,370,594 |
| NET ASSETS–100.00% | $12,114,783,090 |
Investment Abbreviations:
| ADR | – American Depositary Receipt |
Notes to Schedule of Investments:
| (a) | Industry and/or sector classifications used in this report are generally according to the Global Industry Classification Standard, which was developed by and is the exclusive property and a service mark of MSCI Inc. and Standard & Poor’s. |
| (b) | Non-income producing security. |
| (c) | The money market fund and the Fund are affiliated by having the same investment adviser. The rate shown is the 7-day SEC standardized yield as of April 30, 2019. |
See accompanying Notes to Financial Statements which are an integral part of the financial statements.
| Open Forward Foreign Currency Contracts |
Settlement
Date | Counterparty | Contract to | Unrealized
Appreciation
(Depreciation) |
| Deliver | Receive |
| Currency Risk | | | | | | |
| 05/10/2019 | Canadian Imperial Bank of Commerce | CAD | 116,898,324 | USD | 87,541,664 | $264,028 |
| 05/10/2019 | Canadian Imperial Bank of Commerce | GBP | 82,647,963 | USD | 107,993,862 | 174,685 |
| 05/10/2019 | Goldman Sachs International | EUR | 119,785,485 | USD | 135,325,694 | 891,574 |
| 05/10/2019 | Goldman Sachs International | GBP | 82,669,737 | USD | 108,033,473 | 185,892 |
| 05/10/2019 | Goldman Sachs International | CAD | 6,679,471 | USD | 4,991,071 | 4,101 |
| 05/10/2019 | Goldman Sachs International | CHF | 3,008,007 | USD | 2,954,146 | 52 |
| 05/10/2019 | Royal Bank of Canada | CAD | 126,140,543 | USD | 94,469,864 | 291,879 |
| 05/10/2019 | Royal Bank of Canada | CHF | 57,279,729 | USD | 57,476,240 | 1,223,130 |
| 05/10/2019 | Royal Bank of Canada | EUR | 116,613,134 | USD | 131,734,826 | 861,005 |
| 05/10/2019 | Royal Bank of Canada | USD | 1,020,091 | CHF | 1,039,130 | 415 |
| 05/10/2019 | Royal Bank of Canada | USD | 6,260,419 | CAD | 8,425,222 | 29,949 |
| Subtotal—Appreciation | 3,926,710 |
| Currency Risk | | | | | | |
| 05/10/2019 | Goldman Sachs International | USD | 1,390,707 | CHF | 1,409,813 | (6,162) |
| 05/10/2019 | Royal Bank of Canada | USD | 8,014,154 | CHF | 8,021,350 | (136,571) |
| 05/10/2019 | Royal Bank of Canada | CAD | 6,704,876 | USD | 4,971,233 | (34,705) |
| 05/10/2019 | State Street Bank & Trust Co. | USD | 4,843,309 | GBP | 3,707,101 | (7,175) |
| Subtotal—Depreciation | (184,613) |
| Total Forward Foreign Currency Contracts | $3,742,097 |
| Abbreviations: |
| CAD | – Canadian Dollar |
| CHF | – Swiss Franc |
| EUR | – Euro |
| GBP | – British Pound Sterling |
| USD | – U.S. Dollar |
See accompanying Notes to Financial Statements which are an integral part of the financial statements.
Statement of Assets and Liabilities
April 30, 2019
| Assets: | |
Investments in securities, at value
(Cost $8,547,258,872) | $11,326,201,187 |
| Investments in affiliated money market funds, at value (Cost $773,188,036) | 773,211,309 |
| Other investments: | |
| Unrealized appreciation on forward foreign currency contracts outstanding | 3,926,710 |
| Foreign currencies, at value (Cost $541) | 536 |
| Receivable for: | |
| Investments sold | 18,325,728 |
| Fund shares sold | 7,481,315 |
| Dividends | 14,135,152 |
| Investment for trustee deferred compensation and retirement plans | 934,578 |
| Other assets | 109,617 |
| Total assets | 12,144,326,132 |
| Liabilities: | |
| Other investments: | |
| Unrealized depreciation on forward foreign currency contracts outstanding | 184,613 |
| Payable for: | |
| Investments purchased | 28,599 |
| Fund shares reacquired | 18,950,242 |
| Amount due custodian | 3,603,882 |
| Accrued fees to affiliates | 5,070,022 |
| Accrued trustees’ and officers’ fees and benefits | 13,337 |
| Accrued other operating expenses | 631,803 |
| Trustee deferred compensation and retirement plans | 1,060,544 |
| Total liabilities | 29,543,042 |
| Net assets applicable to shares outstanding | $12,114,783,090 |
| Net assets consist of: | |
| Shares of beneficial interest | $8,943,856,502 |
| Distributable earnings | 3,170,926,588 |
| | $12,114,783,090 |
| Net Assets: |
| Class A | $6,350,025,293 |
| Class C | $158,706,792 |
| Class R | $212,842,858 |
| Class Y | $1,765,455,732 |
| Class R5 | $665,080,715 |
| Class R6 | $2,962,671,700 |
| Shares outstanding, no par value, with an unlimited number of shares authorized: |
| Class A | 252,230,650 |
| Class C | 6,307,198 |
| Class R | 8,454,870 |
| Class Y | 70,112,896 |
| Class R5 | 26,433,190 |
| Class R6 | 117,775,415 |
| Class A: | |
| Net asset value per share | $25.18 |
Maximum offering price per share
(Net asset value of $25.18 ÷ 94.50%) | $26.65 |
| Class C: | |
| Net asset value and offering price per share | $25.16 |
| Class R: | |
| Net asset value and offering price per share | $25.17 |
| Class Y: | |
| Net asset value and offering price per share | $25.18 |
| Class R5: | |
| Net asset value and offering price per share | $25.16 |
| Class R6: | |
| Net asset value and offering price per share | $25.16 |
See accompanying Notes to Financial Statements which are an integral part of the financial statements.
Statement of Operations
For the year ended April 30, 2019
| Investment income: | |
| Dividends (net of foreign withholding taxes of $6,543,789) | $302,871,854 |
| Dividends from affiliated money market funds | 12,433,300 |
| Total investment income | 315,305,154 |
| Expenses: | |
| Advisory fees | 45,635,904 |
| Administrative services fees | 1,113,182 |
| Custodian fees | 196,625 |
| Distribution fees: | |
| Class A | 15,540,589 |
| Class C | 3,674,583 |
| Class R | 1,156,467 |
| Transfer agent fees — A, C, R and Y | 14,008,318 |
| Transfer agent fees — R5 | 672,982 |
| Transfer agent fees — R6 | 158,941 |
| Trustees’ and officers’ fees and benefits | 203,102 |
| Registration and filing fees | 277,958 |
| Reports to shareholders | 683,100 |
| Professional services fees | 151,040 |
| Other | 163,931 |
| Total expenses | 83,636,722 |
| Less: Fees waived and expense offset arrangement(s) | (671,073) |
| Net expenses | 82,965,649 |
| Net investment income | 232,339,505 |
| Realized and unrealized gain (loss) from: | |
| Net realized gain (loss) from: | |
| Investment securities | 635,865,046 |
| Foreign currencies | (442,126) |
| Forward foreign currency contracts | 85,228,210 |
| | 720,651,130 |
| Change in net unrealized appreciation (depreciation) of: | |
| Investment securities | (533,092,325) |
| Foreign currencies | 15,114 |
| Forward foreign currency contracts | (22,203,227) |
| | (555,280,438) |
| Net realized and unrealized gain | 165,370,692 |
| Net increase in net assets resulting from operations | $397,710,197 |
See accompanying Notes to Financial Statements which are an integral part of the financial statements.
Statement of Changes in Net Assets
For the years ended April 30, 2019 and 2018
| | 2019 | 2018 |
| Operations: | | |
| Net investment income | $232,339,505 | $182,378,967 |
| Net realized gain | 720,651,130 | 790,828,764 |
| Change in net unrealized appreciation (depreciation) | (555,280,438) | 775,489,924 |
| Net increase in net assets resulting from operations | 397,710,197 | 1,748,697,655 |
| Distributions to shareholders from distributable earnings(1): | | |
| Class A | (506,804,150) | (235,835,039) |
| Class B | — | (898,869) |
| Class C | (31,812,508) | (13,735,893) |
| Class R | (17,885,215) | (9,772,489) |
| Class Y | (155,664,704) | (76,865,461) |
| Class R5 | (59,044,636) | (30,608,345) |
| Class R6 | (249,226,391) | (94,188,729) |
| Total distributions to shareholders from distributable earnings | (1,020,437,604) | (461,904,825) |
| Share transactions–net: | | |
| Class A | 205,489,325 | (591,272,197) |
| Class B | — | (44,867,507) |
| Class C | (268,440,174) | (93,097,155) |
| Class R | (41,047,725) | (90,963,809) |
| Class Y | 3,974,276 | (1,683,728,344) |
| Class R5 | (33,427,639) | (87,474,852) |
| Class R6 | 518,847,087 | 1,651,310,027 |
| Net increase (decrease) in net assets resulting from share transactions | 385,395,150 | (940,093,837) |
| Net increase (decrease) in net assets | (237,332,257) | 346,698,993 |
| Net assets: | | |
| Beginning of year | 12,352,115,347 | 12,005,416,354 |
| End of year | $12,114,783,090 | $12,352,115,347 |
| (1) | For the year ended April 30, 2018 distributions to shareholders from distributable earnings consisted of distributions from net investment income and distributions from net realized gains. The Securities and Exchange Commission eliminated the requirement to disclose the distribution components separately. For the year ended April 30, 2018 distributions from net investment income were $91,742,237, $349,985, $3,276,558, $3,540,449, $37,308,063, $13,363,140, and $37,510,760 and distributions from net realized gains were $144,092,802, $548,884, $10,459,335, $6,232,040, $39,557,398, $17,245,205 and $56,677,969 for Class A, Class B, Class C, Class R, Class Y, Class R5 and Class R6 shares, respectively. |
See accompanying Notes to Financial Statements which are an integral part of the financial statements.
Financial Highlights
April 30, 2019
The following schedule presents financial highlights for a share of the Fund outstanding throughout the periods indicated.
| | Net asset
value,
beginning
of period | Net
investment
income(a) | Net gains
(losses)
on securities
(both
realized and
unrealized) | Total from
investment
operations | Dividends
from net
investment
income | Distributions
from net
realized
gains | Total
distributions | Net asset
value, end
of period | Total
return(b) | Net assets,
end of period
(000’s omitted) | Ratio of
expenses
to average
net assets
with fee waivers
and/or expenses
absorbed | Ratio of
expenses
to average net
assets without
fee waivers
and/or expenses
absorbed | Ratio of net
investment
income
to average
net assets | Portfolio
turnover(c) |
| Class A |
| Year ended 04/30/19 | $26.67 | $0.46 | $0.23 | $0.69 | $(0.41) | $(1.77) | $(2.18) | $25.18 | 3.51% | $6,350,025 | 0.80%(d) | 0.81%(d) | 1.79%(d) | 23% |
| Year ended 04/30/18 | 24.03 | 0.36 | 3.23 | 3.59 | (0.36) | (0.59) | (0.95) | 26.67 | 15.09 | 6,433,646 | 0.81 | 0.81 | 1.38 | 14 |
| Year ended 04/30/17 | 21.86 | 0.40 | 3.61 | 4.01 | (0.49) | (1.35) | (1.84) | 24.03 | 18.56 | 6,350,463 | 0.84 | 0.84 | 1.75 | 18 |
| Year ended 04/30/16 | 26.04 | 0.44 | (2.29) | (1.85) | (0.36) | (1.97) | (2.33) | 21.86 | (6.90) | 6,613,286 | 0.84 | 0.85 | 1.87 | 15 |
| Year ended 04/30/15 | 24.29 | 0.32 | 1.84 | 2.16 | (0.41) | — | (0.41) | 26.04 | 8.98 | 7,698,790 | 0.82 | 0.83 | 1.30 | 17 |
| Class C |
| Year ended 04/30/19 | 26.66 | 0.27 | 0.21 | 0.48 | (0.21) | (1.77) | (1.98) | 25.16 | 2.68(e) | 158,707 | 1.54(d)(e) | 1.55(d)(e) | 1.05(d)(e) | 23 |
| Year ended 04/30/18 | 24.02 | 0.16 | 3.24 | 3.40 | (0.17) | (0.59) | (0.76) | 26.66 | 14.24(e) | 468,225 | 1.55(e) | 1.55(e) | 0.64(e) | 14 |
| Year ended 04/30/17 | 21.85 | 0.23 | 3.61 | 3.84 | (0.32) | (1.35) | (1.67) | 24.02 | 17.70 | 511,920 | 1.59 | 1.59 | 1.00 | 18 |
| Year ended 04/30/16 | 26.03 | 0.27 | (2.29) | (2.02) | (0.19) | (1.97) | (2.16) | 21.85 | (7.59)(e) | 532,230 | 1.56(e) | 1.57(e) | 1.15(e) | 15 |
| Year ended 04/30/15 | 24.28 | 0.13 | 1.84 | 1.97 | (0.22) | — | (0.22) | 26.03 | 8.17 | 637,579 | 1.57 | 1.58 | 0.55 | 17 |
| Class R |
| Year ended 04/30/19 | 26.67 | 0.40 | 0.21 | 0.61 | (0.34) | (1.77) | (2.11) | 25.17 | 3.20 | 212,843 | 1.05(d) | 1.06(d) | 1.54(d) | 23 |
| Year ended 04/30/18 | 24.03 | 0.29 | 3.24 | 3.53 | (0.30) | (0.59) | (0.89) | 26.67 | 14.80 | 265,368 | 1.06 | 1.06 | 1.13 | 14 |
| Year ended 04/30/17 | 21.86 | 0.35 | 3.61 | 3.96 | (0.44) | (1.35) | (1.79) | 24.03 | 18.27 | 324,055 | 1.09 | 1.09 | 1.50 | 18 |
| Year ended 04/30/16 | 26.04 | 0.38 | (2.29) | (1.91) | (0.30) | (1.97) | (2.27) | 21.86 | (7.14) | 358,835 | 1.09 | 1.10 | 1.62 | 15 |
| Year ended 04/30/15 | 24.29 | 0.26 | 1.84 | 2.10 | (0.35) | — | (0.35) | 26.04 | 8.71 | 486,154 | 1.07 | 1.08 | 1.05 | 17 |
| Class Y |
| Year ended 04/30/19 | 26.68 | 0.52 | 0.22 | 0.74 | (0.47) | (1.77) | (2.24) | 25.18 | 3.73 | 1,765,456 | 0.55(d) | 0.56(d) | 2.04(d) | 23 |
| Year ended 04/30/18 | 24.03 | 0.41 | 3.25 | 3.66 | (0.42) | (0.59) | (1.01) | 26.68 | 15.41 | 1,861,752 | 0.56 | 0.56 | 1.63 | 14 |
| Year ended 04/30/17 | 21.86 | 0.46 | 3.61 | 4.07 | (0.55) | (1.35) | (1.90) | 24.03 | 18.86 | 3,334,930 | 0.59 | 0.59 | 2.00 | 18 |
| Year ended 04/30/16 | 26.04 | 0.49 | (2.28) | (1.79) | (0.42) | (1.97) | (2.39) | 21.86 | (6.67) | 3,034,620 | 0.59 | 0.60 | 2.12 | 15 |
| Year ended 04/30/15 | 24.29 | 0.39 | 1.84 | 2.23 | (0.48) | — | (0.48) | 26.04 | 9.26 | 3,422,401 | 0.57 | 0.58 | 1.55 | 17 |
| Class R5 |
| Year ended 04/30/19 | 26.66 | 0.54 | 0.22 | 0.76 | (0.49) | (1.77) | (2.26) | 25.16 | 3.80 | 665,081 | 0.48(d) | 0.49(d) | 2.11(d) | 23 |
| Year ended 04/30/18 | 24.02 | 0.44 | 3.23 | 3.67 | (0.44) | (0.59) | (1.03) | 26.66 | 15.46 | 735,462 | 0.50 | 0.50 | 1.69 | 14 |
| Year ended 04/30/17 | 21.85 | 0.48 | 3.62 | 4.10 | (0.58) | (1.35) | (1.93) | 24.02 | 18.98 | 741,550 | 0.51 | 0.51 | 2.08 | 18 |
| Year ended 04/30/16 | 26.04 | 0.51 | (2.29) | (1.78) | (0.44) | (1.97) | (2.41) | 21.85 | (6.61) | 824,228 | 0.49 | 0.50 | 2.22 | 15 |
| Year ended 04/30/15 | 24.29 | 0.41 | 1.84 | 2.25 | (0.50) | — | (0.50) | 26.04 | 9.36 | 830,574 | 0.49 | 0.50 | 1.63 | 17 |
| Class R6 |
| Year ended 04/30/19 | 26.66 | 0.56 | 0.22 | 0.78 | (0.51) | (1.77) | (2.28) | 25.16 | 3.90 | 2,962,672 | 0.39(d) | 0.40(d) | 2.20(d) | 23 |
| Year ended 04/30/18 | 24.01 | 0.47 | 3.24 | 3.71 | (0.47) | (0.59) | (1.06) | 26.66 | 15.61 | 2,587,663 | 0.41 | 0.41 | 1.78 | 14 |
| Year ended 04/30/17 | 21.85 | 0.50 | 3.61 | 4.11 | (0.60) | (1.35) | (1.95) | 24.01 | 19.05 | 702,678 | 0.41 | 0.41 | 2.18 | 18 |
| Year ended 04/30/16 | 26.03 | 0.54 | (2.29) | (1.75) | (0.46) | (1.97) | (2.43) | 21.85 | (6.48) | 624,206 | 0.39 | 0.40 | 2.32 | 15 |
| Year ended 04/30/15 | 24.28 | 0.44 | 1.83 | 2.27 | (0.52) | — | (0.52) | 26.03 | 9.46 | 595,160 | 0.39 | 0.40 | 1.73 | 17 |
| (a) | Calculated using average shares outstanding. |
| (b) | Includes adjustments in accordance with accounting principles generally accepted in the United States of America and as such, the net asset value for financial reporting purposes and the returns based upon those net asset values may differ from the net asset value and returns for shareholder transactions. Does not include sales charges and is not annualized for periods less than one year, if applicable. |
| (c) | Portfolio turnover is calculated at the fund level and is not annualized for periods less than one year, if applicable. |
| (d) | Ratios are based on average daily net assets (000’s omitted) of $6,231,190, $371,729, $231,293, $1,819,420, $692,152 and $2,835,902 for Class A, Class C, Class R, Class Y, Class R5 and Class R6 shares, respectively. |
| (e) | The total return, ratio of expenses to average net assets and ratio of net investment income to average net assets reflect actual 12b-1 fees of 0.99%, 0.99% and 0.97% for the years ended April 30, 2019, 2018 and 2016, respectively. |
See accompanying Notes to Financial Statements which are an integral part of the financial statements.
Notes to Financial Statements
April 30, 2019
NOTE 1—Significant Accounting Policies
Invesco Comstock Fund (the “Fund”) is a series portfolio of AIM Sector Funds (Invesco Sector Funds) (the “Trust”). The Trust is a Delaware statutory trust registered under the Investment Company Act of 1940, as amended (the “1940 Act”), as an open-end series management investment company authorized to issue an unlimited number of shares of beneficial interest. Information presented in these financial statements pertains only to the Fund. Matters affecting the Fund or each class will be voted on exclusively by the shareholders of the Fund or each class.
The Fund’s investment objective is total return through growth of capital and current income.
The Fund currently consists of six different classes of shares: Class A, Class C, Class R, Class Y, Class R5 and Class R6. Class Y shares are available only to certain investors. Class A shares are sold with a front-end sales charge unless certain waiver criteria are met. Under certain circumstances, load waived shares may be subject to contingent deferred sales charges ("CDSC"). Class C shares are sold with a CDSC. Class R, Class Y, Class R5 and Class R6 shares are sold at net asset value. Class C shares held for ten years after purchase are eligible for automatic conversion into Class A shares of the same Fund (the "Conversion Feature"). The automatic conversion pursuant to the Conversion Feature will generally occur at the end of the month following the tenth anniversary after a purchase of Class C shares.
The Fund is an investment company and accordingly follows the investment company accounting and reporting guidance in accordance with Financial Accounting Standards Board Accounting Standards Codification Topic 946,Financial Services – Investment Companies.
The following is a summary of the significant accounting policies followed by the Fund in the preparation of its financial statements.
| A. | Security Valuations — Securities, including restricted securities, are valued according to the following policy. |
A security listed or traded on an exchange (except convertible securities) is valued at its last sales price or official closing price as of the close of the customary trading session on the exchange where the security is principally traded, or lacking any sales or official closing price on a particular day, the security may be valued at the closing bid price on that day. Securities traded in the over-the-counter market are valued based on prices furnished by independent pricing services or market makers. When such securities are valued by an independent pricing service they may be considered fair valued. Futures contracts are valued at the final settlement price set by an exchange on which they are principally traded. Listed options are valued at the mean between the last bid and asked prices from the exchange on which they are principally traded. Options not listed on an exchange are valued by an independent source at the mean between the last bid and asked prices. For purposes of determining net asset value (“NAV”) per share, futures and option contracts generally are valued 15 minutes after the close of the customary trading session of the New York Stock Exchange (“NYSE”).
Investments in open-end and closed-end registered investment companies that do not trade on an exchange are valued at the end-of-day net asset value per share. Investments in open-end and closed-end registered investment companies that trade on an exchange are valued at the last sales price or official closing price as of the close of the customary trading session on the exchange where the security is principally traded.
Debt obligations (including convertible securities) and unlisted equities are fair valued using an evaluated quote provided by an independent pricing service. Evaluated quotes provided by the pricing service may be determined without exclusive reliance on quoted prices, and may reflect appropriate factors such as institution-size trading in similar groups of securities, developments related to specific securities, dividend rate (for unlisted equities), yield (for debt obligations), quality, type of issue, coupon rate (for debt obligations), maturity (for debt obligations), individual trading characteristics and other market data. Pricing services generally value debt obligations assuming orderly transactions of institutional round lot size, but a fund may hold or transact in the same securities in smaller, odd lot sizes. Odd lots often trade at lower prices than institutional round lots. Debt obligations are subject to interest rate and credit risks. In addition, all debt obligations involve some risk of default with respect to interest and/or principal payments.
Foreign securities’ (including foreign exchange contracts) prices are converted into U.S. dollar amounts using the applicable exchange rates as of the close of the NYSE. If market quotations are available and reliable for foreign exchange-traded equity securities, the securities will be valued at the market quotations. Because trading hours for certain foreign securities end before the close of the NYSE, closing market quotations may become unreliable. If between the time trading ends on a particular security and the close of the customary trading session on the NYSE, events occur that the investment adviser determines are significant and make the closing price unreliable, the Fund may fair value the security. If the event is likely to have affected the closing price of the security, the security will be valued at fair value in good faith using procedures approved by the Board of Trustees. Adjustments to closing prices to reflect fair value may also be based on a screening process of an independent pricing service to indicate the degree of certainty, based on historical data, that the closing price in the principal market where a foreign security trades is not the current value as of the close of the NYSE. Foreign securities’ prices meeting the approved degree of certainty that the price is not reflective of current value will be priced at the indication of fair value from the independent pricing service. Multiple factors may be considered by the independent pricing service in determining adjustments to reflect fair value and may include information relating to sector indices, American Depositary Receipts and domestic and foreign index futures. Foreign securities may have additional risks including exchange rate changes, potential for sharply devalued currencies and high inflation, political and economic upheaval, the relative lack of issuer information, relatively low market liquidity and the potential lack of strict financial and accounting controls and standards.
Securities for which market prices are not provided by any of the above methods may be valued based upon quotes furnished by independent sources. The last bid price may be used to value equity securities. The mean between the last bid and asked prices is used to value debt obligations, including corporate loans.
Securities for which market quotations are not readily available or became unreliable are valued at fair value as determined in good faith by or under the supervision of the Trust’s officers following procedures approved by the Board of Trustees. Issuer specific events, market trends, bid/asked quotes of brokers and information providers and other market data may be reviewed in the course of making a good faith determination of a security’s fair value.
The Fund may invest in securities that are subject to interest rate risk, meaning the risk that the prices will generally fall as interest rates rise and, conversely, the prices will generally rise as interest rates fall. Specific securities differ in their sensitivity to changes in interest rates depending on their individual characteristics. Changes in interest rates may result in increased market volatility, which may affect the value and/or liquidity of certain Fund investments.
Valuations change in response to many factors including the historical and prospective earnings of the issuer, the value of the issuer’s assets, general economic conditions, interest rates, investor perceptions and market liquidity. Because of the inherent uncertainties of valuation, the values reflected in the financial statements may materially differ from the value received upon actual sale of those investments.
| B. | Securities Transactions and Investment Income — Securities transactions are accounted for on a trade date basis. Realized gains or losses on sales are computed on the basis of specific identification of the securities sold. Interest income (net of withholding tax, if any) is recorded on the accrual basis from settlement date. Dividend income (net of withholding tax, if any) is recorded on the ex-dividend date. |
The Fund may periodically participate in litigation related to Fund investments. As such, the Fund may receive proceeds from litigation settlements. Any proceeds received are included in the Statement of Operations as realized gain (loss) for investments no longer held and as unrealized gain (loss) for investments still held.
Brokerage commissions and mark ups are considered transaction costs and are recorded as an increase to the cost basis of securities purchased and/or a reduction of proceeds on a sale of securities. Such transaction costs are included in the determination of net realized and unrealized gain (loss) from investment securities reported in the Statement of Operations and the Statement of Changes in Net Assets and the net realized and unrealized gains (losses) on securities per share in the Financial Highlights. Transaction costs are included in the calculation of the Fund’s net asset value and, accordingly, they reduce the Fund’s total returns. These transaction costs are not considered operating expenses and are not reflected in net investment income reported in the Statement of Operations and the Statement of Changes in Net Assets, or the net investment income per share and the ratios of expenses and net investment income reported in the Financial Highlights, nor are they limited by any expense limitation arrangements between the Fund and the investment adviser.
The Fund allocates income and realized and unrealized capital gains and losses to a class based on the relative net assets of each class.
| C. | Country Determination – For the purposes of making investment selection decisions and presentation in the Schedule of Investments, the investment adviser may determine the country in which an issuer is located and/or credit risk exposure based on various factors. These factors include the laws of the country under which the issuer is organized, where the issuer maintains a principal office, the country in which the issuer derives 50% or more of its total revenues and the country that has the primary market for the issuer’s securities, as well as other criteria. Among the other criteria that may be evaluated for making this determination are the country in which the issuer maintains 50% or more of its assets, the type of security, financial guarantees and enhancements, the nature of the collateral and the sponsor organization. Country of issuer and/or credit risk exposure has been determined to be the United States of America, unless otherwise noted. |
| D. | Distributions- Distributions from net investment income, if any, are declared and paid quarterly and are recorded on the ex-dividend date. Distributions from net realized capital gain, if any, are generally declared and paid annually and recorded on the ex-dividend date. The Fund may elect to treat a portion of the proceeds from redemptions as distributions for federal income tax purposes. |
| E. | Federal Income Taxes – The Fund intends to comply with the requirements of Subchapter M of the Internal Revenue Code of 1986, as amended (the “Internal Revenue Code”), necessary to qualify as a regulated investment company and to distribute substantially all of the Fund’s taxable earnings to shareholders. As such, the Fund will not be subject to federal income taxes on otherwise taxable income (including net realized capital gain) that is distributed to shareholders. Therefore, no provision for federal income taxes is recorded in the financial statements. |
The Fund recognizes the tax benefits of uncertain tax positions only when the position is more likely than not to be sustained. Management has analyzed the Fund’s uncertain tax positions and concluded that no liability for unrecognized tax benefits should be recorded related to uncertain tax positions. Management is not aware of any tax positions for which it is reasonably possible that the total amounts of unrecognized tax benefits will change materially in the next 12 months.
The Fund files tax returns in the U.S. Federal jurisdiction and certain other jurisdictions. Generally, the Fund is subject to examinations by such taxing authorities for up to three years after the filing of the return for the tax period.
| F. | Expenses – Fees provided for under the Rule 12b-1 plan of a particular class of the Fund are charged to the operations of such class. Transfer agency fees and expenses and other shareholder recordkeeping fees and expenses attributable to Class R5 and Class R6 are allocated to each share class based on relative net assets. Sub-accounting fees attributable to Class R5 are charged to the operations of the class. Transfer agency fees and expenses and other shareholder recordkeeping fees and expenses relating to all other classes are allocated among those classes based on relative net assets. All other expenses are allocated among the classes based on relative net assets. |
| G. | Accounting Estimates – The preparation of financial statements in conformity with accounting principles generally accepted in the United States of America (“GAAP”) requires management to make estimates and assumptions that affect the reported amounts of assets and liabilities at the date of the financial statements and the reported amounts of revenues and expenses during the reporting period including estimates and assumptions related to taxation. Actual results could differ from those estimates by a significant amount. In addition, the Fund monitors for material events or transactions that may occur or become known after the period-end date and before the date the financial statements are released to print. |
| H. | Indemnifications – Under the Trust’s organizational documents, each Trustee, officer, employee or other agent of the Trust is indemnified against certain liabilities that may arise out of the performance of their duties to the Fund. Additionally, in the normal course of business, the Fund enters into contracts, including the Fund’s servicing agreements, that contain a variety of indemnification clauses. The Fund’s maximum exposure under these arrangements is unknown as this would involve future claims that may be made against the Fund that have not yet occurred. The risk of material loss as a result of such indemnification claims is considered remote. |
| I. | Foreign Currency Translations – Foreign currency is valued at the close of the NYSE based on quotations posted by banks and major currency dealers. Portfolio securities and other assets and liabilities denominated in foreign currencies are translated into U.S. dollar amounts at the date of valuation. Purchases and sales of portfolio securities (net of foreign taxes withheld on disposition) and income items denominated in foreign currencies are translated into U.S. dollar amounts on the respective dates of such transactions. The Fund does not separately account for the portion of the results of operations resulting from changes in foreign exchange rates on investments and the fluctuations arising from changes in market prices of securities held. The combined results of changes in foreign exchange rates and the fluctuation of market prices on investments (net of estimated foreign tax withholding) are included with the net realized and unrealized gain or loss from investments in the Statement of Operations. Reported net realized foreign currency gains or losses arise from (1) sales of foreign currencies, (2) currency gains or losses realized between the trade and settlement dates on securities transactions, and (3) the difference between the amounts of dividends, interest, and foreign withholding taxes recorded on the Fund’s books and the U.S. dollar equivalent of the amounts actually received or paid. Net |
| | unrealized foreign currency gains and losses arise from changes in the fair values of assets and liabilities, other than investments in securities at fiscal period end, resulting from changes in exchange rates. |
The Fund may invest in foreign securities, which may be subject to foreign taxes on income, gains on investments or currency repatriation, a portion of which may be recoverable. Foreign taxes, if any, are recorded based on the tax regulations and rates that exist in the foreign markets in which the Fund invests and are shown in the Statement of Operations.
| J. | Forward Foreign Currency Contracts – The Fund may engage in foreign currency transactions either on a spot (i.e. for prompt delivery and settlement) basis, or through forward foreign currency contracts, to manage or minimize currency or exchange rate risk. |
The Fund may also enter into forward foreign currency contracts for the purchase or sale of a security denominated in a foreign currency in order to “lock in” the U.S. dollar price of that security, or the Fund may also enter into forward foreign currency contracts that do not provide for physical settlement of the two currencies, but instead are settled by a single cash payment calculated as the difference between the agreed upon exchange rate and the spot rate at settlement based upon an agreed upon notional amount (non-deliverable forwards). The Fund will set aside liquid assets in an amount equal to the daily mark-to-market obligation for forward foreign currency contracts.
A forward foreign currency contract is an obligation between two parties (“Counterparties”) to purchase or sell a specific currency for an agreed-upon price at a future date. The use of forward foreign currency contracts does not eliminate fluctuations in the price of the underlying securities the Fund owns or intends to acquire but establishes a rate of exchange in advance. Fluctuations in the value of these contracts are measured by the difference in the contract date and reporting date exchange rates and are recorded as unrealized appreciation (depreciation) until the contracts are closed. When the contracts are closed, realized gains (losses) are recorded. Realized and unrealized gains (losses) on the contracts are included in the Statement of Operations. The primary risks associated with forward foreign currency contracts include failure of the Counterparty to meet the terms of the contract and the value of the foreign currency changing unfavorably. These risks may be in excess of the amounts reflected in the Statement of Assets and Liabilities.
NOTE 2—Advisory Fees and Other Fees Paid to Affiliates
The Trust has entered into a master investment advisory agreement with Invesco Advisers, Inc. (the "Adviser" or "Invesco"). Under the terms of the investment advisory agreement, the Fund accrues daily and pays monthly an advisory fee to the Adviser based on the annual rate of the Fund’s average daily net assets as follows:
| Average Daily Net Assets | Rate |
| First $1 billion | 0.50% |
| Next $1 billion | 0.45% |
| Next $1 billion | 0.40% |
| Over $3 billion | 0.35% |
For the year ended April 30, 2019, the effective advisory fees incurred by the Fund was 0.37%.
Under the terms of a master sub-advisory agreement between the Adviser and each of Invesco Asset Management Deutschland GmbH, Invesco Asset Management Limited, Invesco Asset Management (Japan) Limited, Invesco Hong Kong Limited, Invesco Senior Secured Management, Inc. and Invesco Canada Ltd. (collectively, the "Affiliated Sub-Advisers") the Adviser, not the Fund, will pay 40% of the fees paid to the Adviser to any such Affiliated Sub-Adviser(s) that provide(s) discretionary investment management services to the Fund based on the percentage of assets allocated to such Affiliated Sub-Adviser(s).
The Adviser has contractually agreed, through at least June 30, 2020, to waive advisory fees and/or reimburse expenses of all shares to the extent necessary to limit total annual fund operating expenses after fee waiver and/or expense reimbursement (excluding certain items discussed below) of Class A, Class C, Class R, Class Y, Class R5 and Class R6 shares to 2.00%, 2.75%, 2.25%, 1.75%, 1.75% and 1.75% respectively, of average daily net assets (the "expense limits"). In determining the Adviser’s obligation to waive advisory fees and/or reimburse expenses, the following expenses are not taken into account, and could cause the total annual fund operating expenses after fee waiver and/or expense reimbursement to exceed the numbers reflected above: (1) interest; (2) taxes; (3) dividend expense on short sales; (4) extraordinary or non-routine items, including litigation expenses; and (5) expenses that the Fund has incurred but did not actually pay because of an expense offset arrangement. Unless Invesco continues the fee waiver agreement, it will terminate on June 30, 2020. During its term, the fee waiver agreement cannot be terminated or amended to increase the expense limits or reduce the advisory fee waiver without approval of the Board of Trustees. The Adviser did not waive fees and/or reimburse expenses during the period under these expense limits.
The Adviser has contractually agreed, through at least June 30, 2021, to waive the advisory fee payable by the Fund in an amount equal to 100% of the net advisory fees the Adviser receives from the affiliated money market funds on investments by the Fund of uninvested cash in such affiliated money market funds.
For the year ended April 30, 2019, the Adviser waived advisory fees of $638,808.
The Trust has entered into a master administrative services agreement with Invesco pursuant to which the Fund has agreed to pay Invesco for certain administrative costs incurred in providing accounting services to the Fund. For the year ended April 30, 2019, expenses incurred under the agreement are shown in the Statement of Operations asAdministrative services fees. Also, Invesco has entered into a sub-administration agreement whereby State Street Bank and Trust Company (“SSB”) serves as custodian and fund accountant and provides certain administrative services to the Fund.
The Trust has entered into a transfer agency and service agreement with Invesco Investment Services, Inc. (“IIS”) pursuant to which the Fund has agreed to pay IIS a fee for providing transfer agency and shareholder services to the Fund and reimburse IIS for certain expenses incurred by IIS in the course of providing such services. IIS may make payments to intermediaries that provide omnibus account services, sub-accounting services and/or networking services. All fees payable by IIS to intermediaries that provide omnibus account services or sub-accounting services are charged back to the Fund, subject to certain limitations approved by the Trust’s Board of Trustees. For the year ended April 30, 2019, expenses incurred under the agreement are shown in the Statement of Operations asTransfer agent fees.
Shares of the Fund are distributed by Invesco Distributors, Inc. (“IDI”). The Fund has adopted a distribution plan pursuant to Rule 12b-1 under the 1940 Act, and a service plan (collectively, the “Plans”) for Class A, Class C and Class R shares to compensate IDI for the sale, distribution, shareholder
servicing and maintenance of shareholder accounts for these shares. Under the Plans, the Fund will incur annual fees of up to 0.25% of Class A average daily net assets, up to 1.00% of Class C average daily net assets and up to 0.50% of Class R average daily net assets. The fees are accrued daily and paid monthly.
With respect to Class C shares, the Fund is authorized to reimburse in future years any distribution related expenses that exceed the maximum annual reimbursement rate for such class, so long as such reimbursement does not cause the Fund to exceed the Class C maximum annual reimbursement rate, respectively. With respect to Class A shares, distribution related expenses that exceed the maximum annual reimbursement rate for such class are not carried forward to future years and the Fund will not reimburse IDI for any such expenses.
For the year ended April 30, 2019, expenses incurred under these agreements are shown in the Statement of Operations asDistribution fees.
Front-end sales commissions and CDSC (collectively, the “sales charges”) are not recorded as expenses of the Fund. Front-end sales commissions are deducted from proceeds from the sales of Fund shares prior to investment in Class A shares of the Fund. CDSC are deducted from redemption proceeds prior to remittance to the shareholder. During the year ended April 30, 2019, IDI advised the Fund that IDI retained $647,004 in front-end sales commissions from the sale of Class A shares and $26,300 and $10,318 from Class A and Class C shares, respectively, for CDSC imposed upon redemptions by shareholders.
For the year ended April 30, 2019, the Fund incurred $46,547 in brokerage commissions with Invesco Capital Markets, Inc., an affiliate of the Adviser and IDI, for portfolio transactions executed on behalf of the Fund.
Certain officers and trustees of the Trust are officers and directors of the Adviser, IIS and/or IDI.
NOTE 3—Additional Valuation Information
GAAP defines fair value as the price that would be received to sell an asset or paid to transfer a liability in an orderly transaction between market participants at the measurement date, under current market conditions. GAAP establishes a hierarchy that prioritizes the inputs to valuation methods, giving the highest priority to readily available unadjusted quoted prices in an active market for identical assets (Level 1) and the lowest priority to significant unobservable inputs (Level 3), generally when market prices are not readily available or are unreliable. Based on the valuation inputs, the securities or other investments are tiered into one of three levels. Changes in valuation methods may result in transfers in or out of an investment’s assigned level:
Level 1 – Prices are determined using quoted prices in an active market for identical assets.
Level 2 – Prices are determined using other significant observable inputs. Observable inputs are inputs that other market participants may use in pricing a security. These may include quoted prices for similar securities, interest rates, prepayment speeds, credit risk, yield curves, loss severities, default rates, discount rates, volatilities and others.
Level 3 – Prices are determined using significant unobservable inputs. In situations where quoted prices or observable inputs are unavailable (for example, when there is little or no market activity for an investment at the end of the period), unobservable inputs may be used. Unobservable inputs reflect the Fund’s own assumptions about the factors market participants would use in determining fair value of the securities or instruments and would be based on the best available information.
The following is a summary of the tiered valuation input levels, as of April 30, 2019. The level assigned to the securities valuations may not be an indication of the risk or liquidity associated with investing in those securities. Because of the inherent uncertainties of valuation, the values reflected in the financial statements may materially differ from the value received upon actual sale of those investments.
| | Level 1 | Level 2 | Level 3 | Total |
| Investments in Securities | | | | |
| Common Stocks & Other Equity Interests | $11,139,255,012 | $186,946,175 | $— | $11,326,201,187 |
| Money Market Funds | 773,211,309 | — | — | 773,211,309 |
| Total Investments in Securities | 11,912,466,321 | 186,946,175 | — | 12,099,412,496 |
| Other Investments - Assets* | | | | |
| Forward Foreign Currency Contracts | — | 3,926,710 | — | 3,926,710 |
| Other Investments - Liabilities* | | | | |
| Forward Foreign Currency Contracts | — | (184,613) | — | (184,613) |
| Total Other Investments | — | 3,742,097 | — | 3,742,097 |
| Total Investments | $11,912,466,321 | $190,688,272 | $— | $12,103,154,593 |
| * | Unrealized appreciation (depreciation). |
NOTE 4—Derivative Investments
The Fund may enter into an International Swaps and Derivatives Association Master Agreement (“ISDA Master Agreement”) under which a fund may trade OTC derivatives. An OTC transaction entered into under an ISDA Master Agreement typically involves a collateral posting arrangement, payment netting provisions and close-out netting provisions. These netting provisions allow for reduction of credit risk through netting of contractual obligations. The enforceability of the netting provisions of the ISDA Master Agreement depends on the governing law of the ISDA Master Agreement, among other factors.
For financial reporting purposes, the Fund does not offset OTC derivative assets or liabilities that are subject to ISDA Master Agreements in the Statement of Assets and Liabilities.
Value of Derivative Investments at Period-End
The table below summarizes the value of the Fund’s derivative investments, detailed by primary risk exposure, held as of April 30, 2019:
| | Value |
| Derivative Assets | Currency
Risk |
| Unrealized appreciation on forward foreign currency contracts outstanding | $3,926,710 |
| Derivatives not subject to master netting agreements | - |
| Total Derivative Assets subject to master netting agreements | $3,926,710 |
| | Value |
| Derivative Liabilities | Currency
Risk |
| Unrealized depreciation on forward foreign currency contracts outstanding | $(184,613) |
| Derivatives not subject to master netting agreements | - |
| Total Derivative Liabilities subject to master netting agreements | $(184,613) |
Offsetting Assets and Liabilities
The table below reflects the Fund’s exposure to Counterparties subject to either an ISDA Master Agreement or other agreement for OTC derivative transactions as of April 30, 2019.
| | Financial
Derivative
Assets | Financial
Derivative
Liabilities | Net Value of
Derivatives | Collateral
(Received)/Pledged | | |
| Counterparty | Forward Foreign
Currency Contracts | Forward Foreign
Currency Contracts | | Non-Cash | Cash | Net
Amount |
| Canadian Imperial Bank of Commerce | $438,713 | $– | $438,713 | $– | $– | $438,713 |
| Goldman Sachs International | 1,081,619 | (6,162) | 1,075,457 | – | – | 1,075,457 |
| Royal Bank of Canada | 2,406,378 | (171,276) | 2,235,102 | – | – | 2,235,102 |
| State Street Bank & Trust Co. | – | (7,175) | (7,175) | – | – | (7,175) |
| Total | $3,926,710 | $(184,613) | $3,742,097 | $– | $– | $3,742,097 |
Effect of Derivative Investments for the year ended April 30, 2019
The table below summarizes the gains (losses) on derivative investments, detailed by primary risk exposure, recognized in earnings during the period:
| | Location of Gain (Loss) on
Statement of Operations |
| | Currency
Risk |
| Realized Gain: | |
| Forward foreign currency contracts | $85,228,210 |
| Change in Net Unrealized Appreciation (Depreciation): | |
| Forward foreign currency contracts | (22,203,227) |
| Total | $63,024,983 |
The table below summarizes the average notional value of derivatives held during the period.
| | Forward
Foreign Currency
Contracts |
| Average notional value | $784,014,399 |
NOTE 5—Expense Offset Arrangement(s)
The expense offset arrangement is comprised of transfer agency credits which result from balances in demand deposit accounts used by the transfer agent for clearing shareholder transactions. For the year ended April 30, 2019, the Fund received credits from this arrangement, which resulted in the reduction of the Fund’s total expenses of $32,265.
NOTE 6—Trustees’ and Officers’ Fees and Benefits
Trustees’ and Officers’ Fees and Benefits include amounts accrued by the Fund to pay remuneration to certain Trustees and Officers of the Fund. Trustees have the option to defer compensation payable by the Fund, and Trustees’ and Officers’ Fees and Benefits also include amounts accrued by the Fund to fund such deferred compensation amounts. Those Trustees who defer compensation have the option to select various Invesco Funds in which
their deferral accounts shall be deemed to be invested. Finally, certain current Trustees were eligible to participate in a retirement plan that provided for benefits to be paid upon retirement to Trustees over a period of time based on the number of years of service. The Fund may have certain former Trustees who also participate in a retirement plan and receive benefits under such plan.Trustees’ and Officers’ Fees and Benefits include amounts accrued by the Fund to fund such retirement benefits. Obligations under the deferred compensation and retirement plans represent unsecured claims against the general assets of the Fund.
NOTE 7—Cash Balances
The Fund is permitted to temporarily carry a negative or overdrawn balance in its account with SSB, the custodian bank. Such balances, if any at period-end, are shown in the Statement of Assets and Liabilities under the payable captionAmount due custodian. To compensate the custodian bank for such overdrafts, the overdrawn Fund may either (1) leave funds as a compensating balance in the account so the custodian bank can be compensated by earning the additional interest; or (2) compensate by paying the custodian bank at a rate agreed upon by the custodian bank and Invesco, not to exceed the contractually agreed upon rate.
NOTE 8—Distributions to Shareholders and Tax Components of Net Assets
| Tax Character of Distributions to Shareholders Paid During the Fiscal Years Ended April 30, 2019 and 2018 |
| | 2019 | 2018 |
| Ordinary income | $261,897,039 | $187,091,192 |
| Long-term capital gain | 758,540,565 | 274,813,633 |
| Total distributions | $1,020,437,604 | $461,904,825 |
| Tax Components of Net Assets at Period-End: |
| | 2019 |
| Undistributed ordinary income | $69,909,885 |
| Undistributed long-term capital gain | 362,516,686 |
| Net unrealized appreciation — investments | 2,739,484,962 |
| Net unrealized appreciation (depreciation) — foreign currencies | (70,973) |
| Temporary book/tax differences | (913,972) |
| Shares of beneficial interest | 8,943,856,502 |
| Total net assets | $12,114,783,090 |
The difference between book-basis and tax-basis unrealized appreciation (depreciation) is due to differences in the timing of recognition of gains and losses on investments for tax and book purposes. The Fund’s net unrealized appreciation difference is attributable primarily to wash sales and forward foreign currency contracts.
The temporary book/tax differences are a result of timing differences between book and tax recognition of income and/or expenses. The Fund’s temporary book/tax differences are the result of the trustee deferral of compensation and retirement plan benefits.
Capital loss carryforward is calculated and reported as of a specific date. Results of transactions and other activity after that date may affect the amount of capital loss carryforward actually available for the Fund to utilize. Capital losses generated in years beginning after December 22, 2010 can be carried forward for an unlimited period, whereas previous losses expire in eight tax years. Capital losses with an expiration period may not be used to offset capital gains until all net capital losses without an expiration date have been utilized. Capital loss carryforwards with no expiration date will retain their character as either short-term or long-term capital losses instead of as short-term capital losses as under prior law. The ability to utilize capital loss carryforwards in the future may be limited under the Internal Revenue Code and related regulations based on the results of future transactions.
The Fund does not have a capital loss carryforward as of April 30, 2019.
NOTE 9—Investment Transactions
The aggregate amount of investment securities (other than short-term securities, U.S. Treasury obligations and money market funds, if any) purchased and sold by the Fund during the year ended April 30, 2019 was $2,606,463,473 and $3,175,225,497, respectively. Cost of investments, including any derivatives, on a tax basis includes the adjustments for financial reporting purposes as of the most recently completed federal income tax reporting period-end.
| Unrealized Appreciation (Depreciation) of Investments on a Tax Basis |
| Aggregate unrealized appreciation of investments | $3,219,983,502 |
| Aggregate unrealized (depreciation) of investments | (480,498,540) |
| Net unrealized appreciation of investments | $2,739,484,962 |
Cost of investments for tax purposes is $9,363,669,631.
NOTE 10—Reclassification of Permanent Differences
Primarily as a result of differing book/tax treatment of foreign currency transactions, on April 30, 2019, undistributed net investment income (loss) was decreased by $442,128 and undistributed net realized gain (loss) was increased by $442,128. This reclassification had no effect on the net assets or distributable earnings of the Fund.
NOTE 11—Share Information
| | Summary of Share Activity |
| | Years ended April 30, |
| | 2019(a) | | 2018 |
| | Shares | Amount | | Shares | Amount |
| Sold: | | | | | |
| Class A | 19,235,509 | $491,515,179 | | 17,881,424 | $457,556,965 |
| Class B(b) | — | — | | 5,754 | 142,232 |
| Class C | 1,534,289 | 39,146,050 | | 1,226,803 | 32,091,232 |
| Class R | 1,192,696 | 30,493,158 | | 1,780,571 | 46,522,283 |
| Class Y | 17,771,878 | 453,272,484 | | 17,799,853 | 455,900,712 |
| Class R5 | 4,438,371 | 113,906,701 | | 4,772,356 | 122,684,025 |
| Class R6 | 38,439,425 | 1,012,581,472 | | 83,015,877 | 2,050,932,804 |
| Issued as reinvestment of dividends: | | | | | |
| Class A | 20,775,822 | 473,525,773 | | 8,550,536 | 222,148,501 |
| Class B(b) | — | — | | 33,805 | 872,904 |
| Class C | 1,301,913 | 29,369,529 | | 488,807 | 12,782,318 |
| Class R | 786,138 | 17,883,529 | | 376,218 | 9,772,489 |
| Class Y | 6,038,549 | 137,929,745 | | 2,695,973 | 69,648,491 |
| Class R5 | 2,581,603 | 59,028,810 | | 1,181,061 | 30,600,266 |
| Class R6 | 10,802,298 | 246,810,381 | | 3,592,003 | 93,645,904 |
| Conversion of Class B shares to Class A shares:(c) | | | | | |
| Class A | — | — | | 863,956 | 24,959,681 |
| Class B | — | — | | (881,443) | (24,959,681) |
| Automatic conversion of Class C shares to Class A shares: | | | | | |
| Class A | 10,774,173 | 251,650,707 | | - | - |
| Class C | (10,774,189) | (251,650,707) | | - | - |
| Reacquired: | | | | | |
| Class A | (39,747,406) | (1,011,202,334) | | (50,399,699) | (1,295,937,344) |
| Class B(b) | — | — | | (815,930) | (20,922,962) |
| Class C | (3,316,074) | (85,305,046) | | (5,468,733) | (137,970,705) |
| Class R | (3,473,453) | (89,424,412) | | (5,695,017) | (147,258,581) |
| Class Y | (23,480,250) | (587,227,953) | | (89,514,093) | (2,209,277,547) |
| Class R5 | (8,171,985) | (206,363,150) | | (9,242,431) | (240,759,143) |
| Class R6 | (28,542,079) | (740,544,766) | | (18,795,017) | (493,268,681) |
| Net increase (decrease) in share activity | 18,167,228 | $385,395,150 | | (36,547,366) | $(940,093,837) |
| (a) | There are entities that are record owners of more than 5% of the outstanding shares of the Fund and in the aggregate own 51% of the outstanding shares of the Fund. IDI has an agreement with these entities to sell Fund shares. The Fund, Invesco and/or Invesco affiliates may make payments to these entities, which are considered to be related to the Fund, for providing services to the Fund, Invesco and/or Invesco affiliates including but not limited to services such as securities brokerage, distribution, third party record keeping and account servicing. The Fund has no knowledge as to whether all or any portion of the shares owned of record by these entities are also owned beneficially. |
| (b) | Class B shares activity for the period May 1, 2017 through January 26, 2018 (date of conversion). |
| (c) | Effective as of the close of business on January 26, 2018, all outstanding Class B shares were converted to Class A shares. |
Report of Independent Registered Public Accounting Firm
To the Board of Trustees of AIM Sector Funds (Invesco Sector Funds) and Shareholders of Invesco Comstock Fund:
Opinion on the Financial Statements
We have audited the accompanying statement of assets and liabilities, including the schedule of investments, of Invesco Comstock Fund (one of the funds constituting AIM Sector Funds (Invesco Sector Funds), hereafter referred to as the “Fund”) as of April 30, 2019, the related statement of operations for the year ended April 30, 2019, the statement of changes in net assets for each of the two years in the period ended April 30, 2019, including the related notes, and the financial highlights for each of the five years in the period ended April 30, 2019 (collectively referred to as the “financial statements”). In our opinion, the financial statements present fairly, in all material respects, the financial position of the Fund as of April 30, 2019, the results of its operations for the year then ended, the changes in its net assets for each of the two years in the period ended April 30, 2019 and the financial highlights for each of the five years in the period ended April 30, 2019 in conformity with accounting principles generally accepted in the United States of America.
Basis for Opinion
These financial statements are the responsibility of the Fund’s management. Our responsibility is to express an opinion on the Fund’s financial statements based on our audits. We are a public accounting firm registered with the Public Company Accounting Oversight Board (United States) (“PCAOB”) and are required to be independent with respect to the Fund in accordance with the U.S. federal securities laws and the applicable rules and regulations of the Securities and Exchange Commission and the PCAOB.
We conducted our audits of these financial statements in accordance with the standards of the PCAOB. Those standards require that we plan and perform the audit to obtain reasonable assurance about whether the financial statements are free of material misstatement, whether due to error or fraud.
Our audits included performing procedures to assess the risks of material misstatement of the financial statements, whether due to error or fraud, and performing procedures that respond to those risks. Such procedures included examining, on a test basis, evidence regarding the amounts and disclosures in the financial statements. Our audits also included evaluating the accounting principles used and significant estimates made by management, as well as evaluating the overall presentation of the financial statements. Our procedures included confirmation of securities owned as of April 30, 2019 by correspondence with the custodian, transfer agent and brokers; when replies were not received from brokers, we performed other auditing procedures. We believe that our audits provide a reasonable basis for our opinion.
PricewaterhouseCoopers LLP
Houston, TX
June 26, 2019
We have served as the auditor of one or more of the investment companies in the Invesco group of investment companies since at least 1995. We have not been able to determine the specific year we began serving as auditor.
Calculating your ongoing Fund expenses
Example
As a shareholder of the Fund, you incur two types of costs: (1) transaction costs, which may include sales charges (loads) on purchase payments or contingent deferred sales charges on redemptions, if any; and (2) ongoing costs, including management fees, distribution and/or service (12b-1) fees, and other Fund expenses. This example is intended to help you understand your ongoing costs (in dollars) of investing in the Fund and to compare these costs with ongoing costs of investing in other mutual funds. The example is based on an investment of $1,000 invested at the beginning of the period and held for the entire period November 1, 2018 through April 30, 2019.
Actual expenses
The table below provides information about actual account values and actual expenses. You may use the information in this table, together with the amount you invested, to estimate the expenses that you paid over the period. Simply divide your account value by $1,000 (for example, an $8,600 account value divided by $1,000 = 8.6), then multiply the result by the number in the table under the heading entitled “Actual Expenses Paid During Period” to estimate the expenses you paid on your account during this period.
Hypothetical example for comparison purposes
The table below also provides information about hypothetical account values and hypothetical expenses based on the Fund’s actual expense ratio and an assumed rate of return of 5% per year before expenses, which is not the Fund’s actual return.
The hypothetical account values and expenses may not be used to estimate the actual ending account balance or expenses you paid for the period. You may use this information to compare the ongoing costs of investing in the Fund and other funds. To do so, compare this 5% hypothetical example with the 5% hypothetical examples that appear in the shareholder reports of the other funds.
Please note that the expenses shown in the table are meant to highlight your ongoing costs only and do not reflect any transaction costs, such as sales charges (loads) on purchase payments or contingent deferred sales charges on redemptions, if any. Therefore, the hypothetical information is useful in comparing ongoing costs only, and will not help you determine the relative total costs of owning different funds. In addition, if these transaction costs were included, your costs would have been higher.
| | Beginning
Account Value (11/01/18) | ACTUAL | HYPOTHETICAL
(5% annual return before
expenses) | Annualized
Expense
Ratio |
Ending
Account Value
(04/30/19)1 | Expenses
Paid During
Period2 | Ending
Account Value
(04/30/19) | Expenses
Paid During
Period2 |
| Class A | $1,000.00 | $1,064.60 | $4.10 | $1,020.83 | $4.01 | 0.80% |
| Class C | 1,000.00 | 1,060.10 | 7.92 | 1,017.11 | 7.75 | 1.55 |
| Class R | 1,000.00 | 1,062.80 | 5.37 | 1,019.59 | 5.26 | 1.05 |
| Class Y | 1,000.00 | 1,065.50 | 2.82 | 1,022.07 | 2.76 | 0.55 |
| Class R5 | 1,000.00 | 1,065.90 | 2.51 | 1,022.36 | 2.46 | 0.49 |
| Class R6 | 1,000.00 | 1,066.40 | 2.00 | 1,022.86 | 1.96 | 0.39 |
| 1 | The actual ending account value is based on the actual total return of the Fund for the period November 1, 2018 through April 30, 2019, after actual expenses and will differ from the hypothetical ending account value which is based on the Fund’s expense ratio and a hypothetical annual return of 5% before expenses. |
| 2 | Expenses are equal to the Fund’s annualized expense ratio as indicated above multiplied by the average account value over the period, multiplied by 181/365 to reflect the most recent fiscal half year. |
Tax Information
Form 1099-DIV, Form 1042-S and other year–end tax information provide shareholders with actual calendar year amounts that should be included in their tax returns. Shareholders should consult their tax advisers.
The following distribution information is being provided as required by the Internal Revenue Code or to meet a specific state’s requirement.
The Fund designates the following amounts or, if subsequently determined to be different, the maximum amount allowable for its fiscal year ended April 30, 2019:
| Federal and State Income Tax | |
| Long-Term Capital Gain Distributions | $758,540,565 |
| Qualified Dividend Income* | 96.22% |
| Corporate Dividends Received Deduction* | 70.56% |
| U.S. Treasury Obligations* | 0.00% |
| * | The above percentages are based on ordinary income dividends paid to shareholders during the Fund’s fiscal year. |
Trustees and Officers
The address of each trustee and officer is AIM Sector Funds (Invesco Sector Funds) (the “Trust”), 11 Greenway Plaza, Suite 1000, Houston, Texas 77046-1173. The trustees serve for the life of the Trust, subject to their earlier death, incapacitation, resignation, retirement or removal as more specifically provided in the Trust’s organizational documents. Each officer serves for a one year term or until their successors are elected and qualified. Column two below includes length of time served with predecessor entities, if any.
| | | | | | | | |
Name, Year of Birth and
Position(s) Held with the Trust | | Trustee and/
or Officer Since | | Principal Occupation(s)
During Past 5 Years | | Number of Funds in Fund
Complex
Overseen by
Trustee | | Other Directorship(s)
Held by Trustee During
Past 5 Years |
| Interested Persons | | | | | | | | |
Martin L. Flanagan1 — 1960 Trustee and Vice Chair | | 2007 | | Executive Director, Chief Executive Officer and President, Invesco Ltd. (ultimate parent of Invesco and a global investment management firm); Trustee and Vice Chair, The Invesco Funds; Vice Chair, Investment Company Institute; and Member of Executive Board, SMU Cox School of Business Formerly: Advisor to the Board, Invesco Advisers, Inc. (formerly known as Invesco Institutional (N.A.), Inc.); Chairman and Chief Executive Officer, Invesco Advisers, Inc. (registered investment adviser); Director, Chairman, Chief Executive Officer and President, Invesco Holding Company (US), Inc. (formerly IVZ Inc.) (holding company), Invesco Group Services, Inc. (service provider) and Invesco North American Holdings, Inc. (holding company); Director, Chief Executive Officer and President, Invesco Holding Company Limited (parent of Invesco and a global investment management firm); Director, Invesco Ltd.; Chairman, Investment Company Institute and President,Co-Chief Executive Officer,Co-President, Chief Operating Officer and Chief Financial Officer, Franklin Resources, Inc. (global investment management organization) | | 241 | | None |
Philip A. Taylor2 — 1954 Trustee | | 2006 | | Vice Chair, Invesco Ltd.; Director, Invesco Canada Ltd. (formerly known as Invesco Trimark Ltd./Invesco Trimark Ltèe) (registered investment adviser and registered transfer agent); Trustee, The Invesco Funds Formerly: Head of the Americas and Senior Managing Director, Invesco Ltd.; Director, Invesco Advisers, Inc. (formerly known as Invesco Institutional (N.A.), Inc.) (registered investment adviser); Director and Chairman, Invesco Investment Services, Inc. (formerly known as Invesco AIM Investment Services, Inc.) (registered transfer agent); Chief Executive Officer, Invesco Corporate Class Inc. (corporate mutual fund company); Chairman and Chief Executive Officer, Invesco Canada Ltd. (formerly known as Invesco Trimark Ltd./Invesco Trimark Ltèe) (registered investment adviser and registered transfer agent); Senior Vice President, The Invesco Funds; Director, Invesco Investment Advisers LLC (formerly known as Van Kampen Asset Management); Director, Chairman, Chief Executive Officer and President, Invesco Management Group, Inc. (formerly known as Invesco AIM Management Group, Inc.) (financial services holding company);Co-Chairman,Co-President andCo-Chief Executive Officer, Invesco Advisers, Inc. (formerly known as Invesco Institutional (N.A.), Inc.) (registered investment adviser); Director, Chief Executive Officer and President, Van Kampen Exchange Corp; President and Principal Executive Officer, The Invesco Funds (other than AIM Treasurer’s Series Trust (Invesco Treasurer’s Series Trust), Short-Term Investments Trust and Invesco Management Trust); Executive Vice President, The Invesco Funds (AIM Treasurer’s Series Trust (Invesco Treasurer’s Series Trust), Short-Term Investments Trust and Invesco Management Trust only); Director and President, INVESCO Funds Group, Inc. (registered investment adviser and registered transfer agent); Director and Chairman, IVZ Distributors, Inc. (formerly known as INVESCO Distributors, Inc.) (registered broker dealer); Director, President and Chairman, Invesco Inc. (holding company), Invesco Canada Holdings Inc. (holding company), Trimark Investments Ltd./Placements Trimark Ltèe and Invesco Financial Services Ltd/Services Financiers Invesco Ltèe; Chief Executive Officer, Invesco Canada Fund Inc. (corporate mutual fund company); Director and Chairman, Van Kampen Investor Services Inc.; Director, Chief Executive Officer and President, 1371 Preferred Inc. (holding company) and Van Kampen Investments Inc.; Director and President, AIM GP Canada Inc. (general partner for limited partnerships) and Van Kampen Advisors, Inc.; Director and Chief Executive Officer, Invesco Trimark Dealer Inc. (registered broker dealer); Director, Invesco Distributors, Inc. (formerly known as Invesco AIM Distributors, Inc.) (registered broker dealer); Manager, Invesco Capital Management LLC; Director, Chief Executive Officer and President, Invesco Advisers, Inc.; Director, Chairman, Chief Executive Officer and President, Invesco AIM Capital Management, Inc.; President, Invesco Trimark Dealer Inc. and Invesco Trimark Ltd./Invesco Trimark Ltèe; Director and President, AIM Trimark Corporate Class Inc. and AIM Trimark Canada Fund Inc.; Senior Managing Director, Invesco Holding Company Limited; Director and Chairman, Fund Management Company (former registered broker dealer); President and Principal Executive Officer, The Invesco Funds (AIM Treasurer’s Series Trust (Invesco Treasurer’s Series Trust), and Short-Term Investments Trust only); President, AIM Trimark Global Fund Inc. and AIM Trimark Canada Fund Inc. | | 241 | | None |
| 1 | Mr. Flanagan is considered an interested person (within the meaning of Section 2(a)(19) of the 1940 Act) of the Trust because he is an officer of the Adviser to the Trust, and an officer and a director of Invesco Ltd., ultimate parent of the Adviser. |
| 2 | Mr. Taylor is considered an interested person (within the meaning of Section 2(a)(19) of the 1940 Act) of the Trust because he is an officer of Invesco Ltd., ultimate parent of the Adviser. |
T-1 Invesco Comstock Fund
Trustees and Officers—(continued)
| | | | | | | | |
Name, Year of Birth and
Position(s) Held with the Trust | | Trustee and/
or Officer Since | | Principal Occupation(s)
During Past 5 Years | | Number of Funds in Fund
Complex
Overseen by
Trustee | | Other Directorship(s)
Held by Trustee During
Past 5 Years |
| Independent Trustees | | | | | | | | |
Bruce L. Crockett — 1944 Trustee and Chair | | 2003 | | Chairman, Crockett Technologies Associates (technology consulting company) Formerly: Director, Captaris (unified messaging provider); Director, President and Chief Executive Officer, COMSAT Corporation; Chairman, Board of Governors of INTELSAT (international communications company); ACE Limited (insurance company); Independent Directors Council and Investment Company Institute: Member of the Audit Committee, Investment Company Institute; Member of the Executive Committee and Chair of the Governance Committee, Independent Directors Council | | 241 | | Director and Chairman of the Audit Committee, ALPS (Attorneys Liability Protection Society) (insurance company); Director and Member of the Audit Committee and Compensation Committee, Ferroglobe PLC (metallurgical company) |
David C. Arch — 1945 Trustee | | 2010 | | Chairman of Blistex Inc. (consumer health care products manufacturer); Member, World Presidents’ Organization | | 241 | | Board member of the Illinois Manufacturers’ Association |
Beth Ann Brown3 — 1968 Trustee | | 2019 | | Independent Consultant Formerly: Head of Intermediary Distribution, Managing Director, Strategic Relations, Managing Director, Head of National Accounts, Senior Vice President, National Account Manager and Senior Vice President, Key Account Manager, Columbia Management Investment Advisers LLC; Vice President, Key Account Manager, Liberty Funds Distributor, Inc.; and Trustee of certain Oppenheimer Funds | | 225 | | Director, Board of Directors of Caron Engineering Inc.; Advisor, Board of Advisors of Caron Engineering Inc.; President and Director, Acton Shapleigh Youth Conservation Corps (non -profit); and Vice President and Director of Grahamtastic Connection(non-profit) |
Jack M. Fields — 1952 Trustee | | 2003 | | Chief Executive Officer, Twenty First Century Group, Inc. (government affairs company); and Chairman, Discovery Learning Alliance(non-profit) Formerly: Owner and Chief Executive Officer, Dos Angeles Ranch L.P. (cattle, hunting, corporate entertainment); Director, Insperity, Inc. (formerly known as Administaff) (human resources provider); Chief Executive Officer, Texana Timber LP (sustainable forestry company); Director of Cross Timbers Quail Research Ranch(non-profit); and member of the U.S. House of Representatives | | 241 | | None |
Cynthia Hostetler — 1962 Trustee | | 2017 | | Non-Executive Director and Trustee of a number of public and private business corporations Formerly: Director, Aberdeen Investment Funds (4 portfolios); Head of Investment Funds and Private Equity, Overseas Private Investment Corporation; President, First Manhattan Bancorporation, Inc.; Attorney, Simpson Thacher & Bartlett LLP | | 241 | | Vulcan Materials Company (construction materials company); Trilinc Global Impact Fund; Genesee & Wyoming, Inc. (railroads); Artio Global Investment LLC (mutual fund complex); Edgen Group, Inc. (specialized energy and infrastructure products distributor); Investment Company Institute (professional organization); Independent Directors Council (professional organization) |
Eli Jones — 1961 Trustee | | 2016 | | Professor and Dean, Mays Business School — Texas A&M University Formerly: Professor and Dean, Walton College of Business, University of Arkansas and E.J. Ourso College of Business, Louisiana State University; Director, Arvest Bank | | 241 | | Insperity, Inc. (formerly known as Administaff) (human resources provider) |
Elizabeth Krentzman3 — 1959 Trustee | | 2019 | | Formerly: Principal and Chief Regulatory Advisor for Asset Management Services and U.S. Mutual Fund Leader of Deloitte & Touche LLP; General Counsel of the Investment Company Institute (trade association); National Director of the Investment Management Regulatory Consulting Practice, Principal, Director and Senior Manager of Deloitte & Touche LLP; Assistant Director of the Division of Investment Management — Office of Disclosure and Investment Adviser Regulation of the U.S. Securities and Exchange Commission and various positions with the Division of Investment Management — Office of Regulatory Policy of the U.S. Securities and Exchange Commission; Associate at Ropes & Gray LLP; Advisory Board Member of the Securities and Exchange Commission Historical Society; and Trustee of certain Oppenheimer Funds | | 225 | | Trustee of the University of Florida National Board Foundation and Audit Committee Member; Member of the Cartica Funds Board of Directors (private investment funds); Member of the University of Florida Law Center Association, Inc. Board of Trustees and Audit Committee Member |
Anthony J. LaCava, Jr. — 1956 Trustee | | 2019 | | Formerly: Director and Member of the Audit Committee, Blue Hills Bank (publicly traded financial institution) and Managing Partner, KPMG LLP | | 241 | | Blue Hills Bank; Chairman, Bentley University; Member, Business School Advisory Council; and Nominating Committee, KPMG LLP |
Prema Mathai-Davis — 1950 Trustee | | 2003 | | Retired Co-Owner & Partner of Quantalytics Research, LLC, (a FinTech Investment Research Platform for the Self-Directed Investor) | | 241 | | None |
| 3 | Mss. Brown and Krentzman and Messrs. Motley, Vandivort and Vaughn were appointed as Trustees of the Trust effective June 10, 2019. |
T-2 Invesco Comstock Fund
Trustees and Officers—(continued)
| | | | | | | | |
Name, Year of Birth and
Position(s) Held with the Trust | | Trustee and/
or Officer Since | | Principal Occupation(s)
During Past 5 Years | | Number of Funds in Fund
Complex
Overseen by
Trustee | | Other Directorship(s)
Held by Trustee During
Past 5 Years |
| Independent Trustees—(continued) |
Joel W. Motley3 — 1952 Trustee | | 2019 | | Director of Office of Finance, Federal Home Loan Bank; Member of the Vestry of Trinity Wall Street; Managing Director of Carmona Motley Inc. (privately held financial advisor); Member of the Finance and Budget Committee of the Council on Foreign Relations, Member of the Investment Committee and Board of Human Rights Watch and Member of the Investment Committee and Board of Historic Hudson Valley(non-profit cultural organization) Formerly: Managing Director of Public Capital Advisors, LLC (privately held financial advisor); Managing Director of Carmona Motley Hoffman, Inc. (privately held financial advisor); Trustee of certain Oppenheimer Funds; and Director of Columbia Equity Financial Corp. (privately held financial advisor) | | 225 | | Director of Greenwall Foundation (bioethics research foundation); Member of Board and Investment Committee of The Greenwall Foundation; Director of Southern Africa Legal Services Foundation; Board Member and Investment Committee Member of Pulitzer Center for Crisis Reporting(non-profit journalism) |
Teresa M. Ressel — 1962 Trustee | | 2017 | | Non-executive director and trustee of a number of public and private business corporations Formerly: Chief Financial Officer, Olayan America, The Olayan Group (international investor/commercial/industrial); Chief Executive Officer, UBS Securities LLC; Group Chief Operating Officer, Americas, UBS AG; Assistant Secretary for Management & Budget and CFO, US Department of the Treasury | | 241 | | Atlantic Power Corporation (power generation company); ON Semiconductor Corp. (semiconductor supplier) |
Ann Barnett Stern — 1957 Trustee | | 2017 | | President and Chief Executive Officer, Houston Endowment Inc. (private philanthropic institution) Formerly: Executive Vice President and General Counsel, Texas Children’s Hospital; Attorney, Beck, Redden and Secrest, LLP; Business Law Instructor, University of St. Thomas; Attorney, Andrews & Kurth LLP | | 241 | | Federal Reserve Bank of Dallas |
Raymond Stickel, Jr. — 1944 Trustee | | 2005 | | Retired Formerly: Director, Mainstay VP Series Funds, Inc. (25 portfolios); Partner, Deloitte & Touche | | 241 | | None |
Robert C. Troccoli — 1949 Trustee | | 2016 | | Adjunct Professor, University of Denver — Daniels College of Business Formerly: Senior Partner, KPMG LLP | | 241 | | None |
Daniel S. Vandivort3 — 1954 Trustee | | 2019 | | Treasurer, Chairman of the Audit and Finance Committee, and Trustee, Board of Trustees, Huntington Disease Foundation of America; and President, Flyway Advisory Services LLC (consulting and property management) Formerly: Trustee and Governance Chair, of certain Oppenheimer Funds | | 225 | | Chairman and Lead Independent Director, Chairman of the Audit Committee, and Director, Board of Directors, Value Line Funds |
James D. Vaughn3 — 1945 Trustee | | 2019 | | Retired Formerly: Managing Partner, Deloitte & Touche LLP; Trustee and Chairman of the Audit Committee, Schroder Funds; Board Member, Mile High United Way, Boys and Girls Clubs, Boy Scouts, Colorado Business Committee for the Arts, Economic Club of Colorado and Metro Denver Network (economic development corporation); and Trustee of certain Oppenheimer Funds | | 225 | | Board member and Chairman of Audit Committee of AMG National Trust Bank; Trustee and Investment Committee member, University of South Dakota Foundation; Board member, Audit Committee Member and past Board Chair, Junior Achievement(non-profit) |
Christopher L. Wilson — 1957 Trustee and Vice Chair | | 2017 | | Non-executive director and trustee of a number of public and private business corporations Formerly: Director, TD Asset Management USA Inc. (mutual fund complex) (22 portfolios); Managing Partner, CT2, LLC (investing and consulting firm); President/Chief Executive Officer, Columbia Funds, Bank of America Corporation; President/Chief Executive Officer, CDC IXIS Asset Management Services, Inc.; Principal & Director of Operations, Scudder Funds, Scudder, Stevens & Clark, Inc.; Assistant Vice President, Fidelity Investments | | 241 | | ISO New England, Inc.(non-profit organization managing regional electricity market) |
| Other Officers | | | | | | | | |
Sheri Morris — 1964 President, Principal Executive Officer and Treasurer | | 2003 | | President, Principal Executive Officer and Treasurer, The Invesco Funds; Vice President, Invesco Advisers, Inc. (formerly known as Invesco Institutional (N.A.), Inc.) (registered investment adviser); and Vice President, Invesco Exchange-Traded Fund Trust, Invesco Exchange-Traded Fund Trust II, Invesco India Exchange-Traded Fund Trust, Invesco Actively Managed Exchange-Traded Fund Trust, Invesco Actively Managed Exchange-Traded Commodity Fund Trust and Invesco Exchange-Traded Self-Indexed Fund Trust Formerly: Vice President and Principal Financial Officer, The Invesco Funds; Vice President, Invesco AIM Advisers, Inc., Invesco AIM Capital Management, Inc. and Invesco AIM Private Asset Management, Inc.; Assistant Vice President and Assistant Treasurer, The Invesco Funds and Assistant Vice President, Invesco Advisers, Inc., Invesco AIM Capital Management, Inc. and Invesco AIM Private Asset Management, Inc.; and Treasurer, Invesco Exchange-Traded Fund Trust, Invesco Exchange-Traded Fund Trust II, Invesco India Exchange-Traded Fund Trust and Invesco Actively Managed Exchange-Traded Fund Trust | | N/A | | N/A |
Russell C. Burk — 1958 Senior Vice President and Senior Officer | | 2005 | | Senior Vice President and Senior Officer, The Invesco Funds | | N/A | | N/A |
| 3 | Mss. Brown and Krentzman and Messrs. Motley, Vandivort and Vaughn were appointed as Trustees of the Trust effective June 10, 2019. |
T-3 Invesco Comstock Fund
Trustees and Officers—(continued)
| | | | | | | | |
Name, Year of Birth and
Position(s) Held with the Trust | | Trustee and/
or Officer Since | | Principal Occupation(s)
During Past 5 Years | | Number of Funds in Fund
Complex
Overseen by
Trustee | | Other Directorship(s)
Held by Trustee During
Past 5 Years |
| Other Officers—(continued) | | | | | | | | |
Jeffrey H. Kupor — 1968 Senior Vice President, Chief Legal Officer and Secretary | | 2018 | | Head of Legal of the Americas, Invesco Ltd.; Senior Vice President and Secretary, Invesco Advisers, Inc. (formerly known as Invesco Institutional (N.A.), Inc.) (registered investment adviser); Senior Vice President and Secretary, Invesco Distributors, Inc. (formerly known as Invesco AIM Distributors, Inc.); Vice President and Secretary, Invesco Investment Services, Inc. (formerly known as Invesco AIM Investment Services, Inc.) Senior Vice President, Chief Legal Officer and Secretary, The Invesco Funds; Secretary and General Counsel, Invesco Investment Advisers LLC (formerly known as Van Kampen Asset Management); Secretary and General Counsel, Invesco Capital Markets, Inc. (formerly known as Van Kampen Funds Inc.) and Chief Legal Officer, Invesco Exchange-Traded Fund Trust, Invesco Exchange-Traded Fund Trust II, Invesco India Exchange-Traded Fund Trust, Invesco Actively Managed Exchange-Traded Fund Trust, Invesco Actively Managed Exchange-Traded Commodity Fund Trust and Invesco Exchange-Traded Self-Indexed Fund Trust; Secretary, Invesco Indexing LLC; Secretary, W.L. Ross & Co., LLC; Secretary and Vice President, Jemstep, Inc. Formerly: Head of Legal, Worldwide Institutional, Invesco Ltd.; Secretary and General Counsel, INVESCO Private Capital Investments, Inc.; Senior Vice President, Secretary and General Counsel, Invesco Management Group, Inc. (formerly known as Invesco AIM Management Group, Inc.); Assistant Secretary, INVESCO Asset Management (Bermuda) Ltd.; Secretary and General Counsel, Invesco Private Capital, Inc.; Assistant Secretary and General Counsel, INVESCO Realty, Inc.; Secretary and General Counsel, Invesco Senior Secured Management, Inc.; and Secretary, Sovereign G./P. Holdings Inc. | | N/A | | N/A |
Andrew R. Schlossberg — 1974 Senior Vice President | | 2019 | | Head of the Americas and Senior Managing Director, Invesco Ltd.; Director and Senior Vice President, Invesco Advisers, Inc. (formerly known as Invesco Institutional (N.A.), Inc.) (registered investment adviser); Director and Chairman, Invesco Investment Services, Inc. (formerly known as Invesco AIM Investment Services, Inc.) (registered transfer agent); Senior Vice President, The Invesco Funds; Director, Invesco Investment Advisers LLC (formerly known as Van Kampen Asset Management) and Invesco UK Limited; Director, President and Chairman, Invesco Insurance Agency, Inc.; Director and Chief Executive, Invesco Asset Management Limited and Invesco Fund Managers Limited Formerly: Assistant Vice President, The Invesco Funds; Senior Vice President, Invesco Advisers, Inc. (formerly known as Invesco Institutional (N.A.), Inc.) (registered investment adviser); Director and Chief Executive, Invesco Administration Services Limited and Invesco Global Investment Funds Limited; Director, Invesco Distributors, Inc.; Head of EMEA, Invesco Ltd.; President, Invesco Actively Managed Exchange-Traded Commodity Fund Trust, Invesco Actively Managed Exchange-Traded Fund Trust, Invesco Exchange-Traded Fund Trust, Invesco Exchange-Traded Fund Trust II and Invesco India Exchange-Traded Fund Trust; Managing Director and Principal Executive Officer, Invesco Capital Management LLC | | N/A | | N/A |
John M. Zerr — 1962 Senior Vice President | | 2006 | | Chief Operating Officer of the Americas; Senior Vice President, Invesco Advisers, Inc. (formerly known as Invesco Institutional (N.A.), Inc.) (registered investment adviser); Senior Vice President, Invesco Distributors, Inc. (formerly known as Invesco AIM Distributors, Inc.); Director and Vice President, Invesco Investment Services, Inc. (formerly known as Invesco AIM Investment Services, Inc.) Senior Vice President, The Invesco Funds; Managing Director, Invesco Capital Management LLC; Director, Invesco Investment Advisers LLC (formerly known as Van Kampen Asset Management); Senior Vice President, Invesco Capital Markets, Inc. (formerly known as Van Kampen Funds Inc.); Manager, Invesco Indexing LLC; Director and Senior Vice President, Invesco Insurance Agency, Inc.; Invesco Canada Funds Advisory Board Member; Director, President Chief Executive Officer, Invesco Corporate Class Inc. (corporate mutual fund company); and Director, Chairman, President and Chief Executive Officer, Invesco Canada Ltd. (formerly known as Invesco Trimark Ltd./Invesco Trimark Ltèe) (registered investment adviser and registered transfer agent) Formerly: Director and Senior Vice President, Invesco Management Group, Inc. (formerly known as Invesco AIM Management Group, Inc.); Secretary and General Counsel, Invesco Management Group, Inc. (formerly known as Invesco AIM Management Group, Inc.); Secretary, Invesco Investment Services, Inc. (formerly known as Invesco AIM Investment Services, Inc.); Chief Legal Officer and Secretary, The Invesco Funds; Secretary and General Counsel, Invesco Investment Advisers LLC (formerly known as Van Kampen Asset Management); Secretary and General Counsel, Invesco Capital Markets, Inc. (formerly known as Van Kampen Funds Inc.); Chief Legal Officer, Invesco Exchange-Traded Fund Trust, Invesco Exchange-Traded Fund Trust II, Invesco India Exchange-Traded Fund Trust, Invesco Actively Managed Exchange-Traded Fund Trust, Invesco Actively Managed Exchange-Traded Commodity Fund Trust and Invesco Exchange-Traded Self-Indexed Fund Trust; Secretary, Invesco Indexing LLC; Director, Secretary, General Counsel and Senior Vice President, Van Kampen Exchange Corp.; Director, Vice President and Secretary, IVZ Distributors, Inc. (formerly known as INVESCO Distributors, Inc.); Director and Vice President, INVESCO Funds Group, Inc.; Director and Vice President, Van Kampen Advisors Inc.; Director, Vice President, Secretary and General Counsel, Van Kampen Investor Services Inc.; Director and Secretary, Invesco Distributors, Inc. (formerly known as Invesco AIM Distributors, Inc.); Director, Senior Vice President, General Counsel and Secretary, Invesco AIM Advisers, Inc. and Van Kampen Investments Inc.; Director, Vice President and Secretary, Fund Management Company; Director, Senior Vice President, Secretary, General Counsel and Vice President, Invesco AIM Capital Management, Inc.; Chief Operating Officer and General Counsel, Liberty Ridge Capital, Inc. (an investment adviser) | | N/A | | N/A |
T-4 Invesco Comstock Fund
Trustees and Officers—(continued)
| | | | | | | | |
Name, Year of Birth and
Position(s) Held with the Trust | | Trustee and/
or Officer Since | | Principal Occupation(s)
During Past 5 Years | | Number of Funds in Fund
Complex
Overseen by
Trustee | | Other Directorship(s)
Held by Trustee During
Past 5 Years |
| Other Officers—(continued) | | | | | | | | |
Gregory G. McGreevey — 1962 Senior Vice President | | 2012 | | Senior Managing Director, Invesco Ltd.; Director, Chairman, President, and Chief Executive Officer, Invesco Advisers, Inc. (formerly known as Invesco Institutional (N.A.), Inc.) (registered investment adviser); Director, Invesco Mortgage Capital, Inc. and Invesco Senior Secured Management, Inc.; and Senior Vice President, The Invesco Funds Formerly: Senior Vice President, Invesco Management Group, Inc. and Invesco Advisers, Inc.; Assistant Vice President, The Invesco Funds | | N/A | | N/A |
Kelli Gallegos — 1970 Vice President, Principal Financial Officer and Assistant Treasurer | | 2008 | | Assistant Treasurer, Invesco Specialized Products, LLC; Vice President, Principal Financial Officer and Assistant Treasurer, The Invesco Funds; Principal Financial and Accounting Officer — Pooled Investments, Invesco Capital Management LLC; Vice President and Treasurer, Invesco Exchange-Traded Fund Trust, Invesco Exchange-Traded Fund Trust II, Invesco India Exchange-Traded Fund Trust, Invesco Actively Managed Exchange-Traded Fund Trust, Invesco Actively Managed Exchange-Traded Commodity Fund Trust and Invesco Exchange-Traded Self-Indexed Fund Trust Formerly: Assistant Treasurer, Invesco Exchange-Traded Fund Trust, Invesco Exchange-Traded Fund Trust II, Invesco India Exchange-Traded Fund Trust, Invesco Actively Managed Exchange-Traded Fund Trust, Invesco Actively Managed Exchange-Traded Commodity Fund Trust and Invesco Exchange-Traded Self-Indexed Fund Trust; Assistant Treasurer, Invesco Capital Management LLC; Assistant Vice President, The Invesco Funds | | N/A | | N/A |
Crissie M. Wisdom — 1969 Anti-Money Laundering Compliance Officer | | 2013 | | Anti-Money Laundering Compliance Officer, Invesco Advisers, Inc. (formerly known as Invesco Institutional (N.A.), Inc.) (registered investment adviser), Invesco Capital Markets, Inc. (formerly known as Van Kampen Funds Inc.), Invesco Distributors, Inc., Invesco Investment Services, Inc., The Invesco Funds, and Invesco Exchange-Traded Fund Trust, Invesco Exchange-Traded Fund Trust II, Invesco India Exchange-Traded Fund Trust, Invesco Actively Managed Exchange-Traded Fund Trust, Invesco Actively Managed Exchange-Traded Commodity Fund Trust and Invesco Exchange-Traded Self-Indexed Fund Trust; Anti-Money Laundering Compliance Officer and Bank Secrecy Act Officer, INVESCO National Trust Company and Invesco Trust Company; and Fraud Prevention Manager and Controls and Risk Analysis Manager for Invesco Investment Services, Inc. Formerly: Anti-Money Laundering Compliance Officer, Van Kampen Exchange Corp. and Invesco Management Group, Inc. | | N/A | | N/A |
Robert R. Leveille — 1969 Chief Compliance Officer | | 2016 | | Chief Compliance Officer, Invesco Advisers, Inc. (registered investment adviser); and Chief Compliance Officer, The Invesco Funds Formerly: Chief Compliance Officer, Putnam Investments and the Putnam Funds | | N/A | | N/A |
The Statement of Additional Information of the Trust includes additional information about the Fund’s Trustees and is available upon request, without charge, by calling 1.800.959.4246. Please refer to the Fund’s Statement of Additional Information for information on the Fund’ssub-advisers.
| | | | | | |
Office of the Fund 11 Greenway Plaza, Suite 1000 Houston, TX 77046-1173 | | Investment Adviser Invesco Advisers, Inc. 1555 Peachtree Street, N.E. Atlanta, GA 30309 | | Distributor Invesco Distributors, Inc. 11 Greenway Plaza, Suite 1000 Houston, TX 77046-1173 | | Auditors PricewaterhouseCoopers LLP 1000 Louisiana Street, Suite 5800 Houston, TX 77002-5021 |
| | | |
| | | | | | |
Counsel to the Fund Stradley Ronon Stevens & Young, LLP 2005 Market Street, Suite 2600 Philadelphia, PA 19103-7018 | | Counsel to the Independent Trustees Goodwin Procter LLP 901 New York Avenue, N.W. Washington, D.C. 20001 | | Transfer Agent Invesco Investment Services, Inc. 11 Greenway Plaza, Suite 1000 Houston, TX 77046-1173 | | Custodian State Street Bank and Trust Company 225 Franklin Street Boston, MA 02110-2801 |
T-5 Invesco Comstock Fund
Go paperless with eDelivery
Visit invesco.com/edelivery to enjoy the convenience and security of anytime electronic access to your investment documents.
With eDelivery, you can elect to have any or all of the following materials delivered straight to your inbox to download, save and print from your own computer:
| • | Fund reports and prospectuses |
| • | Quarterly statements |
| • | Daily confirmations |
| • | Tax forms |
Invesco mailing information
Send general correspondence to Invesco Investment Services, Inc., P.O. Box 219078, Kansas City, MO 64121-9078.
Important notice regarding delivery of security holder documents
To reduce Fund expenses, only one copy of most shareholder documents may be mailed to shareholders with multiple accounts at the same address (Householding). Mailing of your shareholder documents may be householded indefinitely unless you instruct us otherwise. If you do not want the mailing of these documents to be combined with those for other members of your household, please contact Invesco Investment Services, Inc. at 800 959 4246 or contact your financial institution. We will begin sending you individual copies for each account within 30 days after receiving your request.
Fund holdings and proxy voting information
The Fund provides a complete list of its holdings four times in each fiscal year, at the quarter-ends. For the second and fourth quarters, the list appears in the Fund’s semiannual and annual reports to shareholders. For the first and third quarters, the Fund files the lists with the Securities and Exchange Commission (SEC) on Form N-Q (or any successor Form). The most recent list of portfolio holdings is available at invesco.com/completeqtrholdings. Shareholders can also look up the Fund’s Form N-Q (or any successor Form) filings on the SEC website, sec.gov. The SEC file numbers for the Fund are shown below.
A description of the policies and procedures that the Fund uses to determine how to vote proxies relating to portfolio securities is available without charge, upon request, from our Client Services department at 800 959 4246, or at invesco.com/proxyguidelines. The information is also available on the SEC website, sec.gov.
Information regarding how the Fund voted proxies related to its portfolio securities during the most recent 12-month period ended June 30 is available at invesco.com/proxysearch. This information is also available on the SEC website, sec.gov.
Invesco Advisers, Inc. is an investment adviser; it provides investment advisory services to individual and institutional clients and does not sell securities. Invesco Distributors, Inc. is the US distributor for Invesco Ltd.’s retail mutual funds, exchange-traded funds and institutional money market funds. Both are wholly owned, indirect subsidiaries of Invesco Ltd.
| SEC file numbers: 811-03826 and 002-85905 | Invesco Distributors, Inc. | VK-COM-AR-1 |
| Annual Report to Shareholders | April 30, 2019 |
Invesco Dividend Income Fund
Nasdaq:
A: IAUTX ■ C: IUTCX ■ Y: IAUYX ■ Investor: FSTUX ■ R5: FSIUX ■ R6: IFUTX

Beginning on January 1, 2021, as permitted by regulations adopted by the Securities and Exchange Commission, paper copies of the Fund’s shareholder reports will no longer be sent by mail, unless you specifically request paper copies of the reports from the Fund or from your financial intermediary, such as a broker-dealer or bank. Instead, the reports will be made available on the Fund’s website, and you will be notified by mail each time a report is posted and provided with a website link to access the report.
If you already elected to receive shareholder reports electronically, you will not be affected by this change and you need not take any action. You may elect to receive shareholder reports and other communications from the Fund electronically by contacting your financial intermediary (such as a broker-dealer or bank) or, if you are a direct investor, by enrolling at invesco.com/edelivery.
You may elect to receive all future reports in paper free of charge. If you invest through a financial intermediary, you can contact your financial intermediary to request that you continue to receive paper copies of your shareholder reports. If you invest directly with the Fund, you can call (800) 959-4246 to let the Fund know you wish to continue receiving paper copies of your shareholder reports. Your election to receive reports in paper will apply to all funds held with your financial intermediary or all funds held with the fund complex if you invest directly with the Fund.
Dear Shareholders:
This annual report includes information about your Fund, including performance data and a complete list of its investments as of the close of the reporting period. Inside is a discussion of how your Fund was managed and the factors that affected its performance during the reporting period.
Philip Taylor, whose messages to shareholders have appeared here for the last 13 years, transitioned to a senior advisory role on March 1, prior to his retirement at the end of the year, and I assumed his role as Head of the Americas and Senior Managing Director, Invesco Ltd. All of us at Invesco are indebted to Phil for his many years of dedicated service to the company and to its funds’ shareholders. I’m excited about this new opportunity, and I look forward to communicating with fund shareholders going forward.
Investor sentiment during the reporting period ranged from elation to fear, notably in the fourth quarter of 2018. Amid corporate tax cuts and improving global growth, several US equity indexes redefined highs during the first half of the reporting period. The exuberance, however, ended in October as global equities, in particular US stocks, sold off, with the sharpest decline in December of 2018. The catalyst for the sell-off was a combination of ongoing trade concerns between the US and China, fears of a global economic slowdown and lower oil prices from a supply glut. Gains posted earlier in the year for global equities were erased, while US Treasury bonds, along with government and municipal bonds, rallied as investors fled to “safe haven” assets. The reporting period ended on a positive note, however, as global equities bounced back strongly at the outset of 2019, with the US stock market reaching new highs by the period end. Given the strong economy during the reporting period, the US Federal Reserve (the Fed) raised the federal funds rate three times. At its December 2018 meeting, however, the Fed delivered a more “dovish stance” by simultaneously raising rates while reducing guidance for 2019 rate increases. As the fiscal year ended, the Fed had thus far left rates unchanged in 2019. As 2019 unfolds, we’ll see how the interplay of interest rates, economic data, geopolitics and a host of other factors affect US and overseas equity and fixed income markets.
Investor uncertainty and market volatility, such as we witnessed during the reporting period, are unfortunate facts of life when it comes to investing. That’s why Invesco encourages investors to work with a professional financial adviser who can stress the importance of starting to save and invest early and the importance of adhering to a disciplined investment plan. A financial adviser who knows your unique financial situation, investment goals and risk tolerance can be an invaluable partner as you seek to achieve your financial goals. He or she can offer a long-term perspective when markets are volatile and time-tested advice and guidance when your financial situation or investment goals change.
Visit our website for more information on your investments
Our website, invesco.com/us, offers a wide range of market insights and investment perspectives. On the website, you’ll find detailed information about our funds, including performance, holdings and portfolio manager commentaries. You can access information about your account by completing a simple, secure online registration. To do so, select “Log In” on the right side of the homepage, and then select “Register for Individual Account Access.”
In addition to the resources accessible on our website and through our mobile app, you can obtain timely updates to help you stay informed about the markets and the economy by connecting with Invesco on Twitter, LinkedIn or Facebook. You can access our blog at blog.invesco.us.com. Our goal is to provide you the information you want, when and where you want it.
Finally, I’m pleased to share with you Invesco’s commitment to both the Principles for Responsible Investment and to considering environmental, social and governance issues in our robust investment process. I invite you to learn more at invesco.com/esg.
Have questions?
For questions about your account, contact an Invesco client services representative at 800 959 4246.
All of us at Invesco look forward to serving your investment management needs. Thank you for investing with us.
Sincerely,
Andrew Schlossberg
Head of the Americas,
Senior Managing Director, Invesco Ltd.
| 2 | Invesco Dividend Income Fund |
Dear Shareholders:
Among the many important lessons I’ve learned in more than 40 years in a variety of business endeavors is the value of a trusted advocate.
As independent chair of the Invesco Funds Board, I can assure you that the members of the Board are strong advocates for the interests of investors in Invesco’s mutual funds. We work hard to represent your interests through oversight of the quality of the investment management services your funds receive and other matters important to your investment, including but not limited to:
| ■ | Ensuring that Invesco offers a diverse lineup of mutual funds that your financial adviser can use to strive to meet your financial needs as your investment goals change over time. |
| ■ | Monitoring how the portfolio management teams of the Invesco funds are performing in light of changing economic and market conditions. |
| ■ | Assessing each portfolio management team’s investment performance within the context of the investment strategy described in the fund’s prospectus. |
| ■ | Monitoring for potential conflicts of interests that may impact the nature of the services that your funds receive. |
We believe one of the most important services we provide our fund shareholders is the annual review of the funds’ advisory and sub-advisory contracts with Invesco Advisers and its affiliates. This review is required by the Investment Company Act of 1940 and focuses on the nature and quality of the services Invesco provides as the adviser to the Invesco funds and the reasonableness of the fees that it charges for those services. Each year, we spend months carefully reviewing information received from Invesco and a variety of independent sources, such as performance and fee data prepared by Lipper, Inc. (a subsidiary of Broadridge Financial Solutions, Inc.), an independent, third-party firm widely recognized as a leader in its field. We also meet with our independent legal counsel and other independent advisers to review and help us assess the information that we have received. Our goal is to assure that you receive quality investment management services for a reasonable fee.
I trust the measures outlined above provide assurance that you have a worthy advocate when it comes to choosing the Invesco Funds.
As always, please contact me at bruce@brucecrockett.com with any questions or concerns you may have. On behalf of the Board, we look forward to continuing to represent your interests and serving your needs.
Sincerely,
Bruce L. Crockett
Independent Chair
Invesco Funds Board of Trustees
| 3 | Invesco Dividend Income Fund |
Management’s Discussion of Fund Performance
Performance summary
For the fiscal year ended April 30, 2019, Class A shares of Invesco Dividend Income Fund (the Fund), at net asset value (NAV), outperformed the Dow Jones U.S. Select Dividend Index.
Your Fund’s long-term performance appears later in this report.
Fund vs. Indexes
Total returns, April 30, 2018 to April 30, 2019, at net asset value (NAV). Performance shown does not include applicable contingent deferred sales charges (CDSC) or front-end sales charges, which would have reduced performance.
| Class A Shares | 9.51% |
| Class C Shares | 8.65 |
| Class Y Shares | 9.76 |
| Investor Class Shares | 9.49 |
| Class R5 Shares | 9.82 |
| Class R6 Shares | 9.96 |
| S&P 500 Index▼ (Broad Market Index) | 13.49 |
| Dow Jones U.S. Select Dividend Index▼ (Style-Specific Index) | 9.04 |
Russell 1000 Value Index■
(Style-Specific Index) | 9.06 |
Lipper Equity Income Funds Index♦
(Peer Group Index) | 9.96 |
| Source(s):▼FactSet Research Systems Inc.;■ RIMES Technologies Corp.;♦ Lipper Inc. |
During the fiscal year, our management discipline remained unchanged. The Fund continued to prioritize current income and long-term growth of capital by investing in above-market-yielding stocks that may help investors earn income, preserve assets and build capital. We believe that dividend-paying stocks may provide a conservative foundation for investors’ portfolios, and we seek to enhance the value of dividend investing by identifying above-market-yielding stocks with consistent and defensible dividends. Through fundamental research, we measure the strength and sustainability of a company’s dividend by analyzing its free cash flow potential over the next two to three years. We construct a portfolio that we believe provides above-average dividend income and the potential to build capital over the long term. We seek to manage portfolio risk utilizing careful stock selection, maintaining exposure to multiple sectors and employing a rigorous buy-and-sell discipline.
Most major US equity indexes, as well as international equities, generally posted gains for the fiscal year. Within the S&P 500 Index, information technology (IT) and real estate were the best-performing sectors for the fiscal year, while energy was the worst-performing sector and the only one to post a loss. It is important to view the market’s performance within the context of a full market cycle. This cycle, which began in March 2009, is one of the longest expansions on record with one of the largest bull markets, despite a historically low recovery in revenue versus previous cycle troughs.1 We remain focused on our assessment of each investment’s risk-reward profile.
Market conditions and your Fund
The fiscal year proved to be an increasingly volatile time for US equities. Throughout the summer, US equities moved higher as corporate profits surged amid the benefit of corporate tax cuts and improving global economic growth. Several US equity indexes reached new highs despite potential headwinds, including trade tensions, tariff announcements and contagion concerns over a Turkish currency crisis. After a relatively quiet summer, market volatility noticeably rose in October 2018, as US equity markets suffered a sharp sell-off through year-end 2018, amid ongoing trade concerns between the US and China, fears of a global economic slowdown and lower oil prices.
Given signs of a strong economy, the US Federal Reserve (the Fed) raised in-
terest rates three times during the fiscal year: in June, September and December 2018. In contrast, the European Central Bank and central banks in several other countries maintained extraordinarily accommodative monetary policies.
Equity markets rebounded in 2019, fueled by optimism about a potential US-China trade deal and the Fed’s indication that there would be no interest rate hikes in 2019, a surprising shift in monetary policy. The Fed’s more accommodative stance provided a supportive environment for equities and fixed income, even as US economic data were mixed and overseas growth appeared to be slowing. By the end of the fiscal year, the US equity market generally recovered the losses from fourth quarter 2018, backed by improving investor sentiment, low unemployment and a growing economy.
| Portfolio Composition |
| By sector | % of total net assets |
| Consumer Staples | 23.09% |
| Utilities | 21.45 |
| Financials | 11.24 |
| Health Care | 7.56 |
| Communication Services | 7.37 |
| Industrials | 6.60 |
| Energy | 5.92 |
| Consumer Discretionary | 5.77 |
| Materials | 3.66 |
| Other Sectors, Each Less than 2% of Net Assets | 2.10 |
| Money Market Funds Plus Other Assets Less Liabilities | 5.24 |
| Top 10 Equity Holdings* |
| | % of total net assets |
| 1. | Dominion Energy, Inc. | 3.66% |
| 2. | M&T Bank Corp. | 3.36 |
| 3. | General Mills, Inc. | 3.24 |
| 4. | McDonald’s Corp. | 2.86 |
| 5. | Procter & Gamble Co. (The) | 2.82 |
| 6. | National Fuel Gas Co. | 2.79 |
| 7. | Coca-Cola Co. (The) | 2.79 |
| 8. | Verizon Communications, Inc. | 2.71 |
| 9. | Kimberly-Clark Corp. | 2.43 |
| 10. | Nestle S.A. | 2.36 |
| Total Net Assets | $1.5 billion |
| Total Number of Holdings* | 59 |
| The Fund’s holdings are subject to change, and there is no assurance that the Fund will continue to hold any particular security. |
| *Excluding money market fund holdings. |
| Data presented here are as of April 30, 2019. |
| 4 | Invesco Dividend Income Fund |
Household and personal products companyProcter and Gamble was the largest contributor to the Fund’s performance during the fiscal year. Management efforts to streamline the company’s portfolio over the past several years have been bearing fruit, and the company has been driving greater accountability at the business unit level. As a result of higher input costs, the company raised prices in North America on brands that account for approximately 25% of sales, and organic growth accelerated over the fiscal year. Pharmaceutical companyEli Lily was also a top contributor to overall Fund performance during the fiscal year. The company’s new diabetes products showed continued strength, increasing its market share in this highly competitive class. Positive clinical trial results in both diabetes and immunology also enhanced the sustainability of revenues and bolstered its drug pipeline.Merck, another pharmaceutical company, was also a top contributor to the Fund’s performance as its immuno-oncology drug, Keytruda, continued to demonstrate clinical success across multiple cancer trials. These trials not only further entrench Keytruda’s position in current therapies, but also broaden its reach via new indications.
Pharmaceutical and chemical conglomerateBayer was the largest detractor from the Fund’s performance. During the fiscal year, Bayer completed the acquisition of agricultural chemicals company Monsanto. Shares of Bayer declined following trial rulings against Monsanto’s glyphosate, an herbicide product marketed as Roundup. The risk of future litigation and its impact on Bayer’s balance sheet deleveraging plans also weighed on shares. Packaged foods company Kraft Heinz was also a large detractor from the Fund’s overall performance. The company faced increasing costs that have lowered profitability even as organic growth has accelerated. Shares of Kraft Heinz were also impacted by management actions that included a decrease in the dividend and an impairment of company assets. Another detractor from the Fund’s performance during the fiscal year was timber and forest products companyWeyerhaeuser. Shares of the company declined on concerns that high inventory levels would weaken lumber pricing and inflationary pressures would continue in the timberlands business. Over the past four years, the company implemented efficiency programs that resulted in cost reductions of more than 8%. Management continues to target
further profitability improvements. We continued to own Weyerhaeuser at the end of the fiscal year.
Within the Dow Jones U.S. Select Dividend Index, the health care and utilities sectors were the best-performing sectors during the fiscal year, while the communication services, materials and energy sectors posted losses. The Fund’s overweight position and stock selection in the consumer staples sector made a large contribution to the Fund’s performance versus the Dow Jones U.S. Select Dividend Index during the fiscal year. The Fund’s stock selection and underweight position in the materials sector and stock selection in the communication services sector also contributed to the Fund’s relative results. An underweight position in the utilities sector detracted the most from the Fund’s performance relative to the Dow Jones U.S. Select Dividend Index during the fiscal year. A small overweight position in real estate, where the Dow Jones U.S. Select Dividend Index is void, also hurt relative Fund performance.
The Fund used currency forward contracts for the purpose of hedging currency exposure of some of the non-US-based companies held in the portfolio and not for speculative purposes or leverage. The use of currency forward contracts had a very small positive impact on the Fund’s performance during the fiscal year.
At the close of the fiscal year, the Fund remained focused on companies that we believed were reasonably valued, had sustainable cash flows and offered defensible dividends over the next two to three years. We believe the dividend income strategy is a valuable part of a portfolio, potentially helping investors earn income, preserve assets and build capital over the long-term.
It has been our privilege to manage Invesco Dividend Income Fund, and we thank you for your investment.
1 Source(s): National Bureau of Economic Research, Ned Davis Research and FactSet Research Systems Inc.
The views and opinions expressed in management’s discussion of Fund performance are those of Invesco Advisers, Inc. These views and opinions are subject to change at any time based on factors such as market and economic conditions. These views and opinions may not be relied upon as investment advice or recommendations, or as an offer for a particular security. The information is not a complete analysis of every aspect of any market, country, industry, security or the Fund. Statements of fact are from sources considered reliable, but Invesco Advisers, Inc. makes no representation or warranty as to their
completeness or accuracy. Although historical performance is no guarantee of future results, these insights may help you understand our investment management philosophy.
See important Fund and, if applicable, index disclosures later in this report.
Meggan Walsh
Chartered Financial Analyst, Portfolio Manager and Head of Invesco’s Dividend Value Team, is lead manager of Invesco Dividend Income Fund. She joined Invesco in 1991. Ms. Walsh earned a BS in finance from the University of Maryland and an MBA from Loyola University Maryland.
Robert Botard
Chartered Financial Analyst, Portfolio Manager, is manager of Invesco Dividend Income Fund. He joined Invesco in 1993. Mr. Botard earned a BBA in finance and a BBA in international business from The University of Texas at Austin. He also earned a Master of International Management degree from the Thunderbird School of Global Management.
Kristina Bradshaw
Chartered Financial Analyst, Portfolio Manager, is manager of Invesco Dividend Income Fund. She joined Invesco in 2006. Ms. Bradshaw earned BBA with honors from The University of Texas at Austin and an MBA from Stanford University’s Graduate School of Business.
Chris McMeans
Chartered Financial Analyst, Portfolio Manager is manager of Invesco Dividend Income Fund. He joined Invesco in 2008. Mr. McMeans earned a BA in economics from The University of Texas at Austin and an MBA with honors from the University of Houston.
| 5 | Invesco Dividend Income Fund |
Your Fund’s Long-Term Performance
Results of a $10,000 Investment — Oldest Share Class(es)
Fund and index data from 4/30/09
| 1 | Source: FactSet Research Systems Inc. |
| 2 | Source: RIMES Technologies Corp. |
| 3 | Source: Lipper Inc. |
| 4 | It is Invesco’s policy to chart the Fund’s oldest share class(es). Because Investor Class shares do not have a sales charge, we also show the oldest share class with a sales charge, Class C shares. |
Past performance cannot guarantee comparable future results.
The data shown in the chart include reinvested distributions, applicable sales charges and Fund expenses including
management fees. Index results include reinvested dividends, but they do not reflect sales charges. Performance of the peer group, if applicable, reflects fund expenses and management fees; perfor-
mance of a market index does not. Performance shown in the chart and table(s) does not reflect deduction of taxes a shareholder would pay on Fund distributions or sale of Fund shares.
| 6 | Invesco Dividend Income Fund |
| Average Annual Total Returns |
| As of 4/30/19, including maximum applicable sales charges |
| Class A Shares | |
| Inception (3/28/02) | 8.04% |
| 10 Years | 10.97 |
| 5 Years | 6.61 |
| 1 Year | 3.47 |
| Class C Shares | |
| Inception (2/14/00) | 4.01% |
| 10 Years | 10.77 |
| 5 Years | 7.03 |
| 1 Year | 7.66 |
| Class Y Shares | |
| Inception (10/3/08) | 9.41% |
| 10 Years | 11.88 |
| 5 Years | 8.10 |
| 1 Year | 9.76 |
| Investor Class Shares | |
| Inception (6/2/86) | 8.47% |
| 10 Years | 11.60 |
| 5 Years | 7.83 |
| 1 Year | 9.49 |
| Class R5 Shares | |
| Inception (10/25/05) | 8.45% |
| 10 Years | 12.01 |
| 5 Years | 8.16 |
| 1 Year | 9.82 |
| Class R6 Shares | |
| 10 Years | 11.86% |
| 5 Years | 8.24 |
| 1 Year | 9.96 |
Class R6 shares incepted on September 24, 2012. Performance shown prior to that date is that of Class A shares and includes the 12b-1 fees applicable to Class A shares.
The performance data quoted represent past performance and cannot guarantee comparable future results; current performance may be lower or higher. Please visit invesco.com/performance for the most recent month-end performance. Performance figures reflect reinvested distributions, changes in net asset value and the effect of the maximum sales charge unless otherwise stated. Investment return and principal value will fluctuate so that you may have a gain or loss when you sell shares.
The net annual Fund operating expense ratio set forth in the most recent Fund prospectus as of the date of this report for Class A, Class C, Class Y, Investor Class, Class R5 and Class R6 shares was 1.02%, 1.77%, 0.77%, 1.02%, 0.73% and 0.65%, respectively.1 The total annual Fund operating expense ratio set forth in the
| Average Annual Total Returns |
| As of 3/31/19, the most recent calendar quarter end, including maximum applicable sales charges |
| Class A Shares | |
| Inception (3/28/02) | 7.98% |
| 10 Years | 11.09 |
| 5 Years | 6.90 |
| 1 Year | 2.15 |
| Class C Shares | |
| Inception (2/14/00) | 3.94% |
| 10 Years | 10.89 |
| 5 Years | 7.31 |
| 1 Year | 6.31 |
| Class Y Shares | |
| Inception (10/3/08) | 9.31% |
| 10 Years | 12.00 |
| 5 Years | 8.38 |
| 1 Year | 8.37 |
| Investor Class Shares | |
| Inception (6/2/86) | 8.44% |
| 10 Years | 11.72 |
| 5 Years | 8.11 |
| 1 Year | 8.06 |
| Class R5 Shares | |
| Inception (10/25/05) | 8.37% |
| 10 Years | 12.13 |
| 5 Years | 8.42 |
| 1 Year | 8.38 |
| Class R6 Shares | |
| 10 Years | 11.98% |
| 5 Years | 8.51 |
| 1 Year | 8.51 |
most recent Fund prospectus as of the date of this report for Class A, Class C, Class Y, Investor Class, Class R5 and Class R6 shares was 1.03%, 1.78%, 0.78%, 1.03%, 0.74% and 0.66%, respectively. The expense ratios presented above may vary from the expense ratios presented in other sections of this report that are based on expenses incurred during the period covered by this report.
Class A share performance reflects the maximum 5.50% sales charge, and Class C share performance reflects the applicable contingent deferred sales charge (CDSC) for the period involved. The CDSC on Class C shares is 1% for the first year after purchase. Class Y, Investor Class, Class R5 and Class R6 shares do not have a front-end sales charge or a CDSC; therefore, performance is at net asset value.
The performance of the Fund’s share classes will differ primarily due to different sales charge structures and class expenses.
Fund performance reflects any applicable fee waivers and/or expense reim-
bursements. Had the adviser not waived fees and/or reimbursed expenses currently or in the past, returns would have been lower. See current prospectus for more information.
| 1 | Total annual Fund operating expenses after any contractual fee waivers and/or expense reimbursements by the adviser in effect through at least June 30, 2021. See current prospectus for more information. |
| 7 | Invesco Dividend Income Fund |
Invesco Dividend Income Fund’s investment objective is current income and long-term growth of capital.
| ■ | Unless otherwise stated, information presented in this report is as of April 30, 2019, and is based on total net assets. |
| ■ | Unless otherwise noted, all data provided by Invesco. |
| ■ | To access your Fund’s reports/prospectus, visit invesco.com/fundreports. |
About share classes
| ■ | Class Y sharesand Investor Class shares are available only to certain investors. Please see the prospectus for more information. |
| ■ | Class R5 shares andClass R6 shares are available for use by retirement plans that meet certain standards and for institutional investors. Class R6 shares are also available through intermediaries that have established an agreement with Invesco Distributors, Inc. to make such shares available for use in retail omnibus accounts. Please see the prospectus for more information. |
Principal risks of investing in the Fund
| ■ | Foreign securities risk. The Fund’s foreign investments may be adversely affected by political and social instability, changes in economic or taxation policies, difficulty in enforcing obligations, decreased liquidity or increased volatility. Foreign investments also involve the risk of the possible seizure, nationalization or expropriation of the issuer or foreign deposits (in which the Fund could lose its entire investments in a certain market) and the possible adoption of foreign governmental restrictions such as exchange controls. Unless the Fund has hedged its foreign securities risk, foreign securities risk also involves the risk of negative foreign currency rate fluctuations, which may cause the value of securities denominated in such foreign currency (or other instruments through which the Fund has exposure to foreign currencies) to decline in value. Currency exchange rates may fluctuate significantly over short periods of time. Currency hedging strategies, if used, are not always successful. |
| ■ | Management risk. The Fund is actively managed and depends heavily on the Adviser’s judgment about markets, interest rates or the attractiveness, relative values, liquidity, or potential |
| | appreciation of particular investments made for the Fund’s portfolio. The Fund could experience losses if these judgments prove to be incorrect. Additionally, legislative, regulatory, or tax developments may adversely affect management of the Fund and, therefore, the ability of the Fund to achieve its investment objective. |
| ■ | Market risk.The market values of the Fund’s investments, and therefore the value of the Fund’s shares, will go up and down, sometimes rapidly or unpredictably. Market risk may affect a single issuer, industry or section of the economy, or it may affect the market as a whole. Individual stock prices tend to go up and down more dramatically than those of certain other types of investments, such as bonds. During a general downturn in the financial markets, multiple asset classes may decline in value. When markets perform well, there can be no assurance that specific investments held by the Fund will rise in value. |
| ■ | Small- and mid-capitalization companies risks. Small- and mid-capitalization companies tend to be more vulnerable to changing market conditions, may have little or no operating history or track record of success, and may have more limited product lines and markets, less experienced management and fewer financial resources than larger companies. These companies’ securities may be more volatile and less liquid than those of more established companies, and their returns may vary, sometimes significantly, from the overall securities market. |
About indexes used in this report
| ■ | The S&P 500® Indexis an unmanaged index considered representative of the US stock market. |
| ■ | TheDow Jones U.S. Select DividendTM Index represents the country’s leading stocks by dividend yield. |
| ■ | TheRussell 1000® Value Index is an unmanaged index considered repre- |
| | sentative of large-cap value stocks. The Russell 1000 Value Index is a trademark/service mark of the Frank Russell Co. Russell® is a trademark of the Frank Russell Co. |
| ■ | TheLipper Equity Income Funds Index is an unmanaged Index considered representative of equity income funds tracked by Lipper. |
| ■ | The Fund is not managed to track the performance of any particular index, including the index(es) described here, and consequently, the performance of the Fund may deviate significantly from the performance of the index(es). |
| ■ | A direct investment cannot be made in an index. Unless otherwise indicated, index results include reinvested dividends, and they do not reflect sales charges. Performance of the peer group, if applicable, reflects fund expenses; performance of a market index does not. |
Other information
| ■ | The returns shown in management’s discussion of Fund performance are based on net asset values (NAVs) calculated for shareholder transactions. Generally accepted accounting principles require adjustments to be made to the net assets of the Fund at period end for financial reporting purposes, and as such, the NAVs for shareholder transactions and the returns based on those NAVs may differ from the NAVs and returns reported in the Financial Highlights. |
| ■ | Industry classifications used in this report are generally according to the Global Industry Classification Standard, which was developed by and is the exclusive property and a service mark of MSCI Inc. and Standard & Poor’s. |
This report must be accompanied or preceded by a currently effective Fund prospectus, which contains more complete information, including sales charges and expenses. Investors should read it carefully before investing.
NOT FDIC INSURED | MAY LOSE VALUE | NO BANK GUARANTEE
| 8 | Invesco Dividend Income Fund |
Schedule of Investments(a)
April 30, 2019
| | Shares | Value |
| Common Stocks & Other Equity Interests–94.77% |
| Aerospace & Defense–2.28% |
| General Dynamics Corp. | 72,170 | $12,898,223 |
| Lockheed Martin Corp. | 63,789 | 21,262,787 |
| | | | 34,161,010 |
| Air Freight & Logistics–1.10% |
| United Parcel Service, Inc. Class B | 155,068 | 16,471,323 |
| Asset Management & Custody Banks–3.11% |
| Federated Investors, Inc. Class B | 391,363 | 12,026,585 |
| Waddell & Reed Financial, Inc., Class A | 1,839,951 | 34,462,282 |
| | | | 46,488,867 |
| Brewers–1.62% |
| Molson Coors Brewing Co. Class B | 378,004 | 24,264,077 |
| Electric Utilities–7.75% |
| American Electric Power Co., Inc. | 235,996 | 20,189,458 |
| Duke Energy Corp. | 166,610 | 15,181,503 |
| Exelon Corp. | 514,197 | 26,198,337 |
| Pinnacle West Capital Corp. | 252,925 | 24,096,165 |
| Portland General Electric Co. | 580,188 | 30,349,634 |
| | | | 116,015,097 |
| Electrical Components & Equipment–1.88% |
| ABB Ltd. (Switzerland) | 833,669 | 17,156,915 |
| Emerson Electric Co. | 155,241 | 11,020,559 |
| | | | 28,177,474 |
| Fertilizers & Agricultural Chemicals–0.76% |
| Nutrien Ltd. (Canada) | 210,565 | 11,420,208 |
| Food Distributors–1.26% |
| Sysco Corp. | 267,816 | 18,846,212 |
| Gas Utilities–4.28% |
| National Fuel Gas Co. | 705,878 | 41,795,036 |
| Southwest Gas Holdings, Inc. | 267,036 | 22,214,725 |
| | | | 64,009,761 |
| General Merchandise Stores–1.18% |
| Target Corp. | 226,965 | 17,571,630 |
| Household Products–5.25% |
| Kimberly-Clark Corp. | 282,758 | 36,300,472 |
| Procter & Gamble Co. (The) | 397,043 | 42,277,139 |
| | | | 78,577,611 |
| Industrial Machinery–1.33% |
| Kennametal, Inc. | 489,747 | 19,932,703 |
| Integrated Oil & Gas–5.92% |
| Exxon Mobil Corp. | 363,629 | 29,192,136 |
| | Shares | Value |
| Integrated Oil & Gas–(continued) |
| Royal Dutch Shell PLC Class B (United Kingdom) | 276,250 | $8,856,519 |
| Suncor Energy, Inc. (Canada) | 648,673 | 21,391,635 |
| TOTAL S.A. (France) | 522,713 | 29,170,396 |
| | | | 88,610,686 |
| Integrated Telecommunication Services–7.37% |
| AT&T, Inc. | 1,023,936 | 31,701,060 |
| BT Group PLC (United Kingdom) | 6,434,989 | 19,220,106 |
| Deutsche Telekom AG (Germany) | 1,119,108 | 18,719,936 |
| Verizon Communications, Inc. | 710,130 | 40,612,335 |
| | | | 110,253,437 |
| Motorcycle Manufacturers–1.22% |
| Harley-Davidson, Inc. | 489,516 | 18,224,681 |
| Multi-Utilities–9.42% |
| CMS Energy Corp. | 367,874 | 20,435,401 |
| Dominion Energy, Inc. | 702,791 | 54,726,335 |
| National Grid PLC (United Kingdom) | 2,503,220 | 27,344,699 |
| Public Service Enterprise Group, Inc. | 201,717 | 12,032,419 |
| Sempra Energy | 206,323 | 26,399,028 |
| | | | 140,937,882 |
| Packaged Foods & Meats–8.98% |
| Campbell Soup Co. | 612,726 | 23,706,369 |
| Danone S.A. (France) | 195,055 | 15,769,215 |
| General Mills, Inc. | 941,995 | 48,484,483 |
| Kraft Heinz Co. (The) | 335,438 | 11,149,959 |
| Nestle S.A. (Switzerland) | 366,061 | 35,263,307 |
| | | | 134,373,333 |
| Paper Packaging–2.89% |
| International Paper Co. | 387,053 | 18,117,951 |
| Sonoco Products Co. | 398,590 | 25,135,085 |
| | | | 43,253,036 |
| Pharmaceuticals–7.56% |
| Bayer AG (Germany) | 270,522 | 18,004,802 |
| Bristol-Myers Squibb Co. | 388,123 | 18,020,551 |
| Eli Lilly and Co. | 210,103 | 24,590,455 |
| Johnson & Johnson | 147,063 | 20,765,296 |
| Merck & Co., Inc. | 403,635 | 31,770,111 |
| | | | 113,151,215 |
| Property & Casualty Insurance–3.71% |
| Chubb Ltd. | 166,081 | 24,114,961 |
| Travelers Cos., Inc. (The) | 217,830 | 31,313,063 |
| | | | 55,428,024 |
| Regional Banks–4.43% |
| Cullen/Frost Bankers, Inc. | 158,042 | 16,071,291 |
See accompanying Notes to Financial Statements which are an integral part of the financial statements.
| 9 | Invesco Dividend Income Fund |
| | Shares | Value |
| Regional Banks–(continued) |
| M&T Bank Corp. | 295,193 | $50,203,473 |
| | | | 66,274,764 |
| Restaurants–3.38% |
| Darden Restaurants, Inc. | 66,278 | 7,794,293 |
| McDonald’s Corp. | 216,412 | 42,756,519 |
| | | | 50,550,812 |
| Semiconductors–0.70% |
| Microchip Technology, Inc. | 104,279 | 10,416,429 |
| Soft Drinks–2.79% |
| Coca-Cola Co. (The) | 851,073 | 41,753,641 |
| Specialized REITs–1.41% |
| Weyerhaeuser Co. | 786,717 | 21,084,016 |
| Tobacco–3.19% |
| Altria Group, Inc. | 205,801 | 11,181,168 |
| Imperial Brands PLC (United Kingdom) | 761,556 | 24,247,314 |
| | Shares | Value |
| Tobacco–(continued) |
| Philip Morris International, Inc. | 141,543 | $12,251,962 |
| | | | 47,680,444 |
| Total Common Stocks & Other Equity Interests (Cost $1,165,620,115) | 1,417,928,373 |
|
| Money Market Funds–5.83% |
| Invesco Government & Agency Portfolio, Institutional Class, 2.34%(b) | 30,534,078 | 30,534,078 |
| Invesco Liquid Assets Portfolio, Institutional Class, 2.48%(b) | 21,814,667 | 21,821,211 |
| Invesco Treasury Portfolio, Institutional Class, 2.32%(b) | 34,896,089 | 34,896,089 |
| Total Money Market Funds (Cost $87,248,123) | 87,251,378 |
| TOTAL INVESTMENTS IN SECURITIES–100.60% (Cost $1,252,868,238) | 1,505,179,751 |
| OTHER ASSETS LESS LIABILITIES–(0.60)% | (9,037,704) |
| NET ASSETS–100.00% | $1,496,142,047 |
Investment Abbreviations:
| REIT | – Real Estate Investment Trust |
Notes to Schedule of Investments:
| (a) | Industry and/or sector classifications used in this report are generally according to the Global Industry Classification Standard, which was developed by and is the exclusive property and a service mark of MSCI Inc. and Standard & Poor’s. |
| (b) | The money market fund and the Fund are affiliated by having the same investment adviser. The rate shown is the 7-day SEC standardized yield as of April 30, 2019. |
| Open Forward Foreign Currency Contracts |
Settlement
Date | Counterparty | Contract to | Unrealized
Appreciation |
| Deliver | Receive |
| Currency Risk | | | | | | |
| 05/24/2019 | Citibank, N.A. | EUR | 10,407,605 | USD | 11,700,240 | $5,810 |
| 05/24/2019 | JP Morgan Chase Bank, N.A. | EUR | 10,361,714 | USD | 11,649,551 | 6,686 |
| 05/24/2019 | State Street Bank and Trust Co. | EUR | 10,361,714 | USD | 11,650,348 | 7,484 |
| Total Forward Foreign Currency Contracts | $19,980 |
| Abbreviations: |
| EUR | – Euro |
| USD | – U.S. Dollar |
See accompanying Notes to Financial Statements which are an integral part of the financial statements.
| 10 | Invesco Dividend Income Fund |
Statement of Assets and Liabilities
April 30, 2019
| Assets: | |
Investments in securities, at value
(Cost $1,165,620,115) | $1,417,928,373 |
| Investments in affiliated money market funds, at value (Cost $87,248,123) | 87,251,378 |
| Other investments: | |
| Unrealized appreciation on forward foreign currency contracts outstanding | 19,980 |
| Foreign currencies, at value (Cost $978,301) | 976,965 |
| Receivable for: | |
| Investments sold | 2,440,517 |
| Fund shares sold | 654,444 |
| Dividends | 4,475,359 |
| Investment for trustee deferred compensation and retirement plans | 136,750 |
| Other assets | 44,567 |
| Total assets | 1,513,928,333 |
| Liabilities: | |
| Payable for: | |
| Investments purchased | 302,702 |
| Fund shares reacquired | 15,770,325 |
| Amount due custodian | 762,915 |
| Accrued fees to affiliates | 623,771 |
| Accrued trustees’ and officers’ fees and benefits | 7,732 |
| Accrued other operating expenses | 167,214 |
| Trustee deferred compensation and retirement plans | 151,627 |
| Total liabilities | 17,786,286 |
| Net assets applicable to shares outstanding | $1,496,142,047 |
| Net assets consist of: | |
| Shares of beneficial interest | $1,226,206,412 |
| Distributable earnings | 269,935,635 |
| | $1,496,142,047 |
| Net Assets: |
| Class A | $764,036,969 |
| Class C | $152,988,265 |
| Class Y | $248,641,482 |
| Investor Class | $76,436,174 |
| Class R5 | $1,863,290 |
| Class R6 | $252,175,867 |
| Shares outstanding, no par value, with an unlimited number of shares authorized: |
| Class A | 33,654,580 |
| Class C | 6,647,651 |
| Class Y | 10,837,784 |
| Investor Class | 3,333,090 |
| Class R5 | 82,048 |
| Class R6 | 11,095,727 |
| Class A: | |
| Net asset value per share | $22.70 |
Maximum offering price per share
(Net asset value of $22.70 ÷ 94.50%) | $24.02 |
| Class C: | |
| Net asset value and offering price per share | $23.01 |
| Class Y: | |
| Net asset value and offering price per share | $22.94 |
| Investor Class: | |
| Net asset value and offering price per share | $22.93 |
| Class R5: | |
| Net asset value and offering price per share | $22.71 |
| Class R6: | |
| Net asset value and offering price per share | $22.73 |
See accompanying Notes to Financial Statements which are an integral part of the financial statements.
| 11 | Invesco Dividend Income Fund |
Statement of Operations
For the year ended April 30, 2019
| Investment income: | |
| Dividends (net of foreign withholding taxes of $945,571) | $58,193,758 |
| Dividends from affiliated money market funds | 1,295,420 |
| Total investment income | 59,489,178 |
| Expenses: | |
| Advisory fees | 10,132,921 |
| Administrative services fees | 338,189 |
| Custodian fees | 83,187 |
| Distribution fees: | |
| Class A | 1,955,004 |
| Class C | 1,931,482 |
| Investor Class | 191,927 |
| Transfer agent fees — A, C, Y and Investor Class | 1,883,702 |
| Transfer agent fees — R5 | 2,133 |
| Transfer agent fees — R6 | 41,074 |
| Trustees’ and officers’ fees and benefits | 50,573 |
| Registration and filing fees | 142,903 |
| Reports to shareholders | 198,181 |
| Professional services fees | 85,050 |
| Other | 47,881 |
| Total expenses | 17,084,207 |
| Less: Fees waived and expense offset arrangement(s) | (78,689) |
| Net expenses | 17,005,518 |
| Net investment income | 42,483,660 |
| Realized and unrealized gain (loss) from: | |
| Net realized gain (loss) from: | |
| Investment securities | 75,264,592 |
| Foreign currencies | (199,455) |
| Forward foreign currency contracts | 6,565,920 |
| | 81,631,057 |
| Change in net unrealized appreciation (depreciation) of: | |
| Investment securities | 25,701,677 |
| Foreign currencies | (12,068) |
| Forward foreign currency contracts | (1,696,301) |
| | 23,993,308 |
| Net realized and unrealized gain | 105,624,365 |
| Net increase in net assets resulting from operations | $148,108,025 |
See accompanying Notes to Financial Statements which are an integral part of the financial statements.
| 12 | Invesco Dividend Income Fund |
Statement of Changes in Net Assets
For the years ended April 30, 2019 and 2018
| | 2019 | 2018 |
| Operations: | | |
| Net investment income | $42,483,660 | $50,192,464 |
| Net realized gain | 81,631,057 | 77,972,138 |
| Change in net unrealized appreciation (depreciation) | 23,993,308 | (109,928,798) |
| Net increase in net assets resulting from operations | 148,108,025 | 18,235,804 |
| Distributions to shareholders from distributable earnings(1): | | |
| Class A | (74,789,875) | (44,409,856) |
| Class B | — | (95,827) |
| Class C | (17,234,355) | (10,216,069) |
| Class Y | (29,436,119) | (29,021,377) |
| Investor Class | (7,473,172) | (3,798,356) |
| Class R5 | (221,095) | (104,464) |
| Class R6 | (27,738,032) | (15,308,141) |
| Total distributions to shareholders from distributable earnings | (156,892,648) | (102,954,090) |
| Share transactions–net: | | |
| Class A | (96,000,409) | (245,373,749) |
| Class B | — | (4,357,345) |
| Class C | (80,484,324) | (64,867,734) |
| Class Y | (194,241,151) | (395,325,950) |
| Investor Class | (2,168,933) | (14,984,629) |
| Class R5 | (17,802) | (372,337) |
| Class R6 | (69,423,267) | 254,846,222 |
| Net increase (decrease) in net assets resulting from share transactions | (442,335,886) | (470,435,522) |
| Net increase (decrease) in net assets | (451,120,509) | (555,153,808) |
| Net assets: | | |
| Beginning of year | 1,947,262,556 | 2,502,416,364 |
| End of year | $1,496,142,047 | $1,947,262,556 |
| (1) | For the year ended April 30, 2018, distributions to shareholders from distributable earnings consisted of distributions from net investment income and distributions from net realized gains. The Securities and Exchange Commission eliminated the requirement to disclose the distribution components separately, except for tax return of capital. For the year ended April 30, 2018, distributions from net investment income were $19,890,762, $28,588, $3,367,622, $14,173,207, $1,692,169, $51,057 and $6,632,381 and distributions from net realized gains were $24,519,094, $67,239, $6,848,447,$14,848,170, $2,106,187, $53,407 and $8,675,760 for Class A, Class B, Class C, Class Y, Investor Class, Class R5 and Class R6 shares, respectively. |
See accompanying Notes to Financial Statements which are an integral part of the financial statements.
| 13 | Invesco Dividend Income Fund |
Financial Highlights
April 30, 2019
The following schedule presents financial highlights for a share of the Fund outstanding throughout the periods indicated.
| | Net asset
value,
beginning
of period | Net
investment
income(a) | Net gains
(losses)
on securities
(both
realized and
unrealized) | Total from
investment
operations | Dividends
from net
investment
income | Distributions
from net
realized
gains | Total
distributions | Net asset
value, end
of period | Total
return(b) | Net assets,
end of period
(000’s omitted) | Ratio of
expenses
to average
net assets
with fee waivers
and/or expenses
absorbed | Ratio of
expenses
to average net
assets without
fee waivers
and/or expenses
absorbed | Ratio of net
investment
income
to average
net assets | Portfolio
turnover(c) |
| Class A |
| Year ended 04/30/19 | $22.98 | $0.58 | $1.45 | $2.03 | $(0.60) | $(1.71) | $(2.31) | $22.70 | 9.51% | $764,037 | 1.06%(d) | 1.06%(d) | 2.54%(d) | 4% |
| Year ended 04/30/18 | 23.96 | 0.51 | (0.42) | 0.09 | (0.47) | (0.60) | (1.07) | 22.98 | 0.21 | 862,915 | 1.01 | 1.02 | 2.12 | 11 |
| Year ended 04/30/17 | 22.32 | 0.41 | 1.80 | 2.21 | (0.41) | (0.16) | (0.57) | 23.96 | 10.00 | 1,143,946 | 1.03 | 1.05 | 1.74 | 6 |
| Year ended 04/30/16 | 21.03 | 0.40 | 1.77 | 2.17 | (0.41) | (0.47) | (0.88) | 22.32 | 10.72 | 867,596 | 1.13 | 1.17 | 1.91 | 9 |
| Year ended 04/30/15 | 19.88 | 0.41 | 1.37 | 1.78 | (0.42) | (0.21) | (0.63) | 21.03 | 9.07 | 413,896 | 1.12 | 1.22 | 1.99 | 4 |
| Class C |
| Year ended 04/30/19 | 23.28 | 0.42 | 1.46 | 1.88 | (0.44) | (1.71) | (2.15) | 23.01 | 8.65 | 152,988 | 1.81(d) | 1.81(d) | 1.79(d) | 4 |
| Year ended 04/30/18 | 24.26 | 0.33 | (0.42) | (0.09) | (0.29) | (0.60) | (0.89) | 23.28 | (0.52) | 236,168 | 1.76 | 1.77 | 1.37 | 11 |
| Year ended 04/30/17 | 22.60 | 0.24 | 1.82 | 2.06 | (0.24) | (0.16) | (0.40) | 24.26 | 9.16 | 311,194 | 1.78 | 1.80 | 0.99 | 6 |
| Year ended 04/30/16 | 21.28 | 0.25 | 1.80 | 2.05 | (0.26) | (0.47) | (0.73) | 22.60 | 9.94 | 154,584 | 1.88 | 1.92 | 1.16 | 9 |
| Year ended 04/30/15 | 20.11 | 0.26 | 1.39 | 1.65 | (0.27) | (0.21) | (0.48) | 21.28 | 8.29 | 61,818 | 1.87 | 1.97 | 1.24 | 4 |
| Class Y |
| Year ended 04/30/19 | 23.21 | 0.65 | 1.46 | 2.11 | (0.67) | (1.71) | (2.38) | 22.94 | 9.76 | 248,641 | 0.81(d) | 0.81(d) | 2.79(d) | 4 |
| Year ended 04/30/18 | 24.19 | 0.58 | (0.43) | 0.15 | (0.53) | (0.60) | (1.13) | 23.21 | 0.48 | 444,633 | 0.76 | 0.77 | 2.37 | 11 |
| Year ended 04/30/17 | 22.53 | 0.47 | 1.82 | 2.29 | (0.47) | (0.16) | (0.63) | 24.19 | 10.28 | 860,105 | 0.78 | 0.80 | 1.99 | 6 |
| Year ended 04/30/16 | 21.22 | 0.47 | 1.78 | 2.25 | (0.47) | (0.47) | (0.94) | 22.53 | 11.01 | 249,625 | 0.88 | 0.92 | 2.16 | 9 |
| Year ended 04/30/15 | 20.06 | 0.47 | 1.37 | 1.84 | (0.47) | (0.21) | (0.68) | 21.22 | 9.34 | 53,878 | 0.87 | 0.97 | 2.24 | 4 |
| Investor Class |
| Year ended 04/30/19 | 23.20 | 0.59 | 1.46 | 2.05 | (0.61) | (1.71) | (2.32) | 22.93 | 9.49 | 76,436 | 1.06 | 1.06 | 2.54 | 4 |
| Year ended 04/30/18 | 24.18 | 0.51 | (0.42) | 0.09 | (0.47) | (0.60) | (1.07) | 23.20 | 0.23 | 79,103 | 1.01 | 1.02 | 2.12 | 11 |
| Year ended 04/30/17 | 22.52 | 0.41 | 1.82 | 2.23 | (0.41) | (0.16) | (0.57) | 24.18 | 10.01 | 97,228 | 1.03 | 1.05 | 1.74 | 6 |
| Year ended 04/30/16 | 21.22 | 0.41 | 1.78 | 2.19 | (0.42) | (0.47) | (0.89) | 22.52 | 10.69 | 88,691 | 1.13 | 1.17 | 1.91 | 9 |
| Year ended 04/30/15 | 20.05 | 0.41 | 1.39 | 1.80 | (0.42) | (0.21) | (0.63) | 21.22 | 9.11 | 74,957 | 1.12 | 1.22 | 1.99 | 4 |
| Class R5 |
| Year ended 04/30/19 | 22.99 | 0.65 | 1.45 | 2.10 | (0.67) | (1.71) | (2.38) | 22.71 | 9.82 | 1,863 | 0.77(d) | 0.77(d) | 2.83(d) | 4 |
| Year ended 04/30/18 | 23.97 | 0.58 | (0.42) | 0.16 | (0.54) | (0.60) | (1.14) | 22.99 | 0.51 | 1,914 | 0.72 | 0.73 | 2.41 | 11 |
| Year ended 04/30/17 | 22.32 | 0.48 | 1.81 | 2.29 | (0.48) | (0.16) | (0.64) | 23.97 | 10.38 | 2,376 | 0.72 | 0.74 | 2.05 | 6 |
| Year ended 04/30/16 | 21.04 | 0.47 | 1.75 | 2.22 | (0.47) | (0.47) | (0.94) | 22.32 | 10.98 | 551 | 0.84 | 0.85 | 2.20 | 9 |
| Year ended 04/30/15 | 19.88 | 0.46 | 1.39 | 1.85 | (0.48) | (0.21) | (0.69) | 21.04 | 9.44 | 21 | 0.82 | 0.83 | 2.29 | 4 |
| Class R6 |
| Year ended 04/30/19 | 23.00 | 0.67 | 1.46 | 2.13 | (0.69) | (1.71) | (2.40) | 22.73 | 9.96 | 252,176 | 0.69(d) | 0.69(d) | 2.91(d) | 4 |
| Year ended 04/30/18 | 23.98 | 0.60 | (0.42) | 0.18 | (0.56) | (0.60) | (1.16) | 23.00 | 0.59 | 322,530 | 0.64 | 0.65 | 2.49 | 11 |
| Year ended 04/30/17 | 22.34 | 0.50 | 1.80 | 2.30 | (0.50) | (0.16) | (0.66) | 23.98 | 10.42 | 83,352 | 0.64 | 0.66 | 2.13 | 6 |
| Year ended 04/30/16 | 21.05 | 0.49 | 1.77 | 2.26 | (0.50) | (0.47) | (0.97) | 22.34 | 11.13 | 63,000 | 0.74 | 0.75 | 2.30 | 9 |
| Year ended 04/30/15 | 19.89 | 0.48 | 1.38 | 1.86 | (0.49) | (0.21) | (0.70) | 21.05 | 9.49 | 51,080 | 0.78 | 0.79 | 2.33 | 4 |
| (a) | Calculated using average shares outstanding. |
| (b) | Includes adjustments in accordance with accounting principles generally accepted in the United States of America and as such, the net asset value for financial reporting purposes and the returns based upon those net asset values may differ from the net asset value and returns for shareholder transactions. Does not include sales charges and is not annualized for periods less than one year, if applicable. |
| (c) | Portfolio turnover is calculated at the fund level and is not annualized for periods less than one year, if applicable. |
| (d) | Ratios are based on average daily net assets (000’s omitted) of $782,002, $193,148, $316,423, $76,771 , $2,144 and $280,952 for Class A, Class C, Class Y, Investor Class, Class R5 and Class R6 shares, respectively. |
See accompanying Notes to Financial Statements which are an integral part of the financial statements.
| 14 | Invesco Dividend Income Fund |
Notes to Financial Statements
April 30, 2019
NOTE 1—Significant Accounting Policies
Invesco Dividend Income Fund (the “Fund”) is a series portfolio of AIM Sector Funds (Invesco Sector Funds) (the “Trust”). The Trust is a Delaware statutory trust registered under the Investment Company Act of 1940, as amended (the “1940 Act”), as an open-end series management investment company authorized to issue an unlimited number of shares of beneficial interest. Information presented in these financial statements pertains only to the Fund. Matters affecting the Fund or each class will be voted on exclusively by the shareholders of the Fund or each class.
The Fund’s investment objective is current income and long-term growth of capital.
The Fund currently consists of six different classes of shares: Class A, Class C, Class Y, Investor Class, Class R5 and Class R6. Class Y and Investor Class shares are available only to certain investors. Class A shares are sold with a front-end sales charge unless certain waiver criteria are met and under certain circumstances load waived shares may be subject to contingent deferred sales charges ("CDSC"). Class C shares are sold with a CDSC. Class Y, Investor Class, Class R5 and Class R6 shares are sold at net asset value. Class C shares held for ten years after purchase are eligible for automatic conversion into Class A shares of the same Fund (the "Conversion Feature"). The automatic conversion pursuant to the Conversion Feature will generally occur at the end of the month following the tenth anniversary after a purchase of Class C shares.
The Fund is an investment company and accordingly follows the investment company accounting and reporting guidance in accordance with Financial Accounting Standards Board Accounting Standards Codification Topic 946,Financial Services – Investment Companies.
The following is a summary of the significant accounting policies followed by the Fund in the preparation of its financial statements.
| A. | Security Valuations — Securities, including restricted securities, are valued according to the following policy. |
A security listed or traded on an exchange (except convertible securities) is valued at its last sales price or official closing price as of the close of the customary trading session on the exchange where the security is principally traded, or lacking any sales or official closing price on a particular day, the security may be valued at the closing bid price on that day. Securities traded in the over-the-counter market are valued based on prices furnished by independent pricing services or market makers. When such securities are valued by an independent pricing service they may be considered fair valued. Futures contracts are valued at the final settlement price set by an exchange on which they are principally traded. Listed options are valued at the mean between the last bid and asked prices from the exchange on which they are principally traded. Options not listed on an exchange are valued by an independent source at the mean between the last bid and asked prices. For purposes of determining net asset value (“NAV”) per share, futures and option contracts generally are valued 15 minutes after the close of the customary trading session of the New York Stock Exchange (“NYSE”).
Investments in open-end and closed-end registered investment companies that do not trade on an exchange are valued at the end-of-day net asset value per share. Investments in open-end and closed-end registered investment companies that trade on an exchange are valued at the last sales price or official closing price as of the close of the customary trading session on the exchange where the security is principally traded.
Debt obligations (including convertible securities) and unlisted equities are fair valued using an evaluated quote provided by an independent pricing service. Evaluated quotes provided by the pricing service may be determined without exclusive reliance on quoted prices, and may reflect appropriate factors such as institution-size trading in similar groups of securities, developments related to specific securities, dividend rate (for unlisted equities), yield (for debt obligations), quality, type of issue, coupon rate (for debt obligations), maturity (for debt obligations), individual trading characteristics and other market data. Pricing services generally value debt obligations assuming orderly transactions of institutional round lot size, but a fund may hold or transact in the same securities in smaller, odd lot sizes. Odd lots often trade at lower prices than institutional round lots. Debt obligations are subject to interest rate and credit risks. In addition, all debt obligations involve some risk of default with respect to interest and/or principal payments.
Foreign securities’ (including foreign exchange contracts) prices are converted into U.S. dollar amounts using the applicable exchange rates as of the close of the NYSE. If market quotations are available and reliable for foreign exchange-traded equity securities, the securities will be valued at the market quotations. Because trading hours for certain foreign securities end before the close of the NYSE, closing market quotations may become unreliable. If between the time trading ends on a particular security and the close of the customary trading session on the NYSE, events occur that the investment adviser determines are significant and make the closing price unreliable, the Fund may fair value the security. If the event is likely to have affected the closing price of the security, the security will be valued at fair value in good faith using procedures approved by the Board of Trustees. Adjustments to closing prices to reflect fair value may also be based on a screening process of an independent pricing service to indicate the degree of certainty, based on historical data, that the closing price in the principal market where a foreign security trades is not the current value as of the close of the NYSE. Foreign securities’ prices meeting the approved degree of certainty that the price is not reflective of current value will be priced at the indication of fair value from the independent pricing service. Multiple factors may be considered by the independent pricing service in determining adjustments to reflect fair value and may include information relating to sector indices, American Depositary Receipts and domestic and foreign index futures. Foreign securities may have additional risks including exchange rate changes, potential for sharply devalued currencies and high inflation, political and economic upheaval, the relative lack of issuer information, relatively low market liquidity and the potential lack of strict financial and accounting controls and standards.
Securities for which market prices are not provided by any of the above methods may be valued based upon quotes furnished by independent sources. The last bid price may be used to value equity securities. The mean between the last bid and asked prices is used to value debt obligations, including corporate loans.
Securities for which market quotations are not readily available or became unreliable are valued at fair value as determined in good faith by or under the supervision of the Trust’s officers following procedures approved by the Board of Trustees. Issuer specific events, market trends, bid/asked quotes of brokers and information providers and other market data may be reviewed in the course of making a good faith determination of a security’s fair value.
The Fund may invest in securities that are subject to interest rate risk, meaning the risk that the prices will generally fall as interest rates rise and, conversely, the prices will generally rise as interest rates fall. Specific securities differ in their sensitivity to changes in interest rates depending on their individual characteristics. Changes in interest rates may result in increased market volatility, which may affect the value and/or liquidity of certain Fund investments.
| 15 | Invesco Dividend Income Fund |
Valuations change in response to many factors including the historical and prospective earnings of the issuer, the value of the issuer’s assets, general economic conditions, interest rates, investor perceptions and market liquidity. Because of the inherent uncertainties of valuation, the values reflected in the financial statements may materially differ from the value received upon actual sale of those investments.
| B. | Securities Transactions and Investment Income — Securities transactions are accounted for on a trade date basis. Realized gains or losses on sales are computed on the basis of specific identification of the securities sold. Interest income (net of withholding tax, if any) is recorded on the accrual basis from settlement date. Dividend income (net of withholding tax, if any) is recorded on the ex-dividend date. |
The Fund may periodically participate in litigation related to Fund investments. As such, the Fund may receive proceeds from litigation settlements. Any proceeds received are included in the Statement of Operations as realized gain (loss) for investments no longer held and as unrealized gain (loss) for investments still held.
Brokerage commissions and mark ups are considered transaction costs and are recorded as an increase to the cost basis of securities purchased and/or a reduction of proceeds on a sale of securities. Such transaction costs are included in the determination of net realized and unrealized gain (loss) from investment securities reported in the Statement of Operations and the Statement of Changes in Net Assets and the net realized and unrealized gains (losses) on securities per share in the Financial Highlights. Transaction costs are included in the calculation of the Fund’s net asset value and, accordingly, they reduce the Fund’s total returns. These transaction costs are not considered operating expenses and are not reflected in net investment income reported in the Statement of Operations and the Statement of Changes in Net Assets, or the net investment income per share and the ratios of expenses and net investment income reported in the Financial Highlights, nor are they limited by any expense limitation arrangements between the Fund and the investment adviser.
The Fund allocates income and realized and unrealized capital gains and losses to a class based on the relative net assets of each class.
| C. | Country Determination – For the purposes of making investment selection decisions and presentation in the Schedule of Investments, the investment adviser may determine the country in which an issuer is located and/or credit risk exposure based on various factors. These factors include the laws of the country under which the issuer is organized, where the issuer maintains a principal office, the country in which the issuer derives 50% or more of its total revenues and the country that has the primary market for the issuer’s securities, as well as other criteria. Among the other criteria that may be evaluated for making this determination are the country in which the issuer maintains 50% or more of its assets, the type of security, financial guarantees and enhancements, the nature of the collateral and the sponsor organization. Country of issuer and/or credit risk exposure has been determined to be the United States of America, unless otherwise noted. |
| D. | Distributions– Distributions from net investment income, if any, are declared and paid monthly. Distributions from net realized capital gain, if any, are generally declared and paid annually and recorded on the ex-dividend date. The Fund may elect to treat a portion of the proceeds from redemptions as distributions for federal income tax purposes. |
| E. | Federal Income Taxes – The Fund intends to comply with the requirements of Subchapter M of the Internal Revenue Code of 1986, as amended (the “Internal Revenue Code”), necessary to qualify as a regulated investment company and to distribute substantially all of the Fund’s taxable earnings to shareholders. As such, the Fund will not be subject to federal income taxes on otherwise taxable income (including net realized capital gain) that is distributed to shareholders. Therefore, no provision for federal income taxes is recorded in the financial statements. |
The Fund recognizes the tax benefits of uncertain tax positions only when the position is more likely than not to be sustained. Management has analyzed the Fund’s uncertain tax positions and concluded that no liability for unrecognized tax benefits should be recorded related to uncertain tax positions. Management is not aware of any tax positions for which it is reasonably possible that the total amounts of unrecognized tax benefits will change materially in the next 12 months.
The Fund files tax returns in the U.S. Federal jurisdiction and certain other jurisdictions. Generally, the Fund is subject to examinations by such taxing authorities for up to three years after the filing of the return for the tax period.
| F. | Expenses – Fees provided for under the Rule 12b-1 plan of a particular class of the Fund are charged to the operations of such class. Transfer agency fees and expenses and other shareholder recordkeeping fees and expenses attributable to Class R5 and Class R6 are allocated to each share class based on relative net assets. Sub-accounting fees attributable to Class R5 are charged to the operations of the class. Transfer agency fees and expenses and other shareholder recordkeeping fees and expenses relating to all other classes are allocated among those classes based on relative net assets. All other expenses are allocated among the classes based on relative net assets. |
| G. | Accounting Estimates – The preparation of financial statements in conformity with accounting principles generally accepted in the United States of America (“GAAP”) requires management to make estimates and assumptions that affect the reported amounts of assets and liabilities at the date of the financial statements and the reported amounts of revenues and expenses during the reporting period including estimates and assumptions related to taxation. Actual results could differ from those estimates by a significant amount. In addition, the Fund monitors for material events or transactions that may occur or become known after the period-end date and before the date the financial statements are released to print. |
| H. | Indemnifications – Under the Trust’s organizational documents, each Trustee, officer, employee or other agent of the Trust is indemnified against certain liabilities that may arise out of the performance of their duties to the Fund. Additionally, in the normal course of business, the Fund enters into contracts, including the Fund’s servicing agreements, that contain a variety of indemnification clauses. The Fund’s maximum exposure under these arrangements is unknown as this would involve future claims that may be made against the Fund that have not yet occurred. The risk of material loss as a result of such indemnification claims is considered remote. |
| I. | Foreign Currency Translations – Foreign currency is valued at the close of the NYSE based on quotations posted by banks and major currency dealers. Portfolio securities and other assets and liabilities denominated in foreign currencies are translated into U.S. dollar amounts at the date of valuation. Purchases and sales of portfolio securities (net of foreign taxes withheld on disposition) and income items denominated in foreign currencies are translated into U.S. dollar amounts on the respective dates of such transactions. The Fund does not separately account for the portion of the results of operations resulting from changes in foreign exchange rates on investments and the fluctuations arising from changes in market prices of securities held. The combined results of changes in foreign exchange rates and the fluctuation of market prices on investments (net of estimated foreign tax withholding) are included with the net realized and unrealized gain or loss from investments in the Statement of Operations. Reported net realized foreign currency gains or losses arise from (1) sales of foreign currencies, (2) currency gains or losses realized between the trade and settlement dates on securities transactions, and (3) the difference between the amounts of dividends, interest, and foreign withholding taxes recorded on the Fund’s books and the U.S. dollar equivalent of the amounts actually received or paid. Net |
| 16 | Invesco Dividend Income Fund |
| | unrealized foreign currency gains and losses arise from changes in the fair values of assets and liabilities, other than investments in securities at fiscal period end, resulting from changes in exchange rates. |
The Fund may invest in foreign securities, which may be subject to foreign taxes on income, gains on investments or currency repatriation, a portion of which may be recoverable. Foreign taxes, if any, are recorded based on the tax regulations and rates that exist in the foreign markets in which the Fund invests and are shown in the Statement of Operations.
| J. | Forward Foreign Currency Contracts – The Fund may engage in foreign currency transactions either on a spot (i.e. for prompt delivery and settlement) basis, or through forward foreign currency contracts, to manage or minimize currency or exchange rate risk. |
The Fund may also enter into forward foreign currency contracts for the purchase or sale of a security denominated in a foreign currency in order to “lock in” the U.S. dollar price of that security, or the Fund may also enter into forward foreign currency contracts that do not provide for physical settlement of the two currencies, but instead are settled by a single cash payment calculated as the difference between the agreed upon exchange rate and the spot rate at settlement based upon an agreed upon notional amount (non-deliverable forwards). The Fund will set aside liquid assets in an amount equal to the daily mark-to-market obligation for forward foreign currency contracts.
A forward foreign currency contract is an obligation between two parties (“Counterparties”) to purchase or sell a specific currency for an agreed-upon price at a future date. The use of forward foreign currency contracts does not eliminate fluctuations in the price of the underlying securities the Fund owns or intends to acquire but establishes a rate of exchange in advance. Fluctuations in the value of these contracts are measured by the difference in the contract date and reporting date exchange rates and are recorded as unrealized appreciation (depreciation) until the contracts are closed. When the contracts are closed, realized gains (losses) are recorded. Realized and unrealized gains (losses) on the contracts are included in the Statement of Operations. The primary risks associated with forward foreign currency contracts include failure of the Counterparty to meet the terms of the contract and the value of the foreign currency changing unfavorably. These risks may be in excess of the amounts reflected in the Statement of Assets and Liabilities.
NOTE 2—Advisory Fees and Other Fees Paid to Affiliates
The Trust has entered into a master investment advisory agreement with Invesco Advisers, Inc. (the "Adviser" or "Invesco"). Under the terms of the investment advisory agreement, the Fund accrues daily and pays monthly an advisory fee to the Adviser based on the annual rate of the Fund’s average daily net assets as follows:
| Average Daily Net Assets | Rate |
| First $350 million | 0.75% |
| Next $350 million | 0.65% |
| Next $1.3 billion | 0.55% |
| Next $2 billion | 0.45% |
| Next $2 billion | 0.40% |
| Next $2 billion | 0.375% |
| Over $8 billion | 0.35% |
For the year ended April 30, 2019, the effective advisory fees incurred by the Fund was 0.61%.
Under the terms of a master sub-advisory agreement between the Adviser and each of Invesco Asset Management Deutschland GmbH, Invesco Asset Management Limited, Invesco Asset Management (Japan) Limited, Invesco Hong Kong Limited, Invesco Senior Secured Management, Inc. and Invesco Canada Ltd. (collectively, the "Affiliated Sub-Advisers") the Adviser, not the Fund, will pay 40% of the fees paid to the Adviser to any such Affiliated Sub-Adviser(s) that provide(s) discretionary investment management services to the Fund based on the percentage of assets allocated to such Affiliated Sub-Adviser(s).
The Adviser has contractually agreed, through at least June 30, 2020, to waive advisory fees and/or reimburse expenses of all shares to the extent necessary to limit total annual fund operating expenses after fee waiver and/or expense reimbursement (excluding certain items discussed below) of Class A, Class C, Class Y, Investor Class, Class R5 and Class R6 shares to 2.00%, 2.75%, 1.75%, 2.00%, 1.75% and 1.75%, respectively, of average daily net assets (the "expense limits"). In determining the Adviser’s obligation to waive advisory fees and/or reimburse expenses, the following expenses are not taken into account, and could cause the total annual fund operating expenses after fee waivers and/or expense reimbursement to exceed the numbers reflected above: (1) interest; (2) taxes; (3) dividend expense on short sales; (4) extraordinary or non-routine items, including litigation expenses; and (5) expenses that the Fund has incurred but did not actually pay because of an expense offset arrangement. Unless Invesco continues the fee waiver agreement, it will terminate on June 30, 2020. During its term, the fee waiver agreement cannot be terminated or amended to increase the expense limits or reduce the advisory fee waiver without approval of the Board of Trustees. The Adviser did not waive fees and/or reimburse expenses during the period under these expense limits.
Further, the Adviser has contractually agreed, through at least June 30, 2021, to waive the advisory fee payable by the Fund in an amount equal to 100% of the net advisory fees the Adviser receives from the affiliated money market funds on investments by the Fund of uninvested cash in such affiliated money market funds.
For the year ended April 30, 2019, the Adviser waived advisory fees of $67,908.
The Trust has entered into a master administrative services agreement with Invesco pursuant to which the Fund has agreed to pay Invesco for certain administrative costs incurred in providing accounting services to the Fund. For the year ended April 30, 2019, expenses incurred under the agreement are shown in the Statement of Operations asAdministrative services fees. Also, Invesco has entered into a sub-administration agreement whereby State Street Bank and Trust Company (“SSB”) serves as custodian and fund accountant and provides certain administrative services to the Fund.
The Trust has entered into a transfer agency and service agreement with Invesco Investment Services, Inc. (“IIS”) pursuant to which the Fund has agreed to pay IIS a fee for providing transfer agency and shareholder services to the Fund and reimburse IIS for certain expenses incurred by IIS in the course of providing such services. IIS may make payments to intermediaries that provide omnibus account services, sub-accounting services and/or networking services. All fees payable by IIS to intermediaries that provide omnibus account services or sub-accounting services are charged back to
| 17 | Invesco Dividend Income Fund |
the Fund, subject to certain limitations approved by the Trust’s Board of Trustees. For the year ended April 30, 2019, expenses incurred under the agreement are shown in the Statement of Operations asTransfer agent fees.
The Trust has entered into master distribution agreements with Invesco Distributors, Inc. (“IDI”) to serve as the distributor for the Class A, Class C, Class Y, Investor Class, Class R5 and Class R6 shares of the Fund. The Trust has adopted plans pursuant to Rule 12b-1 under the 1940 Act with respect to the Fund’s Class A, Class C and Investor Class shares (collectively, the “Plans”). The Fund, pursuant to the Plans, pays IDI compensation at the annual rate of 0.25% of the Fund’s average daily net assets of Class A shares and 1.00% of the average daily net assets of Class C shares. The Fund, pursuant to the Investor Class Plan, reimburses IDI for its allocated share of expenses incurred pursuant to the Investor Class Plan for the period, up to a maximum annual rate of 0.25% of the average daily net assets of Investor Class shares. The fees are accrued daily and paid monthly. Of the Plan payments, up to 0.25% of the average daily net assets of each class of shares may be paid to furnish continuing personal shareholder services to customers who purchase and own shares of such classes. Any amounts not paid as a service fee under the Plans would constitute an asset-based sales charge. Rules of the Financial Industry Regulatory Authority (“FINRA”) impose a cap on the total sales charges, including asset-based sales charges, that may be paid by any class of shares of the Fund. For the year ended April 30, 2019, expenses incurred under the Plans are shown in the Statement of Operations asDistribution fees.
Front-end sales commissions and CDSC (collectively, the “sales charges”) are not recorded as expenses of the Fund. Front-end sales commissions are deducted from proceeds from the sales of Fund shares prior to investment in Class A shares of the Fund. CDSC are deducted from redemption proceeds prior to remittance to the shareholder. During the year ended April 30, 2019, IDI advised the Fund that IDI retained $111,815 in front-end sales commissions from the sale of Class A shares and $18,446 and $10,291 from Class A and Class C shares, respectively, for CDSC imposed upon redemptions by shareholders.
For the year ended April 30, 2019, the Fund incurred $1,225 in brokerage commissions with Invesco Capital Markets, Inc., an affiliate of the Adviser and IDI, for portfolio transactions executed on behalf of the Fund.
Certain officers and trustees of the Trust are officers and directors of the Adviser, IIS and/or IDI.
NOTE 3—Additional Valuation Information
GAAP defines fair value as the price that would be received to sell an asset or paid to transfer a liability in an orderly transaction between market participants at the measurement date, under current market conditions. GAAP establishes a hierarchy that prioritizes the inputs to valuation methods, giving the highest priority to readily available unadjusted quoted prices in an active market for identical assets (Level 1) and the lowest priority to significant unobservable inputs (Level 3), generally when market prices are not readily available or are unreliable. Based on the valuation inputs, the securities or other investments are tiered into one of three levels. Changes in valuation methods may result in transfers in or out of an investment’s assigned level:
Level 1 – Prices are determined using quoted prices in an active market for identical assets.
Level 2 – Prices are determined using other significant observable inputs. Observable inputs are inputs that other market participants may use in pricing a security. These may include quoted prices for similar securities, interest rates, prepayment speeds, credit risk, yield curves, loss severities, default rates, discount rates, volatilities and others.
Level 3 – Prices are determined using significant unobservable inputs. In situations where quoted prices or observable inputs are unavailable (for example, when there is little or no market activity for an investment at the end of the period), unobservable inputs may be used. Unobservable inputs reflect the Fund’s own assumptions about the factors market participants would use in determining fair value of the securities or instruments and would be based on the best available information.
The following is a summary of the tiered valuation input levels, as of April 30, 2019. The level assigned to the securities valuations may not be an indication of the risk or liquidity associated with investing in those securities. Because of the inherent uncertainties of valuation, the values reflected in the financial statements may materially differ from the value received upon actual sale of those investments.
| | Level 1 | Level 2 | Level 3 | Total |
| Investments in Securities | | | | |
| Common Stocks & Other Equity Interests | $1,293,046,138 | $124,882,235 | $— | $1,417,928,373 |
| Money Market Funds | 87,251,378 | — | — | 87,251,378 |
| Total Investments in Securities | 1,380,297,516 | 124,882,235 | — | 1,505,179,751 |
| Other Investments - Assets* | | | | |
| Forward Foreign Currency Contracts | — | 19,980 | — | 19,980 |
| Total Investments | $1,380,297,516 | $124,902,215 | $— | $1,505,199,731 |
| * | Unrealized appreciation (depreciation). |
NOTE 4—Derivative Investments
The Fund may enter into an International Swaps and Derivatives Association Master Agreement (“ISDA Master Agreement”) under which a fund may trade OTC derivatives. An OTC transaction entered into under an ISDA Master Agreement typically involves a collateral posting arrangement, payment netting provisions and close-out netting provisions. These netting provisions allow for reduction of credit risk through netting of contractual obligations. The enforceability of the netting provisions of the ISDA Master Agreement depends on the governing law of the ISDA Master Agreement, among other factors.
For financial reporting purposes, the Fund does not offset OTC derivative assets or liabilities that are subject to ISDA Master Agreements in the Statement of Assets and Liabilities.
| 18 | Invesco Dividend Income Fund |
Value of Derivative Investments at Period-End
The table below summarizes the value of the Fund’s derivative investments, detailed by primary risk exposure, held as of April 30, 2019:
| | Value |
| Derivative Assets | Currency
Risk |
| Unrealized appreciation on forward foreign currency contracts outstanding | $19,980 |
| Derivatives not subject to master netting agreements | - |
| Total Derivative Assets subject to master netting agreements | $19,980 |
Offsetting Assets and Liabilities
The table below reflects the Fund’s exposure to Counterparties subject to either an ISDA Master Agreement or other agreement for OTC derivative transactions as of April 30, 2019.
| | Financial
Derivative
Assets | Financial
Derivative
Liabilities | | Collateral
(Received)/Pledged | | |
| Counterparty | Forward Foreign
Currency Contracts | Forward Foreign
Currency Contracts | Net Value of
Derivatives | Non-Cash | Cash | Net
Amount |
| Citibank, N.A. | $5,810 | $– | $5,810 | $– | $– | $5,810 |
| JPMorgan Chase Bank, N.A. | 6,686 | – | 6,686 | – | – | 6,686 |
| State Street Bank and Trust Co. | 7,484 | – | 7,484 | – | – | 7,484 |
| Total | $19,980 | $– | $19,980 | $– | $– | $19,980 |
Effect of Derivative Investments for the year ended April 30, 2019
The table below summarizes the gains (losses) on derivative investments, detailed by primary risk exposure, recognized in earnings during the period:
| | Location of Gain (Loss) on
Statement of Operations |
| | Currency
Risk |
| Realized Gain: | |
| Forward foreign currency contracts | $6,565,920 |
| Change in Net Unrealized Appreciation (Depreciation): | |
| Forward foreign currency contracts | (1,696,301) |
| Total | $4,869,619 |
The table below summarizes the average notional value of derivatives held during the period.
| | Forward
Foreign Currency
Contracts |
| Average notional value | $45,290,442 |
NOTE 5—Expense Offset Arrangement(s)
The expense offset arrangement is comprised of transfer agency credits which result from balances in demand deposit accounts used by the transfer agent for clearing shareholder transactions. For the year ended April 30, 2019, the Fund received credits from this arrangement, which resulted in the reduction of the Fund’s total expenses of $10,781.
NOTE 6—Trustees’ and Officers’ Fees and Benefits
Trustees’ and Officers’ Fees and Benefits include amounts accrued by the Fund to pay remuneration to certain Trustees and Officers of the Fund. Trustees have the option to defer compensation payable by the Fund, and Trustees’ and Officers’ Fees and Benefits also include amounts accrued by the Fund to fund such deferred compensation amounts. Those Trustees who defer compensation have the option to select various Invesco Funds in which their deferral accounts shall be deemed to be invested. Finally, certain current Trustees were eligible to participate in a retirement plan that provided for benefits to be paid upon retirement to Trustees over a period of time based on the number of years of service. The Fund may have certain former Trustees who also participate in a retirement plan and receive benefits under such plan.Trustees’ and Officers’ Fees and Benefits include amounts accrued by the Fund to fund such retirement benefits. Obligations under the deferred compensation and retirement plans represent unsecured claims against the general assets of the Fund.
NOTE 7—Cash Balances
The Fund is permitted to temporarily carry a negative or overdrawn balance in its account with SSB, the custodian bank. Such balances, if any at period-end, are shown in the Statement of Assets and Liabilities under the payable captionAmount due custodian. To compensate the custodian bank
| 19 | Invesco Dividend Income Fund |
for such overdrafts, the overdrawn Fund may either (1) leave funds as a compensating balance in the account so the custodian bank can be compensated by earning the additional interest; or (2) compensate by paying the custodian bank at a rate agreed upon by the custodian bank and Invesco, not to exceed the contractually agreed upon rate.
NOTE 8—Distributions to Shareholders and Tax Components of Net Assets
| Tax Character of Distributions to Shareholders Paid During the Fiscal Years Ended April 30, 2019 and 2018 |
| | 2019 | 2018 |
| Ordinary income | $45,333,541 | $54,747,522 |
| Long-term capital gain | 111,559,107 | 48,206,568 |
| Total distributions | $156,892,648 | $102,954,090 |
| Tax Components of Net Assets at Period-End: |
| | 2019 |
| Undistributed ordinary income | $1,532,330 |
| Undistributed long-term capital gain | 16,278,741 |
| Net unrealized appreciation — investments | 252,283,270 |
| Net unrealized appreciation (depreciation) — foreign currencies | (30,961) |
| Temporary book/tax differences | (127,745) |
| Shares of beneficial interest | 1,226,206,412 |
| Total net assets | $1,496,142,047 |
The difference between book-basis and tax-basis unrealized appreciation (depreciation) is due to differences in the timing of recognition of gains and losses on investments for tax and book purposes. The Fund’s net unrealized appreciation difference is attributable primarily to wash sales and forward foreign currency contracts.
The temporary book/tax differences are a result of timing differences between book and tax recognition of income and/or expenses. The Fund’s temporary book/tax differences are the result of the trustee deferral of compensation and retirement plan benefits.
Capital loss carryforward is calculated and reported as of a specific date. Results of transactions and other activity after that date may affect the amount of capital loss carryforward actually available for the Fund to utilize. Capital losses generated in years beginning after December 22, 2010 can be carried forward for an unlimited period, whereas previous losses expire in eight tax years. Capital losses with an expiration period may not be used to offset capital gains until all net capital losses without an expiration date have been utilized. Capital loss carryforwards with no expiration date will retain their character as either short-term or long-term capital losses instead of as short-term capital losses as under prior law. The ability to utilize capital loss carryforwards in the future may be limited under the Internal Revenue Code and related regulations based on the results of future transactions.
The Fund does not have a capital loss carryforward as of April 30, 2019.
NOTE 9—Investment Transactions
The aggregate amount of investment securities (other than short-term securities, U.S. Treasury obligations and money market funds, if any) purchased and sold by the Fund during the year ended April 30, 2019 was $62,942,618 and $603,651,803, respectively. Cost of investments, including any derivatives, on a tax basis includes the adjustments for financial reporting purposes as of the most recently completed federal income tax reporting period-end.
| Unrealized Appreciation (Depreciation) of Investments on a Tax Basis |
| Aggregate unrealized appreciation of investments | $322,350,298 |
| Aggregate unrealized (depreciation) of investments | (70,067,028) |
| Net unrealized appreciation of investments | $252,283,270 |
Cost of investments for tax purposes is $1,252,916,461.
NOTE 10—Reclassification of Permanent Differences
Primarily as a result of differing book/tax treatment of foreign currency transactions and real estate investment trust distributions, on April 30, 2019, undistributed net investment income was decreased by $1,748,151 and undistributed net realized gain was increased by $1,748,151. This reclassification had no effect on the net assets or the distributable earnings of the Fund.
| 20 | Invesco Dividend Income Fund |
NOTE 11—Share Information
| | Summary of Share Activity |
| | Years ended April 30, |
| | 2019(a) | | 2018 |
| | Shares | Amount | | Shares | Amount |
| Sold: | | | | | |
| Class A | 3,006,748 | $67,390,608 | | 5,557,845 | $133,936,507 |
| Class B(b) | — | — | | 3,094 | 75,111 |
| Class C | 595,243 | 13,241,679 | | 1,313,101 | 32,069,130 |
| Class Y | 2,611,346 | 60,093,396 | | 9,063,741 | 221,205,219 |
| Investor Class | 83,246 | 1,921,271 | | 134,779 | 3,281,647 |
| Class R5 | 35,747 | 823,196 | | 23,003 | 548,665 |
| Class R6 | 1,842,834 | 41,639,938 | | 13,276,828 | 319,690,551 |
| Issued as reinvestment of dividends: | | | | | |
| Class A | 3,138,017 | 68,181,648 | | 1,697,639 | 41,200,887 |
| Class B(b) | — | — | | 3,641 | 89,218 |
| Class C | 698,345 | 15,319,004 | | 372,895 | 9,188,155 |
| Class Y | 1,140,934 | 25,088,792 | | 1,017,708 | 24,935,624 |
| Investor Class | 319,556 | 7,008,383 | | 146,539 | 3,588,837 |
| Class R5 | 10,141 | 220,586 | | 4,307 | 104,387 |
| Class R6 | 1,252,991 | 27,304,918 | | 622,824 | 15,117,359 |
| Conversion of Class B shares to Class A shares:(c) | | | | | |
| Class A | — | — | | 117,928 | 2,962,339 |
| Class B | — | — | | (118,411) | (2,962,339) |
| Automatic conversion of Class C shares to Class A shares: | | | | | |
| Class A | 1,243,209 | 26,467,883 | | - | - |
| Class C | (1,226,483) | (26,467,883) | | - | - |
| Reacquired: | | | | | |
| Class A | (11,281,409) | (258,040,548) | | (17,570,287) | (423,473,482) |
| Class B(b) | — | — | | (63,765) | (1,559,335) |
| Class C | (3,566,288) | (82,577,124) | | (4,367,841) | (106,125,019) |
| Class Y | (12,074,171) | (279,423,339) | | (26,482,455) | (641,466,793) |
| Investor Class | (479,561) | (11,098,587) | | (892,407) | (21,855,113) |
| Class R5 | (47,112) | (1,061,584) | | (43,162) | (1,025,389) |
| Class R6 | (6,020,160) | (138,368,123) | | (3,354,816) | (79,961,688) |
| Net increase (decrease) in share activity | (18,716,827) | $(442,335,886) | | (19,537,272) | $(470,435,522) |
| (a) | There are entities that are record owners of more than 5% of the outstanding shares of the Fund and in the aggregate own 38% of the outstanding shares of the Fund. IDI has an agreement with these entities to sell Fund shares. The Fund, Invesco and/or Invesco affiliates may make payments to these entities, which are considered to be related to the Fund, for providing services to the Fund, Invesco and/or Invesco affiliates including but not limited to services such as securities brokerage, distribution, third party record keeping and account servicing. The Fund has no knowledge as to whether all or any portion of the shares owned of record by these entities are also owned beneficially. |
| (b) | Class B shares activity for the period May 1, 2017 through January 26, 2018 (date of conversion). |
| (c) | Effective as of the close of business on January 26, 2018, all outstanding Class B shares were converted to Class A shares. |
| 21 | Invesco Dividend Income Fund |
Report of Independent Registered Public Accounting Firm
To the Board of Trustees of AIM Sector Funds (Invesco Sector Funds) and Shareholders of Invesco Dividend Income Fund:
Opinion on the Financial Statements
We have audited the accompanying statement of assets and liabilities, including the schedule of investments, of Invesco Dividend Income Fund (one of the funds constituting AIM Sector Funds (Invesco Sector Funds), hereafter referred to as the “Fund”) as of April 30, 2019, the related statement of operations for the year ended April 30, 2019, the statement of changes in net assets for each of the two years in the period ended April 30, 2019, including the related notes, and the financial highlights for each of the five years in the period ended April 30, 2019 (collectively referred to as the “financial statements”). In our opinion, the financial statements present fairly, in all material respects, the financial position of the Fund as of April 30, 2019, the results of its operations for the year then ended, the changes in its net assets for each of the two years in the period ended April 30, 2019 and the financial highlights for each of the five years in the period ended April 30, 2019 in conformity with accounting principles generally accepted in the United States of America.
Basis for Opinion
These financial statements are the responsibility of the Fund’s management. Our responsibility is to express an opinion on the Fund’s financial statements based on our audits. We are a public accounting firm registered with the Public Company Accounting Oversight Board (United States) (“PCAOB”) and are required to be independent with respect to the Fund in accordance with the U.S. federal securities laws and the applicable rules and regulations of the Securities and Exchange Commission and the PCAOB.
We conducted our audits of these financial statements in accordance with the standards of the PCAOB. Those standards require that we plan and perform the audit to obtain reasonable assurance about whether the financial statements are free of material misstatement, whether due to error or fraud.
Our audits included performing procedures to assess the risks of material misstatement of the financial statements, whether due to error or fraud, and performing procedures that respond to those risks. Such procedures included examining, on a test basis, evidence regarding the amounts and disclosures in the financial statements. Our audits also included evaluating the accounting principles used and significant estimates made by management, as well as evaluating the overall presentation of the financial statements. Our procedures included confirmation of securities owned as of April 30, 2019 by correspondence with the custodian, transfer agent and brokers; when replies were not received from brokers, we performed other auditing procedures. We believe that our audits provide a reasonable basis for our opinion.
PricewaterhouseCoopers LLP
Houston, TX
June 26, 2019
We have served as the auditor of one or more of the investment companies in the Invesco group of investment companies since at least 1995. We have not been able to determine the specific year we began serving as auditor.
| 22 | Invesco Dividend Income Fund |
Calculating your ongoing Fund expenses
Example
As a shareholder of the Fund, you incur two types of costs: (1) transaction costs, which may include sales charges (loads) on purchase payments or contingent deferred sales charges on redemptions, if any; and (2) ongoing costs, including management fees, distribution and/or service (12b-1) fees, and other Fund expenses. This example is intended to help you understand your ongoing costs (in dollars) of investing in the Fund and to compare these costs with ongoing costs of investing in other mutual funds. The example is based on an investment of $1,000 invested at the beginning of the period and held for the entire period November 1, 2018 through April 30, 2019.
Actual expenses
The table below provides information about actual account values and actual expenses. You may use the information in this table, together with the amount you invested, to estimate the expenses that you paid over the period. Simply divide your account value by $1,000 (for example, an $8,600 account value divided by $1,000 = 8.6), then multiply the result by the number in the table under the heading entitled “Actual Expenses Paid During Period” to estimate the expenses you paid on your account during this period.
Hypothetical example for comparison purposes
The table below also provides information about hypothetical account values and hypothetical expenses based on the Fund’s actual expense ratio and an assumed rate of return of 5% per year before expenses, which is not the Fund’s actual return.
The hypothetical account values and expenses may not be used to estimate the actual ending account balance or expenses you paid for the period. You may use this information to compare the ongoing costs of investing in the Fund and other funds. To do so, compare this 5% hypothetical example with the 5% hypothetical examples that appear in the shareholder reports of the other funds.
Please note that the expenses shown in the table are meant to highlight your ongoing costs only and do not reflect any transaction costs, such as sales charges (loads) on purchase payments or contingent deferred sales charges on redemptions, if any. Therefore, the hypothetical information is useful in comparing ongoing costs only, and will not help you determine the relative total costs of owning different funds. In addition, if these transaction costs were included, your costs would have been higher.
| | Beginning
Account Value (11/01/18) | ACTUAL | HYPOTHETICAL
(5% annual return before
expenses) | Annualized
Expense
Ratio |
Ending
Account Value
(04/30/19)1 | Expenses
Paid During
Period2 | Ending
Account Value
(04/30/19) | Expenses
Paid During
Period2 |
| Class A | $1,000.00 | $1,066.60 | $5.43 | $1,019.54 | $5.31 | 1.06% |
| Class C | 1,000.00 | 1,062.90 | 9.26 | 1,015.82 | 9.05 | 1.81 |
| Class Y | 1,000.00 | 1,067.90 | 4.15 | 1,020.78 | 4.06 | 0.81 |
| Investor Class | 1,000.00 | 1,066.60 | 5.43 | 1,019.54 | 5.31 | 1.06 |
| Class R5 | 1,000.00 | 1,068.10 | 3.95 | 1,020.98 | 3.86 | 0.77 |
| Class R6 | 1,000.00 | 1,069.00 | 3.54 | 1,021.37 | 3.46 | 0.69 |
| 1 | The actual ending account value is based on the actual total return of the Fund for the period November 1, 2018 through April 30, 2019, after actual expenses and will differ from the hypothetical ending account value which is based on the Fund’s expense ratio and a hypothetical annual return of 5% before expenses. |
| 2 | Expenses are equal to the Fund’s annualized expense ratio as indicated above multiplied by the average account value over the period, multiplied by 181/365 to reflect the most recent fiscal half year. |
| 23 | Invesco Dividend Income Fund |
Tax Information
Form 1099-DIV, Form 1042-S and other year–end tax information provide shareholders with actual calendar year amounts that should be included in their tax returns. Shareholders should consult their tax advisers.
The following distribution information is being provided as required by the Internal Revenue Code or to meet a specific state’s requirement.
The Fund designates the following amounts or, if subsequently determined to be different, the maximum amount allowable for its fiscal year ended April 30, 2019:
| Federal and State Income Tax | |
| Long-Term Capital Gain Distributions | $111,559,107 |
| Qualified Dividend Income* | 100.00% |
| Corporate Dividends Received Deduction* | 99.27% |
| U.S. Treasury Obligations* | 0.00% |
| * | The above percentages are based on ordinary income dividends paid to shareholders during the Fund’s fiscal year. |
| | |
| Non-Resident Alien Shareholders | |
| Qualified Short-Term Gains | 1,807,498 |
| 24 | Invesco Dividend Income Fund |
Trustees and Officers
The address of each trustee and officer is AIM Sector Funds (Invesco Sector Funds) (the “Trust”), 11 Greenway Plaza, Suite 1000, Houston, Texas 77046-1173. The trustees serve for the life of the Trust, subject to their earlier death, incapacitation, resignation, retirement or removal as more specifically provided in the Trust’s organizational documents. Each officer serves for a one year term or until their successors are elected and qualified. Column two below includes length of time served with predecessor entities, if any.
| | | | | | | | |
Name, Year of Birth and
Position(s) Held with the Trust | | Trustee and/
or Officer Since | | Principal Occupation(s)
During Past 5 Years | | Number of Funds in Fund
Complex
Overseen by
Trustee | | Other Directorship(s)
Held by Trustee During
Past 5 Years |
| Interested Persons | | | | | | | | |
Martin L. Flanagan1 — 1960 Trustee and Vice Chair | | 2007 | | Executive Director, Chief Executive Officer and President, Invesco Ltd. (ultimate parent of Invesco and a global investment management firm); Trustee and Vice Chair, The Invesco Funds; Vice Chair, Investment Company Institute; and Member of Executive Board, SMU Cox School of Business Formerly: Advisor to the Board, Invesco Advisers, Inc. (formerly known as Invesco Institutional (N.A.), Inc.); Chairman and Chief Executive Officer, Invesco Advisers, Inc. (registered investment adviser); Director, Chairman, Chief Executive Officer and President, Invesco Holding Company (US), Inc. (formerly IVZ Inc.) (holding company), Invesco Group Services, Inc. (service provider) and Invesco North American Holdings, Inc. (holding company); Director, Chief Executive Officer and President, Invesco Holding Company Limited (parent of Invesco and a global investment management firm); Director, Invesco Ltd.; Chairman, Investment Company Institute and President,Co-Chief Executive Officer,Co-President, Chief Operating Officer and Chief Financial Officer, Franklin Resources, Inc. (global investment management organization) | | 241 | | None |
Philip A. Taylor2 — 1954 Trustee | | 2006 | | Vice Chair, Invesco Ltd.; Director, Invesco Canada Ltd. (formerly known as Invesco Trimark Ltd./Invesco Trimark Ltèe) (registered investment adviser and registered transfer agent); Trustee, The Invesco Funds Formerly: Head of the Americas and Senior Managing Director, Invesco Ltd.; Director, Invesco Advisers, Inc. (formerly known as Invesco Institutional (N.A.), Inc.) (registered investment adviser); Director and Chairman, Invesco Investment Services, Inc. (formerly known as Invesco AIM Investment Services, Inc.) (registered transfer agent); Chief Executive Officer, Invesco Corporate Class Inc. (corporate mutual fund company); Chairman and Chief Executive Officer, Invesco Canada Ltd. (formerly known as Invesco Trimark Ltd./Invesco Trimark Ltèe) (registered investment adviser and registered transfer agent); Senior Vice President, The Invesco Funds; Director, Invesco Investment Advisers LLC (formerly known as Van Kampen Asset Management); Director, Chairman, Chief Executive Officer and President, Invesco Management Group, Inc. (formerly known as Invesco AIM Management Group, Inc.) (financial services holding company);Co-Chairman,Co-President andCo-Chief Executive Officer, Invesco Advisers, Inc. (formerly known as Invesco Institutional (N.A.), Inc.) (registered investment adviser); Director, Chief Executive Officer and President, Van Kampen Exchange Corp; President and Principal Executive Officer, The Invesco Funds (other than AIM Treasurer’s Series Trust (Invesco Treasurer’s Series Trust), Short-Term Investments Trust and Invesco Management Trust); Executive Vice President, The Invesco Funds (AIM Treasurer’s Series Trust (Invesco Treasurer’s Series Trust), Short-Term Investments Trust and Invesco Management Trust only); Director and President, INVESCO Funds Group, Inc. (registered investment adviser and registered transfer agent); Director and Chairman, IVZ Distributors, Inc. (formerly known as INVESCO Distributors, Inc.) (registered broker dealer); Director, President and Chairman, Invesco Inc. (holding company), Invesco Canada Holdings Inc. (holding company), Trimark Investments Ltd./Placements Trimark Ltèe and Invesco Financial Services Ltd/Services Financiers Invesco Ltèe; Chief Executive Officer, Invesco Canada Fund Inc. (corporate mutual fund company); Director and Chairman, Van Kampen Investor Services Inc.; Director, Chief Executive Officer and President, 1371 Preferred Inc. (holding company) and Van Kampen Investments Inc.; Director and President, AIM GP Canada Inc. (general partner for limited partnerships) and Van Kampen Advisors, Inc.; Director and Chief Executive Officer, Invesco Trimark Dealer Inc. (registered broker dealer); Director, Invesco Distributors, Inc. (formerly known as Invesco AIM Distributors, Inc.) (registered broker dealer); Manager, Invesco Capital Management LLC; Director, Chief Executive Officer and President, Invesco Advisers, Inc.; Director, Chairman, Chief Executive Officer and President, Invesco AIM Capital Management, Inc.; President, Invesco Trimark Dealer Inc. and Invesco Trimark Ltd./Invesco Trimark Ltèe; Director and President, AIM Trimark Corporate Class Inc. and AIM Trimark Canada Fund Inc.; Senior Managing Director, Invesco Holding Company Limited; Director and Chairman, Fund Management Company (former registered broker dealer); President and Principal Executive Officer, The Invesco Funds (AIM Treasurer’s Series Trust (Invesco Treasurer’s Series Trust), and Short-Term Investments Trust only); President, AIM Trimark Global Fund Inc. and AIM Trimark Canada Fund Inc. | | 241 | | None |
| 1 | Mr. Flanagan is considered an interested person (within the meaning of Section 2(a)(19) of the 1940 Act) of the Trust because he is an officer of the Adviser to the Trust, and an officer and a director of Invesco Ltd., ultimate parent of the Adviser. |
| 2 | Mr. Taylor is considered an interested person (within the meaning of Section 2(a)(19) of the 1940 Act) of the Trust because he is an officer of Invesco Ltd., ultimate parent of the Adviser. |
T-1 Invesco Dividend Income Fund
Trustees and Officers—(continued)
| | | | | | | | |
Name, Year of Birth and
Position(s) Held with the Trust | | Trustee and/
or Officer Since | | Principal Occupation(s)
During Past 5 Years | | Number of Funds in Fund
Complex
Overseen by
Trustee | | Other Directorship(s)
Held by Trustee During
Past 5 Years |
| Independent Trustees | | | | | | | | |
Bruce L. Crockett — 1944 Trustee and Chair | | 2003 | | Chairman, Crockett Technologies Associates (technology consulting company) Formerly: Director, Captaris (unified messaging provider); Director, President and Chief Executive Officer, COMSAT Corporation; Chairman, Board of Governors of INTELSAT (international communications company); ACE Limited (insurance company); Independent Directors Council and Investment Company Institute: Member of the Audit Committee, Investment Company Institute; Member of the Executive Committee and Chair of the Governance Committee, Independent Directors Council | | 241 | | Director and Chairman of the Audit Committee, ALPS (Attorneys Liability Protection Society) (insurance company); Director and Member of the Audit Committee and Compensation Committee, Ferroglobe PLC (metallurgical company) |
David C. Arch — 1945 Trustee | | 2010 | | Chairman of Blistex Inc. (consumer health care products manufacturer); Member, World Presidents’ Organization | | 241 | | Board member of the Illinois Manufacturers’ Association |
Beth Ann Brown3 — 1968 Trustee | | 2019 | | Independent Consultant Formerly: Head of Intermediary Distribution, Managing Director, Strategic Relations, Managing Director, Head of National Accounts, Senior Vice President, National Account Manager and Senior Vice President, Key Account Manager, Columbia Management Investment Advisers LLC; Vice President, Key Account Manager, Liberty Funds Distributor, Inc.; and Trustee of certain Oppenheimer Funds | | 225 | | Director, Board of Directors of Caron Engineering Inc.; Advisor, Board of Advisors of Caron Engineering Inc.; President and Director, Acton Shapleigh Youth Conservation Corps (non -profit); and Vice President and Director of Grahamtastic Connection(non-profit) |
Jack M. Fields — 1952 Trustee | | 2003 | | Chief Executive Officer, Twenty First Century Group, Inc. (government affairs company); and Chairman, Discovery Learning Alliance(non-profit) Formerly: Owner and Chief Executive Officer, Dos Angeles Ranch L.P. (cattle, hunting, corporate entertainment); Director, Insperity, Inc. (formerly known as Administaff) (human resources provider); Chief Executive Officer, Texana Timber LP (sustainable forestry company); Director of Cross Timbers Quail Research Ranch(non-profit); and member of the U.S. House of Representatives | | 241 | | None |
Cynthia Hostetler — 1962 Trustee | | 2017 | | Non-Executive Director and Trustee of a number of public and private business corporations Formerly: Director, Aberdeen Investment Funds (4 portfolios); Head of Investment Funds and Private Equity, Overseas Private Investment Corporation; President, First Manhattan Bancorporation, Inc.; Attorney, Simpson Thacher & Bartlett LLP | | 241 | | Vulcan Materials Company (construction materials company); Trilinc Global Impact Fund; Genesee & Wyoming, Inc. (railroads); Artio Global Investment LLC (mutual fund complex); Edgen Group, Inc. (specialized energy and infrastructure products distributor); Investment Company Institute (professional organization); Independent Directors Council (professional organization) |
Eli Jones — 1961 Trustee | | 2016 | | Professor and Dean, Mays Business School — Texas A&M University Formerly: Professor and Dean, Walton College of Business, University of Arkansas and E.J. Ourso College of Business, Louisiana State University; Director, Arvest Bank | | 241 | | Insperity, Inc. (formerly known as Administaff) (human resources provider) |
Elizabeth Krentzman3 — 1959 Trustee | | 2019 | | Formerly: Principal and Chief Regulatory Advisor for Asset Management Services and U.S. Mutual Fund Leader of Deloitte & Touche LLP; General Counsel of the Investment Company Institute (trade association); National Director of the Investment Management Regulatory Consulting Practice, Principal, Director and Senior Manager of Deloitte & Touche LLP; Assistant Director of the Division of Investment Management — Office of Disclosure and Investment Adviser Regulation of the U.S. Securities and Exchange Commission and various positions with the Division of Investment Management — Office of Regulatory Policy of the U.S. Securities and Exchange Commission; Associate at Ropes & Gray LLP; Advisory Board Member of the Securities and Exchange Commission Historical Society; and Trustee of certain Oppenheimer Funds | | 225 | | Trustee of the University of Florida National Board Foundation and Audit Committee Member; Member of the Cartica Funds Board of Directors (private investment funds); Member of the University of Florida Law Center Association, Inc. Board of Trustees and Audit Committee Member |
Anthony J. LaCava, Jr. — 1956 Trustee | | 2019 | | Formerly: Director and Member of the Audit Committee, Blue Hills Bank (publicly traded financial institution) and Managing Partner, KPMG LLP | | 241 | | Blue Hills Bank; Chairman, Bentley University; Member, Business School Advisory Council; and Nominating Committee, KPMG LLP |
Prema Mathai-Davis — 1950 Trustee | | 2003 | | Retired Co-Owner & Partner of Quantalytics Research, LLC, (a FinTech Investment Research Platform for the Self-Directed Investor) | | 241 | | None |
| 3 | Mss. Brown and Krentzman and Messrs. Motley, Vandivort and Vaughn were appointed as Trustees of the Trust effective June 10, 2019. |
T-2 Invesco Dividend Income Fund
Trustees and Officers—(continued)
| | | | | | | | |
Name, Year of Birth and
Position(s) Held with the Trust | | Trustee and/
or Officer Since | | Principal Occupation(s)
During Past 5 Years | | Number of Funds in Fund
Complex
Overseen by
Trustee | | Other Directorship(s)
Held by Trustee During
Past 5 Years |
| Independent Trustees—(continued) |
Joel W. Motley3 — 1952 Trustee | | 2019 | | Director of Office of Finance, Federal Home Loan Bank; Member of the Vestry of Trinity Wall Street; Managing Director of Carmona Motley Inc. (privately held financial advisor); Member of the Finance and Budget Committee of the Council on Foreign Relations, Member of the Investment Committee and Board of Human Rights Watch and Member of the Investment Committee and Board of Historic Hudson Valley(non-profit cultural organization) Formerly: Managing Director of Public Capital Advisors, LLC (privately held financial advisor); Managing Director of Carmona Motley Hoffman, Inc. (privately held financial advisor); Trustee of certain Oppenheimer Funds; and Director of Columbia Equity Financial Corp. (privately held financial advisor) | | 225 | | Director of Greenwall Foundation (bioethics research foundation); Member of Board and Investment Committee of The Greenwall Foundation; Director of Southern Africa Legal Services Foundation; Board Member and Investment Committee Member of Pulitzer Center for Crisis Reporting(non-profit journalism) |
Teresa M. Ressel — 1962 Trustee | | 2017 | | Non-executive director and trustee of a number of public and private business corporations Formerly: Chief Financial Officer, Olayan America, The Olayan Group (international investor/commercial/industrial); Chief Executive Officer, UBS Securities LLC; Group Chief Operating Officer, Americas, UBS AG; Assistant Secretary for Management & Budget and CFO, US Department of the Treasury | | 241 | | Atlantic Power Corporation (power generation company); ON Semiconductor Corp. (semiconductor supplier) |
Ann Barnett Stern — 1957 Trustee | | 2017 | | President and Chief Executive Officer, Houston Endowment Inc. (private philanthropic institution) Formerly: Executive Vice President and General Counsel, Texas Children’s Hospital; Attorney, Beck, Redden and Secrest, LLP; Business Law Instructor, University of St. Thomas; Attorney, Andrews & Kurth LLP | | 241 | | Federal Reserve Bank of Dallas |
Raymond Stickel, Jr. — 1944 Trustee | | 2005 | | Retired Formerly: Director, Mainstay VP Series Funds, Inc. (25 portfolios); Partner, Deloitte & Touche | | 241 | | None |
Robert C. Troccoli — 1949 Trustee | | 2016 | | Adjunct Professor, University of Denver — Daniels College of Business Formerly: Senior Partner, KPMG LLP | | 241 | | None |
Daniel S. Vandivort3 — 1954 Trustee | | 2019 | | Treasurer, Chairman of the Audit and Finance Committee, and Trustee, Board of Trustees, Huntington Disease Foundation of America; and President, Flyway Advisory Services LLC (consulting and property management) Formerly: Trustee and Governance Chair, of certain Oppenheimer Funds | | 225 | | Chairman and Lead Independent Director, Chairman of the Audit Committee, and Director, Board of Directors, Value Line Funds |
James D. Vaughn3 — 1945 Trustee | | 2019 | | Retired Formerly: Managing Partner, Deloitte & Touche LLP; Trustee and Chairman of the Audit Committee, Schroder Funds; Board Member, Mile High United Way, Boys and Girls Clubs, Boy Scouts, Colorado Business Committee for the Arts, Economic Club of Colorado and Metro Denver Network (economic development corporation); and Trustee of certain Oppenheimer Funds | | 225 | | Board member and Chairman of Audit Committee of AMG National Trust Bank; Trustee and Investment Committee member, University of South Dakota Foundation; Board member, Audit Committee Member and past Board Chair, Junior Achievement(non-profit) |
Christopher L. Wilson — 1957 Trustee and Vice Chair | | 2017 | | Non-executive director and trustee of a number of public and private business corporations Formerly: Director, TD Asset Management USA Inc. (mutual fund complex) (22 portfolios); Managing Partner, CT2, LLC (investing and consulting firm); President/Chief Executive Officer, Columbia Funds, Bank of America Corporation; President/Chief Executive Officer, CDC IXIS Asset Management Services, Inc.; Principal & Director of Operations, Scudder Funds, Scudder, Stevens & Clark, Inc.; Assistant Vice President, Fidelity Investments | | 241 | | ISO New England, Inc.(non-profit organization managing regional electricity market) |
| Other Officers | | | | | | | | |
Sheri Morris — 1964 President, Principal Executive Officer and Treasurer | | 2003 | | President, Principal Executive Officer and Treasurer, The Invesco Funds; Vice President, Invesco Advisers, Inc. (formerly known as Invesco Institutional (N.A.), Inc.) (registered investment adviser); and Vice President, Invesco Exchange-Traded Fund Trust, Invesco Exchange-Traded Fund Trust II, Invesco India Exchange-Traded Fund Trust, Invesco Actively Managed Exchange-Traded Fund Trust, Invesco Actively Managed Exchange-Traded Commodity Fund Trust and Invesco Exchange-Traded Self-Indexed Fund Trust Formerly: Vice President and Principal Financial Officer, The Invesco Funds; Vice President, Invesco AIM Advisers, Inc., Invesco AIM Capital Management, Inc. and Invesco AIM Private Asset Management, Inc.; Assistant Vice President and Assistant Treasurer, The Invesco Funds and Assistant Vice President, Invesco Advisers, Inc., Invesco AIM Capital Management, Inc. and Invesco AIM Private Asset Management, Inc.; and Treasurer, Invesco Exchange-Traded Fund Trust, Invesco Exchange-Traded Fund Trust II, Invesco India Exchange-Traded Fund Trust and Invesco Actively Managed Exchange-Traded Fund Trust | | N/A | | N/A |
Russell C. Burk — 1958 Senior Vice President and Senior Officer | | 2005 | | Senior Vice President and Senior Officer, The Invesco Funds | | N/A | | N/A |
| 3 | Mss. Brown and Krentzman and Messrs. Motley, Vandivort and Vaughn were appointed as Trustees of the Trust effective June 10, 2019. |
T-3 Invesco Dividend Income Fund
Trustees and Officers—(continued)
| | | | | | | | |
Name, Year of Birth and
Position(s) Held with the Trust | | Trustee and/
or Officer Since | | Principal Occupation(s)
During Past 5 Years | | Number of Funds in Fund
Complex
Overseen by
Trustee | | Other Directorship(s)
Held by Trustee During
Past 5 Years |
| Other Officers—(continued) | | | | | | | | |
Jeffrey H. Kupor — 1968 Senior Vice President, Chief Legal Officer and Secretary | | 2018 | | Head of Legal of the Americas, Invesco Ltd.; Senior Vice President and Secretary, Invesco Advisers, Inc. (formerly known as Invesco Institutional (N.A.), Inc.) (registered investment adviser); Senior Vice President and Secretary, Invesco Distributors, Inc. (formerly known as Invesco AIM Distributors, Inc.); Vice President and Secretary, Invesco Investment Services, Inc. (formerly known as Invesco AIM Investment Services, Inc.) Senior Vice President, Chief Legal Officer and Secretary, The Invesco Funds; Secretary and General Counsel, Invesco Investment Advisers LLC (formerly known as Van Kampen Asset Management); Secretary and General Counsel, Invesco Capital Markets, Inc. (formerly known as Van Kampen Funds Inc.) and Chief Legal Officer, Invesco Exchange-Traded Fund Trust, Invesco Exchange-Traded Fund Trust II, Invesco India Exchange-Traded Fund Trust, Invesco Actively Managed Exchange-Traded Fund Trust, Invesco Actively Managed Exchange-Traded Commodity Fund Trust and Invesco Exchange-Traded Self-Indexed Fund Trust; Secretary, Invesco Indexing LLC; Secretary, W.L. Ross & Co., LLC; Secretary and Vice President, Jemstep, Inc. Formerly: Head of Legal, Worldwide Institutional, Invesco Ltd.; Secretary and General Counsel, INVESCO Private Capital Investments, Inc.; Senior Vice President, Secretary and General Counsel, Invesco Management Group, Inc. (formerly known as Invesco AIM Management Group, Inc.); Assistant Secretary, INVESCO Asset Management (Bermuda) Ltd.; Secretary and General Counsel, Invesco Private Capital, Inc.; Assistant Secretary and General Counsel, INVESCO Realty, Inc.; Secretary and General Counsel, Invesco Senior Secured Management, Inc.; and Secretary, Sovereign G./P. Holdings Inc. | | N/A | | N/A |
Andrew R. Schlossberg — 1974 Senior Vice President | | 2019 | | Head of the Americas and Senior Managing Director, Invesco Ltd.; Director and Senior Vice President, Invesco Advisers, Inc. (formerly known as Invesco Institutional (N.A.), Inc.) (registered investment adviser); Director and Chairman, Invesco Investment Services, Inc. (formerly known as Invesco AIM Investment Services, Inc.) (registered transfer agent); Senior Vice President, The Invesco Funds; Director, Invesco Investment Advisers LLC (formerly known as Van Kampen Asset Management) and Invesco UK Limited; Director, President and Chairman, Invesco Insurance Agency, Inc.; Director and Chief Executive, Invesco Asset Management Limited and Invesco Fund Managers Limited Formerly: Assistant Vice President, The Invesco Funds; Senior Vice President, Invesco Advisers, Inc. (formerly known as Invesco Institutional (N.A.), Inc.) (registered investment adviser); Director and Chief Executive, Invesco Administration Services Limited and Invesco Global Investment Funds Limited; Director, Invesco Distributors, Inc.; Head of EMEA, Invesco Ltd.; President, Invesco Actively Managed Exchange-Traded Commodity Fund Trust, Invesco Actively Managed Exchange-Traded Fund Trust, Invesco Exchange-Traded Fund Trust, Invesco Exchange-Traded Fund Trust II and Invesco India Exchange-Traded Fund Trust; Managing Director and Principal Executive Officer, Invesco Capital Management LLC | | N/A | | N/A |
John M. Zerr — 1962 Senior Vice President | | 2006 | | Chief Operating Officer of the Americas; Senior Vice President, Invesco Advisers, Inc. (formerly known as Invesco Institutional (N.A.), Inc.) (registered investment adviser); Senior Vice President, Invesco Distributors, Inc. (formerly known as Invesco AIM Distributors, Inc.); Director and Vice President, Invesco Investment Services, Inc. (formerly known as Invesco AIM Investment Services, Inc.) Senior Vice President, The Invesco Funds; Managing Director, Invesco Capital Management LLC; Director, Invesco Investment Advisers LLC (formerly known as Van Kampen Asset Management); Senior Vice President, Invesco Capital Markets, Inc. (formerly known as Van Kampen Funds Inc.); Manager, Invesco Indexing LLC; Director and Senior Vice President, Invesco Insurance Agency, Inc.; Invesco Canada Funds Advisory Board Member; Director, President Chief Executive Officer, Invesco Corporate Class Inc. (corporate mutual fund company); and Director, Chairman, President and Chief Executive Officer, Invesco Canada Ltd. (formerly known as Invesco Trimark Ltd./Invesco Trimark Ltèe) (registered investment adviser and registered transfer agent) Formerly: Director and Senior Vice President, Invesco Management Group, Inc. (formerly known as Invesco AIM Management Group, Inc.); Secretary and General Counsel, Invesco Management Group, Inc. (formerly known as Invesco AIM Management Group, Inc.); Secretary, Invesco Investment Services, Inc. (formerly known as Invesco AIM Investment Services, Inc.); Chief Legal Officer and Secretary, The Invesco Funds; Secretary and General Counsel, Invesco Investment Advisers LLC (formerly known as Van Kampen Asset Management); Secretary and General Counsel, Invesco Capital Markets, Inc. (formerly known as Van Kampen Funds Inc.); Chief Legal Officer, Invesco Exchange-Traded Fund Trust, Invesco Exchange-Traded Fund Trust II, Invesco India Exchange-Traded Fund Trust, Invesco Actively Managed Exchange-Traded Fund Trust, Invesco Actively Managed Exchange-Traded Commodity Fund Trust and Invesco Exchange-Traded Self-Indexed Fund Trust; Secretary, Invesco Indexing LLC; Director, Secretary, General Counsel and Senior Vice President, Van Kampen Exchange Corp.; Director, Vice President and Secretary, IVZ Distributors, Inc. (formerly known as INVESCO Distributors, Inc.); Director and Vice President, INVESCO Funds Group, Inc.; Director and Vice President, Van Kampen Advisors Inc.; Director, Vice President, Secretary and General Counsel, Van Kampen Investor Services Inc.; Director and Secretary, Invesco Distributors, Inc. (formerly known as Invesco AIM Distributors, Inc.); Director, Senior Vice President, General Counsel and Secretary, Invesco AIM Advisers, Inc. and Van Kampen Investments Inc.; Director, Vice President and Secretary, Fund Management Company; Director, Senior Vice President, Secretary, General Counsel and Vice President, Invesco AIM Capital Management, Inc.; Chief Operating Officer and General Counsel, Liberty Ridge Capital, Inc. (an investment adviser) | | N/A | | N/A |
T-4 Invesco Dividend Income Fund
Trustees and Officers—(continued)
| | | | | | | | |
Name, Year of Birth and
Position(s) Held with the Trust | | Trustee and/
or Officer Since | | Principal Occupation(s)
During Past 5 Years | | Number of Funds in Fund
Complex
Overseen by
Trustee | | Other Directorship(s)
Held by Trustee During
Past 5 Years |
| Other Officers—(continued) | | | | | | | | |
Gregory G. McGreevey — 1962 Senior Vice President | | 2012 | | Senior Managing Director, Invesco Ltd.; Director, Chairman, President, and Chief Executive Officer, Invesco Advisers, Inc. (formerly known as Invesco Institutional (N.A.), Inc.) (registered investment adviser); Director, Invesco Mortgage Capital, Inc. and Invesco Senior Secured Management, Inc.; and Senior Vice President, The Invesco Funds Formerly: Senior Vice President, Invesco Management Group, Inc. and Invesco Advisers, Inc.; Assistant Vice President, The Invesco Funds | | N/A | | N/A |
Kelli Gallegos — 1970 Vice President, Principal Financial Officer and Assistant Treasurer | | 2008 | | Assistant Treasurer, Invesco Specialized Products, LLC; Vice President, Principal Financial Officer and Assistant Treasurer, The Invesco Funds; Principal Financial and Accounting Officer — Pooled Investments, Invesco Capital Management LLC; Vice President and Treasurer, Invesco Exchange-Traded Fund Trust, Invesco Exchange-Traded Fund Trust II, Invesco India Exchange-Traded Fund Trust, Invesco Actively Managed Exchange-Traded Fund Trust, Invesco Actively Managed Exchange-Traded Commodity Fund Trust and Invesco Exchange-Traded Self-Indexed Fund Trust Formerly: Assistant Treasurer, Invesco Exchange-Traded Fund Trust, Invesco Exchange-Traded Fund Trust II, Invesco India Exchange-Traded Fund Trust, Invesco Actively Managed Exchange-Traded Fund Trust, Invesco Actively Managed Exchange-Traded Commodity Fund Trust and Invesco Exchange-Traded Self-Indexed Fund Trust; Assistant Treasurer, Invesco Capital Management LLC; Assistant Vice President, The Invesco Funds | | N/A | | N/A |
Crissie M. Wisdom — 1969 Anti-Money Laundering Compliance Officer | | 2013 | | Anti-Money Laundering Compliance Officer, Invesco Advisers, Inc. (formerly known as Invesco Institutional (N.A.), Inc.) (registered investment adviser), Invesco Capital Markets, Inc. (formerly known as Van Kampen Funds Inc.), Invesco Distributors, Inc., Invesco Investment Services, Inc., The Invesco Funds, and Invesco Exchange-Traded Fund Trust, Invesco Exchange-Traded Fund Trust II, Invesco India Exchange-Traded Fund Trust, Invesco Actively Managed Exchange-Traded Fund Trust, Invesco Actively Managed Exchange-Traded Commodity Fund Trust and Invesco Exchange-Traded Self-Indexed Fund Trust; Anti-Money Laundering Compliance Officer and Bank Secrecy Act Officer, INVESCO National Trust Company and Invesco Trust Company; and Fraud Prevention Manager and Controls and Risk Analysis Manager for Invesco Investment Services, Inc. Formerly: Anti-Money Laundering Compliance Officer, Van Kampen Exchange Corp. and Invesco Management Group, Inc. | | N/A | | N/A |
Robert R. Leveille — 1969 Chief Compliance Officer | | 2016 | | Chief Compliance Officer, Invesco Advisers, Inc. (registered investment adviser); and Chief Compliance Officer, The Invesco Funds Formerly: Chief Compliance Officer, Putnam Investments and the Putnam Funds | | N/A | | N/A |
The Statement of Additional Information of the Trust includes additional information about the Fund’s Trustees and is available upon request, without charge, by calling 1.800.959.4246. Please refer to the Fund’s Statement of Additional Information for information on the Fund’ssub-advisers.
| | | | | | |
Office of the Fund 11 Greenway Plaza, Suite 1000 Houston, TX 77046-1173 | | Investment Adviser Invesco Advisers, Inc. 1555 Peachtree Street, N.E. Atlanta, GA 30309 | | Distributor Invesco Distributors, Inc. 11 Greenway Plaza, Suite 1000 Houston, TX 77046-1173 | | Auditors PricewaterhouseCoopers LLP 1000 Louisiana Street, Suite 5800 Houston, TX 77002-5021 |
| | | |
| | | | | | |
Counsel to the Fund Stradley Ronon Stevens & Young, LLP 2005 Market Street, Suite 2600 Philadelphia, PA 19103-7018 | | Counsel to the Independent Trustees Goodwin Procter LLP 901 New York Avenue, N.W. Washington, D.C. 20001 | | Transfer Agent Invesco Investment Services, Inc. 11 Greenway Plaza, Suite 1000 Houston, TX 77046-1173 | | Custodian State Street Bank and Trust Company 225 Franklin Street Boston, MA 02110-2801 |
T-5 Invesco Dividend Income Fund
(This page intentionally left blank)
(This page intentionally left blank)
Go paperless with eDelivery
Visit invesco.com/edelivery to enjoy the convenience and security of anytime electronic access to your investment documents.
With eDelivery, you can elect to have any or all of the following materials delivered straight to your inbox to download, save and print from your own computer:
| • | Fund reports and prospectuses |
| • | Quarterly statements |
| • | Daily confirmations |
| • | Tax forms |
Invesco mailing information
Send general correspondence to Invesco Investment Services, Inc., P.O. Box 219078, Kansas City, MO 64121-9078.
Important notice regarding delivery of security holder documents
To reduce Fund expenses, only one copy of most shareholder documents may be mailed to shareholders with multiple accounts at the same address (Householding). Mailing of your shareholder documents may be householded indefinitely unless you instruct us otherwise. If you do not want the mailing of these documents to be combined with those for other members of your household, please contact Invesco Investment Services, Inc. at 800 959 4246 or contact your financial institution. We will begin sending you individual copies for each account within 30 days after receiving your request.
Fund holdings and proxy voting information
The Fund provides a complete list of its holdings four times in each fiscal year, at the quarter-ends. For the second and fourth quarters, the list appears in the Fund’s semiannual and annual reports to shareholders. For the first and third quarters, the Fund files the lists with the Securities and Exchange Commission (SEC) on Form N-Q (or any successor Form). The most recent list of portfolio holdings is available at invesco.com/completeqtrholdings. Shareholders can also look up the Fund’s Form N-Q (or any successor Form) filings on the SEC website, sec.gov. The SEC file numbers for the Fund are shown below.
A description of the policies and procedures that the Fund uses to determine how to vote proxies relating to portfolio securities is available without charge, upon request, from our Client Services department at 800 959 4246, or at invesco.com/proxyguidelines. The information is also available on the SEC website, sec.gov.
Information regarding how the Fund voted proxies related to its portfolio securities during the most recent 12-month period ended June 30 is available at invesco.com/proxysearch. This information is also available on the SEC website, sec.gov.
Invesco Advisers, Inc. is an investment adviser; it provides investment advisory services to individual and institutional clients and does not sell securities. Invesco Distributors, Inc. is the US distributor for Invesco Ltd.’s retail mutual funds, exchange-traded funds and institutional money market funds. Both are wholly owned, indirect subsidiaries of Invesco Ltd.
| SEC file numbers: 811-03826 and 002-85905 | Invesco Distributors, Inc. | I-DIVI-AR-1 |
| Annual Report to Shareholders | April 30, 2019 |
Invesco Energy Fund
Nasdaq:
A: IENAX ■ C: IEFCX ■ Y: IENYX ■ Investor: FSTEX ■ R5: IENIX ■ R6: IENSX

Beginning on January 1, 2021, as permitted by regulations adopted by the Securities and Exchange Commission, paper copies of the Fund’s shareholder reports will no longer be sent by mail, unless you specifically request paper copies of the reports from the Fund or from your financial intermediary, such as a broker-dealer or bank. Instead, the reports will be made available on the Fund’s website, and you will be notified by mail each time a report is posted and provided with a website link to access the report.
If you already elected to receive shareholder reports electronically, you will not be affected by this change and you need not take any action. You may elect to receive shareholder reports and other communications from the Fund electronically by contacting your financial intermediary (such as a broker-dealer or bank) or, if you are a direct investor, by enrolling at invesco.com/edelivery.
You may elect to receive all future reports in paper free of charge. If you invest through a financial intermediary, you can contact your financial intermediary to request that you continue to receive paper copies of your shareholder reports. If you invest directly with the Fund, you can call (800) 959-4246 to let the Fund know you wish to continue receiving paper copies of your shareholder reports. Your election to receive reports in paper will apply to all funds held with your financial intermediary or all funds held with the fund complex if you invest directly with the Fund.
Dear Shareholders:
This annual report includes information about your Fund, including performance data and a complete list of its investments as of the close of the reporting period. Inside is a discussion of how your Fund was managed and the factors that affected its performance during the reporting period.
Philip Taylor, whose messages to shareholders have appeared here for the last 13 years, transitioned to a senior advisory role on March 1, prior to his retirement at the end of the year, and I assumed his role as Head of the Americas and Senior Managing Director, Invesco Ltd. All of us at Invesco are indebted to Phil for his many years of dedicated service to the company and to its funds’ shareholders. I’m excited about this new opportunity, and I look forward to communicating with fund shareholders going forward.
Investor sentiment during the reporting period ranged from elation to fear, notably in the fourth quarter of 2018. Amid corporate tax cuts and improving global growth, several US equity indexes redefined highs during the first half of the reporting period. The exuberance, however, ended in October as global equities, in particular US stocks, sold off, with the sharpest decline in December of 2018. The catalyst for the sell-off was a combination of ongoing trade concerns between the US and China, fears of a global economic slowdown and lower oil prices from a supply glut. Gains posted earlier in the year for global equities were erased, while US Treasury bonds, along with government and municipal bonds, rallied as investors fled to “safe haven” assets. The reporting period ended on a positive note, however, as global equities bounced back strongly at the outset of 2019, with the US stock market reaching new highs by the period end. Given the strong economy during the reporting period, the US Federal Reserve (the Fed) raised the federal funds rate three times. At its December 2018 meeting, however, the Fed delivered a more “dovish stance” by simultaneously raising rates while reducing guidance for 2019 rate increases. As the fiscal year ended, the Fed had thus far left rates unchanged in 2019. As 2019 unfolds, we’ll see how the interplay of interest rates, economic data, geopolitics and a host of other factors affect US and overseas equity and fixed income markets.
Investor uncertainty and market volatility, such as we witnessed during the reporting period, are unfortunate facts of life when it comes to investing. That’s why Invesco encourages investors to work with a professional financial adviser who can stress the importance of starting to save and invest early and the importance of adhering to a disciplined investment plan. A financial adviser who knows your unique financial situation, investment goals and risk tolerance can be an invaluable partner as you seek to achieve your financial goals. He or she can offer a long-term perspective when markets are volatile and time-tested advice and guidance when your financial situation or investment goals change.
Visit our website for more information on your investments
Our website, invesco.com/us, offers a wide range of market insights and investment perspectives. On the website, you’ll find detailed information about our funds, including performance, holdings and portfolio manager commentaries. You can access information about your account by completing a simple, secure online registration. To do so, select “Log In” on the right side of the homepage, and then select “Register for Individual Account Access.”
In addition to the resources accessible on our website and through our mobile app, you can obtain timely updates to help you stay informed about the markets and the economy by connecting with Invesco on Twitter, LinkedIn or Facebook. You can access our blog at blog.invesco.us.com. Our goal is to provide you the information you want, when and where you want it.
Finally, I’m pleased to share with you Invesco’s commitment to both the Principles for Responsible Investment and to considering environmental, social and governance issues in our robust investment process. I invite you to learn more at invesco.com/esg.
Have questions?
For questions about your account, contact an Invesco client services representative at 800 959 4246.
All of us at Invesco look forward to serving your investment management needs. Thank you for investing with us.
Sincerely,
Andrew Schlossberg
Head of the Americas,
Senior Managing Director, Invesco Ltd.
Dear Shareholders:
Among the many important lessons I’ve learned in more than 40 years in a variety of business endeavors is the value of a trusted advocate.
As independent chair of the Invesco Funds Board, I can assure you that the members of the Board are strong advocates for the interests of investors in Invesco’s mutual funds. We work hard to represent your interests through oversight of the quality of the investment management services your funds receive and other matters important to your investment, including but not limited to:
| ■ | Ensuring that Invesco offers a diverse lineup of mutual funds that your financial adviser can use to strive to meet your financial needs as your investment goals change over time. |
| ■ | Monitoring how the portfolio management teams of the Invesco funds are performing in light of changing economic and market conditions. |
| ■ | Assessing each portfolio management team’s investment performance within the context of the investment strategy described in the fund’s prospectus. |
| ■ | Monitoring for potential conflicts of interests that may impact the nature of the services that your funds receive. |
We believe one of the most important services we provide our fund shareholders is the annual review of the funds’ advisory and sub-advisory contracts with Invesco Advisers and its affiliates. This review is required by the Investment Company Act of 1940 and focuses on the nature and quality of the services Invesco provides as the adviser to the Invesco funds and the reasonableness of the fees that it charges for those services. Each year, we spend months carefully reviewing information received from Invesco and a variety of independent sources, such as performance and fee data prepared by Lipper, Inc. (a subsidiary of Broadridge Financial Solutions, Inc.), an independent, third-party firm widely recognized as a leader in its field. We also meet with our independent legal counsel and other independent advisers to review and help us assess the information that we have received. Our goal is to assure that you receive quality investment management services for a reasonable fee.
I trust the measures outlined above provide assurance that you have a worthy advocate when it comes to choosing the Invesco Funds.
As always, please contact me at bruce@brucecrockett.com with any questions or concerns you may have. On behalf of the Board, we look forward to continuing to represent your interests and serving your needs.
Sincerely,
Bruce L. Crockett
Independent Chair
Invesco Funds Board of Trustees
Management’s Discussion of Fund Performance
Performance summary
For the fiscal year ended April 30, 2019, Class A shares of Invesco Energy Fund (the Fund), at net asset value (NAV), underperformed the MSCI World Energy Index, the Fund’s style-specific benchmark.
Your Fund’s long-term performance appears later in this report.
Fund vs. Indexes
Total returns, April 30, 2018 to April 30, 2019, at net asset value (NAV). Performance shown does not include applicable contingent deferred sales charges (CDSC) or front-end sales charges, which would have reduced performance.
| Class A Shares | –16.48% |
| Class C Shares | –17.14 |
| Class Y Shares | –16.29 |
| Investor Class Shares | –16.47 |
| Class R5 Shares | –16.12 |
| Class R6 Shares | –16.15 |
| S&P 500 Index▼ (Broad Market Index) | 13.49 |
MSCI World Energy Index■
(Style-Specific Index) | –6.57 |
Lipper Natural Resource Funds Index♦
(Peer Group Index) | –16.16 |
| Source(s):▼FactSet Research Systems Inc.;■ RIMES Technologies Corp.;♦ Lipper Inc. |
region posted gains. US and Chinese equities also delivered robust gains. Both emerging and developed markets had positive returns for the first quarter of 2019.
Despite concerns over a decline in global growth for 2019,1 global equity indexes, in general, ended the fiscal year in positive territory, with developed markets outperforming emerging markets.
Crude oil prices were quite volatile throughout the fiscal year, ending slightly lower than where they began. Brent and West Texas Intermediate oil prices declined from $73.13 and $67.25 per barrel to $72.80 and $63.91 per barrel, respectively, and averaged $70.85 and $62.76 per barrel, respectively. Prices were trending upwards until the end of the third quarter of 2018, but steeply declined during the fourth quarter of 2018 due to concerns of excessive supply and tapered demand. The first quarter of 2019 did see some recovery in prices as global supplies tightened, however, this was not enough to offset earlier declines. Natural gas prices averaged $3.07 per thousand cubic feet for the fiscal year, but declined overall from $2.80 per thousand cubic feet at the beginning of the fiscal year to $2.58 per thousand cubic feet by the end of the fiscal year.2 While energy stocks, as a group, fell over the fiscal year, a disconnect between energy stocks and oil prices was evident, as energy equities experienced greater declines relative to oil prices.
The Fund underperformed its style-specific benchmark, the MSCI World Energy Index, for the fiscal year as a result of security selection in and overweight exposure to the oil and gas equipment and services industry. Additionally, the lack of exposure to the oil and gas storage and transportation industry, which
Market conditions and your Fund
The fiscal year began with significant market and currency volatility. While most domestic equity indexes delivered positive performance at the beginning of the fiscal year, most major international indexes had negative results. Many international stocks struggled as investors worried that heightened global trade tensions would derail economic growth. Other concerns, such as geopolitical uncertainty and the potential impact of higher interest rates, also weakened investor sentiment. In this environment, developed markets held up better than emerging markets. After a relatively quiet summer, market volatility markedly rose again in October 2018. Global equity markets (particularly the US) declined sharply in the fourth quarter of 2018 amid rising interest rates and concerns that higher inflation could result in a more restrictive monetary policy. Inves-
| Portfolio Composition |
| By industry % of total net assets |
| Oil & Gas Exploration & Production | 39.35% |
| Integrated Oil & Gas | 34.67 |
| Oil & Gas Equipment & Services | 11.87 |
| Oil & Gas Drilling | 3.87 |
| Oil & Gas Refining & Marketing | 3.31 |
| Diversified Metals & Mining | 2.71 |
| Other Sectors, Each Less than 2% of Net Assets | 3.54 |
| Money Market Funds Plus Other Assets Less Liabilities | 0.68 |
tors also had concerns over the Brexit negotiations, ongoing US-China trade tensions, declining oil prices and fears of slowing economic growth, particularly in the eurozone.
Following the sharp sell-off in the later part of 2018, global equities rebounded in the beginning of 2019, fueled by accommodative central bank policy and potential for a US-China trade deal. Central bank policy provided a supportive environment for equities and fixed income, even as global economic growth appeared to be slowing. In January, China’s central bank initiated a stimulus program to counteract its slowing economy, while the European Central Bank and US Federal Reserve later indicated they would not raise interest rates for the remainder of 2019. Lack of consensus on a deal for the UK’s withdrawal from the European Union prompted additional concerns for the UK and eurozone economies, though equity markets across the
| Top 10 Equity Holdings* |
| % of total net assets |
| 1. | Noble Energy, Inc. | 6.31% |
| 2. | BP PLC, ADR | 6.19 |
| 3. | Royal Dutch Shell PLC, Class A, ADR | 6.13 |
| 4. | Chevron Corp. | 6.01 |
| 5. | Suncor Energy, Inc. | 5.84 |
| 6. | Canadian Natural Resources Ltd. | 5.83 |
| 7. | Hess Corp. | 4.98 |
| 8. | Exxon Mobil Corp. | 4.73 |
| 9. | PrairieSky Royalty Ltd. | 4.10 |
| 10. | Devon Energy Corp. | 3.95 |
| Total Net Assets | $ 424.2 million |
| Total Number of Holdings* | 38 |
| The Fund’s holdings are subject to change, and there is no assurance that the Fund will continue to hold any particular security. |
| *Excluding money market fund holdings. |
| Data presented here are as of April 30, 2019. |
outperformed the style-specific benchmark, also detracted from the Fund’s relative performance over the fiscal year. Conversely, underweight exposure to the oil and gas refining and marketing industry benefited relative performance, as it poorly performed within the style-specific benchmark.
Top individual detractors from the Fund’s absolute performance for the fiscal year includedRange Resources andSuperior Energy Services. Range Resources, an independent oil and gas exploration and production (E&P) company, saw its shares decline as a result of weakness in natural gas prices. Given the company’s premium land position in the Marcellus Shale, we still felt comfortable with the upside return potential from where the stock was traded at the close of the fiscal year. Shares of Superior Energy Services declined during the fiscal year due to the company’s exposure to the North American fracturing and well stimulation business. The company’s earnings and cash flow profile have been volatile the last few years due to the significant declines in capital expenditures from the E&P customer base. The shares underperformed during the fiscal year, but we still saw significant value in certain business lines that Superior Energy Services operates in despite having a high degree of financial leverage on the balance sheet.
During the fiscal year, top individual contributors to the Fund’s absolute performance includedHess andWhiting Petroleum. Hess added to its long-term value due to its continued success in Guyana. The company remains focused on executing on its two core areas — the Bakken region and Guyana. We believe that significant upside potential remains in our favor. Shares of Whiting Petroleum rose in the earlier part of the fiscal year due to a combination of rising crude oil prices, new management and a more focused capital allocation strategy. We sold our position in Whiting Petroleum after it reached its valuation. The stock was a good example of the disconnect between oil price movements and energy company stock prices, as Whiting Petroleum’s stock had previously traded at a significant discount to the company’s net asset value despite favorable fundamentals.
At the end of the fiscal year, the Fund was overweight in the independent E&P, oilfield equipment and services, and drilling industries relative to the style-specific benchmark. This positioning reflects our opinion of the areas with the best upside
potential. Conversely, the Fund had significant underweight exposures to the integrated oil and gas and the oil and gas storage and transportation industries and had no exposure to the coal and consumable fuels industry.
With the recovery in oil prices, at the end of the fiscal year, it was our view that the industry still required a higher commodity price level in order to encourage reinvestment in the business. At the close of the fiscal year, we saw a significant disconnect in the underlying cash flow generation capabilities of companies within the Fund relative to their current stock price. This was evident in the many holdings that experienced share buybacks and dividend increases over the course of the last fiscal year. Overall, we believe E&P companies are spending prudently in the current oil environment and the price-to-cash flow multiples are cheap compared to historical levels. Further, if there is a shift to higher spending in the energy sector, we believe the service companies will benefit due to their pricing power.
We continue to focus on companies with high-quality assets and high free cash flow, led by capable management teams. We have used market volatility to increase the Fund’s core positions, and we’ve positioned the Fund for a return to an appreciation of long-term company fundamentals.
While oil prices may be headline news, the Fund should be considered a long-term investment. As always, thank you for your continued investment in Invesco Energy Fund.
1 Source: International Monetary Fund World
2 Source: Bloomberg
The views and opinions expressed in management’s discussion of Fund performance are those of Invesco Advisers, Inc. These views and opinions are subject to change at any time based on factors such as market and economic conditions. These views and opinions may not be relied upon as investment advice or recommendations, or as an offer for a particular security. The information is not a complete analysis of every aspect of any market, country, industry, security or the Fund. Statements of fact are from sources considered reliable, but Invesco Advisers, Inc. makes no representation or warranty as to their completeness or accuracy. Although historical performance is no guarantee of future results, these insights may help you understand our investment management philosophy.
See important Fund and, if applicable, index disclosures later in this report.
Norman MacDonald
Chartered Financial Analyst, Portfolio Manager, is manager of Invesco Energy Fund. He joined Invesco in 2008. Mr. MacDonald earned a Bachelor of Commerce from the University of Windsor.
Your Fund’s Long-Term Performance
Results of a $10,000 Investment — Oldest Share Class(es)
Fund and index data from 4/30/09
| 1 | Source: FactSet Research Systems Inc. |
| 2 | Source: RIMES Technologies Corp. |
| 3 | Source: Lipper Inc. |
| 4 | It is Invesco’s policy to chart the Fund’s oldest share class(es). Because Investor Class shares do not have a sales charge, we also show the oldest share class with a sales charge, Class C shares. |
Past performance cannot guarantee comparable future results.
The data shown in the chart include reinvested distributions, applicable sales charges and Fund expenses including
management fees. Index results include reinvested dividends, but they do not reflect sales charges. Performance of the peer group, if applicable, reflects fund expenses and management fees; perfor-
mance of a market index does not. Performance shown in the chart and table(s) does not reflect deduction of taxes a shareholder would pay on Fund distributions or sale of Fund shares.
| Average Annual Total Returns |
| As of 4/30/19, including maximum applicable sales charges |
| Class A Shares | |
| Inception (3/28/02) | 4.16% |
| 10 Years | –0.61 |
| 5 Years | –13.16 |
| 1 Year | –21.08 |
| Class C Shares | |
| Inception (2/14/00) | 5.66% |
| 10 Years | –0.80 |
| 5 Years | –12.83 |
| 1 Year | –17.95 |
| Class Y Shares | |
| Inception (10/3/08) | –1.20% |
| 10 Years | 0.20 |
| 5 Years | –11.95 |
| 1 Year | –16.29 |
| Investor Class Shares | |
| Inception (1/19/84) | 6.59% |
| 10 Years | –0.05 |
| 5 Years | –12.17 |
| 1 Year | –16.47 |
| Class R5 Shares | |
| Inception (1/31/06) | –0.97% |
| 10 Years | 0.35 |
| 5 Years | –11.80 |
| 1 Year | –16.12 |
| Class R6 Shares | |
| 10 Years | 0.04% |
| 5 Years | –12.01 |
| 1 Year | –16.15 |
| Performance includes litigation proceeds. Had these proceeds not been received, total returns would have been lower. |
Class R6 shares incepted on April 4, 2017. Performance shown prior to that date is that of Class A shares and includes the 12b-1 fees applicable to Class A shares.
The performance data quoted represent past performance and cannot guarantee comparable future results; current performance may be lower or higher. Please visit invesco.com/performance for the most recent month-end performance. Performance figures reflect reinvested distributions, changes in net asset value and the effect of the maximum sales charge unless otherwise stated. Investment return and principal value will fluctuate so that you may have a gain or loss when you sell shares.
The total annual Fund operating expense ratio set forth in the most recent Fund prospectus as of the date of this report for Class A, Class C,
| Average Annual Total Returns |
| As of 3/31/19, the most recent calendar quarter end, including maximum applicable sales charges |
| Class A Shares | |
| Inception (3/28/02) | 4.16% |
| 10 Years | 0.38 |
| 5 Years | –12.25 |
| 1 Year | –13.16 |
| Class C Shares | |
| Inception (2/14/00) | 5.66% |
| 10 Years | 0.19 |
| 5 Years | –11.92 |
| 1 Year | –9.70 |
| Class Y Shares | |
| Inception (10/3/08) | –1.23% |
| 10 Years | 1.20 |
| 5 Years | –11.02 |
| 1 Year | –7.85 |
| Investor Class Shares | |
| Inception (1/19/84) | 6.59% |
| 10 Years | 0.95 |
| 5 Years | –11.24 |
| 1 Year | –8.08 |
| Class R5 Shares | |
| Inception (1/31/06) | –1.00% |
| 10 Years | 1.35 |
| 5 Years | –10.88 |
| 1 Year | –7.73 |
| Class R6 Shares | |
| 10 Years | 1.04% |
| 5 Years | –11.08 |
| 1 Year | –7.67 |
| Performance includes litigation proceeds. Had these proceeds not been received, total returns would have been lower. |
Class Y, Investor Class, Class R5 and Class R6 shares was 1.33%, 2.08%, 1.08%, 1.33%, 0.91% and 0.90%, respectively. The expense ratios presented above may vary from the expense ratios presented in other sections of this report that are based on expenses incurred during the period covered by this report.
Class A share performance reflects the maximum 5.50% sales charge, and Class C share performance reflects the applicable contingent deferred sales charge (CDSC) for the period involved. The CDSC on Class C shares is 1% for the first year after purchase. Class Y, Investor Class, Class R5 and Class R6 shares do not have a front-end sales charge or a CDSC; therefore, performance is at net asset value.
The performance of the Fund’s share classes will differ primarily due to dif-
ferent sales charge structures and class expenses.
Fund performance reflects any applicable fee waivers and/or expense reimbursements. Had the adviser not waived fees and/or reimbursed expenses currently or in the past, returns would have been lower. See current prospectus for more information.
Invesco Energy Fund’s investment objective is long-term growth of capital.
| ■ | Unless otherwise stated, information presented in this report is as of April 30, 2019, and is based on total net assets. |
| ■ | Unless otherwise noted, all data provided by Invesco. |
| ■ | To access your Fund’s reports/prospectus, visit invesco.com/fundreports. |
About share classes
| ■ | Class Y sharesand Investor Class sharesare available only to certain investors. Please see the prospectus for more information. |
| ■ | Class R5 shares andClass R6 shares are available for use by retirement plans that meet certain standards and for institutional investors. Class R6 shares are also available through intermediaries that have established an agreement with Invesco Distributors, Inc. to make such shares available for use in retail omnibus accounts. Please see the prospectus for more information. |
Principal risks of investing in the Fund
| ■ | Derivatives risk. The value of a derivative instrument depends largely on (and is derived from) the value of an underlying security, currency, commodity, interest rate, index or other asset (each referred to as an underlying asset). In addition to risks relating to the underlying assets, the use of derivatives may include other, possibly greater, risks, including counterparty, leverage and liquidity risks. Counterparty risk is the risk that the counterparty to the derivative contract will default on its obligation to pay the Fund the amount owed or otherwise perform under the derivative contract. Derivatives create leverage risk because they do not require payment up front equal to the economic exposure created by holding a position in the derivative. As a result, an adverse change in the value of the underlying asset could result in the Fund sustaining a loss that is substantially greater than the amount invested in the derivative or the anticipated value of the underlying asset, which may make the Fund’s returns more volatile and increase the risk of loss. Derivative instruments may also be less liquid than more traditional investments and the Fund may be unable to sell or close out its deriva- |
| | tive positions at a desirable time or price. This risk may be more acute under adverse market conditions, during which the Fund may be most in need of liquidating its derivative positions. Derivatives may also be harder to value, less tax efficient and subject to changing government regulation that could impact the Fund’s ability to use certain derivatives or their cost. Derivatives strategies may not always be successful. For example, derivatives used for hedging or to gain or limit exposure to a particular market segment may not provide the expected benefits, particularly during adverse market conditions. |
| ■ | Emerging markets securities risk. Emerging markets (also referred to as developing markets) are generally subject to greater market volatility, political, social and economic instability, uncertain trading markets and more governmental limitations on foreign investment than more developed markets. In addition, companies operating in emerging markets may be subject to lower trading volume and greater price fluctuations than companies in more developed markets. Securities law and the enforcement of systems of taxation in many emerging market countries may change quickly and unpredictably. In addition, investments in emerging markets securities may also be subject to additional transaction costs, delays in settlement procedures, and lack of timely information. |
| ■ | Energy sector risk. The Fund will concentrate its investments in the securities of issuers engaged primarily in energy-related industries. Changes in worldwide energy prices, exploration and production spending, government regulation, world events, economic conditions, exchange rates, transportation and storage costs and labor relations can affect companies in the energy sector. In addition, these companies are at an increased risk of civil liability and environmental damage |
| | claims, and are also subject to the risk of loss from terrorism and natural disasters. |
| ■ | Foreign securities risk. The Fund’s foreign investments may be adversely affected by political and social instability, changes in economic or taxation policies, difficulty in enforcing obligations, decreased liquidity or increased volatility. Foreign investments also involve the risk of the possible seizure, nationalization or expropriation of the issuer or foreign deposits (in which the Fund could lose its entire investments in a certain market) and the possible adoption of foreign governmental restrictions such as exchange controls. Unless the Fund has hedged its foreign securities risk, foreign securities risk also involves the risk of negative foreign currency rate fluctuations, which may cause the value of securities denominated in such foreign currency (or other instruments through which the Fund has exposure to foreign currencies) to decline in value. Currency exchange rates may fluctuate significantly over short periods of time. Currency hedging strategies, if used, are not always successful. |
| ■ | Management risk. The Fund is actively managed and depends heavily on the Adviser’s judgment about markets, interest rates or the attractiveness, relative values, liquidity, or potential appreciation of particular investments made for the Fund’s portfolio. The Fund could experience losses if these judgments prove to be incorrect. Additionally, legislative, regulatory, or tax developments may adversely affect management of the Fund and, therefore, the ability of the Fund to achieve its investment objective. |
| ■ | Market risk.The market values of the Fund’s investments, and therefore the value of the Fund’s shares, will go up and down, sometimes rapidly or unpredictably. Market risk may affect a single issuer, industry or section of the economy, or it may affect the market as a whole. Individual stock |
This report must be accompanied or preceded by a currently effective Fund prospectus, which contains more complete information, including sales charges and expenses. Investors should read it carefully before investing.
NOT FDIC INSURED | MAY LOSE VALUE | NO BANK GUARANTEE
| | prices tend to go up and down more dramatically than those of certain other types of investments, such as bonds. During a general downturn in the financial markets, multiple asset classes may decline in value. When markets perform well, there can be no assurance that specific investments held by the Fund will rise in value. |
| ■ | Small- and mid-capitalization companies risks. Small- and mid-capitalization companies tend to be more vulnerable to changing market conditions, may have little or no operating history or track record of success, and may have more limited product lines and markets, less experienced management and fewer financial resources than larger companies. These companies’ securities may be more volatile and less liquid than those of more established companies, and their returns may vary, sometimes significantly, from the overall securities market. |
About indexes used in this report
| ■ | TheS&P 500® Index is an unmanaged index considered representative of the US stock market. |
| ■ | TheMSCI World Energy Index is designed to capture the performance of energy stocks across developed market countries. The index is computed using the net return, which withholds applicable taxes for non-resident investors. |
| ■ | TheLipper Natural Resource Funds Index is an unmanaged index considered representative of natural resource funds tracked by Lipper. |
| ■ | The Fund is not managed to track the performance of any particular index, including the index(es) described here, and consequently, the performance of the Fund may deviate significantly from the performance of the index(es). |
| ■ | A direct investment cannot be made in an index. Unless otherwise indicated, index results include reinvested dividends, and they do not reflect sales charges. Performance of the peer group, if applicable, reflects fund expenses; performance of a market index does not. |
Other information
| ■ | The returns shown in management’s discussion of Fund performance are based on net asset values (NAVs) calculated for shareholder transactions. Generally accepted accounting principles require adjustments to be made |
| | to the net assets of the Fund at period end for financial reporting purposes, and as such, the NAVs for shareholder transactions and the returns based on those NAVs may differ from the NAVs and returns reported in the Financial Highlights. |
| ■ | Industry classifications used in this report are generally according to the Global Industry Classification Standard, which was developed by and is the exclusive property and a service mark of MSCI Inc. and Standard & Poor’s. |
Schedule of Investments(a)
April 30, 2019
| | Shares | Value |
| Common Stocks & Other Equity Interests–99.33% |
| Commodity Chemicals–1.24% |
| LG Chem Ltd. (South Korea) | 17,017 | $5,271,996 |
| Diversified Metals & Mining–2.71% |
| Glencore PLC (Switzerland)(b) | 1,707,362 | 6,815,201 |
| Turquoise Hill Resources Ltd. (Mongolia)(b) | 3,113,789 | 4,670,684 |
| | | | 11,485,885 |
| Integrated Oil & Gas–34.67% |
| BP PLC ADR (United Kingdom) | 600,082 | 26,241,586 |
| Chevron Corp. | 212,420 | 25,503,145 |
| Exxon Mobil Corp. | 249,934 | 20,064,702 |
| Occidental Petroleum Corp. | 216,968 | 12,775,076 |
| Royal Dutch Shell PLC Class A, ADR (United Kingdom) | 409,640 | 26,024,429 |
| Suncor Energy, Inc. (Canada) | 751,604 | 24,786,045 |
| TOTAL S.A. (France) | 209,736 | 11,704,477 |
| | | | 147,099,460 |
| Oil & Gas Drilling–3.87% |
| Ensco Rowan PLC, Class A | 274,214 | 3,830,770 |
| Helmerich & Payne, Inc. | 214,752 | 12,567,287 |
| | | | 16,398,057 |
| Oil & Gas Equipment & Services–11.88% |
| Baker Hughes, a GE Co., Class A | 385,288 | 9,254,618 |
| Core Laboratories N.V. | 74,433 | 4,718,308 |
| Halliburton Co. | 518,447 | 14,687,603 |
| Oceaneering International, Inc.(b) | 245,543 | 4,714,425 |
| Schlumberger Ltd. | 137,003 | 5,847,288 |
| Superior Energy Services, Inc.(b) | 1,132,898 | 4,067,104 |
| Tenaris S.A. ADR (Luxembourg) | 249,119 | 6,910,561 |
| Tidewater, Inc. Series A, Wts. expiring 07/31/2023(b) | 24,724 | 87,770 |
| Tidewater, Inc. Series B, Wts. expiring 07/31/2023(b) | 26,728 | 90,341 |
| | | | 50,378,018 |
| Oil & Gas Exploration & Production–39.35% |
| Anadarko Petroleum Corp. | 104,733 | 7,629,799 |
| | Shares | Value |
| Oil & Gas Exploration & Production–(continued) |
| Cabot Oil & Gas Corp. | 518,084 | $13,413,195 |
| Canadian Natural Resources Ltd. (Canada) | 823,339 | 24,717,993 |
| Cobalt International Energy, Inc.(b)(c) | 526,022 | 0 |
| Concho Resources, Inc. | 40,632 | 4,688,120 |
| Devon Energy Corp. | 521,574 | 16,763,388 |
| EOG Resources, Inc. | 88,894 | 8,538,269 |
| Hess Corp. | 329,758 | 21,144,083 |
| Laredo Petroleum, Inc.(b) | 814,859 | 2,460,874 |
| Matador Resources Co.(b) | 201,935 | 3,976,100 |
| Noble Energy, Inc. | 989,373 | 26,772,433 |
| PrairieSky Royalty Ltd. (Canada) | 1,205,162 | 17,370,813 |
| Range Resources Corp. | 1,677,502 | 15,164,618 |
| Tullow Oil PLC (Ghana) | 1,465,897 | 4,292,903 |
| | | | 166,932,588 |
| Oil & Gas Refining & Marketing–3.31% |
| Phillips 66 | 149,017 | 14,047,833 |
| Oil & Gas Storage & Transportation–1.00% |
| Plains All American Pipeline, L.P. | 183,991 | 4,259,392 |
| Specialty Chemicals–1.30% |
| Albemarle Corp. | 73,222 | 5,496,043 |
| Total Common Stocks & Other Equity Interests (Cost $595,275,860) | 421,369,272 |
|
| Money Market Funds–1.28% |
| Invesco Government & Agency Portfolio, Institutional Class, 2.34%(d) | 1,909,297 | 1,909,297 |
| Invesco Liquid Assets Portfolio, Institutional Class, 2.48%(d) | 1,363,371 | 1,363,780 |
| Invesco Treasury Portfolio, Institutional Class, 2.32%(d) | 2,182,054 | 2,182,054 |
| Total Money Market Funds (Cost $5,455,131) | 5,455,131 |
| TOTAL INVESTMENTS IN SECURITIES–100.61% (Cost $600,730,991) | 426,824,403 |
| OTHER ASSETS LESS LIABILITIES–(0.61)% | (2,600,865) |
| NET ASSETS–100.00% | $424,223,538 |
Investment Abbreviations:
| ADR | – American Depositary Receipt |
| Wts. | – Warrants |
Notes to Schedule of Investments:
| (a) | Industry and/or sector classifications used in this report are generally according to the Global Industry Classification Standard, which was developed by and is the exclusive property and a service mark of MSCI Inc. and Standard & Poor’s. |
| (b) | Non-income producing security. |
| (c) | Security valued using significant unobservable inputs (Level 3). See Note 3. |
| (d) | The money market fund and the Fund are affiliated by having the same investment adviser. The rate shown is the 7-day SEC standardized yield as of April 30, 2019. |
See accompanying Notes to Financial Statements which are an integral part of the financial statements.
Statement of Assets and Liabilities
April 30, 2019
| Assets: | |
Investments in securities, at value
(Cost $595,275,860) | $421,369,272 |
| Investments in affiliated money market funds, at value (Cost $5,455,131) | 5,455,131 |
| Foreign currencies, at value (Cost $269,523) | 267,435 |
| Receivable for: | |
| Investments sold | 916,341 |
| Fund shares sold | 103,194 |
| Dividends | 403,962 |
| Investment for trustee deferred compensation and retirement plans | 254,573 |
| Other assets | 36,131 |
| Total assets | 428,806,039 |
| Liabilities: | |
| Payable for: | |
| Investments purchased | 2,841,627 |
| Fund shares reacquired | 704,057 |
| Amount due custodian | 262,419 |
| Accrued fees to affiliates | 388,834 |
| Accrued trustees’ and officers’ fees and benefits | 1,935 |
| Accrued other operating expenses | 104,529 |
| Trustee deferred compensation and retirement plans | 279,100 |
| Total liabilities | 4,582,501 |
| Net assets applicable to shares outstanding | $424,223,538 |
| Net assets consist of: | |
| Shares of beneficial interest | $771,717,737 |
| Distributable earnings | (347,494,199) |
| | $424,223,538 |
| Net Assets: |
| Class A | $248,396,429 |
| Class C | $33,036,486 |
| Class Y | $38,550,321 |
| Investor Class | $97,716,076 |
| Class R5 | $6,051,565 |
| Class R6 | $472,661 |
| Shares outstanding, no par value, with an unlimited number of shares authorized: |
| Class A | 11,799,952 |
| Class C | 1,836,086 |
| Class Y | 1,832,162 |
| Investor Class | 4,662,675 |
| Class R5 | 280,910 |
| Class R6 | 21,957 |
| Class A: | |
| Net asset value per share | $21.05 |
Maximum offering price per share
(Net asset value of $21.05 ÷ 94.50%) | $22.28 |
| Class C: | |
| Net asset value and offering price per share | $17.99 |
| Class Y: | |
| Net asset value and offering price per share | $21.04 |
| Investor Class: | |
| Net asset value and offering price per share | $20.96 |
| Class R5: | |
| Net asset value and offering price per share | $21.54 |
| Class R6: | |
| Net asset value and offering price per share | $21.53 |
See accompanying Notes to Financial Statements which are an integral part of the financial statements.
Statement of Operations
For the year ended April 30, 2019
| Investment income: | |
| Dividends (net of foreign withholding taxes of $724,340) | $13,138,089 |
| Dividends from affiliated money market funds | 154,917 |
| Total investment income | 13,293,006 |
| Expenses: | |
| Advisory fees | 3,716,016 |
| Administrative services fees | 123,546 |
| Custodian fees | 17,560 |
| Distribution fees: | |
| Class A | 694,197 |
| Class C | 678,528 |
| Investor Class | 289,125 |
| Transfer agent fees — A, C, Y and Investor Class | 1,427,152 |
| Transfer agent fees — R5 | 7,045 |
| Transfer agent fees — R6 | 243 |
| Trustees’ and officers’ fees and benefits | 27,578 |
| Registration and filing fees | 95,331 |
| Reports to shareholders | 78,911 |
| Professional services fees | 52,040 |
| Other | 19,368 |
| Total expenses | 7,226,640 |
| Less: Fees waived and expense offset arrangement(s) | (20,865) |
| Net expenses | 7,205,775 |
| Net investment income | 6,087,231 |
| Realized and unrealized gain (loss) from: | |
| Net realized gain (loss) from: | |
| Investment securities | (33,171,568) |
| Foreign currencies | (58,259) |
| | (33,229,827) |
| Change in net unrealized appreciation (depreciation) of: | |
| Investment securities | (68,987,079) |
| Foreign currencies | 2,706 |
| | (68,984,373) |
| Net realized and unrealized gain (loss) | (102,214,200) |
| Net increase (decrease) in net assets resulting from operations | $(96,126,969) |
See accompanying Notes to Financial Statements which are an integral part of the financial statements.
Statement of Changes in Net Assets
For the years ended April 30, 2019 and 2018
| | 2019 | 2018 |
| Operations: | | |
| Net investment income | $6,087,231 | $12,582,605 |
| Net realized gain (loss) | (33,229,827) | 3,307,126 |
| Change in net unrealized appreciation (depreciation) | (68,984,373) | 25,678,865 |
| Net increase (decrease) in net assets resulting from operations | (96,126,969) | 41,568,596 |
| Distributions to shareholders from distributable earnings(1): | | |
| Class A | (6,036,516) | (7,518,092) |
| Class B | — | (16,198) |
| Class C | (1,224,241) | (999,111) |
| Class Y | (1,152,559) | (1,605,135) |
| Investor Class | (2,607,774) | (3,120,324) |
| Class R5 | (184,086) | (243,236) |
| Class R6 | (11,017) | (3,052) |
| Total distributions to shareholders from distributable earnings | (11,216,193) | (13,505,148) |
| Share transactions–net: | | |
| Class A | (20,349,179) | (85,285,570) |
| Class B | — | (3,366,435) |
| Class C | (42,670,624) | (32,746,572) |
| Class Y | (6,390,142) | (10,045,256) |
| Investor Class | (14,783,040) | (29,674,044) |
| Class R5 | (665,191) | (1,125,861) |
| Class R6 | 350,070 | 169,682 |
| Net increase (decrease) in net assets resulting from share transactions | (84,508,106) | (162,074,056) |
| Net increase (decrease) in net assets | (191,851,268) | (134,010,608) |
| Net assets: | | |
| Beginning of year | 616,074,806 | 750,085,414 |
| End of year | $424,223,538 | $616,074,806 |
| (1) | The Securities and Exchange Commission eliminated the requirement to disclose the distribution components separately, except for tax return of capital. For the year ended April 30, 2018, distributions to shareholders from distributable earnings consisted of distributions from net investment income. |
See accompanying Notes to Financial Statements which are an integral part of the financial statements.
Financial Highlights
April 30, 2019
The following schedule presents financial highlights for a share of the Fund outstanding throughout the periods indicated.
| | Net asset
value,
beginning
of period | Net
investment
income
(loss)(a) | Net gains
(losses)
on securities
(both
realized and
unrealized) | Total from
investment
operations | Dividends
from net
investment
income | Distributions
from net
realized
gains | Total
distributions | Net asset
value, end
of period | Total
return(b) | Net assets,
end of period
(000’s omitted) | Ratio of
expenses
to average
net assets
with fee waivers
and/or expenses
absorbed | Ratio of
expenses
to average net
assets without
fee waivers
and/or expenses
absorbed | Ratio of net
investment
income
(loss)
to average
net assets | Portfolio
turnover(c) |
| Class A |
| Year ended 04/30/19 | $25.91 | $0.29 | $(4.61) | $(4.32) | $(0.54) | $— | $(0.54) | $21.05 | (16.48)% | $248,396 | 1.32%(d) | 1.32%(d) | 1.25%(d) | 17% |
| Year ended 04/30/18 | 24.54 | 0.49(e) | 1.44 | 1.93 | (0.56) | — | (0.56) | 25.91 | 8.08 | 323,247 | 1.33 | 1.33 | 2.07(e) | 9 |
| Year ended 04/30/17 | 27.04 | 0.22 | (2.41) | (2.19) | (0.31) | — | (0.31) | 24.54 | (8.29) | 393,998 | 1.27 | 1.27 | 0.84 | 22 |
| Year ended 04/30/16 | 35.41 | 0.27 | (8.28)(f) | (8.01) | (0.15) | (0.21) | (0.36) | 27.04 | (22.45)(f) | 521,910 | 1.26 | 1.27 | 1.05 | 22 |
| Year ended 04/30/15 | 49.87 | 0.29 | (10.33) | (10.04) | (0.13) | (4.29) | (4.42) | 35.41 | (18.60) | 628,443 | 1.16 | 1.17 | 0.69 | 27 |
| Class C |
| Year ended 04/30/19 | 22.17 | 0.10 | (3.93) | (3.83) | (0.35) | — | (0.35) | 17.99 | (17.14) | 33,036 | 2.07(d) | 2.07(d) | 0.50(d) | 17 |
| Year ended 04/30/18 | 20.88 | 0.26(e) | 1.24 | 1.50 | (0.21) | — | (0.21) | 22.17 | 7.29 | 92,349 | 2.08 | 2.08 | 1.32(e) | 9 |
| Year ended 04/30/17 | 23.05 | 0.02 | (2.07) | (2.05) | (0.12) | — | (0.12) | 20.88 | (8.97) | 120,722 | 2.02 | 2.02 | 0.09 | 22 |
| Year ended 04/30/16 | 30.39 | 0.06 | (7.11)(f) | (7.05) | (0.08) | (0.21) | (0.29) | 23.05 | (23.03)(f) | 156,964 | 2.01 | 2.02 | 0.30 | 22 |
| Year ended 04/30/15 | 43.83 | (0.02) | (9.13) | (9.15) | — | (4.29) | (4.29) | 30.39 | (19.21) | 194,893 | 1.91 | 1.92 | (0.06) | 27 |
| Class Y |
| Year ended 04/30/19 | 25.93 | 0.35 | (4.63) | (4.28) | (0.61) | — | (0.61) | 21.04 | (16.29) | 38,550 | 1.07(d) | 1.07(d) | 1.50(d) | 17 |
| Year ended 04/30/18 | 24.63 | 0.55(e) | 1.43 | 1.98 | (0.68) | — | (0.68) | 25.93 | 8.34 | 56,061 | 1.08 | 1.08 | 2.32(e) | 9 |
| Year ended 04/30/17 | 27.12 | 0.29 | (2.41) | (2.12) | (0.37) | — | (0.37) | 24.63 | (8.03) | 63,783 | 1.02 | 1.02 | 1.09 | 22 |
| Year ended 04/30/16 | 35.47 | 0.34 | (8.31)(f) | (7.97) | (0.17) | (0.21) | (0.38) | 27.12 | (22.28)(f) | 50,706 | 1.01 | 1.02 | 1.30 | 22 |
| Year ended 04/30/15 | 50.00 | 0.38 | (10.37) | (9.99) | (0.25) | (4.29) | (4.54) | 35.47 | (18.38) | 78,476 | 0.91 | 0.92 | 0.94 | 27 |
| Investor Class |
| Year ended 04/30/19 | 25.80 | 0.29 | (4.59) | (4.30) | (0.54) | — | (0.54) | 20.96 | (16.47) | 97,716 | 1.32(d) | 1.32(d) | 1.25(d) | 17 |
| Year ended 04/30/18 | 24.44 | 0.49(e) | 1.43 | 1.92 | (0.56) | — | (0.56) | 25.80 | 8.07 | 136,141 | 1.33 | 1.33 | 2.07(e) | 9 |
| Year ended 04/30/17 | 26.93 | 0.22 | (2.40) | (2.18) | (0.31) | — | (0.31) | 24.44 | (8.29) | 159,402 | 1.27 | 1.27 | 0.84 | 22 |
| Year ended 04/30/16 | 35.27 | 0.27 | (8.25)(f) | (7.98) | (0.15) | (0.21) | (0.36) | 26.93 | (22.45)(f) | 210,374 | 1.26 | 1.27 | 1.05 | 22 |
| Year ended 04/30/15 | 49.69 | 0.29 | (10.29) | (10.00) | (0.13) | (4.29) | (4.42) | 35.27 | (18.59) | 295,318 | 1.16 | 1.17 | 0.69 | 27 |
| Class R5 |
| Year ended 04/30/19 | 26.53 | 0.40 | (4.73) | (4.33) | (0.66) | — | (0.66) | 21.54 | (16.12) | 6,052 | 0.90(d) | 0.90(d) | 1.67(d) | 17 |
| Year ended 04/30/18 | 25.23 | 0.61(e) | 1.46 | 2.07 | (0.77) | — | (0.77) | 26.53 | 8.51 | 8,092 | 0.91 | 0.91 | 2.49(e) | 9 |
| Year ended 04/30/17 | 27.77 | 0.34 | (2.46) | (2.12) | (0.42) | — | (0.42) | 25.23 | (7.88) | 8,871 | 0.86 | 0.86 | 1.25 | 22 |
| Year ended 04/30/16 | 36.24 | 0.40 | (8.48)(f) | (8.08) | (0.18) | (0.21) | (0.39) | 27.77 | (22.10)(f) | 22,298 | 0.84 | 0.85 | 1.47 | 22 |
| Year ended 04/30/15 | 50.97 | 0.44 | (10.57) | (10.13) | (0.31) | (4.29) | (4.60) | 36.24 | (18.30) | 32,046 | 0.79 | 0.80 | 1.06 | 27 |
| Class R6 |
| Year ended 04/30/19 | 26.52 | 0.39 | (4.72) | (4.33) | (0.66) | — | (0.66) | 21.53 | (16.11) | 473 | 0.89(d) | 0.89(d) | 1.68(d) | 17 |
| Year ended 04/30/18 | 25.23 | 0.62(e) | 1.46 | 2.08 | (0.79) | — | (0.79) | 26.52 | 8.55 | 185 | 0.90 | 0.90 | 2.50(e) | 9 |
| Year ended 04/30/17(g) | 26.31 | 0.03 | (1.11) | (1.08) | — | — | — | 25.23 | (4.11) | 10 | 0.81(h) | 0.81(h) | 1.30(h) | 22 |
| (a) | Calculated using average shares outstanding. |
| (b) | Includes adjustments in accordance with accounting principles generally accepted in the United States of America and as such, the net asset value for financial reporting purposes and the returns based upon those net asset values may differ from the net asset value and returns for shareholder transactions. Does not include sales charges and is not annualized for periods less than one year, if applicable. |
| (c) | Portfolio turnover is calculated at the fund level and is not annualized for periods less than one year, if applicable. |
| (d) | Ratios are based on average daily net assets (000’s omitted) of $277,679, $67,853, $49,388, $115,650 , $7,002 and $277 for Class A, Class C, Class Y, Investor Class, Class R5 and Class R6 shares, respectively. |
| (e) | Net investment income (loss) per share and the ratio of net investment income (loss) to average net assets includes significant dividends received during the period. Net investment income (loss) per share and the ratio of net investment income (loss) to average net assets excluding the significant dividends are $0.32 and 0.87%, $0.09 and 0.12%, $0.38 and 1.12%, $0.32 and 0.87%, $0.44 and 1.29% and $0.45 and 1.30% for Class A, Class C, Class Y, Investor Class, Class R5 and Class R6 shares, respectively. |
| (f) | Includes litigation proceeds received during the period. Had these litigation proceeds not been received, Net gains (losses) on securities (both realized and unrealized) per share would have been $(8.35), $(7.18), $(8.38), $(8.32) and $(8.55) for Class A, Class C, Class Y, Investor Class and Class R5 shares, respectively. Total returns would have been lower. |
| (g) | Commencement date of April 4, 2017. |
| (h) | Annualized. |
See accompanying Notes to Financial Statements which are an integral part of the financial statements.
Notes to Financial Statements
April 30, 2019
NOTE 1—Significant Accounting Policies
Invesco Energy Fund (the “Fund”) is a series portfolio of AIM Sector Funds (Invesco Sector Funds) (the “Trust”). The Trust is a Delaware statutory trust registered under the Investment Company Act of 1940, as amended (the “1940 Act”), as an open-end series management investment company authorized to issue an unlimited number of shares of beneficial interest. Information presented in these financial statements pertains only to the Fund. Matters affecting the Fund or each class will be voted on exclusively by the shareholders of the Fund or each class.
The Fund’s investment objective is long-term growth of capital.
The Fund currently consists of six different classes of shares: Class A, Class C, Class Y, Investor Class, Class R5 and Class R6. Class Y and Investor Class shares are available only to certain investors. Class A shares are sold with a front-end sales charge unless certain waiver criteria are met and under certain circumstances load waived shares may be subject to contingent deferred sales charges ("CDSC"). Class C shares are sold with a CDSC. Class Y, Investor Class, Class R5 and Class R6 shares are sold at net asset value. Class C shares held for ten years after purchase are eligible for automatic conversion into Class A shares of the same Fund (the "Conversion Feature"). The automatic conversion pursuant to the Conversion Feature will generally occur at the end of the month following the tenth anniversary after a purchase of Class C shares.
The Fund is an investment company and accordingly follows the investment company accounting and reporting guidance in accordance with Financial Accounting Standards Board Accounting Standards Codification Topic 946,Financial Services – Investment Companies.
The following is a summary of the significant accounting policies followed by the Fund in the preparation of its financial statements.
| A. | Security Valuations — Securities, including restricted securities, are valued according to the following policy. |
A security listed or traded on an exchange (except convertible securities) is valued at its last sales price or official closing price as of the close of the customary trading session on the exchange where the security is principally traded, or lacking any sales or official closing price on a particular day, the security may be valued at the closing bid price on that day. Securities traded in the over-the-counter market are valued based on prices furnished by independent pricing services or market makers. When such securities are valued by an independent pricing service they may be considered fair valued. Futures contracts are valued at the final settlement price set by an exchange on which they are principally traded. Listed options are valued at the mean between the last bid and asked prices from the exchange on which they are principally traded. Options not listed on an exchange are valued by an independent source at the mean between the last bid and asked prices. For purposes of determining net asset value (“NAV”) per share, futures and option contracts generally are valued 15 minutes after the close of the customary trading session of the New York Stock Exchange (“NYSE”).
Investments in open-end and closed-end registered investment companies that do not trade on an exchange are valued at the end-of-day net asset value per share. Investments in open-end and closed-end registered investment companies that trade on an exchange are valued at the last sales price or official closing price as of the close of the customary trading session on the exchange where the security is principally traded.
Debt obligations (including convertible securities) and unlisted equities are fair valued using an evaluated quote provided by an independent pricing service. Evaluated quotes provided by the pricing service may be determined without exclusive reliance on quoted prices, and may reflect appropriate factors such as institution-size trading in similar groups of securities, developments related to specific securities, dividend rate (for unlisted equities), yield (for debt obligations), quality, type of issue, coupon rate (for debt obligations), maturity (for debt obligations), individual trading characteristics and other market data. Pricing services generally value debt obligations assuming orderly transactions of institutional round lot size, but a fund may hold or transact in the same securities in smaller, odd lot sizes. Odd lots often trade at lower prices than institutional round lots. Debt obligations are subject to interest rate and credit risks. In addition, all debt obligations involve some risk of default with respect to interest and/or principal payments.
Foreign securities’ (including foreign exchange contracts) prices are converted into U.S. dollar amounts using the applicable exchange rates as of the close of the NYSE. If market quotations are available and reliable for foreign exchange-traded equity securities, the securities will be valued at the market quotations. Because trading hours for certain foreign securities end before the close of the NYSE, closing market quotations may become unreliable. If between the time trading ends on a particular security and the close of the customary trading session on the NYSE, events occur that the investment adviser determines are significant and make the closing price unreliable, the Fund may fair value the security. If the event is likely to have affected the closing price of the security, the security will be valued at fair value in good faith using procedures approved by the Board of Trustees. Adjustments to closing prices to reflect fair value may also be based on a screening process of an independent pricing service to indicate the degree of certainty, based on historical data, that the closing price in the principal market where a foreign security trades is not the current value as of the close of the NYSE. Foreign securities’ prices meeting the approved degree of certainty that the price is not reflective of current value will be priced at the indication of fair value from the independent pricing service. Multiple factors may be considered by the independent pricing service in determining adjustments to reflect fair value and may include information relating to sector indices, American Depositary Receipts and domestic and foreign index futures. Foreign securities may have additional risks including exchange rate changes, potential for sharply devalued currencies and high inflation, political and economic upheaval, the relative lack of issuer information, relatively low market liquidity and the potential lack of strict financial and accounting controls and standards.
Securities for which market prices are not provided by any of the above methods may be valued based upon quotes furnished by independent sources. The last bid price may be used to value equity securities. The mean between the last bid and asked prices is used to value debt obligations, including corporate loans.
Securities for which market quotations are not readily available or became unreliable are valued at fair value as determined in good faith by or under the supervision of the Trust’s officers following procedures approved by the Board of Trustees. Issuer specific events, market trends, bid/asked quotes of brokers and information providers and other market data may be reviewed in the course of making a good faith determination of a security’s fair value.
The Fund may invest in securities that are subject to interest rate risk, meaning the risk that the prices will generally fall as interest rates rise and, conversely, the prices will generally rise as interest rates fall. Specific securities differ in their sensitivity to changes in interest rates depending on their individual characteristics. Changes in interest rates may result in increased market volatility, which may affect the value and/or liquidity of certain Fund investments.
Valuations change in response to many factors including the historical and prospective earnings of the issuer, the value of the issuer’s assets, general economic conditions, interest rates, investor perceptions and market liquidity. Because of the inherent uncertainties of valuation, the values reflected in the financial statements may materially differ from the value received upon actual sale of those investments.
| B. | Securities Transactions and Investment Income — Securities transactions are accounted for on a trade date basis. Realized gains or losses on sales are computed on the basis of specific identification of the securities sold. Interest income (net of withholding tax, if any) is recorded on the accrual basis from settlement date. Dividend income (net of withholding tax, if any) is recorded on the ex-dividend date. |
The Fund may periodically participate in litigation related to Fund investments. As such, the Fund may receive proceeds from litigation settlements. Any proceeds received are included in the Statement of Operations as realized gain (loss) for investments no longer held and as unrealized gain (loss) for investments still held.
Brokerage commissions and mark ups are considered transaction costs and are recorded as an increase to the cost basis of securities purchased and/or a reduction of proceeds on a sale of securities. Such transaction costs are included in the determination of net realized and unrealized gain (loss) from investment securities reported in the Statement of Operations and the Statement of Changes in Net Assets and the net realized and unrealized gains (losses) on securities per share in the Financial Highlights. Transaction costs are included in the calculation of the Fund’s net asset value and, accordingly, they reduce the Fund’s total returns. These transaction costs are not considered operating expenses and are not reflected in net investment income reported in the Statement of Operations and the Statement of Changes in Net Assets, or the net investment income per share and the ratios of expenses and net investment income reported in the Financial Highlights, nor are they limited by any expense limitation arrangements between the Fund and the investment adviser.
The Fund allocates income and realized and unrealized capital gains and losses to a class based on the relative net assets of each class.
| C. | Country Determination – For the purposes of making investment selection decisions and presentation in the Schedule of Investments, the investment adviser may determine the country in which an issuer is located and/or credit risk exposure based on various factors. These factors include the laws of the country under which the issuer is organized, where the issuer maintains a principal office, the country in which the issuer derives 50% or more of its total revenues and the country that has the primary market for the issuer’s securities, as well as other criteria. Among the other criteria that may be evaluated for making this determination are the country in which the issuer maintains 50% or more of its assets, the type of security, financial guarantees and enhancements, the nature of the collateral and the sponsor organization. Country of issuer and/or credit risk exposure has been determined to be the United States of America, unless otherwise noted. |
| D. | Distributions– Distributions from net investment income and net realized capital gain, if any, are generally declared and paid annually and recorded on the ex-dividend date. The Fund may elect to treat a portion of the proceeds from redemptions as distributions for federal income tax purposes. |
| E. | Federal Income Taxes – The Fund intends to comply with the requirements of Subchapter M of the Internal Revenue Code of 1986, as amended (the “Internal Revenue Code”), necessary to qualify as a regulated investment company and to distribute substantially all of the Fund’s taxable earnings to shareholders. As such, the Fund will not be subject to federal income taxes on otherwise taxable income (including net realized capital gain) that is distributed to shareholders. Therefore, no provision for federal income taxes is recorded in the financial statements. |
The Fund recognizes the tax benefits of uncertain tax positions only when the position is more likely than not to be sustained. Management has analyzed the Fund’s uncertain tax positions and concluded that no liability for unrecognized tax benefits should be recorded related to uncertain tax positions. Management is not aware of any tax positions for which it is reasonably possible that the total amounts of unrecognized tax benefits will change materially in the next 12 months.
The Fund files tax returns in the U.S. Federal jurisdiction and certain other jurisdictions. Generally, the Fund is subject to examinations by such taxing authorities for up to three years after the filing of the return for the tax period.
| F. | Expenses – Fees provided for under the Rule 12b-1 plan of a particular class of the Fund are charged to the operations of such class. Transfer agency fees and expenses and other shareholder recordkeeping fees and expenses attributable to Class R5 and Class R6 are allocated to each share class based on relative net assets. Sub-accounting fees attributable to Class R5 are charged to the operations of the class. Transfer agency fees and expenses and other shareholder recordkeeping fees and expenses relating to all other classes are allocated among those classes based on relative net assets. All other expenses are allocated among the classes based on relative net assets. |
| G. | Accounting Estimates – The preparation of financial statements in conformity with accounting principles generally accepted in the United States of America (“GAAP”) requires management to make estimates and assumptions that affect the reported amounts of assets and liabilities at the date of the financial statements and the reported amounts of revenues and expenses during the reporting period including estimates and assumptions related to taxation. Actual results could differ from those estimates by a significant amount. In addition, the Fund monitors for material events or transactions that may occur or become known after the period-end date and before the date the financial statements are released to print. |
| H. | Indemnifications – Under the Trust’s organizational documents, each Trustee, officer, employee or other agent of the Trust is indemnified against certain liabilities that may arise out of the performance of their duties to the Fund. Additionally, in the normal course of business, the Fund enters into contracts, including the Fund’s servicing agreements, that contain a variety of indemnification clauses. The Fund’s maximum exposure under these arrangements is unknown as this would involve future claims that may be made against the Fund that have not yet occurred. The risk of material loss as a result of such indemnification claims is considered remote. |
| I. | Foreign Currency Translations – Foreign currency is valued at the close of the NYSE based on quotations posted by banks and major currency dealers. Portfolio securities and other assets and liabilities denominated in foreign currencies are translated into U.S. dollar amounts at the date of valuation. Purchases and sales of portfolio securities (net of foreign taxes withheld on disposition) and income items denominated in foreign currencies are translated into U.S. dollar amounts on the respective dates of such transactions. The Fund does not separately account for the portion of the results of operations resulting from changes in foreign exchange rates on investments and the fluctuations arising from changes in market prices of securities held. The combined results of changes in foreign exchange rates and the fluctuation of market prices on investments (net of estimated foreign tax withholding) are included with the net realized and unrealized gain or loss from investments in the Statement of Operations. Reported net realized foreign currency gains or losses arise from (1) sales of foreign currencies, (2) currency gains or losses realized between the trade and settlement dates on securities transactions, and (3) the difference between the amounts of dividends, interest, and foreign withholding taxes recorded on the Fund’s books and the U.S. dollar equivalent of the amounts actually received or paid. Net |
| | unrealized foreign currency gains and losses arise from changes in the fair values of assets and liabilities, other than investments in securities at fiscal period end, resulting from changes in exchange rates. |
The Fund may invest in foreign securities, which may be subject to foreign taxes on income, gains on investments or currency repatriation, a portion of which may be recoverable. Foreign taxes, if any, are recorded based on the tax regulations and rates that exist in the foreign markets in which the Fund invests and are shown in the Statement of Operations.
| J. | Forward Foreign Currency Contracts – The Fund may engage in foreign currency transactions either on a spot (i.e. for prompt delivery and settlement) basis, or through forward foreign currency contracts, to manage or minimize currency or exchange rate risk. |
The Fund may also enter into forward foreign currency contracts for the purchase or sale of a security denominated in a foreign currency in order to “lock in” the U.S. dollar price of that security, or the Fund may also enter into forward foreign currency contracts that do not provide for physical settlement of the two currencies, but instead are settled by a single cash payment calculated as the difference between the agreed upon exchange rate and the spot rate at settlement based upon an agreed upon notional amount (non-deliverable forwards). The Fund will set aside liquid assets in an amount equal to the daily mark-to-market obligation for forward foreign currency contracts.
A forward foreign currency contract is an obligation between two parties (“Counterparties”) to purchase or sell a specific currency for an agreed-upon price at a future date. The use of forward foreign currency contracts does not eliminate fluctuations in the price of the underlying securities the Fund owns or intends to acquire but establishes a rate of exchange in advance. Fluctuations in the value of these contracts are measured by the difference in the contract date and reporting date exchange rates and are recorded as unrealized appreciation (depreciation) until the contracts are closed. When the contracts are closed, realized gains (losses) are recorded. Realized and unrealized gains (losses) on the contracts are included in the Statement of Operations. The primary risks associated with forward foreign currency contracts include failure of the Counterparty to meet the terms of the contract and the value of the foreign currency changing unfavorably. These risks may be in excess of the amounts reflected in the Statement of Assets and Liabilities.
| K. | Other Risks- The Fund’s investments are concentrated in a comparatively narrow segment of the economy, which may make the Fund more volatile. |
The businesses in which the Fund invests may be adversely affected by foreign, federal or state regulations governing energy production, distribution and sale. Although individual security selection drives the performance of the Fund, short-term fluctuations in commodity prices may cause price fluctuations in its shares.
NOTE 2—Advisory Fees and Other Fees Paid to Affiliates
The Trust has entered into a master investment advisory agreement with Invesco Advisers, Inc. (the "Adviser" or "Invesco"). Under the terms of the investment advisory agreement, the Fund accrues daily and pays monthly an advisory fee to the Adviser based on the annual rate of the Fund’s average daily net assets as follows:
| Average Daily Net Assets | Rate |
| First $350 million | 0.75% |
| Next $350 million | 0.65% |
| Next $1.3 billion | 0.55% |
| Next $2 billion | 0.45% |
| Next $2 billion | 0.40% |
| Next $2 billion | 0.375% |
| Over $8 billion | 0.35% |
For the year ended April 30, 2019, the effective advisory fees incurred by the Fund was 0.72%.
Under the terms of a master sub-advisory agreement between the Adviser and each of Invesco Asset Management Deutschland GmbH, Invesco Asset Management Limited, Invesco Asset Management (Japan) Limited, Invesco Hong Kong Limited, Invesco Senior Secured Management, Inc. and Invesco Canada Ltd. (collectively, the "Affiliated Sub-Advisers") the Adviser, not the Fund, will pay 40% of the fees paid to the Adviser to any such Affiliated Sub-Adviser(s) that provide(s) discretionary investment management services to the Fund based on the percentage of assets allocated to such Affiliated Sub-Adviser(s).
The Adviser has contractually agreed, through at least June 30, 2020, to waive advisory fees and/or reimburse expenses of all shares to the extent necessary to limit total annual fund operating expenses after fee waiver and/or expense reimbursement (excluding certain items discussed below) of Class A, Class C, Class Y, Investor Class, Class R5 and Class R6 shares to 2.00%, 2.75%, 1.75%, 2.00%, 1.75% and 1.75%, respectively, of average daily net assets (the "expense limits"). In determining the Adviser’s obligation to waive advisory fees and/or reimburse expenses, the following expenses are not taken into account, and could cause the total annual fund operating expenses after fee waivers and/or expense reimbursement to exceed the numbers reflected above: (1) interest; (2) taxes; (3) dividend expense on short sales; (4) extraordinary or non-routine items, including litigation expenses; and (5) expenses that the Fund has incurred but did not actually pay because of an expense offset arrangement. Unless Invesco continues the fee waiver agreement, it will terminate on June 30, 2020. During its term, the fee waiver agreement cannot be terminated or amended to increase the expense limits or reduce the advisory fee waiver without approval of the Board of Trustees. The Adviser did not waive fees and/or reimburse expenses during the period under these expense limits.
Further, the Adviser has contractually agreed, through at least June 30, 2021, to waive the advisory fee payable by the Fund in an amount equal to 100% of the net advisory fees the Adviser receives from the affiliated money market funds on investments by the Fund of uninvested cash in such affiliated money market funds.
For the year ended April 30, 2019, the Adviser waived advisory fees of $8,392.
The Trust has entered into a master administrative services agreement with Invesco pursuant to which the Fund has agreed to pay Invesco for certain administrative costs incurred in providing accounting services to the Fund. For the year ended April 30, 2019, expenses incurred under the
agreement are shown in the Statement of Operations asAdministrative services fees. Also, Invesco has entered into a sub-administration agreement whereby State Street Bank and Trust Company (“SSB”) serves as custodian and fund accountant and provides certain administrative services to the Fund.
The Trust has entered into a transfer agency and service agreement with Invesco Investment Services, Inc. (“IIS”) pursuant to which the Fund has agreed to pay IIS a fee for providing transfer agency and shareholder services to the Fund and reimburse IIS for certain expenses incurred by IIS in the course of providing such services. IIS may make payments to intermediaries that provide omnibus account services, sub-accounting services and/or networking services. All fees payable by IIS to intermediaries that provide omnibus account services or sub-accounting services are charged back to the Fund, subject to certain limitations approved by the Trust’s Board of Trustees. For the year ended April 30, 2019, expenses incurred under the agreement are shown in the Statement of Operations asTransfer agent fees.
The Trust has entered into master distribution agreements with Invesco Distributors, Inc. (“IDI”) to serve as the distributor for the Class A, Class C, Class Y, Investor Class, Class R5 and Class R6 shares of the Fund. The Trust has adopted plans pursuant to Rule 12b-1 under the 1940 Act with respect to the Fund’s Class A, Class C and Investor Class shares (collectively, the “Plans”). The Fund, pursuant to the Plans, pays IDI compensation at the annual rate of 0.25% of the Fund’s average daily net assets of Class A shares and 1.00% of the average daily net assets of Class C shares. The Fund, pursuant to the Investor Class Plan, reimburses IDI for its allocated share of expenses incurred pursuant to the Investor Class Plan for the period, up to a maximum annual rate of 0.25% of the average daily net assets of Investor Class shares. The fees are accrued daily and paid monthly. Of the Plan payments, up to 0.25% of the average daily net assets of each class of shares may be paid to furnish continuing personal shareholder services to customers who purchase and own shares of such classes. Any amounts not paid as a service fee under the Plans would constitute an asset-based sales charge. Rules of the Financial Industry Regulatory Authority (“FINRA”) impose a cap on the total sales charges, including asset-based sales charges, that may be paid by any class of shares of the Fund. For the year ended April 30, 2019, expenses incurred under the Plans are shown in the Statement of Operations asDistribution fees.
Front-end sales commissions and CDSC (collectively, the “sales charges”) are not recorded as expenses of the Fund. Front-end sales commissions are deducted from proceeds from the sales of Fund shares prior to investment in Class A shares of the Fund. CDSC are deducted from redemption proceeds prior to remittance to the shareholder. During the year ended April 30, 2019, IDI advised the Fund that IDI retained $35,686 in front-end sales commissions from the sale of Class A shares and $3,328 and $2,966 from Class A and Class C shares, respectively, for CDSC imposed upon redemptions by shareholders.
Certain officers and trustees of the Trust are officers and directors of the Adviser, IIS and/or IDI.
NOTE 3—Additional Valuation Information
| | Level 1 | Level 2 | Level 3 | Total |
| Investments in Securities | | | | |
| Common Stocks & Other Equity Interests | $393,284,695 | $28,084,577 | $0 | $421,369,272 |
| Money Market Funds | 5,455,131 | — | — | 5,455,131 |
| Total Investments | $398,739,826 | $28,084,577 | $0 | $426,824,403 |
NOTE 4—Security Transactions with Affiliated Funds
The Fund is permitted to purchase or sell securities from or to certain other Invesco Funds under specified conditions outlined in procedures adopted by the Board of Trustees of the Trust. The procedures have been designed to ensure that any purchase or sale of securities by the Fund from or to another fund or portfolio that is or could be considered an affiliate by virtue of having a common investment adviser (or affiliated investment advisers), common Trustees and/or common officers complies with Rule 17a-7 of the 1940 Act. Further, as defined under the procedures, each transaction is effected at the current market price. Pursuant to these procedures, for the year ended April 30, 2019, the Fund engaged in securities purchases of $1,545,439.
NOTE 5—Expense Offset Arrangement(s)
The expense offset arrangement is comprised of transfer agency credits which result from balances in demand deposit accounts used by the transfer agent for clearing shareholder transactions. For the year ended April 30, 2019, the Fund received credits from this arrangement, which resulted in the reduction of the Fund’s total expenses of $12,473.
NOTE 6—Trustees’ and Officers’ Fees and Benefits
Trustees’ and Officers’ Fees and Benefits include amounts accrued by the Fund to pay remuneration to certain Trustees and Officers of the Fund. Trustees have the option to defer compensation payable by the Fund, and Trustees’ and Officers’ Fees and Benefits also include amounts accrued by the Fund to fund such deferred compensation amounts. Those Trustees who defer compensation have the option to select various Invesco Funds in which their deferral accounts shall be deemed to be invested. Finally, certain current Trustees were eligible to participate in a retirement plan that provided for benefits to be paid upon retirement to Trustees over a period of time based on the number of years of service. The Fund may have certain former Trustees who also participate in a retirement plan and receive benefits under such plan.Trustees’ and Officers’ Fees and Benefits include amounts accrued by the Fund to fund such retirement benefits. Obligations under the deferred compensation and retirement plans represent unsecured claims against the general assets of the Fund.
NOTE 7—Cash Balances
The Fund is permitted to temporarily carry a negative or overdrawn balance in its account with SSB, the custodian bank. Such balances, if any at period-end, are shown in the Statement of Assets and Liabilities under the payable captionAmount due custodian. To compensate the custodian bank for such overdrafts, the overdrawn Fund may either (1) leave funds as a compensating balance in the account so the custodian bank can be
compensated by earning the additional interest; or (2) compensate by paying the custodian bank at a rate agreed upon by the custodian bank and Invesco, not to exceed the contractually agreed upon rate.
NOTE 8—Distributions to Shareholders and Tax Components of Net Assets
| Tax Character of Distributions to Shareholders Paid During the Fiscal Years Ended April 30, 2019 and 2018 |
| | 2019 | 2018 |
| Ordinary income | $11,216,193 | $13,505,148 |
| Tax Components of Net Assets at Period-End: |
| | 2019 |
| Undistributed ordinary income | $1,014,031 |
| Net unrealized appreciation (depreciation) — investments | (179,062,458) |
| Net unrealized appreciation (depreciation) — foreign currencies | (3,386) |
| Temporary book/tax differences | (238,955) |
| Capital loss carryforward | (169,203,431) |
| Shares of beneficial interest | 771,717,737 |
| Total net assets | $424,223,538 |
The difference between book-basis and tax-basis unrealized appreciation (depreciation) is due to differences in the timing of recognition of gains and losses on investments for tax and book purposes. The Fund’s net unrealized appreciation (depreciation) difference is attributable primarily to wash sales.
The temporary book/tax differences are a result of timing differences between book and tax recognition of income and/or expenses. The Fund’s temporary book/tax differences are the result of the trustee deferral of compensation and retirement plan benefits.
Capital loss carryforward is calculated and reported as of a specific date. Results of transactions and other activity after that date may affect the amount of capital loss carryforward actually available for the Fund to utilize. Capital losses generated in years beginning after December 22, 2010 can be carried forward for an unlimited period, whereas previous losses expire in eight tax years. Capital losses with an expiration period may not be used to offset capital gains until all net capital losses without an expiration date have been utilized. Capital loss carryforwards with no expiration date will retain their character as either short-term or long-term capital losses instead of as short-term capital losses as under prior law. The ability to utilize capital loss carryforwards in the future may be limited under the Internal Revenue Code and related regulations based on the results of future transactions.
The Fund has a capital loss carryforward as of April 30, 2019, as follows:
| Capital Loss Carryforward* |
| Expiration | Short-Term | Long-Term | Total |
| Not subject to expiration | $12,291,622 | $156,911,809 | $169,203,431 |
| * | Capital loss carryforward as of the date listed above is reduced for limitations, if any, to the extent required by the Internal Revenue Code and may be further limited depending upon a variety of factors, including the realization of net unrealized gains or losses as of the date of any reorganization. |
NOTE 9—Investment Transactions
The aggregate amount of investment securities (other than short-term securities, U.S. Treasury obligations and money market funds, if any) purchased and sold by the Fund during the year ended April 30, 2019 was $88,907,693 and $178,436,116, respectively. Cost of investments, including any derivatives, on a tax basis includes the adjustments for financial reporting purposes as of the most recently completed federal income tax reporting period-end.
| Unrealized Appreciation (Depreciation) of Investments on a Tax Basis |
| Aggregate unrealized appreciation of investments | $31,402,324 |
| Aggregate unrealized (depreciation) of investments | (210,464,782) |
| Net unrealized appreciation (depreciation) of investments | $(179,062,458) |
Cost of investments for tax purposes is $605,886,861.
NOTE 10—Reclassification of Permanent Differences
Primarily as a result of differing book/tax treatment of foreign currency transactions, on April 30, 2019, undistributed net investment income was increased by $57,540 and undistributed net realized gain (loss) was decreased by $57,540. This reclassification had no effect on the net assets or the distributable earnings of the Fund.
NOTE 11—Share Information
| | Summary of Share Activity |
| | Years ended April 30, |
| | 2019(a) | | 2018 |
| | Shares | Amount | | Shares | Amount |
| Sold: | | | | | |
| Class A | 1,464,416 | $34,132,389 | | 1,931,192 | $45,912,812 |
| Class B(b) | — | — | | 1,343 | 27,448 |
| Class C | 236,293 | 4,670,105 | | 423,390 | 8,613,865 |
| Class Y | 1,091,434 | 26,784,693 | | 847,479 | 20,399,788 |
| Investor Class | 565,514 | 13,139,156 | | 788,760 | 18,695,135 |
| Class R5 | 100,263 | 2,443,016 | | 134,215 | 3,318,171 |
| Class R6 | 26,104 | 585,421 | | 8,439 | 213,623 |
| Issued as reinvestment of dividends: | | | | | |
| Class A | 291,586 | 5,645,072 | | 302,405 | 7,124,658 |
| Class B(b) | — | — | | 736 | 15,321 |
| Class C | 65,943 | 1,094,000 | | 45,140 | 912,278 |
| Class Y | 47,535 | 918,856 | | 54,393 | 1,280,949 |
| Investor Class | 129,930 | 2,503,751 | | 127,951 | 3,001,725 |
| Class R5 | 9,257 | 183,021 | | 10,033 | 241,599 |
| Class R6 | 545 | 10,764 | | 114 | 2,750 |
| Conversion of Class B shares to Class A shares:(c) | | | | | |
| Class A | — | — | | 71,192 | 1,909,364 |
| Class B | — | — | | (83,394) | (1,909,364) |
| Automatic conversion of Class C shares to Class A shares: | | | | | |
| Class A | 1,275,937 | 25,590,990 | | - | - |
| Class C | (1,489,808) | (25,590,990) | | - | - |
| Reacquired: | | | | | |
| Class A | (3,705,917) | (85,717,630) | | (5,885,253) | (140,232,404) |
| Class B(b) | — | — | | (72,139) | (1,499,840) |
| Class C | (1,142,265) | (22,843,739) | | (2,083,877) | (42,272,715) |
| Class Y | (1,468,924) | (34,093,691) | | (1,329,890) | (31,725,993) |
| Investor Class | (1,309,220) | (30,425,947) | | (2,162,883) | (51,370,904) |
| Class R5 | (133,548) | (3,291,228) | | (190,990) | (4,685,631) |
| Class R6 | (11,686) | (246,115) | | (1,943) | (46,691) |
| Net increase (decrease) in share activity | (3,956,611) | $(84,508,106) | | (7,063,587) | $(162,074,056) |
| (a) | There are entities that are record owners of more than 5% of the outstanding shares of the Fund and in the aggregate own 23% of the outstanding shares of the Fund. IDI has an agreement with these entities to sell Fund shares. The Fund, Invesco and/or Invesco affiliates may make payments to these entities, which are considered to be related to the Fund, for providing services to the Fund, Invesco and/or Invesco affiliates including but not limited to services such as securities brokerage, distribution, third party record keeping and account servicing. The Fund has no knowledge as to whether all or any portion of the shares owned of record by these entities are also owned beneficially. |
| (b) | Class B shares activity for the period May 1, 2017 through January 26, 2018 (date of conversion). |
| (c) | Effective as of the close of business on January 26, 2018, all outstanding Class B shares were converted to Class A shares. |
Report of Independent Registered Public Accounting Firm
To the Board of Trustees of AIM Sector Funds (Invesco Sector Funds) and Shareholders of Invesco Energy Fund:
Opinion on the Financial Statements
We have audited the accompanying statement of assets and liabilities, including the schedule of investments, of Invesco Energy Fund (one of the funds constituting AIM Sector Funds (Invesco Sector Funds), hereafter referred to as the “Fund”) as of April 30, 2019, the related statement of operations for the year ended April 30, 2019, the statement of changes in net assets for each of the two years in the period ended April 30, 2019, including the related notes, and the financial highlights for each of the periods indicated therein (collectively referred to as the “financial statements”). In our opinion, the financial statements present fairly, in all material respects, the financial position of the Fund as of April 30, 2019, the results of its operations for the year then ended, the changes in its net assets for each of the two years in the period ended April 30, 2019 and the financial highlights for each of the periods indicated therein in conformity with accounting principles generally accepted in the United States of America.
Basis for Opinion
These financial statements are the responsibility of the Fund’s management. Our responsibility is to express an opinion on the Fund’s financial statements based on our audits. We are a public accounting firm registered with the Public Company Accounting Oversight Board (United States) (“PCAOB”) and are required to be independent with respect to the Fund in accordance with the U.S. federal securities laws and the applicable rules and regulations of the Securities and Exchange Commission and the PCAOB.
We conducted our audits of these financial statements in accordance with the standards of the PCAOB. Those standards require that we plan and perform the audit to obtain reasonable assurance about whether the financial statements are free of material misstatement, whether due to error or fraud.
Our audits included performing procedures to assess the risks of material misstatement of the financial statements, whether due to error or fraud, and performing procedures that respond to those risks. Such procedures included examining, on a test basis, evidence regarding the amounts and disclosures in the financial statements. Our audits also included evaluating the accounting principles used and significant estimates made by management, as well as evaluating the overall presentation of the financial statements. Our procedures included confirmation of securities owned as of April 30, 2019 by correspondence with the custodian, transfer agent and brokers; when replies were not received from brokers, we performed other auditing procedures. We believe that our audits provide a reasonable basis for our opinion.
PricewaterhouseCoopers LLP
Houston, TX
June 26, 2019
We have served as the auditor of one or more of the investment companies in the Invesco group of investment companies since at least 1995. We have not been able to determine the specific year we began serving as auditor.
Calculating your ongoing Fund expenses
Example
As a shareholder of the Fund, you incur two types of costs: (1) transaction costs, which may include sales charges (loads) on purchase payments or contingent deferred sales charges on redemptions, if any; and (2) ongoing costs, including management fees, distribution and/or service (12b-1) fees, and other Fund expenses. This example is intended to help you understand your ongoing costs (in dollars) of investing in the Fund and to compare these costs with ongoing costs of investing in other mutual funds. The example is based on an investment of $1,000 invested at the beginning of the period and held for the entire period November 1, 2018 through April 30, 2019.
Actual expenses
The table below provides information about actual account values and actual expenses. You may use the information in this table, together with the amount you invested, to estimate the expenses that you paid over the period. Simply divide your account value by $1,000 (for example, an $8,600 account value divided by $1,000 = 8.6), then multiply the result by the number in the table under the heading entitled “Actual Expenses Paid During Period” to estimate the expenses you paid on your account during this period.
Hypothetical example for comparison purposes
The table below also provides information about hypothetical account values and hypothetical expenses based on the Fund’s actual expense ratio and an assumed rate of return of 5% per year before expenses, which is not the Fund’s actual return.
The hypothetical account values and expenses may not be used to estimate the actual ending account balance or expenses you paid for the period. You may use this information to compare the ongoing costs of investing in the Fund and other funds. To do so, compare this 5% hypothetical example with the 5% hypothetical examples that appear in the shareholder reports of the other funds.
Please note that the expenses shown in the table are meant to highlight your ongoing costs only and do not reflect any transaction costs, such as sales charges (loads) on purchase payments or contingent deferred sales charges on redemptions, if any. Therefore, the hypothetical information is useful in comparing ongoing costs only, and will not help you determine the relative total costs of owning different funds. In addition, if these transaction costs were included, your costs would have been higher.
| | Beginning
Account Value (11/01/18) | ACTUAL | HYPOTHETICAL
(5% annual return before
expenses) | Annualized
Expense
Ratio |
Ending
Account Value
(04/30/19)1 | Expenses
Paid During
Period2 | Ending
Account Value
(04/30/19) | Expenses
Paid During
Period2 |
| Class A | $1,000.00 | $952.90 | $6.68 | $1,017.95 | $6.90 | 1.38% |
| Class C | 1,000.00 | 949.40 | 10.30 | 1,014.23 | 10.64 | 2.13 |
| Class Y | 1,000.00 | 954.20 | 5.48 | 1,019.19 | 5.66 | 1.13 |
| Investor Class | 1,000.00 | 953.20 | 6.68 | 1,017.95 | 6.90 | 1.38 |
| Class R5 | 1,000.00 | 955.10 | 4.41 | 1,020.28 | 4.56 | 0.91 |
| Class R6 | 1,000.00 | 954.90 | 4.36 | 1,020.33 | 4.51 | 0.90 |
| 1 | The actual ending account value is based on the actual total return of the Fund for the period November 1, 2018 through April 30, 2019, after actual expenses and will differ from the hypothetical ending account value which is based on the Fund’s expense ratio and a hypothetical annual return of 5% before expenses. |
| 2 | Expenses are equal to the Fund’s annualized expense ratio as indicated above multiplied by the average account value over the period, multiplied by 181/365 to reflect the most recent fiscal half year. |
Tax Information
Form 1099-DIV, Form 1042-S and other year–end tax information provide shareholders with actual calendar year amounts that should be included in their tax returns. Shareholders should consult their tax advisers.
The following distribution information is being provided as required by the Internal Revenue Code or to meet a specific state’s requirement.
The Fund designates the following amounts or, if subsequently determined to be different, the maximum amount allowable for its fiscal year ended April 30, 2019:
| Federal and State Income Tax | |
| Qualified Dividend Income* | 93.70% |
| Corporate Dividends Received Deduction* | 100.00% |
| U.S. Treasury Obligations* | 0.00% |
| * | The above percentages are based on ordinary income dividends paid to shareholders during the Fund’s fiscal year. |
Trustees and Officers
The address of each trustee and officer is AIM Sector Funds (Invesco Sector Funds) (the “Trust”), 11 Greenway Plaza, Suite 1000, Houston, Texas 77046-1173. The trustees serve for the life of the Trust, subject to their earlier death, incapacitation, resignation, retirement or removal as more specifically provided in the Trust’s organizational documents. Each officer serves for a one year term or until their successors are elected and qualified. Column two below includes length of time served with predecessor entities, if any.
| | | | | | | | |
Name, Year of Birth and
Position(s) Held with the Trust | | Trustee and/
or Officer Since | | Principal Occupation(s)
During Past 5 Years | | Number of Funds in Fund
Complex
Overseen by
Trustee | | Other Directorship(s)
Held by Trustee During
Past 5 Years |
| Interested Persons | | | | | | | | |
Martin L. Flanagan1 — 1960 Trustee and Vice Chair | | 2007 | | Executive Director, Chief Executive Officer and President, Invesco Ltd. (ultimate parent of Invesco and a global investment management firm); Trustee and Vice Chair, The Invesco Funds; Vice Chair, Investment Company Institute; and Member of Executive Board, SMU Cox School of Business Formerly: Advisor to the Board, Invesco Advisers, Inc. (formerly known as Invesco Institutional (N.A.), Inc.); Chairman and Chief Executive Officer, Invesco Advisers, Inc. (registered investment adviser); Director, Chairman, Chief Executive Officer and President, Invesco Holding Company (US), Inc. (formerly IVZ Inc.) (holding company), Invesco Group Services, Inc. (service provider) and Invesco North American Holdings, Inc. (holding company); Director, Chief Executive Officer and President, Invesco Holding Company Limited (parent of Invesco and a global investment management firm); Director, Invesco Ltd.; Chairman, Investment Company Institute and President,Co-Chief Executive Officer,Co-President, Chief Operating Officer and Chief Financial Officer, Franklin Resources, Inc. (global investment management organization) | | 241 | | None |
Philip A. Taylor2 — 1954 Trustee | | 2006 | | Vice Chair, Invesco Ltd.; Director, Invesco Canada Ltd. (formerly known as Invesco Trimark Ltd./Invesco Trimark Ltèe) (registered investment adviser and registered transfer agent); Trustee, The Invesco Funds Formerly: Head of the Americas and Senior Managing Director, Invesco Ltd.; Director, Invesco Advisers, Inc. (formerly known as Invesco Institutional (N.A.), Inc.) (registered investment adviser); Director and Chairman, Invesco Investment Services, Inc. (formerly known as Invesco AIM Investment Services, Inc.) (registered transfer agent); Chief Executive Officer, Invesco Corporate Class Inc. (corporate mutual fund company); Chairman and Chief Executive Officer, Invesco Canada Ltd. (formerly known as Invesco Trimark Ltd./Invesco Trimark Ltèe) (registered investment adviser and registered transfer agent); Senior Vice President, The Invesco Funds; Director, Invesco Investment Advisers LLC (formerly known as Van Kampen Asset Management); Director, Chairman, Chief Executive Officer and President, Invesco Management Group, Inc. (formerly known as Invesco AIM Management Group, Inc.) (financial services holding company);Co-Chairman,Co-President andCo-Chief Executive Officer, Invesco Advisers, Inc. (formerly known as Invesco Institutional (N.A.), Inc.) (registered investment adviser); Director, Chief Executive Officer and President, Van Kampen Exchange Corp; President and Principal Executive Officer, The Invesco Funds (other than AIM Treasurer’s Series Trust (Invesco Treasurer’s Series Trust), Short-Term Investments Trust and Invesco Management Trust); Executive Vice President, The Invesco Funds (AIM Treasurer’s Series Trust (Invesco Treasurer’s Series Trust), Short-Term Investments Trust and Invesco Management Trust only); Director and President, INVESCO Funds Group, Inc. (registered investment adviser and registered transfer agent); Director and Chairman, IVZ Distributors, Inc. (formerly known as INVESCO Distributors, Inc.) (registered broker dealer); Director, President and Chairman, Invesco Inc. (holding company), Invesco Canada Holdings Inc. (holding company), Trimark Investments Ltd./Placements Trimark Ltèe and Invesco Financial Services Ltd/Services Financiers Invesco Ltèe; Chief Executive Officer, Invesco Canada Fund Inc. (corporate mutual fund company); Director and Chairman, Van Kampen Investor Services Inc.; Director, Chief Executive Officer and President, 1371 Preferred Inc. (holding company) and Van Kampen Investments Inc.; Director and President, AIM GP Canada Inc. (general partner for limited partnerships) and Van Kampen Advisors, Inc.; Director and Chief Executive Officer, Invesco Trimark Dealer Inc. (registered broker dealer); Director, Invesco Distributors, Inc. (formerly known as Invesco AIM Distributors, Inc.) (registered broker dealer); Manager, Invesco Capital Management LLC; Director, Chief Executive Officer and President, Invesco Advisers, Inc.; Director, Chairman, Chief Executive Officer and President, Invesco AIM Capital Management, Inc.; President, Invesco Trimark Dealer Inc. and Invesco Trimark Ltd./Invesco Trimark Ltèe; Director and President, AIM Trimark Corporate Class Inc. and AIM Trimark Canada Fund Inc.; Senior Managing Director, Invesco Holding Company Limited; Director and Chairman, Fund Management Company (former registered broker dealer); President and Principal Executive Officer, The Invesco Funds (AIM Treasurer’s Series Trust (Invesco Treasurer’s Series Trust), and Short-Term Investments Trust only); President, AIM Trimark Global Fund Inc. and AIM Trimark Canada Fund Inc. | | 241 | | None |
| 1 | Mr. Flanagan is considered an interested person (within the meaning of Section 2(a)(19) of the 1940 Act) of the Trust because he is an officer of the Adviser to the Trust, and an officer and a director of Invesco Ltd., ultimate parent of the Adviser. |
| 2 | Mr. Taylor is considered an interested person (within the meaning of Section 2(a)(19) of the 1940 Act) of the Trust because he is an officer of Invesco Ltd., ultimate parent of the Adviser. |
T-1 Invesco Energy Fund
Trustees and Officers—(continued)
| | | | | | | | |
Name, Year of Birth and
Position(s) Held with the Trust | | Trustee and/
or Officer Since | | Principal Occupation(s)
During Past 5 Years | | Number of Funds in Fund
Complex
Overseen by
Trustee | | Other Directorship(s)
Held by Trustee During
Past 5 Years |
| Independent Trustees | | | | | | | | |
Bruce L. Crockett — 1944 Trustee and Chair | | 2003 | | Chairman, Crockett Technologies Associates (technology consulting company) Formerly: Director, Captaris (unified messaging provider); Director, President and Chief Executive Officer, COMSAT Corporation; Chairman, Board of Governors of INTELSAT (international communications company); ACE Limited (insurance company); Independent Directors Council and Investment Company Institute: Member of the Audit Committee, Investment Company Institute; Member of the Executive Committee and Chair of the Governance Committee, Independent Directors Council | | 241 | | Director and Chairman of the Audit Committee, ALPS (Attorneys Liability Protection Society) (insurance company); Director and Member of the Audit Committee and Compensation Committee, Ferroglobe PLC (metallurgical company) |
David C. Arch — 1945 Trustee | | 2010 | | Chairman of Blistex Inc. (consumer health care products manufacturer); Member, World Presidents’ Organization | | 241 | | Board member of the Illinois Manufacturers’ Association |
Beth Ann Brown3 — 1968 Trustee | | 2019 | | Independent Consultant Formerly: Head of Intermediary Distribution, Managing Director, Strategic Relations, Managing Director, Head of National Accounts, Senior Vice President, National Account Manager and Senior Vice President, Key Account Manager, Columbia Management Investment Advisers LLC; Vice President, Key Account Manager, Liberty Funds Distributor, Inc.; and Trustee of certain Oppenheimer Funds | | 225 | | Director, Board of Directors of Caron Engineering Inc.; Advisor, Board of Advisors of Caron Engineering Inc.; President and Director, Acton Shapleigh Youth Conservation Corps (non -profit); and Vice President and Director of Grahamtastic Connection(non-profit) |
Jack M. Fields — 1952 Trustee | | 2003 | | Chief Executive Officer, Twenty First Century Group, Inc. (government affairs company); and Chairman, Discovery Learning Alliance(non-profit) Formerly: Owner and Chief Executive Officer, Dos Angeles Ranch L.P. (cattle, hunting, corporate entertainment); Director, Insperity, Inc. (formerly known as Administaff) (human resources provider); Chief Executive Officer, Texana Timber LP (sustainable forestry company); Director of Cross Timbers Quail Research Ranch(non-profit); and member of the U.S. House of Representatives | | 241 | | None |
Cynthia Hostetler — 1962 Trustee | | 2017 | | Non-Executive Director and Trustee of a number of public and private business corporations Formerly: Director, Aberdeen Investment Funds (4 portfolios); Head of Investment Funds and Private Equity, Overseas Private Investment Corporation; President, First Manhattan Bancorporation, Inc.; Attorney, Simpson Thacher & Bartlett LLP | | 241 | | Vulcan Materials Company (construction materials company); Trilinc Global Impact Fund; Genesee & Wyoming, Inc. (railroads); Artio Global Investment LLC (mutual fund complex); Edgen Group, Inc. (specialized energy and infrastructure products distributor); Investment Company Institute (professional organization); Independent Directors Council (professional organization) |
Eli Jones — 1961 Trustee | | 2016 | | Professor and Dean, Mays Business School — Texas A&M University Formerly: Professor and Dean, Walton College of Business, University of Arkansas and E.J. Ourso College of Business, Louisiana State University; Director, Arvest Bank | | 241 | | Insperity, Inc. (formerly known as Administaff) (human resources provider) |
Elizabeth Krentzman3 — 1959 Trustee | | 2019 | | Formerly: Principal and Chief Regulatory Advisor for Asset Management Services and U.S. Mutual Fund Leader of Deloitte & Touche LLP; General Counsel of the Investment Company Institute (trade association); National Director of the Investment Management Regulatory Consulting Practice, Principal, Director and Senior Manager of Deloitte & Touche LLP; Assistant Director of the Division of Investment Management — Office of Disclosure and Investment Adviser Regulation of the U.S. Securities and Exchange Commission and various positions with the Division of Investment Management — Office of Regulatory Policy of the U.S. Securities and Exchange Commission; Associate at Ropes & Gray LLP; Advisory Board Member of the Securities and Exchange Commission Historical Society; and Trustee of certain Oppenheimer Funds | | 225 | | Trustee of the University of Florida National Board Foundation and Audit Committee Member; Member of the Cartica Funds Board of Directors (private investment funds); Member of the University of Florida Law Center Association, Inc. Board of Trustees and Audit Committee Member |
Anthony J. LaCava, Jr. — 1956 Trustee | | 2019 | | Formerly: Director and Member of the Audit Committee, Blue Hills Bank (publicly traded financial institution) and Managing Partner, KPMG LLP | | 241 | | Blue Hills Bank; Chairman, Bentley University; Member, Business School Advisory Council; and Nominating Committee, KPMG LLP |
Prema Mathai-Davis — 1950 Trustee | | 2003 | | Retired Co-Owner & Partner of Quantalytics Research, LLC, (a FinTech Investment Research Platform for the Self-Directed Investor) | | 241 | | None |
| 3 | Mss. Brown and Krentzman and Messrs. Motley, Vandivort and Vaughn were appointed as Trustees of the Trust effective June 10, 2019. |
T-2 Invesco Energy Fund
Trustees and Officers—(continued)
| | | | | | | | |
Name, Year of Birth and
Position(s) Held with the Trust | | Trustee and/
or Officer Since | | Principal Occupation(s)
During Past 5 Years | | Number of Funds in Fund
Complex
Overseen by
Trustee | | Other Directorship(s)
Held by Trustee During
Past 5 Years |
| Independent Trustees—(continued) |
Joel W. Motley3 — 1952 Trustee | | 2019 | | Director of Office of Finance, Federal Home Loan Bank; Member of the Vestry of Trinity Wall Street; Managing Director of Carmona Motley Inc. (privately held financial advisor); Member of the Finance and Budget Committee of the Council on Foreign Relations, Member of the Investment Committee and Board of Human Rights Watch and Member of the Investment Committee and Board of Historic Hudson Valley(non-profit cultural organization) Formerly: Managing Director of Public Capital Advisors, LLC (privately held financial advisor); Managing Director of Carmona Motley Hoffman, Inc. (privately held financial advisor); Trustee of certain Oppenheimer Funds; and Director of Columbia Equity Financial Corp. (privately held financial advisor) | | 225 | | Director of Greenwall Foundation (bioethics research foundation); Member of Board and Investment Committee of The Greenwall Foundation; Director of Southern Africa Legal Services Foundation; Board Member and Investment Committee Member of Pulitzer Center for Crisis Reporting(non-profit journalism) |
Teresa M. Ressel — 1962 Trustee | | 2017 | | Non-executive director and trustee of a number of public and private business corporations Formerly: Chief Financial Officer, Olayan America, The Olayan Group (international investor/commercial/industrial); Chief Executive Officer, UBS Securities LLC; Group Chief Operating Officer, Americas, UBS AG; Assistant Secretary for Management & Budget and CFO, US Department of the Treasury | | 241 | | Atlantic Power Corporation (power generation company); ON Semiconductor Corp. (semiconductor supplier) |
Ann Barnett Stern — 1957 Trustee | | 2017 | | President and Chief Executive Officer, Houston Endowment Inc. (private philanthropic institution) Formerly: Executive Vice President and General Counsel, Texas Children’s Hospital; Attorney, Beck, Redden and Secrest, LLP; Business Law Instructor, University of St. Thomas; Attorney, Andrews & Kurth LLP | | 241 | | Federal Reserve Bank of Dallas |
Raymond Stickel, Jr. — 1944 Trustee | | 2005 | | Retired Formerly: Director, Mainstay VP Series Funds, Inc. (25 portfolios); Partner, Deloitte & Touche | | 241 | | None |
Robert C. Troccoli — 1949 Trustee | | 2016 | | Adjunct Professor, University of Denver — Daniels College of Business Formerly: Senior Partner, KPMG LLP | | 241 | | None |
Daniel S. Vandivort3 — 1954 Trustee | | 2019 | | Treasurer, Chairman of the Audit and Finance Committee, and Trustee, Board of Trustees, Huntington Disease Foundation of America; and President, Flyway Advisory Services LLC (consulting and property management) Formerly: Trustee and Governance Chair, of certain Oppenheimer Funds | | 225 | | Chairman and Lead Independent Director, Chairman of the Audit Committee, and Director, Board of Directors, Value Line Funds |
James D. Vaughn3 — 1945 Trustee | | 2019 | | Retired Formerly: Managing Partner, Deloitte & Touche LLP; Trustee and Chairman of the Audit Committee, Schroder Funds; Board Member, Mile High United Way, Boys and Girls Clubs, Boy Scouts, Colorado Business Committee for the Arts, Economic Club of Colorado and Metro Denver Network (economic development corporation); and Trustee of certain Oppenheimer Funds | | 225 | | Board member and Chairman of Audit Committee of AMG National Trust Bank; Trustee and Investment Committee member, University of South Dakota Foundation; Board member, Audit Committee Member and past Board Chair, Junior Achievement(non-profit) |
Christopher L. Wilson — 1957 Trustee and Vice Chair | | 2017 | | Non-executive director and trustee of a number of public and private business corporations Formerly: Director, TD Asset Management USA Inc. (mutual fund complex) (22 portfolios); Managing Partner, CT2, LLC (investing and consulting firm); President/Chief Executive Officer, Columbia Funds, Bank of America Corporation; President/Chief Executive Officer, CDC IXIS Asset Management Services, Inc.; Principal & Director of Operations, Scudder Funds, Scudder, Stevens & Clark, Inc.; Assistant Vice President, Fidelity Investments | | 241 | | ISO New England, Inc.(non-profit organization managing regional electricity market) |
| Other Officers | | | | | | | | |
Sheri Morris — 1964 President, Principal Executive Officer and Treasurer | | 2003 | | President, Principal Executive Officer and Treasurer, The Invesco Funds; Vice President, Invesco Advisers, Inc. (formerly known as Invesco Institutional (N.A.), Inc.) (registered investment adviser); and Vice President, Invesco Exchange-Traded Fund Trust, Invesco Exchange-Traded Fund Trust II, Invesco India Exchange-Traded Fund Trust, Invesco Actively Managed Exchange-Traded Fund Trust, Invesco Actively Managed Exchange-Traded Commodity Fund Trust and Invesco Exchange-Traded Self-Indexed Fund Trust Formerly: Vice President and Principal Financial Officer, The Invesco Funds; Vice President, Invesco AIM Advisers, Inc., Invesco AIM Capital Management, Inc. and Invesco AIM Private Asset Management, Inc.; Assistant Vice President and Assistant Treasurer, The Invesco Funds and Assistant Vice President, Invesco Advisers, Inc., Invesco AIM Capital Management, Inc. and Invesco AIM Private Asset Management, Inc.; and Treasurer, Invesco Exchange-Traded Fund Trust, Invesco Exchange-Traded Fund Trust II, Invesco India Exchange-Traded Fund Trust and Invesco Actively Managed Exchange-Traded Fund Trust | | N/A | | N/A |
Russell C. Burk — 1958 Senior Vice President and Senior Officer | | 2005 | | Senior Vice President and Senior Officer, The Invesco Funds | | N/A | | N/A |
| 3 | Mss. Brown and Krentzman and Messrs. Motley, Vandivort and Vaughn were appointed as Trustees of the Trust effective June 10, 2019. |
T-3 Invesco Energy Fund
Trustees and Officers—(continued)
| | | | | | | | |
Name, Year of Birth and
Position(s) Held with the Trust | | Trustee and/
or Officer Since | | Principal Occupation(s)
During Past 5 Years | | Number of Funds in Fund
Complex
Overseen by
Trustee | | Other Directorship(s)
Held by Trustee During
Past 5 Years |
| Other Officers—(continued) | | | | | | | | |
Jeffrey H. Kupor — 1968 Senior Vice President, Chief Legal Officer and Secretary | | 2018 | | Head of Legal of the Americas, Invesco Ltd.; Senior Vice President and Secretary, Invesco Advisers, Inc. (formerly known as Invesco Institutional (N.A.), Inc.) (registered investment adviser); Senior Vice President and Secretary, Invesco Distributors, Inc. (formerly known as Invesco AIM Distributors, Inc.); Vice President and Secretary, Invesco Investment Services, Inc. (formerly known as Invesco AIM Investment Services, Inc.) Senior Vice President, Chief Legal Officer and Secretary, The Invesco Funds; Secretary and General Counsel, Invesco Investment Advisers LLC (formerly known as Van Kampen Asset Management); Secretary and General Counsel, Invesco Capital Markets, Inc. (formerly known as Van Kampen Funds Inc.) and Chief Legal Officer, Invesco Exchange-Traded Fund Trust, Invesco Exchange-Traded Fund Trust II, Invesco India Exchange-Traded Fund Trust, Invesco Actively Managed Exchange-Traded Fund Trust, Invesco Actively Managed Exchange-Traded Commodity Fund Trust and Invesco Exchange-Traded Self-Indexed Fund Trust; Secretary, Invesco Indexing LLC; Secretary, W.L. Ross & Co., LLC; Secretary and Vice President, Jemstep, Inc. Formerly: Head of Legal, Worldwide Institutional, Invesco Ltd.; Secretary and General Counsel, INVESCO Private Capital Investments, Inc.; Senior Vice President, Secretary and General Counsel, Invesco Management Group, Inc. (formerly known as Invesco AIM Management Group, Inc.); Assistant Secretary, INVESCO Asset Management (Bermuda) Ltd.; Secretary and General Counsel, Invesco Private Capital, Inc.; Assistant Secretary and General Counsel, INVESCO Realty, Inc.; Secretary and General Counsel, Invesco Senior Secured Management, Inc.; and Secretary, Sovereign G./P. Holdings Inc. | | N/A | | N/A |
Andrew R. Schlossberg — 1974 Senior Vice President | | 2019 | | Head of the Americas and Senior Managing Director, Invesco Ltd.; Director and Senior Vice President, Invesco Advisers, Inc. (formerly known as Invesco Institutional (N.A.), Inc.) (registered investment adviser); Director and Chairman, Invesco Investment Services, Inc. (formerly known as Invesco AIM Investment Services, Inc.) (registered transfer agent); Senior Vice President, The Invesco Funds; Director, Invesco Investment Advisers LLC (formerly known as Van Kampen Asset Management) and Invesco UK Limited; Director, President and Chairman, Invesco Insurance Agency, Inc.; Director and Chief Executive, Invesco Asset Management Limited and Invesco Fund Managers Limited Formerly: Assistant Vice President, The Invesco Funds; Senior Vice President, Invesco Advisers, Inc. (formerly known as Invesco Institutional (N.A.), Inc.) (registered investment adviser); Director and Chief Executive, Invesco Administration Services Limited and Invesco Global Investment Funds Limited; Director, Invesco Distributors, Inc.; Head of EMEA, Invesco Ltd.; President, Invesco Actively Managed Exchange-Traded Commodity Fund Trust, Invesco Actively Managed Exchange-Traded Fund Trust, Invesco Exchange-Traded Fund Trust, Invesco Exchange-Traded Fund Trust II and Invesco India Exchange-Traded Fund Trust; Managing Director and Principal Executive Officer, Invesco Capital Management LLC | | N/A | | N/A |
John M. Zerr — 1962 Senior Vice President | | 2006 | | Chief Operating Officer of the Americas; Senior Vice President, Invesco Advisers, Inc. (formerly known as Invesco Institutional (N.A.), Inc.) (registered investment adviser); Senior Vice President, Invesco Distributors, Inc. (formerly known as Invesco AIM Distributors, Inc.); Director and Vice President, Invesco Investment Services, Inc. (formerly known as Invesco AIM Investment Services, Inc.) Senior Vice President, The Invesco Funds; Managing Director, Invesco Capital Management LLC; Director, Invesco Investment Advisers LLC (formerly known as Van Kampen Asset Management); Senior Vice President, Invesco Capital Markets, Inc. (formerly known as Van Kampen Funds Inc.); Manager, Invesco Indexing LLC; Director and Senior Vice President, Invesco Insurance Agency, Inc.; Invesco Canada Funds Advisory Board Member; Director, President Chief Executive Officer, Invesco Corporate Class Inc. (corporate mutual fund company); and Director, Chairman, President and Chief Executive Officer, Invesco Canada Ltd. (formerly known as Invesco Trimark Ltd./Invesco Trimark Ltèe) (registered investment adviser and registered transfer agent) Formerly: Director and Senior Vice President, Invesco Management Group, Inc. (formerly known as Invesco AIM Management Group, Inc.); Secretary and General Counsel, Invesco Management Group, Inc. (formerly known as Invesco AIM Management Group, Inc.); Secretary, Invesco Investment Services, Inc. (formerly known as Invesco AIM Investment Services, Inc.); Chief Legal Officer and Secretary, The Invesco Funds; Secretary and General Counsel, Invesco Investment Advisers LLC (formerly known as Van Kampen Asset Management); Secretary and General Counsel, Invesco Capital Markets, Inc. (formerly known as Van Kampen Funds Inc.); Chief Legal Officer, Invesco Exchange-Traded Fund Trust, Invesco Exchange-Traded Fund Trust II, Invesco India Exchange-Traded Fund Trust, Invesco Actively Managed Exchange-Traded Fund Trust, Invesco Actively Managed Exchange-Traded Commodity Fund Trust and Invesco Exchange-Traded Self-Indexed Fund Trust; Secretary, Invesco Indexing LLC; Director, Secretary, General Counsel and Senior Vice President, Van Kampen Exchange Corp.; Director, Vice President and Secretary, IVZ Distributors, Inc. (formerly known as INVESCO Distributors, Inc.); Director and Vice President, INVESCO Funds Group, Inc.; Director and Vice President, Van Kampen Advisors Inc.; Director, Vice President, Secretary and General Counsel, Van Kampen Investor Services Inc.; Director and Secretary, Invesco Distributors, Inc. (formerly known as Invesco AIM Distributors, Inc.); Director, Senior Vice President, General Counsel and Secretary, Invesco AIM Advisers, Inc. and Van Kampen Investments Inc.; Director, Vice President and Secretary, Fund Management Company; Director, Senior Vice President, Secretary, General Counsel and Vice President, Invesco AIM Capital Management, Inc.; Chief Operating Officer and General Counsel, Liberty Ridge Capital, Inc. (an investment adviser) | | N/A | | N/A |
T-4 Invesco Energy Fund
Trustees and Officers—(continued)
| | | | | | | | |
Name, Year of Birth and
Position(s) Held with the Trust | | Trustee and/
or Officer Since | | Principal Occupation(s)
During Past 5 Years | | Number of Funds in Fund
Complex
Overseen by
Trustee | | Other Directorship(s)
Held by Trustee During
Past 5 Years |
| Other Officers—(continued) | | | | | | | | |
Gregory G. McGreevey — 1962 Senior Vice President | | 2012 | | Senior Managing Director, Invesco Ltd.; Director, Chairman, President, and Chief Executive Officer, Invesco Advisers, Inc. (formerly known as Invesco Institutional (N.A.), Inc.) (registered investment adviser); Director, Invesco Mortgage Capital, Inc. and Invesco Senior Secured Management, Inc.; and Senior Vice President, The Invesco Funds Formerly: Senior Vice President, Invesco Management Group, Inc. and Invesco Advisers, Inc.; Assistant Vice President, The Invesco Funds | | N/A | | N/A |
Kelli Gallegos — 1970 Vice President, Principal Financial Officer and Assistant Treasurer | | 2008 | | Assistant Treasurer, Invesco Specialized Products, LLC; Vice President, Principal Financial Officer and Assistant Treasurer, The Invesco Funds; Principal Financial and Accounting Officer — Pooled Investments, Invesco Capital Management LLC; Vice President and Treasurer, Invesco Exchange-Traded Fund Trust, Invesco Exchange-Traded Fund Trust II, Invesco India Exchange-Traded Fund Trust, Invesco Actively Managed Exchange-Traded Fund Trust, Invesco Actively Managed Exchange-Traded Commodity Fund Trust and Invesco Exchange-Traded Self-Indexed Fund Trust Formerly: Assistant Treasurer, Invesco Exchange-Traded Fund Trust, Invesco Exchange-Traded Fund Trust II, Invesco India Exchange-Traded Fund Trust, Invesco Actively Managed Exchange-Traded Fund Trust, Invesco Actively Managed Exchange-Traded Commodity Fund Trust and Invesco Exchange-Traded Self-Indexed Fund Trust; Assistant Treasurer, Invesco Capital Management LLC; Assistant Vice President, The Invesco Funds | | N/A | | N/A |
Crissie M. Wisdom — 1969 Anti-Money Laundering Compliance Officer | | 2013 | | Anti-Money Laundering Compliance Officer, Invesco Advisers, Inc. (formerly known as Invesco Institutional (N.A.), Inc.) (registered investment adviser), Invesco Capital Markets, Inc. (formerly known as Van Kampen Funds Inc.), Invesco Distributors, Inc., Invesco Investment Services, Inc., The Invesco Funds, and Invesco Exchange-Traded Fund Trust, Invesco Exchange-Traded Fund Trust II, Invesco India Exchange-Traded Fund Trust, Invesco Actively Managed Exchange-Traded Fund Trust, Invesco Actively Managed Exchange-Traded Commodity Fund Trust and Invesco Exchange-Traded Self-Indexed Fund Trust; Anti-Money Laundering Compliance Officer and Bank Secrecy Act Officer, INVESCO National Trust Company and Invesco Trust Company; and Fraud Prevention Manager and Controls and Risk Analysis Manager for Invesco Investment Services, Inc. Formerly: Anti-Money Laundering Compliance Officer, Van Kampen Exchange Corp. and Invesco Management Group, Inc. | | N/A | | N/A |
Robert R. Leveille — 1969 Chief Compliance Officer | | 2016 | | Chief Compliance Officer, Invesco Advisers, Inc. (registered investment adviser); and Chief Compliance Officer, The Invesco Funds Formerly: Chief Compliance Officer, Putnam Investments and the Putnam Funds | | N/A | | N/A |
The Statement of Additional Information of the Trust includes additional information about the Fund’s Trustees and is available upon request, without charge, by calling 1.800.959.4246. Please refer to the Fund’s Statement of Additional Information for information on the Fund’ssub-advisers.
| | | | | | |
Office of the Fund 11 Greenway Plaza, Suite 1000 Houston, TX 77046-1173 | | Investment Adviser Invesco Advisers, Inc. 1555 Peachtree Street, N.E. Atlanta, GA 30309 | | Distributor Invesco Distributors, Inc. 11 Greenway Plaza, Suite 1000 Houston, TX 77046-1173 | | Auditors PricewaterhouseCoopers LLP 1000 Louisiana Street, Suite 5800 Houston, TX 77002-5021 |
| | | |
| | | | | | |
Counsel to the Fund Stradley Ronon Stevens & Young, LLP 2005 Market Street, Suite 2600 Philadelphia, PA 19103-7018 | | Counsel to the Independent Trustees Goodwin Procter LLP 901 New York Avenue, N.W. Washington, D.C. 20001 | | Transfer Agent Invesco Investment Services, Inc. 11 Greenway Plaza, Suite 1000 Houston, TX 77046-1173 | | Custodian State Street Bank and Trust Company 225 Franklin Street Boston, MA 02110-2801 |
T-5 Invesco Energy Fund
(This page intentionally left blank)
(This page intentionally left blank)
(This page intentionally left blank)
Go paperless with eDelivery
Visit invesco.com/edelivery to enjoy the convenience and security of anytime electronic access to your investment documents.
With eDelivery, you can elect to have any or all of the following materials delivered straight to your inbox to download, save and print from your own computer:
| • | Fund reports and prospectuses |
| • | Quarterly statements |
| • | Daily confirmations |
| • | Tax forms |
Invesco mailing information
Send general correspondence to Invesco Investment Services, Inc., P.O. Box 219078, Kansas City, MO 64121-9078.
Important notice regarding delivery of security holder documents
To reduce Fund expenses, only one copy of most shareholder documents may be mailed to shareholders with multiple accounts at the same address (Householding). Mailing of your shareholder documents may be householded indefinitely unless you instruct us otherwise. If you do not want the mailing of these documents to be combined with those for other members of your household, please contact Invesco Investment Services, Inc. at 800 959 4246 or contact your financial institution. We will begin sending you individual copies for each account within 30 days after receiving your request.
Fund holdings and proxy voting information
The Fund provides a complete list of its holdings four times in each fiscal year, at the quarter-ends. For the second and fourth quarters, the list appears in the Fund’s semiannual and annual reports to shareholders. For the first and third quarters, the Fund files the lists with the Securities and Exchange Commission (SEC) on Form N-Q (or any successor Form). The most recent list of portfolio holdings is available at invesco.com/completeqtrholdings. Shareholders can also look up the Fund’s Form N-Q (or any successor Form) filings on the SEC website, sec.gov. The SEC file numbers for the Fund are shown below.
A description of the policies and procedures that the Fund uses to determine how to vote proxies relating to portfolio securities is available without charge, upon request, from our Client Services department at 800 959 4246, or at invesco.com/proxyguidelines. The information is also available on the SEC website, sec.gov.
Information regarding how the Fund voted proxies related to its portfolio securities during the most recent 12-month period ended June 30 is available at invesco.com/proxysearch. This information is also available on the SEC website, sec.gov.
Invesco Advisers, Inc. is an investment adviser; it provides investment advisory services to individual and institutional clients and does not sell securities. Invesco Distributors, Inc. is the US distributor for Invesco Ltd.’s retail mutual funds, exchange-traded funds and institutional money market funds. Both are wholly owned, indirect subsidiaries of Invesco Ltd.
| SEC file numbers: 811-03826 and 002-85905 | Invesco Distributors, Inc. | I-ENE-AR-1 |
| Annual Report to Shareholders | April 30, 2019 |
Invesco Gold & Precious Metals Fund
Nasdaq:
A: IGDAX ■ C: IGDCX ■ Y: IGDYX ■ Investor: FGLDX ■ R6: IGDSX

Beginning on January 1, 2021, as permitted by regulations adopted by the Securities and Exchange Commission, paper copies of the Fund’s shareholder reports will no longer be sent by mail, unless you specifically request paper copies of the reports from the Fund or from your financial intermediary, such as a broker-dealer or bank. Instead, the reports will be made available on the Fund’s website, and you will be notified by mail each time a report is posted and provided with a website link to access the report.
If you already elected to receive shareholder reports electronically, you will not be affected by this change and you need not take any action. You may elect to receive shareholder reports and other communications from the Fund electronically by contacting your financial intermediary (such as a broker-dealer or bank) or, if you are a direct investor, by enrolling at invesco.com/edelivery.
You may elect to receive all future reports in paper free of charge. If you invest through a financial intermediary, you can contact your financial intermediary to request that you continue to receive paper copies of your shareholder reports. If you invest directly with the Fund, you can call (800) 959-4246 to let the Fund know you wish to continue receiving paper copies of your shareholder reports. Your election to receive reports in paper will apply to all funds held with your financial intermediary or all funds held with the fund complex if you invest directly with the Fund.
Dear Shareholders:
This annual report includes information about your Fund, including performance data and a complete list of its investments as of the close of the reporting period. Inside is a discussion of how your Fund was managed and the factors that affected its performance during the reporting period.
Philip Taylor, whose messages to shareholders have appeared here for the last 13 years, transitioned to a senior advisory role on March 1, prior to his retirement at the end of the year, and I assumed his role as Head of the Americas and Senior Managing Director, Invesco Ltd. All of us at Invesco are indebted to Phil for his many years of dedicated service to the company and to its funds’ shareholders. I’m excited about this new opportunity, and I look forward to communicating with fund shareholders going forward.
Investor sentiment during the reporting period ranged from elation to fear, notably in the fourth quarter of 2018. Amid corporate tax cuts and improving global growth, several US equity indexes redefined highs during the first half of the reporting period. The exuberance, however, ended in October as global equities, in particular US stocks, sold off, with the sharpest decline in December of 2018. The catalyst for the sell-off was a combination of ongoing trade concerns between the US and China, fears of a global economic slowdown and lower oil prices from a supply glut. Gains posted earlier in the year for global equities were erased, while US Treasury bonds, along with government and municipal bonds, rallied as investors fled to “safe haven” assets. The reporting period ended on a positive note, however, as global equities bounced back strongly at the outset of 2019, with the US stock market reaching new highs by the period end. Given the strong economy during the reporting period, the US Federal Reserve (the Fed) raised the federal funds rate three times. At its December 2018 meeting, however, the Fed delivered a more “dovish stance” by simultaneously raising rates while reducing guidance for 2019 rate increases. As the fiscal year ended, the Fed had thus far left rates unchanged in 2019. As 2019 unfolds, we’ll see how the interplay of interest rates, economic data, geopolitics and a host of other factors affect US and overseas equity and fixed income markets.
Investor uncertainty and market volatility, such as we witnessed during the reporting period, are unfortunate facts of life when it comes to investing. That’s why Invesco encourages investors to work with a professional financial adviser who can stress the importance of starting to save and invest early and the importance of adhering to a disciplined investment plan. A financial adviser who knows your unique financial situation, investment goals and risk tolerance can be an invaluable partner as you seek to achieve your financial goals. He or she can offer a long-term perspective when markets are volatile and time-tested advice and guidance when your financial situation or investment goals change.
Visit our website for more information on your investments
Our website, invesco.com/us, offers a wide range of market insights and investment perspectives. On the website, you’ll find detailed information about our funds, including performance, holdings and portfolio manager commentaries. You can access information about your account by completing a simple, secure online registration. To do so, select “Log In” on the right side of the homepage, and then select “Register for Individual Account Access.”
In addition to the resources accessible on our website and through our mobile app, you can obtain timely updates to help you stay informed about the markets and the economy by connecting with Invesco on Twitter, LinkedIn or Facebook. You can access our blog at blog.invesco.us.com. Our goal is to provide you the information you want, when and where you want it.
Finally, I’m pleased to share with you Invesco’s commitment to both the Principles for Responsible Investment and to considering environmental, social and governance issues in our robust investment process. I invite you to learn more at invesco.com/esg.
Have questions?
For questions about your account, contact an Invesco client services representative at 800 959 4246.
All of us at Invesco look forward to serving your investment management needs. Thank you for investing with us.
Sincerely,
Andrew Schlossberg
Head of the Americas,
Senior Managing Director, Invesco Ltd.
| 2 | Invesco Gold & Precious Metals Fund |
Dear Shareholders:
Among the many important lessons I’ve learned in more than 40 years in a variety of business endeavors is the value of a trusted advocate.
As independent chair of the Invesco Funds Board, I can assure you that the members of the Board are strong advocates for the interests of investors in Invesco’s mutual funds. We work hard to represent your interests through oversight of the quality of the investment management services your funds receive and other matters important to your investment, including but not limited to:
| ■ | Ensuring that Invesco offers a diverse lineup of mutual funds that your financial adviser can use to strive to meet your financial needs as your investment goals change over time. |
| ■ | Monitoring how the portfolio management teams of the Invesco funds are performing in light of changing economic and market conditions. |
| ■ | Assessing each portfolio management team’s investment performance within the context of the investment strategy described in the fund’s prospectus. |
| ■ | Monitoring for potential conflicts of interests that may impact the nature of the services that your funds receive. |
We believe one of the most important services we provide our fund shareholders is the annual review of the funds’ advisory and sub-advisory contracts with Invesco Advisers and its affiliates. This review is required by the Investment Company Act of 1940 and focuses on the nature and quality of the services Invesco provides as the adviser to the Invesco funds and the reasonableness of the fees that it charges for those services. Each year, we spend months carefully reviewing information received from Invesco and a variety of independent sources, such as performance and fee data prepared by Lipper, Inc. (a subsidiary of Broadridge Financial Solutions, Inc.), an independent, third-party firm widely recognized as a leader in its field. We also meet with our independent legal counsel and other independent advisers to review and help us assess the information that we have received. Our goal is to assure that you receive quality investment management services for a reasonable fee.
I trust the measures outlined above provide assurance that you have a worthy advocate when it comes to choosing the Invesco Funds.
As always, please contact me at bruce@brucecrockett.com with any questions or concerns you may have. On behalf of the Board, we look forward to continuing to represent your interests and serving your needs.
Sincerely,
Bruce L. Crockett
Independent Chair
Invesco Funds Board of Trustees
| 3 | Invesco Gold & Precious Metals Fund |
Management’s Discussion of Fund Performance
Performance summary
For the fiscal year ended April 30, 2019, Class A shares of Invesco Gold & Precious Metals Fund (the Fund), at net asset value (NAV), outperformed the Philadelphia Gold & Silver Index (price only), the Fund’s style-specific benchmark.
Your Fund’s long-term performance appears later in this report.
Fund vs. Indexes
Total returns, April 30, 2018 to April 30, 2019, at net asset value (NAV). Performance shown does not include applicable contingent deferred sales charges (CDSC) or front-end sales charges, which would have reduced performance.
| Class A Shares | –11.90% |
| Class C Shares | –12.40 |
| Class Y Shares | –11.66 |
| Investor Class Shares | –11.84 |
| Class R6 Shares | –11.40 |
| S&P 500 Index▼ (Broad Market Index) | 13.49 |
| Philadelphia Gold & Silver Index (price only)▼ (Style-Specific Index) | –12.31 |
Lipper Precious Metals Equity Funds Index■
(Peer Group Index) | –8.03 |
| Source(s):▼FactSet Research Systems Inc.;■ Lipper Inc. |
mies, though equity markets across the region posted gains. US and Chinese equities also delivered robust gains. Both emerging and developed markets had positive returns for the first quarter of 2019.
Despite concerns over a decline in global growth for 2019,1 global equity indexes, in general, ended the fiscal year in positive territory, with developed markets outperforming emerging markets.
The US dollar, measured against a basket of major currencies, trended higher during the fiscal year. Stock market volatility spiked in December 2018 but tapered off in the beginning of 2019 as markets recovered. Gold bullion prices averaged approximately 2.5% lower during the fiscal year than the previous fiscal year, ending the current fiscal year at $1,284 per troy ounce.2
The Fund’s outperformance relative to the style-specific benchmark, the Philadelphia Gold & Silver Index (price only), for the fiscal year was driven by a combination of stock selection and market allocation. Specifically, stock selection in copper mining equities, as well as stock selection in and underweight allocation to silver mining equities, benefited the Fund’s relative performance, as silver mining equities underperformed within the style-specific benchmark. Conversely, out-of-benchmark exposure to diversified metals and mining equities and precious metals and minerals equities were the primary detractors from the Fund’s relative performance.
During the fiscal year, the top individual contributors to Fund performance includedNevsun Resources andSandstorm Gold. Shares of Canadian gold miner Nevsun Resources rose following a revised takeover bid from China’s Zijin
Market conditions and your Fund
The fiscal year began with significant market and currency volatility. While most domestic equity indexes delivered positive performance at the beginning of the fiscal year, most major international indexes had negative results. Many international stocks struggled as investors worried that heightened global trade tensions would derail economic growth. Other concerns, such as geopolitical uncertainty and the potential impact of higher interest rates, also weakened investor sentiment. In this environment, developed markets held up better than emerging markets. After a relatively quiet summer, market volatility markedly rose again in October 2018. Global equity markets (particularly the US) declined sharply in the fourth quarter of 2018 amid rising interest rates and concerns that higher inflation could result in a more restrictive monetary policy. Inves-
| Portfolio Composition |
| By sector | % of total net assets |
| Gold | 69.58% |
| Diversified Metals & Mining | 11.40 |
| Investment Companies - Exchange-Traded Funds | 7.65 |
| Silver | 5.57 |
| Precious Metals & Minerals | 4.59 |
| Other Sectors, Each Less than 2% of Net Assets | 0.60 |
| Money Market Funds Plus Other Assets Less Liabilities | 0.61 |
tors also had concerns over the Brexit negotiations, ongoing US-China trade tensions, declining oil prices and fears of slowing economic growth, particularly in the eurozone.
Following the sharp sell-off in the later part of 2018, global equities rebounded in the beginning of 2019, fueled by accommodative central bank policy and potential for a US-China trade deal. Central bank policy provided a supportive environment for equities and fixed income, even as global economic growth appeared to be slowing. In January, China’s central bank initiated a stimulus program to counteract its slowing economy, while the European Central Bank and US Federal Reserve later indicated they would not raise interest rates for the remainder of 2019. Lack of consensus on a deal for the UK’s withdrawal from the European Union prompted additional concerns for the UK and eurozone econo-
| Top 10 Equity Holdings* |
| % of total net assets |
| 1. | Torex Gold Resources, Inc. | 5.50% |
| 2. | Newmont Goldcorp Corp. | 5.18 |
| 3. | Sandstorm Gold Ltd. | 5.17 |
| 4. | Agnico Eagle Mines Ltd. | 5.16 |
| 5. | Franco-Nevada Corp. | 4.71 |
| 6. | Continental Gold, Inc. | 4.53 |
| 7. | Wheaton Precious Metals Corp. | 4.53 |
| 8. | Kinross Gold Corp. | 4.43 |
| 9. | Turquoise Hill Resources Ltd. | 4.39 |
| 10. | Barrick Gold Corp. | 4.37 |
| Total Net Assets | $ 186.7 million |
| Total Number of Holdings* | 42 |
| The Fund’s holdings are subject to change, and there is no assurance that the Fund will continue to hold any particular security. |
| *Excluding money market fund holdings. |
| Data presented here are as of April 30, 2019. |
| 4 | Invesco Gold & Precious Metals Fund |
Mining (not a Fund holding).2 Following the announcement, we sold our position in Nevsun in favor of what we believe were more attractive opportunities. Sandstorm Gold’s shares increased during the fiscal year as the market began to recognize improving fundamentals and the firm’s relative valuation. In spite of the increase, we believed significant value remained in the stock given its partial ownership of the Hod Maden project in Turkey that is scheduled to be developed by early next decade. Once completed, Sandstorm Gold’s free cash flow is expected to increase significantly. Further, competition for lucrative streams and royalties has intensified in recent years, making Sandstorm Gold an attractive takeout target for larger companies seeking growth in our view.
Conversely,Turquoise Hill Resources andContinental Gold were the largest individual detractors from Fund performance for the fiscal year. Shares of Turquoise Hill Resources declined due to lower copper prices and modest uncertainty regarding progress on its key underground mine deposit. The uncertainty regarding its project schedule and capital created some ambiguity until the company’s mid-year update. Our thesis remained unchanged and we believe significant value remains in the Oyu Tolgoi mine, which is expected to generate strong free cash flow after the underground mine is built in 2020. Further, we believe the company will be a beneficiary of the eventual electrification of the global vehicle fleet through its exposure to copper. Shares of Continental Gold declined as the company suffered two unfortunate security incidents at its mine site in Colombia. The company has the full support of the Colombian government to determine the cause of the security breaches. Our view of the company and its assets did not change as a result of the incidents.
At the close of the fiscal year, relative to the style-specific benchmark, the Fund had exposure to gold bullion ETFs, the diversified metals and mining industry and the precious metals and minerals mining industry — exposure the Fund’s style-specific benchmark lacked. Conversely, the Fund had underweight exposures to gold, silver and copper mining equities.
At the close of the fiscal year, we maintained a constructive outlook for gold and precious metal prices given the historically low interest rate environment and increased geopolitical risks, though we expect further volatility given uncer-
tainty associated with these factors. Based on our marginal cost analysis, at the close of the fiscal year, we saw more upside potential in gold equities than in gold bullion and the Fund’s weighting in gold bullion ETFs remained fairly low. We are comfortable with the Fund’s exposure to base metals through holdings of copper mining equities and diversified metals and mining equities. We have maintained our discipline of selling stocks when they hit our target price and recycling cash proceeds to find new investments. We continue to focus on what we believe to be top-tier companies with good management teams. This has led us to seek better opportunities among the mid-cap and junior miners compared to their large-cap counterparts.
Thank you for your continued investment in Invesco Gold & Precious Metals Fund.
1 Source: International Monetary Fund World
2 Source: Bloomberg
The views and opinions expressed in management’s discussion of Fund performance are those of Invesco Advisers, Inc. These views and opinions are subject to change at any time based on factors such as market and economic conditions. These views and opinions may not be relied upon as investment advice or recommendations, or as an offer for a particular security. The information is not a complete analysis of every aspect of any market, country, industry, security or the Fund. Statements of fact are from sources considered reliable, but Invesco Advisers, Inc. makes no representation or warranty as to their completeness or accuracy. Although historical performance is no guarantee of future results, these insights may help you understand our investment management philosophy.
See important Fund and, if applicable, index disclosures later in this report.
Norman MacDonald
Chartered Financial Analyst, Portfolio Manager, is manager of Invesco Gold & Precious Metals Fund. He joined Invesco in 2008. Mr. MacDonald earned a Bachelor of Commerce from the University of Windsor.
| 5 | Invesco Gold & Precious Metals Fund |
Your Fund’s Long-Term Performance
Results of a $10,000 Investment — Oldest Share Class(es)
Fund and index data from 4/30/09
| 1 | Source: FactSet Research Systems Inc. |
| 2 | Source: Lipper Inc. |
| 3 | It is Invesco’s policy to chart the Fund’s oldest share class(es). Because Investor Class shares do not have a sales charge, we also show the oldest share class with a sales charge, Class C shares. |
Past performance cannot guarantee comparable future results.
The data shown in the chart include reinvested distributions, applicable sales charges and Fund expenses including
management fees. Index results include reinvested dividends, but they do not reflect sales charges. Performance of the peer group, if applicable, reflects fund expenses and management fees; perfor-
mance of a market index does not. Performance shown in the chart and table(s) does not reflect deduction of taxes a shareholder would pay on Fund distributions or sale of Fund shares.
| 6 | Invesco Gold & Precious Metals Fund |
| Average Annual Total Returns |
| As of 4/30/19, including maximum applicable sales charges |
| Class A Shares | |
| Inception (3/28/02) | 3.86% |
| 10 Years | –3.26 |
| 5 Years | –5.93 |
| 1 Year | –16.75 |
| Class C Shares | |
| Inception (2/14/00) | 5.36% |
| 10 Years | –3.44 |
| 5 Years | –5.56 |
| 1 Year | –13.28 |
| Class Y Shares | |
| Inception (10/3/08) | –1.31% |
| 10 Years | –2.49 |
| 5 Years | –4.61 |
| 1 Year | –11.66 |
| Investor Class Shares | |
| Inception (1/19/84) | –0.21% |
| 10 Years | –2.73 |
| 5 Years | –4.82 |
| 1 Year | –11.84 |
| Class R6 Shares | |
| 10 Years | –2.62% |
| 5 Years | –4.69 |
| 1 Year | –11.40 |
| Average Annual Total Returns |
| As of 3/31/19, the most recent calendar quarter end, including maximum applicable sales charges |
| Class A Shares | |
| Inception (3/28/02) | 4.34% |
| 10 Years | –3.00 |
| 5 Years | –3.80 |
| 1 Year | –9.57 |
| Class C Shares | |
| Inception (2/14/00) | 5.80% |
| 10 Years | –3.20 |
| 5 Years | –3.44 |
| 1 Year | –5.99 |
| Class Y Shares | |
| Inception (10/3/08) | –0.62% |
| 10 Years | –2.25 |
| 5 Years | –2.50 |
| 1 Year | –4.18 |
| Investor Class Shares | |
| Inception (1/19/84) | 0.00% |
| 10 Years | –2.47 |
| 5 Years | –2.69 |
| 1 Year | –4.24 |
| Class R6 Shares | |
| 10 Years | –2.40% |
| 5 Years | –2.57 |
| 1 Year | –4.17 |
Class R6 shares incepted on April 4, 2017. Performance shown prior to that date is that of Class A shares and includes the 12b-1 fees applicable to Class A shares.
The performance data quoted represent past performance and cannot guarantee comparable future results; current performance may be lower or higher. Please visit invesco.com/performance for the most recent month-end performance. Performance figures reflect reinvested distributions, changes in net asset value and the effect of the maximum sales charge unless otherwise stated. Investment return and principal value will fluctuate so that you may have a gain or loss when you sell shares.
The total annual Fund operating expense ratio set forth in the most recent Fund prospectus as of the date of this report for Class A, Class C, Class Y, Investor Class and Class R6 shares was 1.45%, 2.20%, 1.20%, 1.45% and 1.01%, respectively. The expense ratios presented above may vary from the expense ratios presented in other sections of this report that are based on expenses incurred during the period covered by this report.
Class A share performance reflects the maximum 5.50% sales charge, and Class C share performance reflects the applicable contingent deferred sales charge (CDSC) for the period involved. The CDSC on Class C shares is 1% for the first year after purchase. Class Y, Investor Class and Class R6 shares do not have a front-end sales charge or a CDSC; therefore, performance is at net asset value.
The performance of the Fund’s share classes will differ primarily due to different sales charge structures and class expenses.
Fund performance reflects any applicable fee waivers and/or expense reimbursements. Had the adviser not waived fees and/or reimbursed expenses currently or in the past, returns would have been lower. See current prospectus for more information.
| 7 | Invesco Gold & Precious Metals Fund |
Invesco Gold & Precious Metals Fund’s investment objective is long-term growth of capital.
| ■ | Unless otherwise stated, information presented in this report is as of April 30, 2019, and is based on total net assets. |
| ■ | Unless otherwise noted, all data provided by Invesco. |
| ■ | To access your Fund’s reports/prospectus, visit invesco.com/fundreports. |
About share classes
| ■ | Class Y sharesand Investor Class shares are available only to certain investors. Please see the prospectus for more information. |
| ■ | Class R6 shares are available for use by retirement plans that meet certain standards and for institutional investors. Class R6 shares are also available through intermediaries that have established an agreement with Invesco Distributors, Inc. to make such shares available for use in retail omnibus accounts. Please see the prospectus for more information. |
Principal risks of investing in the Fund
| ■ | Canada risk. Due to the Fund’s potentially significant exposure to companies that are domiciled in Canada, the Fund is particularly sensitive to political, economic and social conditions in that country. Canada is a major producer of metals. The Canadian economy is especially dependent on the demand for, and supply of, natural resources, and the Canadian market is relatively concentrated in issuers involved in the production and distribution of natural resources. Any adverse events that affect Canada’s major industries may have a negative impact on the overall Canadian economy and the shares of the Fund. |
| ■ | Derivatives risk. The value of a derivative instrument depends largely on (and is derived from) the value of an underlying security, currency, commodity, interest rate, index or other asset (each referred to as an underlying asset). In addition to risks relating to the underlying assets, the use of derivatives may include other, possibly greater, risks, including counterparty, leverage and liquidity risks. Counterparty risk is the risk that the counterparty to the derivative contract will default on its obligation to pay the Fund the amount owed or otherwise perform under the derivative contract. Derivatives create lever- |
| | age risk because they do not require payment up front equal to the economic exposure created by holding a position in the derivative. As a result, an adverse change in the value of the underlying asset could result in the Fund sustaining a loss that is substantially greater than the amount invested in the derivative or the anticipated value of the underlying asset, which may make the Fund’s returns more volatile and increase the risk of loss. Derivative instruments may also be less liquid than more traditional investments and the Fund may be unable to sell or close out its derivative positions at a desirable time or price. This risk may be more acute under adverse market conditions, during which the Fund may be most in need of liquidating its derivative positions. Derivatives may also be harder to value, less tax efficient and subject to changing government regulation that could impact the Fund’s ability to use certain derivatives or their cost. Derivatives strategies may not always be successful. For example, derivatives used for hedging or to gain or limit exposure to a particular market segment may not provide the expected benefits, particularly during adverse market conditions. |
| ■ | Emerging markets securities risk. Emerging markets (also referred to as developing markets) are generally subject to greater market volatility, political, social and economic instability, uncertain trading markets and more governmental limitations on foreign investment than more developed markets. In addition, companies operating in emerging markets may be subject to lower trading volume and greater price fluctuations than companies in more developed markets. Securities law and the enforcement of systems of taxation in many emerging market countries may change quickly and unpredictably. In addition, investments in emerging markets securities may also be subject to additional |
| | transaction costs, delays in settlement procedures, and lack of timely information. |
| ■ | Foreign securities risk. The Fund’s foreign investments may be adversely affected by political and social instability, changes in economic or taxation policies, difficulty in enforcing obligations, decreased liquidity or increased volatility. Foreign investments also involve the risk of the possible seizure, nationalization or expropriation of the issuer or foreign deposits (in which the Fund could lose its entire investments in a certain market) and the possible adoption of foreign governmental restrictions such as exchange controls. Unless the Fund has hedged its foreign securities risk, foreign securities risk also involves the risk of negative foreign currency rate fluctuations, which may cause the value of securities denominated in such foreign currency (or other instruments through which the Fund has exposure to foreign currencies) to decline in value. Currency exchange rates may fluctuate significantly over short periods of time. Currency hedging strategies, if used, are not always successful. |
| ■ | Gold bullion risk. To the extent the Fund invests in gold bullion, it will earn no income from such investment. Appreciation in the market price of gold is the sole manner in which the Fund can realize gains on gold bullion, and such investments may incur higher storage and custody costs as compared to purchasing, holding and selling more traditional investments. |
| ■ | Gold and precious metals sector risk. The Fund will concentrate its investments in the securities of issuers primarily engaged in gold and precious metals-related industries. Fluctuations in the price of gold and precious metals resulting from supply and demand imbalances, increased mining, transportation or storage costs or other market forces will have a significant impact on the profitability of companies in the gold and precious metals |
This report must be accompanied or preceded by a currently effective Fund prospectus, which contains more complete information, including sales charges and expenses. Investors should read it carefully before investing.
NOT FDIC INSURED | MAY LOSE VALUE | NO BANK GUARANTEE
| 8 | Invesco Gold & Precious Metals Fund |
| | sector. The price of gold and precious metals may also be affected by changes in political or economic conditions of countries where gold and precious metals companies are located. |
| ■ | Management risk. The Fund is actively managed and depends heavily on the Adviser’s judgment about markets, interest rates or the attractiveness, relative values, liquidity, or potential appreciation of particular investments made for the Fund’s portfolio. The Fund could experience losses if these judgments prove to be incorrect. Additionally, legislative, regulatory, or tax developments may adversely affect management of the Fund and, therefore, the ability of the Fund to achieve its investment objective. |
| ■ | Market risk.The market values of the Fund’s investments, and therefore the value of the Fund’s shares, will go up and down, sometimes rapidly or unpredictably. Market risk may affect a single issuer, industry or section of the economy, or it may affect the market as a whole. Individual stock prices tend to go up and down more dramatically than those of certain other types of investments, such as bonds. During a general downturn in the financial markets, multiple asset classes may decline in value. When markets perform well, there can be no assurance that specific investments held by the Fund will rise in value. |
| ■ | Small- and mid-capitalization companies risks. Small- and mid-capitalization companies tend to be more vulnerable to changing market conditions, may have little or no operating history or track record of success, and may have more limited product lines and markets, less experienced management and fewer financial resources than larger companies. These companies’ securities may be more volatile and less liquid than those of more established companies, and their returns may vary, sometimes significantly, from the overall securities market. |
About indexes used in this report
| ■ | TheS&P 500®Index is an un managed index considered representative of the US stock market. |
| ■ | ThePhiladelphia Gold & Silver Index (price only) is a capitalization-weighted, price only index on the Philadelphia Stock Exchange that includes the leading companies involved in mining gold and silver. |
| ■ | TheLipper Precious Metals Equity Funds Index is an un managed index considered representative of precious metals funds tracked by Lipper. |
| ■ | The Fund is not managed to track the performance of any particular index, including the index(es) described here, and consequently, the performance of the Fund may deviate significantly from the performance of the index(es). |
| ■ | A direct investment cannot be made in an index. Unless otherwise indicated, index results include reinvested dividends, and they do not reflect sales charges. Performance of the peer group, if applicable, reflects fund expenses; performance of a market index does not. |
Other information
| ■ | The returns shown in management’s discussion of Fund performance are based on net asset values (NAVs) calculated for shareholder transactions. Generally accepted accounting principles require adjustments to be made to the net assets of the Fund at period end for financial reporting purposes, and as such, the NAVs for shareholder transactions and the returns based on those NAVs may differ from the NAVs and returns reported in the Financial Highlights. |
| ■ | Industry classifications used in this report are generally according to the Global Industry Classification Standard, which was developed by and is the exclusive property and a service mark of MSCI Inc. and Standard & Poor’s. |
| 9 | Invesco Gold & Precious Metals Fund |
Schedule of Investments
April 30, 2019
| | Shares | Value |
| Common Stocks & Other Equity Interests–99.39% |
| Australia–2.74% |
| Cardinal Resources Ltd.(a) | 4,955,462 | $1,331,616 |
| Gold Road Resources Ltd.(a) | 2,961,739 | 1,952,167 |
| New Century Resources Ltd.(a) | 3,492,501 | 1,834,219 |
| | | | 5,118,002 |
| Brazil–1.01% |
| Yamana Gold, Inc. | 858,917 | 1,881,028 |
| Canada–70.25% |
| Agnico Eagle Mines Ltd. | 232,587 | 9,631,428 |
| Alamos Gold, Inc., Class A | 1,310,008 | 6,082,145 |
| B2Gold Corp.(a) | 2,314,676 | 6,289,035 |
| Barrick Gold Corp. | 641,180 | 8,155,810 |
| Belo Sun Mining Corp.(a) | 8,558,904 | 1,565,225 |
| Chesapeake Gold Corp.(a) | 638,403 | 819,626 |
| Continental Gold, Inc.(a) | 4,169,682 | 8,465,727 |
| Detour Gold Corp.(a) | 554,035 | 4,921,263 |
| Franco-Nevada Corp. | 122,645 | 8,787,560 |
| Guyana Goldfields, Inc.(a) | 2,016,693 | 1,399,959 |
| INV Metals, Inc.(a) | 2,646,266 | 780,231 |
| Ivanhoe Mines Ltd., Class A(a) | 2,633,254 | 6,407,709 |
| Kinross Gold Corp.(a) | 2,600,711 | 8,269,783 |
| Lundin Gold, Inc.(a) | 1,826,317 | 7,156,949 |
| North American Palladium Ltd. | 104,337 | 992,981 |
| Osisko Mining, Inc.(a) | 1,115,908 | 2,315,611 |
| Premier Gold Mines Ltd.(a) | 2,563,570 | 3,214,748 |
| Pretium Resources, Inc.(a) | 800,586 | 6,077,450 |
| Progress Minerals, Inc., (Acquired 06/26/2018; Cost $1,215,733)(a)(b)(c)(d) | 6,474,020 | 1,208,110 |
| Reunion Gold Corp.(a) | 5,100,767 | 723,405 |
| Roxgold, Inc.(a) | 1,974,887 | 1,282,490 |
| Sandstorm Gold Ltd.(a) | 1,793,751 | 9,653,612 |
| SEMAFO, Inc.(a) | 2,228,422 | 5,921,611 |
| TMAC Resources, Inc.(a) | 786,657 | 2,278,293 |
| Torex Gold Resources, Inc.(a) | 1,074,819 | 10,277,250 |
| Wheaton Precious Metals Corp. | 389,971 | 8,454,571 |
| | | | 131,132,582 |
| | Shares | Value |
| Ivory Coast–2.19% |
| Endeavour Mining Corp.(a) | 287,362 | $4,079,738 |
| Mexico–2.37% |
| Fresnillo PLC | 452,371 | 4,429,205 |
| Mongolia–4.39% |
| Turquoise Hill Resources Ltd.(a) | 5,489,455 | 8,195,051 |
| Switzerland–1.14% |
| Glencore PLC(a) | 535,634 | 2,138,066 |
| Tanzania–0.83% |
| Acacia Mining PLC(a) | 803,070 | 1,541,930 |
| United States–13.89% |
| Boart Longyear Ltd.(a) | 8,083,336 | 22,793 |
| Boart Longyear Ltd., Wts. expiring 09/13/2024(a) | 11,188,146 | 7,887 |
| Coeur Mining, Inc.(a) | 538,541 | 1,944,133 |
| iShares® Gold Trust - ETF(a) | 590,000 | 7,251,100 |
| Newmont Goldcorp Corp. | 311,581 | 9,677,706 |
| SPDR ® Gold Trust–ETF(a) | 58,000 | 7,029,600 |
| | | | 25,933,219 |
| Zambia–0.58% |
| First Quantum Minerals Ltd. | 102,904 | 1,086,879 |
| Total Common Stocks & Other Equity Interests (Cost $239,912,426) | 185,535,700 |
| Money Market Funds–0.70% |
| Invesco Government & Agency Portfolio, Institutional Class, 2.34%(e) | 456,375 | 456,375 |
| Invesco Liquid Assets Portfolio, Institutional Class, 2.48%(e) | 326,028 | 326,126 |
| Invesco Treasury Portfolio, Institutional Class, 2.32%(e) | 521,572 | 521,572 |
| Total Money Market Funds (Cost $1,304,073) | 1,304,073 |
| TOTAL INVESTMENTS IN SECURITIES—100.09% (Cost $241,216,499) | 186,839,773 |
| OTHER ASSETS LESS LIABILITIES–(0.09)% | (166,010) |
| NET ASSETS–100.00% | $186,673,763 |
Investment Abbreviations:
| ETF | – Exchange-Traded Fund |
| SPDR | – Standard & Poor’s Depositary Receipt |
| Wts. | – Warrants |
See accompanying Notes to Financial Statements which are an integral part of the financial statements.
| 10 | Invesco Gold & Precious Metals Fund |
Notes to Schedule of Investments:
| (a) | Non-income producing security. |
| (b) | Affiliated company during the period. The Investment Company Act of 1940 defines an “affiliated person” as an issuance in which a fund holds 5% or more of the outstanding voting securities. The Fund has not owned enough of the outstanding voting securities of the issuer to have control (as defined in the Investment Company Act of 1940) of that issuer. The value of this security as of April 30, 2019 represented less than 1% of the Fund’s Net Assets. See Note 4. |
| (c) | Security purchased or received in a transaction exempt from registration under the Securities Act of 1933, as amended (the “1933 Act”). The security may be resold pursuant to an exemption from registration under the 1933 Act, typically to qualified institutional buyers. The value of this security at April 30, 2019 represented less than 1% of the Fund’s Net Assets. |
| (d) | Security valued using significant unobservable inputs (Level 3). See Note 3. |
| (e) | The money market fund and the Fund are affiliated by having the same investment adviser. The rate shown is the 7-day SEC standardized yield as of April 30, 2019. |
See accompanying Notes to Financial Statements which are an integral part of the financial statements.
| 11 | Invesco Gold & Precious Metals Fund |
Statement of Assets and Liabilities
April 30, 2019
| Assets: | |
Investments in securities, at value
(Cost $238,696,693) | $184,327,590 |
| Investments in affiliates, at value (Cost $2,519,806) | 2,512,183 |
| Foreign currencies, at value (Cost $295) | 295 |
| Receivable for: | |
| Fund shares sold | 66,107 |
| Dividends | 407,582 |
| Investment for trustee deferred compensation and retirement plans | 101,706 |
| Other assets | 28,952 |
| Total assets | 187,444,415 |
| Liabilities: | |
| Payable for: | |
| Fund shares reacquired | 251,274 |
| Amount due custodian | 118,780 |
| Accrued fees to affiliates | 184,645 |
| Accrued trustees’ and officers’ fees and benefits | 1,702 |
| Accrued other operating expenses | 103,207 |
| Trustee deferred compensation and retirement plans | 111,044 |
| Total liabilities | 770,652 |
| Net assets applicable to shares outstanding | $186,673,763 |
| Net assets consist of: | |
| Shares of beneficial interest | $457,570,254 |
| Distributable earnings | (270,896,491) |
| | $186,673,763 |
| Net Assets: |
| Class A | $91,265,557 |
| Class C | $14,345,060 |
| Class Y | $30,122,048 |
| Investor Class | $50,814,613 |
| Class R6 | $126,485 |
| Shares outstanding, no par value, with an unlimited number of shares authorized: |
| Class A | 27,411,280 |
| Class C | 4,321,571 |
| Class Y | 8,830,736 |
| Investor Class | 15,169,666 |
| Class R6 | 36,975 |
| Class A: | |
| Net asset value per share | $3.33 |
Maximum offering price per share
(Net asset value of $3.33 ÷ 94.50%) | $3.52 |
| Class C: | |
| Net asset value and offering price per share | $3.32 |
| Class Y: | |
| Net asset value and offering price per share | $3.41 |
| Investor Class: | |
| Net asset value and offering price per share | $3.35 |
| Class R6: | |
| Net asset value and offering price per share | $3.42 |
See accompanying Notes to Financial Statements which are an integral part of the financial statements.
| 12 | Invesco Gold & Precious Metals Fund |
Statement of Operations
For the year ended April 30, 2019
| Investment income: | |
| Dividends (net of foreign withholding taxes of $78,081) | $1,287,060 |
| Dividends from affiliated money market funds | 45,939 |
| Total investment income | 1,332,999 |
| Expenses: | |
| Advisory fees | 1,537,116 |
| Administrative services fees | 42,842 |
| Custodian fees | 19,574 |
| Distribution fees: | |
| Class A | 241,625 |
| Class C | 193,852 |
| Investor Class | 142,679 |
| Transfer agent fees — A, C, Y and Investor | 687,707 |
| Transfer agent fees — R6 | 235 |
| Trustees’ and officers’ fees and benefits | 23,905 |
| Registration and filing fees | 76,558 |
| Reports to shareholders | 53,389 |
| Professional services fees | 50,378 |
| Other | 14,524 |
| Total expenses | 3,084,384 |
| Less: Fees waived and expense offset arrangement(s) | (9,799) |
| Net expenses | 3,074,585 |
| Net investment income (loss) | (1,741,586) |
| Realized and unrealized gain (loss) from: | |
| Net realized gain (loss) from: | |
| Investment securities | (11,109,071) |
| Foreign currencies | (3,546) |
| | (11,112,617) |
| Change in net unrealized appreciation (depreciation) of: | |
| Investment securities | (14,842,509) |
| Foreign currencies | (877) |
| | (14,843,386) |
| Net realized and unrealized gain (loss) | (25,956,003) |
| Net increase (decrease) in net assets resulting from operations | $(27,697,589) |
See accompanying Notes to Financial Statements which are an integral part of the financial statements.
| 13 | Invesco Gold & Precious Metals Fund |
Statement of Changes in Net Assets
For the years ended April 30, 2019 and 2018
| | 2019 | 2018 |
| Operations: | | |
| Net investment income (loss) | $(1,741,586) | $(2,989,931) |
| Net realized gain (loss) | (11,112,617) | 9,523,216 |
| Change in net unrealized appreciation (depreciation) | (14,843,386) | (28,190,429) |
| Net increase (decrease) in net assets resulting from operations | (27,697,589) | (21,657,144) |
| Distributions to shareholders from distributable earnings(1): | | |
| Class A | — | (2,176,312) |
| Class B | — | (15,662) |
| Class C | — | (370,585) |
| Class Y | — | (822,520) |
| Investor Class | — | (1,210,692) |
| Class R6 | — | (10,479) |
| Total distributions to shareholders from distributable earnings | — | (4,606,250) |
| Share transactions–net: | | |
| Class A | (9,719,980) | (19,718,763) |
| Class B | — | (1,958,163) |
| Class C | (7,585,965) | (4,025,675) |
| Class Y | (3,145,358) | (3,488,354) |
| Investor Class | (8,693,917) | (4,499,995) |
| Class R6 | (388,489) | 591,998 |
| Net increase (decrease) in net assets resulting from share transactions | (29,533,709) | (33,098,952) |
| Net increase (decrease) in net assets | (57,231,298) | (59,362,346) |
| Net assets: | | |
| Beginning of year | 243,905,061 | 303,267,407 |
| End of year | $186,673,763 | $243,905,061 |
| (1) | The Securities and Exchange Commission eliminated the requirement to disclose the distribution components separately, except for tax return of capital. For the year ended April 30, 2018, distributions to shareholders from distributable earnings consisted of distributions from net investment income. |
See accompanying Notes to Financial Statements which are an integral part of the financial statements.
| 14 | Invesco Gold & Precious Metals Fund |
Financial Highlights
April 30, 2019
The following schedule presents financial highlights for a share of the Fund outstanding throughout the periods indicated.
| | Net asset
value,
beginning
of period | Net
investment
income
(loss)(a) | Net gains
(losses)
on securities
(both
realized and
unrealized) | Total from
investment
operations | Dividends
from net
investment
income | Net asset
value, end
of period | Total
return(b) | Net assets,
end of period
(000’s omitted) | Ratio of
expenses
to average
net assets
with fee waivers
and/or expenses
absorbed | Ratio of
expenses
to average net
assets without
fee waivers
and/or expenses
absorbed | Ratio of net
investment
income
(loss)
to average
net assets | Portfolio
turnover(c) |
| Class A |
| Year ended 04/30/19 | $3.78 | $(0.03) | $(0.42) | $(0.45) | $— | $3.33 | (11.90)% | $91,266 | 1.47%(d) | 1.47%(d) | (0.82)%(d) | 16% |
| Year ended 04/30/18 | 4.16 | (0.04) | (0.27) | (0.31) | (0.07) | 3.78 | (7.55) | 113,737 | 1.43 | 1.43 | (1.00) | 20 |
| Year ended 04/30/17 | 5.05 | (0.05) | (0.46) | (0.51) | (0.38) | 4.16 | (9.90) | 145,269 | 1.41 | 1.42 | (1.00) | 28 |
| Year ended 04/30/16 | 4.00 | (0.03) | 1.08 | 1.05 | — | 5.05 | 26.25 | 160,494 | 1.54 | 1.54 | (0.90) | 23 |
| Year ended 04/30/15 | 4.75 | (0.04) | (0.71) | (0.75) | — | 4.00 | (15.79) | 113,862 | 1.45 | 1.46 | (0.89) | 35 |
| Class C |
| Year ended 04/30/19 | 3.79 | (0.05) | (0.42) | (0.47) | — | 3.32 | (12.40) | 14,345 | 2.22(d) | 2.22(d) | (1.57)(d) | 16 |
| Year ended 04/30/18 | 4.20 | (0.07) | (0.29) | (0.36) | (0.05) | 3.79 | (8.51) | 24,859 | 2.18 | 2.18 | (1.75) | 20 |
| Year ended 04/30/17 | 5.07 | (0.09) | (0.45) | (0.54) | (0.33) | 4.20 | (10.53) | 31,563 | 2.16 | 2.17 | (1.75) | 28 |
| Year ended 04/30/16 | 4.05 | (0.06) | 1.08 | 1.02 | — | 5.07 | 25.19 | 36,157 | 2.29 | 2.29 | (1.65) | 23 |
| Year ended 04/30/15 | 4.84 | (0.07) | (0.72) | (0.79) | — | 4.05 | (16.32) | 27,351 | 2.20 | 2.21 | (1.64) | 35 |
| Class Y |
| Year ended 04/30/19 | 3.86 | (0.02) | (0.43) | (0.45) | — | 3.41 | (11.66) | 30,122 | 1.22(d) | 1.22(d) | (0.57)(d) | 16 |
| Year ended 04/30/18 | 4.24 | (0.03) | (0.28) | (0.31) | (0.07) | 3.86 | (7.30) | 37,373 | 1.18 | 1.18 | (0.75) | 20 |
| Year ended 04/30/17 | 5.15 | (0.04) | (0.47) | (0.51) | (0.40) | 4.24 | (9.75) | 45,797 | 1.16 | 1.17 | (0.75) | 28 |
| Year ended 04/30/16 | 4.07 | (0.02) | 1.10 | 1.08 | — | 5.15 | 26.54 | 42,446 | 1.29 | 1.29 | (0.65) | 23 |
| Year ended 04/30/15 | 4.82 | (0.03) | (0.72) | (0.75) | — | 4.07 | (15.56) | 19,530 | 1.20 | 1.21 | (0.64) | 35 |
| Investor Class |
| Year ended 04/30/19 | 3.80 | (0.03) | (0.42) | (0.45) | — | 3.35 | (11.84) | 50,815 | 1.47(d) | 1.47(d) | (0.82)(d) | 16 |
| Year ended 04/30/18 | 4.19 | (0.04) | (0.28) | (0.32) | (0.07) | 3.80 | (7.73) | 67,393 | 1.43 | 1.43 | (1.00) | 20 |
| Year ended 04/30/17 | 5.08 | (0.05) | (0.46) | (0.51) | (0.38) | 4.19 | (9.84) | 78,703 | 1.41 | 1.42 | (1.00) | 28 |
| Year ended 04/30/16 | 4.02 | (0.03) | 1.09 | 1.06 | — | 5.08 | 26.37 | 97,678 | 1.54 | 1.54 | (0.90) | 23 |
| Year ended 04/30/15 | 4.77 | (0.04) | (0.71) | (0.75) | — | 4.02 | (15.72) | 82,486 | 1.45 | 1.46 | (0.89) | 35 |
| Class R6 |
| Year ended 04/30/19 | 3.86 | (0.01) | (0.43) | (0.44) | — | 3.42 | (11.40) | 126 | 0.98(d) | 0.98(d) | (0.33)(d) | 16 |
| Year ended 04/30/18 | 4.25 | (0.02) | (0.29) | (0.31) | (0.08) | 3.86 | (7.45) | 543 | 0.99 | 0.99 | (0.56) | 20 |
| Year ended 04/30/17(e) | 4.57 | (0.00) | (0.32) | (0.32) | — | 4.25 | (7.00) | 9 | 0.97(f) | 0.97(f) | (0.56)(f) | 28 |
| (a) | Calculated using average shares outstanding. |
| (b) | Includes adjustments in accordance with accounting principles generally accepted in the United States of America and as such, the net asset value for financial reporting purposes and the returns based upon those net asset values may differ from the net asset value and returns for shareholder transactions. Does not include sales charges and is not annualized for periods less than one year, if applicable. |
| (c) | Portfolio turnover is calculated at the fund level and is not annualized for periods less than one year, if applicable. |
| (d) | Ratios are based on average daily net assets (000’s omitted) of $96,650, $19,385, $31,612, $57,072 and $230 for Class A, Class C, Class Y, Investor Class and Class R6 shares, respectively. |
| (e) | Commencement date of April 4, 2017. |
| (f) | Annualized. |
See accompanying Notes to Financial Statements which are an integral part of the financial statements.
| 15 | Invesco Gold & Precious Metals Fund |
Notes to Financial Statements
April 30, 2019
NOTE 1—Significant Accounting Policies
Invesco Gold & Precious Metals Fund (the “Fund”) is a series portfolio of AIM Sector Funds (Invesco Sector Funds) (the “Trust”). The Trust is a Delaware statutory trust registered under the Investment Company Act of 1940, as amended (the “1940 Act”), as an open-end series management investment company authorized to issue an unlimited number of shares of beneficial interest. Information presented in these financial statements pertains only to the Fund. Matters affecting the Fund or each class will be voted on exclusively by the shareholders of the Fund or each class.
The Fund’s investment objective is long-term growth of capital.
The Fund currently consists of five different classes of shares: Class A, Class C, Class Y, Investor Class and Class R6. Class Y and Investor Class shares are available only to certain investors. Class A shares are sold with a front-end sales charge unless certain waiver criteria are met. Under certain circumstances, load waived shares may be subject to contingent deferred sales charges ("CDSC"). Class C shares are sold with a CDSC. Class Y, Investor Class and Class R6 shares are sold at net asset value. Class C shares held for ten years after purchase are eligible for automatic conversion into Class A shares of the same Fund (the "Conversion Feature"). The automatic conversion pursuant to the Conversion Feature will generally occur at the end of the month following the tenth anniversary after a purchase of Class C shares.
The Fund is an investment company and accordingly follows the investment company accounting and reporting guidance in accordance with Financial Accounting Standards Board Accounting Standards Codification Topic 946,Financial Services – Investment Companies.
The following is a summary of the significant accounting policies followed by the Fund in the preparation of its financial statements.
| A. | Security Valuations — Securities, including restricted securities, are valued according to the following policy. |
A security listed or traded on an exchange (except convertible securities) is valued at its last sales price or official closing price as of the close of the customary trading session on the exchange where the security is principally traded, or lacking any sales or official closing price on a particular day, the security may be valued at the closing bid price on that day. Securities traded in the over-the-counter market are valued based on prices furnished by independent pricing services or market makers. When such securities are valued by an independent pricing service they may be considered fair valued. Futures contracts are valued at the final settlement price set by an exchange on which they are principally traded. Listed options are valued at the mean between the last bid and asked prices from the exchange on which they are principally traded. Options not listed on an exchange are valued by an independent source at the mean between the last bid and asked prices. For purposes of determining net asset value (“NAV”) per share, futures and option contracts generally are valued 15 minutes after the close of the customary trading session of the New York Stock Exchange (“NYSE”).
Investments in open-end and closed-end registered investment companies that do not trade on an exchange are valued at the end-of-day net asset value per share. Investments in open-end and closed-end registered investment companies that trade on an exchange are valued at the last sales price or official closing price as of the close of the customary trading session on the exchange where the security is principally traded.
Debt obligations (including convertible securities) and unlisted equities are fair valued using an evaluated quote provided by an independent pricing service. Evaluated quotes provided by the pricing service may be determined without exclusive reliance on quoted prices, and may reflect appropriate factors such as institution-size trading in similar groups of securities, developments related to specific securities, dividend rate (for unlisted equities), yield (for debt obligations), quality, type of issue, coupon rate (for debt obligations), maturity (for debt obligations), individual trading characteristics and other market data. Pricing services generally value debt obligations assuming orderly transactions of institutional round lot size, but a fund may hold or transact in the same securities in smaller, odd lot sizes. Odd lots often trade at lower prices than institutional round lots. Debt obligations are subject to interest rate and credit risks. In addition, all debt obligations involve some risk of default with respect to interest and/or principal payments.
Foreign securities’ (including foreign exchange contracts) prices are converted into U.S. dollar amounts using the applicable exchange rates as of the close of the NYSE. If market quotations are available and reliable for foreign exchange-traded equity securities, the securities will be valued at the market quotations. Because trading hours for certain foreign securities end before the close of the NYSE, closing market quotations may become unreliable. If between the time trading ends on a particular security and the close of the customary trading session on the NYSE, events occur that the investment adviser determines are significant and make the closing price unreliable, the Fund may fair value the security. If the event is likely to have affected the closing price of the security, the security will be valued at fair value in good faith using procedures approved by the Board of Trustees. Adjustments to closing prices to reflect fair value may also be based on a screening process of an independent pricing service to indicate the degree of certainty, based on historical data, that the closing price in the principal market where a foreign security trades is not the current value as of the close of the NYSE. Foreign securities’ prices meeting the approved degree of certainty that the price is not reflective of current value will be priced at the indication of fair value from the independent pricing service. Multiple factors may be considered by the independent pricing service in determining adjustments to reflect fair value and may include information relating to sector indices, American Depositary Receipts and domestic and foreign index futures. Foreign securities may have additional risks including exchange rate changes, potential for sharply devalued currencies and high inflation, political and economic upheaval, the relative lack of issuer information, relatively low market liquidity and the potential lack of strict financial and accounting controls and standards.
Securities for which market prices are not provided by any of the above methods may be valued based upon quotes furnished by independent sources. The last bid price may be used to value equity securities. The mean between the last bid and asked prices is used to value debt obligations, including corporate loans.
Securities for which market quotations are not readily available or became unreliable are valued at fair value as determined in good faith by or under the supervision of the Trust’s officers following procedures approved by the Board of Trustees. Issuer specific events, market trends, bid/asked quotes of brokers and information providers and other market data may be reviewed in the course of making a good faith determination of a security’s fair value.
The Fund may invest in securities that are subject to interest rate risk, meaning the risk that the prices will generally fall as interest rates rise and, conversely, the prices will generally rise as interest rates fall. Specific securities differ in their sensitivity to changes in interest rates depending on their individual characteristics. Changes in interest rates may result in increased market volatility, which may affect the value and/or liquidity of certain Fund investments.
| 16 | Invesco Gold & Precious Metals Fund |
Valuations change in response to many factors including the historical and prospective earnings of the issuer, the value of the issuer’s assets, general economic conditions, interest rates, investor perceptions and market liquidity. Because of the inherent uncertainties of valuation, the values reflected in the financial statements may materially differ from the value received upon actual sale of those investments.
| B. | Securities Transactions and Investment Income — Securities transactions are accounted for on a trade date basis. Realized gains or losses on sales are computed on the basis of specific identification of the securities sold. Interest income (net of withholding tax, if any) is recorded on the accrual basis from settlement date. Dividend income (net of withholding tax, if any) is recorded on the ex-dividend date. |
The Fund may periodically participate in litigation related to Fund investments. As such, the Fund may receive proceeds from litigation settlements. Any proceeds received are included in the Statement of Operations as realized gain (loss) for investments no longer held and as unrealized gain (loss) for investments still held.
Brokerage commissions and mark ups are considered transaction costs and are recorded as an increase to the cost basis of securities purchased and/or a reduction of proceeds on a sale of securities. Such transaction costs are included in the determination of net realized and unrealized gain (loss) from investment securities reported in the Statement of Operations and the Statement of Changes in Net Assets and the net realized and unrealized gains (losses) on securities per share in the Financial Highlights. Transaction costs are included in the calculation of the Fund’s net asset value and, accordingly, they reduce the Fund’s total returns. These transaction costs are not considered operating expenses and are not reflected in net investment income reported in the Statement of Operations and the Statement of Changes in Net Assets, or the net investment income per share and the ratios of expenses and net investment income reported in the Financial Highlights, nor are they limited by any expense limitation arrangements between the Fund and the investment adviser.
The Fund allocates income and realized and unrealized capital gains and losses to a class based on the relative net assets of each class.
| C. | Country Determination – For the purposes of making investment selection decisions and presentation in the Schedule of Investments, the investment adviser may determine the country in which an issuer is located and/or credit risk exposure based on various factors. These factors include the laws of the country under which the issuer is organized, where the issuer maintains a principal office, the country in which the issuer derives 50% or more of its total revenues and the country that has the primary market for the issuer’s securities, as well as other criteria. Among the other criteria that may be evaluated for making this determination are the country in which the issuer maintains 50% or more of its assets, the type of security, financial guarantees and enhancements, the nature of the collateral and the sponsor organization. Country of issuer and/or credit risk exposure has been determined to be the United States of America, unless otherwise noted. |
| D. | Distributions– Distributions from net investment income and net realized capital gain, if any, are generally declared and paid annually and recorded on the ex-dividend date. The Fund may elect to treat a portion of the proceeds from redemptions as distributions for federal income tax purposes. |
| E. | Federal Income Taxes – The Fund intends to comply with the requirements of Subchapter M of the Internal Revenue Code of 1986, as amended (the “Internal Revenue Code”), necessary to qualify as a regulated investment company and to distribute substantially all of the Fund’s taxable earnings to shareholders. As such, the Fund will not be subject to federal income taxes on otherwise taxable income (including net realized capital gain) that is distributed to shareholders. Therefore, no provision for federal income taxes is recorded in the financial statements. |
The Fund recognizes the tax benefits of uncertain tax positions only when the position is more likely than not to be sustained. Management has analyzed the Fund’s uncertain tax positions and concluded that no liability for unrecognized tax benefits should be recorded related to uncertain tax positions. Management is not aware of any tax positions for which it is reasonably possible that the total amounts of unrecognized tax benefits will change materially in the next 12 months.
The Fund files tax returns in the U.S. Federal jurisdiction and certain other jurisdictions. Generally, the Fund is subject to examinations by such taxing authorities for up to three years after the filing of the return for the tax period.
| F. | Expenses – Fees provided for under the Rule 12b-1 plan of a particular class of the Fund are charged to the operations of such class. Transfer agency fees and expenses and other shareholder recordkeeping fees and expenses attributable to Class R5 and Class R6 are allocated to each share class based on relative net assets. Sub-accounting fees attributable to Class R5 are charged to the operations of the class. Transfer agency fees and expenses and other shareholder recordkeeping fees and expenses relating to all other classes are allocated among those classes based on relative net assets. All other expenses are allocated among the classes based on relative net assets. |
| G. | Accounting Estimates – The preparation of financial statements in conformity with accounting principles generally accepted in the United States of America (“GAAP”) requires management to make estimates and assumptions that affect the reported amounts of assets and liabilities at the date of the financial statements and the reported amounts of revenues and expenses during the reporting period including estimates and assumptions related to taxation. Actual results could differ from those estimates by a significant amount. In addition, the Fund monitors for material events or transactions that may occur or become known after the period-end date and before the date the financial statements are released to print. |
| H. | Indemnifications – Under the Trust’s organizational documents, each Trustee, officer, employee or other agent of the Trust is indemnified against certain liabilities that may arise out of the performance of their duties to the Fund. Additionally, in the normal course of business, the Fund enters into contracts, including the Fund’s servicing agreements, that contain a variety of indemnification clauses. The Fund’s maximum exposure under these arrangements is unknown as this would involve future claims that may be made against the Fund that have not yet occurred. The risk of material loss as a result of such indemnification claims is considered remote. |
| I. | Foreign Currency Translations – Foreign currency is valued at the close of the NYSE based on quotations posted by banks and major currency dealers. Portfolio securities and other assets and liabilities denominated in foreign currencies are translated into U.S. dollar amounts at the date of valuation. Purchases and sales of portfolio securities (net of foreign taxes withheld on disposition) and income items denominated in foreign currencies are translated into U.S. dollar amounts on the respective dates of such transactions. The Fund does not separately account for the portion of the results of operations resulting from changes in foreign exchange rates on investments and the fluctuations arising from changes in market prices of securities held. The combined results of changes in foreign exchange rates and the fluctuation of market prices on investments (net of estimated foreign tax withholding) are included with the net realized and unrealized gain or loss from investments in the Statement of Operations. Reported net realized foreign currency gains or losses arise from (1) sales of foreign currencies, (2) currency gains or losses realized between the trade and settlement dates on securities transactions, and (3) the difference between the amounts of dividends, interest, and foreign withholding taxes recorded on the Fund’s books and the U.S. dollar equivalent of the amounts actually received or paid. Net |
| 17 | Invesco Gold & Precious Metals Fund |
| | unrealized foreign currency gains and losses arise from changes in the fair values of assets and liabilities, other than investments in securities at fiscal period end, resulting from changes in exchange rates. |
The Fund may invest in foreign securities, which may be subject to foreign taxes on income, gains on investments or currency repatriation, a portion of which may be recoverable. Foreign taxes, if any, are recorded based on the tax regulations and rates that exist in the foreign markets in which the Fund invests and are shown in the Statement of Operations.
| J. | Forward Foreign Currency Contracts – The Fund may engage in foreign currency transactions either on a spot (i.e. for prompt delivery and settlement) basis, or through forward foreign currency contracts, to manage or minimize currency or exchange rate risk. |
The Fund may also enter into forward foreign currency contracts for the purchase or sale of a security denominated in a foreign currency in order to “lock in” the U.S. dollar price of that security, or the Fund may also enter into forward foreign currency contracts that do not provide for physical settlement of the two currencies, but instead are settled by a single cash payment calculated as the difference between the agreed upon exchange rate and the spot rate at settlement based upon an agreed upon notional amount (non-deliverable forwards). The Fund will set aside liquid assets in an amount equal to the daily mark-to-market obligation for forward foreign currency contracts.
A forward foreign currency contract is an obligation between two parties (“Counterparties”) to purchase or sell a specific currency for an agreed-upon price at a future date. The use of forward foreign currency contracts does not eliminate fluctuations in the price of the underlying securities the Fund owns or intends to acquire but establishes a rate of exchange in advance. Fluctuations in the value of these contracts are measured by the difference in the contract date and reporting date exchange rates and are recorded as unrealized appreciation (depreciation) until the contracts are closed. When the contracts are closed, realized gains (losses) are recorded. Realized and unrealized gains (losses) on the contracts are included in the Statement of Operations. The primary risks associated with forward foreign currency contracts include failure of the Counterparty to meet the terms of the contract and the value of the foreign currency changing unfavorably. These risks may be in excess of the amounts reflected in the Statement of Assets and Liabilities.
| K. | Other Risks - The Fund’s investments are concentrated in a comparatively narrow segment of the economy, which may make the Fund more volatile. |
The Fund may invest a large percentage of its assets in a limited number of securities or other instruments, which could negatively affect the value of the Fund.
Fluctuations in the price of gold and precious metals may affect the profitability of companies in the gold and precious metals sector. Changes in the political or economic conditions of countries where companies in the gold and precious metals sector are located may have a direct effect on the price of gold and precious metals.
NOTE 2—Advisory Fees and Other Fees Paid to Affiliates
The Trust has entered into a master investment advisory agreement with Invesco Advisers, Inc. (the "Adviser" or "Invesco"). Under the terms of the investment advisory agreement, the Fund accrues daily and pays monthly an advisory fee to the Adviser based on the annual rate of the Fund’s average daily net assets as follows:
| Average Daily Net Assets | Rate |
| First $350 million | 0.75% |
| Next $350 million | 0.65% |
| Next $1.3 billion | 0.55% |
| Next $2 billion | 0.45% |
| Next $2 billion | 0.40% |
| Next $2 billion | 0.375% |
| Over $8 billion | 0.35% |
For the year ended April 30, 2019, the effective advisory fees incurred by the Fund was 0.75%.
Under the terms of a master sub-advisory agreement between the Adviser and each of Invesco Asset Management Deutschland GmbH, Invesco Asset Management Limited, Invesco Asset Management (Japan) Limited, Invesco Hong Kong Limited, Invesco Senior Secured Management, Inc. and Invesco Canada Ltd. (collectively, the "Affiliated Sub-Advisers") the Adviser, not the Fund, will pay 40% of the fees paid to the Adviser to any such Affiliated Sub-Adviser(s) that provide(s) discretionary investment management services to the Fund based on the percentage of assets allocated to such Affiliated Sub-Adviser(s).
The Adviser has contractually agreed, through at least June 30, 2020, to waive advisory fees and/or reimburse expenses of all shares to the extent necessary to limit total annual fund operating expenses after fee waiver and/or expense reimbursement (excluding certain items discussed below) of Class A, Class C, Class Y, Investor Class and Class R6 shares to 2.00%, 2.75%, 1.75%, 2.00% and 1.75%, respectively, of average daily net assets (the "expense limits"). In determining the Adviser’s obligation to waive advisory fees and/or reimburse expenses, the following expenses are not taken into account, and could cause the total annual fund operating expenses after fee waivers and/or expense reimbursement to exceed the numbers reflected above: (1) interest; (2) taxes; (3) dividend expense on short sales; (4) extraordinary or non-routine items, including litigation expenses; and (5) expenses that the Fund has incurred but did not actually pay because of an expense offset arrangement. Unless Invesco continues the fee waiver agreement, it will terminate on June 30, 2020. During its term, the fee waiver agreement cannot be terminated or amended to increase the expense limits or reduce the advisory fee waiver without approval of the Board of Trustees. The Adviser did not waive fees and/or reimburse expenses during the period under these expense limits.
Further, the Adviser has contractually agreed, through at least June 30, 2021, to waive the advisory fee payable by the Fund in an amount equal to 100% of the net advisory fees the Adviser receives from the affiliated money market funds on investments by the Fund of uninvested cash in such affiliated money market funds.
For the year ended April 30, 2019, the Adviser waived advisory fees of $2,218.
The Trust has entered into a master administrative services agreement with Invesco pursuant to which the Fund has agreed to pay Invesco for certain administrative costs incurred in providing accounting services to the Fund. For the year ended April 30, 2019, expenses incurred under the
| 18 | Invesco Gold & Precious Metals Fund |
agreement are shown in the Statement of Operations asAdministrative services fees. Also, Invesco has entered into a sub-administration agreement whereby State Street Bank and Trust Company (“SSB”) serves as custodian and fund accountant and provides certain administrative services to the Fund.
The Trust has entered into a transfer agency and service agreement with Invesco Investment Services, Inc. (“IIS”) pursuant to which the Fund has agreed to pay IIS a fee for providing transfer agency and shareholder services to the Fund and reimburse IIS for certain expenses incurred by IIS in the course of providing such services. IIS may make payments to intermediaries that provide omnibus account services, sub-accounting services and/or networking services. All fees payable by IIS to intermediaries that provide omnibus account services or sub-accounting services are charged back to the Fund, subject to certain limitations approved by the Trust’s Board of Trustees. For the year ended April 30, 2019, expenses incurred under the agreement are shown in the Statement of Operations asTransfer agent fees.
The Trust has entered into master distribution agreements with Invesco Distributors, Inc. (“IDI”) to serve as the distributor for the Class A, Class C, Class Y, Investor Class and Class R6 shares of the Fund. The Trust has adopted plans pursuant to Rule 12b-1 under the 1940 Act with respect to the Fund’s Class A, Class C and Investor Class shares (collectively, the “Plans”). The Fund, pursuant to the Plans, pays IDI compensation at the annual rate of 0.25% of the Fund’s average daily net assets of Class A shares, 1.00% of the average daily net assets of Class C shares and 0.25% of the average daily net assets of Investor Class shares. The fees are accrued daily and paid monthly. Of the Plan payments, up to 0.25% of the average daily net assets of each class of shares may be paid to furnish continuing personal shareholder services to customers who purchase and own shares of such classes. Any amounts not paid as a service fee under the Plans would constitute an asset-based sales charge. Rules of the Financial Industry Regulatory Authority (“FINRA”) impose a cap on the total sales charges, including asset-based sales charges, that may be paid by any class of shares of the Fund. For the year ended April 30, 2019, expenses incurred under the Plan are shown in the Statement of Operations asDistribution fees.
Front-end sales commissions and CDSC (collectively, the “sales charges”) are not recorded as expenses of the Fund. Front-end sales commissions are deducted from proceeds from the sales of Fund shares prior to investment in Class A shares of the Fund. CDSC are deducted from redemption proceeds prior to remittance to the shareholder. During the year ended April 30, 2019, IDI advised the Fund that IDI retained $21,151 in front-end sales commissions from the sale of Class A shares and $2,014 and $1,381 from Class A and Class C shares, respectively, for CDSC imposed upon redemptions by shareholders.
For the year ended April 30, 2019, the Fund incurred $194 in brokerage commissions with Invesco Capital Markets, Inc., an affiliate of the Adviser and IDI, for portfolio transactions executed on behalf of the Fund.
Certain officers and trustees of the Trust are officers and directors of the Adviser, IIS and/or IDI.
NOTE 3—Additional Valuation Information
GAAP defines fair value as the price that would be received to sell an asset or paid to transfer a liability in an orderly transaction between market participants at the measurement date, under current market conditions. GAAP establishes a hierarchy that prioritizes the inputs to valuation methods, giving the highest priority to readily available unadjusted quoted prices in an active market for identical assets (Level 1) and the lowest priority to significant unobservable inputs (Level 3), generally when market prices are not readily available or are unreliable. Based on the valuation inputs, the securities or other investments are tiered into one of three levels. Changes in valuation methods may result in transfers in or out of an investment’s assigned level:
Level 1 – Prices are determined using quoted prices in an active market for identical assets.
Level 2 – Prices are determined using other significant observable inputs. Observable inputs are inputs that other market participants may use in pricing a security. These may include quoted prices for similar securities, interest rates, prepayment speeds, credit risk, yield curves, loss severities, default rates, discount rates, volatilities and others.
Level 3 – Prices are determined using significant unobservable inputs. In situations where quoted prices or observable inputs are unavailable (for example, when there is little or no market activity for an investment at the end of the period), unobservable inputs may be used. Unobservable inputs reflect the Fund’s own assumptions about the factors market participants would use in determining fair value of the securities or instruments and would be based on the best available information.
The following is a summary of the tiered valuation input levels, as of April 30, 2019. The level assigned to the securities valuations may not be an indication of the risk or liquidity associated with investing in those securities. Because of the inherent uncertainties of valuation, the values reflected in the financial statements may materially differ from the value received upon actual sale of those investments.
| | Level 1 | Level 2 | Level 3 | Total |
| Investments in Securities | | | | |
| Australia | $5,118,002 | $— | $— | $5,118,002 |
| Brazil | 1,881,028 | — | — | 1,881,028 |
| Canada | 129,924,472 | — | 1,208,110 | 131,132,582 |
| Ivory Coast | 4,079,738 | — | — | 4,079,738 |
| Mexico | — | 4,429,205 | — | 4,429,205 |
| Mongolia | 8,195,051 | — | — | 8,195,051 |
| Switzerland | — | 2,138,066 | — | 2,138,066 |
| Tanzania | — | 1,541,930 | — | 1,541,930 |
| United States | 25,933,219 | — | — | 25,933,219 |
| Zambia | 1,086,879 | — | — | 1,086,879 |
| Money Market Funds | 1,304,073 | — | — | 1,304,073 |
| Total Investments | $177,522,462 | $8,109,201 | $1,208,110 | $186,839,773 |
| 19 | Invesco Gold & Precious Metals Fund |
NOTE 4—Investments in Other Affiliates
The 1940 Act defines an “affiliated person” as an issuance in which a fund holds 5% or more of the outstanding voting securities. The Fund has not owned enough of the outstanding voting securities of the issuer to have control (as defined in the 1940 Act) of that issuer. The following is a summary of the investments in other affiliates (excluding affiliated money market funds) for the year ended April 30, 2019.
| | Value
04/30/18 | Purchases
at Cost | Proceeds
from Sales | Change in
Unrealized
Appreciation
(Depreciation) | Realized
Gain | Value
04/30/19 | Dividend
Income |
| Progress Minerals, Inc. | $– | $ 1,215,733 | $– | $(7,623) | $– | $1,208,110 | $– |
NOTE 5—Expense Offset Arrangement(s)
The expense offset arrangement is comprised of transfer agency credits which result from balances in demand deposit accounts used by the transfer agent for clearing shareholder transactions. For the year ended April 30, 2019, the Fund received credits from this arrangement, which resulted in the reduction of the Fund’s total expenses of $7,581.
NOTE 6—Trustees’ and Officers’ Fees and Benefits
Trustees’ and Officers’ Fees and Benefits include amounts accrued by the Fund to pay remuneration to certain Trustees and Officers of the Fund. Trustees have the option to defer compensation payable by the Fund, and Trustees’ and Officers’ Fees and Benefits also include amounts accrued by the Fund to fund such deferred compensation amounts. Those Trustees who defer compensation have the option to select various Invesco Funds in which their deferral accounts shall be deemed to be invested. Finally, certain current Trustees were eligible to participate in a retirement plan that provided for benefits to be paid upon retirement to Trustees over a period of time based on the number of years of service. The Fund may have certain former Trustees who also participate in a retirement plan and receive benefits under such plan.Trustees’ and Officers’ Fees and Benefits include amounts accrued by the Fund to fund such retirement benefits. Obligations under the deferred compensation and retirement plans represent unsecured claims against the general assets of the Fund.
NOTE 7—Cash Balances
The Fund is permitted to temporarily carry a negative or overdrawn balance in its account with SSB, the custodian bank. Such balances, if any at period-end, are shown in the Statement of Assets and Liabilities under the payable captionAmount due custodian. To compensate the custodian bank for such overdrafts, the overdrawn Fund may either (1) leave funds as a compensating balance in the account so the custodian bank can be compensated by earning the additional interest; or (2) compensate by paying the custodian bank at a rate agreed upon by the custodian bank and Invesco, not to exceed the contractually agreed upon rate.
NOTE 8—Distributions to Shareholders and Tax Components of Net Assets
| Tax Character of Distributions to Shareholders Paid During the Fiscal Years Ended April 30, 2019 and 2018 |
| | 2019 | 2018 |
| Ordinary income | $— | $4,606,250 |
| Tax Components of Net Assets at Period-End: |
| | 2019 |
| Net unrealized appreciation (depreciation) — investments | (73,713,286) |
| Temporary book/tax differences | (93,953) |
| Capital loss carryforward | (197,089,252) |
| Shares of beneficial interest | 457,570,254 |
| Total net assets | $186,673,763 |
The difference between book-basis and tax-basis unrealized appreciation (depreciation) is due to differences in the timing of recognition of gains and losses on investments for tax and book purposes. The Fund’s net unrealized appreciation (depreciation) difference is attributable primarily to wash sales and passive foreigh investment income.
The temporary book/tax differences are a result of timing differences between book and tax recognition of income and/or expenses. The Fund’s temporary book/tax differences are the result of the trustee deferral of compensation and retirement plan benefits.
Capital loss carryforward is calculated and reported as of a specific date. Results of transactions and other activity after that date may affect the amount of capital loss carryforward actually available for the Fund to utilize. Capital losses generated in years beginning after December 22, 2010 can be carried forward for an unlimited period, whereas previous losses expire in eight tax years. Capital losses with an expiration period may not be used to offset capital gains until all net capital losses without an expiration date have been utilized. Capital loss carryforwards with no expiration date will retain their character as either short-term or long-term capital losses instead of as short-term capital losses as under prior law. The ability to utilize capital loss carryforwards in the future may be limited under the Internal Revenue Code and related regulations based on the results of future transactions.
| 20 | Invesco Gold & Precious Metals Fund |
The Fund has a capital loss carryforward as of April 30, 2019, as follows:
| Capital Loss Carryforward* |
| Expiration | Short-Term | Long-Term | Total |
| Not subject to expiration | $2,429,863 | $194,659,389 | $197,089,252 |
| * | Capital loss carryforward as of the date listed above is reduced for limitations, if any, to the extent required by the Internal Revenue Code and may be further limited depending upon a variety of factors, including the realization of net unrealized gains or losses as of the date of any reorganization. |
NOTE 9—Investment Transactions
The aggregate amount of investment securities (other than short-term securities, U.S. Treasury obligations and money market funds, if any) purchased and sold by the Fund during the year ended April 30, 2019 was $32,370,882 and $64,304,494, respectively. Cost of investments, including any derivatives, on a tax basis includes the adjustments for financial reporting purposes as of the most recently completed federal income tax reporting period-end.
| Unrealized Appreciation (Depreciation) of Investments on a Tax Basis |
| Aggregate unrealized appreciation of investments | $15,724,652 |
| Aggregate unrealized (depreciation) of investments | (89,437,938) |
| Net unrealized appreciation (depreciation) of investments | $(73,713,286) |
Cost of investments for tax purposes is $260,553,059.
NOTE 10—Reclassification of Permanent Differences
Primarily as a result of differing book/tax treatment of net operating losses and passive foreign investment companies, on April 30, 2019, undistributed net investment income (loss) was increased by $9,798,650, undistributed net realized gain (loss) was decreased by $3,317,718 and shares of beneficial interest was decreased by $6,480,932. This reclassification had no effect on the net assets of the Fund.
| 21 | Invesco Gold & Precious Metals Fund |
NOTE 11—Share Information
| | Summary of Share Activity |
| | Years ended April 30, |
| | 2019(a) | | 2018 |
| | Shares | Amount | | Shares | Amount |
| Sold: | | | | | |
| Class A | 5,324,677 | $18,031,730 | | 7,906,830 | $32,609,648 |
| Class B(b) | — | — | | 3,076 | 12,190 |
| Class C | 611,475 | 2,096,303 | | 926,703 | 3,815,907 |
| Class Y | 3,860,343 | 13,317,900 | | 9,198,979 | 39,349,877 |
| Investor Class | 1,434,168 | 4,820,782 | | 1,485,878 | 6,106,179 |
| Class R6 | 40,702 | 150,620 | | 142,331 | 609,241 |
| Issued as reinvestment of dividends: | | | | | |
| Class A | — | — | | 535,889 | 2,084,604 |
| Class B(b) | — | — | | 4,123 | 15,007 |
| Class C | — | — | | 86,204 | 337,919 |
| Class Y | — | — | | 177,930 | 706,382 |
| Investor Class | — | — | | 296,051 | 1,157,558 |
| Class R6 | — | — | | 2,597 | 10,312 |
| Conversion of Class B shares to Class A shares:(c) | | | | | |
| Class A | — | — | | 279,159 | 1,194,802 |
| Class B | — | — | | (298,919) | (1,194,802) |
| Automatic conversion of Class C shares to Class A shares: | | | | | |
| Class A | 1,024,704 | 3,456,388 | | - | - |
| Class C | (1,024,817) | (3,456,388) | | - | - |
| Reacquired: | | | | | |
| Class A | (9,062,490) | (31,208,098) | | (13,502,707) | (55,607,817) |
| Class B(b) | — | — | | (201,481) | (790,558) |
| Class C | (1,817,475) | (6,225,880) | | (1,978,139) | (8,179,501) |
| Class Y | (4,714,293) | (16,463,258) | | (10,482,120) | (43,544,613) |
| Investor Class | (4,005,931) | (13,514,699) | | (2,837,498) | (11,763,732) |
| Class R6 | (144,275) | (539,109) | | (6,583) | (27,555) |
| Net increase (decrease) in share activity | (8,473,212) | $(29,533,709) | | (8,261,697) | $(33,098,952) |
| (a) | There are entities that are record owners of more than 5% of the outstanding shares of the Fund and in the aggregate own 26% of the outstanding shares of the Fund. IDI has an agreement with these entities to sell Fund shares. The Fund, Invesco and/or Invesco affiliates may make payments to these entities, which are considered to be related to the Fund, for providing services to the Fund, Invesco and/or Invesco affiliates including but not limited to services such as securities brokerage, distribution, third party record keeping and account servicing. The Fund has no knowledge as to whether all or any portion of the shares owned of record by these entities are also owned beneficially. |
| (b) | Class B shares activity for the period May 1, 2017 through January 26, 2018 (date of conversion). |
| (c) | Effective as of the close of business on January 26, 2018, all outstanding Class B shares were converted to Class A shares. |
| 22 | Invesco Gold & Precious Metals Fund |
Report of Independent Registered Public Accounting Firm
To the Board of Trustees of AIM Sector Funds (Invesco Sector Funds) and Shareholders of Invesco Gold & Precious Metals Fund:
Opinion on the Financial Statements
We have audited the accompanying statement of assets and liabilities, including the schedule of investments, of Invesco Gold & Precious Metals Fund (one of the funds constituting AIM Sector Funds (Invesco Sector Funds), hereafter referred to as the “Fund”) as of April 30, 2019, the related statement of operations for the year ended April 30, 2019, the statement of changes in net assets for each of the two years in the period ended April 30, 2019, including the related notes, and the financial highlights for each of the periods indicated therein (collectively referred to as the “financial statements”). In our opinion, the financial statements present fairly, in all material respects, the financial position of the Fund as of April 30, 2019, the results of its operations for the year then ended, the changes in its net assets for each of the two years in the period ended April 30, 2019 and the financial highlights for each of the periods indicated therein in conformity with accounting principles generally accepted in the United States of America.
Basis for Opinion
These financial statements are the responsibility of the Fund’s management. Our responsibility is to express an opinion on the Fund’s financial statements based on our audits. We are a public accounting firm registered with the Public Company Accounting Oversight Board (United States) (“PCAOB”) and are required to be independent with respect to the Fund in accordance with the U.S. federal securities laws and the applicable rules and regulations of the Securities and Exchange Commission and the PCAOB.
We conducted our audits of these financial statements in accordance with the standards of the PCAOB. Those standards require that we plan and perform the audit to obtain reasonable assurance about whether the financial statements are free of material misstatement, whether due to error or fraud.
Our audits included performing procedures to assess the risks of material misstatement of the financial statements, whether due to error or fraud, and performing procedures that respond to those risks. Such procedures included examining, on a test basis, evidence regarding the amounts and disclosures in the financial statements. Our audits also included evaluating the accounting principles used and significant estimates made by management, as well as evaluating the overall presentation of the financial statements. Our procedures included confirmation of securities owned as of April 30, 2019 by correspondence with the custodian and transfer agent. We believe that our audits provide a reasonable basis for our opinion.
PricewaterhouseCoopers LLP
Houston, TX
June 26, 2019
We have served as the auditor of one or more of the investment companies in the Invesco group of investment companies since at least 1995. We have not been able to determine the specific year we began serving as auditor.
| 23 | Invesco Gold & Precious Metals Fund |
Calculating your ongoing Fund expenses
Example
As a shareholder of the Fund, you incur two types of costs: (1) transaction costs, which may include sales charges (loads) on purchase payments or contingent deferred sales charges on redemptions, if any; and (2) ongoing costs, including management fees, distribution and/or service (12b-1) fees, and other Fund expenses. This example is intended to help you understand your ongoing costs (in dollars) of investing in the Fund and to compare these costs with ongoing costs of investing in other mutual funds. The example is based on an investment of $1,000 invested at the beginning of the period and held for the entire period November 1, 2018 through April 30, 2019.
Actual expenses
The table below provides information about actual account values and actual expenses. You may use the information in this table, together with the amount you invested, to estimate the expenses that you paid over the period. Simply divide your account value by $1,000 (for example, an $8,600 account value divided by $1,000 = 8.6), then multiply the result by the number in the table under the heading entitled “Actual Expenses Paid During Period” to estimate the expenses you paid on your account during this period.
Hypothetical example for comparison purposes
The table below also provides information about hypothetical account values and hypothetical expenses based on the Fund’s actual expense ratio and an assumed rate of return of 5% per year before expenses, which is not the Fund’s actual return.
The hypothetical account values and expenses may not be used to estimate the actual ending account balance or expenses you paid for the period. You may use this information to compare the ongoing costs of investing in the Fund and other funds. To do so, compare this 5% hypothetical example with the 5% hypothetical examples that appear in the shareholder reports of the other funds.
Please note that the expenses shown in the table are meant to highlight your ongoing costs only and do not reflect any transaction costs, such as sales charges (loads) on purchase payments or contingent deferred sales charges on redemptions, if any. Therefore, the hypothetical information is useful in comparing ongoing costs only, and will not help you determine the relative total costs of owning different funds. In addition, if these transaction costs were included, your costs would have been higher.
| | Beginning
Account Value (11/01/18) | ACTUAL | HYPOTHETICAL
(5% annual return before
expenses) | Annualized
Expense
Ratio |
Ending
Account Value
(04/30/19)1 | Expenses
Paid During
Period2 | Ending
Account Value
(04/30/19) | Expenses
Paid During
Period2 |
| Class A | $1,000.00 | $1,084.70 | $7.60 | $1,017.50 | $7.35 | 1.47% |
| Class C | 1,000.00 | 1,077.90 | 11.44 | 1,013.79 | 11.08 | 2.22 |
| Class Y | 1,000.00 | 1,086.00 | 6.31 | 1,018.74 | 6.11 | 1.22 |
| Investor Class | 1,000.00 | 1,084.10 | 7.60 | 1,017.50 | 7.35 | 1.47 |
| Class R6 | 1,000.00 | 1,085.70 | 5.07 | 1,019.93 | 4.91 | 0.98 |
| 1 | The actual ending account value is based on the actual total return of the Fund for the period November 1, 2018 through April 30, 2019, after actual expenses and will differ from the hypothetical ending account value which is based on the Fund’s expense ratio and a hypothetical annual return of 5% before expenses. |
| 2 | Expenses are equal to the Fund’s annualized expense ratio as indicated above multiplied by the average account value over the period, multiplied by 181/365 to reflect the most recent fiscal half year. |
Approval of Investment Advisory and Sub-Advisory Contracts
The Board of Trustees (the Board) of AIM Equity Funds (Invesco Equity Funds) is required under the Investment Company Act of 1940, as amended, to approve annually the renewal of Invesco Diversified Dividend Fund’s (the Fund) investment advisory agreements. During contract renewal meetings held on June 12-13, 2017, the Board as a whole, and the disinterested or “independent” Trustees, who comprise over 75% of the Board, voting separately, approved the continuance for the Fund of the Master Investment Advisory Agreement with Invesco Advisers, Inc. (Invesco Advisers and the investment advisory agreement) and the Master Intergroup Sub-Advisory Contract for Mutual Funds with Invesco Asset Management Deutschland GmbH, Invesco Asset Management Limited, Invesco Asset Management (Japan) Limited, Invesco Hong Kong Limited, Invesco Senior Secured Management, Inc. and Invesco Canada Ltd. (collectively, the Affiliated Sub-Advisers and the sub-advisory contracts) for another year, effective July 1, 2017.
In evaluating the fairness and reasonableness of compensation under the Fund’s investment advisory agreement and sub-advisory contracts, the Board considered, among other things, the factors discussed below. The Board determined that continuation of the Fund’s investment advisory agreement and the sub-advisory contracts is in the best interest of the Fund and its shareholders and that the compensation payable to Invesco Advisers and the Affiliated Sub-Advisers under the agreements is fair and reasonable.
The Board’s Fund Evaluation Process
The Board’s Investments Committee has established three Sub-Committees, which meet throughout the year to review the performance of funds advised by Invesco Advisers (the Invesco Funds). Over the course of each year, the Sub-Committees meet with portfolio managers for their assigned Invesco Funds and other members of management to review the performance, investment objective(s), policies, strategies, limitations and investment risks of these funds. The Board had the benefit of reports from the Sub-Committees and Investments Committee throughout the year in considering approval of the continuance of each Invesco Fund’s investment advisory agreement and sub-advisory contracts for another year.
During the contract renewal process, the Board receives comparative performance and fee data regarding the Invesco Funds prepared by Invesco Advisers and Broadridge Financial Solutions, Inc. (Broadridge), an independent provider of investment company data. The Board also receives an independent written evaluation from the Senior Officer, an officer of
the Invesco Funds who reports directly to the independent Trustees. The Senior Officer’s evaluation is prepared as part of his responsibility to manage the process by which the Invesco Funds’ proposed management fees are negotiated during the annual contract renewal process to ensure they are negotiated in a manner that is at arms’ length and reasonable. In addition to meetings with Invesco Advisers and fund counsel, the independent Trustees also discuss the continuance of the investment advisory agreement and sub-advisory contracts in separate sessions with the Senior Officer and with independent legal counsel.
The Trustees recognized that the advisory fee rates for the Invesco Funds are, in most cases, the result of years of review and negotiation. The Trustees’ deliberations and conclusions in a particular year may be based in part on their deliberations and conclusions regarding these arrangements throughout the year and in prior years. The Trustees’ review and conclusions are based on the comprehensive consideration of all information presented to them and are not the result of any single determinative factor. Moreover, one Trustee may have weighed a particular piece of information or factor differently than another Trustee.
The discussion below is a summary of the Senior Officer’s independent written evaluation with respect to the Fund’s investment advisory agreement as well as a discussion of the material factors and related conclusions that formed the basis for the Board’s approval of the Fund’s investment advisory agreement and sub-advisory contracts. This information is current as of June 13, 2017, and does not reflect consideration of factors that became known to the Board after that date.
Factors and Conclusions and Summary of Independent Written Fee Evaluation
A. Nature, Extent and Quality of Services Provided by Invesco Advisers and the Affiliated Sub-Advisers
The Board reviewed the advisory services provided to the Fund by Invesco Advisers under the Fund’s investment advisory agreement, the performance of Invesco Advisers in providing these services, and the credentials and experience of the officers and employees of Invesco Advisers who provide these services, including the Fund’s portfolio manager or managers. The Board’s review included consideration of Invesco Advisers’ investment process oversight, credit analysis and investment risk management. The Board also considered non-advisory services that Invesco Advisers and its affiliates provide to the Invesco Funds such as various back office support
functions, trading operations, internal audit, valuation and legal and compliance.
In determining whether to continue the Fund’s investment advisory agreement, the Board considered the benefits of reapproving an existing relationship as contrasted with the greater uncertainty that may be associated with entering into a new relationship. The Board concluded that the nature, extent and quality of the services provided to the Fund by Invesco Advisers are appropriate and satisfactory.
The Board reviewed the services that may be provided by the Affiliated Sub-Advisers under the sub-advisory contracts and the credentials and experience of the officers and employees of the Affiliated Sub-Advisers who provide these services. The Board noted that the Affiliated Sub-Advisers have offices and personnel that are located in financial centers around the world. As a result, the Board noted that the Affiliated Sub-Advisers can provide research and investment analysis on the markets and economies of various countries in which the Fund may invest, make recommendations regarding securities and assist with security trades. The Board concluded that the sub-advisory contracts may benefit the Fund and its shareholders by permitting Invesco Advisers to use the resources and talents of the Affiliated Sub-Advisers in managing the Fund. The Board concluded that the nature, extent and quality of the services that may be provided by the Affiliated Sub-Advisers are appropriate and satisfactory.
B. Fund Investment Performance
The Board considered Fund investment performance as a relevant factor in considering whether to approve the investment advisory agreement. The Board did not view Fund performance as a relevant factor in considering whether to approve the sub-advisory contracts for the Fund, as no Affiliated Sub-Adviser currently manages assets of the Fund.
The Board compared the Fund’s investment performance over multiple time periods ending April 30, 2018 to the performance of funds in the Broadridge performance universe and against the Lipper Large-Cap Value Funds Index. The Board noted that performance of Class A shares of the Fund was in the third quintile of its performance universe for the one year period and the first quintile for the three and five year periods (the first quintile being the best performing funds and the fifth quintile being the worst performing funds). The Board noted that performance of Class A shares of the Fund was below the performance of the Index for the one year period and above the performance of the Index for the three and five year periods. The Trustees also reviewed more recent Fund
performance and this review did not change their conclusions.
C. Advisory and Sub-Advisory Fees
The Board compared the Fund’s contractual management fee rate to the contractual management fee rates of funds in the Fund’s Broadridge expense group at a common asset level. The Board noted that the contractual management fee rate for Class A shares of the Fund was below the median contractual management fee rate of funds in its expense group. The Board noted that the term “contractual management fee” for funds in the expense group may include both advisory and certain administrative services fees, but that Broadridge does not provide information on a fund by fund basis as to what is included. The Board noted that Invesco Advisers does not separately charge the Invesco Funds for the administrative services included in the term as defined by Broadridge. The Board also reviewed the methodology used by Broadridge in providing expense group information, which includes using each fund’s contractual management fee schedule (including any applicable breakpoints) as reported in the most recent prospectus or statement of additional information for each fund in the expense group.
The Board also compared the Fund’s effective advisory fee rate (the advisory fee rate after advisory fee waivers and before other expense limitations/waivers) to the effective advisory fee rates of other mutual funds advised by Invesco Advisers and its affiliates with investment strategies comparable to those of the Fund, based on asset balances as of April 30, 2018. The Board noted that the Fund’s rate was below the rate of one mutual fund and below the rate of an offshore fund advised by Invesco Advisers using a similar investment process.
The Board also considered the fees charged by Invesco Advisers and the Affiliated Sub-Advisers to other client accounts with investment strategies comparable to those of the Fund. The Board noted that Invesco Advisers or the Affiliated Sub-Advisers may charge lower fees to large institutional clients. Invesco Advisers reviewed with the Board the significantly greater scope of services it provides to the Invesco Funds relative to certain other types of client accounts. These additional services include provision of administrative services, officers and office space, oversight of service providers, preparation of annual registration statement updates and financial information and regulatory compliance under the Investment Company Act of 1940, as amended.
Invesco Advisers also reviewed generally the higher frequency of shareholder purchases and redemptions in the Invesco Funds relative to the flow of assets for other client accounts. Invesco Advisers advised the Board that advance notice of redemptions is often provided to Invesco Advisers by institutional clients. The Board did
note that sub-advisory fee rates charged by the Affiliated Sub-Advisers to manage the Invesco Funds and to manage other client accounts tended to be more comparable, reflecting a similar scope of services.
The Board also considered the services that may be provided by the Affiliated Sub-Advisers pursuant to the sub-advisory contracts, as well as the fees payable by Invesco Advisers to the Affiliated Sub-Advisers pursuant to the sub-advisory contracts. The Board also noted that the sub-advisory fees are not paid directly by the Fund, but rather, are payable by Invesco Advisers to the Affiliated Sub-Advisers.
D. Economies of Scale and Breakpoints
The Board considered the extent to which there are economies of scale in the provision of advisory services to the Fund. The Board also considered that the Fund benefits from economies of scale through contractual breakpoints in the Fund’s advisory fee schedule. The Board noted that the Fund shares directly in economies of scale through lower fees charged by third party service providers based on the combined size of the Invesco Funds advised by Invesco Advisers.
E. Profitability and Financial Resources
The Board reviewed information from Invesco Advisers concerning the costs of the advisory and other services that Invesco Advisers and its affiliates provide to the Fund and the Invesco Funds and the profitability of Invesco Advisers and its affiliates in providing these services. The Board noted that Invesco Advisers continues to operate at a net profit from services Invesco Advisers and its affiliates provide to the Invesco Funds and the Fund. The Board did not deem the level of profits realized by Invesco Advisers and its affiliates from providing services to the Fund to be excessive given the nature, quality and extent of the services provided. The Board received and accepted information from Invesco Advisers demonstrating that Invesco Advisers and each Affiliated Sub-Adviser are financially sound and have the resources necessary to perform their obligations under the investment advisory agreement and sub-advisory contracts.
F. Collateral Benefits to Invesco Advisers and its Affiliates
The Board considered various other benefits received by Invesco Advisers and its affiliates from the relationship with the Fund, including the fees received for providing transfer agency and distribution services to the Fund. The Board considered comparative information regarding fees charged for these services, including information provided by Broadridge and other independent sources. The Board considered the performance of Invesco Advisers and its affiliates in providing these services and the organizational structure employed to provide these services. The Board also considered that these services are provided to the Fund pursuant to written contracts that are reviewed and approved on an annual basis by the Board;
and that the services are required for the operation of the Fund.
The Board considered the benefits realized by Invesco Advisers and the Affiliated Sub-Advisers as a result of portfolio brokerage transactions executed through “soft dollar” arrangements. The Board noted that soft dollar arrangements may result in the Fund bearing costs to purchase research that may be used by Invesco Advisers or the Affiliated Sub-Advisers with other clients and may reduce Invesco Advisers’ or the Affiliated Sub-Advisers’ expenses. The Board also considered that it receives periodic reports from the Chief Compliance Officer of the Invesco Funds demonstrating that these arrangements are consistent with regulatory requirements. The Board did not deem the soft dollar arrangements to be inappropriate.
The Board considered that the Fund’s uninvested cash and cash collateral from any securities lending arrangements may be invested in money market funds advised by Invesco Advisers pursuant to procedures approved by the Board. The Board noted that Invesco Advisers receives advisory fees from these affiliated money market funds attributable to such investments, although Invesco Advisers has contractually agreed to waive through varying periods the advisory fees payable by the Invesco Funds with respect to certain investments in the affiliated money market funds. The waiver is in an amount equal to 100% of the net advisory fee Invesco Advisers receives from the affiliated money market funds with respect to the Fund’s investment in the affiliated money market funds of uninvested cash, but not cash collateral. The Board concluded that the amount of advisory fees received by Invesco Advisers from the Fund’s investment of cash collateral from any securities lending arrangements in the affiliated money market funds is fair and reasonable.
The Board also considered that the Fund may use an affiliated broker to execute certain trades for the Fund to, among other things, control information leakage, and was advised that such trades would be executed in compliance with rules under the federal securities laws and consistent with best execution obligations.
Trustees and Officers
The address of each trustee and officer is AIM Sector Funds (Invesco Sector Funds) (the “Trust”), 11 Greenway Plaza, Suite 1000, Houston, Texas 77046-1173. The trustees serve for the life of the Trust, subject to their earlier death, incapacitation, resignation, retirement or removal as more specifically provided in the Trust’s organizational documents. Each officer serves for a one year term or until their successors are elected and qualified. Column two below includes length of time served with predecessor entities, if any.
| | | | | | | | |
Name, Year of Birth and
Position(s) Held with the Trust | | Trustee and/
or Officer Since | | Principal Occupation(s)
During Past 5 Years | | Number of Funds in Fund
Complex
Overseen by
Trustee | | Other Directorship(s)
Held by Trustee During
Past 5 Years |
| Interested Persons | | | | | | | | |
Martin L. Flanagan1 — 1960 Trustee and Vice Chair | | 2007 | | Executive Director, Chief Executive Officer and President, Invesco Ltd. (ultimate parent of Invesco and a global investment management firm); Trustee and Vice Chair, The Invesco Funds; Vice Chair, Investment Company Institute; and Member of Executive Board, SMU Cox School of Business Formerly: Advisor to the Board, Invesco Advisers, Inc. (formerly known as Invesco Institutional (N.A.), Inc.); Chairman and Chief Executive Officer, Invesco Advisers, Inc. (registered investment adviser); Director, Chairman, Chief Executive Officer and President, Invesco Holding Company (US), Inc. (formerly IVZ Inc.) (holding company), Invesco Group Services, Inc. (service provider) and Invesco North American Holdings, Inc. (holding company); Director, Chief Executive Officer and President, Invesco Holding Company Limited (parent of Invesco and a global investment management firm); Director, Invesco Ltd.; Chairman, Investment Company Institute and President,Co-Chief Executive Officer,Co-President, Chief Operating Officer and Chief Financial Officer, Franklin Resources, Inc. (global investment management organization) | | 241 | | None |
Philip A. Taylor2 — 1954 Trustee | | 2006 | | Vice Chair, Invesco Ltd.; Director, Invesco Canada Ltd. (formerly known as Invesco Trimark Ltd./Invesco Trimark Ltèe) (registered investment adviser and registered transfer agent); Trustee, The Invesco Funds Formerly: Head of the Americas and Senior Managing Director, Invesco Ltd.; Director, Invesco Advisers, Inc. (formerly known as Invesco Institutional (N.A.), Inc.) (registered investment adviser); Director and Chairman, Invesco Investment Services, Inc. (formerly known as Invesco AIM Investment Services, Inc.) (registered transfer agent); Chief Executive Officer, Invesco Corporate Class Inc. (corporate mutual fund company); Chairman and Chief Executive Officer, Invesco Canada Ltd. (formerly known as Invesco Trimark Ltd./Invesco Trimark Ltèe) (registered investment adviser and registered transfer agent); Senior Vice President, The Invesco Funds; Director, Invesco Investment Advisers LLC (formerly known as Van Kampen Asset Management); Director, Chairman, Chief Executive Officer and President, Invesco Management Group, Inc. (formerly known as Invesco AIM Management Group, Inc.) (financial services holding company);Co-Chairman,Co-President andCo-Chief Executive Officer, Invesco Advisers, Inc. (formerly known as Invesco Institutional (N.A.), Inc.) (registered investment adviser); Director, Chief Executive Officer and President, Van Kampen Exchange Corp; President and Principal Executive Officer, The Invesco Funds (other than AIM Treasurer’s Series Trust (Invesco Treasurer’s Series Trust), Short-Term Investments Trust and Invesco Management Trust); Executive Vice President, The Invesco Funds (AIM Treasurer’s Series Trust (Invesco Treasurer’s Series Trust), Short-Term Investments Trust and Invesco Management Trust only); Director and President, INVESCO Funds Group, Inc. (registered investment adviser and registered transfer agent); Director and Chairman, IVZ Distributors, Inc. (formerly known as INVESCO Distributors, Inc.) (registered broker dealer); Director, President and Chairman, Invesco Inc. (holding company), Invesco Canada Holdings Inc. (holding company), Trimark Investments Ltd./Placements Trimark Ltèe and Invesco Financial Services Ltd/Services Financiers Invesco Ltèe; Chief Executive Officer, Invesco Canada Fund Inc. (corporate mutual fund company); Director and Chairman, Van Kampen Investor Services Inc.; Director, Chief Executive Officer and President, 1371 Preferred Inc. (holding company) and Van Kampen Investments Inc.; Director and President, AIM GP Canada Inc. (general partner for limited partnerships) and Van Kampen Advisors, Inc.; Director and Chief Executive Officer, Invesco Trimark Dealer Inc. (registered broker dealer); Director, Invesco Distributors, Inc. (formerly known as Invesco AIM Distributors, Inc.) (registered broker dealer); Manager, Invesco Capital Management LLC; Director, Chief Executive Officer and President, Invesco Advisers, Inc.; Director, Chairman, Chief Executive Officer and President, Invesco AIM Capital Management, Inc.; President, Invesco Trimark Dealer Inc. and Invesco Trimark Ltd./Invesco Trimark Ltèe; Director and President, AIM Trimark Corporate Class Inc. and AIM Trimark Canada Fund Inc.; Senior Managing Director, Invesco Holding Company Limited; Director and Chairman, Fund Management Company (former registered broker dealer); President and Principal Executive Officer, The Invesco Funds (AIM Treasurer’s Series Trust (Invesco Treasurer’s Series Trust), and Short-Term Investments Trust only); President, AIM Trimark Global Fund Inc. and AIM Trimark Canada Fund Inc. | | 241 | | None |
| 1 | Mr. Flanagan is considered an interested person (within the meaning of Section 2(a)(19) of the 1940 Act) of the Trust because he is an officer of the Adviser to the Trust, and an officer and a director of Invesco Ltd., ultimate parent of the Adviser. |
| 2 | Mr. Taylor is considered an interested person (within the meaning of Section 2(a)(19) of the 1940 Act) of the Trust because he is an officer of Invesco Ltd., ultimate parent of the Adviser. |
T-1 Invesco Gold & Precious Metals Fund
Trustees and Officers—(continued)
| | | | | | | | |
Name, Year of Birth and
Position(s) Held with the Trust | | Trustee and/
or Officer Since | | Principal Occupation(s)
During Past 5 Years | | Number of Funds in Fund
Complex
Overseen by
Trustee | | Other Directorship(s)
Held by Trustee During
Past 5 Years |
| Independent Trustees | | | | | | | | |
Bruce L. Crockett — 1944 Trustee and Chair | | 2003 | | Chairman, Crockett Technologies Associates (technology consulting company) Formerly: Director, Captaris (unified messaging provider); Director, President and Chief Executive Officer, COMSAT Corporation; Chairman, Board of Governors of INTELSAT (international communications company); ACE Limited (insurance company); Independent Directors Council and Investment Company Institute: Member of the Audit Committee, Investment Company Institute; Member of the Executive Committee and Chair of the Governance Committee, Independent Directors Council | | 241 | | Director and Chairman of the Audit Committee, ALPS (Attorneys Liability Protection Society) (insurance company); Director and Member of the Audit Committee and Compensation Committee, Ferroglobe PLC (metallurgical company) |
David C. Arch — 1945 Trustee | | 2010 | | Chairman of Blistex Inc. (consumer health care products manufacturer); Member, World Presidents’ Organization | | 241 | | Board member of the Illinois Manufacturers’ Association |
Beth Ann Brown3 — 1968 Trustee | | 2019 | | Independent Consultant Formerly: Head of Intermediary Distribution, Managing Director, Strategic Relations, Managing Director, Head of National Accounts, Senior Vice President, National Account Manager and Senior Vice President, Key Account Manager, Columbia Management Investment Advisers LLC; Vice President, Key Account Manager, Liberty Funds Distributor, Inc.; and Trustee of certain Oppenheimer Funds | | 225 | | Director, Board of Directors of Caron Engineering Inc.; Advisor, Board of Advisors of Caron Engineering Inc.; President and Director, Acton Shapleigh Youth Conservation Corps (non -profit); and Vice President and Director of Grahamtastic Connection(non-profit) |
Jack M. Fields — 1952 Trustee | | 2003 | | Chief Executive Officer, Twenty First Century Group, Inc. (government affairs company); and Chairman, Discovery Learning Alliance(non-profit) Formerly: Owner and Chief Executive Officer, Dos Angeles Ranch L.P. (cattle, hunting, corporate entertainment); Director, Insperity, Inc. (formerly known as Administaff) (human resources provider); Chief Executive Officer, Texana Timber LP (sustainable forestry company); Director of Cross Timbers Quail Research Ranch(non-profit); and member of the U.S. House of Representatives | | 241 | | None |
Cynthia Hostetler — 1962 Trustee | | 2017 | | Non-Executive Director and Trustee of a number of public and private business corporations Formerly: Director, Aberdeen Investment Funds (4 portfolios); Head of Investment Funds and Private Equity, Overseas Private Investment Corporation; President, First Manhattan Bancorporation, Inc.; Attorney, Simpson Thacher & Bartlett LLP | | 241 | | Vulcan Materials Company (construction materials company); Trilinc Global Impact Fund; Genesee & Wyoming, Inc. (railroads); Artio Global Investment LLC (mutual fund complex); Edgen Group, Inc. (specialized energy and infrastructure products distributor); Investment Company Institute (professional organization); Independent Directors Council (professional organization) |
Eli Jones — 1961 Trustee | | 2016 | | Professor and Dean, Mays Business School — Texas A&M University Formerly: Professor and Dean, Walton College of Business, University of Arkansas and E.J. Ourso College of Business, Louisiana State University; Director, Arvest Bank | | 241 | | Insperity, Inc. (formerly known as Administaff) (human resources provider) |
Elizabeth Krentzman3 — 1959 Trustee | | 2019 | | Formerly: Principal and Chief Regulatory Advisor for Asset Management Services and U.S. Mutual Fund Leader of Deloitte & Touche LLP; General Counsel of the Investment Company Institute (trade association); National Director of the Investment Management Regulatory Consulting Practice, Principal, Director and Senior Manager of Deloitte & Touche LLP; Assistant Director of the Division of Investment Management — Office of Disclosure and Investment Adviser Regulation of the U.S. Securities and Exchange Commission and various positions with the Division of Investment Management — Office of Regulatory Policy of the U.S. Securities and Exchange Commission; Associate at Ropes & Gray LLP; Advisory Board Member of the Securities and Exchange Commission Historical Society; and Trustee of certain Oppenheimer Funds | | 225 | | Trustee of the University of Florida National Board Foundation and Audit Committee Member; Member of the Cartica Funds Board of Directors (private investment funds); Member of the University of Florida Law Center Association, Inc. Board of Trustees and Audit Committee Member |
Anthony J. LaCava, Jr. — 1956 Trustee | | 2019 | | Formerly: Director and Member of the Audit Committee, Blue Hills Bank (publicly traded financial institution) and Managing Partner, KPMG LLP | | 241 | | Blue Hills Bank; Chairman, Bentley University; Member, Business School Advisory Council; and Nominating Committee, KPMG LLP |
Prema Mathai-Davis — 1950 Trustee | | 2003 | | Retired Co-Owner & Partner of Quantalytics Research, LLC, (a FinTech Investment Research Platform for the Self-Directed Investor) | | 241 | | None |
| 3 | Mss. Brown and Krentzman and Messrs. Motley, Vandivort and Vaughn were appointed as Trustees of the Trust effective June 10, 2019. |
T-2 Invesco Gold & Precious Metals Fund
Trustees and Officers—(continued)
| | | | | | | | |
Name, Year of Birth and
Position(s) Held with the Trust | | Trustee and/
or Officer Since | | Principal Occupation(s)
During Past 5 Years | | Number of Funds in Fund
Complex
Overseen by
Trustee | | Other Directorship(s)
Held by Trustee During
Past 5 Years |
| Independent Trustees—(continued) |
Joel W. Motley3 — 1952 Trustee | | 2019 | | Director of Office of Finance, Federal Home Loan Bank; Member of the Vestry of Trinity Wall Street; Managing Director of Carmona Motley Inc. (privately held financial advisor); Member of the Finance and Budget Committee of the Council on Foreign Relations, Member of the Investment Committee and Board of Human Rights Watch and Member of the Investment Committee and Board of Historic Hudson Valley(non-profit cultural organization) Formerly: Managing Director of Public Capital Advisors, LLC (privately held financial advisor); Managing Director of Carmona Motley Hoffman, Inc. (privately held financial advisor); Trustee of certain Oppenheimer Funds; and Director of Columbia Equity Financial Corp. (privately held financial advisor) | | 225 | | Director of Greenwall Foundation (bioethics research foundation); Member of Board and Investment Committee of The Greenwall Foundation; Director of Southern Africa Legal Services Foundation; Board Member and Investment Committee Member of Pulitzer Center for Crisis Reporting(non-profit journalism) |
Teresa M. Ressel — 1962 Trustee | | 2017 | | Non-executive director and trustee of a number of public and private business corporations Formerly: Chief Financial Officer, Olayan America, The Olayan Group (international investor/commercial/industrial); Chief Executive Officer, UBS Securities LLC; Group Chief Operating Officer, Americas, UBS AG; Assistant Secretary for Management & Budget and CFO, US Department of the Treasury | | 241 | | Atlantic Power Corporation (power generation company); ON Semiconductor Corp. (semiconductor supplier) |
Ann Barnett Stern — 1957 Trustee | | 2017 | | President and Chief Executive Officer, Houston Endowment Inc. (private philanthropic institution) Formerly: Executive Vice President and General Counsel, Texas Children’s Hospital; Attorney, Beck, Redden and Secrest, LLP; Business Law Instructor, University of St. Thomas; Attorney, Andrews & Kurth LLP | | 241 | | Federal Reserve Bank of Dallas |
Raymond Stickel, Jr. — 1944 Trustee | | 2005 | | Retired Formerly: Director, Mainstay VP Series Funds, Inc. (25 portfolios); Partner, Deloitte & Touche | | 241 | | None |
Robert C. Troccoli — 1949 Trustee | | 2016 | | Adjunct Professor, University of Denver — Daniels College of Business Formerly: Senior Partner, KPMG LLP | | 241 | | None |
Daniel S. Vandivort3 — 1954 Trustee | | 2019 | | Treasurer, Chairman of the Audit and Finance Committee, and Trustee, Board of Trustees, Huntington Disease Foundation of America; and President, Flyway Advisory Services LLC (consulting and property management) Formerly: Trustee and Governance Chair, of certain Oppenheimer Funds | | 225 | | Chairman and Lead Independent Director, Chairman of the Audit Committee, and Director, Board of Directors, Value Line Funds |
James D. Vaughn3 — 1945 Trustee | | 2019 | | Retired Formerly: Managing Partner, Deloitte & Touche LLP; Trustee and Chairman of the Audit Committee, Schroder Funds; Board Member, Mile High United Way, Boys and Girls Clubs, Boy Scouts, Colorado Business Committee for the Arts, Economic Club of Colorado and Metro Denver Network (economic development corporation); and Trustee of certain Oppenheimer Funds | | 225 | | Board member and Chairman of Audit Committee of AMG National Trust Bank; Trustee and Investment Committee member, University of South Dakota Foundation; Board member, Audit Committee Member and past Board Chair, Junior Achievement(non-profit) |
Christopher L. Wilson — 1957 Trustee and Vice Chair | | 2017 | | Non-executive director and trustee of a number of public and private business corporations Formerly: Director, TD Asset Management USA Inc. (mutual fund complex) (22 portfolios); Managing Partner, CT2, LLC (investing and consulting firm); President/Chief Executive Officer, Columbia Funds, Bank of America Corporation; President/Chief Executive Officer, CDC IXIS Asset Management Services, Inc.; Principal & Director of Operations, Scudder Funds, Scudder, Stevens & Clark, Inc.; Assistant Vice President, Fidelity Investments | | 241 | | ISO New England, Inc.(non-profit organization managing regional electricity market) |
| Other Officers | | | | | | | | |
Sheri Morris — 1964 President, Principal Executive Officer and Treasurer | | 2003 | | President, Principal Executive Officer and Treasurer, The Invesco Funds; Vice President, Invesco Advisers, Inc. (formerly known as Invesco Institutional (N.A.), Inc.) (registered investment adviser); and Vice President, Invesco Exchange-Traded Fund Trust, Invesco Exchange-Traded Fund Trust II, Invesco India Exchange-Traded Fund Trust, Invesco Actively Managed Exchange-Traded Fund Trust, Invesco Actively Managed Exchange-Traded Commodity Fund Trust and Invesco Exchange-Traded Self-Indexed Fund Trust Formerly: Vice President and Principal Financial Officer, The Invesco Funds; Vice President, Invesco AIM Advisers, Inc., Invesco AIM Capital Management, Inc. and Invesco AIM Private Asset Management, Inc.; Assistant Vice President and Assistant Treasurer, The Invesco Funds and Assistant Vice President, Invesco Advisers, Inc., Invesco AIM Capital Management, Inc. and Invesco AIM Private Asset Management, Inc.; and Treasurer, Invesco Exchange-Traded Fund Trust, Invesco Exchange-Traded Fund Trust II, Invesco India Exchange-Traded Fund Trust and Invesco Actively Managed Exchange-Traded Fund Trust | | N/A | | N/A |
Russell C. Burk — 1958 Senior Vice President and Senior Officer | | 2005 | | Senior Vice President and Senior Officer, The Invesco Funds | | N/A | | N/A |
| 3 | Mss. Brown and Krentzman and Messrs. Motley, Vandivort and Vaughn were appointed as Trustees of the Trust effective June 10, 2019. |
T-3 Invesco Gold & Precious Metals Fund
Trustees and Officers—(continued)
| | | | | | | | |
Name, Year of Birth and
Position(s) Held with the Trust | | Trustee and/
or Officer Since | | Principal Occupation(s)
During Past 5 Years | | Number of Funds in Fund
Complex
Overseen by
Trustee | | Other Directorship(s)
Held by Trustee During
Past 5 Years |
| Other Officers—(continued) | | | | | | | | |
Jeffrey H. Kupor — 1968 Senior Vice President, Chief Legal Officer and Secretary | | 2018 | | Head of Legal of the Americas, Invesco Ltd.; Senior Vice President and Secretary, Invesco Advisers, Inc. (formerly known as Invesco Institutional (N.A.), Inc.) (registered investment adviser); Senior Vice President and Secretary, Invesco Distributors, Inc. (formerly known as Invesco AIM Distributors, Inc.); Vice President and Secretary, Invesco Investment Services, Inc. (formerly known as Invesco AIM Investment Services, Inc.) Senior Vice President, Chief Legal Officer and Secretary, The Invesco Funds; Secretary and General Counsel, Invesco Investment Advisers LLC (formerly known as Van Kampen Asset Management); Secretary and General Counsel, Invesco Capital Markets, Inc. (formerly known as Van Kampen Funds Inc.) and Chief Legal Officer, Invesco Exchange-Traded Fund Trust, Invesco Exchange-Traded Fund Trust II, Invesco India Exchange-Traded Fund Trust, Invesco Actively Managed Exchange-Traded Fund Trust, Invesco Actively Managed Exchange-Traded Commodity Fund Trust and Invesco Exchange-Traded Self-Indexed Fund Trust; Secretary, Invesco Indexing LLC; Secretary, W.L. Ross & Co., LLC; Secretary and Vice President, Jemstep, Inc. Formerly: Head of Legal, Worldwide Institutional, Invesco Ltd.; Secretary and General Counsel, INVESCO Private Capital Investments, Inc.; Senior Vice President, Secretary and General Counsel, Invesco Management Group, Inc. (formerly known as Invesco AIM Management Group, Inc.); Assistant Secretary, INVESCO Asset Management (Bermuda) Ltd.; Secretary and General Counsel, Invesco Private Capital, Inc.; Assistant Secretary and General Counsel, INVESCO Realty, Inc.; Secretary and General Counsel, Invesco Senior Secured Management, Inc.; and Secretary, Sovereign G./P. Holdings Inc. | | N/A | | N/A |
Andrew R. Schlossberg — 1974 Senior Vice President | | 2019 | | Head of the Americas and Senior Managing Director, Invesco Ltd.; Director and Senior Vice President, Invesco Advisers, Inc. (formerly known as Invesco Institutional (N.A.), Inc.) (registered investment adviser); Director and Chairman, Invesco Investment Services, Inc. (formerly known as Invesco AIM Investment Services, Inc.) (registered transfer agent); Senior Vice President, The Invesco Funds; Director, Invesco Investment Advisers LLC (formerly known as Van Kampen Asset Management) and Invesco UK Limited; Director, President and Chairman, Invesco Insurance Agency, Inc.; Director and Chief Executive, Invesco Asset Management Limited and Invesco Fund Managers Limited Formerly: Assistant Vice President, The Invesco Funds; Senior Vice President, Invesco Advisers, Inc. (formerly known as Invesco Institutional (N.A.), Inc.) (registered investment adviser); Director and Chief Executive, Invesco Administration Services Limited and Invesco Global Investment Funds Limited; Director, Invesco Distributors, Inc.; Head of EMEA, Invesco Ltd.; President, Invesco Actively Managed Exchange-Traded Commodity Fund Trust, Invesco Actively Managed Exchange-Traded Fund Trust, Invesco Exchange-Traded Fund Trust, Invesco Exchange-Traded Fund Trust II and Invesco India Exchange-Traded Fund Trust; Managing Director and Principal Executive Officer, Invesco Capital Management LLC | | N/A | | N/A |
John M. Zerr — 1962 Senior Vice President | | 2006 | | Chief Operating Officer of the Americas; Senior Vice President, Invesco Advisers, Inc. (formerly known as Invesco Institutional (N.A.), Inc.) (registered investment adviser); Senior Vice President, Invesco Distributors, Inc. (formerly known as Invesco AIM Distributors, Inc.); Director and Vice President, Invesco Investment Services, Inc. (formerly known as Invesco AIM Investment Services, Inc.) Senior Vice President, The Invesco Funds; Managing Director, Invesco Capital Management LLC; Director, Invesco Investment Advisers LLC (formerly known as Van Kampen Asset Management); Senior Vice President, Invesco Capital Markets, Inc. (formerly known as Van Kampen Funds Inc.); Manager, Invesco Indexing LLC; Director and Senior Vice President, Invesco Insurance Agency, Inc.; Invesco Canada Funds Advisory Board Member; Director, President Chief Executive Officer, Invesco Corporate Class Inc. (corporate mutual fund company); and Director, Chairman, President and Chief Executive Officer, Invesco Canada Ltd. (formerly known as Invesco Trimark Ltd./Invesco Trimark Ltèe) (registered investment adviser and registered transfer agent) Formerly: Director and Senior Vice President, Invesco Management Group, Inc. (formerly known as Invesco AIM Management Group, Inc.); Secretary and General Counsel, Invesco Management Group, Inc. (formerly known as Invesco AIM Management Group, Inc.); Secretary, Invesco Investment Services, Inc. (formerly known as Invesco AIM Investment Services, Inc.); Chief Legal Officer and Secretary, The Invesco Funds; Secretary and General Counsel, Invesco Investment Advisers LLC (formerly known as Van Kampen Asset Management); Secretary and General Counsel, Invesco Capital Markets, Inc. (formerly known as Van Kampen Funds Inc.); Chief Legal Officer, Invesco Exchange-Traded Fund Trust, Invesco Exchange-Traded Fund Trust II, Invesco India Exchange-Traded Fund Trust, Invesco Actively Managed Exchange-Traded Fund Trust, Invesco Actively Managed Exchange-Traded Commodity Fund Trust and Invesco Exchange-Traded Self-Indexed Fund Trust; Secretary, Invesco Indexing LLC; Director, Secretary, General Counsel and Senior Vice President, Van Kampen Exchange Corp.; Director, Vice President and Secretary, IVZ Distributors, Inc. (formerly known as INVESCO Distributors, Inc.); Director and Vice President, INVESCO Funds Group, Inc.; Director and Vice President, Van Kampen Advisors Inc.; Director, Vice President, Secretary and General Counsel, Van Kampen Investor Services Inc.; Director and Secretary, Invesco Distributors, Inc. (formerly known as Invesco AIM Distributors, Inc.); Director, Senior Vice President, General Counsel and Secretary, Invesco AIM Advisers, Inc. and Van Kampen Investments Inc.; Director, Vice President and Secretary, Fund Management Company; Director, Senior Vice President, Secretary, General Counsel and Vice President, Invesco AIM Capital Management, Inc.; Chief Operating Officer and General Counsel, Liberty Ridge Capital, Inc. (an investment adviser) | | N/A | | N/A |
T-4 Invesco Gold & Precious Metals Fund
Trustees and Officers—(continued)
| | | | | | | | |
Name, Year of Birth and
Position(s) Held with the Trust | | Trustee and/
or Officer Since | | Principal Occupation(s)
During Past 5 Years | | Number of Funds in Fund
Complex
Overseen by
Trustee | | Other Directorship(s)
Held by Trustee During
Past 5 Years |
| Other Officers—(continued) | | | | | | | | |
Gregory G. McGreevey — 1962 Senior Vice President | | 2012 | | Senior Managing Director, Invesco Ltd.; Director, Chairman, President, and Chief Executive Officer, Invesco Advisers, Inc. (formerly known as Invesco Institutional (N.A.), Inc.) (registered investment adviser); Director, Invesco Mortgage Capital, Inc. and Invesco Senior Secured Management, Inc.; and Senior Vice President, The Invesco Funds Formerly: Senior Vice President, Invesco Management Group, Inc. and Invesco Advisers, Inc.; Assistant Vice President, The Invesco Funds | | N/A | | N/A |
Kelli Gallegos — 1970 Vice President, Principal Financial Officer and Assistant Treasurer | | 2008 | | Assistant Treasurer, Invesco Specialized Products, LLC; Vice President, Principal Financial Officer and Assistant Treasurer, The Invesco Funds; Principal Financial and Accounting Officer — Pooled Investments, Invesco Capital Management LLC; Vice President and Treasurer, Invesco Exchange-Traded Fund Trust, Invesco Exchange-Traded Fund Trust II, Invesco India Exchange-Traded Fund Trust, Invesco Actively Managed Exchange-Traded Fund Trust, Invesco Actively Managed Exchange-Traded Commodity Fund Trust and Invesco Exchange-Traded Self-Indexed Fund Trust Formerly: Assistant Treasurer, Invesco Exchange-Traded Fund Trust, Invesco Exchange-Traded Fund Trust II, Invesco India Exchange-Traded Fund Trust, Invesco Actively Managed Exchange-Traded Fund Trust, Invesco Actively Managed Exchange-Traded Commodity Fund Trust and Invesco Exchange-Traded Self-Indexed Fund Trust; Assistant Treasurer, Invesco Capital Management LLC; Assistant Vice President, The Invesco Funds | | N/A | | N/A |
Crissie M. Wisdom — 1969 Anti-Money Laundering Compliance Officer | | 2013 | | Anti-Money Laundering Compliance Officer, Invesco Advisers, Inc. (formerly known as Invesco Institutional (N.A.), Inc.) (registered investment adviser), Invesco Capital Markets, Inc. (formerly known as Van Kampen Funds Inc.), Invesco Distributors, Inc., Invesco Investment Services, Inc., The Invesco Funds, and Invesco Exchange-Traded Fund Trust, Invesco Exchange-Traded Fund Trust II, Invesco India Exchange-Traded Fund Trust, Invesco Actively Managed Exchange-Traded Fund Trust, Invesco Actively Managed Exchange-Traded Commodity Fund Trust and Invesco Exchange-Traded Self-Indexed Fund Trust; Anti-Money Laundering Compliance Officer and Bank Secrecy Act Officer, INVESCO National Trust Company and Invesco Trust Company; and Fraud Prevention Manager and Controls and Risk Analysis Manager for Invesco Investment Services, Inc. Formerly: Anti-Money Laundering Compliance Officer, Van Kampen Exchange Corp. and Invesco Management Group, Inc. | | N/A | | N/A |
Robert R. Leveille — 1969 Chief Compliance Officer | | 2016 | | Chief Compliance Officer, Invesco Advisers, Inc. (registered investment adviser); and Chief Compliance Officer, The Invesco Funds Formerly: Chief Compliance Officer, Putnam Investments and the Putnam Funds | | N/A | | N/A |
The Statement of Additional Information of the Trust includes additional information about the Fund’s Trustees and is available upon request, without charge, by calling 1.800.959.4246. Please refer to the Fund’s Statement of Additional Information for information on the Fund’ssub-advisers.
| | | | | | |
Office of the Fund 11 Greenway Plaza, Suite 1000 Houston, TX 77046-1173 | | Investment Adviser Invesco Advisers, Inc. 1555 Peachtree Street, N.E. Atlanta, GA 30309 | | Distributor Invesco Distributors, Inc. 11 Greenway Plaza, Suite 1000 Houston, TX 77046-1173 | | Auditors PricewaterhouseCoopers LLP 1000 Louisiana Street, Suite 5800 Houston, TX 77002-5021 |
| | | |
| | | | | | |
Counsel to the Fund Stradley Ronon Stevens & Young, LLP 2005 Market Street, Suite 2600 Philadelphia, PA 19103-7018 | | Counsel to the Independent Trustees Goodwin Procter LLP 901 New York Avenue, N.W. Washington, D.C. 20001 | | Transfer Agent Invesco Investment Services, Inc. 11 Greenway Plaza, Suite 1000 Houston, TX 77046-1173 | | Custodian State Street Bank and Trust Company 225 Franklin Street Boston, MA 02110-2801 |
T-5 Invesco Gold & Precious Metals Fund
(This page intentionally left blank)
(This page intentionally left blank)
(This page intentionally left blank)
Go paperless with eDelivery
Visit invesco.com/edelivery to enjoy the convenience and security of anytime electronic access to your investment documents.
With eDelivery, you can elect to have any or all of the following materials delivered straight to your inbox to download, save and print from your own computer:
| • | Fund reports and prospectuses |
| • | Quarterly statements |
| • | Daily confirmations |
| • | Tax forms |
Invesco mailing information
Send general correspondence to Invesco Investment Services, Inc., P.O. Box 219078, Kansas City, MO 64121-9078.
Important notice regarding delivery of security holder documents
To reduce Fund expenses, only one copy of most shareholder documents may be mailed to shareholders with multiple accounts at the same address (Householding). Mailing of your shareholder documents may be householded indefinitely unless you instruct us otherwise. If you do not want the mailing of these documents to be combined with those for other members of your household, please contact Invesco Investment Services, Inc. at 800 959 4246 or contact your financial institution. We will begin sending you individual copies for each account within 30 days after receiving your request.
Fund holdings and proxy voting information
The Fund provides a complete list of its holdings four times in each fiscal year, at the quarter-ends. For the second and fourth quarters, the list appears in the Fund’s semiannual and annual reports to shareholders. For the first and third quarters, the Fund files the lists with the Securities and Exchange Commission (SEC) on Form N-Q (or any successor Form). The most recent list of portfolio holdings is available at invesco.com/completeqtrholdings. Shareholders can also look up the Fund’s Form N-Q (or any successor Form) filings on the SEC website, sec.gov. The SEC file numbers for the Fund are shown below.
A description of the policies and procedures that the Fund uses to determine how to vote proxies relating to portfolio securities is available without charge, upon request, from our Client Services department at 800 959 4246, or at invesco.com/proxyguidelines. The information is also available on the SEC website, sec.gov.
Information regarding how the Fund voted proxies related to its portfolio securities during the most recent 12-month period ended June 30 is available at invesco.com/proxysearch. This information is also available on the SEC website, sec.gov.
Invesco Advisers, Inc. is an investment adviser; it provides investment advisory services to individual and institutional clients and does not sell securities. Invesco Distributors, Inc. is the US distributor for Invesco Ltd.’s retail mutual funds, exchange-traded funds and institutional money market funds. Both are wholly owned, indirect subsidiaries of Invesco Ltd.
| SEC file numbers: 811-03826 and 002-85905 | Invesco Distributors, Inc. | I-GPM-AR-1 |
| Annual Report to Shareholders | April 30, 2019 |
Invesco Mid Cap Growth Fund
Nasdaq:
A: VGRAX ■ C: VGRCX ■ R: VGRRX ■ Y: VGRDX ■ R5: VGRJX ■ R6: VGRFX

Beginning on January 1, 2021, as permitted by regulations adopted by the Securities and Exchange Commission, paper copies of the Fund’s shareholder reports will no longer be sent by mail, unless you specifically request paper copies of the reports from the Fund or from your financial intermediary, such as a broker-dealer or bank. Instead, the reports will be made available on the Fund’s website, and you will be notified by mail each time a report is posted and provided with a website link to access the report.
If you already elected to receive shareholder reports electronically, you will not be affected by this change and you need not take any action. You may elect to receive shareholder reports and other communications from the Fund electronically by contacting your financial intermediary (such as a broker-dealer or bank) or, if you are a direct investor, by enrolling at invesco.com/edelivery.
You may elect to receive all future reports in paper free of charge. If you invest through a financial intermediary, you can contact your financial intermediary to request that you continue to receive paper copies of your shareholder reports. If you invest directly with the Fund, you can call (800) 959-4246 to let the Fund know you wish to continue receiving paper copies of your shareholder reports. Your election to receive reports in paper will apply to all funds held with your financial intermediary or all funds held with the fund complex if you invest directly with the Fund.
Dear Shareholders:
This annual report includes information about your Fund, including performance data and a complete list of its investments as of the close of the reporting period. Inside is a discussion of how your Fund was managed and the factors that affected its performance during the reporting period.
Philip Taylor, whose messages to shareholders have appeared here for the last 13 years, transitioned to a senior advisory role on March 1, prior to his retirement at the end of the year, and I assumed his role as Head of the Americas and Senior Managing Director, Invesco Ltd. All of us at Invesco are indebted to Phil for his many years of dedicated service to the company and to its funds’ shareholders. I’m excited about this new opportunity, and I look forward to communicating with fund shareholders going forward.
Investor sentiment during the reporting period ranged from elation to fear, notably in the fourth quarter of 2018. Amid corporate tax cuts and improving global growth, several US equity indexes redefined highs during the first half of the reporting period. The exuberance, however, ended in October as global equities, in particular US stocks, sold off, with the sharpest decline in December of 2018. The catalyst for the sell-off was a combination of ongoing trade concerns between the US and China, fears of a global economic slowdown and lower oil prices from a supply glut. Gains posted earlier in the year for global equities were erased, while US Treasury bonds, along with government and municipal bonds, rallied as investors fled to “safe haven” assets. The reporting period ended on a positive note, however, as global equities bounced back strongly at the outset of 2019, with the US stock market reaching new highs by the period end. Given the strong economy during the reporting period, the US Federal Reserve (the Fed) raised the federal funds rate three times. At its December 2018 meeting, however, the Fed delivered a more “dovish stance” by simultaneously raising rates while reducing guidance for 2019 rate increases. As the fiscal year ended, the Fed had thus far left rates unchanged in 2019. As 2019 unfolds, we’ll see how the interplay of interest rates, economic data, geopolitics and a host of other factors affect US and overseas equity and fixed income markets.
Investor uncertainty and market volatility, such as we witnessed during the reporting period, are unfortunate facts of life when it comes to investing. That’s why Invesco encourages investors to work with a professional financial adviser who can stress the importance of starting to save and invest early and the importance of adhering to a disciplined investment plan. A financial adviser who knows your unique financial situation, investment goals and risk tolerance can be an invaluable partner as you seek to achieve your financial goals. He or she can offer a long-term perspective when markets are volatile and time-tested advice and guidance when your financial situation or investment goals change.
Visit our website for more information on your investments
Our website, invesco.com/us, offers a wide range of market insights and investment perspectives. On the website, you’ll find detailed information about our funds, including performance, holdings and portfolio manager commentaries. You can access information about your account by completing a simple, secure online registration. To do so, select “Log In” on the right side of the homepage, and then select “Register for Individual Account Access.”
In addition to the resources accessible on our website and through our mobile app, you can obtain timely updates to help you stay informed about the markets and the economy by connecting with Invesco on Twitter, LinkedIn or Facebook. You can access our blog at blog.invesco.us.com. Our goal is to provide you the information you want, when and where you want it.
Finally, I’m pleased to share with you Invesco’s commitment to both the Principles for Responsible Investment and to considering environmental, social and governance issues in our robust investment process. I invite you to learn more at invesco.com/esg.
Have questions?
For questions about your account, contact an Invesco client services representative at 800 959 4246.
All of us at Invesco look forward to serving your investment management needs. Thank you for investing with us.
Sincerely,
Andrew Schlossberg
Head of the Americas,
Senior Managing Director, Invesco Ltd.
| 2 | Invesco Mid Cap Growth Fund |
Dear Shareholders:
Among the many important lessons I’ve learned in more than 40 years in a variety of business endeavors is the value of a trusted advocate.
As independent chair of the Invesco Funds Board, I can assure you that the members of the Board are strong advocates for the interests of investors in Invesco’s mutual funds. We work hard to represent your interests through oversight of the quality of the investment management services your funds receive and other matters important to your investment, including but not limited to:
| ■ | Ensuring that Invesco offers a diverse lineup of mutual funds that your financial adviser can use to strive to meet your financial needs as your investment goals change over time. |
| ■ | Monitoring how the portfolio management teams of the Invesco funds are performing in light of changing economic and market conditions. |
| ■ | Assessing each portfolio management team’s investment performance within the context of the investment strategy described in the fund’s prospectus. |
| ■ | Monitoring for potential conflicts of interests that may impact the nature of the services that your funds receive. |
We believe one of the most important services we provide our fund shareholders is the annual review of the funds’ advisory and sub-advisory contracts with Invesco Advisers and its affiliates. This review is required by the Investment Company Act of 1940 and focuses on the nature and quality of the services Invesco provides as the adviser to the Invesco funds and the reasonableness of the fees that it charges for those services. Each year, we spend months carefully reviewing information received from Invesco and a variety of independent sources, such as performance and fee data prepared by Lipper, Inc. (a subsidiary of Broadridge Financial Solutions, Inc.), an independent, third-party firm widely recognized as a leader in its field. We also meet with our independent legal counsel and other independent advisers to review and help us assess the information that we have received. Our goal is to assure that you receive quality investment management services for a reasonable fee.
I trust the measures outlined above provide assurance that you have a worthy advocate when it comes to choosing the Invesco Funds.
As always, please contact me at bruce@brucecrockett.com with any questions or concerns you may have. On behalf of the Board, we look forward to continuing to represent your interests and serving your needs.
Sincerely,
Bruce L. Crockett
Independent Chair
Invesco Funds Board of Trustees
| 3 | Invesco Mid Cap Growth Fund |
Management’s Discussion of Fund Performance
Performance Summary
For the fiscal year ended April 30, 2019, Class A shares of Invesco Mid Cap Growth Fund (the Fund), at net asset value (NAV), underperformed the Russell Midcap Growth Index, the Fund’s style-specific benchmark.
Your Fund’s long-term performance appears later in this report.
Fund vs. Indexes
Total returns, April 30, 2018 to April 30, 2019, at net asset value (NAV). Performance shown does not include applicable contingent deferred sales charges (CDSC) or front-end sales charges, which would have reduced performance.
| Class A Shares | 11.83% |
| Class C Shares | 11.00 |
| Class R Shares | 11.53 |
| Class Y Shares | 12.09 |
| Class R5 Shares | 12.21 |
| Class R6 Shares | 12.33 |
| S&P 500 Index▼ (Broad Market Index) | 13.49 |
Russell Midcap Growth Index■
(Style-Specific Index) | 17.64 |
Lipper Mid-Cap Growth Funds Index♦
(Peer Group Index) | 16.56 |
| Source(s):▼FactSet Research Systems Inc.;■ RIMES Technologies Corp.;♦ Lipper Inc. |
Equity markets rebounded in 2019, fueled by optimism about a potential US-China trade deal and the Fed’s indication that there would be no interest rate hikes in 2019, a surprising shift in monetary policy. The Fed’s more accommodative stance provided a supportive environment for equities and fixed income, even as US economic data were mixed and overseas growth appeared to be slowing. By the end of the fiscal year, the US equity market generally recovered the losses from fourth quarter 2018, backed by improving investor sentiment, low unemployment and a growing economy.
In this environment, the Fund’s Class A shares, at NAV, produced a double-digit return but underperformed its style-specific index during the fiscal year. Notable drivers of relative performance included security selection in and underweight exposure to the information technology (IT) sector, security selection in and overweight exposure to the financials and energy sectors and security selection in the consumer discretionary sector. Conversely, security selection in and underweight exposure to the materials sector, as well as security selection in the industrials sector contributed to the Fund’s relative performance.
During the fiscal year,Wynn Resorts was the leading individual detractor from the Fund’s absolute returns. The hotel and casino company faced headwinds as several factors slowed gambling revenue at its Wynn Macau Resort location in China, including the World Cup in Russia and a September typhoon that shut down the casinos. We sold the position during the fiscal year as a result of deteriorating fundamentals, including the
Market conditions and your Fund
The fiscal year proved to be an increasingly volatile time for US equities. Throughout the summer, US equities moved higher as corporate profits surged amid the benefit of corporate tax cuts
and improving global economic growth. Several US equity indexes reached new highs despite potential headwinds, including trade tensions, tariff announcements and contagion concerns over a Turkish currency crisis. After a relatively quiet summer, market volatility noticeably rose in October 2018, as US equity markets suffered a sharp sell-off through year-end 2018, amid ongoing trade concerns between the US and China, fears of a global economic slowdown and lower oil prices from a supply glut, with oil prices plum-
| Portfolio Composition |
| By sector | % of total net assets |
| Information Technology | 31.64% |
| Industrials | 18.11 |
| Consumer Discretionary | 16.32 |
| Health Care | 13.47 |
| Financials | 7.10 |
| Energy | 3.53 |
| Communication Services | 3.40 |
| Materials | 2.16 |
| Other Sectors, Each Less than 2% of Net Assets | 2.30 |
| Money Market Funds Plus Other Assets Less Liabilities | 1.97 |
meting from near $75 per barrel in early October 2018 to around $45 per barrel in late December 2018.1 In this environment, there was a flight to safety, as investors fled to defensive areas of the market, such as health care, utilities and US Treasuries.
Given signs of a strong economy, the US Federal Reserve (the Fed) raised interest rates three times during the fiscal year: in June, September and December 2018. Following December’s Fed meeting, the Fed raised interest rates by 25 basis points to a targeted range of 2.25% to 2.50%, which signaled a slightly more dovish stance than expected.2 In contrast, the European Central Bank and central banks in several other countries maintained extraordinarily accommodative monetary policies.
| Top 10 Equity Holdings* |
| | % of total net assets |
| 1. | ServiceNow, Inc. | 2.71% |
| 2. | CoStar Group, Inc. | 2.45 |
| 3. | Roper Technologies, Inc. | 1.92 |
| 4. | Cheniere Energy, Inc. | 1.88 |
| 5. | SS&C Technologies Holdings, Inc. | 1.87 |
| 6. | Live Nation Entertainment, Inc. | 1.83 |
| 7. | Burlington Stores, Inc. | 1.82 |
| 8. | Guidewire Software, Inc. | 1.76 |
| 9. | Black Knight, Inc. | 1.68 |
| 10. | GoDaddy, Inc., Class A | 1.65 |
| Total Net Assets | $3.0 billion |
| Total Number of Holdings* | 86 |
| The Fund’s holdings are subject to change, and there is no assurance that the Fund will continue to hold any particular security. |
| *Excluding money market fund holdings. |
| Data presented here are as of April 30, 2019. |
| 4 | Invesco Mid Cap Growth Fund |
slowing Chinese economy and potential for negative impacts from global trade pressures.
Parsley Energy was among the top detractors from the Fund’s absolute performance and performance versus the style-specific benchmark for the fiscal year. Given volatility in oil prices, we believed capital efficiency was becoming increasingly important for exploration and production (E&P) companies. We anticipated Parsley Energy’s size would make it difficult for them to show favorable capital efficiency in 2019 and possibly into 2020. As a result, we sold the position and reallocated in companies that we believe have better risk and reward dynamics.
Transportation and logistics firmXPO Logistics was also among the top detractors from the Fund’s absolute performance for the fiscal year. XPO Logistics experienced turnover in its management team during the fiscal year, causing some volatility for the stock. Given this turnover and, in our view, deteriorating fundamentals overall for the transportation industry, we sold the holding and reallocated capital elsewhere within the industrials sector.
While security selection within the IT sector detracted from the Fund’s performance relative to the style-specific index,ServiceNow was among the top individual contributors to the Fund’s absolute performance and an overweight position in the holding was beneficial to relative performance. ServiceNow provides cloud computing services to businesses in an effort to “make work better for people.” The company’s stock price benefited from continued growth across both the public and private sectors.
During the fiscal year,Dexcom was among the top contributors to the Fund’s absolute performance and the leading contributor to its performance relative to the style-specific benchmark. Dexcom is a company that develops, manufactures and distributes continuous glucose monitors for people of all ages with Type 1 diabetes. The company offers superior features, such as customizable alerts to warn of approaching dangerously high or low glucose levels. The company is also in the early stages of new product launches that we expect will support long-term revenue growth.
CoStar Group was also among the top contributors to absolute Fund performance and the Fund’s performance relative to its style-specific benchmark for the fiscal year. The company is the leading provider of commercial real estate
information, marketing and analytic services. During the fiscal year, CoStar reported strong results with revenues, earnings and bookings all exceeding expectations.
During the fiscal year, the most significant changes to the Fund’s exposure at the sector level included increased exposure to the consumer discretionary and IT sectors, and decreased exposure to the health care, financials, consumer staples and real estate sectors. At the end of the fiscal year, the industrials and energy sectors were the Fund’s largest overweight allocations relative to the style-specific index. The Fund’s largest underweight exposures relative to the style-specific index were in the consumer staples, IT and materials sectors.
At the close of the fiscal year, it appeared that the global growth environment was slowing as the benefits of US tax stimulus and deregulation were being offset by higher interest rates, rising labor costs and trade pressures. In such an environment, true growth will likely remain scarce, and we believe the market will favor companies that can produce growth and compound earnings in spite of the economic cycle. Given this scenario, we seek to identify companies that are taking share within their respective industries. Though we anticipate a possible economic slowing, we strive to prudently balance the Fund between dynamic growth opportunities and more durable growth opportunities.
We thank you for your commitment to Invesco Mid Cap Growth Fund and for sharing our long-term investment horizon.
1 Source: Bloomberg
2 Source: US Federal Reserve
The views and opinions expressed in management’s discussion of Fund performance are those of Invesco Advisers, Inc. These views and opinions are subject to change at any time based on factors such as market and economic conditions. These views and opinions may not be relied upon as investment advice or recommendations, or as an offer for a particular security. The information is not a complete analysis of every aspect of any market, country, industry, security or the Fund. Statements of fact are from sources considered reliable, but Invesco Advisers, Inc. makes no representation or warranty as to their completeness or accuracy. Although historical performance is no guarantee of future results, these insights may help you understand our investment management philosophy.
See important Fund and, if applicable, index disclosures later in this report.
Jim Leach
Chartered Financial Analyst, Portfolio Manager, is manager of Invesco Mid Cap Growth Fund. He joined Invesco in 2011. Mr. Leach earned a BS in mechanical engineering from the University of California and an MBA from New York University Stern School of Business.
Effective June 21, 2019, after the close of the fiscal year, the Portfolio Management team changed to Ronald J. Zibelli, Jr. and Justin Livengood.
| 5 | Invesco Mid Cap Growth Fund |
Your Fund’s Long-Term Performance
Results of a $10,000 Investment — Oldest Share Class(es)
Fund and index data from 4/30/09
| 1 | Source: RIMES Technologies Corp. |
| 2 | Source: FactSet Research Systems Inc. |
| 3 | Source: Lipper Inc. |
Past performance cannot guarantee comparable future results.
The data shown in the chart include reinvested distributions, applicable sales charges and Fund expenses including
management fees. Index results include reinvested dividends, but they do not reflect sales charges. Performance of the peer group, if applicable, reflects fund expenses and management fees; perfor-
mance of a market index does not. Performance shown in the chart and table(s) does not reflect deduction of taxes a shareholder would pay on Fund distributions or sale of Fund shares.
| 6 | Invesco Mid Cap Growth Fund |
| Average Annual Total Returns |
| As of 4/30/19, including maximum applicable sales charges |
| Class A Shares | |
| Inception (12/27/95) | 11.34% |
| 10 Years | 13.58 |
| 5 Years | 7.96 |
| 1 Year | 5.67 |
| Class C Shares | |
| Inception (12/27/95) | 11.28% |
| 10 Years | 13.39 |
| 5 Years | 8.41 |
| 1 Year | 10.07 |
| Class R Shares | |
| Inception (7/11/08) | 9.30% |
| 10 Years | 13.94 |
| 5 Years | 8.92 |
| 1 Year | 11.53 |
| Class Y Shares | |
| Inception (8/12/05) | 9.19% |
| 10 Years | 14.51 |
| 5 Years | 9.47 |
| 1 Year | 12.09 |
| Class R5 Shares | |
| 10 Years | 14.59% |
| 5 Years | 9.59 |
| 1 Year | 12.21 |
| Class R6 Shares | |
| 10 Years | 14.52% |
| 5 Years | 9.68 |
| 1 Year | 12.33 |
Effective June 1, 2010, Class A, Class C, Class R and Class I shares of the predecessor fund, Van Kampen Mid Cap Growth Fund, advised by Van Kampen Asset Management were reorganized into Class A, Class C, Class R and Class Y shares, respectively, of Invesco Van Kampen Mid Cap Growth Fund (renamed Invesco Mid Cap Growth Fund). Returns shown above, prior to June 1, 2010, for Class A, Class C, Class R and Class Y shares are blended returns of the predecessor fund and Invesco Mid Cap Growth Fund. Share class returns will differ from the predecessor fund because of different expenses.
Class R5 shares incepted on June 1, 2010. Performance shown prior to that date is that of the predecessor fund’s Class A shares and includes the 12b-1 fees applicable to Class A shares.
Class R6 shares incepted on July 15, 2013. Performance shown prior to that date is that of the Fund’s and the predecessor fund’s Class A shares and includes the 12b-1 fees applicable to Class A shares.
| Average Annual Total Returns |
| As of 3/31/19, the most recent calendar quarter end,including maximum applicable sales charges |
| Class A Shares | |
| Inception (12/27/95) | 11.20% |
| 10 Years | 15.02 |
| 5 Years | 6.70 |
| 1 Year | 1.10 |
| Class C Shares | |
| Inception (12/27/95) | 11.13% |
| 10 Years | 14.84 |
| 5 Years | 7.15 |
| 1 Year | 5.39 |
| Class R Shares | |
| Inception (7/11/08) | 8.98% |
| 10 Years | 15.38 |
| 5 Years | 7.64 |
| 1 Year | 6.73 |
| Class Y Shares | |
| Inception (8/12/05) | 8.94% |
| 10 Years | 15.96 |
| 5 Years | 8.18 |
| 1 Year | 7.26 |
| Class R5 Shares | |
| 10 Years | 16.04% |
| 5 Years | 8.30 |
| 1 Year | 7.39 |
| Class R6 Shares | |
| 10 Years | 15.96% |
| 5 Years | 8.40 |
| 1 Year | 7.47 |
The performance data quoted represent past performance and cannot guarantee comparable future results; current performance may be lower or higher. Please visit invesco.com/performance for the most recent month-end performance. Performance figures reflect reinvested distributions, changes in net asset value and the effect of the maximum sales charge unless otherwise stated. Investment return and principal value will fluctuate so that you may have a gain or loss when you sell shares.
The total annual Fund operating expense ratio set forth in the most recent Fund prospectus as of the date of this report for Class A, Class C, Class R, Class Y, Class R5 and Class R6 shares was 1.17%, 1.88%, 1.42%, 0.92%, 0.82% and 0.73%, respectively. The expense ratios presented above may vary from the expense ratios presented in other sections of this report that are based on expenses incurred during the period covered by this report.
Class A share performance reflects the maximum 5.50% sales charge, and
Class C share performance reflects the applicable contingent deferred sales charge (CDSC) for the period involved. The CDSC on Class C shares is 1% for the first year after purchase. Class R, Class Y, Class R5 and Class R6 shares do not have a front-end sales charge or a CDSC; therefore, performance is at net asset value.
The performance of the Fund’s share classes will differ primarily due to different sales charge structures and class expenses.
Fund performance reflects any applicable fee waivers and/or expense reimbursements. Had the adviser not waived fees and/or reimbursed expenses currently or in the past, returns would have been lower. See current prospectus for more information.
| 7 | Invesco Mid Cap Growth Fund |
Invesco Mid Cap Growth Fund’s investment objective is to seek capital growth.
| ■ | Unless otherwise stated, information presented in this report is as of April 30, 2019, and is based on total net assets. |
| ■ | Unless otherwise noted, all data provided by Invesco. |
| ■ | To access your Fund’s reports/prospectus, visit invesco.com/fundreports. |
About share classes
| ■ | Class R sharesare generally available only to employer sponsored retirement and benefit plans. Please see the prospectus for more information. |
| ■ | Class Y shares are available only to certain investors. Please see the prospectus for more information. |
| ■ | Class R5 shares andClass R6 shares are available for use by retirement plans that meet certain standards and for institutional investors. Class R6 shares are also available through intermediaries that have established an agreement with Invesco Distributors, Inc. to make such shares available for use in retail omnibus accounts. Please see the prospectus for more information. |
Principal risks of investing in the Fund
| ■ | Foreign securities risk. The Fund’s foreign investments may be adversely affected by political and social instability, changes in economic or taxation policies, difficulty in enforcing obligations, decreased liquidity or increased volatility. Foreign investments also involve the risk of the possible seizure, nationalization or expropriation of the issuer or foreign deposits (in which the Fund could lose its entire investments in a certain market) and the possible adoption of foreign governmental restrictions such as exchange controls. Unless the Fund has hedged its foreign securities risk, foreign securities risk also involves the risk of negative foreign currency rate fluctuations, which may cause the value of securities denominated in such foreign currency (or other instruments through which the Fund has exposure to foreign currencies) to decline in value. Currency exchange rates may fluctuate significantly over short periods of time. Currency hedging strategies, if used, are not always successful. |
| ■ | Growth investing risk. Growth stocks tend to be more expensive relative to |
| | the issuing company’s earnings or assets compared with other types of stock. As a result, they tend to be more sensitive to changes in, or investors’ expectations of, the issuing company’s earnings and can be more volatile. |
| ■ | Management risk. The Fund is actively managed and depends heavily on the Adviser’s judgment about markets, interest rates or the attractiveness, relative values, liquidity, or potential appreciation of particular investments made for the Fund’s portfolio. The Fund could experience losses if these judgments prove to be incorrect. Additionally, legislative, regulatory, or tax developments may adversely affect management of the Fund and, therefore, the ability of the Fund to achieve its investment objective. |
| ■ | Market risk.The market values of the Fund’s investments, and therefore the value of the Fund’s shares, will go up and down, sometimes rapidly or unpredictably. Market risk may affect a single issuer, industry or section of the economy, or it may affect the market as a whole. Individual stock prices tend to go up and down more dramatically than those of certain other types of investments, such as bonds. During a general downturn in the financial markets, multiple asset classes may decline in value. When markets perform well, there can be no assurance that specific investments held by the Fund will rise in value. |
| ■ | Mid-capitalization companies risk. Mid-capitalization companies tend to be more vulnerable to changing market conditions and may have more limited product lines and markets, less experienced management and fewer financial resources than larger companies. These companies’ securities may be more volatile and less liquid than those of more established companies, and their returns may vary, sometimes significantly, from the overall securities market. |
| ■ | Sector focus risk. The Fund may from time to time invest a significant |
amount of its assets (i.e. over 25%) in one market sector or group of related industries. In this event, the Fund’s performance will depend to a greater extent on the overall condition of the sector or group of industries and there is increased risk that the Fund will lose significant value if conditions adversely affect that sector or group of industries.
About indexes used in this report
| ■ | TheS&P 500®Index is an un managed index considered representative of the US stock market. |
| ■ | TheRussell Midcap®Growth Index is an unmanaged index considered representative of mid-cap growth stocks. The Russell Midcap Growth Index is a trademark/service mark of the Frank Russell Co. Russell® is a trademark of the Frank Russell Co. |
| ■ | TheLipper Mid-Cap Growth Funds Index is an unmanaged index considered representative of mid-cap growth funds tracked by Lipper. |
| ■ | The Fund is not managed to track the performance of any particular index, including the index(es) described here, and consequently, the performance of the Fund may deviate significantly from the performance of the index(es). |
| ■ | A direct investment cannot be made in an index. Unless otherwise indicated, index results include reinvested dividends, and they do not reflect sales charges. Performance of the peer group, if applicable, reflects fund expenses; performance of a market index does not. |
Other information
| ■ | The returns shown in management’s discussion of Fund performance are based on net asset values (NAVs) calculated for shareholder transactions. Generally accepted accounting principles require adjustments to be made to the net assets of the Fund at period end for financial reporting purposes, |
This report must be accompanied or preceded by a currently effective Fund prospectus, which contains more complete information, including sales charges and expenses. Investors should read it carefully before investing.
NOT FDIC INSURED | MAY LOSE VALUE | NO BANK GUARANTEE
| 8 | Invesco Mid Cap Growth Fund |
| | and as such, the NAVs for shareholder transactions and the returns based on those NAVs may differ from the NAVs and returns reported in the Financial Highlights. |
| ■ | Industry classifications used in this report are generally according to the Global Industry Classification Standard, which was developed by and is the exclusive property and a service mark of MSCI Inc. and Standard & Poor’s. |
| 9 | Invesco Mid Cap Growth Fund |
Schedule of Investments(a)
April 30, 2019
| | Shares | Value |
| Common Stocks & Other Equity Interests–98.03% |
| Aerospace & Defense–2.91% |
| Harris Corp. | 232,405 | $39,160,242 |
| TransDigm Group, Inc.(b) | 97,359 | 46,977,665 |
| | | | 86,137,907 |
| Apparel Retail–1.82% |
| Burlington Stores, Inc.(b) | 318,622 | 53,818,442 |
| Apparel, Accessories & Luxury Goods–0.63% |
| lululemon athletica, Inc.(b) | 105,638 | 18,629,261 |
| Application Software–9.36% |
| Autodesk, Inc.(b) | 170,826 | 30,442,901 |
| Guidewire Software, Inc.(b) | 488,653 | 52,041,545 |
| New Relic, Inc.(b) | 380,200 | 40,012,248 |
| SS&C Technologies Holdings, Inc. | 818,040 | 55,348,586 |
| Synopsys, Inc.(b) | 293,085 | 35,486,732 |
| Tyler Technologies, Inc.(b) | 142,650 | 33,081,962 |
| Zendesk, Inc.(b) | 349,292 | 30,660,852 |
| | | | 277,074,826 |
| Auto Parts & Equipment–0.79% |
| Aptiv PLC | 271,220 | 23,243,554 |
| Biotechnology–3.20% |
| BioMarin Pharmaceutical, Inc.(b) | 371,471 | 31,771,914 |
| Neurocrine Biosciences, Inc.(b) | 262,245 | 18,944,579 |
| Sage Therapeutics, Inc.(b) | 123,369 | 20,754,367 |
| Sarepta Therapeutics, Inc.(b) | 198,087 | 23,164,294 |
| | | | 94,635,154 |
| Building Products–0.79% |
| Trex Co., Inc.(b) | 336,729 | 23,325,218 |
| Communications Equipment–0.66% |
| Arista Networks, Inc.(b) | 62,441 | 19,499,700 |
| Data Processing & Outsourced Services–4.25% |
| Black Knight, Inc.(b) | 882,895 | 49,812,936 |
| Fidelity National Information Services, Inc. | 325,499 | 37,735,099 |
| FleetCor Technologies, Inc.(b) | 145,958 | 38,087,740 |
| | | | 125,635,775 |
| Department Stores–0.61% |
| Kohl’s Corp. | 253,381 | 18,015,389 |
| Diversified Support Services–1.24% |
| KAR Auction Services, Inc. | 650,653 | 36,748,882 |
| Education Services–2.19% |
| Bright Horizons Family Solutions, Inc.(b) | 307,914 | 39,459,179 |
| | Shares | Value |
| Education Services–(continued) |
| Grand Canyon Education, Inc.(b) | 219,369 | $25,422,674 |
| | | | 64,881,853 |
| Electronic Components–1.24% |
| Amphenol Corp., Class A | 367,666 | 36,604,827 |
| Electronic Equipment & Instruments–0.60% |
| FLIR Systems, Inc. | 335,400 | 17,756,076 |
| Environmental & Facilities Services–1.16% |
| Republic Services, Inc. | 414,968 | 34,367,650 |
| Financial Exchanges & Data–2.42% |
| London Stock Exchange Group PLC (United Kingdom) | 568,065 | 37,246,068 |
| Nasdaq, Inc. | 371,650 | 34,266,130 |
| | | | 71,512,198 |
| General Merchandise Stores–1.41% |
| Dollar General Corp. | 331,218 | 41,763,278 |
| Health Care Equipment–5.02% |
| Boston Scientific Corp.(b) | 565,808 | 21,002,793 |
| DexCom, Inc.(b) | 234,471 | 28,387,404 |
| Edwards Lifesciences Corp.(b) | 134,059 | 23,603,768 |
| Insulet Corp.(b) | 188,700 | 16,275,375 |
| LivaNova PLC(b) | 258,955 | 17,839,410 |
| Penumbra, Inc.(b) | 307,800 | 41,399,100 |
| | | | 148,507,850 |
| Hotels, Resorts & Cruise Lines–1.84% |
| Hilton Worldwide Holdings, Inc. | 272,670 | 23,719,563 |
| Royal Caribbean Cruises Ltd. | 253,194 | 30,621,283 |
| | | | 54,340,846 |
| Household Products–0.87% |
| Church & Dwight Co., Inc. | 344,437 | 25,815,553 |
| Industrial Conglomerates–1.92% |
| Roper Technologies, Inc. | 158,087 | 56,863,894 |
| Industrial Machinery–4.15% |
| Fortive Corp. | 515,997 | 44,551,181 |
| Graco, Inc. | 739,814 | 37,915,468 |
| Ingersoll-Rand PLC | 327,835 | 40,195,849 |
| | | | 122,662,498 |
| Interactive Home Entertainment–1.57% |
| Nintendo Co., Ltd. (Japan) | 73,900 | 25,341,537 |
| Take-Two Interactive Software, Inc.(b) | 217,055 | 21,017,436 |
| | | | 46,358,973 |
| Internet & Direct Marketing Retail–1.25% |
| Etsy, Inc.(b) | 546,043 | 36,879,744 |
See accompanying Notes to Financial Statements which are an integral part of the financial statements.
| 10 | Invesco Mid Cap Growth Fund |
| | Shares | Value |
| Internet Services & Infrastructure–2.63% |
| GoDaddy, Inc., Class A(b) | 598,836 | $48,805,134 |
| Twilio, Inc., Class A(b) | 212,364 | 29,123,599 |
| | | | 77,928,733 |
| Investment Banking & Brokerage–2.62% |
| E*TRADE Financial Corp. | 812,403 | 41,156,336 |
| TD Ameritrade Holding Corp. | 693,330 | 36,455,291 |
| | | | 77,611,627 |
| IT Consulting & Other Services–1.08% |
| Gartner, Inc.(b) | 201,826 | 32,084,279 |
| Leisure Facilities–0.64% |
| Vail Resorts, Inc. | 83,102 | 19,017,893 |
| Life Sciences Tools & Services–2.15% |
| Mettler-Toledo International, Inc.(b) | 62,975 | 46,932,748 |
| Syneos Health, Inc.(b) | 357,204 | 16,763,584 |
| | | | 63,696,332 |
| Managed Health Care–1.10% |
| Centene Corp.(b) | 460,202 | 23,728,015 |
| Humana, Inc. | 34,582 | 8,832,589 |
| | | | 32,560,604 |
| Movies & Entertainment–1.83% |
| Live Nation Entertainment, Inc.(b) | 828,654 | 54,144,252 |
| Multi-line Insurance–0.97% |
| Assurant, Inc. | 302,006 | 28,690,570 |
| Oil & Gas Exploration & Production–1.65% |
| Diamondback Energy, Inc. | 458,072 | 48,734,280 |
| Oil & Gas Storage & Transportation–1.88% |
| Cheniere Energy, Inc.(b) | 864,121 | 55,606,186 |
| Pharmaceuticals–2.00% |
| Aerie Pharmaceuticals, Inc.(b) | 309,955 | 11,824,783 |
| Zoetis, Inc. | 463,815 | 47,234,920 |
| | | | 59,059,703 |
| Regional Banks–1.09% |
| SVB Financial Group(b) | 128,099 | 32,245,080 |
| Research & Consulting Services–3.59% |
| CoStar Group, Inc.(b) | 145,761 | 72,333,896 |
| IHS Markit Ltd.(b) | 590,592 | 33,817,298 |
| | | | 106,151,194 |
| Restaurants–2.50% |
| Domino’s Pizza, Inc. | 168,250 | 45,525,085 |
| Papa John’s International, Inc.(c) | 556,696 | 28,480,567 |
| | | | 74,005,652 |
| Semiconductor Equipment–1.64% |
| KLA-Tencor Corp. | 191,184 | 24,372,136 |
| | Shares | Value |
| Semiconductor Equipment–(continued) |
| Lam Research Corp. | 116,093 | $24,081,171 |
| | | | 48,453,307 |
| Semiconductors–5.07% |
| Advanced Micro Devices, Inc.(b) | 965,363 | 26,672,980 |
| Analog Devices, Inc. | 226,861 | 26,370,323 |
| Marvell Technology Group Ltd. | 1,067,062 | 26,697,891 |
| Microchip Technology, Inc. | 406,806 | 40,635,851 |
| Universal Display Corp. | 185,284 | 29,571,326 |
| | | | 149,948,371 |
| Specialized Consumer Services–1.51% |
| ServiceMaster Global Holdings, Inc.(b) | 914,307 | 44,828,472 |
| Specialized REITs–1.43% |
| SBA Communications Corp., Class A(b) | 207,378 | 42,249,120 |
| Specialty Chemicals–2.16% |
| Celanese Corp. Series A | 247,660 | 26,720,037 |
| Sherwin-Williams Co. (The) | 81,812 | 37,210,552 |
| | | | 63,930,589 |
| Specialty Stores–1.13% |
| Ulta Beauty, Inc.(b) | 95,959 | 33,487,772 |
| Systems Software–5.11% |
| Palo Alto Networks, Inc.(b) | 97,227 | 24,192,994 |
| ServiceNow, Inc.(b) | 295,693 | 80,283,607 |
| Tableau Software, Inc., Class A(b) | 201,847 | 24,586,983 |
| Varonis Systems, Inc.(b) | 312,574 | 22,239,640 |
| | | | 151,303,224 |
| Trading Companies & Distributors–2.35% |
| HD Supply Holdings, Inc.(b) | 776,514 | 35,478,925 |
| United Rentals, Inc.(b) | 242,608 | 34,188,319 |
| | | | 69,667,244 |
| Total Common Stocks & Other Equity Interests (Cost $2,173,834,334) | 2,900,483,832 |
|
| Money Market Funds–1.37% |
| Invesco Government & Agency Portfolio, Institutional Class, 2.34%(d) | 14,246,299 | 14,246,300 |
| Invesco Liquid Assets Portfolio, Institutional Class, 2.48%(d) | 10,172,701 | 10,175,752 |
| Invesco Treasury Portfolio, Institutional Class, 2.32%(d) | 16,281,485 | 16,281,485 |
| Total Money Market Funds (Cost $40,702,230) | 40,703,537 |
| TOTAL INVESTMENTS IN SECURITIES (excluding investments purchased with cash collateral from securities on loan)-99.40% (Cost $2,214,536,564) | | | 2,941,187,369 |
| Investments Purchased with Cash Collateral from Securities on Loan |
| Money Market Funds–0.90% |
| Invesco Government & Agency Portfolio, Institutional Class, 2.34%(d)(e) | 19,904,479 | 19,904,479 |
See accompanying Notes to Financial Statements which are an integral part of the financial statements.
| 11 | Invesco Mid Cap Growth Fund |
| | Shares | Value |
| Money Market Funds–(continued) |
| Invesco Liquid Assets Portfolio, Institutional Class, 2.48%(d)(e) | 6,632,837 | $6,634,826 |
| Total Investments Purchased with Cash Collateral from Securities on Loan (Cost $26,539,305) | 26,539,305 |
| TOTAL INVESTMENTS IN SECURITIES–100.30% (Cost $2,241,075,869) | 2,967,726,674 |
| OTHER ASSETS LESS LIABILITIES–(0.30)% | (8,964,372) |
| NET ASSETS–100.00% | $2,958,762,302 |
Investment Abbreviations:
| REIT | – Real Estate Investment Trust |
Notes to Schedule of Investments:
| (a) | Industry and/or sector classifications used in this report are generally according to the Global Industry Classification Standard, which was developed by and is the exclusive property and a service mark of MSCI Inc. and Standard & Poor’s. |
| (b) | Non-income producing security. |
| (c) | All or a portion of this security was out on loan at April 30, 2019. |
| (d) | The money market fund and the Fund are affiliated by having the same investment adviser. The rate shown is the 7-day SEC standardized yield as of April 30, 2019. |
| (e) | The security has been segregated to satisfy the commitment to return the cash collateral received in securities lending transactions upon the borrower’s return of the securities loaned. See Note 1I. |
See accompanying Notes to Financial Statements which are an integral part of the financial statements.
| 12 | Invesco Mid Cap Growth Fund |
Statement of Assets and Liabilities
April 30, 2019
| Assets: | |
Investments in securities, at value
(Cost $2,173,834,334)1 | $2,900,483,832 |
| Investments in affiliated money market funds, at value (Cost $67,241,535) | 67,242,842 |
| Foreign currencies, at value (Cost $302) | 303 |
| Receivable for: | |
| Investments sold | 20,972,307 |
| Fund shares sold | 1,267,137 |
| Dividends | 788,060 |
| Investment for trustee deferred compensation and retirement plans | 615,853 |
| Other assets | 137,827 |
| Total assets | 2,991,508,161 |
| Liabilities: | |
| Payable for: | |
| Fund shares reacquired | 1,968,135 |
| Amount due custodian | 1,615,401 |
| Collateral upon return of securities loaned | 26,539,305 |
| Accrued fees to affiliates | 1,698,993 |
| Accrued trustees’ and officers’ fees and benefits | 4,248 |
| Accrued other operating expenses | 240,453 |
| Trustee deferred compensation and retirement plans | 679,324 |
| Total liabilities | 32,745,859 |
| Net assets applicable to shares outstanding | $2,958,762,302 |
| Net assets consist of: | |
| Shares of beneficial interest | $2,160,522,470 |
| Distributable earnings | 798,239,832 |
| | $2,958,762,302 |
| Net Assets: |
| Class A | $2,509,975,344 |
| Class C | $54,608,683 |
| Class R | $27,457,578 |
| Class Y | $147,816,055 |
| Class R5 | $118,048,260 |
| Class R6 | $100,856,382 |
| Shares outstanding, no par value, with an unlimited number of shares authorized: |
| Class A | 65,541,082 |
| Class C | 2,016,690 |
| Class R | 745,265 |
| Class Y | 3,660,452 |
| Class R5 | 2,885,439 |
| Class R6 | 2,449,487 |
| Class A: | |
| Net asset value per share | $38.30 |
Maximum offering price per share
(Net asset value of $38.30 ÷ 94.50%) | $40.53 |
| Class C: | |
| Net asset value and offering price per share | $27.08 |
| Class R: | |
| Net asset value and offering price per share | $36.84 |
| Class Y: | |
| Net asset value and offering price per share | $40.38 |
| Class R5: | |
| Net asset value and offering price per share | $40.91 |
| Class R6: | |
| Net asset value and offering price per share | $41.17 |
| 1 | At April 30, 2019, securities with an aggregate value of $25,988,219 were on loan to brokers. |
See accompanying Notes to Financial Statements which are an integral part of the financial statements.
| 13 | Invesco Mid Cap Growth Fund |
Statement of Operations
For the year ended April 30, 2019
| Investment income: | |
| Dividends (net of foreign withholding taxes of $54,507) | $17,729,727 |
| Dividends from affiliated money market funds (includes securities lending income of $115,512) | 889,158 |
| Total investment income | 18,618,885 |
| Expenses: | |
| Advisory fees | 19,344,232 |
| Administrative services fees | 500,362 |
| Custodian fees | 40,183 |
| Distribution fees: | |
| Class A | 5,927,294 |
| Class C | 1,074,337 |
| Class R | 140,375 |
| Transfer agent fees — A, C, R and Y | 5,204,166 |
| Transfer agent fees — R5 | 111,658 |
| Transfer agent fees — R6 | 10,941 |
| Trustees’ and officers’ fees and benefits | 65,128 |
| Registration and filing fees | 146,278 |
| Reports to shareholders | 244,636 |
| Professional services fees | 74,192 |
| Other | 50,870 |
| Total expenses | 32,934,652 |
| Less: Fees waived and expense offset arrangement(s) | (81,274) |
| Net expenses | 32,853,378 |
| Net investment income (loss) | (14,234,493) |
| Realized and unrealized gain (loss) from: | |
| Net realized gain (loss) from: | |
| Investment securities (includes net gains from securities sold to affiliates of $113,802) | 234,805,757 |
| Foreign currencies | (9,379) |
| | 234,796,378 |
| Change in net unrealized appreciation of: | |
| Investment securities | 93,691,494 |
| Foreign currencies | 3,626 |
| | 93,695,120 |
| Net realized and unrealized gain | 328,491,498 |
| Net increase in net assets resulting from operations | $314,257,005 |
See accompanying Notes to Financial Statements which are an integral part of the financial statements.
| 14 | Invesco Mid Cap Growth Fund |
Statement of Changes in Net Assets
For the years ended April 30, 2019 and 2018
| | 2019 | 2018 |
| Operations: | | |
| Net investment income (loss) | $(14,234,493) | $(15,236,593) |
| Net realized gain | 234,796,378 | 263,618,537 |
| Change in net unrealized appreciation | 93,695,120 | 119,279,927 |
| Net increase in net assets resulting from operations | 314,257,005 | 367,661,871 |
| Distributions to shareholders from distributable earnings(1): | | |
| Class A | (254,259,756) | (186,533,891) |
| Class B | — | (1,443,484) |
| Class C | (18,703,991) | (14,133,949) |
| Class R | (3,128,673) | (2,399,573) |
| Class Y | (15,190,359) | (10,446,300) |
| Class R5 | (11,426,078) | (8,139,975) |
| Class R6 | (9,896,881) | (6,509,149) |
| Total distributions to shareholders from distributable earnings | (312,605,738) | (229,606,321) |
| Share transactions–net: | | |
| Class A | 167,289,296 | (7,540,152) |
| Class B | — | (25,718,606) |
| Class C | (63,321,086) | (10,930,116) |
| Class R | (639,069) | (988,247) |
| Class Y | 13,990,046 | (5,818,701) |
| Class R5 | 7,183,187 | (3,227,347) |
| Class R6 | 10,495,555 | 30,490,841 |
| Net increase (decrease) in net assets resulting from share transactions | 134,997,929 | (23,732,328) |
| Net increase in net assets | 136,649,196 | 114,323,222 |
| Net assets: | | |
| Beginning of year | 2,822,113,106 | 2,707,789,884 |
| End of year | $2,958,762,302 | $2,822,113,106 |
| (1) | The Securities and Exchange Commission eliminated the requirement to disclose the distribution components separately, except for tax return of capital. For the year ended April 30, 2018, distributions to shareholders from distributable earnings consisted of distributions from net realized gains. |
See accompanying Notes to Financial Statements which are an integral part of the financial statements.
| 15 | Invesco Mid Cap Growth Fund |
Financial Highlights
April 30, 2019
The following schedule presents financial highlights for a share of the Fund outstanding throughout the periods indicated.
| | Net asset
value,
beginning
of period | Net
investment
income
(loss)(a) | Net gains
(losses)
on securities
(both
realized and
unrealized) | Total from
investment
operations | Distributions
from net
realized
gains | Net asset
value, end
of period | Total
return(b) | Net assets,
end of period
(000’s omitted) | Ratio of
expenses
to average
net assets
with fee waivers
and/or expenses
absorbed | Ratio of
expenses
to average net
assets without
fee waivers
and/or expenses
absorbed | Ratio of net
investment
income
(loss)
to average
net assets | Portfolio
turnover(c) |
| Class A |
| Year ended 04/30/19 | $38.92 | $(0.20) | $3.97 | $3.77 | $(4.39) | $38.30 | 11.83% | $2,509,975 | 1.16%(d) | 1.16%(d) | (0.51)%(d) | 53% |
| Year ended 04/30/18 | 37.12 | (0.21) | 5.29 | 5.08 | (3.28) | 38.92 | 14.06 | 2,329,236 | 1.17 | 1.17 | (0.54) | 51 |
| Year ended 04/30/17 | 33.16 | (0.20) | 5.08 | 4.88 | (0.92) | 37.12 | 14.94 | 2,221,949 | 1.21 | 1.21 | (0.57) | 53 |
| Year ended 04/30/16 | 38.74 | (0.18) | (2.66) | (2.84) | (2.74) | 33.16 | (7.43) | 2,177,520 | 1.20 | 1.21 | (0.49) | 60 |
| Year ended 04/30/15 | 37.30 | (0.15) | 5.18 | 5.03 | (3.59) | 38.74 | 14.39 | 2,482,328 | 1.14 | 1.19 | (0.38) | 61 |
| Class C |
| Year ended 04/30/19 | 29.09 | (0.35) | 2.73 | 2.38 | (4.39) | 27.08 | 11.00(e) | 54,609 | 1.87(d)(e) | 1.87(d)(e) | (1.22)(d)(e) | 53 |
| Year ended 04/30/18 | 28.69 | (0.37) | 4.05 | 3.68 | (3.28) | 29.09 | 13.27(e) | 131,905 | 1.88(e) | 1.88(e) | (1.25)(e) | 51 |
| Year ended 04/30/17 | 26.01 | (0.35) | 3.95 | 3.60 | (0.92) | 28.69 | 14.11(e) | 139,950 | 1.93(e) | 1.93(e) | (1.29)(e) | 53 |
| Year ended 04/30/16 | 31.24 | (0.35) | (2.14) | (2.49) | (2.74) | 26.01 | (8.12)(e) | 148,892 | 1.92(e) | 1.93(e) | (1.21)(e) | 60 |
| Year ended 04/30/15 | 30.95 | (0.35) | 4.23 | 3.88 | (3.59) | 31.24 | 13.59(e) | 176,447 | 1.86(e) | 1.91(e) | (1.10)(e) | 61 |
| Class R |
| Year ended 04/30/19 | 37.71 | (0.28) | 3.80 | 3.52 | (4.39) | 36.84 | 11.53 | 27,458 | 1.41(d) | 1.41(d) | (0.76)(d) | 53 |
| Year ended 04/30/18 | 36.15 | (0.30) | 5.14 | 4.84 | (3.28) | 37.71 | 13.76 | 28,265 | 1.42 | 1.42 | (0.79) | 51 |
| Year ended 04/30/17 | 32.39 | (0.28) | 4.96 | 4.68 | (0.92) | 36.15 | 14.67 | 27,975 | 1.46 | 1.46 | (0.82) | 53 |
| Year ended 04/30/16 | 38.01 | (0.26) | (2.62) | (2.88) | (2.74) | 32.39 | (7.69) | 29,547 | 1.45 | 1.46 | (0.74) | 60 |
| Year ended 04/30/15 | 36.74 | (0.24) | 5.10 | 4.86 | (3.59) | 38.01 | 14.14 | 34,942 | 1.39 | 1.44 | (0.63) | 61 |
| Class Y |
| Year ended 04/30/19 | 40.69 | (0.10) | 4.18 | 4.08 | (4.39) | 40.38 | 12.09 | 147,816 | 0.91(d) | 0.91(d) | (0.26)(d) | 53 |
| Year ended 04/30/18 | 38.58 | (0.12) | 5.51 | 5.39 | (3.28) | 40.69 | 14.33 | 134,312 | 0.92 | 0.92 | (0.29) | 51 |
| Year ended 04/30/17 | 34.34 | (0.12) | 5.28 | 5.16 | (0.92) | 38.58 | 15.24 | 132,925 | 0.96 | 0.96 | (0.32) | 53 |
| Year ended 04/30/16 | 39.92 | (0.09) | (2.75) | (2.84) | (2.74) | 34.34 | (7.21) | 76,291 | 0.95 | 0.96 | (0.24) | 60 |
| Year ended 04/30/15 | 38.23 | (0.05) | 5.33 | 5.28 | (3.59) | 39.92 | 14.70 | 80,736 | 0.89 | 0.94 | (0.13) | 61 |
| Class R5 |
| Year ended 04/30/19 | 41.13 | (0.07) | 4.24 | 4.17 | (4.39) | 40.91 | 12.18 | 118,048 | 0.82(d) | 0.82(d) | (0.17)(d) | 53 |
| Year ended 04/30/18 | 38.92 | (0.08) | 5.57 | 5.49 | (3.28) | 41.13 | 14.47 | 109,122 | 0.82 | 0.82 | (0.19) | 51 |
| Year ended 04/30/17 | 34.59 | (0.07) | 5.32 | 5.25 | (0.92) | 38.92 | 15.39 | 106,223 | 0.83 | 0.83 | (0.19) | 53 |
| Year ended 04/30/16 | 40.14 | (0.04) | (2.77) | (2.81) | (2.74) | 34.59 | (7.08) | 91,700 | 0.82 | 0.82 | (0.11) | 60 |
| Year ended 04/30/15 | 38.39 | (0.02) | 5.36 | 5.34 | (3.59) | 40.14 | 14.80 | 86,090 | 0.81 | 0.81 | (0.05) | 61 |
| Class R6 |
| Year ended 04/30/19 | 41.33 | (0.03) | 4.26 | 4.23 | (4.39) | 41.17 | 12.27 | 100,856 | 0.73(d) | 0.73(d) | (0.08)(d) | 53 |
| Year ended 04/30/18 | 39.06 | (0.04) | 5.59 | 5.55 | (3.28) | 41.33 | 14.58 | 89,273 | 0.73 | 0.73 | (0.10) | 51 |
| Year ended 04/30/17 | 34.68 | (0.04) | 5.34 | 5.30 | (0.92) | 39.06 | 15.50 | 54,568 | 0.75 | 0.75 | (0.11) | 53 |
| Year ended 04/30/16 | 40.21 | (0.01) | (2.78) | (2.79) | (2.74) | 34.68 | (7.02) | 49,485 | 0.73 | 0.73 | (0.02) | 60 |
| Year ended 04/30/15 | 38.41 | 0.02 | 5.37 | 5.39 | (3.59) | 40.21 | 14.93 | 61,029 | 0.72 | 0.72 | 0.04 | 61 |
| (a) | Calculated using average shares outstanding. |
| (b) | Includes adjustments in accordance with accounting principles generally accepted in the United States of America and as such, the net asset value for financial reporting purposes and the returns based upon those net asset values may differ from the net asset value and returns for shareholder transactions. Does not include sales charges and is not annualized for periods less than one year, if applicable. |
| (c) | Portfolio turnover is calculated at the fund level and is not annualized for periods less than one year, if applicable. |
| (d) | Ratios are based on average daily net assets (000’s omitted) of $2,370,918, $111,591, $28,075, $143,103, $111,738 and $95,227 for Class A, Class C, Class R, Class Y, Class R5 and Class R6 shares, respectively. |
| (e) | The total return, ratio of expenses to average net assets and ratio of net investment income (loss) to average net assets reflect actual 12b-1 fees of 0.96%, 0.96%, 0.97%, 0.98% and 0.97% for the years ended April 30, 2019, 2018, 2017, 2016 and 2015, respectively. |
See accompanying Notes to Financial Statements which are an integral part of the financial statements.
| 16 | Invesco Mid Cap Growth Fund |
Notes to Financial Statements
April 30, 2019
NOTE 1—Significant Accounting Policies
Invesco Mid Cap Growth Fund (the “Fund”) is a series portfolio of AIM Sector Funds (Invesco Sector Funds) (the “Trust”). The Trust is a Delaware statutory trust registered under the Investment Company Act of 1940, as amended (the “1940 Act”), as an open-end series management investment company authorized to issue an unlimited number of shares of beneficial interest. Information presented in these financial statements pertains only to the Fund. Matters affecting the Fund or each class will be voted on exclusively by the shareholders of the Fund or each class.
The Fund’s investment objective is to seek capital growth.
The Fund currently consists of six different classes of shares: Class A, Class C, Class R, Class Y, Class R5 and Class R6. Class Y shares are available only to certain investors. Class A shares are sold with a front-end sales charge unless certain waiver criteria are met. Under certain circumstances, load waived shares may be subject to contingent deferred sales charges ("CDSC"). Class C shares are sold with a CDSC. Class R, Class Y, Class R5 and Class R6 shares are sold at net asset value. Class C shares held for ten years after purchase are eligible for automatic conversion into Class A shares of the same Fund (the "Conversion Feature"). The automatic conversion pursuant to the Conversion Feature will generally occur at the end of the month following the tenth anniversary after a purchase of Class C shares.
The Fund is an investment company and accordingly follows the investment company accounting and reporting guidance in accordance with Financial Accounting Standards Board Accounting Standards Codification Topic 946,Financial Services – Investment Companies.
The following is a summary of the significant accounting policies followed by the Fund in the preparation of its financial statements.
| A. | Security Valuations — Securities, including restricted securities, are valued according to the following policy. |
A security listed or traded on an exchange (except convertible securities) is valued at its last sales price or official closing price as of the close of the customary trading session on the exchange where the security is principally traded, or lacking any sales or official closing price on a particular day, the security may be valued at the closing bid price on that day. Securities traded in the over-the-counter market are valued based on prices furnished by independent pricing services or market makers. When such securities are valued by an independent pricing service they may be considered fair valued. Futures contracts are valued at the final settlement price set by an exchange on which they are principally traded. Listed options are valued at the mean between the last bid and asked prices from the exchange on which they are principally traded. Options not listed on an exchange are valued by an independent source at the mean between the last bid and asked prices. For purposes of determining net asset value (“NAV”) per share, futures and option contracts generally are valued 15 minutes after the close of the customary trading session of the New York Stock Exchange (“NYSE”).
Investments in open-end and closed-end registered investment companies that do not trade on an exchange are valued at the end-of-day net asset value per share. Investments in open-end and closed-end registered investment companies that trade on an exchange are valued at the last sales price or official closing price as of the close of the customary trading session on the exchange where the security is principally traded.
Debt obligations (including convertible securities) and unlisted equities are fair valued using an evaluated quote provided by an independent pricing service. Evaluated quotes provided by the pricing service may be determined without exclusive reliance on quoted prices, and may reflect appropriate factors such as institution-size trading in similar groups of securities, developments related to specific securities, dividend rate (for unlisted equities), yield (for debt obligations), quality, type of issue, coupon rate (for debt obligations), maturity (for debt obligations), individual trading characteristics and other market data. Pricing services generally value debt obligations assuming orderly transactions of institutional round lot size, but a fund may hold or transact in the same securities in smaller, odd lot sizes. Odd lots often trade at lower prices than institutional round lots. Debt obligations are subject to interest rate and credit risks. In addition, all debt obligations involve some risk of default with respect to interest and/or principal payments.
Foreign securities’ (including foreign exchange contracts) prices are converted into U.S. dollar amounts using the applicable exchange rates as of the close of the NYSE. If market quotations are available and reliable for foreign exchange-traded equity securities, the securities will be valued at the market quotations. Because trading hours for certain foreign securities end before the close of the NYSE, closing market quotations may become unreliable. If between the time trading ends on a particular security and the close of the customary trading session on the NYSE, events occur that the investment adviser determines are significant and make the closing price unreliable, the Fund may fair value the security. If the event is likely to have affected the closing price of the security, the security will be valued at fair value in good faith using procedures approved by the Board of Trustees. Adjustments to closing prices to reflect fair value may also be based on a screening process of an independent pricing service to indicate the degree of certainty, based on historical data, that the closing price in the principal market where a foreign security trades is not the current value as of the close of the NYSE. Foreign securities’ prices meeting the approved degree of certainty that the price is not reflective of current value will be priced at the indication of fair value from the independent pricing service. Multiple factors may be considered by the independent pricing service in determining adjustments to reflect fair value and may include information relating to sector indices, American Depositary Receipts and domestic and foreign index futures. Foreign securities may have additional risks including exchange rate changes, potential for sharply devalued currencies and high inflation, political and economic upheaval, the relative lack of issuer information, relatively low market liquidity and the potential lack of strict financial and accounting controls and standards.
Securities for which market prices are not provided by any of the above methods may be valued based upon quotes furnished by independent sources. The last bid price may be used to value equity securities. The mean between the last bid and asked prices is used to value debt obligations, including corporate loans.
Securities for which market quotations are not readily available or became unreliable are valued at fair value as determined in good faith by or under the supervision of the Trust’s officers following procedures approved by the Board of Trustees. Issuer specific events, market trends, bid/asked quotes of brokers and information providers and other market data may be reviewed in the course of making a good faith determination of a security’s fair value.
The Fund may invest in securities that are subject to interest rate risk, meaning the risk that the prices will generally fall as interest rates rise and, conversely, the prices will generally rise as interest rates fall. Specific securities differ in their sensitivity to changes in interest rates depending on their individual characteristics. Changes in interest rates may result in increased market volatility, which may affect the value and/or liquidity of certain Fund investments.
| 17 | Invesco Mid Cap Growth Fund |
Valuations change in response to many factors including the historical and prospective earnings of the issuer, the value of the issuer’s assets, general economic conditions, interest rates, investor perceptions and market liquidity. Because of the inherent uncertainties of valuation, the values reflected in the financial statements may materially differ from the value received upon actual sale of those investments.
| B. | Securities Transactions and Investment Income — Securities transactions are accounted for on a trade date basis. Realized gains or losses on sales are computed on the basis of specific identification of the securities sold. Interest income (net of withholding tax, if any) is recorded on the accrual basis from settlement date. Dividend income (net of withholding tax, if any) is recorded on the ex-dividend date. |
The Fund may periodically participate in litigation related to Fund investments. As such, the Fund may receive proceeds from litigation settlements. Any proceeds received are included in the Statement of Operations as realized gain (loss) for investments no longer held and as unrealized gain (loss) for investments still held.
Brokerage commissions and mark ups are considered transaction costs and are recorded as an increase to the cost basis of securities purchased and/or a reduction of proceeds on a sale of securities. Such transaction costs are included in the determination of net realized and unrealized gain (loss) from investment securities reported in the Statement of Operations and the Statement of Changes in Net Assets and the net realized and unrealized gains (losses) on securities per share in the Financial Highlights. Transaction costs are included in the calculation of the Fund’s net asset value and, accordingly, they reduce the Fund’s total returns. These transaction costs are not considered operating expenses and are not reflected in net investment income reported in the Statement of Operations and the Statement of Changes in Net Assets, or the net investment income per share and the ratios of expenses and net investment income reported in the Financial Highlights, nor are they limited by any expense limitation arrangements between the Fund and the investment adviser.
The Fund allocates income and realized and unrealized capital gains and losses to a class based on the relative net assets of each class.
| C. | Country Determination – For the purposes of making investment selection decisions and presentation in the Schedule of Investments, the investment adviser may determine the country in which an issuer is located and/or credit risk exposure based on various factors. These factors include the laws of the country under which the issuer is organized, where the issuer maintains a principal office, the country in which the issuer derives 50% or more of its total revenues and the country that has the primary market for the issuer’s securities, as well as other criteria. Among the other criteria that may be evaluated for making this determination are the country in which the issuer maintains 50% or more of its assets, the type of security, financial guarantees and enhancements, the nature of the collateral and the sponsor organization. Country of issuer and/or credit risk exposure has been determined to be the United States of America, unless otherwise noted. |
| D. | Distributions– Distributions from net investment income and net realized capital gain, if any, are generally declared and paid annually and recorded on the ex-dividend date. The Fund may elect to treat a portion of the proceeds from redemptions as distributions for federal income tax purposes. |
| E. | Federal Income Taxes – The Fund intends to comply with the requirements of Subchapter M of the Internal Revenue Code of 1986, as amended (the “Internal Revenue Code”), necessary to qualify as a regulated investment company and to distribute substantially all of the Fund’s taxable earnings to shareholders. As such, the Fund will not be subject to federal income taxes on otherwise taxable income (including net realized capital gain) that is distributed to shareholders. Therefore, no provision for federal income taxes is recorded in the financial statements. |
The Fund recognizes the tax benefits of uncertain tax positions only when the position is more likely than not to be sustained. Management has analyzed the Fund’s uncertain tax positions and concluded that no liability for unrecognized tax benefits should be recorded related to uncertain tax positions. Management is not aware of any tax positions for which it is reasonably possible that the total amounts of unrecognized tax benefits will change materially in the next 12 months.
The Fund files tax returns in the U.S. Federal jurisdiction and certain other jurisdictions. Generally, the Fund is subject to examinations by such taxing authorities for up to three years after the filing of the return for the tax period.
| F. | Expenses – Fees provided for under the Rule 12b-1 plan of a particular class of the Fund are charged to the operations of such class. Transfer agency fees and expenses and other shareholder recordkeeping fees and expenses attributable to Class R5 and Class R6 are allocated to each share class based on relative net assets. Sub-accounting fees attributable to Class R5 are charged to the operations of the class. Transfer agency fees and expenses and other shareholder recordkeeping fees and expenses relating to all other classes are allocated among those classes based on relative net assets. All other expenses are allocated among the classes based on relative net assets. |
| G. | Accounting Estimates – The preparation of financial statements in conformity with accounting principles generally accepted in the United States of America (“GAAP”) requires management to make estimates and assumptions that affect the reported amounts of assets and liabilities at the date of the financial statements and the reported amounts of revenues and expenses during the reporting period including estimates and assumptions related to taxation. Actual results could differ from those estimates by a significant amount. In addition, the Fund monitors for material events or transactions that may occur or become known after the period-end date and before the date the financial statements are released to print. |
| H. | Indemnifications – Under the Trust’s organizational documents, each Trustee, officer, employee or other agent of the Trust is indemnified against certain liabilities that may arise out of the performance of their duties to the Fund. Additionally, in the normal course of business, the Fund enters into contracts, including the Fund’s servicing agreements, that contain a variety of indemnification clauses. The Fund’s maximum exposure under these arrangements is unknown as this would involve future claims that may be made against the Fund that have not yet occurred. The risk of material loss as a result of such indemnification claims is considered remote. |
| I. | Securities Lending– The Fund may lend portfolio securities having a market value up to one-third of the Fund’s total assets. Such loans are secured by collateral equal to no less than the market value of the loaned securities determined daily by the securities lending provider. Such collateral will be cash or debt securities issued or guaranteed by the U.S. Government or any of its sponsored agencies. Cash collateral received in connection with these loans is invested in short-term money market instruments or affiliated money market funds and is shown as such on the Schedule of Investments. The Fund bears the risk of loss with respect to the investment of collateral. It is the Fund’s policy to obtain additional collateral from or return excess collateral to the borrower by the end of the next business day, following the valuation date of the securities loaned. Therefore, the value of the collateral held may be temporarily less than the value of the securities on loan. When loaning securities, the Fund retains certain benefits of owning the securities, including the economic equivalent of dividends or interest generated by the security. Lending securities entails a risk of loss to the Fund if, and to the extent that, the market value of the securities loaned were to increase and the borrower did not increase the collateral accordingly, and the borrower failed to return the securities. The securities loaned are subject to termination at the option of the borrower or the Fund. Upon termination, the borrower will return to the Fund the securities loaned and the Fund |
| 18 | Invesco Mid Cap Growth Fund |
| | will return the collateral. Upon the failure of the borrower to return the securities, collateral may be liquidated and the securities may be purchased on the open market to replace the loaned securities. The Fund could experience delays and costs in gaining access to the collateral and the securities may lose value during the delay which could result in potential losses to the Fund. Some of these losses may be indemnified by the lending agent. The Fund bears the risk of any deficiency in the amount of the collateral available for return to the borrower due to any loss on the collateral invested. Dividends received on cash collateral investments for securities lending transactions, which are net of compensation to counterparties, are included inDividends from affiliated money market funds on the Statement of Operations. The aggregate value of securities out on loan, if any, is shown as a footnote on the Statement of Assets and Liabilities. |
| J. | Foreign Currency Translations – Foreign currency is valued at the close of the NYSE based on quotations posted by banks and major currency dealers. Portfolio securities and other assets and liabilities denominated in foreign currencies are translated into U.S. dollar amounts at the date of valuation. Purchases and sales of portfolio securities (net of foreign taxes withheld on disposition) and income items denominated in foreign currencies are translated into U.S. dollar amounts on the respective dates of such transactions. The Fund does not separately account for the portion of the results of operations resulting from changes in foreign exchange rates on investments and the fluctuations arising from changes in market prices of securities held. The combined results of changes in foreign exchange rates and the fluctuation of market prices on investments (net of estimated foreign tax withholding) are included with the net realized and unrealized gain or loss from investments in the Statement of Operations. Reported net realized foreign currency gains or losses arise from (1) sales of foreign currencies, (2) currency gains or losses realized between the trade and settlement dates on securities transactions, and (3) the difference between the amounts of dividends, interest, and foreign withholding taxes recorded on the Fund’s books and the U.S. dollar equivalent of the amounts actually received or paid. Net unrealized foreign currency gains and losses arise from changes in the fair values of assets and liabilities, other than investments in securities at fiscal period end, resulting from changes in exchange rates. |
The Fund may invest in foreign securities, which may be subject to foreign taxes on income, gains on investments or currency repatriation, a portion of which may be recoverable. Foreign taxes, if any, are recorded based on the tax regulations and rates that exist in the foreign markets in which the Fund invests and are shown in the Statement of Operations.
| K. | Forward Foreign Currency Contracts – The Fund may engage in foreign currency transactions either on a spot (i.e. for prompt delivery and settlement) basis, or through forward foreign currency contracts, to manage or minimize currency or exchange rate risk. |
The Fund may also enter into forward foreign currency contracts for the purchase or sale of a security denominated in a foreign currency in order to “lock in” the U.S. dollar price of that security, or the Fund may also enter into forward foreign currency contracts that do not provide for physical settlement of the two currencies, but instead are settled by a single cash payment calculated as the difference between the agreed upon exchange rate and the spot rate at settlement based upon an agreed upon notional amount (non-deliverable forwards). The Fund will set aside liquid assets in an amount equal to the daily mark-to-market obligation for forward foreign currency contracts.
A forward foreign currency contract is an obligation between two parties (“Counterparties”) to purchase or sell a specific currency for an agreed-upon price at a future date. The use of forward foreign currency contracts does not eliminate fluctuations in the price of the underlying securities the Fund owns or intends to acquire but establishes a rate of exchange in advance. Fluctuations in the value of these contracts are measured by the difference in the contract date and reporting date exchange rates and are recorded as unrealized appreciation (depreciation) until the contracts are closed. When the contracts are closed, realized gains (losses) are recorded. Realized and unrealized gains (losses) on the contracts are included in the Statement of Operations. The primary risks associated with forward foreign currency contracts include failure of the Counterparty to meet the terms of the contract and the value of the foreign currency changing unfavorably. These risks may be in excess of the amounts reflected in the Statement of Assets and Liabilities.
NOTE 2—Advisory Fees and Other Fees Paid to Affiliates
The Trust has entered into a master investment advisory agreement with Invesco Advisers, Inc. (the "Adviser" or "Invesco"). Under the terms of the investment advisory agreement, the Fund accrues daily and pays monthly an advisory fee to the Adviser based on the annual rate of the Fund’s average daily net assets as follows:
| Average Daily Net Assets | Rate |
| First $500 million | 0.75% |
| Next $500 million | 0.70% |
| Over $1 billion | 0.65% |
For the year ended April 30, 2019, the effective advisory fees incurred by the Fund was 0.68%.
Under the terms of a master sub-advisory agreement between the Adviser and each of Invesco Asset Management Deutschland GmbH, Invesco Asset Management Limited, Invesco Asset Management (Japan) Limited, Invesco Hong Kong Limited, Invesco Senior Secured Management, Inc. and Invesco Canada Ltd. (collectively, the "Affiliated Sub-Advisers") the Adviser, not the Fund, will pay 40% of the fees paid to the Adviser to any such Affiliated Sub-Adviser(s) that provide(s) discretionary investment management services to the Fund based on the percentage of assets allocated to such Affiliated Sub-Adviser(s).
The Adviser has contractually agreed, through at least June 30, 2020, to waive advisory fees and/or reimburse expenses of all shares to the extent necessary to limit total annual fund operating expenses after fee waiver and/or expense reimbursement (excluding certain items discussed above) of Class A, Class C, Class R, Class Y, Class R5 and Class R6 shares to 2.00%, 2.75%, 2.25%, 1.75%, 1.75% and 1.75%, respectively, of average daily net assets (the "expense limits"). In determining the Adviser’s obligation to waive advisory fees and/or reimburse expenses, the following expenses are not taken into account, and could cause the total annual fund operating expenses after fee waiver and/or expense reimbursement to exceed the numbers reflected above: (1) interest; (2) taxes; (3) dividend expense on short sales; (4) extraordinary or non-routine items, including litigation expenses; and (5) expenses that the Fund has incurred but did not actually pay because of an expense offset arrangement. Unless Invesco continues the fee waiver agreement, it will terminate on June 30, 2020. During its term, the fee waiver agreement cannot be terminated or amended to increase the expense limits or reduce the advisory fee waiver without approval of the Board of Trustees. The Adviser did not waive fees and/or reimburse expenses during the period under these expense limits.
| 19 | Invesco Mid Cap Growth Fund |
The Adviser has contractually agreed, through at least June 30, 2021, to waive the advisory fee payable by the Fund in an amount equal to 100% of the net advisory fees the Adviser receives from the affiliated money market funds on investments by the Fund of uninvested cash (excluding investments of cash collateral from securities lending) in such affiliated money market funds.
For the year ended April 30, 2019, the Adviser waived advisory fees of $40,275.
The Trust has entered into a master administrative services agreement with Invesco pursuant to which the Fund has agreed to pay Invesco for certain administrative costs incurred in providing accounting services to the Fund. For the year ended April 30, 2019, expenses incurred under the agreement are shown in the Statement of Operations asAdministrative services fees. Also, Invesco has entered into a sub-administration agreement whereby State Street Bank and Trust Company (“SSB”) serves as custodian and fund accountant and provides certain administrative services to the Fund.
The Trust has entered into a transfer agency and service agreement with Invesco Investment Services, Inc. (“IIS”) pursuant to which the Fund has agreed to pay IIS a fee for providing transfer agency and shareholder services to the Fund and reimburse IIS for certain expenses incurred by IIS in the course of providing such services. IIS may make payments to intermediaries that provide omnibus account services, sub-accounting services and/or networking services. All fees payable by IIS to intermediaries that provide omnibus account services or sub-accounting services are charged back to the Fund, subject to certain limitations approved by the Trust’s Board of Trustees. For the year ended April 30, 2019, expenses incurred under the agreement are shown in the Statement of Operations asTransfer agent fees.
Shares of the Fund are distributed by Invesco Distributors, Inc. (“IDI”). The Fund has adopted a distribution plan pursuant to Rule 12b-1 under the 1940 Act, and a service plan (collectively, the “Plans”) for Class A, Class C and Class R shares to compensate IDI for the sale, distribution, shareholder servicing and maintenance of shareholder accounts for these shares. Under the Plans, the Fund will incur annual fees of up to 0.25% of Class A average daily net assets, up to 1.00% of Class C average daily net assets and up to 0.50% of Class R average daily net assets. The fees are accrued daily and paid monthly.
With respect to Class C shares, the Fund is authorized to reimburse in future years any distribution related expenses that exceed the maximum annual reimbursement rate for such class, so long as such reimbursement does not cause the Fund to exceed the Class C maximum annual reimbursement rate, respectively. With respect to Class A shares, distribution related expenses that exceed the maximum annual reimbursement rate for such class are not carried forward to future years and the Fund will not reimburse IDI for any such expenses.
For the year ended April 30, 2019, expenses incurred under these agreements are shown in the Statement of Operations asDistribution fees.
Front-end sales commissions and CDSC (collectively, the “sales charges”) are not recorded as expenses of the Fund. Front-end sales commissions are deducted from proceeds from the sales of Fund shares prior to investment in Class A shares of the Fund. CDSC are deducted from redemption proceeds prior to remittance to the shareholder. During the year ended April 30, 2019, IDI advised the Fund that IDI retained $336,051 in front-end sales commissions from the sale of Class A shares and $7,297 and $3,947 from Class A and Class C shares, respectively, for CDSC imposed upon redemptions by shareholders.
For the year ended April 30, 2019, the Fund incurred $19,753 in brokerage commissions with Invesco Capital Markets, Inc., an affiliate of the Adviser and IDI, for portfolio transactions executed on behalf of the Fund.
Certain officers and trustees of the Trust are officers and directors of the Adviser, IIS and/or IDI.
NOTE 3—Additional Valuation Information
GAAP defines fair value as the price that would be received to sell an asset or paid to transfer a liability in an orderly transaction between market participants at the measurement date, under current market conditions. GAAP establishes a hierarchy that prioritizes the inputs to valuation methods, giving the highest priority to readily available unadjusted quoted prices in an active market for identical assets (Level 1) and the lowest priority to significant unobservable inputs (Level 3), generally when market prices are not readily available or are unreliable. Based on the valuation inputs, the securities or other investments are tiered into one of three levels. Changes in valuation methods may result in transfers in or out of an investment’s assigned level:
Level 1 – Prices are determined using quoted prices in an active market for identical assets.
Level 2 – Prices are determined using other significant observable inputs. Observable inputs are inputs that other market participants may use in pricing a security. These may include quoted prices for similar securities, interest rates, prepayment speeds, credit risk, yield curves, loss severities, default rates, discount rates, volatilities and others.
Level 3 – Prices are determined using significant unobservable inputs. In situations where quoted prices or observable inputs are unavailable (for example, when there is little or no market activity for an investment at the end of the period), unobservable inputs may be used. Unobservable inputs reflect the Fund’s own assumptions about the factors market participants would use in determining fair value of the securities or instruments and would be based on the best available information.
The following is a summary of the tiered valuation input levels, as of April 30, 2019. The level assigned to the securities valuations may not be an indication of the risk or liquidity associated with investing in those securities. Because of the inherent uncertainties of valuation, the values reflected in the financial statements may materially differ from the value received upon actual sale of those investments.
| | Level 1 | Level 2 | Level 3 | Total |
| Investments in Securities | | | | |
| Common Stocks & Other Equity Interests | $2,837,896,227 | $62,587,605 | $— | $2,900,483,832 |
| Money Market Funds | 67,242,842 | — | — | 67,242,842 |
| Total Investments | $2,905,139,069 | $62,587,605 | $— | $2,967,726,674 |
NOTE 4—Security Transactions with Affiliated Funds
The Fund is permitted to purchase or sell securities from or to certain other Invesco Funds under specified conditions outlined in procedures adopted by the Board of Trustees of the Trust. The procedures have been designed to ensure that any purchase or sale of securities by the Fund from or to another fund or portfolio that is or could be considered an affiliate by virtue of having a common investment adviser (or affiliated investment
| 20 | Invesco Mid Cap Growth Fund |
advisers), common Trustees and/or common officers complies with Rule 17a-7 of the 1940 Act. Further, as defined under the procedures, each transaction is effected at the current market price. Pursuant to these procedures, for the year ended April 30, 2019, the Fund engaged in securities purchases of $0 and securities sales of $2,752,476, which resulted in net realized gains of $113,802.
NOTE 5—Expense Offset Arrangement(s)
The expense offset arrangement is comprised of transfer agency credits which result from balances in demand deposit accounts used by the transfer agent for clearing shareholder transactions. For the year ended April 30, 2019, the Fund received credits from this arrangement, which resulted in the reduction of the Fund’s total expenses of $40,999.
NOTE 6—Trustees’ and Officers’ Fees and Benefits
Trustees’ and Officers’ Fees and Benefits include amounts accrued by the Fund to pay remuneration to certain Trustees and Officers of the Fund. Trustees have the option to defer compensation payable by the Fund, and Trustees’ and Officers’ Fees and Benefits also include amounts accrued by the Fund to fund such deferred compensation amounts. Those Trustees who defer compensation have the option to select various Invesco Funds in which their deferral accounts shall be deemed to be invested. Finally, certain current Trustees were eligible to participate in a retirement plan that provided for benefits to be paid upon retirement to Trustees over a period of time based on the number of years of service. The Fund may have certain former Trustees who also participate in a retirement plan and receive benefits under such plan.Trustees’ and Officers’ Fees and Benefits include amounts accrued by the Fund to fund such retirement benefits. Obligations under the deferred compensation and retirement plans represent unsecured claims against the general assets of the Fund.
NOTE 7—Cash Balances
The Fund is permitted to temporarily carry a negative or overdrawn balance in its account with SSB, the custodian bank. Such balances, if any at period-end, are shown in the Statement of Assets and Liabilities under the payable captionAmount due custodian. To compensate the custodian bank for such overdrafts, the overdrawn Fund may either (1) leave funds as a compensating balance in the account so the custodian bank can be compensated by earning the additional interest; or (2) compensate by paying the custodian bank at a rate agreed upon by the custodian bank and Invesco, not to exceed the contractually agreed upon rate.
NOTE 8—Distributions to Shareholders and Tax Components of Net Assets
| Tax Character of Distributions to Shareholders Paid During the Fiscal Years Ended April 30, 2019 and 2018 |
| | 2019 | 2018 |
| Long-term capital gain | $312,605,738 | $229,606,321 |
| Tax Components of Net Assets at Period-End: |
| | 2019 |
| Undistributed long-term capital gain | $80,936,996 |
| Net unrealized appreciation — investments | 722,962,720 |
| Net unrealized appreciation (depreciation) - foreign currencies | (3,007) |
| Temporary book/tax differences | (581,865) |
| Late-Year ordinary loss deferral | (5,075,012) |
| Shares of beneficial interest | 2,160,522,470 |
| Total net assets | $2,958,762,302 |
The difference between book-basis and tax-basis unrealized appreciation (depreciation) is due to differences in the timing of recognition of gains and losses on investments for tax and book purposes. The Fund’s net unrealized appreciation difference is attributable primarily to wash sales.
The temporary book/tax differences are a result of timing differences between book and tax recognition of income and/or expenses. The Fund’s temporary book/tax differences are the result of the trustee deferral of compensation and retirement plan benefits.
Capital loss carryforward is calculated and reported as of a specific date. Results of transactions and other activity after that date may affect the amount of capital loss carryforward actually available for the Fund to utilize. Capital losses generated in years beginning after December 22, 2010 can be carried forward for an unlimited period, whereas previous losses expire in eight tax years. Capital losses with an expiration period may not be used to offset capital gains until all net capital losses without an expiration date have been utilized. Capital loss carryforwards with no expiration date will retain their character as either short-term or long-term capital losses instead of as short-term capital losses as under prior law. The ability to utilize capital loss carryforwards in the future may be limited under the Internal Revenue Code and related regulations based on the results of future transactions.
The Fund does not have a capital loss carryforward as of April 30, 2019.
NOTE 9—Investment Transactions
The aggregate amount of investment securities (other than short-term securities, U.S. Treasury obligations and money market funds, if any) purchased and sold by the Fund during the year ended April 30, 2019 was $1,504,431,576 and $1,721,054,287, respectively. Cost of
| 21 | Invesco Mid Cap Growth Fund |
investments, including any derivatives, on a tax basis includes the adjustments for financial reporting purposes as of the most recently completed federal income tax reporting period-end.
| Unrealized Appreciation (Depreciation) of Investments on a Tax Basis |
| Aggregate unrealized appreciation of investments | $763,501,916 |
| Aggregate unrealized (depreciation) of investments | (40,539,196) |
| Net unrealized appreciation of investments | $722,962,720 |
Cost of investments for tax purposes is $2,244,763,954.
NOTE 10—Reclassification of Permanent Differences
Primarily as a result of differing book/tax treatment of net operating losses, on April 30, 2019, undistributed net investment income (loss) was increased by $14,892,074, undistributed net realized gain (loss) was increased by $7,696 and shares of beneficial interest was decreased by $14,899,770. This reclassification had no effect on the net assets of the Fund.
NOTE 11—Share Information
| | Summary of Share Activity |
| | Years ended April 30, |
| | 2019(a) | | 2018 |
| | Shares | Amount | | Shares | Amount |
| Sold: | | | | | |
| Class A | 5,293,960 | $202,811,605 | | 3,899,411 | $151,352,310 |
| Class B(b) | — | — | | 4,220 | 135,650 |
| Class C | 549,888 | 15,462,432 | | 349,725 | 10,325,834 |
| Class R | 140,001 | 5,253,940 | | 138,324 | 5,218,379 |
| Class Y | 1,110,051 | 45,092,144 | | 1,151,161 | 46,472,987 |
| Class R5 | 583,744 | 23,421,457 | | 393,133 | 16,091,654 |
| Class R6 | 462,424 | 19,096,267 | | 930,463 | 37,712,818 |
| Issued as reinvestment of dividends: | | | | | |
| Class A | 7,549,869 | 242,879,270 | | 4,806,247 | 179,321,059 |
| Class B(b) | — | — | | 46,109 | 1,414,158 |
| Class C | 780,942 | 17,813,390 | | 483,978 | 13,532,038 |
| Class R | 100,990 | 3,127,656 | | 66,284 | 2,398,814 |
| Class Y | 372,715 | 12,631,297 | | 217,920 | 8,492,346 |
| Class R5 | 332,018 | 11,394,869 | | 206,243 | 8,121,852 |
| Class R6 | 283,765 | 9,798,392 | | 163,188 | 6,454,078 |
| Conversion of Class B shares to Class A shares:(c) | | | | | |
| Class A | — | — | | 429,037 | 17,384,572 |
| Class B | — | — | | (524,767) | (17,384,572) |
| Automatic conversion of Class C shares to Class A shares: | | | | | |
| Class A | 1,966,180 | 67,063,265 | | - | - |
| Class C | (2,775,239) | (67,063,265) | | - | - |
| 22 | Invesco Mid Cap Growth Fund |
| | Summary of Share Activity |
| | Years ended April 30, |
| | 2019(a) | | 2018 |
| | Shares | Amount | | Shares | Amount |
| Reacquired: | | | | | |
| Class A | (9,109,199) | $(345,464,844) | | (9,150,784) | $(355,598,093) |
| Class B(b) | — | — | | (305,001) | (9,883,842) |
| Class C | (1,073,590) | (29,533,643) | | (1,176,787) | (34,787,988) |
| Class R | (245,158) | (9,020,665) | | (229,065) | (8,605,440) |
| Class Y | (1,123,010) | (43,733,395) | | (1,514,023) | (60,784,034) |
| Class R5 | (683,592) | (27,633,139) | | (675,432) | (27,440,853) |
| Class R6 | (456,886) | (18,399,104) | | (330,531) | (13,676,055) |
| Net increase (decrease) in share activity | 4,059,873 | $134,997,929 | | (620,947) | $(23,732,328) |
| (a) | There are entities that are record owners of more than 5% of the outstanding shares of the Fund and in the aggregate own 31% of the outstanding shares of the Fund. IDI has an agreement with these entities to sell Fund shares. The Fund, Invesco and/or Invesco affiliates may make payments to these entities, which are considered to be related to the Fund, for providing services to the Fund, Invesco and/or Invesco affiliates including but not limited to services such as securities brokerage, distribution, third party record keeping and account servicing. The Fund has no knowledge as to whether all or any portion of the shares owned of record by these entities are also owned beneficially. |
| (b) | Class B shares activity for the period May 1, 2017 through January 26, 2018 (date of conversion). |
| (c) | Effective as of the close of business on January 26, 2018, all outstanding Class B shares were converted to Class A shares. |
| 23 | Invesco Mid Cap Growth Fund |
Report of Independent Registered Public Accounting Firm
To the Board of Trustees of AIM Sector Funds (Invesco Sector Funds) and Shareholders of Invesco Mid Cap Growth Fund:
Opinion on the Financial Statements
We have audited the accompanying statement of assets and liabilities, including the schedule of investments, of Invesco Mid Cap Growth Fund (one of the funds constituting AIM Sector Funds (Invesco Sector Funds), hereafter referred to as the “Fund”) as of April 30, 2019, the related statement of operations for the year ended April 30, 2019, the statement of changes in net assets for each of the two years in the period ended April 30, 2019, including the related notes, and the financial highlights for each of the five years in the period ended April 30, 2019 (collectively referred to as the “financial statements”). In our opinion, the financial statements present fairly, in all material respects, the financial position of the Fund as of April 30, 2019, the results of its operations for the year then ended, the changes in its net assets for each of the two years in the period ended April 30, 2019 and the financial highlights for each of the five years in the period ended April 30, 2019 in conformity with accounting principles generally accepted in the United States of America.
Basis for Opinion
These financial statements are the responsibility of the Fund’s management. Our responsibility is to express an opinion on the Fund’s financial statements based on our audits. We are a public accounting firm registered with the Public Company Accounting Oversight Board (United States) (“PCAOB”) and are required to be independent with respect to the Fund in accordance with the U.S. federal securities laws and the applicable rules and regulations of the Securities and Exchange Commission and the PCAOB.
We conducted our audits of these financial statements in accordance with the standards of the PCAOB. Those standards require that we plan and perform the audit to obtain reasonable assurance about whether the financial statements are free of material misstatement, whether due to error or fraud.
Our audits included performing procedures to assess the risks of material misstatement of the financial statements, whether due to error or fraud, and performing procedures that respond to those risks. Such procedures included examining, on a test basis, evidence regarding the amounts and disclosures in the financial statements. Our audits also included evaluating the accounting principles used and significant estimates made by management, as well as evaluating the overall presentation of the financial statements. Our procedures included confirmation of securities owned as of April 30, 2019 by correspondence with the custodian, transfer agent and brokers; when replies were not received from brokers, we performed other auditing procedures. We believe that our audits provide a reasonable basis for our opinion.
PricewaterhouseCoopers LLP
Houston, TX
June 26, 2019
We have served as the auditor of one or more of the investment companies in the Invesco group of investment companies since at least 1995. We have not been able to determine the specific year we began serving as auditor.
| 24 | Invesco Mid Cap Growth Fund |
Calculating your ongoing Fund expenses
Example
As a shareholder of the Fund, you incur two types of costs: (1) transaction costs, which may include sales charges (loads) on purchase payments or contingent deferred sales charges on redemptions, if any; and (2) ongoing costs, including management fees, distribution and/or service (12b-1) fees, and other Fund expenses. This example is intended to help you understand your ongoing costs (in dollars) of investing in the Fund and to compare these costs with ongoing costs of investing in other mutual funds. The example is based on an investment of $1,000 invested at the beginning of the period and held for the entire period November 1, 2018 through April 30, 2019.
Actual expenses
The table below provides information about actual account values and actual expenses. You may use the information in this table, together with the amount you invested, to estimate the expenses that you paid over the period. Simply divide your account value by $1,000 (for example, an $8,600 account value divided by $1,000 = 8.6), then multiply the result by the number in the table under the heading entitled “Actual Expenses Paid During Period” to estimate the expenses you paid on your account during this period.
Hypothetical example for comparison purposes
The table below also provides information about hypothetical account values and hypothetical expenses based on the Fund’s actual expense ratio and an assumed rate of return of 5% per year before expenses, which is not the Fund’s actual return.
The hypothetical account values and expenses may not be used to estimate the actual ending account balance or expenses you paid for the period. You may use this information to compare the ongoing costs of investing in the Fund and other funds. To do so, compare this 5% hypothetical example with the 5% hypothetical examples that appear in the shareholder reports of the other funds.
Please note that the expenses shown in the table are meant to highlight your ongoing costs only and do not reflect any transaction costs, such as sales charges (loads) on purchase payments or contingent deferred sales charges on redemptions, if any. Therefore, the hypothetical information is useful in comparing ongoing costs only, and will not help you determine the relative total costs of owning different funds. In addition, expenses shown in the table do not include the expenses of the underlying funds, which are borne indirectly by the Fund. If transaction costs and indirect expenses were included, your costs would have been higher.
| | Beginning
Account Value (11/01/18) | ACTUAL | HYPOTHETICAL
(5% annual return before
expenses) | Annualized
Expense
Ratio |
Ending
Account Value
(04/30/19)1 | Expenses
Paid During
Period2 | Ending
Account Value
(04/30/19) | Expenses
Paid During
Period2 |
| Class A | $1,000.00 | $1,111.40 | $6.13 | $1,018.99 | $5.86 | 1.17% |
| Class C | 1,000.00 | 1,107.30 | 9.88 | 1,015.42 | 9.44 | 1.89 |
| Class R | 1,000.00 | 1,109.80 | 7.43 | 1,017.75 | 7.10 | 1.42 |
| Class Y | 1,000.00 | 1,112.70 | 4.82 | 1,020.23 | 4.61 | 0.92 |
| Class R5 | 1,000.00 | 1,113.20 | 4.30 | 1,020.73 | 4.11 | 0.82 |
| Class R6 | 1,000.00 | 1,113.80 | 3.83 | 1,021.17 | 3.66 | 0.73 |
| 1 | The actual ending account value is based on the actual total return of the Fund for the period November 1, 2018 through April 30, 2019, after actual expenses and will differ from the hypothetical ending account value which is based on the Fund’s expense ratio and a hypothetical annual return of 5% before expenses. |
| 2 | Expenses are equal to the Fund’s annualized expense ratio as indicated above multiplied by the average account value over the period, multiplied by 181/365 to reflect the most recent fiscal half year. |
| 25 | Invesco Mid Cap Growth Fund |
Tax Information
Form 1099-DIV, Form 1042-S and other year–end tax information provide shareholders with actual calendar year amounts that should be included in their tax returns. Shareholders should consult their tax advisers.
The following distribution information is being provided as required by the Internal Revenue Code or to meet a specific state’s requirement.
The Fund designates the following amounts or, if subsequently determined to be different, the maximum amount allowable for its fiscal year ended April 30, 2019:
| Federal and State Income Tax | |
| Long-Term Capital Gain Distributions | $312,605,738 |
| Qualified Dividend Income* | 0% |
| Corporate Dividends Received Deduction* | 0% |
| U.S. Treasury Obligations* | 0% |
| * | The above percentages are based on ordinary income dividends paid to shareholders during the Fund’s fiscal year. |
| 26 | Invesco Mid Cap Growth Fund |
Trustees and Officers
The address of each trustee and officer is AIM Sector Funds (Invesco Sector Funds) (the “Trust”), 11 Greenway Plaza, Suite 1000, Houston, Texas 77046-1173. The trustees serve for the life of the Trust, subject to their earlier death, incapacitation, resignation, retirement or removal as more specifically provided in the Trust’s organizational documents. Each officer serves for a one year term or until their successors are elected and qualified. Column two below includes length of time served with predecessor entities, if any.
| | | | | | | | |
Name, Year of Birth and
Position(s) Held with the Trust | | Trustee and/
or Officer Since | | Principal Occupation(s)
During Past 5 Years | | Number of Funds in Fund
Complex
Overseen by
Trustee | | Other Directorship(s)
Held by Trustee During
Past 5 Years |
| Interested Persons | | | | | | | | |
Martin L. Flanagan1 — 1960 Trustee and Vice Chair | | 2007 | | Executive Director, Chief Executive Officer and President, Invesco Ltd. (ultimate parent of Invesco and a global investment management firm); Trustee and Vice Chair, The Invesco Funds; Vice Chair, Investment Company Institute; and Member of Executive Board, SMU Cox School of Business Formerly: Advisor to the Board, Invesco Advisers, Inc. (formerly known as Invesco Institutional (N.A.), Inc.); Chairman and Chief Executive Officer, Invesco Advisers, Inc. (registered investment adviser); Director, Chairman, Chief Executive Officer and President, Invesco Holding Company (US), Inc. (formerly IVZ Inc.) (holding company), Invesco Group Services, Inc. (service provider) and Invesco North American Holdings, Inc. (holding company); Director, Chief Executive Officer and President, Invesco Holding Company Limited (parent of Invesco and a global investment management firm); Director, Invesco Ltd.; Chairman, Investment Company Institute and President,Co-Chief Executive Officer,Co-President, Chief Operating Officer and Chief Financial Officer, Franklin Resources, Inc. (global investment management organization) | | 241 | | None |
Philip A. Taylor2 — 1954 Trustee | | 2006 | | Vice Chair, Invesco Ltd.; Director, Invesco Canada Ltd. (formerly known as Invesco Trimark Ltd./Invesco Trimark Ltèe) (registered investment adviser and registered transfer agent); Trustee, The Invesco Funds Formerly: Head of the Americas and Senior Managing Director, Invesco Ltd.; Director, Invesco Advisers, Inc. (formerly known as Invesco Institutional (N.A.), Inc.) (registered investment adviser); Director and Chairman, Invesco Investment Services, Inc. (formerly known as Invesco AIM Investment Services, Inc.) (registered transfer agent); Chief Executive Officer, Invesco Corporate Class Inc. (corporate mutual fund company); Chairman and Chief Executive Officer, Invesco Canada Ltd. (formerly known as Invesco Trimark Ltd./Invesco Trimark Ltèe) (registered investment adviser and registered transfer agent); Senior Vice President, The Invesco Funds; Director, Invesco Investment Advisers LLC (formerly known as Van Kampen Asset Management); Director, Chairman, Chief Executive Officer and President, Invesco Management Group, Inc. (formerly known as Invesco AIM Management Group, Inc.) (financial services holding company);Co-Chairman,Co-President andCo-Chief Executive Officer, Invesco Advisers, Inc. (formerly known as Invesco Institutional (N.A.), Inc.) (registered investment adviser); Director, Chief Executive Officer and President, Van Kampen Exchange Corp; President and Principal Executive Officer, The Invesco Funds (other than AIM Treasurer’s Series Trust (Invesco Treasurer’s Series Trust), Short-Term Investments Trust and Invesco Management Trust); Executive Vice President, The Invesco Funds (AIM Treasurer’s Series Trust (Invesco Treasurer’s Series Trust), Short-Term Investments Trust and Invesco Management Trust only); Director and President, INVESCO Funds Group, Inc. (registered investment adviser and registered transfer agent); Director and Chairman, IVZ Distributors, Inc. (formerly known as INVESCO Distributors, Inc.) (registered broker dealer); Director, President and Chairman, Invesco Inc. (holding company), Invesco Canada Holdings Inc. (holding company), Trimark Investments Ltd./Placements Trimark Ltèe and Invesco Financial Services Ltd/Services Financiers Invesco Ltèe; Chief Executive Officer, Invesco Canada Fund Inc. (corporate mutual fund company); Director and Chairman, Van Kampen Investor Services Inc.; Director, Chief Executive Officer and President, 1371 Preferred Inc. (holding company) and Van Kampen Investments Inc.; Director and President, AIM GP Canada Inc. (general partner for limited partnerships) and Van Kampen Advisors, Inc.; Director and Chief Executive Officer, Invesco Trimark Dealer Inc. (registered broker dealer); Director, Invesco Distributors, Inc. (formerly known as Invesco AIM Distributors, Inc.) (registered broker dealer); Manager, Invesco Capital Management LLC; Director, Chief Executive Officer and President, Invesco Advisers, Inc.; Director, Chairman, Chief Executive Officer and President, Invesco AIM Capital Management, Inc.; President, Invesco Trimark Dealer Inc. and Invesco Trimark Ltd./Invesco Trimark Ltèe; Director and President, AIM Trimark Corporate Class Inc. and AIM Trimark Canada Fund Inc.; Senior Managing Director, Invesco Holding Company Limited; Director and Chairman, Fund Management Company (former registered broker dealer); President and Principal Executive Officer, The Invesco Funds (AIM Treasurer’s Series Trust (Invesco Treasurer’s Series Trust), and Short-Term Investments Trust only); President, AIM Trimark Global Fund Inc. and AIM Trimark Canada Fund Inc. | | 241 | | None |
| 1 | Mr. Flanagan is considered an interested person (within the meaning of Section 2(a)(19) of the 1940 Act) of the Trust because he is an officer of the Adviser to the Trust, and an officer and a director of Invesco Ltd., ultimate parent of the Adviser. |
| 2 | Mr. Taylor is considered an interested person (within the meaning of Section 2(a)(19) of the 1940 Act) of the Trust because he is an officer of Invesco Ltd., ultimate parent of the Adviser. |
T-1 Invesco Mid Cap Growth Fund
Trustees and Officers—(continued)
| | | | | | | | |
Name, Year of Birth and
Position(s) Held with the Trust | | Trustee and/
or Officer Since | | Principal Occupation(s)
During Past 5 Years | | Number of Funds in Fund
Complex
Overseen by
Trustee | | Other Directorship(s)
Held by Trustee During
Past 5 Years |
| Independent Trustees | | | | | | | | |
Bruce L. Crockett — 1944 Trustee and Chair | | 2003 | | Chairman, Crockett Technologies Associates (technology consulting company) Formerly: Director, Captaris (unified messaging provider); Director, President and Chief Executive Officer, COMSAT Corporation; Chairman, Board of Governors of INTELSAT (international communications company); ACE Limited (insurance company); Independent Directors Council and Investment Company Institute: Member of the Audit Committee, Investment Company Institute; Member of the Executive Committee and Chair of the Governance Committee, Independent Directors Council | | 241 | | Director and Chairman of the Audit Committee, ALPS (Attorneys Liability Protection Society) (insurance company); Director and Member of the Audit Committee and Compensation Committee, Ferroglobe PLC (metallurgical company) |
David C. Arch — 1945 Trustee | | 2010 | | Chairman of Blistex Inc. (consumer health care products manufacturer); Member, World Presidents’ Organization | | 241 | | Board member of the Illinois Manufacturers’ Association |
Beth Ann Brown3 — 1968 Trustee | | 2019 | | Independent Consultant Formerly: Head of Intermediary Distribution, Managing Director, Strategic Relations, Managing Director, Head of National Accounts, Senior Vice President, National Account Manager and Senior Vice President, Key Account Manager, Columbia Management Investment Advisers LLC; Vice President, Key Account Manager, Liberty Funds Distributor, Inc.; and Trustee of certain Oppenheimer Funds | | 225 | | Director, Board of Directors of Caron Engineering Inc.; Advisor, Board of Advisors of Caron Engineering Inc.; President and Director, Acton Shapleigh Youth Conservation Corps (non -profit); and Vice President and Director of Grahamtastic Connection(non-profit) |
Jack M. Fields — 1952 Trustee | | 2003 | | Chief Executive Officer, Twenty First Century Group, Inc. (government affairs company); and Chairman, Discovery Learning Alliance(non-profit) Formerly: Owner and Chief Executive Officer, Dos Angeles Ranch L.P. (cattle, hunting, corporate entertainment); Director, Insperity, Inc. (formerly known as Administaff) (human resources provider); Chief Executive Officer, Texana Timber LP (sustainable forestry company); Director of Cross Timbers Quail Research Ranch(non-profit); and member of the U.S. House of Representatives | | 241 | | None |
Cynthia Hostetler — 1962 Trustee | | 2017 | | Non-Executive Director and Trustee of a number of public and private business corporations Formerly: Director, Aberdeen Investment Funds (4 portfolios); Head of Investment Funds and Private Equity, Overseas Private Investment Corporation; President, First Manhattan Bancorporation, Inc.; Attorney, Simpson Thacher & Bartlett LLP | | 241 | | Vulcan Materials Company (construction materials company); Trilinc Global Impact Fund; Genesee & Wyoming, Inc. (railroads); Artio Global Investment LLC (mutual fund complex); Edgen Group, Inc. (specialized energy and infrastructure products distributor); Investment Company Institute (professional organization); Independent Directors Council (professional organization) |
Eli Jones — 1961 Trustee | | 2016 | | Professor and Dean, Mays Business School — Texas A&M University Formerly: Professor and Dean, Walton College of Business, University of Arkansas and E.J. Ourso College of Business, Louisiana State University; Director, Arvest Bank | | 241 | | Insperity, Inc. (formerly known as Administaff) (human resources provider) |
Elizabeth Krentzman3 — 1959 Trustee | | 2019 | | Formerly: Principal and Chief Regulatory Advisor for Asset Management Services and U.S. Mutual Fund Leader of Deloitte & Touche LLP; General Counsel of the Investment Company Institute (trade association); National Director of the Investment Management Regulatory Consulting Practice, Principal, Director and Senior Manager of Deloitte & Touche LLP; Assistant Director of the Division of Investment Management — Office of Disclosure and Investment Adviser Regulation of the U.S. Securities and Exchange Commission and various positions with the Division of Investment Management — Office of Regulatory Policy of the U.S. Securities and Exchange Commission; Associate at Ropes & Gray LLP; Advisory Board Member of the Securities and Exchange Commission Historical Society; and Trustee of certain Oppenheimer Funds | | 225 | | Trustee of the University of Florida National Board Foundation and Audit Committee Member; Member of the Cartica Funds Board of Directors (private investment funds); Member of the University of Florida Law Center Association, Inc. Board of Trustees and Audit Committee Member |
Anthony J. LaCava, Jr. — 1956 Trustee | | 2019 | | Formerly: Director and Member of the Audit Committee, Blue Hills Bank (publicly traded financial institution) and Managing Partner, KPMG LLP | | 241 | | Blue Hills Bank; Chairman, Bentley University; Member, Business School Advisory Council; and Nominating Committee, KPMG LLP |
Prema Mathai-Davis — 1950 Trustee | | 2003 | | Retired Co-Owner & Partner of Quantalytics Research, LLC, (a FinTech Investment Research Platform for the Self-Directed Investor) | | 241 | | None |
| 3 | Mss. Brown and Krentzman and Messrs. Motley, Vandivort and Vaughn were appointed as Trustees of the Trust effective June 10, 2019. |
T-2 Invesco Mid Cap Growth Fund
Trustees and Officers—(continued)
| | | | | | | | |
Name, Year of Birth and
Position(s) Held with the Trust | | Trustee and/
or Officer Since | | Principal Occupation(s)
During Past 5 Years | | Number of Funds in Fund
Complex
Overseen by
Trustee | | Other Directorship(s)
Held by Trustee During
Past 5 Years |
| Independent Trustees—(continued) |
Joel W. Motley3 — 1952 Trustee | | 2019 | | Director of Office of Finance, Federal Home Loan Bank; Member of the Vestry of Trinity Wall Street; Managing Director of Carmona Motley Inc. (privately held financial advisor); Member of the Finance and Budget Committee of the Council on Foreign Relations, Member of the Investment Committee and Board of Human Rights Watch and Member of the Investment Committee and Board of Historic Hudson Valley(non-profit cultural organization) Formerly: Managing Director of Public Capital Advisors, LLC (privately held financial advisor); Managing Director of Carmona Motley Hoffman, Inc. (privately held financial advisor); Trustee of certain Oppenheimer Funds; and Director of Columbia Equity Financial Corp. (privately held financial advisor) | | 225 | | Director of Greenwall Foundation (bioethics research foundation); Member of Board and Investment Committee of The Greenwall Foundation; Director of Southern Africa Legal Services Foundation; Board Member and Investment Committee Member of Pulitzer Center for Crisis Reporting(non-profit journalism) |
Teresa M. Ressel — 1962 Trustee | | 2017 | | Non-executive director and trustee of a number of public and private business corporations Formerly: Chief Financial Officer, Olayan America, The Olayan Group (international investor/commercial/industrial); Chief Executive Officer, UBS Securities LLC; Group Chief Operating Officer, Americas, UBS AG; Assistant Secretary for Management & Budget and CFO, US Department of the Treasury | | 241 | | Atlantic Power Corporation (power generation company); ON Semiconductor Corp. (semiconductor supplier) |
Ann Barnett Stern — 1957 Trustee | | 2017 | | President and Chief Executive Officer, Houston Endowment Inc. (private philanthropic institution) Formerly: Executive Vice President and General Counsel, Texas Children’s Hospital; Attorney, Beck, Redden and Secrest, LLP; Business Law Instructor, University of St. Thomas; Attorney, Andrews & Kurth LLP | | 241 | | Federal Reserve Bank of Dallas |
Raymond Stickel, Jr. — 1944 Trustee | | 2005 | | Retired Formerly: Director, Mainstay VP Series Funds, Inc. (25 portfolios); Partner, Deloitte & Touche | | 241 | | None |
Robert C. Troccoli — 1949 Trustee | | 2016 | | Adjunct Professor, University of Denver — Daniels College of Business Formerly: Senior Partner, KPMG LLP | | 241 | | None |
Daniel S. Vandivort3 — 1954 Trustee | | 2019 | | Treasurer, Chairman of the Audit and Finance Committee, and Trustee, Board of Trustees, Huntington Disease Foundation of America; and President, Flyway Advisory Services LLC (consulting and property management) Formerly: Trustee and Governance Chair, of certain Oppenheimer Funds | | 225 | | Chairman and Lead Independent Director, Chairman of the Audit Committee, and Director, Board of Directors, Value Line Funds |
James D. Vaughn3 — 1945 Trustee | | 2019 | | Retired Formerly: Managing Partner, Deloitte & Touche LLP; Trustee and Chairman of the Audit Committee, Schroder Funds; Board Member, Mile High United Way, Boys and Girls Clubs, Boy Scouts, Colorado Business Committee for the Arts, Economic Club of Colorado and Metro Denver Network (economic development corporation); and Trustee of certain Oppenheimer Funds | | 225 | | Board member and Chairman of Audit Committee of AMG National Trust Bank; Trustee and Investment Committee member, University of South Dakota Foundation; Board member, Audit Committee Member and past Board Chair, Junior Achievement(non-profit) |
Christopher L. Wilson — 1957 Trustee and Vice Chair | | 2017 | | Non-executive director and trustee of a number of public and private business corporations Formerly: Director, TD Asset Management USA Inc. (mutual fund complex) (22 portfolios); Managing Partner, CT2, LLC (investing and consulting firm); President/Chief Executive Officer, Columbia Funds, Bank of America Corporation; President/Chief Executive Officer, CDC IXIS Asset Management Services, Inc.; Principal & Director of Operations, Scudder Funds, Scudder, Stevens & Clark, Inc.; Assistant Vice President, Fidelity Investments | | 241 | | ISO New England, Inc.(non-profit organization managing regional electricity market) |
| Other Officers | | | | | | | | |
Sheri Morris — 1964 President, Principal Executive Officer and Treasurer | | 2003 | | President, Principal Executive Officer and Treasurer, The Invesco Funds; Vice President, Invesco Advisers, Inc. (formerly known as Invesco Institutional (N.A.), Inc.) (registered investment adviser); and Vice President, Invesco Exchange-Traded Fund Trust, Invesco Exchange-Traded Fund Trust II, Invesco India Exchange-Traded Fund Trust, Invesco Actively Managed Exchange-Traded Fund Trust, Invesco Actively Managed Exchange-Traded Commodity Fund Trust and Invesco Exchange-Traded Self-Indexed Fund Trust Formerly: Vice President and Principal Financial Officer, The Invesco Funds; Vice President, Invesco AIM Advisers, Inc., Invesco AIM Capital Management, Inc. and Invesco AIM Private Asset Management, Inc.; Assistant Vice President and Assistant Treasurer, The Invesco Funds and Assistant Vice President, Invesco Advisers, Inc., Invesco AIM Capital Management, Inc. and Invesco AIM Private Asset Management, Inc.; and Treasurer, Invesco Exchange-Traded Fund Trust, Invesco Exchange-Traded Fund Trust II, Invesco India Exchange-Traded Fund Trust and Invesco Actively Managed Exchange-Traded Fund Trust | | N/A | | N/A |
Russell C. Burk — 1958 Senior Vice President and Senior Officer | | 2005 | | Senior Vice President and Senior Officer, The Invesco Funds | | N/A | | N/A |
| 3 | Mss. Brown and Krentzman and Messrs. Motley, Vandivort and Vaughn were appointed as Trustees of the Trust effective June 10, 2019. |
T-3 Invesco Mid Cap Growth Fund
Trustees and Officers—(continued)
| | | | | | | | |
Name, Year of Birth and
Position(s) Held with the Trust | | Trustee and/
or Officer Since | | Principal Occupation(s)
During Past 5 Years | | Number of Funds in Fund
Complex
Overseen by
Trustee | | Other Directorship(s)
Held by Trustee During
Past 5 Years |
| Other Officers—(continued) | | | | | | | | |
Jeffrey H. Kupor — 1968 Senior Vice President, Chief Legal Officer and Secretary | | 2018 | | Head of Legal of the Americas, Invesco Ltd.; Senior Vice President and Secretary, Invesco Advisers, Inc. (formerly known as Invesco Institutional (N.A.), Inc.) (registered investment adviser); Senior Vice President and Secretary, Invesco Distributors, Inc. (formerly known as Invesco AIM Distributors, Inc.); Vice President and Secretary, Invesco Investment Services, Inc. (formerly known as Invesco AIM Investment Services, Inc.) Senior Vice President, Chief Legal Officer and Secretary, The Invesco Funds; Secretary and General Counsel, Invesco Investment Advisers LLC (formerly known as Van Kampen Asset Management); Secretary and General Counsel, Invesco Capital Markets, Inc. (formerly known as Van Kampen Funds Inc.) and Chief Legal Officer, Invesco Exchange-Traded Fund Trust, Invesco Exchange-Traded Fund Trust II, Invesco India Exchange-Traded Fund Trust, Invesco Actively Managed Exchange-Traded Fund Trust, Invesco Actively Managed Exchange-Traded Commodity Fund Trust and Invesco Exchange-Traded Self-Indexed Fund Trust; Secretary, Invesco Indexing LLC; Secretary, W.L. Ross & Co., LLC; Secretary and Vice President, Jemstep, Inc. Formerly: Head of Legal, Worldwide Institutional, Invesco Ltd.; Secretary and General Counsel, INVESCO Private Capital Investments, Inc.; Senior Vice President, Secretary and General Counsel, Invesco Management Group, Inc. (formerly known as Invesco AIM Management Group, Inc.); Assistant Secretary, INVESCO Asset Management (Bermuda) Ltd.; Secretary and General Counsel, Invesco Private Capital, Inc.; Assistant Secretary and General Counsel, INVESCO Realty, Inc.; Secretary and General Counsel, Invesco Senior Secured Management, Inc.; and Secretary, Sovereign G./P. Holdings Inc. | | N/A | | N/A |
Andrew R. Schlossberg — 1974 Senior Vice President | | 2019 | | Head of the Americas and Senior Managing Director, Invesco Ltd.; Director and Senior Vice President, Invesco Advisers, Inc. (formerly known as Invesco Institutional (N.A.), Inc.) (registered investment adviser); Director and Chairman, Invesco Investment Services, Inc. (formerly known as Invesco AIM Investment Services, Inc.) (registered transfer agent); Senior Vice President, The Invesco Funds; Director, Invesco Investment Advisers LLC (formerly known as Van Kampen Asset Management) and Invesco UK Limited; Director, President and Chairman, Invesco Insurance Agency, Inc.; Director and Chief Executive, Invesco Asset Management Limited and Invesco Fund Managers Limited Formerly: Assistant Vice President, The Invesco Funds; Senior Vice President, Invesco Advisers, Inc. (formerly known as Invesco Institutional (N.A.), Inc.) (registered investment adviser); Director and Chief Executive, Invesco Administration Services Limited and Invesco Global Investment Funds Limited; Director, Invesco Distributors, Inc.; Head of EMEA, Invesco Ltd.; President, Invesco Actively Managed Exchange-Traded Commodity Fund Trust, Invesco Actively Managed Exchange-Traded Fund Trust, Invesco Exchange-Traded Fund Trust, Invesco Exchange-Traded Fund Trust II and Invesco India Exchange-Traded Fund Trust; Managing Director and Principal Executive Officer, Invesco Capital Management LLC | | N/A | | N/A |
John M. Zerr — 1962 Senior Vice President | | 2006 | | Chief Operating Officer of the Americas; Senior Vice President, Invesco Advisers, Inc. (formerly known as Invesco Institutional (N.A.), Inc.) (registered investment adviser); Senior Vice President, Invesco Distributors, Inc. (formerly known as Invesco AIM Distributors, Inc.); Director and Vice President, Invesco Investment Services, Inc. (formerly known as Invesco AIM Investment Services, Inc.) Senior Vice President, The Invesco Funds; Managing Director, Invesco Capital Management LLC; Director, Invesco Investment Advisers LLC (formerly known as Van Kampen Asset Management); Senior Vice President, Invesco Capital Markets, Inc. (formerly known as Van Kampen Funds Inc.); Manager, Invesco Indexing LLC; Director and Senior Vice President, Invesco Insurance Agency, Inc.; Invesco Canada Funds Advisory Board Member; Director, President Chief Executive Officer, Invesco Corporate Class Inc. (corporate mutual fund company); and Director, Chairman, President and Chief Executive Officer, Invesco Canada Ltd. (formerly known as Invesco Trimark Ltd./Invesco Trimark Ltèe) (registered investment adviser and registered transfer agent) Formerly: Director and Senior Vice President, Invesco Management Group, Inc. (formerly known as Invesco AIM Management Group, Inc.); Secretary and General Counsel, Invesco Management Group, Inc. (formerly known as Invesco AIM Management Group, Inc.); Secretary, Invesco Investment Services, Inc. (formerly known as Invesco AIM Investment Services, Inc.); Chief Legal Officer and Secretary, The Invesco Funds; Secretary and General Counsel, Invesco Investment Advisers LLC (formerly known as Van Kampen Asset Management); Secretary and General Counsel, Invesco Capital Markets, Inc. (formerly known as Van Kampen Funds Inc.); Chief Legal Officer, Invesco Exchange-Traded Fund Trust, Invesco Exchange-Traded Fund Trust II, Invesco India Exchange-Traded Fund Trust, Invesco Actively Managed Exchange-Traded Fund Trust, Invesco Actively Managed Exchange-Traded Commodity Fund Trust and Invesco Exchange-Traded Self-Indexed Fund Trust; Secretary, Invesco Indexing LLC; Director, Secretary, General Counsel and Senior Vice President, Van Kampen Exchange Corp.; Director, Vice President and Secretary, IVZ Distributors, Inc. (formerly known as INVESCO Distributors, Inc.); Director and Vice President, INVESCO Funds Group, Inc.; Director and Vice President, Van Kampen Advisors Inc.; Director, Vice President, Secretary and General Counsel, Van Kampen Investor Services Inc.; Director and Secretary, Invesco Distributors, Inc. (formerly known as Invesco AIM Distributors, Inc.); Director, Senior Vice President, General Counsel and Secretary, Invesco AIM Advisers, Inc. and Van Kampen Investments Inc.; Director, Vice President and Secretary, Fund Management Company; Director, Senior Vice President, Secretary, General Counsel and Vice President, Invesco AIM Capital Management, Inc.; Chief Operating Officer and General Counsel, Liberty Ridge Capital, Inc. (an investment adviser) | | N/A | | N/A |
T-4 Invesco Mid Cap Growth Fund
Trustees and Officers—(continued)
| | | | | | | | |
Name, Year of Birth and
Position(s) Held with the Trust | | Trustee and/
or Officer Since | | Principal Occupation(s)
During Past 5 Years | | Number of Funds in Fund
Complex
Overseen by
Trustee | | Other Directorship(s)
Held by Trustee During
Past 5 Years |
| Other Officers—(continued) | | | | | | | | |
Gregory G. McGreevey — 1962 Senior Vice President | | 2012 | | Senior Managing Director, Invesco Ltd.; Director, Chairman, President, and Chief Executive Officer, Invesco Advisers, Inc. (formerly known as Invesco Institutional (N.A.), Inc.) (registered investment adviser); Director, Invesco Mortgage Capital, Inc. and Invesco Senior Secured Management, Inc.; and Senior Vice President, The Invesco Funds Formerly: Senior Vice President, Invesco Management Group, Inc. and Invesco Advisers, Inc.; Assistant Vice President, The Invesco Funds | | N/A | | N/A |
Kelli Gallegos — 1970 Vice President, Principal Financial Officer and Assistant Treasurer | | 2008 | | Assistant Treasurer, Invesco Specialized Products, LLC; Vice President, Principal Financial Officer and Assistant Treasurer, The Invesco Funds; Principal Financial and Accounting Officer — Pooled Investments, Invesco Capital Management LLC; Vice President and Treasurer, Invesco Exchange-Traded Fund Trust, Invesco Exchange-Traded Fund Trust II, Invesco India Exchange-Traded Fund Trust, Invesco Actively Managed Exchange-Traded Fund Trust, Invesco Actively Managed Exchange-Traded Commodity Fund Trust and Invesco Exchange-Traded Self-Indexed Fund Trust Formerly: Assistant Treasurer, Invesco Exchange-Traded Fund Trust, Invesco Exchange-Traded Fund Trust II, Invesco India Exchange-Traded Fund Trust, Invesco Actively Managed Exchange-Traded Fund Trust, Invesco Actively Managed Exchange-Traded Commodity Fund Trust and Invesco Exchange-Traded Self-Indexed Fund Trust; Assistant Treasurer, Invesco Capital Management LLC; Assistant Vice President, The Invesco Funds | | N/A | | N/A |
Crissie M. Wisdom — 1969 Anti-Money Laundering Compliance Officer | | 2013 | | Anti-Money Laundering Compliance Officer, Invesco Advisers, Inc. (formerly known as Invesco Institutional (N.A.), Inc.) (registered investment adviser), Invesco Capital Markets, Inc. (formerly known as Van Kampen Funds Inc.), Invesco Distributors, Inc., Invesco Investment Services, Inc., The Invesco Funds, and Invesco Exchange-Traded Fund Trust, Invesco Exchange-Traded Fund Trust II, Invesco India Exchange-Traded Fund Trust, Invesco Actively Managed Exchange-Traded Fund Trust, Invesco Actively Managed Exchange-Traded Commodity Fund Trust and Invesco Exchange-Traded Self-Indexed Fund Trust; Anti-Money Laundering Compliance Officer and Bank Secrecy Act Officer, INVESCO National Trust Company and Invesco Trust Company; and Fraud Prevention Manager and Controls and Risk Analysis Manager for Invesco Investment Services, Inc. Formerly: Anti-Money Laundering Compliance Officer, Van Kampen Exchange Corp. and Invesco Management Group, Inc. | | N/A | | N/A |
Robert R. Leveille — 1969 Chief Compliance Officer | | 2016 | | Chief Compliance Officer, Invesco Advisers, Inc. (registered investment adviser); and Chief Compliance Officer, The Invesco Funds Formerly: Chief Compliance Officer, Putnam Investments and the Putnam Funds | | N/A | | N/A |
The Statement of Additional Information of the Trust includes additional information about the Fund’s Trustees and is available upon request, without charge, by calling 1.800.959.4246. Please refer to the Fund’s Statement of Additional Information for information on the Fund’ssub-advisers.
| | | | | | |
Office of the Fund 11 Greenway Plaza, Suite 1000 Houston, TX 77046-1173 | | Investment Adviser Invesco Advisers, Inc. 1555 Peachtree Street, N.E. Atlanta, GA 30309 | | Distributor Invesco Distributors, Inc. 11 Greenway Plaza, Suite 1000 Houston, TX 77046-1173 | | Auditors PricewaterhouseCoopers LLP 1000 Louisiana Street, Suite 5800 Houston, TX 77002-5021 |
| | | |
| | | | | | |
Counsel to the Fund Stradley Ronon Stevens & Young, LLP 2005 Market Street, Suite 2600 Philadelphia, PA 19103-7018 | | Counsel to the Independent Trustees Goodwin Procter LLP 901 New York Avenue, N.W. Washington, D.C. 20001 | | Transfer Agent Invesco Investment Services, Inc. 11 Greenway Plaza, Suite 1000 Houston, TX 77046-1173 | | Custodian State Street Bank and Trust Company 225 Franklin Street Boston, MA 02110-2801 |
T-5 Invesco Mid Cap Growth Fund
Go paperless with eDelivery
Visit invesco.com/edelivery to enjoy the convenience and security of anytime electronic access to your investment documents.
With eDelivery, you can elect to have any or all of the following materials delivered straight to your inbox to download, save and print from your own computer:
| • | Fund reports and prospectuses |
| • | Quarterly statements |
| • | Daily confirmations |
| • | Tax forms |
Invesco mailing information
Send general correspondence to Invesco Investment Services, Inc., P.O. Box 219078, Kansas City, MO 64121-9078.
Important notice regarding delivery of security holder documents
To reduce Fund expenses, only one copy of most shareholder documents may be mailed to shareholders with multiple accounts at the same address (Householding). Mailing of your shareholder documents may be householded indefinitely unless you instruct us otherwise. If you do not want the mailing of these documents to be combined with those for other members of your household, please contact Invesco Investment Services, Inc. at 800 959 4246 or contact your financial institution. We will begin sending you individual copies for each account within 30 days after receiving your request.
Fund holdings and proxy voting information
The Fund provides a complete list of its holdings four times in each fiscal year, at the quarter-ends. For the second and fourth quarters, the list appears in the Fund’s semiannual and annual reports to shareholders. For the first and third quarters, the Fund files the lists with the Securities and Exchange Commission (SEC) on Form N-Q (or any successor Form). The most recent list of portfolio holdings is available at invesco.com/completeqtrholdings. Shareholders can also look up the Fund’s Form N-Q (or any successor Form) filings on the SEC website, sec.gov. The SEC file numbers for the Fund are shown below.
A description of the policies and procedures that the Fund uses to determine how to vote proxies relating to portfolio securities is available without charge, upon request, from our Client Services department at 800 959 4246, or at invesco.com/proxyguidelines. The information is also available on the SEC website, sec.gov.
Information regarding how the Fund voted proxies related to its portfolio securities during the most recent 12-month period ended June 30 is available at invesco.com/proxysearch. This information is also available on the SEC website, sec.gov.
Invesco Advisers, Inc. is an investment adviser; it provides investment advisory services to individual and institutional clients and does not sell securities. Invesco Distributors, Inc. is the US distributor for Invesco Ltd.’s retail mutual funds, exchange-traded funds and institutional money market funds. Both are wholly owned, indirect subsidiaries of Invesco Ltd.
| SEC file numbers: 811-03826 and 002-85905 | Invesco Distributors, Inc. | VK-MCG-AR-1 |
| Annual Report to Shareholders | April 30, 2019 |
Invesco Small Cap Value Fund
Nasdaq:
A: VSCAX ■ C: VSMCX ■ Y: VSMIX ■ R6: SMVSX

Beginning on January 1, 2021, as permitted by regulations adopted by the Securities and Exchange Commission, paper copies of the Fund’s shareholder reports will no longer be sent by mail, unless you specifically request paper copies of the reports from the Fund or from your financial intermediary, such as a broker-dealer or bank. Instead, the reports will be made available on the Fund’s website, and you will be notified by mail each time a report is posted and provided with a website link to access the report.
If you already elected to receive shareholder reports electronically, you will not be affected by this change and you need not take any action. You may elect to receive shareholder reports and other communications from the Fund electronically by contacting your financial intermediary (such as a broker-dealer or bank) or, if you are a direct investor, by enrolling at invesco.com/edelivery.
You may elect to receive all future reports in paper free of charge. If you invest through a financial intermediary, you can contact your financial intermediary to request that you continue to receive paper copies of your shareholder reports. If you invest directly with the Fund, you can call (800) 959-4246 to let the Fund know you wish to continue receiving paper copies of your shareholder reports. Your election to receive reports in paper will apply to all funds held with your financial intermediary or all funds held with the fund complex if you invest directly with the Fund.
Dear Shareholders:
This annual report includes information about your Fund, including performance data and a complete list of its investments as of the close of the reporting period. Inside is a discussion of how your Fund was managed and the factors that affected its performance during the reporting period.
Philip Taylor, whose messages to shareholders have appeared here for the last 13 years, transitioned to a senior advisory role on March 1, prior to his retirement at the end of the year, and I assumed his role as Head of the Americas and Senior Managing Director, Invesco Ltd. All of us at Invesco are indebted to Phil for his many years of dedicated service to the company and to its funds’ shareholders. I’m excited about this new opportunity, and I look forward to communicating with fund shareholders going forward.
Investor sentiment during the reporting period ranged from elation to fear, notably in the fourth quarter of 2018. Amid corporate tax cuts and improving global growth, several US equity indexes redefined highs during the first half of the reporting period. The exuberance, however, ended in October as global equities, in particular US stocks, sold off, with the sharpest decline in December of 2018. The catalyst for the sell-off was a combination of ongoing trade concerns between the US and China, fears of a global economic slowdown and lower oil prices from a supply glut. Gains posted earlier in the year for global equities were erased, while US Treasury bonds, along with government and municipal bonds, rallied as investors fled to “safe haven” assets. The reporting period ended on a positive note, however, as global equities bounced back strongly at the outset of 2019, with the US stock market reaching new highs by the period end. Given the strong economy during the reporting period, the US Federal Reserve (the Fed) raised the federal funds rate three times. At its December 2018 meeting, however, the Fed delivered a more “dovish stance” by simultaneously raising rates while reducing guidance for 2019 rate increases. As the fiscal year ended, the Fed had thus far left rates unchanged in 2019. As 2019 unfolds, we’ll see how the interplay of interest rates, economic data, geopolitics and a host of other factors affect US and overseas equity and fixed income markets.
Investor uncertainty and market volatility, such as we witnessed during the reporting period, are unfortunate facts of life when it comes to investing. That’s why Invesco encourages investors to work with a professional financial adviser who can stress the importance of starting to save and invest early and the importance of adhering to a disciplined investment plan. A financial adviser who knows your unique financial situation, investment goals and risk tolerance can be an invaluable partner as you seek to achieve your financial goals. He or she can offer a long-term perspective when markets are volatile and time-tested advice and guidance when your financial situation or investment goals change.
Visit our website for more information on your investments
Our website, invesco.com/us, offers a wide range of market insights and investment perspectives. On the website, you’ll find detailed information about our funds, including performance, holdings and portfolio manager commentaries. You can access information about your account by completing a simple, secure online registration. To do so, select “Log In” on the right side of the homepage, and then select “Register for Individual Account Access.”
In addition to the resources accessible on our website and through our mobile app, you can obtain timely updates to help you stay informed about the markets and the economy by connecting with Invesco on Twitter, LinkedIn or Facebook. You can access our blog at blog.invesco.us.com. Our goal is to provide you the information you want, when and where you want it.
Finally, I’m pleased to share with you Invesco’s commitment to both the Principles for Responsible Investment and to considering environmental, social and governance issues in our robust investment process. I invite you to learn more at invesco.com/esg.
Have questions?
For questions about your account, contact an Invesco client services representative at 800 959 4246.
All of us at Invesco look forward to serving your investment management needs. Thank you for investing with us.
Sincerely,
Andrew Schlossberg
Head of the Americas,
Senior Managing Director, Invesco Ltd.
| 2 | Invesco Small Cap Value Fund |
Dear Shareholders:
Among the many important lessons I’ve learned in more than 40 years in a variety of business endeavors is the value of a trusted advocate.
As independent chair of the Invesco Funds Board, I can assure you that the members of the Board are strong advocates for the interests of investors in Invesco’s mutual funds. We work hard to represent your interests through oversight of the quality of the investment management services your funds receive and other matters important to your investment, including but not limited to:
| ■ | Ensuring that Invesco offers a diverse lineup of mutual funds that your financial adviser can use to strive to meet your financial needs as your investment goals change over time. |
| ■ | Monitoring how the portfolio management teams of the Invesco funds are performing in light of changing economic and market conditions. |
| ■ | Assessing each portfolio management team’s investment performance within the context of the investment strategy described in the fund’s prospectus. |
| ■ | Monitoring for potential conflicts of interests that may impact the nature of the services that your funds receive. |
We believe one of the most important services we provide our fund shareholders is the annual review of the funds’ advisory and sub-advisory contracts with Invesco Advisers and its affiliates. This review is required by the Investment Company Act of 1940 and focuses on the nature and quality of the services Invesco provides as the adviser to the Invesco funds and the reasonableness of the fees that it charges for those services. Each year, we spend months carefully reviewing information received from Invesco and a variety of independent sources, such as performance and fee data prepared by Lipper, Inc. (a subsidiary of Broadridge Financial Solutions, Inc.), an independent, third-party firm widely recognized as a leader in its field. We also meet with our independent legal counsel and other independent advisers to review and help us assess the information that we have received. Our goal is to assure that you receive quality investment management services for a reasonable fee.
I trust the measures outlined above provide assurance that you have a worthy advocate when it comes to choosing the Invesco Funds.
As always, please contact me at bruce@brucecrockett.com with any questions or concerns you may have. On behalf of the Board, we look forward to continuing to represent your interests and serving your needs.
Sincerely,
Bruce L. Crockett
Independent Chair
Invesco Funds Board of Trustees
| 3 | Invesco Small Cap Value Fund |
Management’s Discussion of Fund Performance
Performance summary
For the fiscal year ended April 30, 2019, Class A shares of Invesco Small Cap Value Fund (the Fund), at net asset value (NAV), underperformed the Russell 2000 Value Index, the Fund’s style-specific benchmark.
Your Fund’s long-term performance appears later in this report.
Fund vs. Indexes
Total returns, April 30, 2018 to April 30, 2019, at net asset value (NAV). Performance shown does not include applicable contingent deferred sales charges (CDSC) or front-end sales charges, which would have reduced performance.
| Class A Shares | –3.16% |
| Class C Shares | –3.98 |
| Class Y Shares | –2.97 |
| Class R6 Shares | –2.80 |
| S&P 500 Index▼ (Broad Market Index) | 13.49 |
Russell 2000 Value Index■
(Style-Specific Index) | 2.19 |
Lipper Small-Cap Value Funds Index♦
(Peer Group Index) | 0.43 |
| Source(s):▼FactSet Research Systems Inc.;■ RIMES Technologies Corp.;♦ Lipper Inc. |
and health care posted double-digit losses.
During the fiscal year, we continued to use our intrinsic value strategy, seeking to create wealth by maintaining a long-term investment horizon and investing in companies trading at a significant discount to our estimate of their intrinsic value. We believe intrinsic value represents the fair economic worth of a business. Since our application of this strategy is highly disciplined and relatively unique, it is important to understand the benefits and limitations of our process. First, the investment strategy is intended to preserve capital while growing it at above-market rates over the long term. Second, our investments have little in common with popular stock market indexes and most of our peers. And third, the Fund’s short-term relative performance will naturally be different from stock market indexes and peers since we typically structure the portfolio significantly differently than these benchmarks.
Drivers of Fund performance were mainly stock-specific during the fiscal year. However, the Fund’s lack of exposure to the more defensive/yield-oriented sectors, such as utilities and real estate, hurt the Fund’s performance versus the Russell 2000 Value Index as these sectors performed well for much of the fiscal year. The Fund’s overweight position in the health care sector also hurt the Fund’s relative performance. Conversely, the Fund’s underweight position in the energy sector helped relative Fund performance as it was the worst-performing sector during the fiscal year.
Materials companySealed Air was the largest contributor to Fund performance
Market conditions and your Fund
The fiscal year proved to be an increasingly volatile time for US equities. Throughout the summer, US equities moved higher as corporate profits surged amid the benefit of corporate tax cuts and improving global economic growth. Several US equity indexes reached new highs despite potential headwinds, including trade tensions, tariff announcements and contagion concerns over a Turkish currency crisis. After a relatively quiet summer, market volatility noticeably rose in October 2018, as US equity markets suffered a sharp sell-off through year-end 2018, amid ongoing trade concerns between the US and China, fears of a global economic slowdown and lower oil prices. In this environment, there was a flight to safety, as investors fled to defensive areas of the markets.
Given signs of a strong economy, the US Federal Reserve (the Fed) raised interest rates three times during the fiscal
| Portfolio Composition |
| By sector | % of total net assets |
| Industrials | 30.09% |
| Financials | 17.71 |
| Materials | 14.60 |
| Consumer Discretionary | 10.91 |
| Energy | 7.03 |
| Health Care | 6.46 |
| Information Technology | 5.70 |
| Consumer Staples | 3.33 |
| Money Market Funds Plus Other Assets Less Liabilities | 4.17 |
year: in June, September and December 2018. In contrast, the European Central Bank and central banks in several other countries maintained extraordinarily accommodative monetary policies.
Equity markets rebounded in 2019, fueled by optimism about a potential US-China trade deal and the Fed’s indication that there would be no interest rate hikes in 2019, a surprising shift in monetary policy. The Fed’s more accommodative stance provided a supportive environment for equities and fixed income, even as US economic data were mixed and overseas growth appeared to be slowing. By the end of the fiscal year, the US equity market generally recovered the losses from fourth quarter 2018, backed by improving investor sentiment, low unemployment and a growing economy.
Within the Russell 2000 Value Index, sector performance was mixed during the fiscal year. Communication services, information technology and utilities posted double-digit gains, while energy
| Top 10 Equity Holdings* |
| % of total net assets |
| 1. | AECOM | 4.13% |
| 2. | Carpenter Technology Corp. | 3.07 |
| 3. | Delphi Technologies PLC | 3.06 |
| 4. | Owens Corning | 3.00 |
| 5. | Crown Holdings, Inc. | 2.81 |
| 6. | Sealed Air Corp. | 2.71 |
| 7. | Builders FirstSource, Inc. | 2.68 |
| 8. | MGIC Investment Corp. | 2.65 |
| 9. | Carlisle Cos., Inc. | 2.55 |
| 10. | Flex Ltd. | 2.53 |
| Total Net Assets | $1.6 billion |
| Total Number of Holdings* | 66 |
| The Fund’s holdings are subject to change, and there is no assurance that the Fund will continue to hold any particular security. |
| *Excluding money market fund holdings. |
| Data presented here are as of April 30, 2019. |
| 4 | Invesco Small Cap Value Fund |
during the fiscal year. The company produces a variety of flexible resin packaging, protective shipping materials and integrated packaging systems. Shares of Sealed Air rose during the fiscal year as the company announced a comprehensive cost reduction and profitability improvement program in 2018. Industrial firmCarlisle Companies was also a top contributor to the Fund’s performance for the fiscal year. The company manufactures materials for commercial roofing systems, as well as other industrial products. Shares of Carlisle Companies rose after the company reported record financial results for the first quarter of 2019. Financial services companyRadian Group also made a large contribution to the Fund’s performance. Radian Group provides mortgage insurance and services to the real estate and mortgage finance industries. Shares of the company rose after management reported strong financial results in 2018 and for the first quarter of 2019.
Health care companyMylan was the largest detractor from overall Fund performance during the fiscal year. Mylan is one of the largest generic pharmaceutical manufacturers in the world. Shares of the company declined due to the delay of several product launches and industry-wide generic drug pricing pressure. Marketing services companyMDC Partners also detracted from the Fund’s performance during the fiscal year. The company’s financial results were disappointing for most of 2018, due to several account losses and the inability to replace the lost business. We sold our remaining position in MDC Partners to invest in better opportunities elsewhere. Asset managerAffiliated Managers Group was also a large detractor from Fund performance. Shares of the company fell as net inflows and assets under management for the company were below expectations for much of the fiscal year.
We believe the single most important indicator of how the Fund is positioned for potential future success is not our recent investment results nor popular statistical measures, but rather the difference between current market price and the Fund’s estimated intrinsic value — the aggregate business value of the portfolio based on our estimate of intrinsic value for each individual holding.
At the end of the fiscal year, the difference between the market price and the estimated intrinsic value of the Fund remained attractive, according to our estimation. While there is no assurance that market value will ever reflect our esti-
mate of the Fund’s intrinsic value, we believe the gap between price and estimated intrinsic value may provide above-average capital appreciation. We will continue to work hard to protect and grow the Fund’s estimated intrinsic value.
We thank you for your investment in Invesco Small Cap Value Fund and for sharing our long-term investment perspective.
The views and opinions expressed in management’s discussion of Fund performance are those of Invesco Advisers, Inc. These views and opinions are subject to change at any time based on factors such as market and economic conditions. These views and opinions may not be relied upon as investment advice or recommendations, or as an offer for a particular security. The information is not a complete analysis of every aspect of any market, country, industry, security or the Fund. Statements of fact are from sources considered reliable, but Invesco Advisers, Inc. makes no representation or warranty as to their completeness or accuracy. Although historical performance is no guarantee of future results, these insights may help you understand our investment management philosophy.
See important Fund and, if applicable, index disclosures later in this report.
Jonathan Edwards
Chartered Financial Analyst, Portfolio Manager, is lead manager of Invesco Small Cap Value Fund. He joined Invesco in 2001. Mr. Edwards earned a BS in economics from Texas A&M University and an MBA from The University of Texas at Austin.
Jonathan Mueller
Chartered Financial Analyst, Portfolio Manager, is manager of Invesco Small Cap Value Fund. He joined Invesco in 2001. Mr. Mueller earned a BBA in accounting from Texas Christian University and an MBA in finance from The University of Texas at Austin. He is also a Certified Public Accountant.
| 5 | Invesco Small Cap Value Fund |
Your Fund’s Long-Term Performance
Results of a $10,000 Investment — Oldest Share Class(es)
Fund and index data from 4/30/09
| 1 | Source: FactSet Research Systems Inc. |
| 2 | Source: RIMES Technologies Corp. |
| 3 | Source: Lipper Inc. |
Past performance cannot guarantee comparable future results.
The data shown in the chart include reinvested distributions, applicable sales charges and Fund expenses including
management fees. Index results include reinvested dividends, but they do not reflect sales charges. Performance of the peer group, if applicable, reflects fund expenses and management fees; perfor-
mance of a market index does not. Performance shown in the chart and table(s) does not reflect deduction of taxes a shareholder would pay on Fund distributions or sale of Fund shares.
| 6 | Invesco Small Cap Value Fund |
| Average Annual Total Returns |
| As of 4/30/19, including maximum applicable sales charges |
| Class A Shares | |
| Inception (6/21/99) | 9.72% |
| 10 Years | 13.01 |
| 5 Years | 3.08 |
| 1 Year | –8.49 |
| Class C Shares | |
| Inception (6/21/99) | 9.61% |
| 10 Years | 12.80 |
| 5 Years | 3.45 |
| 1 Year | –4.65 |
| Class Y Shares | |
| Inception (8/12/05) | 9.23% |
| 10 Years | 13.93 |
| 5 Years | 4.49 |
| 1 Year | –2.97 |
| Class R6 Shares | |
| 10 Years | 13.74% |
| 5 Years | 4.42 |
| 1 Year | –2.80 |
| Average Annual Total Returns |
| As of 3/31/19, the most recent calendar quarter end, including maximum applicable sales charges |
| Class A Shares | |
| Inception (6/21/99) | 9.44% |
| 10 Years | 13.81 |
| 5 Years | 2.03 |
| 1 Year | –13.33 |
| Class C Shares | |
| Inception (6/21/99) | 9.33% |
| 10 Years | 13.62 |
| 5 Years | 2.42 |
| 1 Year | –9.61 |
| Class Y Shares | |
| Inception (8/12/05) | 8.83% |
| 10 Years | 14.75 |
| 5 Years | 3.44 |
| 1 Year | –8.04 |
| Class R6 Shares | |
| 10 Years | 14.56% |
| 5 Years | 3.36 |
| 1 Year | –7.92 |
Effective June 1, 2010, Class A, Class C and Class I shares of the predecessor fund, Van Kampen Small Cap Value Fund, advised by Van Kampen Asset Management were reorganized into Class A, Class C and Class Y shares, respectively, of Invesco Van Kampen Small Cap Value Fund (renamed Invesco Small Cap Value Fund). Returns shown above, prior to June 1, 2010, for Class A, Class C and Class Y shares are blended returns of the predecessor fund and Invesco Small Cap Value Fund. Share class returns will differ from the predecessor fund because of different expenses.
Class R6 shares incepted on February 7, 2017. Performance shown prior to that date is that of the Fund’s and the predecessor fund’s Class A shares and includes the 12b-1 fees applicable to Class A shares.
The performance data quoted represent past performance and cannot guarantee comparable future results; current performance may be lower or higher. Please visit invesco.com/performance for the most recent month-end performance. Performance figures reflect reinvested distributions, changes in net asset value and the effect of the maximum sales charge unless otherwise stated. Investment return and principal value will fluctuate so that you may have a gain or loss when you sell shares.
The total annual Fund operating expense ratio set forth in the most recent Fund prospectus as of the date of this report for Class A, Class C, Class Y and Class R6 shares was 1.12%, 1.86%, 0.87% and 0.69%, respectively. The expense ratios presented above may vary from the expense ratios presented in other sections of this report that are based on expenses incurred during the period covered by this report.
Class A share performance reflects the maximum 5.50% sales charge, and Class C share performance reflects the applicable contingent deferred sales charge (CDSC) for the period involved. The CDSC on Class C shares is 1% for the first year after purchase. Class Y and Class R6 shares do not have a front-end sales charge or a CDSC; therefore, performance is at net asset value.
The performance of the Fund’s share classes will differ primarily due to different sales charge structures and class expenses.
Fund performance reflects any applicable fee waivers and/or expense reimbursements. Had the adviser not waived fees and/or reimbursed expenses currently or in the past, returns would have been lower. See current prospectus for more information.
| 7 | Invesco Small Cap Value Fund |
Invesco Small Cap Value Fund’s investment objective is long-term growth of capital.
| ■ | Unless otherwise stated, information presented in this report is as of April 30, 2019, and is based on total net assets. |
| ■ | Unless otherwise noted, all data provided by Invesco. |
| ■ | To access your Fund’s reports/prospectus, visit invesco.com/fundreports. |
About share classes
| ■ | Class Y shares are available to only certain investors. Please see the prospectus for more information. |
| ■ | Class R6 sharesare available for use by for retirement plans that meet certain standards and for institutional investors. Class R6 shares are also available through intermediaries that have established an agreement with Invesco Distributors, Inc. to make such shares available for use in retail omnibus accounts. Please see the prospectus for more information. |
Principal Risks of Investing in the Fund
| ■ | Depositary receipts risk. Investing in depositary receipts involves the same risks as direct investments in foreign securities. In addition, the underlying issuers of certain depositary receipts are under no obligation to distribute shareholder communications or pass through any voting rights with respect to the deposited securities to the holders of such receipts. The Fund may therefore receive less timely information or have less control than if it invested directly in the foreign issuer. |
| ■ | Derivatives risk. The value of a derivative instrument depends largely on (and is derived from) the value of an underlying security, currency, commodity, interest rate, index or other asset (each referred to as an underlying asset). In addition to risks relating to the underlying assets, the use of derivatives may include other, possibly greater, risks, including counterparty, leverage and liquidity risks. Counterparty risk is the risk that the counterparty to the derivative contract will default on its obligation to pay the Fund the amount owed or otherwise perform under the derivative contract. Derivatives create leverage risk because they do not require payment up front equal to the economic exposure created by holding a position in the derivative. As a result, |
| | an adverse change in the value of the underlying asset could result in the Fund sustaining a loss that is substantially greater than the amount invested in the derivative or the anticipated value of the underlying asset, which may make the Fund’s returns more volatile and increase the risk of loss. Derivative instruments may also be less liquid than more traditional investments and the Fund may be unable to sell or close out its derivative positions at a desirable time or price. This risk may be more acute under adverse market conditions, during which the Fund may be most in need of liquidating its derivative positions. Derivatives may also be harder to value, less tax efficient and subject to changing government regulation that could impact the Fund’s ability to use certain derivatives or their cost. Derivatives strategies may not always be successful. For example, derivatives used for hedging or to gain or limit exposure to a particular market segment may not provide the expected benefits, particularly during adverse market conditions. |
| ■ | Emerging markets securities risk. Emerging markets (also referred to as developing markets) are generally subject to greater market volatility, political, social and economic instability, uncertain trading markets and more governmental limitations on foreign investment than more developed markets. In addition, companies operating in emerging markets may be subject to lower trading volume and greater price fluctuations than companies in more developed markets. Securities law and the enforcement of systems of taxation in many emerging market countries may change quickly and unpredictably. In addition, investments in emerging markets securities may also be subject to additional transaction costs, delays in settlement procedures, and lack of timely information. |
| ■ | Foreign securities risk. The Fund’s foreign investments may be adversely |
| | affected by political and social instability, changes in economic or taxation policies, difficulty in enforcing obligations, decreased liquidity or increased volatility. Foreign investments also involve the risk of the possible seizure, nationalization or expropriation of the issuer or foreign deposits (in which the Fund could lose its entire investments in a certain market) and the possible adoption of foreign governmental restrictions such as exchange controls. Unless the Fund has hedged its foreign securities risk, foreign securities risk also involves the risk of negative foreign currency rate fluctuations, which may cause the value of securities denominated in such foreign currency (or other instruments through which the Fund has exposure to foreign currencies) to decline in value. Currency exchange rates may fluctuate significantly over short periods of time. Currency hedging strategies, if used, are not always successful. |
| ■ | Management risk. The Fund is actively managed and depends heavily on the Adviser’s judgment about markets, interest rates or the attractiveness, relative values, liquidity, or potential appreciation of particular investments made for the Fund’s portfolio. The Fund could experience losses if these judgments prove to be incorrect. Additionally, legislative, regulatory, or tax developments may adversely affect management of the Fund and, therefore, the ability of the Fund to achieve its investment objective. |
| ■ | Market risk. The market values of the Fund’s investments, and therefore the value of the Fund’s shares, will go up and down, sometimes rapidly or unpredictably. Market risk may affect a single issuer, industry or section of the economy, or it may affect the market as a whole. Individual stock prices tend to go up and down more dramatically than those of certain other types of investments, such as bonds. During a general downturn in the financial markets, multiple asset |
This report must be accompanied or preceded by a currently effective Fund prospectus, which contains more complete information, including sales charges and expenses. Investors should read it carefully before investing.
NOT FDIC INSURED | MAY LOSE VALUE | NO BANK GUARANTEE
| 8 | Invesco Small Cap Value Fund |
| | classes may decline in value. When markets perform well, there can be no assurance that specific investments held by the Fund will rise in value. |
| ■ | REIT risk/real estate risk. Investments in real estate related instruments may be affected by economic, legal, cultural, environmental or technological factors that affect property values, rents or occupancies of real estate related to the Fund’s holdings. Shares of real estate related companies, which tend to be small- and mid-cap companies, may be more volatile and less liquid. |
| ■ | Sector focus risk. The Fund may from time to time invest a significant amount of its assets (i.e. over 25%) in one market sector or group of related industries. In this event, the Fund’s performance will depend to a greater extent on the overall condition of the sector or group of industries and there is increased risk that the Fund will lose significant value if conditions adversely affect that sector or group of industries. |
| ■ | Small- and mid-capitalization companies risks. Small- and mid-capitalization companies tend to be more vulnerable to changing market conditions, may have little or no operating history or track record of success, and may have more limited product lines and markets, less experienced management and fewer financial resources than larger companies. These companies’ securities may be more volatile and less liquid than those of more established companies, and their returns may vary, sometimes significantly, from the overall securities market. |
| ■ | Value investing style risk. A value investing style subjects the Fund to the risk that the valuations never improve or that the returns on value equity securities are less than returns on other styles of investing or the overall stock market |
About indexes used in this report
| ■ | TheS&P 500® Index is an unmanaged index considered representative of the US stock market. |
| ■ | TheRussell 2000® Value Index is an unmanaged index considered representative of small-cap value stocks. The Russell 2000 Value Index is a trademark/service mark of the Frank Russell Co. Russell® is a trademark of the Frank Russell Co. |
| ■ | The Lipper Small-Cap Value Funds Index is an unmanaged index considered representative of small-cap value funds tracked by Lipper. |
| ■ | The Fund is not managed to track the performance of any particular index, including the index(es) described here, and consequently, the performance of the Fund may deviate significantly from the performance of the index(es). |
| ■ | A direct investment cannot be made in an index. Unless otherwise indicated, index results include reinvested dividends, and they do not reflect sales charges. Performance of the peer group, if applicable, reflects fund expenses; performance of a market index does not. |
Other information
| ■ | CPA® and Certified Public Accountant®are trademarks owned by the American Institute of Certified Public Accountants. |
| ■ | The returns shown in management’s discussion of Fund performance are based on net asset values (NAVs) calculated for shareholder transactions. Generally accepted accounting principles require adjustments to be made to the net assets of the Fund at period end for financial reporting purposes, and as such, the NAVs for shareholder transactions and the returns based on those NAVs may differ from the NAVs and returns reported in the Financial Highlights. |
| ■ | Industry classifications used in this report are generally according to the Global Industry Classification Standard, which was developed by and is the exclusive property and a service mark of MSCI Inc. and Standard & Poor’s. |
| 9 | Invesco Small Cap Value Fund |
Schedule of Investments(a)
April 30, 2019
| | Shares | Value |
| Common Stocks & Other Equity Interests–95.83% |
| Agricultural & Farm Machinery–1.91% |
| AGCO Corp. | 437,594 | $30,972,903 |
| Asset Management & Custody Banks–2.47% |
| Affiliated Managers Group, Inc. | 361,700 | 40,119,764 |
| Auto Parts & Equipment–7.00% |
| Dana, Inc. | 2,006,240 | 39,121,680 |
| Delphi Technologies PLC | 2,248,559 | 49,760,611 |
| Motorcar Parts of America, Inc.(b) | 788,109 | 16,282,332 |
| Visteon Corp. | 130,400 | 8,609,008 |
| | | | 113,773,631 |
| Building Products–8.17% |
| Builders FirstSource, Inc.(b) | 3,164,812 | 43,611,109 |
| JELD-WEN Holding, Inc.(b) | 1,090,600 | 21,539,350 |
| Masco Corp. | 21,351 | 833,970 |
| Masonite International Corp.(b) | 349,900 | 18,016,351 |
| Owens Corning | 951,500 | 48,783,405 |
| | | | 132,784,185 |
| Construction & Engineering–6.16% |
| AECOM(b) | 1,981,799 | 67,182,986 |
| Fluor Corp. | 831,200 | 33,023,576 |
| | | | 100,206,562 |
| Construction Machinery & Heavy Trucks–1.23% |
| REV Group, Inc. | 1,577,769 | 20,021,889 |
| Consumer Finance–1.01% |
| SLM Corp. | 1,619,400 | 16,453,104 |
| Distributors–2.22% |
| LKQ Corp.(b) | 1,199,500 | 36,104,950 |
| Diversified Chemicals–2.59% |
| Chemours Co. (The) | 521,600 | 18,782,816 |
| Huntsman Corp. | 1,047,600 | 23,298,624 |
| | | | 42,081,440 |
| Diversified Metals & Mining–0.00% |
| Ferroglobe Representation & Warranty Insurance Trust(b)(c) | 1,203,948 | 0 |
| Electronic Components–1.36% |
| Belden, Inc. | 398,068 | 22,112,677 |
| Electronic Manufacturing Services–2.53% |
| Flex Ltd.(b) | 3,730,939 | 41,189,567 |
| Environmental & Facilities Services–3.41% |
| Stericycle, Inc.(b) | 679,940 | 39,701,697 |
| Team, Inc.(b) | 931,007 | 15,734,018 |
| | | | 55,435,715 |
| | Shares | Value |
| Health Care Distributors–1.76% |
| Cardinal Health, Inc. | 253,200 | $12,333,372 |
| McKesson Corp. | 136,400 | 16,265,700 |
| | | | 28,599,072 |
| Health Care Equipment–0.07% |
| Invacare Corp. | 152,300 | 1,127,020 |
| Health Care Facilities–2.36% |
| Brookdale Senior Living, Inc.(b) | 4,426,803 | 27,357,643 |
| Capital Senior Living Corp.(b) | 993,100 | 4,171,020 |
| Hanger, Inc.(b) | 343,900 | 6,833,293 |
| | | | 38,361,956 |
| Home Furnishings–0.53% |
| Ethan Allen Interiors, Inc. | 392,900 | 8,683,090 |
| Homebuilding–1.16% |
| TopBuild Corp.(b) | 263,600 | 18,776,228 |
| Household Products–3.33% |
| Energizer Holdings, Inc. | 674,100 | 32,282,649 |
| Spectrum Brands Holdings, Inc. | 355,835 | 21,908,761 |
| | | | 54,191,410 |
| Human Resource & Employment Services–0.32% |
| ManpowerGroup, Inc. | 46,033 | 4,421,009 |
| TrueBlue, Inc.(b) | 31,554 | 762,345 |
| | | | 5,183,354 |
| Industrial Conglomerates–2.55% |
| Carlisle Cos., Inc. | 292,600 | 41,379,492 |
| Industrial Machinery–0.52% |
| Timken Co. (The) | 174,900 | 8,386,455 |
| Investment Banking & Brokerage–3.27% |
| Greenhill & Co., Inc. | 30,222 | 625,897 |
| LPL Financial Holdings, Inc. | 551,719 | 40,876,861 |
| Stifel Financial Corp. | 195,100 | 11,641,617 |
| | | | 53,144,375 |
| Life & Health Insurance–2.28% |
| CNO Financial Group, Inc. | 2,241,318 | 37,093,813 |
| Metal & Glass Containers–2.81% |
| Crown Holdings, Inc.(b) | 784,700 | 45,614,611 |
| Oil & Gas Equipment & Services–2.11% |
| C&J Energy Services, Inc.(b) | 731,300 | 10,274,765 |
| Forum Energy Technologies, Inc.(b) | 1,553,300 | 9,288,734 |
| Helix Energy Solutions Group, Inc.(b) | 1,880,500 | 14,705,510 |
| | | | 34,269,009 |
See accompanying Notes to Financial Statements which are an integral part of the financial statements.
| 10 | Invesco Small Cap Value Fund |
| | Shares | Value |
| Oil & Gas Exploration & Production–4.92% |
| Noble Energy, Inc. | 732,800 | $19,829,568 |
| Northern Oil and Gas, Inc.(b) | 3,648,498 | 9,668,520 |
| Parsley Energy, Inc., Class A(b) | 1,827,900 | 36,484,884 |
| QEP Resources, Inc.(b) | 1,860,700 | 13,992,464 |
| | | | 79,975,436 |
| Paper Packaging–2.71% |
| Sealed Air Corp. | 944,600 | 44,037,252 |
| Pharmaceuticals–2.27% |
| Mylan N.V.(b) | 1,369,200 | 36,954,708 |
| Regional Banks–2.04% |
| First Horizon National Corp. | 2,198,867 | 33,180,903 |
| Research & Consulting Services–0.73% |
| Huron Consulting Group, Inc.(b) | 13,481 | 651,537 |
| Resources Connection, Inc. | 696,897 | 11,192,166 |
| | | | 11,843,703 |
| Semiconductor Equipment–1.80% |
| Kulicke & Soffa Industries, Inc. (Singapore) | 1,260,200 | 29,324,854 |
| Specialty Chemicals–1.41% |
| Flotek Industries, Inc.(b) | 2,176,500 | 7,770,105 |
| Kraton Corp.(b) | 462,107 | 15,166,352 |
| | | | 22,936,457 |
| Steel–5.08% |
| Allegheny Technologies, Inc.(b) | 1,313,516 | 32,732,819 |
| Carpenter Technology Corp. | 1,003,904 | 49,863,911 |
| | | | 82,596,730 |
| | Shares | Value |
| Thrifts & Mortgage Finance–6.64% |
| Axos Financial, Inc.(b) | 907,312 | $29,687,249 |
| MGIC Investment Corp.(b) | 2,937,413 | 43,003,726 |
| Radian Group, Inc. | 1,501,386 | 35,162,460 |
| | | | 107,853,435 |
| Trading Companies & Distributors–5.10% |
| Beacon Roofing Supply, Inc.(b) | 658,137 | 24,785,439 |
| BMC Stock Holdings, Inc.(b) | 979,095 | 20,149,775 |
| DXP Enterprises, Inc.(b) | 203,400 | 8,723,826 |
| WESCO International, Inc.(b) | 509,700 | 29,175,228 |
| | | | 82,834,268 |
| Total Common Stocks & Other Equity Interests (Cost $1,467,557,529) | 1,557,604,018 |
|
| Money Market Funds–1.67% |
| Invesco Government & Agency Portfolio, Institutional Class, 2.34%(d) | 9,518,896 | 9,518,896 |
| Invesco Liquid Assets Portfolio, Institutional Class, 2.48%(d) | 6,798,535 | 6,800,574 |
| Invesco Treasury Portfolio, Institutional Class, 2.32%(d) | 10,878,738 | 10,878,738 |
| Total Money Market Funds (Cost $27,196,257) | 27,198,208 |
| TOTAL INVESTMENTS IN SECURITIES–97.50% (Cost $1,494,753,786) | 1,584,802,226 |
| OTHER ASSETS LESS LIABILITIES–2.50% | 40,656,557 |
| NET ASSETS–100.00% | $1,625,458,783 |
Notes to Schedule of Investments:
| (a) | Industry and/or sector classifications used in this report are generally according to the Global Industry Classification Standard, which was developed by and is the exclusive property and a service mark of MSCI Inc. and Standard & Poor’s. |
| (b) | Non-income producing security. |
| (c) | Security valued using significant unobservable inputs (Level 3). See Note 3. |
| (d) | The money market fund and the Fund are affiliated by having the same investment adviser. The rate shown is the 7-day SEC standardized yield as of April 30, 2019. |
See accompanying Notes to Financial Statements which are an integral part of the financial statements.
| 11 | Invesco Small Cap Value Fund |
Statement of Assets and Liabilities
April 30, 2019
| Assets: | |
Investments in securities, at value
(Cost $1,467,557,529) | $1,557,604,018 |
| Investments in affiliated money market funds, at value (Cost $27,196,257) | 27,198,208 |
| Receivable for: | |
| Investments sold | 16,547,594 |
| Fund shares sold | 30,018,218 |
| Dividends | 371,043 |
| Investment for trustee deferred compensation and retirement plans | 261,684 |
| Other assets | 40,658 |
| Total assets | 1,632,041,423 |
| Liabilities: | |
| Payable for: | |
| Fund shares reacquired | 4,125,712 |
| Amount due custodian | 853,508 |
| Accrued fees to affiliates | 1,156,749 |
| Accrued trustees’ and officers’ fees and benefits | 3,220 |
| Accrued other operating expenses | 151,831 |
| Trustee deferred compensation and retirement plans | 291,620 |
| Total liabilities | 6,582,640 |
| Net assets applicable to shares outstanding | $1,625,458,783 |
| Net assets consist of: | |
| Shares of beneficial interest | $1,543,344,971 |
| Distributable earnings | 82,113,812 |
| | $1,625,458,783 |
| Net Assets: |
| Class A | $662,115,222 |
| Class C | $22,059,394 |
| Class Y | $875,875,215 |
| Class R6 | $65,408,952 |
| Shares outstanding, no par value, with an unlimited number of shares authorized: |
| Class A | 46,972,380 |
| Class C | 2,469,453 |
| Class Y | 58,568,421 |
| Class R6 | 4,354,280 |
| Class A: | |
| Net asset value per share | $14.10 |
Maximum offering price per share
(Net asset value of $14.10 ÷ 94.50%) | $14.92 |
| Class C: | |
| Net asset value and offering price per share | $8.93 |
| Class Y: | |
| Net asset value and offering price per share | $14.95 |
| Class R6: | |
| Net asset value and offering price per share | $15.02 |
See accompanying Notes to Financial Statements which are an integral part of the financial statements.
| 12 | Invesco Small Cap Value Fund |
Statement of Operations
For the year ended April 30, 2019
| Investment income: | |
| Dividends | $16,956,959 |
| Dividends from affiliated money market funds | 1,090,272 |
| Total investment income | 18,047,231 |
| Expenses: | |
| Advisory fees | 12,780,143 |
| Administrative services fees | 377,242 |
| Custodian fees | 35,632 |
| Distribution fees: | |
| Class A | 1,923,374 |
| Class C | 544,225 |
| Transfer agent fees — A, C and Y | 3,687,132 |
| Transfer agent fees — R6 | 8,297 |
| Trustees’ and officers’ fees and benefits | 51,347 |
| Registration and filing fees | 136,642 |
| Reports to shareholders | 205,941 |
| Professional services fees | 87,715 |
| Other | 50,609 |
| Total expenses | 19,888,299 |
| Less: Fees waived and expense offset arrangement(s) | (61,310) |
| Net expenses | 19,826,989 |
| Net investment income (loss) | (1,779,758) |
| Realized and unrealized gain (loss) from: | |
| Net realized gain from Investment securities | 85,150,289 |
| Change in net unrealized appreciation (depreciation) of Investment securities | (198,347,184) |
| Net realized and unrealized gain (loss) | (113,196,895) |
| Net increase (decrease) in net assets resulting from operations | $(114,976,653) |
See accompanying Notes to Financial Statements which are an integral part of the financial statements.
| 13 | Invesco Small Cap Value Fund |
Statement of Changes in Net Assets
For the years ended April 30, 2019 and 2018
| | 2019 | 2018 |
| Operations: | | |
| Net investment income (loss) | $(1,779,758) | $(5,068,830) |
| Net realized gain | 85,150,289 | 415,963,865 |
| Change in net unrealized appreciation (depreciation) | (198,347,184) | (128,313,041) |
| Net increase (decrease) in net assets resulting from operations | (114,976,653) | 282,581,994 |
| Distributions to shareholders from distributable earnings(1): | | |
| Class A | (132,802,646) | (151,563,858) |
| Class B | — | (1,022,675) |
| Class C | (14,194,064) | (16,734,389) |
| Class Y | (177,702,688) | (208,778,203) |
| Class R6 | (7,472,773) | (2,519,491) |
| Total distributions to shareholders from distributable earnings | (332,172,171) | (380,618,616) |
| Share transactions–net: | | |
| Class A | (101,574,893) | (122,639,885) |
| Class B | — | (8,240,481) |
| Class C | (34,019,574) | (11,666,219) |
| Class Y | (276,425,272) | 3,493,471 |
| Class R6 | 49,772,898 | 28,296,553 |
| Net increase (decrease) in net assets resulting from share transactions | (362,246,841) | (110,756,561) |
| Net increase (decrease) in net assets | (809,395,665) | (208,793,183) |
| Net assets: | | |
| Beginning of year | 2,434,854,448 | 2,643,647,631 |
| End of year | $1,625,458,783 | $2,434,854,448 |
| (1) | The Securities and Exchange Commission eliminated the requirement to disclose the distribution components separately, except for tax return of capital. For the year ended April 30, 2018, distributions to shareholders from distributable earnings consisted of distributions from net realized gains. |
See accompanying Notes to Financial Statements which are an integral part of the financial statements.
| 14 | Invesco Small Cap Value Fund |
Financial Highlights
April 30, 2019
The following schedule presents financial highlights for a share of the Fund outstanding throughout the periods indicated.
| | Net asset
value,
beginning
of period | Net
investment
income
(loss)(a) | Net gains
(losses)
on securities
(both
realized and
unrealized) | Total from
investment
operations | Dividends
from net
investment
income | Distributions
from net
realized
gains | Total
distributions | Net asset
value, end
of period | Total
return(b) | Net assets,
end of period
(000’s omitted) | Ratio of
expenses
to average
net assets
with fee waivers
and/or expenses
absorbed | Ratio of
expenses
to average net
assets without
fee waivers
and/or expenses
absorbed | Ratio of net
investment
income
(loss)
to average
net assets | Portfolio
turnover(c) |
| Class A |
| Year ended 04/30/19 | $18.53 | $(0.04) | $(1.22) | $(1.26) | $— | $(3.17) | $(3.17) | $14.10 | (3.16)% | $662,115 | 1.12%(d) | 1.12%(d) | (0.22)%(d) | 43% |
| Year ended 04/30/18 | 19.44 | (0.06) | 2.31 | 2.25 | — | (3.16) | (3.16) | 18.53 | 11.32 | 933,986 | 1.12 | 1.12 | (0.31) | 28 |
| Year ended 04/30/17 | 16.21 | (0.02) | 3.60 | 3.58 | (0.03) | (0.32) | (0.35) | 19.44 | 22.14 | 1,094,070 | 1.10 | 1.11 | (0.12) | 32 |
| Year ended 04/30/16 | 20.33 | 0.04 | (2.37) | (2.33) | (0.01) | (1.78) | (1.79) | 16.21 | (11.43) | 1,320,826 | 1.11 | 1.11 | 0.24 | 45 |
| Year ended 04/30/15 | 22.75 | (0.00) | 0.95 | 0.95 | — | (3.37) | (3.37) | 20.33 | 5.59 | 1,751,109 | 1.13 | 1.13 | (0.02) | 44 |
| Class C |
| Year ended 04/30/19 | 13.29 | (0.11) | (1.08) | (1.19) | — | (3.17) | (3.17) | 8.93 | (3.98) | 22,059 | 1.87(d) | 1.87(d) | (0.97)(d) | 43 |
| Year ended 04/30/18 | 14.83 | (0.15) | 1.77 | 1.62 | — | (3.16) | (3.16) | 13.29 | 10.53(e) | 76,302 | 1.86(e) | 1.86(e) | (1.05)(e) | 28 |
| Year ended 04/30/17 | 12.50 | (0.12) | 2.76 | 2.65 | — | (0.32) | (0.32) | 14.83 | 21.23(e) | 95,892 | 1.84(e) | 1.85(e) | (0.86)(e) | 32 |
| Year ended 04/30/16 | 16.25 | (0.07) | (1.90) | (1.97) | — | (1.78) | (1.78) | 12.50 | (12.11) | 107,647 | 1.86 | 1.86 | (0.51) | 45 |
| Year ended 04/30/15 | 19.02 | (0.13) | 0.73 | 0.60 | — | (3.37) | (3.37) | 16.25 | 4.80(e) | 151,196 | 1.86(e) | 1.86(e) | (0.75)(e) | 44 |
| Class Y |
| Year ended 04/30/19 | 19.37 | 0.01 | (1.26) | (1.25) | — | (3.17) | (3.17) | 14.95 | (2.97) | 875,875 | 0.87(d) | 0.87(d) | 0.03(d) | 43 |
| Year ended 04/30/18 | 20.15 | (0.01) | 2.39 | 2.38 | — | (3.16) | (3.16) | 19.37 | 11.58 | 1,397,754 | 0.87 | 0.87 | (0.06) | 28 |
| Year ended 04/30/17 | 16.79 | 0.02 | 3.74 | 3.76 | (0.08) | (0.32) | (0.40) | 20.15 | 22.45 | 1,445,051 | 0.85 | 0.86 | 0.13 | 32 |
| Year ended 04/30/16 | 20.97 | 0.09 | (2.45) | (2.36) | (0.04) | (1.78) | (1.82) | 16.79 | (11.19) | 1,329,637 | 0.86 | 0.86 | 0.49 | 45 |
| Year ended 04/30/15 | 23.31 | 0.05 | 0.98 | 1.03 | — | (3.37) | (3.37) | 20.97 | 5.81 | 1,614,118 | 0.88 | 0.88 | 0.23 | 44 |
| Class R6 |
| Year ended 04/30/19 | 19.41 | 0.03 | (1.25) | (1.22) | — | (3.17) | (3.17) | 15.02 | (2.80) | 65,409 | 0.71(d) | 0.71(d) | 0.19(d) | 43 |
| Year ended 04/30/18 | 20.16 | 0.02 | 2.39 | 2.41 | — | (3.16) | (3.16) | 19.41 | 11.73 | 26,813 | 0.69 | 0.69 | 0.12 | 28 |
| Year ended 04/30/17(f) | 20.29 | 0.01 | (0.14) | (0.13) | — | — | — | 20.16 | (0.64) | 469 | 0.72(g) | 0.72(g) | 0.26(g) | 32 |
| (a) | Calculated using average shares outstanding. |
| (b) | Includes adjustments in accordance with accounting principles generally accepted in the United States of America and as such, the net asset value for financial reporting purposes and the returns based upon those net asset values may differ from the net asset value and returns for shareholder transactions. Does not include sales charges and is not annualized for periods less than one year, if applicable. |
| (c) | Portfolio turnover is calculated at the fund level and is not annualized for periods less than one year, if applicable. |
| (d) | Ratios are based on average daily net assets (000’s omitted) of $769,350, $54,489, $1,136,967 and $40,023 for Class A, Class C, Class Y and Class R6 shares, respectively. |
| (e) | The total return, ratio of expenses to average net assets and ratio of net investment income (loss) to average net assets reflect actual 12b-1 fees of 0.99% for the years ended April 30, 2018, 2017 and 2015, respectively. |
| (f) | Commencement date of February 7, 2017. |
| (g) | Annualized. |
See accompanying Notes to Financial Statements which are an integral part of the financial statements.
| 15 | Invesco Small Cap Value Fund |
Notes to Financial Statements
April 30, 2019
NOTE 1—Significant Accounting Policies
Invesco Small Cap Value Fund (the “Fund”) is a series portfolio of AIM Sector Funds (Invesco Sector Funds) (the “Trust”). The Trust is a Delaware statutory trust registered under the Investment Company Act of 1940, as amended (the “1940 Act”), as an open-end series management investment company authorized to issue an unlimited number of shares of beneficial interest. Information presented in these financial statements pertains only to the Fund. Matters affecting the Fund or each class will be voted on exclusively by the shareholders of the Fund or each class.
The Fund’s investment objective is long-term growth of capital.
The Fund currently consists of four different classes of shares: Class A, Class C, Class Y and Class R6. Class Y shares are available only to certain investors. Class A shares are sold with a front-end sales charge unless certain waiver criteria are met. Under certain circumstances, load waived shares may be subject to contingent deferred sales charges ("CDSC"). Class C shares are sold with a CDSC. Class Y and Class R6 shares are sold at net asset value. Class C shares held for ten years after purchase are eligible for automatic conversion into Class A shares of the same Fund (the "Conversion Feature"). The automatic conversion pursuant to the Conversion Feature will generally occur at the end of the month following the tenth anniversary after a purchase of Class C shares.
The Fund is an investment company and accordingly follows the investment company accounting and reporting guidance in accordance with Financial Accounting Standards Board Accounting Standards Codification Topic 946,Financial Services – Investment Companies.
The following is a summary of the significant accounting policies followed by the Fund in the preparation of its financial statements.
| A. | Security Valuations — Securities, including restricted securities, are valued according to the following policy. |
A security listed or traded on an exchange (except convertible securities) is valued at its last sales price or official closing price as of the close of the customary trading session on the exchange where the security is principally traded, or lacking any sales or official closing price on a particular day, the security may be valued at the closing bid price on that day. Securities traded in the over-the-counter market are valued based on prices furnished by independent pricing services or market makers. When such securities are valued by an independent pricing service they may be considered fair valued. Futures contracts are valued at the final settlement price set by an exchange on which they are principally traded. Listed options are valued at the mean between the last bid and asked prices from the exchange on which they are principally traded. Options not listed on an exchange are valued by an independent source at the mean between the last bid and asked prices. For purposes of determining net asset value (“NAV”) per share, futures and option contracts generally are valued 15 minutes after the close of the customary trading session of the New York Stock Exchange (“NYSE”).
Investments in open-end and closed-end registered investment companies that do not trade on an exchange are valued at the end-of-day net asset value per share. Investments in open-end and closed-end registered investment companies that trade on an exchange are valued at the last sales price or official closing price as of the close of the customary trading session on the exchange where the security is principally traded.
Debt obligations (including convertible securities) and unlisted equities are fair valued using an evaluated quote provided by an independent pricing service. Evaluated quotes provided by the pricing service may be determined without exclusive reliance on quoted prices, and may reflect appropriate factors such as institution-size trading in similar groups of securities, developments related to specific securities, dividend rate (for unlisted equities), yield (for debt obligations), quality, type of issue, coupon rate (for debt obligations), maturity (for debt obligations), individual trading characteristics and other market data. Pricing services generally value debt obligations assuming orderly transactions of institutional round lot size, but a fund may hold or transact in the same securities in smaller, odd lot sizes. Odd lots often trade at lower prices than institutional round lots. Debt obligations are subject to interest rate and credit risks. In addition, all debt obligations involve some risk of default with respect to interest and/or principal payments.
Foreign securities’ (including foreign exchange contracts) prices are converted into U.S. dollar amounts using the applicable exchange rates as of the close of the NYSE. If market quotations are available and reliable for foreign exchange-traded equity securities, the securities will be valued at the market quotations. Because trading hours for certain foreign securities end before the close of the NYSE, closing market quotations may become unreliable. If between the time trading ends on a particular security and the close of the customary trading session on the NYSE, events occur that the investment adviser determines are significant and make the closing price unreliable, the Fund may fair value the security. If the event is likely to have affected the closing price of the security, the security will be valued at fair value in good faith using procedures approved by the Board of Trustees. Adjustments to closing prices to reflect fair value may also be based on a screening process of an independent pricing service to indicate the degree of certainty, based on historical data, that the closing price in the principal market where a foreign security trades is not the current value as of the close of the NYSE. Foreign securities’ prices meeting the approved degree of certainty that the price is not reflective of current value will be priced at the indication of fair value from the independent pricing service. Multiple factors may be considered by the independent pricing service in determining adjustments to reflect fair value and may include information relating to sector indices, American Depositary Receipts and domestic and foreign index futures. Foreign securities may have additional risks including exchange rate changes, potential for sharply devalued currencies and high inflation, political and economic upheaval, the relative lack of issuer information, relatively low market liquidity and the potential lack of strict financial and accounting controls and standards.
Securities for which market prices are not provided by any of the above methods may be valued based upon quotes furnished by independent sources. The last bid price may be used to value equity securities. The mean between the last bid and asked prices is used to value debt obligations, including corporate loans.
Securities for which market quotations are not readily available or became unreliable are valued at fair value as determined in good faith by or under the supervision of the Trust’s officers following procedures approved by the Board of Trustees. Issuer specific events, market trends, bid/asked quotes of brokers and information providers and other market data may be reviewed in the course of making a good faith determination of a security’s fair value.
The Fund may invest in securities that are subject to interest rate risk, meaning the risk that the prices will generally fall as interest rates rise and, conversely, the prices will generally rise as interest rates fall. Specific securities differ in their sensitivity to changes in interest rates depending on their individual characteristics. Changes in interest rates may result in increased market volatility, which may affect the value and/or liquidity of certain Fund investments.
| 16 | Invesco Small Cap Value Fund |
Valuations change in response to many factors including the historical and prospective earnings of the issuer, the value of the issuer’s assets, general economic conditions, interest rates, investor perceptions and market liquidity. Because of the inherent uncertainties of valuation, the values reflected in the financial statements may materially differ from the value received upon actual sale of those investments.
| B. | Securities Transactions and Investment Income — Securities transactions are accounted for on a trade date basis. Realized gains or losses on sales are computed on the basis of specific identification of the securities sold. Interest income (net of withholding tax, if any) is recorded on the accrual basis from settlement date. Dividend income (net of withholding tax, if any) is recorded on the ex-dividend date. |
The Fund may periodically participate in litigation related to Fund investments. As such, the Fund may receive proceeds from litigation settlements. Any proceeds received are included in the Statement of Operations as realized gain (loss) for investments no longer held and as unrealized gain (loss) for investments still held.
Brokerage commissions and mark ups are considered transaction costs and are recorded as an increase to the cost basis of securities purchased and/or a reduction of proceeds on a sale of securities. Such transaction costs are included in the determination of net realized and unrealized gain (loss) from investment securities reported in the Statement of Operations and the Statement of Changes in Net Assets and the net realized and unrealized gains (losses) on securities per share in the Financial Highlights. Transaction costs are included in the calculation of the Fund’s net asset value and, accordingly, they reduce the Fund’s total returns. These transaction costs are not considered operating expenses and are not reflected in net investment income reported in the Statement of Operations and the Statement of Changes in Net Assets, or the net investment income per share and the ratios of expenses and net investment income reported in the Financial Highlights, nor are they limited by any expense limitation arrangements between the Fund and the investment adviser.
The Fund allocates income and realized and unrealized capital gains and losses to a class based on the relative net assets of each class.
| C. | Country Determination – For the purposes of making investment selection decisions and presentation in the Schedule of Investments, the investment adviser may determine the country in which an issuer is located and/or credit risk exposure based on various factors. These factors include the laws of the country under which the issuer is organized, where the issuer maintains a principal office, the country in which the issuer derives 50% or more of its total revenues and the country that has the primary market for the issuer’s securities, as well as other criteria. Among the other criteria that may be evaluated for making this determination are the country in which the issuer maintains 50% or more of its assets, the type of security, financial guarantees and enhancements, the nature of the collateral and the sponsor organization. Country of issuer and/or credit risk exposure has been determined to be the United States of America, unless otherwise noted. |
| D. | Distributions– Distributions from net investment income and net realized capital gain, if any, are generally declared and paid annually and recorded on the ex-dividend date. The Fund may elect to treat a portion of the proceeds from redemptions as distributions for federal income tax purposes. |
| E. | Federal Income Taxes – The Fund intends to comply with the requirements of Subchapter M of the Internal Revenue Code of 1986, as amended (the “Internal Revenue Code”), necessary to qualify as a regulated investment company and to distribute substantially all of the Fund’s taxable earnings to shareholders. As such, the Fund will not be subject to federal income taxes on otherwise taxable income (including net realized capital gain) that is distributed to shareholders. Therefore, no provision for federal income taxes is recorded in the financial statements. |
The Fund recognizes the tax benefits of uncertain tax positions only when the position is more likely than not to be sustained. Management has analyzed the Fund’s uncertain tax positions and concluded that no liability for unrecognized tax benefits should be recorded related to uncertain tax positions. Management is not aware of any tax positions for which it is reasonably possible that the total amounts of unrecognized tax benefits will change materially in the next 12 months.
The Fund files tax returns in the U.S. Federal jurisdiction and certain other jurisdictions. Generally, the Fund is subject to examinations by such taxing authorities for up to three years after the filing of the return for the tax period.
| F. | Expenses – Fees provided for under the Rule 12b-1 plan of a particular class of the Fund are charged to the operations of such class. Transfer agency fees and expenses and other shareholder recordkeeping fees and expenses attributable to Class R6 are charged to such class. Transfer agency fees and expenses and other shareholder recordkeeping fees and expenses relating to all other classes are allocated among those classes based on relative net assets. All other expenses are allocated among the classes based on relative net assets. |
| G. | Accounting Estimates – The preparation of financial statements in conformity with accounting principles generally accepted in the United States of America (“GAAP”) requires management to make estimates and assumptions that affect the reported amounts of assets and liabilities at the date of the financial statements and the reported amounts of revenues and expenses during the reporting period including estimates and assumptions related to taxation. Actual results could differ from those estimates by a significant amount. In addition, the Fund monitors for material events or transactions that may occur or become known after the period-end date and before the date the financial statements are released to print. |
| H. | Indemnifications – Under the Trust’s organizational documents, each Trustee, officer, employee or other agent of the Trust is indemnified against certain liabilities that may arise out of the performance of their duties to the Fund. Additionally, in the normal course of business, the Fund enters into contracts, including the Fund’s servicing agreements, that contain a variety of indemnification clauses. The Fund’s maximum exposure under these arrangements is unknown as this would involve future claims that may be made against the Fund that have not yet occurred. The risk of material loss as a result of such indemnification claims is considered remote. |
| I. | Foreign Currency Translations – Foreign currency is valued at the close of the NYSE based on quotations posted by banks and major currency dealers. Portfolio securities and other assets and liabilities denominated in foreign currencies are translated into U.S. dollar amounts at the date of valuation. Purchases and sales of portfolio securities (net of foreign taxes withheld on disposition) and income items denominated in foreign currencies are translated into U.S. dollar amounts on the respective dates of such transactions. The Fund does not separately account for the portion of the results of operations resulting from changes in foreign exchange rates on investments and the fluctuations arising from changes in market prices of securities held. The combined results of changes in foreign exchange rates and the fluctuation of market prices on investments (net of estimated foreign tax withholding) are included with the net realized and unrealized gain or loss from investments in the Statement of Operations. Reported net realized foreign currency gains or losses arise from (1) sales of foreign currencies, (2) currency gains or losses realized between the trade and settlement dates on securities transactions, and (3) the difference between the amounts of dividends, interest, and foreign withholding taxes recorded on the Fund’s books and the U.S. dollar equivalent of the amounts actually received or paid. Net unrealized foreign currency gains and losses arise from changes in the fair values of assets and liabilities, other than investments in securities at fiscal period end, resulting from changes in exchange rates. |
| 17 | Invesco Small Cap Value Fund |
The Fund may invest in foreign securities, which may be subject to foreign taxes on income, gains on investments or currency repatriation, a portion of which may be recoverable. Foreign taxes, if any, are recorded based on the tax regulations and rates that exist in the foreign markets in which the Fund invests and are shown in the Statement of Operations.
| J. | Forward Foreign Currency Contracts – The Fund may engage in foreign currency transactions either on a spot (i.e. for prompt delivery and settlement) basis, or through forward foreign currency contracts, to manage or minimize currency or exchange rate risk. |
The Fund may also enter into forward foreign currency contracts for the purchase or sale of a security denominated in a foreign currency in order to “lock in” the U.S. dollar price of that security, or the Fund may also enter into forward foreign currency contracts that do not provide for physical settlement of the two currencies, but instead are settled by a single cash payment calculated as the difference between the agreed upon exchange rate and the spot rate at settlement based upon an agreed upon notional amount (non-deliverable forwards). The Fund will set aside liquid assets in an amount equal to the daily mark-to-market obligation for forward foreign currency contracts.
A forward foreign currency contract is an obligation between two parties (“Counterparties”) to purchase or sell a specific currency for an agreed-upon price at a future date. The use of forward foreign currency contracts does not eliminate fluctuations in the price of the underlying securities the Fund owns or intends to acquire but establishes a rate of exchange in advance. Fluctuations in the value of these contracts are measured by the difference in the contract date and reporting date exchange rates and are recorded as unrealized appreciation (depreciation) until the contracts are closed. When the contracts are closed, realized gains (losses) are recorded. Realized and unrealized gains (losses) on the contracts are included in the Statement of Operations. The primary risks associated with forward foreign currency contracts include failure of the Counterparty to meet the terms of the contract and the value of the foreign currency changing unfavorably. These risks may be in excess of the amounts reflected in the Statement of Assets and Liabilities.
NOTE 2—Advisory Fees and Other Fees Paid to Affiliates
The Trust has entered into a master investment advisory agreement with Invesco Advisers, Inc. (the "Adviser" or "Invesco"). Under the terms of the investment advisory agreement, the Fund accrues daily and pays monthly an advisory fee to the Adviser based on the annual rate of the Fund’s average daily net assets as follows:
| Average Daily Net Assets | Rate |
| First $500 million | 0.67% |
| Next $500 million | 0.645% |
| Over $1 billion | 0.62% |
For the year ended April 30, 2019, the effective advisory fees incurred by the Fund was 0.64%.
Under the terms of a master sub-advisory agreement between the Adviser and each of Invesco Asset Management Deutschland GmbH, Invesco Asset Management Limited, Invesco Asset Management (Japan) Limited, Invesco Hong Kong Limited, Invesco Senior Secured Management, Inc. and Invesco Canada Ltd. (collectively, the "Affiliated Sub-Advisers") the Adviser, not the Fund, will pay 40% of the fees paid to the Adviser to any such Affiliated Sub-Adviser(s) that provide(s) discretionary investment management services to the Fund based on the percentage of assets allocated to such Affiliated Sub-Adviser(s).
The Adviser has contractually agreed, through at least June 30, 2020, to waive advisory fees and/or reimburse expenses of all shares to the extent necessary to limit total annual fund operating expenses after fee waivers and/or expense reimbursements (excluding certain items discussed below) of Class A, Class C, Class Y and Class R6 shares to 2.00%, 2.75%, 1.75% and 1.75%, respectively, of average daily net assets (the “expense limits”). In determining the Adviser’s obligation to waive advisory fees and/or reimburse expenses, the following expenses are not taken into account, and could cause the total annual fund operating expenses after fee waiver and/or expense reimbursement to exceed the numbers reflected above: (1) interest; (2) taxes; (3) dividend expense on short sales; (4) extraordinary or non-routine items, including litigation expenses; and (5) expenses that the Fund has incurred but did not actually pay because of an expense offset arrangement. Unless Invesco continues the fee waiver agreement, it will terminate on June 30, 2020. During its term, the fee waiver agreement cannot be terminated or amended to increase the expense limits or reduce the advisory fee waiver without approval of the Board of Trustees. The Adviser did not waive fees and/or reimburse expenses during the period under these expense limits.
Further, the Adviser has contractually agreed, through at least June 30, 2021, to waive the advisory fee payable by the Fund in an amount equal to 100% of the net advisory fees the Adviser receives from the affiliated money market funds on investments by the Fund of uninvested cash in such affiliated money market funds.
For the year ended April 30, 2019, the Adviser waived advisory fees of $58,203.
The Trust has entered into a master administrative services agreement with Invesco pursuant to which the Fund has agreed to pay Invesco for certain administrative costs incurred in providing accounting services to the Fund. For the year ended April 30, 2019, expenses incurred under the agreement are shown in the Statement of Operations asAdministrative services fees. Also, Invesco has entered into a sub-administration agreement whereby State Street Bank and Trust Company (“SSB”) serves as custodian and fund accountant and provides certain administrative services to the Fund.
The Trust has entered into a transfer agency and service agreement with Invesco Investment Services, Inc. (“IIS”) pursuant to which the Fund has agreed to pay IIS a fee for providing transfer agency and shareholder services to the Fund and reimburse IIS for certain expenses incurred by IIS in the course of providing such services. IIS may make payments to intermediaries that provide omnibus account services, sub-accounting services and/or networking services. All fees payable by IIS to intermediaries that provide omnibus account services or sub-accounting services are charged back to the Fund, subject to certain limitations approved by the Trust’s Board of Trustees. For the year ended April 30, 2019, expenses incurred under the agreement are shown in the Statement of Operations asTransfer agent fees.
Shares of the Fund are distributed by Invesco Distributors, Inc. (“IDI”). The Fund has adopted a distribution plan pursuant to Rule 12b-1 under the 1940 Act, and a service plan (collectively, the “Plans”) for Class A shares and Class C shares to compensate IDI for the sale, distribution, shareholder servicing and maintenance of shareholder accounts for these shares. Under the Plans, the Fund will incur annual fees of up to 0.25% of Class A average daily net assets and up to 1.00% of Class C average daily net assets. The fees are accrued daily and paid monthly.
| 18 | Invesco Small Cap Value Fund |
With respect to Class C shares, the Fund is authorized to reimburse in future years any distribution related expenses that exceed the maximum annual reimbursement rate for such class, so long as such reimbursement does not cause the Fund to exceed the Class C maximum annual reimbursement rate, respectively. With respect to Class A shares, distribution related expenses that exceed the maximum annual reimbursement rate for such class are not carried forward to future years and the Fund will not reimburse IDI for any such expenses.
For the year ended April 30, 2019, expenses incurred under these agreements are shown in the Statement of Operations asDistribution fees.
Front-end sales commissions and CDSC (collectively, the “sales charges”) are not recorded as expenses of the Fund. Front-end sales commissions are deducted from proceeds from the sales of Fund shares prior to investment in Class A shares of the Fund. CDSC are deducted from redemption proceeds prior to remittance to the shareholder. During the year ended April 30, 2019, IDI advised the Fund that IDI retained $22,088 in front-end sales commissions from the sale of Class A shares and $153 and $1,195 from Class A and Class C shares, respectively, for CDSC imposed upon redemptions by shareholders.
For the year ended April 30, 2019, the Fund incurred $37,906 in brokerage commissions with Invesco Capital Markets, Inc., an affiliate of the Adviser and IDI, for portfolio transactions executed on behalf of the Fund.
Certain officers and trustees of the Trust are officers and directors of the Adviser, IIS and/or IDI.
NOTE 3—Additional Valuation Information
GAAP defines fair value as the price that would be received to sell an asset or paid to transfer a liability in an orderly transaction between market participants at the measurement date, under current market conditions. GAAP establishes a hierarchy that prioritizes the inputs to valuation methods, giving the highest priority to readily available unadjusted quoted prices in an active market for identical assets (Level 1) and the lowest priority to significant unobservable inputs (Level 3), generally when market prices are not readily available or are unreliable. Based on the valuation inputs, the securities or other investments are tiered into one of three levels. Changes in valuation methods may result in transfers in or out of an investment’s assigned level:
Level 1 – Prices are determined using quoted prices in an active market for identical assets.
Level 2 – Prices are determined using other significant observable inputs. Observable inputs are inputs that other market participants may use in pricing a security. These may include quoted prices for similar securities, interest rates, prepayment speeds, credit risk, yield curves, loss severities, default rates, discount rates, volatilities and others.
Level 3 – Prices are determined using significant unobservable inputs. In situations where quoted prices or observable inputs are unavailable (for example, when there is little or no market activity for an investment at the end of the period), unobservable inputs may be used. Unobservable inputs reflect the Fund’s own assumptions about the factors market participants would use in determining fair value of the securities or instruments and would be based on the best available information.
The following is a summary of the tiered valuation input levels, as of April 30, 2019. The level assigned to the securities valuations may not be an indication of the risk or liquidity associated with investing in those securities. Because of the inherent uncertainties of valuation, the values reflected in the financial statements may materially differ from the value received upon actual sale of those investments.
| | Level 1 | Level 2 | Level 3 | Total |
| Investments in Securities | | | | |
| Common Stocks & Other Equity Interests | $1,557,604,018 | $— | $0 | $1,557,604,018 |
| Money Market Funds | 27,198,208 | — | — | 27,198,208 |
| Total Investments | $1,584,802,226 | $— | $0 | $1,584,802,226 |
NOTE 4—Investments in Other Affiliates
The 1940 Act defines an “affiliated person” as an issuance in which a fund holds 5% or more of the outstanding voting securities. The Fund has not owned enough of the outstanding voting securities of the issuer to have control (as defined in the 1940 Act) of that issuer. The following is a summary of the investments in other affiliates (excluding affiliated money market funds) for the year ended April 30, 2019.
| | Value
04/30/18 | Purchases
at Cost | Proceeds
from Sales | Change in
Unrealized
Appreciation
(Depreciation) | Realized
Gain (Loss) | Value
04/30/19 | Dividend
Income |
| American Outdoor Brands Corp.(a) | $50,368,989 | $— | $(52,106,249) | $28,875,335 | $(27,138,075) | $— | $— |
| Hanger, Inc.(a) | 86,435,164 | — | (84,640,824) | 14,271,766 | (9,232,813) | 6,833,293 | — |
| Kforce Inc.(a) | 40,313,255 | — | (53,452,828) | (10,710,294) | 23,849,867 | — | 94,019 |
MDC Partners Inc.–
Class A(a) | 34,336,486 | — | (12,945,904) | 54,212,360 | (75,602,942) | — | — |
| Total | $211,453,894 | $— | $(203,145,805) | $86,649,167 | $(88,123,963) | $6,833,293 | $94,019 |
| (a)As of April 30, 2019, this security is no longer considered as an affiliate of the Fund. | |
NOTE 5—Expense Offset Arrangement(s)
The expense offset arrangement is comprised of transfer agency credits which result from balances in demand deposit accounts used by the transfer agent for clearing shareholder transactions. For the year ended April 30, 2019, the Fund received credits from this arrangement, which resulted in the reduction of the Fund’s total expenses of $3,107.
| 19 | Invesco Small Cap Value Fund |
NOTE 6—Trustees’ and Officers’ Fees and Benefits
Trustees’ and Officers’ Fees and Benefits include amounts accrued by the Fund to pay remuneration to certain Trustees and Officers of the Fund. Trustees have the option to defer compensation payable by the Fund, and Trustees’ and Officers’ Fees and Benefits also include amounts accrued by the Fund to fund such deferred compensation amounts. Those Trustees who defer compensation have the option to select various Invesco Funds in which their deferral accounts shall be deemed to be invested. Finally, certain current Trustees were eligible to participate in a retirement plan that provided for benefits to be paid upon retirement to Trustees over a period of time based on the number of years of service. The Fund may have certain former Trustees who also participate in a retirement plan and receive benefits under such plan.Trustees’ and Officers’ Fees and Benefits include amounts accrued by the Fund to fund such retirement benefits. Obligations under the deferred compensation and retirement plans represent unsecured claims against the general assets of the Fund.
NOTE 7—Cash Balances
The Fund is permitted to temporarily carry a negative or overdrawn balance in its account with SSB, the custodian bank. Such balances, if any at period-end, are shown in the Statement of Assets and Liabilities under the payable captionAmount due custodian. To compensate the custodian bank for such overdrafts, the overdrawn Fund may either (1) leave funds as a compensating balance in the account so the custodian bank can be compensated by earning the additional interest; or (2) compensate by paying the custodian bank at a rate agreed upon by the custodian bank and Invesco, not to exceed the contractually agreed upon rate.
NOTE 8—Distributions to Shareholders and Tax Components of Net Assets
| Tax Character of Distributions to Shareholders Paid During the Fiscal Years Ended April 30, 2019 and 2018 |
| | 2019 | 2018 |
| Ordinary income | $22,332,893 | $17,009,297 |
| Long-term capital gain | 309,839,278 | 363,609,319 |
| Total distributions | $332,172,171 | $380,618,616 |
| Tax Components of Net Assets at Period-End: |
| | 2019 |
| Net unrealized appreciation — investments | 86,228,879 |
| Temporary book/tax differences | (249,596) |
| Late-Year ordinary loss deferral | (422,312) |
| Post-October capital loss deferral | (3,443,159) |
| Shares of beneficial interest | 1,543,344,971 |
| Total net assets | $1,625,458,783 |
The difference between book-basis and tax-basis unrealized appreciation (depreciation) is due to differences in the timing of recognition of gains and losses on investments for tax and book purposes. The Fund’s net unrealized appreciation (depreciation) difference is attributable primarily to wash sales.
The temporary book/tax differences are a result of timing differences between book and tax recognition of income and/or expenses. The Fund’s temporary book/tax differences are the result of the trustee deferral of compensation and retirement plan benefits.
Capital loss carryforward is calculated and reported as of a specific date. Results of transactions and other activity after that date may affect the amount of capital loss carryforward actually available for the Fund to utilize. Capital losses generated in years beginning after December 22, 2010 can be carried forward for an unlimited period, whereas previous losses expire in eight tax years. Capital losses with an expiration period may not be used to offset capital gains until all net capital losses without an expiration date have been utilized. Capital loss carryforwards with no expiration date will retain their character as either short-term or long-term capital losses instead of as short-term capital losses as under prior law. The ability to utilize capital loss carryforwards in the future may be limited under the Internal Revenue Code and related regulations based on the results of future transactions.
The Fund does not have a capital loss carryforward as of April 30, 2019.
NOTE 9—Investment Transactions
The aggregate amount of investment securities (other than short-term securities, U.S. Treasury obligations and money market funds, if any) purchased and sold by the Fund during the year ended April 30, 2019 was $840,834,992 and $1,553,916,239, respectively. Cost of investments, including any derivatives, on a tax basis includes the adjustments for financial reporting purposes as of the most recently completed federal income tax reporting period-end.
| Unrealized Appreciation (Depreciation) of Investments on a Tax Basis |
| Aggregate unrealized appreciation of investments | $243,694,381 |
| Aggregate unrealized (depreciation) of investments | (157,465,502) |
| Net unrealized appreciation of investments | $86,228,879 |
Cost of investments for tax purposes is $1,498,573,347.
| 20 | Invesco Small Cap Value Fund |
NOTE 10—Reclassification of Permanent Differences
Primarily as a result of differing book/tax treatment of net operating loss, on April 30, 2019, undistributed net investment income (loss) was increased by $1,371,746, undistributed net realized gain (loss) was decreased by $1,363,370 and shares of beneficial interest was decreased by $8,376. This reclassification had no effect on the net assets of the Fund.
| 21 | Invesco Small Cap Value Fund |
NOTE 11—Share Information
| | Summary of Share Activity |
| | Years ended April 30, |
| | 2019(a) | | 2018 |
| | Shares | Amount | | Shares | Amount |
| Sold: | | | | | |
| Class A | 6,438,723 | $99,781,448 | | 5,655,726 | $111,022,084 |
| Class B(b) | — | — | | 1,336 | 21,013 |
| Class C | 291,115 | 2,707,631 | | 128,619 | 1,889,774 |
| Class Y | 12,975,591 | 209,325,329 | | 14,502,085 | 296,417,165 |
| Class R6 | 4,523,594 | 75,108,753 | | 1,394,417 | 29,058,635 |
| Issued as reinvestment of dividends: | | | | | |
| Class A | 10,919,128 | 126,771,080 | | 7,772,737 | 146,205,191 |
| Class B(b) | — | — | | 69,697 | 988,298 |
| Class C | 1,808,563 | 13,347,193 | | 1,170,766 | 15,840,462 |
| Class Y | 12,834,262 | 157,989,771 | | 9,501,911 | 186,712,559 |
| Class R6 | 601,408 | 7,433,399 | | 127,944 | 2,517,937 |
| Conversion of Class B shares to Class A shares:(c) | | | | | |
| Class A | — | — | | 247,221 | 5,018,579 |
| Class B | — | — | | (327,676) | (5,018,579) |
| Automatic conversion of Class C shares to Class A shares: | | | | | |
| Class A | 2,045,445 | 26,511,273 | | - | - |
| Class C | (3,220,634) | (26,511,273) | | - | - |
| Reacquired: | | | | | |
| Class A | (22,831,931) | (354,638,694) | | (19,555,087) | (384,885,739) |
| Class B(b) | — | — | | (272,949) | (4,231,213) |
| Class C | (2,151,563) | (23,563,125) | | (2,021,757) | (29,396,455) |
| Class Y | (39,393,058) | (643,740,372) | | (23,562,698) | (479,636,253) |
| Class R6 | (2,151,890) | (32,769,254) | | (164,477) | (3,280,019) |
| Net increase (decrease) in share activity | (17,311,247) | $(362,246,841) | | (5,332,185) | $(110,756,561) |
| (a) | There are entities that are record owners of more than 5% of the outstanding shares of the Fund and in the aggregate own 28% of the outstanding shares of the Fund. IDI has an agreement with these entities to sell Fund shares. The Fund, Invesco and/or Invesco affiliates may make payments to these entities, which are considered to be related to the Fund, for providing services to the Fund, Invesco and/or Invesco affiliates including but not limited to services such as securities brokerage, distribution, third party record keeping and account servicing. The Fund has no knowledge as to whether all or any portion of the shares owned of record by these entities are also owned beneficially. |
| (b) | Class B shares activity for the period May 1, 2017 through January 26, 2018 (date of conversion). |
| (c) | Effective as of the close of business on January 26, 2018, all outstanding Class B shares were converted to Class A shares. |
| 22 | Invesco Small Cap Value Fund |
Report of Independent Registered Public Accounting Firm
To the Board of Trustees of AIM Sector Funds (Invesco Sector Funds) and Shareholders of Invesco Small Cap Value Fund:
Opinion on the Financial Statements
We have audited the accompanying statement of assets and liabilities, including the schedule of investments, of Invesco Small Cap Value Fund (one of the funds constituting AIM Sector Funds (Invesco Sector Funds), hereafter referred to as the “Fund”) as of April 30, 2019, the related statement of operations for the year ended April 30, 2019, the statement of changes in net assets for each of the two years in the period ended April 30, 2019, including the related notes, and the financial highlights for each of the periods indicated therein (collectively referred to as the “financial statements”). In our opinion, the financial statements present fairly, in all material respects, the financial position of the Fund as of April 30, 2019, the results of its operations for the year then ended, the changes in its net assets for each of the two years in the period ended April 30, 2019 and the financial highlights for each of the periods indicated therein in conformity with accounting principles generally accepted in the United States of America.
Basis for Opinion
These financial statements are the responsibility of the Fund’s management. Our responsibility is to express an opinion on the Fund’s financial statements based on our audits. We are a public accounting firm registered with the Public Company Accounting Oversight Board (United States) (“PCAOB”) and are required to be independent with respect to the Fund in accordance with the U.S. federal securities laws and the applicable rules and regulations of the Securities and Exchange Commission and the PCAOB.
We conducted our audits of these financial statements in accordance with the standards of the PCAOB. Those standards require that we plan and perform the audit to obtain reasonable assurance about whether the financial statements are free of material misstatement, whether due to error or fraud.
Our audits included performing procedures to assess the risks of material misstatement of the financial statements, whether due to error or fraud, and performing procedures that respond to those risks. Such procedures included examining, on a test basis, evidence regarding the amounts and disclosures in the financial statements. Our audits also included evaluating the accounting principles used and significant estimates made by management, as well as evaluating the overall presentation of the financial statements. Our procedures included confirmation of securities owned as of April 30, 2019 by correspondence with the custodian and transfer agent. We believe that our audits provide a reasonable basis for our opinion.
PricewaterhouseCoopers LLP
Houston, TX
June 26, 2019
We have served as the auditor of one or more of the investment companies in the Invesco group of investment companies since at least 1995. We have not been able to determine the specific year we began serving as auditor.
| 23 | Invesco Small Cap Value Fund |
Calculating your ongoing Fund expenses
Example
As a shareholder of the Fund, you incur two types of costs: (1) transaction costs, which may include sales charges (loads) on purchase payments or contingent deferred sales charges on redemptions, if any; and (2) ongoing costs, including management fees, distribution and/or service (12b-1) fees, and other Fund expenses. This example is intended to help you understand your ongoing costs (in dollars) of investing in the Fund and to compare these costs with ongoing costs of investing in other mutual funds. The example is based on an investment of $1,000 invested at the beginning of the period and held for the entire period November 1, 2018 through April 30, 2019.
Actual expenses
The table below provides information about actual account values and actual expenses. You may use the information in this table, together with the amount you invested, to estimate the expenses that you paid over the period. Simply divide your account value by $1,000 (for example, an $8,600 account value divided by $1,000 = 8.6), then multiply the result by the number in the table under the heading entitled “Actual Expenses Paid During Period” to estimate the expenses you paid on your account during this period.
Hypothetical example for comparison purposes
The table below also provides information about hypothetical account values and hypothetical expenses based on the Fund’s actual expense ratio and an assumed rate of return of 5% per year before expenses, which is not the Fund’s actual return.
The hypothetical account values and expenses may not be used to estimate the actual ending account balance or expenses you paid for the period. You may use this information to compare the ongoing costs of investing in the Fund and other funds. To do so, compare this 5% hypothetical example with the 5% hypothetical examples that appear in the shareholder reports of the other funds.
Please note that the expenses shown in the table are meant to highlight your ongoing costs only and do not reflect any transaction costs, such as sales charges (loads) on purchase payments or contingent deferred sales charges on redemptions, if any. Therefore, the hypothetical information is useful in comparing ongoing costs only, and will not help you determine the relative total costs of owning different funds. In addition, if these transaction costs were included, your costs would have been higher.
| | Beginning
Account Value (11/01/18) | ACTUAL | HYPOTHETICAL
(5% annual return before
expenses) | Annualized
Expense
Ratio |
Ending
Account Value
(04/30/19)1 | Expenses
Paid During
Period2 | Ending
Account Value
(04/30/19) | Expenses
Paid During
Period2 |
| Class A | $1,000.00 | $1,090.90 | $5.91 | $1,019.14 | $5.71 | 1.14% |
| Class C | 1,000.00 | 1,086.00 | 9.88 | 1,015.32 | 9.54 | 1.91 |
| Class Y | 1,000.00 | 1,091.50 | 4.62 | 1,020.38 | 4.46 | 0.89 |
| Class R6 | 1,000.00 | 1,092.50 | 3.63 | 1,021.32 | 3.51 | 0.70 |
| 1 | The actual ending account value is based on the actual total return of the Fund for the period November 1, 2018 through April 30, 2019, after actual expenses and will differ from the hypothetical ending account value which is based on the Fund’s expense ratio and a hypothetical annual return of 5% before expenses. |
| 2 | Expenses are equal to the Fund’s annualized expense ratio as indicated above multiplied by the average account value over the period, multiplied by 181/365 to reflect the most recent fiscal half year. |
| 24 | Invesco Small Cap Value Fund |
Tax Information
Form 1099-DIV, Form 1042-S and other year–end tax information provide shareholders with actual calendar year amounts that should be included in their tax returns. Shareholders should consult their tax advisers.
The following distribution information is being provided as required by the Internal Revenue Code or to meet a specific state’s requirement.
The Fund designates the following amounts or, if subsequently determined to be different, the maximum amount allowable for its fiscal year ended April 30, 2019:
| Federal and State Income Tax | |
| Long-Term Capital Gain Distributions | $309,839,278 |
| Qualified Dividend Income* | 67.83% |
| Corporate Dividends Received Deduction* | 67.84% |
| U.S. Treasury Obligations* | 0.00% |
| * | The above percentages are based on ordinary income dividends paid to shareholders during the Fund’s fiscal year. |
| | |
| Non-Resident Alien Shareholders | |
| Qualified Short-Term Gains | $22,332,893 |
| 25 | Invesco Small Cap Value Fund |
Trustees and Officers
The address of each trustee and officer is AIM Sector Funds (Invesco Sector Funds) (the “Trust”), 11 Greenway Plaza, Suite 1000, Houston, Texas 77046-1173. The trustees serve for the life of the Trust, subject to their earlier death, incapacitation, resignation, retirement or removal as more specifically provided in the Trust’s organizational documents. Each officer serves for a one year term or until their successors are elected and qualified. Column two below includes length of time served with predecessor entities, if any.
| | | | | | | | |
Name, Year of Birth and
Position(s) Held with the Trust | | Trustee and/
or Officer Since | | Principal Occupation(s)
During Past 5 Years | | Number of Funds in Fund
Complex
Overseen by
Trustee | | Other Directorship(s)
Held by Trustee During
Past 5 Years |
| Interested Persons | | | | | | | | |
Martin L. Flanagan1 — 1960 Trustee and Vice Chair | | 2007 | | Executive Director, Chief Executive Officer and President, Invesco Ltd. (ultimate parent of Invesco and a global investment management firm); Trustee and Vice Chair, The Invesco Funds; Vice Chair, Investment Company Institute; and Member of Executive Board, SMU Cox School of Business Formerly: Advisor to the Board, Invesco Advisers, Inc. (formerly known as Invesco Institutional (N.A.), Inc.); Chairman and Chief Executive Officer, Invesco Advisers, Inc. (registered investment adviser); Director, Chairman, Chief Executive Officer and President, Invesco Holding Company (US), Inc. (formerly IVZ Inc.) (holding company), Invesco Group Services, Inc. (service provider) and Invesco North American Holdings, Inc. (holding company); Director, Chief Executive Officer and President, Invesco Holding Company Limited (parent of Invesco and a global investment management firm); Director, Invesco Ltd.; Chairman, Investment Company Institute and President,Co-Chief Executive Officer,Co-President, Chief Operating Officer and Chief Financial Officer, Franklin Resources, Inc. (global investment management organization) | | 241 | | None |
Philip A. Taylor2 — 1954 Trustee | | 2006 | | Vice Chair, Invesco Ltd.; Director, Invesco Canada Ltd. (formerly known as Invesco Trimark Ltd./Invesco Trimark Ltèe) (registered investment adviser and registered transfer agent); Trustee, The Invesco Funds Formerly: Head of the Americas and Senior Managing Director, Invesco Ltd.; Director, Invesco Advisers, Inc. (formerly known as Invesco Institutional (N.A.), Inc.) (registered investment adviser); Director and Chairman, Invesco Investment Services, Inc. (formerly known as Invesco AIM Investment Services, Inc.) (registered transfer agent); Chief Executive Officer, Invesco Corporate Class Inc. (corporate mutual fund company); Chairman and Chief Executive Officer, Invesco Canada Ltd. (formerly known as Invesco Trimark Ltd./Invesco Trimark Ltèe) (registered investment adviser and registered transfer agent); Senior Vice President, The Invesco Funds; Director, Invesco Investment Advisers LLC (formerly known as Van Kampen Asset Management); Director, Chairman, Chief Executive Officer and President, Invesco Management Group, Inc. (formerly known as Invesco AIM Management Group, Inc.) (financial services holding company);Co-Chairman,Co-President andCo-Chief Executive Officer, Invesco Advisers, Inc. (formerly known as Invesco Institutional (N.A.), Inc.) (registered investment adviser); Director, Chief Executive Officer and President, Van Kampen Exchange Corp; President and Principal Executive Officer, The Invesco Funds (other than AIM Treasurer’s Series Trust (Invesco Treasurer’s Series Trust), Short-Term Investments Trust and Invesco Management Trust); Executive Vice President, The Invesco Funds (AIM Treasurer’s Series Trust (Invesco Treasurer’s Series Trust), Short-Term Investments Trust and Invesco Management Trust only); Director and President, INVESCO Funds Group, Inc. (registered investment adviser and registered transfer agent); Director and Chairman, IVZ Distributors, Inc. (formerly known as INVESCO Distributors, Inc.) (registered broker dealer); Director, President and Chairman, Invesco Inc. (holding company), Invesco Canada Holdings Inc. (holding company), Trimark Investments Ltd./Placements Trimark Ltèe and Invesco Financial Services Ltd/Services Financiers Invesco Ltèe; Chief Executive Officer, Invesco Canada Fund Inc. (corporate mutual fund company); Director and Chairman, Van Kampen Investor Services Inc.; Director, Chief Executive Officer and President, 1371 Preferred Inc. (holding company) and Van Kampen Investments Inc.; Director and President, AIM GP Canada Inc. (general partner for limited partnerships) and Van Kampen Advisors, Inc.; Director and Chief Executive Officer, Invesco Trimark Dealer Inc. (registered broker dealer); Director, Invesco Distributors, Inc. (formerly known as Invesco AIM Distributors, Inc.) (registered broker dealer); Manager, Invesco Capital Management LLC; Director, Chief Executive Officer and President, Invesco Advisers, Inc.; Director, Chairman, Chief Executive Officer and President, Invesco AIM Capital Management, Inc.; President, Invesco Trimark Dealer Inc. and Invesco Trimark Ltd./Invesco Trimark Ltèe; Director and President, AIM Trimark Corporate Class Inc. and AIM Trimark Canada Fund Inc.; Senior Managing Director, Invesco Holding Company Limited; Director and Chairman, Fund Management Company (former registered broker dealer); President and Principal Executive Officer, The Invesco Funds (AIM Treasurer’s Series Trust (Invesco Treasurer’s Series Trust), and Short-Term Investments Trust only); President, AIM Trimark Global Fund Inc. and AIM Trimark Canada Fund Inc. | | 241 | | None |
| 1 | Mr. Flanagan is considered an interested person (within the meaning of Section 2(a)(19) of the 1940 Act) of the Trust because he is an officer of the Adviser to the Trust, and an officer and a director of Invesco Ltd., ultimate parent of the Adviser. |
| 2 | Mr. Taylor is considered an interested person (within the meaning of Section 2(a)(19) of the 1940 Act) of the Trust because he is an officer of Invesco Ltd., ultimate parent of the Adviser. |
T-1 Invesco Small Cap Value Fund
Trustees and Officers—(continued)
| | | | | | | | |
Name, Year of Birth and
Position(s) Held with the Trust | | Trustee and/
or Officer Since | | Principal Occupation(s)
During Past 5 Years | | Number of Funds in Fund
Complex
Overseen by
Trustee | | Other Directorship(s)
Held by Trustee During
Past 5 Years |
| Independent Trustees | | | | | | | | |
Bruce L. Crockett — 1944 Trustee and Chair | | 2003 | | Chairman, Crockett Technologies Associates (technology consulting company) Formerly: Director, Captaris (unified messaging provider); Director, President and Chief Executive Officer, COMSAT Corporation; Chairman, Board of Governors of INTELSAT (international communications company); ACE Limited (insurance company); Independent Directors Council and Investment Company Institute: Member of the Audit Committee, Investment Company Institute; Member of the Executive Committee and Chair of the Governance Committee, Independent Directors Council | | 241 | | Director and Chairman of the Audit Committee, ALPS (Attorneys Liability Protection Society) (insurance company); Director and Member of the Audit Committee and Compensation Committee, Ferroglobe PLC (metallurgical company) |
David C. Arch — 1945 Trustee | | 2010 | | Chairman of Blistex Inc. (consumer health care products manufacturer); Member, World Presidents’ Organization | | 241 | | Board member of the Illinois Manufacturers’ Association |
Beth Ann Brown3 — 1968 Trustee | | 2019 | | Independent Consultant Formerly: Head of Intermediary Distribution, Managing Director, Strategic Relations, Managing Director, Head of National Accounts, Senior Vice President, National Account Manager and Senior Vice President, Key Account Manager, Columbia Management Investment Advisers LLC; Vice President, Key Account Manager, Liberty Funds Distributor, Inc.; and Trustee of certain Oppenheimer Funds | | 225 | | Director, Board of Directors of Caron Engineering Inc.; Advisor, Board of Advisors of Caron Engineering Inc.; President and Director, Acton Shapleigh Youth Conservation Corps (non -profit); and Vice President and Director of Grahamtastic Connection(non-profit) |
Jack M. Fields — 1952 Trustee | | 2003 | | Chief Executive Officer, Twenty First Century Group, Inc. (government affairs company); and Chairman, Discovery Learning Alliance(non-profit) Formerly: Owner and Chief Executive Officer, Dos Angeles Ranch L.P. (cattle, hunting, corporate entertainment); Director, Insperity, Inc. (formerly known as Administaff) (human resources provider); Chief Executive Officer, Texana Timber LP (sustainable forestry company); Director of Cross Timbers Quail Research Ranch(non-profit); and member of the U.S. House of Representatives | | 241 | | None |
Cynthia Hostetler — 1962 Trustee | | 2017 | | Non-Executive Director and Trustee of a number of public and private business corporations Formerly: Director, Aberdeen Investment Funds (4 portfolios); Head of Investment Funds and Private Equity, Overseas Private Investment Corporation; President, First Manhattan Bancorporation, Inc.; Attorney, Simpson Thacher & Bartlett LLP | | 241 | | Vulcan Materials Company (construction materials company); Trilinc Global Impact Fund; Genesee & Wyoming, Inc. (railroads); Artio Global Investment LLC (mutual fund complex); Edgen Group, Inc. (specialized energy and infrastructure products distributor); Investment Company Institute (professional organization); Independent Directors Council (professional organization) |
Eli Jones — 1961 Trustee | | 2016 | | Professor and Dean, Mays Business School — Texas A&M University Formerly: Professor and Dean, Walton College of Business, University of Arkansas and E.J. Ourso College of Business, Louisiana State University; Director, Arvest Bank | | 241 | | Insperity, Inc. (formerly known as Administaff) (human resources provider) |
Elizabeth Krentzman3 — 1959 Trustee | | 2019 | | Formerly: Principal and Chief Regulatory Advisor for Asset Management Services and U.S. Mutual Fund Leader of Deloitte & Touche LLP; General Counsel of the Investment Company Institute (trade association); National Director of the Investment Management Regulatory Consulting Practice, Principal, Director and Senior Manager of Deloitte & Touche LLP; Assistant Director of the Division of Investment Management — Office of Disclosure and Investment Adviser Regulation of the U.S. Securities and Exchange Commission and various positions with the Division of Investment Management — Office of Regulatory Policy of the U.S. Securities and Exchange Commission; Associate at Ropes & Gray LLP; Advisory Board Member of the Securities and Exchange Commission Historical Society; and Trustee of certain Oppenheimer Funds | | 225 | | Trustee of the University of Florida National Board Foundation and Audit Committee Member; Member of the Cartica Funds Board of Directors (private investment funds); Member of the University of Florida Law Center Association, Inc. Board of Trustees and Audit Committee Member |
Anthony J. LaCava, Jr. — 1956 Trustee | | 2019 | | Formerly: Director and Member of the Audit Committee, Blue Hills Bank (publicly traded financial institution) and Managing Partner, KPMG LLP | | 241 | | Blue Hills Bank; Chairman, Bentley University; Member, Business School Advisory Council; and Nominating Committee, KPMG LLP |
Prema Mathai-Davis — 1950 Trustee | | 2003 | | Retired Co-Owner & Partner of Quantalytics Research, LLC, (a FinTech Investment Research Platform for the Self-Directed Investor) | | 241 | | None |
| 3 | Mss. Brown and Krentzman and Messrs. Motley, Vandivort and Vaughn were appointed as Trustees of the Trust effective June 10, 2019. |
T-2 Invesco Small Cap Value Fund
Trustees and Officers—(continued)
| | | | | | | | |
Name, Year of Birth and
Position(s) Held with the Trust | | Trustee and/
or Officer Since | | Principal Occupation(s)
During Past 5 Years | | Number of Funds in Fund
Complex
Overseen by
Trustee | | Other Directorship(s)
Held by Trustee During
Past 5 Years |
| Independent Trustees—(continued) |
Joel W. Motley3 — 1952 Trustee | | 2019 | | Director of Office of Finance, Federal Home Loan Bank; Member of the Vestry of Trinity Wall Street; Managing Director of Carmona Motley Inc. (privately held financial advisor); Member of the Finance and Budget Committee of the Council on Foreign Relations, Member of the Investment Committee and Board of Human Rights Watch and Member of the Investment Committee and Board of Historic Hudson Valley(non-profit cultural organization) Formerly: Managing Director of Public Capital Advisors, LLC (privately held financial advisor); Managing Director of Carmona Motley Hoffman, Inc. (privately held financial advisor); Trustee of certain Oppenheimer Funds; and Director of Columbia Equity Financial Corp. (privately held financial advisor) | | 225 | | Director of Greenwall Foundation (bioethics research foundation); Member of Board and Investment Committee of The Greenwall Foundation; Director of Southern Africa Legal Services Foundation; Board Member and Investment Committee Member of Pulitzer Center for Crisis Reporting(non-profit journalism) |
Teresa M. Ressel — 1962 Trustee | | 2017 | | Non-executive director and trustee of a number of public and private business corporations Formerly: Chief Financial Officer, Olayan America, The Olayan Group (international investor/commercial/industrial); Chief Executive Officer, UBS Securities LLC; Group Chief Operating Officer, Americas, UBS AG; Assistant Secretary for Management & Budget and CFO, US Department of the Treasury | | 241 | | Atlantic Power Corporation (power generation company); ON Semiconductor Corp. (semiconductor supplier) |
Ann Barnett Stern — 1957 Trustee | | 2017 | | President and Chief Executive Officer, Houston Endowment Inc. (private philanthropic institution) Formerly: Executive Vice President and General Counsel, Texas Children’s Hospital; Attorney, Beck, Redden and Secrest, LLP; Business Law Instructor, University of St. Thomas; Attorney, Andrews & Kurth LLP | | 241 | | Federal Reserve Bank of Dallas |
Raymond Stickel, Jr. — 1944 Trustee | | 2005 | | Retired Formerly: Director, Mainstay VP Series Funds, Inc. (25 portfolios); Partner, Deloitte & Touche | | 241 | | None |
Robert C. Troccoli — 1949 Trustee | | 2016 | | Adjunct Professor, University of Denver — Daniels College of Business Formerly: Senior Partner, KPMG LLP | | 241 | | None |
Daniel S. Vandivort3 — 1954 Trustee | | 2019 | | Treasurer, Chairman of the Audit and Finance Committee, and Trustee, Board of Trustees, Huntington Disease Foundation of America; and President, Flyway Advisory Services LLC (consulting and property management) Formerly: Trustee and Governance Chair, of certain Oppenheimer Funds | | 225 | | Chairman and Lead Independent Director, Chairman of the Audit Committee, and Director, Board of Directors, Value Line Funds |
James D. Vaughn3 — 1945 Trustee | | 2019 | | Retired Formerly: Managing Partner, Deloitte & Touche LLP; Trustee and Chairman of the Audit Committee, Schroder Funds; Board Member, Mile High United Way, Boys and Girls Clubs, Boy Scouts, Colorado Business Committee for the Arts, Economic Club of Colorado and Metro Denver Network (economic development corporation); and Trustee of certain Oppenheimer Funds | | 225 | | Board member and Chairman of Audit Committee of AMG National Trust Bank; Trustee and Investment Committee member, University of South Dakota Foundation; Board member, Audit Committee Member and past Board Chair, Junior Achievement(non-profit) |
Christopher L. Wilson — 1957 Trustee and Vice Chair | | 2017 | | Non-executive director and trustee of a number of public and private business corporations Formerly: Director, TD Asset Management USA Inc. (mutual fund complex) (22 portfolios); Managing Partner, CT2, LLC (investing and consulting firm); President/Chief Executive Officer, Columbia Funds, Bank of America Corporation; President/Chief Executive Officer, CDC IXIS Asset Management Services, Inc.; Principal & Director of Operations, Scudder Funds, Scudder, Stevens & Clark, Inc.; Assistant Vice President, Fidelity Investments | | 241 | | ISO New England, Inc.(non-profit organization managing regional electricity market) |
| Other Officers | | | | | | | | |
Sheri Morris — 1964 President, Principal Executive Officer and Treasurer | | 2003 | | President, Principal Executive Officer and Treasurer, The Invesco Funds; Vice President, Invesco Advisers, Inc. (formerly known as Invesco Institutional (N.A.), Inc.) (registered investment adviser); and Vice President, Invesco Exchange-Traded Fund Trust, Invesco Exchange-Traded Fund Trust II, Invesco India Exchange-Traded Fund Trust, Invesco Actively Managed Exchange-Traded Fund Trust, Invesco Actively Managed Exchange-Traded Commodity Fund Trust and Invesco Exchange-Traded Self-Indexed Fund Trust Formerly: Vice President and Principal Financial Officer, The Invesco Funds; Vice President, Invesco AIM Advisers, Inc., Invesco AIM Capital Management, Inc. and Invesco AIM Private Asset Management, Inc.; Assistant Vice President and Assistant Treasurer, The Invesco Funds and Assistant Vice President, Invesco Advisers, Inc., Invesco AIM Capital Management, Inc. and Invesco AIM Private Asset Management, Inc.; and Treasurer, Invesco Exchange-Traded Fund Trust, Invesco Exchange-Traded Fund Trust II, Invesco India Exchange-Traded Fund Trust and Invesco Actively Managed Exchange-Traded Fund Trust | | N/A | | N/A |
Russell C. Burk — 1958 Senior Vice President and Senior Officer | | 2005 | | Senior Vice President and Senior Officer, The Invesco Funds | | N/A | | N/A |
| 3 | Mss. Brown and Krentzman and Messrs. Motley, Vandivort and Vaughn were appointed as Trustees of the Trust effective June 10, 2019. |
T-3 Invesco Small Cap Value Fund
Trustees and Officers—(continued)
| | | | | | | | |
Name, Year of Birth and
Position(s) Held with the Trust | | Trustee and/
or Officer Since | | Principal Occupation(s)
During Past 5 Years | | Number of Funds in Fund
Complex
Overseen by
Trustee | | Other Directorship(s)
Held by Trustee During
Past 5 Years |
| Other Officers—(continued) | | | | | | | | |
Jeffrey H. Kupor — 1968 Senior Vice President, Chief Legal Officer and Secretary | | 2018 | | Head of Legal of the Americas, Invesco Ltd.; Senior Vice President and Secretary, Invesco Advisers, Inc. (formerly known as Invesco Institutional (N.A.), Inc.) (registered investment adviser); Senior Vice President and Secretary, Invesco Distributors, Inc. (formerly known as Invesco AIM Distributors, Inc.); Vice President and Secretary, Invesco Investment Services, Inc. (formerly known as Invesco AIM Investment Services, Inc.) Senior Vice President, Chief Legal Officer and Secretary, The Invesco Funds; Secretary and General Counsel, Invesco Investment Advisers LLC (formerly known as Van Kampen Asset Management); Secretary and General Counsel, Invesco Capital Markets, Inc. (formerly known as Van Kampen Funds Inc.) and Chief Legal Officer, Invesco Exchange-Traded Fund Trust, Invesco Exchange-Traded Fund Trust II, Invesco India Exchange-Traded Fund Trust, Invesco Actively Managed Exchange-Traded Fund Trust, Invesco Actively Managed Exchange-Traded Commodity Fund Trust and Invesco Exchange-Traded Self-Indexed Fund Trust; Secretary, Invesco Indexing LLC; Secretary, W.L. Ross & Co., LLC; Secretary and Vice President, Jemstep, Inc. Formerly: Head of Legal, Worldwide Institutional, Invesco Ltd.; Secretary and General Counsel, INVESCO Private Capital Investments, Inc.; Senior Vice President, Secretary and General Counsel, Invesco Management Group, Inc. (formerly known as Invesco AIM Management Group, Inc.); Assistant Secretary, INVESCO Asset Management (Bermuda) Ltd.; Secretary and General Counsel, Invesco Private Capital, Inc.; Assistant Secretary and General Counsel, INVESCO Realty, Inc.; Secretary and General Counsel, Invesco Senior Secured Management, Inc.; and Secretary, Sovereign G./P. Holdings Inc. | | N/A | | N/A |
Andrew R. Schlossberg — 1974 Senior Vice President | | 2019 | | Head of the Americas and Senior Managing Director, Invesco Ltd.; Director and Senior Vice President, Invesco Advisers, Inc. (formerly known as Invesco Institutional (N.A.), Inc.) (registered investment adviser); Director and Chairman, Invesco Investment Services, Inc. (formerly known as Invesco AIM Investment Services, Inc.) (registered transfer agent); Senior Vice President, The Invesco Funds; Director, Invesco Investment Advisers LLC (formerly known as Van Kampen Asset Management) and Invesco UK Limited; Director, President and Chairman, Invesco Insurance Agency, Inc.; Director and Chief Executive, Invesco Asset Management Limited and Invesco Fund Managers Limited Formerly: Assistant Vice President, The Invesco Funds; Senior Vice President, Invesco Advisers, Inc. (formerly known as Invesco Institutional (N.A.), Inc.) (registered investment adviser); Director and Chief Executive, Invesco Administration Services Limited and Invesco Global Investment Funds Limited; Director, Invesco Distributors, Inc.; Head of EMEA, Invesco Ltd.; President, Invesco Actively Managed Exchange-Traded Commodity Fund Trust, Invesco Actively Managed Exchange-Traded Fund Trust, Invesco Exchange-Traded Fund Trust, Invesco Exchange-Traded Fund Trust II and Invesco India Exchange-Traded Fund Trust; Managing Director and Principal Executive Officer, Invesco Capital Management LLC | | N/A | | N/A |
John M. Zerr — 1962 Senior Vice President | | 2006 | | Chief Operating Officer of the Americas; Senior Vice President, Invesco Advisers, Inc. (formerly known as Invesco Institutional (N.A.), Inc.) (registered investment adviser); Senior Vice President, Invesco Distributors, Inc. (formerly known as Invesco AIM Distributors, Inc.); Director and Vice President, Invesco Investment Services, Inc. (formerly known as Invesco AIM Investment Services, Inc.) Senior Vice President, The Invesco Funds; Managing Director, Invesco Capital Management LLC; Director, Invesco Investment Advisers LLC (formerly known as Van Kampen Asset Management); Senior Vice President, Invesco Capital Markets, Inc. (formerly known as Van Kampen Funds Inc.); Manager, Invesco Indexing LLC; Director and Senior Vice President, Invesco Insurance Agency, Inc.; Invesco Canada Funds Advisory Board Member; Director, President Chief Executive Officer, Invesco Corporate Class Inc. (corporate mutual fund company); and Director, Chairman, President and Chief Executive Officer, Invesco Canada Ltd. (formerly known as Invesco Trimark Ltd./Invesco Trimark Ltèe) (registered investment adviser and registered transfer agent) Formerly: Director and Senior Vice President, Invesco Management Group, Inc. (formerly known as Invesco AIM Management Group, Inc.); Secretary and General Counsel, Invesco Management Group, Inc. (formerly known as Invesco AIM Management Group, Inc.); Secretary, Invesco Investment Services, Inc. (formerly known as Invesco AIM Investment Services, Inc.); Chief Legal Officer and Secretary, The Invesco Funds; Secretary and General Counsel, Invesco Investment Advisers LLC (formerly known as Van Kampen Asset Management); Secretary and General Counsel, Invesco Capital Markets, Inc. (formerly known as Van Kampen Funds Inc.); Chief Legal Officer, Invesco Exchange-Traded Fund Trust, Invesco Exchange-Traded Fund Trust II, Invesco India Exchange-Traded Fund Trust, Invesco Actively Managed Exchange-Traded Fund Trust, Invesco Actively Managed Exchange-Traded Commodity Fund Trust and Invesco Exchange-Traded Self-Indexed Fund Trust; Secretary, Invesco Indexing LLC; Director, Secretary, General Counsel and Senior Vice President, Van Kampen Exchange Corp.; Director, Vice President and Secretary, IVZ Distributors, Inc. (formerly known as INVESCO Distributors, Inc.); Director and Vice President, INVESCO Funds Group, Inc.; Director and Vice President, Van Kampen Advisors Inc.; Director, Vice President, Secretary and General Counsel, Van Kampen Investor Services Inc.; Director and Secretary, Invesco Distributors, Inc. (formerly known as Invesco AIM Distributors, Inc.); Director, Senior Vice President, General Counsel and Secretary, Invesco AIM Advisers, Inc. and Van Kampen Investments Inc.; Director, Vice President and Secretary, Fund Management Company; Director, Senior Vice President, Secretary, General Counsel and Vice President, Invesco AIM Capital Management, Inc.; Chief Operating Officer and General Counsel, Liberty Ridge Capital, Inc. (an investment adviser) | | N/A | | N/A |
T-4 Invesco Small Cap Value Fund
Trustees and Officers—(continued)
| | | | | | | | |
Name, Year of Birth and
Position(s) Held with the Trust | | Trustee and/
or Officer Since | | Principal Occupation(s)
During Past 5 Years | | Number of Funds in Fund
Complex
Overseen by
Trustee | | Other Directorship(s)
Held by Trustee During
Past 5 Years |
| Other Officers—(continued) | | | | | | | | |
Gregory G. McGreevey — 1962 Senior Vice President | | 2012 | | Senior Managing Director, Invesco Ltd.; Director, Chairman, President, and Chief Executive Officer, Invesco Advisers, Inc. (formerly known as Invesco Institutional (N.A.), Inc.) (registered investment adviser); Director, Invesco Mortgage Capital, Inc. and Invesco Senior Secured Management, Inc.; and Senior Vice President, The Invesco Funds Formerly: Senior Vice President, Invesco Management Group, Inc. and Invesco Advisers, Inc.; Assistant Vice President, The Invesco Funds | | N/A | | N/A |
Kelli Gallegos — 1970 Vice President, Principal Financial Officer and Assistant Treasurer | | 2008 | | Assistant Treasurer, Invesco Specialized Products, LLC; Vice President, Principal Financial Officer and Assistant Treasurer, The Invesco Funds; Principal Financial and Accounting Officer — Pooled Investments, Invesco Capital Management LLC; Vice President and Treasurer, Invesco Exchange-Traded Fund Trust, Invesco Exchange-Traded Fund Trust II, Invesco India Exchange-Traded Fund Trust, Invesco Actively Managed Exchange-Traded Fund Trust, Invesco Actively Managed Exchange-Traded Commodity Fund Trust and Invesco Exchange-Traded Self-Indexed Fund Trust Formerly: Assistant Treasurer, Invesco Exchange-Traded Fund Trust, Invesco Exchange-Traded Fund Trust II, Invesco India Exchange-Traded Fund Trust, Invesco Actively Managed Exchange-Traded Fund Trust, Invesco Actively Managed Exchange-Traded Commodity Fund Trust and Invesco Exchange-Traded Self-Indexed Fund Trust; Assistant Treasurer, Invesco Capital Management LLC; Assistant Vice President, The Invesco Funds | | N/A | | N/A |
Crissie M. Wisdom — 1969 Anti-Money Laundering Compliance Officer | | 2013 | | Anti-Money Laundering Compliance Officer, Invesco Advisers, Inc. (formerly known as Invesco Institutional (N.A.), Inc.) (registered investment adviser), Invesco Capital Markets, Inc. (formerly known as Van Kampen Funds Inc.), Invesco Distributors, Inc., Invesco Investment Services, Inc., The Invesco Funds, and Invesco Exchange-Traded Fund Trust, Invesco Exchange-Traded Fund Trust II, Invesco India Exchange-Traded Fund Trust, Invesco Actively Managed Exchange-Traded Fund Trust, Invesco Actively Managed Exchange-Traded Commodity Fund Trust and Invesco Exchange-Traded Self-Indexed Fund Trust; Anti-Money Laundering Compliance Officer and Bank Secrecy Act Officer, INVESCO National Trust Company and Invesco Trust Company; and Fraud Prevention Manager and Controls and Risk Analysis Manager for Invesco Investment Services, Inc. Formerly: Anti-Money Laundering Compliance Officer, Van Kampen Exchange Corp. and Invesco Management Group, Inc. | | N/A | | N/A |
Robert R. Leveille — 1969 Chief Compliance Officer | | 2016 | | Chief Compliance Officer, Invesco Advisers, Inc. (registered investment adviser); and Chief Compliance Officer, The Invesco Funds Formerly: Chief Compliance Officer, Putnam Investments and the Putnam Funds | | N/A | | N/A |
The Statement of Additional Information of the Trust includes additional information about the Fund’s Trustees and is available upon request, without charge, by calling 1.800.959.4246. Please refer to the Fund’s Statement of Additional Information for information on the Fund’ssub-advisers.
| | | | | | |
Office of the Fund 11 Greenway Plaza, Suite 1000 Houston, TX 77046-1173 | | Investment Adviser Invesco Advisers, Inc. 1555 Peachtree Street, N.E. Atlanta, GA 30309 | | Distributor Invesco Distributors, Inc. 11 Greenway Plaza, Suite 1000 Houston, TX 77046-1173 | | Auditors PricewaterhouseCoopers LLP 1000 Louisiana Street, Suite 5800 Houston, TX 77002-5021 |
| | | |
| | | | | | |
Counsel to the Fund Stradley Ronon Stevens & Young, LLP 2005 Market Street, Suite 2600 Philadelphia, PA 19103-7018 | | Counsel to the Independent Trustees Goodwin Procter LLP 901 New York Avenue, N.W. Washington, D.C. 20001 | | Transfer Agent Invesco Investment Services, Inc. 11 Greenway Plaza, Suite 1000 Houston, TX 77046-1173 | | Custodian State Street Bank and Trust Company 225 Franklin Street Boston, MA 02110-2801 |
T-5 Invesco Small Cap Value Fund
(This page intentionally left blank)
Go paperless with eDelivery
Visit invesco.com/edelivery to enjoy the convenience and security of anytime electronic access to your investment documents.
With eDelivery, you can elect to have any or all of the following materials delivered straight to your inbox to download, save and print from your own computer:
| • | Fund reports and prospectuses |
| • | Quarterly statements |
| • | Daily confirmations |
| • | Tax forms |
Invesco mailing information
Send general correspondence to Invesco Investment Services, Inc., P.O. Box 219078, Kansas City, MO 64121-9078.
Important notice regarding delivery of security holder documents
To reduce Fund expenses, only one copy of most shareholder documents may be mailed to shareholders with multiple accounts at the same address (Householding). Mailing of your shareholder documents may be householded indefinitely unless you instruct us otherwise. If you do not want the mailing of these documents to be combined with those for other members of your household, please contact Invesco Investment Services, Inc. at 800 959 4246 or contact your financial institution. We will begin sending you individual copies for each account within 30 days after receiving your request.
Fund holdings and proxy voting information
The Fund provides a complete list of its holdings four times in each fiscal year, at the quarter-ends. For the second and fourth quarters, the list appears in the Fund’s semiannual and annual reports to shareholders. For the first and third quarters, the Fund files the lists with the Securities and Exchange Commission (SEC) on Form N-Q (or any successor Form). The most recent list of portfolio holdings is available at invesco.com/completeqtrholdings. Shareholders can also look up the Fund’s Form N-Q (or any successor Form) filings on the SEC website, sec.gov. The SEC file numbers for the Fund are shown below.
A description of the policies and procedures that the Fund uses to determine how to vote proxies relating to portfolio securities is available without charge, upon request, from our Client Services department at 800 959 4246, or at invesco.com/proxyguidelines. The information is also available on the SEC website, sec.gov.
Information regarding how the Fund voted proxies related to its portfolio securities during the most recent 12-month period ended June 30 is available at invesco.com/proxysearch. This information is also available on the SEC website, sec.gov.
Invesco Advisers, Inc. is an investment adviser; it provides investment advisory services to individual and institutional clients and does not sell securities. Invesco Distributors, Inc. is the US distributor for Invesco Ltd.’s retail mutual funds, exchange-traded funds and institutional money market funds. Both are wholly owned, indirect subsidiaries of Invesco Ltd.
| SEC file numbers: 811-03826 and 002-85905 | Invesco Distributors, Inc. | VK-SCV-AR-1 |
| Annual Report to Shareholders | April 30, 2019 |
Invesco Technology Fund
Nasdaq:
A: ITYAX ■ C: ITHCX ■ Y: ITYYX ■ Investor: FTCHX ■ R5: FTPIX ■ R6: FTPSX

Beginning on January 1, 2021, as permitted by regulations adopted by the Securities and Exchange Commission, paper copies of the Fund’s shareholder reports will no longer be sent by mail, unless you specifically request paper copies of the reports from the Fund or from your financial intermediary, such as a broker-dealer or bank. Instead, the reports will be made available on the Fund’s website, and you will be notified by mail each time a report is posted and provided with a website link to access the report.
If you already elected to receive shareholder reports electronically, you will not be affected by this change and you need not take any action. You may elect to receive shareholder reports and other communications from the Fund electronically by contacting your financial intermediary (such as a broker-dealer or bank) or, if you are a direct investor, by enrolling at invesco.com/edelivery.
You may elect to receive all future reports in paper free of charge. If you invest through a financial intermediary, you can contact your financial intermediary to request that you continue to receive paper copies of your shareholder reports. If you invest directly with the Fund, you can call (800) 959-4246 to let the Fund know you wish to continue receiving paper copies of your shareholder reports. Your election to receive reports in paper will apply to all funds held with your financial intermediary or all funds held with the fund complex if you invest directly with the Fund.
Dear Shareholders:
This annual report includes information about your Fund, including performance data and a complete list of its investments as of the close of the reporting period. Inside is a discussion of how your Fund was managed and the factors that affected its performance during the reporting period.
Philip Taylor, whose messages to shareholders have appeared here for the last 13 years, transitioned to a senior advisory role on March 1, prior to his retirement at the end of the year, and I assumed his role as Head of the Americas and Senior Managing Director, Invesco Ltd. All of us at Invesco are indebted to Phil for his many years of dedicated service to the company and to its funds’ shareholders. I’m excited about this new opportunity, and I look forward to communicating with fund shareholders going forward.
Investor sentiment during the reporting period ranged from elation to fear, notably in the fourth quarter of 2018. Amid corporate tax cuts and improving global growth, several US equity indexes redefined highs during the first half of the reporting period. The exuberance, however, ended in October as global equities, in particular US stocks, sold off, with the sharpest decline in December of 2018. The catalyst for the sell-off was a combination of ongoing trade concerns between the US and China, fears of a global economic slowdown and lower oil prices from a supply glut. Gains posted earlier in the year for global equities were erased, while US Treasury bonds, along with government and municipal bonds, rallied as investors fled to “safe haven” assets. The reporting period ended on a positive note, however, as global equities bounced back strongly at the outset of 2019, with the US stock market reaching new highs by the period end. Given the strong economy during the reporting period, the US Federal Reserve (the Fed) raised the federal funds rate three times. At its December 2018 meeting, however, the Fed delivered a more “dovish stance” by simultaneously raising rates while reducing guidance for 2019 rate increases. As the fiscal year ended, the Fed had thus far left rates unchanged in 2019. As 2019 unfolds, we’ll see how the interplay of interest rates, economic data, geopolitics and a host of other factors affect US and overseas equity and fixed income markets.
Investor uncertainty and market volatility, such as we witnessed during the reporting period, are unfortunate facts of life when it comes to investing. That’s why Invesco encourages investors to work with a professional financial adviser who can stress the importance of starting to save and invest early and the importance of adhering to a disciplined investment plan. A financial adviser who knows your unique financial situation, investment goals and risk tolerance can be an invaluable partner as you seek to achieve your financial goals. He or she can offer a long-term perspective when markets are volatile and time-tested advice and guidance when your financial situation or investment goals change.
Visit our website for more information on your investments
Our website, invesco.com/us, offers a wide range of market insights and investment perspectives. On the website, you’ll find detailed information about our funds, including performance, holdings and portfolio manager commentaries. You can access information about your account by completing a simple, secure online registration. To do so, select “Log In” on the right side of the homepage, and then select “Register for Individual Account Access.”
In addition to the resources accessible on our website and through our mobile app, you can obtain timely updates to help you stay informed about the markets and the economy by connecting with Invesco on Twitter, LinkedIn or Facebook. You can access our blog at blog.invesco.us.com. Our goal is to provide you the information you want, when and where you want it.
Finally, I’m pleased to share with you Invesco’s commitment to both the Principles for Responsible Investment and to considering environmental, social and governance issues in our robust investment process. I invite you to learn more at invesco.com/esg.
Have questions?
For questions about your account, contact an Invesco client services representative at 800 959 4246.
All of us at Invesco look forward to serving your investment management needs. Thank you for investing with us.
Sincerely,
Andrew Schlossberg
Head of the Americas,
Senior Managing Director, Invesco Ltd.
Dear Shareholders:
Among the many important lessons I’ve learned in more than 40 years in a variety of business endeavors is the value of a trusted advocate.
As independent chair of the Invesco Funds Board, I can assure you that the members of the Board are strong advocates for the interests of investors in Invesco’s mutual funds. We work hard to represent your interests through oversight of the quality of the investment management services your funds receive and other matters important to your investment, including but not limited to:
| ■ | Ensuring that Invesco offers a diverse lineup of mutual funds that your financial adviser can use to strive to meet your financial needs as your investment goals change over time. |
| ■ | Monitoring how the portfolio management teams of the Invesco funds are performing in light of changing economic and market conditions. |
| ■ | Assessing each portfolio management team’s investment performance within the context of the investment strategy described in the fund’s prospectus. |
| ■ | Monitoring for potential conflicts of interests that may impact the nature of the services that your funds receive. |
We believe one of the most important services we provide our fund shareholders is the annual review of the funds’ advisory and sub-advisory contracts with Invesco Advisers and its affiliates. This review is required by the Investment Company Act of 1940 and focuses on the nature and quality of the services Invesco provides as the adviser to the Invesco funds and the reasonableness of the fees that it charges for those services. Each year, we spend months carefully reviewing information received from Invesco and a variety of independent sources, such as performance and fee data prepared by Lipper, Inc. (a subsidiary of Broadridge Financial Solutions, Inc.), an independent, third-party firm widely recognized as a leader in its field. We also meet with our independent legal counsel and other independent advisers to review and help us assess the information that we have received. Our goal is to assure that you receive quality investment management services for a reasonable fee.
I trust the measures outlined above provide assurance that you have a worthy advocate when it comes to choosing the Invesco Funds.
As always, please contact me at bruce@brucecrockett.com with any questions or concerns you may have. On behalf of the Board, we look forward to continuing to represent your interests and serving your needs.
Sincerely,
Bruce L. Crockett
Independent Chair
Invesco Funds Board of Trustees
Management’s Discussion of Fund Performance
Performance summary
For the fiscal year ended April 30, 2019, Class A shares of Invesco Technology Fund (the Fund), at net asset value (NAV), underperformed the NASDAQ Composite Index, the Fund’s broad market/style-specific benchmark.
Your Fund’s long-term performance appears later in this report.
Fund vs. Indexes
Total returns, April 30, 2018 to April 30, 2019, at net asset value (NAV). Performance shown does not include applicable contingent deferred sales charges (CDSC) or front-end sales charges, which would have reduced performance.
| Class A Shares | 14.85% |
| Class C Shares | 13.98 |
| Class Y Shares | 15.16 |
| Investor Class Shares | 15.00 |
| Class R5 Shares | 15.34 |
| Class R6 Shares | 15.34 |
| NASDAQ Composite Index▼ (Broad Market/Style-Specific Index) | 15.82 |
Lipper Science & Technology Funds Index■
(Peer Group Index) | 17.83 |
| Source(s):▼FactSet Research Systems Inc.;■ Lipper Inc. |
timent, low unemployment and a growing economy.
The Fund’s Class A shares, at NAV, posted a double-digit positive return but underperformed the Fund’s broad market/style-specific benchmark, the NASDAQ Composite Index.
The Fund’s underperformance relative to the broad market/style-specific benchmark was driven by entertainment industry holdings that experienced some headwinds during the fiscal year. The leading individual detractor on an absolute basis wasActivision Blizzard. The video game publisher suffered from the delayed release of planned titles, regulatory hurdles in China and a rotation from growth toward defensive areas of the market at the end of 2018.
During the fiscal year,Nintendo was also among the leading detractors on a relative and absolute basis. The video game and console maker reported slower sales of its Switch console due to a lack of big title game releases. The company also suffered slightly from the push out of expected mobile game titles to later in 2019. Nintendo also faced similar regulatory and macroeconomic headwinds as Activision Blizzard.
Another detractor from the Fund’s results relative to its broad market/style-specific benchmark for the fiscal year was electronic equipment manufacturerSony. The company began the fiscal year with strong operating profits that beat consensus estimates due to strong video game and music sales. Subsequently, Sony reported disappointing results that fell short of high consensus expectations. The profitability of the company’s games was also weaker-than-anticipated as the fiscal year came to a close.
At the industry level, stock selection in and the Fund’s overweight allocation to
Market conditions and your Fund
The fiscal year proved to be an increasingly volatile time for US equities. Throughout the summer, US equities moved higher as corporate profits surged amid the benefit of corporate tax cuts and improving global economic growth. Several US equity indexes reached new highs despite potential headwinds, including trade tensions, tariff announcements and contagion concerns over a Turkish currency crisis. Market volatility noticeably rose in October 2018, as US equity markets suffered a sharp sell-off through year-end 2018, amid ongoing trade concerns between the US and China, fears of a global economic slowdown and lower oil prices from a supply glut, with oil prices plummeting from near $75 per barrel in early October 2018 to around $45 per barrel in late December 2018.1 In this environment, there was a flight to safety, as investors fled to defensive areas of the
| Portfolio Composition |
| By sector | % of total net assets |
| Information Technology | 39.73% |
| Communication Services | 28.84 |
| Consumer Discretionary | 16.07 |
| Health Care | 12.49 |
| Industrials | 0.41 |
| Money Market Funds Plus Other Assets Less Liabilities | 2.46 |
markets, such as health care, utilities and US Treasuries.
Given signs of a strong economy, the US Federal Reserve (the Fed) raised interest rates three times during the fiscal year: in June, September and December 2018. Following December’s Fed meeting, the Fed raised interest rates by 25 basis points to a targeted range of 2.25% to 2.50%, which signaled a slightly more dovish stance than expected.2 Equity markets rebounded in 2019, fueled by optimism about a potential US-China trade deal and the Fed’s indication that there would be no interest rate hikes in 2019, a surprising shift in monetary policy. The Fed’s more accommodative stance provided a supportive environment for equities and fixed income, even as US economic data were mixed and overseas growth appeared to be slowing. By the end of the fiscal year, the US equity market generally recovered the losses from fourth quarter 2018, backed by improving investor sen-
| Top 10 Equity Holdings* |
| % of total net assets |
| 1. | Amazon.com, Inc. | 9.61% |
| 2. | Facebook, Inc., Class A | 5.52 |
| 3. | Microsoft Corp. | 5.38 |
| 4. | Alphabet, Inc., Class A | 5.25 |
| 5. | Apple, Inc. | 4.94 |
| 6. | Alibaba Group Holding Ltd., ADR | 4.44 |
| 7. | Nintendo Co., Ltd. | 3.24 |
| 8. | Illumina, Inc. | 3.01 |
| 9. | PayPal Holdings, Inc. | 2.74 |
| 10. | salesforce.com, inc. | 2.56 |
| Total Net Assets | $980.5 million |
| Total Number of Holdings* | 50 |
| The Fund’s holdings are subject to change, and there is no assurance that the Fund will continue to hold any particular security. |
| *Excluding money market fund holdings. |
| Data presented here are as of April 30, 2019. |
information technology services and underweight allocation to biotechnology were the leading contributors to the Fund’s performance relative to the broad market/style-specific benchmark during the fiscal year. Additionally, not having any exposure to the banking industry benefited the Fund’s relative results.
At the individual security level, out-of-index holdingSea was the leading contributor relative to the broad market/style-specific benchmark during the fiscal year. The Southeast Asian digital entertainment and e-commerce company experienced strong earnings and top-line growth driven by its self-developed battle royale mobile gaming title called “Free Fire.” Sea also gave better revenue guidance for Garena, its video gaming unit and Shopee, its e-commerce unit.
During the fiscal year,Amazon.com was the leading individual contributor on an absolute basis. The e-commerce giant largely benefited from better-than-expected profitability driven by strength in its international and cloud computing services platform.Integrated Device Technology (IDT) was among the leading contributors to the Fund’s performance on an absolute basis and relative to the broad market/style-specific benchmark for the fiscal year. The semiconductor company benefited from news that Renesas Electronics (not a Fund holding) would acquire IDT at a 30% premium above the stock’s price as of the date of the announcement. We exited our position in IDT in the fourth quarter of 2018. On March 30, 2019, Renesas announced that the acquisition was completed successfully.ServiceNow was also a notable relative contributor to the Fund’s performance during the fiscal year. The California-based cloud computing company reported strong quarterly billings and margin expansion. Use cases for ServiceNow’s platform continued to expand during the fiscal year causing revenue per customer to accelerate even as the company grows larger.
At the close of the fiscal year, the Fund was biased toward growth technology, including medical technology, and away from mature technology. We emphasized innovation, transformative technology and opportunities, which we expect to take market share from mature companies, including the game-changing technologies of mobile, security, cloud and medical technology. We remain optimistic about technology spending given strong corporate balance sheets and companies’ need to invest in more robust security solutions and for future growth.
In our opinion, the increased pace of health care innovation is likely to continue to drive attractive long-term growth rates due to successful mapping of the human genome and recent productivity improvements, both of which have fostered faster and more effective targeting of promising therapeutics. We attempt to harness multi-year secular trends, which may benefit long-term investors regardless of near-term economic strength.
As we’ve discussed, stocks remain volatile and we caution investors against making investment decisions based on short-term performance.
We thank you for your commitment to Invesco Technology Fund.
1 Source: Bloomberg
2 Source: US Federal Reserve
The views and opinions expressed in management’s discussion of Fund performance are those of Invesco Advisers, Inc. These views and opinions are subject to change at any time based on factors such as market and economic conditions. These views and opinions may not be relied upon as investment advice or recommendations, or as an offer for a particular security. The information is not a complete analysis of every aspect of any market, country, industry, security or the Fund. Statements of fact are from sources considered reliable, but Invesco Advisers, Inc. makes no representation or warranty as to their completeness or accuracy. Although historical performance is no guarantee of future results, these insights may help you understand our investment management philosophy.
See important Fund and, if applicable, index disclosures later in this report.
Erik Voss
Chartered Financial Analyst, Portfolio Manager, is lead manager of Invesco Technology Fund. He joined Invesco in 2010. Mr. Voss earned a BS in mathematics and an MS in finance from the University of Wisconsin.
Janet Luby
Chartered Financial Analyst, Portfolio Manager, is manager of Invesco Technology Fund. She joined Invesco in 2011. Ms. Luby earned a BBA in finance from Texas A&M University. She is also a Certified Public Accountant.
Your Fund’s Long-Term Performance
Results of a $10,000 Investment — Oldest Share Class(es)
Fund and index data from 4/30/09
| 1 | Source: FactSet Research Systems Inc. |
| 2 | Source: Lipper Inc. |
| 3 | It is Invesco’s policy to chart the Fund’s oldest share class(es). Because Investor Class shares do not have a sales charge, we also show the oldest share class with a sales charge, Class C shares. |
Past performance cannot guarantee comparable future results.
The data shown in the chart include reinvested distributions, applicable sales charges and Fund expenses including
management fees. Index results include reinvested dividends, but they do not reflect sales charges. Performance of the peer group, if applicable, reflects fund expenses and management fees; perfor-
mance of a market index does not. Performance shown in the chart and table(s) does not reflect deduction of taxes a shareholder would pay on Fund distributions or sale of Fund shares.
| Average Annual Total Returns |
| As of 4/30/19, including maximum applicable sales charges |
| Class A Shares | |
| Inception (3/28/02) | 5.74% |
| 10 Years | 14.79 |
| 5 Years | 13.04 |
| 1 Year | 8.54 |
| Class C Shares | |
| Inception (2/14/00) | –0.92% |
| 10 Years | 14.59 |
| 5 Years | 13.47 |
| 1 Year | 12.98 |
| Class Y Shares | |
| Inception (10/3/08) | 14.17% |
| 10 Years | 15.73 |
| 5 Years | 14.62 |
| 1 Year | 15.16 |
| Investor Class Shares | |
| Inception (1/19/84) | 10.38% |
| 10 Years | 15.53 |
| 5 Years | 14.44 |
| 1 Year | 15.00 |
| Class R5 Shares | |
| Inception (12/21/98) | 5.69% |
| 10 Years | 16.11 |
| 5 Years | 14.87 |
| 1 Year | 15.34 |
| Class R6 Shares | |
| 10 Years | 15.55% |
| 5 Years | 14.53 |
| 1 Year | 15.34 |
Class R6 shares incepted on April 4, 2017. Performance shown prior to that date is that of Class A shares and includes the 12b-1 fees applicable to Class A shares.
The performance data quoted represent past performance and cannot guarantee comparable future results; current performance may be lower or higher. Please visit invesco.com/performance for the most recent month-end performance. Performance figures reflect reinvested distributions, changes in net asset value and the effect of the maximum sales charge unless otherwise stated. Investment return and principal value will fluctuate so that you may have a gain or loss when you sell shares.
The total annual Fund operating expense ratio set forth in the most recent Fund prospectus as of the date of this report for Class A, Class C, Class Y, Investor Class, Class R5 and Class R6 shares was 1.28%, 2.03%, 1.03%, 1.20%, 0.85% and 0.85%, respectively. The expense ratios presented above may vary from the ex-
| Average Annual Total Returns |
| As of 3/31/19, the most recent calendar quarter end, including maximum applicable sales charges |
| Class A Shares | |
| Inception (3/28/02) | 5.43% |
| 10 Years | 15.46 |
| 5 Years | 11.05 |
| 1 Year | 3.63 |
| Class C Shares | |
| Inception (2/14/00) | –1.20% |
| 10 Years | 15.25 |
| 5 Years | 11.47 |
| 1 Year | 7.83 |
| Class Y Shares | |
| Inception (10/3/08) | 13.70% |
| 10 Years | 16.40 |
| 5 Years | 12.60 |
| 1 Year | 9.93 |
| Investor Class Shares | |
| Inception (1/19/84) | 10.23% |
| 10 Years | 16.20 |
| 5 Years | 12.42 |
| 1 Year | 9.77 |
| Class R5 Shares | |
| Inception (12/21/98) | 5.43% |
| 10 Years | 16.78 |
| 5 Years | 12.86 |
| 1 Year | 10.10 |
| Class R6 Shares | |
| 10 Years | 16.21% |
| 5 Years | 12.51 |
| 1 Year | 10.10 |
pense ratios presented in other sections of this report that are based on expenses incurred during the period covered by this report.
Class A share performance reflects the maximum 5.50% sales charge, and Class C share performance reflects the applicable contingent deferred sales charge (CDSC) for the period involved. The CDSC on Class C shares is 1% for the first year after purchase. Class Y, Investor Class, Class R5 and Class R6 shares do not have a front-end sales charge or a CDSC; therefore, performance is at net asset value.
The performance of the Fund’s share classes will differ primarily due to different sales charge structures and class expenses.
Fund performance reflects any applicable fee waivers and/or expense reimbursements. Had the adviser not waived fees and/or reimbursed expenses currently or in the past, returns would have been lower. See current prospectus for more information.
Invesco Technology Fund’s investment objective is long-term growth of capital.
| ■ | Unless otherwise stated, information presented in this report is as of April 30, 2019, and is based on total net assets. |
| ■ | Unless otherwise noted, all data provided by Invesco. |
| ■ | To access your Fund’s reports/prospectus, visit invesco.com/fundreports. |
About share classes
| ■ | Class Y sharesand Investor Class shares are available only to certain investors. Please see the prospectus for more information. |
| ■ | Class R5 shares andClass R6 shares are available for use by retirement plans that meet certain standards and for institutional investors. Class R6 shares are also available through intermediaries that have established an agreement with Invesco Distributors, Inc. to make such shares available for use in retail omnibus accounts. Please see the prospectus for more information. |
Principal risks of investing in the Fund
| ■ | Depositary receipts risk.Investing in depositary receipts involves the same risks as direct investments in foreign securities. In addition, the underlying issuers of certain depositary receipts are under no obligation to distribute shareholder communications or pass through any voting rights with respect to the deposited securities to the holders of such receipts. The Fund may therefore receive less timely information or have less control than if it invested directly in the foreign issuer. |
| ■ | Derivatives risk. The value of a derivative instrument depends largely on (and is derived from) the value of an underlying security, currency, commodity, interest rate, index or other asset (each referred to as an underlying asset). In addition to risks relating to the underlying assets, the use of derivatives may include other, possibly greater, risks, including counterparty, leverage and liquidity risks. Counterparty risk is the risk that the counterparty to the derivative contract will default on its obligation to pay the Fund the amount owed or otherwise perform under the derivative contract. Derivatives create leverage risk because they do not require payment up front equal to the eco- |
| | nomic exposure created by holding a position in the derivative. As a result, an adverse change in the value of the underlying asset could result in the Fund sustaining a loss that is substantially greater than the amount invested in the derivative or the anticipated value of the underlying asset, which may make the Fund’s returns more volatile and increase the risk of loss. Derivative instruments may also be less liquid than more traditional investments and the Fund may be unable to sell or close out its derivative positions at a desirable time or price. This risk may be more acute under adverse market conditions, during which the Fund may be most in need of liquidating its derivative positions. Derivatives may also be harder to value, less tax efficient and subject to changing government regulation that could impact the Fund’s ability to use certain derivatives or their cost. Derivatives strategies may not always be successful. For example, derivatives used for hedging or to gain or limit exposure to a particular market segment may not provide the expected benefits, particularly during adverse market conditions. |
| ■ | Emerging markets securities risk. Emerging markets (also referred to as developing markets) are generally subject to greater market volatility, political, social and economic instability, uncertain trading markets and more governmental limitations on foreign investment than more developed markets. In addition, companies operating in emerging markets may be subject to lower trading volume and greater price fluctuations than companies in more developed markets. Securities law and the enforcement of systems of taxation in many emerging market countries may change quickly and unpredictably. In addition, investments in emerging markets securities may also be subject to additional transaction costs, delays in settlement procedures, and lack of timely information. |
| ■ | Foreign securities risk. The Fund’s foreign investments may be adversely affected by political and social instability, changes in economic or taxation policies, difficulty in enforcing obligations, decreased liquidity or increased volatility. Foreign investments also involve the risk of the possible seizure, nationalization or expropriation of the issuer or foreign deposits (in which the Fund could lose its entire investments in a certain market) and the possible adoption of foreign governmental restrictions such as exchange controls. Unless the Fund has hedged its foreign securities risk, foreign securities risk also involves the risk of negative foreign currency rate fluctuations, which may cause the value of securities denominated in such foreign currency (or other instruments through which the Fund has exposure to foreign currencies) to decline in value. Currency exchange rates may fluctuate significantly over short periods of time. Currency hedging strategies, if used, are not always successful. |
| ■ | Growth investing risk. Growth stocks tend to be more expensive relative to the issuing company’s earnings or assets compared with other types of stock. As a result, they tend to be more sensitive to changes in, or investors’ expectations of, the issuing company’s earnings and can be more volatile. |
| ■ | Management risk. The Fund is actively managed and depends heavily on the Adviser’s judgment about markets, interest rates or the attractiveness, relative values, liquidity, or potential appreciation of particular investments made for the Fund’s portfolio. The Fund could experience losses if these judgments prove to be incorrect. Additionally, legislative, regulatory, or tax developments may adversely affect management of the Fund and, therefore, the ability of the Fund to achieve its investment objective. |
| ■ | Market risk. The market values of the Fund’s investments, and therefore the |
This report must be accompanied or preceded by a currently effective Fund prospectus, which contains more complete information, including sales charges and expenses. Investors should read it carefully before investing.
NOT FDIC INSURED | MAY LOSE VALUE | NO BANK GUARANTEE
| | value of the Fund’s shares, will go up and down, sometimes rapidly or unpredictably. Market risk may affect a single issuer, industry or section of the economy, or it may affect the market as a whole. Individual stock prices tend to go up and down more dramatically than those of certain other types of investments, such as bonds. During a general downturn in the financial markets, multiple asset classes may decline in value. When markets perform well, there can be no assurance that specific investments held by the Fund will rise in value. |
| ■ | Mid-capitalization companies risk. Mid-capitalization companies tend to be more vulnerable to changing market conditions and may have more limited product lines and markets, less experienced management and fewer financial resources than larger companies. These companies’ securities may be more volatile and less liquid than those of more established companies, and their returns may vary, sometimes significantly, from the overall securities market. |
| ■ | Technology sector risk. The Fund will concentrate its investments in the securities of issuers engaged primarily in technology-related industries. Technology companies are subject to intense competition, rapid obsolescence of their products, issues with obtaining financing or regulatory approvals, product incompatibility, changing consumer preferences, high required corporate capital expenditure for research and development or infrastructure and development of new products, each of which make the prices of securities issued by these companies more volatile. |
About indexes used in this report
| ■ | TheNASDAQ Composite Index is a broad-based market index of the common stocks and similar securities listed on the Nasdaq stock market. |
| ■ | TheLipper Science & Technology Funds Index is an unmanaged index considered representative of science and technology funds tracked by Lipper. |
| ■ | The Fund is not managed to track the performance of any particular index, including the index(es) described here, and consequently, the performance of the Fund may deviate significantly from the performance of the index(es). |
| ■ | A direct investment cannot be made in an index. Unless otherwise indi- |
cated, index results include reinvested dividends, and they do not reflect sales charges. Performance of the peer group, if applicable, reflects fund expenses; performance of a market index does not.
Other information
| ■ | CPA® and Certified Public Accountant® are trademarks owned by the American Institute of Certified Public Accountants. |
| ■ | The returns shown in management’s discussion of Fund performance are based on net asset values (NAVs) calculated for shareholder transactions. Generally accepted accounting principles require adjustments to be made to the net assets of the Fund at period end for financial reporting purposes, and as such, the NAVs for shareholder transactions and the returns based on those NAVs may differ from the NAVs and returns reported in the Financial Highlights. |
| ■ | Industry classifications used in this report are generally according to the Global Industry Classification Standard, which was developed by and is the exclusive property and a service mark of MSCI Inc. and Standard & Poor’s. |
Schedule of Investments(a)
April 30, 2019
| | Shares | Value |
| Common Stocks & Other Equity Interests–97.54% |
| Alternative Carriers–2.04% |
| Intelsat S.A.(b) | 987,254 | $19,982,021 |
| Application Software–5.19% |
| Adobe, Inc.(b) | 74,007 | 21,406,525 |
| salesforce.com, inc.(b) | 151,697 | 25,083,099 |
| Splunk, Inc.(b) | 31,576 | 4,358,751 |
| | | | 50,848,375 |
| Biotechnology–1.02% |
| Alexion Pharmaceuticals, Inc.(b) | 73,464 | 10,000,654 |
| Consumer Electronics–1.52% |
| Sony Corp. (Japan) | 294,600 | 14,923,117 |
| Data Processing & Outsourced Services–7.49% |
| First Data Corp., Class A(b) | 166,491 | 4,305,457 |
| Mastercard, Inc., Class A | 68,668 | 17,458,152 |
| PayPal Holdings, Inc.(b) | 238,128 | 26,853,695 |
| Visa, Inc., Class A | 151,095 | 24,844,551 |
| | | | 73,461,855 |
| Health Care Equipment–5.08% |
| Abbott Laboratories | 167,767 | 13,347,543 |
| Boston Scientific Corp.(b) | 201,120 | 7,465,574 |
| Intuitive Surgical, Inc.(b) | 19,300 | 9,855,159 |
| Stryker Corp. | 26,295 | 4,967,389 |
| Teleflex, Inc. | 49,591 | 14,191,952 |
| | | | 49,827,617 |
| Interactive Home Entertainment–11.27% |
| Activision Blizzard, Inc. | 383,304 | 18,479,086 |
| Electronic Arts, Inc.(b) | 171,661 | 16,247,714 |
| Nintendo Co., Ltd. (Japan) | 92,700 | 31,788,370 |
| Sea Ltd. ADR (Thailand)(b) | 640,099 | 15,932,064 |
| Take-Two Interactive Software, Inc.(b) | 58,989 | 5,711,905 |
| Ubisoft Entertainment S.A. (France)(b) | 234,181 | 22,336,397 |
| | | | 110,495,536 |
| Interactive Media & Services–13.58% |
| Alphabet, Inc., Class A(b) | 42,982 | 51,533,699 |
| Alphabet, Inc. Class C(b) | 14,985 | 17,809,373 |
| Facebook, Inc., Class A(b) | 280,034 | 54,158,575 |
| Match Group, Inc. | 160,285 | 9,681,214 |
| | | | 133,182,861 |
| Internet & Direct Marketing Retail–14.55% |
| Alibaba Group Holding Ltd. ADR (China)(b) | 234,645 | 43,543,072 |
| Amazon.com, Inc.(b) | 48,919 | 94,243,432 |
| Booking Holdings, Inc.(b) | 2,619 | 4,858,219 |
| | | | 142,644,723 |
| | Shares | Value |
| Life Sciences Tools & Services–5.89% |
| Illumina, Inc.(b) | 94,695 | $29,544,840 |
| IQVIA Holdings, Inc.(b) | 113,754 | 15,800,431 |
| Thermo Fisher Scientific, Inc. | 44,649 | 12,387,865 |
| | | | 57,733,136 |
| Managed Health Care–0.50% |
| UnitedHealth Group, Inc. | 21,229 | 4,947,843 |
| Movies & Entertainment–1.95% |
| Netflix, Inc.(b) | 51,604 | 19,121,346 |
| Semiconductor Equipment–4.63% |
| Applied Materials, Inc. | 535,288 | 23,590,142 |
| ASML Holding N.V. New York Shares (Netherlands) | 104,413 | 21,803,523 |
| | | | 45,393,665 |
| Semiconductors–8.55% |
| Broadcom, Inc. | 67,929 | 21,628,594 |
| NVIDIA Corp. | 63,661 | 11,522,641 |
| QUALCOMM, Inc. | 222,575 | 19,170,385 |
| Semtech Corp.(b) | 211,574 | 11,397,491 |
| Silicon Motion Technology Corp. ADR (Taiwan) | 525,168 | 20,082,424 |
| | | | 83,801,535 |
| Systems Software–8.93% |
| Microsoft Corp. | 404,114 | 52,777,288 |
| Palo Alto Networks, Inc.(b) | 65,354 | 16,262,036 |
| ServiceNow, Inc.(b) | 68,368 | 18,562,596 |
| | | | 87,601,920 |
| Technology Hardware, Storage & Peripherals–4.94% |
| Apple, Inc. | 241,353 | 48,432,306 |
| Trucking–0.41% |
| Lyft, Inc., Class A(b)(c) | 66,878 | 3,999,304 |
| Total Common Stocks & Other Equity Interests (Cost $499,420,076) | 956,397,814 |
|
| Money Market Funds–0.59% |
| Invesco Government & Agency Portfolio, Institutional Class, 2.34%(d) | 2,054,969 | 2,054,969 |
| Invesco Liquid Assets Portfolio, Institutional Class, 2.48%(d) | 1,466,587 | 1,467,027 |
| Invesco Treasury Portfolio, Institutional Class, 2.32%(d) | 2,314,434 | 2,314,434 |
| Total Money Market Funds (Cost $5,836,421) | 5,836,430 |
| TOTAL INVESTMENTS IN SECURITIES (excluding investments purchased with cash collateral from securities on loan)-98.13% (Cost $505,256,497) | | | 962,234,244 |
See accompanying Notes to Financial Statements which are an integral part of the financial statements.
| 10 | Invesco Technology Fund |
| | Shares | Value |
| Investments Purchased with Cash Collateral from Securities on Loan |
| Money Market Funds–0.38% |
| Invesco Government & Agency Portfolio, Institutional Class, 2.34%(d)(e) | 2,798,835 | $2,798,835 |
| Invesco Liquid Assets Portfolio, Institutional Class, 2.48%(d)(e) | 932,665 | 932,945 |
| Total Investments Purchased with Cash Collateral from Securities on Loan (Cost $3,731,780) | 3,731,780 |
| TOTAL INVESTMENTS IN SECURITIES–98.51% (Cost $508,988,277) | 965,966,024 |
| OTHER ASSETS LESS LIABILITIES–1.49% | 14,560,905 |
| NET ASSETS–100.00% | $980,526,929 |
Investment Abbreviations:
| ADR | – American Depositary Receipt |
Notes to Schedule of Investments:
| (a) | Industry and/or sector classifications used in this report are generally according to the Global Industry Classification Standard, which was developed by and is the exclusive property and a service mark of MSCI Inc. and Standard & Poor’s. |
| (b) | Non-income producing security. |
| (c) | All or a portion of this security was out on loan at April 30, 2019. |
| (d) | The money market fund and the Fund are affiliated by having the same investment adviser. The rate shown is the 7-day SEC standardized yield as of April 30, 2019. |
| (e) | The security has been segregated to satisfy the commitment to return the cash collateral received in securities lending transactions upon the borrower’s return of the securities loaned. See Note 1I. |
See accompanying Notes to Financial Statements which are an integral part of the financial statements.
| 11 | Invesco Technology Fund |
Statement of Assets and Liabilities
April 30, 2019
| Assets: | |
Investments in securities, at value
(Cost $499,420,076)1 | $956,397,814 |
| Investments in affiliated money market funds, at value (Cost $9,568,201) | 9,568,210 |
| Cash | 2,750,546 |
| Foreign currencies, at value (Cost $296) | 297 |
| Receivable for: | |
| Investments sold | 23,299,575 |
| Fund shares sold | 164,791 |
| Dividends | 1,023,664 |
| Investment for trustee deferred compensation and retirement plans | 193,960 |
| Other assets | 37,416 |
| Total assets | 993,436,273 |
| Liabilities: | |
| Payable for: | |
| Investments purchased | 7,545,502 |
| Fund shares reacquired | 648,798 |
| Collateral upon return of securities loaned | 3,731,780 |
| Accrued fees to affiliates | 630,454 |
| Accrued trustees’ and officers’ fees and benefits | 2,789 |
| Accrued other operating expenses | 135,917 |
| Trustee deferred compensation and retirement plans | 214,104 |
| Total liabilities | 12,909,344 |
| Net assets applicable to shares outstanding | $980,526,929 |
| Net assets consist of: | |
| Shares of beneficial interest | $474,792,296 |
| Distributable earnings | 505,734,633 |
| | $980,526,929 |
| Net Assets: |
| Class A | $443,049,700 |
| Class C | $28,216,961 |
| Class Y | $32,657,897 |
| Investor Class | $475,856,981 |
| Class R5 | $262,773 |
| Class R6 | $482,617 |
| Shares outstanding, no par value, with an unlimited number of shares authorized: |
| Class A | 8,918,868 |
| Class C | 719,575 |
| Class Y | 646,079 |
| Investor Class | 9,625,842 |
| Class R5 | 4,440 |
| Class R6 | 8,153 |
| Class A: | |
| Net asset value per share | $49.68 |
Maximum offering price per share
(Net asset value of $49.68 ÷ 94.50%) | $52.57 |
| Class C: | |
| Net asset value and offering price per share | $39.21 |
| Class Y: | |
| Net asset value and offering price per share | $50.55 |
| Investor Class: | |
| Net asset value and offering price per share | $49.44 |
| Class R5: | |
| Net asset value and offering price per share | $59.18 |
| Class R6: | |
| Net asset value and offering price per share | $59.20 |
| 1 | At April 30, 2019, securities with an aggregate value of $3,646,912 were on loan to brokers. |
See accompanying Notes to Financial Statements which are an integral part of the financial statements.
| 12 | Invesco Technology Fund |
Statement of Operations
For the year ended April 30, 2019
| Investment income: | |
| Dividends (net of foreign withholding taxes of $130,376) | $4,528,326 |
| Dividends from affiliated money market funds (includes securities lending income of $7,906) | 366,224 |
| Total investment income | 4,894,550 |
| Expenses: | |
| Advisory fees | 6,197,316 |
| Administrative services fees | 205,687 |
| Custodian fees | 67,121 |
| Distribution fees: | |
| Class A | 1,012,906 |
| Class C | 398,898 |
| Investor Class | 586,962 |
| Transfer agent fees— A, C, Y and Investor | 2,457,000 |
| Transfer agent fees — R5 | 182 |
| Transfer agent fees — R6 | 127 |
| Trustees’ and officers’ fees and benefits | 36,145 |
| Registration and filing fees | 101,750 |
| Reports to shareholders | 96,038 |
| Professional services fees | 48,060 |
| Other | 20,408 |
| Total expenses | 11,228,600 |
| Less: Fees waived and expense offset arrangement(s) | (51,901) |
| Net expenses | 11,176,699 |
| Net investment income (loss) | (6,282,149) |
| Realized and unrealized gain from: | |
| Net realized gain from: | |
| Investment securities | 81,191,809 |
| Foreign currencies | 1,788 |
| | 81,193,597 |
| Change in net unrealized appreciation of: | |
| Investment securities | 51,277,694 |
| Foreign currencies | 33,222 |
| | 51,310,916 |
| Net realized and unrealized gain | 132,504,513 |
| Net increase in net assets resulting from operations | $126,222,364 |
See accompanying Notes to Financial Statements which are an integral part of the financial statements.
| 13 | Invesco Technology Fund |
Statement of Changes in Net Assets
For the years ended April 30, 2019 and 2018
| | 2019 | 2018 |
| Operations: | | |
| Net investment income (loss) | $(6,282,149) | $(5,235,823) |
| Net realized gain | 81,193,597 | 67,117,063 |
| Change in net unrealized appreciation | 51,310,916 | 107,343,428 |
| Net increase in net assets resulting from operations | 126,222,364 | 169,224,668 |
| Distributions to shareholders from distributable earnings(1): | | |
| Class A | (29,341,022) | (13,941,905) |
| Class B | — | (102,497) |
| Class C | (4,044,783) | (1,700,242) |
| Class Y | (2,636,792) | (994,138) |
| Investor Class | (33,562,031) | (17,229,581) |
| Class R5 | (14,556) | (8,304) |
| Class R6 | (2,866) | (681) |
| Total distributions to shareholders from distributable earnings | (69,602,050) | (33,977,348) |
| Share transactions–net: | | |
| Class A | 38,822,626 | 10,590,273 |
| Class B | — | (3,903,177) |
| Class C | (10,928,886) | 5,092,812 |
| Class Y | 4,471,260 | 6,525,350 |
| Investor Class | (1,318,955) | (6,546,005) |
| Class R5 | 79,006 | (12,533) |
| Class R6 | 357,314 | 28,877 |
| Net increase in net assets resulting from share transactions | 31,482,365 | 11,775,597 |
| Net increase in net assets | 88,102,679 | 147,022,917 |
| Net assets: | | |
| Beginning of year | 892,424,250 | 745,401,333 |
| End of year | $980,526,929 | $892,424,250 |
| (1) | The Securities and Exchange Commission eliminated the requirement to disclose the distribution components separately, except for tax return of capital. For the year ended April 30, 2018, distributions to shareholders from distributable earnings consisted of distributions from net realized gains. |
See accompanying Notes to Financial Statements which are an integral part of the financial statements.
| 14 | Invesco Technology Fund |
Financial Highlights
April 30, 2019
The following schedule presents financial highlights for a share of the Fund outstanding throughout the periods indicated.
| | Net asset
value,
beginning
of period | Net
investment
income
(loss)(a) | Net gains
(losses)
on securities
(both
realized and
unrealized) | Total from
investment
operations | Distributions
from net
realized
gains | Net asset
value, end
of period | Total
return(b) | Net assets,
end of period
(000’s omitted) | Ratio of
expenses
to average
net assets
with fee waivers
and/or expenses
absorbed | Ratio of
expenses
to average net
assets without
fee waivers
and/or expenses
absorbed | Ratio of net
investment
income
(loss)
to average
net assets | Portfolio
turnover(c) |
| Class A |
| Year ended 04/30/19 | $46.98 | $(0.34) | $6.66 | $6.32 | $(3.62) | $49.68 | 14.87% | $443,050 | 1.23%(d) | 1.23%(d) | (0.71)%(d) | 48% |
| Year ended 04/30/18 | 39.78 | (0.29) | 9.31 | 9.02 | (1.82) | 46.98 | 22.94 | 377,444 | 1.27 | 1.28 | (0.63) | 47 |
| Year ended 04/30/17 | 32.99 | (0.23) | 9.39 | 9.16 | (2.37) | 39.78 | 28.80 | 310,505 | 1.43 | 1.43 | (0.65) | 49 |
| Year ended 04/30/16 | 37.86 | (0.26) | (2.09) | (2.35) | (2.52) | 32.99 | (6.83) | 279,234 | 1.39 | 1.39 | (0.70) | 46 |
| Year ended 04/30/15 | 37.61 | (0.35) | 5.88 | 5.53 | (5.28) | 37.86 | 15.27 | 311,682 | 1.40 | 1.40 | (0.89) | 67 |
| Class C |
| Year ended 04/30/19 | 38.15 | (0.57) | 5.25 | 4.68 | (3.62) | 39.21 | 13.98 | 28,217 | 1.98(d) | 1.98(d) | (1.46)(d) | 48 |
| Year ended 04/30/18 | 32.84 | (0.51) | 7.64 | 7.13 | (1.82) | 38.15 | 22.02 | 39,954 | 2.02 | 2.03 | (1.38) | 47 |
| Year ended 04/30/17 | 27.80 | (0.42) | 7.83 | 7.41 | (2.37) | 32.84 | 27.85 | 29,930 | 2.18 | 2.18 | (1.40) | 49 |
| Year ended 04/30/16 | 32.53 | (0.45) | (1.76) | (2.21) | (2.52) | 27.80 | (7.53) | 27,898 | 2.14 | 2.14 | (1.45) | 46 |
| Year ended 04/30/15 | 33.22 | (0.56) | 5.15 | 4.59 | (5.28) | 32.53 | 14.40 | 30,645 | 2.15 | 2.15 | (1.64) | 67 |
| Class Y |
| Year ended 04/30/19 | 47.62 | (0.22) | 6.77 | 6.55 | (3.62) | 50.55 | 15.16 | 32,658 | 0.98(d) | 0.98(d) | (0.46)(d) | 48 |
| Year ended 04/30/18 | 40.21 | (0.18) | 9.41 | 9.23 | (1.82) | 47.62 | 23.22 | 27,364 | 1.02 | 1.03 | (0.38) | 47 |
| Year ended 04/30/17 | 33.24 | (0.14) | 9.48 | 9.34 | (2.37) | 40.21 | 29.13 | 17,205 | 1.18 | 1.18 | (0.40) | 49 |
| Year ended 04/30/16 | 38.04 | (0.17) | (2.11) | (2.28) | (2.52) | 33.24 | (6.61) | 9,256 | 1.14 | 1.14 | (0.45) | 46 |
| Year ended 04/30/15 | 37.67 | (0.25) | 5.90 | 5.65 | (5.28) | 38.04 | 15.58 | 9,013 | 1.15 | 1.15 | (0.64) | 67 |
| Investor Class |
| Year ended 04/30/19 | 46.71 | (0.28) | 6.63 | 6.35 | (3.62) | 49.44 | 15.02(e) | 475,857 | 1.11(d)(e) | 1.11(d)(e) | (0.59)(d)(e) | 48 |
| Year ended 04/30/18 | 39.53 | (0.25) | 9.25 | 9.00 | (1.82) | 46.71 | 23.03(e) | 447,456 | 1.19(e) | 1.20(e) | (0.55)(e) | 47 |
| Year ended 04/30/17 | 32.78 | (0.21) | 9.33 | 9.12 | (2.37) | 39.53 | 28.86(e) | 384,283 | 1.35(e) | 1.35(e) | (0.57)(e) | 49 |
| Year ended 04/30/16 | 37.60 | (0.22) | (2.08) | (2.30) | (2.52) | 32.78 | (6.73)(e) | 330,298 | 1.30(e) | 1.30(e) | (0.61)(e) | 46 |
| Year ended 04/30/15 | 37.34 | (0.31) | 5.85 | 5.54 | (5.28) | 37.60 | 15.41(e) | 383,681 | 1.30(e) | 1.30(e) | (0.78)(e) | 67 |
| Class R5 |
| Year ended 04/30/19 | 55.03 | (0.16) | 7.93 | 7.77 | (3.62) | 59.18 | 15.34 | 263 | 0.81(d) | 0.81(d) | (0.29)(d) | 48 |
| Year ended 04/30/18 | 46.14 | (0.11) | 10.82 | 10.71 | (1.82) | 55.03 | 23.44 | 163 | 0.85 | 0.85 | (0.21) | 47 |
| Year ended 04/30/17 | 37.74 | (0.05) | 10.82 | 10.77 | (2.37) | 46.14 | 29.45 | 132 | 0.92 | 0.92 | (0.14) | 49 |
| Year ended 04/30/16 | 42.75 | (0.08) | (2.41) | (2.49) | (2.52) | 37.74 | (6.36) | 465 | 0.87 | 0.87 | (0.18) | 46 |
| Year ended 04/30/15 | 41.63 | (0.16) | 6.56 | 6.40 | (5.28) | 42.75 | 15.91 | 965 | 0.87 | 0.87 | (0.36) | 67 |
| Class R6 |
| Year ended 04/30/19 | 55.04 | (0.15) | 7.93 | 7.78 | (3.62) | 59.20 | 15.36 | 483 | 0.80(d) | 0.80(d) | (0.28)(d) | 48 |
| Year ended 04/30/18 | 46.14 | (0.11) | 10.83 | 10.72 | (1.82) | 55.04 | 23.47 | 42 | 0.85 | 0.85 | (0.21) | 47 |
| Year ended 04/30/17(f) | 44.75 | (0.00) | 1.39 | 1.39 | — | 46.14 | 3.10 | 10 | 0.89(g) | 0.89(g) | (0.11)(g) | 49 |
| (a) | Calculated using average shares outstanding. |
| (b) | Includes adjustments in accordance with accounting principles generally accepted in the United States of America and as such, the net asset value for financial reporting purposes and the returns based upon those net asset values may differ from the net asset value and returns for shareholder transactions. Does not include sales charges and is not annualized for periods less than one year, if applicable. |
| (c) | Portfolio turnover is calculated at the fund level and is not annualized for periods less than one year, if applicable. |
| (d) | Ratios are based on average daily net assets (000’s omitted) of $405,162, $39,890, $31,642, $458,806 , $201 and $175 for Class A, Class C, Class Y, Investor Class, Class R5 and Class R6 shares, respectively. |
| (e) | The total return, ratio of expenses to average net assets and ratio of net investment income (loss) to average net assets reflect actual 12b-1 fees of 0.13%, 0.17%, 0.17% 0.16% and 0.15% for the years ended April 30, 2019, 2018, 2017, 2016 and 2015, respectively. |
| (f) | Commencement date of April 4, 2017. |
| (g) | Annualized. |
See accompanying Notes to Financial Statements which are an integral part of the financial statements.
| 15 | Invesco Technology Fund |
Notes to Financial Statements
April 30, 2019
NOTE 1—Significant Accounting Policies
Invesco Technology Fund (the “Fund”) is a series portfolio of AIM Sector Funds (Invesco Sector Funds) (the “Trust”). The Trust is a Delaware statutory trust registered under the Investment Company Act of 1940, as amended (the “1940 Act”), as an open-end series management investment company authorized to issue an unlimited number of shares of beneficial interest. Information presented in these financial statements pertains only to the Fund. Matters affecting the Fund or each class will be voted on exclusively by the shareholders of the Fund or each class.
The Fund’s investment objective is long-term growth of capital.
The Fund currently consists of six different classes of shares: Class A, Class C, Class Y, Investor Class, Class R5 and Class R6. Class Y and Investor Class shares are available only to certain investors. Class A shares are sold with a front-end sales charge unless certain waiver criteria are met and under certain circumstances load waived shares may be subject to contingent deferred sales charges ("CDSC"). Class C shares are sold with a CDSC. Class Y, Investor Class, Class R5 and Class R6 shares are sold at net asset value. Class C shares held for ten years after purchase are eligible for automatic conversion into Class A shares of the same Fund (the "Conversion Feature"). The automatic conversion pursuant to the Conversion Feature will generally occur at the end of the month following the tenth anniversary after a purchase of Class C shares.
The Fund is an investment company and accordingly follows the investment company accounting and reporting guidance in accordance with Financial Accounting Standards Board Accounting Standards Codification Topic 946,Financial Services – Investment Companies.
The following is a summary of the significant accounting policies followed by the Fund in the preparation of its financial statements.
| A. | Security Valuations — Securities, including restricted securities, are valued according to the following policy. |
A security listed or traded on an exchange (except convertible securities) is valued at its last sales price or official closing price as of the close of the customary trading session on the exchange where the security is principally traded, or lacking any sales or official closing price on a particular day, the security may be valued at the closing bid price on that day. Securities traded in the over-the-counter market are valued based on prices furnished by independent pricing services or market makers. When such securities are valued by an independent pricing service they may be considered fair valued. Futures contracts are valued at the final settlement price set by an exchange on which they are principally traded. Listed options are valued at the mean between the last bid and asked prices from the exchange on which they are principally traded. Options not listed on an exchange are valued by an independent source at the mean between the last bid and asked prices. For purposes of determining net asset value (“NAV”) per share, futures and option contracts generally are valued 15 minutes after the close of the customary trading session of the New York Stock Exchange (“NYSE”).
Investments in open-end and closed-end registered investment companies that do not trade on an exchange are valued at the end-of-day net asset value per share. Investments in open-end and closed-end registered investment companies that trade on an exchange are valued at the last sales price or official closing price as of the close of the customary trading session on the exchange where the security is principally traded.
Debt obligations (including convertible securities) and unlisted equities are fair valued using an evaluated quote provided by an independent pricing service. Evaluated quotes provided by the pricing service may be determined without exclusive reliance on quoted prices, and may reflect appropriate factors such as institution-size trading in similar groups of securities, developments related to specific securities, dividend rate (for unlisted equities), yield (for debt obligations), quality, type of issue, coupon rate (for debt obligations), maturity (for debt obligations), individual trading characteristics and other market data. Pricing services generally value debt obligations assuming orderly transactions of institutional round lot size, but a fund may hold or transact in the same securities in smaller, odd lot sizes. Odd lots often trade at lower prices than institutional round lots. Debt obligations are subject to interest rate and credit risks. In addition, all debt obligations involve some risk of default with respect to interest and/or principal payments.
Foreign securities’ (including foreign exchange contracts) prices are converted into U.S. dollar amounts using the applicable exchange rates as of the close of the NYSE. If market quotations are available and reliable for foreign exchange-traded equity securities, the securities will be valued at the market quotations. Because trading hours for certain foreign securities end before the close of the NYSE, closing market quotations may become unreliable. If between the time trading ends on a particular security and the close of the customary trading session on the NYSE, events occur that the investment adviser determines are significant and make the closing price unreliable, the Fund may fair value the security. If the event is likely to have affected the closing price of the security, the security will be valued at fair value in good faith using procedures approved by the Board of Trustees. Adjustments to closing prices to reflect fair value may also be based on a screening process of an independent pricing service to indicate the degree of certainty, based on historical data, that the closing price in the principal market where a foreign security trades is not the current value as of the close of the NYSE. Foreign securities’ prices meeting the approved degree of certainty that the price is not reflective of current value will be priced at the indication of fair value from the independent pricing service. Multiple factors may be considered by the independent pricing service in determining adjustments to reflect fair value and may include information relating to sector indices, American Depositary Receipts and domestic and foreign index futures. Foreign securities may have additional risks including exchange rate changes, potential for sharply devalued currencies and high inflation, political and economic upheaval, the relative lack of issuer information, relatively low market liquidity and the potential lack of strict financial and accounting controls and standards.
Securities for which market prices are not provided by any of the above methods may be valued based upon quotes furnished by independent sources. The last bid price may be used to value equity securities. The mean between the last bid and asked prices is used to value debt obligations, including corporate loans.
Securities for which market quotations are not readily available or became unreliable are valued at fair value as determined in good faith by or under the supervision of the Trust’s officers following procedures approved by the Board of Trustees. Issuer specific events, market trends, bid/asked quotes of brokers and information providers and other market data may be reviewed in the course of making a good faith determination of a security’s fair value.
The Fund may invest in securities that are subject to interest rate risk, meaning the risk that the prices will generally fall as interest rates rise and, conversely, the prices will generally rise as interest rates fall. Specific securities differ in their sensitivity to changes in interest rates depending on their individual characteristics. Changes in interest rates may result in increased market volatility, which may affect the value and/or liquidity of certain Fund investments.
| 16 | Invesco Technology Fund |
Valuations change in response to many factors including the historical and prospective earnings of the issuer, the value of the issuer’s assets, general economic conditions, interest rates, investor perceptions and market liquidity. Because of the inherent uncertainties of valuation, the values reflected in the financial statements may materially differ from the value received upon actual sale of those investments.
| B. | Securities Transactions and Investment Income — Securities transactions are accounted for on a trade date basis. Realized gains or losses on sales are computed on the basis of specific identification of the securities sold. Interest income (net of withholding tax, if any) is recorded on the accrual basis from settlement date. Dividend income (net of withholding tax, if any) is recorded on the ex-dividend date. |
The Fund may periodically participate in litigation related to Fund investments. As such, the Fund may receive proceeds from litigation settlements. Any proceeds received are included in the Statement of Operations as realized gain (loss) for investments no longer held and as unrealized gain (loss) for investments still held.
Brokerage commissions and mark ups are considered transaction costs and are recorded as an increase to the cost basis of securities purchased and/or a reduction of proceeds on a sale of securities. Such transaction costs are included in the determination of net realized and unrealized gain (loss) from investment securities reported in the Statement of Operations and the Statement of Changes in Net Assets and the net realized and unrealized gains (losses) on securities per share in the Financial Highlights. Transaction costs are included in the calculation of the Fund’s net asset value and, accordingly, they reduce the Fund’s total returns. These transaction costs are not considered operating expenses and are not reflected in net investment income reported in the Statement of Operations and the Statement of Changes in Net Assets, or the net investment income per share and the ratios of expenses and net investment income reported in the Financial Highlights, nor are they limited by any expense limitation arrangements between the Fund and the investment adviser.
The Fund allocates income and realized and unrealized capital gains and losses to a class based on the relative net assets of each class.
| C. | Country Determination – For the purposes of making investment selection decisions and presentation in the Schedule of Investments, the investment adviser may determine the country in which an issuer is located and/or credit risk exposure based on various factors. These factors include the laws of the country under which the issuer is organized, where the issuer maintains a principal office, the country in which the issuer derives 50% or more of its total revenues and the country that has the primary market for the issuer’s securities, as well as other criteria. Among the other criteria that may be evaluated for making this determination are the country in which the issuer maintains 50% or more of its assets, the type of security, financial guarantees and enhancements, the nature of the collateral and the sponsor organization. Country of issuer and/or credit risk exposure has been determined to be the United States of America, unless otherwise noted. |
| D. | Distributions– Distributions from net investment income and net realized capital gain, if any, are generally declared and paid annually and recorded on the ex-dividend date. The Fund may elect to treat a portion of the proceeds from redemptions as distributions for federal income tax purposes. |
| E. | Federal Income Taxes – The Fund intends to comply with the requirements of Subchapter M of the Internal Revenue Code of 1986, as amended (the “Internal Revenue Code”), necessary to qualify as a regulated investment company and to distribute substantially all of the Fund’s taxable earnings to shareholders. As such, the Fund will not be subject to federal income taxes on otherwise taxable income (including net realized capital gain) that is distributed to shareholders. Therefore, no provision for federal income taxes is recorded in the financial statements. |
The Fund recognizes the tax benefits of uncertain tax positions only when the position is more likely than not to be sustained. Management has analyzed the Fund’s uncertain tax positions and concluded that no liability for unrecognized tax benefits should be recorded related to uncertain tax positions. Management is not aware of any tax positions for which it is reasonably possible that the total amounts of unrecognized tax benefits will change materially in the next 12 months.
The Fund files tax returns in the U.S. Federal jurisdiction and certain other jurisdictions. Generally, the Fund is subject to examinations by such taxing authorities for up to three years after the filing of the return for the tax period.
| F. | Expenses – Fees provided for under the Rule 12b-1 plan of a particular class of the Fund are charged to the operations of such class. Transfer agency fees and expenses and other shareholder recordkeeping fees and expenses attributable to Class R5 and Class R6 are allocated to each share class based on relative net assets. Sub-accounting fees attributable to Class R5 are charged to the operations of the class. Transfer agency fees and expenses and other shareholder recordkeeping fees and expenses relating to all other classes are allocated among those classes based on relative net assets. All other expenses are allocated among the classes based on relative net assets. |
| G. | Accounting Estimates – The preparation of financial statements in conformity with accounting principles generally accepted in the United States of America (“GAAP”) requires management to make estimates and assumptions that affect the reported amounts of assets and liabilities at the date of the financial statements and the reported amounts of revenues and expenses during the reporting period including estimates and assumptions related to taxation. Actual results could differ from those estimates by a significant amount. In addition, the Fund monitors for material events or transactions that may occur or become known after the period-end date and before the date the financial statements are released to print. |
| H. | Indemnifications – Under the Trust’s organizational documents, each Trustee, officer, employee or other agent of the Trust is indemnified against certain liabilities that may arise out of the performance of their duties to the Fund. Additionally, in the normal course of business, the Fund enters into contracts, including the Fund’s servicing agreements, that contain a variety of indemnification clauses. The Fund’s maximum exposure under these arrangements is unknown as this would involve future claims that may be made against the Fund that have not yet occurred. The risk of material loss as a result of such indemnification claims is considered remote. |
| I. | Securities Lending– The Fund may lend portfolio securities having a market value up to one-third of the Fund’s total assets. Such loans are secured by collateral equal to no less than the market value of the loaned securities determined daily by the securities lending provider. Such collateral will be cash or debt securities issued or guaranteed by the U.S. Government or any of its sponsored agencies. Cash collateral received in connection with these loans is invested in short-term money market instruments or affiliated money market funds and is shown as such on the Schedule of Investments. The Fund bears the risk of loss with respect to the investment of collateral. It is the Fund’s policy to obtain additional collateral from or return excess collateral to the borrower by the end of the next business day, following the valuation date of the securities loaned. Therefore, the value of the collateral held may be temporarily less than the value of the securities on loan. When loaning securities, the Fund retains certain benefits of owning the securities, including the economic equivalent of dividends or interest generated by the security. Lending securities entails a risk of loss to the Fund if, and to the extent that, the market value of the securities loaned were to increase and the borrower did not increase the collateral accordingly, and the borrower failed to return the securities. The securities loaned are subject to termination at the option of the borrower or the Fund. Upon termination, the borrower will return to the Fund the securities loaned and the Fund |
| 17 | Invesco Technology Fund |
| | will return the collateral. Upon the failure of the borrower to return the securities, collateral may be liquidated and the securities may be purchased on the open market to replace the loaned securities. The Fund could experience delays and costs in gaining access to the collateral and the securities may lose value during the delay which could result in potential losses to the Fund. Some of these losses may be indemnified by the lending agent. The Fund bears the risk of any deficiency in the amount of the collateral available for return to the borrower due to any loss on the collateral invested. Dividends received on cash collateral investments for securities lending transactions, which are net of compensation to counterparties, are included inDividends from affiliated money market funds on the Statement of Operations. The aggregate value of securities out on loan, if any, is shown as a footnote on the Statement of Assets and Liabilities. |
| J. | Foreign Currency Translations – Foreign currency is valued at the close of the NYSE based on quotations posted by banks and major currency dealers. Portfolio securities and other assets and liabilities denominated in foreign currencies are translated into U.S. dollar amounts at the date of valuation. Purchases and sales of portfolio securities (net of foreign taxes withheld on disposition) and income items denominated in foreign currencies are translated into U.S. dollar amounts on the respective dates of such transactions. The Fund does not separately account for the portion of the results of operations resulting from changes in foreign exchange rates on investments and the fluctuations arising from changes in market prices of securities held. The combined results of changes in foreign exchange rates and the fluctuation of market prices on investments (net of estimated foreign tax withholding) are included with the net realized and unrealized gain or loss from investments in the Statement of Operations. Reported net realized foreign currency gains or losses arise from (1) sales of foreign currencies, (2) currency gains or losses realized between the trade and settlement dates on securities transactions, and (3) the difference between the amounts of dividends, interest, and foreign withholding taxes recorded on the Fund’s books and the U.S. dollar equivalent of the amounts actually received or paid. Net unrealized foreign currency gains and losses arise from changes in the fair values of assets and liabilities, other than investments in securities at fiscal period end, resulting from changes in exchange rates. |
The Fund may invest in foreign securities, which may be subject to foreign taxes on income, gains on investments or currency repatriation, a portion of which may be recoverable. Foreign taxes, if any, are recorded based on the tax regulations and rates that exist in the foreign markets in which the Fund invests and are shown in the Statement of Operations.
| K. | Forward Foreign Currency Contracts – The Fund may engage in foreign currency transactions either on a spot (i.e. for prompt delivery and settlement) basis, or through forward foreign currency contracts, to manage or minimize currency or exchange rate risk. |
The Fund may also enter into forward foreign currency contracts for the purchase or sale of a security denominated in a foreign currency in order to “lock in” the U.S. dollar price of that security, or the Fund may also enter into forward foreign currency contracts that do not provide for physical settlement of the two currencies, but instead are settled by a single cash payment calculated as the difference between the agreed upon exchange rate and the spot rate at settlement based upon an agreed upon notional amount (non-deliverable forwards). The Fund will set aside liquid assets in an amount equal to the daily mark-to-market obligation for forward foreign currency contracts.
A forward foreign currency contract is an obligation between two parties (“Counterparties”) to purchase or sell a specific currency for an agreed-upon price at a future date. The use of forward foreign currency contracts does not eliminate fluctuations in the price of the underlying securities the Fund owns or intends to acquire but establishes a rate of exchange in advance. Fluctuations in the value of these contracts are measured by the difference in the contract date and reporting date exchange rates and are recorded as unrealized appreciation (depreciation) until the contracts are closed. When the contracts are closed, realized gains (losses) are recorded. Realized and unrealized gains (losses) on the contracts are included in the Statement of Operations. The primary risks associated with forward foreign currency contracts include failure of the Counterparty to meet the terms of the contract and the value of the foreign currency changing unfavorably. These risks may be in excess of the amounts reflected in the Statement of Assets and Liabilities.
| L. | Other Risks - The Fund’s investments are concentrated in a comparatively narrow segment of the economy, which may make the Fund more volatile. |
Many products and services offered in technology-related industries are subject to rapid obsolescence, which may lower the value of the issuers in this sector.
NOTE 2—Advisory Fees and Other Fees Paid to Affiliates
The Trust has entered into a master investment advisory agreement with Invesco Advisers, Inc. (the "Adviser" or "Invesco"). Under the terms of the investment advisory agreement, the Fund accrues daily and pays monthly an advisory fee to the Adviser based on the annual rate of the Fund’s average daily net assets as follows:
| Average Daily Net Assets | Rate |
| First $350 million | 0.75% |
| Next $350 million | 0.65% |
| Next $1.3 billion | 0.55% |
| Next $2 billion | 0.45% |
| Next $2 billion | 0.40% |
| Next $2 billion | 0.375% |
| Over $8 billion | 0.35% |
For the year ended April 30, 2019, the effective advisory fees incurred by the Fund was 0.66%.
Under the terms of a master sub-advisory agreement between the Adviser and each of Invesco Asset Management Deutschland GmbH, Invesco Asset Management Limited, Invesco Asset Management (Japan) Limited, Invesco Hong Kong Limited, Invesco Senior Secured Management, Inc. and Invesco Canada Ltd. (collectively, the "Affiliated Sub-Advisers") the Adviser, not the Fund, will pay 40% of the fees paid to the Adviser to any such Affiliated Sub-Adviser(s) that provide(s) discretionary investment management services to the Fund based on the percentage of assets allocated to such Affiliated Sub-Adviser(s).
The Adviser has contractually agreed, through at least June 30, 2020, to waive advisory fees and/or reimburse expenses of all shares to the extent necessary to limit total annual fund operating expenses after fee waiver and/or expense reimbursement (excluding certain items discussed
| 18 | Invesco Technology Fund |
above) of Class A, Class C, Class Y, Investor Class, Class R5 and Class R6 shares to 2.00%, 2.75%, 1.75%, 2.00%, 1.75% and 1.75%, respectively, of average daily net assets (the “expense limits”). In determining the Adviser’s obligation to waive advisory fees and/or reimburse expenses, the following expenses are not taken into account, and could cause the total annual fund operating expenses after fee waiver and/or expense reimbursement to exceed the numbers reflected above: (1) interest; (2) taxes; (3) dividend expense on short sales; (4) extraordinary or nonroutine items, including litigation expenses; and (5) expenses that the Fund has incurred but did not actually pay because of an expense offset arrangement. Unless Invesco continues the fee waiver agreement, it will terminate on June 30, 2020. During its term, the fee waiver agreement cannot be terminated or amended to increase the expense limits or reduce the advisory fee waiver without approval of the Board of Trustees. The Adviser did not waive fees and/or reimburse expenses during the period under these expense limits.
Further, the Adviser has contractually agreed, through at least June 30, 2021, to waive the advisory fee payable by the Fund in an amount equal to 100% of the net advisory fees the Adviser receives from the affiliated money market funds on investments by the Fund of uninvested cash (excluding investments of cash collateral from securities lending) in such affiliated money market funds.
For the year ended April 30, 2019, the Adviser waived advisory fees of $18,908.
The Trust has entered into a master administrative services agreement with Invesco pursuant to which the Fund has agreed to pay Invesco for certain administrative costs incurred in providing accounting services to the Fund. For the year ended April 30, 2019, expenses incurred under the agreement are shown in the Statement of Operations asAdministrative services fees. Also, Invesco has entered into a sub-administration agreement whereby State Street Bank and Trust Company (“SSB”) serves as custodian and fund accountant and provides certain administrative services to the Fund.
The Trust has entered into a transfer agency and service agreement with Invesco Investment Services, Inc. (“IIS”) pursuant to which the Fund has agreed to pay IIS a fee for providing transfer agency and shareholder services to the Fund and reimburse IIS for certain expenses incurred by IIS in the course of providing such services. IIS may make payments to intermediaries that provide omnibus account services, sub-accounting services and/or networking services. All fees payable by IIS to intermediaries that provide omnibus account services or sub-accounting services are charged back to the Fund, subject to certain limitations approved by the Trust’s Board of Trustees. For the year ended April 30, 2019, expenses incurred under the agreement are shown in the Statement of Operations asTransfer agent fees.
The Trust has entered into master distribution agreements with Invesco Distributors, Inc. (“IDI”) to serve as the distributor for the Class A, Class C, Class Y, Investor Class, Class R5 and Class R6 shares of the Fund. The Trust has adopted plans pursuant to Rule 12b-1 under the 1940 Act with respect to the Fund’s Class A, Class C and Investor Class shares (collectively, the “Plans”). The Fund, pursuant to the Plans, pays IDI compensation at the annual rate of 0.25% of the Fund’s average daily net assets of Class A shares and 1.00% of the average daily net assets of Class C shares. The Fund, pursuant to the Investor Class Plan, reimburses IDI for its allocated share of expenses incurred pursuant to the Investor Class Plan for the period, up to a maximum annual rate of 0.25% of the average daily net assets of Investor Class shares. The fees are accrued daily and paid monthly. Of the Plan payments, up to 0.25% of the average daily net assets of each class of shares may be paid to furnish continuing personal shareholder services to customers who purchase and own shares of such classes. Any amounts not paid as a service fee under the Plans would constitute an asset-based sales charge. Rules of the Financial Industry Regulatory Authority (“FINRA”) impose a cap on the total sales charges, including asset-based sales charges, that may be paid by any class of shares of the Fund. For the year ended April 30, 2019, expenses incurred under the Plans are shown in the Statement of Operations asDistribution fees.
Front-end sales commissions and CDSC (collectively, the “sales charges”) are not recorded as expenses of the Fund. Front-end sales commissions are deducted from proceeds from the sales of Fund shares prior to investment in Class A shares of the Fund. CDSC are deducted from redemption proceeds prior to remittance to the shareholder. During the year ended April 30, 2019, IDI advised the Fund that IDI retained $85,048 in front-end sales commissions from the sale of Class A shares and $725 and $3,187 from Class A and Class C shares, respectively, for CDSC imposed upon redemptions by shareholders.
For the year ended April 30, 2019, the Fund incurred $5,669 in brokerage commissions with Invesco Capital Markets, Inc., an affiliate of the Adviser and IDI, for portfolio transactions executed on behalf of the Fund.
Certain officers and trustees of the Trust are officers and directors of the Adviser, IIS and/or IDI.
NOTE 3—Additional Valuation Information
GAAP defines fair value as the price that would be received to sell an asset or paid to transfer a liability in an orderly transaction between market participants at the measurement date, under current market conditions. GAAP establishes a hierarchy that prioritizes the inputs to valuation methods, giving the highest priority to readily available unadjusted quoted prices in an active market for identical assets (Level 1) and the lowest priority to significant unobservable inputs (Level 3), generally when market prices are not readily available or are unreliable. Based on the valuation inputs, the securities or other investments are tiered into one of three levels. Changes in valuation methods may result in transfers in or out of an investment’s assigned level:
Level 1 – Prices are determined using quoted prices in an active market for identical assets.
Level 2 – Prices are determined using other significant observable inputs. Observable inputs are inputs that other market participants may use in pricing a security. These may include quoted prices for similar securities, interest rates, prepayment speeds, credit risk, yield curves, loss severities, default rates, discount rates, volatilities and others.
Level 3 – Prices are determined using significant unobservable inputs. In situations where quoted prices or observable inputs are unavailable (for example, when there is little or no market activity for an investment at the end of the period), unobservable inputs may be used. Unobservable inputs reflect the Fund’s own assumptions about the factors market participants would use in determining fair value of the securities or instruments and would be based on the best available information.
| 19 | Invesco Technology Fund |
The following is a summary of the tiered valuation input levels, as of April 30, 2019. The level assigned to the securities valuations may not be an indication of the risk or liquidity associated with investing in those securities. Because of the inherent uncertainties of valuation, the values reflected in the financial statements may materially differ from the value received upon actual sale of those investments.
| | Level 1 | Level 2 | Level 3 | Total |
| Investments in Securities | | | | |
| Common Stocks & Other Equity Interests | $909,686,327 | $46,711,487 | $— | $956,397,814 |
| Money Market Funds | 9,568,210 | — | — | 9,568,210 |
| Total Investments | $919,254,537 | $46,711,487 | $— | $965,966,024 |
NOTE 4—Expense Offset Arrangement(s)
The expense offset arrangement is comprised of transfer agency credits which result from balances in demand deposit accounts used by the transfer agent for clearing shareholder transactions. For the year ended April 30, 2019, the Fund received credits from this arrangement, which resulted in the reduction of the Fund’s total expenses of $32,993.
NOTE 5—Trustees’ and Officers’ Fees and Benefits
Trustees’ and Officers’ Fees and Benefits include amounts accrued by the Fund to pay remuneration to certain Trustees and Officers of the Fund. Trustees have the option to defer compensation payable by the Fund, and Trustees’ and Officers’ Fees and Benefits also include amounts accrued by the Fund to fund such deferred compensation amounts. Those Trustees who defer compensation have the option to select various Invesco Funds in which their deferral accounts shall be deemed to be invested. Finally, certain current Trustees were eligible to participate in a retirement plan that provided for benefits to be paid upon retirement to Trustees over a period of time based on the number of years of service. The Fund may have certain former Trustees who also participate in a retirement plan and receive benefits under such plan.Trustees’ and Officers’ Fees and Benefits include amounts accrued by the Fund to fund such retirement benefits. Obligations under the deferred compensation and retirement plans represent unsecured claims against the general assets of the Fund.
NOTE 6—Cash Balances
The Fund is permitted to temporarily carry a negative or overdrawn balance in its account with SSB, the custodian bank. Such balances, if any at period-end, are shown in the Statement of Assets and Liabilities under the payable captionAmount due custodian. To compensate the custodian bank for such overdrafts, the overdrawn Fund may either (1) leave funds as a compensating balance in the account so the custodian bank can be compensated by earning the additional interest; or (2) compensate by paying the custodian bank at a rate agreed upon by the custodian bank and Invesco, not to exceed the contractually agreed upon rate.
NOTE 7—Distributions to Shareholders and Tax Components of Net Assets
| Tax Character of Distributions to Shareholders Paid During the Fiscal Years Ended April 30, 2019 and 2018 |
| | 2019 | 2018 |
| Ordinary income | $— | $3,077,054 |
| Long-term capital gain | 69,602,050 | 30,900,294 |
| Total distributions | $69,602,050 | $33,977,348 |
| Tax Components of Net Assets at Period-End: |
| | 2019 |
| Undistributed long-term capital gain | $61,521,107 |
| Net unrealized appreciation — investments | 452,683,083 |
| Net unrealized appreciation — foreign currencies | 20,599 |
| Temporary book/tax differences | (182,526) |
| Late-Year ordinary loss deferral | (2,278,120) |
| Post-October capital loss deferral | (6,029,510) |
| Shares of beneficial interest | 474,792,296 |
| Total net assets | $980,526,929 |
The difference between book-basis and tax-basis unrealized appreciation (depreciation) is due to differences in the timing of recognition of gains and losses on investments for tax and book purposes. The Fund’s net unrealized appreciation (depreciation) difference is attributable primarily to wash sales.
The temporary book/tax differences are a result of timing differences between book and tax recognition of income and/or expenses. The Fund’s temporary book/tax differences are the result of the trustee deferral of compensation and retirement plan benefits.
Capital loss carryforward is calculated and reported as of a specific date. Results of transactions and other activity after that date may affect the amount of capital loss carryforward actually available for the Fund to utilize. Capital losses generated in years beginning after December 22, 2010 can be carried forward for an unlimited period, whereas previous losses expire in eight tax years. Capital losses with an expiration period may not be used to offset capital gains until all net capital losses without an expiration date have been utilized. Capital loss carryforwards with no expiration date
| 20 | Invesco Technology Fund |
will retain their character as either short-term or long-term capital losses instead of as short-term capital losses as under prior law. The ability to utilize capital loss carryforwards in the future may be limited under the Internal Revenue Code and related regulations based on the results of future transactions.
The Fund does not have a capital loss carryforward as of April 30, 2019.
NOTE 8—Investment Transactions
The aggregate amount of investment securities (other than short-term securities, U.S. Treasury obligations and money market funds, if any) purchased and sold by the Fund during the year ended April 30, 2019 was $439,445,745 and $489,396,977, respectively. Cost of investments, including any derivatives, on a tax basis includes the adjustments for financial reporting purposes as of the most recently completed federal income tax reporting period-end.
| Unrealized Appreciation (Depreciation) of Investments on a Tax Basis |
| Aggregate unrealized appreciation of investments | $455,651,956 |
| Aggregate unrealized (depreciation) of investments | (2,968,873) |
| Net unrealized appreciation of investments | $452,683,083 |
Cost of investments for tax purposes is $513,282,941.
NOTE 9—Reclassification of Permanent Differences
Primarily as a result of differing book/tax treatment of net operating loss, on April 30, 2019, undistributed net investment income (loss) was increased by $4,471,838, undistributed net realized gain (loss) was decreased by $2,842,879 and shares of beneficial interest was decreased by $1,628,959. This reclassification had no effect on the net assets of the Fund.
| 21 | Invesco Technology Fund |
NOTE 10—Share Information
| | Summary of Share Activity |
| | Years ended April 30, |
| | 2019(a) | | 2018 |
| | Shares | Amount | | Shares | Amount |
| Sold: | | | | | |
| Class A | 1,165,594 | $57,202,175 | | 1,080,192 | $48,966,844 |
| Class B(b) | — | — | | 1,468 | 55,911 |
| Class C | 304,477 | 12,186,625 | | 321,979 | 12,008,651 |
| Class Y | 345,911 | 17,105,926 | | 322,754 | 14,664,978 |
| Investor Class | 352,388 | 17,112,863 | | 586,193 | 26,339,535 |
| Class R5 | 1,638 | 92,014 | | 27,714 | 1,348,572 |
| Class R6 | 7,888 | 384,606 | | 644 | 34,337 |
| Issued as reinvestment of dividends: | | | | | |
| Class A | 669,047 | 28,086,552 | | 301,902 | 13,410,507 |
| Class B(b) | — | — | | 2,680 | 101,364 |
| Class C | 115,840 | 3,849,363 | | 45,149 | 1,633,499 |
| Class Y | 57,091 | 2,436,631 | | 19,973 | 898,580 |
| Investor Class | 774,274 | 32,333,688 | | 376,477 | 16,625,230 |
| Class R5 | 268 | 13,395 | | 149 | 7,721 |
| Class R6 | 41 | 2,057 | | 5 | 275 |
| Conversion of Class B shares to Class A shares:(c) | | | | | |
| Class A | — | — | | 59,723 | 2,940,746 |
| Class B | — | — | | (72,038) | (2,940,746) |
| Automatic conversion of Class C shares to Class A shares: | | | | | |
| Class A | 374,011 | 16,430,312 | | - | - |
| Class C | (472,845) | (16,430,312) | | - | - |
| Reacquired: | | | | | |
| Class A | (1,324,107) | (62,896,413) | | (1,212,452) | (54,727,824) |
| Class B(b) | — | — | | (29,459) | (1,119,706) |
| Class C | (275,231) | (10,534,562) | | (231,123) | (8,549,338) |
| Class Y | (331,510) | (15,071,297) | | (196,048) | (9,038,208) |
| Investor Class | (1,079,268) | (50,765,506) | | (1,104,288) | (49,510,770) |
| Class R5 | (436) | (26,403) | | (27,762) | (1,368,826) |
| Class R6 | (544) | (29,349) | | (104) | (5,735) |
| Net increase in share activity | 684,527 | $31,482,365 | | 273,728 | $11,775,597 |
| (a) | There are entities that are record owners of more than 5% of the outstanding shares of the Fund and in the aggregate own 13% of the outstanding shares of the Fund. IDI has an agreement with these entities to sell Fund shares. The Fund, Invesco and/or Invesco affiliates may make payments to these entities, which are considered to be related to the Fund, for providing services to the Fund, Invesco and/or Invesco affiliates including but not limited to services such as securities brokerage, distribution, third party record keeping and account servicing. The Fund has no knowledge as to whether all or any portion of the shares owned of record by these entities are also owned beneficially. |
| (b) | Class B shares activity for the period May 1, 2017 through January 26, 2018 (date of conversion). |
| (c) | Effective as of the close of business on January 26, 2018, all outstanding Class B shares were converted to Class A shares. |
| 22 | Invesco Technology Fund |
Report of Independent Registered Public Accounting Firm
To the Board of Trustees of AIM Sector Funds (Invesco Sector Funds) and Shareholders of Invesco Technology Fund:
Opinion on the Financial Statements
We have audited the accompanying statement of assets and liabilities, including the schedule of investments, of Invesco Technology Fund (one of the funds constituting AIM Sector Funds (Invesco Sector Funds), hereafter referred to as the “Fund”) as of April 30, 2019, the related statement of operations for the year ended April 30, 2019, the statement of changes in net assets for each of the two years in the period ended April 30, 2019, including the related notes, and the financial highlights for each of the periods indicated therein (collectively referred to as the “financial statements”). In our opinion, the financial statements present fairly, in all material respects, the financial position of the Fund as of April 30, 2019, the results of its operations for the year then ended, the changes in its net assets for each of the two years in the period ended April 30, 2019 and the financial highlights for each of the periods indicated therein in conformity with accounting principles generally accepted in the United States of America.
Basis for Opinion
These financial statements are the responsibility of the Fund’s management. Our responsibility is to express an opinion on the Fund’s financial statements based on our audits. We are a public accounting firm registered with the Public Company Accounting Oversight Board (United States) (“PCAOB”) and are required to be independent with respect to the Fund in accordance with the U.S. federal securities laws and the applicable rules and regulations of the Securities and Exchange Commission and the PCAOB.
We conducted our audits of these financial statements in accordance with the standards of the PCAOB. Those standards require that we plan and perform the audit to obtain reasonable assurance about whether the financial statements are free of material misstatement, whether due to error or fraud.
Our audits included performing procedures to assess the risks of material misstatement of the financial statements, whether due to error or fraud, and performing procedures that respond to those risks. Such procedures included examining, on a test basis, evidence regarding the amounts and disclosures in the financial statements. Our audits also included evaluating the accounting principles used and significant estimates made by management, as well as evaluating the overall presentation of the financial statements. Our procedures included confirmation of securities owned as of April 30, 2019 by correspondence with the custodian, transfer agent and brokers; when replies were not received from brokers, we performed other auditing procedures. We believe that our audits provide a reasonable basis for our opinion.
PricewaterhouseCoopers LLP
Houston, TX
June 26, 2019
We have served as the auditor of one or more of the investment companies in the Invesco group of investment companies since at least 1995. We have not been able to determine the specific year we began serving as auditor.
| 23 | Invesco Technology Fund |
Calculating your ongoing Fund expenses
Example
As a shareholder of the Fund, you incur two types of costs: (1) transaction costs, which may include sales charges (loads) on purchase payments or contingent deferred sales charges on redemptions, if any; and (2) ongoing costs, including management fees, distribution and/or service (12b-1) fees, and other Fund expenses. This example is intended to help you understand your ongoing costs (in dollars) of investing in the Fund and to compare these costs with ongoing costs of investing in other mutual funds. The example is based on an investment of $1,000 invested at the beginning of the period and held for the entire period November 1, 2018 through April 30, 2019.
Actual expenses
The table below provides information about actual account values and actual expenses. You may use the information in this table, together with the amount you invested, to estimate the expenses that you paid over the period. Simply divide your account value by $1,000 (for example, an $8,600 account value divided by $1,000 = 8.6), then multiply the result by the number in the table under the heading entitled “Actual Expenses Paid During Period” to estimate the expenses you paid on your account during this period.
Hypothetical example for comparison purposes
The table below also provides information about hypothetical account values and hypothetical expenses based on the Fund’s actual expense ratio and an assumed rate of return of 5% per year before expenses, which is not the Fund’s actual return.
The hypothetical account values and expenses may not be used to estimate the actual ending account balance or expenses you paid for the period. You may use this information to compare the ongoing costs of investing in the Fund and other funds. To do so, compare this 5% hypothetical example with the 5% hypothetical examples that appear in the shareholder reports of the other funds.
Please note that the expenses shown in the table are meant to highlight your ongoing costs only and do not reflect any transaction costs, such as sales charges (loads) on purchase payments or contingent deferred sales charges on redemptions, if any. Therefore, the hypothetical information is useful in comparing ongoing costs only, and will not help you determine the relative total costs of owning different funds. In addition, if these transaction costs were included, your costs would have been higher.
| | Beginning
Account Value (11/01/18) | ACTUAL | HYPOTHETICAL
(5% annual return before
expenses) | Annualized
Expense
Ratio |
Ending
Account Value
(04/30/19)1 | Expenses
Paid During
Period2 | Ending
Account Value
(04/30/19) | Expenses
Paid During
Period2 |
| Class A | $1,000.00 | $1,122.20 | $6.58 | $1,018.60 | $6.26 | 1.25% |
| Class C | 1,000.00 | 1,118.10 | 10.50 | 1,014.88 | 9.99 | 2.00 |
| Class Y | 1,000.00 | 1,123.70 | 5.27 | 1,019.84 | 5.01 | 1.00 |
| Investor Class | 1,000.00 | 1,122.80 | 5.95 | 1,019.19 | 5.66 | 1.13 |
| Class R5 | 1,000.00 | 1,124.60 | 4.32 | 1,020.73 | 4.11 | 0.82 |
| Class R6 | 1,000.00 | 1,124.80 | 4.16 | 1,020.88 | 3.96 | 0.79 |
| 1 | The actual ending account value is based on the actual total return of the Fund for the period November 1, 2018 through April 30, 2019, after actual expenses and will differ from the hypothetical ending account value which is based on the Fund’s expense ratio and a hypothetical annual return of 5% before expenses. |
| 2 | Expenses are equal to the Fund’s annualized expense ratio as indicated above multiplied by the average account value over the period, multiplied by 181/365 to reflect the most recent fiscal half year. |
| 24 | Invesco Technology Fund |
Tax Information
Form 1099-DIV, Form 1042-S and other year–end tax information provide shareholders with actual calendar year amounts that should be included in their tax returns. Shareholders should consult their tax advisers.
The following distribution information is being provided as required by the Internal Revenue Code or to meet a specific state’s requirement.
The Fund designates the following amounts or, if subsequently determined to be different, the maximum amount allowable for its fiscal year ended April 30, 2019:
| Federal and State Income Tax | |
| Long-Term Capital Gain Distributions | $69,602,050 |
| Qualified Dividend Income* | 0% |
| Corporate Dividends Received Deduction* | 0% |
| U.S. Treasury Obligations* | 0% |
| * | The above percentages are based on ordinary income dividends paid to shareholders during the Fund’s fiscal year. |
| 25 | Invesco Technology Fund |
Trustees and Officers
The address of each trustee and officer is AIM Sector Funds (Invesco Sector Funds) (the “Trust”), 11 Greenway Plaza, Suite 1000, Houston, Texas 77046-1173. The trustees serve for the life of the Trust, subject to their earlier death, incapacitation, resignation, retirement or removal as more specifically provided in the Trust’s organizational documents. Each officer serves for a one year term or until their successors are elected and qualified. Column two below includes length of time served with predecessor entities, if any.
| | | | | | | | |
Name, Year of Birth and
Position(s) Held with the Trust | | Trustee and/
or Officer Since | | Principal Occupation(s)
During Past 5 Years | | Number of Funds in Fund
Complex
Overseen by
Trustee | | Other Directorship(s)
Held by Trustee During
Past 5 Years |
| Interested Persons | | | | | | | | |
Martin L. Flanagan1 — 1960 Trustee and Vice Chair | | 2007 | | Executive Director, Chief Executive Officer and President, Invesco Ltd. (ultimate parent of Invesco and a global investment management firm); Trustee and Vice Chair, The Invesco Funds; Vice Chair, Investment Company Institute; and Member of Executive Board, SMU Cox School of Business Formerly: Advisor to the Board, Invesco Advisers, Inc. (formerly known as Invesco Institutional (N.A.), Inc.); Chairman and Chief Executive Officer, Invesco Advisers, Inc. (registered investment adviser); Director, Chairman, Chief Executive Officer and President, Invesco Holding Company (US), Inc. (formerly IVZ Inc.) (holding company), Invesco Group Services, Inc. (service provider) and Invesco North American Holdings, Inc. (holding company); Director, Chief Executive Officer and President, Invesco Holding Company Limited (parent of Invesco and a global investment management firm); Director, Invesco Ltd.; Chairman, Investment Company Institute and President,Co-Chief Executive Officer,Co-President, Chief Operating Officer and Chief Financial Officer, Franklin Resources, Inc. (global investment management organization) | | 241 | | None |
Philip A. Taylor2 — 1954 Trustee | | 2006 | | Vice Chair, Invesco Ltd.; Director, Invesco Canada Ltd. (formerly known as Invesco Trimark Ltd./Invesco Trimark Ltèe) (registered investment adviser and registered transfer agent); Trustee, The Invesco Funds Formerly: Head of the Americas and Senior Managing Director, Invesco Ltd.; Director, Invesco Advisers, Inc. (formerly known as Invesco Institutional (N.A.), Inc.) (registered investment adviser); Director and Chairman, Invesco Investment Services, Inc. (formerly known as Invesco AIM Investment Services, Inc.) (registered transfer agent); Chief Executive Officer, Invesco Corporate Class Inc. (corporate mutual fund company); Chairman and Chief Executive Officer, Invesco Canada Ltd. (formerly known as Invesco Trimark Ltd./Invesco Trimark Ltèe) (registered investment adviser and registered transfer agent); Senior Vice President, The Invesco Funds; Director, Invesco Investment Advisers LLC (formerly known as Van Kampen Asset Management); Director, Chairman, Chief Executive Officer and President, Invesco Management Group, Inc. (formerly known as Invesco AIM Management Group, Inc.) (financial services holding company);Co-Chairman,Co-President andCo-Chief Executive Officer, Invesco Advisers, Inc. (formerly known as Invesco Institutional (N.A.), Inc.) (registered investment adviser); Director, Chief Executive Officer and President, Van Kampen Exchange Corp; President and Principal Executive Officer, The Invesco Funds (other than AIM Treasurer’s Series Trust (Invesco Treasurer’s Series Trust), Short-Term Investments Trust and Invesco Management Trust); Executive Vice President, The Invesco Funds (AIM Treasurer’s Series Trust (Invesco Treasurer’s Series Trust), Short-Term Investments Trust and Invesco Management Trust only); Director and President, INVESCO Funds Group, Inc. (registered investment adviser and registered transfer agent); Director and Chairman, IVZ Distributors, Inc. (formerly known as INVESCO Distributors, Inc.) (registered broker dealer); Director, President and Chairman, Invesco Inc. (holding company), Invesco Canada Holdings Inc. (holding company), Trimark Investments Ltd./Placements Trimark Ltèe and Invesco Financial Services Ltd/Services Financiers Invesco Ltèe; Chief Executive Officer, Invesco Canada Fund Inc. (corporate mutual fund company); Director and Chairman, Van Kampen Investor Services Inc.; Director, Chief Executive Officer and President, 1371 Preferred Inc. (holding company) and Van Kampen Investments Inc.; Director and President, AIM GP Canada Inc. (general partner for limited partnerships) and Van Kampen Advisors, Inc.; Director and Chief Executive Officer, Invesco Trimark Dealer Inc. (registered broker dealer); Director, Invesco Distributors, Inc. (formerly known as Invesco AIM Distributors, Inc.) (registered broker dealer); Manager, Invesco Capital Management LLC; Director, Chief Executive Officer and President, Invesco Advisers, Inc.; Director, Chairman, Chief Executive Officer and President, Invesco AIM Capital Management, Inc.; President, Invesco Trimark Dealer Inc. and Invesco Trimark Ltd./Invesco Trimark Ltèe; Director and President, AIM Trimark Corporate Class Inc. and AIM Trimark Canada Fund Inc.; Senior Managing Director, Invesco Holding Company Limited; Director and Chairman, Fund Management Company (former registered broker dealer); President and Principal Executive Officer, The Invesco Funds (AIM Treasurer’s Series Trust (Invesco Treasurer’s Series Trust), and Short-Term Investments Trust only); President, AIM Trimark Global Fund Inc. and AIM Trimark Canada Fund Inc. | | 241 | | None |
| 1 | Mr. Flanagan is considered an interested person (within the meaning of Section 2(a)(19) of the 1940 Act) of the Trust because he is an officer of the Adviser to the Trust, and an officer and a director of Invesco Ltd., ultimate parent of the Adviser. |
| 2 | Mr. Taylor is considered an interested person (within the meaning of Section 2(a)(19) of the 1940 Act) of the Trust because he is an officer of Invesco Ltd., ultimate parent of the Adviser. |
T-1 Invesco Technology Fund
Trustees and Officers—(continued)
| | | | | | | | |
Name, Year of Birth and
Position(s) Held with the Trust | | Trustee and/
or Officer Since | | Principal Occupation(s)
During Past 5 Years | | Number of Funds in Fund
Complex
Overseen by
Trustee | | Other Directorship(s)
Held by Trustee During
Past 5 Years |
| Independent Trustees | | | | | | | | |
Bruce L. Crockett — 1944 Trustee and Chair | | 2003 | | Chairman, Crockett Technologies Associates (technology consulting company) Formerly: Director, Captaris (unified messaging provider); Director, President and Chief Executive Officer, COMSAT Corporation; Chairman, Board of Governors of INTELSAT (international communications company); ACE Limited (insurance company); Independent Directors Council and Investment Company Institute: Member of the Audit Committee, Investment Company Institute; Member of the Executive Committee and Chair of the Governance Committee, Independent Directors Council | | 241 | | Director and Chairman of the Audit Committee, ALPS (Attorneys Liability Protection Society) (insurance company); Director and Member of the Audit Committee and Compensation Committee, Ferroglobe PLC (metallurgical company) |
David C. Arch — 1945 Trustee | | 2010 | | Chairman of Blistex Inc. (consumer health care products manufacturer); Member, World Presidents’ Organization | | 241 | | Board member of the Illinois Manufacturers’ Association |
Beth Ann Brown3 — 1968 Trustee | | 2019 | | Independent Consultant Formerly: Head of Intermediary Distribution, Managing Director, Strategic Relations, Managing Director, Head of National Accounts, Senior Vice President, National Account Manager and Senior Vice President, Key Account Manager, Columbia Management Investment Advisers LLC; Vice President, Key Account Manager, Liberty Funds Distributor, Inc.; and Trustee of certain Oppenheimer Funds | | 225 | | Director, Board of Directors of Caron Engineering Inc.; Advisor, Board of Advisors of Caron Engineering Inc.; President and Director, Acton Shapleigh Youth Conservation Corps (non -profit); and Vice President and Director of Grahamtastic Connection(non-profit) |
Jack M. Fields — 1952 Trustee | | 2003 | | Chief Executive Officer, Twenty First Century Group, Inc. (government affairs company); and Chairman, Discovery Learning Alliance(non-profit) Formerly: Owner and Chief Executive Officer, Dos Angeles Ranch L.P. (cattle, hunting, corporate entertainment); Director, Insperity, Inc. (formerly known as Administaff) (human resources provider); Chief Executive Officer, Texana Timber LP (sustainable forestry company); Director of Cross Timbers Quail Research Ranch(non-profit); and member of the U.S. House of Representatives | | 241 | | None |
Cynthia Hostetler — 1962 Trustee | | 2017 | | Non-Executive Director and Trustee of a number of public and private business corporations Formerly: Director, Aberdeen Investment Funds (4 portfolios); Head of Investment Funds and Private Equity, Overseas Private Investment Corporation; President, First Manhattan Bancorporation, Inc.; Attorney, Simpson Thacher & Bartlett LLP | | 241 | | Vulcan Materials Company (construction materials company); Trilinc Global Impact Fund; Genesee & Wyoming, Inc. (railroads); Artio Global Investment LLC (mutual fund complex); Edgen Group, Inc. (specialized energy and infrastructure products distributor); Investment Company Institute (professional organization); Independent Directors Council (professional organization) |
Eli Jones — 1961 Trustee | | 2016 | | Professor and Dean, Mays Business School — Texas A&M University Formerly: Professor and Dean, Walton College of Business, University of Arkansas and E.J. Ourso College of Business, Louisiana State University; Director, Arvest Bank | | 241 | | Insperity, Inc. (formerly known as Administaff) (human resources provider) |
Elizabeth Krentzman3 — 1959 Trustee | | 2019 | | Formerly: Principal and Chief Regulatory Advisor for Asset Management Services and U.S. Mutual Fund Leader of Deloitte & Touche LLP; General Counsel of the Investment Company Institute (trade association); National Director of the Investment Management Regulatory Consulting Practice, Principal, Director and Senior Manager of Deloitte & Touche LLP; Assistant Director of the Division of Investment Management — Office of Disclosure and Investment Adviser Regulation of the U.S. Securities and Exchange Commission and various positions with the Division of Investment Management — Office of Regulatory Policy of the U.S. Securities and Exchange Commission; Associate at Ropes & Gray LLP; Advisory Board Member of the Securities and Exchange Commission Historical Society; and Trustee of certain Oppenheimer Funds | | 225 | | Trustee of the University of Florida National Board Foundation and Audit Committee Member; Member of the Cartica Funds Board of Directors (private investment funds); Member of the University of Florida Law Center Association, Inc. Board of Trustees and Audit Committee Member |
Anthony J. LaCava, Jr. — 1956 Trustee | | 2019 | | Formerly: Director and Member of the Audit Committee, Blue Hills Bank (publicly traded financial institution) and Managing Partner, KPMG LLP | | 241 | | Blue Hills Bank; Chairman, Bentley University; Member, Business School Advisory Council; and Nominating Committee, KPMG LLP |
Prema Mathai-Davis — 1950 Trustee | | 2003 | | Retired Co-Owner & Partner of Quantalytics Research, LLC, (a FinTech Investment Research Platform for the Self-Directed Investor) | | 241 | | None |
| 3 | Mss. Brown and Krentzman and Messrs. Motley, Vandivort and Vaughn were appointed as Trustees of the Trust effective June 10, 2019. |
T-2 Invesco Technology Fund
Trustees and Officers—(continued)
| | | | | | | | |
Name, Year of Birth and
Position(s) Held with the Trust | | Trustee and/
or Officer Since | | Principal Occupation(s)
During Past 5 Years | | Number of Funds in Fund
Complex
Overseen by
Trustee | | Other Directorship(s)
Held by Trustee During
Past 5 Years |
| Independent Trustees—(continued) |
Joel W. Motley3 — 1952 Trustee | | 2019 | | Director of Office of Finance, Federal Home Loan Bank; Member of the Vestry of Trinity Wall Street; Managing Director of Carmona Motley Inc. (privately held financial advisor); Member of the Finance and Budget Committee of the Council on Foreign Relations, Member of the Investment Committee and Board of Human Rights Watch and Member of the Investment Committee and Board of Historic Hudson Valley(non-profit cultural organization) Formerly: Managing Director of Public Capital Advisors, LLC (privately held financial advisor); Managing Director of Carmona Motley Hoffman, Inc. (privately held financial advisor); Trustee of certain Oppenheimer Funds; and Director of Columbia Equity Financial Corp. (privately held financial advisor) | | 225 | | Director of Greenwall Foundation (bioethics research foundation); Member of Board and Investment Committee of The Greenwall Foundation; Director of Southern Africa Legal Services Foundation; Board Member and Investment Committee Member of Pulitzer Center for Crisis Reporting(non-profit journalism) |
Teresa M. Ressel — 1962 Trustee | | 2017 | | Non-executive director and trustee of a number of public and private business corporations Formerly: Chief Financial Officer, Olayan America, The Olayan Group (international investor/commercial/industrial); Chief Executive Officer, UBS Securities LLC; Group Chief Operating Officer, Americas, UBS AG; Assistant Secretary for Management & Budget and CFO, US Department of the Treasury | | 241 | | Atlantic Power Corporation (power generation company); ON Semiconductor Corp. (semiconductor supplier) |
Ann Barnett Stern — 1957 Trustee | | 2017 | | President and Chief Executive Officer, Houston Endowment Inc. (private philanthropic institution) Formerly: Executive Vice President and General Counsel, Texas Children’s Hospital; Attorney, Beck, Redden and Secrest, LLP; Business Law Instructor, University of St. Thomas; Attorney, Andrews & Kurth LLP | | 241 | | Federal Reserve Bank of Dallas |
Raymond Stickel, Jr. — 1944 Trustee | | 2005 | | Retired Formerly: Director, Mainstay VP Series Funds, Inc. (25 portfolios); Partner, Deloitte & Touche | | 241 | | None |
Robert C. Troccoli — 1949 Trustee | | 2016 | | Adjunct Professor, University of Denver — Daniels College of Business Formerly: Senior Partner, KPMG LLP | | 241 | | None |
Daniel S. Vandivort3 — 1954 Trustee | | 2019 | | Treasurer, Chairman of the Audit and Finance Committee, and Trustee, Board of Trustees, Huntington Disease Foundation of America; and President, Flyway Advisory Services LLC (consulting and property management) Formerly: Trustee and Governance Chair, of certain Oppenheimer Funds | | 225 | | Chairman and Lead Independent Director, Chairman of the Audit Committee, and Director, Board of Directors, Value Line Funds |
James D. Vaughn3 — 1945 Trustee | | 2019 | | Retired Formerly: Managing Partner, Deloitte & Touche LLP; Trustee and Chairman of the Audit Committee, Schroder Funds; Board Member, Mile High United Way, Boys and Girls Clubs, Boy Scouts, Colorado Business Committee for the Arts, Economic Club of Colorado and Metro Denver Network (economic development corporation); and Trustee of certain Oppenheimer Funds | | 225 | | Board member and Chairman of Audit Committee of AMG National Trust Bank; Trustee and Investment Committee member, University of South Dakota Foundation; Board member, Audit Committee Member and past Board Chair, Junior Achievement(non-profit) |
Christopher L. Wilson — 1957 Trustee and Vice Chair | | 2017 | | Non-executive director and trustee of a number of public and private business corporations Formerly: Director, TD Asset Management USA Inc. (mutual fund complex) (22 portfolios); Managing Partner, CT2, LLC (investing and consulting firm); President/Chief Executive Officer, Columbia Funds, Bank of America Corporation; President/Chief Executive Officer, CDC IXIS Asset Management Services, Inc.; Principal & Director of Operations, Scudder Funds, Scudder, Stevens & Clark, Inc.; Assistant Vice President, Fidelity Investments | | 241 | | ISO New England, Inc.(non-profit organization managing regional electricity market) |
| Other Officers | | | | | | | | |
Sheri Morris — 1964 President, Principal Executive Officer and Treasurer | | 2003 | | President, Principal Executive Officer and Treasurer, The Invesco Funds; Vice President, Invesco Advisers, Inc. (formerly known as Invesco Institutional (N.A.), Inc.) (registered investment adviser); and Vice President, Invesco Exchange-Traded Fund Trust, Invesco Exchange-Traded Fund Trust II, Invesco India Exchange-Traded Fund Trust, Invesco Actively Managed Exchange-Traded Fund Trust, Invesco Actively Managed Exchange-Traded Commodity Fund Trust and Invesco Exchange-Traded Self-Indexed Fund Trust Formerly: Vice President and Principal Financial Officer, The Invesco Funds; Vice President, Invesco AIM Advisers, Inc., Invesco AIM Capital Management, Inc. and Invesco AIM Private Asset Management, Inc.; Assistant Vice President and Assistant Treasurer, The Invesco Funds and Assistant Vice President, Invesco Advisers, Inc., Invesco AIM Capital Management, Inc. and Invesco AIM Private Asset Management, Inc.; and Treasurer, Invesco Exchange-Traded Fund Trust, Invesco Exchange-Traded Fund Trust II, Invesco India Exchange-Traded Fund Trust and Invesco Actively Managed Exchange-Traded Fund Trust | | N/A | | N/A |
Russell C. Burk — 1958 Senior Vice President and Senior Officer | | 2005 | | Senior Vice President and Senior Officer, The Invesco Funds | | N/A | | N/A |
| 3 | Mss. Brown and Krentzman and Messrs. Motley, Vandivort and Vaughn were appointed as Trustees of the Trust effective June 10, 2019. |
T-3 Invesco Technology Fund
Trustees and Officers—(continued)
| | | | | | | | |
Name, Year of Birth and
Position(s) Held with the Trust | | Trustee and/
or Officer Since | | Principal Occupation(s)
During Past 5 Years | | Number of Funds in Fund
Complex
Overseen by
Trustee | | Other Directorship(s)
Held by Trustee During
Past 5 Years |
| Other Officers—(continued) | | | | | | | | |
Jeffrey H. Kupor — 1968 Senior Vice President, Chief Legal Officer and Secretary | | 2018 | | Head of Legal of the Americas, Invesco Ltd.; Senior Vice President and Secretary, Invesco Advisers, Inc. (formerly known as Invesco Institutional (N.A.), Inc.) (registered investment adviser); Senior Vice President and Secretary, Invesco Distributors, Inc. (formerly known as Invesco AIM Distributors, Inc.); Vice President and Secretary, Invesco Investment Services, Inc. (formerly known as Invesco AIM Investment Services, Inc.) Senior Vice President, Chief Legal Officer and Secretary, The Invesco Funds; Secretary and General Counsel, Invesco Investment Advisers LLC (formerly known as Van Kampen Asset Management); Secretary and General Counsel, Invesco Capital Markets, Inc. (formerly known as Van Kampen Funds Inc.) and Chief Legal Officer, Invesco Exchange-Traded Fund Trust, Invesco Exchange-Traded Fund Trust II, Invesco India Exchange-Traded Fund Trust, Invesco Actively Managed Exchange-Traded Fund Trust, Invesco Actively Managed Exchange-Traded Commodity Fund Trust and Invesco Exchange-Traded Self-Indexed Fund Trust; Secretary, Invesco Indexing LLC; Secretary, W.L. Ross & Co., LLC; Secretary and Vice President, Jemstep, Inc. Formerly: Head of Legal, Worldwide Institutional, Invesco Ltd.; Secretary and General Counsel, INVESCO Private Capital Investments, Inc.; Senior Vice President, Secretary and General Counsel, Invesco Management Group, Inc. (formerly known as Invesco AIM Management Group, Inc.); Assistant Secretary, INVESCO Asset Management (Bermuda) Ltd.; Secretary and General Counsel, Invesco Private Capital, Inc.; Assistant Secretary and General Counsel, INVESCO Realty, Inc.; Secretary and General Counsel, Invesco Senior Secured Management, Inc.; and Secretary, Sovereign G./P. Holdings Inc. | | N/A | | N/A |
Andrew R. Schlossberg — 1974 Senior Vice President | | 2019 | | Head of the Americas and Senior Managing Director, Invesco Ltd.; Director and Senior Vice President, Invesco Advisers, Inc. (formerly known as Invesco Institutional (N.A.), Inc.) (registered investment adviser); Director and Chairman, Invesco Investment Services, Inc. (formerly known as Invesco AIM Investment Services, Inc.) (registered transfer agent); Senior Vice President, The Invesco Funds; Director, Invesco Investment Advisers LLC (formerly known as Van Kampen Asset Management) and Invesco UK Limited; Director, President and Chairman, Invesco Insurance Agency, Inc.; Director and Chief Executive, Invesco Asset Management Limited and Invesco Fund Managers Limited Formerly: Assistant Vice President, The Invesco Funds; Senior Vice President, Invesco Advisers, Inc. (formerly known as Invesco Institutional (N.A.), Inc.) (registered investment adviser); Director and Chief Executive, Invesco Administration Services Limited and Invesco Global Investment Funds Limited; Director, Invesco Distributors, Inc.; Head of EMEA, Invesco Ltd.; President, Invesco Actively Managed Exchange-Traded Commodity Fund Trust, Invesco Actively Managed Exchange-Traded Fund Trust, Invesco Exchange-Traded Fund Trust, Invesco Exchange-Traded Fund Trust II and Invesco India Exchange-Traded Fund Trust; Managing Director and Principal Executive Officer, Invesco Capital Management LLC | | N/A | | N/A |
John M. Zerr — 1962 Senior Vice President | | 2006 | | Chief Operating Officer of the Americas; Senior Vice President, Invesco Advisers, Inc. (formerly known as Invesco Institutional (N.A.), Inc.) (registered investment adviser); Senior Vice President, Invesco Distributors, Inc. (formerly known as Invesco AIM Distributors, Inc.); Director and Vice President, Invesco Investment Services, Inc. (formerly known as Invesco AIM Investment Services, Inc.) Senior Vice President, The Invesco Funds; Managing Director, Invesco Capital Management LLC; Director, Invesco Investment Advisers LLC (formerly known as Van Kampen Asset Management); Senior Vice President, Invesco Capital Markets, Inc. (formerly known as Van Kampen Funds Inc.); Manager, Invesco Indexing LLC; Director and Senior Vice President, Invesco Insurance Agency, Inc.; Invesco Canada Funds Advisory Board Member; Director, President Chief Executive Officer, Invesco Corporate Class Inc. (corporate mutual fund company); and Director, Chairman, President and Chief Executive Officer, Invesco Canada Ltd. (formerly known as Invesco Trimark Ltd./Invesco Trimark Ltèe) (registered investment adviser and registered transfer agent) Formerly: Director and Senior Vice President, Invesco Management Group, Inc. (formerly known as Invesco AIM Management Group, Inc.); Secretary and General Counsel, Invesco Management Group, Inc. (formerly known as Invesco AIM Management Group, Inc.); Secretary, Invesco Investment Services, Inc. (formerly known as Invesco AIM Investment Services, Inc.); Chief Legal Officer and Secretary, The Invesco Funds; Secretary and General Counsel, Invesco Investment Advisers LLC (formerly known as Van Kampen Asset Management); Secretary and General Counsel, Invesco Capital Markets, Inc. (formerly known as Van Kampen Funds Inc.); Chief Legal Officer, Invesco Exchange-Traded Fund Trust, Invesco Exchange-Traded Fund Trust II, Invesco India Exchange-Traded Fund Trust, Invesco Actively Managed Exchange-Traded Fund Trust, Invesco Actively Managed Exchange-Traded Commodity Fund Trust and Invesco Exchange-Traded Self-Indexed Fund Trust; Secretary, Invesco Indexing LLC; Director, Secretary, General Counsel and Senior Vice President, Van Kampen Exchange Corp.; Director, Vice President and Secretary, IVZ Distributors, Inc. (formerly known as INVESCO Distributors, Inc.); Director and Vice President, INVESCO Funds Group, Inc.; Director and Vice President, Van Kampen Advisors Inc.; Director, Vice President, Secretary and General Counsel, Van Kampen Investor Services Inc.; Director and Secretary, Invesco Distributors, Inc. (formerly known as Invesco AIM Distributors, Inc.); Director, Senior Vice President, General Counsel and Secretary, Invesco AIM Advisers, Inc. and Van Kampen Investments Inc.; Director, Vice President and Secretary, Fund Management Company; Director, Senior Vice President, Secretary, General Counsel and Vice President, Invesco AIM Capital Management, Inc.; Chief Operating Officer and General Counsel, Liberty Ridge Capital, Inc. (an investment adviser) | | N/A | | N/A |
T-4 Invesco Technology Fund
Trustees and Officers—(continued)
| | | | | | | | |
Name, Year of Birth and
Position(s) Held with the Trust | | Trustee and/
or Officer Since | | Principal Occupation(s)
During Past 5 Years | | Number of Funds in Fund
Complex
Overseen by
Trustee | | Other Directorship(s)
Held by Trustee During
Past 5 Years |
| Other Officers—(continued) | | | | | | | | |
Gregory G. McGreevey — 1962 Senior Vice President | | 2012 | | Senior Managing Director, Invesco Ltd.; Director, Chairman, President, and Chief Executive Officer, Invesco Advisers, Inc. (formerly known as Invesco Institutional (N.A.), Inc.) (registered investment adviser); Director, Invesco Mortgage Capital, Inc. and Invesco Senior Secured Management, Inc.; and Senior Vice President, The Invesco Funds Formerly: Senior Vice President, Invesco Management Group, Inc. and Invesco Advisers, Inc.; Assistant Vice President, The Invesco Funds | | N/A | | N/A |
Kelli Gallegos — 1970 Vice President, Principal Financial Officer and Assistant Treasurer | | 2008 | | Assistant Treasurer, Invesco Specialized Products, LLC; Vice President, Principal Financial Officer and Assistant Treasurer, The Invesco Funds; Principal Financial and Accounting Officer — Pooled Investments, Invesco Capital Management LLC; Vice President and Treasurer, Invesco Exchange-Traded Fund Trust, Invesco Exchange-Traded Fund Trust II, Invesco India Exchange-Traded Fund Trust, Invesco Actively Managed Exchange-Traded Fund Trust, Invesco Actively Managed Exchange-Traded Commodity Fund Trust and Invesco Exchange-Traded Self-Indexed Fund Trust Formerly: Assistant Treasurer, Invesco Exchange-Traded Fund Trust, Invesco Exchange-Traded Fund Trust II, Invesco India Exchange-Traded Fund Trust, Invesco Actively Managed Exchange-Traded Fund Trust, Invesco Actively Managed Exchange-Traded Commodity Fund Trust and Invesco Exchange-Traded Self-Indexed Fund Trust; Assistant Treasurer, Invesco Capital Management LLC; Assistant Vice President, The Invesco Funds | | N/A | | N/A |
Crissie M. Wisdom — 1969 Anti-Money Laundering Compliance Officer | | 2013 | | Anti-Money Laundering Compliance Officer, Invesco Advisers, Inc. (formerly known as Invesco Institutional (N.A.), Inc.) (registered investment adviser), Invesco Capital Markets, Inc. (formerly known as Van Kampen Funds Inc.), Invesco Distributors, Inc., Invesco Investment Services, Inc., The Invesco Funds, and Invesco Exchange-Traded Fund Trust, Invesco Exchange-Traded Fund Trust II, Invesco India Exchange-Traded Fund Trust, Invesco Actively Managed Exchange-Traded Fund Trust, Invesco Actively Managed Exchange-Traded Commodity Fund Trust and Invesco Exchange-Traded Self-Indexed Fund Trust; Anti-Money Laundering Compliance Officer and Bank Secrecy Act Officer, INVESCO National Trust Company and Invesco Trust Company; and Fraud Prevention Manager and Controls and Risk Analysis Manager for Invesco Investment Services, Inc. Formerly: Anti-Money Laundering Compliance Officer, Van Kampen Exchange Corp. and Invesco Management Group, Inc. | | N/A | | N/A |
Robert R. Leveille — 1969 Chief Compliance Officer | | 2016 | | Chief Compliance Officer, Invesco Advisers, Inc. (registered investment adviser); and Chief Compliance Officer, The Invesco Funds Formerly: Chief Compliance Officer, Putnam Investments and the Putnam Funds | | N/A | | N/A |
The Statement of Additional Information of the Trust includes additional information about the Fund’s Trustees and is available upon request, without charge, by calling 1.800.959.4246. Please refer to the Fund’s Statement of Additional Information for information on the Fund’ssub-advisers.
| | | | | | |
Office of the Fund 11 Greenway Plaza, Suite 1000 Houston, TX 77046-1173 | | Investment Adviser Invesco Advisers, Inc. 1555 Peachtree Street, N.E. Atlanta, GA 30309 | | Distributor Invesco Distributors, Inc. 11 Greenway Plaza, Suite 1000 Houston, TX 77046-1173 | | Auditors PricewaterhouseCoopers LLP 1000 Louisiana Street, Suite 5800 Houston, TX 77002-5021 |
| | | |
| | | | | | |
Counsel to the Fund Stradley Ronon Stevens & Young, LLP 2005 Market Street, Suite 2600 Philadelphia, PA 19103-7018 | | Counsel to the Independent Trustees Goodwin Procter LLP 901 New York Avenue, N.W. Washington, D.C. 20001 | | Transfer Agent Invesco Investment Services, Inc. 11 Greenway Plaza, Suite 1000 Houston, TX 77046-1173 | | Custodian State Street Bank and Trust Company 225 Franklin Street Boston, MA 02110-2801 |
T-5 Invesco Technology Fund
(This page intentionally left blank)
Go paperless with eDelivery
Visit invesco.com/edelivery to enjoy the convenience and security of anytime electronic access to your investment documents.
With eDelivery, you can elect to have any or all of the following materials delivered straight to your inbox to download, save and print from your own computer:
| • | Fund reports and prospectuses |
| • | Quarterly statements |
| • | Daily confirmations |
| • | Tax forms |
Invesco mailing information
Send general correspondence to Invesco Investment Services, Inc., P.O. Box 219078, Kansas City, MO 64121-9078.
Important notice regarding delivery of security holder documents
To reduce Fund expenses, only one copy of most shareholder documents may be mailed to shareholders with multiple accounts at the same address (Householding). Mailing of your shareholder documents may be householded indefinitely unless you instruct us otherwise. If you do not want the mailing of these documents to be combined with those for other members of your household, please contact Invesco Investment Services, Inc. at 800 959 4246 or contact your financial institution. We will begin sending you individual copies for each account within 30 days after receiving your request.
Fund holdings and proxy voting information
The Fund provides a complete list of its holdings four times in each fiscal year, at the quarter-ends. For the second and fourth quarters, the list appears in the Fund’s semiannual and annual reports to shareholders. For the first and third quarters, the Fund files the lists with the Securities and Exchange Commission (SEC) on Form N-Q (or any successor Form). The most recent list of portfolio holdings is available at invesco.com/completeqtrholdings. Shareholders can also look up the Fund’s Form N-Q (or any successor Form) filings on the SEC website, sec.gov. The SEC file numbers for the Fund are shown below.
A description of the policies and procedures that the Fund uses to determine how to vote proxies relating to portfolio securities is available without charge, upon request, from our Client Services department at 800 959 4246, or at invesco.com/proxyguidelines. The information is also available on the SEC website, sec.gov.
Information regarding how the Fund voted proxies related to its portfolio securities during the most recent 12-month period ended June 30 is available at invesco.com/proxysearch. This information is also available on the SEC website, sec.gov.
Invesco Advisers, Inc. is an investment adviser; it provides investment advisory services to individual and institutional clients and does not sell securities. Invesco Distributors, Inc. is the US distributor for Invesco Ltd.’s retail mutual funds, exchange-traded funds and institutional money market funds. Both are wholly owned, indirect subsidiaries of Invesco Ltd.
| SEC file numbers: 811-03826 and 002-85905 | Invesco Distributors, Inc. | I-TEC-AR-1 |
| Annual Report to Shareholders | April 30, 2019 |
Invesco Technology Sector Fund
Nasdaq:
A: IFOAX ■ C: IFOCX ■ Y: IFODX

Beginning on January 1, 2021, as permitted by regulations adopted by the Securities and Exchange Commission, paper copies of the Fund’s shareholder reports will no longer be sent by mail, unless you specifically request paper copies of the reports from the Fund or from your financial intermediary, such as a broker-dealer or bank. Instead, the reports will be made available on the Fund’s website, and you will be notified by mail each time a report is posted and provided with a website link to access the report.
If you already elected to receive shareholder reports electronically, you will not be affected by this change and you need not take any action. You may elect to receive shareholder reports and other communications from the Fund electronically by contacting your financial intermediary (such as a broker-dealer or bank) or, if you are a direct investor, by enrolling at invesco.com/edelivery.
You may elect to receive all future reports in paper free of charge. If you invest through a financial intermediary, you can contact your financial intermediary to request that you continue to receive paper copies of your shareholder reports. If you invest directly with the Fund, you can call (800) 959-4246 to let the Fund know you wish to continue receiving paper copies of your shareholder reports. Your election to receive reports in paper will apply to all funds held with your financial intermediary or all funds held with the fund complex if you invest directly with the Fund.
Dear Shareholders:
This annual report includes information about your Fund, including performance data and a complete list of its investments as of the close of the reporting period. Inside is a discussion of how your Fund was managed and the factors that affected its performance during the reporting period.
Philip Taylor, whose messages to shareholders have appeared here for the last 13 years, transitioned to a senior advisory role on March 1, prior to his retirement at the end of the year, and I assumed his role as Head of the Americas and Senior Managing Director, Invesco Ltd. All of us at Invesco are indebted to Phil for his many years of dedicated service to the company and to its funds’ shareholders. I’m excited about this new opportunity, and I look forward to communicating with fund shareholders going forward.
Investor sentiment during the reporting period ranged from elation to fear, notably in the fourth quarter of 2018. Amid corporate tax cuts and improving global growth, several US equity indexes redefined highs during the first half of the reporting period. The exuberance, however, ended in October as global equities, in particular US stocks, sold off, with the sharpest decline in December of 2018. The catalyst for the sell-off was a combination of ongoing trade concerns between the US and China, fears of a global economic slowdown and lower oil prices from a supply glut. Gains posted earlier in the year for global equities were erased, while US Treasury bonds, along with government and municipal bonds, rallied as investors fled to “safe haven” assets. The reporting period ended on a positive note, however, as global equities bounced back strongly at the outset of 2019, with the US stock market reaching new highs by the period end. Given the strong economy during the reporting period, the US Federal Reserve (the Fed) raised the federal funds rate three times. At its December 2018 meeting, however, the Fed delivered a more “dovish stance” by simultaneously raising rates while reducing guidance for 2019 rate increases. As the fiscal year ended, the Fed had thus far left rates unchanged in 2019. As 2019 unfolds, we’ll see how the interplay of interest rates, economic data, geopolitics and a host of other factors affect US and overseas equity and fixed income markets.
Investor uncertainty and market volatility, such as we witnessed during the reporting period, are unfortunate facts of life when it comes to investing. That’s why Invesco encourages investors to work with a professional financial adviser who can stress the importance of starting to save and invest early and the importance of adhering to a disciplined investment plan. A financial adviser who knows your unique financial situation, investment goals and risk tolerance can be an invaluable partner as you seek to achieve your financial goals. He or she can offer a long-term perspective when markets are volatile and time-tested advice and guidance when your financial situation or investment goals change.
Visit our website for more information on your investments
Our website, invesco.com/us, offers a wide range of market insights and investment perspectives. On the website, you’ll find detailed information about our funds, including performance, holdings and portfolio manager commentaries. You can access information about your account by completing a simple, secure online registration. To do so, select “Log In” on the right side of the homepage, and then select “Register for Individual Account Access.”
In addition to the resources accessible on our website and through our mobile app, you can obtain timely updates to help you stay informed about the markets and the economy by connecting with Invesco on Twitter, LinkedIn or Facebook. You can access our blog at blog.invesco.us.com. Our goal is to provide you the information you want, when and where you want it.
Finally, I’m pleased to share with you Invesco’s commitment to both the Principles for Responsible Investment and to considering environmental, social and governance issues in our robust investment process. I invite you to learn more at invesco.com/esg.
Have questions?
For questions about your account, contact an Invesco client services representative at 800 959 4246.
All of us at Invesco look forward to serving your investment management needs. Thank you for investing with us.
Sincerely,
Andrew Schlossberg
Head of the Americas,
Senior Managing Director, Invesco Ltd.
| 2 | Invesco Technology Sector Fund |
Dear Shareholders:
Among the many important lessons I’ve learned in more than 40 years in a variety of business endeavors is the value of a trusted advocate.
As independent chair of the Invesco Funds Board, I can assure you that the members of the Board are strong advocates for the interests of investors in Invesco’s mutual funds. We work hard to represent your interests through oversight of the quality of the investment management services your funds receive and other matters important to your investment, including but not limited to:
| ■ | Ensuring that Invesco offers a diverse lineup of mutual funds that your financial adviser can use to strive to meet your financial needs as your investment goals change over time. |
| ■ | Monitoring how the portfolio management teams of the Invesco funds are performing in light of changing economic and market conditions. |
| ■ | Assessing each portfolio management team’s investment performance within the context of the investment strategy described in the fund’s prospectus. |
| ■ | Monitoring for potential conflicts of interests that may impact the nature of the services that your funds receive. |
We believe one of the most important services we provide our fund shareholders is the annual review of the funds’ advisory and sub-advisory contracts with Invesco Advisers and its affiliates. This review is required by the Investment Company Act of 1940 and focuses on the nature and quality of the services Invesco provides as the adviser to the Invesco funds and the reasonableness of the fees that it charges for those services. Each year, we spend months carefully reviewing information received from Invesco and a variety of independent sources, such as performance and fee data prepared by Lipper, Inc. (a subsidiary of Broadridge Financial Solutions, Inc.), an independent, third-party firm widely recognized as a leader in its field. We also meet with our independent legal counsel and other independent advisers to review and help us assess the information that we have received. Our goal is to assure that you receive quality investment management services for a reasonable fee.
I trust the measures outlined above provide assurance that you have a worthy advocate when it comes to choosing the Invesco Funds.
As always, please contact me at bruce@brucecrockett.com with any questions or concerns you may have. On behalf of the Board, we look forward to continuing to represent your interests and serving your needs.
Sincerely,
Bruce L. Crockett
Independent Chair
Invesco Funds Board of Trustees
| 3 | Invesco Technology Sector Fund |
Management’s Discussion of Fund Performance
Performance summary
For the fiscal year ended April 30, 2019, Class A shares of Invesco Technology Sector Fund (the Fund), at net asset value (NAV), underperformed the NASDAQ Composite Index, the Fund’s broad market/style-specific benchmark.
Your Fund’s long-term performance appears later in this report.
Fund vs. Indexes
Total returns, April 30, 2018 to April 30, 2019, at net asset value (NAV). Performance shown does not include applicable contingent deferred sales charges (CDSC) or front-end sales charges, which would have reduced performance.
| Class A Shares | 14.65% |
| Class C Shares | 13.79 |
| Class Y Shares | 14.91 |
| NASDAQ Composite Index▼ (Broad Market/Style-Specific Index) | 15.82 |
Lipper Science & Technology Funds Index■
(Peer Group Index) | 17.83 |
| Source(s):▼FactSet Research Systems Inc.;■ Lipper Inc. |
benchmark, the NASDAQ Composite Index.
The Fund’s underperformance relative to the broad market/style-specific benchmark was driven by entertainment industry holdings that experienced some headwinds during the fiscal year. The leading individual detractor on an absolute basis wasActivision Blizzard. The video game publisher suffered from the delayed release of planned titles, regulatory hurdles in China and a rotation from growth toward defensive areas of the market at the end of 2018.
Nintendo was also among the leading detractors on a relative and absolute basis during the fiscal year. The video game and console maker reported slower sales of its Switch console due to a lack of big title game releases. The company also suffered slightly from the push out of expected mobile game titles to later in 2019. Nintendo also faced similar regulatory and macroeconomic headwinds as Activision Blizzard.
Another detractor from the Fund’s results relative to its broad market/style-specific benchmark for the fiscal year was electronic equipment manufacturerSony. The company began the fiscal year with strong operating profits that beat consensus estimates due to strong video game and music sales. Subsequently, Sony reported disappointing results that fell short of high consensus expectations. The profitability of the company’s games was also weaker-than-anticipated as the fiscal year came to a close.
At the industry level, stock selection in and the Fund’s overweight allocation to information technology services and underweight allocation to biotechnology were the leading contributors to the Fund’s performance relative to the broad market/style-specific benchmark during
Market conditions and your Fund
The fiscal year proved to be an increasingly volatile time for US equities. Throughout the summer, US equities moved higher as corporate profits surged amid the benefit of corporate tax cuts and improving global economic growth. Several US equity indexes reached new highs despite potential headwinds, including trade tensions, tariff announcements and contagion concerns over a Turkish currency crisis. Market volatility noticeably rose in October 2018, as US equity markets suffered a sharp sell-off through year-end 2018, amid ongoing trade concerns between the US and China, fears of a global economic slowdown and lower oil prices from a supply glut, with oil prices plummeting from near $75 per barrel in early October 2018 to around $45 per barrel in late December 2018.1 In this environment, there was a flight to safety, as investors fled to defensive areas of the equities markets, such as health care, utilities and US Treasuries.
| Portfolio Composition |
| By sector % of total net assets |
| Information Technology | 39.70% |
| Communication Services | 28.89 |
| Consumer Discretionary | 16.20 |
| Health Care | 12.48 |
| Industrials | 0.41 |
| Money Market Funds Plus Other Assets Less Liabilities | 2.32 |
Given signs of a strong economy, the US Federal Reserve (the Fed) raised interest rates three times during the fiscal year: in June, September and December 2018. Following December’s Fed meeting, the Fed raised interest rates by 25 basis points to a targeted range of 2.25% to 2.50%, which signaled a slightly more dovish stance than expected.2 Equity markets rebounded in 2019, fueled by optimism about a potential US-China trade deal and the Fed’s indication that there would be no interest rate hikes in 2019, a surprising shift in monetary policy. The Fed’s more accommodative stance provided a supportive environment for equities and fixed income, even as US economic data were mixed and overseas growth appeared to be slowing. By the end of the fiscal year, the US equity market generally recovered the losses from fourth quarter 2018, backed by improving investor sentiment, low unemployment and a growing economy.
The Fund, at NAV, posted a double-digit positive return but underperformed the Fund’s broad market/style-specific
| Top 10 Equity Holdings* |
| % of total net assets |
| 1. | Amazon.com, Inc. | 9.75% |
| 2. | Facebook, Inc., Class A | 5.52 |
| 3. | Microsoft Corp. | 5.37 |
| 4. | Alphabet, Inc., Class A | 5.25 |
| 5. | Apple, Inc. | 4.93 |
| 6. | Alibaba Group Holding Ltd., ADR | 4.44 |
| 7. | Nintendo Co., Ltd. | 3.28 |
| 8. | Illumina, Inc. | 3.01 |
| 9. | PayPal Holdings, Inc. | 2.73 |
| 10. | salesforce.com, inc. | 2.57 |
| Total Net Assets | $101.6 million |
| Total Number of Holdings* | 45 |
| The Fund’s holdings are subject to change, and there is no assurance that the Fund will continue to hold any particular security. |
| *Excluding money market fund holdings. |
| Data presented here are as of April 30, 2019. |
| 4 | Invesco Technology Sector Fund |
the fiscal year. Additionally, not having any exposure to the banking industry benefited the Fund’s relative results.
At the individual security level, out-of-index holdingSea was the leading contributor relative to the broad market/style-specific benchmark during the fiscal year. The Southeast Asian digital entertainment and e-commerce company experienced strong earnings and top-line growth driven by its self-developed battle royale mobile gaming title called “Free Fire.” Sea also gave better revenue guidance for Garena, its video gaming unit and Shopee, its e-commerce unit.
Amazon.com was the leading individual contributor to the Fund’s performance on an absolute basis during the fiscal year. The e-commerce giant largely benefited from better-than-expected profitability driven by strength in its international and cloud computing services platform.Integrated Device Technology (IDT) was among the leading contributors to the Fund’s performance on an absolute basis and relative to the broad market/style-specific benchmark for the fiscal year. The semiconductor company benefited from news that Renesas Electronics (not a Fund holding) would acquire IDT at a 30% premium above the stock’s price as of the date of the announcement. We exited the Fund’s position in IDT in the fourth quarter of 2018. On March 30, 2019, Renesas announced that the acquisition was completed successfully.ServiceNow was also a notable relative contributor to the Fund’s performance during the fiscal year. The California-based cloud computing company reported strong quarterly billings and margin expansion. Use cases for ServiceNow’s platform continued to expand during the fiscal year causing revenue per customer to accelerate even as the company grows larger.
At the close of the fiscal year, the Fund was biased toward growth technology, including medical technology, and away from mature technology. We emphasized innovation, transformative technology and opportunities, which we expect to take market share from mature companies, including the game-changing technologies of mobile, security, cloud and medical technology. We remain optimistic about technology spending given strong corporate balance sheets and companies’ need to invest in more robust security solutions and for future growth. In our opinion, the increased pace of health care innovation is likely to continue to drive attractive long-term growth rates due to successful mapping
of the human genome and recent productivity improvements, both of which have fostered faster and more effective targeting of promising therapeutics. We attempt to harness multi-year secular trends, which may benefit long-term investors regardless of near-term economic strength.
As we’ve discussed, stocks remain volatile and we caution investors against making investment decisions based on short-term performance.
We thank you for your commitment to Invesco Technology Sector Fund.
1 Source: Bloomberg
2 Source: US Federal Reserve
The views and opinions expressed in management’s discussion of Fund performance are those of Invesco Advisers, Inc. These views and opinions are subject to change at any time based on factors such as market and economic conditions. These views and opinions may not be relied upon as investment advice or recommendations, or as an offer for a particular security. The information is not a complete analysis of every aspect of any market, country, industry, security or the Fund. Statements of fact are from sources considered reliable, but Invesco Advisers, Inc. makes no representation or warranty as to their completeness or accuracy. Although historical performance is no guarantee of future results, these insights may help you understand our investment management philosophy.
See important Fund and, if applicable, index disclosures later in this report.
Erik Voss
Chartered Financial Analyst, Portfolio Manager, is lead manager of Invesco Technology Sector Fund. He joined Invesco in 2010. Mr. Voss earned a BS in mathematics and an MS in finance from the University of Wisconsin.
Janet Luby
Chartered Financial Analyst, Portfolio Manager, is manager of Invesco Technology Sector Fund. She joined Invesco in 2011. Ms. Luby earned a BBA in finance from Texas A&M University. She is also a Certified Public Accountant.
| 5 | Invesco Technology Sector Fund |
Your Fund’s Long-Term Performance
Results of a $10,000 Investment — Oldest Share Class(es)
Fund and index data from 4/30/09
| 1 | Source: FactSet Research Systems Inc. |
| 2 | Source: Lipper Inc. |
Past performance cannot guarantee comparable future results.
The data shown in the chart include reinvested distributions, applicable sales charges and Fund expenses including
management fees. Index results include reinvested dividends, but they do not reflect sales charges. Performance of the peer group, if applicable, reflects fund expenses and management fees; perfor-
mance of a market index does not. Performance shown in the chart and table(s) does not reflect deduction of taxes a shareholder would pay on Fund distributions or sale of Fund shares.
| 6 | Invesco Technology Sector Fund |
| Average Annual Total Returns |
| As of 4/30/19, including maximum applicable sales charges |
| Class A Shares | |
| Inception (7/28/97) | 6.11% |
| 10 Years | 12.89 |
| 5 Years | 12.99 |
| 1 Year | 8.34 |
| Class C Shares | |
| Inception (7/28/97) | 6.01% |
| 10 Years | 12.69 |
| 5 Years | 13.42 |
| 1 Year | 12.79 |
| Class Y Shares | |
| Inception (7/28/97) | 6.63% |
| 10 Years | 13.80 |
| 5 Years | 14.54 |
| 1 Year | 14.91 |
Effective June 1, 2010, Class A, Class C and Class I shares of the predecessor fund, Morgan Stanley Technology Fund, advised by Morgan Stanley Investment Advisors Inc. were reorganized into Class A, Class C and Class Y shares, respectively, of Invesco Technology Sector Fund. Returns shown above, prior to June 1, 2010, for Class A, Class C and Class Y shares are blended returns of the predecessor fund and Invesco Technology Sector Fund. Share class returns will differ from the predecessor fund because of different expenses.
The performance data quoted represent past performance and cannot guarantee comparable future results; current performance may be lower or higher. Please visit invesco.com/performance for the most recent month-end performance. Performance figures reflect reinvested distributions, changes in net asset value and the effect of the maximum sales charge unless otherwise stated. Investment return and principal value will fluctuate so that you may have a gain or loss when you sell shares.
The total annual Fund operating expense ratio set forth in the most recent Fund prospectus as of the date of this report for Class A, Class C and Class Y shares was 1.33%, 2.07% and 1.08%, respectively. The expense ratios presented above may vary from the expense ratios presented in other sections of this report that are based on expenses incurred during the period covered by this report.
| Average Annual Total Returns |
| As of 3/31/19, the most recent calendar quarter end, including maximum applicable sales charges |
| Class A Shares | |
| Inception (7/28/97) | 5.87% |
| 10 Years | 13.51 |
| 5 Years | 11.00 |
| 1 Year | 3.59 |
| Class C Shares | |
| Inception (7/28/97) | 5.77% |
| 10 Years | 13.31 |
| 5 Years | 11.41 |
| 1 Year | 7.72 |
| Class Y Shares | |
| Inception (7/28/97) | 6.39% |
| 10 Years | 14.42 |
| 5 Years | 12.53 |
| 1 Year | 9.84 |
Class A share performance reflects the maximum 5.50% sales charge, and Class C share performance reflects the applicable contingent deferred sales charge (CDSC) for the period involved. The CDSC on Class C shares is 1% for the first year after purchase. Class Y shares do not have a front-end sales charge or a CDSC; therefore, performance is at net asset value.
The performance of the Fund’s share classes will differ primarily due to different sales charge structures and class expenses.
Fund performance reflects any applicable fee waivers and/or expense reimbursements. Had the adviser not waived fees and/or reimbursed expenses currently or in the past, returns would have been lower. See current prospectus for more information.
| 7 | Invesco Technology Sector Fund |
Invesco Technology Sector Fund’s investment objective is long-term growth of capital.
| ■ | Unless otherwise stated, information presented in this report is as of April 30, 2019, and is based on total net assets. |
| ■ | Unless otherwise noted, all data provided by Invesco. |
| ■ | To access your Fund’s reports/prospectus, visit invesco.com/fundreports. |
About share classes
| ■ | Class Y shares are available only to certain investors. Please see the prospectus for more information. |
Principal risks of investing in the Fund
| ■ | Depositary receipts risk. Investing in depositary receipts involves the same risks as direct investments in foreign securities. In addition, the underlying issuers of certain depositary receipts are under no obligation to distribute shareholder communications or pass through any voting rights with respect to the deposited securities to the holders of such receipts. The Fund may therefore receive less timely information or have less control than if it invested directly in the foreign issuer. |
| ■ | Derivatives risk. The value of a derivative instrument depends largely on (and is derived from) the value of an underlying security, currency, commodity, interest rate, index or other asset (each referred to as an underlying asset). In addition to risks relating to the underlying assets, the use of derivatives may include other, possibly greater, risks, including counterparty, leverage and liquidity risks. Counterparty risk is the risk that the counterparty to the derivative contract will default on its obligation to pay the Fund the amount owed or otherwise perform under the derivative contract. Derivatives create leverage risk because they do not require payment up front equal to the economic exposure created by holding a position in the derivative. As a result, an adverse change in the value of the underlying asset could result in the Fund sustaining a loss that is substantially greater than the amount invested in the derivative or the anticipated value of the underlying asset, which may make the Fund’s returns more volatile and increase the risk of loss. Derivative instruments may also be less liquid than more traditional |
| | investments and the Fund may be unable to sell or close out its derivative positions at a desirable time or price. This risk may be more acute under adverse market conditions, during which the Fund may be most in need of liquidating its derivative positions. Derivatives may also be harder to value, less tax efficient and subject to changing government regulation that could impact the Fund’s ability to use certain derivatives or their cost. Derivatives strategies may not always be successful. For example, derivatives used for hedging or to gain or limit exposure to a particular market segment may not provide the expected benefits, particularly during adverse market conditions. |
| ■ | Emerging markets securities risk.Emerging markets (also referred to as developing markets) are generally subject to greater market volatility, political, social and economic instability, uncertain trading markets and more governmental limitations on foreign investment than more developed markets. In addition, companies operating in emerging markets may be subject to lower trading volume and greater price fluctuations than companies in more developed markets. Securities law and the enforcement of systems of taxation in many emerging market countries may change quickly and unpredictably. In addition, investments in emerging markets securities may also be subject to additional transaction costs, delays in settlement procedures, and lack of timely information. |
| ■ | Foreign securities risk.The Fund’s foreign investments may be adversely affected by political and social instability, changes in economic or taxation policies, difficulty in enforcing obligations, decreased liquidity or increased volatility. Foreign investments also involve the risk of the possible seizure, nationalization or expropriation of the issuer or foreign deposits (in which the Fund could lose its entire investments in a certain market) and |
| | the possible adoption of foreign governmental restrictions such as exchange controls. Unless the Fund has hedged its foreign securities risk, foreign securities risk also involves the risk of negative foreign currency rate fluctuations, which may cause the value of securities denominated in such foreign currency (or other instruments through which the Fund has exposure to foreign currencies) to decline in value. Currency exchange rates may fluctuate significantly over short periods of time. Currency hedging strategies, if used, are not always successful. |
| ■ | Growth investing risk.Growth stocks tend to be more expensive relative to the issuing company’s earnings or assets compared with other types of stock. As a result, they tend to be more sensitive to changes in, or investors’ expectations of, the issuing company’s earnings and can be more volatile. |
| ■ | Management risk. The Fund is actively managed and depends heavily on the Adviser’s judgment about markets, interest rates or the attractiveness, relative values, liquidity, or potential appreciation of particular investments made for the Fund’s portfolio. The Fund could experience losses if these judgments prove to be incorrect. Additionally, legislative, regulatory, or tax developments may adversely affect management of the Fund and, therefore, the ability of the Fund to achieve its investment objective. |
| ■ | Market risk. The market values of the Fund’s investments, and therefore the value of the Fund’s shares, will go up and down, sometimes rapidly or unpredictably. Market risk may affect a single issuer, industry or section of the economy, or it may affect the market as a whole. Individual stock prices tend to go up and down more dramatically than those of certain other types of investments, such as bonds. During a general downturn in the financial markets, multiple asset classes may decline in value. When |
This report must be accompanied or preceded by a currently effective Fund prospectus, which contains more complete information, including sales charges and expenses. Investors should read it carefully before investing.
NOT FDIC INSURED | MAY LOSE VALUE | NO BANK GUARANTEE
| 8 | Invesco Technology Sector Fund |
| | markets perform well, there can be no assurance that specific investments held by the Fund will rise in value. |
| ■ | Mid-capitalization companies risk. Mid-capitalization companies tend to be more vulnerable to changing market conditions and may have more limited product lines and markets, less experienced management and fewer financial resources than larger companies. These companies’ securities may be more volatile and less liquid than those of more established companies, and their returns may vary, sometimes significantly, from the overall securities market. |
| ■ | Technology sector risk. The Fund will concentrate its investments in the securities of issuers engaged primarily in the communications and information industry. Technology companies are subject to intense competition, rapid obsolescence of their products, issues with obtaining financing or regulatory approvals, product incompatibility, changing consumer preferences, high required corporate capital expenditure for research and development or infrastructure and development of new products, each of which make the prices of securities issued by these companies more volatile. |
About indexes used in this report
| ■ | TheNASDAQ Composite Index is a broad-based market index of the common stocks and similar securities listed on the Nasdaq stock market. |
| ■ | TheLipper Science & Technology Funds Index is an unmanaged index considered representative of science and technology funds tracked by Lipper. |
| ■ | The Fund is not managed to track the performance of any particular index, including the index(es) described here, and consequently, the performance of the Fund may deviate significantly from the performance of the index(es). |
| ■ | A direct investment cannot be made in an index. Unless otherwise indicated, index results include reinvested dividends, and they do not reflect sales charges. Performance of the peer group, if applicable, reflects fund expenses; performance of a market index does not. |
Other information
| ■ | CPA® and Certified Public Accountant® are trademarks owned by the American Institute of Certified Public Accountants. |
| ■ | The returns shown in management’s discussion of Fund performance are based on net asset values (NAVs) calculated for shareholder transactions. Generally accepted accounting principles require adjustments to be made to the net assets of the Fund at period end for financial reporting purposes, and as such, the NAVs for shareholder transactions and the returns based on those NAVs may differ from the NAVs and returns reported in the Financial Highlights. |
| ■ | Industry classifications used in this report are generally according to the Global Industry Classification Standard, which was developed by and is the exclusive property and a service mark of MSCI Inc. and Standard & Poor’s. |
| 9 | Invesco Technology Sector Fund |
Schedule of Investments(a)
April 30, 2019
| | Shares | Value |
| Common Stocks & Other Equity Interests–97.68% |
| Alternative Carriers–2.04% |
| Intelsat S.A.(b) | 102,288 | $2,070,309 |
| Application Software–5.20% |
| Adobe, Inc.(b) | 7,672 | 2,219,126 |
| salesforce.com, inc.(b) | 15,785 | 2,610,050 |
| Splunk, Inc.(b) | 3,267 | 450,977 |
| | | | 5,280,153 |
| Biotechnology–1.02% |
| Alexion Pharmaceuticals, Inc.(b) | 7,587 | 1,032,818 |
| Consumer Electronics–1.53% |
| Sony Corp. (Japan) | 30,600 | 1,550,059 |
| Data Processing & Outsourced Services–7.48% |
| First Data Corp., Class A(b) | 17,227 | 445,490 |
| Mastercard, Inc., Class A | 7,100 | 1,805,104 |
| PayPal Holdings, Inc.(b) | 24,640 | 2,778,653 |
| Visa, Inc., Class A | 15,633 | 2,570,534 |
| | | | 7,599,781 |
| Health Care Equipment–5.08% |
| Abbott Laboratories | 17,397 | 1,384,105 |
| Boston Scientific Corp.(b) | 20,850 | 773,952 |
| Intuitive Surgical, Inc.(b) | 2,001 | 1,021,770 |
| Stryker Corp. | 2,726 | 514,969 |
| Teleflex, Inc. | 5,132 | 1,468,676 |
| | | | 5,163,472 |
| Interactive Home Entertainment–11.30% |
| Activision Blizzard, Inc. | 39,846 | 1,920,976 |
| Electronic Arts, Inc.(b) | 17,747 | 1,679,754 |
| Nintendo Co., Ltd. (Japan) | 9,700 | 3,326,291 |
| Sea Ltd. ADR (Thailand)(b) | 66,225 | 1,648,340 |
| Take-Two Interactive Software, Inc.(b) | 6,105 | 591,147 |
| Ubisoft Entertainment S.A. (France)(b) | 24,312 | 2,318,901 |
| | | | 11,485,409 |
| Interactive Media & Services–13.61% |
| Alphabet, Inc., Class A(b) | 4,447 | 5,331,775 |
| Alphabet, Inc. Class C(b) | 1,586 | 1,884,929 |
| Facebook, Inc., Class A(b) | 28,975 | 5,603,765 |
| Match Group, Inc. | 16,617 | 1,003,667 |
| | | | 13,824,136 |
| Internet & Direct Marketing Retail–14.68% |
| Alibaba Group Holding Ltd. ADR (China)(b) | 24,285 | 4,506,568 |
| Amazon.com, Inc.(b) | 5,140 | 9,902,313 |
| Booking Holdings, Inc.(b) | 271 | 502,702 |
| | | | 14,911,583 |
| | Shares | Value |
| Life Sciences Tools & Services–5.87% |
| Illumina, Inc.(b) | 9,817 | $3,062,904 |
| IQVIA Holdings, Inc.(b) | 11,749 | 1,631,936 |
| Thermo Fisher Scientific, Inc. | 4,591 | 1,273,773 |
| | | | 5,968,613 |
| Managed Health Care–0.50% |
| UnitedHealth Group, Inc. | 2,197 | 512,055 |
| Movies & Entertainment–1.95% |
| Netflix, Inc.(b) | 5,336 | 1,977,202 |
| Semiconductor Equipment–4.65% |
| Applied Materials, Inc. | 55,743 | 2,456,594 |
| ASML Holding N.V. New York Shares (Netherlands) | 10,873 | 2,270,500 |
| | | | 4,727,094 |
| Semiconductors–8.52% |
| Broadcom, Inc. | 7,074 | 2,252,362 |
| NVIDIA Corp. | 6,332 | 1,146,092 |
| QUALCOMM, Inc. | 23,151 | 1,993,996 |
| Semtech Corp.(b) | 21,974 | 1,183,739 |
| Silicon Motion Technology Corp. ADR (Taiwan) | 54,444 | 2,081,938 |
| | | | 8,658,127 |
| Systems Software–8.91% |
| Microsoft Corp. | 41,780 | 5,456,468 |
| Palo Alto Networks, Inc.(b) | 6,758 | 1,681,593 |
| ServiceNow, Inc.(b) | 7,073 | 1,920,390 |
| | | | 9,058,451 |
| Technology Hardware, Storage & Peripherals–4.93% |
| Apple, Inc. | 24,972 | 5,011,131 |
| Trucking–0.41% |
| Lyft, Inc., Class A(b)(c) | 6,963 | 416,387 |
| Total Common Stocks & Other Equity Interests (Cost $56,165,871) | 99,246,780 |
|
| Money Market Funds–0.52% |
| Invesco Government & Agency Portfolio, Institutional Class, 2.34%(d) | 186,334 | 186,334 |
| Invesco Liquid Assets Portfolio, Institutional Class, 2.48%(d) | 132,976 | 133,016 |
| Invesco Treasury Portfolio, Institutional Class, 2.32%(d) | 212,952 | 212,952 |
| Total Money Market Funds (Cost $532,302) | 532,302 |
| TOTAL INVESTMENTS IN SECURITIES (excluding investments purchased with cash collateral from securities on loan)-98.20% (Cost $56,698,173) | | | 99,779,082 |
See accompanying Notes to Financial Statements which are an integral part of the financial statements.
| 10 | Invesco Technology Sector Fund |
| | Shares | Value |
| Investments Purchased with Cash Collateral from Securities on Loan |
| Money Market Funds–0.38% |
| Invesco Government & Agency Portfolio, Institutional Class, 2.34%(d)(e) | 290,664 | $290,664 |
| Invesco Liquid Assets Portfolio, Institutional Class, 2.48%(d)(e) | 96,859 | 96,888 |
| Total Investments Purchased with Cash Collateral from Securities on Loan (Cost $387,552) | 387,552 |
| TOTAL INVESTMENTS IN SECURITIES–98.58% (Cost $57,085,725) | 100,166,634 |
| OTHER ASSETS LESS LIABILITIES–1.42% | 1,439,169 |
| NET ASSETS–100.00% | $101,605,803 |
Investment Abbreviations:
| ADR | – American Depositary Receipt |
Notes to Schedule of Investments:
| (a) | Industry and/or sector classifications used in this report are generally according to the Global Industry Classification Standard, which was developed by and is the exclusive property and a service mark of MSCI Inc. and Standard & Poor’s. |
| (b) | Non-income producing security. |
| (c) | All or a portion of this security was out on loan at April 30, 2019. |
| (d) | The money market fund and the Fund are affiliated by having the same investment adviser. The rate shown is the 7-day SEC standardized yield as of April 30, 2019. |
| (e) | The security has been segregated to satisfy the commitment to return the cash collateral received in securities lending transactions upon the borrower’s return of the securities loaned. See Note 1I. |
See accompanying Notes to Financial Statements which are an integral part of the financial statements.
| 11 | Invesco Technology Sector Fund |
Statement of Assets and Liabilities
April 30, 2019
| Assets: | |
Investments in securities, at value
(Cost $56,165,871)1 | $99,246,780 |
| Investments in affiliated money market funds, at value (Cost $919,854) | 919,854 |
| Foreign currencies, at value (Cost $152) | 152 |
| Receivable for: | |
| Investments sold | 2,389,119 |
| Fund shares sold | 26,981 |
| Dividends | 106,471 |
| Investment for trustee deferred compensation and retirement plans | 35,975 |
| Other assets | 12,327 |
| Total assets | 102,737,659 |
| Liabilities: | |
| Payable for: | |
| Investments purchased | 443,725 |
| Fund shares reacquired | 87,649 |
| Amount due custodian | 54,766 |
| Collateral upon return of securities loaned | 387,552 |
| Accrued fees to affiliates | 52,342 |
| Accrued trustees’ and officers’ fees and benefits | 1,633 |
| Accrued other operating expenses | 65,522 |
| Trustee deferred compensation and retirement plans | 38,667 |
| Total liabilities | 1,131,856 |
| Net assets applicable to shares outstanding | $101,605,803 |
| Net assets consist of: | |
| Shares of beneficial interest | $53,372,855 |
| Distributable earnings | 48,232,948 |
| | $101,605,803 |
| Net Assets: |
| Class A | $95,986,273 |
| Class C | $1,309,205 |
| Class Y | $4,310,325 |
| Shares outstanding, no par value, with an unlimited number of shares authorized: |
| Class A | 3,859,761 |
| Class C | 64,057 |
| Class Y | 163,241 |
| Class A: | |
| Net asset value per share | $24.87 |
Maximum offering price per share
(Net asset value of $24.87 ÷ 94.50%) | $26.32 |
| Class C: | |
| Net asset value and offering price per share | $20.44 |
| Class Y: | |
| Net asset value and offering price per share | $26.40 |
| 1 | At April 30, 2019, securities with an aggregate value of $379,657 were on loan to brokers. |
See accompanying Notes to Financial Statements which are an integral part of the financial statements.
| 12 | Invesco Technology Sector Fund |
Statement of Operations
For the year ended April 30, 2019
| Investment income: | |
| Dividends (net of foreign withholding taxes of $13,473) | $478,405 |
| Dividends from affiliated money market funds (includes securities lending income of $438) | 28,142 |
| Interest | 1,323 |
| Total investment income | 507,870 |
| Expenses: | |
| Advisory fees | 661,701 |
| Administrative services fees | 37,982 |
| Custodian fees | 8,128 |
| Distribution fees: | |
| Class A | 217,008 |
| Class C | 64,400 |
| Transfer agent fees— A, C and Y | 145,094 |
| Trustees’ and officers’ fees and benefits | 22,267 |
| Registration and filing fees | 47,421 |
| Reports to shareholders | 38,162 |
| Professional services fees | 51,270 |
| Other | 10,016 |
| Total expenses | 1,303,449 |
| Less: Fees waived and expense offset arrangement(s) | (2,156) |
| Net expenses | 1,301,293 |
| Net investment income (loss) | (793,423) |
| Realized and unrealized gain from: | |
| Net realized gain from: | |
| Investment securities | 9,342,550 |
| Foreign currencies | 329 |
| | 9,342,879 |
| Change in net unrealized appreciation of: | |
| Investment securities | 4,827,241 |
| Foreign currencies | 3,543 |
| | 4,830,784 |
| Net realized and unrealized gain | 14,173,663 |
| Net increase in net assets resulting from operations | $13,380,240 |
See accompanying Notes to Financial Statements which are an integral part of the financial statements.
| 13 | Invesco Technology Sector Fund |
Statement of Changes in Net Assets
For the years ended April 30, 2019 and 2018
| | 2019 | 2018 |
| Operations: | | |
| Net investment income (loss) | $(793,423) | $(719,701) |
| Net realized gain | 9,342,879 | 6,381,987 |
| Change in net unrealized appreciation | 4,830,784 | 13,879,162 |
| Net increase in net assets resulting from operations | 13,380,240 | 19,541,448 |
| Distributions to shareholders from distributable earnings(1): | | |
| Class A | (6,004,053) | (1,875,164) |
| Class B | — | (4,057) |
| Class C | (675,683) | (209,764) |
| Class Y | (300,931) | (72,200) |
| Total distributions to shareholders from distributable earnings | (6,980,667) | (2,161,185) |
| Share transactions–net: | | |
| Class A | 3,403,836 | (7,493,232) |
| Class B | — | (389,282) |
| Class C | (6,301,314) | (939,539) |
| Class Y | 388,433 | 836,007 |
| Net increase (decrease) in net assets resulting from share transactions | (2,509,045) | (7,986,046) |
| Net increase in net assets | 3,890,528 | 9,394,217 |
| Net assets: | | |
| Beginning of year | 97,715,275 | 88,321,058 |
| End of year | $101,605,803 | $97,715,275 |
| (1) | The Securities and Exchange Commission eliminated the requirement to disclose the distribution components separately, except for tax return of capital. For the year ended April 30, 2018, distributions to shareholders from distributable earnings consisted of distributions from net realized gains. |
See accompanying Notes to Financial Statements which are an integral part of the financial statements.
| 14 | Invesco Technology Sector Fund |
Financial Highlights
April 30, 2019
The following schedule presents financial highlights for a share of the Fund outstanding throughout the periods indicated.
| | Net asset
value,
beginning
of period | Net
investment
income
(loss)(a) | Net gains
(losses)
on securities
(both
realized and
unrealized) | Total from
investment
operations | Distributions
from net
realized
gains | Net asset
value, end
of period | Total
return(b) | Net assets,
end of period
(000’s omitted) | Ratio of
expenses
to average
net assets
with fee waivers
and/or expenses
absorbed | Ratio of
expenses
to average net
assets without
fee waivers
and/or expenses
absorbed | Ratio of net
investment
income
(loss)
to average
net assets | Portfolio
turnover(c) |
| Class A |
| Year ended 04/30/19 | $23.49 | $(0.18) | $3.30 | $3.12 | $(1.74) | $24.87 | 14.65% | $95,986 | 1.28%(d) | 1.28%(d) | (0.77)%(d) | 44% |
| Year ended 04/30/18 | 19.53 | (0.15) | 4.61 | 4.46 | (0.50) | 23.49 | 22.99 | 85,929 | 1.33 | 1.33 | (0.69) | 46 |
| Year ended 04/30/17 | 15.58 | (0.16) | 4.54 | 4.38 | (0.43) | 19.53 | 28.52 | 78,058 | 1.67 | 1.67 | (0.90) | 49 |
| Year ended 04/30/16 | 16.73 | (0.15) | (1.00) | (1.15) | — | 15.58 | (6.87) | 70,256 | 1.58 | 1.58 | (0.89) | 44 |
| Year ended 04/30/15 | 14.49 | (0.17) | 2.41 | 2.24 | — | 16.73 | 15.46 | 86,451 | 1.58 | 1.58 | (1.07) | 66 |
| Class C |
| Year ended 04/30/19 | 19.77 | (0.31) | 2.72 | 2.41 | (1.74) | 20.44 | 13.79 | 1,309 | 2.03(d) | 2.03(d) | (1.52)(d) | 44 |
| Year ended 04/30/18 | 16.64 | (0.27) | 3.90 | 3.63 | (0.50) | 19.77 | 21.98(e) | 8,087 | 2.07(e) | 2.07(e) | (1.43)(e) | 46 |
| Year ended 04/30/17 | 13.42 | (0.24) | 3.89 | 3.65 | (0.43) | 16.64 | 27.66(e) | 7,635 | 2.39(e) | 2.39(e) | (1.62)(e) | 49 |
| Year ended 04/30/16 | 14.52 | (0.24) | (0.86) | (1.10) | — | 13.42 | (7.58) | 6,759 | 2.33 | 2.33 | (1.64) | 44 |
| Year ended 04/30/15 | 12.67 | (0.25) | 2.10 | 1.85 | — | 14.52 | 14.60(e) | 8,087 | 2.32(e) | 2.32(e) | (1.81)(e) | 66 |
| Class Y |
| Year ended 04/30/19 | 24.77 | (0.13) | 3.50 | 3.37 | (1.74) | 26.40 | 14.91 | 4,310 | 1.03(d) | 1.03(d) | (0.52)(d) | 44 |
| Year ended 04/30/18 | 20.53 | (0.10) | 4.84 | 4.74 | (0.50) | 24.77 | 23.23 | 3,699 | 1.08 | 1.08 | (0.44) | 46 |
| Year ended 04/30/17 | 16.32 | (0.12) | 4.76 | 4.64 | (0.43) | 20.53 | 28.82 | 2,291 | 1.42 | 1.42 | (0.65) | 49 |
| Year ended 04/30/16 | 17.49 | (0.11) | (1.06) | (1.17) | — | 16.32 | (6.69) | 1,299 | 1.33 | 1.33 | (0.64) | 44 |
| Year ended 04/30/15 | 15.10 | (0.14) | 2.53 | 2.39 | — | 17.49 | 15.83 | 909 | 1.33 | 1.33 | (0.82) | 66 |
| (a) | Calculated using average shares outstanding. |
| (b) | Includes adjustments in accordance with accounting principles generally accepted in the United States of America and as such, the net asset value for financial reporting purposes and the returns based upon those net asset values may differ from the net asset value and returns for shareholder transactions. Does not include sales charges and is not annualized for periods less than one year, if applicable. |
| (c) | Portfolio turnover is calculated at the fund level and is not annualized for periods less than one year, if applicable. |
| (d) | Ratios are based on average daily net assets (000’s omitted) of $88,263, $6,446 and$4,052 for Class A, Class C and Class Y shares, respectively. |
| (e) | The total return, ratio of expenses to average net assets and ratio of net investment income (loss) to average net assets reflect actual 12b-1 fees of 0.99%, 0.97% and 0.99% for the years ended April 30, 2018, 2017 and 2015, respectively. |
See accompanying Notes to Financial Statements which are an integral part of the financial statements.
| 15 | Invesco Technology Sector Fund |
Notes to Financial Statements
April 30, 2019
NOTE 1—Significant Accounting Policies
Invesco Technology Sector Fund (the “Fund”) is a series portfolio of AIM Sector Funds (Invesco Sector Funds) (the “Trust”). The Trust is a Delaware statutory trust registered under the Investment Company Act of 1940, as amended (the “1940 Act”), as an open-end series management investment company authorized to issue an unlimited number of shares of beneficial interest. Information presented in these financial statements pertains only to the Fund. Matters affecting the Fund or each class will be voted on exclusively by the shareholders of the Fund or each class.
The Fund’s investment objective is long-term growth of capital.
The Fund currently consists of three different classes of shares: Class A, Class C and Class Y. Class Y shares are available only to certain investors. Class A shares are sold with a front-end sales charge unless certain waiver criteria are met. Under certain circumstances, load waived shares may be subject to contingent deferred sales charges (“CDSC”). Class C shares are sold with a CDSC. Class Y shares are sold at net asset value. Class C shares held for ten years after purchase are eligible for automatic conversion into Class A shares of the same Fund (the "Conversion Feature"). The automatic conversion pursuant to the Conversion Feature will generally occur at the end of the month following the tenth anniversary after a purchase of Class C shares.
The Fund is an investment company and accordingly follows the investment company accounting and reporting guidance in accordance with Financial Accounting Standards Board Accounting Standards Codification Topic 946,Financial Services – Investment Companies.
The following is a summary of the significant accounting policies followed by the Fund in the preparation of its financial statements.
| A. | Security Valuations — Securities, including restricted securities, are valued according to the following policy. |
A security listed or traded on an exchange (except convertible securities) is valued at its last sales price or official closing price as of the close of the customary trading session on the exchange where the security is principally traded, or lacking any sales or official closing price on a particular day, the security may be valued at the closing bid price on that day. Securities traded in the over-the-counter market are valued based on prices furnished by independent pricing services or market makers. When such securities are valued by an independent pricing service they may be considered fair valued. Futures contracts are valued at the final settlement price set by an exchange on which they are principally traded. Listed options are valued at the mean between the last bid and asked prices from the exchange on which they are principally traded. Options not listed on an exchange are valued by an independent source at the mean between the last bid and asked prices. For purposes of determining net asset value (“NAV”) per share, futures and option contracts generally are valued 15 minutes after the close of the customary trading session of the New York Stock Exchange (“NYSE”).
Investments in open-end and closed-end registered investment companies that do not trade on an exchange are valued at the end-of-day net asset value per share. Investments in open-end and closed-end registered investment companies that trade on an exchange are valued at the last sales price or official closing price as of the close of the customary trading session on the exchange where the security is principally traded.
Debt obligations (including convertible securities) and unlisted equities are fair valued using an evaluated quote provided by an independent pricing service. Evaluated quotes provided by the pricing service may be determined without exclusive reliance on quoted prices, and may reflect appropriate factors such as institution-size trading in similar groups of securities, developments related to specific securities, dividend rate (for unlisted equities), yield (for debt obligations), quality, type of issue, coupon rate (for debt obligations), maturity (for debt obligations), individual trading characteristics and other market data. Pricing services generally value debt obligations assuming orderly transactions of institutional round lot size, but a fund may hold or transact in the same securities in smaller, odd lot sizes. Odd lots often trade at lower prices than institutional round lots. Debt obligations are subject to interest rate and credit risks. In addition, all debt obligations involve some risk of default with respect to interest and/or principal payments.
Foreign securities’ (including foreign exchange contracts) prices are converted into U.S. dollar amounts using the applicable exchange rates as of the close of the NYSE. If market quotations are available and reliable for foreign exchange-traded equity securities, the securities will be valued at the market quotations. Because trading hours for certain foreign securities end before the close of the NYSE, closing market quotations may become unreliable. If between the time trading ends on a particular security and the close of the customary trading session on the NYSE, events occur that the investment adviser determines are significant and make the closing price unreliable, the Fund may fair value the security. If the event is likely to have affected the closing price of the security, the security will be valued at fair value in good faith using procedures approved by the Board of Trustees. Adjustments to closing prices to reflect fair value may also be based on a screening process of an independent pricing service to indicate the degree of certainty, based on historical data, that the closing price in the principal market where a foreign security trades is not the current value as of the close of the NYSE. Foreign securities’ prices meeting the approved degree of certainty that the price is not reflective of current value will be priced at the indication of fair value from the independent pricing service. Multiple factors may be considered by the independent pricing service in determining adjustments to reflect fair value and may include information relating to sector indices, American Depositary Receipts and domestic and foreign index futures. Foreign securities may have additional risks including exchange rate changes, potential for sharply devalued currencies and high inflation, political and economic upheaval, the relative lack of issuer information, relatively low market liquidity and the potential lack of strict financial and accounting controls and standards.
Securities for which market prices are not provided by any of the above methods may be valued based upon quotes furnished by independent sources. The last bid price may be used to value equity securities. The mean between the last bid and asked prices is used to value debt obligations, including corporate loans.
Securities for which market quotations are not readily available or became unreliable are valued at fair value as determined in good faith by or under the supervision of the Trust’s officers following procedures approved by the Board of Trustees. Issuer specific events, market trends, bid/asked quotes of brokers and information providers and other market data may be reviewed in the course of making a good faith determination of a security’s fair value.
The Fund may invest in securities that are subject to interest rate risk, meaning the risk that the prices will generally fall as interest rates rise and, conversely, the prices will generally rise as interest rates fall. Specific securities differ in their sensitivity to changes in interest rates depending on their individual characteristics. Changes in interest rates may result in increased market volatility, which may affect the value and/or liquidity of certain Fund investments.
| 16 | Invesco Technology Sector Fund |
Valuations change in response to many factors including the historical and prospective earnings of the issuer, the value of the issuer’s assets, general economic conditions, interest rates, investor perceptions and market liquidity. Because of the inherent uncertainties of valuation, the values reflected in the financial statements may materially differ from the value received upon actual sale of those investments.
| B. | Securities Transactions and Investment Income — Securities transactions are accounted for on a trade date basis. Realized gains or losses on sales are computed on the basis of specific identification of the securities sold. Interest income (net of withholding tax, if any) is recorded on the accrual basis from settlement date. Dividend income (net of withholding tax, if any) is recorded on the ex-dividend date. |
The Fund may periodically participate in litigation related to Fund investments. As such, the Fund may receive proceeds from litigation settlements. Any proceeds received are included in the Statement of Operations as realized gain (loss) for investments no longer held and as unrealized gain (loss) for investments still held.
Brokerage commissions and mark ups are considered transaction costs and are recorded as an increase to the cost basis of securities purchased and/or a reduction of proceeds on a sale of securities. Such transaction costs are included in the determination of net realized and unrealized gain (loss) from investment securities reported in the Statement of Operations and the Statement of Changes in Net Assets and the net realized and unrealized gains (losses) on securities per share in the Financial Highlights. Transaction costs are included in the calculation of the Fund’s net asset value and, accordingly, they reduce the Fund’s total returns. These transaction costs are not considered operating expenses and are not reflected in net investment income reported in the Statement of Operations and the Statement of Changes in Net Assets, or the net investment income per share and the ratios of expenses and net investment income reported in the Financial Highlights, nor are they limited by any expense limitation arrangements between the Fund and the investment adviser.
The Fund allocates income and realized and unrealized capital gains and losses to a class based on the relative net assets of each class.
| C. | Country Determination – For the purposes of making investment selection decisions and presentation in the Schedule of Investments, the investment adviser may determine the country in which an issuer is located and/or credit risk exposure based on various factors. These factors include the laws of the country under which the issuer is organized, where the issuer maintains a principal office, the country in which the issuer derives 50% or more of its total revenues and the country that has the primary market for the issuer’s securities, as well as other criteria. Among the other criteria that may be evaluated for making this determination are the country in which the issuer maintains 50% or more of its assets, the type of security, financial guarantees and enhancements, the nature of the collateral and the sponsor organization. Country of issuer and/or credit risk exposure has been determined to be the United States of America, unless otherwise noted. |
| D. | Distributions– Distributions from net investment income and net realized capital gain, if any, are generally declared and paid annually and recorded on the ex-dividend date. The Fund may elect to treat a portion of the proceeds from redemptions as distributions for federal income tax purposes. |
| E. | Federal Income Taxes – The Fund intends to comply with the requirements of Subchapter M of the Internal Revenue Code of 1986, as amended (the “Internal Revenue Code”), necessary to qualify as a regulated investment company and to distribute substantially all of the Fund’s taxable earnings to shareholders. As such, the Fund will not be subject to federal income taxes on otherwise taxable income (including net realized capital gain) that is distributed to shareholders. Therefore, no provision for federal income taxes is recorded in the financial statements. |
The Fund recognizes the tax benefits of uncertain tax positions only when the position is more likely than not to be sustained. Management has analyzed the Fund’s uncertain tax positions and concluded that no liability for unrecognized tax benefits should be recorded related to uncertain tax positions. Management is not aware of any tax positions for which it is reasonably possible that the total amounts of unrecognized tax benefits will change materially in the next 12 months.
The Fund files tax returns in the U.S. Federal jurisdiction and certain other jurisdictions. Generally, the Fund is subject to examinations by such taxing authorities for up to three years after the filing of the return for the tax period.
| F. | Expenses– Fees provided for under the Rule 12b-1 plan of a particular class of the Fund and which are directly attributable to that class are charged to the operations of such class. All other expenses are allocated among the classes based on relative net assets. |
| G. | Accounting Estimates – The preparation of financial statements in conformity with accounting principles generally accepted in the United States of America (“GAAP”) requires management to make estimates and assumptions that affect the reported amounts of assets and liabilities at the date of the financial statements and the reported amounts of revenues and expenses during the reporting period including estimates and assumptions related to taxation. Actual results could differ from those estimates by a significant amount. In addition, the Fund monitors for material events or transactions that may occur or become known after the period-end date and before the date the financial statements are released to print. |
| H. | Indemnifications – Under the Trust’s organizational documents, each Trustee, officer, employee or other agent of the Trust is indemnified against certain liabilities that may arise out of the performance of their duties to the Fund. Additionally, in the normal course of business, the Fund enters into contracts, including the Fund’s servicing agreements, that contain a variety of indemnification clauses. The Fund’s maximum exposure under these arrangements is unknown as this would involve future claims that may be made against the Fund that have not yet occurred. The risk of material loss as a result of such indemnification claims is considered remote. |
| I. | Securities Lending– The Fund may lend portfolio securities having a market value up to one-third of the Fund’s total assets. Such loans are secured by collateral equal to no less than the market value of the loaned securities determined daily by the securities lending provider. Such collateral will be cash or debt securities issued or guaranteed by the U.S. Government or any of its sponsored agencies. Cash collateral received in connection with these loans is invested in short-term money market instruments or affiliated money market funds and is shown as such on the Schedule of Investments. The Fund bears the risk of loss with respect to the investment of collateral. It is the Fund’s policy to obtain additional collateral from or return excess collateral to the borrower by the end of the next business day, following the valuation date of the securities loaned. Therefore, the value of the collateral held may be temporarily less than the value of the securities on loan. When loaning securities, the Fund retains certain benefits of owning the securities, including the economic equivalent of dividends or interest generated by the security. Lending securities entails a risk of loss to the Fund if, and to the extent that, the market value of the securities loaned were to increase and the borrower did not increase the collateral accordingly, and the borrower failed to return the securities. The securities loaned are subject to termination at the option of the borrower or the Fund. Upon termination, the borrower will return to the Fund the securities loaned and the Fund will return the collateral. Upon the failure of the borrower to return the securities, collateral may be liquidated and the securities may be purchased on the open market to replace the loaned securities. The Fund could experience delays and costs in gaining access to the collateral and the securities may lose value during the delay which could result in potential losses to the Fund. Some of these losses may be indemnified by the |
| 17 | Invesco Technology Sector Fund |
| | lending agent. The Fund bears the risk of any deficiency in the amount of the collateral available for return to the borrower due to any loss on the collateral invested. Dividends received on cash collateral investments for securities lending transactions, which are net of compensation to counterparties, are included inDividends from affiliated money market funds on the Statement of Operations. The aggregate value of securities out on loan, if any, is shown as a footnote on the Statement of Assets and Liabilities. |
| J. | Foreign Currency Translations – Foreign currency is valued at the close of the NYSE based on quotations posted by banks and major currency dealers. Portfolio securities and other assets and liabilities denominated in foreign currencies are translated into U.S. dollar amounts at the date of valuation. Purchases and sales of portfolio securities (net of foreign taxes withheld on disposition) and income items denominated in foreign currencies are translated into U.S. dollar amounts on the respective dates of such transactions. The Fund does not separately account for the portion of the results of operations resulting from changes in foreign exchange rates on investments and the fluctuations arising from changes in market prices of securities held. The combined results of changes in foreign exchange rates and the fluctuation of market prices on investments (net of estimated foreign tax withholding) are included with the net realized and unrealized gain or loss from investments in the Statement of Operations. Reported net realized foreign currency gains or losses arise from (1) sales of foreign currencies, (2) currency gains or losses realized between the trade and settlement dates on securities transactions, and (3) the difference between the amounts of dividends, interest, and foreign withholding taxes recorded on the Fund’s books and the U.S. dollar equivalent of the amounts actually received or paid. Net unrealized foreign currency gains and losses arise from changes in the fair values of assets and liabilities, other than investments in securities at fiscal period end, resulting from changes in exchange rates. |
The Fund may invest in foreign securities, which may be subject to foreign taxes on income, gains on investments or currency repatriation, a portion of which may be recoverable. Foreign taxes, if any, are recorded based on the tax regulations and rates that exist in the foreign markets in which the Fund invests and are shown in the Statement of Operations.
| K. | Forward Foreign Currency Contracts – The Fund may engage in foreign currency transactions either on a spot (i.e. for prompt delivery and settlement) basis, or through forward foreign currency contracts, to manage or minimize currency or exchange rate risk. |
The Fund may also enter into forward foreign currency contracts for the purchase or sale of a security denominated in a foreign currency in order to “lock in” the U.S. dollar price of that security, or the Fund may also enter into forward foreign currency contracts that do not provide for physical settlement of the two currencies, but instead are settled by a single cash payment calculated as the difference between the agreed upon exchange rate and the spot rate at settlement based upon an agreed upon notional amount (non-deliverable forwards). The Fund will set aside liquid assets in an amount equal to the daily mark-to-market obligation for forward foreign currency contracts.
A forward foreign currency contract is an obligation between two parties (“Counterparties”) to purchase or sell a specific currency for an agreed-upon price at a future date. The use of forward foreign currency contracts does not eliminate fluctuations in the price of the underlying securities the Fund owns or intends to acquire but establishes a rate of exchange in advance. Fluctuations in the value of these contracts are measured by the difference in the contract date and reporting date exchange rates and are recorded as unrealized appreciation (depreciation) until the contracts are closed. When the contracts are closed, realized gains (losses) are recorded. Realized and unrealized gains (losses) on the contracts are included in the Statement of Operations. The primary risks associated with forward foreign currency contracts include failure of the Counterparty to meet the terms of the contract and the value of the foreign currency changing unfavorably. These risks may be in excess of the amounts reflected in the Statement of Assets and Liabilities.
| L. | Other Risks - The Fund’s investments are concentrated in a comparatively narrow segment of the economy, which may make the Fund more volatile. |
Many products and services offered in technology-related industries are subject to rapid obsolescence, which may lower the value of the issuers in this sector.
NOTE 2—Advisory Fees and Other Fees Paid to Affiliates
The Trust has entered into a master investment advisory agreement with Invesco Advisers, Inc. (the "Adviser" or "Invesco"). Under the terms of the investment advisory agreement, the Fund accrues daily and pays monthly an advisory fee to the Adviser based on the annual rate of the Fund’s average daily net assets as follows:
| Average Daily Net Assets | Rate |
| First $500 million | 0.67% |
| Next $2.5 billion | 0.645% |
| Over $3 billion | 0.62% |
For the year ended April 30, 2019, the effective advisory fees incurred by the Fund was 0.67%.
Under the terms of a master sub-advisory agreement between the Adviser and each of Invesco Asset Management Deutschland GmbH, Invesco Asset Management Limited, Invesco Asset Management (Japan) Limited, Invesco Hong Kong Limited, Invesco Senior Secured Management, Inc. and Invesco Canada Ltd. (collectively, the "Affiliated Sub-Advisers") the Adviser, not the Fund, will pay 40% of the fees paid to the Adviser to any such Affiliated Sub-Adviser(s) that provide(s) discretionary investment management services to the Fund based on the percentage of assets allocated to such Affiliated Sub-Adviser(s).
The Adviser has contractually agreed, through at least June 30, 2020, to waive advisory fees and/or reimburse expenses of all shares to the extent necessary to limit total annual fund operating expenses after fee waiver and/or expense reimbursement (excluding certain items discussed below) of Class A, Class C, and Class Y shares to 2.00%, 2.75%, and 1.75%, respectively, of average daily net assets (the “expense limits”). In determining the Adviser’s obligation to waive advisory fees and/or reimburse expenses, the following expenses are not taken into account, and could cause the total annual fund operating expenses after fee waiver and/or expense reimbursement to exceed the numbers reflected above: (1) interest; (2) taxes; (3) dividend expense on short sales; (4) extraordinary or non-routine items, including litigation expenses; and (5) expenses that the Fund has incurred but did not actually pay because of an expense offset arrangement. Unless Invesco continues the fee waiver agreement, it will terminate on June 30, 2020. During its term, the fee waiver agreement cannot be terminated or amended to increase the expense limits or reduce the advisory fee waiver without approval of the Board of Trustees. The Adviser did not waive fees and/or reimburse expenses during the period under these expense limits.
| 18 | Invesco Technology Sector Fund |
Further, the Adviser has contractually agreed, through at least June 30, 2021, to waive the advisory fee payable by the Fund in an amount equal to 100% of the net advisory fees the Adviser receives from the affiliated money market funds on investments by the Fund of uninvested cash (excluding investments of cash collateral from securities lending) in such affiliated money market funds.
For the year ended April 30, 2019, the Adviser waived advisory fees of $1,503.
The Trust has entered into a master administrative services agreement with Invesco pursuant to which the Fund has agreed to pay Invesco for certain administrative costs incurred in providing accounting services to the Fund. For the year ended April 30, 2019, expenses incurred under the agreement are shown in the Statement of Operations asAdministrative services fees. Also, Invesco has entered into a sub-administration agreement whereby State Street Bank and Trust Company (“SSB”) serves as custodian and fund accountant and provides certain administrative services to the Fund.
The Trust has entered into a transfer agency and service agreement with Invesco Investment Services, Inc. (“IIS”) pursuant to which the Fund has agreed to pay IIS a fee for providing transfer agency and shareholder services to the Fund and reimburse IIS for certain expenses incurred by IIS in the course of providing such services. IIS may make payments to intermediaries that provide omnibus account services, sub-accounting services and/or networking services. All fees payable by IIS to intermediaries that provide omnibus account services or sub-accounting services are charged back to the Fund, subject to certain limitations approved by the Trust’s Board of Trustees. For the year ended April 30, 2019, expenses incurred under the agreement are shown in the Statement of Operations asTransfer agent fees.
Shares of the Fund are distributed by Invesco Distributors, Inc. (“IDI”), an affiliate of the Adviser. The Fund has adopted a Plan of Distribution (the “Plan”) pursuant to Rule 12b-1 under the 1940 Act. The Plan provides that the Fund will reimburse IDI for distribution related expenses that IDI incurs up to a maximum of the following annual rates: (1) Class A — up to 0.25% of the average daily net assets of Class A shares; and (2) Class C — up to 1.00% of the average daily net assets of Class C shares. The fees are accrued daily and paid monthly.
For the year ended April 30, 2019, expenses incurred under these agreements are shown in the Statement of Operations asDistribution fees.
Front-end sales commissions and CDSC (collectively, the “sales charges”) are not recorded as expenses of the Fund. Front-end sales commissions are deducted from proceeds from the sales of Fund shares prior to investment in Class A shares of the Fund. CDSC are deducted from redemption proceeds prior to remittance to the shareholder. During the year ended April 30, 2019, IDI advised the Fund that IDI retained $2,043 in front-end sales commissions from the sale of Class A shares and $2 from Class C shares, for CDSC imposed upon redemptions by shareholders.
For the year ended April 30, 2019, the Fund incurred $536 in brokerage commissions with Invesco Capital Markets, Inc., an affiliate of the Adviser and IDI, for portfolio transactions executed on behalf of the Fund.
Certain officers and trustees of the Trust are officers and directors of the Adviser, IIS and/or IDI.
NOTE 3—Additional Valuation Information
GAAP defines fair value as the price that would be received to sell an asset or paid to transfer a liability in an orderly transaction between market participants at the measurement date, under current market conditions. GAAP establishes a hierarchy that prioritizes the inputs to valuation methods, giving the highest priority to readily available unadjusted quoted prices in an active market for identical assets (Level 1) and the lowest priority to significant unobservable inputs (Level 3), generally when market prices are not readily available or are unreliable. Based on the valuation inputs, the securities or other investments are tiered into one of three levels. Changes in valuation methods may result in transfers in or out of an investment’s assigned level:
Level 1 – Prices are determined using quoted prices in an active market for identical assets.
Level 2 – Prices are determined using other significant observable inputs. Observable inputs are inputs that other market participants may use in pricing a security. These may include quoted prices for similar securities, interest rates, prepayment speeds, credit risk, yield curves, loss severities, default rates, discount rates, volatilities and others.
Level 3 – Prices are determined using significant unobservable inputs. In situations where quoted prices or observable inputs are unavailable (for example, when there is little or no market activity for an investment at the end of the period), unobservable inputs may be used. Unobservable inputs reflect the Fund’s own assumptions about the factors market participants would use in determining fair value of the securities or instruments and would be based on the best available information.
The following is a summary of the tiered valuation input levels, as of April 30, 2019. The level assigned to the securities valuations may not be an indication of the risk or liquidity associated with investing in those securities. Because of the inherent uncertainties of valuation, the values reflected in the financial statements may materially differ from the value received upon actual sale of those investments.
| | Level 1 | Level 2 | Level 3 | Total |
| Investments in Securities | | | | |
| Common Stocks & Other Equity Interests | $94,370,430 | $4,876,350 | $— | $99,246,780 |
| Money Market Funds | 919,854 | — | — | 919,854 |
| Total Investments | $95,290,284 | $4,876,350 | $— | $100,166,634 |
NOTE 4—Expense Offset Arrangement(s)
The expense offset arrangement is comprised of transfer agency credits which result from balances in demand deposit accounts used by the transfer agent for clearing shareholder transactions. For the year ended April 30, 2019, the Fund received credits from this arrangement, which resulted in the reduction of the Fund’s total expenses of $653.
NOTE 5—Trustees’ and Officers’ Fees and Benefits
Trustees’ and Officers’ Fees and Benefits include amounts accrued by the Fund to pay remuneration to certain Trustees and Officers of the Fund. Trustees have the option to defer compensation payable by the Fund, and Trustees’ and Officers’ Fees and Benefits also include amounts accrued by the Fund to fund such deferred compensation amounts. Those Trustees who defer compensation have the option to select various Invesco Funds in which
| 19 | Invesco Technology Sector Fund |
their deferral accounts shall be deemed to be invested. Finally, certain current Trustees were eligible to participate in a retirement plan that provided for benefits to be paid upon retirement to Trustees over a period of time based on the number of years of service. The Fund may have certain former Trustees who also participate in a retirement plan and receive benefits under such plan.Trustees’ and Officers’ Fees and Benefits include amounts accrued by the Fund to fund such retirement benefits. Obligations under the deferred compensation and retirement plans represent unsecured claims against the general assets of the Fund.
NOTE 6—Cash Balances
The Fund is permitted to temporarily carry a negative or overdrawn balance in its account with SSB, the custodian bank. Such balances, if any at period-end, are shown in the Statement of Assets and Liabilities under the payable captionAmount due custodian. To compensate the custodian bank for such overdrafts, the overdrawn Fund may either (1) leave funds as a compensating balance in the account so the custodian bank can be compensated by earning the additional interest; or (2) compensate by paying the custodian bank at a rate agreed upon by the custodian bank and Invesco, not to exceed the contractually agreed upon rate.
NOTE 7—Distributions to Shareholders and Tax Components of Net Assets
| Tax Character of Distributions to Shareholders Paid During the Fiscal Years Ended April 30, 2019 and 2018 |
| | 2019 | 2018 |
| Ordinary income | $20,985 | $160,599 |
| Long-term capital gain | 6,959,682 | 2,000,586 |
| Total distributions | $6,980,667 | $2,161,185 |
| Tax Components of Net Assets at Period-End: |
| | 2019 |
| Undistributed long-term capital gain | $6,367,439 |
| Net unrealized appreciation — investments | 42,739,763 |
| Net unrealized appreciation — foreign currencies | 2,136 |
| Temporary book/tax differences | (31,908) |
| Late-Year ordinary loss deferral | (213,209) |
| Post-October capital loss deferral | (631,273) |
| Shares of beneficial interest | 53,372,855 |
| Total net assets | $101,605,803 |
The difference between book-basis and tax-basis unrealized appreciation (depreciation) is due to differences in the timing of recognition of gains and losses on investments for tax and book purposes. The Fund’s net unrealized appreciation (depreciation) difference is attributable primarily to wash sales.
The temporary book/tax differences are a result of timing differences between book and tax recognition of income and/or expenses. The Fund’s temporary book/tax differences are the result of the trustee deferral of compensation and retirement plan benefits.
Capital loss carryforward is calculated and reported as of a specific date. Results of transactions and other activity after that date may affect the amount of capital loss carryforward actually available for the Fund to utilize. Capital losses generated in years beginning after December 22, 2010 can be carried forward for an unlimited period, whereas previous losses expire in eight tax years. Capital losses with an expiration period may not be used to offset capital gains until all net capital losses without an expiration date have been utilized. Capital loss carryforwards with no expiration date will retain their character as either short-term or long-term capital losses instead of as short-term capital losses as under prior law. The ability to utilize capital loss carryforwards in the future may be limited under the Internal Revenue Code and related regulations based on the results of future transactions.
The Fund does not have a capital loss carryforward as of April 30, 2019.
NOTE 8—Investment Transactions
The aggregate amount of investment securities (other than short-term securities, U.S. Treasury obligations and money market funds, if any) purchased and sold by the Fund during the year ended April 30, 2019 was $42,744,294 and $53,327,862, respectively. Cost of investments, including any derivatives, on a tax basis includes the adjustments for financial reporting purposes as of the most recently completed federal income tax reporting period-end.
| Unrealized Appreciation (Depreciation) of Investments on a Tax Basis |
| Aggregate unrealized appreciation of investments | $43,041,640 |
| Aggregate unrealized (depreciation) of investments | (301,877) |
| Net unrealized appreciation of investments | $42,739,763 |
Cost of investments for tax purposes is $57,426,871.
| 20 | Invesco Technology Sector Fund |
NOTE 9—Reclassification of Permanent Differences
Primarily as a result of differing book/tax treatment of net operating losses, on April 30, 2019, undistributed net investment income (loss) was increased by $580,141, undistributed net realized gain (loss) was decreased by $394,817 and shares of beneficial interest was decreased by $185,324. This reclassification had no effect on the net assets of the Fund.
| 21 | Invesco Technology Sector Fund |
NOTE 10—Share Information
| | Summary of Share Activity |
| | Years ended April 30, |
| | 2019(a) | | 2018 |
| | Shares | Amount | | Shares | Amount |
| Sold: | | | | | |
| Class A | 181,758 | $4,345,007 | | 79,249 | $1,748,165 |
| Class C | 14,852 | 291,493 | | 5,744 | 106,300 |
| Class Y | 61,164 | 1,592,764 | | 79,087 | 1,827,377 |
| Issued as reinvestment of dividends: | | | | | |
| Class A | 251,334 | 5,288,077 | | 76,522 | 1,698,024 |
| Class B(b) | — | — | | 199 | 3,721 |
| Class C | 35,448 | 615,010 | | 10,042 | 188,082 |
| Class Y | 10,134 | 226,194 | | 2,385 | 55,788 |
| Conversion of Class B shares to Class A shares:(c) | | | | | |
| Class A | — | — | | 6,984 | 171,744 |
| Class B | — | — | | (8,371) | (171,744) |
| Automatic conversion of Class C shares to Class A shares: | | | | | |
| Class A | 286,777 | 6,295,142 | | - | - |
| Class C | (348,198) | (6,295,142) | | - | - |
| Reacquired: | | | | | |
| Class A | (518,544) | (12,524,390) | | (500,170) | (11,111,165) |
| Class B(b) | — | — | | (12,065) | (221,259) |
| Class C | (47,017) | (912,675) | | (65,744) | (1,233,921) |
| Class Y | (57,370) | (1,430,525) | | (43,740) | (1,047,158) |
| Net increase (decrease) in share activity | (129,662) | $(2,509,045) | | (369,878) | $(7,986,046) |
| (a) | There is an entity that is a record owner of more than 5% of the outstanding shares of the Fund and owns 69% of the outstanding shares of the Fund. IDI has an agreement with this entity to sell Fund shares. The Fund, Invesco and/or Invesco affiliates may make payments to this entity, which is considered to be related to the Fund, for providing services to the Fund, Invesco and/or Invesco affiliates including but not limited to services such as, securities brokerage, distribution, third party record keeping and account servicing. The Fund has no knowledge as to whether all or any portion of the shares owned of record by this entity are also owned beneficially. |
| (b) | Class B shares activity for the period May 1, 2017 through January 26, 2018 (date of conversion). |
| (c) | Effective as of the close of business on January 26, 2018, all outstanding Class B shares were converted to Class A shares. |
| 22 | Invesco Technology Sector Fund |
Report of Independent Registered Public Accounting Firm
To the Board of Trustees of AIM Sector Funds (Invesco Sector Funds) and Shareholders of Invesco Technology Sector Fund:
Opinion on the Financial Statements
We have audited the accompanying statement of assets and liabilities, including the schedule of investments, of Invesco Technology Sector Fund (one of the funds constituting AIM Sector Funds (Invesco Sector Funds), hereafter referred to as the “Fund”) as of April 30, 2019, the related statement of operations for the year ended April 30, 2019, the statement of changes in net assets for each of the two years in the period ended April 30, 2019, including the related notes, and the financial highlights for each of the periods indicated therein (collectively referred to as the “financial statements”). In our opinion, the financial statements present fairly, in all material respects, the financial position of the Fund as of April 30, 2019, the results of its operations for the year then ended, the changes in its net assets for each of the two years in the period ended April 30, 2019 and the financial highlights for each of the periods indicated therein in conformity with accounting principles generally accepted in the United States of America.
Basis for Opinion
These financial statements are the responsibility of the Fund’s management. Our responsibility is to express an opinion on the Fund’s financial statements based on our audits. We are a public accounting firm registered with the Public Company Accounting Oversight Board (United States) (“PCAOB”) and are required to be independent with respect to the Fund in accordance with the U.S. federal securities laws and the applicable rules and regulations of the Securities and Exchange Commission and the PCAOB.
We conducted our audits of these financial statements in accordance with the standards of the PCAOB. Those standards require that we plan and perform the audit to obtain reasonable assurance about whether the financial statements are free of material misstatement, whether due to error or fraud.
Our audits included performing procedures to assess the risks of material misstatement of the financial statements, whether due to error or fraud, and performing procedures that respond to those risks. Such procedures included examining, on a test basis, evidence regarding the amounts and disclosures in the financial statements. Our audits also included evaluating the accounting principles used and significant estimates made by management, as well as evaluating the overall presentation of the financial statements. Our procedures included confirmation of securities owned as of April 30, 2019 by correspondence with the custodian, transfer agent and brokers; when replies were not received from brokers, we performed other auditing procedures. We believe that our audits provide a reasonable basis for our opinion.
PricewaterhouseCoopers LLP
Houston, TX
June 26, 2019
We have served as the auditor of one or more of the investment companies in the Invesco group of investment companies since at least 1995. We have not been able to determine the specific year we began serving as auditor.
| 23 | Invesco Technology Sector Fund |
Calculating your ongoing Fund expenses
Example
As a shareholder of the Fund, you incur two types of costs: (1) transaction costs, which may include sales charges (loads) on purchase payments or contingent deferred sales charges on redemptions, if any; and (2) ongoing costs, including management fees, distribution and/or service (12b-1) fees, and other Fund expenses. This example is intended to help you understand your ongoing costs (in dollars) of investing in the Fund and to compare these costs with ongoing costs of investing in other mutual funds. The example is based on an investment of $1,000 invested at the beginning of the period and held for the entire period November 1, 2018 through April 30, 2019.
Actual expenses
The table below provides information about actual account values and actual expenses. You may use the information in this table, together with the amount you invested, to estimate the expenses that you paid over the period. Simply divide your account value by $1,000 (for example, an $8,600 account value divided by $1,000 = 8.6), then multiply the result by the number in the table under the heading entitled “Actual Expenses Paid During Period” to estimate the expenses you paid on your account during this period.
Hypothetical example for comparison purposes
The table below also provides information about hypothetical account values and hypothetical expenses based on the Fund’s actual expense ratio and an assumed rate of return of 5% per year before expenses, which is not the Fund’s actual return.
The hypothetical account values and expenses may not be used to estimate the actual ending account balance or expenses you paid for the period. You may use this information to compare the ongoing costs of investing in the Fund and other funds. To do so, compare this 5% hypothetical example with the 5% hypothetical examples that appear in the shareholder reports of the other funds.
Please note that the expenses shown in the table are meant to highlight your ongoing costs only and do not reflect any transaction costs, such as sales charges (loads) on purchase payments or contingent deferred sales charges on redemptions, if any. Therefore, the hypothetical information is useful in comparing ongoing costs only, and will not help you determine the relative total costs of owning different funds. In addition, if these transaction costs were included, your costs would have been higher.
| | Beginning
Account Value (11/01/18) | ACTUAL | HYPOTHETICAL
(5% annual return before
expenses) | Annualized
Expense
Ratio |
Ending
Account Value
(04/30/19)1 | Expenses
Paid During
Period2 | Ending
Account Value
(04/30/19) | Expenses
Paid During
Period2 |
| Class A | $1,000.00 | $1,120.80 | $6.68 | $1,018.50 | $6.36 | 1.27% |
| Class C | 1,000.00 | 1,116.40 | 10.76 | 1,014.63 | 10.24 | 2.05 |
| Class Y | 1,000.00 | 1,121.90 | 5.42 | 1,019.69 | 5.16 | 1.03 |
| 1 | The actual ending account value is based on the actual total return of the Fund for the period November 1, 2018 through April 30, 2019, after actual expenses and will differ from the hypothetical ending account value which is based on the Fund’s expense ratio and a hypothetical annual return of 5% before expenses. |
| 2 | Expenses are equal to the Fund’s annualized expense ratio as indicated above multiplied by the average account value over the period, multiplied by 181/365 to reflect the most recent fiscal half year. |
| 24 | Invesco Technology Sector Fund |
Tax Information
Form 1099-DIV, Form 1042-S and other year–end tax information provide shareholders with actual calendar year amounts that should be included in their tax returns. Shareholders should consult their tax advisers.
The following distribution information is being provided as required by the Internal Revenue Code or to meet a specific state’s requirement.
The Fund designates the following amounts or, if subsequently determined to be different, the maximum amount allowable for its fiscal year ended April 30, 2019:
| Federal and State Income Tax | |
| Long-Term Capital Gain Distributions | $6,959,682 |
| Qualified Dividend Income* | 100.00% |
| Corporate Dividends Received Deduction* | 100.00% |
| U.S. Treasury Obligations* | 0.00% |
| * | The above percentages are based on ordinary income dividends paid to shareholders during the Fund’s fiscal year. |
| 25 | Invesco Technology Sector Fund |
Trustees and Officers
The address of each trustee and officer is AIM Sector Funds (Invesco Sector Funds) (the “Trust”), 11 Greenway Plaza, Suite 1000, Houston, Texas 77046-1173. The trustees serve for the life of the Trust, subject to their earlier death, incapacitation, resignation, retirement or removal as more specifically provided in the Trust’s organizational documents. Each officer serves for a one year term or until their successors are elected and qualified. Column two below includes length of time served with predecessor entities, if any.
| | | | | | | | |
Name, Year of Birth and
Position(s) Held with the Trust | | Trustee and/
or Officer Since | | Principal Occupation(s)
During Past 5 Years | | Number of Funds in Fund
Complex
Overseen by
Trustee | | Other Directorship(s)
Held by Trustee During
Past 5 Years |
| Interested Persons | | | | | | | | |
Martin L. Flanagan1 — 1960 Trustee and Vice Chair | | 2007 | | Executive Director, Chief Executive Officer and President, Invesco Ltd. (ultimate parent of Invesco and a global investment management firm); Trustee and Vice Chair, The Invesco Funds; Vice Chair, Investment Company Institute; and Member of Executive Board, SMU Cox School of Business Formerly: Advisor to the Board, Invesco Advisers, Inc. (formerly known as Invesco Institutional (N.A.), Inc.); Chairman and Chief Executive Officer, Invesco Advisers, Inc. (registered investment adviser); Director, Chairman, Chief Executive Officer and President, Invesco Holding Company (US), Inc. (formerly IVZ Inc.) (holding company), Invesco Group Services, Inc. (service provider) and Invesco North American Holdings, Inc. (holding company); Director, Chief Executive Officer and President, Invesco Holding Company Limited (parent of Invesco and a global investment management firm); Director, Invesco Ltd.; Chairman, Investment Company Institute and President,Co-Chief Executive Officer,Co-President, Chief Operating Officer and Chief Financial Officer, Franklin Resources, Inc. (global investment management organization) | | 241 | | None |
Philip A. Taylor2 — 1954 Trustee | | 2006 | | Vice Chair, Invesco Ltd.; Director, Invesco Canada Ltd. (formerly known as Invesco Trimark Ltd./Invesco Trimark Ltèe) (registered investment adviser and registered transfer agent); Trustee, The Invesco Funds Formerly: Head of the Americas and Senior Managing Director, Invesco Ltd.; Director, Invesco Advisers, Inc. (formerly known as Invesco Institutional (N.A.), Inc.) (registered investment adviser); Director and Chairman, Invesco Investment Services, Inc. (formerly known as Invesco AIM Investment Services, Inc.) (registered transfer agent); Chief Executive Officer, Invesco Corporate Class Inc. (corporate mutual fund company); Chairman and Chief Executive Officer, Invesco Canada Ltd. (formerly known as Invesco Trimark Ltd./Invesco Trimark Ltèe) (registered investment adviser and registered transfer agent); Senior Vice President, The Invesco Funds; Director, Invesco Investment Advisers LLC (formerly known as Van Kampen Asset Management); Director, Chairman, Chief Executive Officer and President, Invesco Management Group, Inc. (formerly known as Invesco AIM Management Group, Inc.) (financial services holding company);Co-Chairman,Co-President andCo-Chief Executive Officer, Invesco Advisers, Inc. (formerly known as Invesco Institutional (N.A.), Inc.) (registered investment adviser); Director, Chief Executive Officer and President, Van Kampen Exchange Corp; President and Principal Executive Officer, The Invesco Funds (other than AIM Treasurer’s Series Trust (Invesco Treasurer’s Series Trust), Short-Term Investments Trust and Invesco Management Trust); Executive Vice President, The Invesco Funds (AIM Treasurer’s Series Trust (Invesco Treasurer’s Series Trust), Short-Term Investments Trust and Invesco Management Trust only); Director and President, INVESCO Funds Group, Inc. (registered investment adviser and registered transfer agent); Director and Chairman, IVZ Distributors, Inc. (formerly known as INVESCO Distributors, Inc.) (registered broker dealer); Director, President and Chairman, Invesco Inc. (holding company), Invesco Canada Holdings Inc. (holding company), Trimark Investments Ltd./Placements Trimark Ltèe and Invesco Financial Services Ltd/Services Financiers Invesco Ltèe; Chief Executive Officer, Invesco Canada Fund Inc. (corporate mutual fund company); Director and Chairman, Van Kampen Investor Services Inc.; Director, Chief Executive Officer and President, 1371 Preferred Inc. (holding company) and Van Kampen Investments Inc.; Director and President, AIM GP Canada Inc. (general partner for limited partnerships) and Van Kampen Advisors, Inc.; Director and Chief Executive Officer, Invesco Trimark Dealer Inc. (registered broker dealer); Director, Invesco Distributors, Inc. (formerly known as Invesco AIM Distributors, Inc.) (registered broker dealer); Manager, Invesco Capital Management LLC; Director, Chief Executive Officer and President, Invesco Advisers, Inc.; Director, Chairman, Chief Executive Officer and President, Invesco AIM Capital Management, Inc.; President, Invesco Trimark Dealer Inc. and Invesco Trimark Ltd./Invesco Trimark Ltèe; Director and President, AIM Trimark Corporate Class Inc. and AIM Trimark Canada Fund Inc.; Senior Managing Director, Invesco Holding Company Limited; Director and Chairman, Fund Management Company (former registered broker dealer); President and Principal Executive Officer, The Invesco Funds (AIM Treasurer’s Series Trust (Invesco Treasurer’s Series Trust), and Short-Term Investments Trust only); President, AIM Trimark Global Fund Inc. and AIM Trimark Canada Fund Inc. | | 241 | | None |
| 1 | Mr. Flanagan is considered an interested person (within the meaning of Section 2(a)(19) of the 1940 Act) of the Trust because he is an officer of the Adviser to the Trust, and an officer and a director of Invesco Ltd., ultimate parent of the Adviser. |
| 2 | Mr. Taylor is considered an interested person (within the meaning of Section 2(a)(19) of the 1940 Act) of the Trust because he is an officer of Invesco Ltd., ultimate parent of the Adviser. |
T-1 Invesco Technology Sector Fund
Trustees and Officers—(continued)
| | | | | | | | |
Name, Year of Birth and
Position(s) Held with the Trust | | Trustee and/
or Officer Since | | Principal Occupation(s)
During Past 5 Years | | Number of Funds in Fund
Complex
Overseen by
Trustee | | Other Directorship(s)
Held by Trustee During
Past 5 Years |
| Independent Trustees | | | | | | | | |
Bruce L. Crockett — 1944 Trustee and Chair | | 2003 | | Chairman, Crockett Technologies Associates (technology consulting company) Formerly: Director, Captaris (unified messaging provider); Director, President and Chief Executive Officer, COMSAT Corporation; Chairman, Board of Governors of INTELSAT (international communications company); ACE Limited (insurance company); Independent Directors Council and Investment Company Institute: Member of the Audit Committee, Investment Company Institute; Member of the Executive Committee and Chair of the Governance Committee, Independent Directors Council | | 241 | | Director and Chairman of the Audit Committee, ALPS (Attorneys Liability Protection Society) (insurance company); Director and Member of the Audit Committee and Compensation Committee, Ferroglobe PLC (metallurgical company) |
David C. Arch — 1945 Trustee | | 2010 | | Chairman of Blistex Inc. (consumer health care products manufacturer); Member, World Presidents’ Organization | | 241 | | Board member of the Illinois Manufacturers’ Association |
Beth Ann Brown3 — 1968 Trustee | | 2019 | | Independent Consultant Formerly: Head of Intermediary Distribution, Managing Director, Strategic Relations, Managing Director, Head of National Accounts, Senior Vice President, National Account Manager and Senior Vice President, Key Account Manager, Columbia Management Investment Advisers LLC; Vice President, Key Account Manager, Liberty Funds Distributor, Inc.; and Trustee of certain Oppenheimer Funds | | 225 | | Director, Board of Directors of Caron Engineering Inc.; Advisor, Board of Advisors of Caron Engineering Inc.; President and Director, Acton Shapleigh Youth Conservation Corps (non -profit); and Vice President and Director of Grahamtastic Connection(non-profit) |
Jack M. Fields — 1952 Trustee | | 2003 | | Chief Executive Officer, Twenty First Century Group, Inc. (government affairs company); and Chairman, Discovery Learning Alliance(non-profit) Formerly: Owner and Chief Executive Officer, Dos Angeles Ranch L.P. (cattle, hunting, corporate entertainment); Director, Insperity, Inc. (formerly known as Administaff) (human resources provider); Chief Executive Officer, Texana Timber LP (sustainable forestry company); Director of Cross Timbers Quail Research Ranch(non-profit); and member of the U.S. House of Representatives | | 241 | | None |
Cynthia Hostetler — 1962 Trustee | | 2017 | | Non-Executive Director and Trustee of a number of public and private business corporations Formerly: Director, Aberdeen Investment Funds (4 portfolios); Head of Investment Funds and Private Equity, Overseas Private Investment Corporation; President, First Manhattan Bancorporation, Inc.; Attorney, Simpson Thacher & Bartlett LLP | | 241 | | Vulcan Materials Company (construction materials company); Trilinc Global Impact Fund; Genesee & Wyoming, Inc. (railroads); Artio Global Investment LLC (mutual fund complex); Edgen Group, Inc. (specialized energy and infrastructure products distributor); Investment Company Institute (professional organization); Independent Directors Council (professional organization) |
Eli Jones — 1961 Trustee | | 2016 | | Professor and Dean, Mays Business School — Texas A&M University Formerly: Professor and Dean, Walton College of Business, University of Arkansas and E.J. Ourso College of Business, Louisiana State University; Director, Arvest Bank | | 241 | | Insperity, Inc. (formerly known as Administaff) (human resources provider) |
Elizabeth Krentzman3 — 1959 Trustee | | 2019 | | Formerly: Principal and Chief Regulatory Advisor for Asset Management Services and U.S. Mutual Fund Leader of Deloitte & Touche LLP; General Counsel of the Investment Company Institute (trade association); National Director of the Investment Management Regulatory Consulting Practice, Principal, Director and Senior Manager of Deloitte & Touche LLP; Assistant Director of the Division of Investment Management — Office of Disclosure and Investment Adviser Regulation of the U.S. Securities and Exchange Commission and various positions with the Division of Investment Management — Office of Regulatory Policy of the U.S. Securities and Exchange Commission; Associate at Ropes & Gray LLP; Advisory Board Member of the Securities and Exchange Commission Historical Society; and Trustee of certain Oppenheimer Funds | | 225 | | Trustee of the University of Florida National Board Foundation and Audit Committee Member; Member of the Cartica Funds Board of Directors (private investment funds); Member of the University of Florida Law Center Association, Inc. Board of Trustees and Audit Committee Member |
Anthony J. LaCava, Jr. — 1956 Trustee | | 2019 | | Formerly: Director and Member of the Audit Committee, Blue Hills Bank (publicly traded financial institution) and Managing Partner, KPMG LLP | | 241 | | Blue Hills Bank; Chairman, Bentley University; Member, Business School Advisory Council; and Nominating Committee, KPMG LLP |
Prema Mathai-Davis — 1950 Trustee | | 2003 | | Retired Co-Owner & Partner of Quantalytics Research, LLC, (a FinTech Investment Research Platform for the Self-Directed Investor) | | 241 | | None |
| 3 | Mss. Brown and Krentzman and Messrs. Motley, Vandivort and Vaughn were appointed as Trustees of the Trust effective June 10, 2019. |
T-2 Invesco Technology Sector Fund
Trustees and Officers—(continued)
| | | | | | | | |
Name, Year of Birth and
Position(s) Held with the Trust | | Trustee and/
or Officer Since | | Principal Occupation(s)
During Past 5 Years | | Number of Funds in Fund
Complex
Overseen by
Trustee | | Other Directorship(s)
Held by Trustee During
Past 5 Years |
| Independent Trustees—(continued) |
Joel W. Motley3 — 1952 Trustee | | 2019 | | Director of Office of Finance, Federal Home Loan Bank; Member of the Vestry of Trinity Wall Street; Managing Director of Carmona Motley Inc. (privately held financial advisor); Member of the Finance and Budget Committee of the Council on Foreign Relations, Member of the Investment Committee and Board of Human Rights Watch and Member of the Investment Committee and Board of Historic Hudson Valley(non-profit cultural organization) Formerly: Managing Director of Public Capital Advisors, LLC (privately held financial advisor); Managing Director of Carmona Motley Hoffman, Inc. (privately held financial advisor); Trustee of certain Oppenheimer Funds; and Director of Columbia Equity Financial Corp. (privately held financial advisor) | | 225 | | Director of Greenwall Foundation (bioethics research foundation); Member of Board and Investment Committee of The Greenwall Foundation; Director of Southern Africa Legal Services Foundation; Board Member and Investment Committee Member of Pulitzer Center for Crisis Reporting(non-profit journalism) |
Teresa M. Ressel — 1962 Trustee | | 2017 | | Non-executive director and trustee of a number of public and private business corporations Formerly: Chief Financial Officer, Olayan America, The Olayan Group (international investor/commercial/industrial); Chief Executive Officer, UBS Securities LLC; Group Chief Operating Officer, Americas, UBS AG; Assistant Secretary for Management & Budget and CFO, US Department of the Treasury | | 241 | | Atlantic Power Corporation (power generation company); ON Semiconductor Corp. (semiconductor supplier) |
Ann Barnett Stern — 1957 Trustee | | 2017 | | President and Chief Executive Officer, Houston Endowment Inc. (private philanthropic institution) Formerly: Executive Vice President and General Counsel, Texas Children’s Hospital; Attorney, Beck, Redden and Secrest, LLP; Business Law Instructor, University of St. Thomas; Attorney, Andrews & Kurth LLP | | 241 | | Federal Reserve Bank of Dallas |
Raymond Stickel, Jr. — 1944 Trustee | | 2005 | | Retired Formerly: Director, Mainstay VP Series Funds, Inc. (25 portfolios); Partner, Deloitte & Touche | | 241 | | None |
Robert C. Troccoli — 1949 Trustee | | 2016 | | Adjunct Professor, University of Denver — Daniels College of Business Formerly: Senior Partner, KPMG LLP | | 241 | | None |
Daniel S. Vandivort3 — 1954 Trustee | | 2019 | | Treasurer, Chairman of the Audit and Finance Committee, and Trustee, Board of Trustees, Huntington Disease Foundation of America; and President, Flyway Advisory Services LLC (consulting and property management) Formerly: Trustee and Governance Chair, of certain Oppenheimer Funds | | 225 | | Chairman and Lead Independent Director, Chairman of the Audit Committee, and Director, Board of Directors, Value Line Funds |
James D. Vaughn3 — 1945 Trustee | | 2019 | | Retired Formerly: Managing Partner, Deloitte & Touche LLP; Trustee and Chairman of the Audit Committee, Schroder Funds; Board Member, Mile High United Way, Boys and Girls Clubs, Boy Scouts, Colorado Business Committee for the Arts, Economic Club of Colorado and Metro Denver Network (economic development corporation); and Trustee of certain Oppenheimer Funds | | 225 | | Board member and Chairman of Audit Committee of AMG National Trust Bank; Trustee and Investment Committee member, University of South Dakota Foundation; Board member, Audit Committee Member and past Board Chair, Junior Achievement(non-profit) |
Christopher L. Wilson — 1957 Trustee and Vice Chair | | 2017 | | Non-executive director and trustee of a number of public and private business corporations Formerly: Director, TD Asset Management USA Inc. (mutual fund complex) (22 portfolios); Managing Partner, CT2, LLC (investing and consulting firm); President/Chief Executive Officer, Columbia Funds, Bank of America Corporation; President/Chief Executive Officer, CDC IXIS Asset Management Services, Inc.; Principal & Director of Operations, Scudder Funds, Scudder, Stevens & Clark, Inc.; Assistant Vice President, Fidelity Investments | | 241 | | ISO New England, Inc.(non-profit organization managing regional electricity market) |
| Other Officers | | | | | | | | |
Sheri Morris — 1964 President, Principal Executive Officer and Treasurer | | 2003 | | President, Principal Executive Officer and Treasurer, The Invesco Funds; Vice President, Invesco Advisers, Inc. (formerly known as Invesco Institutional (N.A.), Inc.) (registered investment adviser); and Vice President, Invesco Exchange-Traded Fund Trust, Invesco Exchange-Traded Fund Trust II, Invesco India Exchange-Traded Fund Trust, Invesco Actively Managed Exchange-Traded Fund Trust, Invesco Actively Managed Exchange-Traded Commodity Fund Trust and Invesco Exchange-Traded Self-Indexed Fund Trust Formerly: Vice President and Principal Financial Officer, The Invesco Funds; Vice President, Invesco AIM Advisers, Inc., Invesco AIM Capital Management, Inc. and Invesco AIM Private Asset Management, Inc.; Assistant Vice President and Assistant Treasurer, The Invesco Funds and Assistant Vice President, Invesco Advisers, Inc., Invesco AIM Capital Management, Inc. and Invesco AIM Private Asset Management, Inc.; and Treasurer, Invesco Exchange-Traded Fund Trust, Invesco Exchange-Traded Fund Trust II, Invesco India Exchange-Traded Fund Trust and Invesco Actively Managed Exchange-Traded Fund Trust | | N/A | | N/A |
Russell C. Burk — 1958 Senior Vice President and Senior Officer | | 2005 | | Senior Vice President and Senior Officer, The Invesco Funds | | N/A | | N/A |
| 3 | Mss. Brown and Krentzman and Messrs. Motley, Vandivort and Vaughn were appointed as Trustees of the Trust effective June 10, 2019. |
T-3 Invesco Technology Sector Fund
Trustees and Officers—(continued)
| | | | | | | | |
Name, Year of Birth and
Position(s) Held with the Trust | | Trustee and/
or Officer Since | | Principal Occupation(s)
During Past 5 Years | | Number of Funds in Fund
Complex
Overseen by
Trustee | | Other Directorship(s)
Held by Trustee During
Past 5 Years |
| Other Officers—(continued) | | | | | | | | |
Jeffrey H. Kupor — 1968 Senior Vice President, Chief Legal Officer and Secretary | | 2018 | | Head of Legal of the Americas, Invesco Ltd.; Senior Vice President and Secretary, Invesco Advisers, Inc. (formerly known as Invesco Institutional (N.A.), Inc.) (registered investment adviser); Senior Vice President and Secretary, Invesco Distributors, Inc. (formerly known as Invesco AIM Distributors, Inc.); Vice President and Secretary, Invesco Investment Services, Inc. (formerly known as Invesco AIM Investment Services, Inc.) Senior Vice President, Chief Legal Officer and Secretary, The Invesco Funds; Secretary and General Counsel, Invesco Investment Advisers LLC (formerly known as Van Kampen Asset Management); Secretary and General Counsel, Invesco Capital Markets, Inc. (formerly known as Van Kampen Funds Inc.) and Chief Legal Officer, Invesco Exchange-Traded Fund Trust, Invesco Exchange-Traded Fund Trust II, Invesco India Exchange-Traded Fund Trust, Invesco Actively Managed Exchange-Traded Fund Trust, Invesco Actively Managed Exchange-Traded Commodity Fund Trust and Invesco Exchange-Traded Self-Indexed Fund Trust; Secretary, Invesco Indexing LLC; Secretary, W.L. Ross & Co., LLC; Secretary and Vice President, Jemstep, Inc. Formerly: Head of Legal, Worldwide Institutional, Invesco Ltd.; Secretary and General Counsel, INVESCO Private Capital Investments, Inc.; Senior Vice President, Secretary and General Counsel, Invesco Management Group, Inc. (formerly known as Invesco AIM Management Group, Inc.); Assistant Secretary, INVESCO Asset Management (Bermuda) Ltd.; Secretary and General Counsel, Invesco Private Capital, Inc.; Assistant Secretary and General Counsel, INVESCO Realty, Inc.; Secretary and General Counsel, Invesco Senior Secured Management, Inc.; and Secretary, Sovereign G./P. Holdings Inc. | | N/A | | N/A |
Andrew R. Schlossberg — 1974 Senior Vice President | | 2019 | | Head of the Americas and Senior Managing Director, Invesco Ltd.; Director and Senior Vice President, Invesco Advisers, Inc. (formerly known as Invesco Institutional (N.A.), Inc.) (registered investment adviser); Director and Chairman, Invesco Investment Services, Inc. (formerly known as Invesco AIM Investment Services, Inc.) (registered transfer agent); Senior Vice President, The Invesco Funds; Director, Invesco Investment Advisers LLC (formerly known as Van Kampen Asset Management) and Invesco UK Limited; Director, President and Chairman, Invesco Insurance Agency, Inc.; Director and Chief Executive, Invesco Asset Management Limited and Invesco Fund Managers Limited Formerly: Assistant Vice President, The Invesco Funds; Senior Vice President, Invesco Advisers, Inc. (formerly known as Invesco Institutional (N.A.), Inc.) (registered investment adviser); Director and Chief Executive, Invesco Administration Services Limited and Invesco Global Investment Funds Limited; Director, Invesco Distributors, Inc.; Head of EMEA, Invesco Ltd.; President, Invesco Actively Managed Exchange-Traded Commodity Fund Trust, Invesco Actively Managed Exchange-Traded Fund Trust, Invesco Exchange-Traded Fund Trust, Invesco Exchange-Traded Fund Trust II and Invesco India Exchange-Traded Fund Trust; Managing Director and Principal Executive Officer, Invesco Capital Management LLC | | N/A | | N/A |
John M. Zerr — 1962 Senior Vice President | | 2006 | | Chief Operating Officer of the Americas; Senior Vice President, Invesco Advisers, Inc. (formerly known as Invesco Institutional (N.A.), Inc.) (registered investment adviser); Senior Vice President, Invesco Distributors, Inc. (formerly known as Invesco AIM Distributors, Inc.); Director and Vice President, Invesco Investment Services, Inc. (formerly known as Invesco AIM Investment Services, Inc.) Senior Vice President, The Invesco Funds; Managing Director, Invesco Capital Management LLC; Director, Invesco Investment Advisers LLC (formerly known as Van Kampen Asset Management); Senior Vice President, Invesco Capital Markets, Inc. (formerly known as Van Kampen Funds Inc.); Manager, Invesco Indexing LLC; Director and Senior Vice President, Invesco Insurance Agency, Inc.; Invesco Canada Funds Advisory Board Member; Director, President Chief Executive Officer, Invesco Corporate Class Inc. (corporate mutual fund company); and Director, Chairman, President and Chief Executive Officer, Invesco Canada Ltd. (formerly known as Invesco Trimark Ltd./Invesco Trimark Ltèe) (registered investment adviser and registered transfer agent) Formerly: Director and Senior Vice President, Invesco Management Group, Inc. (formerly known as Invesco AIM Management Group, Inc.); Secretary and General Counsel, Invesco Management Group, Inc. (formerly known as Invesco AIM Management Group, Inc.); Secretary, Invesco Investment Services, Inc. (formerly known as Invesco AIM Investment Services, Inc.); Chief Legal Officer and Secretary, The Invesco Funds; Secretary and General Counsel, Invesco Investment Advisers LLC (formerly known as Van Kampen Asset Management); Secretary and General Counsel, Invesco Capital Markets, Inc. (formerly known as Van Kampen Funds Inc.); Chief Legal Officer, Invesco Exchange-Traded Fund Trust, Invesco Exchange-Traded Fund Trust II, Invesco India Exchange-Traded Fund Trust, Invesco Actively Managed Exchange-Traded Fund Trust, Invesco Actively Managed Exchange-Traded Commodity Fund Trust and Invesco Exchange-Traded Self-Indexed Fund Trust; Secretary, Invesco Indexing LLC; Director, Secretary, General Counsel and Senior Vice President, Van Kampen Exchange Corp.; Director, Vice President and Secretary, IVZ Distributors, Inc. (formerly known as INVESCO Distributors, Inc.); Director and Vice President, INVESCO Funds Group, Inc.; Director and Vice President, Van Kampen Advisors Inc.; Director, Vice President, Secretary and General Counsel, Van Kampen Investor Services Inc.; Director and Secretary, Invesco Distributors, Inc. (formerly known as Invesco AIM Distributors, Inc.); Director, Senior Vice President, General Counsel and Secretary, Invesco AIM Advisers, Inc. and Van Kampen Investments Inc.; Director, Vice President and Secretary, Fund Management Company; Director, Senior Vice President, Secretary, General Counsel and Vice President, Invesco AIM Capital Management, Inc.; Chief Operating Officer and General Counsel, Liberty Ridge Capital, Inc. (an investment adviser) | | N/A | | N/A |
T-4 Invesco Technology Sector Fund
Trustees and Officers—(continued)
| | | | | | | | |
Name, Year of Birth and
Position(s) Held with the Trust | | Trustee and/
or Officer Since | | Principal Occupation(s)
During Past 5 Years | | Number of Funds in Fund
Complex
Overseen by
Trustee | | Other Directorship(s)
Held by Trustee During
Past 5 Years |
| Other Officers—(continued) | | | | | | | | |
Gregory G. McGreevey — 1962 Senior Vice President | | 2012 | | Senior Managing Director, Invesco Ltd.; Director, Chairman, President, and Chief Executive Officer, Invesco Advisers, Inc. (formerly known as Invesco Institutional (N.A.), Inc.) (registered investment adviser); Director, Invesco Mortgage Capital, Inc. and Invesco Senior Secured Management, Inc.; and Senior Vice President, The Invesco Funds Formerly: Senior Vice President, Invesco Management Group, Inc. and Invesco Advisers, Inc.; Assistant Vice President, The Invesco Funds | | N/A | | N/A |
Kelli Gallegos — 1970 Vice President, Principal Financial Officer and Assistant Treasurer | | 2008 | | Assistant Treasurer, Invesco Specialized Products, LLC; Vice President, Principal Financial Officer and Assistant Treasurer, The Invesco Funds; Principal Financial and Accounting Officer — Pooled Investments, Invesco Capital Management LLC; Vice President and Treasurer, Invesco Exchange-Traded Fund Trust, Invesco Exchange-Traded Fund Trust II, Invesco India Exchange-Traded Fund Trust, Invesco Actively Managed Exchange-Traded Fund Trust, Invesco Actively Managed Exchange-Traded Commodity Fund Trust and Invesco Exchange-Traded Self-Indexed Fund Trust Formerly: Assistant Treasurer, Invesco Exchange-Traded Fund Trust, Invesco Exchange-Traded Fund Trust II, Invesco India Exchange-Traded Fund Trust, Invesco Actively Managed Exchange-Traded Fund Trust, Invesco Actively Managed Exchange-Traded Commodity Fund Trust and Invesco Exchange-Traded Self-Indexed Fund Trust; Assistant Treasurer, Invesco Capital Management LLC; Assistant Vice President, The Invesco Funds | | N/A | | N/A |
Crissie M. Wisdom — 1969 Anti-Money Laundering Compliance Officer | | 2013 | | Anti-Money Laundering Compliance Officer, Invesco Advisers, Inc. (formerly known as Invesco Institutional (N.A.), Inc.) (registered investment adviser), Invesco Capital Markets, Inc. (formerly known as Van Kampen Funds Inc.), Invesco Distributors, Inc., Invesco Investment Services, Inc., The Invesco Funds, and Invesco Exchange-Traded Fund Trust, Invesco Exchange-Traded Fund Trust II, Invesco India Exchange-Traded Fund Trust, Invesco Actively Managed Exchange-Traded Fund Trust, Invesco Actively Managed Exchange-Traded Commodity Fund Trust and Invesco Exchange-Traded Self-Indexed Fund Trust; Anti-Money Laundering Compliance Officer and Bank Secrecy Act Officer, INVESCO National Trust Company and Invesco Trust Company; and Fraud Prevention Manager and Controls and Risk Analysis Manager for Invesco Investment Services, Inc. Formerly: Anti-Money Laundering Compliance Officer, Van Kampen Exchange Corp. and Invesco Management Group, Inc. | | N/A | | N/A |
Robert R. Leveille — 1969 Chief Compliance Officer | | 2016 | | Chief Compliance Officer, Invesco Advisers, Inc. (registered investment adviser); and Chief Compliance Officer, The Invesco Funds Formerly: Chief Compliance Officer, Putnam Investments and the Putnam Funds | | N/A | | N/A |
The Statement of Additional Information of the Trust includes additional information about the Fund’s Trustees and is available upon request, without charge, by calling 1.800.959.4246. Please refer to the Fund’s Statement of Additional Information for information on the Fund’ssub-advisers.
| | | | | | |
Office of the Fund 11 Greenway Plaza, Suite 1000 Houston, TX 77046-1173 | | Investment Adviser Invesco Advisers, Inc. 1555 Peachtree Street, N.E. Atlanta, GA 30309 | | Distributor Invesco Distributors, Inc. 11 Greenway Plaza, Suite 1000 Houston, TX 77046-1173 | | Auditors PricewaterhouseCoopers LLP 1000 Louisiana Street, Suite 5800 Houston, TX 77002-5021 |
| | | |
| | | | | | |
Counsel to the Fund Stradley Ronon Stevens & Young, LLP 2005 Market Street, Suite 2600 Philadelphia, PA 19103-7018 | | Counsel to the Independent Trustees Goodwin Procter LLP 901 New York Avenue, N.W. Washington, D.C. 20001 | | Transfer Agent Invesco Investment Services, Inc. 11 Greenway Plaza, Suite 1000 Houston, TX 77046-1173 | | Custodian State Street Bank and Trust Company 225 Franklin Street Boston, MA 02110-2801 |
T-5 Invesco Technology Sector Fund
(This page intentionally left blank)
Go paperless with eDelivery
Visit invesco.com/edelivery to enjoy the convenience and security of anytime electronic access to your investment documents.
With eDelivery, you can elect to have any or all of the following materials delivered straight to your inbox to download, save and print from your own computer:
| • | Fund reports and prospectuses |
| • | Quarterly statements |
| • | Daily confirmations |
| • | Tax forms |
Invesco mailing information
Send general correspondence to Invesco Investment Services, Inc., P.O. Box 219078, Kansas City, MO 64121-9078.
Important notice regarding delivery of security holder documents
To reduce Fund expenses, only one copy of most shareholder documents may be mailed to shareholders with multiple accounts at the same address (Householding). Mailing of your shareholder documents may be householded indefinitely unless you instruct us otherwise. If you do not want the mailing of these documents to be combined with those for other members of your household, please contact Invesco Investment Services, Inc. at 800 959 4246 or contact your financial institution. We will begin sending you individual copies for each account within 30 days after receiving your request.
Fund holdings and proxy voting information
The Fund provides a complete list of its holdings four times in each fiscal year, at the quarter-ends. For the second and fourth quarters, the list appears in the Fund’s semiannual and annual reports to shareholders. For the first and third quarters, the Fund files the lists with the Securities and Exchange Commission (SEC) on Form N-Q (or any successor Form). The most recent list of portfolio holdings is available at invesco.com/completeqtrholdings. Shareholders can also look up the Fund’s Form N-Q (or any successor Form) filings on the SEC website, sec.gov. The SEC file numbers for the Fund are shown below.
A description of the policies and procedures that the Fund uses to determine how to vote proxies relating to portfolio securities is available without charge, upon request, from our Client Services department at 800 959 4246, or at invesco.com/proxyguidelines. The information is also available on the SEC website, sec.gov.
Information regarding how the Fund voted proxies related to its portfolio securities during the most recent 12-month period ended June 30 is available at invesco.com/proxysearch. This information is also available on the SEC website, sec.gov.
Invesco Advisers, Inc. is an investment adviser; it provides investment advisory services to individual and institutional clients and does not sell securities. Invesco Distributors, Inc. is the US distributor for Invesco Ltd.’s retail mutual funds, exchange-traded funds and institutional money market funds. Both are wholly owned, indirect subsidiaries of Invesco Ltd.
| SEC file numbers: 811-03826 and 002-85905 | Invesco Distributors, Inc. | MS-TECH-AR-1 |
| Annual Report to Shareholders | April 30, 2019 |
Invesco Value Opportunities Fund
Nasdaq:
A: VVOAX ■ C: VVOCX ■ R: VVORX ■ Y: VVOIX ■ R5: VVONX ■ R6: VVOSX

Beginning on January 1, 2021, as permitted by regulations adopted by the Securities and Exchange Commission, paper copies of the Fund’s shareholder reports will no longer be sent by mail, unless you specifically request paper copies of the reports from the Fund or from your financial intermediary, such as a broker-dealer or bank. Instead, the reports will be made available on the Fund’s website, and you will be notified by mail each time a report is posted and provided with a website link to access the report.
If you already elected to receive shareholder reports electronically, you will not be affected by this change and you need not take any action. You may elect to receive shareholder reports and other communications from the Fund electronically by contacting your financial intermediary (such as a broker-dealer or bank) or, if you are a direct investor, by enrolling at invesco.com/edelivery.
You may elect to receive all future reports in paper free of charge. If you invest through a financial intermediary, you can contact your financial intermediary to request that you continue to receive paper copies of your shareholder reports. If you invest directly with the Fund, you can call (800) 959-4246 to let the Fund know you wish to continue receiving paper copies of your shareholder reports. Your election to receive reports in paper will apply to all funds held with your financial intermediary or all funds held with the fund complex if you invest directly with the Fund.
Dear Shareholders:
This annual report includes information about your Fund, including performance data and a complete list of its investments as of the close of the reporting period. Inside is a discussion of how your Fund was managed and the factors that affected its performance during the reporting period.
Philip Taylor, whose messages to shareholders have appeared here for the last 13 years, transitioned to a senior advisory role on March 1, prior to his retirement at the end of the year, and I assumed his role as Head of the Americas and Senior Managing Director, Invesco Ltd. All of us at Invesco are indebted to Phil for his many years of dedicated service to the company and to its funds’ shareholders. I’m excited about this new opportunity, and I look forward to communicating with fund shareholders going forward.
Investor sentiment during the reporting period ranged from elation to fear, notably in the fourth quarter of 2018. Amid corporate tax cuts and improving global growth, several US equity indexes redefined highs during the first half of the reporting period. The exuberance, however, ended in October as global equities, in particular US stocks, sold off, with the sharpest decline in December of 2018. The catalyst for the sell-off was a combination of ongoing trade concerns between the US and China, fears of a global economic slowdown and lower oil prices from a supply glut. Gains posted earlier in the year for global equities were erased, while US Treasury bonds, along with government and municipal bonds, rallied as investors fled to “safe haven” assets. The reporting period ended on a positive note, however, as global equities bounced back strongly at the outset of 2019, with the US stock market reaching new highs by the period end. Given the strong economy during the reporting period, the US Federal Reserve (the Fed) raised the federal funds rate three times. At its December 2018 meeting, however, the Fed delivered a more “dovish stance” by simultaneously raising rates while reducing guidance for 2019 rate increases. As the fiscal year ended, the Fed had thus far left rates unchanged in 2019. As 2019 unfolds, we’ll see how the interplay of interest rates, economic data, geopolitics and a host of other factors affect US and overseas equity and fixed income markets.
Investor uncertainty and market volatility, such as we witnessed during the reporting period, are unfortunate facts of life when it comes to investing. That’s why Invesco encourages investors to work with a professional financial adviser who can stress the importance of starting to save and invest early and the importance of adhering to a disciplined investment plan. A financial adviser who knows your unique financial situation, investment goals and risk tolerance can be an invaluable partner as you seek to achieve your financial goals. He or she can offer a long-term perspective when markets are volatile and time-tested advice and guidance when your financial situation or investment goals change.
Visit our website for more information on your investments
Our website, invesco.com/us, offers a wide range of market insights and investment perspectives. On the website, you’ll find detailed information about our funds, including performance, holdings and portfolio manager commentaries. You can access information about your account by completing a simple, secure online registration. To do so, select “Log In” on the right side of the homepage, and then select “Register for Individual Account Access.”
In addition to the resources accessible on our website and through our mobile app, you can obtain timely updates to help you stay informed about the markets and the economy by connecting with Invesco on Twitter, LinkedIn or Facebook. You can access our blog at blog.invesco.us.com. Our goal is to provide you the information you want, when and where you want it.
Finally, I’m pleased to share with you Invesco’s commitment to both the Principles for Responsible Investment and to considering environmental, social and governance issues in our robust investment process. I invite you to learn more at invesco.com/esg.
Have questions?
For questions about your account, contact an Invesco client services representative at 800 959 4246.
All of us at Invesco look forward to serving your investment management needs. Thank you for investing with us.
Sincerely,
Andrew Schlossberg
Head of the Americas,
Senior Managing Director, Invesco Ltd.
| 2 | Invesco Value Opportunities Fund |
Dear Shareholders:
Among the many important lessons I’ve learned in more than 40 years in a variety of business endeavors is the value of a trusted advocate.
As independent chair of the Invesco Funds Board, I can assure you that the members of the Board are strong advocates for the interests of investors in Invesco’s mutual funds. We work hard to represent your interests through oversight of the quality of the investment management services your funds receive and other matters important to your investment, including but not limited to:
| ■ | Ensuring that Invesco offers a diverse lineup of mutual funds that your financial adviser can use to strive to meet your financial needs as your investment goals change over time. |
| ■ | Monitoring how the portfolio management teams of the Invesco funds are performing in light of changing economic and market conditions. |
| ■ | Assessing each portfolio management team’s investment performance within the context of the investment strategy described in the fund’s prospectus. |
| ■ | Monitoring for potential conflicts of interests that may impact the nature of the services that your funds receive. |
We believe one of the most important services we provide our fund shareholders is the annual review of the funds’ advisory and sub-advisory contracts with Invesco Advisers and its affiliates. This review is required by the Investment Company Act of 1940 and focuses on the nature and quality of the services Invesco provides as the adviser to the Invesco funds and the reasonableness of the fees that it charges for those services. Each year, we spend months carefully reviewing information received from Invesco and a variety of independent sources, such as performance and fee data prepared by Lipper, Inc. (a subsidiary of Broadridge Financial Solutions, Inc.), an independent, third-party firm widely recognized as a leader in its field. We also meet with our independent legal counsel and other independent advisers to review and help us assess the information that we have received. Our goal is to assure that you receive quality investment management services for a reasonable fee.
I trust the measures outlined above provide assurance that you have a worthy advocate when it comes to choosing the Invesco Funds.
As always, please contact me at bruce@brucecrockett.com with any questions or concerns you may have. On behalf of the Board, we look forward to continuing to represent your interests and serving your needs.
Sincerely,
Bruce L. Crockett
Independent Chair
Invesco Funds Board of Trustees
| 3 | Invesco Value Opportunities Fund |
Management’s Discussion of Fund Performance
Performance summary
For the fiscal year ended April 30, 2019, Class A shares of Invesco Value Opportunities Fund (the Fund), at net asset value (NAV), underperformed the S&P 1500 Value Index, the Fund’s style-specific benchmark.
Your Fund’s long-term performance appears later in this report.
Fund vs. Indexes
Total returns, April 30, 2018 to April 30, 2019, at net asset value (NAV). Performance shown does not include applicable contingent deferred sales charges (CDSC) or front-end sales charges, which would have reduced performance.
| Class A Shares | 3.58% |
| Class C Shares | 2.83 |
| Class R Shares | 3.32 |
| Class Y Shares | 3.80 |
| Class R5 Shares | 3.94 |
| Class R6 Shares | 4.00 |
| S&P 500 Index▼ (Broad Market Index) | 13.49 |
| S&P 1500 Value Index▼ (Style-Specific Index) | 9.34 |
Lipper Multi-Cap Value Funds Index■
(Peer Group Index) | 4.50 |
| Source(s):▼FactSet Research Systems Inc.;■ Lipper Inc. |
Within the S&P 1500 Value Index, sector performance was mixed during the fiscal year. Communication services, real estate, information technology, consumer staples and utilities posted strong double-digit gains, while energy and materials posted losses.
During the fiscal year, we continued to use our intrinsic value strategy, seeking to create wealth by maintaining a long-term investment horizon and investing in companies selling at a significant discount to our estimate of their intrinsic value. We believe intrinsic value represents the fair economic worth of a business. Since our application of this strategy is highly disciplined and relatively unique, it is important to understand the benefits and limitations of our process. First, the investment strategy is intended to preserve your capital while growing it at above-market rates over the long term. Second, our investments have little in common with popular stock market indexes and most of our peers. And third, the Fund’s short-term relative performance will naturally be different from stock market indexes and peers since we typically structure the portfolio significantly differently than these benchmarks.
Drivers of Fund performance were mainly stock-specific during the fiscal year. However, the Fund’s lack of or minimal exposure to the more defensive/yield-oriented sectors, such as real estate, consumer staples and utilities, hurt the Fund’s performance versus the S&P 1500 Value Index as these sectors performed well for much of the fiscal year. Conversely, the Fund’s underweight position in the energy sector helped the Fund’s relative performance as it was the worst-performing sector within the S&P 1500 Value Index during the fiscal year.
Market conditions and your Fund
The fiscal year proved to be an increasingly volatile time for US equities. Throughout the summer, US equities moved higher as corporate profits surged amid the benefit of corporate tax cuts and improving global economic growth. Several US equity indexes reached new highs despite potential headwinds, including trade tensions, tariff announcements and contagion concerns over a Turkish currency crisis. After a relatively quiet summer, market volatility noticeably rose in October 2018, as US equity markets suffered a sharp sell-off through year-end 2018, amid ongoing trade concerns between the US and China, fears of a global economic slowdown and lower oil prices. In this environment, there was a flight to safety, as investors fled to defensive areas of the markets.
| Portfolio Composition |
| By sector | % of total net assets |
| Financials | 23.36% |
| Industrials | 21.02 |
| Materials | 13.21 |
| Health Care | 10.27 |
| Consumer Discretionary | 9.81 |
| Energy | 9.60 |
| Information Technology | 6.87 |
| Other Sectors, Each Less than 2% of Net Assets | 2.01 |
| Money Market Funds Plus Other Assets Less Liabilities | 3.85 |
Given signs of a strong economy, the US Federal Reserve (the Fed) raised interest rates three times during the fiscal year: in June, September and December 2018. In contrast, the European Central Bank and central banks in several other countries maintained extraordinarily accommodative monetary policies.
Equity markets rebounded in 2019, fueled by optimism about a potential US-China trade deal and the Fed’s indication that there would be no interest rate hikes in 2019, a surprising shift in monetary policy. The Fed’s more accommodative stance provided a supportive environment for equities and fixed income, even as US economic data were mixed and overseas growth appeared to be slowing. By the end of the fiscal year, the US equity market generally recovered the losses from fourth quarter 2018, backed by improving investor sentiment, low unemployment and a growing economy.
| Top 10 Equity Holdings* |
| % of total net assets |
| 1. | Crown Holdings, Inc. | 4.03% |
| 2. | AECOM | 3.88 |
| 3. | MGIC Investment Corp. | 3.71 |
| 4. | Owens Corning | 3.63 |
| 5. | Sealed Air Corp. | 3.54 |
| 6. | Delphi Technologies PLC | 3.47 |
| 7. | Carlisle Cos., Inc. | 3.45 |
| 8. | Citigroup, Inc. | 3.37 |
| 9. | LKQ Corp. | 3.20 |
| 10. | LPL Financial Holdings, Inc. | 3.10 |
| Total Net Assets | $759.0 million |
| Total Number of Holdings* | 47 |
| The Fund’s holdings are subject to change, and there is no assurance that the Fund will continue to hold any particular security. |
| *Excluding money market fund holdings. |
| Data presented here are as of April 30, 2019. |
| 4 | Invesco Value Opportunities Fund |
Specialty insurance companyMGIC Investmentwas the largest contributor to overall Fund performance during the fiscal year. MGIC Investment provides private mortgage insurance and other services to mortgage lenders. The company’s financial results benefited from favorable employment and housing trends during much of 2018. Materials companySealed Air also made a significant contribution to the Fund’s performance during the fiscal year. The company produces a variety of flexible resin packaging, protective shipping materials and integrated packaging systems. Shares of Sealed Air rose during the fiscal year as the company announced a comprehensive cost reduction and profitability improvement program in 2018. Industrial firmCarlisle Companies was also a top contributor to the Fund’s performance for the fiscal year. The company manufactures materials for commercial roofing systems, as well as other industrial products. Shares of Carlisle Companies rose after the company reported record financial results for the first quarter of 2019.
The Fund’s health care holdings were the largest detractors from the Fund’s overall performance during the fiscal year. Health care companyMylan was the largest detractor from Fund performance during the fiscal year. Mylan is one of the largest generic pharmaceutical manufacturers in the world. Shares of the company declined due to the delay of several product launches and industry-wide generic drug pricing pressure. Medical distribution companiesMcKesson andCardinal Health were also large detractors from the Fund’s performance during the fiscal year. Both companies experienced pressure in their core distribution operations from the impact of generic price deflation.
We believe the single most important indicator of how the Fund is positioned for potential future success is not our recent investment results or popular statistical measures, but rather the difference between current market prices and the Fund’s estimated intrinsic value — the aggregate business value of the portfolio based on our estimate of intrinsic value for each individual holding.
At the end of the fiscal year, the difference between the market price and the estimated intrinsic value of the Fund was attractive, according to our estimation. While there is no assurance that market value will ever reflect our estimate of the Fund’s intrinsic value, we believe the gap between price and estimated intrinsic
value may provide above-average capital appreciation.
We will continue to work hard to protect and grow the Fund’s estimated intrinsic value. We thank you for your investment in Invesco Value Opportunities Fund and for sharing our long-term investment perspective.
The views and opinions expressed in management’s discussion of Fund performance are those of Invesco Advisers, Inc. These views and opinions are subject to change at any time based on factors such as market and economic conditions. These views and opinions may not be relied upon as investment advice or recommendations, or as an offer for a particular security. The information is not a complete analysis of every aspect of any market, country, industry, security or the Fund. Statements of fact are from sources considered reliable, but Invesco Advisers, Inc. makes no representation or warranty as to their completeness or accuracy. Although historical performance is no guarantee of future results, these insights may help you understand our investment management philosophy.
See important Fund and, if applicable, index disclosures later in this report.
Jonathan Edwards
Chartered Financial Analyst, Portfolio Manager, is lead manager of Invesco Value Opportunities Fund. He joined Invesco in 2001. Mr. Edwards earned a BS in economics from Texas A&M University and an MBA from The University of Texas at Austin.
Jonathan Mueller
Chartered Financial Analyst, Portfolio Manager, is manager of Invesco Value Opportunities Fund. He joined Invesco in 2001. Mr. Mueller earned a BBA in accounting from Texas Christian University and an MBA in finance from The University of Texas at Austin. He is also a Certified Public Accountant.
| 5 | Invesco Value Opportunities Fund |
Your Fund’s Long-Term Performance
Results of a $10,000 Investment — Oldest Share Class(es)
Fund and index data from 4/30/09
| 1 | Source: FactSet Research Systems Inc. |
| 2 | Source: Lipper Inc. |
Past performance cannot guarantee comparable future results.
The data shown in the chart include reinvested distributions, applicable sales charges and Fund expenses including
management fees. Index results include reinvested dividends, but they do not reflect sales charges. Performance of the peer group, if applicable, reflects fund expenses and management fees; perfor-
mance of a market index does not. Performance shown in the chart and table(s) does not reflect deduction of taxes a shareholder would pay on Fund distributions or sale of Fund shares.
| 6 | Invesco Value Opportunities Fund |
| Average Annual Total Returns |
| As of 4/30/19, including maximum applicable sales charges |
| Class A Shares | |
| Inception (6/25/01) | 5.19% |
| 10 Years | 10.78 |
| 5 Years | 4.21 |
| 1 Year | –2.13 |
| Class C Shares | |
| Inception (6/25/01) | 5.10% |
| 10 Years | 10.61 |
| 5 Years | 4.65 |
| 1 Year | 1.95 |
| Class R Shares | |
| 10 Years | 11.14% |
| 5 Years | 5.14 |
| 1 Year | 3.32 |
| Class Y Shares | |
| Inception (3/23/05) | 5.60% |
| 10 Years | 11.68 |
| 5 Years | 5.66 |
| 1 Year | 3.80 |
| Class R5 Shares | |
| 10 Years | 11.81% |
| 5 Years | 5.82 |
| 1 Year | 3.94 |
| Class R6 Shares | |
| 10 Years | 11.51% |
| 5 Years | 5.58 |
| 1 Year | 4.00 |
Effective June 1, 2010, Class A, Class C and Class I shares of the predecessor fund, Van Kampen Value Opportunities Fund, advised by Van Kampen Asset Management were reorganized into Class A, Class C and Class Y shares, respectively, of Invesco Van Kampen Value Opportunities Fund (renamed Invesco Value Opportunities Fund). Returns shown above, prior to June 1, 2010, for Class A, Class C and Class Y shares are blended returns of the predecessor fund and Invesco Value Opportunities Fund. Share class returns will differ from the predecessor fund because of different expenses.
Class R shares incepted on May 23, 2011. Performance shown prior to that date is that of the Fund’s and the predecessor fund’s Class A shares, restated to reflect the higher 12b-1 fees applicable to Class R shares.
Class R5 shares incepted on May 23, 2011. Performance shown prior to that date is that of the Fund’s and the predecessor fund’s Class A shares and includes the 12b-1 fees applicable to Class A shares.
| Average Annual Total Returns |
| As of 3/31/19, the most recent calendar quarter end, including maximum applicable sales charges |
| Class A Shares | |
| Inception (6/25/01) | 4.90% |
| 10 Years | 11.43 |
| 5 Years | 3.15 |
| 1 Year | –7.74 |
| Class C Shares | |
| Inception (6/25/01) | 4.80% |
| 10 Years | 11.28 |
| 5 Years | 3.59 |
| 1 Year | –3.96 |
| Class R Shares | |
| 10 Years | 11.79% |
| 5 Years | 4.07 |
| 1 Year | –2.62 |
| Class Y Shares | |
| Inception (3/23/05) | 5.22% |
| 10 Years | 12.34 |
| 5 Years | 4.59 |
| 1 Year | –2.17 |
| Class R5 Shares | |
| 10 Years | 12.46% |
| 5 Years | 4.74 |
| 1 Year | –2.01 |
| Class R6 Shares | |
| 10 Years | 12.16% |
| 5 Years | 4.51 |
| 1 Year | –2.01 |
Class R6 shares incepted on April 4, 2017. Performance shown prior to that date is that of the Fund’s and the predecessor fund’s Class A shares and includes the 12b-1 fees applicable to Class A shares.
The performance data quoted represent past performance and cannot guarantee comparable future results; current performance may be lower or higher. Please visit invesco.com/performance for the most recent month-end performance. Performance figures reflect reinvested distributions, changes in net asset value and the effect of the maximum sales charge unless otherwise stated. Investment return and principal value will fluctuate so that you may have a gain or loss when you sell shares.
The total annual Fund operating expense ratio set forth in the most recent Fund prospectus as of the date of this report for Class A, Class C, Class R, Class Y, Class R5 and Class R6 shares was 1.22%, 1.92%, 1.47%, 0.97%, 0.85% and 0.78%, respectively. The expense ratios presented above may vary from the expense ratios presented in other
sections of this report that are based on expenses incurred during the period covered by this report.
Class A share performance reflects the maximum 5.50% sales charge, and Class C share performance reflects the applicable contingent deferred sales charge (CDSC) for the period involved. The CDSC on Class C shares is 1% for the first year after purchase. Class R, Class Y, Class R5 and Class R6 shares do not have a front-end sales charge or a CDSC; therefore, performance is at net asset value.
The performance of the Fund’s share classes will differ primarily due to different sales charge structures and class expenses.
Fund performance reflects any applicable fee waivers and/or expense reimbursements. Had the adviser not waived fees and/or reimbursed expenses currently or in the past, returns would have been lower. See current prospectus for more information.
| 7 | Invesco Value Opportunities Fund |
Invesco Value Opportunities Fund’s investment objective is total return through growth of capital and current income.
| ■ | Unless otherwise stated, information presented in this report is as of April 30, 2019, and is based on total net assets. |
| ■ | Unless otherwise noted, all data provided by Invesco. |
| ■ | To access your Fund’s reports/prospectus, visit invesco.com/fundreports. |
About share classes
| ■ | Class R sharesare generally available only to employer sponsored retirement and benefit plans. Please see the prospectus for more information. |
| ■ | Class Y sharesare available only to certain investors. Please see the prospectus for more information. |
| ■ | Class R5 shares andClass R6 shares are available for use by retirement plans that meet certain standards and for institutional investors. Class R6 shares are also available through intermediaries that have established an agreement with Invesco Distributors, Inc. to make such shares available for use in retail omnibus accounts. Please see the prospectus for more information. |
Principal risks of investing in the Fund
| ■ | Convertible securities risk. The market values of convertible securities are affected by market interest rates, the risk of actual issuer default on interest or principal payments and the value of the underlying common stock into which the convertible security may be converted. Additionally, a convertible security is subject to the same types of market and issuer risks as apply to the underlying common stock. In addition, certain convertible securities are subject to involuntary conversions and may undergo principal write-downs upon the occurrence of certain triggering events, and, as a result, are subject to an increased risk of loss. Convertible securities may be rated below investment grade. |
| ■ | Depositary receipts risk. Investing in depositary receipts involves the same risks as direct investments in foreign securities. In addition, the underlying issuers of certain depositary receipts are under no obligation to distribute shareholder communications or pass through any voting rights with respect to the deposited securities to the holders of such receipts. The Fund |
| | may therefore receive less timely information or have less control than if it invested directly in the foreign issuer. |
| ■ | Derivatives risk. The value of a derivative instrument depends largely on (and is derived from) the value of an underlying security, currency, commodity, interest rate, index or other asset (each referred to as an underlying asset). In addition to risks relating to the underlying assets, the use of derivatives may include other, possibly greater, risks, including counterparty, leverage and liquidity risks. Counterparty risk is the risk that the counterparty to the derivative contract will default on its obligation to pay the Fund the amount owed or otherwise perform under the derivative contract. Derivatives create leverage risk because they do not require payment up front equal to the economic exposure created by holding a position in the derivative. As a result, an adverse change in the value of the underlying asset could result in the Fund sustaining a loss that is substantially greater than the amount invested in the derivative or the anticipated value of the underlying asset, which may make the Fund’s returns more volatile and increase the risk of loss. Derivative instruments may also be less liquid than more traditional investments and the Fund may be unable to sell or close out its derivative positions at a desirable time or price. This risk may be more acute under adverse market conditions, during which the Fund may be most in need of liquidating its derivative positions. Derivatives may also be harder to value, less tax efficient and subject to changing government regulation that could impact the Fund’s ability to use certain derivatives or their cost. Derivatives strategies may not always be successful. For example, derivatives used for hedging or to gain or limit exposure to a particular market |
| | segment may not provide the expected benefits, particularly during adverse market conditions. |
| ■ | Emerging markets securities risk. Emerging markets (also referred to as developing markets) are generally subject to greater market volatility, political, social and economic instability, uncertain trading markets and more governmental limitations on foreign investment than more developed markets. In addition, companies operating in emerging markets may be subject to lower trading volume and greater price fluctuations than companies in more developed markets. Securities law and the enforcement of systems of taxation in many emerging market countries may change quickly and unpredictably. In addition, investments in emerging markets securities may also be subject to additional transaction costs, delays in settlement procedures, and lack of timely information. |
| ■ | Foreign securities risk. The Fund’s foreign investments may be adversely affected by political and social instability, changes in economic or taxation policies, difficulty in enforcing obligations, decreased liquidity or increased volatility. Foreign investments also involve the risk of the possible seizure, nationalization or expropriation of the issuer or foreign deposits (in which the Fund could lose its entire investments in a certain market) and the possible adoption of foreign governmental restrictions such as exchange controls. Unless the Fund has hedged its foreign securities risk, foreign securities risk also involves the risk of negative foreign currency rate fluctuations, which may cause the value of securities denominated in such foreign currency (or other instruments through which the Fund has exposure to foreign currencies) to decline in value. Currency exchange rates may fluctuate significantly over |
This report must be accompanied or preceded by a currently effective Fund prospectus, which contains more complete information, including sales charges and expenses. Investors should read it carefully before investing.
NOT FDIC INSURED | MAY LOSE VALUE | NO BANK GUARANTEE
| 8 | Invesco Value Opportunities Fund |
| | short periods of time. Currency hedging strategies, if used, are not always successful. |
| ■ | Initial public offerings (IPO) risk. The prices of IPO securities often fluctuate more than prices of securities of companies with longer trading histories and sometimes experience significant price drops shortly after their initial issuance. In addition, companies offering securities in IPOs may have less experienced management or limited operating histories. |
| ■ | Management risk. The Fund is actively managed and depends heavily on the Adviser’s judgment about markets, interest rates or the attractiveness, relative values, liquidity, or potential appreciation of particular investments made for the Fund’s portfolio. The Fund could experience losses if these judgments prove to be incorrect. Additionally, legislative, regulatory, or tax developments may adversely affect management of the Fund and, therefore, the ability of the Fund to achieve its investment objective. |
| ■ | Market risk. The market values of the Fund’s investments, and therefore the value of the Fund’s shares, will go up and down, sometimes rapidly or unpredictably. Market risk may affect a single issuer, industry or section of the economy, or it may affect the market as a whole. Individual stock prices tend to go up and down more dramatically than those of certain other types of investments, such as bonds. During a general downturn in the financial markets, multiple asset classes may decline in value. When markets perform well, there can be no assurance that specific investments held by the Fund will rise in value. |
| ■ | Preferred securities risk. Preferred securities are subject to issuer-specific and market risks applicable generally to equity securities. Preferred securities also may be subordinated to bonds or other debt instruments, subjecting them to a greater risk of non-payment, may be less liquid than many other securities, such as common stocks, and generally offer no voting rights with respect to the issuer. |
| ■ | REIT risk/real estate risk. Investments in real estate related instruments may be affected by economic, legal, cultural, environmental or technological factors that affect property values, rents or occupancies of real estate related to the Fund’s holdings. Shares of real estate related companies, |
| | which tend to be small- and mid-cap companies, may be more volatile and less liquid. |
| ■ | Sector focus risk. The Fund may from time to time invest a significant amount of its assets (i.e. over 25%) in one market sector or group of related industries. In this event, the Fund’s performance will depend to a greater extent on the overall condition of the sector or group of industries and there is increased risk that the Fund will lose significant value if conditions adversely affect that sector or group of industries. |
| ■ | Small- and mid-capitalization companies risks. Small- and mid-capitalization companies tend to be more vulnerable to changing market conditions, may have little or no operating history or track record of success, and may have more limited product lines and markets, less experienced management and fewer financial resources than larger companies. These companies’ securities may be more volatile and less liquid than those of more established companies, and their returns may vary, sometimes significantly, from the overall securities market. |
| ■ | Unseasoned issuer risk. Investments in unseasoned companies or companies with special circumstances often involve much greater risks than are inherent in other types of investments and securities of such companies may be more likely to experience fluctuations in price. In addition, investments made in anticipation of future events may, if the events are delayed or never achieved, cause stock prices to fall. |
| ■ | Value investing style risk. A value investing style subjects the Fund to the risk that the valuations never improve or that the returns on value equity securities are less than returns on other styles of investing or the overall stock market. |
About indexes used in this report
| ■ | TheS&P 500® Index is an unmanaged index considered representative of the US stock market. |
| ■ | TheS&P 1500® Value Index tracks the performance of US large-, mid- and small-cap value stocks. |
| ■ | TheLipper Multi-Cap Value Funds Index is an unmanaged index considered representative of multicap value funds tracked by Lipper. |
| ■ | The Fund is not managed to track the performance of any particular index, |
| | including the index(es) described here, and consequently, the performance of the Fund may deviate significantly from the performance of the index(es). |
| ■ | A direct investment cannot be made in an index. Unless otherwise indicated, index results include reinvested dividends, and they do not reflect sales charges. Performance of the peer group, if applicable, reflects fund expenses; performance of a market index does not. |
Other information
| ■ | CPA®and Certified Public Accountant® are trademarks owned by the American Institute of Certified Public Accountants. |
| ■ | The returns shown in management’s discussion of Fund performance are based on net asset values (NAVs) calculated for shareholder transactions. Generally accepted accounting principles require adjustments to be made to the net assets of the Fund at period end for financial reporting purposes, and as such, the NAVs for shareholder transactions and the returns based on those NAVs may differ from the NAVs and returns reported in the Financial Highlights. |
| ■ | Industry classifications used in this report are generally according to the Global Industry Classification Standard, which was developed by and is the exclusive property and a service mark of MSCI Inc. and Standard & Poor’s. |
| 9 | Invesco Value Opportunities Fund |
Schedule of Investments(a)
April 30, 2019
| | Shares | Value |
| Common Stocks & Other Equity Interests–96.15% |
| Advertising–0.18% |
| Interpublic Group of Cos., Inc. (The) | 31,000 | $713,000 |
| Omnicom Group, Inc. | 8,655 | 692,660 |
| | | | 1,405,660 |
| Agricultural & Farm Machinery–2.02% |
| AGCO Corp. | 216,904 | 15,352,465 |
| Asset Management & Custody Banks–2.37% |
| Affiliated Managers Group, Inc. | 162,100 | 17,980,132 |
| Auto Parts & Equipment–6.09% |
| Dana, Inc. | 1,017,368 | 19,838,676 |
| Delphi Technologies PLC(b) | 1,190,635 | 26,348,753 |
| | | | 46,187,429 |
| Building Products–6.68% |
| Masco Corp. | 591,536 | 23,105,396 |
| Owens Corning | 537,900 | 27,578,133 |
| | | | 50,683,529 |
| Construction & Engineering–5.89% |
| AECOM(b) | 867,890 | 29,421,471 |
| Fluor Corp. | 383,800 | 15,248,374 |
| | | | 44,669,845 |
| Consumer Finance–1.53% |
| SLM Corp. | 1,139,800 | 11,580,368 |
| Distributors–3.20% |
| LKQ Corp.(b) | 808,000 | 24,320,800 |
| Diversified Banks–6.40% |
| Bank of America Corp. | 690,294 | 21,109,190 |
| Citigroup, Inc. | 361,721 | 25,573,675 |
| JPMorgan Chase & Co. | 16,105 | 1,868,985 |
| | | | 48,551,850 |
| Diversified Chemicals–3.58% |
| Chemours Co. (The) | 345,900 | 12,455,859 |
| Huntsman Corp. | 661,500 | 14,711,760 |
| | | | 27,167,619 |
| Electronic Components–1.34% |
| Belden, Inc. | 182,492 | 10,137,431 |
| Electronic Manufacturing Services–2.54% |
| Flex Ltd.(b) | 1,745,180 | 19,266,787 |
| Environmental & Facilities Services–2.98% |
| Stericycle, Inc.(b) | 386,768 | 22,583,384 |
| Health Care Distributors–3.07% |
| Cardinal Health, Inc. | 205,200 | 9,995,292 |
| | Shares | Value |
| Health Care Distributors–(continued) |
| McKesson Corp. | 111,700 | $13,320,225 |
| | | | 23,315,517 |
| Health Care Facilities–1.56% |
| Brookdale Senior Living, Inc.(b) | 1,918,485 | 11,856,237 |
| Health Care Services–1.19% |
| Cigna Corp. | 56,800 | 9,022,112 |
| Homebuilding–0.18% |
| D.R. Horton, Inc. | 31,600 | 1,400,196 |
| Hotels, Resorts & Cruise Lines–0.33% |
| Norwegian Cruise Line Holdings Ltd.(b) | 44,500 | 2,509,355 |
| Household Products–1.83% |
| Spectrum Brands Holdings, Inc. | 225,195 | 13,865,256 |
| Industrial Conglomerates–3.45% |
| Carlisle Cos., Inc. | 185,400 | 26,219,268 |
| Investment Banking & Brokerage–5.23% |
| Goldman Sachs Group, Inc. (The) | 75,400 | 15,526,368 |
| LPL Financial Holdings, Inc. | 317,366 | 23,513,647 |
| TD Ameritrade Holding Corp. | 12,900 | 678,282 |
| | | | 39,718,297 |
| Life & Health Insurance–0.05% |
| MetLife, Inc. | 8,000 | 369,040 |
| Managed Health Care–1.09% |
| Anthem, Inc. | 31,500 | 8,285,445 |
| Metal & Glass Containers–4.03% |
| Crown Holdings, Inc.(b) | 526,300 | 30,593,819 |
| Oil & Gas Exploration & Production–9.60% |
| Apache Corp. | 220,200 | 7,246,782 |
| Diamondback Energy, Inc. | 142,700 | 15,181,853 |
| Noble Energy, Inc. | 661,600 | 17,902,896 |
| Parsley Energy, Inc., Class A(b) | 778,800 | 15,544,848 |
| Pioneer Natural Resources Co. | 102,100 | 16,995,566 |
| | | | 72,871,945 |
| Other Diversified Financial Services–1.85% |
| AXA Equitable Holdings, Inc. | 620,200 | 14,072,338 |
| Paper Packaging–3.54% |
| Sealed Air Corp. | 576,700 | 26,885,754 |
| Pharmaceuticals–3.36% |
| Mylan N.V.(b) | 724,000 | 19,540,760 |
| Novartis AG (Switzerland) | 72,900 | 5,953,196 |
| | | | 25,493,956 |
See accompanying Notes to Financial Statements which are an integral part of the financial statements.
| 10 | Invesco Value Opportunities Fund |
| | Shares | Value |
| Steel–2.05% |
| Allegheny Technologies, Inc.(b) | 625,221 | $15,580,507 |
| Systems Software–3.00% |
| Oracle Corp. | 411,200 | 22,751,696 |
| Thrifts & Mortgage Finance–5.94% |
| MGIC Investment Corp.(b) | 1,921,316 | 28,128,066 |
| Radian Group, Inc. | 722,449 | 16,919,756 |
| | | | 45,047,822 |
| Total Common Stocks & Other Equity Interests (Cost $678,614,979) | 729,745,859 |
| | Shares | Value |
|
| Money Market Funds–3.87% |
| Invesco Government & Agency Portfolio, Institutional Class, 2.34%(c) | 10,283,176 | $10,283,176 |
| Invesco Liquid Assets Portfolio, Institutional Class, 2.48%(c) | 7,343,016 | 7,345,219 |
| Invesco Treasury Portfolio, Institutional Class, 2.32%(c) | 11,752,201 | 11,752,201 |
| Total Money Market Funds (Cost $29,379,421) | 29,380,596 |
| TOTAL INVESTMENTS IN SECURITIES–100.02% (Cost $707,994,400) | 759,126,455 |
| OTHER ASSETS LESS LIABILITIES–(0.02)% | (168,487) |
| NET ASSETS–100.00% | $758,957,968 |
Notes to Schedule of Investments:
| (a) | Industry and/or sector classifications used in this report are generally according to the Global Industry Classification Standard, which was developed by and is the exclusive property and a service mark of MSCI Inc. and Standard & Poor’s. |
| (b) | Non-income producing security. |
| (c) | The money market fund and the Fund are affiliated by having the same investment adviser. The rate shown is the 7-day SEC standardized yield as of April 30, 2019. |
See accompanying Notes to Financial Statements which are an integral part of the financial statements.
| 11 | Invesco Value Opportunities Fund |
Statement of Assets and Liabilities
April 30, 2019
| Assets: | |
Investments in securities, at value
(Cost $678,614,979) | $729,745,859 |
| Investments in affiliated money market funds, at value (Cost $29,379,421) | 29,380,596 |
| Foreign currencies, at value (Cost $648) | 675 |
| Receivable for: | |
| Investments sold | 2,369,563 |
| Fund shares sold | 222,665 |
| Dividends | 470,104 |
| Investment for trustee deferred compensation and retirement plans | 496,759 |
| Other assets | 58,294 |
| Total assets | 762,744,515 |
| Liabilities: | |
| Payable for: | |
| Investments purchased | 1,737,382 |
| Fund shares reacquired | 510,812 |
| Amount due custodian | 416,815 |
| Accrued fees to affiliates | 435,934 |
| Accrued trustees’ and officers’ fees and benefits | 2,240 |
| Accrued other operating expenses | 143,297 |
| Trustee deferred compensation and retirement plans | 540,067 |
| Total liabilities | 3,786,547 |
| Net assets applicable to shares outstanding | $758,957,968 |
| Net assets consist of: | |
| Shares of beneficial interest | $698,810,150 |
| Distributable earnings | 60,147,818 |
| | $758,957,968 |
| Net Assets: |
| Class A | $658,684,998 |
| Class C | $17,027,251 |
| Class R | $10,898,476 |
| Class Y | $37,468,827 |
| Class R5 | $2,212,177 |
| Class R6 | $32,666,239 |
| Shares outstanding, no par value, with an unlimited number of shares authorized: |
| Class A | 51,304,387 |
| Class C | 1,416,038 |
| Class R | 858,946 |
| Class Y | 2,912,746 |
| Class R5 | 170,829 |
| Class R6 | 2,518,360 |
| Class A: | |
| Net asset value per share | $12.84 |
Maximum offering price per share
(Net asset value of $12.84 ÷ 94.50%) | $13.59 |
| Class C: | |
| Net asset value and offering price per share | $12.02 |
| Class R: | |
| Net asset value and offering price per share | $12.69 |
| Class Y: | |
| Net asset value and offering price per share | $12.86 |
| Class R5: | |
| Net asset value and offering price per share | $12.95 |
| Class R6: | |
| Net asset value and offering price per share | $12.97 |
See accompanying Notes to Financial Statements which are an integral part of the financial statements.
| 12 | Invesco Value Opportunities Fund |
Statement of Operations
For the year ended April 30, 2019
| Investment income: | |
| Dividends (net of foreign withholding taxes of $31,174) | $8,937,596 |
| Dividends from affiliated money market funds | 423,005 |
| Total investment income | 9,360,601 |
| Expenses: | |
| Advisory fees | 5,106,244 |
| Administrative services fees | 171,085 |
| Custodian fees | 18,276 |
| Distribution fees: | |
| Class A | 1,573,144 |
| Class C | 489,134 |
| Class R | 60,410 |
| Transfer agent fees— A, C, R and Y | 1,597,169 |
| Transfer agent fees — R5 | 2,394 |
| Transfer agent fees — R6 | 13,511 |
| Trustees’ and officers’ fees and benefits | 32,190 |
| Registration and filing fees | 101,959 |
| Reports to shareholders | 144,199 |
| Professional services fees | 71,022 |
| Other | 29,685 |
| Total expenses | 9,410,422 |
| Less: Fees waived and expense offset arrangement(s) | (39,831) |
| Net expenses | 9,370,591 |
| Net investment income (loss) | (9,990) |
| Realized and unrealized gain (loss) from: | |
| Net realized gain from: | |
| Investment securities | 53,173,491 |
| Foreign currencies | 2,279 |
| | 53,175,770 |
| Change in net unrealized appreciation (depreciation) of: | |
| Investment securities | (28,825,734) |
| Foreign currencies | (7,744) |
| | (28,833,478) |
| Net realized and unrealized gain | 24,342,292 |
| Net increase in net assets resulting from operations | $24,332,302 |
See accompanying Notes to Financial Statements which are an integral part of the financial statements.
| 13 | Invesco Value Opportunities Fund |
Statement of Changes in Net Assets
For the years ended April 30, 2019 and 2018
| | 2019 | 2018 |
| Operations: | | |
| Net investment income (loss) | $(9,990) | $(58,546) |
| Net realized gain | 53,175,770 | 49,316,909 |
| Change in net unrealized appreciation (depreciation) | (28,833,478) | 35,048,084 |
| Net increase in net assets resulting from operations | 24,332,302 | 84,306,447 |
| Distributions to shareholders from distributable earnings(1): | | |
| Class A | (68,727,018) | (33,994,064) |
| Class B | — | (286,229) |
| Class C | (7,256,248) | (3,782,570) |
| Class R | (1,393,943) | (725,454) |
| Class Y | (4,210,458) | (3,129,069) |
| Class R5 | (267,250) | (128,051) |
| Class R6 | (3,356,878) | (7,273) |
| Total distributions to shareholders from distributable earnings | (85,211,795) | (42,052,710) |
| Share transactions–net: | | |
| Class A | 41,564,681 | (17,733,820) |
| Class B | — | (9,801,875) |
| Class C | (41,578,892) | (17,454,601) |
| Class R | (905,036) | (1,996,871) |
| Class Y | 1,018,691 | (12,094,925) |
| Class R5 | (43,992) | (159,671) |
| Class R6 | 6,374,257 | 31,168,802 |
| Net increase (decrease) in net assets resulting from share transactions | 6,429,709 | (28,072,961) |
| Net increase (decrease) in net assets | (54,449,784) | 14,180,776 |
| Net assets: | | |
| Beginning of year | 813,407,752 | 799,226,976 |
| End of year | $758,957,968 | $813,407,752 |
| (1) | The Securities and Exchange Commission eliminated the requirement to disclose the distribution components separately, except for tax return of capital. For the year ended April 30, 2018, distributions to shareholders from distributable earnings consisted of distributions from net realized gains. |
See accompanying Notes to Financial Statements which are an integral part of the financial statements.
| 14 | Invesco Value Opportunities Fund |
Financial Highlights
April 30, 2019
The following schedule presents financial highlights for a share of the Fund outstanding throughout the periods indicated.
| | Net asset
value,
beginning
of period | Net
investment
income
(loss)(a) | Net gains
(losses)
on securities
(both
realized and
unrealized) | Total from
investment
operations | Dividends
from net
investment
income | Distributions
from net
realized
gains | Total
distributions | Net asset
value, end
of period | Total
return(b) | Net assets,
end of period
(000’s omitted) | Ratio of
expenses
to average
net assets
with fee waivers
and/or expenses
absorbed | Ratio of
expenses
to average net
assets without
fee waivers
and/or expenses
absorbed | Ratio of net
investment
income
(loss)
to average
net assets | Portfolio
turnover(c) |
| Class A |
| Year ended 04/30/19 | $14.24 | $0.00 | $0.18 | $0.18 | $— | $(1.58) | $(1.58) | $12.84 | 3.58% | $658,685 | 1.21%(d) | 1.21%(d) | 0.02%(d) | 51% |
| Year ended 04/30/18 | 13.50 | 0.01 | 1.48 | 1.49 | — | (0.75) | (0.75) | 14.24 | 10.87 | 662,211 | 1.21 | 1.21 | 0.04 | 30 |
| Year ended 04/30/17 | 11.60 | 0.01 | 2.05 | 2.06 | (0.02) | (0.14) | (0.16) | 13.50 | 17.81 | 645,216 | 1.26 | 1.27 | 0.07 | 33 |
| Year ended 04/30/16 | 14.45 | 0.02 | (1.08) | (1.06) | (0.13) | (1.66) | (1.79) | 11.60 | (6.93) | 622,026 | 1.25 | 1.25 | 0.17 | 38 |
| Year ended 04/30/15 | 14.24 | 0.13 | 0.33 | 0.46 | (0.25) | — | (0.25) | 14.45 | 3.29 | 754,084 | 1.22 | 1.23 | 0.88 | 64 |
| Class C |
| Year ended 04/30/19 | 13.54 | (0.09) | 0.15 | 0.06 | — | (1.58) | (1.58) | 12.02 | 2.83(e) | 17,027 | 1.92(d)(e) | 1.92(d)(e) | (0.69)(d)(e) | 51 |
| Year ended 04/30/18 | 12.96 | (0.09) | 1.42 | 1.33 | — | (0.75) | (0.75) | 13.54 | 10.07(e) | 68,174 | 1.91(e) | 1.91(e) | (0.66)(e) | 30 |
| Year ended 04/30/17 | 11.20 | (0.08) | 1.98 | 1.90 | — | (0.14) | (0.14) | 12.96 | 17.00(e) | 82,590 | 1.97(e) | 1.98(e) | (0.64)(e) | 33 |
| Year ended 04/30/16 | 14.07 | (0.07) | (1.05) | (1.12) | (0.09) | (1.66) | (1.75) | 11.20 | (7.57)(e) | 79,538 | 1.97(e) | 1.97(e) | (0.55)(e) | 38 |
| Year ended 04/30/15 | 13.87 | 0.02 | 0.33 | 0.35 | (0.15) | — | (0.15) | 14.07 | 2.53(e) | 99,994 | 1.95(e) | 1.96(e) | 0.15(e) | 64 |
| Class R |
| Year ended 04/30/19 | 14.13 | (0.03) | 0.17 | 0.14 | — | (1.58) | (1.58) | 12.69 | 3.32 | 10,898 | 1.46(d) | 1.46(d) | (0.23)(d) | 51 |
| Year ended 04/30/18 | 13.43 | (0.03) | 1.48 | 1.45 | — | (0.75) | (0.75) | 14.13 | 10.63 | 12,955 | 1.46 | 1.46 | (0.21) | 30 |
| Year ended 04/30/17 | 11.55 | (0.02) | 2.04 | 2.02 | — | (0.14) | (0.14) | 13.43 | 17.53 | 14,135 | 1.51 | 1.52 | (0.18) | 33 |
| Year ended 04/30/16 | 14.41 | (0.01) | (1.07) | (1.08) | (0.12) | (1.66) | (1.78) | 11.55 | (7.12) | 16,119 | 1.50 | 1.50 | (0.08) | 38 |
| Year ended 04/30/15 | 14.20 | 0.09 | 0.33 | 0.42 | (0.21) | — | (0.21) | 14.41 | 3.03 | 20,696 | 1.47 | 1.48 | 0.63 | 64 |
| Class Y |
| Year ended 04/30/19 | 14.23 | 0.04 | 0.17 | 0.21 | — | (1.58) | (1.58) | 12.86 | 3.80 | 37,469 | 0.96(d) | 0.96(d) | 0.27(d) | 51 |
| Year ended 04/30/18 | 13.46 | 0.04 | 1.48 | 1.52 | — | (0.75) | (0.75) | 14.23 | 11.13 | 39,323 | 0.96 | 0.96 | 0.29 | 30 |
| Year ended 04/30/17 | 11.56 | 0.04 | 2.06 | 2.10 | (0.06) | (0.14) | (0.20) | 13.46 | 18.17 | 46,105 | 1.01 | 1.02 | 0.32 | 33 |
| Year ended 04/30/16 | 14.39 | 0.05 | (1.08) | (1.03) | (0.14) | (1.66) | (1.80) | 11.56 | (6.71) | 21,016 | 1.00 | 1.00 | 0.42 | 38 |
| Year ended 04/30/15 | 14.21 | 0.16 | 0.33 | 0.49 | (0.31) | — | (0.31) | 14.39 | 3.55 | 22,295 | 0.97 | 0.98 | 1.13 | 64 |
| Class R5 |
| Year ended 04/30/19 | 14.29 | 0.05 | 0.19 | 0.24 | — | (1.58) | (1.58) | 12.95 | 4.01 | 2,212 | 0.84(d) | 0.84(d) | 0.39(d) | 51 |
| Year ended 04/30/18 | 13.50 | 0.06 | 1.48 | 1.54 | — | (0.75) | (0.75) | 14.29 | 11.25 | 2,439 | 0.84 | 0.84 | 0.41 | 30 |
| Year ended 04/30/17 | 11.60 | 0.06 | 2.06 | 2.12 | (0.08) | (0.14) | (0.22) | 13.50 | 18.30 | 2,456 | 0.85 | 0.86 | 0.48 | 33 |
| Year ended 04/30/16 | 14.42 | 0.08 | (1.09) | (1.01) | (0.15) | (1.66) | (1.81) | 11.60 | (6.56) | 2,850 | 0.84 | 0.84 | 0.58 | 38 |
| Year ended 04/30/15 | 14.25 | 0.19 | 0.33 | 0.52 | (0.35) | — | (0.35) | 14.42 | 3.76 | 2,952 | 0.82 | 0.83 | 1.28 | 64 |
| Class R6 |
| Year ended 04/30/19 | 14.31 | 0.06 | 0.18 | 0.24 | — | (1.58) | (1.58) | 12.97 | 4.00 | 32,666 | 0.79(d) | 0.79(d) | 0.44(d) | 51 |
| Year ended 04/30/18 | 13.50 | 0.08 | 1.48 | 1.56 | — | (0.75) | (0.75) | 14.31 | 11.40 | 28,305 | 0.77 | 0.77 | 0.48 | 30 |
| Year ended 04/30/17(f) | 13.60 | 0.01 | (0.11) | (0.10) | — | — | — | 13.50 | (0.74) | 10 | 0.76(g) | 0.76(g) | 0.57(g) | 33 |
| (a) | Calculated using average shares outstanding. |
| (b) | Includes adjustments in accordance with accounting principles generally accepted in the United States of America and as such, the net asset value for financial reporting purposes and the returns based upon those net asset values may differ from the net asset value and returns for shareholder transactions. Does not include sales charges and is not annualized for periods less than one year, if applicable. |
| (c) | Portfolio turnover is calculated at the fund level and is not annualized for periods less than one year, if applicable. |
| (d) | Ratios are based on average daily net assets (000’s omitted) of $629,257, $51,125, $12,082, $38,167, $2,403 and $29,562 for Class A, Class C, Class R, Class Y, Class R5 and Class R6 shares, respectively. |
| (e) | The total return, ratio of expenses to average net assets and ratio of net investment income (loss) to average net assets reflect actual 12b-1 fees of 0.96%, 0.95%, 0.97%, 0.97% and 0.98% for the years ended April 30, 2019, 2018, 2017, 2016 and 2015, respectively. |
| (f) | Commencement date of April 04, 2017. |
| (g) | Annualized. |
See accompanying Notes to Financial Statements which are an integral part of the financial statements.
| 15 | Invesco Value Opportunities Fund |
Notes to Financial Statements
April 30, 2019
NOTE 1—Significant Accounting Policies
Invesco Value Opportunities Fund (the “Fund”) is a series portfolio of AIM Sector Funds (Invesco Sector Funds) (the “Trust”). The Trust is a Delaware statutory trust registered under the Investment Company Act of 1940, as amended (the “1940 Act”), as an open-end series management investment company authorized to issue an unlimited number of shares of beneficial interest. Information presented in these financial statements pertains only to the Fund. Matters affecting the Fund or each class will be voted on exclusively by the shareholders of the Fund or each class.
The Fund’s investment objective is total return through growth of capital and current income.
The Fund currently consists of six different classes of shares: Class A, Class C, Class R, Class Y, Class R5 and Class R6. Class Y shares are available only to certain investors. Class A shares are sold with a front-end sales charge unless certain waiver criteria are met. Under certain circumstances, load waived shares may be subject to contingent deferred sales charges ("CDSC"). Class C shares are sold with a CDSC. Class R, Class Y, Class R5 and Class R6 shares are sold at net asset value. Class C shares held for ten years after purchase are eligible for automatic conversion into Class A shares of the same Fund (the "Conversion Feature"). The automatic conversion pursuant to the Conversion Feature will generally occur at the end of the month following the tenth anniversary after a purchase of Class C shares.
The Fund is an investment company and accordingly follows the investment company accounting and reporting guidance in accordance with Financial Accounting Standards Board Accounting Standards Codification Topic 946,Financial Services – Investment Companies.
The following is a summary of the significant accounting policies followed by the Fund in the preparation of its financial statements.
| A. | Security Valuations — Securities, including restricted securities, are valued according to the following policy. |
A security listed or traded on an exchange (except convertible securities) is valued at its last sales price or official closing price as of the close of the customary trading session on the exchange where the security is principally traded, or lacking any sales or official closing price on a particular day, the security may be valued at the closing bid price on that day. Securities traded in the over-the-counter market are valued based on prices furnished by independent pricing services or market makers. When such securities are valued by an independent pricing service they may be considered fair valued. Futures contracts are valued at the final settlement price set by an exchange on which they are principally traded. Listed options are valued at the mean between the last bid and asked prices from the exchange on which they are principally traded. Options not listed on an exchange are valued by an independent source at the mean between the last bid and asked prices. For purposes of determining net asset value (“NAV”) per share, futures and option contracts generally are valued 15 minutes after the close of the customary trading session of the New York Stock Exchange (“NYSE”).
Investments in open-end and closed-end registered investment companies that do not trade on an exchange are valued at the end-of-day net asset value per share. Investments in open-end and closed-end registered investment companies that trade on an exchange are valued at the last sales price or official closing price as of the close of the customary trading session on the exchange where the security is principally traded.
Debt obligations (including convertible securities) and unlisted equities are fair valued using an evaluated quote provided by an independent pricing service. Evaluated quotes provided by the pricing service may be determined without exclusive reliance on quoted prices, and may reflect appropriate factors such as institution-size trading in similar groups of securities, developments related to specific securities, dividend rate (for unlisted equities), yield (for debt obligations), quality, type of issue, coupon rate (for debt obligations), maturity (for debt obligations), individual trading characteristics and other market data. Pricing services generally value debt obligations assuming orderly transactions of institutional round lot size, but a fund may hold or transact in the same securities in smaller, odd lot sizes. Odd lots often trade at lower prices than institutional round lots. Debt obligations are subject to interest rate and credit risks. In addition, all debt obligations involve some risk of default with respect to interest and/or principal payments.
Foreign securities’ (including foreign exchange contracts) prices are converted into U.S. dollar amounts using the applicable exchange rates as of the close of the NYSE. If market quotations are available and reliable for foreign exchange-traded equity securities, the securities will be valued at the market quotations. Because trading hours for certain foreign securities end before the close of the NYSE, closing market quotations may become unreliable. If between the time trading ends on a particular security and the close of the customary trading session on the NYSE, events occur that the investment adviser determines are significant and make the closing price unreliable, the Fund may fair value the security. If the event is likely to have affected the closing price of the security, the security will be valued at fair value in good faith using procedures approved by the Board of Trustees. Adjustments to closing prices to reflect fair value may also be based on a screening process of an independent pricing service to indicate the degree of certainty, based on historical data, that the closing price in the principal market where a foreign security trades is not the current value as of the close of the NYSE. Foreign securities’ prices meeting the approved degree of certainty that the price is not reflective of current value will be priced at the indication of fair value from the independent pricing service. Multiple factors may be considered by the independent pricing service in determining adjustments to reflect fair value and may include information relating to sector indices, American Depositary Receipts and domestic and foreign index futures. Foreign securities may have additional risks including exchange rate changes, potential for sharply devalued currencies and high inflation, political and economic upheaval, the relative lack of issuer information, relatively low market liquidity and the potential lack of strict financial and accounting controls and standards.
Securities for which market prices are not provided by any of the above methods may be valued based upon quotes furnished by independent sources. The last bid price may be used to value equity securities. The mean between the last bid and asked prices is used to value debt obligations, including corporate loans.
Securities for which market quotations are not readily available or became unreliable are valued at fair value as determined in good faith by or under the supervision of the Trust’s officers following procedures approved by the Board of Trustees. Issuer specific events, market trends, bid/asked quotes of brokers and information providers and other market data may be reviewed in the course of making a good faith determination of a security’s fair value.
The Fund may invest in securities that are subject to interest rate risk, meaning the risk that the prices will generally fall as interest rates rise and, conversely, the prices will generally rise as interest rates fall. Specific securities differ in their sensitivity to changes in interest rates depending on their individual characteristics. Changes in interest rates may result in increased market volatility, which may affect the value and/or liquidity of certain Fund investments.
| 16 | Invesco Value Opportunities Fund |
Valuations change in response to many factors including the historical and prospective earnings of the issuer, the value of the issuer’s assets, general economic conditions, interest rates, investor perceptions and market liquidity. Because of the inherent uncertainties of valuation, the values reflected in the financial statements may materially differ from the value received upon actual sale of those investments.
| B. | Securities Transactions and Investment Income — Securities transactions are accounted for on a trade date basis. Realized gains or losses on sales are computed on the basis of specific identification of the securities sold. Interest income (net of withholding tax, if any) is recorded on the accrual basis from settlement date. Dividend income (net of withholding tax, if any) is recorded on the ex-dividend date. |
The Fund may periodically participate in litigation related to Fund investments. As such, the Fund may receive proceeds from litigation settlements. Any proceeds received are included in the Statement of Operations as realized gain (loss) for investments no longer held and as unrealized gain (loss) for investments still held.
Brokerage commissions and mark ups are considered transaction costs and are recorded as an increase to the cost basis of securities purchased and/or a reduction of proceeds on a sale of securities. Such transaction costs are included in the determination of net realized and unrealized gain (loss) from investment securities reported in the Statement of Operations and the Statement of Changes in Net Assets and the net realized and unrealized gains (losses) on securities per share in the Financial Highlights. Transaction costs are included in the calculation of the Fund’s net asset value and, accordingly, they reduce the Fund’s total returns. These transaction costs are not considered operating expenses and are not reflected in net investment income reported in the Statement of Operations and the Statement of Changes in Net Assets, or the net investment income per share and the ratios of expenses and net investment income reported in the Financial Highlights, nor are they limited by any expense limitation arrangements between the Fund and the investment adviser.
The Fund allocates income and realized and unrealized capital gains and losses to a class based on the relative net assets of each class.
| C. | Country Determination – For the purposes of making investment selection decisions and presentation in the Schedule of Investments, the investment adviser may determine the country in which an issuer is located and/or credit risk exposure based on various factors. These factors include the laws of the country under which the issuer is organized, where the issuer maintains a principal office, the country in which the issuer derives 50% or more of its total revenues and the country that has the primary market for the issuer’s securities, as well as other criteria. Among the other criteria that may be evaluated for making this determination are the country in which the issuer maintains 50% or more of its assets, the type of security, financial guarantees and enhancements, the nature of the collateral and the sponsor organization. Country of issuer and/or credit risk exposure has been determined to be the United States of America, unless otherwise noted. |
| D. | Distributions– Distributions from net investment income and net realized capital gain, if any, are generally declared and paid annually and recorded on the ex-dividend date. The Fund may elect to treat a portion of the proceeds from redemptions as distributions for federal income tax purposes. |
| E. | Federal Income Taxes – The Fund intends to comply with the requirements of Subchapter M of the Internal Revenue Code of 1986, as amended (the “Internal Revenue Code”), necessary to qualify as a regulated investment company and to distribute substantially all of the Fund’s taxable earnings to shareholders. As such, the Fund will not be subject to federal income taxes on otherwise taxable income (including net realized capital gain) that is distributed to shareholders. Therefore, no provision for federal income taxes is recorded in the financial statements. |
The Fund recognizes the tax benefits of uncertain tax positions only when the position is more likely than not to be sustained. Management has analyzed the Fund’s uncertain tax positions and concluded that no liability for unrecognized tax benefits should be recorded related to uncertain tax positions. Management is not aware of any tax positions for which it is reasonably possible that the total amounts of unrecognized tax benefits will change materially in the next 12 months.
The Fund files tax returns in the U.S. Federal jurisdiction and certain other jurisdictions. Generally, the Fund is subject to examinations by such taxing authorities for up to three years after the filing of the return for the tax period.
| F. | Expenses – Fees provided for under the Rule 12b-1 plan of a particular class of the Fund are charged to the operations of such class. Transfer agency fees and expenses and other shareholder recordkeeping fees and expenses attributable to Class R5 and Class R6 are allocated to each share class based on relative net assets. Sub-accounting fees attributable to Class R5 are charged to the operations of the class. Transfer agency fees and expenses and other shareholder recordkeeping fees and expenses relating to all other classes are allocated among those classes based on relative net assets. All other expenses are allocated among the classes based on relative net assets. |
| G. | Accounting Estimates – The preparation of financial statements in conformity with accounting principles generally accepted in the United States of America (“GAAP”) requires management to make estimates and assumptions that affect the reported amounts of assets and liabilities at the date of the financial statements and the reported amounts of revenues and expenses during the reporting period including estimates and assumptions related to taxation. Actual results could differ from those estimates by a significant amount. In addition, the Fund monitors for material events or transactions that may occur or become known after the period-end date and before the date the financial statements are released to print. |
| H. | Indemnifications – Under the Trust’s organizational documents, each Trustee, officer, employee or other agent of the Trust is indemnified against certain liabilities that may arise out of the performance of their duties to the Fund. Additionally, in the normal course of business, the Fund enters into contracts, including the Fund’s servicing agreements, that contain a variety of indemnification clauses. The Fund’s maximum exposure under these arrangements is unknown as this would involve future claims that may be made against the Fund that have not yet occurred. The risk of material loss as a result of such indemnification claims is considered remote. |
| I. | Foreign Currency Translations – Foreign currency is valued at the close of the NYSE based on quotations posted by banks and major currency dealers. Portfolio securities and other assets and liabilities denominated in foreign currencies are translated into U.S. dollar amounts at the date of valuation. Purchases and sales of portfolio securities (net of foreign taxes withheld on disposition) and income items denominated in foreign currencies are translated into U.S. dollar amounts on the respective dates of such transactions. The Fund does not separately account for the portion of the results of operations resulting from changes in foreign exchange rates on investments and the fluctuations arising from changes in market prices of securities held. The combined results of changes in foreign exchange rates and the fluctuation of market prices on investments (net of estimated foreign tax withholding) are included with the net realized and unrealized gain or loss from investments in the Statement of Operations. Reported net realized foreign currency gains or losses arise from (1) sales of foreign currencies, (2) currency gains or losses realized between the trade and settlement dates on securities transactions, and (3) the difference between the amounts of dividends, interest, and foreign withholding taxes recorded on the Fund’s books and the U.S. dollar equivalent of the amounts actually received or paid. Net |
| 17 | Invesco Value Opportunities Fund |
| | unrealized foreign currency gains and losses arise from changes in the fair values of assets and liabilities, other than investments in securities at fiscal period end, resulting from changes in exchange rates. |
The Fund may invest in foreign securities, which may be subject to foreign taxes on income, gains on investments or currency repatriation, a portion of which may be recoverable. Foreign taxes, if any, are recorded based on the tax regulations and rates that exist in the foreign markets in which the Fund invests and are shown in the Statement of Operations.
| J. | Forward Foreign Currency Contracts – The Fund may engage in foreign currency transactions either on a spot (i.e. for prompt delivery and settlement) basis, or through forward foreign currency contracts, to manage or minimize currency or exchange rate risk. |
The Fund may also enter into forward foreign currency contracts for the purchase or sale of a security denominated in a foreign currency in order to “lock in” the U.S. dollar price of that security, or the Fund may also enter into forward foreign currency contracts that do not provide for physical settlement of the two currencies, but instead are settled by a single cash payment calculated as the difference between the agreed upon exchange rate and the spot rate at settlement based upon an agreed upon notional amount (non-deliverable forwards). The Fund will set aside liquid assets in an amount equal to the daily mark-to-market obligation for forward foreign currency contracts.
A forward foreign currency contract is an obligation between two parties (“Counterparties”) to purchase or sell a specific currency for an agreed-upon price at a future date. The use of forward foreign currency contracts does not eliminate fluctuations in the price of the underlying securities the Fund owns or intends to acquire but establishes a rate of exchange in advance. Fluctuations in the value of these contracts are measured by the difference in the contract date and reporting date exchange rates and are recorded as unrealized appreciation (depreciation) until the contracts are closed. When the contracts are closed, realized gains (losses) are recorded. Realized and unrealized gains (losses) on the contracts are included in the Statement of Operations. The primary risks associated with forward foreign currency contracts include failure of the Counterparty to meet the terms of the contract and the value of the foreign currency changing unfavorably. These risks may be in excess of the amounts reflected in the Statement of Assets and Liabilities.
NOTE 2—Advisory Fees and Other Fees Paid to Affiliates
The Trust has entered into a master investment advisory agreement with Invesco Advisers, Inc. (the "Adviser" or "Invesco"). Under the terms of the investment advisory agreement, the Fund accrues daily and pays monthly an advisory fee to the Adviser based on the annual rate of the Fund’s average daily net assets as follows:
| Average Daily Net Assets | Rate |
| First $250 million | 0.695% |
| Next $250 million | 0.67% |
| Next $500 million | 0.645% |
| Next $1.5 billion | 0.62% |
| Next $2.5 billion | 0.595% |
| Next $2.5 billion | 0.57% |
| Next $2.5 billion | 0.545% |
| Over $10 billion | 0.52% |
For the year ended April 30, 2019, the effective advisory fees incurred by the Fund was 0.67%.
Under the terms of a master sub-advisory agreement between the Adviser and each of Invesco Asset Management Deutschland GmbH, Invesco Asset Management Limited, Invesco Asset Management (Japan) Limited, Invesco Hong Kong Limited, Invesco Senior Secured Management, Inc. and Invesco Canada Ltd. (collectively, the "Affiliated Sub-Advisers") the Adviser, not the Fund, will pay 40% of the fees paid to the Adviser to any such Affiliated Sub-Adviser(s) that provide(s) discretionary investment management services to the Fund based on the percentage of assets allocated to such Affiliated Sub-Adviser(s).
The Adviser has contractually agreed, through at least June 30, 2020, to waive advisory fees and/or reimburse expenses of all shares to the extent necessary to limit total annual fund operating expenses after fee waiver and/or expense reimbursement (excluding certain items discussed above) of Class A, Class C, Class R, Class Y, Class R5 and Class R6 shares to 2.00%, 2.75%, 2.25%, 1.75%, 1.75% and 1.75%, respectively, of average daily net assets (the “expense limits”). In determining the Adviser’s obligation to waive advisory fees and/or reimburse expenses, the following expenses are not taken into account, and could cause the total annual fund operating expenses after fee waiver and/or expense reimbursement to exceed the numbers reflected above: (1) interest; (2) taxes; (3) dividend expense on short sales; (4) extraordinary or non-routine items, including litigation expenses; and (5) expenses that the Fund has incurred but did not actually pay because of an expense offset arrangement. Unless Invesco continues the fee waiver agreement, it will terminate on June 30, 2020. During its term, the fee waiver agreement cannot be terminated or amended to increase the expense limits or reduce the advisory fee waiver without approval of the Board of Trustees. The Adviser did not waive fees and/or reimburse expenses during the period under these expense limits.
Further, the Adviser has contractually agreed, through at least June 30, 2021, to waive the advisory fee payable by the Fund in an amount equal to 100% of the net advisory fees the Adviser receives from the affiliated money market funds on investments by the Fund of uninvested cash (excluding investments of cash collateral from securities lending) in such affiliated money market funds.
For the year ended April 30, 2019, the Adviser waived advisory fees of $20,913.
The Trust has entered into a master administrative services agreement with Invesco pursuant to which the Fund has agreed to pay Invesco for certain administrative costs incurred in providing accounting services to the Fund. For the year ended April 30, 2019, expenses incurred under the agreement are shown in the Statement of Operations asAdministrative services fees. Also, Invesco has entered into a sub-administration agreement whereby State Street Bank and Trust Company (“SSB”) serves as custodian and fund accountant and provides certain administrative services to the Fund.
The Trust has entered into a transfer agency and service agreement with Invesco Investment Services, Inc. (“IIS”) pursuant to which the Fund has agreed to pay IIS a fee for providing transfer agency and shareholder services to the Fund and reimburse IIS for certain expenses incurred by IIS in the course of providing such services. IIS may make payments to intermediaries that provide omnibus account services, sub-accounting services and/or
| 18 | Invesco Value Opportunities Fund |
networking services. All fees payable by IIS to intermediaries that provide omnibus account services or sub-accounting services are charged back to the Fund, subject to certain limitations approved by the Trust’s Board of Trustees. For the year ended April 30, 2019, expenses incurred under the agreement are shown in the Statement of Operations asTransfer agent fees.
Shares of the Fund are distributed by Invesco Distributors, Inc. (“IDI”). The Fund has adopted a distribution plan pursuant to Rule 12b-1 under the 1940 Act, and a service plan (collectively, the “Plans”) for Class A, Class C and Class R shares to compensate IDI for the sale, distribution, shareholder servicing and maintenance of shareholder accounts for these shares. Under the Plans, the Fund will incur annual fees of up to 0.25% of Class A average daily net assets, up to 1.00% of Class C average daily net assets and up to 0.50% of Class R average daily net assets. The fees are accrued daily and paid monthly.
With respect to Class C shares, the Fund is authorized to reimburse in future years any distribution related expenses that exceed the maximum annual reimbursement rate for such class, so long as such reimbursement does not cause the Fund to exceed the Class C maximum annual reimbursement rate, respectively. With respect to Class A shares, distribution related expenses that exceed the maximum annual reimbursement rate for such class are not carried forward to future years and the Fund will not reimburse IDI for any such expenses.
For the year ended April 30, 2019, expenses incurred under these agreements are shown in the Statement of Operations asDistribution fees.
Front-end sales commissions and CDSC (collectively, the “sales charges”) are not recorded as expenses of the Fund. Front-end sales commissions are deducted from proceeds from the sales of Fund shares prior to investment in Class A shares of the Fund. CDSC are deducted from redemption proceeds prior to remittance to the shareholder. During the year ended April 30, 2019, IDI advised the Fund that IDI retained $58,323 in front-end sales commissions from the sale of Class A shares and $5,967 and $801 from Class A and Class C shares, respectively, for CDSC imposed upon redemptions by shareholders.
For the year ended April 30, 2019, the Fund incurred $11,660 in brokerage commissions with Invesco Capital Markets, Inc., an affiliate of the Adviser and IDI, for portfolio transactions executed on behalf of the Fund.
Certain officers and trustees of the Trust are officers and directors of the Adviser, IIS and/or IDI.
NOTE 3—Additional Valuation Information
GAAP defines fair value as the price that would be received to sell an asset or paid to transfer a liability in an orderly transaction between market participants at the measurement date, under current market conditions. GAAP establishes a hierarchy that prioritizes the inputs to valuation methods, giving the highest priority to readily available unadjusted quoted prices in an active market for identical assets (Level 1) and the lowest priority to significant unobservable inputs (Level 3), generally when market prices are not readily available or are unreliable. Based on the valuation inputs, the securities or other investments are tiered into one of three levels. Changes in valuation methods may result in transfers in or out of an investment’s assigned level:
Level 1 — Prices are determined using quoted prices in an active market for identical assets.
Level 2 — Prices are determined using other significant observable inputs. Observable inputs are inputs that other market participants may use in pricing a security. These may include quoted prices for similar securities, interest rates, prepayment speeds, credit risk, yield curves, loss severities, default rates, discount rates, volatilities and others.
Level 3 — Prices are determined using significant unobservable inputs. In situations where quoted prices or observable inputs are unavailable (for example, when there is little or no market activity for an investment at the end of the period), unobservable inputs may be used. Unobservable inputs reflect the Fund’s own assumptions about the factors market participants would use in determining fair value of the securities or instruments and would be based on the best available information.
As of April 30, 2019, all of the securities in this Fund were valued based on Level 1 inputs (see the Schedule of Investments for security categories). The level assigned to the securities valuations may not be an indication of the risk or liquidity associated with investing in those securities. Because of the inherent uncertainties of valuation, the values reflected in the financial statements may materially differ from the value received upon actual sale of those investments.
NOTE 4—Expense Offset Arrangement(s)
The expense offset arrangement is comprised of transfer agency credits which result from balances in demand deposit accounts used by the transfer agent for clearing shareholder transactions. For the year ended April 30, 2019, the Fund received credits from this arrangement, which resulted in the reduction of the Fund’s total expenses of $18,918.
NOTE 5—Trustees’ and Officers’ Fees and Benefits
Trustees’ and Officers’ Fees and Benefits include amounts accrued by the Fund to pay remuneration to certain Trustees and Officers of the Fund. Trustees have the option to defer compensation payable by the Fund, and Trustees’ and Officers’ Fees and Benefits also include amounts accrued by the Fund to fund such deferred compensation amounts. Those Trustees who defer compensation have the option to select various Invesco Funds in which their deferral accounts shall be deemed to be invested. Finally, certain current Trustees were eligible to participate in a retirement plan that provided for benefits to be paid upon retirement to Trustees over a period of time based on the number of years of service. The Fund may have certain former Trustees who also participate in a retirement plan and receive benefits under such plan.Trustees’ and Officers’ Fees and Benefits include amounts accrued by the Fund to fund such retirement benefits. Obligations under the deferred compensation and retirement plans represent unsecured claims against the general assets of the Fund.
NOTE 6—Cash Balances
The Fund is permitted to temporarily carry a negative or overdrawn balance in its account with SSB, the custodian bank. Such balances, if any at period-end, are shown in the Statement of Assets and Liabilities under the payable captionAmount due custodian. To compensate the custodian bank for such overdrafts, the overdrawn Fund may either (1) leave funds as a compensating balance in the account so the custodian bank can be compensated by earning the additional interest; or (2) compensate by paying the custodian bank at a rate agreed upon by the custodian bank and Invesco, not to exceed the contractually agreed upon rate.
| 19 | Invesco Value Opportunities Fund |
NOTE 7—Distributions to Shareholders and Tax Components of Net Assets
| Tax Character of Distributions to Shareholders Paid During the Fiscal Years Ended April 30, 2019 and 2018 |
| | 2019 | 2018 |
| Ordinary income | $8,204,810 | $13,300,586 |
| Long-term capital gain | 77,006,985 | 28,752,124 |
| Total distributions | $85,211,795 | $42,052,710 |
| Tax Components of Net Assets at Period-End: |
| | 2019 |
| Undistributed ordinary income | $3,211,326 |
| Undistributed long-term capital gain | 10,728,373 |
| Net unrealized appreciation — investments | 46,686,222 |
| Net unrealized appreciation (depreciation) - foreign currencies | (14,307) |
| Temporary book/tax differences | (463,796) |
| Shares of beneficial interest | 698,810,150 |
| Total net assets | $758,957,968 |
The difference between book-basis and tax-basis unrealized appreciation (depreciation) is due to differences in the timing of recognition of gains and losses on investments for tax and book purposes. The Fund’s net unrealized appreciation difference is attributable primarily to wash sales.
The temporary book/tax differences are a result of timing differences between book and tax recognition of income and/or expenses. The Fund’s temporary book/tax differences are the result of the trustee deferral of compensation and retirement plan benefits.
Capital loss carryforward is calculated and reported as of a specific date. Results of transactions and other activity after that date may affect the amount of capital loss carryforward actually available for the Fund to utilize. Capital losses generated in years beginning after December 22, 2010 can be carried forward for an unlimited period, whereas previous losses expire in eight tax years. Capital losses with an expiration period may not be used to offset capital gains until all net capital losses without an expiration date have been utilized. Capital loss carryforwards with no expiration date will retain their character as either short-term or long-term capital losses instead of as short-term capital losses as under prior law. The ability to utilize capital loss carryforwards in the future may be limited under the Internal Revenue Code and related regulations based on the results of future transactions.
The Fund does not have a capital loss carryforward as of April 30, 2019.
NOTE 8—Investment Transactions
The aggregate amount of investment securities (other than short-term securities, U.S. Treasury obligations and money market funds, if any) purchased and sold by the Fund during the year ended April 30, 2019 was $380,058,690 and $469,453,495, respectively. Cost of investments, including any derivatives, on a tax basis includes the adjustments for financial reporting purposes as of the most recently completed federal income tax reporting period-end.
| Unrealized Appreciation (Depreciation) of Investments on a Tax Basis |
| Aggregate unrealized appreciation of investments | $102,220,559 |
| Aggregate unrealized (depreciation) of investments | (55,534,337) |
| Net unrealized appreciation of investments | $46,686,222 |
Cost of investments for tax purposes is $712,440,233.
NOTE 9—Reclassification of Permanent Differences
Primarily as a result of differing book/tax treatment of net operating losses, on April 30, 2019, undistributed net investment income (loss) was increased by $50,761 and undistributed net realized gain was decreased by $50,761. This reclassification had no effect on the net assets or the distributable earnings of the Fund.
| 20 | Invesco Value Opportunities Fund |
NOTE 10—Share Information
| | Summary of Share Activity |
| | Years ended April 30, |
| | 2019(a) | | 2018 |
| | Shares | Amount | | Shares | Amount |
| Sold: | | | | | |
| Class A | 2,997,323 | $38,539,069 | | 3,456,497 | $49,060,752 |
| Class B(b) | — | — | | 4,849 | 65,989 |
| Class C | 261,349 | 3,284,811 | | 329,810 | 4,592,496 |
| Class R | 84,122 | 1,110,544 | | 131,947 | 1,885,739 |
| Class Y | 1,098,977 | 13,944,039 | | 1,742,268 | 24,879,394 |
| Class R5 | 20,827 | 293,122 | | 13,325 | 196,313 |
| Class R6 | 811,481 | 10,686,666 | | 2,086,303 | 32,782,874 |
| Issued as reinvestment of dividends: | | | | | |
| Class A | 6,168,261 | 65,568,617 | | 2,228,755 | 32,651,271 |
| Class B(b) | — | — | | 19,605 | 281,915 |
| Class C | 682,635 | 6,812,768 | | 256,843 | 3,588,097 |
| Class R | 132,621 | 1,393,851 | | 49,882 | 725,285 |
| Class Y | 363,569 | 3,868,374 | | 196,807 | 2,877,326 |
| Class R5 | 24,915 | 266,591 | | 8,702 | 127,739 |
| Class R6 | 308,054 | 3,302,335 | | 457 | 6,718 |
| Conversion of Class B shares to Class A shares:(c) | | | | | |
| Class A | — | — | | 521,290 | 8,325,001 |
| Class B | — | — | | (551,441) | (8,325,001) |
| Automatic conversion of Class C shares to Class A shares: | | | | | |
| Class A | 3,463,765 | 40,606,720 | | - | - |
| Class C | (3,690,780) | (40,606,720) | | - | - |
| Reacquired: | | | | | |
| Class A | (7,830,091) | (103,149,725) | | (7,486,368) | (107,770,844) |
| Class B(b) | — | — | | (129,648) | (1,824,778) |
| Class C | (871,075) | (11,069,751) | | (1,924,642) | (25,635,194) |
| Class R | (274,956) | (3,409,431) | | (316,990) | (4,607,895) |
| Class Y | (1,313,108) | (16,793,722) | | (2,600,650) | (39,851,645) |
| Class R5 | (45,550) | (603,705) | | (33,244) | (483,723) |
| Class R6 | (579,271) | (7,614,744) | | (109,405) | (1,620,790) |
| Net increase (decrease) in share activity | 1,813,068 | $6,429,709 | | (2,105,048) | $(28,072,961) |
| (a) | There are entities that are record owners of more than 5% of the outstanding shares of the Fund and in the aggregate own 29% of the outstanding shares of the Fund. IDI has an agreement with these entities to sell Fund shares. The Fund, Invesco and/or Invesco affiliates may make payments to these entities, which are considered to be related to the Fund, for providing services to the Fund, Invesco and/or Invesco affiliates including but not limited to services such as securities brokerage, distribution, third party record keeping and account servicing. The Fund has no knowledge as to whether all or any portion of the shares owned of record by these entities are also owned beneficially. |
| (b) | Class B shares activity for the period May 1, 2017 through January 26, 2018 (date of conversion). |
| (c) | Effective as of the close of business on January 26, 2018, all outstanding Class B shares were converted to Class A shares. |
| 21 | Invesco Value Opportunities Fund |
Report of Independent Registered Public Accounting Firm
To the Board of Trustees of AIM Sector Funds (Invesco Sector Funds) and Shareholders of Invesco Value Opportunities Fund:
Opinion on the Financial Statements
We have audited the accompanying statement of assets and liabilities, including the schedule of investments, of Invesco Value Opportunities Fund (one of the funds constituting AIM Sector Funds (Invesco Sector Funds), hereafter referred to as the “Fund”) as of April 30, 2019, the related statement of operations for the year ended April 30, 2019, the statement of changes in net assets for each of the two years in the period ended April 30, 2019, including the related notes, and the financial highlights for each of the periods indicated therein (collectively referred to as the “financial statements”). In our opinion, the financial statements present fairly, in all material respects, the financial position of the Fund as of April 30, 2019, the results of its operations for the year then ended, the changes in its net assets for each of the two years in the period ended April 30, 2019 and the financial highlights for each of the periods indicated therein in conformity with accounting principles generally accepted in the United States of America.
Basis for Opinion
These financial statements are the responsibility of the Fund’s management. Our responsibility is to express an opinion on the Fund’s financial statements based on our audits. We are a public accounting firm registered with the Public Company Accounting Oversight Board (United States) (“PCAOB”) and are required to be independent with respect to the Fund in accordance with the U.S. federal securities laws and the applicable rules and regulations of the Securities and Exchange Commission and the PCAOB.
We conducted our audits of these financial statements in accordance with the standards of the PCAOB. Those standards require that we plan and perform the audit to obtain reasonable assurance about whether the financial statements are free of material misstatement, whether due to error or fraud.
Our audits included performing procedures to assess the risks of material misstatement of the financial statements, whether due to error or fraud, and performing procedures that respond to those risks. Such procedures included examining, on a test basis, evidence regarding the amounts and disclosures in the financial statements. Our audits also included evaluating the accounting principles used and significant estimates made by management, as well as evaluating the overall presentation of the financial statements. Our procedures included confirmation of securities owned as of April 30, 2019 by correspondence with the custodian, transfer agent and brokers; when replies were not received from brokers, we performed other auditing procedures. We believe that our audits provide a reasonable basis for our opinion.
PricewaterhouseCoopers LLP
Houston, TX
June 26, 2019
We have served as the auditor of one or more of the investment companies in the Invesco group of investment companies since at least 1995. We have not been able to determine the specific year we began serving as auditor.
| 22 | Invesco Value Opportunities Fund |
Calculating your ongoing Fund expenses
Example
As a shareholder of the Fund, you incur two types of costs: (1) transaction costs, which may include sales charges (loads) on purchase payments or contingent deferred sales charges on redemptions, if any; and (2) ongoing costs, including management fees, distribution and/or service (12b-1) fees, and other Fund expenses. This example is intended to help you understand your ongoing costs (in dollars) of investing in the Fund and to compare these costs with ongoing costs of investing in other mutual funds. The example is based on an investment of $1,000 invested at the beginning of the period and held for the entire period November 1, 2018 through April 30, 2019.
Actual expenses
The table below provides information about actual account values and actual expenses. You may use the information in this table, together with the amount you invested, to estimate the expenses that you paid over the period. Simply divide your account value by $1,000 (for example, an $8,600 account value divided by $1,000 = 8.6), then multiply the result by the number in the table under the heading entitled “Actual Expenses Paid During Period” to estimate the expenses you paid on your account during this period.
Hypothetical example for comparison purposes
The table below also provides information about hypothetical account values and hypothetical expenses based on the Fund’s actual expense ratio and an assumed rate of return of 5% per year before expenses, which is not the Fund’s actual return.
The hypothetical account values and expenses may not be used to estimate the actual ending account balance or expenses you paid for the period. You may use this information to compare the ongoing costs of investing in the Fund and other funds. To do so, compare this 5% hypothetical example with the 5% hypothetical examples that appear in the shareholder reports of the other funds.
Please note that the expenses shown in the table are meant to highlight your ongoing costs only and do not reflect any transaction costs, such as sales charges (loads) on purchase payments or contingent deferred sales charges on redemptions, if any. Therefore, the hypothetical information is useful in comparing ongoing costs only, and will not help you determine the relative total costs of owning different funds. In addition, if these transaction costs were included, your costs would have been higher.
| | Beginning
Account Value (11/01/18) | ACTUAL | HYPOTHETICAL
(5% annual return before
expenses) | Annualized
Expense
Ratio |
Ending
Account Value
(04/30/19)1 | Expenses
Paid During
Period2 | Ending
Account Value
(04/30/19) | Expenses
Paid During
Period2 |
| Class A | $1,000.00 | $1,105.70 | $6.37 | $1,018.74 | $6.11 | 1.22% |
| Class C | 1,000.00 | 1,101.60 | 10.11 | 1,015.17 | 9.69 | 1.94 |
| Class R | 1,000.00 | 1,104.30 | 7.67 | 1,017.50 | 7.35 | 1.47 |
| Class Y | 1,000.00 | 1,106.40 | 5.07 | 1,019.98 | 4.86 | 0.97 |
| Class R5 | 1,000.00 | 1,107.50 | 4.44 | 1,020.58 | 4.26 | 0.85 |
| Class R6 | 1,000.00 | 1,107.30 | 4.18 | 1,020.83 | 4.01 | 0.80 |
| 1 | The actual ending account value is based on the actual total return of the Fund for the period November 1, 2018 through April 30, 2019, after actual expenses and will differ from the hypothetical ending account value which is based on the Fund’s expense ratio and a hypothetical annual return of 5% before expenses. |
| 2 | Expenses are equal to the Fund’s annualized expense ratio as indicated above multiplied by the average account value over the period, multiplied by 181/365 to reflect the most recent fiscal half year. |
| 23 | Invesco Value Opportunities Fund |
Tax Information
Form 1099-DIV, Form 1042-S and other year–end tax information provide shareholders with actual calendar year amounts that should be included in their tax returns. Shareholders should consult their tax advisers.
The following distribution information is being provided as required by the Internal Revenue Code or to meet a specific state’s requirement.
The Fund designates the following amounts or, if subsequently determined to be different, the maximum amount allowable for its fiscal year ended April 30, 2019:
| Federal and State Income Tax | |
| Long-Term Capital Gain Distributions | $77,006,985 |
| Qualified Dividend Income* | 77.15% |
| Corporate Dividends Received Deduction* | 75.44% |
| U.S. Treasury Obligations* | 0.00% |
| * | The above percentages are based on ordinary income dividends paid to shareholders during the Fund’s fiscal year. |
| | |
| Non-Resident Alien Shareholders | |
| Qualified Short-Term Gains | $8,204,810 |
| 24 | Invesco Value Opportunities Fund |
Trustees and Officers
The address of each trustee and officer is AIM Sector Funds (Invesco Sector Funds) (the “Trust”), 11 Greenway Plaza, Suite 1000, Houston, Texas 77046-1173. The trustees serve for the life of the Trust, subject to their earlier death, incapacitation, resignation, retirement or removal as more specifically provided in the Trust’s organizational documents. Each officer serves for a one year term or until their successors are elected and qualified. Column two below includes length of time served with predecessor entities, if any.
| | | | | | | | |
Name, Year of Birth and
Position(s) Held with the Trust | | Trustee and/
or Officer Since | | Principal Occupation(s)
During Past 5 Years | | Number of Funds in Fund
Complex
Overseen by
Trustee | | Other Directorship(s)
Held by Trustee During
Past 5 Years |
| Interested Persons | | | | | | | | |
Martin L. Flanagan1 — 1960 Trustee and Vice Chair | | 2007 | | Executive Director, Chief Executive Officer and President, Invesco Ltd. (ultimate parent of Invesco and a global investment management firm); Trustee and Vice Chair, The Invesco Funds; Vice Chair, Investment Company Institute; and Member of Executive Board, SMU Cox School of Business Formerly: Advisor to the Board, Invesco Advisers, Inc. (formerly known as Invesco Institutional (N.A.), Inc.); Chairman and Chief Executive Officer, Invesco Advisers, Inc. (registered investment adviser); Director, Chairman, Chief Executive Officer and President, Invesco Holding Company (US), Inc. (formerly IVZ Inc.) (holding company), Invesco Group Services, Inc. (service provider) and Invesco North American Holdings, Inc. (holding company); Director, Chief Executive Officer and President, Invesco Holding Company Limited (parent of Invesco and a global investment management firm); Director, Invesco Ltd.; Chairman, Investment Company Institute and President,Co-Chief Executive Officer,Co-President, Chief Operating Officer and Chief Financial Officer, Franklin Resources, Inc. (global investment management organization) | | 241 | | None |
Philip A. Taylor2 — 1954 Trustee | | 2006 | | Vice Chair, Invesco Ltd.; Director, Invesco Canada Ltd. (formerly known as Invesco Trimark Ltd./Invesco Trimark Ltèe) (registered investment adviser and registered transfer agent); Trustee, The Invesco Funds Formerly: Head of the Americas and Senior Managing Director, Invesco Ltd.; Director, Invesco Advisers, Inc. (formerly known as Invesco Institutional (N.A.), Inc.) (registered investment adviser); Director and Chairman, Invesco Investment Services, Inc. (formerly known as Invesco AIM Investment Services, Inc.) (registered transfer agent); Chief Executive Officer, Invesco Corporate Class Inc. (corporate mutual fund company); Chairman and Chief Executive Officer, Invesco Canada Ltd. (formerly known as Invesco Trimark Ltd./Invesco Trimark Ltèe) (registered investment adviser and registered transfer agent); Senior Vice President, The Invesco Funds; Director, Invesco Investment Advisers LLC (formerly known as Van Kampen Asset Management); Director, Chairman, Chief Executive Officer and President, Invesco Management Group, Inc. (formerly known as Invesco AIM Management Group, Inc.) (financial services holding company);Co-Chairman,Co-President andCo-Chief Executive Officer, Invesco Advisers, Inc. (formerly known as Invesco Institutional (N.A.), Inc.) (registered investment adviser); Director, Chief Executive Officer and President, Van Kampen Exchange Corp; President and Principal Executive Officer, The Invesco Funds (other than AIM Treasurer’s Series Trust (Invesco Treasurer’s Series Trust), Short-Term Investments Trust and Invesco Management Trust); Executive Vice President, The Invesco Funds (AIM Treasurer’s Series Trust (Invesco Treasurer’s Series Trust), Short-Term Investments Trust and Invesco Management Trust only); Director and President, INVESCO Funds Group, Inc. (registered investment adviser and registered transfer agent); Director and Chairman, IVZ Distributors, Inc. (formerly known as INVESCO Distributors, Inc.) (registered broker dealer); Director, President and Chairman, Invesco Inc. (holding company), Invesco Canada Holdings Inc. (holding company), Trimark Investments Ltd./Placements Trimark Ltèe and Invesco Financial Services Ltd/Services Financiers Invesco Ltèe; Chief Executive Officer, Invesco Canada Fund Inc. (corporate mutual fund company); Director and Chairman, Van Kampen Investor Services Inc.; Director, Chief Executive Officer and President, 1371 Preferred Inc. (holding company) and Van Kampen Investments Inc.; Director and President, AIM GP Canada Inc. (general partner for limited partnerships) and Van Kampen Advisors, Inc.; Director and Chief Executive Officer, Invesco Trimark Dealer Inc. (registered broker dealer); Director, Invesco Distributors, Inc. (formerly known as Invesco AIM Distributors, Inc.) (registered broker dealer); Manager, Invesco Capital Management LLC; Director, Chief Executive Officer and President, Invesco Advisers, Inc.; Director, Chairman, Chief Executive Officer and President, Invesco AIM Capital Management, Inc.; President, Invesco Trimark Dealer Inc. and Invesco Trimark Ltd./Invesco Trimark Ltèe; Director and President, AIM Trimark Corporate Class Inc. and AIM Trimark Canada Fund Inc.; Senior Managing Director, Invesco Holding Company Limited; Director and Chairman, Fund Management Company (former registered broker dealer); President and Principal Executive Officer, The Invesco Funds (AIM Treasurer’s Series Trust (Invesco Treasurer’s Series Trust), and Short-Term Investments Trust only); President, AIM Trimark Global Fund Inc. and AIM Trimark Canada Fund Inc. | | 241 | | None |
| 1 | Mr. Flanagan is considered an interested person (within the meaning of Section 2(a)(19) of the 1940 Act) of the Trust because he is an officer of the Adviser to the Trust, and an officer and a director of Invesco Ltd., ultimate parent of the Adviser. |
| 2 | Mr. Taylor is considered an interested person (within the meaning of Section 2(a)(19) of the 1940 Act) of the Trust because he is an officer of Invesco Ltd., ultimate parent of the Adviser. |
T-1 Invesco Value Opportunities Fund
Trustees and Officers—(continued)
| | | | | | | | |
Name, Year of Birth and
Position(s) Held with the Trust | | Trustee and/
or Officer Since | | Principal Occupation(s)
During Past 5 Years | | Number of Funds in Fund
Complex
Overseen by
Trustee | | Other Directorship(s)
Held by Trustee During
Past 5 Years |
| Independent Trustees | | | | | | | | |
Bruce L. Crockett — 1944 Trustee and Chair | | 2003 | | Chairman, Crockett Technologies Associates (technology consulting company) Formerly: Director, Captaris (unified messaging provider); Director, President and Chief Executive Officer, COMSAT Corporation; Chairman, Board of Governors of INTELSAT (international communications company); ACE Limited (insurance company); Independent Directors Council and Investment Company Institute: Member of the Audit Committee, Investment Company Institute; Member of the Executive Committee and Chair of the Governance Committee, Independent Directors Council | | 241 | | Director and Chairman of the Audit Committee, ALPS (Attorneys Liability Protection Society) (insurance company); Director and Member of the Audit Committee and Compensation Committee, Ferroglobe PLC (metallurgical company) |
David C. Arch — 1945 Trustee | | 2010 | | Chairman of Blistex Inc. (consumer health care products manufacturer); Member, World Presidents’ Organization | | 241 | | Board member of the Illinois Manufacturers’ Association |
Beth Ann Brown3 — 1968 Trustee | | 2019 | | Independent Consultant Formerly: Head of Intermediary Distribution, Managing Director, Strategic Relations, Managing Director, Head of National Accounts, Senior Vice President, National Account Manager and Senior Vice President, Key Account Manager, Columbia Management Investment Advisers LLC; Vice President, Key Account Manager, Liberty Funds Distributor, Inc.; and Trustee of certain Oppenheimer Funds | | 225 | | Director, Board of Directors of Caron Engineering Inc.; Advisor, Board of Advisors of Caron Engineering Inc.; President and Director, Acton Shapleigh Youth Conservation Corps (non -profit); and Vice President and Director of Grahamtastic Connection(non-profit) |
Jack M. Fields — 1952 Trustee | | 2003 | | Chief Executive Officer, Twenty First Century Group, Inc. (government affairs company); and Chairman, Discovery Learning Alliance(non-profit) Formerly: Owner and Chief Executive Officer, Dos Angeles Ranch L.P. (cattle, hunting, corporate entertainment); Director, Insperity, Inc. (formerly known as Administaff) (human resources provider); Chief Executive Officer, Texana Timber LP (sustainable forestry company); Director of Cross Timbers Quail Research Ranch(non-profit); and member of the U.S. House of Representatives | | 241 | | None |
Cynthia Hostetler — 1962 Trustee | | 2017 | | Non-Executive Director and Trustee of a number of public and private business corporations Formerly: Director, Aberdeen Investment Funds (4 portfolios); Head of Investment Funds and Private Equity, Overseas Private Investment Corporation; President, First Manhattan Bancorporation, Inc.; Attorney, Simpson Thacher & Bartlett LLP | | 241 | | Vulcan Materials Company (construction materials company); Trilinc Global Impact Fund; Genesee & Wyoming, Inc. (railroads); Artio Global Investment LLC (mutual fund complex); Edgen Group, Inc. (specialized energy and infrastructure products distributor); Investment Company Institute (professional organization); Independent Directors Council (professional organization) |
Eli Jones — 1961 Trustee | | 2016 | | Professor and Dean, Mays Business School — Texas A&M University Formerly: Professor and Dean, Walton College of Business, University of Arkansas and E.J. Ourso College of Business, Louisiana State University; Director, Arvest Bank | | 241 | | Insperity, Inc. (formerly known as Administaff) (human resources provider) |
Elizabeth Krentzman3 — 1959 Trustee | | 2019 | | Formerly: Principal and Chief Regulatory Advisor for Asset Management Services and U.S. Mutual Fund Leader of Deloitte & Touche LLP; General Counsel of the Investment Company Institute (trade association); National Director of the Investment Management Regulatory Consulting Practice, Principal, Director and Senior Manager of Deloitte & Touche LLP; Assistant Director of the Division of Investment Management — Office of Disclosure and Investment Adviser Regulation of the U.S. Securities and Exchange Commission and various positions with the Division of Investment Management — Office of Regulatory Policy of the U.S. Securities and Exchange Commission; Associate at Ropes & Gray LLP; Advisory Board Member of the Securities and Exchange Commission Historical Society; and Trustee of certain Oppenheimer Funds | | 225 | | Trustee of the University of Florida National Board Foundation and Audit Committee Member; Member of the Cartica Funds Board of Directors (private investment funds); Member of the University of Florida Law Center Association, Inc. Board of Trustees and Audit Committee Member |
Anthony J. LaCava, Jr. — 1956 Trustee | | 2019 | | Formerly: Director and Member of the Audit Committee, Blue Hills Bank (publicly traded financial institution) and Managing Partner, KPMG LLP | | 241 | | Blue Hills Bank; Chairman, Bentley University; Member, Business School Advisory Council; and Nominating Committee, KPMG LLP |
Prema Mathai-Davis — 1950 Trustee | | 2003 | | Retired Co-Owner & Partner of Quantalytics Research, LLC, (a FinTech Investment Research Platform for the Self-Directed Investor) | | 241 | | None |
| 3 | Mss. Brown and Krentzman and Messrs. Motley, Vandivort and Vaughn were appointed as Trustees of the Trust effective June 10, 2019. |
T-2 Invesco Value Opportunities Fund
Trustees and Officers—(continued)
| | | | | | | | |
Name, Year of Birth and
Position(s) Held with the Trust | | Trustee and/
or Officer Since | | Principal Occupation(s)
During Past 5 Years | | Number of Funds in Fund
Complex
Overseen by
Trustee | | Other Directorship(s)
Held by Trustee During
Past 5 Years |
| Independent Trustees—(continued) |
Joel W. Motley3 — 1952 Trustee | | 2019 | | Director of Office of Finance, Federal Home Loan Bank; Member of the Vestry of Trinity Wall Street; Managing Director of Carmona Motley Inc. (privately held financial advisor); Member of the Finance and Budget Committee of the Council on Foreign Relations, Member of the Investment Committee and Board of Human Rights Watch and Member of the Investment Committee and Board of Historic Hudson Valley(non-profit cultural organization) Formerly: Managing Director of Public Capital Advisors, LLC (privately held financial advisor); Managing Director of Carmona Motley Hoffman, Inc. (privately held financial advisor); Trustee of certain Oppenheimer Funds; and Director of Columbia Equity Financial Corp. (privately held financial advisor) | | 225 | | Director of Greenwall Foundation (bioethics research foundation); Member of Board and Investment Committee of The Greenwall Foundation; Director of Southern Africa Legal Services Foundation; Board Member and Investment Committee Member of Pulitzer Center for Crisis Reporting(non-profit journalism) |
Teresa M. Ressel — 1962 Trustee | | 2017 | | Non-executive director and trustee of a number of public and private business corporations Formerly: Chief Financial Officer, Olayan America, The Olayan Group (international investor/commercial/industrial); Chief Executive Officer, UBS Securities LLC; Group Chief Operating Officer, Americas, UBS AG; Assistant Secretary for Management & Budget and CFO, US Department of the Treasury | | 241 | | Atlantic Power Corporation (power generation company); ON Semiconductor Corp. (semiconductor supplier) |
Ann Barnett Stern — 1957 Trustee | | 2017 | | President and Chief Executive Officer, Houston Endowment Inc. (private philanthropic institution) Formerly: Executive Vice President and General Counsel, Texas Children’s Hospital; Attorney, Beck, Redden and Secrest, LLP; Business Law Instructor, University of St. Thomas; Attorney, Andrews & Kurth LLP | | 241 | | Federal Reserve Bank of Dallas |
Raymond Stickel, Jr. — 1944 Trustee | | 2005 | | Retired Formerly: Director, Mainstay VP Series Funds, Inc. (25 portfolios); Partner, Deloitte & Touche | | 241 | | None |
Robert C. Troccoli — 1949 Trustee | | 2016 | | Adjunct Professor, University of Denver — Daniels College of Business Formerly: Senior Partner, KPMG LLP | | 241 | | None |
Daniel S. Vandivort3 — 1954 Trustee | | 2019 | | Treasurer, Chairman of the Audit and Finance Committee, and Trustee, Board of Trustees, Huntington Disease Foundation of America; and President, Flyway Advisory Services LLC (consulting and property management) Formerly: Trustee and Governance Chair, of certain Oppenheimer Funds | | 225 | | Chairman and Lead Independent Director, Chairman of the Audit Committee, and Director, Board of Directors, Value Line Funds |
James D. Vaughn3 — 1945 Trustee | | 2019 | | Retired Formerly: Managing Partner, Deloitte & Touche LLP; Trustee and Chairman of the Audit Committee, Schroder Funds; Board Member, Mile High United Way, Boys and Girls Clubs, Boy Scouts, Colorado Business Committee for the Arts, Economic Club of Colorado and Metro Denver Network (economic development corporation); and Trustee of certain Oppenheimer Funds | | 225 | | Board member and Chairman of Audit Committee of AMG National Trust Bank; Trustee and Investment Committee member, University of South Dakota Foundation; Board member, Audit Committee Member and past Board Chair, Junior Achievement(non-profit) |
Christopher L. Wilson — 1957 Trustee and Vice Chair | | 2017 | | Non-executive director and trustee of a number of public and private business corporations Formerly: Director, TD Asset Management USA Inc. (mutual fund complex) (22 portfolios); Managing Partner, CT2, LLC (investing and consulting firm); President/Chief Executive Officer, Columbia Funds, Bank of America Corporation; President/Chief Executive Officer, CDC IXIS Asset Management Services, Inc.; Principal & Director of Operations, Scudder Funds, Scudder, Stevens & Clark, Inc.; Assistant Vice President, Fidelity Investments | | 241 | | ISO New England, Inc.(non-profit organization managing regional electricity market) |
| Other Officers | | | | | | | | |
Sheri Morris — 1964 President, Principal Executive Officer and Treasurer | | 2003 | | President, Principal Executive Officer and Treasurer, The Invesco Funds; Vice President, Invesco Advisers, Inc. (formerly known as Invesco Institutional (N.A.), Inc.) (registered investment adviser); and Vice President, Invesco Exchange-Traded Fund Trust, Invesco Exchange-Traded Fund Trust II, Invesco India Exchange-Traded Fund Trust, Invesco Actively Managed Exchange-Traded Fund Trust, Invesco Actively Managed Exchange-Traded Commodity Fund Trust and Invesco Exchange-Traded Self-Indexed Fund Trust Formerly: Vice President and Principal Financial Officer, The Invesco Funds; Vice President, Invesco AIM Advisers, Inc., Invesco AIM Capital Management, Inc. and Invesco AIM Private Asset Management, Inc.; Assistant Vice President and Assistant Treasurer, The Invesco Funds and Assistant Vice President, Invesco Advisers, Inc., Invesco AIM Capital Management, Inc. and Invesco AIM Private Asset Management, Inc.; and Treasurer, Invesco Exchange-Traded Fund Trust, Invesco Exchange-Traded Fund Trust II, Invesco India Exchange-Traded Fund Trust and Invesco Actively Managed Exchange-Traded Fund Trust | | N/A | | N/A |
Russell C. Burk — 1958 Senior Vice President and Senior Officer | | 2005 | | Senior Vice President and Senior Officer, The Invesco Funds | | N/A | | N/A |
| 3 | Mss. Brown and Krentzman and Messrs. Motley, Vandivort and Vaughn were appointed as Trustees of the Trust effective June 10, 2019. |
T-3 Invesco Value Opportunities Fund
Trustees and Officers—(continued)
| | | | | | | | |
Name, Year of Birth and
Position(s) Held with the Trust | | Trustee and/
or Officer Since | | Principal Occupation(s)
During Past 5 Years | | Number of Funds in Fund
Complex
Overseen by
Trustee | | Other Directorship(s)
Held by Trustee During
Past 5 Years |
| Other Officers—(continued) | | | | | | | | |
Jeffrey H. Kupor — 1968 Senior Vice President, Chief Legal Officer and Secretary | | 2018 | | Head of Legal of the Americas, Invesco Ltd.; Senior Vice President and Secretary, Invesco Advisers, Inc. (formerly known as Invesco Institutional (N.A.), Inc.) (registered investment adviser); Senior Vice President and Secretary, Invesco Distributors, Inc. (formerly known as Invesco AIM Distributors, Inc.); Vice President and Secretary, Invesco Investment Services, Inc. (formerly known as Invesco AIM Investment Services, Inc.) Senior Vice President, Chief Legal Officer and Secretary, The Invesco Funds; Secretary and General Counsel, Invesco Investment Advisers LLC (formerly known as Van Kampen Asset Management); Secretary and General Counsel, Invesco Capital Markets, Inc. (formerly known as Van Kampen Funds Inc.) and Chief Legal Officer, Invesco Exchange-Traded Fund Trust, Invesco Exchange-Traded Fund Trust II, Invesco India Exchange-Traded Fund Trust, Invesco Actively Managed Exchange-Traded Fund Trust, Invesco Actively Managed Exchange-Traded Commodity Fund Trust and Invesco Exchange-Traded Self-Indexed Fund Trust; Secretary, Invesco Indexing LLC; Secretary, W.L. Ross & Co., LLC; Secretary and Vice President, Jemstep, Inc. Formerly: Head of Legal, Worldwide Institutional, Invesco Ltd.; Secretary and General Counsel, INVESCO Private Capital Investments, Inc.; Senior Vice President, Secretary and General Counsel, Invesco Management Group, Inc. (formerly known as Invesco AIM Management Group, Inc.); Assistant Secretary, INVESCO Asset Management (Bermuda) Ltd.; Secretary and General Counsel, Invesco Private Capital, Inc.; Assistant Secretary and General Counsel, INVESCO Realty, Inc.; Secretary and General Counsel, Invesco Senior Secured Management, Inc.; and Secretary, Sovereign G./P. Holdings Inc. | | N/A | | N/A |
Andrew R. Schlossberg — 1974 Senior Vice President | | 2019 | | Head of the Americas and Senior Managing Director, Invesco Ltd.; Director and Senior Vice President, Invesco Advisers, Inc. (formerly known as Invesco Institutional (N.A.), Inc.) (registered investment adviser); Director and Chairman, Invesco Investment Services, Inc. (formerly known as Invesco AIM Investment Services, Inc.) (registered transfer agent); Senior Vice President, The Invesco Funds; Director, Invesco Investment Advisers LLC (formerly known as Van Kampen Asset Management) and Invesco UK Limited; Director, President and Chairman, Invesco Insurance Agency, Inc.; Director and Chief Executive, Invesco Asset Management Limited and Invesco Fund Managers Limited Formerly: Assistant Vice President, The Invesco Funds; Senior Vice President, Invesco Advisers, Inc. (formerly known as Invesco Institutional (N.A.), Inc.) (registered investment adviser); Director and Chief Executive, Invesco Administration Services Limited and Invesco Global Investment Funds Limited; Director, Invesco Distributors, Inc.; Head of EMEA, Invesco Ltd.; President, Invesco Actively Managed Exchange-Traded Commodity Fund Trust, Invesco Actively Managed Exchange-Traded Fund Trust, Invesco Exchange-Traded Fund Trust, Invesco Exchange-Traded Fund Trust II and Invesco India Exchange-Traded Fund Trust; Managing Director and Principal Executive Officer, Invesco Capital Management LLC | | N/A | | N/A |
John M. Zerr — 1962 Senior Vice President | | 2006 | | Chief Operating Officer of the Americas; Senior Vice President, Invesco Advisers, Inc. (formerly known as Invesco Institutional (N.A.), Inc.) (registered investment adviser); Senior Vice President, Invesco Distributors, Inc. (formerly known as Invesco AIM Distributors, Inc.); Director and Vice President, Invesco Investment Services, Inc. (formerly known as Invesco AIM Investment Services, Inc.) Senior Vice President, The Invesco Funds; Managing Director, Invesco Capital Management LLC; Director, Invesco Investment Advisers LLC (formerly known as Van Kampen Asset Management); Senior Vice President, Invesco Capital Markets, Inc. (formerly known as Van Kampen Funds Inc.); Manager, Invesco Indexing LLC; Director and Senior Vice President, Invesco Insurance Agency, Inc.; Invesco Canada Funds Advisory Board Member; Director, President Chief Executive Officer, Invesco Corporate Class Inc. (corporate mutual fund company); and Director, Chairman, President and Chief Executive Officer, Invesco Canada Ltd. (formerly known as Invesco Trimark Ltd./Invesco Trimark Ltèe) (registered investment adviser and registered transfer agent) Formerly: Director and Senior Vice President, Invesco Management Group, Inc. (formerly known as Invesco AIM Management Group, Inc.); Secretary and General Counsel, Invesco Management Group, Inc. (formerly known as Invesco AIM Management Group, Inc.); Secretary, Invesco Investment Services, Inc. (formerly known as Invesco AIM Investment Services, Inc.); Chief Legal Officer and Secretary, The Invesco Funds; Secretary and General Counsel, Invesco Investment Advisers LLC (formerly known as Van Kampen Asset Management); Secretary and General Counsel, Invesco Capital Markets, Inc. (formerly known as Van Kampen Funds Inc.); Chief Legal Officer, Invesco Exchange-Traded Fund Trust, Invesco Exchange-Traded Fund Trust II, Invesco India Exchange-Traded Fund Trust, Invesco Actively Managed Exchange-Traded Fund Trust, Invesco Actively Managed Exchange-Traded Commodity Fund Trust and Invesco Exchange-Traded Self-Indexed Fund Trust; Secretary, Invesco Indexing LLC; Director, Secretary, General Counsel and Senior Vice President, Van Kampen Exchange Corp.; Director, Vice President and Secretary, IVZ Distributors, Inc. (formerly known as INVESCO Distributors, Inc.); Director and Vice President, INVESCO Funds Group, Inc.; Director and Vice President, Van Kampen Advisors Inc.; Director, Vice President, Secretary and General Counsel, Van Kampen Investor Services Inc.; Director and Secretary, Invesco Distributors, Inc. (formerly known as Invesco AIM Distributors, Inc.); Director, Senior Vice President, General Counsel and Secretary, Invesco AIM Advisers, Inc. and Van Kampen Investments Inc.; Director, Vice President and Secretary, Fund Management Company; Director, Senior Vice President, Secretary, General Counsel and Vice President, Invesco AIM Capital Management, Inc.; Chief Operating Officer and General Counsel, Liberty Ridge Capital, Inc. (an investment adviser) | | N/A | | N/A |
T-4 Invesco Value Opportunities Fund
Trustees and Officers—(continued)
| | | | | | | | |
Name, Year of Birth and
Position(s) Held with the Trust | | Trustee and/
or Officer Since | | Principal Occupation(s)
During Past 5 Years | | Number of Funds in Fund
Complex
Overseen by
Trustee | | Other Directorship(s)
Held by Trustee During
Past 5 Years |
| Other Officers—(continued) | | | | | | | | |
Gregory G. McGreevey — 1962 Senior Vice President | | 2012 | | Senior Managing Director, Invesco Ltd.; Director, Chairman, President, and Chief Executive Officer, Invesco Advisers, Inc. (formerly known as Invesco Institutional (N.A.), Inc.) (registered investment adviser); Director, Invesco Mortgage Capital, Inc. and Invesco Senior Secured Management, Inc.; and Senior Vice President, The Invesco Funds Formerly: Senior Vice President, Invesco Management Group, Inc. and Invesco Advisers, Inc.; Assistant Vice President, The Invesco Funds | | N/A | | N/A |
Kelli Gallegos — 1970 Vice President, Principal Financial Officer and Assistant Treasurer | | 2008 | | Assistant Treasurer, Invesco Specialized Products, LLC; Vice President, Principal Financial Officer and Assistant Treasurer, The Invesco Funds; Principal Financial and Accounting Officer — Pooled Investments, Invesco Capital Management LLC; Vice President and Treasurer, Invesco Exchange-Traded Fund Trust, Invesco Exchange-Traded Fund Trust II, Invesco India Exchange-Traded Fund Trust, Invesco Actively Managed Exchange-Traded Fund Trust, Invesco Actively Managed Exchange-Traded Commodity Fund Trust and Invesco Exchange-Traded Self-Indexed Fund Trust Formerly: Assistant Treasurer, Invesco Exchange-Traded Fund Trust, Invesco Exchange-Traded Fund Trust II, Invesco India Exchange-Traded Fund Trust, Invesco Actively Managed Exchange-Traded Fund Trust, Invesco Actively Managed Exchange-Traded Commodity Fund Trust and Invesco Exchange-Traded Self-Indexed Fund Trust; Assistant Treasurer, Invesco Capital Management LLC; Assistant Vice President, The Invesco Funds | | N/A | | N/A |
Crissie M. Wisdom — 1969 Anti-Money Laundering Compliance Officer | | 2013 | | Anti-Money Laundering Compliance Officer, Invesco Advisers, Inc. (formerly known as Invesco Institutional (N.A.), Inc.) (registered investment adviser), Invesco Capital Markets, Inc. (formerly known as Van Kampen Funds Inc.), Invesco Distributors, Inc., Invesco Investment Services, Inc., The Invesco Funds, and Invesco Exchange-Traded Fund Trust, Invesco Exchange-Traded Fund Trust II, Invesco India Exchange-Traded Fund Trust, Invesco Actively Managed Exchange-Traded Fund Trust, Invesco Actively Managed Exchange-Traded Commodity Fund Trust and Invesco Exchange-Traded Self-Indexed Fund Trust; Anti-Money Laundering Compliance Officer and Bank Secrecy Act Officer, INVESCO National Trust Company and Invesco Trust Company; and Fraud Prevention Manager and Controls and Risk Analysis Manager for Invesco Investment Services, Inc. Formerly: Anti-Money Laundering Compliance Officer, Van Kampen Exchange Corp. and Invesco Management Group, Inc. | | N/A | | N/A |
Robert R. Leveille — 1969 Chief Compliance Officer | | 2016 | | Chief Compliance Officer, Invesco Advisers, Inc. (registered investment adviser); and Chief Compliance Officer, The Invesco Funds Formerly: Chief Compliance Officer, Putnam Investments and the Putnam Funds | | N/A | | N/A |
The Statement of Additional Information of the Trust includes additional information about the Fund’s Trustees and is available upon request, without charge, by calling 1.800.959.4246. Please refer to the Fund’s Statement of Additional Information for information on the Fund’ssub-advisers.
| | | | | | |
Office of the Fund 11 Greenway Plaza, Suite 1000 Houston, TX 77046-1173 | | Investment Adviser Invesco Advisers, Inc. 1555 Peachtree Street, N.E. Atlanta, GA 30309 | | Distributor Invesco Distributors, Inc. 11 Greenway Plaza, Suite 1000 Houston, TX 77046-1173 | | Auditors PricewaterhouseCoopers LLP 1000 Louisiana Street, Suite 5800 Houston, TX 77002-5021 |
| | | |
| | | | | | |
Counsel to the Fund Stradley Ronon Stevens & Young, LLP 2005 Market Street, Suite 2600 Philadelphia, PA 19103-7018 | | Counsel to the Independent Trustees Goodwin Procter LLP 901 New York Avenue, N.W. Washington, D.C. 20001 | | Transfer Agent Invesco Investment Services, Inc. 11 Greenway Plaza, Suite 1000 Houston, TX 77046-1173 | | Custodian State Street Bank and Trust Company 225 Franklin Street Boston, MA 02110-2801 |
T-5 Invesco Value Opportunities Fund
(This page intentionally left blank)
(This page intentionally left blank)
Go paperless with eDelivery
Visit invesco.com/edelivery to enjoy the convenience and security of anytime electronic access to your investment documents.
With eDelivery, you can elect to have any or all of the following materials delivered straight to your inbox to download, save and print from your own computer:
| • | Fund reports and prospectuses |
| • | Quarterly statements |
| • | Daily confirmations |
| • | Tax forms |
Invesco mailing information
Send general correspondence to Invesco Investment Services, Inc., P.O. Box 219078, Kansas City, MO 64121-9078.
Important notice regarding delivery of security holder documents
To reduce Fund expenses, only one copy of most shareholder documents may be mailed to shareholders with multiple accounts at the same address (Householding). Mailing of your shareholder documents may be householded indefinitely unless you instruct us otherwise. If you do not want the mailing of these documents to be combined with those for other members of your household, please contact Invesco Investment Services, Inc. at 800 959 4246 or contact your financial institution. We will begin sending you individual copies for each account within 30 days after receiving your request.
Fund holdings and proxy voting information
The Fund provides a complete list of its holdings four times in each fiscal year, at the quarter-ends. For the second and fourth quarters, the list appears in the Fund’s semiannual and annual reports to shareholders. For the first and third quarters, the Fund files the lists with the Securities and Exchange Commission (SEC) on Form N-Q (or any successor Form). The most recent list of portfolio holdings is available at invesco.com/completeqtrholdings. Shareholders can also look up the Fund’s Form N-Q (or any successor Form) filings on the SEC website, sec.gov. The SEC file numbers for the Fund are shown below.
A description of the policies and procedures that the Fund uses to determine how to vote proxies relating to portfolio securities is available without charge, upon request, from our Client Services department at 800 959 4246, or at invesco.com/proxyguidelines. The information is also available on the SEC website, sec.gov.
Information regarding how the Fund voted proxies related to its portfolio securities during the most recent 12-month period ended June 30 is available at invesco.com/proxysearch. This information is also available on the SEC website, sec.gov.
Invesco Advisers, Inc. is an investment adviser; it provides investment advisory services to individual and institutional clients and does not sell securities. Invesco Distributors, Inc. is the US distributor for Invesco Ltd.’s retail mutual funds, exchange-traded funds and institutional money market funds. Both are wholly owned, indirect subsidiaries of Invesco Ltd.
| SEC file numbers: 811-03826 and 002-85905 | Invesco Distributors, Inc. | VK-VOPP-AR-1 |
There were no amendments to the Code of Ethics (the “Code”) that applies to the Registrant’s Principal Executive Officer (“PEO”) and Principal Financial Officer (“PFO”) during the period covered by the report. The Registrant did not grant any waivers, including implicit waivers, from any provisions of the Code to the PEO or PFO during the period covered by this report.
| ITEM 3. | AUDIT COMMITTEE FINANCIAL EXPERT. |
The Board of Trustees has determined that the Registrant has at least one audit committee financial expert serving on its Audit Committee. The Audit Committee financial experts are David C. Arch, Bruce L. Crockett, Cynthia Hostetler, Elizabeth Krentzman, Anthony J. LaCava, Jr., Teresa M. Ressel, Raymond Stickel, Jr. Robert C. Troccoli and James Vaughn. David C. Arch, Bruce L. Crockett, Cynthia Hostetler, Elizabeth Krentzman, Anthony J. LaCava, Jr., Teresa M. Ressel, Raymond Stickel, Jr. Robert C. Troccoli and James Vaughn are “independent” within the meaning of that term as used in FormN-CSR.
| ITEM 4. | PRINCIPAL ACCOUNTANT FEES AND SERVICES. |
PricewaterhouseCoopers LLP (“PwC”) informed the Audit Committee that it has identified an issue related to its independence under Rule2-01(c)(1)(ii)(A) of RegulationS-X (referred to as the Loan Rule). The Loan Rule prohibits accounting firms, such as PricewaterhouseCoopers LLP, from being deemed independent if they have certain financial relationships with their audit clients or certain affiliates of those clients. The Trust is required under various securities laws to have its financial statements audited by an independent accounting firm.
The Loan Rule specifically provides that an accounting firm would not be independent if it or certain affiliates and covered persons receives a loan from a lender that is a record or beneficial owner of more than ten percent of an audit client’s equity securities (referred to as a “more than ten percent owner”). For purposes of the Loan Rule, audit clients include the Funds as well as all registered investment companies advised by the Adviser and its affiliates, including other subsidiaries of the Adviser’s parent company, Invesco Ltd. (collectively, the Invesco Fund Complex). PwC informed the Trust it and certain affiliates and covered persons have relationships with lenders who hold, as record owner, more than ten percent of the shares of certain funds within the Invesco Fund Complex.
On June 20, 2016, the SEC Staff issued a“no-action” letter to another mutual fund complex (see Fidelity Management & Research Company et al.,No-Action Letter) related to the audit independence issue described above. In that letter, the SEC confirmed that it would not recommend enforcement action against a fund that relied on audit services performed by an audit firm that was not in compliance with the Loan Rule in certain specified circumstances. On June 18, 2019, the SEC adopted amendments to the Loan Rule (the “Amendments”) addressing many of the issues that led to the issuance of theno-action letter. The Amendments will become effective and supersede theno-action letter 90 days after publication in the Federal Register. In connection with prior independence determinations, PwC communicated, as contemplated by theno-action letter, that it believes that it remains objective and impartial and that a reasonable investor possessing all the facts would conclude that PwC is able to exhibit the requisite objectivity and impartiality to report on the Funds’ financial statements as the independent registered public accounting firm. PwC also represented that it has complied with PCAOB Rule 3526(b)(1) and (2), which are conditions to the Funds relying on the no action letter, and affirmed that it is an independent accountant within the meaning of PCAOB Rule 3520. Therefore, the Adviser, the
Funds and PwC concluded that PwC could continue as the Funds’ independent registered public accounting firm. The Invesco Fund Complex relied upon theno-action letter in reaching this conclusion.
If in the future the independence of PwC is called into question under the Loan Rule by circumstances that are not addressed in the SEC’sno-action letter, the Funds will need to take other action in order for the Funds’ filings with the SEC containing financial statements to be deemed compliant with applicable securities laws. Such additional actions could result in additional costs, impair the ability of the Funds to issue new shares or have other material adverse effects on the Funds. The SECno-action relief was initially set to expire 18 months from issuance but has been extended by the SEC without an expiration date, except that theno-action letter will be withdrawn upon the effectiveness of the Amendments.
During the reporting period, PwC advised the Audit Committee of the following matters for consideration under the SEC’s auditor independence rules. PwC advised the Audit Committee that a PwC Manager, a PwC Senior Manager and a PwC Director each held financial interests in investment companies within the Invesco Fund Complex that were inconsistent with the requirements of Rule2-01(c)(1) of RegulationS-X. PwC noted, among other things, that during the time of its audit, the engagement team was not aware of the investments, the individuals were not in the chain of command of the audit or the audit partners of Invesco or the affiliate of the Registrant, the services each individual provided were not relied upon by the audit engagement team with respect to the audit of the Registrant or its affiliates and the investments were not material to the net worth of each individual or their respective immediate family members which they considered in reaching their conclusion. PwC advised the Audit Committee that it believes its objectivity and impartiality had not been adversely affected by these matters as they related to the audit of the Registrant.
(a) to (d)
Fees Billed by PwC Related to the Registrant
PwC billed the Registrant aggregate fees for services rendered to the Registrant for the last two fiscal years as follows:
| | | | | | | | |
| | | Fees Billed for
Services Rendered
to the Registrant
for fiscal year end 2019 | | | Fees Billed for
Services Rendered
to the Registrant
for fiscal year end 2018 | |
Audit Fees | | $ | 333,858 | | | $ | 291,750 | |
Audit-Related Fees(1) | | $ | 0 | | | $ | 31,500 | |
Tax Fees(2) | | $ | 78,568 | | | $ | 99,600 | |
All Other Fees | | $ | 0 | | | $ | 0 | |
| | | | | | | | |
Total Fees | | $ | 412,426 | | | $ | 422,850 | |
(g) PwC billed the Registrant aggregatenon-audit fees of $78,568 for the fiscal year ended 2019, and $131,100 for the fiscal year ended 2018, fornon-audit services rendered to the Registrant.
| (1) | Audit-Related Fees for the fiscal year end April 30, 2018 included fees billed for agreed upon procedures for regulatory filings. |
| (2) | Tax Fees for the fiscal year end April 30, 2019 includes fees billed for reviewing tax returns and/or services related to tax compliance. Tax Fees for fiscal year end April 30, 2018 included fees billed for reviewing tax returns and/or services related to tax compliance. |
Fees Billed by PwC Related to Invesco and Invesco Affiliates
PwC billed Invesco Advisers, Inc. (“Invesco”), the Registrant’s adviser, and any entity controlling, controlled by or under common control with Invesco that provides ongoing services to the Registrant (“Invesco Affiliates”) aggregate fees forpre-approvednon-audit services rendered to Invesco and Invesco Affiliates for the last two fiscal years as follows:
| | | | | | | | |
| | | Fees Billed for
Non-Audit Services
Rendered to Invesco
and Invesco
Affiliates for fiscal
year end 2019
That Were Required
to bePre-Approved
by the Registrant’s
Audit Committee | | | Fees Billed for
Non-Audit Services
Rendered to Invesco
and Invesco
Affiliates for fiscal
year end 2018 That
Were Required
to bePre-Approved
by the Registrant’s
Audit Committee | |
Audit-Related Fees(1) | | $ | 690,000 | | | $ | 662,000 | |
Tax Fees | | $ | 0 | | | $ | 0 | |
All Other Fees(2) | | $ | 0 | | | $ | 611,000 | |
| | | | | | | | |
Total Fees | | $ | 690,000 | | | $ | 1,273,000 | |
| (1) | Audit-Related Fees for the year end 2019 include fees billed related to reviewing controls at a service organization. Audit-Related Fees for the year end 2018 included fees billed related to reviewing controls at a service organization. |
| (2) | All Other Fees for the year end 2018 included fees billed related to the assessments for certain of the company’s risk management tools, current state analysis against regulatory requirements and identification of structural and organizational alternatives, informed by industry practices, for certain of the company’s administrative activities and functions. |
(e)(2) There were no amounts that werepre-approved by the Audit Committee pursuant to the de minimus exception under Rule2-01 of RegulationS-X.
(f) Not applicable.
(g) Including the fees for services not required to bepre-approved by the Registrant’s Audit Committee, PwC billed Invesco and Invesco Affiliates aggregatenon-audit fees of $4,240,000 for the fiscal year ended April 30, 2019, and $4,101,000 for the fiscal year ended April 30, 2018, fornon-audit services rendered to Invesco and Invesco Affiliates.
PwC provided audit services to the Investment Company complex of approximately $25 million.
(h) The Audit Committee also has considered whether the provision ofnon-audit services that were rendered to Invesco and Invesco Affiliates that were not required to bepre-approved pursuant to SEC regulations, if any, is compatible with maintaining PwC’s independence.
(e)(1)
PRE-APPROVAL OF AUDIT ANDNON-AUDIT SERVICES
POLICIES AND PROCEDURES
As adopted by the Audit Committees
of the Invesco Funds (the “Funds”)
Last Amended March 29, 2017
| | I. | Statement of Principles |
The Audit Committees (the “Audit Committee”) of the Boards of Trustees of the Funds (the “Board”) have adopted these policies and procedures (the “Procedures”) with respect to thepre-approval of audit andnon-audit services to be provided by the Funds’ independent auditor (the “Auditor”) to the Funds, and to the Funds’ investment adviser(s) and any entity controlling, controlled by, or under common control with the investment adviser(s) that provides ongoing services to the Funds (collectively, “Service Affiliates”).
Under Section 202 of the Sarbanes-Oxley Act of 2002, all audit andnon-audit services provided to the Funds by the Auditor must be preapproved by the Audit Committee. Rule2-01 of RegulationS-X requires that the Audit Committee alsopre-approve a Service Affiliate’s engagement of the Auditor fornon-audit services if the engagement relates directly to the operations and financial reporting of the Funds (a “Service Affiliate’s Covered Engagement”).
These Procedures set forth the procedures and the conditions pursuant to which the Audit Committee maypre-approve audit andnon-audit services for the Funds and a Service Affiliate’s Covered Engagement pursuant to rules and regulations of the Securities and Exchange Commission (“SEC”) and other organizations and regulatory bodies applicable to the Funds (“Applicable Rules”).1 They address both generalpre-approvals without consideration of specificcase-by-case services (“general pre-approvals”) and pre-approvals on acase-by-case basis (“specific pre-approvals”). Any services requiringpre-approval that are not within the scope of generalpre-approvals hereunder are subject to specificpre-approval. These Procedures also address the delegation by the Audit Committee ofpre-approval authority to the Audit Committee Chair or Vice Chair.
| | II. | Pre-Approval of Fund Audit Services |
The annual Fund audit services engagement, including terms and fees, is subject to specificpre-approval by the Audit Committee. Audit services include the annual financial statement audit and other procedures required to be performed by an independent auditor to be able to form an opinion on the Funds’ financial statements. The Audit Committee will receive, review and consider sufficient information concerning a proposed Fund audit engagement to make a reasonable evaluation of the Auditor’s qualifications and independence. The Audit Committee
| 1 | Applicable Rules include, for example, New York Stock Exchange (“NYSE”) rules applicable toclosed-end funds managed by Invesco and listed on NYSE. |
will oversee the Fund audit services engagement as necessary, including approving any changes in terms, audit scope, conditions and fees.
In addition to approving the Fund audit services engagement at least annually and specifically approving any changes, the Audit Committee may generally or specificallypre-approve engagements for other audit services, which are those services that only an independent auditor reasonably can provide. Other audit services may include services associated with SEC registration statements, periodic reports and other documents filed with the SEC.
| | III. | General and SpecificPre-Approval ofNon-Audit Fund Services |
The Audit Committee will consider, at least annually, the list of GeneralPre-ApprovedNon-Audit Services which list may be terminated or modified at any time by the Audit Committee. To inform the Audit Committee’s review and approval of GeneralPre-ApprovedNon-Audit Services, the Funds’ Treasurer (or his or her designee) and Auditor shall provide such information regarding independence or other matters as the Audit Committee may request.
Any services or fee ranges that are not within the scope of GeneralPre-ApprovedNon-Audit Services have not received generalpre-approval and require specificpre-approval. Each request for specificpre-approval by the Audit Committee for services to be provided by the Auditor to the Funds must be submitted to the Audit Committee by the Funds’ Treasurer (or his or her designee)and must include detailed information about the services to be provided, the fees or fee ranges to be charged, and other relevant information sufficient to allow the Audit Committee to consider whether topre-approve such engagement, including evaluating whether the provision of such services will impair the independence of the Auditor and is otherwise consistent with Applicable Rules.
| | IV. | Non-Audit Service Types |
The Audit Committee may provide either general or specificpre-approval of audit-related, tax or other services, each as described in more detail below.
“Audit-related services” are assurance and related services that are reasonably related to the performance of the audit or review of the Fund’s financial statements or that are traditionally performed by an independent auditor. Audit-related services include, among others, accounting consultations related to accounting, financial reporting or disclosure matters not classified as “Audit services”; assistance with understanding and implementing new accounting and financial reporting guidance from rulemaking authorities; services related to mergers, acquisitions or dispositions; compliance with ratings agency requirements and interfund lending activities; and assistance with internal control reporting requirements.
“Tax services” include, but are not limited to, the review and signing of the Funds’ federal tax returns, the review of required distributions by the Funds and consultations regarding tax matters such as the tax treatment of new investments or the impact of new regulations. The Audit Committee will not approve proposed services of the Auditor which the Audit Committee believes are to be provided in connection with a service or transaction initially recommended by the Auditor, the sole business purpose of which may be tax avoidance and the tax treatment of
which may not be supported in the Internal Revenue Code and related regulations. The Audit Committee will consult with the Funds’ Treasurer (or his or her designee) and may consult with outside counsel or advisers as necessary to ensure the consistency of tax services rendered by the Auditor with the foregoing policy. The Auditor shall not represent any Fund or any Service Affiliate before a tax court, district court or federal court of claims.
Each request to provide tax services under either the general or specificpre-approval of the Audit Committee will include a description from the Auditor in writing of (i) the scope of the service, the fee structure for the engagement, and any side letter or other amendment to the engagement letter, or any other agreement (whether oral, written, or otherwise) between the Auditor and the Funds, relating to the service; and (ii) any compensation arrangement or other agreement, such as a referral agreement, a referral fee orfee-sharing arrangement, between the Auditor (or an affiliate of the Auditor) and any person (other than the Funds or Service Affiliates receiving the services) with respect to the promoting, marketing, or recommending of a transaction covered by the service. The Auditor will also discuss with the Audit Committee the potential effects of the services on the independence of the Auditor, and document the substance of its discussion with the Audit Committee.
The Audit Committee maypre-approve other non-audit services so long as the Audit Committee believes that the service will not impair the independence of the Auditor.Appendix I includes a list of services that the Auditor is prohibited from performing by the SEC rules.Appendix I also includes a list of services that would impair the Auditor’s independence unless the Audit Committee reasonably concludes that the results of the services will not be subject to audit procedures during an audit of the Funds’ financial statements.
| | V. | Pre-Approval of Service Affiliate’s Covered Engagements |
Rule2-01 of RegulationS-X requires that the Audit Committeepre-approve a Service Affiliate’s engagement of the Auditor fornon-audit services if the engagement relates directly to the operations and financial reporting of the Funds, defined above as a “Service Affiliate’s Covered Engagement”.
The Audit Committee may provide either general or specificpre-approval of any Service Affiliate’s Covered Engagement, including for audit-related, tax or other services, as described above, if the Audit Committee believes that the provision of the services to a Service Affiliate will not impair the independence of the Auditor with respect to the Funds. Any Service Affiliate’s Covered Engagements that are not within the scope of GeneralPre-ApprovedNon-Audit Services have not received generalpre-approval and require specificpre-approval.
Each request for specificpre-approval by the Audit Committee of a Service Affiliate’s Covered Engagement must be submitted to the Audit Committee by the Funds’ Treasurer (or his or her designee)and must include detailed information about the services to be provided, the fees or fee ranges to be charged, a description of the current status of thepre-approval process involving other audit committees in the Invesco investment company complex (as defined in Rule2-201 of RegulationS-X) with respect to the proposed engagement, and other relevant information
sufficient to allow the Audit Committee to consider whether the provision of such services will impair the independence of the Auditor from the Funds. Additionally, the Funds’ Treasurer (or his or her designee) and the Auditor will provide the Audit Committee with a statement that the proposed engagement requirespre-approval by the Audit Committee, the proposed engagement, in their view, will not impair the independence of the Auditor and is consistent with Applicable Rules, and the description of the proposed engagement provided to the Audit Committee is consistent with that presented to or approved by the Invesco audit committee.
Information about all Service Affiliate engagements of the Auditor fornon-audit services, whether or not subject topre-approval by the Audit Committee, shall be provided to the Audit Committee at least quarterly, to allow the Audit Committee to consider whether the provision of such services is compatible with maintaining the Auditor’s independence from the Funds. The Funds’ Treasurer and Auditor shall provide the Audit Committee with sufficiently detailed information about the scope of services provided and the fees for such services, to ensure that the Audit Committee can adequately consider whether the provision of such services is compatible with maintaining the Auditor’s independence from the Funds.
| | VI. | Pre-Approved Fee Levels or Established Amounts |
Pre-approved fee levels or ranges for audit andnon-audit services to be provided by the Auditor to the Funds, and for a Service Affiliate’s Covered Engagement, under generalpre-approval or specificpre-approval will be set periodically by the Audit Committee. Any proposed fees exceeding 110% of the maximumpre-approved fee levels or ranges for such services or engagements will be promptly presented to the Audit Committee and will require specificpre-approval by the Audit Committee before payment of any additional fees is made.
The Audit Committee hereby delegates, subject to the dollar limitations set forth below, specific authority to its Chair, or in his or her absence, Vice Chair, topre-approve audit andnon-audit services proposed to be provided by the Auditor to the Funds and/or a Service Affiliate’s Covered Engagement, between Audit Committee meetings. Such delegation does not preclude the Chair or Vice Chair from declining, on a case by case basis, to exercise his or her delegated authority and instead convening the Audit Committee to consider andpre-approve any proposed services or engagements.
Notwithstanding the foregoing, the Audit Committee mustpre-approve: (a) anynon-audit services to be provided to the Funds for which the fees are estimated to exceed $500,000; (b) any Service Affiliate’s Covered Engagement for which the fees are estimated to exceed $500,000; or (c) any cost increase to any previously approved service or engagement that exceeds the greater of $250,000 or 50% of the previously approved fees up to a maximum increase of $500,000.
| | VIII. | Compliance with Procedures |
Notwithstanding anything herein to the contrary, failure topre-approve any services or engagements that are not required to bepre-approved pursuant to the de minimis exception provided for in Rule2-01(c)(7)(i)(C) of RegulationS-X shall not constitute a violation of these Procedures. The Audit Committee has designated the Funds’ Treasurer to ensure services and engagements arepre-approved in compliance with these Procedures. The Funds’ Treasurer will immediately report to the Chair of the Audit Committee, or the Vice Chair in his or her absence, any breach of these Procedures that comes to the attention of the Funds’ Treasurer or any services or engagements that are not required to bepre-approved pursuant to the de minimis exception provided for in Rule2-01(c)(7)(i)(C) of RegulationS-X.
On at least an annual basis, the Auditor will provide the Audit Committee with a summary of allnon-audit services provided to any entity in the investment company complex (as defined in section2-01(f)(14) of RegulationS-X, including the Funds and Service Affiliates) that were notpre-approved, including the nature of services provided and the associated fees.
| | IX. | Amendments to Procedures |
All material amendments to these Procedures must be approved in advance by the Audit Committee.Non-material amendments to these Procedures may be made by the Legal and Compliance Departments and will be reported to the Audit Committee at the next regularly scheduled meeting of the Audit Committee.
Appendix I
Non-Audit Services That May Impair the Auditor’s Independence
The Auditor is not independent if, at any point during the audit and professional engagement, the Auditor provides the followingnon-audit services:
| | • | | Broker-dealer, investment adviser, or investment banking services; |
| | • | | Expert services unrelated to the audit; |
| | • | | Any service or product provided for a contingent fee or a commission; |
| | • | | Services related to marketing, planning, or opining in favor of the tax treatment of confidential transactions or aggressive tax position transactions, a significant purpose of which is tax avoidance; |
| | • | | Tax services for persons in financial reporting oversight roles at the Fund; and |
| | • | | Any other service that the Public Company Oversight Board determines by regulation is impermissible. |
An Auditor is not independent if, at any point during the audit and professional engagement, the Auditor provides the followingnon-audit services unless it is reasonable to conclude that the results of the services will not be subject to audit procedures during an audit of the Funds’ financial statements:
| | • | | Bookkeeping or other services related to the accounting records or financial statements of the audit client; |
| | • | | Financial information systems design and implementation; |
| | • | | Appraisal or valuation services, fairness opinions, orcontribution-in-kind reports; |
| | • | | Actuarial services; and |
| | • | | Internal audit outsourcing services. |
| ITEM 5. | AUDIT COMMITTEE OF LISTED REGISTRANTS. |
Not applicable.
| ITEM 6. | SCHEDULE OF INVESTMENTS. |
Investments in securities of unaffiliated issuers is included as part of the reports to stockholders filed under Item 1 of this Form.
| ITEM 7. | DISCLOSURE OF PROXY VOTING POLICIES AND PROCEDURES FORCLOSED-END MANAGEMENT INVESTMENT COMPANIES. |
Not applicable.
| ITEM 8. | PORTFOLIO MANAGERS OFCLOSED-END MANAGEMENT COMPANIES. |
Not applicable.
| ITEM 9. | PURCHASES OF EQUITY SECURITIES BYCLOSED-END MANAGEMENT INVESTMENT COMPANY AND AFFILIATED PURCHASERS. |
Not applicable.
| ITEM 10. | SUBMISSION OF MATTERS TO A VOTE OF SECURITY HOLDERS. |
None
| ITEM 11. | CONTROLS AND PROCEDURES. |
| | (a) | As of June 18, 2019, an evaluation was performed under the supervision and with the participation of the officers of the Registrant, including the Principal Executive Officer (“PEO”) and Principal Financial Officer (“PFO”), to assess the effectiveness of the Registrant’s disclosure controls and procedures, as that term is defined in Rule30a-3(c) under the Investment Company Act of 1940 (“Act”), as amended. Based on that evaluation, the Registrant’s officers, including the PEO and PFO, concluded that, as of June 18, 2019, the Registrant’s disclosure controls and procedures were reasonably designed so as to ensure: (1) that information required to be disclosed by the Registrant on FormN-Q is recorded, processed, summarized and reported within the time periods specified by the rules and forms of the Securities and Exchange Commission; and (2) that material information relating to the Registrant is made known to the PEO and PFO as appropriate to allow timely decisions regarding required disclosure. |
| | (b) | There have been no changes in the Registrant’s internal control over financial reporting (as defined in Rule30a-3(d) under the Act) that occurred during the Registrant’s last fiscal quarter that have materially affected, or are reasonably likely to materially affect, the Registrant’s internal control over financial reporting. |
| ITEM 12. | DISCLOSURE OF SECURITIES LENDING ACTIVITIES FORCLOSED-END MANAGEMENT INVESTMENT COMPANIES. |
Not applicable.
| | |
| |
13(a) (1) | | Code of Ethics. |
| |
13(a) (2) | | Certifications of principal executive officer and principal financial officer as required by Rule30a-2(a) under the Investment Company Act of 1940. |
| |
13(a) (3) | | Not applicable. |
| |
13(a) (4) | | Not applicable. |
| |
13(b) | | Certifications of principal executive officer and principal financial officer as required by Rule30a-2(b) under the Investment Company Act of 1940. |
SIGNATURES
Pursuant to the requirements of the Securities Exchange Act of 1934 and the Investment Company Act of 1940, the Registrant has duly caused this report to be signed on its behalf by the undersigned, thereunto duly authorized.
| | |
| Registrant: AIM Sector Funds (Invesco Sector Funds) |
| |
| By: | | /s/ Sheri Morris |
| | Sheri Morris |
| | Principal Executive Officer |
|
| Date: July 8, 2019 |
Pursuant to the requirements of the Securities and Exchange Act of 1934 and the Investment Company Act of 1940, this report has been signed below by the following persons on behalf of the Registrant and in the capacities and on the dates indicated.
| | |
By: | | /s/ Sheri Morris |
| | Sheri Morris |
| | Principal Executive Officer |
|
Date: July 8, 2019 |
| | |
By: | | /s/ Kelli Gallegos |
| | Kelli Gallegos |
| | Principal Financial Officer |
|
Date: July 8, 2019 |