UNITED STATES
SECURITIES AND EXCHANGE COMMISSION
Washington, D.C. 20549
FORM N-CSR
CERTIFIED SHAREHOLDER REPORT OF REGISTERED
MANAGEMENT INVESTMENT COMPANIES
Investment Company Act file number 811-03826
AIM Sector Funds (Invesco Sector Funds)
(Exact name of registrant as specified in charter)
11 Greenway Plaza, Suite 1000 Houston, Texas 77046
(Address of principal executive offices) (Zip code)
Sheri Morris 11 Greenway Plaza, Suite 1000 Houston, Texas 77046
(Name and address of agent for service)
Registrant’s telephone number, including area code: (713) 626-1919
Date of fiscal year end: 04/30
Date of reporting period: 04/30/20
| Item 1. | Reports to Stockholders. |
| | | | |
| | |
 | | Annual Report to Shareholders | | April 30, 2020 |
| | Invesco American Value Fund |
| | Nasdaq: | | |
| | A: MSAVX ∎ C: MSVCX ∎ R: MSARX ∎ Y: MSAIX ∎ R5: MSAJX ∎ R6: MSAFX |

Beginning on January 1, 2021, as permitted by regulations adopted by the Securities and Exchange Commission, paper copies of the Fund’s shareholder reports will no longer be sent by mail, unless you specifically request paper copies of the reports from the Fund or from your financial intermediary, such as a broker-dealer or bank. Instead, the reports will be made available on the Fund’s website, and you will be notified by mail each time a report is posted and provided with a website link to access the report.
If you already elected to receive shareholder reports electronically, you will not be affected by this change and you need not take any action. You may elect to receive shareholder reports and other communications from the Fund electronically by contacting your financial intermediary (such as a broker-dealer or bank) or, if you are a direct investor, by enrolling at invesco.com/edelivery.
You may elect to receive all future reports in paper free of charge. If you invest through a financial intermediary, you can contact your financial intermediary to request that you continue to receive paper copies of your shareholder reports. If you invest directly with the Fund, you can call (800) 959-4246 to let the Fund know you wish to continue receiving paper copies of your shareholder reports. Your election to receive reports in paper will apply to all funds held with your financial intermediary or all funds held with the fund complex if you invest directly with the Fund.
Letters to Shareholders
| | |

Andrew Schlossberg | | Dear Shareholders: This annual report includes information about your Fund, including performance data and a complete list of its investments as of the close of the reporting period. Inside is a discussion of how your Fund was managed and the factors that affected its performance during the reporting period. Global equities and fixed-income securities faced a tumultuous environment during the reporting period. This was particularly true in the later stages of the period as a pandemic gripped the world and unsettled markets. At the onset of the reporting period, global equity markets were buoyed by a more accommodative stance from central banks. Despite US-China trade concerns and signs of slowing global growth, which led to some market volatility along the way, the second and third quarters of 2019 were relatively calm. In the final Andrew Schlossberg months of 2019, better-than-expected third quarter corporate earnings and initial agreement of the phase one US-China trade deal provided a favorable backdrop for equities and impressive fourth quarter global equity returns. |
The first quarter of 2020 proved to be a wild roller-coaster ride as the year began with US investors treated to equity gains culminating in record highs on February 19, 2020. The first half of the quarter, however, belied the impact the coronavirus (COVID-19) would have on markets in a world faced with shuttered businesses and global lockdowns. Equity markets began to sell off in late February and plummeted in March. The speed and depth of market declines and reversals during the month made March 2020 one of the most volatile months on record. While equities languished, government bonds largely performed as expected as central banks cut interest rates, which lowered bond yields but sent bond prices soaring. Like equities, however, corporate bond prices fell due to the impact of diminished corporate profits. Commodity prices, sans gold, largely declined during the first quarter. Oil prices suffered steep declines losing more than half their value in March amid a demand slump due to both COVID-19 and a supply glut from the Russia-Saudi Arabi oil-price war.
In response to the financial and economic hardships caused by the pandemic, central banks and governments around the world responded with fiscal and monetary stimulus. The US Federal Reserve cut interest rates to near zero (0.00-0.25%) and announced an unprecedented quantitative easing program. The US administration also passed a $2.2 trillion economic-relief package – the largest in US history. Most major economies outside of the US provided liquidity in the bond and equity markets in the form of fiscal policy and quantitative easing.
Massive global fiscal and monetary responses prompted a significant market rebound in April, with the S&P 500 Index recording one of its best monthly performances ever, despite macroeconomic data that illustrated the enormous economic cost of the shutdowns – more than 30 million US workers have lost their jobs and the US economy contracted at a 5.0% annualized rate (second estimate) for the first quarter of 2020. The final month of the reporting period also proved less volatile than March as markets attempted to normalize. As markets and investors attempt to adapt to a new normal, we’ll see how the interplay of interest rates, economic data, geopolitics and a host of other factors affect US and overseas equity and fixed income markets.
Investor uncertainty and market volatility, such as we witnessed during the reporting period, are unfortunate facts of life when it comes to investing. That’s why Invesco encourages investors to work with a professional financial adviser who can stress the importance of starting to save and invest early and the importance of adhering to a disciplined investment plan. A financial adviser who knows your unique financial situation, investment goals and risk tolerance can be an invaluable partner as you seek to achieve your financial goals. Financial advisers can also offer a long-term perspective when markets are volatile and time-tested advice and guidance when your financial situation or investment goals change.
Visit our website for more information on your investments
Our website, invesco.com/us, offers a wide range of market insights and investment perspectives. On the website, you’ll find detailed information about our funds, including performance, holdings and portfolio manager commentaries. You can access information about your account by completing a simple, secure online registration. To do so, select “Log In” on the right side of the homepage, and then select “Register for Individual Account Access.”
In addition to the resources accessible on our website and through our mobile app, you can obtain timely updates to help you stay informed about the markets and the economy by connecting with Invesco on Twitter, LinkedIn or Facebook. You can access our blog at blog.invesco.us.com. Our goal is to provide you the information you want, when and where you want it.
Finally, I’m pleased to share with you Invesco’s commitment to both the Principles for Responsible Investment and to considering environmental, social and governance issues in our robust investment process. I invite you to learn more at invesco.com/esg.
Have questions?
For questions about your account, contact an Invesco client services representative at 800 959 4246.
All of us at Invesco look forward to serving your investment management needs. Thank you for investing with us.
Sincerely,

Andrew Schlossberg
Head of the Americas,
Senior Managing Director, Invesco Ltd.
2 Invesco American Value Fund
| | |

Bruce Crockett | | Dear Shareholders: Among the many important lessons I’ve learned in more than 40 years in a variety of business endeavors is the value of a trusted advocate. As independent chair of the Invesco Funds Board, I can assure you that the members of the Board are strong advocates for the interests of investors in Invesco’s mutual funds. We work hard to represent your interests through oversight of the quality of the investment management services your funds receive and other matters important to your investment, including but not limited to: ∎ Ensuring that Invesco offers a diverse lineup of mutual funds that your financial adviser can use to strive to meet your financial needs as your investment goals change over time. ∎ Monitoring how the portfolio management teams of the Invesco funds are performing in light of changing economic and market conditions. ∎ Assessing each portfolio management team’s investment performance within the context of the investment strategy described in the fund’s prospectus. |
| ∎ | | Monitoring for potential conflicts of interests that may impact the nature of the services that your funds receive. |
We believe one of the most important services we provide our fund shareholders is the annual review of the funds’ advisory and sub-advisory contracts with Invesco Advisers and its affiliates. This review is required by the Investment Company Act of 1940 and focuses on the nature and quality of the services Invesco provides as the adviser to the Invesco funds and the reasonableness of the fees that it charges for those services. Each year, we spend months carefully reviewing information received from Invesco and a variety of independent sources, such as performance and fee data prepared by Lipper, Inc. (a subsidiary of Broadridge Financial Solutions, Inc.), an independent, third-party firm widely recognized as a leader in its field. We also meet with our independent legal counsel and other independent advisers to review and help us assess the information that we have received. Our goal is to assure that you receive quality investment management services for a reasonable fee.
I trust the measures outlined above provide assurance that you have a worthy advocate when it comes to choosing the Invesco Funds.
On behalf of the Board, we look forward to continuing to represent your interests and serving your needs.
Sincerely,

Bruce L. Crockett
Independent Chair
Invesco Funds Board of Trustees
3 Invesco American Value Fund
Management’s Discussion of Fund Performance
| | | | | | |
| | Performance summary For the fiscal year ended April 30, 2020, Class A shares of Invesco American Value Fund (the Fund), at net asset value (NAV), underperformed the Russell Midcap Value Index, the Fund’s style-specific benchmark. Your Fund’s long-term performance appears later in this report. | |
| | Fund vs. Indexes Total returns, April 30, 2019 to April 30, 2020, at net asset value (NAV). Performance shown does not include applicable contingent deferred sales charges (CDSC) or front-end sales charges, which would have reduced performance. | |
| | | Class A Shares | | | –21.65 | % |
| | | Class C Shares | | | –22.20 | |
| | | Class R Shares | | | –21.84 | |
| | | Class Y Shares | | | –21.46 | |
| | | Class R5 Shares | | | –21.39 | |
| | | Class R6 Shares | | | –21.32 | |
| | | S&P 500 Index▼ (Broad Market Index) | | | 0.86 | |
| | | Russell Midcap Value Index▼ (Style-Specific Index) | | | –16.74 | |
| | | Lipper Mid-Cap Value Funds Index∎ (Peer Group Index) | | | –20.68 | |
| | Source(s): ▼RIMES Technologies Corp.; ∎Lipper Inc. | | | | |
Market conditions and your Fund
Although the S&P 500 Index, considered representative of the US stock market, posted modest gains for the second quarter of 2019, US equities experienced increased volatility. After four consecutive months of rising stock prices, markets sold off in May 2019, along with bond yields and oil prices, as investors weighed the impact of the lingering trade war between the US and China, as well as potential tariffs imposed on Mexico. In addition, economic data showed a slowing domestic and global economy.
Key issues that concerned investors in the second quarter of 2019 carried over into the third quarter. The US-China trade conflict worried investors and stifled business investment, even as the US Federal Reserve (the Fed) cut interest rates by 0.25% in July and again in September 2019.1 This environment, combined with evidence of slowing global economic growth, fueled market volatility in August 2019. The US Treasury yield curve inverted several times, increasing fears of a possible US recession. As a result, August saw increased risk aversion, with investors crowding into asset classes perceived as safe havens, such as US Treasuries and gold. However, the Fed’s accommodative tone provided some support for risk assets.
Macroeconomic issues that concerned investors in the third quarter of 2019 mostly abated during the fourth quarter, providing the backdrop for strong equity market returns. The US economy rose higher than expected, at 2.1% during the third quarter of 2019.2 During its October meeting, the Fed cut interest rates again by 0.25% based on business investment and exports remaining weak.1 Investors were also encouraged by a resilient US economy and corporate earnings, putting the US equity market on track for its largest annual rise since 2013.
During the first quarter of 2020, as the spread of the new coronavirus disrupted travel and suppressed consumer activity, investors became increasingly concerned about the global economy. At the same time, oil prices fell sharply as a price war between Saudi Arabia and Russia threatened to boost supply even as demand was falling. Beginning in late February, equity markets declined sharply and quickly, ushering in the first bear market since the financial crisis of 2008. Though the equity market stabilized somewhat toward the end of March, all sectors declined during the downturn. Cyclical sectors, where company performance tends to be closely linked to macroeconomic changes in the business cycle, were the hardest hit. As expected, the US economy reported dismal numbers. At the close of the fiscal year in April, US unemployment numbers continued to climb, with over 30 million Americans seeking unemployment benefits since March 2020.3 In addition, the second gross domestic product estimate for the first quarter of 2020 saw the economy shrink by 5.0%, the sharpest drop since the 2008 financial crisis.2
All but one sector within the Russell Midcap Value Index had negative returns for the fiscal year. Health care was the best performing sector in the Fund’s style-specific benchmark, posting a small gain, while energy was the worst, declining by approximately 50%.
Stock selection in the consumer discretionary sector was the largest detractor from Fund performance relative to the style-specific benchmark, driven primarily by Norwegian Cruise Lines and Royal Caribbean. Shares of both companies declined sharply following news of COVID-19 infections on cruise ships, and the industry was also hurt by the suspension of cruise travel that resulted from the virus outbreak. We believe the companies are making prudent decisions with regard to their balance sheets and future
opportunities in light of the pandemic related headwinds; however, we eliminated our position in both stocks given significant uncertainty about an eventual normalization in travel activity.
Security selection in the energy sector also detracted from Fund performance relative to the style-specific benchmark, as oil prices declined sharply due to the concurrent increase in supply resulting from the Saudi Arabia/ Russia conflict, and the sharp deceleration in demand due to COVID-19. The sector included two of the Fund’s largest detractors, Marathon Oil and Technip FMC. Given these issues, we sold both positions during the fiscal year.
Security selection in the materials and industrials sectors also detracted from the Fund’s performance relative to the style-specific benchmark for the fiscal year. Within industrials, a key detractor from the Fund’s performance, was Textron, an industrial conglomerate primarily focused on aerospace and defense related business lines. The company reported solid earnings during the fiscal year, but the COVID-19 related slowdown raised investor concerns about business jet and corporate helicopter demand, which weighed on the stock. Within materials, W.R. Grace underperformed as the company’s catalyst products are utilized to refine petroleum into fuel. The company responded to the downturn by suspending share repurchases, which we believe was prudent given the situation. We maintained our position in both companies during the fiscal year.
Security selection in the health care sector was the largest contributor to the Fund’s performance relative to the style-specific benchmark. Key contributors in the sector included Centene and DaVita. During the fiscal year, health insurer Centene posted strong earnings growth reports due to lower costs and double-digit revenue growth year over year. DaVita, a dialysis provider, reported stronger than expected operating results and increased earnings guidance for 2020.
Strong security selection in and a lack of exposure to some of the weaker REITs in the real estate sector also benefitted the Fund’s returns relative to the style-specific benchmark. Additionally, Liberty Property Trust was a strong individual contributor. In late October, Prologis (not a fund holding) announced a deal to acquire the company in an all-stock transaction representing an approximately 21% premium to Liberty’s stock price. We sold shares of the company shortly after the announcement.
Security selection in information technology (IT) was another contributor to the Fund’s relative performance, driven by strong performance from Ciena and KLA Corporation. Ciena released better than expected earnings results for the fiscal year, driven by higher revenue. In our view, the company has executed well in a challenging environment, with
4 Invesco American Value Fund
minimal supply chain disruption. KLA also reported solid results for the fiscal year, beating their earnings expectations. The company continues to benefit from improving demand, even amid an uncertain environment. We maintained our position in both companies at the end of the fiscal year.
During the fiscal year, we reduced the Fund’s exposure to the energy, financials and consumer discretionary sectors. Within these sectors, we harvested gains in a number of strong performers, and reduced exposure where we saw heightened risk. We used proceeds of these transactions to increase exposure to the consumer staples, IT, utilities and real estate sectors. At fiscal year end, the Fund’s largest overweight allocations relative to the style-specific index were in financials, IT and health care, while the largest underweight allocations were in utilities, real estate and communication services sectors.
Market volatility increased significantly during the fiscal year, and we believe it may continue given the considerable uncertainty about the severity of the economic impact from the coronavirus pandemic. We believe market volatility creates opportunities to invest in companies with attractive valuations and strong fundamentals. We believe that ultimately those valuations and fundamentals will be reflected in those companies’ stock prices.
As always, we are committed to working to achieve positive returns for the Fund’s shareholders through an entire market cycle.
Thank you for your continued investment in Invesco American Value Fund.
1 Source: US Federal Reserve
2 Source: US Bureau of Economic Analysis
3 Source: The Associated Press
Portfolio manager:
Jeffrey Vancavage
The views and opinions expressed in management’s discussion of Fund performance are those of Invesco Advisers, Inc. These views and opinions are subject to change at any time based on factors such as market and economic conditions. These views and opinions may not be relied upon as investment advice or recommendations, or as an offer for a particular security. The information is not a complete analysis of every aspect of any market, country, industry, security or the Fund. Statements of fact are from sources considered reliable, but Invesco Advisers, Inc. makes no representation or warranty as to their completeness or accuracy. Although historical performance is no guarantee of future results, these insights may help you understand our investment management philosophy.
See important Fund and, if applicable, index disclosures later in this report.
5 Invesco American Value Fund
Your Fund’s Long-Term Performance
Results of a $10,000 Investment – Oldest Share Class(es)
Fund and index data from 4/30/10
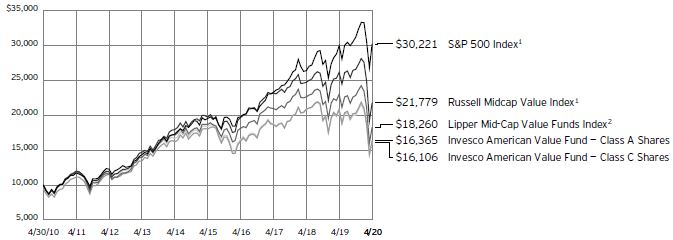
1 Source: RIMES Technologies Corp.
2 Source: Lipper Inc.
Past performance cannot guarantee future results.
The data shown in the chart include reinvested distributions, applicable sales charges and Fund expenses including management
fees. Index results include reinvested dividends, but they do not reflect sales charges. Performance of the peer group, if applicable, reflects fund expenses and management fees;
performance of a market index does not. Performance shown in the chart does not reflect deduction of taxes a shareholder would pay on Fund distributions or sale of Fund shares.
6 Invesco American Value Fund
| | | | |
Average Annual Total Returns As of 4/30/20, including maximum applicable sales charges | |
|
| Class A Shares | |
| Inception (10/18/93) | | | 7.59 | % |
| 10 Years | | | 5.05 | |
| 5 Years | | | -3.02 | |
| 1 Year | | | -25.96 | |
| |
| Class C Shares | | | | |
| Inception (10/18/93) | | | 7.53 | % |
| 10 Years | | | 4.88 | |
| 5 Years | | | -2.62 | |
| 1 Year | | | -22.95 | |
| |
| Class R Shares | | | | |
| Inception (3/20/07) | | | 3.90 | % |
| 10 Years | | | 5.38 | |
| 5 Years | | | -2.16 | |
| 1 Year | | | -21.84 | |
| |
| Class Y Shares | | | | |
| Inception (2/7/06) | | | 5.40 | % |
| 10 Years | | | 5.91 | |
| 5 Years | | | -1.67 | |
| 1 Year | | | -21.46 | |
| |
| Class R5 Shares | | | | |
| 10 Years | | | 6.03 | % |
| 5 Years | | | -1.57 | |
| 1 Year | | | -21.39 | |
| |
| Class R6 Shares | | | | |
| 10 Years | | | 5.99 | % |
| 5 Years | | | -1.49 | |
| 1 Year | | | -21.32 | |
Effective June 1, 2010, Class A, Class C, Class I and Class R shares of the predecessor fund, Van Kampen American Value Fund, advised by Van Kampen Asset Management were reorganized into Class A, Class C, Class Y and Class R shares, respectively, of Invesco Van Kampen American Value Fund (renamed Invesco American Value Fund). Returns shown above, prior to June 1, 2010, for Class A, Class C, Class R and Class Y shares are blended returns of the predecessor fund and Invesco American Value Fund. Share class returns will differ from the predecessor fund because of different expenses.
Class R5 shares incepted on June 1, 2010. Performance shown prior to that date is that of the predecessor fund’s Class A shares and includes the 12b-1 fees applicable to Class A shares.
Class R6 shares incepted on September 24, 2012. Performance shown prior to that date is that of the Fund’s and the predecessor fund’s Class A shares and includes the 12b-1 fees applicable to Class A shares.
The performance data quoted represent past performance and cannot guarantee future results; current performance may be lower or higher. Please visit invesco.com/
performance for the most recent month-end performance. Performance figures reflect reinvested distributions, changes in net asset value and the effect of the maximum sales charge unless otherwise stated. Performance figures do not reflect deduction of taxes a shareholder would pay on Fund distributions or sale of Fund shares. Investment return and principal value will fluctuate so that you may have a gain or loss when you sell shares.
Class A share performance reflects the maximum 5.50% sales charge, and Class C share performance reflects the applicable contingent deferred sales charge (CDSC) for the period involved. The CDSC on Class C shares is 1% for the first year after purchase. Class R, Class Y, Class R5 and Class R6 shares do not have a front-end sales charge or a CDSC; therefore, performance is at net asset value.
The performance of the Fund’s share classes will differ primarily due to different sales charge structures and class expenses.
Fund performance reflects any applicable fee waivers and/or expense reimbursements. Had the adviser not waived fees and/or reimbursed expenses currently or in the past, returns would have been lower. See current prospectus for more information.
7 Invesco American Value Fund
Invesco American Value Fund’s investment objective is long-term capital appreciation.
| ∎ | | Unless otherwise stated, information presented in this report is as of April 30, 2020, and is based on total net assets. |
| ∎ | | Unless otherwise noted, all data provided by Invesco. |
| ∎ | | To access your Fund’s reports/prospectus, visit invesco.com/fundreports. |
About indexes used in this report
| ∎ | | The S&P 500® Index is an unmanaged index considered representative of the US stock market. |
| ∎ | | The Russell Midcap® Value Index is an unmanaged index considered representative of mid-cap value stocks. The Russell Midcap Value Index is a trademark/service mark of the Frank Russell Co. Russell® is a trademark of the Frank Russell Co. |
| ∎ | | The Lipper Mid-Cap Value Funds Index is an unmanaged index considered representative of mid-cap value funds tracked by Lipper. |
| ∎ | | The Fund is not managed to track the performance of any particular index, including the index(es) described here, and consequently, the performance of the Fund may deviate significantly from the performance of the index(es). |
| ∎ | | A direct investment cannot be made in an index. Unless otherwise indicated, index results include reinvested dividends, and they do not reflect sales charges. Performance of the peer group, if applicable, reflects fund expenses; performance of a market index does not. |
Liquidity Risk Management Program
The Securities and Exchange Commission has adopted Rule 22e-4 under the Investment Company Act of 1940 (the “Liquidity Rule”) in order to promote effective liquidity risk management throughout the open-end investment company industry, thereby reducing the risk that funds will be unable to meet their redemption obligations and mitigating dilution of the interests of fund shareholders. The Fund has adopted and implemented a liquidity risk management program in accordance with the Liquidity Rule (the “Program”). The Program is reasonably designed to assess and manage the Fund’s liquidity risk, which is the risk that the Fund could not meet redemption requests without significant dilution of remaining investors’ interests in the Fund. The Board of Trustees of the Fund (the “Board”) has appointed Invesco Advisers, Inc. (“Invesco”), the Fund’s investment adviser, as the Program’s administrator, and Invesco has delegated oversight of the Program to the Liquidity Risk Management Committee (the “Committee”), which is composed of senior representatives from relevant business groups at Invesco.
As required by the Liquidity Rule, the Program includes policies and procedures providing for an assessment, no less frequently than annually, of the Fund’s liquidity risk that takes into account, as relevant to the Fund’s liquidity risk: (1) the Fund’s investment strategy and liquidity of portfolio investments during both normal and reasonably foreseeable stressed conditions; (2) short-term and long-term cash flow projections for the Fund during both normal and reasonably foreseeable stressed conditions; and (3) the Fund’s holdings of cash and cash equivalents and any borrowing arrangements. The Liquidity Rule also requires the classification of the Fund’s investments into categories that reflect the assessment of their relative liquidity under current market conditions. The Fund classifies its investments into one of four categories defined in the Liquidity Rule: “Highly Liquid,” “Moderately Liquid,” “Less Liquid” and “Illiquid.” Funds that are not invested primarily in “Highly Liquid Investments” that are assets (cash or investments that are reasonably expected to be convertible into cash within three business days without significantly changing the market value of the investment) are required to establish a “Highly Liquid Investment Minimum” (“HLIM”), which is the minimum percentage of net assets that must be invested in Highly Liquid Investments. Funds with HLIMs have procedures for addressing HLIM shortfalls, including reporting to the Board and the SEC (on a non-public basis) as required by the Program and the Liquidity Rule. In addition, the Fund may not acquire an investment if, immediately after the acquisition, over 15% of the Fund’s net assets would consist of “Illiquid Investments” that are assets (an investment that cannot reasonably be expected to be sold or disposed of in current market conditions in seven calendar days or less without the sale or disposition significantly changing the market value of the investment). The Liquidity Rule and the Program also require reporting to the Board and the SEC (on a non-public basis) if a Fund’s holdings of Illiquid Investments exceed 15% of the Fund’s assets.
At a meeting held on March 30-April 1, 2020, the Committee presented a report to the Board that addressed the operation of the Program and assessed the
Program’s adequacy and effectiveness of implementation (the “Report”). The Report covered the period from December 1, 2018 through December 31, 2019 (the “Program Reporting Period”).
The Report stated, in relevant part, that during the Program Reporting Period:
| ∎ | | The Program, as adopted and implemented, remained reasonably designed to assess and manage the Fund’s liquidity risk and was operated effectively to achieve that goal; |
| ∎ | | The Fund’s investment strategy remained appropriate for an open-end fund; |
| ∎ | | The Fund was able to meet requests for redemption without significant dilution of remaining investors’ interests in the Fund; |
| ∎ | | The Fund did not breach the 15% limit on Illiquid Investments; and |
| ∎ | | The Fund primarily held Highly Liquid Investments and therefore has not adopted an HLIM. |
|
This report must be accompanied or preceded by a currently effective Fund prospectus, which contains more complete information, including sales charges and expenses. Investors should read it carefully before investing. |
NOT FDIC INSURED | MAY LOSE VALUE | NO BANK GUARANTEE
8 Invesco American Value Fund
Fund Information
Portfolio Composition
| | | | | | |
| By sector | | % of total net assets |
| |
Financials | | | 22.04 | % |
Information Technology | | | 13.14 | |
Industrials | | | 11.73 | |
Health Care | | | 9.45 | |
Consumer Discretionary | | | 8.89 | |
Real Estate | | | 8.30 | |
Materials | | | 6.40 | |
Utilities | | | 6.24 | |
Consumer Staples | | | 5.88 | |
Energy | | | 3.50 | |
Communication Services | | | 2.29 | |
Money Market Funds Plus Other Assets Less Liabilities | | | 2.14 | |
Top 10 Equity Holdings* | | |
| | | | | % of total net assets |
| | |
1. | | Centene Corp. | | | 4.05 | % |
2. | | Ciena Corp. | | | 3.77 | |
3. | | Willis Towers Watson PLC | | | 3.45 | |
4. | | Encompass Health Corp. | | | 3.33 | |
5. | | Arthur J. Gallagher & Co. | | | 3.07 | |
6. | | Science Applications International Corp. | | | 2.86 | |
7. | | Kroger Co. (The) | | | 2.81 | |
8. | | KLA Corp. | | | 2.79 | |
9. | | Keysight Technologies, Inc. | | | 2.56 | |
10. | | Edison International | | | 2.55 | |
The Fund’s holdings are subject to change, and there is no assurance that the Fund will continue to hold any particular security.
* Excluding money market fund holdings, if any.
Data presented here are as of April 30, 2020.
9 Invesco American Value Fund
Schedule of Investments(a)
April 30, 2020
| | | | | | |
| | | Shares | | | Value |
Common Stocks & Other Equity Interests–97.86% |
Aerospace & Defense–1.26% | | | | | | |
Textron, Inc. | | | 718,000 | | | $ 18,926,480 |
| |
| Agricultural & Farm Machinery–0.90% | | | |
AGCO Corp. | | | 255,575 | | | 13,504,583 |
|
| Apparel, Accessories & Luxury Goods–1.83% |
Tapestry, Inc. | | | 1,853,049 | | | 27,573,369 |
|
| Asset Management & Custody Banks–1.28% |
Ares Management Corp., Class A | | | 575,556 | | | 19,309,904 |
| | |
| Automotive Retail–2.50% | | | | | | |
Advance Auto Parts, Inc. | | | 310,955 | | | 37,597,569 |
| | |
| Broadcasting–0.64% | | | | | | |
Nexstar Media Group, Inc., Class A | | | 137,222 | | | 9,611,029 |
| | |
| Building Products–3.43% | | | | | | |
Johnson Controls International PLC | | | 1,235,930 | | | 35,977,922 |
Owens Corning | | | 357,328 | | | 15,493,742 |
| | | | | | | 51,471,664 |
|
| Communications Equipment–4.93% |
Ciena Corp.(b) | | | 1,225,969 | | | 56,701,066 |
Motorola Solutions, Inc. | | | 121,003 | | | 17,401,442 |
| | | | | | | 74,102,508 |
|
| Consumer Finance–1.44% |
Santander Consumer USA Holdings, Inc.(c) | | | 1,385,800 | | | 21,604,622 |
| | |
| Copper–1.88% | | | | | | |
Freeport-McMoRan, Inc. | | | 3,194,614 | | | 28,208,442 |
| | |
| Distributors–2.32% | | | | | | |
LKQ Corp.(b) | | | 1,336,131 | | | 34,939,826 |
| |
| Diversified Chemicals–2.11% | | | |
Eastman Chemical Co. | | | 523,225 | | | 31,660,345 |
| | |
| Electric Utilities–6.24% | | | | | | |
Edison International | | | 653,693 | | | 38,378,316 |
Evergy, Inc. | | | 414,202 | | | 24,201,823 |
FirstEnergy Corp. | | | 754,884 | | | 31,154,062 |
| | | | | | | 93,734,201 |
|
| Electronic Equipment & Instruments–2.56% |
Keysight Technologies, Inc.(b) | | | 397,799 | | | 38,495,009 |
| |
| Food Distributors–1.85% | | | |
Performance Food Group Co.(b) | | | 945,016 | | | 27,736,220 |
| | |
| Food Retail–4.04% | | | | | | |
Casey’s General Stores, Inc. | | | 121,615 | | | 18,413,727 |
Kroger Co. (The) | | | 1,336,272 | | | 42,239,558 |
| | | | | | | 60,653,285 |
|
| Health Care Facilities–3.33% |
Encompass Health Corp. | | | 754,190 | | | 49,965,087 |
| | | | | | |
| | | Shares | | | Value |
Health Care Services–0.71% | | | | | | |
DaVita, Inc.(b) | | | 134,955 | | | $ 10,662,794 |
| |
| Health Care Technology–1.36% | | | |
Cerner Corp. | | | 294,964 | | | 20,467,552 |
|
| Hotels, Resorts & Cruise Lines–2.23% |
Wyndham Hotels & Resorts, Inc. | | | 888,194 | | | 33,493,796 |
| | |
| Industrial Machinery–1.85% | | | | | | |
Kennametal, Inc. | | | 1,083,987 | | | 27,760,907 |
| | |
| Industrial REITs–2.28% | | | | | | |
First Industrial Realty Trust, Inc. | | | 905,419 | | | 34,197,676 |
| | |
| Insurance Brokers–6.52% | | | | | | |
Arthur J. Gallagher & Co. | | | 588,492 | | | 46,196,622 |
Willis Towers Watson PLC | | | 290,716 | | | 51,831,756 |
| | | | | | | 98,028,378 |
|
| Interactive Home Entertainment–1.65% |
Take-Two Interactive Software,
Inc.(b) | | | 204,542 | | | 24,759,809 |
|
| Investment Banking & Brokerage–1.86% |
Stifel Financial Corp. | | | 632,896 | | | 28,024,635 |
| |
| IT Consulting & Other Services–2.86% | | | |
Science Applications International Corp. | | | 526,706 | | | 43,010,812 |
| | |
| Life & Health Insurance–1.48% | | | | | | |
Athene Holding Ltd., Class A(b) | | | 825,078 | | | 22,277,106 |
| | |
| Managed Health Care–4.05% | | | | | | |
Centene Corp.(b) | | | 914,653 | | | 60,897,597 |
| | |
| Marine–1.92% | | | | | | |
Kirby Corp.(b) | | | 539,284 | | | 28,808,551 |
| | |
| Office REITs–2.18% | | | | | | |
Hudson Pacific Properties, Inc. | | | 1,332,649 | | | 32,756,512 |
| |
| Oil & Gas Exploration & Production–3.50% | | | |
Noble Energy, Inc. | | | 2,852,640 | | | 27,984,399 |
Parsley Energy, Inc., Class A | | | 2,604,943 | | | 24,616,711 |
| | | | | | | 52,601,110 |
|
| Other Diversified Financial Services–2.44% |
Voya Financial, Inc. | | | 811,082 | | | 36,636,574 |
| | |
| Regional Banks–7.01% | | | | | | |
KeyCorp | | | 2,421,133 | | | 28,206,199 |
TCF Financial Corp. | | | 985,692 | | | 29,265,195 |
Wintrust Financial Corp. | | | 551,925 | | | 23,125,658 |
Zions Bancorporation N.A. | | | 780,741 | | | 24,679,223 |
| | | | | | | 105,276,275 |
| | |
| Residential REITs–2.29% | | | | | | |
American Homes 4 Rent, Class A | | | 1,423,559 | | | 34,364,714 |
|
| Semiconductor Equipment–2.79% |
KLA Corp. | | | 255,060 | | | 41,852,795 |
See accompanying Notes to Financial Statements which are an integral part of the financial statements.
10 Invesco American Value Fund
| | | | | | |
| | | Shares | | | Value |
Specialized REITs–1.56% | | | |
Life Storage, Inc. | | | 267,423 | | | $ 23,423,581 |
| |
Specialty Chemicals–2.41% | | | |
W.R. Grace & Co. | | | 766,270 | | | 36,190,932 |
| | |
Trucking–2.37% | | | | | | |
Knight-Swift Transportation Holdings, Inc. | | | 959,516 | | | 35,674,805 |
Total Common Stocks & Other Equity Interests
(Cost $1,537,630,932) | | | | | | 1,470,261,054 |
|
Money Market Funds–2.27% |
Invesco Government & Agency Portfolio, Institutional Class, 0.20%(d)(e) | | | 9,614,409 | | | 9,614,409 |
Invesco Liquid Assets Portfolio, Institutional Class, 0.60%(d)(e) | | | 13,502,712 | | | 13,510,814 |
Invesco Treasury Portfolio, Institutional Class, 0.10%(d)(e) | | | 10,987,896 | | | 10,987,896 |
Total Money Market Funds
(Cost $34,105,522) | | | 34,113,119 |
TOTAL INVESTMENTS IN SECURITIES (excluding investments purchased with cash collateral from securities on loan)-100.13%
(Cost $1,571,736,454) | | | | | | 1,504,374,173 |
| | | | | | | | |
| | | Shares | | | Value | |
Investments Purchased with Cash Collateral from Securities on Loan | |
Money Market Funds–0.20% | | | | | | | | |
Invesco Private Government Fund, 0.01%(d)(f)(g)
(Cost $2,982,315) | | | 2,982,315 | | | $ | 2,982,315 | |
| |
TOTAL INVESTMENTS IN SECURITIES–100.33%
(Cost $1,574,718,769) | | | | 1,507,356,488 | |
| |
OTHER ASSETS LESS LIABILITIES–(0.33)% | | | | (4,941,261 | ) |
| |
NET ASSETS–100.00% | | | $ | 1,502,415,227 | |
| |
Investment Abbreviations:
REIT – Real Estate Investment Trust
Notes to Schedule of Investments:
| (a) | Industry and/or sector classifications used in this report are generally according to the Global Industry Classification Standard, which was developed by and is the exclusive property and a service mark of MSCI Inc. and Standard & Poor’s. |
| (b) | Non-income producing security. |
| (c) | All or a portion of this security was out on loan at April 30, 2020. |
| (d) | Affiliated issuer. The issuer and/or the Fund is a wholly-owned subsidiary of Invesco Ltd., or is affiliated by having an investment adviser that is under common control of Invesco Ltd. The table below shows the Fund’s transactions in, and earnings from, its investments in affiliates for the fiscal year ended April 30, 2020. |
| | | | | | | | | | | | | | | | | | | | | | | | | | | | |
| | | | | | | | | | | | Change in | | | Realized | | | | | | | |
| | | Value | | | Purchases | | | Proceeds | | | Unrealized | | | Gain | | | Value | | | Dividend | |
| | | April 30, 2019 | | | at Cost | | | from Sales | | | Appreciation | | | (Loss) | | | April 30, 2020 | | | Income | |
| Investments in Affiliated Money Market Funds: | | | | | | | | | | | | | | | | | | | | | | | | | | | | |
| Invesco Government & Agency Portfolio, Institutional Class | | $ | 8,828,959 | | | $ | 99,795,230 | | | $ | (99,009,780 | ) | | | $ - | | | $ | - | | | $ | 9,614,409 | | | $ | 142,410 | |
| Invesco Liquid Assets Portfolio, Institutional Class | | | 6,306,613 | | | | 58,654,402 | | | | (51,456,009 | ) | | | 6,105 | | | | (297 | ) | | | 13,510,814 | | | | 113,938 | |
| Invesco Treasury Portfolio, Institutional Class | | | 10,090,239 | | | | 84,029,863 | | | | (83,132,206 | ) | | | - | | | | - | | | | 10,987,896 | | | | 151,209 | |
| Investments Purchased with Cash Collateral from Securities on Loan: | | | | | | | | | | | | | | | | | | | | | | | | | | | | |
| Invesco Private Government Fund | | | - | | | | 5,239,875 | | | | (2,257,560 | ) | | | - | | | | - | | | | 2,982,315 | | | | 830 | |
| Total | | $ | 25,225,811 | | | $ | 247,719,370 | | | $ | (235,855,555 | ) | | | $6,105 | | | $ | (297 | ) | | $ | 37,095,434 | | | $ | 408,387 | |
| (e) | The rate shown is the 7-day SEC standardized yield as of April 30, 2020. |
| (f) | The security has been segregated to satisfy the commitment to return the cash collateral received in securities lending transactions upon the borrower’s return of the securities loaned. See Note 1I. |
| (g) | The rate shown is the 3-day SEC standardized yield as of April 30, 2020. The money market fund commenced operations on April 28, 2020. |
See accompanying Notes to Financial Statements which are an integral part of the financial statements.
11 Invesco American Value Fund
Statement of Assets and Liabilities
April 30, 2020
| | | | |
Assets: | | | | |
Investments in securities, at value
(Cost $1,537,630,932)* | | $ | 1,470,261,054 | |
| |
Investments in affiliated money market funds, at value
(Cost $37,087,837) | | | 37,095,434 | |
| |
Cash | | | 262,245 | |
| |
Receivable for: | | | | |
Investments sold | | | 5,240,377 | |
| |
Fund shares sold | | | 461,182 | |
| |
Dividends | | | 381,005 | |
| |
Investment for trustee deferred compensation and retirement plans | | | 316,055 | |
| |
Other assets | | | 58,999 | |
| |
Total assets | | | 1,514,076,351 | |
| |
| |
| Liabilities: | | | | |
Payable for: | | | | |
Investments purchased | | | 4,765,060 | |
| |
Fund shares reacquired | | | 2,247,910 | |
| |
Collateral upon return of securities loaned | | | 2,982,315 | |
| |
Accrued fees to affiliates | | | 551,394 | |
| |
Accrued trustees’ and officers’ fees and benefits | | | 976 | |
| |
Accrued other operating expenses | | | 638,211 | |
| |
Trustee deferred compensation and retirement plans | | | 475,258 | |
| |
Total liabilities | | | 11,661,124 | |
| |
Net assets applicable to shares outstanding | | $ | 1,502,415,227 | |
| |
| |
| Net assets consist of: | | | | |
Shares of beneficial interest | | $ | 1,717,592,865 | |
| |
Distributable earnings (loss) | | | (215,177,638 | ) |
| |
| | $ | 1,502,415,227 | |
| |
| | | | |
Net Assets: | | | | |
Class A | | $ | 1,167,163,627 | |
| |
Class C | | $ | 67,089,016 | |
| |
Class R | | $ | 51,330,414 | |
| |
Class Y | | $ | 154,826,270 | |
| |
Class R5 | | $ | 10,999,258 | |
| |
Class R6 | | $ | 51,006,642 | |
| |
|
Shares outstanding, no par value, with an unlimited number of shares authorized: | |
Class A | | | 45,176,037 | |
| |
Class C | | | 3,303,336 | |
| |
Class R | | | 2,001,314 | |
| |
Class Y | | | 5,945,204 | |
| |
Class R5 | | | 422,155 | |
| |
Class R6 | | | 1,958,213 | |
| |
Class A: | | | | |
Net asset value per share | | $ | 25.84 | |
| |
Maximum offering price per share
(Net asset value of $25.84 ÷ 94.50%) | | $ | 27.34 | |
| |
Class C: | | | | |
Net asset value and offering price per share | | $ | 20.31 | |
| |
Class R: | | | | |
Net asset value and offering price per share | | $ | 25.65 | |
| |
Class Y: | | | | |
Net asset value and offering price per share | | $ | 26.04 | |
| |
Class R5: | | | | |
Net asset value and offering price per share | | $ | 26.06 | |
| |
Class R6: | | | | |
Net asset value and offering price per share | | $ | 26.05 | |
| |
| * | At April 30, 2020, securities with an aggregate value of $2,864,468 were on loan to brokers. |
See accompanying Notes to Financial Statements which are an integral part of the financial statements.
12 Invesco American Value Fund
Statement of Operations
For the year ended April 30, 2020
| | | | |
Investment income: | | | | |
Dividends | | $ | 17,345,746 | |
| |
Dividends from affiliated money market funds (includes securities lending income of $830) | | | 408,387 | |
| |
Total investment income | | | 17,754,133 | |
| |
| |
Expenses: | | | | |
Advisory fees | | | 7,335,026 | |
| |
Administrative services fees | | | 153,710 | |
| |
Custodian fees | | | 14,120 | |
| |
Distribution fees: | | | | |
Class A | | | 1,925,122 | |
| |
Class C | | | 232,615 | |
| |
Class R | | | 87,406 | |
| |
Transfer agent fees – A, C, R and Y | | | 1,843,501 | |
| |
Transfer agent fees – R5 | | | 19,496 | |
| |
Transfer agent fees – R6 | | | 17,558 | |
| |
Trustees’ and officers’ fees and benefits | | | 56,546 | |
| |
Registration and filing fees | | | 100,792 | |
| |
Reports to shareholders | | | 119,784 | |
| |
Professional services fees | | | 50,316 | |
| |
Other | | | 20,346 | |
| |
Total expenses | | | 11,976,338 | |
| |
Less: Fees waived, expenses reimbursed and/or expense offset arrangement(s) | | | (34,852 | ) |
| |
Net expenses | | | 11,941,486 | |
| |
Net investment income | | | 5,812,647 | |
| |
| |
Realized and unrealized gain (loss) from: | | | | |
Net realized gain (loss) from investment securities | | | (82,387,814 | ) |
| |
Change in net unrealized appreciation (depreciation) of investment securities | | | (117,274,283 | ) |
| |
Net realized and unrealized gain (loss) | | | (199,662,097 | ) |
| |
Net increase (decrease) in net assets resulting from operations | | $ | (193,849,450 | ) |
| |
See accompanying Notes to Financial Statements which are an integral part of the financial statements.
13 Invesco American Value Fund
Statement of Changes in Net Assets
For the years ended April 30, 2020 and 2019
| | | | | | | | |
| | | 2020 | | | 2019 | |
Operations: | | | | | | | | |
Net investment income | | $ | 5,812,647 | | | $ | 5,137,226 | |
| |
Net realized gain (loss) | | | (82,387,814 | ) | | | 71,007,064 | |
| |
Change in net unrealized appreciation (depreciation) | | | (117,274,283 | ) | | | (80,784,485 | ) |
| |
Net increase (decrease) in net assets resulting from operations | | | (193,849,450 | ) | | | (4,640,195 | ) |
| |
| | |
Distributions to shareholders from distributable earnings: | | | | | | | | |
Class A | | | (24,288,764 | ) | | | (89,083,319 | ) |
| |
Class C | | | (870,901 | ) | | | (8,383,288 | ) |
| |
Class R | | | (518,214 | ) | | | (2,150,588 | ) |
| |
Class Y | | | (4,491,736 | ) | | | (18,637,935 | ) |
| |
Class R5 | | | (564,068 | ) | | | (3,019,574 | ) |
| |
Class R6 | | | (2,218,029 | ) | | | (7,656,836 | ) |
| |
Total distributions from distributable earnings | | | (32,951,712 | ) | | | (128,931,540 | ) |
| |
| | |
Share transactions–net: | | | | | | | | |
Class A | | | 468,527,083 | | | | 23,943,978 | |
| |
Class C | | | 41,755,082 | | | | (40,803,017 | ) |
| |
Class R | | | 34,074,724 | | | | (3,016,181 | ) |
| |
Class Y | | | 27,656,769 | | | | (31,945,480 | ) |
| |
Class R5 | | | (12,488,212 | ) | | | (32,686,919 | ) |
| |
Class R6 | | | (2,609,087 | ) | | | (66,839,564 | ) |
| |
Net increase (decrease) in net assets resulting from share transactions | | | 556,916,359 | | | | (151,347,183 | ) |
| |
Net increase (decrease) in net assets | | | 330,115,197 | | | | (284,918,918 | ) |
| |
| | |
Net assets: | | | | | | | | |
Beginning of year | | | 1,172,300,030 | | | | 1,457,218,948 | |
| |
End of year | | $ | 1,502,415,227 | | | $ | 1,172,300,030 | |
| |
See accompanying Notes to Financial Statements which are an integral part of the financial statements.
14 Invesco American Value Fund
Financial Highlights
The following schedule presents financial highlights for a share of the Fund outstanding throughout the periods indicated.
| | | | | | | | | | | | | | | | | | | | | | | | | | | | | | | | | | | | | | | | | | | | | | | | | | | | | | | | | | | | | | | | | | | | | | |
| | | | | | | | | | | | | | | | | | | | | | | Ratio of | | Ratio of | | | | |
| | | | | | | | | | | | | | | | | | | | | | | expenses | | expenses | | | | |
| | | | | | | Net gains | | | | | | | | | | | | | | | | to average | | to average net | | Ratio of net | | |
| | | | | | | (losses) | | | | | | | | | | | | | | | | net assets | | assets without | | investment | | |
| | | Net asset | | Net | | on securities | | | | Dividends | | Distributions | | | | | | | | | | with fee waivers | | fee waivers | | income | | |
| | | value, | | investment | | (both | | Total from | | from net | | from net | | | | Net asset | | | | Net assets, | | and/or | | and/or | | (loss) | | |
| | | beginning | | income | | realized and | | investment | | investment | | realized | | Total | | value, end | | Total | | end of period | | expenses | | expenses | | to average | | Portfolio |
| | | of period | | (loss)(a) | | unrealized) | | operations | | income | | gains | | distributions | | of period | | return (b) | | (000’s omitted) | | absorbed | | absorbed | | net assets | | turnover (c) |
Class A | | | | | | | | | | | | | | | | | | | | | | | | | | | | | | | | | | | | | | | | | | | | | | | | | | | | | | | | | | | | | | | | | | | | | | |
Year ended 04/30/20 | | | $ | 34.02 | | | | $ | 0.17 | | | | $ | (7.29 | ) | | | $ | (7.12 | ) | | | $ | – | | | | $ | (1.06 | ) | | | $ | (1.06 | ) | | | $ | 25.84 | | | | | (21.65 | )% | | | $ | 1,167,164 | | | | | 1.21 | %(d) | | | | 1.21 | %(d) | | | | 0.53 | %(d) | | | | 38 | % |
Year ended 04/30/19 | | | | 38.47 | | | | | 0.13 | | | | | (0.69 | ) | | | | (0.56 | ) | | | | (0.14 | ) | | | | (3.75 | ) | | | | (3.89 | ) | | | | 34.02 | | | | | (0.03 | ) | | | | 871,220 | | | | | 1.19 | | | | | 1.19 | | | | | 0.37 | | | | | 38 | |
Year ended 04/30/18 | | | | 38.52 | | | | | 0.07 | | | | | 4.37 | | | | | 4.44 | | | | | (0.24 | ) | | | | (4.25 | ) | | | | (4.49 | ) | | | | 38.47 | | | | | 12.11 | | | | | 938,346 | | | | | 1.19 | | | | | 1.19 | | | | | 0.19 | | | | | 44 | |
Year ended 04/30/17 | | | | 34.01 | | | | | 0.20 | | | | | 4.70 | | | | | 4.90 | | | | | (0.08 | ) | | | | (0.31 | ) | | | | (0.39 | ) | | | | 38.52 | | | | | 14.40 | | | | | 1,031,600 | | | | | 1.21 | | | | | 1.21 | | | | | 0.53 | | | | | 42 | |
Year ended 04/30/16 | | | | 40.44 | | | | | 0.09 | | | | | (4.06 | ) | | | | (3.97 | ) | | | | (0.01 | ) | | | | (2.45 | ) | | | | (2.46 | ) | | | | 34.01 | | | | | (9.62 | ) | | | | 1,122,286 | | | | | 1.19 | | | | | 1.20 | | | | | 0.26 | | | | | 28 | |
Class C | | | | | | | | | | | | | | | | | | | | | | | | | | | | | | | | | | | | | | | | | | | | | | | | | | | | | | | | | | | | | | | | | | | | | | |
Year ended 04/30/20 | | | | 27.15 | | | | | (0.05 | ) | | | | (5.73 | ) | | | | (5.78 | ) | | | | – | | | | | (1.06 | ) | | | | (1.06 | ) | | | | 20.31 | | | | | (22.20 | )(e) | | | | 67,089 | | | | | 1.93 | (d)(e) | | | | 1.93 | (d)(e) | | | | (0.19 | )(d)(e) | | | | 38 | |
Year ended 04/30/19 | | | | 31.66 | | | | | (0.11 | ) | | | | (0.65 | ) | | | | (0.76 | ) | | | | – | | | | | (3.75 | ) | | | | (3.75 | ) | | | | 27.15 | | | | | (0.77 | )(e) | | | | 29,562 | | | | | 1.91 | (e) | | | | 1.91 | (e) | | | | (0.35 | )(e) | | | | 38 | |
Year ended 04/30/18 | | | | 32.44 | | | | | (0.17 | ) | | | | 3.64 | | | | | 3.47 | | | | | – | | | | | (4.25 | ) | | | | (4.25 | ) | | | | 31.66 | | | | | 11.30 | (e) | | | | 82,217 | | | | | 1.92 | (e) | | | | 1.92 | (e) | | | | (0.54 | )(e) | | | | 44 | |
Year ended 04/30/17 | | | | 28.83 | | | | | (0.06 | ) | | | | 3.98 | | | | | 3.92 | | | | | – | | | | | (0.31 | ) | | | | (0.31 | ) | | | | 32.44 | | | | | 13.59 | (e) | | | | 98,096 | | | | | 1.94 | (e) | | | | 1.94 | (e) | | | | (0.20 | )(e) | | | | 42 | |
Year ended 04/30/16 | | | | 34.95 | | | | | (0.15 | ) | | | | (3.52 | ) | | | | (3.67 | ) | | | | – | | | | | (2.45 | ) | | | | (2.45 | ) | | | | 28.83 | | | | | (10.28 | )(e) | | | | 103,706 | | | | | 1.93 | (e) | | | | 1.94 | (e) | | | | (0.48 | )(e) | | | | 28 | |
Class R | | | | | | | | | | | | | | | | | | | | | | | | | | | | | | | | | | | | | | | | | | | | | | | | | | | | | | | | | | | | | | | | | | | | | | |
Year ended 04/30/20 | | | | 33.86 | | | | | 0.09 | | | | | (7.24 | ) | | | | (7.15 | ) | | | | – | | | | | (1.06 | ) | | | | (1.06 | ) | | | | 25.65 | | | | | (21.84 | ) | | | | 51,330 | | | | | 1.46 | (d) | | | | 1.46 | (d) | | | | 0.28 | (d) | | | | 38 | |
Year ended 04/30/19 | | | | 38.24 | | | | | 0.04 | | | | | (0.67 | ) | | | | (0.63 | ) | | | | – | | | | | (3.75 | ) | | | | (3.75 | ) | | | | 33.86 | | | | | (0.28 | ) | | | | 19,979 | | | | | 1.44 | | | | | 1.44 | | | | | 0.12 | | | | | 38 | |
Year ended 04/30/18 | | | | 38.26 | | | | | (0.02 | ) | | | | 4.33 | | | | | 4.31 | | | | | (0.08 | ) | | | | (4.25 | ) | | | | (4.33 | ) | | | | 38.24 | | | | | 11.81 | | | | | 25,189 | | | | | 1.44 | | | | | 1.44 | | | | | (0.06 | ) | | | | 44 | |
Year ended 04/30/17 | | | | 33.80 | | | | | 0.10 | | | | | 4.67 | | | | | 4.77 | | | | | – | | | | | (0.31 | ) | | | | (0.31 | ) | | | | 38.26 | | | | | 14.11 | | | | | 46,937 | | | | | 1.46 | | | | | 1.46 | | | | | 0.28 | | | | | 42 | |
Year ended 04/30/16 | | | | 40.29 | | | | | 0.00 | | | | | (4.04 | ) | | | | (4.04 | ) | | | | – | | | | | (2.45 | ) | | | | (2.45 | ) | | | | 33.80 | | | | | (9.82 | ) | | | | 66,207 | | | | | 1.44 | | | | | 1.45 | | | | | 0.01 | | | | | 28 | |
Class Y | | | | | | | | | | | | | | | | | | | | | | | | | | | | | | | | | | | | | | | | | | | | | | | | | | | | | | | | | | | | | | | | | | | | | | |
Year ended 04/30/20 | | | | 34.28 | | | | | 0.25 | | | | | (7.34 | ) | | | | (7.09 | ) | | | | (0.09 | ) | | | | (1.06 | ) | | | | (1.15 | ) | | | | 26.04 | | | | | (21.46 | ) | | | | 154,826 | | | | | 0.96 | (d) | | | | 0.96 | (d) | | | | 0.78 | (d) | | | | 38 | |
Year ended 04/30/19 | | | | 38.76 | | | | | 0.23 | | | | | (0.71 | ) | | | | (0.48 | ) | | | | (0.25 | ) | | | | (3.75 | ) | | | | (4.00 | ) | | | | 34.28 | | | | | 0.21 | | | | | 155,238 | | | | | 0.94 | | | | | 0.94 | | | | | 0.62 | | | | | 38 | |
Year ended 04/30/18 | | | | 38.80 | | | | | 0.17 | | | | | 4.40 | | | | | 4.57 | | | | | (0.36 | ) | | | | (4.25 | ) | | | | (4.61 | ) | | | | 38.76 | | | | | 12.38 | | | | | 208,223 | | | | | 0.94 | | | | | 0.94 | | | | | 0.44 | | | | | 44 | |
Year ended 04/30/17 | | | | 34.25 | | | | | 0.29 | | | | | 4.73 | | | | | 5.02 | | | | | (0.16 | ) | | | | (0.31 | ) | | | | (0.47 | ) | | | | 38.80 | | | | | 14.66 | | | | | 375,626 | | | | | 0.96 | | | | | 0.96 | | | | | 0.78 | | | | | 42 | |
Year ended 04/30/16 | | | | 40.62 | | | | | 0.18 | | | | | (4.07 | ) | | | | (3.89 | ) | | | | (0.03 | ) | | | | (2.45 | ) | | | | (2.48 | ) | | | | 34.25 | | | | | (9.36 | ) | | | | 452,703 | | | | | 0.94 | | | | | 0.95 | | | | | 0.51 | | | | | 28 | |
Class R5 | | | | | | | | | | | | | | | | | | | | | | | | | | | | | | | | | | | | | | | | | | | | | | | | | | | | | | | | | | | | | | | | | | | | | | |
Year ended 04/30/20 | | | | 34.30 | | | | | 0.28 | | | | | (7.33 | ) | | | | (7.05 | ) | | | | (0.13 | ) | | | | (1.06 | ) | | | | (1.19 | ) | | | | 26.06 | | | | | (21.36 | ) | | | | 10,999 | | | | | 0.86 | (d) | | | | 0.86 | (d) | | | | 0.88 | (d) | | | | 38 | |
Year ended 04/30/19 | | | | 38.80 | | | | | 0.26 | | | | | (0.73 | ) | | | | (0.47 | ) | | | | (0.28 | ) | | | | (3.75 | ) | | | | (4.03 | ) | | | | 34.30 | | | | | 0.27 | | | | | 27,732 | | | | | 0.86 | | | | | 0.86 | | | | | 0.70 | | | | | 38 | |
Year ended 04/30/18 | | | | 38.84 | | | | | 0.20 | | | | | 4.43 | | | | | 4.63 | | | | | (0.42 | ) | | | | (4.25 | ) | | | | (4.67 | ) | | | | 38.80 | | | | | 12.53 | | | | | 62,354 | | | | | 0.86 | | | | | 0.86 | | | | | 0.52 | | | | | 44 | |
Year ended 04/30/17 | | | | 34.29 | | | | | 0.33 | | | | | 4.74 | | | | | 5.07 | | | | | (0.21 | ) | | | | (0.31 | ) | | | | (0.52 | ) | | | | 38.84 | | | | | 14.77 | | | | | 86,569 | | | | | 0.85 | | | | | 0.85 | | | | | 0.89 | | | | | 42 | |
Year ended 04/30/16 | | | | 40.63 | | | | | 0.22 | | | | | (4.07 | ) | | | | (3.85 | ) | | | | (0.04 | ) | | | | (2.45 | ) | | | | (2.49 | ) | | | | 34.29 | | | | | (9.26 | ) | | | | 128,357 | | | | | 0.82 | | | | | 0.83 | | | | | 0.63 | | | | | 28 | |
Class R6 | | | | | | | | | | | | | | | | | | | | | | | | | | | | | | | | | | | | | | | | | | | | | | | | | | | | | | | | | | | | | | | | | | | | | | |
Year ended 04/30/20 | | | | 34.31 | | | | | 0.30 | | | | | (7.34 | ) | | | | (7.04 | ) | | | | (0.16 | ) | | | | (1.06 | ) | | | | (1.22 | ) | | | | 26.05 | | | | | (21.32 | ) | | | | 51,007 | | | | | 0.79 | (d) | | | | 0.79 | (d) | | | | 0.95 | (d) | | | | 38 | |
Year ended 04/30/19 | | | | 38.82 | | | | | 0.29 | | | | | (0.73 | ) | | | | (0.44 | ) | | | | (0.32 | ) | | | | (3.75 | ) | | | | (4.07 | ) | | | | 34.31 | | | | | 0.37 | | | | | 68,568 | | | | | 0.78 | | | | | 0.78 | | | | | 0.78 | | | | | 38 | |
Year ended 04/30/18 | | | | 38.88 | | | | | 0.24 | | | | | 4.42 | | | | | 4.66 | | | | | (0.47 | ) | | | | (4.25 | ) | | | | (4.72 | ) | | | | 38.82 | | | | | 12.59 | | | | | 140,889 | | | | | 0.77 | | | | | 0.77 | | | | | 0.61 | | | | | 44 | |
Year ended 04/30/17 | | | | 34.32 | | | | | 0.37 | | | | | 4.74 | | | | | 5.11 | | | | | (0.24 | ) | | | | (0.31 | ) | | | | (0.55 | ) | | | | 38.88 | | | | | 14.88 | | | | | 165,781 | | | | | 0.76 | | | | | 0.76 | | | | | 0.98 | | | | | 42 | |
Year ended 04/30/16 | | | | 40.64 | | | | | 0.25 | | | | | (4.07 | ) | | | | (3.82 | ) | | | | (0.05 | ) | | | | (2.45 | ) | | | | (2.50 | ) | | | | 34.32 | | | | | (9.19 | ) | | | | 143,003 | | | | | 0.73 | | | | | 0.74 | | | | | 0.72 | | | | | 28 | |
| (a) | Calculated using average shares outstanding. |
| (b) | Includes adjustments in accordance with accounting principles generally accepted in the United States of America and as such, the net asset value for financial reporting purposes and the returns based upon those net asset values may differ from the net asset value and returns for shareholder transactions. Does not include sales charges and is not annualized for periods less than one year, if applicable. |
| (c) | Portfolio turnover is calculated at the fund level and is not annualized for periods less than one year, if applicable. For the year ended April 30, 2020, the portfolio turnover calculation excludes the value of securities purchased of $846,125,268 in connection with the acquisition of Invesco Oppenheimer Mid Cap Value Fund into the Fund. |
| (d) | Ratios are based on average daily net assets (000’s omitted) of $770,049, $23,992, $17,481, $131,173, $19,492 and $60,553 for Class A, Class C, Class R, Class Y, Class R5 and Class R6 shares, respectively. |
| (e) | The total return, ratio of expenses to average net assets and ratio of net investment income (loss) to average net assets reflect actual 12b-1 fees of 0.97%, 0.97%, 0.97%, 0.97% and 0.99% for the years ended April 30, 2020, 2019, 2018, 2017 and 2016, respectively. |
See accompanying Notes to Financial Statements which are an integral part of the financial statements.
15 Invesco American Value Fund
Notes to Financial Statements
April 30, 2020
NOTE 1–Significant Accounting Policies
Invesco American Value Fund (the “Fund”) is a series portfolio of AIM Sector Funds (Invesco Sector Funds) (the “Trust”). The Trust is a Delaware statutory trust registered under the Investment Company Act of 1940, as amended (the “1940 Act”), as an open-end series management investment company authorized to issue an unlimited number of shares of beneficial interest. Information presented in these financial statements pertains only to the Fund. Matters affecting the Fund or each class will be voted on exclusively by the shareholders of the Fund or each class.
The Fund’s investment objective is long-term capital appreciation. Prior to October 28, 2019, the Fund’s investment objective was total return through growth of capital and current income.
The Fund currently consists of six different classes of shares: Class A, Class C, Class R, Class Y, Class R5 and Class R6. Class Y shares are available only to certain investors. Class A shares are sold with a front-end sales charge unless certain waiver criteria are met. Under certain circumstances, load waived shares may be subject to contingent deferred sales charges (“CDSC”). Class C shares are sold with a CDSC. Class R, Class Y, Class R5 and Class R6 shares are sold at net asset value. Class C shares held for ten years after purchase are eligible for automatic conversion into Class A shares of the same Fund (the “Conversion Feature”). The automatic conversion pursuant to the Conversion Feature will generally occur at the end of the month following the tenth anniversary after a purchase of Class C shares.
The Fund is an investment company and accordingly follows the investment company accounting and reporting guidance in accordance with Financial Accounting Standards Board Accounting Standards Codification Topic 946, Financial Services – Investment Companies.
The following is a summary of the significant accounting policies followed by the Fund in the preparation of its financial statements.
| A. | Security Valuations – Securities, including restricted securities, are valued according to the following policy. |
A security listed or traded on an exchange (except convertible securities) is valued at its last sales price or official closing price as of the close of the customary trading session on the exchange where the security is principally traded, or lacking any sales or official closing price on a particular day, the security may be valued at the closing bid price on that day. Securities traded in the over-the-counter market are valued based on prices furnished by independent pricing services or market makers. When such securities are valued by an independent pricing service they may be considered fair valued. Futures contracts are valued at the final settlement price set by an exchange on which they are principally traded. Listed options are valued at the mean between the last bid and asked prices from the exchange on which they are principally traded. Options not listed on an exchange are valued by an independent source at the mean between the last bid and asked prices. For purposes of determining net asset value (“NAV”) per share, futures and option contracts generally are valued 15 minutes after the close of the customary trading session of the New York Stock Exchange (“NYSE”).
Investments in open-end and closed-end registered investment companies that do not trade on an exchange are valued at the end-of-day net asset value per share. Investments in open-end and closed-end registered investment companies that trade on an exchange are valued at the last sales price or official closing price as of the close of the customary trading session on the exchange where the security is principally traded.
Debt obligations (including convertible securities) and unlisted equities are fair valued using an evaluated quote provided by an independent pricing service. Evaluated quotes provided by the pricing service may be determined without exclusive reliance on quoted prices, and may reflect appropriate factors such as institution-size trading in similar groups of securities, developments related to specific securities, dividend rate (for unlisted equities), yield (for debt obligations), quality, type of issue, coupon rate (for debt obligations), maturity (for debt obligations), individual trading characteristics and other market data. Pricing services generally value debt obligations assuming orderly transactions of institutional round lot size, but a fund may hold or transact in the same securities in smaller, odd lot sizes. Odd lots often trade at lower prices than institutional round lots. Debt obligations are subject to interest rate and credit risks. In addition, all debt obligations involve some risk of default with respect to interest and/or principal payments.
Foreign securities’ (including foreign exchange contracts) prices are converted into U.S. dollar amounts using the applicable exchange rates as of the close of the NYSE. If market quotations are available and reliable for foreign exchange-traded equity securities, the securities will be valued at the market quotations. Because trading hours for certain foreign securities end before the close of the NYSE, closing market quotations may become unreliable. If between the time trading ends on a particular security and the close of the customary trading session on the NYSE, events occur that the investment adviser determines are significant and make the closing price unreliable, the Fund may fair value the security. If the event is likely to have affected the closing price of the security, the security will be valued at fair value in good faith using procedures approved by the Board of Trustees. Adjustments to closing prices to reflect fair value may also be based on a screening process of an independent pricing service to indicate the degree of certainty, based on historical data, that the closing price in the principal market where a foreign security trades is not the current value as of the close of the NYSE. Foreign securities’ prices meeting the approved degree of certainty that the price is not reflective of current value will be priced at the indication of fair value from the independent pricing service. Multiple factors may be considered by the independent pricing service in determining adjustments to reflect fair value and may include information relating to sector indices, American Depositary Receipts and domestic and foreign index futures. Foreign securities may have additional risks including exchange rate changes, potential for sharply devalued currencies and high inflation, political and economic upheaval, the relative lack of issuer information, relatively low market liquidity and the potential lack of strict financial and accounting controls and standards.
Securities for which market prices are not provided by any of the above methods may be valued based upon quotes furnished by independent sources. The last bid price may be used to value equity securities. The mean between the last bid and asked prices is used to value debt obligations, including corporate loans.
Securities for which market quotations are not readily available or became unreliable are valued at fair value as determined in good faith by or under the supervision of the Trust’s officers following procedures approved by the Board of Trustees. Issuer specific events, market trends, bid/asked quotes of brokers and information providers and other market data may be reviewed in the course of making a good faith determination of a security’s fair value.
The Fund may invest in securities that are subject to interest rate risk, meaning the risk that the prices will generally fall as interest rates rise and, conversely, the prices will generally rise as interest rates fall. Specific securities differ in their sensitivity to changes in interest rates depending on their individual characteristics. Changes in interest rates may result in increased market volatility, which may affect the value and/or liquidity of certain Fund investments.
Valuations change in response to many factors including the historical and prospective earnings of the issuer, the value of the issuer’s assets, general market conditions which are not specifically related to the particular issuer, such as real or perceived adverse economic conditions, changes in the general outlook for revenues or corporate earnings, changes in interest or currency rates, regional or global instability, natural or environmental disasters, widespread disease or other public health issues, war, acts of terrorism or adverse investor sentiment generally and market liquidity. Because of the inherent uncertainties of valuation, the values reflected in the financial statements may materially differ from the value received upon actual sale of those investments.
| B. | Securities Transactions and Investment Income – Securities transactions are accounted for on a trade date basis. Realized gains or losses on sales are computed on the basis of specific identification of the securities sold. Interest income (net of withholding tax, if any) is recorded on an accrual basis from settlement date. Dividend income (net of withholding tax, if any) is recorded on the ex-dividend date. |
The Fund may periodically participate in litigation related to Fund investments. As such, the Fund may receive proceeds from litigation settlements. Any proceeds received are included in the Statement of Operations as realized gain (loss) for investments no longer held and as unrealized gain (loss) for investments still held.
Brokerage commissions and mark ups are considered transaction costs and are recorded as an increase to the cost basis of securities purchased and/or a reduction of proceeds on a sale of securities. Such transaction costs are included in the determination of net realized and unrealized gain (loss) from investment
16 Invesco American Value Fund
| | securities reported in the Statement of Operations and the Statement of Changes in Net Assets and the net realized and unrealized gains (losses) on securities per share in the Financial Highlights. Transaction costs are included in the calculation of the Fund’s net asset value and, accordingly, they reduce the Fund’s total returns. These transaction costs are not considered operating expenses and are not reflected in net investment income reported in the Statement of Operations and the Statement of Changes in Net Assets, or the net investment income per share and the ratios of expenses and net investment income reported in the Financial Highlights, nor are they limited by any expense limitation arrangements between the Fund and the investment adviser. |
The Fund allocates income and realized and unrealized capital gains and losses to a class based on the relative net assets of each class.
| C. | Country Determination – For the purposes of making investment selection decisions and presentation in the Schedule of Investments, the investment adviser may determine the country in which an issuer is located and/or credit risk exposure based on various factors. These factors include the laws of the country under which the issuer is organized, where the issuer maintains a principal office, the country in which the issuer derives 50% or more of its total revenues and the country that has the primary market for the issuer’s securities, as well as other criteria. Among the other criteria that may be evaluated for making this determination are the country in which the issuer maintains 50% or more of its assets, the type of security, financial guarantees and enhancements, the nature of the collateral and the sponsor organization. Country of issuer and/or credit risk exposure has been determined to be the United States of America, unless otherwise noted. |
| D. | Distributions – Distributions from net investment income and net realized capital gain, if any, are generally declared and paid annually and recorded on the ex-dividend date. The Fund may elect to treat a portion of the proceeds from redemptions as distributions for federal income tax purposes. |
| E. | Federal Income Taxes – The Fund intends to comply with the requirements of Subchapter M of the Internal Revenue Code of 1986, as amended (the “Internal Revenue Code”), necessary to qualify as a regulated investment company and to distribute substantially all of the Fund’s taxable earnings to shareholders. As such, the Fund will not be subject to federal income taxes on otherwise taxable income (including net realized capital gain) that is distributed to shareholders. Therefore, no provision for federal income taxes is recorded in the financial statements. |
The Fund recognizes the tax benefits of uncertain tax positions only when the position is more likely than not to be sustained. Management has analyzed the Fund’s uncertain tax positions and concluded that no liability for unrecognized tax benefits should be recorded related to uncertain tax positions. Management is not aware of any tax positions for which it is reasonably possible that the total amounts of unrecognized tax benefits will change materially in the next 12 months.
The Fund files tax returns in the U.S. Federal jurisdiction and certain other jurisdictions. Generally, the Fund is subject to examinations by such taxing authorities for up to three years after the filing of the return for the tax period.
| F. | Expenses – Fees provided for under the Rule 12b-1 plan of a particular class of the Fund are charged to the operations of such class. Transfer agency fees and expenses and other shareholder recordkeeping fees and expenses attributable to Class R5 and Class R6 are allocated to each share class based on relative net assets. Sub-accounting fees attributable to Class R5 are charged to the operations of the class. Transfer agency fees and expenses and other shareholder recordkeeping fees and expenses relating to all other classes are allocated among those classes based on relative net assets. All other expenses are allocated among the classes based on relative net assets. |
| G. | Accounting Estimates – The preparation of financial statements in conformity with accounting principles generally accepted in the United States of America (“GAAP”) requires management to make estimates and assumptions that affect the reported amounts of assets and liabilities at the date of the financial statements and the reported amounts of revenues and expenses during the reporting period including estimates and assumptions related to taxation. Actual results could differ from those estimates by a significant amount. In addition, the Fund monitors for material events or transactions that may occur or become known after the period-end date and before the date the financial statements are released to print. |
| H. | Indemnifications – Under the Trust’s organizational documents, each Trustee, officer, employee or other agent of the Trust is indemnified against certain liabilities that may arise out of the performance of their duties to the Fund. Additionally, in the normal course of business, the Fund enters into contracts, including the Fund’s servicing agreements, that contain a variety of indemnification clauses. The Fund’s maximum exposure under these arrangements is unknown as this would involve future claims that may be made against the Fund that have not yet occurred. The risk of material loss as a result of such indemnification claims is considered remote. |
| I. | Securities Lending – The Fund may lend portfolio securities having a market value up to one-third of the Fund’s total assets. Such loans are secured by collateral equal to no less than the market value of the loaned securities determined daily by the securities lending provider. Such collateral will be cash or debt securities issued or guaranteed by the U.S. Government or any of its sponsored agencies. Cash collateral received in connection with these loans is invested in short-term money market instruments or affiliated money market funds and is shown as such on the Schedule of Investments. The Fund bears the risk of loss with respect to the investment of collateral. It is the Fund’s policy to obtain additional collateral from or return excess collateral to the borrower by the end of the next business day, following the valuation date of the securities loaned. Therefore, the value of the collateral held may be temporarily less than the value of the securities on loan. When loaning securities, the Fund retains certain benefits of owning the securities, including the economic equivalent of dividends or interest generated by the security. Lending securities entails a risk of loss to the Fund if, and to the extent that, the market value of the securities loaned were to increase and the borrower did not increase the collateral accordingly, and the borrower failed to return the securities. The securities loaned are subject to termination at the option of the borrower or the Fund. Upon termination, the borrower will return to the Fund the securities loaned and the Fund will return the collateral. Upon the failure of the borrower to return the securities, collateral may be liquidated and the securities may be purchased on the open market to replace the loaned securities. The Fund could experience delays and costs in gaining access to the collateral and the securities may lose value during the delay which could result in potential losses to the Fund. Some of these losses may be indemnified by the lending agent. The Fund bears the risk of any deficiency in the amount of the collateral available for return to the borrower due to any loss on the collateral invested. Dividends received on cash collateral investments for securities lending transactions, which are net of compensation to counterparties, are included in Dividends from affiliated money market funds on the Statement of Operations. The aggregate value of securities out on loan, if any, is shown as a footnote on the Statement of Assets and Liabilities. |
NOTE 2–Advisory Fees and Other Fees Paid to Affiliates
The Trust has entered into a master investment advisory agreement with Invesco Advisers, Inc. (the “Adviser” or “Invesco”). Effective April 17, 2020, under the terms of the investment advisory agreement, the Fund accrues daily and pays monthly an advisory fee to the Adviser based on the annual rate of the Fund’s average daily net assets as follows:
| | |
| Average Daily Net Assets | | Rate |
First $500 million | | 0.720% |
Next $500 million | | 0.715% |
Next $1 billion | | 0.585% |
Next $4 billion | | 0.563% |
Over $6 billion | | 0.543% |
17 Invesco American Value Fund
Prior to April 17, 2020, the Fund accrued daily and paid monthly an advisory fee to the Adviser based on the annual rate of the Fund’s average daily net assets as follows:
| | |
| Average Daily Net Assets | | Rate |
First $500 million | | 0.720% |
Next $535 million | | 0.715% |
Next $31.965 billion | | 0.650% |
Over $33 billion | | 0.640% |
For the year ended April 30, 2020, the effective advisory fee rate incurred by the Fund was 0.72%.
Under the terms of a master sub-advisory agreement between the Adviser and each of Invesco Asset Management Deutschland GmbH, Invesco Asset Management Limited, Invesco Asset Management (Japan) Limited, Invesco Hong Kong Limited, Invesco Senior Secured Management, Inc. and Invesco Canada Ltd. (collectively, the “Affiliated Sub-Advisers”) the Adviser, not the Fund, will pay 40% of the fees paid to the Adviser to any such Affiliated Sub-Adviser(s) that provide(s) discretionary investment management services to the Fund based on the percentage of assets allocated to such Affiliated Sub-Adviser(s).
Effective April 17, 2020, the Adviser has contractually agreed, through at least May 31, 2021, to waive advisory fees and/or reimburse expenses of all shares to the extent necessary to limit total annual fund operating expenses after fee waiver and/or expense reimbursement (excluding certain items discussed below) of Class A, Class C, Class R, Class Y, Class R5 and Class R6 shares to 1.16%, 1.90%, 1.40%, 0.91%, 0.80% and 0.75%, respectively, of average daily net assets (the “expense limits”). Prior to April 17, 2020, the Adviser had contractually agreed to waive advisory fees and/or reimburse expenses of all shares to the extent necessary to limit total annual fund operating expenses after fee waiver and/or expense reimbursement (excluding certain items discussed below) of Class A, Class C, Class R, Class Y, Class R5 and Class R6 shares to 2.00%, 2.75%, 2.25%, 1.75%, 1.75% and 1.75%, respectively, of average daily net assets. In determining the Adviser’s obligation to waive advisory fees and/or reimburse expenses, the following expenses are not taken into account, and could cause the total annual fund operating expenses after fee waiver and/or expense reimbursement to exceed the numbers reflected above: (1) interest; (2) taxes; (3) dividend expense on short sales; (4) extraordinary or non-routine items, including litigation expenses; and (5) expenses that the Fund has incurred but did not actually pay because of an expense offset arrangement. Unless Invesco continues the fee waiver agreement, it will terminate on May 31, 2021. During its term, the fee waiver agreement cannot be terminated or amended to increase the expense limits or reduce the advisory fee waiver without approval of the Board of Trustees.
The Adviser has contractually agreed, through at least June 30, 2022, to waive the advisory fee payable by the Fund in an amount equal to 100% of the net advisory fees the Adviser receives from the affiliated money market funds on investments by the Fund of uninvested cash in such affiliated money market funds.
For the year ended April 30, 2020, the Adviser waived advisory fees of $26,449 and reimbursed class level expenses of $0, $0, $615, $0, $141 and $0 of Class A, Class C, Class R, Class Y, Class R5 and Class R6 shares, respectively.
The Trust has entered into a master administrative services agreement with Invesco pursuant to which the Fund has agreed to pay Invesco for certain administrative costs incurred in providing accounting services to the Fund. For the year ended April 30, 2020, expenses incurred under the agreement are shown in the Statement of Operations as Administrative services fees. Invesco has entered into a sub-administration agreement whereby State Street Bank and Trust Company (“SSB”) serves as fund accountant and provides certain administrative services to the Fund. Pursuant to a custody agreement with the Trust on behalf of the Fund, SSB also serves as the Fund’s custodian.
The Trust has entered into a transfer agency and service agreement with Invesco Investment Services, Inc. (“IIS”) pursuant to which the Fund has agreed to pay IIS a fee for providing transfer agency and shareholder services to the Fund and reimburse IIS for certain expenses incurred by IIS in the course of providing such services. IIS may make payments to intermediaries that provide omnibus account services, sub-accounting services and/or networking services. All fees payable by IIS to intermediaries that provide omnibus account services or sub-accounting services are charged back to the Fund, subject to certain limitations approved by the Trust’s Board of Trustees. For the year ended April 30, 2020, expenses incurred under the agreement are shown in the Statement of Operations as Transfer agent fees.
Shares of the Fund are distributed by Invesco Distributors, Inc. (“IDI”). The Fund has adopted a distribution plan pursuant to Rule 12b-1 under the 1940 Act, and a service plan (collectively, the “Plans”) for Class A, Class C and Class R shares to compensate IDI for the sale, distribution, shareholder servicing and maintenance of shareholder accounts for these shares. Under the Plans, the Fund will incur annual fees of up to 0.25% of Class A average daily net assets, up to 1.00% of Class C average daily net assets and up to 0.50% of Class R average daily net assets. The fees are accrued daily and paid monthly.
With respect to Class C shares, the Fund is authorized to reimburse in future years any distribution related expenses that exceed the maximum annual reimbursement rate for such class, so long as such reimbursement does not cause the Fund to exceed the Class C maximum annual reimbursement rate, respectively. With respect to Class A shares, distribution related expenses that exceed the maximum annual reimbursement rate for such class are not carried forward to future years and the Fund will not reimburse IDI for any such expenses.
For the year ended April 30, 2020, expenses incurred under these agreements are shown in the Statement of Operations as Distribution fees.
Front-end sales commissions and CDSC (collectively, the “sales charges”) are not recorded as expenses of the Fund. Front-end sales commissions are deducted from proceeds from the sales of Fund shares prior to investment in Class A shares of the Fund. CDSC are deducted from redemption proceeds prior to remittance to the shareholder. During the year ended April 30, 2020, IDI advised the Fund that IDI retained $102,322 in front-end sales commissions from the sale of Class A shares and $3,496 and $518 from Class A and Class C shares, respectively, for CDSC imposed upon redemptions by shareholders.
For the year ended April 30, 2020, the Fund incurred $7,696 in brokerage commissions with Invesco Capital Markets, Inc., an affiliate of the Adviser and IDI, for portfolio transactions executed on behalf of the Fund.
Certain officers and trustees of the Trust are officers and directors of the Adviser, IIS and/or IDI.
NOTE 3—Additional Valuation Information
GAAP defines fair value as the price that would be received to sell an asset or paid to transfer a liability in an orderly transaction between market participants at the measurement date, under current market conditions. GAAP establishes a hierarchy that prioritizes the inputs to valuation methods, giving the highest priority to readily available unadjusted quoted prices in an active market for identical assets (Level 1) and the lowest priority to significant unobservable inputs (Level 3), generally when market prices are not readily available or are unreliable. Based on the valuation inputs, the securities or other investments are tiered into one of three levels. Changes in valuation methods may result in transfers in or out of an investment’s assigned level:
| | Level 1 – | Prices are determined using quoted prices in an active market for identical assets. |
| | Level 2 – | Prices are determined using other significant observable inputs. Observable inputs are inputs that other market participants may use in pricing a security. These may include quoted prices for similar securities, interest rates, prepayment speeds, credit risk, yield curves, loss severities, default rates, discount rates, volatilities and others. |
| | Level 3 – | Prices are determined using significant unobservable inputs. In situations where quoted prices or observable inputs are unavailable (for example, when there is little or no market activity for an investment at the end of the period), unobservable inputs may be used. Unobservable inputs reflect the Fund’s own assumptions about the factors market participants would use in determining fair value of the securities or instruments and would be based on the best available information. |
18 Invesco American Value Fund
The following is a summary of the tiered valuation input levels, as of April 30, 2020. The level assigned to the securities valuations may not be an indication of the risk or liquidity associated with investing in those securities. Because of the inherent uncertainties of valuation, the values reflected in the financial statements may materially differ from the value received upon actual sale of those investments.
| | | | | | | | | | | | |
| | | Level 1 | | | Level 2 | | | Level 3 | | Total |
Investments in Securities | | | | | | | | | | | | |
Common Stocks & Other Equity Interests | | $ | 1,470,261,054 | | | $ | – | | | $– | | $1,470,261,054 |
Money Market Funds | | | 34,113,119 | | | | 2,982,315 | | | – | | 37,095,434 |
Total Investments | | $ | 1,504,374,173 | | | $ | 2,982,315 | | | $– | | $1,507,356,488 |
NOTE 4–Expense Offset Arrangement(s)
The expense offset arrangement is comprised of transfer agency credits which result from balances in demand deposit accounts used by the transfer agent for clearing shareholder transactions. For the year ended April 30, 2020, the Fund received credits from this arrangement, which resulted in the reduction of the Fund’s total expenses of $7,647.
NOTE 5–Trustees’ and Officers’ Fees and Benefits
Trustees’ and Officers’ Fees and Benefits include amounts accrued by the Fund to pay remuneration to certain Trustees and Officers of the Fund. Trustees have the option to defer compensation payable by the Fund, and Trustees’ and Officers’ Fees and Benefits also include amounts accrued by the Fund to fund such deferred compensation amounts. Those Trustees who defer compensation have the option to select various Invesco Funds in which their deferral accounts shall be deemed to be invested. Finally, certain current Trustees were eligible to participate in a retirement plan that provided for benefits to be paid upon retirement to Trustees over a period of time based on the number of years of service. The Fund may have certain former Trustees who also participate in a retirement plan and receive benefits under such plan. Trustees’ and Officers’ Fees and Benefits include amounts accrued by the Fund to fund such retirement benefits. Obligations under the deferred compensation and retirement plans represent unsecured claims against the general assets of the Fund.
NOTE 6–Cash Balances
The Fund is permitted to temporarily carry a negative or overdrawn balance in its account with SSB, the custodian bank. Such balances, if any at period-end, are shown in the Statement of Assets and Liabilities under the payable caption Amount due custodian. To compensate the custodian bank for such overdrafts, the overdrawn Fund may either (1) leave funds as a compensating balance in the account so the custodian bank can be compensated by earning the additional interest; or (2) compensate by paying the custodian bank at a rate agreed upon by the custodian bank and Invesco, not to exceed the contractually agreed upon rate. The Fund may not purchase additional securities when any borrowings from banks or broker-dealers exceed 5% of the Fund’s total assets, or when any borrowings from an Invesco Fund are outstanding.
NOTE 7–Distributions to Shareholders and Tax Components of Net Assets
Tax Character of Distributions to Shareholders Paid During the Fiscal Years Ended April 30, 2020 and 2019:
| | | | | | | | |
| | | 2020 | | | 2019 | |
| |
Ordinary income | | $ | 1,163,896 | | | $ | 16,405,908 | |
| |
Long-term capital gain | | | 31,787,816 | | | | 112,525,632 | |
| |
Total distributions | | $ | 32,951,712 | | | $ | 128,931,540 | |
| |
| | |
| Tax Components of Net Assets at Period-End: | | | | | | |
| | | | | | 2020 | |
| |
Undistributed ordinary income | | | | | | $ | 5,339,350 | |
| |
Net unrealized appreciation (depreciation) – investments | | | | | | | (87,964,656 | ) |
| |
Temporary book/tax differences | | | | | | | (458,232 | ) |
| |
Post-October capital loss deferral | | | | | | | (132,094,100 | ) |
| |
Shares of beneficial interest | | | | | | | 1,717,592,865 | |
| |
Total net assets | | | | | | $ | 1,502,415,227 | |
| |
The difference between book-basis and tax-basis unrealized appreciation (depreciation) is due to differences in the timing of recognition of gains and losses on investments for tax and book purposes. The Fund’s net unrealized appreciation (depreciation) difference is attributable primarily to wash sales.
The temporary book/tax differences are a result of timing differences between book and tax recognition of income and/or expenses. The Fund’s temporary book/tax differences are the result of the trustee deferral of compensation and retirement plan benefits.
Capital loss carryforward is calculated and reported as of a specific date. Results of transactions and other activity after that date may affect the amount of capital loss carryforward actually available for the Fund to utilize. The ability to utilize capital loss carryforward in the future may be limited under the Internal Revenue Code and related regulations based on the results of future transactions.
The Fund does not have a capital loss carryforward as of April 30, 2020.
19 Invesco American Value Fund
NOTE 8–Investment Transactions
The aggregate amount of investment securities (other than short-term securities, U.S. Treasury obligations and money market funds, if any) purchased and sold by the Fund during the year ended April 30, 2020 was $368,502,209 and $554,677,695, respectively. Cost of investments, including any derivatives, on a tax basis includes the adjustments for financial reporting purposes as of the most recently completed federal income tax reporting period-end.
Unrealized Appreciation (Depreciation) of Investments on a Tax Basis
| | | | |
| |
Aggregate unrealized appreciation of investments | | $ | 152,755,841 | |
| |
Aggregate unrealized (depreciation) of investments | | | (240,720,497 | ) |
| |
Net unrealized appreciation (depreciation) of investments | | $ | (87,964,656 | ) |
| |
Cost of investments for tax purposes is $1,595,321,144.
NOTE 9–Reclassification of Permanent Differences
Primarily as a result of differing book/tax treatment of distribution re-designation, on April 30, 2020, undistributed net investment income was decreased by $449,508 and undistributed net realized gain (loss) was increased by $449,508. Further, as a result of tax deferrals acquired in the reorganization of Invesco Oppenheimer Mid Cap Value Fund into the Fund, undistributed net investment income was decreased by $178,756, undistributed net realized gain (loss) was decreased by $51,575,171 and shares of beneficial interest was increased by $51,753,927. These reclassifications had no effect on the net assets of the Fund.
NOTE 10–Share Information
| | | | | | | | | | | | | | | | |
| | | Summary of Share Activity | |
| |
| | | Year ended | | | Year ended | |
| | | April 30, 2020(a) | | | April 30, 2019 | |
| | | Shares | | | Amount | | | Shares | | | Amount | |
| |
Sold: | | | | | | | | | | | | | | | | |
Class A | | | 1,823,677 | | | $ | 54,440,993 | | | | 2,374,194 | | | $ | 84,237,878 | |
| |
Class C | | | 128,877 | | | | 3,081,383 | | | | 143,531 | | | | 4,246,582 | |
| |
Class R | | | 125,562 | | | | 3,611,631 | | | | 146,104 | | | | 5,203,373 | |
| |
Class Y | | | 911,871 | | | | 25,764,118 | | | | 888,661 | | | | 32,058,634 | |
| |
Class R5 | | | 91,826 | | | | 2,923,009 | | | | 170,349 | | | | 6,146,454 | |
| |
Class R6 | | | 428,337 | | | | 12,997,090 | | | | 489,656 | | | | 18,018,069 | |
| |
| | | | |
Issued as reinvestment of dividends: | | | | | | | | | | | | | | | | |
Class A | | | 682,087 | | | | 22,938,603 | | | | 2,825,470 | | | | 84,340,635 | |
| |
Class C | | | 31,309 | | | | 829,990 | | | | 330,584 | | | | 7,897,661 | |
| |
Class R | | | 15,503 | | | | 517,958 | | | | 72,283 | | | | 2,149,682 | |
| |
Class Y | | | 108,841 | | | | 3,685,363 | | | | 488,901 | | | | 14,691,467 | |
| |
Class R5 | | | 16,642 | | | | 563,510 | | | | 99,659 | | | | 2,995,763 | |
| |
Class R6 | | | 64,204 | | | | 2,173,295 | | | | 248,801 | | | | 7,478,944 | |
| |
| | | |
Automatic conversion of Class C shares to Class A shares: | | | | | | | | | | | | | |
Class A | | | 131,592 | | | | 3,913,285 | | | | 1,046,064 | | | | 33,068,721 | |
| |
Class C | | | (166,308 | ) | | | (3,913,285 | ) | | | (1,308,333 | ) | | | (33,068,721 | ) |
| |
| | | | |
Issued in connection with acquisitions:(b) | | | | | | | | | | | | | | | | |
Class A | | | 23,172,250 | | | | 580,253,329 | | | | - | | | | - | |
| |
Class C | | | 2,625,561 | | | | 51,703,112 | | | | - | | | | - | |
| |
Class R | | | 1,559,009 | | | | 38,757,955 | | | | - | | | | - | |
| |
Class Y | | | 2,274,623 | | | | 57,406,484 | | | | - | | | | - | |
| |
Class R5 | | | 283 | | | | 7,147 | | | | - | | | | - | |
| |
Class R6 | | | 161,974 | | | | 4,088,710 | | | | - | | | | - | |
| |
20 Invesco American Value Fund
| | | | | | | | | | | | | | | | |
| | | Summary of Share Activity | |
| |
| | | Year ended | | | Year ended | |
| | | April 30, 2020(a) | | | April 30, 2019 | |
| | | Shares | | | Amount | | | Shares | | | Amount | |
| |
| | | | |
Reacquired: | | | | | | | | | | | | | | | | |
Class A | | | (6,245,687 | ) | | $ | (193,019,127 | ) | | | (5,025,225 | ) | | $ | (177,703,256 | ) |
| |
Class C | | | (404,776 | ) | | | (9,946,118 | ) | | | (674,289 | ) | | | (19,878,539 | ) |
| |
Class R | | | (288,840 | ) | | | (8,812,820 | ) | | | (287,002 | ) | | | (10,369,236 | ) |
| |
Class Y | | | (1,878,805 | ) | | | (59,199,196 | ) | | | (2,220,865 | ) | | | (78,695,581 | ) |
| |
Class R5 | | | (495,150 | ) | | | (15,981,878 | ) | | | (1,068,701 | ) | | | (41,829,136 | ) |
| |
Class R6 | | | (695,026 | ) | | | (21,868,182 | ) | | | (2,369,083 | ) | | | (92,336,577 | ) |
| |
Net increase (decrease) in share activity | | | 24,179,436 | | | $ | 556,916,359 | | | | (3,629,241 | ) | | $ | (151,347,183 | ) |
| |
| (a) | There are entities that are record owners of more than 5% of the outstanding shares of the Fund and in the aggregate own 25% of the outstanding shares of the Fund. IDI has an agreement with these entities to sell Fund shares. The Fund, Invesco and/or Invesco affiliates may make payments to these entities, which are considered to be related to the Fund, for providing services to the Fund, Invesco and/or Invesco affiliates including but not limited to services such as securities brokerage, distribution, third party record keeping and account servicing. The Fund has no knowledge as to whether all or any portion of the shares owned of record by these entities are also owned beneficially. |
| (b) | After the close of business on April 17, 2020, the Fund acquired all the net assets of Invesco Oppenheimer Mid Cap Value Fund (the “Target Fund”) pursuant to a plan of reorganization approved by the Board of Trustees of the Fund on February 14, 2020. The reorganization was executed in order to reduce overlap and increase efficiencies in the Adviser’s product line. The acquisition was accomplished by a tax-free exchange of 29,793,699 shares of the Fund for 21,659,372 shares outstanding of the Target Fund as of the close of business on April 17, 2020. Shares of the Target Fund were exchanged for the like class of shares of the Fund, based on the relative net asset value of the Target Fund to the net asset value of the Fund on the close of business, April 17, 2020. The Target Fund’s net assets as of the close of business on April 17, 2020 of $732,216,736, including $(139,106,066) of unrealized appreciation (depreciation), were combined with those of the Fund. The net assets of the Fund immediately before the acquisition were $735,922,174 and $1,468,138,910 immediately after the acquisition. |
The pro forma results of operations for the year ended April 30, 2020 assuming the reorganization had been completed on May 1, 2019, the beginning of the annual reporting period are as follows:
| | | | |
Net investment income | | $ | 11,514,754 | |
| |
Net realized/unrealized gains (losses) | | | (419,973,271 | ) |
| |
Change in net assets resulting from operations | | $ | (408,458,517 | ) |
| |
As the combined investment portfolios have been managed as a single integrated portfolio since the acquisition was completed, it is not practicable to separate the amounts of revenue and earnings of the Target Fund that has been included in the Fund’s Statement of Operations since April 18, 2020.
NOTE 11–Coronavirus (COVID-19) Pandemic
During the first quarter of 2020, the World Health Organization declared COVID-19 to be a public health emergency. COVID-19 has led to increased short-term market volatility and may have adverse long-term effects on U.S. and world economies and markets in general. COVID-19 may adversely impact the Fund’s ability to achieve its investment objective. Because of the uncertainties on valuation, the global economy and business operations, values reflected in these financial statements may materially differ from the value received upon actual sales of those investments.
The extent of the impact on the performance of the Fund and its investments will depend on future developments, including the duration and spread of the COVID-19 outbreak, related restrictions and advisories, and the effects on the financial markets and economy overall, all of which are highly uncertain and cannot be predicted.
21 Invesco American Value Fund
Report of Independent Registered Public Accounting Firm
To the Board of Trustees of AIM Sector Funds (Invesco Sector Funds) and Shareholders of Invesco American Value Fund
Opinion on the Financial Statements
We have audited the accompanying statement of assets and liabilities, including the schedule of investments, of Invesco American Value Fund (one of the funds constituting AIM Sector Funds (Invesco Sector Funds), referred to hereafter as the “Fund”) as of April 30, 2020, the related statement of operations for the year ended April 30, 2020, the statement of changes in net assets for each of the two years in the period ended April 30, 2020, including the related notes, and the financial highlights for each of the five years in the period ended April 30, 2020 (collectively referred to as the “financial statements”). In our opinion, the financial statements present fairly, in all material respects, the financial position of the Fund as of April 30, 2020, the results of its operations for the year then ended, the changes in its net assets for each of the two years in the period ended April 30, 2020 and the financial highlights for each of the five years in the period ended April 30, 2020 in conformity with accounting principles generally accepted in the United States of America.
Basis for Opinion
These financial statements are the responsibility of the Fund’s management. Our responsibility is to express an opinion on the Fund’s financial statements based on our audits. We are a public accounting firm registered with the Public Company Accounting Oversight Board (United States) (PCAOB) and are required to be independent with respect to the Fund in accordance with the U.S. federal securities laws and the applicable rules and regulations of the Securities and Exchange Commission and the PCAOB.
We conducted our audits of these financial statements in accordance with the standards of the PCAOB. Those standards require that we plan and perform the audit to obtain reasonable assurance about whether the financial statements are free of material misstatement, whether due to error or fraud.
Our audits included performing procedures to assess the risks of material misstatement of the financial statements, whether due to error or fraud, and performing procedures that respond to those risks. Such procedures included examining, on a test basis, evidence regarding the amounts and disclosures in the financial statements. Our audits also included evaluating the accounting principles used and significant estimates made by management, as well as evaluating the overall presentation of the financial statements. Our procedures included confirmation of securities owned as of April 30, 2020 by correspondence with the custodian, transfer agent and brokers; when replies were not received from brokers, we performed other auditing procedures. We believe that our audits provide a reasonable basis for our opinion.
/s/ PricewaterhouseCoopers LLP
Houston, Texas
June 26, 2020
We have served as the auditor of one or more of the investment companies in the Invesco group of investment companies since at least 1995. We have not been able to determine the specific year we began serving as auditor.
22 Invesco American Value Fund
Calculating your ongoing Fund expenses
Example
As a shareholder of the Fund, you incur two types of costs: (1) transaction costs, which may include sales charges (loads) on purchase payments or contingent deferred sales charges on redemptions, if any; and (2) ongoing costs, including management fees, distribution and/or service (12b-1) fees, and other Fund expenses. This example is intended to help you understand your ongoing costs (in dollars) of investing in the Fund and to compare these costs with ongoing costs of investing in other mutual funds. The example is based on an investment of $1,000 invested at the beginning of the period and held for the entire period November 1, 2019 through April 30, 2020.
Actual expenses
The table below provides information about actual account values and actual expenses. You may use the information in this table, together with the amount you invested, to estimate the expenses that you paid over the period. Simply divide your account value by $1,000 (for example, an $8,600 account value divided by $1,000 = 8.6), then multiply the result by the number in the table under the heading entitled “Actual Expenses Paid During Period” to estimate the expenses you paid on your account during this period.
Hypothetical example for comparison purposes
The table below also provides information about hypothetical account values and hypothetical expenses based on the Fund’s actual expense ratio and an assumed rate of return of 5% per year before expenses, which is not the Fund’s actual return.
The hypothetical account values and expenses may not be used to estimate the actual ending account balance or expenses you paid for the period. You may use this information to compare the ongoing costs of investing in the Fund and other funds. To do so, compare this 5% hypothetical example with the 5% hypothetical examples that appear in the shareholder reports of the other funds.
Please note that the expenses shown in the table are meant to highlight your ongoing costs only and do not reflect any transaction costs, such as sales charges (loads) on purchase payments or contingent deferred sales charges on redemptions, if any. Therefore, the hypothetical information is useful in comparing ongoing costs only, and will not help you determine the relative total costs of owning different funds. In addition, if these transaction costs were included, your costs would have been higher.
| | | | | | | | | | | | | | | | | | | | | | |
| | | | | ACTUAL | | HYPOTHETICAL (5% annual return before expenses) | | |
| | | Beginning
Account Value
(11/01/19) | | Ending
Account Value
(04/30/20)2 | | Expenses
Paid During
Period1,3 | | Ending
Account Value
(04/30/20) | | Expenses
Paid During
Period1,4 | | Annualized
Expense
Ratio 1 |
| Class A | | | $1,000.00 | | | | $807.00 | | | | $5.44 | | | | $1,018.85 | | | | $6.07 | | | 1.21% |
| Class C | | | 1,000.00 | | | | 803.80 | | | | 8.75 | | | | 1,015.17 | | | | 9.77 | | | 1.95 |
| Class R | | | 1,000.00 | | | | 805.90 | | | | 6.51 | | | | 1,017.65 | | | | 7.27 | | | 1.45 |
| Class Y | | | 1,000.00 | | | | 807.80 | | | | 4.32 | | | | 1,020.09 | | | | 4.82 | | | 0.96 |
| Class R5 | | | 1,000.00 | | | | 808.30 | | | | 3.91 | | | | 1,020.54 | | | | 4.37 | | | 0.87 |
| Class R6 | | | 1,000.00 | | | | 808.70 | | | | 3.60 | | | | 1,020.89 | | | | 4.02 | | | 0.80 |
| 1 | Expenses are equal to the Fund’s annualized expense ratio as indicated above multiplied by the average account value over the period, multiplied by 182/366 to reflect the most recent fiscal half year. Effective April 17, 2020, the Fund’s adviser has contractually agreed to waive advisory fees and/or reimburse expenses to the extent necessary to limit total annual fund operating expense of Class A, Class C, Class R, Class Y, Class R5 and Class R6 shares to 1.16%, 1.90%, 1.40%, 0.91%, 0.80% and 0.75% of average daily net assets, respectively. The annualized expense ratios restated as if these agreements had been in effect throughout the entire most recent fiscal half year are 1.16%, 1.90%, 1.40%, 0.91%, 0.80% and 0.75% for Class A, Class C, Class R, Class Y, Class R5 and Class R6 shares, respectively. |
| 2 | The actual ending account value is based on the actual total return of the Fund for the period November 1, 2019 through April 30, 2020, after actual expenses and will differ from the hypothetical ending account value which is based on the Fund’s expense ratio and a hypothetical annual return of 5% before expenses. |
| 3 | The actual expenses paid restated as if the changes discussed above had been in effect throughout the entire most recent fiscal half year are $5.21, $8.52, $6.29, $4.09, $3.60 and $3.37 for Class A, Class C, Class R, Class Y, Class R5 and Class R6 shares, respectively. |
| 4 | The hypothetical expenses paid restated as if the changes discussed above had been in effect throughout the entire most recent fiscal half year are $5.82, $9.52, $7.02, $4.57, $4.02 and $3.77 for Class A, Class C, Class R, Class Y, Class R5 and Class R6 shares, respectively. |
23 Invesco American Value Fund
Tax Information
Form 1099-DIV, Form 1042-S and other year–end tax information provide shareholders with actual calendar year amounts that should be included in their tax returns. Shareholders should consult their tax advisers.
The following distribution information is being provided as required by the Internal Revenue Code or to meet a specific state’s requirement.
The Fund designates the following amounts or, if subsequently determined to be different, the maximum amount allowable for its fiscal year ended April 30, 2020:
| | | | | | |
Federal and State Income Tax | | | | | | |
Long-term capital gain Distributions | | $ | 31,787,816 | | | |
Qualified Dividend Income* | | | 100.00 | % | | |
Corporate Dividends Received Deduction* | | | 100.00 | % | | |
U.S. Treasury Obligations* | | | 0.00 | % | | |
* The above percentages are based on ordinary income dividends paid to shareholders during the Fund’s fiscal year. |
24 Invesco American Value Fund
Trustees and Officers
The address of each trustee and officer is AIM Sector Funds (Invesco Sector Funds) (the “Trust”), 11 Greenway Plaza, Suite 1000, Houston, Texas 77046-1173. The trustees serve for the life of the Trust, subject to their earlier death, incapacitation, resignation, retirement or removal as more specifically provided in the Trust’s organizational documents. Each officer serves for a one year term or until their successors are elected and qualified. Column two below includes length of time served with predecessor entities, if any.
| | | | | | | | |
Name, Year of Birth and Position(s) Held with the Trust | | Trustee and/or Officer Since | | Principal Occupation(s) During Past 5 Years | | Number of Funds in Fund Complex Overseen by Trustee | | Other Directorship(s)
Held by Trustee
During Past 5 Years |
Interested Trustee | | | | | | | | |
Martin L. Flanagan1 – 1960 Trustee and Vice Chair | | 2007 | | Executive Director, Chief Executive Officer and President, Invesco Ltd. (ultimate parent of Invesco and a global investment management firm); Trustee and Vice Chair, The Invesco Funds; Vice Chair, Investment Company Institute; and Member of Executive Board, SMU Cox School of Business Formerly: Advisor to the Board, Invesco Advisers, Inc. (formerly known as Invesco Institutional (N.A.), Inc.); Chairman and Chief Executive Officer, Invesco Advisers, Inc. (registered investment adviser); Director, Chairman, Chief Executive Officer and President, Invesco Holding Company (US), Inc. (formerly IVZ Inc.) (holding company), Invesco Group Services, Inc. (service provider) and Invesco North American Holdings, Inc. (holding company); Director, Chief Executive Officer and President, Invesco Holding Company Limited (parent of Invesco and a global investment management firm); Director, Invesco Ltd.; Chairman, Investment Company Institute and President, Co-Chief Executive Officer, Co-President, Chief Operating Officer and Chief Financial Officer, Franklin Resources, Inc. (global investment management organization) | | 203 | | None |
| 1 | Mr. Flanagan is considered an interested person (within the meaning of Section 2(a)(19) of the 1940 Act) of the Trust because he is an officer of the Adviser to the Trust, and an officer and a director of Invesco Ltd., ultimate parent of the Adviser. |
T-1 Invesco American Value Fund
Trustees and Officers–(continued)
| | | | | | | | |
Name, Year of Birth and Position(s) Held with the Trust | | Trustee and/or Officer Since | | Principal Occupation(s) During Past 5 Years | | Number of Funds in Fund Complex Overseen by Trustee | | Other Directorship(s)
Held by Trustee
During Past 5 Years |
Independent Trustees | | | | | | |
Bruce L. Crockett – 1944 Trustee and Chair | | 2003 | | Chairman, Crockett Technologies Associates (technology consulting company) Formerly: Director, Captaris (unified messaging provider); Director, President and Chief Executive Officer, COMSAT Corporation; Chairman, Board of Governors of INTELSAT (international communications company); ACE Limited (insurance company); Independent Directors Council and Investment Company Institute: Member of the Audit Committee, Investment Company Institute; Member of the Executive Committee and Chair of the Governance Committee, Independent Directors Council | | 203 | | Director and Chairman of the Audit Committee, ALPS (Attorneys Liability Protection Society) (insurance company); Director and Member of the Audit Committee and Compensation Committee, Ferroglobe PLC (metallurgical company) |
David C. Arch – 1945 Trustee | | 2010 | | Chairman of Blistex Inc. (consumer health care products manufacturer); Member, World Presidents’ Organization | | 203 | | Board member of the Illinois Manufacturers’ Association |
| Beth Ann Brown – 1968 Trustee | | 2019 | | Independent Consultant Formerly: Head of Intermediary Distribution, Managing Director, Strategic Relations, Managing Director, Head of National Accounts, Senior Vice President, National Account Manager and Senior Vice President, Key Account Manager, Columbia Management Investment Advisers LLC; Vice President, Key Account Manager, Liberty Funds Distributor, Inc.; and Trustee of certain Oppenheimer Funds | | 203 | | Director, Board of Directors of Caron Engineering Inc.; Advisor, Board of Advisors of Caron Engineering Inc.; President and Director, Acton Shapleigh Youth Conservation Corps (non - profit); and Vice President and Director of Grahamtastic Connection (non- profit) |
Jack M. Fields – 1952 Trustee | | 2003 | | Chief Executive Officer, Twenty First Century Group, Inc. (government affairs company); and Chairman, Discovery Learning Alliance (non-profit) Formerly: Owner and Chief Executive Officer, Dos Angeles Ranch L.P. (cattle, hunting, corporate entertainment); Director, Insperity, Inc. (formerly known as Administaff) (human resources provider); Chief Executive Officer, Texana Timber LP (sustainable forestry company); Director of Cross Timbers Quail Research Ranch (non-profit); and member of the U.S. House of Representatives | | 203 | | Member, Board of Directors of Baylor College of Medicine |
T-2 Invesco American Value Fund
Trustees and Officers–(continued)
| | | | | | | | |
Name, Year of Birth and Position(s) Held with the Trust | | Trustee and/or Officer Since | | Principal Occupation(s) During Past 5 Years | | Number of Funds in Fund Complex Overseen by Trustee | | Other Directorship(s)
Held by Trustee
During Past 5 Years |
Independent Trustees–(continued) | | | | |
Cynthia Hostetler – 1962 Trustee | | 2017 | | Non-Executive Director and Trustee of a number of public and private business corporations Formerly: Director, Aberdeen Investment Funds (4 portfolios); Head of Investment Funds and Private Equity, Overseas Private Investment Corporation; President, First Manhattan Bancorporation, Inc.; Attorney, Simpson Thacher & Bartlett LLP | | 203 | | Vulcan Materials Company (construction materials company); Trilinc Global Impact Fund; Genesee & Wyoming, Inc. (railroads); Artio Global Investment LLC (mutual fund complex); Edgen Group, Inc. (specialized energy and infrastructure products distributor); Investment Company Institute (professional organization); Independent Directors Council (professional organization) |
Eli Jones – 1961 Trustee | | 2016 | | Professor and Dean, Mays Business School - Texas A&M University Formerly: Professor and Dean, Walton College of Business, University of Arkansas and E.J. Ourso College of Business, Louisiana State University; Director, Arvest Bank | | 229 | | Insperity, Inc. (formerly known as Administaff) (human resources provider) |
Elizabeth Krentzman – 1959 Trustee | | 2019 | | Formerly: Principal and Chief Regulatory Advisor for Asset Management Services and U.S. Mutual Fund Leader of Deloitte & Touche LLP; General Counsel of the Investment Company Institute (trade association); National Director of the Investment Management Regulatory Consulting Practice, Principal, Director and Senior Manager of Deloitte & Touche LLP; Assistant Director of the Division of Investment Management - Office of Disclosure and Investment Adviser Regulation of the U.S. Securities and Exchange Commission and various positions with the Division of Investment Management – Office of Regulatory Policy of the U.S. Securities and Exchange Commission; Associate at Ropes & Gray LLP; Advisory Board Member of the Securities and Exchange Commission Historical Society; and Trustee of certain Oppenheimer Funds | | 203 | | Trustee of the University of Florida National Board Foundation and Audit Committee Member; Member of the Cartica Funds Board of Directors (private investment funds); Member of the University of Florida Law Center Association, Inc. Board of Trustees and Audit Committee Member |
| Anthony J. LaCava, Jr. – 1956 Trustee | | 2019 | | Formerly: Director and Member of the Audit Committee, Blue Hills Bank (publicly traded financial institution) and Managing Partner, KPMG LLP | | 203 | | Blue Hills Bank; Chairman, Bentley University; Member, Business School Advisory Council; and Nominating Committee KPMG LLP |
| Prema Mathai-Davis – 1950 Trustee | | 2003 | | Retired Co-Owner & Partner of Quantalytics Research, LLC, (a FinTech Investment Research Platform for the Self-Directed Investor) | | 203 | | None |
T-3 Invesco American Value Fund
Trustees and Officers–(continued)
| | | | | | | | |
Name, Year of Birth and Position(s) Held with the Trust | | Trustee and/or Officer Since | | Principal Occupation(s) During Past 5 Years | | Number of Funds in Fund Complex Overseen by Trustee | | Other Directorship(s)
Held by Trustee
During Past 5 Years |
Independent Trustees–(continued) | | | | |
Joel W. Motley – 1952 Trustee | | 2019 | | Director of Office of Finance, Federal Home Loan Bank System; Member of the Vestry of Trinity Wall Street; Managing Director of Carmona Motley Inc. (privately held financial advisor); Member of the Council on Foreign Relations and its Finance and Budget Committee; Chairman Emeritus of Board of Human Rights Watch and Member of its Investment Committee; and Member of Investment Committee and Board of Historic Hudson Valley (non-profit cultural organization) Formerly: Managing Director of Public Capital Advisors, LLC (privately held financial advisor); Managing Director of Carmona Motley Hoffman, Inc. (privately held financial advisor); Trustee of certain Oppenheimer Funds; and Director of Columbia Equity Financial Corp. (privately held financial advisor) | | 203 | | Member of Board of Greenwall Foundation (bioethics research foundation) and its Investment Committee; Member of Board of Friends of the LRC (non-profit legal advocacy); Board Member and Investment Committee Member of Pulizer Center for Crisis Reporting (non-profit journalism) |
Teresa M. Ressel – 1962 Trustee | | 2017 | | Non-executive director and trustee of a number of public and private business corporations Formerly: Chief Financial Officer, Olayan America, The Olayan Group (international investor/commercial/industrial); Chief Executive Officer, UBS Securities LLC; Group Chief Operating Officer, Americas, UBS AG; Assistant Secretary for Management & Budget and CFO, US Department of the Treasury | | 203 | | Atlantic Power Corporation (power generation company); ON Semiconductor Corp. (semiconductor supplier) |
Ann Barnett Stern – 1957 Trustee | | 2017 | | President and Chief Executive Officer, Houston Endowment Inc. (private philanthropic institution) Formerly: Executive Vice President and General Counsel, Texas Children’s Hospital; Attorney, Beck, Redden and Secrest, LLP; Business Law Instructor, University of St. Thomas; Attorney, Andrews & Kurth LLP | | 203 | | Federal Reserve Bank of Dallas |
Robert C. Troccoli – 1949 Trustee | | 2016 | | Retired Formerly: Adjunct Professor, University of Denver – Daniels College of Business; Senior Partner, KPMG LLP | | 203 | | None |
Daniel S. Vandivort –1954 Trustee | | 2019 | | Treasurer, Chairman of the Audit and Finance Committee, and Trustee, Board of Trustees, Huntington Disease Foundation of America; and President, Flyway Advisory Services LLC (consulting and property management) Formerly: Trustee and Governance Chair, of certain Oppenheimer Funds | | 203 | | Chairman and Lead Independent Director, Chairman of the Audit Committee, and Director, Board of Directors, Value Line Funds |
James D. Vaughn – 1945 Trustee | | 2019 | | Retired Formerly: Managing Partner, Deloitte & Touche LLP; Trustee and Chairman of the Audit Committee, Schroder Funds; Board Member, Mile High United Way, Boys and Girls Clubs, Boy Scouts, Colorado Business Committee for the Arts, Economic Club of Colorado and Metro Denver Network (economic development corporation); and Trustee of certain Oppenheimer Funds | | 203 | | Board member and Chairman of Audit Committee of AMG National Trust Bank; Trustee and Investment Committee member, University of South Dakota Foundation; Board member, Audit Committee Member and past Board Chair, Junior Achievement (non-profit) |
Christopher L. Wilson - 1957 Trustee, Vice Chair and Chair Designate | | 2017 | | Retired Formerly: Director, TD Asset Management USA Inc. (mutual fund complex) (22 portfolios); Managing Partner, CT2, LLC (investing and consulting firm); President/Chief Executive Officer, Columbia Funds, Bank of America Corporation; President/Chief Executive Officer, CDC IXIS Asset Management Services, Inc.; Principal & Director of Operations, Scudder Funds, Scudder, Stevens & Clark, Inc.; Assistant Vice President, Fidelity Investments | | 203 | | ISO New England, Inc. (non-profit organization managing regional electricity market) |
T-4 Invesco American Value Fund
Trustees and Officers–(continued)
| | | | | | | | |
Name, Year of Birth and Position(s) Held with the Trust | | Trustee and/or Officer Since | | Principal Occupation(s) During Past 5 Years | | Number of Funds in Fund Complex Overseen by Trustee | | Other Directorship(s)
Held by Trustee
During Past 5 Years |
Officers | | | | | | | | |
Sheri Morris – 1964 President, Principal Executive Officer and Treasurer | | 2003 | | Head of Global Fund Services, Invesco Ltd.; President, Principal Executive Officer and Treasurer, The Invesco Funds; Vice President, Invesco Advisers, Inc. (formerly known as Invesco Institutional (N.A.), Inc.) (registered investment adviser); and Vice President, Invesco Exchange-Traded Fund Trust, Invesco Exchange-Traded Fund Trust II, Invesco India Exchange-Traded Fund Trust, Invesco Actively Managed Exchange-Traded Fund Trust, Invesco Actively Managed Exchange-Traded Commodity Fund Trust and Invesco Exchange-Traded Self-Indexed Fund Trust; and Vice President, OppenheimerFunds, Inc. Formerly: Vice President and Principal Financial Officer, The Invesco Funds; Vice President, Invesco AIM Advisers, Inc., Invesco AIM Capital Management, Inc. and Invesco AIM Private Asset Management, Inc.; Assistant Vice President and Assistant Treasurer, The Invesco Funds and Assistant Vice President, Invesco Advisers, Inc., Invesco AIM Capital Management, Inc. and Invesco AIM Private Asset Management, Inc.; and Treasurer, Invesco Exchange-Traded Fund Trust, Invesco Exchange-Traded Fund Trust II, Invesco India Exchange-Traded Fund Trust and Invesco Actively Managed Exchange-Traded Fund Trust | | N/A | | N/A |
Russell C. Burk – 1958 Senior Vice President and Senior Officer | | 2005 | | Senior Vice President and Senior Officer, The Invesco Funds | | N/A | | N/A |
Jeffrey H. Kupor – 1968 Senior Vice President, Chief Legal Officer and Secretary | | 2018 | | Head of Legal of the Americas, Invesco Ltd.; Senior Vice President and Secretary, Invesco Advisers, Inc. (formerly known as Invesco Institutional (N.A.), Inc.) (registered investment adviser); Senior Vice President and Secretary, Invesco Distributors, Inc. (formerly known as Invesco AIM Distributors, Inc.); Vice President and Secretary, Invesco Investment Services, Inc. (formerly known as Invesco AIM Investment Services, Inc.) Senior Vice President, Chief Legal Officer and Secretary, The Invesco Funds; Secretary and General Counsel, Invesco Investment Advisers LLC (formerly known as Van Kampen Asset Management); Secretary and General Counsel, Invesco Capital Markets, Inc. (formerly known as Van Kampen Funds Inc.) and Chief Legal Officer, Invesco Exchange-Traded Fund Trust, Invesco Exchange-Traded Fund Trust II, Invesco India Exchange-Traded Fund Trust, Invesco Actively Managed Exchange-Traded Fund Trust, Invesco Actively Managed Exchange-Traded Commodity Fund Trust and Invesco Exchange-Traded Self-Indexed Fund Trust; Secretary, Invesco Indexing LLC; Secretary, W.L. Ross & Co., LLC Formerly: Secretary and Vice President, Jemstep, Inc.; Head of Legal, Worldwide Institutional, Invesco Ltd.; Secretary and General Counsel, INVESCO Private Capital Investments, Inc.; Senior Vice President, Secretary and General Counsel, Invesco Management Group, Inc. (formerly known as Invesco AIM Management Group, Inc.); Assistant Secretary, INVESCO Asset Management (Bermuda) Ltd.; Secretary and General Counsel, Invesco Private Capital, Inc.; Assistant Secretary and General Counsel, INVESCO Realty, Inc.; Secretary and General Counsel, Invesco Senior Secured Management, Inc.; and Secretary, Sovereign G./P. Holdings Inc. | | N/A | | N/A |
Andrew R. Schlossberg – 1974 Senior Vice President | | 2019 | | Head of the Americas and Senior Managing Director, Invesco Ltd.; Director and Senior Vice President, Invesco Advisers, Inc. (formerly known as Invesco Institutional (N.A.), Inc.) (registered investment adviser); Director and Chairman, Invesco Investment Services, Inc. (formerly known as Invesco AIM Investment Services, Inc.) (registered transfer agent); Senior Vice President, The Invesco Funds; Director, Invesco Investment Advisers LLC (formerly known as Van Kampen Asset Management); Director, President and Chairman, Invesco Insurance Agency, Inc. Formerly: Director, Invesco UK Limited; Director and Chief Executive, Invesco Asset Management Limited and Invesco Fund Managers Limited; Assistant Vice President, The Invesco Funds; Senior Vice President, Invesco Advisers, Inc. (formerly known as Invesco Institutional (N.A.), Inc.) (registered investment adviser); Director and Chief Executive, Invesco Administration Services Limited and Invesco Global Investment Funds Limited; Director, Invesco Distributors, Inc.; Head of EMEA, Invesco Ltd.; President, Invesco Actively Managed Exchange-Traded Commodity Fund Trust, Invesco Actively Managed Exchange-Traded Fund Trust, Invesco Exchange-Traded Fund Trust, Invesco Exchange-Traded Fund Trust II and Invesco India Exchange-Traded Fund Trust; Managing Director and Principal Executive Officer, Invesco Capital Management LLC | | N/A | | N/A |
T-5 Invesco American Value Fund
Trustees and Officers–(continued)
| | | | | | | | |
Name, Year of Birth and Position(s) Held with the Trust | | Trustee and/or Officer Since | | Principal Occupation(s) During Past 5 Years | | Number of Funds in Fund Complex Overseen by Trustee | | Other Directorship(s)
Held by Trustee
During Past 5 Years |
Officers–(continued) | | | | | | | | |
John M. Zerr – 1962 Senior Vice President | | 2006 | | Chief Operating Officer of the Americas; Senior Vice President, Invesco Advisers, Inc. (formerly known as Invesco Institutional (N.A.), Inc.) (registered investment adviser); Senior Vice President, Invesco Distributors, Inc. (formerly known as Invesco AIM Distributors, Inc.); Director and Vice President, Invesco Investment Services, Inc. (formerly known as Invesco AIM Investment Services, Inc.) Senior Vice President, The Invesco Funds; Managing Director, Invesco Capital Management LLC; Director, Invesco Investment Advisers LLC (formerly known as Van Kampen Asset Management); Senior Vice President, Invesco Capital Markets, Inc. (formerly known as Van Kampen Funds Inc.); Manager, Invesco Indexing LLC; Manager, Invesco Specialized Products, LLC; Director and Senior Vice President, Invesco Insurance Agency, Inc.; Member, Invesco Canada Funds Advisory Board; Director, President and Chief Executive Officer, Invesco Corporate Class Inc. (corporate mutual fund company); and Director, Chairman, President and Chief Executive Officer, Invesco Canada Ltd. (formerly known as Invesco Trimark Ltd./Invesco Trimark Ltèe) (registered investment adviser and registered transfer agent); President, Invesco, Inc.; President, Invesco Global Direct Real Estate Feeder GP Ltd.; President, Invesco IP Holdings (Canada) Ltd; President, Invesco Global Direct Real Estate GP Ltd.; President, Invesco Financial Services Ltd. / Services Financiers Invesco Ltée; and President, Trimark Investments Ltd./Placements Trimark Ltée | | N/A | | N/A |
| | | | | Formerly: Director and Senior Vice President, Invesco Management Group, Inc. (formerly known as Invesco AIM Management Group, Inc.); Secretary and General Counsel, Invesco Management Group, Inc. (formerly known as Invesco AIM Management Group, Inc.); Secretary, Invesco Investment Services, Inc. (formerly known as Invesco AIM Investment Services, Inc.); Chief Legal Officer and Secretary, The Invesco Funds; Secretary and General Counsel, Invesco Investment Advisers LLC (formerly known as Van Kampen Asset Management); Secretary and General Counsel, Invesco Capital Markets, Inc. (formerly known as Van Kampen Funds Inc.); Chief Legal Officer, Invesco Exchange-Traded Fund Trust, Invesco Exchange-Traded Fund Trust II, Invesco India Exchange-Traded Fund Trust, Invesco Actively Managed Exchange-Traded Fund Trust, Invesco Actively Managed Exchange-Traded Commodity Fund Trust and Invesco Exchange-Traded Self-Indexed Fund Trust; Secretary, Invesco Indexing LLC; Director, Secretary, General Counsel and Senior Vice President, Van Kampen Exchange Corp.; Director, Vice President and Secretary, IVZ Distributors, Inc. (formerly known as INVESCO Distributors, Inc.); Director and Vice President, INVESCO Funds Group, Inc.; Director and Vice President, Van Kampen Advisors Inc.; Director, Vice President, Secretary and General Counsel, Van Kampen Investor Services Inc.; Director and Secretary, Invesco Distributors, Inc. (formerly known as Invesco AIM Distributors, Inc.); Director, Senior Vice President, General Counsel and Secretary, Invesco AIM Advisers, Inc. and Van Kampen Investments Inc.; Director, Vice President and Secretary, Fund Management Company; Director, Senior Vice President, Secretary, General Counsel and Vice President, Invesco AIM Capital Management, Inc.; Chief Operating Officer and General Counsel, Liberty Ridge Capital, Inc. (an investment adviser) | | | | |
Gregory G. McGreevey – 1962 Senior Vice President | | 2012 | | Senior Managing Director, Invesco Ltd.; Director, Chairman, President, and Chief Executive Officer, Invesco Advisers, Inc. (formerly known as Invesco Institutional (N.A.), Inc.) (registered investment adviser); Director, Invesco Mortgage Capital, Inc. and Invesco Senior Secured Management, Inc.; and Senior Vice President, The Invesco Funds; and President, SNW Asset Management Corporation and Invesco Managed Accounts, LLC Formerly: Senior Vice President, Invesco Management Group, Inc. and Invesco Advisers, Inc.; Assistant Vice President, The Invesco Funds | | N/A | | N/A |
Kelli Gallegos – 1970 Vice President, Principal Financial Officer and Assistant Treasurer | | 2008 | | Principal Financial and Accounting Officer – Investments Pool, Invesco Specialized Products, LLC; Vice President, Principal Financial Officer and Assistant Treasurer, The Invesco Funds; Principal Financial and Accounting Officer – Pooled Investments, Invesco Capital Management LLC; Vice President and Treasurer, Invesco Exchange-Traded Fund Trust, Invesco Exchange-Traded Fund Trust II, Invesco India Exchange-Traded Fund Trust, Invesco Actively Managed Exchange-Traded Fund Trust, Invesco Actively Managed Exchange-Traded Commodity Fund Trust and Invesco Exchange-Traded Self-Indexed Fund Trust; Vice President, Invesco Advisers, Inc. Formerly: Assistant Treasurer, Invesco Specialized Products, LLC; Assistant Treasurer, Invesco Exchange-Traded Fund Trust, Invesco Exchange-Traded Fund Trust II, Invesco India Exchange-Traded Fund Trust, Invesco Actively Managed Exchange-Traded Fund Trust, Invesco Actively Managed Exchange-Traded Commodity Fund Trust and Invesco Exchange-Traded Self-Indexed Fund Trust; Assistant Treasurer, Invesco Capital Management LLC; Assistant Vice President, The Invesco Funds | | N/A | | N/A |
T-6 Invesco American Value Fund
Trustees and Officers–(continued)
| | | | | | | | |
Name, Year of Birth and Position(s) Held with the Trust | | Trustee and/or Officer Since | | Principal Occupation(s) During Past 5 Years | | Number of Funds in Fund Complex Overseen by Trustee | | Other Directorship(s)
Held by Trustee
During Past 5 Years |
Officers–(continued) | | | | | | | | |
Crissie M. Wisdom – 1969 Anti-Money Laundering Compliance Officer | | 2013 | | Anti-Money Laundering and OFAC Compliance Officer for Invesco U.S. entities including: Invesco Advisers, Inc. and its affiliates, Invesco Capital Markets, Inc., Invesco Distributors, Inc., Invesco Investment Services, Inc., The Invesco Funds, Invesco Capital Management, LLC, Invesco Trust Company; OppenheimerFunds Distributor, Inc., and Fraud Prevention Manager for Invesco Investment Services, Inc. | | N/A | | N/A |
Todd F. Kuehl – 1969 Chief Compliance Officer | | 2020 | | Chief Compliance Officer, Invesco Advisers, Inc. (registered investment adviser); and Chief Compliance Officer, The Invesco Funds Formerly: Managing Director and Chief Compliance Officer, Legg Mason (Mutual Funds); Chief Compliance Officer, Legg Mason Private Portfolio Group (registered investment adviser) | | N/A | | N/A |
The Statement of Additional Information of the Trust includes additional information about the Fund’s Trustees and is available upon request, without charge, by calling 1.800.959.4246. Please refer to the Fund’s Statement of Additional Information for information on the Fund’s sub-advisers.
| | | | | | |
| Office of the Fund | | Investment Adviser | | Distributor | | Auditors |
| 11 Greenway Plaza, Suite 1000 | | Invesco Advisers, Inc. | | Invesco Distributors, Inc. | | PricewaterhouseCoopers LLP |
| Houston, TX 77046-1173 | | 1555 Peachtree Street, N.E. | | 11 Greenway Plaza, Suite 1000 | | 1000 Louisiana Street, Suite 5800 |
| | Atlanta, GA 30309 | | Houston, TX 77046-1173 | | Houston, TX 77002-5678 |
| | | |
| Counsel to the Fund | | Counsel to the Independent Trustees | | Transfer Agent | | Custodian |
| Stradley Ronon Stevens & Young, LLP | | Goodwin Procter LLP | | Invesco Investment Services, Inc. | | State Street Bank and Trust Company |
| 2005 Market Street, Suite 2600 | | 901 New York Avenue, N.W. | | 11 Greenway Plaza, Suite 1000 | | 225 Franklin Street |
| Philadelphia, PA 19103-7018 | | Washington, D.C. 20001 | | Houston, TX 77046-1173 | | Boston, MA 02110-2801 |
T-7 Invesco American Value Fund

Go paperless with eDelivery
Visit invesco.com/edelivery to enjoy the convenience and security of anytime electronic access to your investment documents.
With eDelivery, you can elect to have any or all of the following materials delivered straight to your inbox to download, save and print from your own computer:
| ∎ | | Fund reports and prospectuses |
Invesco mailing information
Send general correspondence to Invesco Investment Services, Inc., P.O. Box 219078, Kansas City, MO 64121-9078.
Important notice regarding delivery of security holder documents
To reduce Fund expenses, only one copy of most shareholder documents may be mailed to shareholders with multiple accounts at the same address (Householding). Mailing of your shareholder documents may be householded indefinitely unless you instruct us otherwise. If you do not want the mailing of these documents to be combined with those for other members of your household, please contact Invesco Investment Services, Inc. at 800 959 4246 or contact your financial institution. We will begin sending you individual copies for each account within 30 days after receiving your request.
Fund holdings and proxy voting information
The Fund provides a complete list of its holdings four times in each fiscal year, at the quarter-ends. For the second and fourth quarters, the list appears in the Fund’s semiannual and annual reports to shareholders. For the first and third quarters, the Fund files the lists with the Securities and Exchange Commission (SEC) as an exhibit to its reports on Form N-PORT. The most recent list of portfolio holdings is available at invesco.com/completeqtrholdings. Shareholders can also look up the Fund’s Form N-PORT filings on the SEC website, sec.gov. The SEC file numbers for the Fund are shown below.
A description of the policies and procedures that the Fund uses to determine how to vote proxies relating to portfolio securities is available without charge, upon request, from our Client Services department at 800 959 4246, or at invesco.com/proxyguidelines. The information is also available on the SEC website, sec.gov.
Information regarding how the Fund voted proxies related to its portfolio securities during the most recent 12-month period ended June 30 is available at invesco.com/proxysearch. This information is also available on the SEC website, sec.gov.
| | |
| Invesco Advisers, Inc. is an investment adviser; it provides investment advisory services to individual and institutional clients and does not sell securities. Invesco Distributors, Inc. is the US distributor for Invesco Ltd.’s retail mutual funds, exchange-traded funds and institutional money market funds. Both are wholly owned, indirect subsidiaries of Invesco Ltd. | | |
SEC file numbers: 811-03826 and 002-85905 Invesco Distributors, Inc. VK-AMVA-AR-1
| | | | |
| | |
 | | Annual Report to Shareholders | | April 30, 2020 |
| | Invesco Comstock Fund |
| | Nasdaq: |
| | A: ACSTX ∎ C: ACSYX ∎ R: ACSRX ∎ Y: ACSDX ∎ R5: ACSHX ∎ R6: ICSFX |

Beginning on January 1, 2021, as permitted by regulations adopted by the Securities and Exchange Commission, paper copies of the Fund’s shareholder reports will no longer be sent by mail, unless you specifically request paper copies of the reports from the Fund or from your financial intermediary, such as a broker-dealer or bank. Instead, the reports will be made available on the Fund’s website, and you will be notified by mail each time a report is posted and provided with a website link to access the report.
If you already elected to receive shareholder reports electronically, you will not be affected by this change and you need not take any action. You may elect to receive shareholder reports and other communications from the Fund electronically by contacting your financial intermediary (such as a broker-dealer or bank) or, if you are a direct investor, by enrolling at invesco.com/edelivery.
You may elect to receive all future reports in paper free of charge. If you invest through a financial intermediary, you can contact your financial intermediary to request that you continue to receive paper copies of your shareholder reports. If you invest directly with the Fund, you can call (800) 959-4246 to let the Fund know you wish to continue receiving paper copies of your shareholder reports. Your election to receive reports in paper will apply to all funds held with your financial intermediary or all funds held with the fund complex if you invest directly with the Fund.
Letters to Shareholders
| | |

Andrew Schlossberg | | Dear Shareholders: This annual report includes information about your Fund, including performance data and a complete list of its investments as of the close of the reporting period. Inside is a discussion of how your Fund was managed and the factors that affected its performance during the reporting period. Global equities and fixed-income securities faced a tumultuous environment during the reporting period. This was particularly true in the later stages of the period as a pandemic gripped the world and unsettled markets. At the onset of the reporting period, global equity markets were buoyed by a more accommodative stance from central banks. Despite US-China trade concerns and signs of slowing global growth, which led to some market volatility along the way, the second and third quarters of 2019 were relatively calm. In the final months of 2019, better-than-expected third quarter corporate earnings and initial agreement of the phase one US-China trade deal provided a favorable backdrop for equities and impressive fourth quarter global equity returns. |
The first quarter of 2020 proved to be a wild roller-coaster ride as the year began with US investors treated to equity gains culminating in record highs on February 19, 2020. The first half of the quarter, however, belied the impact the coronavirus (COVID-19) would have on markets in a world faced with shuttered businesses and global lockdowns. Equity markets began to sell off in late February and plummeted in March. The speed and depth of market declines and reversals during the month made March 2020 one of the most volatile months on record. While equities languished, government bonds largely performed as expected as central banks cut interest rates, which lowered bond yields but sent bond prices soaring. Like equities, however, corporate bond prices fell due to the impact of diminished corporate profits. Commodity prices, sans gold, largely declined during the first quarter. Oil prices suffered steep declines losing more than half their value in March amid a demand slump due to both COVID-19 and a supply glut from the Russia-Saudi Arabi oil-price war.
In response to the financial and economic hardships caused by the pandemic, central banks and governments around the world responded with fiscal and monetary stimulus. The US Federal Reserve cut interest rates to near zero (0.00-0.25%) and announced an unprecedented quantitative easing program. The US administration also passed a $2.2 trillion economic-relief package – the largest in US history. Most major economies outside of the US provided liquidity in the bond and equity markets in the form of fiscal policy and quantitative easing.
Massive global fiscal and monetary responses prompted a significant market rebound in April, with the S&P 500 Index recording one of its best monthly performances ever, despite macroeconomic data that illustrated the enormous economic cost of the shutdowns – more than 30 million US workers have lost their jobs and the US economy contracted at a 5.0% annualized rate (second estimate) for the first quarter of 2020. The final month of the reporting period also proved less volatile than March as markets attempted to normalize. As markets and investors attempt to adapt to a new normal, we’ll see how the interplay of interest rates, economic data, geopolitics and a host of other factors affect US and overseas equity and fixed income markets.
Investor uncertainty and market volatility, such as we witnessed during the reporting period, are unfortunate facts of life when it comes to investing. That’s why Invesco encourages investors to work with a professional financial adviser who can stress the importance of starting to save and invest early and the importance of adhering to a disciplined investment plan. A financial adviser who knows your unique financial situation, investment goals and risk tolerance can be an invaluable partner as you seek to achieve your financial goals. Financial advisers can also offer a long-term perspective when markets are volatile and time-tested advice and guidance when your financial situation or investment goals change.
Visit our website for more information on your investments
Our website, invesco.com/us, offers a wide range of market insights and investment perspectives. On the website, you’ll find detailed information about our funds, including performance, holdings and portfolio manager commentaries. You can access information about your account by completing a simple, secure online registration. To do so, select “Log In” on the right side of the homepage, and then select “Register for Individual Account Access.”
In addition to the resources accessible on our website and through our mobile app, you can obtain timely updates to help you stay informed about the markets and the economy by connecting with Invesco on Twitter, LinkedIn or Facebook. You can access our blog at blog.invesco.us.com. Our goal is to provide you the information you want, when and where you want it.
Finally, I’m pleased to share with you Invesco’s commitment to both the Principles for Responsible Investment and to considering environmental, social and governance issues in our robust investment process. I invite you to learn more at invesco.com/esg.
Have questions?
For questions about your account, contact an Invesco client services representative at 800 959 4246.
All of us at Invesco look forward to serving your investment management needs. Thank you for investing with us.
Sincerely,

Andrew Schlossberg
Head of the Americas,
Senior Managing Director, Invesco Ltd.
2 Invesco Comstock Fund
| | |

Bruce Crockett | | Dear Shareholders: Among the many important lessons I’ve learned in more than 40 years in a variety of business endeavors is the value of a trusted advocate. As independent chair of the Invesco Funds Board, I can assure you that the members of the Board are strong advocates for the interests of investors in Invesco’s mutual funds. We work hard to represent your interests through oversight of the quality of the investment management services your funds receive and other matters important to your investment, including but not limited to: |
| | ∎ Ensuring that Invesco offers a diverse lineup of mutual funds that your financial adviser can use to strive to meet your financial needs as your investment goals change over time. ∎ Monitoring how the portfolio management teams of the Invesco funds are performing in light of changing economic and market conditions. |
∎ Assessing each portfolio management team’s investment performance within the context of the investment strategy described in the fund’s prospectus. |
| ∎ | | Monitoring for potential conflicts of interests that may impact the nature of the services that your funds receive. |
We believe one of the most important services we provide our fund shareholders is the annual review of the funds’ advisory and sub-advisory contracts with Invesco Advisers and its affiliates. This review is required by the Investment Company Act of 1940 and focuses on the nature and quality of the services Invesco provides as the adviser to the Invesco funds and the reasonableness of the fees that it charges for those services. Each year, we spend months carefully reviewing information received from Invesco and a variety of independent sources, such as performance and fee data prepared by Lipper, Inc. (a subsidiary of Broadridge Financial Solutions, Inc.), an independent, third-party firm widely recognized as a leader in its field. We also meet with our independent legal counsel and other independent advisers to review and help us assess the information that we have received. Our goal is to assure that you receive quality investment management services for a reasonable fee.
I trust the measures outlined above provide assurance that you have a worthy advocate when it comes to choosing the Invesco Funds.
On behalf of the Board, we look forward to continuing to represent your interests and serving your needs.
Sincerely,

Bruce L. Crockett
Independent Chair
Invesco Funds Board of Trustees
3 Invesco Comstock Fund
Management’s Discussion of Fund Performance
| | | | |
| Performance summary | |
For the fiscal year ended April 30, 2020, Class A shares of Invesco Comstock Fund (the Fund), at net asset value (NAV), underperformed the Russell 1000 Value Index, the Fund’s style-specific benchmark. Your Fund’s long-term performance appears later in this report. | |
| Fund vs. Indexes | |
| Total returns, April 30, 2019 to April 30, 2020, at net asset value (NAV). Performance shown does not include applicable contingent deferred sales charges (CDSC) or front-end sales charges, which would have reduced performance. | |
Class A Shares | | | -18.80 | % |
Class C Shares | | | -19.32 | |
Class R Shares | | | -18.95 | |
Class Y Shares | | | -18.59 | |
Class R5 Shares | | | -18.50 | |
Class R6 Shares | | | -18.46 | |
S&P 500 Indexq (Broad Market Index) | | | 0.86 | |
Russell 1000 Value Indexq (Style-Specific Index) | | | -11.01 | |
Lipper Large-Cap Value Funds Index∎ (Peer Group Index) | | | -10.38 | |
Source(s): qRIMES Technologies Corp.; ∎Lipper Inc. | | | | |
Market conditions and your Fund
Although the S&P 500 Index, considered representative of the US stock market, posted modest gains for the second quarter of 2019, US equities experienced increased volatility. After four consecutive months of rising stock prices, markets sold off in May 2019, along with bond yields and oil prices, as investors weighed the impact of the lingering trade war between the US and China, as well as potential tariffs imposed on Mexico. In addition, economic data showed a slowing domestic and global economy.
Key issues that concerned investors in the second quarter of 2019 carried over into the third quarter. The US-China trade conflict worried investors and stifled business investment, even as the US Federal Reserve (the Fed) cut interest rates by 0.25% in July and again in September 2019.1 This environment, combined with evidence of slowing global economic growth, fueled market volatility in August 2019. The US Treasury yield curve inverted several times, increasing fears of a possible US recession. As a result, August saw increased risk aversion, with investors crowding into asset classes perceived as safe havens, such as US Treasuries and gold. However, the Fed’s accommodative tone provided some support for risk assets.
Macroeconomic issues that concerned investors in the third quarter of 2019 mostly abated during the fourth quarter, providing the backdrop for strong equity market returns. The US economy rose higher than expected, at 2.1% during the third quarter of 2019.2 During its October meeting, the Fed cut interest rates again by 0.25% based on business investment and exports remaining weak.1 Investors were also encouraged by a resilient US economy and corporate earnings, putting the US equity market on track for its largest annual rise since 2013.
During the first quarter of 2020, as the spread of the new coronavirus disrupted travel and suppressed consumer activity, investors became increasingly concerned about the global economy. At the same time, oil prices fell sharply as a price war between Saudi Arabia and Russia threatened to boost supply even as demand was falling. Beginning in late February, equity markets declined sharply and quickly, ushering in the first bear market since the financial crisis of 2008. Though the equity market stabilized somewhat toward the end of March, all sectors declined during the downturn. Cyclical sectors, where company performance tends to be closely linked to macroeconomic changes in the business cycle, were the hardest hit. As expected, the US economy reported dismal numbers. At the close of the fiscal year in April, US unemployment numbers continued to climb, with over 30 million Americans seeking unemployment benefits since March 2020.3 In addition, the second gross domestic product estimate for the first quarter of 2020 saw the economy shrink by 5.0%, the sharpest drop since the 2008 financial crisis.2
On the positive side, stock selection within the information technology sector was the largest driver of the Fund’s performance relative to the style-specific benchmark for the fiscal year. Most notably, Microsoft was a top performer within the sector. The company beat earnings estimates in multiple quarters and provided strong guidance. Microsoft has benefited from predictable growth in both their cloud business and cloud-computing service Azure, as well as sustained demand for Office 365.
Having little exposure to the real estate sector boosted the Fund’s relative returns for the fiscal year. Real estate underperformed most sectors, with underperformance mostly driven during the first quarter of 2020.
Cash also assisted Fund performance relative to its style-specific benchmark for the fiscal year, as would be expected in a negative equity market environment.
On the negative side, stock selection in and overweight exposure to the energy sector was the largest detractor from the Fund’s relative performance for the fiscal year. Marathon Petroleum, Ovintiv and Suncor Energy were large detractors on a relative and absolute basis. We sold our position in Ovintiv before the close of the fiscal year to fund more attractive investment opportunities. The energy sector was the worst performing sector for the fiscal year, as oil prices experienced an unprecedented “double black-swan event” with Saudi Arabia and Russia increasing oil supply to gain market share and global demand for oil falling sharply due to the COVID-19 virus. We believe COVID-19 effects should ease, allowing business activity to resume, which should support demand. With respect to supply, oil prices aren’t sustainable at current levels, but we believe it may be many months before the imbalance is corrected. We continue to focus on balance sheets and debt levels for the Fund’s energy holdings.
Stock selection in the consumer discretionary sector also detracted from relative Fund performance. Carnival, a large cruise operator, was a notable detractor from Fund performance compared to the style-specific benchmark for the fiscal year as the cruise industry was hit particularly hard by the coronavirus outbreak due primarily to lack of demand for bookings. We sold our position in the stock due to weak guidance from management for demand going forward, as well as concern for the debt level and lack of revenues.
Financials also hampered the Fund’s relative performance for the fiscal year. The precipitous decline in interest rates during the height of the COVID-19 pandemic, from already low levels, weighed heavily on the financials sector. As a result, many bank stocks were trading at valuations last seen at the depth of the 2008 financial crisis. This is despite sweeping changes since that period, such as improved balance sheets, lower leverage and solid capital positions. Given these changes, we believe banks have rarely been better positioned to withstand a crisis and thus offer compelling value at current valuations.
We used currency forward contracts during the fiscal year for the purpose of hedging currency exposure of non-US-based companies held in the Fund. Derivatives were used solely for the purpose of hedging and not for speculative purposes or leverage. The use of currency forward contracts had a positive impact on the Fund’s performance relative to the Russell 1000 Value Index for the year.
4 Invesco Comstock Fund
At the end of the fiscal year, relative to the style-specific benchmark, the Fund had a cyclical bias with overweight exposures to financial, energy and industrial companies. The Fund was also overweight in technology stocks. Conversely, the Fund had underweight exposure to the real estate, utilities, communication services, consumer staples and health care sectors relative to the style-specific benchmark.
Based on history and our experience, we believe a shift toward value stocks lies on the other side of this fear, momentum and growth-driven market environment. When we are faced with situations such as the current environment, our discipline is to be opportunistic by depending heavily on fundamentals, demanding a deep discount to intrinsic value and maintaining a long-term view.
Thank you for your investment in Invesco Comstock Fund and for sharing our long-term investment horizon.
1 Source: US Federal Reserve
2 Source: US Bureau of Economic Analysis
3 Source: The Associated Press
Portfolio managers:
Devin Armstrong - Lead
Charles DyReyes
Kevin Holt - Lead
James (Jay) Warwick
The views and opinions expressed in management’s discussion of Fund performance are those of Invesco Advisers, Inc. These views and opinions are subject to change at any time based on factors such as market and economic conditions. These views and opinions may not be relied upon as investment advice or recommendations, or as an offer for a particular security. The information is not a complete analysis of every aspect of any market, country, industry, security or the Fund. Statements of fact are from sources considered reliable, but Invesco Advisers, Inc. makes no representation or warranty as to their completeness or accuracy. Although historical performance is no guarantee of future results, these insights may help you understand our investment management philosophy.
See important Fund and, if applicable, index disclosures later in this report.
5 Invesco Comstock Fund
Your Fund’s Long-Term Performance
Results of a $10,000 Investment – Oldest Share Class(es)
Fund and index data from 4/30/10
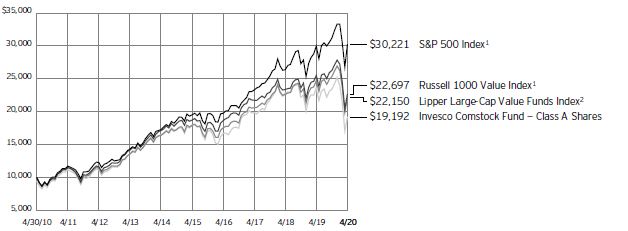
1 Source: RIMES Technologies Corp.
2 Source: Lipper Inc.
Past performance cannot guarantee future results.
The data shown in the chart include reinvested distributions, applicable sales charges and Fund expenses including management
fees. Index results include reinvested dividends, but they do not reflect sales charges. Performance of the peer group, if applicable, reflects fund expenses and management fees;
performance of a market index does not. Performance shown in the chart does not reflect deduction of taxes a shareholder would pay on Fund distributions or sale of Fund shares.
6 Invesco Comstock Fund
| | | | |
| Average Annual Total Returns | |
| As of 4/30/20, including maximum applicable sales charges | |
| |
| Class A Shares | | | | |
| Inception (10/7/68) | | | 10.02 | % |
| 10 Years | | | 6.74 | |
5 Years | | | 0.17 | |
1 Year | | | -23.28 | |
| |
| Class C Shares | | | | |
| Inception (10/26/93) | | | 8.29 | % |
| 10 Years | | | 6.55 | |
5 Years | | | 0.58 | |
1 Year | | | -20.07 | |
| |
| Class R Shares | | | | |
| Inception (10/1/02) | | | 7.24 | % |
| 10 Years | | | 7.08 | |
5 Years | | | 1.07 | |
1 Year | | | -18.95 | |
| |
| Class Y Shares | | | | |
| Inception (10/29/04) | | | 5.84 | % |
| 10 Years | | | 7.61 | |
5 Years | | | 1.58 | |
1 Year | | | -18.59 | |
| |
| Class R5 Shares | | | | |
| 10 Years | | | 7.71 | % |
5 Years | | | 1.65 | |
1 Year | | | -18.50 | |
| |
| Class R6 Shares | | | | |
| 10 Years | | | 7.69 | % |
5 Years | | | 1.75 | |
1 Year | | | -18.46 | |
Effective June 1, 2010, Class A, Class C, Class I and Class R shares of the predecessor fund, Van Kampen Comstock Fund, advised by Van Kampen Asset Management were reorganized into Class A, Class C, Class Y and Class R shares, respectively, of Invesco Van Kampen Comstock Fund (renamed Invesco Comstock Fund). Returns shown above, prior to June 1, 2010, for Class A, Class C, Class R and Class Y shares are blended returns of the predecessor fund and Invesco Comstock Fund. Share class returns will differ from the predecessor fund because of different expenses.
Class R5 shares incepted on June 1, 2010. Performance shown prior to that date is that of the predecessor fund’s Class A shares and includes the 12b-1 fees applicable to Class A shares.
Class R6 shares incepted on September 24, 2012. Performance shown prior to that date is that of the Fund’s and the predecessor fund’s Class A shares and includes the 12b-1 fees applicable to Class A shares.
The performance data quoted represent past performance and cannot guarantee future results; current performance may be lower or higher. Please visit invesco.com/
performance for the most recent month-end performance. Performance figures reflect reinvested distributions, changes in net asset value and the effect of the maximum sales charge unless otherwise stated. Performance figures do not reflect deduction of taxes a shareholder would pay on Fund distributions or sale of Fund shares. Investment return and principal value will fluctuate so that you may have a gain or loss when you sell shares.
Class A share performance reflects the maximum 5.50% sales charge, and Class C share performance reflects the applicable contingent deferred sales charge (CDSC) for the period involved. The CDSC on Class C shares is 1% for the first year after purchase. Class R, Class Y, Class R5 and Class R6 shares do not have a front-end sales charge or a CDSC; therefore, performance is at net asset value.
The performance of the Fund’s share classes will differ primarily due to different sales charge structures and class expenses.
Fund performance reflects any applicable fee waivers and/or expense reimbursements. Had the adviser not waived fees and/or reimbursed expenses currently or in the past, returns would have been lower. See current prospectus for more information.
7 Invesco Comstock Fund
Invesco Comstock Fund’s investment objective is total return through growth of capital and current income.
| ∎ | | Unless otherwise stated, information presented in this report is as of April 30, 2020, and is based on total net assets. |
| ∎ | | Unless otherwise noted, all data provided by Invesco. |
| ∎ | | To access your Fund’s reports/prospectus, visit invesco.com/fundreports. |
About indexes used in this report
| ∎ | | The S&P 500® Index is an unmanaged index considered representative of the US stock market. |
| ∎ | | The Russell 1000® Value Index is an unmanaged index considered representative of large-cap value stocks. The Russell 1000 Value Index is a trademark/service mark of the Frank Russell Co. Russell® is a trademark of the Frank Russell Co. |
| ∎ | | The Lipper Large-Cap Value Funds Index is an unmanaged index considered representative of large-cap value funds tracked by Lipper. |
| ∎ | | The Fund is not managed to track the performance of any particular index, including the index(es) described here, and consequently, the performance of the Fund may deviate significantly from the performance of the index(es). |
| ∎ | | A direct investment cannot be made in an index. Unless otherwise indicated, index results include reinvested dividends, and they do not reflect sales charges. Performance of the peer group, if applicable, reflects fund expenses; performance of a market index does not. |
Liquidity Risk Management Program
The Securities and Exchange Commission has adopted Rule 22e-4 under the Investment Company Act of 1940 (the “Liquidity Rule”) in order to promote effective liquidity risk management throughout the open-end investment company industry, thereby reducing the risk that funds will be unable to meet their redemption obligations and mitigating dilution of the interests of fund shareholders. The Fund has adopted and implemented a liquidity risk management program in accordance with the Liquidity Rule (the “Program”). The Program is reasonably designed to assess and manage the Fund’s liquidity risk, which is the risk that the Fund could not meet redemption requests without significant dilution of remaining investors’ interests in the Fund. The Board of Trustees of the Fund (the “Board”) has appointed Invesco Advisers, Inc. (“Invesco”), the Fund’s investment adviser, as the Program’s administrator, and Invesco has delegated oversight of the Program to the Liquidity Risk Management Committee (the “Committee”), which is composed of senior representatives from relevant business groups at Invesco.
As required by the Liquidity Rule, the Program includes policies and procedures providing for an assessment, no less frequently than annually, of the Fund’s liquidity risk that takes into account, as relevant to the Fund’s liquidity risk: (1) the Fund’s investment strategy and liquidity of portfolio investments during both normal and reasonably foreseeable stressed conditions; (2) short-term and long-term cash flow projections for the Fund during both normal and reasonably foreseeable stressed conditions; and (3) the Fund’s holdings of cash and cash equivalents and any borrowing arrangements. The Liquidity Rule also requires the classification of the Fund’s investments into categories that reflect the assessment of their relative liquidity under current market conditions. The Fund classifies its investments into one of four categories defined in the Liquidity Rule: “Highly Liquid,” “Moderately Liquid,” “Less Liquid” and “Illiquid.” Funds that are not invested primarily in “Highly Liquid Investments” that are assets (cash or investments that are reasonably expected to be convertible into cash within three business days without significantly changing the market value of the investment) are required to establish a “Highly Liquid Investment Minimum” (“HLIM”), which is the minimum percentage of net assets that must be invested in Highly Liquid Investments. Funds with HLIMs have procedures for addressing HLIM shortfalls, including reporting to the Board and the SEC (on a non-public basis) as required by the Program and the Liquidity Rule. In addition, the Fund may not acquire an investment if, immediately after the acquisition, over 15% of the Fund’s net assets would consist of “Illiquid Investments” that are assets (an investment that cannot reasonably be expected to be sold or disposed of in current market conditions in seven calendar days or less without the sale or disposition significantly changing the market value of the investment). The Liquidity Rule and the Program also require reporting to the Board and the SEC (on a non-public basis) if a Fund’s holdings of Illiquid Investments exceed 15% of the Fund’s assets.
At a meeting held on March 30-April 1, 2020, the Committee presented a report to the Board that addressed the operation
of the Program and assessed the Program’s adequacy and effectiveness of implementation (the “Report”). The Report covered the period from December 1, 2018 through December 31, 2019 (the “Program Reporting Period”).
The Report stated, in relevant part, that during the Program Reporting Period:
| ∎ | | The Program, as adopted and implemented, remained reasonably designed to assess and manage the Fund’s liquidity risk and was operated effectively to achieve that goal; |
| ∎ | | The Fund’s investment strategy remained appropriate for an open-end fund; |
| ∎ | | The Fund was able to meet requests for redemption without significant dilution of remaining investors’ interests in the Fund; |
| ∎ | | The Fund did not breach the 15% limit on Illiquid Investments; and |
| ∎ | | The Fund primarily held Highly Liquid Investments and therefore has not adopted an HLIM. |
|
This report must be accompanied or preceded by a currently effective Fund prospectus, which contains more complete information, including sales charges and expenses. Investors should read it carefully before investing. |
|
| NOT FDIC INSURED | MAY LOSE VALUE | NO BANK GUARANTEE |
8 Invesco Comstock Fund
Fund Information
Portfolio Composition
| | | | | |
| By sector | | % of total net assets |
| |
Financials | | | | 27.24 | % |
Health Care | | | | 13.38 | |
Energy | | | | 12.26 | |
Information Technology | | | | 11.26 | |
Industrials | | | | 10.83 | |
Consumer Staples | | | | 5.80 | |
Materials | | | | 4.96 | |
Consumer Discretionary | | | | 4.53 | |
Communication Services | | | | 3.60 | |
Utilities | | | | 2.98 | |
Real Estate | | | | 0.35 | |
Money Market Funds Plus Other Assets Less Liabilities | | | | 2.81 | |
Top 10 Equity Holdings*
| | | | | | | |
| | | | | % of total net assets |
| | |
1. | | Citigroup, Inc. | | | | 4.52 | % |
2. | | Bank of America Corp. | | | | 4.22 | |
3. | | Philip Morris International, Inc. | | | | 2.98 | |
4. | | Anthem, Inc. | | | | 2.75 | |
5. | | Chevron Corp. | | | | 2.55 | |
6. | | Morgan Stanley | | | | 2.47 | |
7. | | Intel Corp. | | | | 2.40 | |
8. | | Microsoft Corp. | | | | 2.22 | |
9. | | Sanofi, ADR | | | | 2.16 | |
10. | | General Motors Co. | | | | 1.90 | |
The Fund’s holdings are subject to change, and there is no assurance that the Fund will continue to hold any particular security.
* Excluding money market fund holdings, if any.
Data presented here are as of April 30, 2020.
9 Invesco Comstock Fund
Schedule of Investments(a)
April 30, 2020
| | | | | | |
| | | Shares | | | Value |
Common Stocks & Other Equity Interests–97.19% |
Aerospace & Defense–1.10% |
Textron, Inc. | | | 3,606,634 | | | $ 95,070,872 |
|
| Agricultural Products–1.53% |
Archer-Daniels-Midland Co. | | | 3,556,692 | | | 132,095,541 |
|
| Air Freight & Logistics–1.55% |
FedEx Corp. | | | 1,056,379 | | | 133,917,166 |
|
| Asset Management & Custody Banks–3.29% |
Bank of New York Mellon Corp. (The) | | | 3,497,503 | | | 131,296,263 |
State Street Corp. | | | 2,420,605 | | | 152,594,939 |
| | | | | | | 283,891,202 |
|
| Automobile Manufacturers–1.90% |
General Motors Co.(b) | | | 7,372,226 | | | 164,326,917 |
|
| Building Products–1.96% |
Johnson Controls International PLC | | | 3,725,201 | | | 108,440,601 |
Trane Technologies PLC | | | 695,094 | | | 60,765,118 |
| | | | | | | 169,205,719 |
|
| Cable & Satellite–1.33% |
Comcast Corp., Class A | | | 3,052,071 | | | 114,849,432 |
|
| Casinos & Gaming–0.71% |
Las Vegas Sands Corp.(b) | | | 1,273,745 | | | 61,165,235 |
|
| Communications Equipment–1.84% |
Cisco Systems, Inc. | | | 3,746,420 | | | 158,773,280 |
|
| Construction Machinery & Heavy Trucks–1.68% |
Caterpillar, Inc. | | | 1,242,410 | | | 144,591,676 |
|
| Consumer Finance–0.61% |
Ally Financial, Inc. | | | 3,211,045 | | | 52,629,028 |
|
| Diversified Banks–11.96% |
Bank of America Corp. | | | 15,135,214 | | | 364,001,897 |
Citigroup, Inc. | | | 8,030,904 | | | 389,980,698 |
JPMorgan Chase & Co. | | | 1,685,522 | | | 161,405,587 |
Wells Fargo & Co. | | | 4,016,018 | | | 116,665,323 |
| | | | | | | 1,032,053,505 |
|
| Electric Utilities–1.63% |
Exelon Corp. | | | 3,791,398 | | | 140,585,038 |
|
| Electrical Components & Equipment–3.44% |
Eaton Corp. PLC | | | 1,722,600 | | | 143,837,100 |
Emerson Electric Co. | | | 2,677,000 | | | 152,669,310 |
| | | | | | | 296,506,410 |
|
| Fertilizers & Agricultural Chemicals–2.72% |
CF Industries Holdings, Inc. | | | 4,125,751 | | | 113,458,152 |
Corteva, Inc. | | | 4,644,483 | | | 121,639,010 |
| | | | | | | 235,097,162 |
|
| Health Care Distributors–2.01% |
Cardinal Health, Inc. | | | 676,763 | | | 33,486,233 |
McKesson Corp. | | | 994,211 | | | 140,432,304 |
| | | | | | | 173,918,537 |
| | | | | | |
| | | | Shares | | | Value |
Health Care Facilities–1.25% |
HCA Healthcare, Inc.(b) | | | 979,904 | | | $ 107,671,851 |
|
| Health Care Services–1.46% |
CVS Health Corp. | | | 2,045,135 | | | 125,878,059 |
|
| Hotel & Resort REITs–0.35% |
Host Hotels & Resorts, Inc. | | | 2,459,168 | | | 30,272,358 |
|
| Independent Power Producers & Energy Traders–1.35% |
Vistra Energy Corp. | | | 5,957,912 | | | 116,417,600 |
|
| Industrial Conglomerates–1.11% |
General Electric Co. | | | 14,076,486 | | | 95,720,105 |
|
| Integrated Oil & Gas–6.21% |
BP PLC, ADR (United Kingdom) | | | 6,305,729 | | | 150,076,350 |
Chevron Corp. | | | 2,395,764 | | | 220,410,288 |
Royal Dutch Shell PLC, Class A, ADR (United Kingdom) | | | 1,052,778 | | | 34,878,535 |
Suncor Energy, Inc. (Canada) | | | 7,335,948 | | | 130,946,672 |
| | | | | | | 536,311,845 |
|
| Integrated Telecommunication Services–1.63% |
AT&T, Inc. | | | 4,630,227 | | | 141,083,017 |
|
| Internet & Direct Marketing Retail–1.92% |
Booking Holdings, Inc.(b) | | | 36,225 | | | 53,633,648 |
eBay, Inc. | | | 2,810,163 | | | 111,928,792 |
| | | | | | | 165,562,440 |
|
| Investment Banking & Brokerage–4.07% |
Goldman Sachs Group, Inc. (The) | | | 752,534 | | | 138,029,786 |
Morgan Stanley | | | 5,407,322 | | | 213,210,707 |
| | | | | | | 351,240,493 |
|
| IT Consulting & Other Services–1.81% |
Cognizant Technology Solutions Corp., Class A | | | 2,687,800 | | | 155,946,156 |
|
| Life & Health Insurance–1.10% |
MetLife, Inc. | | | 2,624,388 | | | 94,687,919 |
|
| Managed Health Care–2.75% |
Anthem, Inc. | | | 846,363 | | | 237,599,485 |
|
| Multi-line Insurance–1.80% |
American International Group, Inc. | | | 6,097,976 | | | 155,071,530 |
|
| Oil & Gas Exploration & Production–6.05% |
Canadian Natural Resources Ltd. (Canada) | | | 4,397,761 | | | 73,646,186 |
Devon Energy Corp. | | | 7,496,868 | | | 93,485,944 |
Hess Corp. | | | 2,896,490 | | | 140,885,274 |
Marathon Oil Corp. | | | 17,199,977 | | | 105,263,859 |
Noble Energy, Inc. | | | 6,271,655 | | | 61,524,935 |
Pioneer Natural Resources Co. | | | 529,625 | | | 47,300,809 |
| | | | | | | 522,107,007 |
|
| Paper Packaging–1.49% |
International Paper Co. | | | 3,746,290 | | | 128,310,432 |
See accompanying Notes to Financial Statements which are an integral part of the financial statements.
10 Invesco Comstock Fund
| | | | | | |
| | | Shares | | | Value |
Pharmaceuticals–5.91% |
Bristol-Myers Squibb Co. | | | 2,622,292 | | | $ 159,461,576 |
Johnson & Johnson | | | 1,092,359 | | | 163,897,544 |
Sanofi, ADR (France) | | | 3,985,979 | | | 186,663,397 |
| | | | | | | 510,022,517 |
|
| Property & Casualty Insurance–1.48% |
Allstate Corp. (The) | | | 1,260,220 | | | 128,189,578 |
|
| Regional Banks–2.94% |
Citizens Financial Group, Inc. | | | 4,085,212 | | | 91,467,897 |
Fifth Third Bancorp | | | 5,030,530 | | | 94,020,606 |
PNC Financial Services Group, Inc. (The) | | | 636,308 | | | 67,874,974 |
| | | | | | | 253,363,477 |
|
| Semiconductors–5.39% |
Intel Corp. | | | 3,456,626 | | | 207,328,428 |
NXP Semiconductors N.V. (Netherlands) | | | 952,379 | | | 94,828,377 |
QUALCOMM, Inc. | | | 2,073,454 | | | 163,118,626 |
| | | | | | | 465,275,431 |
|
| Specialty Chemicals–0.74% |
DuPont de Nemours, Inc. | | | 1,364,459 | | | 64,156,862 |
|
| Systems Software–2.22% |
Microsoft Corp. | | | 1,069,822 | | | 191,722,801 |
| | | | | | |
| | | | Shares | | | Value |
Tobacco–4.27% |
Altria Group, Inc. | | | 2,836,769 | | | $ 111,343,183 |
Philip Morris International, Inc. | | | 3,445,097 | | | 257,004,236 |
| | | | | | | 368,347,419 |
|
| Wireless Telecommunication Services–0.63% |
Vodafone Group PLC (United Kingdom) | | | 38,501,999 | | | 54,443,431 |
Total Common Stocks & Other Equity Interests
(Cost $7,839,233,639) | | | 8,388,078,533 |
|
Money Market Funds–2.32% |
Invesco Government & Agency Portfolio, Institutional Class, 0.20%(c)(d) | | | 69,472,866 | | | 69,472,866 |
Invesco Liquid Assets Portfolio, Institutional Class, 0.60%(c)(d) | | | 50,821,583 | | | 50,852,076 |
Invesco Treasury Portfolio, Institutional Class, 0.10%(c)(d) | | | 79,397,562 | | | 79,397,562 |
Total Money Market Funds
(Cost $199,676,019) | | | 199,722,504 |
TOTAL INVESTMENTS IN
SECURITIES–99.51%
(Cost $8,038,909,658) | | | 8,587,801,037 |
OTHER ASSETS LESS LIABILITIES–0.49% | | | 42,669,631 |
NET ASSETS–100.00% | | | | | | $8,630,470,668 |
|
| Investment Abbreviations: |
|
| ADR - American Depositary Receipt |
| REIT - Real Estate Investment Trust |
|
| Notes to Schedule of Investments: |
| (a) | Industry and/or sector classifications used in this report are generally according to the Global Industry Classification Standard, which was developed by and is the exclusive property and a service mark of MSCI Inc. and Standard & Poor’s. |
| (b) | Non-income producing security. |
| (c) | Affiliated issuer. The issuer and/or the Fund is a wholly-owned subsidiary of Invesco Ltd., or is affiliated by having an investment adviser that is under common control of Invesco Ltd. The table below shows the Fund’s transactions in, and earnings from, its investments in affiliates for the fiscal year ended April 30, 2020. |
| | | | | | | | | | | | | | | | | | | | | | | | | | | | |
| | | Value
April 30, 2019 | | | Purchases at Cost | | | Proceeds from Sales | | | Change in
Unrealized
Appreciation | | | Realized
Gain | | | Value
April 30, 2020 | | | Dividend
Income | |
Investments in Affiliated Money Market Funds: | | | | | | | | | | | | | | | | | | | | | | | | | | | | |
Invesco Government & Agency Portfolio, Institutional Class | | $ | 270,614,086 | | | $ | 555,518,705 | | | $ | (756,659,925 | ) | | | $ - | | | | $ - | | | $ | 69,472,866 | | | $ | 3,807,934 | |
Invesco Liquid Assets Portfolio, Institutional Class | | | 193,323,983 | | | | 401,455,236 | | | | (543,957,934 | ) | | | 23,212 | | | | 7,579 | | | | 50,852,076 | | | | 2,984,528 | |
Invesco Treasury Portfolio, Institutional Class | | | 309,273,240 | | | | 634,878,520 | | | | (864,754,198 | ) | | | - | | | | - | | | | 79,397,562 | | | | 4,256,538 | |
Total | | $ | 773,211,309 | | | $ | 1,591,852,461 | | | $ | (2,165,372,057 | ) | | | $23,212 | | | | $7,579 | | | $ | 199,722,504 | | | $ | 11,049,000 | |
| (d) | The rate shown is the 7-day SEC standardized yield as of April 30, 2020. |
| | | | | | | | | | | | | | | | | | | | | | |
| Open Forward Foreign Currency Contracts | |
| |
| | | | |
| Settlement | | | | | | | Contract to | | | Unrealized
Appreciation | |
Date | | Counterparty | | | | | Deliver | | | | | | Receive | | | (Depreciation) | |
| |
Currency Risk | | | | | | | | | | | | | | | | | | | | | | |
| |
05/15/2020 | | Goldman Sachs International | | | GBP | | | | 2,264,094 | | | | USD | | | | 2,852,099 | | | $ | 378 | |
| |
05/15/2020 | | Goldman Sachs International | | | USD | | | | 9,007,519 | | | | CAD | | | | 12,618,345 | | | | 57,759 | |
| |
05/15/2020 | | Goldman Sachs International | | | USD | | | | 43,837,714 | | | | EUR | | | | 40,012,956 | | | | 18,268 | |
| |
05/15/2020 | | Goldman Sachs International | | | USD | | | | 8,786,327 | | | | GBP | | | | 7,027,937 | | | | 65,651 | |
| |
05/15/2020 | | Royal Bank of Canada | | | CAD | | | | 6,695,375 | | | | USD | | | | 4,823,063 | | | | 12,969 | |
| |
05/15/2020 | | Royal Bank of Canada | | | USD | | | | 3,907,881 | | | | CAD | | | | 5,543,278 | | | | 74,523 | |
| |
05/15/2020 | | Royal Bank of Canada | | | USD | | | | 6,164,701 | | | | EUR | | | | 5,665,556 | | | | 45,000 | |
| |
See accompanying Notes to Financial Statements which are an integral part of the financial statements.
11 Invesco Comstock Fund
| | | | | | | | | | | | | | | | | | | | | | |
| Open Forward Foreign Currency Contracts–(continued) | |
| |
| Settlement | | | | | | | Contract to | | | Unrealized Appreciation | |
Date | | Counterparty | | | | | Deliver | | | | | | Receive | | | (Depreciation) | |
| |
05/15/2020 | | State Street Bank & Trust Co. | | | USD | | | | 5,541,823 | | | | GBP | | | | 4,496,594 | | | $ | 121,824 | |
| |
Subtotal–Appreciation | | | | | | | | | | | | | | | | | | | 396,372 | |
| |
| | | | | | |
Currency Risk | | | | | | | | | | | | | | | | | | | | | | |
| |
05/15/2020 | | Canadian Imperial Bank of Commerce | | | CAD | | | | 19,299,471 | | | | USD | | | | 13,839,111 | | | | (26,024 | ) |
| |
05/15/2020 | | Canadian Imperial Bank of Commerce | | | EUR | | | | 141,592,232 | | | | USD | | | | 154,012,279 | | | | (1,179,117 | ) |
| |
05/15/2020 | | Deutsche Bank AG | | | CAD | | | | 123,223,183 | | | | USD | | | | 87,445,044 | | | | (1,081,015 | ) |
| |
05/15/2020 | | Deutsche Bank AG | | | EUR | | | | 7,673,495 | | | | USD | | | | 8,340,713 | | | | (69,779 | ) |
| |
05/15/2020 | | Deutsche Bank AG | | | GBP | | | | 84,081,871 | | | | USD | | | | 104,673,771 | | | | (1,230,829 | ) |
| |
05/15/2020 | | Goldman Sachs International | | | CAD | | | | 2,805,753 | | | | USD | | | | 1,990,352 | | | | (25,359 | ) |
| |
05/15/2020 | | Goldman Sachs International | | | EUR | | | | 4,031,142 | | | | USD | | | | 4,367,097 | | | | (51,214 | ) |
| |
05/15/2020 | | Goldman Sachs International | | | GBP | | | | 8,879,393 | | | | USD | | | | 10,999,524 | | | | (184,440 | ) |
| |
05/15/2020 | | Royal Bank of Canada | | | CAD | | | | 16,351,069 | | | | USD | | | | 11,592,530 | | | | (154,413 | ) |
| |
05/15/2020 | | Royal Bank of Canada | | | GBP | | | | 2,841,632 | | | | USD | | | | 3,532,407 | | | | (46,746 | ) |
| |
Subtotal–Depreciation | | | | | | | | | | | | | | | | | | | (4,048,936 | ) |
| |
Total Forward Foreign Currency Contracts | | | | | | | | | | | | | | | | | | $ | (3,652,564 | ) |
| |
Abbreviations:
CAD - Canadian Dollar
EUR - Euro
GBP - British Pound Sterling
USD - U.S. Dollar
See accompanying Notes to Financial Statements which are an integral part of the financial statements.
12 Invesco Comstock Fund
Statement of Assets and Liabilities
April 30, 2020
| | | | |
Assets: | | | | |
Investments in securities, at value
(Cost $7,839,233,639) | | $ | 8,388,078,533 | |
Investments in affiliated money market funds, at value
(Cost $199,676,019) | | | 199,722,504 | |
Other investments: | | | | |
Unrealized appreciation on forward foreign currency contracts outstanding | | | 396,372 | |
Cash | | | 29,957 | |
Foreign currencies, at value
(Cost $535) | | | 542 | |
Receivable for: | | | | |
Investments sold | | | 100,185,731 | |
Fund shares sold | | | 4,081,983 | |
Dividends | | | 20,031,563 | |
Investment for trustee deferred compensation and retirement plans | | | 829,160 | |
Other assets | | | 94,271 | |
Total assets | | | 8,713,450,616 | |
| |
Liabilities: | | | | |
Other investments: | | | | |
Unrealized depreciation on forward foreign currency contracts outstanding | | | 4,048,936 | |
Payable for: | | | | |
Investments purchased | | | 56,502,818 | |
Fund shares reacquired | | | 16,650,675 | |
Accrued fees to affiliates | | | 3,789,535 | |
Accrued trustees’ and officers’ fees and benefits | | | 3,357 | |
Accrued other operating expenses | | | 1,026,539 | |
Trustee deferred compensation and retirement plans | | | 958,088 | |
Total liabilities | | | 82,979,948 | |
Net assets applicable to shares outstanding | | $ | 8,630,470,668 | |
| |
Net assets consist of: | | | | |
Shares of beneficial interest | | $ | 8,294,699,280 | |
Distributable earnings | | | 335,771,388 | |
| | | $ | 8,630,470,668 | |
| | | | |
Net Assets: | | | | |
Class A | | $ | 4,512,553,025 | |
Class C | | $ | 96,492,339 | |
Class R | | $ | 133,185,630 | |
Class Y | | $ | 1,179,054,788 | |
Class R5 | | $ | 440,297,861 | |
Class R6 | | $ | 2,268,887,025 | |
|
Shares outstanding, no par value, with an unlimited number of shares authorized: | |
Class A | | | 238,184,296 | |
Class C | | | 5,091,011 | |
Class R | | | 7,028,882 | |
Class Y | | | 62,232,707 | |
Class R5 | | | 23,260,058 | |
Class R6 | | | 119,896,494 | |
Class A: | | | | |
Net asset value per share | | $ | 18.95 | |
Maximum offering price per share
(Net asset value of $18.95 ÷ 94.50%) | | $ | 20.05 | |
Class C: | | | | |
Net asset value and offering price per share | | $ | 18.95 | |
Class R: | | | | |
Net asset value and offering price per share | | $ | 18.95 | |
Class Y: | | | | |
Net asset value and offering price per share | | $ | 18.95 | |
Class R5: | | | | |
Net asset value and offering price per share | | $ | 18.93 | |
Class R6: | | | | |
Net asset value and offering price per share | | $ | 18.92 | |
See accompanying Notes to Financial Statements which are an integral part of the financial statements.
13 Invesco Comstock Fund
Statement of Operations
For the year ended April 30, 2020
| | | | |
Investment income: | | | | |
Dividends (net of foreign withholding taxes of $6,941,484) | | $ | 312,488,454 | |
| |
Dividends from affiliates (includes securities lending income of $813,764) | | | 11,862,764 | |
| |
Total investment income | | | 324,351,218 | |
| |
| |
Expenses: | | | | |
Advisory fees | | | 41,036,491 | |
| |
Administrative services fees | | | 1,630,170 | |
| |
Custodian fees | | | 177,899 | |
| |
Distribution fees: | | | | |
Class A | | | 14,326,793 | |
| |
Class C | | | 1,224,977 | |
| |
Class R | | | 899,928 | |
| |
Transfer agent fees – A, C, R and Y | | | 12,848,365 | |
| |
Transfer agent fees – R5 | | | 580,684 | |
| |
Transfer agent fees – R6 | | | 139,941 | |
| |
Trustees’ and officers’ fees and benefits | | | 136,999 | |
| |
Registration and filing fees | | | 223,309 | |
| |
Reports to shareholders | | | 888,771 | |
| |
Professional services fees | | | 197,414 | |
| |
Other | | | 202,513 | |
| |
Total expenses | | | 74,514,254 | |
| |
Less: Fees waived and/or expense offset arrangement(s) | | | (737,983 | ) |
| |
Net expenses | | | 73,776,271 | |
| |
Net investment income | | | 250,574,947 | |
| |
| |
Realized and unrealized gain (loss) from: | | | | |
Net realized gain (loss) from: | | | | |
Investment securities | | | (26,984,476 | ) |
| |
Foreign currencies | | | 237,717 | |
| |
Forward foreign currency contracts | | | 29,627,653 | |
| |
| | | 2,880,894 | |
| |
Change in net unrealized appreciation (depreciation) of: | | | | |
Investment securities | | | (2,230,074,209 | ) |
| |
Foreign currencies | | | 109,956 | |
| |
Forward foreign currency contracts | | | (7,394,661 | ) |
| |
| | | (2,237,358,914 | ) |
| |
Net realized and unrealized gain (loss) | | | (2,234,478,020 | ) |
| |
Net increase (decrease) in net assets resulting from operations | | $ | (1,983,903,073 | ) |
| |
See accompanying Notes to Financial Statements which are an integral part of the financial statements.
14 Invesco Comstock Fund
Statement of Changes in Net Assets
For the years ended April 30, 2020 and 2019
| | | | | | | | |
| | | 2020 | | | 2019 | |
| |
Operations: | | | | | | | | |
Net investment income | | $ | 250,574,947 | | | $ | 232,339,505 | |
| |
Net realized gain | | | 2,880,894 | | | | 720,651,130 | |
| |
Change in net unrealized appreciation (depreciation) | | | (2,237,358,914 | ) | | | (555,280,438 | ) |
| |
Net increase (decrease) in net assets resulting from operations | | | (1,983,903,073 | ) | | | 397,710,197 | |
| |
| | |
Distributions to shareholders from distributable earnings: | | | | | | | | |
Class A | | | (444,075,331 | ) | | | (506,804,150 | ) |
| |
Class C | | | (9,094,284 | ) | | | (31,812,508 | ) |
| |
Class R | | | (13,299,334 | ) | | | (17,885,215 | ) |
| |
Class Y | | | (123,114,106 | ) | | | (155,664,704 | ) |
| |
Class R5 | | | (46,403,655 | ) | | | (59,044,636 | ) |
| |
Class R6 | | | (215,265,417 | ) | | | (249,226,391 | ) |
| |
Total distributions from distributable earnings | | | (851,252,127 | ) | | | (1,020,437,604 | ) |
| |
| | |
Share transactions-net: | | | | | | | | |
Class A | | | (313,779,950 | ) | | | 205,489,325 | |
| |
Class C | | | (27,862,399 | ) | | | (268,440,174 | ) |
| |
Class R | | | (33,881,844 | ) | | | (41,047,725 | ) |
| |
Class Y | | | (178,190,047 | ) | | | 3,974,276 | |
| |
Class R5 | | | (78,157,119 | ) | | | (33,427,639 | ) |
| |
Class R6 | | | (17,285,863 | ) | | | 518,847,087 | |
| |
Net increase (decrease) in net assets resulting from share transactions | | | (649,157,222 | ) | | | 385,395,150 | |
| |
Net increase (decrease) in net assets | | | (3,484,312,422 | ) | | | (237,332,257 | ) |
| |
| | |
Net assets: | | | | | | | | |
Beginning of year | | | 12,114,783,090 | | | | 12,352,115,347 | |
| |
End of year | | $ | 8,630,470,668 | | | $ | 12,114,783,090 | |
| |
See accompanying Notes to Financial Statements which are an integral part of the financial statements.
15 Invesco Comstock Fund
Financial Highlights
The following schedule presents financial highlights for a share of the Fund outstanding throughout the periods indicated.
| | | | | | | | | | | | | | | | | | | | | | | | | | | | | | | | | | | | | | | | | | | | | | | | | | | | | | | | |
| | | Net asset value, beginning of period | | Net investment income(a) | | Net gains (losses) on securities (both realized and unrealized) | | Total from investment operations | | Dividends from net investment income | | Distributions from net realized gains | | Total distributions | | Net asset value, end of period | | Total return (b) | | Net assets, end of period (000’s omitted) | | Ratio of expenses to average net assets with fee waivers and/or expenses absorbed | | Ratio of expenses to average net assets without fee waivers and/or expenses absorbed | | Ratio of net investment income to average net assets | | Portfolio turnover (c) |
| |
Class A | | | | | | | | | | | | | | | | | | | | | | | | | | | | | | | | | | | | | | | | | | | | | | | | | | | | | | | | |
Year ended 04/30/20 | | | $25.18 | | | | $0.51 | | | | $(4.88 | ) | | | $(4.37 | ) | | | $(0.52 | ) | | | $(1.34 | ) | | | $(1.86 | ) | | | $18.95 | | | | (18.76 | )% | | | $4,512,553 | | | | 0.82 | %(d) | | | 0.83 | %(d) | | | 2.16 | %(d) | | | 30 | % |
Year ended 04/30/19 | | | 26.67 | | | | 0.46 | | | | 0.23 | | | | 0.69 | | | | (0.41 | ) | | | (1.77 | ) | | | (2.18 | ) | | | 25.18 | | | | 3.51 | | | | 6,350,025 | | | | 0.80 | | | | 0.81 | | | | 1.79 | | | | 23 | |
Year ended 04/30/18 | | | 24.03 | | | | 0.36 | | | | 3.23 | | | | 3.59 | | | | (0.36 | ) | | | (0.59 | ) | | | (0.95 | ) | | | 26.67 | | | | 15.09 | | | | 6,433,646 | | | | 0.81 | | | | 0.81 | | | | 1.38 | | | | 14 | |
Year ended 04/30/17 | | | 21.86 | | | | 0.40 | | | | 3.61 | | | | 4.01 | | | | (0.49 | ) | | | (1.35 | ) | | | (1.84 | ) | | | 24.03 | | | | 18.56 | | | | 6,350,463 | | | | 0.84 | | | | 0.84 | | | | 1.75 | | | | 18 | |
Year ended 04/30/16 | | | 26.04 | | | | 0.44 | | | | (2.29 | ) | | | (1.85 | ) | | | (0.36 | ) | | | (1.97 | ) | | | (2.33 | ) | | | 21.86 | | | | (6.90 | ) | | | 6,613,286 | | | | 0.84 | | | | 0.85 | | | | 1.87 | | | | 15 | |
| |
Class C | | | | | | | | | | | | | | | | | | | | | | | | | | | | | | | | | | | | | | | | | | | | | | | | | | | | | | | | |
Year ended 04/30/20 | | | 25.16 | | | | 0.35 | | | | (4.87 | ) | | | (4.52 | ) | | | (0.35 | ) | | | (1.34 | ) | | | (1.69 | ) | | | 18.95 | | | | (19.32 | )(e) | | | 96,492 | | | | 1.49 | (d)(e) | | | 1.50 | (d)(e) | | | 1.49 | (d)(e) | | | 30 | |
Year ended 04/30/19 | | | 26.66 | | | | 0.27 | | | | 0.21 | | | | 0.48 | | | | (0.21 | ) | | | (1.77 | ) | | | (1.98 | ) | | | 25.16 | | | | 2.68 | (e) | | | 158,707 | | | | 1.54 | (e) | | | 1.55 | (e) | | | 1.05 | (e) | | | 23 | |
Year ended 04/30/18 | | | 24.02 | | | | 0.16 | | | | 3.24 | | | | 3.40 | | | | (0.17 | ) | | | (0.59 | ) | | | (0.76 | ) | | | 26.66 | | | | 14.24 | (e) | | | 468,225 | | | | 1.55 | (e) | | | 1.55 | (e) | | | 0.64 | (e) | | | 14 | |
Year ended 04/30/17 | | | 21.85 | | | | 0.23 | | | | 3.61 | | | | 3.84 | | | | (0.32 | ) | | | (1.35 | ) | | | (1.67 | ) | | | 24.02 | | | | 17.70 | | | | 511,920 | | | | 1.59 | | | | 1.59 | | | | 1.00 | | | | 18 | |
Year ended 04/30/16 | | | 26.03 | | | | 0.27 | | | | (2.29 | ) | | | (2.02 | ) | | | (0.19 | ) | | | (1.97 | ) | | | (2.16 | ) | | | 21.85 | | | | (7.59 | )(e) | | | 532,230 | | | | 1.56 | (e) | | | 1.57 | (e) | | | 1.15 | (e) | | | 15 | |
| |
Class R | | | | | | | | | | | | | | | | | | | | | | | | | | | | | | | | | | | | | | | | | | | | | | | | | | | | | | | | |
Year ended 04/30/20 | | | 25.17 | | | | 0.45 | | | | (4.87 | ) | | | (4.42 | ) | | | (0.46 | ) | | | (1.34 | ) | | | (1.80 | ) | | | 18.95 | | | | (18.95 | ) | | | 133,186 | | | | 1.07 | (d) | | | 1.08 | (d) | | | 1.91 | (d) | | | 30 | |
Year ended 04/30/19 | | | 26.67 | | | | 0.40 | | | | 0.21 | | | | 0.61 | | | | (0.34 | ) | | | (1.77 | ) | | | (2.11 | ) | | | 25.17 | | | | 3.20 | | | | 212,843 | | | | 1.05 | | | | 1.06 | | | | 1.54 | | | | 23 | |
Year ended 04/30/18 | | | 24.03 | | | | 0.29 | | | | 3.24 | | | | 3.53 | | | | (0.30 | ) | | | (0.59 | ) | | | (0.89 | ) | | | 26.67 | | | | 14.80 | | | | 265,368 | | | | 1.06 | | | | 1.06 | | | | 1.13 | | | | 14 | |
Year ended 04/30/17 | | | 21.86 | | | | 0.35 | | | | 3.61 | | | | 3.96 | | | | (0.44 | ) | | | (1.35 | ) | | | (1.79 | ) | | | 24.03 | | | | 18.27 | | | | 324,055 | | | | 1.09 | | | | 1.09 | | | | 1.50 | | | | 18 | |
Year ended 04/30/16 | | | 26.04 | | | | 0.38 | | | | (2.29 | ) | | | (1.91 | ) | | | (0.30 | ) | | | (1.97 | ) | | | (2.27 | ) | | | 21.86 | | | | (7.14 | ) | | | 358,835 | | | | 1.09 | | | | 1.10 | | | | 1.62 | | | | 15 | |
| |
Class Y | | | | | | | | | | | | | | | | | | | | | | | | | | | | | | | | | | | | | | | | | | | | | | | | | | | | | | | | |
Year ended 04/30/20 | | | 25.18 | | | | 0.57 | | | | (4.88 | ) | | | (4.31 | ) | | | (0.58 | ) | | | (1.34 | ) | | | (1.92 | ) | | | 18.95 | | | | (18.54 | ) | | | 1,179,055 | | | | 0.57 | (d) | | | 0.58 | (d) | | | 2.41 | (d) | | | 30 | |
Year ended 04/30/19 | | | 26.68 | | | | 0.52 | | | | 0.22 | | | | 0.74 | | | | (0.47 | ) | | | (1.77 | ) | | | (2.24 | ) | | | 25.18 | | | | 3.73 | | | | 1,765,456 | | | | 0.55 | | | | 0.56 | | | | 2.04 | | | | 23 | |
Year ended 04/30/18 | | | 24.03 | | | | 0.41 | | | | 3.25 | | | | 3.66 | | | | (0.42 | ) | | | (0.59 | ) | | | (1.01 | ) | | | 26.68 | | | | 15.41 | | | | 1,861,752 | | | | 0.56 | | | | 0.56 | | | | 1.63 | | | | 14 | |
Year ended 04/30/17 | | | 21.86 | | | | 0.46 | | | | 3.61 | | | | 4.07 | | | | (0.55 | ) | | | (1.35 | ) | | | (1.90 | ) | | | 24.03 | | | | 18.86 | | | | 3,334,930 | | | | 0.59 | | | | 0.59 | | | | 2.00 | | | | 18 | |
Year ended 04/30/16 | | | 26.04 | | | | 0.49 | | | | (2.28 | ) | | | (1.79 | ) | | | (0.42 | ) | | | (1.97 | ) | | | (2.39 | ) | | | 21.86 | | | | (6.67 | ) | | | 3,034,620 | | | | 0.59 | | | | 0.60 | | | | 2.12 | | | | 15 | |
Class R5 | | | | | | | | | | | | | | | | | | | | | | | | | | | | | | | | | | | | | | | | | | | | | | | | | | | | | | | | |
Year ended 04/30/20 | | | 25.16 | | | | 0.58 | | | | (4.87 | ) | | | (4.29 | ) | | | (0.60 | ) | | | (1.34 | ) | | | (1.94 | ) | | | 18.93 | | | | (18.50 | ) | | | 440,298 | | | | 0.50 | (d) | | | 0.51 | (d) | | | 2.48 | (d) | | | 30 | |
Year ended 04/30/19 | | | 26.66 | | | | 0.54 | | | | 0.22 | | | | 0.76 | | | | (0.49 | ) | | | (1.77 | ) | | | (2.26 | ) | | | 25.16 | | | | 3.80 | | | | 665,081 | | | | 0.48 | | | | 0.49 | | | | 2.11 | | | | 23 | |
Year ended 04/30/18 | | | 24.02 | | | | 0.44 | | | | 3.23 | | | | 3.67 | | | | (0.44 | ) | | | (0.59 | ) | | | (1.03 | ) | | | 26.66 | | | | 15.46 | | | | 735,462 | | | | 0.50 | | | | 0.50 | | | | 1.69 | | | | 14 | |
Year ended 04/30/17 | | | 21.85 | | | | 0.48 | | | | 3.62 | | | | 4.10 | | | | (0.58 | ) | | | (1.35 | ) | | | (1.93 | ) | | | 24.02 | | | | 18.98 | | | | 741,550 | | | | 0.51 | | | | 0.51 | | | | 2.08 | | | | 18 | |
Year ended 04/30/16 | | | 26.04 | | | | 0.51 | | | | (2.29 | ) | | | (1.78 | ) | | | (0.44 | ) | | | (1.97 | ) | | | (2.41 | ) | | | 21.85 | | | | (6.61 | ) | | | 824,228 | | | | 0.49 | | | | 0.50 | | | | 2.22 | | | | 15 | |
| |
Class R6 | | | | | | | | | | | | | | | | | | | | | | | | | | | | | | | | | | | | | | | | | | | | | | | | | | | | | | | | |
Year ended 04/30/20 | | | 25.16 | | | | 0.60 | | | | (4.88 | ) | | | (4.28 | ) | | | (0.62 | ) | | | (1.34 | ) | | | (1.96 | ) | | | 18.92 | | | | (18.46 | ) | | | 2,268,887 | | | | 0.41 | (d) | | | 0.42 | (d) | | | 2.57 | (d) | | | 30 | |
Year ended 04/30/19 | | | 26.66 | | | | 0.56 | | | | 0.22 | | | | 0.78 | | | | (0.51 | ) | | | (1.77 | ) | | | (2.28 | ) | | | 25.16 | | | | 3.90 | | | | 2,962,672 | | | | 0.39 | | | | 0.40 | | | | 2.20 | | | | 23 | |
Year ended 04/30/18 | | | 24.01 | | | | 0.47 | | | | 3.24 | | | | 3.71 | | | | (0.47 | ) | | | (0.59 | ) | | | (1.06 | ) | | | 26.66 | | | | 15.61 | | | | 2,587,663 | | | | 0.41 | | | | 0.41 | | | | 1.78 | | | | 14 | |
Year ended 04/30/17 | | | 21.85 | | | | 0.50 | | | | 3.61 | | | | 4.11 | | | | (0.60 | ) | | | (1.35 | ) | | | (1.95 | ) | | | 24.01 | | | | 19.05 | | | | 702,678 | | | | 0.41 | | | | 0.41 | | | | 2.18 | | | | 18 | |
Year ended 04/30/16 | | | 26.03 | | | | 0.54 | | | | (2.29 | ) | | | (1.75 | ) | | | (0.46 | ) | | | (1.97 | ) | | | (2.43 | ) | | | 21.85 | | | | (6.48 | ) | | | 624,206 | | | | 0.39 | | | | 0.40 | | | | 2.32 | | | | 15 | |
| |
| (a) | Calculated using average shares outstanding. |
| (b) | Includes adjustments in accordance with accounting principles generally accepted in the United States of America and as such, the net asset value for financial reporting purposes and the returns based upon those net asset values may differ from the net asset value and returns for shareholder transactions. Does not include sales charges and is not annualized for periods less than one year, if applicable. |
| (c) | Portfolio turnover is calculated at the fund level and is not annualized for periods less than one year, if applicable. |
| (d) | Ratios are based on average daily net assets (000’s omitted) of $5,744,130, $132,911, $179,986, $1,554,576, $580,676 and $2,675,290 for Class A, Class C, Class R, Class Y, Class R5 and Class R6 shares, respectively. |
| (e) | The total return, ratio of expenses to average net assets and ratio of net investment income (loss) to average net assets reflect actual 12b-1 fees of 0.92%, 0.99%, 0.99% and 0.97% for the years ended April 30, 2020, 2019, 2018 and 2016, respectively. |
See accompanying Notes to Financial Statements which are an integral part of the financial statements.
16 Invesco Comstock Fund
Notes to Financial Statements
April 30, 2020
NOTE 1–Significant Accounting Policies
Invesco Comstock Fund (the “Fund”) is a series portfolio of AIM Sector Funds (Invesco Sector Funds) (the “Trust”). The Trust is a Delaware statutory trust registered under the Investment Company Act of 1940, as amended (the “1940 Act”), as an open-end series management investment company authorized to issue an unlimited number of shares of beneficial interest. Information presented in these financial statements pertains only to the Fund. Matters affecting the Fund or each class will be voted on exclusively by the shareholders of the Fund or each class.
The Fund’s investment objective is total return through growth of capital and current income.
The Fund currently consists of six different classes of shares: Class A, Class C, Class R, Class Y, Class R5 and Class R6. Class Y shares are available only to certain investors. Class A shares are sold with a front-end sales charge unless certain waiver criteria are met. Under certain circumstances, load waived shares may be subject to contingent deferred sales charges (“CDSC”). Class C shares are sold with a CDSC. Class R, Class Y, Class R5 and Class R6 shares are sold at net asset value. Class C shares held for ten years after purchase are eligible for automatic conversion into Class A shares of the same Fund (the “Conversion Feature”). The automatic conversion pursuant to the Conversion Feature will generally occur at the end of the month following the tenth anniversary after a purchase of Class C shares.
The Fund is an investment company and accordingly follows the investment company accounting and reporting guidance in accordance with Financial Accounting Standards Board Accounting Standards Codification Topic 946, Financial Services - Investment Companies.
The following is a summary of the significant accounting policies followed by the Fund in the preparation of its financial statements.
| A. | Security Valuations – Securities, including restricted securities, are valued according to the following policy. |
A security listed or traded on an exchange (except convertible securities) is valued at its last sales price or official closing price as of the close of the customary trading session on the exchange where the security is principally traded, or lacking any sales or official closing price on a particular day, the security may be valued at the closing bid price on that day. Securities traded in the over-the-counter market are valued based on prices furnished by independent pricing services or market makers. When such securities are valued by an independent pricing service they may be considered fair valued. Futures contracts are valued at the final settlement price set by an exchange on which they are principally traded. Listed options are valued at the mean between the last bid and asked prices from the exchange on which they are principally traded. Options not listed on an exchange are valued by an independent source at the mean between the last bid and asked prices. For purposes of determining net asset value (“NAV”) per share, futures and option contracts generally are valued 15 minutes after the close of the customary trading session of the New York Stock Exchange (“NYSE”).
Investments in open-end and closed-end registered investment companies that do not trade on an exchange are valued at the end-of-day net asset value per share. Investments in open-end and closed-end registered investment companies that trade on an exchange are valued at the last sales price or official closing price as of the close of the customary trading session on the exchange where the security is principally traded.
Debt obligations (including convertible securities) and unlisted equities are fair valued using an evaluated quote provided by an independent pricing service. Evaluated quotes provided by the pricing service may be determined without exclusive reliance on quoted prices, and may reflect appropriate factors such as institution-size trading in similar groups of securities, developments related to specific securities, dividend rate (for unlisted equities), yield (for debt obligations), quality, type of issue, coupon rate (for debt obligations), maturity (for debt obligations), individual trading characteristics and other market data. Pricing services generally value debt obligations assuming orderly transactions of institutional round lot size, but a fund may hold or transact in the same securities in smaller, odd lot sizes. Odd lots often trade at lower prices than institutional round lots. Debt obligations are subject to interest rate and credit risks. In addition, all debt obligations involve some risk of default with respect to interest and/or principal payments.
Foreign securities’ (including foreign exchange contracts) prices are converted into U.S. dollar amounts using the applicable exchange rates as of the close of the NYSE. If market quotations are available and reliable for foreign exchange-traded equity securities, the securities will be valued at the market quotations. Because trading hours for certain foreign securities end before the close of the NYSE, closing market quotations may become unreliable. If between the time trading ends on a particular security and the close of the customary trading session on the NYSE, events occur that the investment adviser determines are significant and make the closing price unreliable, the Fund may fair value the security. If the event is likely to have affected the closing price of the security, the security will be valued at fair value in good faith using procedures approved by the Board of Trustees. Adjustments to closing prices to reflect fair value may also be based on a screening process of an independent pricing service to indicate the degree of certainty, based on historical data, that the closing price in the principal market where a foreign security trades is not the current value as of the close of the NYSE. Foreign securities’ prices meeting the approved degree of certainty that the price is not reflective of current value will be priced at the indication of fair value from the independent pricing service. Multiple factors may be considered by the independent pricing service in determining adjustments to reflect fair value and may include information relating to sector indices, American Depositary Receipts and domestic and foreign index futures. Foreign securities may have additional risks including exchange rate changes, potential for sharply devalued currencies and high inflation, political and economic upheaval, the relative lack of issuer information, relatively low market liquidity and the potential lack of strict financial and accounting controls and standards.
Securities for which market prices are not provided by any of the above methods may be valued based upon quotes furnished by independent sources. The last bid price may be used to value equity securities. The mean between the last bid and asked prices is used to value debt obligations, including corporate loans.
Securities for which market quotations are not readily available or became unreliable are valued at fair value as determined in good faith by or under the supervision of the Trust’s officers following procedures approved by the Board of Trustees. Issuer specific events, market trends, bid/asked quotes of brokers and information providers and other market data may be reviewed in the course of making a good faith determination of a security’s fair value.
The Fund may invest in securities that are subject to interest rate risk, meaning the risk that the prices will generally fall as interest rates rise and, conversely, the prices will generally rise as interest rates fall. Specific securities differ in their sensitivity to changes in interest rates depending on their individual characteristics. Changes in interest rates may result in increased market volatility, which may affect the value and/or liquidity of certain Fund investments.
Valuations change in response to many factors including the historical and prospective earnings of the issuer, the value of the issuer’s assets, general market conditions which are not specifically related to the particular issuer, such as real or perceived adverse economic conditions, changes in the general outlook for revenues or corporate earnings, changes in interest or currency rates, regional or global instability, natural or environmental disasters, widespread disease or other public health issues, war, acts of terrorism or adverse investor sentiment generally and market liquidity. Because of the inherent uncertainties of valuation, the values reflected in the financial statements may materially differ from the value received upon actual sale of those investments.
| B. | Securities Transactions and Investment Income – Securities transactions are accounted for on a trade date basis. Realized gains or losses on sales are computed on the basis of specific identification of the securities sold. Interest income (net of withholding tax, if any) is recorded on an accrual basis from settlement date. Dividend income (net of withholding tax, if any) is recorded on the ex-dividend date. |
The Fund may periodically participate in litigation related to Fund investments. As such, the Fund may receive proceeds from litigation settlements. Any proceeds received are included in the Statement of Operations as realized gain (loss) for investments no longer held and as unrealized gain (loss) for investments still held.
Brokerage commissions and mark ups are considered transaction costs and are recorded as an increase to the cost basis of securities purchased and/or a reduction of proceeds on a sale of securities. Such transaction costs are included in the determination of net realized and unrealized gain (loss) from investment securities reported in the Statement of Operations and the Statement of Changes in Net Assets and the net realized and unrealized gains (losses) on securities per
17 Invesco Comstock Fund
share in the Financial Highlights. Transaction costs are included in the calculation of the Fund’s net asset value and, accordingly, they reduce the Fund’s total returns. These transaction costs are not considered operating expenses and are not reflected in net investment income reported in the Statement of Operations and the Statement of Changes in Net Assets, or the net investment income per share and the ratios of expenses and net investment income reported in the Financial Highlights, nor are they limited by any expense limitation arrangements between the Fund and the investment adviser.
The Fund allocates income and realized and unrealized capital gains and losses to a class based on the relative net assets of each class.
| C. | Country Determination – For the purposes of making investment selection decisions and presentation in the Schedule of Investments, the investment adviser may determine the country in which an issuer is located and/or credit risk exposure based on various factors. These factors include the laws of the country under which the issuer is organized, where the issuer maintains a principal office, the country in which the issuer derives 50% or more of its total revenues and the country that has the primary market for the issuer’s securities, as well as other criteria. Among the other criteria that may be evaluated for making this determination are the country in which the issuer maintains 50% or more of its assets, the type of security, financial guarantees and enhancements, the nature of the collateral and the sponsor organization. Country of issuer and/or credit risk exposure has been determined to be the United States of America, unless otherwise noted. |
| D. | Distributions - Distributions from net investment income, if any, are declared and paid quarterly and are recorded on the ex-dividend date. Distributions from net realized capital gain, if any, are generally declared and paid annually and recorded on the ex-dividend date. The Fund may elect to treat a portion of the proceeds from redemptions as distributions for federal income tax purposes. |
| E. | Federal Income Taxes – The Fund intends to comply with the requirements of Subchapter M of the Internal Revenue Code of 1986, as amended (the “Internal Revenue Code”), necessary to qualify as a regulated investment company and to distribute substantially all of the Fund’s taxable earnings to shareholders. As such, the Fund will not be subject to federal income taxes on otherwise taxable income (including net realized capital gain) that is distributed to shareholders. Therefore, no provision for federal income taxes is recorded in the financial statements. |
The Fund recognizes the tax benefits of uncertain tax positions only when the position is more likely than not to be sustained. Management has analyzed the Fund’s uncertain tax positions and concluded that no liability for unrecognized tax benefits should be recorded related to uncertain tax positions. Management is not aware of any tax positions for which it is reasonably possible that the total amounts of unrecognized tax benefits will change materially in the next 12 months.
The Fund files tax returns in the U.S. Federal jurisdiction and certain other jurisdictions. Generally, the Fund is subject to examinations by such taxing authorities for up to three years after the filing of the return for the tax period.
| F. | Expenses – Fees provided for under the Rule 12b-1 plan of a particular class of the Fund are charged to the operations of such class. Transfer agency fees and expenses and other shareholder recordkeeping fees and expenses attributable to Class R5 and Class R6 are allocated to each share class based on relative net assets. Sub-accounting fees attributable to Class R5 are charged to the operations of the class. Transfer agency fees and expenses and other shareholder recordkeeping fees and expenses relating to all other classes are allocated among those classes based on relative net assets. All other expenses are allocated among the classes based on relative net assets. |
| G. | Accounting Estimates – The preparation of financial statements in conformity with accounting principles generally accepted in the United States of America (“GAAP”) requires management to make estimates and assumptions that affect the reported amounts of assets and liabilities at the date of the financial statements and the reported amounts of revenues and expenses during the reporting period including estimates and assumptions related to taxation. Actual results could differ from those estimates by a significant amount. In addition, the Fund monitors for material events or transactions that may occur or become known after the period-end date and before the date the financial statements are released to print. |
| H. | Indemnifications – Under the Trust’s organizational documents, each Trustee, officer, employee or other agent of the Trust is indemnified against certain liabilities that may arise out of the performance of their duties to the Fund. Additionally, in the normal course of business, the Fund enters into contracts, including the Fund’s servicing agreements, that contain a variety of indemnification clauses. The Fund’s maximum exposure under these arrangements is unknown as this would involve future claims that may be made against the Fund that have not yet occurred. The risk of material loss as a result of such indemnification claims is considered remote. |
| I. | Securities Lending – The Fund may lend portfolio securities having a market value up to one-third of the Fund’s total assets. Such loans are secured by collateral equal to no less than the market value of the loaned securities determined daily by the securities lending provider. Such collateral will be cash or debt securities issued or guaranteed by the U.S. Government or any of its sponsored agencies. Cash collateral received in connection with these loans is invested in short-term money market instruments or affiliated money market funds and is shown as such on the Schedule of Investments. The Fund bears the risk of loss with respect to the investment of collateral. It is the Fund’s policy to obtain additional collateral from or return excess collateral to the borrower by the end of the next business day, following the valuation date of the securities loaned. Therefore, the value of the collateral held may be temporarily less than the value of the securities on loan. When loaning securities, the Fund retains certain benefits of owning the securities, including the economic equivalent of dividends or interest generated by the security. Lending securities entails a risk of loss to the Fund if, and to the extent that, the market value of the securities loaned were to increase and the borrower did not increase the collateral accordingly, and the borrower failed to return the securities. The securities loaned are subject to termination at the option of the borrower or the Fund. Upon termination, the borrower will return to the Fund the securities loaned and the Fund will return the collateral. Upon the failure of the borrower to return the securities, collateral may be liquidated and the securities may be purchased on the open market to replace the loaned securities. The Fund could experience delays and costs in gaining access to the collateral and the securities may lose value during the delay which could result in potential losses to the Fund. Some of these losses may be indemnified by the lending agent. The Fund bears the risk of any deficiency in the amount of the collateral available for return to the borrower due to any loss on the collateral invested. Dividends received on cash collateral investments for securities lending transactions, which are net of compensation to counterparties, are included in Dividends from affiliated money market funds on the Statement of Operations. The aggregate value of securities out on loan, if any, is shown as a footnote on the Statement of Assets and Liabilities. |
| J. | Foreign Currency Translations – Foreign currency is valued at the close of the NYSE based on quotations posted by banks and major currency dealers. Portfolio securities and other assets and liabilities denominated in foreign currencies are translated into U.S. dollar amounts at the date of valuation. Purchases and sales of portfolio securities (net of foreign taxes withheld on disposition) and income items denominated in foreign currencies are translated into U.S. dollar amounts on the respective dates of such transactions. The Fund does not separately account for the portion of the results of operations resulting from changes in foreign exchange rates on investments and the fluctuations arising from changes in market prices of securities held. The combined results of changes in foreign exchange rates and the fluctuation of market prices on investments (net of estimated foreign tax withholding) are included with the net realized and unrealized gain or loss from investments in the Statement of Operations. Reported net realized foreign currency gains or losses arise from (1) sales of foreign currencies, (2) currency gains or losses realized between the trade and settlement dates on securities transactions, and (3) the difference between the amounts of dividends, interest, and foreign withholding taxes recorded on the Fund’s books and the U.S. dollar equivalent of the amounts actually received or paid. Net unrealized foreign currency gains and losses arise from changes in the fair values of assets and liabilities, other than investments in securities at fiscal period end, resulting from changes in exchange rates. |
The Fund may invest in foreign securities, which may be subject to foreign taxes on income, gains on investments or currency repatriation, a portion of which may be recoverable. Foreign taxes, if any, are recorded based on the tax regulations and rates that exist in the foreign markets in which the Fund invests and are shown in the Statement of Operations.
18 Invesco Comstock Fund
| K. | Forward Foreign Currency Contracts - The Fund may engage in foreign currency transactions either on a spot (i.e. for prompt delivery and settlement) basis, or through forward foreign currency contracts, to manage or minimize currency or exchange rate risk. |
The Fund may also enter into forward foreign currency contracts for the purchase or sale of a security denominated in a foreign currency in order to “lock in” the U.S. dollar price of that security, or the Fund may also enter into forward foreign currency contracts that do not provide for physical settlement of the two currencies, but instead are settled by a single cash payment calculated as the difference between the agreed upon exchange rate and the spot rate at settlement based upon an agreed upon notional amount (non-deliverable forwards). The Fund will set aside liquid assets in an amount equal to the daily mark-to-market obligation for forward foreign currency contracts.
A forward foreign currency contract is an obligation between two parties (“Counterparties”) to purchase or sell a specific currency for an agreed-upon price at a future date. The use of forward foreign currency contracts does not eliminate fluctuations in the price of the underlying securities the Fund owns or intends to acquire but establishes a rate of exchange in advance. Fluctuations in the value of these contracts are measured by the difference in the contract date and reporting date exchange rates and are recorded as unrealized appreciation (depreciation) until the contracts are closed. When the contracts are closed, realized gains (losses) are recorded. Realized and unrealized gains (losses) on the contracts are included in the Statement of Operations. The primary risks associated with forward foreign currency contracts include failure of the Counterparty to meet the terms of the contract and the value of the foreign currency changing unfavorably. These risks may be in excess of the amounts reflected in the Statement of Assets and Liabilities.
NOTE 2–Advisory Fees and Other Fees Paid to Affiliates
The Trust has entered into a master investment advisory agreement with Invesco Advisers, Inc. (the “Adviser” or “Invesco”). Under the terms of the investment advisory agreement, the Fund accrues daily and pays monthly an advisory fee to the Adviser based on the annual rate of the Fund’s average daily net assets as follows:
| | | | |
| Average Daily Net Assets | | Rate |
| |
First $1 billion | | | 0.500% | |
| |
Next $1 billion | | | 0.450% | |
| |
Next $1 billion | | | 0.400% | |
| |
Over $3 billion | | | 0.350% | |
| |
For the year ended April 30, 2020, the effective advisory fee rate incurred by the Fund was 0.38%.
Under the terms of a master sub-advisory agreement between the Adviser and each of Invesco Asset Management Deutschland GmbH, Invesco Asset Management Limited, Invesco Asset Management (Japan) Limited, Invesco Hong Kong Limited, Invesco Senior Secured Management, Inc. and Invesco Canada Ltd. (collectively, the “Affiliated Sub-Advisers”) the Adviser, not the Fund, will pay 40% of the fees paid to the Adviser to any such Affiliated Sub-Adviser(s) that provide(s) discretionary investment management services to the Fund based on the percentage of assets allocated to such Affiliated Sub-Adviser(s).
The Adviser has contractually agreed, through at least June 30, 2021, to waive advisory fees and/or reimburse expenses of all shares to the extent necessary to limit total annual fund operating expenses after fee waiver and/or expense reimbursement (excluding certain items discussed below) of Class A, Class C, Class R, Class Y, Class R5 and Class R6 shares to 2.00%, 2.75%, 2.25%, 1.75%, 1.75% and 1.75% respectively, of average daily net assets (the “expense limits”). In determining the Adviser’s obligation to waive advisory fees and/or reimburse expenses, the following expenses are not taken into account, and could cause the total annual fund operating expenses after fee waiver and/or expense reimbursement to exceed the numbers reflected above: (1) interest; (2) taxes; (3) dividend expense on short sales; (4) extraordinary or non-routine items, including litigation expenses; and (5) expenses that the Fund has incurred but did not actually pay because of an expense offset arrangement. Unless Invesco continues the fee waiver agreement, it will terminate on June 30, 2021. During its term, the fee waiver agreement cannot be terminated or amended to increase the expense limits or reduce the advisory fee waiver without approval of the Board of Trustees. The Adviser did not waive fees and/or reimburse expenses during the period under these expense limits.
The Adviser has contractually agreed, through at least June 30, 2022, to waive the advisory fee payable by the Fund in an amount equal to 100% of the net advisory fees the Adviser receives from the affiliated money market funds on investments by the Fund of uninvested cash in such affiliated money market funds.
For the year ended April 30, 2020, the Adviser waived advisory fees of $710,592.
The Trust has entered into a master administrative services agreement with Invesco pursuant to which the Fund has agreed to pay Invesco for certain administrative costs incurred in providing accounting services to the Fund. For the year ended April 30, 2020, expenses incurred under the agreement are shown in the Statement of Operations as Administrative services fees. Invesco has entered into a sub-administration agreement whereby State Street Bank and Trust Company (“SSB”) serves as fund accountant and provides certain administrative services to the Fund. Pursuant to a custody agreement with the Trust on behalf of the Fund, SSB also serves as the Fund’s custodian.
The Trust has entered into a transfer agency and service agreement with Invesco Investment Services, Inc. (“IIS”) pursuant to which the Fund has agreed to pay IIS a fee for providing transfer agency and shareholder services to the Fund and reimburse IIS for certain expenses incurred by IIS in the course of providing such services. IIS may make payments to intermediaries that provide omnibus account services, sub-accounting services and/or networking services. All fees payable by IIS to intermediaries that provide omnibus account services or sub-accounting services are charged back to the Fund, subject to certain limitations approved by the Trust’s Board of Trustees. For the year ended April 30, 2020, expenses incurred under the agreement are shown in the Statement of Operations as Transfer agent fees.
Shares of the Fund are distributed by Invesco Distributors, Inc. (“IDI”). The Fund has adopted a distribution plan pursuant to Rule 12b-1 under the 1940 Act, and a service plan (collectively, the “Plans”) for Class A, Class C and Class R shares to compensate IDI for the sale, distribution, shareholder servicing and maintenance of shareholder accounts for these shares. Under the Plans, the Fund will incur annual fees of up to 0.25% of Class A average daily net assets, up to 1.00% of Class C average daily net assets and up to 0.50% of Class R average daily net assets. The fees are accrued daily and paid monthly.
With respect to Class C shares, the Fund is authorized to reimburse in future years any distribution related expenses that exceed the maximum annual reimbursement rate for such class, so long as such reimbursement does not cause the Fund to exceed the Class C maximum annual reimbursement rate, respectively. With respect to Class A shares, distribution related expenses that exceed the maximum annual reimbursement rate for such class are not carried forward to future years and the Fund will not reimburse IDI for any such expenses.
For the year ended April 30, 2020, expenses incurred under these agreements are shown in the Statement of Operations as Distribution fees.
Front-end sales commissions and CDSC (collectively, the “sales charges”) are not recorded as expenses of the Fund. Front-end sales commissions are deducted from proceeds from the sales of Fund shares prior to investment in Class A shares of the Fund. CDSC are deducted from redemption proceeds prior to remittance to the shareholder. During the year ended April 30, 2020, IDI advised the Fund that IDI retained $490,246 in front-end sales commissions from the sale of Class A shares and $24,753 and $7,181 from Class A and Class C shares, respectively, for CDSC imposed upon redemptions by shareholders.
For the year ended April 30, 2020, the Fund incurred $116,236 in brokerage commissions with Invesco Capital Markets, Inc., an affiliate of the Adviser and IDI, for portfolio transactions executed on behalf of the Fund.
Certain officers and trustees of the Trust are officers and directors of the Adviser, IIS and/or IDI.
19 Invesco Comstock Fund
NOTE 3–Additional Valuation Information
GAAP defines fair value as the price that would be received to sell an asset or paid to transfer a liability in an orderly transaction between market participants at the measurement date, under current market conditions. GAAP establishes a hierarchy that prioritizes the inputs to valuation methods, giving the highest priority to readily available unadjusted quoted prices in an active market for identical assets (Level 1) and the lowest priority to significant unobservable inputs (Level 3), generally when market prices are not readily available or are unreliable. Based on the valuation inputs, the securities or other investments are tiered into one of three levels. Changes in valuation methods may result in transfers in or out of an investment’s assigned level:
| | | | |
Level 1 | | - | | Prices are determined using quoted prices in an active market for identical assets. |
| Level 2 | | - | | Prices are determined using other significant observable inputs. Observable inputs are inputs that other market participants may use in pricing a security. These may include quoted prices for similar securities, interest rates, prepayment speeds, credit risk, yield curves, loss severities, default rates, discount rates, volatilities and others. |
| Level 3 | | - | | Prices are determined using significant unobservable inputs. In situations where quoted prices or observable inputs are unavailable (for example, when there is little or no market activity for an investment at the end of the period), unobservable inputs may be used. Unobservable inputs reflect the Fund’s own assumptions about the factors market participants would use in determining fair value of the securities or instruments and would be based on the best available information. |
The following is a summary of the tiered valuation input levels, as of April 30, 2020. The level assigned to the securities valuations may not be an indication of the risk or liquidity associated with investing in those securities. Because of the inherent uncertainties of valuation, the values reflected in the financial statements may materially differ from the value received upon actual sale of those investments.
| | | | | | | | | | | | | | | | |
| | | Level 1 | | | Level 2 | | | Level 3 | | | Total | |
| |
Investments in Securities | | | | | | | | | | | | | | | | |
| |
Common Stocks & Other Equity Interests | | | $8,333,635,102 | | | | $54,443,431 | | | | $– | | | | $8,388,078,533 | |
| |
Money Market Funds | | | 199,722,504 | | | | – | | | | – | | | | 199,722,504 | |
| |
Total Investments in Securities | | | 8,533,357,606 | | | | 54,443,431 | | | | – | | | | 8,587,801,037 | |
| |
Other Investments - Assets* | | | | | | | | | | | | | | | | |
| |
Forward Foreign Currency Contracts | | | – | | | | 396,372 | | | | – | | | | 396,372 | |
| |
Other Investments - Liabilities* | | | | | | | | | | | | | | | | |
| |
Forward Foreign Currency Contracts | | | – | | | | (4,048,936 | ) | | | – | | | | (4,048,936 | ) |
| |
Total Other Investments | | | – | | | | (3,652,564 | ) | | | – | | | | (3,652,564 | ) |
| |
Total Investments | | | $8,533,357,606 | | | | $50,790,867 | | | | $– | | | | $8,584,148,473 | |
| |
| * | Unrealized appreciation (depreciation). |
NOTE 4–Derivative Investments
The Fund may enter into an International Swaps and Derivatives Association Master Agreement (“ISDA Master Agreement”) under which a fund may trade OTC derivatives. An OTC transaction entered into under an ISDA Master Agreement typically involves a collateral posting arrangement, payment netting provisions and close-out netting provisions. These netting provisions allow for reduction of credit risk through netting of contractual obligations. The enforceability of the netting provisions of the ISDA Master Agreement depends on the governing law of the ISDA Master Agreement, among other factors.
For financial reporting purposes, the Fund does not offset OTC derivative assets or liabilities that are subject to ISDA Master Agreements in the Statement of Assets and Liabilities.
Value of Derivative Investments at Period-End
The table below summarizes the value of the Fund’s derivative investments, detailed by primary risk exposure, held as of April 30, 2020:
| | | | |
| | | Value | |
| | | Currency | |
| Derivative Assets | | Risk | |
| |
Unrealized appreciation on forward foreign currency contracts outstanding | | $ | 396,372 | |
| |
Derivatives not subject to master netting agreements | | | - | |
| |
Total Derivative Assets subject to master netting agreements | | $ | 396,372 | |
| |
| |
| | | Value | |
| | | Currency | |
| Derivative Liabilities | | Risk | |
| |
Unrealized depreciation on forward foreign currency contracts outstanding | | $ | (4,048,936 | ) |
| |
Derivatives not subject to master netting agreements | | | - | |
| |
Total Derivative Liabilities subject to master netting agreements | | $ | (4,048,936 | ) |
| |
20 Invesco Comstock Fund
Offsetting Assets and Liabilities
The table below reflects the Fund’s exposure to Counterparties subject to either an ISDA Master Agreement or other agreement for OTC derivative transactions as of April 30, 2020.
| | | | | | | | | | | | | | | | | | | | |
| | | Financial | | Financial | | | | | | | | | |
| | | Derivative | | Derivative | | | | Collateral | | | |
| | | Assets | | Liabilities | | | | (Received)/Pledged | | | |
| Counterparty | | Forward Foreign
Currency Contracts | | Forward Foreign
Currency Contracts | | Net Value of Derivatives | | Non-Cash | | Cash | | Net Amount | |
| |
Canadian Imperial Bank of Commerce | | | $ - | | | | $(1,205,141 | ) | | $ | (1,205,141 | ) | | $- | | $- | | $ | (1,205,141 | ) |
| |
Deutsche Bank AG | | | - | | | | (2,381,623 | ) | | | (2,381,623 | ) | | - | | - | | | (2,381,623 | ) |
| |
Goldman Sachs International | | | 142,056 | | | | (261,013 | ) | | | (118,957 | ) | | - | | - | | | (118,957 | ) |
| |
Royal Bank of Canada | | | 132,492 | | | | (201,159 | ) | | | (68,667 | ) | | - | | - | | | (68,667 | ) |
| |
State Street Bank & Trust CO. | | | 121,824 | | | | - | | | | 121,824 | | | | | | | | 121,824 | |
| |
Total | | | $396,372 | | | | $(4,048,936) | | | $ | (3,652,564 | ) | | $- | | $- | | $ | (3,652,564 | ) |
| |
Effect of Derivative Investments for the year ended April 30, 2020
The table below summarizes the gains (losses) on derivative investments, detailed by primary risk exposure, recognized in earnings during the period:
| | | | |
| | | Location of Gain (Loss) on |
| | | Statement of Operations |
| | | Currency |
| | | Risk |
| | |
Realized Gain: | | | | |
Forward foreign currency contracts | | | $29,627,653 | |
| | |
Change in Net Unrealized Appreciation (Depreciation): | | | | |
Forward foreign currency contracts | | | (7,394,661 | ) |
| | |
Total | | | $22,232,992 | |
| | |
The table below summarizes the average notional value of derivatives held during the period.
| | | | |
| | | Forward | |
| | | Foreign Currency | |
| | | Contracts | |
| |
Average notional value | | | $869,401,247 | |
| |
NOTE 5–Expense Offset Arrangement(s)
The expense offset arrangement is comprised of transfer agency credits which result from balances in demand deposit accounts used by the transfer agent for clearing shareholder transactions. For the year ended April 30, 2020, the Fund received credits from this arrangement, which resulted in the reduction of the Fund’s total expenses of $27,391.
NOTE 6–Trustees’ and Officers’ Fees and Benefits
Trustees’ and Officers’ Fees and Benefits include amounts accrued by the Fund to pay remuneration to certain Trustees and Officers of the Fund. Trustees have the option to defer compensation payable by the Fund, and Trustees’ and Officers’ Fees and Benefits also include amounts accrued by the Fund to fund such deferred compensation amounts. Those Trustees who defer compensation have the option to select various Invesco Funds in which their deferral accounts shall be deemed to be invested. Finally, certain current Trustees were eligible to participate in a retirement plan that provided for benefits to be paid upon retirement to Trustees over a period of time based on the number of years of service. The Fund may have certain former Trustees who also participate in a retirement plan and receive benefits under such plan. Trustees’ and Officers’ Fees and Benefits include amounts accrued by the Fund to fund such retirement benefits. Obligations under the deferred compensation and retirement plans represent unsecured claims against the general assets of the Fund.
NOTE 7–Cash Balances
The Fund is permitted to temporarily carry a negative or overdrawn balance in its account with SSB, the custodian bank. Such balances, if any at period-end, are shown in the Statement of Assets and Liabilities under the payable caption Amount due custodian. To compensate the custodian bank for such overdrafts, the overdrawn Fund may either (1) leave funds as a compensating balance in the account so the custodian bank can be compensated by earning the additional interest; or (2) compensate by paying the custodian bank at a rate agreed upon by the custodian bank and Invesco, not to exceed the contractually agreed upon rate. The Fund may not purchase additional securities when any borrowings from banks or broker-dealers exceed 5% of the Fund’s total assets, or when any borrowings from an Invesco Fund are outstanding.
NOTE 8–Distributions to Shareholders and Tax Components of Net Assets
Tax Character of Distributions to Shareholders Paid During the Fiscal Years Ended April 30, 2020 and 2019:
| | | | | | | | |
| | | 2020 | | | 2019 | |
| |
Ordinary income | | $ | 283,801,901 | | | $ | 261,897,039 | |
| |
Long-term capital gain | | | 567,450,226 | | | | 758,540,565 | |
| |
Total distributions | | $ | 851,252,127 | | | $ | 1,020,437,604 | |
| |
21 Invesco Comstock Fund
| | | | |
Tax Components of Net Assets at Period-End: | | | | |
| | | 2020 | |
| |
Undistributed ordinary income | | $ | 36,905,848 | |
| |
Net unrealized appreciation – investments | | | 397,989,508 | |
| |
Net unrealized appreciation - foreign currencies | | | 38,978 | |
| |
Temporary book/tax differences | | | (879,752 | ) |
| |
Post-October capital loss deferral | | | (98,283,194 | ) |
| |
Shares of beneficial interest | | | 8,294,699,280 | |
| |
Total net assets | | $ | 8,630,470,668 | |
| |
The difference between book-basis and tax-basis unrealized appreciation (depreciation) is due to differences in the timing of recognition of gains and losses on investments for tax and book purposes. The Fund’s net unrealized appreciation (depreciation) difference is attributable primarily to wash sales.
The temporary book/tax differences are a result of timing differences between book and tax recognition of income and/or expenses. The Fund’s temporary book/tax differences are the result of the trustee deferral of compensation and retirement plan benefits.
Capital loss carryforward is calculated and reported as of a specific date. Results of transactions and other activity after that date may affect the amount of capital loss carryforward actually available for the Fund to utilize. The ability to utilize capital loss carryforward in the future may be limited under the Internal Revenue Code and related regulations based on the results of future transactions.
The Fund does not have a capital loss carryforward as of April 30, 2020.
NOTE 9–Investment Transactions
The aggregate amount of investment securities (other than short-term securities, U.S. Treasury obligations and money market funds, if any) purchased and sold by the Fund during the year ended April 30, 2020 was $3,099,802,172 and $3,748,076,527, respectively. Cost of investments, including any derivatives, on a tax basis includes the adjustments for financial reporting purposes as of the most recently completed federal income tax reporting period-end.
| | | | |
| Unrealized Appreciation (Depreciation) of Investments on a Tax Basis | |
| |
Aggregate unrealized appreciation of investments | | $ | 1,419,944,537 | |
| |
Aggregate unrealized (depreciation) of investments | | | (1,021,955,029 | ) |
| |
Net unrealized appreciation of investments | | $ | 397,989,508 | |
| |
Cost of investments for tax purposes is $8,186,158,965.
NOTE 10–Reclassification of Permanent Differences
Primarily as a result of differing book/tax treatment of distribution and foreign currency transactions, on April 30, 2020, undistributed net investment income was decreased by $382,600 and undistributed net realized gain (loss) was increased by $382,600. This reclassification had no effect on the net assets or the distributable earnings of the Fund.
NOTE 11–Share Information
| | | | | | | | | | | | | | | | |
| | | | | | Summary of Share Activity | |
| |
| | | Year ended | | | Year ended | |
| | | April 30, 2020(a) | | | April 30, 2019 | |
| | | Shares | | | Amount | | | Shares | | | Amount | |
| |
Sold: | | | | | | | | | | | | | | | | |
Class A | | | 14,823,340 | | | $ | 326,476,393 | | | | 19,235,509 | | | $ | 491,515,179 | |
| |
Class C | | | 836,730 | | | | 18,364,258 | | | | 1,534,289 | | | | 39,146,050 | |
| |
Class R | | | 1,147,738 | | | | 25,029,054 | | | | 1,192,696 | | | | 30,493,158 | |
| |
Class Y | | | 13,876,272 | | | | 304,958,289 | | | | 17,771,878 | | | | 453,272,484 | |
| |
Class R5 | | | 4,014,780 | | | | 88,821,947 | | | | 4,438,371 | | | | 113,906,701 | |
| |
Class R6 | | | 28,081,364 | | | | 564,760,935 | | | | 38,439,425 | | | | 1,012,581,472 | |
| |
| | | | |
Issued as reinvestment of dividends: | | | | | | | | | | | | | | | | |
Class A | | | 17,277,921 | | | | 410,084,725 | | | | 20,775,822 | | | | 473,525,773 | |
| |
Class C | | | 350,528 | | | | 8,411,761 | | | | 1,301,913 | | | | 29,369,529 | |
| |
Class R | | | 557,959 | | | | 13,298,890 | | | | 786,138 | | | | 17,883,529 | |
| |
Class Y | | | 4,584,324 | | | | 108,588,430 | | | | 6,038,549 | | | | 137,929,745 | |
| |
Class R5 | | | 1,955,495 | | | | 46,230,230 | | | | 2,581,603 | | | | 59,028,810 | |
| |
Class R6 | | | 9,023,395 | | | | 212,691,539 | | | | 10,802,298 | | | | 246,810,381 | |
| |
| | | |
Automatic conversion of Class C shares to Class A shares: | | | | | | | | | | | | | |
Class A | | | 580,431 | | | | 13,695,611 | | | | 10,774,173 | | | | 251,650,707 | |
| |
Class C | | | (580,381 | ) | | | (13,695,611 | ) | | | (10,774,189 | ) | | | (251,650,707 | ) |
| |
22 Invesco Comstock Fund
| | | | | | | | | | | | | | | | |
| | | | | | Summary of Share Activity | | | | |
| |
| | | Year ended | | | Year ended | |
| | | April 30, 2020(a) | | | April 30, 2019 | |
| | | Shares | | | Amount | | | Shares | | | Amount | |
| |
Reacquired: | | | | | | | | | | | | | | | | |
Class A | | | (46,728,046 | ) | | $ | (1,064,036,679 | ) | | | (39,747,406 | ) | | $ | (1,011,202,334 | ) |
| |
Class C | | | (1,823,064 | ) | | | (40,942,807 | ) | | | (3,316,074 | ) | | | (85,305,046 | ) |
| |
Class R | | | (3,131,685 | ) | | | (72,209,788 | ) | | | (3,473,453 | ) | | | (89,424,412 | ) |
| |
Class Y | | | (26,340,785 | ) | | | (591,736,766 | ) | | | (23,480,250 | ) | | | (587,227,953 | ) |
| |
Class R5 | | | (9,143,407 | ) | | | (213,209,296 | ) | | | (8,171,985 | ) | | | (206,363,150 | ) |
| |
Class R6 | | | (34,983,680 | ) | | | (794,738,337 | ) | | | (28,542,079 | ) | | | (740,544,766 | ) |
| |
Net increase (decrease) in share activity | | | (25,620,771 | ) | | $ | (649,157,222 | ) | | | 18,167,228 | | | $ | 385,395,150 | |
| |
| (a) | There are entities that are record owners of more than 5% of the outstanding shares of the Fund and in the aggregate own 48% of the outstanding shares of the Fund. IDI has an agreement with these entities to sell Fund shares. The Fund, Invesco and/or Invesco affiliates may make payments to these entities, which are considered to be related to the Fund, for providing services to the Fund, Invesco and/or Invesco affiliates including but not limited to services such as securities brokerage, distribution, third party record keeping and account servicing. The Fund has no knowledge as to whether all or any portion of the shares owned of record by these entities are also owned beneficially. |
NOTE 12–Coronavirus (COVID-19) Pandemic
During the first quarter of 2020, the World Health Organization declared COVID-19 to be a public health emergency. COVID-19 has led to increased short-term market volatility and may have adverse long-term effects on U.S. and world economies and markets in general. COVID-19 may adversely impact the Fund’s ability to achieve its investment objective. Because of the uncertainties on valuation, the global economy and business operations, values reflected in these financial statements may materially differ from the value received upon actual sales of those investments.
The extent of the impact on the performance of the Fund and its investments will depend on future developments, including the duration and spread of the COVID-19 outbreak, related restrictions and advisories, and the effects on the financial markets and economy overall, all of which are highly uncertain and cannot be predicted.
23 Invesco Comstock Fund
Report of Independent Registered Public Accounting Firm
To the Board of Trustees of AIM Sector Funds (Invesco Sector Funds) and Shareholders of Invesco Comstock Fund
Opinion on the Financial Statements
We have audited the accompanying statement of assets and liabilities, including the schedule of investments, of Invesco Comstock Fund (one of the funds constituting AIM Sector Funds (Invesco Sector Funds), referred to hereafter as the “Fund”) as of April 30, 2020, the related statement of operations for the year ended April 30, 2020, the statement of changes in net assets for each of the two years in the period ended April 30, 2020, including the related notes, and the financial highlights for each of the five years in the period ended April 30, 2020 (collectively referred to as the “financial statements”). In our opinion, the financial statements present fairly, in all material respects, the financial position of the Fund as of April 30, 2020, the results of its operations for the year then ended, the changes in its net assets for each of the two years in the period ended April 30, 2020 and the financial highlights for each of the five years in the period ended April 30, 2020 in conformity with accounting principles generally accepted in the United States of America.
Basis for Opinion
These financial statements are the responsibility of the Fund’s management. Our responsibility is to express an opinion on the Fund’s financial statements based on our audits. We are a public accounting firm registered with the Public Company Accounting Oversight Board (United States) (PCAOB) and are required to be independent with respect to the Fund in accordance with the U.S. federal securities laws and the applicable rules and regulations of the Securities and Exchange Commission and the PCAOB.
We conducted our audits of these financial statements in accordance with the standards of the PCAOB. Those standards require that we plan and perform the audit to obtain reasonable assurance about whether the financial statements are free of material misstatement, whether due to error or fraud.
Our audits included performing procedures to assess the risks of material misstatement of the financial statements, whether due to error or fraud, and performing procedures that respond to those risks. Such procedures included examining, on a test basis, evidence regarding the amounts and disclosures in the financial statements. Our audits also included evaluating the accounting principles used and significant estimates made by management, as well as evaluating the overall presentation of the financial statements. Our procedures included confirmation of securities owned as of April 30, 2020 by correspondence with the custodian, transfer agent and brokers; when replies were not received from brokers, we performed other auditing procedures. We believe that our audits provide a reasonable basis for our opinion.
/s/ PricewaterhouseCoopers LLP
Houston, Texas
June 26, 2020
We have served as the auditor of one or more of the investment companies in the Invesco group of investment companies since at least 1995. We have not been able to determine the specific year we began serving as auditor.
24 Invesco Comstock Fund
Calculating your ongoing Fund expenses
Example
As a shareholder of the Fund, you incur two types of costs: (1) transaction costs, which may include sales charges (loads) on purchase payments or contingent deferred sales charges on redemptions, if any; and (2) ongoing costs, including management fees, distribution and/or service (12b-1) fees, and other Fund expenses. This example is intended to help you understand your ongoing costs (in dollars) of investing in the Fund and to compare these costs with ongoing costs of investing in other mutual funds. The example is based on an investment of $1,000 invested at the beginning of the period and held for the entire period November 1, 2019 through April 30, 2020.
Actual expenses
The table below provides information about actual account values and actual expenses. You may use the information in this table, together with the amount you invested, to estimate the expenses that you paid over the period. Simply divide your account value by $1,000 (for example, an $8,600 account value divided by $1,000 = 8.6), then multiply the result by the number in the table under the heading entitled “Actual Expenses Paid During Period” to estimate the expenses you paid on your account during this period.
Hypothetical example for comparison purposes
The table below also provides information about hypothetical account values and hypothetical expenses based on the Fund’s actual expense ratio and an assumed rate of return of 5% per year before expenses, which is not the Fund’s actual return.
The hypothetical account values and expenses may not be used to estimate the actual ending account balance or expenses you paid for the period. You may use this information to compare the ongoing costs of investing in the Fund and other funds. To do so, compare this 5% hypothetical example with the 5% hypothetical examples that appear in the shareholder reports of the other funds.
Please note that the expenses shown in the table are meant to highlight your ongoing costs only and do not reflect any transaction costs, such as sales charges (loads) on purchase payments or contingent deferred sales charges on redemptions, if any. Therefore, the hypothetical information is useful in comparing ongoing costs only, and will not help you determine the relative total costs of owning different funds. In addition, if these transaction costs were included, your costs would have been higher.
| | | | | | | | | | | | | | | | | | | | | | | | | | | | | | |
| | | | | ACTUAL | | HYPOTHETICAL (5% annual return before expenses) | | |
| | | Beginning Account Value (11/01/19) | | Ending
Account Value (04/30/20)1 | | Expenses
Paid During
Period2 | | Ending
Account Value
(04/30/20) | | Expenses
Paid During
Period2 | | Annualized
Expense Ratio |
Class A | | | $ | 1,000.00 | | | | $ | 819.30 | | | | $ | 3.80 | | | | $ | 1,020.69 | | | | $ | 4.22 | | | | | 0.84 | % |
Class C | | | | 1,000.00 | | | | | 816.30 | | | | | 7.04 | | | | | 1,017.11 | | | | | 7.82 | | | | | 1.56 | |
Class R | | | | 1,000.00 | | | | | 818.50 | | | | | 4.93 | | | | | 1,019.44 | | | | | 5.47 | | | | | 1.09 | |
Class Y | | | | 1,000.00 | | | | | 820.20 | | | | | 2.67 | | | | | 1,021.93 | | | | | 2.97 | | | | | 0.59 | |
Class R5 | | | | 1,000.00 | | | | | 820.80 | | | | | 2.35 | | | | | 1,022.28 | | | | | 2.61 | | | | | 0.52 | |
Class R6 | | | | 1,000.00 | | | | | 820.90 | | | | | 1.90 | | | | | 1,022.77 | | | | | 2.11 | | | | | 0.42 | |
| 1 | The actual ending account value is based on the actual total return of the Fund for the period November 1, 2019 through April 30, 2020, after actual expenses and will differ from the hypothetical ending account value which is based on the Fund’s expense ratio and a hypothetical annual return of 5% before expenses. |
| 2 | Expenses are equal to the Fund’s annualized expense ratio as indicated above multiplied by the average account value over the period, multiplied by 182/366 to reflect the most recent fiscal half year. |
25 Invesco Comstock Fund
Tax Information
Form 1099-DIV, Form 1042-S and other year–end tax information provide shareholders with actual calendar year amounts that should be included in their tax returns. Shareholders should consult their tax advisers.
The following distribution information is being provided as required by the Internal Revenue Code or to meet a specific state’s requirement.
The Fund designates the following amounts or, if subsequently determined to be different, the maximum amount allowable for its fiscal year ended April 30, 2020:
| | | | | | | | |
| | Federal and State Income Tax | | | | | | |
| | Long-Term Capital Gain Distributions | | $ | 567,450,226 | | | |
| | Qualified Dividend Income* | | | 99.03 | % | | |
| | Corporate Dividends Received Deduction* | | | 87.61 | % | | |
| | U.S. Treasury Obligations* | | | 0.00 | % | | |
| |
| | * The above percentages are based on ordinary income dividends paid to shareholders during the Fund’s fiscal year. |
26 Invesco Comstock Fund
Trustees and Officers
The address of each trustee and officer is AIM Sector Funds (Invesco Sector Funds) (the “Trust”), 11 Greenway Plaza, Suite 1000, Houston, Texas 77046-1173. The trustees serve for the life of the Trust, subject to their earlier death, incapacitation, resignation, retirement or removal as more specifically provided in the Trust’s organizational documents. Each officer serves for a one year term or until their successors are elected and qualified. Column two below includes length of time served with predecessor entities, if any.
| | | | | | | | | | |
Name, Year of Birth and
Position(s) Held with the Trust | | Trustee and/or Officer Since | | | Principal Occupation(s) During Past 5 Years | | Number of Funds in Fund Complex
Overseen by Trustee | | Other Directorship(s) Held by Trustee During Past 5
Years |
| | | | | |
Interested Trustee | | | | | | | | | | |
| | | | | |
| Martin L. Flanagan1 - 1960 Trustee and Vice Chair | | | 2007 | | | Executive Director, Chief Executive Officer and President, Invesco Ltd. (ultimate parent of Invesco and a global investment management firm); Trustee and Vice Chair, The Invesco Funds; Vice Chair, Investment Company Institute; and Member of Executive Board, SMU Cox School of Business Formerly: Advisor to the Board, Invesco Advisers, Inc. (formerly known as Invesco Institutional (N.A.), Inc.); Chairman and Chief Executive Officer, Invesco Advisers, Inc. (registered investment adviser); Director, Chairman, Chief Executive Officer and President, Invesco Holding Company (US), Inc. (formerly IVZ Inc.) (holding company), Invesco Group Services, Inc. (service provider) and Invesco North American Holdings, Inc. (holding company); Director, Chief Executive Officer and President, Invesco Holding Company Limited (parent of Invesco and a global investment management firm); Director, Invesco Ltd.; Chairman, Investment Company Institute and President, Co-Chief Executive Officer, Co-President, Chief Operating Officer and Chief Financial Officer, Franklin Resources, Inc. (global investment management organization) | | 203 | | None |
| 1 | Mr. Flanagan is considered an interested person (within the meaning of Section 2(a)(19) of the 1940 Act) of the Trust because he is an officer of the Adviser to the Trust, and an officer and a director of Invesco Ltd., ultimate parent of the Adviser. |
| | | | | | | | | | |
Name, Year of Birth and
Position(s) Held with the Trust | | Trustee and/or Officer Since | | | Principal Occupation(s) During Past 5 Years | | Number of Funds in Fund Complex
Overseen by Trustee | | Other Directorship(s) Held by Trustee During Past 5
Years |
| | | | | |
Independent Trustees | | | | | | | | | | |
| | | | | |
Bruce L. Crockett - 1944 Trustee and Chair | | | 2003 | | | Chairman, Crockett Technologies Associates (technology consulting company) Formerly: Director, Captaris (unified messaging provider); Director, President and Chief Executive Officer, COMSAT Corporation; Chairman, Board of Governors of INTELSAT (international communications company); ACE Limited (insurance company); Independent Directors Council and Investment Company Institute: Member of the Audit Committee, Investment Company Institute; Member of the Executive Committee and Chair of the Governance Committee, Independent Directors Council | | 203 | | Director and Chairman of the Audit Committee, ALPS (Attorneys Liability Protection Society) (insurance company); Director and Member of the Audit Committee and Compensation Committee, Ferroglobe PLC (metallurgical company) |
| | | | | |
David C. Arch - 1945 Trustee | | | 2010 | | | Chairman of Blistex Inc. (consumer health care products manufacturer); Member, World Presidents’ Organization | | 203 | | Board member of the Illinois Manufacturers’ Association |
| | | | | |
Beth Ann Brown - 1968 Trustee | | | 2019 | | | Independent Consultant Formerly: Head of Intermediary Distribution, Managing Director, Strategic Relations, Managing Director, Head of National Accounts, Senior Vice President, National Account Manager and Senior Vice President, Key Account Manager, Columbia Management Investment Advisers LLC; Vice President, Key Account Manager, Liberty Funds Distributor, Inc.; and Trustee of certain Oppenheimer Funds | | 203 | | Director, Board of Directors of Caron Engineering Inc.; Advisor, Board of Advisors of Caron Engineering Inc.; President and Director, Acton Shapleigh Youth Conservation Corps (non - profit); and Vice President and Director of Grahamtastic Connection (non-profit) |
T-1 Invesco Comstock Fund
Trustees and Officers–(continued)
| | | | | | | | |
Name, Year of Birth and
Position(s) Held with the Trust | | Trustee and/or Officer Since | | Principal Occupation(s) During Past 5 Years | | Number of Funds in Fund Complex
Overseen by Trustee | | Other Directorship(s) Held by Trustee During Past 5
Years |
| | | |
Independent Trustees–(continued) | | | | |
| | | | | |
Jack M. Fields - 1952 Trustee | | 2003 | | Chief Executive Officer, Twenty First Century Group, Inc. (government affairs company); and Chairman, Discovery Learning Alliance (non-profit) Formerly: Owner and Chief Executive Officer, Dos Angeles Ranch L.P. (cattle, hunting, corporate entertainment); Director, Insperity, Inc. (formerly known as Administaff) (human resources provider); Chief Executive Officer, Texana Timber LP (sustainable forestry company); Director of Cross Timbers Quail Research Ranch (non-profit); and member of the U.S. House of Representatives | | 203 | | Member, Board of Directors of Baylor College of Medicine |
| | | | | |
Cynthia Hostetler - 1962 Trustee | | 2017 | | Non-Executive Director and Trustee of a number of public and private business corporations Formerly: Director, Aberdeen Investment Funds (4 portfolios); Head of Investment Funds and Private Equity, Overseas Private Investment Corporation; President, First Manhattan Bancorporation, Inc.; Attorney, Simpson Thacher & Bartlett LLP | | 203 | | Vulcan Materials Company (construction materials company); Trilinc Global Impact Fund; Genesee & Wyoming, Inc. (railroads); Artio Global Investment LLC (mutual fund complex); Edgen Group, Inc. (specialized energy and infrastructure products distributor); Investment Company Institute (professional organization); Independent Directors Council (professional organization) |
| | | | | |
Eli Jones - 1961 Trustee | | 2016 | | Professor and Dean, Mays Business School - Texas A&M University Formerly: Professor and Dean, Walton College of Business, University of Arkansas and E.J. Ourso College of Business, Louisiana State University; Director, Arvest Bank | | 229 | | Insperity, Inc. (formerly known as Administaff) (human resources provider) |
| | | | | |
Elizabeth Krentzman - 1959 Trustee | | 2019 | | Formerly: Principal and Chief Regulatory Advisor for Asset Management Services and U.S. Mutual Fund Leader of Deloitte & Touche LLP; General Counsel of the Investment Company Institute (trade association); National Director of the Investment Management Regulatory Consulting Practice, Principal, Director and Senior Manager of Deloitte & Touche LLP; Assistant Director of the Division of Investment Management - Office of Disclosure and Investment Adviser Regulation of the U.S. Securities and Exchange Commission and various positions with the Division of Investment Management – Office of Regulatory Policy of the U.S. Securities and Exchange Commission; Associate at Ropes & Gray LLP; Advisory Board Member of the Securities and Exchange Commission Historical Society; and Trustee of certain Oppenheimer Funds | | 203 | | Trustee of the University of Florida National Board Foundation and Audit Committee Member; Member of the Cartica Funds Board of Directors (private investment funds); Member of the University of Florida Law Center Association, Inc. Board of Trustees and Audit Committee Member |
| | | | | |
Anthony J. LaCava, Jr. - 1956 Trustee | | 2019 | | Formerly: Director and Member of the Audit Committee, Blue Hills Bank (publicly traded financial institution) and Managing Partner, KPMG LLP | | 203 | | Blue Hills Bank; Chairman, Bentley University; Member, Business School Advisory Council; and Nominating Committee KPMG LLP |
| | | | | |
Prema Mathai-Davis - 1950 Trustee | | 2003 | | Retired Co-Owner & Partner of Quantalytics Research, LLC, (a FinTech Investment Research Platform for the Self-Directed Investor) | | 203 | | None |
T-2 Invesco Comstock Fund
Trustees and Officers–(continued)
| | | | | | | | |
Name, Year of Birth and
Position(s) Held with the Trust | | Trustee and/or Officer Since | | Principal Occupation(s) During Past 5 Years | | Number of Funds in Fund Complex
Overseen by Trustee | | Other Directorship(s) Held by Trustee During Past 5
Years |
| | | |
Independent Trustees–(continued) | | | | |
| | | | | |
Joel W. Motley - 1952 Trustee | | 2019 | | Director of Office of Finance, Federal Home Loan Bank System; Member of the Vestry of Trinity Wall Street; Managing Director of Carmona Motley Inc. (privately held financial advisor); Member of the Council on Foreign Relations and its Finance and Budget Committee; Chairman Emeritus of Board of Human Rights Watch and Member of its Investment Committee; and Member of Investment Committee and Board of Historic Hudson Valley (non-profit cultural organization) Formerly: Managing Director of Public Capital Advisors, LLC (privately held financial advisor); Managing Director of Carmona Motley Hoffman, Inc. (privately held financial advisor); Trustee of certain Oppenheimer Funds; and Director of Columbia Equity Financial Corp. (privately held financial advisor) | | 203 | | Member of Board of Greenwall Foundation (bioethics research foundation) and its Investment Committee; Member of Board of Friends of the LRC (non-profit legal advocacy); Board Member and Investment Committee Member of Pulizer Center for Crisis Reporting (non-profit journalism) |
| | | | | |
Teresa M. Ressel - 1962 Trustee | | 2017 | | Non-executive director and trustee of a number of public and private business corporations Formerly: Chief Financial Officer, Olayan America, The Olayan Group (international investor/commercial/industrial); Chief Executive Officer, UBS Securities LLC; Group Chief Operating Officer, Americas, UBS AG; Assistant Secretary for Management & Budget and CFO, US Department of the Treasury | | 203 | | Atlantic Power Corporation (power generation company); ON Semiconductor Corp. (semiconductor supplier) |
| | | | | |
Ann Barnett Stern - 1957 Trustee | | 2017 | | President and Chief Executive Officer, Houston Endowment Inc. (private philanthropic institution) Formerly: Executive Vice President and General Counsel, Texas Children’s Hospital; Attorney, Beck, Redden and Secrest, LLP; Business Law Instructor, University of St. Thomas; Attorney, Andrews & Kurth LLP | | 203 | | Federal Reserve Bank of Dallas |
| | | | | |
Robert C. Troccoli - 1949 Trustee | | 2016 | | Retired Formerly: Adjunct Professor, University of Denver – Daniels College of Business; Senior Partner, KPMG LLP | | 203 | | None |
| | | | | |
Daniel S. Vandivort -1954 Trustee | | 2019 | | Treasurer, Chairman of the Audit and Finance Committee, and Trustee, Board of Trustees, Huntington Disease Foundation of America; and President, Flyway Advisory Services LLC (consulting and property management) Formerly: Trustee and Governance Chair, of certain Oppenheimer Funds | | 203 | | Chairman and Lead Independent Director, Chairman of the Audit Committee, and Director, Board of Directors, Value Line Funds |
| | | | | |
James D. Vaughn - 1945 Trustee | | 2019 | | Retired Formerly: Managing Partner, Deloitte & Touche LLP; Trustee and Chairman of the Audit Committee, Schroder Funds; Board Member, Mile High United Way, Boys and Girls Clubs, Boy Scouts, Colorado Business Committee for the Arts, Economic Club of Colorado and Metro Denver Network (economic development corporation); and Trustee of certain Oppenheimer Funds | | 203 | | Board member and Chairman of Audit Committee of AMG National Trust Bank; Trustee and Investment Committee member, University of South Dakota Foundation; Board member, Audit Committee Member and past Board Chair, Junior Achievement (non-profit) |
| | | | | |
Christopher L. Wilson - 1957 Trustee, Vice Chair and Chair Designate | | 2017 | | Retired Formerly: Director, TD Asset Management USA Inc. (mutual fund complex) (22 portfolios); Managing Partner, CT2, LLC (investing and consulting firm); President/Chief Executive Officer, Columbia Funds, Bank of America Corporation; President/Chief Executive Officer, CDC IXIS Asset Management Services, Inc.; Principal & Director of Operations, Scudder Funds, Scudder, Stevens & Clark, Inc.; Assistant Vice President, Fidelity Investments | | 203 | | ISO New England, Inc. (non-profit organization managing regional electricity market) |
T-3 Invesco Comstock Fund
Trustees and Officers–(continued)
| | | | | | | | | | |
Name, Year of Birth and
Position(s) Held with the Trust | | Trustee and/or Officer Since | | | Principal Occupation(s) During Past 5 Years | | Number of Funds in Fund Complex
Overseen by Trustee | | Other Directorship(s) Held by Trustee During Past 5
Years |
| | | | | |
Officers | | | | | | | | | | |
| | | | | |
Sheri Morris - 1964 President, Principal Executive Officer and Treasurer | | | 2003 | | | Head of Global Fund Services, Invesco Ltd.; President, Principal Executive Officer and Treasurer, The Invesco Funds; Vice President, Invesco Advisers, Inc. (formerly known as Invesco Institutional (N.A.), Inc.) (registered investment adviser); and Vice President, Invesco Exchange-Traded Fund Trust, Invesco Exchange-Traded Fund Trust II, Invesco India Exchange-Traded Fund Trust, Invesco Actively Managed Exchange-Traded Fund Trust, Invesco Actively Managed Exchange-Traded Commodity Fund Trust and Invesco Exchange-Traded Self-Indexed Fund Trust; and Vice President, OppenheimerFunds, Inc. Formerly: Vice President and Principal Financial Officer, The Invesco Funds; Vice President, Invesco AIM Advisers, Inc., Invesco AIM Capital Management, Inc. and Invesco AIM Private Asset Management, Inc.; Assistant Vice President and Assistant Treasurer, The Invesco Funds and Assistant Vice President, Invesco Advisers, Inc., Invesco AIM Capital Management, Inc. and Invesco AIM Private Asset Management, Inc.; and Treasurer, Invesco Exchange-Traded Fund Trust, Invesco Exchange-Traded Fund Trust II, Invesco India Exchange-Traded Fund Trust and Invesco Actively Managed Exchange-Traded Fund Trust | | N/A | | N/A |
| | | | | |
Russell C. Burk - 1958 Senior Vice President and Senior Officer | | | 2005 | | | Senior Vice President and Senior Officer, The Invesco Funds | | N/A | | N/A |
| | | | | |
Jeffrey H. Kupor - 1968 Senior Vice President, Chief Legal Officer and Secretary | | | 2018 | | | Head of Legal of the Americas, Invesco Ltd.; Senior Vice President and Secretary, Invesco Advisers, Inc. (formerly known as Invesco Institutional (N.A.), Inc.) (registered investment adviser); Senior Vice President and Secretary, Invesco Distributors, Inc. (formerly known as Invesco AIM Distributors, Inc.); Vice President and Secretary, Invesco Investment Services, Inc. (formerly known as Invesco AIM Investment Services, Inc.) Senior Vice President, Chief Legal Officer and Secretary, The Invesco Funds; Secretary and General Counsel, Invesco Investment Advisers LLC (formerly known as Van Kampen Asset Management); Secretary and General Counsel, Invesco Capital Markets, Inc. (formerly known as Van Kampen Funds Inc.) and Chief Legal Officer, Invesco Exchange-Traded Fund Trust, Invesco Exchange-Traded Fund Trust II, Invesco India Exchange-Traded Fund Trust, Invesco Actively Managed Exchange-Traded Fund Trust, Invesco Actively Managed Exchange-Traded Commodity Fund Trust and Invesco Exchange-Traded Self-Indexed Fund Trust; Secretary, Invesco Indexing LLC; Secretary, W.L. Ross & Co., LLC Formerly: Secretary and Vice President, Jemstep, Inc.; Head of Legal, Worldwide Institutional, Invesco Ltd.; Secretary and General Counsel, INVESCO Private Capital Investments, Inc.; Senior Vice President, Secretary and General Counsel, Invesco Management Group, Inc. (formerly known as Invesco AIM Management Group, Inc.); Assistant Secretary, INVESCO Asset Management (Bermuda) Ltd.; Secretary and General Counsel, Invesco Private Capital, Inc.; Assistant Secretary and General Counsel, INVESCO Realty, Inc.; Secretary and General Counsel, Invesco Senior Secured Management, Inc.; and Secretary, Sovereign G./P. Holdings Inc. | | N/A | | N/A |
| | | | | |
Andrew R. Schlossberg - 1974 Senior Vice President | | | 2019 | | | Head of the Americas and Senior Managing Director, Invesco Ltd.; Director and Senior Vice President, Invesco Advisers, Inc. (formerly known as Invesco Institutional (N.A.), Inc.) (registered investment adviser); Director and Chairman, Invesco Investment Services, Inc. (formerly known as Invesco AIM Investment Services, Inc.) (registered transfer agent); Senior Vice President, The Invesco Funds; Director, Invesco Investment Advisers LLC (formerly known as Van Kampen Asset Management); Director, President and Chairman, Invesco Insurance Agency, Inc. Formerly: Director, Invesco UK Limited; Director and Chief Executive, Invesco Asset Management Limited and Invesco Fund Managers Limited; Assistant Vice President, The Invesco Funds; Senior Vice President, Invesco Advisers, Inc. (formerly known as Invesco Institutional (N.A.), Inc.) (registered investment adviser); Director and Chief Executive, Invesco Administration Services Limited and Invesco Global Investment Funds Limited; Director, Invesco Distributors, Inc.; Head of EMEA, Invesco Ltd.; President, Invesco Actively Managed Exchange-Traded Commodity Fund Trust, Invesco Actively Managed Exchange-Traded Fund Trust, Invesco Exchange-Traded Fund Trust, Invesco Exchange-Traded Fund Trust II and Invesco India Exchange-Traded Fund Trust; Managing Director and Principal Executive Officer, Invesco Capital Management LLC | | N/A | | N/A |
T-4 Invesco Comstock Fund
Trustees and Officers–(continued)
| | | | | | | | |
Name, Year of Birth and
Position(s) Held with the Trust | | Trustee and/or Officer Since | | Principal Occupation(s) During Past 5 Years | | Number of Funds in Fund Complex
Overseen by Trustee | | Other Directorship(s) Held by Trustee During Past 5
Years |
| | | | |
Officers–(continued) | | | | | | |
| | | | | |
John M. Zerr – 1962 Senior Vice President | | 2006 | | Chief Operating Officer of the Americas; Senior Vice President, Invesco Advisers, Inc. (formerly known as Invesco Institutional (N.A.), Inc.) (registered investment adviser); Senior Vice President, Invesco Distributors, Inc. (formerly known as Invesco AIM Distributors, Inc.); Director and Vice President, Invesco Investment Services, Inc. (formerly known as Invesco AIM Investment Services, Inc.) Senior Vice President, The Invesco Funds; Managing Director, Invesco Capital Management LLC; Director, Invesco Investment Advisers LLC (formerly known as Van Kampen Asset Management); Senior Vice President, Invesco Capital Markets, Inc. (formerly known as Van Kampen Funds Inc.); Manager, Invesco Indexing LLC; Manager, Invesco Specialized Products, LLC; Director and Senior Vice President, Invesco Insurance Agency, Inc.; Member, Invesco Canada Funds Advisory Board; Director, President and Chief Executive Officer, Invesco Corporate Class Inc. (corporate mutual fund company); and Director, Chairman, President and Chief Executive Officer, Invesco Canada Ltd. (formerly known as Invesco Trimark Ltd./Invesco Trimark Ltèe) (registered investment adviser and registered transfer agent); President, Invesco, Inc.; President, Invesco Global Direct Real Estate Feeder GP Ltd.; President, Invesco IP Holdings (Canada) Ltd; President, Invesco Global Direct Real Estate GP Ltd.; President, Invesco Financial Services Ltd. / Services Financiers Invesco Ltée; and President, Trimark Investments Ltd./Placements Trimark Ltée Formerly: Director and Senior Vice President, Invesco Management Group, Inc. (formerly known as Invesco AIM Management Group, Inc.); Secretary and General Counsel, Invesco Management Group, Inc. (formerly known as Invesco AIM Management Group, Inc.); Secretary, Invesco Investment Services, Inc. (formerly known as Invesco AIM Investment Services, Inc.); Chief Legal Officer and Secretary, The Invesco Funds; Secretary and General Counsel, Invesco Investment Advisers LLC (formerly known as Van Kampen Asset Management); Secretary and General Counsel, Invesco Capital Markets, Inc. (formerly known as Van Kampen Funds Inc.); Chief Legal Officer, Invesco Exchange-Traded Fund Trust, Invesco Exchange-Traded Fund Trust II, Invesco India Exchange-Traded Fund Trust, Invesco Actively Managed Exchange-Traded Fund Trust, Invesco Actively Managed Exchange-Traded Commodity Fund Trust and Invesco Exchange-Traded Self-Indexed Fund Trust; Secretary, Invesco Indexing LLC; Director, Secretary, General Counsel and Senior Vice President, Van Kampen Exchange Corp.; Director, Vice President and Secretary, IVZ Distributors, Inc. (formerly known as INVESCO Distributors, Inc.); Director and Vice President, INVESCO Funds Group, Inc.; Director and Vice President, Van Kampen Advisors Inc.; Director, Vice President, Secretary and General Counsel, Van Kampen Investor Services Inc.; Director and Secretary, Invesco Distributors, Inc. (formerly known as Invesco AIM Distributors, Inc.); Director, Senior Vice President, General Counsel and Secretary, Invesco AIM Advisers, Inc. and Van Kampen Investments Inc.; Director, Vice President and Secretary, Fund Management Company; Director, Senior Vice President, Secretary, General Counsel and Vice President, Invesco AIM Capital Management, Inc.; Chief Operating Officer and General Counsel, Liberty Ridge Capital, Inc. (an investment adviser) | | N/A | | N/A |
| | | | | |
Gregory G. McGreevey - 1962 Senior Vice President | | 2012 | | Senior Managing Director, Invesco Ltd.; Director, Chairman, President, and Chief Executive Officer, Invesco Advisers, Inc. (formerly known as Invesco Institutional (N.A.), Inc.) (registered investment adviser); Director, Invesco Mortgage Capital, Inc. and Invesco Senior Secured Management, Inc.; and Senior Vice President, The Invesco Funds; and President, SNW Asset Management Corporation and Invesco Managed Accounts, LLC Formerly: Senior Vice President, Invesco Management Group, Inc. and Invesco Advisers, Inc.; Assistant Vice President, The Invesco Funds | | N/A | | N/A |
| | | | | |
Kelli Gallegos - 1970 Vice President, Principal Financial Officer and Assistant Treasurer | | 2008 | | Principal Financial and Accounting Officer - Investments Pool, Invesco Specialized Products, LLC; Vice President, Principal Financial Officer and Assistant Treasurer, The Invesco Funds; Principal Financial and Accounting Officer - Pooled Investments, Invesco Capital Management LLC; Vice President and Treasurer, Invesco Exchange-Traded Fund Trust, Invesco Exchange-Traded Fund Trust II, Invesco India Exchange-Traded Fund Trust, Invesco Actively Managed Exchange-Traded Fund Trust, Invesco Actively Managed Exchange-Traded Commodity Fund Trust and Invesco Exchange-Traded Self-Indexed Fund Trust; Vice President, Invesco Advisers, Inc. Formerly: Assistant Treasurer, Invesco Specialized Products, LLC; Assistant Treasurer, Invesco Exchange-Traded Fund Trust, Invesco Exchange-Traded Fund Trust II, Invesco India Exchange-Traded Fund Trust, Invesco Actively Managed Exchange-Traded Fund Trust, Invesco Actively Managed Exchange-Traded Commodity Fund Trust and Invesco Exchange-Traded Self-Indexed Fund Trust; Assistant Treasurer, Invesco Capital Management LLC; Assistant Vice President, The Invesco Funds | | N/A | | N/A |
T-5 Invesco Comstock Fund
Trustees and Officers–(continued)
| | | | | | | | | | |
Name, Year of Birth and
Position(s) Held with the Trust | | Trustee and/or Officer Since | | | Principal Occupation(s) During Past 5 Years | | Number of Funds in Fund Complex
Overseen by Trustee | | Other Directorship(s) Held by Trustee During Past 5
Years |
Officers–(continued) | | | | | | | | | | |
| | | | | |
Crissie M. Wisdom - 1969 Anti-Money Laundering Compliance Officer | | | 2013 | | | Anti-Money Laundering and OFAC Compliance Officer for Invesco U.S. entities including: Invesco Advisers, Inc. and its affiliates, Invesco Capital Markets, Inc., Invesco Distributors, Inc., Invesco Investment Services, Inc., The Invesco Funds, Invesco Capital Management, LLC, Invesco Trust Company; OppenheimerFunds Distributor, Inc., and Fraud Prevention Manager for Invesco Investment Services, Inc. | | N/A | | N/A |
| | | | | |
Todd F. Kuehl - 1969 Chief Compliance Officer | | | 2020 | | | Chief Compliance Officer, Invesco Advisers, Inc. (registered investment adviser); and Chief Compliance Officer, The Invesco Funds Formerly: Managing Director and Chief Compliance Officer, Legg Mason (Mutual Funds); Chief Compliance Officer, Legg Mason Private Portfolio Group (registered investment adviser) | | N/A | | N/A |
The Statement of Additional Information of the Trust includes additional information about the Fund’s Trustees and is available upon request, without charge, by calling 1.800.959.4246. Please refer to the Fund’s Statement of Additional Information for information on the Fund’s sub-advisers.
| | | | | | |
| Office of the Fund | | Investment Adviser | | Distributor | | Auditors |
| 11 Greenway Plaza, Suite 1000 | | Invesco Advisers, Inc. | | Invesco Distributors, Inc. | | PricewaterhouseCoopers LLP |
| Houston, TX 77046-1173 | | 1555 Peachtree Street, N.E. | | 11 Greenway Plaza, Suite 1000 | | 1000 Louisiana Street, Suite 5800 |
| | Atlanta, GA 30309 | | Houston, TX 77046-1173 | | Houston, TX 77002-5678 |
| | | |
| Counsel to the Fund | | Counsel to the Independent Trustees | | Transfer Agent | | Custodian |
| Stradley Ronon Stevens & Young, LLP | | Goodwin Procter LLP | | Invesco Investment Services, Inc. | | State Street Bank and Trust Company |
| 2005 Market Street, Suite 2600 | | 901 New York Avenue, N.W. | | 11 Greenway Plaza, Suite 1000 | | 225 Franklin Street |
| Philadelphia, PA 19103-7018 | | Washington, D.C. 20001 | | Houston, TX 77046-1173 | | Boston, MA 02110-2801 |
T-6 Invesco Comstock Fund
(This page intentionally left blank)
(This page intentionally left blank)
(This page intentionally left blank)

Go paperless with eDelivery
Visit invesco.com/edelivery to enjoy the convenience and security of anytime electronic access to your investment documents.
With eDelivery, you can elect to have any or all of the following materials delivered straight to your inbox to download, save and print from your own computer:
∎ Fund reports and prospectuses
∎ Quarterly statements
∎ Daily confirmations
∎ Tax forms
Invesco mailing information
Send general correspondence to Invesco Investment Services, Inc., P.O. Box 219078, Kansas City, MO 64121-9078.
Important notice regarding delivery of security holder documents
To reduce Fund expenses, only one copy of most shareholder documents may be mailed to shareholders with multiple accounts at the same address (Householding). Mailing of your shareholder documents may be householded indefinitely unless you instruct us otherwise. If you do not want the mailing of these documents to be combined with those for other members of your household, please contact Invesco Investment Services, Inc. at 800 959 4246 or contact your financial institution. We will begin sending you individual copies for each account within 30 days after receiving your request.
Fund holdings and proxy voting information
The Fund provides a complete list of its holdings four times in each fiscal year, at the quarter-ends. For the second and fourth quarters, the list appears in the Fund’s semiannual and annual reports to shareholders. For the first and third quarters, the Fund files the lists with the Securities and Exchange Commission (SEC) as an exhibit to its reports on Form N-PORT. The most recent list of portfolio holdings is available at invesco.com/completeqtrholdings. Shareholders can also look up the Fund’s Form N-PORT filings on the SEC website, sec.gov. The SEC file numbers for the Fund are shown below.
A description of the policies and procedures that the Fund uses to determine how to vote proxies relating to portfolio securities is available without charge, upon request, from our Client Services department at 800 959 4246, or at invesco.com/ proxyguidelines. The information is also available on the SEC website, sec.gov.
| | |
Information regarding how the Fund voted proxies related to its portfolio securities during the most recent 12-month period ended June 30 is available at invesco.com/proxysearch. This information is also available on the SEC website, sec.gov. Invesco Advisers, Inc. is an investment adviser; it provides investment advisory services to individual and institutional clients and does not sell securities. Invesco Distributors, Inc. is the US distributor for Invesco Ltd.’s retail mutual funds, exchange-traded funds and institutional money market funds. Both are wholly owned, indirect subsidiaries of Invesco Ltd. | | |
| | | | |
| SEC file numbers: 811-03826 and 002-85905 | | Invesco Distributors, Inc. | | VK-COM-AR-1 |
| | | | |
| | |
 | | Annual Report to Shareholders | | April 30, 2020 |
| | |
| | Invesco Dividend Income Fund |
| | Nasdaq: | | |
| | A: IAUTX ∎ C: IUTCX ∎ R IRTCX ∎ Y: IAUYX ∎ Investor: FSTUX ∎ R5: FSIUX ∎ R6: IFUTX |

Beginning on January 1, 2021, as permitted by regulations adopted by the Securities and Exchange Commission, paper copies of the Fund’s shareholder reports will no longer be sent by mail, unless you specifically request paper copies of the reports from the Fund or from your financial intermediary, such as a broker-dealer or bank. Instead, the reports will be made available on the Fund’s web-site, and you will be notified by mail each time a report is posted and provided with a website link to access the report.
If you already elected to receive shareholder reports electronically, you will not be affected by this change and you need not take any action. You may elect to receive shareholder reports and other communications from the Fund electronically by contacting your financial intermediary (such as a broker-dealer or bank) or, if you are a direct investor, by enrolling at invesco.com/edelivery.
You may elect to receive all future reports in paper free of charge. If you invest through a financial intermediary, you can contact your financial intermediary to request that you continue to receive paper copies of your shareholder reports. If you invest directly with the Fund, you can call (800) 959-4246 to let the Fund know you wish to continue receiving paper copies of your shareholder reports. Your election to receive reports in paper will apply to all funds held with your financial intermediary or all funds held with the fund complex if you invest directly with the Fund.
Letters to Shareholders
| | |

Andrew Schlossberg | | Dear Shareholders: This annual report includes information about your Fund, including performance data and a complete list of its investments as of the close of the reporting period. Inside is a discussion of how your Fund was managed and the factors that affected its performance during the reporting period. Global equities and fixed-income securities faced a tumultuous environment during the reporting period. This was particularly true in the later stages of the period as a pandemic gripped the world and unsettled markets. At the onset of the reporting period, global equity markets were buoyed by a more accommodative stance from central banks. Despite US-China trade concerns and signs of slowing global growth, which led to some market volatility along the way, the second and third quarters of 2019 were relatively calm. In the final months of 2019, better-than-expected third quarter corporate earnings and initial agreement of the phase one US-China trade deal provided a favorable backdrop for equities and impressive fourth quarter global equity returns. |
The first quarter of 2020 proved to be a wild roller-coaster ride as the year began with US investors treated to equity gains culminating in record highs on February 19, 2020. The first half of the quarter, however, belied the impact the coronavirus (COVID-19) would have on markets in a world faced with shuttered businesses and global lockdowns. Equity markets began to sell off in late February and plummeted in March. The speed and depth of market declines and reversals during the month made March 2020 one of the most volatile months on record. While equities languished, government bonds largely performed as expected as central banks cut interest rates, which lowered bond yields but sent bond prices soaring. Like equities, however, corporate bond prices fell due to the impact of diminished corporate profits. Commodity prices, sans gold, largely declined during the first quarter. Oil prices suffered steep declines losing more than half their value in March amid a demand slump due to both COVID-19 and a supply glut from the Russia-Saudi Arabi oil-price war.
In response to the financial and economic hardships caused by the pandemic, central banks and governments around the world responded with fiscal and monetary stimulus. The US Federal Reserve cut interest rates to near zero (0.00-0.25%) and announced an unprecedented quantitative easing program. The US administration also passed a $2.2 trillion economic-relief package – the largest in US history. Most major economies outside of the US provided liquidity in the bond and equity markets in the form of fiscal policy and quantitative easing.
Massive global fiscal and monetary responses prompted a significant market rebound in April, with the S&P 500 Index recording one of its best monthly performances ever, despite macroeconomic data that illustrated the enormous economic cost of the shutdowns – more than 30 million US workers have lost their jobs and the US economy contracted at a 5.0% annualized rate (second estimate) for the first quarter of 2020. The final month of the reporting period also proved less volatile than March as markets attempted to normalize. As markets and investors attempt to adapt to a new normal, we’ll see how the interplay of interest rates, economic data, geopolitics and a host of other factors affect US and overseas equity and fixed income markets.
Investor uncertainty and market volatility, such as we witnessed during the reporting period, are unfortunate facts of life when it comes to investing. That’s why Invesco encourages investors to work with a professional financial adviser who can stress the importance of starting to save and invest early and the importance of adhering to a disciplined investment plan. A financial adviser who knows your unique financial situation, investment goals and risk tolerance can be an invaluable partner as you seek to achieve your financial goals. Financial advisers can also offer a long-term perspective when markets are volatile and time-tested advice and guidance when your financial situation or investment goals change.
Visit our website for more information on your investments
Our website, invesco.com/us, offers a wide range of market insights and investment perspectives. On the website, you’ll find detailed information about our funds, including performance, holdings and portfolio manager commentaries. You can access information about your account by completing a simple, secure online registration. To do so, select “Log In” on the right side of the homepage, and then select “Register for Individual Account Access.”
In addition to the resources accessible on our website and through our mobile app, you can obtain timely updates to help you stay informed about the markets and the economy by connecting with Invesco on Twitter, LinkedIn or Facebook. You can access our blog at blog.invesco.us.com. Our goal is to provide you the information you want, when and where you want it.
Finally, I’m pleased to share with you Invesco’s commitment to both the Principles for Responsible Investment and to considering environmental, social and governance issues in our robust investment process. I invite you to learn more at invesco.com/esg.
Have questions?
For questions about your account, contact an Invesco client services representative at 800 959 4246.
All of us at Invesco look forward to serving your investment management needs. Thank you for investing with us.
Sincerely,

Andrew Schlossberg
Head of the Americas,
Senior Managing Director, Invesco Ltd.
2 Invesco Dividend Income Fund
| | |

Bruce Crockett
| | Dear Shareholders: Among the many important lessons I’ve learned in more than 40 years in a variety of business
endeavors is the value of a trusted advocate. As independent chair of the Invesco Funds Board, I can assure you that the members of the
Board are strong advocates for the interests of investors in Invesco’s mutual funds. We work hard to
represent your interests through oversight of the quality of the investment management services
your funds receive and other matters important to your investment, including but not limited to: ∎ Ensuring that Invesco offers a diverse lineup of mutual funds that your financial adviser can use
to strive to meet your financial needs as your investment goals change over time.
∎ Monitoring how the portfolio management teams of the Invesco funds are performing in light of
changing economic and market conditions.
∎ Assessing each portfolio management team’s investment performance within the context of the
investment strategy described in the fund’s prospectus. |
| ∎ | | Monitoring for potential conflicts of interests that may impact the nature of the services that your funds receive. |
We believe one of the most important services we provide our fund shareholders is the annual review of the funds’ advisory and sub-advisory contracts with Invesco Advisers and its affiliates. This review is required by the Investment Company Act of 1940 and focuses on the nature and quality of the services Invesco provides as the adviser to the Invesco funds and the reasonableness of the fees that it charges for those services. Each year, we spend months carefully reviewing information received from Invesco and a variety of independent sources, such as performance and fee data prepared by Lipper, Inc. (a subsidiary of Broadridge Financial Solutions, Inc.), an independent, third-party firm widely recognized as a leader in its field. We also meet with our independent legal counsel and other independent advisers to review and help us assess the information that we have received. Our goal is to assure that you receive quality investment management services for a reasonable fee.
I trust the measures outlined above provide assurance that you have a worthy advocate when it comes to choosing the Invesco Funds.
On behalf of the Board, we look forward to continuing to represent your interests and serving your needs.
Sincerely,

Bruce L. Crockett
Independent Chair
Invesco Funds Board of Trustees
3 Invesco Dividend Income Fund
Management’s Discussion of Fund Performance
| | | | |
Performance summary | |
For the fiscal year ended April 30, 2020, Class A shares of Invesco Dividend Income Fund (the Fund), at net asset value (NAV), outperformed the Dow Jones U.S. Select Dividend Index, the Fund’s style-specific benchmark. Your Fund’s long-term performance appears later in this report. | |
Fund vs. Indexes Total returns, April 30, 2019 to April 30, 2020, at net asset value (NAV). Performance shown does not include applicable contingent deferred sales charges (CDSC) or front-end sales charges, which would have reduced performance. | |
Class A Shares | | | -8.30 | % |
Class C Shares | | | -9.02 | |
Class R Shares* | | | -8.50 | |
Class Y Shares | | | -8.09 | |
Investor Class Shares | | | -8.32 | |
Class R5 Shares | | | -8.05 | |
Class R6 Shares | | | -7.97 | |
S&P 500 Index▼ (Broad Market Index) | | | 0.86 | |
Dow Jones U.S. Select Dividend Index∎ (Style-Specific Index) | | | -16.69 | |
Russell 1000 Value Index▼ (Style-Specific Index) | | | -11.01 | |
Lipper Equity Income Funds Indext (Peer Group Index) | | | -7.01 | |
Source(s): ▼RIMES Technologies Corp.; ∎FactSet Research Systems Inc.; tLipper Inc. | | | | |
*Class R shares incepted on April 17, 2020. See page 7 for more information. | | | | |
Market conditions and your Fund
The fiscal year proved to be another increasingly volatile period for US equities. Although the S&P 500 Index, considered representative of the US stock market, posted modest gains for the second quarter of 2019, US equities experienced increased volatility. After four consecutive months of rising stock prices, markets sold off in May 2019, along with bond yields and oil prices, as investors weighed the impact of the lingering trade war between the US and China, as well as potential tariffs imposed on Mexico.
Key issues that concerned investors in the second quarter of 2019 carried over into the third quarter. The US-China trade conflict worried investors and stifled business investment, even as the US Federal Reserve (the Fed) cut interest rates by 0.25% in July and again in September 2019.1 This environment, combined with evidence of slowing global economic growth, fueled market volatility in August 2019.
Macroeconomic issues that concerned investors in the third quarter of 2019 mostly abated during the fourth quarter, providing the backdrop for strong equity market returns. The US economy rose higher than expected, at 2.1% during the third quarter of 2019.2 During its October meeting, the Fed cut interest rates again by 0.25% based on business investment and exports remaining weak.1
During the first quarter of 2020, as the spread of the new coronavirus disrupted travel and suppressed consumer activity, investors became increasingly concerned about the global economy. At the same time, oil prices fell sharply as a price war between
Saudi Arabia and Russia threatened to boost supply even as demand was falling. Beginning in late February, equity markets declined sharply and quickly, ushering in the first bear market since the financial crisis of 2008. Though the equity market stabilized somewhat toward the end of March, all sectors declined during the downturn. Cyclical sectors, where company performance tends to be closely linked to macroeconomic changes in the business cycle, were the hardest hit.
During the fiscal year, our management discipline remained unchanged. The Fund continued to prioritize current income and long-term growth of capital by investing in what we believe to be above-market-yielding stocks that may help investors earn income, preserve assets and build capital. We believe that dividend-paying stocks may provide a conservative foundation for investors’ portfolios, and we seek to enhance the value of dividend investing by identifying above-market-yielding stocks with consistent and defensible dividends. Through fundamental research, we measure the strength and sustainability of a company’s dividend by analyzing its free cash flow potential over the next two to three years. We construct a portfolio that we believe provides above-average dividend income and the potential to build capital over the long term. We seek to manage portfolio risk utilizing careful stock selection, maintaining exposure to multiple sectors and employing a rigorous buy-and-sell discipline.
Major US equity indexes were mixed for the fiscal year with growth indexes generally outperforming value. The S&P 500 Index posted a small gain during the fiscal year, with information technology (IT) and health care as the
best-performing sectors and energy as the worst-performing sector. It is important to view the market’s performance within the context of a full market cycle. This cycle, which began in March 2009, was one of the longest expansions on record with one of the largest bull markets, despite a historically low recovery in revenue versus previous cycle troughs.3 We remain focused on our assessment of each investment’s risk-reward profile.
During the fiscal year, holdings in the health care and consumer staples sectors contributed to the Fund’s overall performance. Packaged foods company General Mills was the largest contributor, as the company benefited from increased demand for its retail products and expanded distribution of its pet food products. General Mills also improved profit margins by improving supply chain efficiency and optimizing its product portfolio. Pharmaceutical company Eli Lilly was also a top contributor to Fund performance during the fiscal year. Shares of the company performed well as newer drugs within its diabetes and immunology portfolios continued to gain market share and drive better operating performance. The company also divested its animal health business and remained focused on shareholder returns by repurchasing shares and increasing its dividend by 15%.
Holdings within the financials and energy sectors were the largest detractors from the Fund’s performance during the fiscal year. Shares of regional bank M&T Bank fell on expectations of a decline in net interest income as lower interest rates pressured asset yields, particularly within the company’s commercial loan portfolio. Integrated oil and gas company Exxon Mobil was also a large detractor from the Fund’s performance during the fiscal year. The company’s exploration and production segment was negatively impacted by elevated capital expenditures and declining unit profitability. Earnings within the company’s refining and chemicals segment were also challenged by industry capacity growth during the fiscal year.
Within the Dow Jones U.S. Select Dividend Index, the health care and industrials sectors were the best-performing sectors during the fiscal year, posting very small gains, while the energy and consumer discretionary sectors posted the largest losses. The Fund’s overweight position and stock selection in the consumer staples sector made a large contribution to the Fund’s performance versus the Dow Jones U.S. Select Dividend Index during the fiscal year. The Fund’s stock selection in the consumer discretionary sector also contributed significantly to the Fund’s relative results, along with an overweight position in the health care sector. An underweight position in the IT sector detracted the most from the Fund’s performance relative to the Dow Jones U.S. Select Dividend Index during the fiscal year.
4 Invesco Dividend Income Fund
At the close of the fiscal year, the Fund remained focused on companies that we believed were reasonably valued, had sustainable cash flows and offered defensible dividends over the next two to three years. We believe the dividend income strategy is a valuable part of a portfolio, potentially helping investors earn income, preserve assets and build capital over the long-term.
It has been our privilege to manage Invesco Dividend Income Fund, and we thank you for your investment.
| 1 | Source: US Federal Reserve |
| 2 | Source: US Bureau of Economic Analysis |
| 3 | Source(s): National Bureau of Economic Research, Ned Davis Research and FactSet Research Systems Inc. |
Portfolio Managers:
Robert Botard
Kristina Bradshaw
Chris McMeans
Meggan Walsh - Lead
The views and opinions expressed in management’s discussion of Fund performance are those of Invesco Advisers, Inc. These views and opinions are subject to change at any time based on factors such as market and economic conditions. These views and opinions may not be relied upon as investment advice or recommendations, or as an offer for a particular security. The information is not a complete analysis of every aspect of any market, country, industry, security or the Fund. Statements of fact are from sources considered reliable, but Invesco Advisers, Inc. makes no representation or warranty as to their completeness or accuracy. Although historical performance is no guarantee of future results, these insights may help you understand our investment management philosophy.
See important Fund and, if applicable, index disclosures later in this report.
5 Invesco Dividend Income Fund
Your Fund’s Long-Term Performance
Results of a $10,000 Investment – Oldest Share Class(es)
Fund and index data from 4/30/10
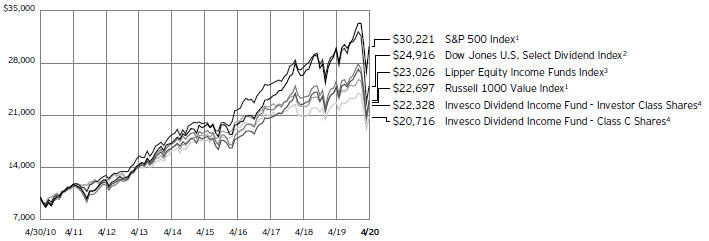
| 1 | Source: RIMES Technologies Corp. |
| 2 | Source: FactSet Research Systems Inc. |
| 4 | It is Invesco’s policy to chart the Fund’s oldest share class(es). Because Investor Class shares do not have a sales charge, we also show the oldest share class with a sales charge, Class C shares. |
Past performance cannot guarantee future results.
The data shown in the chart include reinvested distributions, applicable sales charges and Fund expenses including management
fees. Index results include reinvested dividends, but they do not reflect sales charges. Performance of the peer group, if applicable, reflects fund expenses and management fees;
performance of a market index does not. Performance shown in the chart does not reflect deduction of taxes a shareholder would pay on Fund distributions or sale of Fund shares.
6 Invesco Dividend Income Fund
| | | | |
| Average Annual Total Returns | |
| As of 4/30/20, including maximum applicable sales charges | |
| |
| Class A Shares | | | | |
| Inception (3/28/02) | | | 7.07 | % |
| 10 Years | | | 7.76 | |
5 Years | | | 2.98 | |
1 Year | | | -13.34 | |
| |
| Class C Shares | | | | |
| Inception (2/14/00) | | | 3.36 | % |
| 10 Years | | | 7.56 | |
5 Years | | | 3.37 | |
1 Year | | | -9.91 | |
| |
| Class R Shares | | | | |
| Inception | | | 7.67 | |
| 10 Years | | | 8.10 | |
5 Years | | | 3.89 | |
1 Year | | | -8.50 | |
| |
| Class Y Shares | | | | |
| Inception (10/3/08) | | | 7.77 | % |
| 10 Years | | | 8.64 | |
5 Years | | | 4.41 | |
1 Year | | | -8.09 | |
| |
| Investor Class Shares | | | | |
| Inception (6/2/86) | | | 7.94 | % |
| 10 Years | | | 8.36 | |
5 Years | | | 4.15 | |
1 Year | | | -8.32 | |
| |
| Class R5 Shares | | | | |
| Inception (10/25/05) | | | 7.23 | % |
| 10 Years | | | 8.74 | |
5 Years | | | 4.45 | |
1 Year | | | -8.05 | |
| |
| Class R6 Shares | | | | |
| 10 Years | | | 8.66 | % |
5 Years | | | 4.55 | |
1 Year | | | -7.97 | |
Class R shares incepted on April 17, 2020. Performance shown prior to that date is that of Investor Class shares restated to reflect the higher 12b-1 fees applicable to Class R shares.
Class R6 shares incepted on September 24, 2012. Performance shown prior to that date is that of Class A shares and includes the 12b-1 fees applicable to Class A shares.
The performance data quoted represent past performance and cannot guarantee future results; current performance may be lower or higher. Please visit invesco.com/ performance for the most recent month-end performance. Performance figures reflect reinvested distributions, changes in net asset value and the effect of the maximum sales charge unless otherwise stated. Performance figures do not reflect deduction of taxes a shareholder would pay on Fund distributions or sale of Fund shares. Investment return and principal value will
fluctuate so that you may have a gain or loss when you sell shares.
Class A share performance reflects the maximum 5.50% sales charge, and Class C share performance reflects the applicable contingent deferred sales charge (CDSC) for the period involved. The CDSC on Class C shares is 1% for the first year after purchase. Class R, Class Y, Investor Class, Class R5 and Class R6 shares do not have a front-end sales charge or a CDSC; therefore, performance is at net asset value.
The performance of the Fund’s share classes will differ primarily due to different sales charge structures and class expenses.
Fund performance reflects any applicable fee waivers and/or expense reimbursements. Had the adviser not waived fees and/or reimbursed expenses currently or in the past, returns would have been lower. See current prospectus for more information.
7 Invesco Dividend Income Fund
Invesco Dividend Income Fund’s investment objective is current income and long-term growth of capital.
| ∎ | | Unless otherwise stated, information presented in this report is as of April 30, 2020, and is based on total net assets. |
| ∎ | | Unless otherwise noted, all data provided by Invesco. |
| ∎ | | To access your Fund’s reports/prospectus, visit invesco.com/fundreports. |
About indexes used in this report
| ∎ | | The S&P 500® Index is an unmanaged index considered representative of the US stock market. |
| ∎ | | The Dow Jones U.S. Select Dividend™ Index represents the country’s leading stocks by dividend yield. |
| ∎ | | The Russell 1000® Value Index is an unmanaged index considered representative of large-cap value stocks. The Russell 1000 Value Index is a trademark/service mark of the Frank Russell Co. Russell® is a trademark of the Frank Russell Co. |
| ∎ | | The Lipper Equity Income Funds Index is an unmanaged index considered representative of equity income funds tracked by Lipper. |
| ∎ | | The Fund is not managed to track the performance of any particular index, including the index(es) described here, and consequently, the performance of the Fund may deviate significantly from the performance of the index(es). |
| ∎ | | A direct investment cannot be made in an index. Unless otherwise indicated, index results include reinvested dividends, and they do not reflect sales charges. Performance of the peer group, if applicable, reflects fund expenses; performance of a market index does not. |
Liquidity Risk Management Program
The Securities and Exchange Commission has adopted Rule 22e-4 under the Investment Company Act of 1940 (the “Liquidity Rule”) in order to promote effective liquidity risk management throughout the open-end investment company industry, thereby reducing the risk that funds will be unable to meet their redemption obligations and mitigating dilution of the interests of fund shareholders. The Fund has adopted and implemented a liquidity risk management program in accordance with the Liquidity Rule (the “Program”). The Program is reasonably designed to assess and manage the Fund’s liquidity risk, which is the risk that the Fund could not meet redemption requests without significant dilution of remaining investors’ interests in the Fund. The Board of Trustees of the Fund (the “Board”) has appointed Invesco Advisers, Inc. (“Invesco”), the Fund’s investment adviser, as the Program’s administrator, and Invesco has delegated oversight of the Program to the Liquidity Risk Management Committee (the “Committee”), which is
composed of senior representatives from relevant business groups at Invesco.
As required by the Liquidity Rule, the Program includes policies and procedures providing for an assessment, no less frequently than annually, of the Fund’s liquidity risk that takes into account, as relevant to the Fund’s liquidity risk: (1) the Fund’s investment strategy and liquidity of portfolio investments during both normal and reasonably foreseeable stressed conditions; (2) short-term and long-term cash flow projections for the Fund during both normal and reasonably foreseeable stressed conditions; and (3) the Fund’s holdings of cash and cash equivalents and any borrowing arrangements. The Liquidity Rule also requires the classification of the Fund’s investments into categories that reflect the assessment of their relative liquidity under current market conditions. The Fund classifies its investments into one of four categories defined in the Liquidity Rule: “Highly Liquid,” “Moderately Liquid,” “Less Liquid” and “Illiquid.” Funds that are not invested primarily in “Highly Liquid Investments” that are assets (cash or investments that are reasonably expected to be convertible into cash within three business days without significantly changing the market value of the investment) are required to establish a “Highly Liquid Investment Minimum” (“HLIM”), which is the minimum percentage of net assets that must be invested in Highly Liquid Investments. Funds with HLIMs have procedures for addressing HLIM shortfalls, including reporting to the Board and the SEC (on a non-public basis) as required by the Program and the Liquidity Rule. In addition, the Fund may not acquire an investment if, immediately after the acquisition, over 15% of the Fund’s net assets would consist of “Illiquid Investments” that are assets (an investment that cannot reasonably be expected to be sold or disposed of in current market conditions in seven calendar days or less without the sale or disposition significantly changing the market value of the investment). The Liquidity Rule and the Program also require reporting to the Board and the SEC (on a non-public basis) if a Fund’s holdings of Illiquid Investments exceed 15% of the Fund’s assets.
At a meeting held on March 30-April 1, 2020, the Committee presented a report to the Board that addressed the operation of the Program and assessed the Program’s adequacy and effectiveness of implementation (the “Report”). The Report covered the period from December 1, 2018 through December 31, 2019 (the “Program Reporting Period”).
The Report stated, in relevant part, that during the Program Reporting Period:
| ∎ | | The Program, as adopted and implemented, remained reasonably designed to assess and manage the Fund’s liquidity risk and was operated effectively to achieve that goal; |
| ∎ | | The Fund’s investment strategy remained appropriate for an open-end fund; |
| ∎ | | The Fund was able to meet requests for redemption without significant dilution of remaining investors’ interests in the Fund; |
| ∎ | | The Fund did not breach the 15% limit on Illiquid Investments; and |
| ∎ | | The Fund primarily held Highly Liquid Investments and therefore has not adopted an HLIM. |
|
This report must be accompanied or preceded by a currently effective Fund prospectus, which contains more complete information, including sales charges and expenses. Investors should read it carefully before investing. |
NOT FDIC INSURED | MAY LOSE VALUE | NO BANK GUARANTEE |
8 Invesco Dividend Income Fund
Fund Information
Portfolio Composition
| | |
| By sector | | % of total net assets |
Consumer Staples | | 21.37% |
Utilities | | 14.72 |
Health Care | | 11.95 |
Financials | | 10.53 |
Industrials | | 9.13 |
Consumer Discretionary | | 6.79 |
Communication Services | | 5.46 |
Energy | | 4.18 |
Information Technology | | 3.19 |
Materials | | 3.02 |
Real Estate | | 2.57 |
Money Market Funds Plus Other Assets Less Liabilities | | 7.09 |
Top 10 Equity Holdings*
| | | | |
| | | | | % of total net assets |
1. | | Procter & Gamble Co. (The) | | 3.33% |
| 2. | | Johnson & Johnson | | 3.11 |
| 3. | | General Mills, Inc. | | 3.07 |
| 4. | | Lockheed Martin Corp. | | 2.71 |
| 5. | | Verizon Communications, Inc. | | 2.70 |
| 6. | | Campbell Soup Co. | | 2.69 |
| 7. | | Dominion Energy, Inc. | | 2.49 |
| 8. | | Coca-Cola Co. (The) | | 2.35 |
| 9. | | AT&T, Inc. | | 2.22 |
| 10. | | National Grid PLC | | 2.19 |
The Fund’s holdings are subject to change, and there is no assurance that the Fund will continue to hold any particular security.
* Excluding money market fund holdings, if any.
Data presented here are as of April 30, 2020.
9 Invesco Dividend Income Fund
Schedule of Investments(a)
April 30, 2020
| | | | | | |
| | | Shares | | | Value |
Common Stocks & Other Equity Interests–92.90% |
Aerospace & Defense–3.33% |
General Dynamics Corp. | | | 171,811 | | | $ 22,441,953 |
Lockheed Martin Corp. | | | 252,963 | | | 98,417,785 |
| | | | | | | 120,859,738 |
|
| Asset Management & Custody Banks–0.75% |
Waddell & Reed Financial, Inc., Class A | | | 1,860,401 | | | 27,068,834 |
|
| Automobile Manufacturers–0.76% |
Bayerische Motoren Werke AG (Germany) | | | 465,360 | | | 27,529,984 |
| | |
| Brewers–1.77% | | | | | | |
Molson Coors Beverage Co., Class B | | | 1,563,926 | | | 64,136,605 |
|
| Communications Equipment–1.49% |
Cisco Systems, Inc. | | | 1,272,010 | | | 53,907,784 |
|
| Construction Machinery & Heavy Trucks–0.75% |
Caterpillar, Inc. | | | 234,399 | | | 27,279,356 |
| | |
| Diversified Banks–1.29% | | | | | | |
Bank of America Corp. | | | 1,942,601 | | | 46,719,554 |
| | |
| Electric Utilities–5.64% | | | | | | |
Duke Energy Corp. | | | 490,170 | | | 41,497,792 |
Entergy Corp. | | | 337,660 | | | 32,249,907 |
Exelon Corp. | | | 1,503,668 | | | 55,756,009 |
Pinnacle West Capital Corp. | | | 377,125 | | | 29,034,854 |
Portland General Electric Co. | | | 985,796 | | | 46,125,395 |
| | | | | | | 204,663,957 |
|
| Electrical Components & Equipment–3.14% |
ABB Ltd. (Switzerland) | | | 2,767,741 | | | 52,610,884 |
Emerson Electric Co. | | | 1,076,329 | | | 61,383,043 |
| | | | | | | 113,993,927 |
|
| Fertilizers & Agricultural Chemicals–0.17% |
Nutrien Ltd. (Canada) | | | 169,177 | | | 6,041,732 |
|
| Food Distributors–0.83% |
Sysco Corp. | | | 537,364 | | | 30,237,472 |
| | |
| Gas Utilities–3.11% | | | | | | |
National Fuel Gas Co. | | | 1,590,217 | | | 65,198,897 |
Southwest Gas Holdings, Inc. | | | 629,965 | | | 47,751,347 |
| | | | | | | 112,950,244 |
|
| General Merchandise Stores–1.77% |
Target Corp. | | | 585,362 | | | 64,237,626 |
|
| Health Care Equipment–0.75% |
Medtronic PLC | | | 280,126 | | | 27,348,701 |
|
| Home Improvement Retail–1.36% |
Lowe’s Cos., Inc. | | | 470,885 | | | 49,325,204 |
|
| Household Products–4.90% |
Kimberly-Clark Corp. | | | 412,485 | | | 57,120,923 |
| | | | | | |
| | | Shares | | | Value |
| Household Products–(continued) |
Procter & Gamble Co. (The) | | | 1,024,949 | | | $ 120,810,738 |
| | | | | | | 177,931,661 |
|
| Hypermarkets & Super Centers–1.10% |
Walmart, Inc. | | | 329,619 | | | 40,065,189 |
|
| Industrial Machinery–1.90% |
Kennametal, Inc. | | | 1,308,151 | | | 33,501,747 |
Snap-on, Inc. | | | 273,236 | | | 35,599,918 |
| | | | | | | 69,101,665 |
| | |
| Integrated Oil & Gas–3.40% | | | | | | |
Chevron Corp. | | | 358,343 | | | 32,967,556 |
Exxon Mobil Corp. | | | 663,182 | | | 30,818,068 |
TOTAL S.A. (France) | | | 1,652,979 | | | 59,602,019 |
| | | | | | | 123,387,643 |
|
| Integrated Telecommunication Services–5.45% |
AT&T, Inc. | | | 2,650,810 | | | 80,770,181 |
Deutsche Telekom AG (Germany) | | | 1,309,770 | | | 19,134,640 |
Verizon Communications, Inc. | | | 1,707,460 | | | 98,093,577 |
| | | | | | | 197,998,398 |
|
| IT Consulting & Other Services–1.04% |
International Business Machines Corp. | | | 301,862 | | | 37,901,793 |
|
| Motorcycle Manufacturers–0.87% |
Harley-Davidson, Inc. | | | 1,443,915 | | | 31,520,664 |
|
| Multi-line Insurance–0.99% |
Hartford Financial Services Group, Inc. (The) | | | 949,082 | | | 36,055,625 |
|
| Multi-Utilities–5.97% |
Dominion Energy, Inc. | | | 1,171,546 | | | 90,361,343 |
National Grid PLC (United Kingdom) | | | 6,755,995 | | | 79,522,785 |
Public Service Enterprise Group, Inc. | | | 452,429 | | | 22,942,675 |
Sempra Energy | | | 193,357 | | | 23,947,264 |
| | | | | | | 216,774,067 |
|
| Oil & Gas Storage & Transportation–0.78% |
Enbridge, Inc. (Canada) | | | 926,748 | | | 28,395,993 |
|
| Packaged Foods & Meats–10.40% |
Campbell Soup Co. | | | 1,958,425 | | | 97,882,082 |
Conagra Brands, Inc. | | | 1,190,642 | | | 39,815,068 |
General Mills, Inc. | | | 1,863,074 | | | 111,579,502 |
Kraft Heinz Co. (The) | | | 1,516,089 | | | 45,982,979 |
McCormick & Co., Inc. | | | 118,334 | | | 18,559,505 |
Nestle S.A. (Switzerland) | | | 604,618 | | | 63,869,469 |
| | | | | | | 377,688,605 |
| | |
| Paper Packaging–1.68% | | | | | | |
International Paper Co. | | | 819,805 | | | 28,078,321 |
Sonoco Products Co. | | | 675,021 | | | 32,968,026 |
| | | | | | | 61,046,347 |
| | |
| Pharmaceuticals–11.20% | | | | | | |
AstraZeneca PLC (United Kingdom) | | | 398,053 | | | 41,757,533 |
See accompanying Notes to Financial Statements which are an integral part of the financial statements.
10 Invesco Dividend Income Fund
| | | | | | |
| | | Shares | | | Value |
Pharmaceuticals–(continued) |
Bayer AG (Germany) | | | 897,468 | | | $ 59,392,485 |
Bristol-Myers Squibb Co. | | | 311,348 | | | 18,933,072 |
Eli Lilly and Co. | | | 417,517 | | | 64,564,829 |
GlaxoSmithKline PLC (United Kingdom) | | | 2,090,360 | | | 43,764,129 |
Johnson & Johnson | | | 751,719 | | | 112,787,919 |
Merck & Co., Inc. | | | 822,240 | | | 65,236,521 |
| | | | | | | 406,436,488 |
|
| Property & Casualty Insurance–2.40% |
Chubb Ltd. | | | 396,491 | | | 42,824,993 |
Travelers Cos., Inc. (The) | | | 436,662 | | | 44,194,561 |
| | | | | | | 87,019,554 |
|
| Regional Banks–5.11% |
Cullen/Frost Bankers, Inc. | | | 461,358 | | | 33,153,186 |
Fifth Third Bancorp | | | 2,160,478 | | | 40,379,334 |
M&T Bank Corp. | | | 652,130 | | | 73,090,730 |
Regions Financial Corp. | | | 3,617,394 | | | 38,886,986 |
| | | | | | | 185,510,236 |
|
| Restaurants–2.04% |
McDonald’s Corp. | | | 394,303 | | | 73,955,471 |
| | |
| Semiconductors–0.66% | | | | | | |
Microchip Technology, Inc. | | | 272,891 | | | 23,940,727 |
| | |
| Soft Drinks–2.35% | | | | | | |
Coca-Cola Co. (The) | | | 1,861,474 | | | 85,423,042 |
| | |
| Specialized REITs–2.57% | | | | | | |
Crown Castle International Corp. | | | 321,597 | | | 51,272,210 |
| | | | | | |
| | | Shares | | | Value |
Specialized REITs–(continued) |
Weyerhaeuser Co. | | | 1,921,001 | | | $ 42,012,292 |
| | | | | | | 93,284,502 |
|
| Specialty Chemicals–1.18% |
DuPont de Nemours, Inc. | | | 907,632 | | | 42,676,857 |
Total Common Stocks & Other Equity Interests
(Cost $3,216,174,572) | | | 3,372,415,245 |
| | |
| | | Principal
Amount | | | |
U.S. Dollar Denominated Bonds & Notes–0.01% |
Tobacco–0.01% | | | | | | |
Reynolds American, Inc. (United Kingdom), 7.00%, 08/04/2041
(Cost $358,672)(b) | | $ | 354,000 | | | 418,202 |
| | |
| | | Shares | | | |
Money Market Funds–9.53% |
Invesco Government & Agency Portfolio, Institutional Class,
0.20%(c)(d) | | | 113,108,843 | | | 113,108,843 |
Invesco Liquid Assets Portfolio, Institutional Class, 0.60%(c)(d) | | | 103,622,197 | | | 103,684,370 |
Invesco Treasury Portfolio, Institutional Class,
0.10%(c)(d) | | | 129,267,249 | | | 129,267,249 |
Total Money Market Funds
(Cost $346,017,154) | | | 346,060,462 |
TOTAL INVESTMENTS IN
SECURITIES-102.44%
(Cost $3,562,550,398) | | | 3,718,893,909 |
OTHER ASSETS LESS LIABILITIES-(2.44)% | | | (88,564,931) |
NET ASSETS-100.00% | | | $3,630,328,978 |
Investment Abbreviations:
REIT - Real Estate Investment Trust
Notes to Schedule of Investments:
| (a) | Industry and/or sector classifications used in this report are generally according to the Global Industry Classification Standard, which was developed by and is the exclusive property and a service mark of MSCI Inc. and Standard & Poor’s. |
| (b) | Security purchased or received in a transaction exempt from registration under the Securities Act of 1933, as amended (the “1933 Act”). The security may be resold pursuant to an exemption from registration under the 1933 Act, typically to qualified institutional buyers. The value of this security at April 30, 2020 represented less than 1% of the Fund’s Net Assets. |
| (c) | Affiliated issuer. The issuer and/or the Fund is a wholly-owned subsidiary of Invesco Ltd., or is affiliated by having an investment adviser that is under common control of Invesco Ltd. The table below shows the Fund’s transactions in, and earnings from, its investments in affiliates for the fiscal year ended April 30, 2020. |
| | | | | | | | | | | | | | | | | | | | | | | | | | | | |
| | | Value April 30, 2019 | | | Purchases at Cost | | | Proceeds from Sales | | | Change in Unrealized Appreciation | | | Realized Gain | | | Value April 30, 2020 | | | Dividend Income | |
Investments in Affiliated Money Market Funds: | |
Invesco Government & Agency Portfolio, Institutional Class | | $ | 30,534,078 | | | $ | 258,996,018 | | | $ | (176,421,253 | ) | | $ | - | | | $ | - | | | $ | 113,108,843 | | | $ | 520,227 | |
| |
Invesco Liquid Assets Portfolio, Institutional Class | | | 21,821,211 | | | | 140,001,460 | | | | (58,179,653 | ) | | | 40,053 | | | | 1,299 | | | | 103,684,370 | | | | 397,297 | |
| |
Invesco Treasury Portfolio, Institutional Class | | | 34,896,089 | | | | 186,614,005 | | | | (92,242,845 | ) | | | - | | | | - | | | | 129,267,249 | | | | 543,048 | |
| |
Total | | $ | 87,251,378 | | | $ | 585,611,483 | | | $ | (326,843,751 | ) | | $ | 40,053 | | | $ | 1,299 | | | $ | 346,060,462 | | | $ | 1,460,572 | |
| |
| (d) | The rate shown is the 7-day SEC standardized yield as of April 30, 2020. |
See accompanying Notes to Financial Statements which are an integral part of the financial statements.
11 Invesco Dividend Income Fund
Statement of Assets and Liabilities
April 30, 2020
| | | | |
Assets: | | | | |
Investments in securities, at value
(Cost $3,216,533,244) | | $ | 3,372,833,447 | |
| |
Investments in affiliated money market funds, at value
(Cost $346,017,154) | | | 346,060,462 | |
| |
Foreign currencies, at value
(Cost $1,185,382) | | | 1,187,122 | |
| |
Receivable for: | | | | |
Investments sold | | | 201,738,167 | |
| |
Fund shares sold | | | 1,557,925 | |
| |
Dividends | | | 11,358,243 | |
| |
Interest | | | 5,931 | |
| |
Investment for trustee deferred compensation and retirement plans | | | 318,258 | |
| |
Other assets | | | 55,932 | |
| |
Total assets | | | 3,935,115,487 | |
| |
| |
Liabilities: | | | | |
Payable for: | | | | |
Investments purchased | | | 296,951,417 | |
| |
Fund shares reacquired | | | 4,331,910 | |
| |
Amount due custodian | | | 442,605 | |
| |
Accrued fees to affiliates | | | 870,745 | |
| |
Accrued trustees’ and officers’ fees and benefits | | | 65,801 | |
| |
Accrued other operating expenses | | | 1,713,703 | |
| |
Trustee deferred compensation and retirement plans | | | 410,328 | |
| |
Total liabilities | | | 304,786,509 | |
| |
Net assets applicable to shares outstanding | | $ | 3,630,328,978 | |
| |
| |
Net assets consist of: | | | | |
Shares of beneficial interest | | $ | 3,531,173,701 | |
| |
Distributable earnings | | | 99,155,277 | |
| |
| | $ | 3,630,328,978 | |
| |
| | | | |
Net Assets: | | | | |
Class A | | $ | 2,506,396,618 | |
| |
Class C | | $ | 385,968,031 | |
| |
Class R | | $ | 97,559,739 | |
| |
Class Y | | $ | 330,421,297 | |
| |
Investor Class | | $ | 62,298,017 | |
| |
Class R5 | | $ | 2,159,129 | |
| |
Class R6 | | $ | 245,526,147 | |
| |
|
Shares outstanding, no par value, with an unlimited number of shares authorized: | |
Class A | | | 124,650,454 | |
| |
Class C | | | 18,936,526 | |
| |
Class R | | | 4,852,353 | |
| |
Class Y | | | 16,261,102 | |
| |
Investor Class | | | 3,066,791 | |
| |
Class R5 | | | 107,344 | |
| |
Class R6 | | | 12,197,450 | |
| |
Class A: | | | | |
Net asset value per share | | $ | 20.11 | |
| |
Maximum offering price per share (Net asset value of $20.11 ÷ 94.50%) | | $ | 21.28 | |
| |
Class C: | | | | |
Net asset value and offering price per share | | $ | 20.38 | |
| |
Class R: | | | | |
Net asset value and offering price per share | | $ | 20.11 | |
| |
Class Y: | | | | |
Net asset value and offering price per share | | $ | 20.32 | |
| |
Investor Class: | | | | |
Net asset value and offering price per share | | $ | 20.31 | |
| |
Class R5: | | | | |
Net asset value and offering price per share | | $ | 20.11 | |
| |
Class R6: | | | | |
Net asset value and offering price per share | | $ | 20.13 | |
| |
See accompanying Notes to Financial Statements which are an integral part of the financial statements.
12 Invesco Dividend Income Fund
Statement of Operations
For the year ended April 30, 2020
| | | | |
Investment income: | | | | |
Dividends (net of foreign withholding taxes of $1,571,735) | | $ | 47,217,186 | |
| |
Dividends from affiliated money market funds | | | 1,460,572 | |
| |
Interest | | | 754 | |
| |
Total investment income | | | 48,678,512 | |
| |
| |
Expenses: | | | | |
Advisory fees | | | 8,969,560 | |
| |
Administrative services fees | | | 212,874 | |
| |
Custodian fees | | | 50,513 | |
| |
Distribution fees: | | | | |
Class A | | | 1,914,678 | |
| |
Class C | | | 1,399,839 | |
| |
Class R | | | 14,520 | |
| |
Investor Class | | | 181,310 | |
| |
Transfer agent fees – A, C, R, Y and Investor Class | | | 1,866,076 | |
| |
Transfer agent fees – R5 | | | 2,401 | |
| |
Transfer agent fees – R6 | | | 32,528 | |
| |
Trustees’ and officers’ fees and benefits | | | 18,426 | |
| |
Registration and filing fees | | | 108,548 | |
| |
Reports to shareholders | | | 134,359 | |
| |
Professional services fees | | | 71,767 | |
| |
Other | | | 22,669 | |
| |
Total expenses | | | 15,000,068 | |
| |
Less: Fees waived and/or expense offset arrangement(s) | | | (102,848 | ) |
| |
Net expenses | | | 14,897,220 | |
| |
Net investment income | | | 33,781,292 | |
| |
| |
Realized and unrealized gain (loss) from: | | | | |
Net realized gain (loss) from: | | | | |
Investment securities | | | (40,228,128 | ) |
| |
Foreign currencies | | | 112,924 | |
| |
Forward foreign currency contracts | | | 1,227,743 | |
| |
| | | (38,887,461 | ) |
| |
Change in net unrealized appreciation (depreciation) of: | | | | |
Investment securities | | | (113,367,012 | ) |
| |
Foreign currencies | | | 207,158 | |
| |
Forward foreign currency contracts | | | (19,980 | ) |
| |
| | | (113,179,834 | ) |
| |
Net realized and unrealized gain (loss) | | | (152,067,295 | ) |
| |
Net increase (decrease) in net assets resulting from operations | | $ | (118,286,003 | ) |
| |
See accompanying Notes to Financial Statements which are an integral part of the financial statements.
13 Invesco Dividend Income Fund
Statement of Changes in Net Assets
For the years ended April 30, 2020 and 2019
| | | | | | | | |
| | | 2020 | | | 2019 | |
| |
Operations: | | | | | | | | |
Net investment income | | $ | 33,781,292 | | | $ | 42,483,660 | |
| |
Net realized gain (loss) | | | (38,887,461 | ) | | | 81,631,057 | |
| |
Change in net unrealized appreciation (depreciation) | | | (113,179,834 | ) | | | 23,993,308 | |
| |
Net increase (decrease) in net assets resulting from operations | | | (118,286,003 | ) | | | 148,108,025 | |
| |
| | |
Distributions to shareholders from distributable earnings: | | | | | | | | |
Class A | | | (24,658,771 | ) | | | (74,789,875 | ) |
| |
Class C | | | (3,518,028 | ) | | | (17,234,355 | ) |
| |
Class Y | | | (7,988,218 | ) | | | (29,436,119 | ) |
| |
Investor Class | | | (2,502,018 | ) | | | (7,473,172 | ) |
| |
Class R5 | | | (91,517 | ) | | | (221,095 | ) |
| |
Class R6 | | | (9,185,465 | ) | | | (27,738,032 | ) |
| |
Total distributions from distributable earnings | | | (47,944,017 | ) | | | (156,892,648 | ) |
| |
| | |
Share transactions-net: | | | | | | | | |
Class A | | | 1,831,924,956 | | | | (96,000,409 | ) |
| |
Class C | | | 248,665,994 | | | | (80,484,324 | ) |
| |
Class R | | | 97,930,979 | | | | – | |
| |
Class Y | | | 105,989,387 | | | | (194,241,151 | ) |
| |
Investor Class | | | (5,694,878 | ) | | | (2,168,933 | ) |
| |
Class R5 | | | 541,771 | | | | (17,802 | ) |
| |
Class R6 | | | 21,058,742 | | | | (69,423,267 | ) |
| |
Net increase (decrease) in net assets resulting from share transactions | | | 2,300,416,951 | | | | (442,335,886 | ) |
| |
Net increase (decrease) in net assets | | | 2,134,186,931 | | | | (451,120,509 | ) |
| |
| | |
Net assets: | | | | | | | | |
Beginning of year | | | 1,496,142,047 | | | | 1,947,262,556 | |
| |
End of year | | $ | 3,630,328,978 | | | $ | 1,496,142,047 | |
| |
See accompanying Notes to Financial Statements which are an integral part of the financial statements.
14 Invesco Dividend Income Fund
Financial Highlights
The following schedule presents financial highlights for a share of the Fund outstanding throughout the periods indicated.
| | | | | | | | | | | | | | | | | | | | | | | | | | | | | | | | | | | | | | | | | | | | | | | | | | | | | | | | | | | | | | | | | | | | | | |
| | | | | | | | | | | | | | | | | | | | | | | Ratio of | | Ratio of | | | | |
| | | | | | | | | | | | | | | | | | | | | | | expenses | | expenses | | | | |
| | | | | | | Net gains | | | | | | | | | | | | | | | | to average | | to average net | | | | |
| | | | | | | (losses) | | | | | | | | | | | | | | | | net assets | | assets without | | Ratio of net | | |
| | | Net asset | | | | on securities | | | | Dividends | | Distributions | | | | | | | | | | with fee waivers | | fee waivers | | investment | | |
| | | value, | | Net | | (both | | Total from | | from net | | from net | | | | Net asset | | | | Net assets, | | and/or | | and/or | | income | | |
| | | beginning | | investment | | realized and | | investment | | investment | | realized | | Total | | value, end | | Total | | end of period | | expenses | | expenses | | to average | | Portfolio |
| | | of period | | income(a) | | unrealized) | | operations | | income | | gains | | distributions | | of period | | return (b) | | (000’s omitted) | | absorbed | | absorbed | | net assets | | turnover (c) |
Class A | |
Year ended 04/30/20 | | | $ | 22.70 | | | | $ | 0.51 | | | | $ | (2.33 | ) | | | $ | (1.82 | ) | | | $ | (0.52 | ) | | | $ | (0.25 | ) | | | $ | (0.77 | ) | | | $ | 20.11 | | | | | (8.30 | )% | | | $ | 2,506,397 | | | | | 1.05 | %(d) | | | | 1.06 | %(d) | | | | 2.31 | %(d) | | | | 47 | % |
Year ended 04/30/19 | | | | 22.98 | | | | | 0.58 | | | | | 1.45 | | | | | 2.03 | | | | | (0.60 | ) | | | | (1.71 | ) | | | | (2.31 | ) | | | | 22.70 | | | | | 9.51 | | | | | 764,037 | | | | | 1.06 | | | | | 1.06 | | | | | 2.54 | | | | | 4 | |
Year ended 04/30/18 | | | | 23.96 | | | | | 0.51 | | | | | (0.42 | ) | | | | 0.09 | | | | | (0.47 | ) | | | | (0.60 | ) | | | | (1.07 | ) | | | | 22.98 | | | | | 0.21 | | | | | 862,915 | | | | | 1.01 | | | | | 1.02 | | | | | 2.12 | | | | | 11 | |
Year ended 04/30/17 | | | | 22.32 | | | | | 0.41 | | | | | 1.80 | | | | | 2.21 | | | | | (0.41 | ) | | | | (0.16 | ) | | | | (0.57 | ) | | | | 23.96 | | | | | 10.00 | | | | | 1,143,946 | | | | | 1.03 | | | | | 1.05 | | | | | 1.74 | | | | | 6 | |
Year ended 04/30/16 | | | | 21.03 | | | | | 0.40 | | | | | 1.77 | | | | | 2.17 | | | | | (0.41 | ) | | | | (0.47 | ) | | | | (0.88 | ) | | | | 22.32 | | | | | 10.72 | | | | | 867,596 | | | | | 1.13 | | | | | 1.17 | | | | | 1.91 | | | | | 9 | |
Class C | |
Year ended 04/30/20 | | | | 23.01 | | | | | 0.35 | | | | | (2.37 | ) | | | | (2.02 | ) | | | | (0.36 | ) | | | | (0.25 | ) | | | | (0.61 | ) | | | | 20.38 | | | | | (9.02 | ) | | | | 385,968 | | | | | 1.80 | (d) | | | | 1.81 | (d) | | | | 1.56 | (d) | | | | 47 | |
Year ended 04/30/19 | | | | 23.28 | | | | | 0.42 | | | | | 1.46 | | | | | 1.88 | | | | | (0.44 | ) | | | | (1.71 | ) | | | | (2.15 | ) | | | | 23.01 | | | | | 8.65 | | | | | 152,988 | | | | | 1.81 | | | | | 1.81 | | | | | 1.79 | | | | | 4 | |
Year ended 04/30/18 | | | | 24.26 | | | | | 0.33 | | | | | (0.42 | ) | | | | (0.09 | ) | | | | (0.29 | ) | | | | (0.60 | ) | | | | (0.89 | ) | | | | 23.28 | | | | | (0.52 | ) | | | | 236,168 | | | | | 1.76 | | | | | 1.77 | | | | | 1.37 | | | | | 11 | |
Year ended 04/30/17 | | | | 22.60 | | | | | 0.24 | | | | | 1.82 | | | | | 2.06 | | | | | (0.24 | ) | | | | (0.16 | ) | | | | (0.40 | ) | | | | 24.26 | | | | | 9.16 | | | | | 311,194 | | | | | 1.78 | | | | | 1.80 | | | | | 0.99 | | | | | 6 | |
Year ended 04/30/16 | | | | 21.28 | | | | | 0.25 | | | | | 1.80 | | | | | 2.05 | | | | | (0.26 | ) | | | | (0.47 | ) | | | | (0.73 | ) | | | | 22.60 | | | | | 9.94 | | | | | 154,584 | | | | | 1.88 | | | | | 1.92 | | | | | 1.16 | | | | | 9 | |
Class R | | | | | | | | | | | | | | | | | | | | | | | | | | | | | | | | | | | | | | | | | | | | | | | | | | | | | | | | | | | | | | | | | | | | | | |
Year ended 04/30/20(e) | | | | 20.18 | | | | | 0.01 | | | | | (0.08 | ) | | | | (0.07 | ) | | | | – | | | | | – | | | | | – | | | | | 20.11 | | | | | (0.35 | ) | | | | 97,560 | | | | | 1.20 | (d)(f) | | | | 1.21 | (d)(f) | | | | 2.16 | (d)(f) | | | | 47 | |
Class Y | | | | | | | | | | | | | | | | | | | | | | | | | | | | | | | | | | | | | | | | | | | | | | | | | | | | | | | | | | | | | | | | | | | | | | |
Year ended 04/30/20 | | | | 22.94 | | | | | 0.57 | | | | | (2.36 | ) | | | | (1.79 | ) | | | | (0.58 | ) | | | | (0.25 | ) | | | | (0.83 | ) | | | | 20.32 | | | | | (8.09 | ) | | | | 330,421 | | | | | 0.81 | (d) | | | | 0.82 | (d) | | | | 2.55 | (d) | | | | 47 | |
Year ended 04/30/19 | | | | 23.21 | | | | | 0.65 | | | | | 1.46 | | | | | 2.11 | | | | | (0.67 | ) | | | | (1.71 | ) | | | | (2.38 | ) | | | | 22.94 | | | | | 9.76 | | | | | 248,641 | | | | | 0.81 | | | | | 0.81 | | | | | 2.79 | | | | | 4 | |
Year ended 04/30/18 | | | | 24.19 | | | | | 0.58 | | | | | (0.43 | ) | | | | 0.15 | | | | | (0.53 | ) | | | | (0.60 | ) | | | | (1.13 | ) | | | | 23.21 | | | | | 0.48 | | | | | 444,633 | | | | | 0.76 | | | | | 0.77 | | | | | 2.37 | | | | | 11 | |
Year ended 04/30/17 | | | | 22.53 | | | | | 0.47 | | | | | 1.82 | | | | | 2.29 | | | | | (0.47 | ) | | | | (0.16 | ) | | | | (0.63 | ) | | | | 24.19 | | | | | 10.28 | | | | | 860,105 | | | | | 0.78 | | | | | 0.80 | | | | | 1.99 | | | | | 6 | |
Year ended 04/30/16 | | | | 21.22 | | | | | 0.47 | | | | | 1.78 | | | | | 2.25 | | | | | (0.47 | ) | | | | (0.47 | ) | | | | (0.94 | ) | | | | 22.53 | | | | | 11.01 | | | | | 249,625 | | | | | 0.88 | | | | | 0.92 | | | | | 2.16 | | | | | 9 | |
Investor Class | |
Year ended 04/30/20 | | | | 22.93 | | | | | 0.52 | | | | | (2.37 | ) | | | | (1.85 | ) | | | | (0.52 | ) | | | | (0.25 | ) | | | | (0.77 | ) | | | | 20.31 | | | | | (8.32 | ) | | | | 62,298 | | | | | 1.06 | (d) | | | | 1.07 | (d) | | | | 2.30 | (d) | | | | 47 | |
Year ended 04/30/19 | | | | 23.20 | | | | | 0.59 | | | | | 1.46 | | | | | 2.05 | | | | | (0.61 | ) | | | | (1.71 | ) | | | | (2.32 | ) | | | | 22.93 | | | | | 9.49 | | | | | 76,436 | | | | | 1.06 | | | | | 1.06 | | | | | 2.54 | | | | | 4 | |
Year ended 04/30/18 | | | | 24.18 | | | | | 0.51 | | | | | (0.42 | ) | | | | 0.09 | | | | | (0.47 | ) | | | | (0.60 | ) | | | | (1.07 | ) | | | | 23.20 | | | | | 0.23 | | | | | 79,103 | | | | | 1.01 | | | | | 1.02 | | | | | 2.12 | | | | | 11 | |
Year ended 04/30/17 | | | | 22.52 | | | | | 0.41 | | | | | 1.82 | | | | | 2.23 | | | | | (0.41 | ) | | | | (0.16 | ) | | | | (0.57 | ) | | | | 24.18 | | | | | 10.01 | | | | | 97,228 | | | | | 1.03 | | | | | 1.05 | | | | | 1.74 | | | | | 6 | |
Year ended 04/30/16 | | | | 21.22 | | | | | 0.41 | | | | | 1.78 | | | | | 2.19 | | | | | (0.42 | ) | | | | (0.47 | ) | | | | (0.89 | ) | | | | 22.52 | | | | | 10.69 | | | | | 88,691 | | | | | 1.13 | | | | | 1.17 | | | | | 1.91 | | | | | 9 | |
Class R5 | |
Year ended 04/30/20 | | | | 22.71 | | | | | 0.58 | | | | | (2.34 | ) | | | | (1.76 | ) | | | | (0.59 | ) | | | | (0.25 | ) | | | | (0.84 | ) | | | | 20.11 | | | | | (8.05 | ) | | | | 2,159 | | | | | 0.75 | (d) | | | | 0.76 | (d) | | | | 2.61 | (d) | | | | 47 | |
Year ended 04/30/19 | | | | 22.99 | | | | | 0.65 | | | | | 1.45 | | | | | 2.10 | | | | | (0.67 | ) | | | | (1.71 | ) | | | | (2.38 | ) | | | | 22.71 | | | | | 9.82 | | | | | 1,863 | | | | | 0.77 | | | | | 0.77 | | | | | 2.83 | | | | | 4 | |
Year ended 04/30/18 | | | | 23.97 | | | | | 0.58 | | | | | (0.42 | ) | | | | 0.16 | | | | | (0.54 | ) | | | | (0.60 | ) | | | | (1.14 | ) | | | | 22.99 | | | | | 0.51 | | | | | 1,914 | | | | | 0.72 | | | | | 0.73 | | | | | 2.41 | | | | | 11 | |
Year ended 04/30/17 | | | | 22.32 | | | | | 0.48 | | | | | 1.81 | | | | | 2.29 | | | | | (0.48 | ) | | | | (0.16 | ) | | | | (0.64 | ) | | | | 23.97 | | | | | 10.38 | | | | | 2,376 | | | | | 0.72 | | | | | 0.74 | | | | | 2.05 | | | | | 6 | |
Year ended 04/30/16 | | | | 21.04 | | | | | 0.47 | | | | | 1.75 | | | | | 2.22 | | | | | (0.47 | ) | | | | (0.47 | ) | | | | (0.94 | ) | | | | 22.32 | | | | | 10.98 | | | | | 551 | | | | | 0.84 | | | | | 0.85 | | | | | 2.20 | | | | | 9 | |
Class R6 | | | | | | | | | | | | | | | | | | | | | | | | | | | | | | | | | | | | | | | | | | | | | | | | | | | | | | | | | | | | | | | | | | | | | | |
Year ended 04/30/20 | | | | 22.73 | | | | | 0.60 | | | | | (2.34 | ) | | | | (1.74 | ) | | | | (0.61 | ) | | | | (0.25 | ) | | | | (0.86 | ) | | | | 20.13 | | | | | (7.97 | ) | | | | 245,526 | | | | | 0.66 | (d) | | | | 0.67 | (d) | | | | 2.70 | (d) | | | | 47 | |
Year ended 04/30/19 | | | | 23.00 | | | | | 0.67 | | | | | 1.46 | | | | | 2.13 | | | | | (0.69 | ) | | | | (1.71 | ) | | | | (2.40 | ) | | | | 22.73 | | | | | 9.96 | | | | | 252,176 | | | | | 0.69 | | | | | 0.69 | | | | | 2.91 | | | | | 4 | |
Year ended 04/30/18 | | | | 23.98 | | | | | 0.60 | | | | | (0.42 | ) | | | | 0.18 | | | | | (0.56 | ) | | | | (0.60 | ) | | | | (1.16 | ) | | | | 23.00 | | | | | 0.59 | | | | | 322,530 | | | | | 0.64 | | | | | 0.65 | | | | | 2.49 | | | | | 11 | |
Year ended 04/30/17 | | | | 22.34 | | | | | 0.50 | | | | | 1.80 | | | | | 2.30 | | | | | (0.50 | ) | | | | (0.16 | ) | | | | (0.66 | ) | | | | 23.98 | | | | | 10.42 | | | | | 83,352 | | | | | 0.64 | | | | | 0.66 | | | | | 2.13 | | | | | 6 | |
Year ended 04/30/16 | | | | 21.05 | | | | | 0.49 | | | | | 1.77 | | | | | 2.26 | | | | | (0.50 | ) | | | | (0.47 | ) | | | | (0.97 | ) | | | | 22.34 | | | | | 11.13 | | | | | 63,000 | | | | | 0.74 | | | | | 0.75 | | | | | 2.30 | | | | | 9 | |
| (a) | Calculated using average shares outstanding. |
| (b) | Includes adjustments in accordance with accounting principles generally accepted in the United States of America and as such, the net asset value for financial reporting purposes and the returns based upon those net asset values may differ from the net asset value and returns for shareholder transactions. Does not include sales charges and is not annualized for periods less than one year, if applicable. |
| (c) | Portfolio turnover is calculated at the fund level and is not annualized for periods less than one year, if applicable. For the year ended April 30, 2020, the portfolio turnover calculation excludes the value of securities purchased of $2,372,954,426 in connection with the acquisitions of Invesco Oppenheimer Dividend Opportunity Fund and Invesco Oppenheimer Equity Income Fund into the Fund. |
| (d) | Ratios are based on average daily net assets (000’s omitted) of $769,978, $139,984, $96,759, $221,555 , $72,524 , $2,419 and $239,857 for Class A, Class C, Class R, Class Y, Investor Class, Class R5 and Class R6 shares, respectively. |
| (e) | Commencement date of April 17, 2020. |
See accompanying Notes to Financial Statements which are an integral part of the financial statements.
15 Invesco Dividend Income Fund
Notes to Financial Statements
April 30, 2020
NOTE 1–Significant Accounting Policies
Invesco Dividend Income Fund (the “Fund”) is a series portfolio of AIM Sector Funds (Invesco Sector Funds) (the “Trust”). The Trust is a Delaware statutory trust registered under the Investment Company Act of 1940, as amended (the “1940 Act”), as an open-end series management investment company authorized to issue an unlimited number of shares of beneficial interest. Information presented in these financial statements pertains only to the Fund. Matters affecting the Fund or each class will be voted on exclusively by the shareholders of the Fund or each class.
The Fund’s investment objective is current income and long-term growth of capital.
The Fund currently consists of seven different classes of shares: Class A, Class C, Class R, Class Y, Investor Class, Class R5 and Class R6. On April 17, 2020, the Fund began offering Class R shares. Class Y and Investor Class shares are available only to certain investors. Class A shares are sold with a front-end sales charge unless certain waiver criteria are met. Under certain circumstances, load waived shares may be subject to contingent deferred sales charges (“CDSC”). Class C shares are sold with a CDSC. Class R, Class Y, Investor Class, Class R5 and Class R6 shares are sold at net asset value. Class C shares held for ten years after purchase are eligible for automatic conversion into Class A shares of the same Fund (the “Conversion Feature”). The automatic conversion pursuant to the Conversion Feature will generally occur at the end of the month following the tenth anniversary after a purchase of Class C shares.
The Fund is an investment company and accordingly follows the investment company accounting and reporting guidance in accordance with Financial Accounting Standards Board Accounting Standards Codification Topic 946, Financial Services – Investment Companies.
The following is a summary of the significant accounting policies followed by the Fund in the preparation of its financial statements.
| A. | Security Valuations – Securities, including restricted securities, are valued according to the following policy. |
A security listed or traded on an exchange (except convertible securities) is valued at its last sales price or official closing price as of the close of the customary trading session on the exchange where the security is principally traded, or lacking any sales or official closing price on a particular day, the security may be valued at the closing bid price on that day. Securities traded in the over-the-counter market are valued based on prices furnished by independent pricing services or market makers. When such securities are valued by an independent pricing service they may be considered fair valued. Futures contracts are valued at the final settlement price set by an exchange on which they are principally traded. Listed options are valued at the mean between the last bid and asked prices from the exchange on which they are principally traded. Options not listed on an exchange are valued by an independent source at the mean between the last bid and asked prices. For purposes of determining net asset value (“NAV”) per share, futures and option contracts generally are valued 15 minutes after the close of the customary trading session of the New York Stock Exchange (“NYSE”).
Investments in open-end and closed-end registered investment companies that do not trade on an exchange are valued at the end-of-day net asset value per share. Investments in open-end and closed-end registered investment companies that trade on an exchange are valued at the last sales price or official closing price as of the close of the customary trading session on the exchange where the security is principally traded.
Debt obligations (including convertible securities) and unlisted equities are fair valued using an evaluated quote provided by an independent pricing service. Evaluated quotes provided by the pricing service may be determined without exclusive reliance on quoted prices, and may reflect appropriate factors such as institution-size trading in similar groups of securities, developments related to specific securities, dividend rate (for unlisted equities), yield (for debt obligations), quality, type of issue, coupon rate (for debt obligations), maturity (for debt obligations), individual trading characteristics and other market data. Pricing services generally value debt obligations assuming orderly transactions of institutional round lot size, but a fund may hold or transact in the same securities in smaller, odd lot sizes. Odd lots often trade at lower prices than institutional round lots. Debt obligations are subject to interest rate and credit risks. In addition, all debt obligations involve some risk of default with respect to interest and/or principal payments.
Foreign securities’ (including foreign exchange contracts) prices are converted into U.S. dollar amounts using the applicable exchange rates as of the close of the NYSE. If market quotations are available and reliable for foreign exchange-traded equity securities, the securities will be valued at the market quotations. Because trading hours for certain foreign securities end before the close of the NYSE, closing market quotations may become unreliable. If between the time trading ends on a particular security and the close of the customary trading session on the NYSE, events occur that the investment adviser determines are significant and make the closing price unreliable, the Fund may fair value the security. If the event is likely to have affected the closing price of the security, the security will be valued at fair value in good faith using procedures approved by the Board of Trustees. Adjustments to closing prices to reflect fair value may also be based on a screening process of an independent pricing service to indicate the degree of certainty, based on historical data, that the closing price in the principal market where a foreign security trades is not the current value as of the close of the NYSE. Foreign securities’ prices meeting the approved degree of certainty that the price is not reflective of current value will be priced at the indication of fair value from the independent pricing service. Multiple factors may be considered by the independent pricing service in determining adjustments to reflect fair value and may include information relating to sector indices, American Depositary Receipts and domestic and foreign index futures. Foreign securities may have additional risks including exchange rate changes, potential for sharply devalued currencies and high inflation, political and economic upheaval, the relative lack of issuer information, relatively low market liquidity and the potential lack of strict financial and accounting controls and standards.
Securities for which market prices are not provided by any of the above methods may be valued based upon quotes furnished by independent sources. The last bid price may be used to value equity securities. The mean between the last bid and asked prices is used to value debt obligations, including corporate loans.
Securities for which market quotations are not readily available or became unreliable are valued at fair value as determined in good faith by or under the supervision of the Trust’s officers following procedures approved by the Board of Trustees. Issuer specific events, market trends, bid/asked quotes of brokers and information providers and other market data may be reviewed in the course of making a good faith determination of a security’s fair value.
The Fund may invest in securities that are subject to interest rate risk, meaning the risk that the prices will generally fall as interest rates rise and, conversely, the prices will generally rise as interest rates fall. Specific securities differ in their sensitivity to changes in interest rates depending on their individual characteristics. Changes in interest rates may result in increased market volatility, which may affect the value and/or liquidity of certain Fund investments.
Valuations change in response to many factors including the historical and prospective earnings of the issuer, the value of the issuer’s assets, general market conditions which are not specifically related to the particular issuer, such as real or perceived adverse economic conditions, changes in the general outlook for revenues or corporate earnings, changes in interest or currency rates, regional or global instability, natural or environmental disasters, widespread disease or other public health issues, war, acts of terrorism or adverse investor sentiment generally and market liquidity. Because of the inherent uncertainties of valuation, the values reflected in the financial statements may materially differ from the value received upon actual sale of those investments.
| B. | Securities Transactions and Investment Income – Securities transactions are accounted for on a trade date basis. Realized gains or losses on sales are computed on the basis of specific identification of the securities sold. Interest income (net of withholding tax, if any) is recorded on an accrual basis from settlement date. Dividend income (net of withholding tax, if any) is recorded on the ex-dividend date. |
The Fund may periodically participate in litigation related to Fund investments. As such, the Fund may receive proceeds from litigation settlements. Any proceeds received are included in the Statement of Operations as realized gain (loss) for investments no longer held and as unrealized gain (loss) for investments still held.
Brokerage commissions and mark ups are considered transaction costs and are recorded as an increase to the cost basis of securities purchased and/or a reduction of proceeds on a sale of securities. Such transaction costs are included in the determination of net realized and unrealized gain (loss) from investment
16 Invesco Dividend Income Fund
securities reported in the Statement of Operations and the Statement of Changes in Net Assets and the net realized and unrealized gains (losses) on securities per share in the Financial Highlights. Transaction costs are included in the calculation of the Fund’s net asset value and, accordingly, they reduce the Fund’s total returns. These transaction costs are not considered operating expenses and are not reflected in net investment income reported in the Statement of Operations and the Statement of Changes in Net Assets, or the net investment income per share and the ratios of expenses and net investment income reported in the Financial Highlights, nor are they limited by any expense limitation arrangements between the Fund and the investment adviser.
The Fund allocates income and realized and unrealized capital gains and losses to a class based on the relative net assets of each class.
| C. | Country Determination – For the purposes of making investment selection decisions and presentation in the Schedule of Investments, the investment adviser may determine the country in which an issuer is located and/or credit risk exposure based on various factors. These factors include the laws of the country under which the issuer is organized, where the issuer maintains a principal office, the country in which the issuer derives 50% or more of its total revenues and the country that has the primary market for the issuer’s securities, as well as other criteria. Among the other criteria that may be evaluated for making this determination are the country in which the issuer maintains 50% or more of its assets, the type of security, financial guarantees and enhancements, the nature of the collateral and the sponsor organization. Country of issuer and/or credit risk exposure has been determined to be the United States of America, unless otherwise noted. |
| D. | Distributions – Distributions from net investment income, if any, are declared and paid monthly. Distributions from net realized capital gain, if any, are generally declared and paid annually and recorded on the ex-dividend date. The Fund may elect to treat a portion of the proceeds from redemptions as distributions for federal income tax purposes. |
| E. | Federal Income Taxes – The Fund intends to comply with the requirements of Subchapter M of the Internal Revenue Code of 1986, as amended (the “Internal Revenue Code”), necessary to qualify as a regulated investment company and to distribute substantially all of the Fund’s taxable earnings to shareholders. As such, the Fund will not be subject to federal income taxes on otherwise taxable income (including net realized capital gain) that is distributed to shareholders. Therefore, no provision for federal income taxes is recorded in the financial statements. |
The Fund recognizes the tax benefits of uncertain tax positions only when the position is more likely than not to be sustained. Management has analyzed the Fund’s uncertain tax positions and concluded that no liability for unrecognized tax benefits should be recorded related to uncertain tax positions. Management is not aware of any tax positions for which it is reasonably possible that the total amounts of unrecognized tax benefits will change materially in the next 12 months.
The Fund files tax returns in the U.S. Federal jurisdiction and certain other jurisdictions. Generally, the Fund is subject to examinations by such taxing authorities for up to three years after the filing of the return for the tax period.
| F. | Expenses – Fees provided for under the Rule 12b-1 plan of a particular class of the Fund are charged to the operations of such class. Transfer agency fees and expenses and other shareholder recordkeeping fees and expenses attributable to Class R5 and Class R6 are allocated to each share class based on relative net assets. Sub-accounting fees attributable to Class R5 are charged to the operations of the class. Transfer agency fees and expenses and other shareholder recordkeeping fees and expenses relating to all other classes are allocated among those classes based on relative net assets. All other expenses are allocated among the classes based on relative net assets. |
| G. | Accounting Estimates – The preparation of financial statements in conformity with accounting principles generally accepted in the United States of America (“GAAP”) requires management to make estimates and assumptions that affect the reported amounts of assets and liabilities at the date of the financial statements and the reported amounts of revenues and expenses during the reporting period including estimates and assumptions related to taxation. Actual results could differ from those estimates by a significant amount. In addition, the Fund monitors for material events or transactions that may occur or become known after the period-end date and before the date the financial statements are released to print. |
| H. | Indemnifications – Under the Trust’s organizational documents, each Trustee, officer, employee or other agent of the Trust is indemnified against certain liabilities that may arise out of the performance of their duties to the Fund. Additionally, in the normal course of business, the Fund enters into contracts, including the Fund’s servicing agreements, that contain a variety of indemnification clauses. The Fund’s maximum exposure under these arrangements is unknown as this would involve future claims that may be made against the Fund that have not yet occurred. The risk of material loss as a result of such indemnification claims is considered remote. |
| I. | Foreign Currency Translations – Foreign currency is valued at the close of the NYSE based on quotations posted by banks and major currency dealers. Portfolio securities and other assets and liabilities denominated in foreign currencies are translated into U.S. dollar amounts at the date of valuation. Purchases and sales of portfolio securities (net of foreign taxes withheld on disposition) and income items denominated in foreign currencies are translated into U.S. dollar amounts on the respective dates of such transactions. The Fund does not separately account for the portion of the results of operations resulting from changes in foreign exchange rates on investments and the fluctuations arising from changes in market prices of securities held. The combined results of changes in foreign exchange rates and the fluctuation of market prices on investments (net of estimated foreign tax withholding) are included with the net realized and unrealized gain or loss from investments in the Statement of Operations. Reported net realized foreign currency gains or losses arise from (1) sales of foreign currencies, (2) currency gains or losses realized between the trade and settlement dates on securities transactions, and (3) the difference between the amounts of dividends, interest, and foreign withholding taxes recorded on the Fund’s books and the U.S. dollar equivalent of the amounts actually received or paid. Net unrealized foreign currency gains and losses arise from changes in the fair values of assets and liabilities, other than investments in securities at fiscal period end, resulting from changes in exchange rates. |
The Fund may invest in foreign securities, which may be subject to foreign taxes on income, gains on investments or currency repatriation, a portion of which may be recoverable. Foreign taxes, if any, are recorded based on the tax regulations and rates that exist in the foreign markets in which the Fund invests and are shown in the Statement of Operations.
| J. | Forward Foreign Currency Contracts – The Fund may engage in foreign currency transactions either on a spot (i.e. for prompt delivery and settlement) basis, or through forward foreign currency contracts, to manage or minimize currency or exchange rate risk. |
The Fund may also enter into forward foreign currency contracts for the purchase or sale of a security denominated in a foreign currency in order to “lock in” the U.S. dollar price of that security, or the Fund may also enter into forward foreign currency contracts that do not provide for physical settlement of the two currencies, but instead are settled by a single cash payment calculated as the difference between the agreed upon exchange rate and the spot rate at settlement based upon an agreed upon notional amount (non-deliverable forwards). The Fund will set aside liquid assets in an amount equal to the daily mark-to-market obligation for forward foreign currency contracts.
A forward foreign currency contract is an obligation between two parties (“Counterparties”) to purchase or sell a specific currency for an agreed-upon price at a future date. The use of forward foreign currency contracts does not eliminate fluctuations in the price of the underlying securities the Fund owns or intends to acquire but establishes a rate of exchange in advance. Fluctuations in the value of these contracts are measured by the difference in the contract date and reporting date exchange rates and are recorded as unrealized appreciation (depreciation) until the contracts are closed. When the contracts are closed, realized gains (losses) are recorded. Realized and unrealized gains (losses) on the contracts are included in the Statement of Operations. The primary risks associated with forward foreign currency contracts include failure of the Counterparty to meet the terms of the contract and the value of the foreign currency changing unfavorably. These risks may be in excess of the amounts reflected in the Statement of Assets and Liabilities.
17 Invesco Dividend Income Fund
NOTE 2–Advisory Fees and Other Fees Paid to Affiliates
The Trust has entered into a master investment advisory agreement with Invesco Advisers, Inc. (the “Adviser” or “Invesco”). Effective April 17, 2020, under the terms of the investment advisory agreement, the Fund accrues daily and pays monthly an advisory fee to the Adviser based on the annual rate of the Fund’s average daily net assets as follows:
| | |
| Average Daily Net Assets | | Rate |
First $500 million | | 0.633% |
Next $500 million | | 0.613% |
Next $600 million | | 0.600% |
Next $400 million | | 0.533% |
Next $2 billion | | 0.450% |
Next $2 billion | | 0.400% |
Next $2 billion | | 0.375% |
Over $8 billion | | 0.350% |
Prior to April 17, 2020, the Fund accrued daily and paid monthly an advisory fee to the Adviser based on the annual rate of the Fund’s average daily net assets as follows:
| | |
| Average Daily Net Assets | | Rate |
First $350 million | | 0.750% |
Next $350 million | | 0.650% |
Next $1.3 billion | | 0.550% |
Next $2 billion | | 0.450% |
Next $2 billion | | 0.400% |
Next $2 billion | | 0.375% |
Over $8 billion | | 0.350% |
For the year ended April 30, 2020, the effective advisory fee rate incurred by the Fund was 0.58%.
Under the terms of a master sub-advisory agreement between the Adviser and each of Invesco Asset Management Deutschland GmbH, Invesco Asset Management Limited, Invesco Asset Management (Japan) Limited, Invesco Hong Kong Limited, Invesco Senior Secured Management, Inc. and Invesco Canada Ltd. (collectively, the “Affiliated Sub-Advisers”) the Adviser, not the Fund, will pay 40% of the fees paid to the Adviser to any such Affiliated Sub-Adviser(s) that provide(s) discretionary investment management services to the Fund based on the percentage of assets allocated to such Affiliated Sub-Adviser(s).
Effective April 17, 2020, the Adviser has contractually agreed, through at least May 31, 2021, to waive advisory fees and/or reimburse expenses of all shares to the extent necessary to limit total annual fund operating expenses after fee waiver and/or expense reimbursement (excluding certain items discussed below) of Class A, Class C, Class R, Class Y, Investor Class, Class R5 and Class R6 shares to 1.05%, 1.80%, 1.30%, 0.80%, 1.05%, 0.66% and 0.61%, respectively, of average daily net assets (the “expense limits”). Prior to April 17, 2020, the Adviser had contractually agreed, through at least June 30, 2020, to waive advisory fees and/or reimburse expenses of all shares to the extent necessary to limit total annual fund operating expenses after fee waiver and/or expense reimbursement (excluding certain items discussed below) of Class A, Class C, Class Y, Investor Class, Class R5 and Class R6 shares to 2.00%, 2.75%, 1.75%, 2.00%, 1.75% and 1.75%, respectively, of average daily net assets. In determining the Adviser’s obligation to waive advisory fees and/or reimburse expenses, the following expenses are not taken into account, and could cause the total annual fund operating expenses after fee waivers and/or expense reimbursement to exceed the numbers reflected above: (1) interest; (2) taxes; (3) dividend expense on short sales; (4) extraordinary or non-routine items, including litigation expenses; and (5) expenses that the Fund has incurred but did not actually pay because of an expense offset arrangement. Unless Invesco continues the fee waiver agreement, it will terminate on May 31, 2021. During its term, the fee waiver agreement cannot be terminated or amended to increase the expense limits or reduce the advisory fee waiver without approval of the Board of Trustees. The Adviser did not waive fees and/or reimburse expenses during the period under these expense limits.
Further, the Adviser has contractually agreed, through at least June 30, 2022, to waive the advisory fee payable by the Fund in an amount equal to 100% of the net advisory fees the Adviser receives from the affiliated money market funds on investments by the Fund of uninvested cash in such affiliated money market funds.
For the year ended April 30, 2020, the Adviser waived advisory fees of $93,739.
The Trust has entered into a master administrative services agreement with Invesco pursuant to which the Fund has agreed to pay Invesco for certain administrative costs incurred in providing accounting services to the Fund. For the year ended April 30, 2020, expenses incurred under the agreement are shown in the Statement of Operations as Administrative services fees. Invesco has entered into a sub-administration agreement whereby State Street Bank and Trust Company (“SSB”) serves as fund accountant and provides certain administrative services to the Fund. Pursuant to a custody agreement with the Trust on behalf of the Fund, SSB also serves as the Fund’s custodian.
The Trust has entered into a transfer agency and service agreement with Invesco Investment Services, Inc. (“IIS”) pursuant to which the Fund has agreed to pay IIS a fee for providing transfer agency and shareholder services to the Fund and reimburse IIS for certain expenses incurred by IIS in the course of providing such services. IIS may make payments to intermediaries that provide omnibus account services, sub-accounting services and/or networking services. All fees payable by IIS to intermediaries that provide omnibus account services or sub-accounting services are charged back to the Fund, subject to certain limitations approved by the Trust’s Board of Trustees. For the year ended April 30, 2020, expenses incurred under the agreement are shown in the Statement of Operations as Transfer agent fees.
The Trust has entered into master distribution agreements with Invesco Distributors, Inc. (“IDI”) to serve as the distributor for the Class A, Class C, Class R, Investor Class, Class R5 and Class R6 shares of the Fund. The Trust has adopted plans pursuant to Rule 12b-1 under the 1940 Act with respect to the Fund’s Class A, Class C, Class R and Investor Class shares (collectively, the “Plans”). The Fund, pursuant to the Plans, reimburses IDI for its allocated share of expenses incurred for the period, up to a maximum annual rate of 0.25% of the average daily net assets of Class A shares and up to a maximum annual rate of 0.25% of the average daily net assets of Investor Class shares. The Fund pursuant to the Class C Plan and Class R Plan, pays IDI compensation at the annual rate of 1.00% of the average daily net assets of Class C shares and at the annual rate of 0.50% of the average daily net assets of Class R shares, respectively. The fees are accrued daily and paid monthly. Of the Plan payments, up to 0.25% of the average daily net assets of each class of shares may be paid to furnish continuing personal shareholder services to customers who purchase and own shares of such classes. Any amounts not paid as a service fee under the Plans would constitute an asset-based sales charge. Rules of the Financial Industry Regulatory Authority (“FINRA”) impose a cap on the total sales charges, including asset-based sales charges, that may be paid by any class of shares of the Fund. For the year ended April 30, 2020, expenses incurred under the Plans are shown in the Statement of Operations as Distribution fees.
18 Invesco Dividend Income Fund
Front-end sales commissions and CDSC (collectively, the “sales charges”) are not recorded as expenses of the Fund. Front-end sales commissions are deducted from proceeds from the sales of Fund shares prior to investment in Class A shares of the Fund. CDSC are deducted from redemption proceeds prior to remittance to the shareholder. During the year ended April 30, 2020, IDI advised the Fund that IDI retained $128,351 in front-end sales commissions from the sale of Class A shares and $9,515 and $4,641 from Class A and Class C shares, respectively, for CDSC imposed upon redemptions by shareholders.
For the year ended April 30, 2020, the Fund incurred $3,138 in brokerage commissions with Invesco Capital Markets, Inc., an affiliate of the Adviser and IDI, for portfolio transactions executed on behalf of the Fund.
Certain officers and trustees of the Trust are officers and directors of the Adviser, IIS and/or IDI.
NOTE 3–Additional Valuation Information
GAAP defines fair value as the price that would be received to sell an asset or paid to transfer a liability in an orderly transaction between market participants at the measurement date, under current market conditions. GAAP establishes a hierarchy that prioritizes the inputs to valuation methods, giving the highest priority to readily available unadjusted quoted prices in an active market for identical assets (Level 1) and the lowest priority to significant unobservable inputs (Level 3), generally when market prices are not readily available or are unreliable. Based on the valuation inputs, the securities or other investments are tiered into one of three levels. Changes in valuation methods may result in transfers in or out of an investment’s assigned level:
| | |
| Level 1 – | | Prices are determined using quoted prices in an active market for identical assets. |
| Level 2 – | | Prices are determined using other significant observable inputs. Observable inputs are inputs that other market participants may use in pricing a security. These may include quoted prices for similar securities, interest rates, prepayment speeds, credit risk, yield curves, loss severities, default rates, discount rates, volatilities and others. |
| Level 3 – | | Prices are determined using significant unobservable inputs. In situations where quoted prices or observable inputs are unavailable (for example, when there is little or no market activity for an investment at the end of the period), unobservable inputs may be used. Unobservable inputs reflect the Fund’s own assumptions about the factors market participants would use in determining fair value of the securities or instruments and would be based on the best available information. |
The following is a summary of the tiered valuation input levels, as of April 30, 2020. The level assigned to the securities valuations may not be an indication of the risk or liquidity associated with investing in those securities. Because of the inherent uncertainties of valuation, the values reflected in the financial statements may materially differ from the value received upon actual sale of those investments.
| | | | | | | | | | | | | | | | |
| | | Level 1 | | | Level 2 | | | Level 3 | | | Total | |
| |
Investments in Securities | | | | | | | | | | | | | | | | |
| |
Common Stocks & Other Equity Interests | | | $2,925,231,317 | | | | $447,183,928 | | | | $– | | | | $3,372,415,245 | |
| |
U.S. Dollar Denominated Bonds & Notes | | | – | | | | 418,202 | | | | – | | | | 418,202 | |
| |
Money Market Funds | | | 346,060,462 | | | | – | | | | – | | | | 346,060,462 | |
| |
Total Investments | | | $3,271,291,779 | | | | $447,602,130 | | | | $– | | | | $3,718,893,909 | |
| |
NOTE 4–Derivative Investments
The Fund may enter into an International Swaps and Derivatives Association Master Agreement (“ISDA Master Agreement”) under which a fund may trade OTC derivatives. An OTC transaction entered into under an ISDA Master Agreement typically involves a collateral posting arrangement, payment netting provisions and close-out netting provisions. These netting provisions allow for reduction of credit risk through netting of contractual obligations. The enforceability of the netting provisions of the ISDA Master Agreement depends on the governing law of the ISDA Master Agreement, among other factors.
For financial reporting purposes, the Fund does not offset OTC derivative assets or liabilities that are subject to ISDA Master Agreements in the Statement of Assets and Liabilities.
Effect of Derivative Investments for the year ended April 30, 2020
The table below summarizes the gains (losses) on derivative investments, detailed by primary risk exposure, recognized in earnings during the period:
| | | | | |
| | | Location of Gain (Loss) on |
| | | Statement of Operations |
| | | Currency |
| | | Risk |
Realized Gain: | | | | | |
Forward foreign currency contracts | | | | $1,227,743 | |
Change in Net Unrealized Appreciation (Depreciation): | | | | | |
Forward foreign currency contracts | | | | (19,980 | ) |
Total | | | | $1,207,763 | |
The table below summarizes the average notional value of derivatives held during the period.
| | |
| | | Forward |
| | | Foreign Currency |
| | | Contracts |
Average notional value | | $32,781,195 |
NOTE 5–Expense Offset Arrangement(s)
The expense offset arrangement is comprised of transfer agency credits which result from balances in demand deposit accounts used by the transfer agent for clearing shareholder transactions. For the year ended April 30, 2020, the Fund received credits from this arrangement, which resulted in the reduction of the Fund’s total expenses of $9,109.
19 Invesco Dividend Income Fund
NOTE 6–Trustees’ and Officers’ Fees and Benefits
Trustees’ and Officers’ Fees and Benefits include amounts accrued by the Fund to pay remuneration to certain Trustees and Officers of the Fund. Trustees have the option to defer compensation payable by the Fund, and Trustees’ and Officers’ Fees and Benefits also include amounts accrued by the Fund to fund such deferred compensation amounts. Those Trustees who defer compensation have the option to select various Invesco Funds in which their deferral accounts shall be deemed to be invested. Finally, certain current Trustees were eligible to participate in a retirement plan that provided for benefits to be paid upon retirement to Trustees over a period of time based on the number of years of service. The Fund may have certain former Trustees who also participate in a retirement plan and receive benefits under such plan. Trustees’ and Officers’ Fees and Benefits include amounts accrued by the Fund to fund such retirement benefits. Obligations under the deferred compensation and retirement plans represent unsecured claims against the general assets of the Fund.
NOTE 7–Cash Balances
The Fund is permitted to temporarily carry a negative or overdrawn balance in its account with SSB, the custodian bank. Such balances, if any at period-end, are shown in the Statement of Assets and Liabilities under the payable caption Amount due custodian. To compensate the custodian bank for such overdrafts, the overdrawn Fund may either (1) leave funds as a compensating balance in the account so the custodian bank can be compensated by earning the additional interest; or (2) compensate by paying the custodian bank at a rate agreed upon by the custodian bank and Invesco, not to exceed the contractually agreed upon rate. The Fund may not purchase additional securities when any borrowings from banks or broker-dealers exceed 5% of the Fund’s total assets, or when any borrowings from an Invesco Fund are outstanding.
NOTE 8–Distributions to Shareholders and Tax Components of Net Assets
Tax Character of Distributions to Shareholders Paid During the Fiscal Years Ended April 30, 2020 and 2019:
| | | | | | | | |
| | | 2020 | | | 2019 | |
| |
Ordinary income | | $ | 32,347,017 | | | $ | 45,333,541 | |
| |
Long-term capital gain | | | 15,597,000 | | | | 111,559,107 | |
| |
Total distributions | | $ | 47,944,017 | | | $ | 156,892,648 | |
| |
Tax Components of Net Assets at Period-End:
| | | | | | | | |
| | | | | | 2020 | |
| |
Undistributed ordinary income | | | | | | $ | 3,766,570 | |
| �� |
Net unrealized appreciation – investments | | | | | | | 139,994,078 | |
| |
Net unrealized appreciation - foreign currencies | | | | | | | 176,199 | |
| |
Temporary book/tax differences | | | | | | | (475,066 | ) |
| |
Capital loss carryforward | | | | | | | (44,306,504 | ) |
| |
Shares of beneficial interest | | | | | | | 3,531,173,701 | |
| |
Total net assets | | | | | | $ | 3,630,328,978 | |
| |
The difference between book-basis and tax-basis unrealized appreciation (depreciation) is due to differences in the timing of recognition of gains and losses on investments for tax and book purposes. The Fund’s net unrealized appreciation (depreciation) difference is attributable primarily to wash sales and straddle losses deferred.
The temporary book/tax differences are a result of timing differences between book and tax recognition of income and/or expenses. The Fund’s temporary book/tax differences are the result of the trustee deferral of compensation and retirement plan benefits.
Capital loss carryforward is calculated and reported as of a specific date. Results of transactions and other activity after that date may affect the amount of capital loss carryforward actually available for the Fund to utilize. The ability to utilize capital loss carryforward in the future may be limited under the Internal Revenue Code and related regulations based on the results of future transactions.
The Fund has a capital loss carryforward as of April 30, 2020, as follows:
| | | | | | | | | | | | |
| Capital Loss Carryforward* | |
| |
| Expiration | | Short-Term | | | Long-Term | | | Total | |
| |
Not subject to expiration | | $ | 10,605,098 | | | $ | 33,701,406 | | | $ | 44,306,504 | |
| |
| * | Capital loss carryforward is reduced for limitations, if any, to the extent required by the Internal Revenue Code and may be further limited depending upon a variety of factors, including the realization of net unrealized gains or losses as of the date of any reorganization. |
NOTE 9–Investment Transactions
The aggregate amount of investment securities (other than short-term securities, U.S. Treasury obligations and money market funds, if any) purchased and sold by the Fund during the year ended April 30, 2020 was $617,721,602 and $898,295,499, respectively. Cost of investments, including any derivatives, on a tax basis includes the adjustments for financial reporting purposes as of the most recently completed federal income tax reporting period-end.
| | | | |
| Unrealized Appreciation (Depreciation) of Investments on a Tax Basis | | | |
| |
Aggregate unrealized appreciation of investments | | $ | 368,555,152 | |
| |
Aggregate unrealized (depreciation) of investments | | | (228,561,074 | ) |
| |
Net unrealized appreciation of investments | | $ | 139,994,078 | |
| |
Cost of investments for tax purposes is $3,578,899,831.
20 Invesco Dividend Income Fund
NOTE 10–Reclassification of Permanent Differences
Primarily as a result of differing book/tax treatment of distributions, on April 30, 2020, undistributed net investment income was increased by $3,537,949 and undistributed net realized gain (loss) was decreased by $3,537,949. Further, as a result of tax deferrals acquired in the reorganizations of Invesco Oppenheimer Dividend Opportunity Fund and Invesco Oppenheimer Equity Income Fund into the Fund, undistributed net investment income was decreased by $375,725, undistributed net realized gain (loss) was decreased by $21,573,623 and shares of beneficial interest was increased by $21,949,348. These reclassifications had no effect on the net assets of the Fund.
NOTE 11–Share Information
| | | | | | | | | | | | | | | | |
| | | Summary of Share Activity | |
| |
| | | Year ended | | | Year ended | |
| | | April 30, 2020(a) | | | April 30, 2019 | |
| | | Shares | | | Amount | | | Shares | | | Amount | |
| |
Sold: | | | | | | | | | | | | | | | | |
Class A | | | 3,812,090 | | | $ | 81,632,098 | | | | 3,006,748 | | | $ | 67,390,608 | |
| |
Class C | | | 554,738 | | | | 11,968,892 | | | | 595,243 | | | | 13,241,679 | |
| |
Class R | | | 11,114 | | | | 224,671 | | | | - | | | | - | |
| |
Class Y | | | 2,055,071 | | | | 44,867,487 | | | | 2,611,346 | | | | 60,093,396 | |
| |
Investor Class | | | 76,479 | | | | 1,727,207 | | | | 83,246 | | | | 1,921,271 | |
| |
Class R5 | | | 40,185 | | | | 877,287 | | | | 35,747 | | | | 823,196 | |
| |
Class R6 | | | 1,913,724 | | | | 41,417,956 | | | | 1,842,834 | | | | 41,639,938 | |
| |
| | | | |
Issued as reinvestment of dividends: | | | | | | | | | | | | | | | | |
Class A | | | 981,064 | | | | 21,890,282 | | | | 3,138,017 | | | | 68,181,648 | |
| |
Class C | | | 133,337 | | | | 3,027,051 | | | | 698,345 | | | | 15,319,004 | |
| |
Class Y | | | 289,938 | | | | 6,543,541 | | | | 1,140,934 | | | | 25,088,792 | |
| |
Investor Class | | | 99,503 | | | | 2,242,265 | | | | 319,556 | | | | 7,008,383 | |
| |
Class R5 | | | 4,103 | | | | 91,461 | | | | 10,141 | | | | 220,586 | |
| |
Class R6 | | | 403,535 | | | | 8,995,223 | | | | 1,252,991 | | | | 27,304,918 | |
| |
| | | | |
Automatic conversion of Class C shares to Class A shares: | | | | | | | | | | | | | | | | |
Class A | | | 284,086 | | | | 6,110,263 | | | | 1,243,209 | | | | 26,467,883 | |
| |
Class C | | | (280,232 | ) | | | (6,110,263 | ) | | | (1,226,483 | ) | | | (26,467,883 | ) |
| |
| | | | |
Issued in connection with acquisitions:(b) | | | | | | | | | | | | | | | | |
Class A | | | 94,223,079 | | | | 1,901,350,313 | | | | - | | | | - | |
| |
Class C | | | 13,963,114 | | | | 285,741,496 | | | | - | | | | - | |
| |
Class R | | | 4,873,243 | | | | 98,338,348 | | | | - | | | | - | |
| |
Class Y | | | 8,117,361 | | | | 165,532,230 | | | | - | | | | - | |
| |
Class R5 | | | 873 | | | | 17,631 | | | | - | | | | - | |
| |
Class R6 | | | 1,882,299 | | | | 38,019,462 | | | | - | | | | - | |
| |
| | | | |
Reacquired: | | | | | | | | | | | | | | | | |
Class A | | | (8,304,445 | ) | | | (179,058,000 | ) | | | (11,281,409 | ) | | | (258,040,548 | ) |
| |
Class C | | | (2,082,082 | ) | | | (45,961,182 | ) | | | (3,566,288 | ) | | | (82,577,124 | ) |
| |
Class R | | | (32,004 | ) | | | (632,040 | ) | | | - | | | | - | |
| |
Class Y | | | (5,039,052 | ) | | | (110,953,871 | ) | | | (12,074,171 | ) | | | (279,423,339 | ) |
| |
Investor Class | | | (442,281 | ) | | | (9,664,350 | ) | | | (479,561 | ) | | | (11,098,587 | ) |
| |
Class R5 | | | (19,865 | ) | | | (444,608 | ) | | | (47,112 | ) | | | (1,061,584 | ) |
| |
Class R6 | | | (3,097,835 | ) | | | (67,373,899 | ) | | | (6,020,160 | ) | | | (138,368,123 | ) |
| |
Net increase (decrease) in share activity | | | 114,421,140 | | | $ | 2,300,416,951 | | | | (18,716,827 | ) | | $ | (442,335,886 | ) |
| |
| (a) | There are entities that are record owners of more than 5% of the outstanding shares of the Fund and in the aggregate own 21% of the outstanding shares of the Fund. IDI has an agreement with these entities to sell Fund shares. The Fund, Invesco and/or Invesco affiliates may make payments to these entities, which are considered to be related to the Fund, for providing services to the Fund, Invesco and/or Invesco affiliates including but not limited to services such as securities brokerage, distribution, third party record keeping and account servicing. The Fund has no knowledge as to whether all or any portion of the shares owned of record by these entities are also owned beneficially. |
| (b) | After the close of business on April 17, 2020, the Fund acquired all the net assets of Invesco Oppenheimer Dividend Opportunity Fund and Invesco Oppenheimer Equity Income Fund pursuant to a plan of reorganization approved by the Board of Trustees of the Fund on February 14, 2020. The reorganization was executed in order to reduce overlap and increase efficiencies in the Adviser’s product line. The acquisition was accomplished by a tax-free exchange of 123,059,969 shares of the Fund for 10,079,523 and 94,493,678 shares outstanding of Invesco Oppenheimer Dividend Opportunity Fund and Invesco Oppenheimer Equity Income Fund, respectively, as of the close of business on April 17, 2020. Shares of Invesco Oppenheimer Dividend Opportunity Fund and Invesco Oppenheimer Equity Income Fund were exchanged for the like class of shares of the Fund, based on the relative net asset value of Invesco Oppenheimer Dividend Opportunity Fund and Invesco Oppenheimer Equity Income Fund to the net asset value of the Fund on the close of business, April 17, 2020. The Invesco Oppenheimer Dividend Opportunity Fund and Invesco Oppenheimer Equity Income Fund’s net assets as of the close of business on April 17, 2020 of $203,484,378 and $2,285,515,102, respectively, including $17,399,010 of unrealized appreciation, were combined with those of the Fund. The net assets of the Fund immediately before the acquisition were $1,175,677,851 and $3,664,677,331 immediately after the acquisition. |
The pro forma results of operations for the year ended April 30, 2020 assuming the reorganization had been completed on May 1, 2019, the beginning of the annual reporting period are as follows:
21 Invesco Dividend Income Fund
| | | | |
Net investment income | | $ | 98,767,428 | |
| |
Net realized/unrealized (losses) | | | (534,309,797 | ) |
| |
Change in net assets resulting from operations | | $ | (435,542,369 | ) |
| |
As the combined investment portfolios have been managed as a single integrated portfolio since the acquisition was completed, it is not practicable to separate the amounts of revenue and earnings of Invesco Oppenheimer Dividend Opportunity Fund and Invesco Oppenheimer Equity Income Fund that has been included in the Fund’s Statement of Operations since April 18, 2020.
NOTE 12–Coronavirus (COVID-19) Pandemic
During the first quarter of 2020, the World Health Organization declared COVID-19 to be a public health emergency. COVID-19 has led to increased short-term market volatility and may have adverse long-term effects on U.S. and world economies and markets in general. COVID-19 may adversely impact the Fund’s ability to achieve its investment objective. Because of the uncertainties on valuation, the global economy and business operations, values reflected in these financial statements may materially differ from the value received upon actual sales of those investments.
The extent of the impact on the performance of the Fund and its investments will depend on future developments, including the duration and spread of the COVID-19 outbreak, related restrictions and advisories, and the effects on the financial markets and economy overall, all of which are highly uncertain and cannot be predicted.
22 Invesco Dividend Income Fund
Report of Independent Registered Public Accounting Firm
To the Board of Trustees of AIM Sector Funds (Invesco Sector Funds) and Shareholders of Invesco Dividend Income Fund
Opinion on the Financial Statements
We have audited the accompanying statement of assets and liabilities, including the schedule of investments, of Invesco Dividend Income Fund (one of the funds constituting AIM Sector Funds (Invesco Sector Funds), referred to hereafter as the “Fund”) as of April 30, 2020, the related statement of operations for the year ended April 30, 2020, the statement of changes in net assets for each of the two years in the period ended April 30, 2020, including the related notes, and the financial highlights for each of the periods indicated therein (collectively referred to as the “financial statements”). In our opinion, the financial statements present fairly, in all material respects, the financial position of the Fund as of April 30, 2020, the results of its operations for the year then ended, the changes in its net assets for each of the two years in the period ended April 30, 2020 and the financial highlights for each of the periods indicated therein in conformity with accounting principles generally accepted in the United States of America.
Basis for Opinion
These financial statements are the responsibility of the Fund’s management. Our responsibility is to express an opinion on the Fund’s financial statements based on our audits. We are a public accounting firm registered with the Public Company Accounting Oversight Board (United States) (PCAOB) and are required to be independent with respect to the Fund in accordance with the U.S. federal securities laws and the applicable rules and regulations of the Securities and Exchange Commission and the PCAOB.
We conducted our audits of these financial statements in accordance with the standards of the PCAOB. Those standards require that we plan and perform the audit to obtain reasonable assurance about whether the financial statements are free of material misstatement, whether due to error or fraud.
Our audits included performing procedures to assess the risks of material misstatement of the financial statements, whether due to error or fraud, and performing procedures that respond to those risks. Such procedures included examining, on a test basis, evidence regarding the amounts and disclosures in the financial statements. Our audits also included evaluating the accounting principles used and significant estimates made by management, as well as evaluating the overall presentation of the financial statements. Our procedures included confirmation of securities owned as of April 30, 2020 by correspondence with the custodian, transfer agent and brokers; when replies were not received from brokers, we performed other auditing procedures. We believe that our audits provide a reasonable basis for our opinion.
/s/ PricewaterhouseCoopers LLP
Houston, Texas
June 26, 2020
We have served as the auditor of one or more of the investment companies in the Invesco group of investment companies since at least 1995. We have not been able to determine the specific year we began serving as auditor.
23 Invesco Dividend Income Fund
Calculating your ongoing Fund expenses
Example
As a shareholder of the Fund, you incur two types of costs: (1) transaction costs, which may include sales charges (loads) on purchase payments or contingent deferred sales charges on redemptions, if any; and (2) ongoing costs, including management fees, distribution and/or service (12b-1) fees, and other Fund expenses. This example is intended to help you understand your ongoing costs (in dollars) of investing in the Fund and to compare these costs with ongoing costs of investing in other mutual funds. With the exception of the actual ending account value and expenses of the Class R shares, the example is based on an investment of $1,000 invested at the beginning of the period and held for the entire period November 1, 2018 through April 30, 2020. The actual ending account value and expenses for the Class R shares in the example below are based on an investment of $1,000 invested as of close of business April 17, 2020 (commencement date) and held through April 30, 2020.
Actual expenses
The table below provides information about actual account values and actual expenses. You may use the information in this table, together with the amount you invested, to estimate the expenses that you paid over the period. Simply divide your account value by $1,000 (for example, an $8,600 account value divided by $1,000 = 8.6), then multiply the result by the number in the table under the heading entitled “Actual Expenses Paid During Period” to estimate the expenses you paid on your account during this period (as of close of business April 17, 2020 through April 30, 2020 for the Class R shares). Because the actual ending account value and expense information in the example is not based upon a six month period for the Class R shares, the ending account value and expense information may not provide a meaningful comparison to mutual funds that provide such information for a full six month period.
Hypothetical example for comparison purposes
The table below also provides information about hypothetical account values and hypothetical expenses based on the Fund’s actual expense ratio and an assumed rate of return of 5% per year before expenses, which is not the Fund’s actual return.
The hypothetical account values and expenses may not be used to estimate the actual ending account balance or expenses you paid for the period. You may use this information to compare the ongoing costs of investing in the Fund and other funds. To do so, compare this 5% hypothetical example with the 5% hypothetical examples that appear in the shareholder reports of the other funds.
Please note that the expenses shown in the table are meant to highlight your ongoing costs only and do not reflect any transaction costs, such as sales charges (loads) on purchase payments or contingent deferred sales charges on redemptions, if any. Therefore, the hypothetical information is useful in comparing ongoing costs only, and will not help you determine the relative total costs of owning different funds. In addition, if these transaction costs were included, your costs would have been higher.
| | | | | | | | | | | | | | | | | | | | | | | | | | | | | | |
| | | | | ACTUAL | | HYPOTHETICAL (5% annual return before expenses) | | |
| | | Beginning | | Ending | | Expenses | | Ending | | Expenses | | Annualized |
| | | Account Value | | Account Value | | Paid During | | Account Value | | Paid During | | Expense |
| | | (11/01/19) | | (04/30/20)1 | | Period2,3 | | (04/30/20) | | Period2,4 | | Ratio |
Class A | | | $ | 1,000.00 | | | | $ | 896.70 | | | | $ | 4.95 | | | | $ | 1,019.64 | | | | $ | 5.27 | | | | | 1.05 | % |
Class C | | | | 1,000.00 | | | | | 893.00 | | | | | 8.47 | | | | | 1,015.91 | | | | | 9.02 | | | | | 1.80 | |
Class R | | | | 1,000.00 | | | | | 996.50 | | | | | 0.36 | | | | | 1,018.90 | | | | | 6.02 | | | | | 1.20 | |
Class Y | | | | 1,000.00 | | | | | 897.80 | | | | | 3.82 | | | | | 1,020.84 | | | | | 4.07 | | | | | 0.81 | |
Investor Class | | | | 1,000.00 | | | | | 896.50 | | | | | 5.00 | | | | | 1,019.59 | | | | | 5.32 | | | | | 1.06 | |
Class R5 | | | | 1,000.00 | | | | | 898.10 | | | | | 3.54 | | | | | 1,021.13 | | | | | 3.77 | | | | | 0.75 | |
Class R6 | | | | 1,000.00 | | | | | 898.60 | | | | | 3.12 | | | | | 1,021.58 | | | | | 3.32 | | | | | 0.66 | |
| 1 | The actual ending account value is based on the actual total return of the Fund for the period November 1, 2019 through April 30, 2020, after actual expenses and will differ from the hypothetical ending account value which is based on the Fund’s expense ratio and a hypothetical annual return of 5% before expenses. |
| 2 | Expenses are equal to the Fund’s annualized expense ratio as indicated above multiplied by the average account value over the period, multiplied by 182/366 to reflect the most recent fiscal half year. Effective April 20, 2020, the Fund’s adviser has contractually agreed to waive advisory fees and/or reimburse expenses to the extent necessary to limit total annual fund operating expense of Class A, Class C, Class R, Class Y, Investor Class, Class R5 and Class R6 shares to 1.05%, 1.80%, 1.30%, 0.80%, 1.08%, 0.66% and 0.61% of average daily net assets, respectively. The annualized expense ratios restated as if these agreements had been in effect throughout the entire most recent fiscal half year are 0.97%, 1.72%, 1.21%, 0.72%, 0.97%, 0.66% and 0.58% for Class A, Class C, Class R, Class Y, Investor Class, Class R5 and Class R6 shares, respectively. |
| 3 | The actual expenses paid restated as if the changes discussed above had been in effect throughout the entire most recent fiscal half year are $4.57, $8.10, $6.01, $3.40, $4.57, $3.11 and $2.74 for Class A, Class C, Class R, Class Y, Investor Class, Class R5 and Class R6 shares, respectively. |
| 4 | The hypothetical expenses paid restated as if the changes discussed above had been in effect throughout the entire most recent fiscal half year are $4.87, $8.62, $6.07, $3.62, $4.87, $3.32 and $2.92 for Class A, Class C, Class R, Class Y, Investor Class, Class R5 and Class R6 shares, respectively. |
24 Invesco Dividend Income Fund
Tax Information
Form 1099-DIV, Form 1042-S and other year-end tax information provide shareholders with actual calendar year amounts that should be included in their tax returns. Shareholders should consult their tax advisers.
The following distribution information is being provided as required by the Internal Revenue Code or to meet a specific state’s requirement.
The Fund designates the following amounts or, if subsequently determined to be different, the maximum amount allowable for its fiscal year ended April 30, 2020:
| | | | |
Federal and State Income Tax | | | | |
Long-Term Capital Gain Distributions | | $ | 15,597,000 | |
Qualified Dividend Income* | | | 100.00 | % |
Corporate Dividends Received Deduction* | | | 99.95 | % |
U.S. Treasury Obligations* | | | 0.00 | % |
| | |
|
| * The above percentages are based on ordinary income dividends paid to shareholders during the Fund’s fiscal year. |
25 Invesco Dividend Income Fund
Trustees and Officers
The address of each trustee and officer is AIM Sector Funds (Invesco Sector Funds) (the “Trust”), 11 Greenway Plaza, Suite 1000, Houston, Texas 77046-1173. The trustees serve for the life of the Trust, subject to their earlier death, incapacitation, resignation, retirement or removal as more specifically provided in the Trust’s organizational documents. Each officer serves for a one year term or until their successors are elected and qualified. Column two below includes length of time served with predecessor entities, if any.
| | | | | | | | |
Name, Year of Birth and Position(s) Held with the Trust | | Trustee and/or Officer Since | | Principal Occupation(s) During Past 5 Years | | Number of Funds in Fund Complex Overseen by Trustee | | Other Directorship(s) Held by Trustee During Past 5 Years |
Interested Trustee | | | | | | | | |
Martin L. Flanagan1 – 1960 Trustee and Vice Chair | | 2007 | | Executive Director, Chief Executive Officer and President, Invesco Ltd. (ultimate parent of Invesco and a global investment management firm); Trustee and Vice Chair, The Invesco Funds; Vice Chair, Investment Company Institute; and Member of Executive Board, SMU Cox School of Business Formerly: Advisor to the Board, Invesco Advisers, Inc. (formerly known as Invesco Institutional (N.A.), Inc.); Chairman and Chief Executive Officer, Invesco Advisers, Inc. (registered investment adviser); Director, Chairman, Chief Executive Officer and President, Invesco Holding Company (US), Inc. (formerly IVZ Inc.) (holding company), Invesco Group Services, Inc. (service provider) and Invesco North American Holdings, Inc. (holding company); Director, Chief Executive Officer and President, Invesco Holding Company Limited (parent of Invesco and a global investment management firm); Director, Invesco Ltd.; Chairman, Investment Company Institute and President, Co-Chief Executive Officer, Co-President, Chief Operating Officer and Chief Financial Officer, Franklin Resources, Inc. (global investment management organization) | | 203 | | None |
|
1 Mr. Flanagan is considered an interested person (within the meaning of Section 2(a)(19) of the 1940 Act) of the Trust because he is an officer of the Adviser to the Trust, and an officer and a director of Invesco Ltd., ultimate parent of the Adviser. |
| | | | | | | | |
Name, Year of Birth and Position(s) Held with the Trust | | Trustee and/or Officer Since | | Principal Occupation(s) During Past 5 Years | | Number of Funds in Fund Complex Overseen by Trustee | | Other Directorship(s) Held by Trustee During Past 5 Years |
Independent Trustees | | | | | | | | |
Bruce L. Crockett - 1944 Trustee and Chair | | 2003 | | Chairman, Crockett Technologies Associates (technology consulting company) Formerly: Director, Captaris (unified messaging provider); Director, President and Chief Executive Officer, COMSAT Corporation; Chairman, Board of Governors of INTELSAT (international communications company); ACE Limited (insurance company); Independent Directors Council and Investment Company Institute: Member of the Audit Committee, Investment Company Institute; Member of the Executive Committee and Chair of the Governance Committee, Independent Directors Council | | 203 | | Director and Chairman of the Audit Committee, ALPS (Attorneys Liability Protection Society) (insurance company); Director and Member of the Audit Committee and Compensation Committee, Ferroglobe PLC (metallurgical company) |
David C. Arch - 1945 Trustee | | 2010 | | Chairman of Blistex Inc. (consumer health care products manufacturer); Member, World Presidents’ Organization | | 203 | | Board member of the Illinois Manufacturers’ Association |
Beth Ann Brown - 1968 Trustee | | 2019 | | Independent Consultant Formerly: Head of Intermediary Distribution, Managing Director, Strategic Relations, Managing Director, Head of National Accounts, Senior Vice President, National Account Manager and Senior Vice President, Key Account Manager, Columbia Management Investment Advisers LLC; Vice President, Key Account Manager, Liberty Funds Distributor, Inc.; and Trustee of certain Oppenheimer Funds | | 203 | | Director, Board of Directors of Caron Engineering Inc.; Advisor, Board of Advisors of Caron Engineering Inc.; President and Director, Acton Shapleigh Youth Conservation Corps (non - profit); and Vice President and Director of Grahamtastic Connection (non- profit) |
T-1 Invesco Dividend Income Fund
Trustees and Officers–(continued)
| | | | | | | | |
Name, Year of Birth and Position(s) Held with the Trust | | Trustee and/or Officer Since | | Principal Occupation(s) During Past 5 Years | | Number of Funds in Fund Complex Overseen by Trustee | | Other Directorship(s) Held by Trustee During Past 5 Years |
Independent Trustees–(continued) | | | | |
Jack M. Fields - 1952 Trustee | | 2003 | | Chief Executive Officer, Twenty First Century Group, Inc. (government affairs company); and Chairman, Discovery Learning Alliance (non-profit) Formerly: Owner and Chief Executive Officer, Dos Angeles Ranch L.P. (cattle, hunting, corporate entertainment); Director, Insperity, Inc. (formerly known as Administaff) (human resources provider); Chief Executive Officer, Texana Timber LP (sustainable forestry company); Director of Cross Timbers Quail Research Ranch (non-profit); and member of the U.S. House of Representatives | | 203 | | Member, Board of Directors of Baylor College of Medicine |
Cynthia Hostetler –1962 Trustee | | 2017 | | Non-Executive Director and Trustee of a number of public and private business corporations Formerly: Director, Aberdeen Investment Funds (4 portfolios); Head of Investment Funds and Private Equity, Overseas Private Investment Corporation; President, First Manhattan Bancorporation, Inc.; Attorney, Simpson Thacher & Bartlett LLP | | 203 | | Vulcan Materials Company (construction materials company); Trilinc Global Impact Fund; Genesee & Wyoming, Inc. (railroads); Artio Global Investment LLC (mutual fund complex); Edgen Group, Inc. (specialized energy and infrastructure products distributor); Investment Company Institute (professional organization); Independent Directors Council (professional organization) |
Eli Jones - 1961 Trustee | | 2016 | | Professor and Dean, Mays Business School - Texas A&M University Formerly: Professor and Dean, Walton College of Business, University of Arkansas and E.J. Ourso College of Business, Louisiana State University; Director, Arvest Bank | | 229 | | Insperity, Inc. (formerly known as Administaff) (human resources provider) |
Elizabeth Krentzman - 1959 Trustee | | 2019 | | Formerly: Principal and Chief Regulatory Advisor for Asset Management Services and U.S. Mutual Fund Leader of Deloitte & Touche LLP; General Counsel of the Investment Company Institute (trade association); National Director of the Investment Management Regulatory Consulting Practice, Principal, Director and Senior Manager of Deloitte & Touche LLP; Assistant Director of the Division of Investment Management - Office of Disclosure and Investment Adviser Regulation of the U.S. Securities and Exchange Commission and various positions with the Division of Investment Management – Office of Regulatory Policy of the U.S. Securities and Exchange Commission; Associate at Ropes & Gray LLP; Advisory Board Member of the Securities and Exchange Commission Historical Society; and Trustee of certain Oppenheimer Funds | | 203 | | Trustee of the University of Florida National Board Foundation and Audit Committee Member; Member of the Cartica Funds Board of Directors (private investment funds); Member of the University of Florida Law Center Association, Inc. Board of Trustees and Audit Committee Member |
Anthony J. LaCava, Jr. - 1956 Trustee | | 2019 | | Formerly: Director and Member of the Audit Committee, Blue Hills Bank (publicly traded financial institution) and Managing Partner, KPMG LLP | | 203 | | Blue Hills Bank; Chairman, Bentley University; Member, Business School Advisory Council; and Nominating Committee KPMG LLP |
Prema Mathai-Davis - 1950 Trustee | | 2003 | | Retired Co-Owner & Partner of Quantalytics Research, LLC, (a FinTech Investment Research Platform for the Self-Directed Investor) | | 203 | | None |
T-2 Invesco Dividend Income Fund
Trustees and Officers–(continued)
| | | | | | | | |
Name, Year of Birth and Position(s) Held with the Trust | | Trustee and/or Officer Since | | Principal Occupation(s) During Past 5 Years | | Number of Funds in Fund Complex Overseen by Trustee | | Other Directorship(s) Held by Trustee During Past 5 Years |
Independent Trustees-(continued) | | | | |
Joel W. Motley – 1952 Trustee | | 2019 | | Director of Office of Finance, Federal Home Loan Bank System; Member of the Vestry of Trinity Wall Street; Managing Director of Carmona Motley Inc. (privately held financial advisor); Member of the Council on Foreign Relations and its Finance and Budget Committee; Chairman Emeritus of Board of Human Rights Watch and Member of its Investment Committee; and Member of Investment Committee and Board of Historic Hudson Valley (non-profit cultural organization) Formerly: Managing Director of Public Capital Advisors, LLC (privately held financial advisor); Managing Director of Carmona Motley Hoffman, Inc. (privately held financial advisor); Trustee of certain Oppenheimer Funds; and Director of Columbia Equity Financial Corp. (privately held financial advisor) | | 203 | | Member of Board of Greenwall Foundation (bioethics research foundation) and its Investment Committee; Member of Board of Friends of the LRC (non-profit legal advocacy); Board Member and Investment Committee Member of Pulizer Center for Crisis Reporting (non-profit journalism) |
Teresa M. Ressel – 1962 Trustee | | 2017 | | Non-executive director and trustee of a number of public and private business corporations Formerly: Chief Financial Officer, Olayan America, The Olayan Group (international investor/commercial/industrial); Chief Executive Officer, UBS Securities LLC; Group Chief Operating Officer, Americas, UBS AG; Assistant Secretary for Management & Budget and CFO, US Department of the Treasury | | 203 | | Atlantic Power Corporation (power generation company); ON Semiconductor Corp. (semiconductor supplier) |
Ann Barnett Stern – 1957 Trustee | | 2017 | | President and Chief Executive Officer, Houston Endowment Inc. (private philanthropic institution) Formerly: Executive Vice President and General Counsel, Texas Children’s Hospital; Attorney, Beck, Redden and Secrest, LLP; Business Law Instructor, University of St. Thomas; Attorney, Andrews & Kurth LLP | | 203 | | Federal Reserve Bank of Dallas |
Robert C. Troccoli – 1949 Trustee | | 2016 | | Retired Formerly: Adjunct Professor, University of Denver – Daniels College of Business; Senior Partner, KPMG LLP | | 203 | | None |
Daniel S. Vandivort –1954 Trustee | | 2019 | | Treasurer, Chairman of the Audit and Finance Committee, and Trustee, Board of Trustees, Huntington Disease Foundation of America; and President, Flyway Advisory Services LLC (consulting and property management) Formerly: Trustee and Governance Chair, of certain Oppenheimer Funds | | 203 | | Chairman and Lead Independent Director, Chairman of the Audit Committee, and Director, Board of Directors, Value Line Funds |
James D. Vaughn – 1945 Trustee | | 2019 | | Retired Formerly: Managing Partner, Deloitte & Touche LLP; Trustee and Chairman of the Audit Committee, Schroder Funds; Board Member, Mile High United Way, Boys and Girls Clubs, Boy Scouts, Colorado Business Committee for the Arts, Economic Club of Colorado and Metro Denver Network (economic development corporation); and Trustee of certain Oppenheimer Funds | | 203 | | Board member and Chairman of Audit Committee of AMG National Trust Bank; Trustee and Investment Committee member, University of South Dakota Foundation; Board member, Audit Committee Member and past Board Chair, Junior Achievement (non-profit) |
Christopher L. Wilson - 1957 Trustee, Vice Chair and Chair Designate | | 2017 | | Retired Formerly: Director, TD Asset Management USA Inc. (mutual fund complex) (22 portfolios); Managing Partner, CT2, LLC (investing and consulting firm); President/Chief Executive Officer, Columbia Funds, Bank of America Corporation; President/Chief Executive Officer, CDC IXIS Asset Management Services, Inc.; Principal & Director of Operations, Scudder Funds, Scudder, Stevens & Clark, Inc.; Assistant Vice President, Fidelity Investments | | 203 | | ISO New England, Inc. (non-profit organization managing regional electricity market) |
T-3 Invesco Dividend Income Fund
Trustees and Officers–(continued)
| | | | | | | | |
Name, Year of Birth and Position(s) Held with the Trust | | Trustee and/or Officer Since | | Principal Occupation(s) During Past 5 Years | | Number of Funds in Fund Complex Overseen by Trustee | | Other Directorship(s) Held by Trustee During Past 5 Years |
Officers | | | | �� | | | | |
| Sheri Morris – 1964 President, Principal Executive Officer and Treasurer | | 2003 | | Head of Global Fund Services, Invesco Ltd.; President, Principal Executive Officer and Treasurer, The Invesco Funds; Vice President, Invesco Advisers, Inc. (formerly known as Invesco Institutional (N.A.), Inc.) (registered investment adviser); and Vice President, Invesco Exchange-Traded Fund Trust, Invesco Exchange-Traded Fund Trust II, Invesco India Exchange-Traded Fund Trust, Invesco Actively Managed Exchange-Traded Fund Trust, Invesco Actively Managed Exchange-Traded Commodity Fund Trust and Invesco Exchange-Traded Self-Indexed Fund Trust; and Vice President, OppenheimerFunds, Inc. Formerly: Vice President and Principal Financial Officer, The Invesco Funds; Vice President, Invesco AIM Advisers, Inc., Invesco AIM Capital Management, Inc. and Invesco AIM Private Asset Management, Inc.; Assistant Vice President and Assistant Treasurer, The Invesco Funds and Assistant Vice President, Invesco Advisers, Inc., Invesco AIM Capital Management, Inc. and Invesco AIM Private Asset Management, Inc.; and Treasurer, Invesco Exchange-Traded Fund Trust, Invesco Exchange-Traded Fund Trust II, Invesco India Exchange-Traded Fund Trust and Invesco Actively Managed Exchange-Traded Fund Trust | | N/A | | N/A |
| Russell C. Burk – 1958 Senior Vice President and Senior Officer | | 2005 | | Senior Vice President and Senior Officer, The Invesco Funds | | N/A | | N/A |
| Jeffrey H. Kupor – 1968 Senior Vice President, Chief Legal Officer and Secretary | | 2018 | | Head of Legal of the Americas, Invesco Ltd.; Senior Vice President and Secretary, Invesco Advisers, Inc. (formerly known as Invesco Institutional (N.A.), Inc.) (registered investment adviser); Senior Vice President and Secretary, Invesco Distributors, Inc. (formerly known as Invesco AIM Distributors, Inc.); Vice President and Secretary, Invesco Investment Services, Inc. (formerly known as Invesco AIM Investment Services, Inc.) Senior Vice President, Chief Legal Officer and Secretary, The Invesco Funds; Secretary and General Counsel, Invesco Investment Advisers LLC (formerly known as Van Kampen Asset Management); Secretary and General Counsel, Invesco Capital Markets, Inc. (formerly known as Van Kampen Funds Inc.) and Chief Legal Officer, Invesco Exchange-Traded Fund Trust, Invesco Exchange-Traded Fund Trust II, Invesco India Exchange-Traded Fund Trust, Invesco Actively Managed Exchange-Traded Fund Trust, Invesco Actively Managed Exchange-Traded Commodity Fund Trust and Invesco Exchange-Traded Self-Indexed Fund Trust; Secretary, Invesco Indexing LLC; Secretary, W.L. Ross & Co., LLC Formerly: Secretary and Vice President, Jemstep, Inc.; Head of Legal, Worldwide Institutional, Invesco Ltd.; Secretary and General Counsel, INVESCO Private Capital Investments, Inc.; Senior Vice President, Secretary and General Counsel, Invesco Management Group, Inc. (formerly known as Invesco AIM Management Group, Inc.); Assistant Secretary, INVESCO Asset Management (Bermuda) Ltd.; Secretary and General Counsel, Invesco Private Capital, Inc.; Assistant Secretary and General Counsel, INVESCO Realty, Inc.; Secretary and General Counsel, Invesco Senior Secured Management, Inc.; and Secretary, Sovereign G./P. Holdings Inc. | | N/A | | N/A |
| Andrew R. Schlossberg – 1974 Senior Vice President | | 2019 | | Head of the Americas and Senior Managing Director, Invesco Ltd.; Director and Senior Vice President, Invesco Advisers, Inc. (formerly known as Invesco Institutional (N.A.), Inc.) (registered investment adviser); Director and Chairman, Invesco Investment Services, Inc. (formerly known as Invesco AIM Investment Services, Inc.) (registered transfer agent); Senior Vice President, The Invesco Funds; Director, Invesco Investment Advisers LLC (formerly known as Van Kampen Asset Management); Director, President and Chairman, Invesco Insurance Agency, Inc. Formerly: Director, Invesco UK Limited; Director and Chief Executive, Invesco Asset Management Limited and Invesco Fund Managers Limited; Assistant Vice President, The Invesco Funds; Senior Vice President, Invesco Advisers, Inc. (formerly known as Invesco Institutional (N.A.), Inc.) (registered investment adviser); Director and Chief Executive, Invesco Administration Services Limited and Invesco Global Investment Funds Limited; Director, Invesco Distributors, Inc.; Head of EMEA, Invesco Ltd.; President, Invesco Actively Managed Exchange-Traded Commodity Fund Trust, Invesco Actively Managed Exchange-Traded Fund Trust, Invesco Exchange-Traded Fund Trust, Invesco Exchange-Traded Fund Trust II and Invesco India Exchange-Traded Fund Trust; Managing Director and Principal Executive Officer, Invesco Capital Management LLC | | N/A | | N/A |
T-4 Invesco Dividend Income Fund
Trustees and Officers–(continued)
| | | | | | | | |
Name, Year of Birth and Position(s) Held with the Trust | | Trustee and/or Officer Since | | Principal Occupation(s) During Past 5 Years | | Number of Funds in Fund Complex Overseen by Trustee | | Other Directorship(s) Held by Trustee During Past 5 Years |
Officers–(continued) | | | | | | | | |
John M. Zerr - 1962 Senior Vice President | | 2006 | | Chief Operating Officer of the Americas; Senior Vice President, Invesco Advisers, Inc. (formerly known as Invesco Institutional (N.A.), Inc.) (registered investment adviser); Senior Vice President, Invesco Distributors, Inc. (formerly known as Invesco AIM Distributors, Inc.); Director and Vice President, Invesco Investment Services, Inc. (formerly known as Invesco AIM Investment Services, Inc.) Senior Vice President, The Invesco Funds; Managing Director, Invesco Capital Management LLC; Director, Invesco Investment Advisers LLC (formerly known as Van Kampen Asset Management); Senior Vice President, Invesco Capital Markets, Inc. (formerly known as Van Kampen Funds Inc.); Manager, Invesco Indexing LLC; Manager, Invesco Specialized Products, LLC; Director and Senior Vice President, Invesco Insurance Agency, Inc.; Member, Invesco Canada Funds Advisory Board; Director, President and Chief Executive Officer, Invesco Corporate Class Inc. (corporate mutual fund company); and Director, Chairman, President and Chief Executive Officer, Invesco Canada Ltd. (formerly known as Invesco Trimark Ltd./Invesco Trimark Ltèe) (registered investment adviser and registered transfer agent); President, Invesco, Inc.; President, Invesco Global Direct Real Estate Feeder GP Ltd.; President, Invesco IP Holdings(Canada) Ltd; President, Invesco Global Direct Real Estate GP Ltd.; President, Invesco Financial Services Ltd. / Services Financiers Invesco Ltée; and President, Trimark Investments Ltd./Placements Trimark Ltée Formerly: Director and Senior Vice President, Invesco Management Group, Inc. (formerly known as Invesco AIM Management Group, Inc.); Secretary and General Counsel, Invesco Management Group, Inc. (formerly known as Invesco AIM Management Group, Inc.); Secretary, Invesco Investment Services, Inc. (formerly known as Invesco AIM Investment Services, Inc.); Chief Legal Officer and Secretary, The Invesco Funds; Secretary and General Counsel, Invesco Investment Advisers LLC (formerly known as Van Kampen Asset Management); Secretary and General Counsel, Invesco Capital Markets, Inc. (formerly known as Van Kampen Funds Inc.); Chief Legal Officer, Invesco Exchange-Traded Fund Trust, Invesco Exchange-Traded Fund Trust II, Invesco India Exchange-Traded Fund Trust, Invesco Actively Managed Exchange-Traded Fund Trust, Invesco Actively Managed Exchange-Traded Commodity Fund Trust and Invesco Exchange-Traded Self-Indexed Fund Trust; Secretary, Invesco Indexing LLC; Director, Secretary, General Counsel and Senior Vice President, Van Kampen Exchange Corp.; Director, Vice President and Secretary, IVZ Distributors, Inc. (formerly known as INVESCO Distributors, Inc.); Director and Vice President, INVESCO Funds Group, Inc.; Director and Vice President, Van Kampen Advisors Inc.; Director, Vice President, Secretary and General Counsel, Van Kampen Investor Services Inc.; Director and Secretary, Invesco Distributors, Inc. (formerly known as Invesco AIM Distributors, Inc.); Director, Senior Vice President, General Counsel and Secretary, Invesco AIM Advisers, Inc. and Van Kampen Investments Inc.; Director, Vice President and Secretary, Fund Management Company; Director, Senior Vice President, Secretary, General Counsel and Vice President, Invesco AIM Capital Management, Inc.; Chief Operating Officer and General Counsel, Liberty Ridge Capital, Inc. (an investment adviser) | | N/A | | N/A |
Gregory G. McGreevey - 1962 Senior Vice President | | 2012 | | Senior Managing Director, Invesco Ltd.; Director, Chairman, President, and Chief Executive Officer, Invesco Advisers, Inc. (formerly known as Invesco Institutional (N.A.), Inc.) (registered investment adviser); Director, Invesco Mortgage Capital, Inc. and Invesco Senior Secured Management, Inc.; and Senior Vice President, The Invesco Funds; and President, SNW Asset Management Corporation and Invesco Managed Accounts, LLC Formerly: Senior Vice President, Invesco Management Group, Inc. and Invesco Advisers, Inc.; Assistant Vice President, The Invesco Funds | | N/A | | N/A |
Kelli Gallegos – 1970 Vice President, Principal Financial Officer and Assistant Treasurer | | 2008 | | Principal Financial and Accounting Officer – Investments Pool, Invesco Specialized Products, LLC; Vice President, Principal Financial Officer and Assistant Treasurer, The Invesco Funds; Principal Financial and Accounting Officer – Pooled Investments, Invesco Capital Management LLC; Vice President and Treasurer, Invesco Exchange-Traded Fund Trust, Invesco Exchange-Traded Fund Trust II, Invesco India Exchange-Traded Fund Trust, Invesco Actively Managed Exchange-Traded Fund Trust, Invesco Actively Managed Exchange-Traded Commodity Fund Trust and Invesco Exchange-Traded Self-Indexed Fund Trust; Vice President, Invesco Advisers, Inc. Formerly: Assistant Treasurer, Invesco Specialized Products, LLC; Assistant Treasurer, Invesco Exchange-Traded Fund Trust, Invesco Exchange-Traded Fund Trust II, Invesco India Exchange-Traded Fund Trust, Invesco Actively Managed Exchange-Traded Fund Trust, Invesco Actively Managed Exchange-Traded Commodity Fund Trust and Invesco Exchange-Traded Self-Indexed Fund Trust; Assistant Treasurer, Invesco Capital Management LLC; Assistant Vice President, The Invesco Funds | | N/A | | N/A |
T-5 Invesco Dividend Income Fund
Trustees and Officers–(continued)
| | | | | | | | |
Name, Year of Birth and Position(s) Held with the Trust | | Trustee and/or Officer Since | | Principal Occupation(s) During Past 5 Years | | Number of Funds in Fund Complex Overseen by Trustee | | Other Directorship(s) Held by Trustee During Past 5 Years |
Officers–(continued) | | | | | | | | |
Crissie M. Wisdom - 1969 Anti-Money Laundering Compliance Officer | | 2013 | | Anti-Money Laundering and OFAC Compliance Officer for Invesco U.S. entities including: Invesco Advisers, Inc. and its affiliates, Invesco Capital Markets, Inc., Invesco Distributors, Inc., Invesco Investment Services, Inc., The Invesco Funds, Invesco Capital Management, LLC, Invesco Trust Company; OppenheimerFunds Distributor, Inc., and Fraud Prevention Manager for Invesco Investment Services, Inc. | | N/A | | N/A |
Todd F. Kuehl - 1969 Chief Compliance Officer | | 2020 | | Chief Compliance Officer, Invesco Advisers, Inc. (registered investment adviser); and Chief Compliance Officer, The Invesco Funds Formerly: Managing Director and Chief Compliance Officer, Legg Mason (Mutual Funds);Chief Compliance Officer, Legg Mason Private Portfolio Group (registered investment adviser) | | N/A | | N/A |
The Statement of Additional Information of the Trust includes additional information about the Fund’s Trustees and is available upon request, without charge, by calling 1.800.959.4246. Please refer to the Fund’s Statement of Additional Information for information on the Fund’s sub-advisers.
| | | | | | |
| Office of the Fund | | Investment Adviser | | Distributor | | Auditors |
| 11 Greenway Plaza, Suite 1000 | | Invesco Advisers, Inc. | | Invesco Distributors, Inc. | | PricewaterhouseCoopers LLP |
| Houston, TX 77046-1173 | | 1555 Peachtree Street, N.E. | | 11 Greenway Plaza, Suite 1000 | | 1000 Louisiana Street, Suite 5800 |
| | Atlanta, GA 30309 | | Houston, TX 77046-1173 | | Houston, TX 77002-5678 |
| | | |
| Counsel to the Fund | | Counsel to the Independent Trustees | | Transfer Agent | | Custodian |
| Stradley Ronon Stevens & Young, LLP | | Goodwin Procter LLP | | Invesco Investment Services, Inc. | | State Street Bank and Trust Company |
| 2005 Market Street, Suite 2600 | | 901 New York Avenue, N.W. | | 11 Greenway Plaza, Suite 1000 | | 225 Franklin Street |
| Philadelphia, PA 19103-7018 | | Washington, D.C. 20001 | | Houston, TX 77046-1173 | | Boston, MA 02110-2801 |
T-6 Invesco Dividend Income Fund

Go paperless with eDelivery
Visit invesco.com/edelivery to enjoy the convenience and security of anytime electronic access to your investment documents.
With eDelivery, you can elect to have any or all of the following materials delivered straight to your inbox to download, save and print from your own computer:
| ∎ | | Fund reports and prospectuses |
Invesco mailing information
Send general correspondence to Invesco Investment Services, Inc., P.O. Box 219078, Kansas City, MO 64121-9078.
Important notice regarding delivery of security holder documents
To reduce Fund expenses, only one copy of most shareholder documents may be mailed to shareholders with multiple accounts at the same address (Householding). Mailing of your shareholder documents may be householded indefinitely unless you instruct us otherwise. If you do not want the mailing of these documents to be combined with those for other members of your household, please contact Invesco Investment Services, Inc. at 800 959 4246 or contact your financial institution. We will begin sending you individual copies for each account within 30 days after receiving your request.
Fund holdings and proxy voting information
The Fund provides a complete list of its holdings four times in each fiscal year, at the quarter-ends. For the second and fourth quarters, the list appears in the Fund’s semiannual and annual reports to shareholders. For the first and third quarters, the Fund files the lists with the Securities and Exchange Commission (SEC) as an exhibit to its reports on Form N-PORT. The most recent list of portfolio holdings is available at invesco.com/completeqtrholdings. Shareholders can also look up the Fund’s Form N-PORT filings on the SEC website, sec.gov. The SEC file numbers for the Fund are shown below.
A description of the policies and procedures that the Fund uses to determine how to vote proxies relating to portfolio securities is available without charge, upon request, from our Client Services department at 800 959 4246, or at invesco.com/ proxyguidelines. The information is also available on the SEC website, sec.gov.
| | |
Information regarding how the Fund voted proxies related to its portfolio securities during the most recent 12-month period ended June 30 is available at invesco.com/proxysearch. This information is also available on the SEC website, sec.gov. Invesco Advisers, Inc. is an investment adviser; it provides investment advisory services to individual and institutional clients and does not sell securities. Invesco Distributors, Inc. is the US distributor for Invesco Ltd.’s retail mutual funds, exchange-traded funds and institutional money market funds. Both are wholly owned, indirect subsidiaries of Invesco Ltd. | | |
| | | | | | |
| SEC file numbers: 811-03826 and 002-85905 | | Invesco Distributors, Inc. | | I-DIVI-AR-1 | | |
| | | | |
| | |
 | | Annual Report to Shareholders | | April 30, 2020 |
| | Invesco Energy Fund |
| | Nasdaq: | | |
| | A: IENAX ∎ C: IEFCX ∎ Y: IENYX ∎ Investor: FSTEX ∎ R5: IENIX ∎ R6: IENSX |

Beginning on January 1, 2021, as permitted by regulations adopted by the Securities and Exchange Commission, paper copies of the Fund’s shareholder reports will no longer be sent by mail, unless you specifically request paper copies of the reports from the Fund or from your financial intermediary, such as a broker-dealer or bank. Instead, the reports will be made available on the Fund’s website, and you will be notified by mail each time a report is posted and provided with a website link to access the report.
If you already elected to receive shareholder reports electronically, you will not be affected by this change and you need not take any action. You may elect to receive shareholder reports and other communications from the Fund electronically by contacting your financial intermediary (such as a broker-dealer or bank) or, if you are a direct investor, by enrolling at invesco.com/edelivery.
You may elect to receive all future reports in paper free of charge. If you invest through a financial intermediary, you can contact your financial intermediary to request that you continue to receive paper copies of your shareholder reports. If you invest directly with the Fund, you can call (800) 959-4246 to let the Fund know you wish to continue receiving paper copies of your shareholder reports. Your election to receive reports in paper will apply to all funds held with your financial intermediary or all funds held with the fund complex if you invest directly with the Fund.
Letters to Shareholders
| | |

Andrew Schlossberg | | Dear Shareholders: This annual report includes information about your Fund, including performance data and a complete list of its investments as of the close of the reporting period. Inside is a discussion of how your Fund was managed and the factors that affected its performance during the reporting period. |
| | Global equities and fixed-income securities faced a tumultuous environment during the reporting period. This was particularly true in the later stages of the period as a pandemic gripped the world and unsettled markets. At the onset of the reporting period, global equity markets were buoyed by a more accommodative stance from central banks. Despite US-China trade concerns and signs of slowing global growth, which led to some market volatility along the way, the second and third quarters of 2019 were relatively calm. In the final months of 2019, better-than-expected third quarter corporate earnings and initial agreement of the phase one US-China trade deal provided a favorable backdrop for equities and impressive fourth quarter global equity returns. |
The first quarter of 2020 proved to be a wild roller-coaster ride as the year began with US investors treated to equity gains culminating in record highs on February 19, 2020. The first half of the quarter, however, belied the impact the coronavirus (COVID-19) would have on markets in a world faced with shuttered businesses and global lockdowns. Equity markets began to sell off in late February and plummeted in March. The speed and depth of market declines and reversals during the month made March 2020 one of the most volatile months on record. While equities languished, government bonds largely performed as expected as central banks cut interest rates, which lowered bond yields but sent bond prices soaring. Like equities, however, corporate bond prices fell due to the impact of diminished corporate profits. Commodity prices, sans gold, largely declined during the first quarter. Oil prices suffered steep declines losing more than half their value in March amid a demand slump due to both COVID-19 and a supply glut from the Russia-Saudi Arabi oil-price war.
In response to the financial and economic hardships caused by the pandemic, central banks and governments around the world responded with fiscal and monetary stimulus. The US Federal Reserve cut interest rates to near zero (0.00-0.25%) and announced an unprecedented quantitative easing program. The US administration also passed a $2.2 trillion economic-relief package – the largest in US history. Most major economies outside of the US provided liquidity in the bond and equity markets in the form of fiscal policy and quantitative easing.
Massive global fiscal and monetary responses prompted a significant market rebound in April, with the S&P 500 Index recording one of its best monthly performances ever, despite macroeconomic data that illustrated the enormous economic cost of the shutdowns – more than 30 million US workers have lost their jobs and the US economy contracted at a 5.0% annualized rate (second estimate) for the first quarter of 2020. The final month of the reporting period also proved less volatile than March as markets attempted to normalize. As markets and investors attempt to adapt to a new normal, we’ll see how the interplay of interest rates, economic data, geopolitics and a host of other factors affect US and overseas equity and fixed income markets.
Investor uncertainty and market volatility, such as we witnessed during the reporting period, are unfortunate facts of life when it comes to investing. That’s why Invesco encourages investors to work with a professional financial adviser who can stress the importance of starting to save and invest early and the importance of adhering to a disciplined investment plan. A financial adviser who knows your unique financial situation, investment goals and risk tolerance can be an invaluable partner as you seek to achieve your financial goals. Financial advisers can also offer a long-term perspective when markets are volatile and time-tested advice and guidance when your financial situation or investment goals change.
Visit our website for more information on your investments
Our website, invesco.com/us, offers a wide range of market insights and investment perspectives. On the website, you’ll find detailed information about our funds, including performance, holdings and portfolio manager commentaries. You can access information about your account by completing a simple, secure online registration. To do so, select “Log In” on the right side of the homepage, and then select “Register for Individual Account Access.”
In addition to the resources accessible on our website and through our mobile app, you can obtain timely updates to help you stay informed about the markets and the economy by connecting with Invesco on Twitter, LinkedIn or Facebook. You can access our blog at blog.invesco.us.com. Our goal is to provide you the information you want, when and where you want it.
Finally, I’m pleased to share with you Invesco’s commitment to both the Principles for Responsible Investment and to considering environmental, social and governance issues in our robust investment process. I invite you to learn more at invesco.com/esg.
Have questions?
For questions about your account, contact an Invesco client services representative at 800 959 4246.
All of us at Invesco look forward to serving your investment management needs. Thank you for investing with us.
Sincerely,

Andrew Schlossberg
Head of the Americas,
Senior Managing Director, Invesco Ltd.
2 Invesco Energy Fund
| | |

Bruce Crockett | | Dear Shareholders: Among the many important lessons I’ve learned in more than 40 years in a variety of business endeavors is
the value of a trusted advocate. As independent chair of the Invesco Funds Board, I can assure you that the members of the Board are
strong advocates for the interests of investors in Invesco’s mutual funds. We work hard to represent your
interests through oversight of the quality of the investment management services your funds receive and
other matters important to your investment, including but not limited to: ∎ Ensuring that Invesco offers a diverse lineup of mutual funds that your financial adviser can use
to strive to meet your financial needs as your investment goals change over time.
∎ Monitoring how the portfolio management teams of the Invesco funds are performing in light of
changing economic and market conditions. |
| | ∎ Assessing each portfolio management team’s investment performance within the context of |
| the investment strategy described in the fund’s prospectus. |
| ∎ | | Monitoring for potential conflicts of interests that may impact the nature of the services that your funds receive. |
We believe one of the most important services we provide our fund shareholders is the annual review of the funds’ advisory and sub-advisory contracts with Invesco Advisers and its affiliates. This review is required by the Investment Company Act of 1940 and focuses on the nature and quality of the services Invesco provides as the adviser to the Invesco funds and the reasonableness of the fees that it charges for those services. Each year, we spend months carefully reviewing information received from Invesco and a variety of independent sources, such as performance and fee data prepared by Lipper, Inc. (a subsidiary of Broadridge Financial Solutions, Inc.), an independent, third-party firm widely recognized as a leader in its field. We also meet with our independent legal counsel and other independent advisers to review and help us assess the information that we have received. Our goal is to assure that you receive quality investment management services for a reasonable fee.
I trust the measures outlined above provide assurance that you have a worthy advocate when it comes to choosing the Invesco Funds. On behalf of the Board, we look forward to continuing to represent your interests and serving your needs.
|
| Sincerely, |
 |
| Bruce L. Crockett |
| Independent Chair |
| Invesco Funds Board of Trustees |
3 Invesco Energy Fund
Management’s Discussion of Fund Performance
| | | | |
Performance summary | |
For the fiscal year ended April 30, 2020, Class A shares of Invesco Energy Fund (the Fund), at net asset value (NAV), underperformed the MSCI World Energy Index, the Fund’s style-specific benchmark. | |
| Your Fund’s long-term performance appears later in this report. | | | | |
Fund vs. Indexes Total returns, April 30, 2019 to April 30, 2020, at net asset value (NAV). Performance shown does not include applicable contingent deferred sales charges (CDSC) or front-end sales charges, which would have reduced performance. | |
| Class A Shares | | | -44.30 | % |
| Class C Shares | | | -44.72 | |
| Class Y Shares | | | -44.17 | |
| Investor Class Shares | | | -44.30 | |
| Class R5 Shares | | | -44.03 | |
| Class R6 Shares | | | -44.02 | |
| S&P 500 Index▼ (Broad Market Index) | | | 0.86 | |
| MSCI World Energy Index▼ (Style-Specific Index) | | | -37.77 | |
| Lipper Natural Resource Funds Index∎ (Peer Group Index) | | | -44.55 | |
Source(s): ▼RIMES Technologies Corp.; ∎Lipper Inc. | | | | |
Market conditions and your Fund
Global equity markets faced volatility in the second and third quarters of 2019, hampered by ongoing US and China trade issues, potential for new tariffs and weakening global economic growth. Disagreement within the UK regarding its withdrawal from the European Union increased uncertainty for the UK and eurozone economies.
Much of 2019 showed slowing manufacturing activity and declining business investment, which was evidence that trade tensions were stifling economic growth across both developed and emerging markets. Global recession concerns caused a sharp equity sell-off in August 2019, as investors crowded into asset classes perceived as safe havens, including US Treasuries and gold.
Third quarter macroeconomic and geopolitical issues mostly abated during the fourth quarter, providing a favorable backdrop for global equity returns. In response to third quarter economic weakness, central banks maintained accommodative policies, with the US Federal Reserve cutting interest rates in October 2019 and the European Central Bank restarting net purchases in its asset purchase program in November. Better economic data and signs of progress in US and China trade talks also supported global equities. The UK’s general election in December delivered a decisive victory to the conservative party, reaffirming the original Brexit vote and the UK’s eventual exit from the European Union.
Global equity markets started 2020 well, buoyed by positive economic data and the phase one signing of the US and China trade deal. However, initial optimism was dampened by the outbreak of the new coronavirus (COVID-19) that swiftly spread from China to other global regions. Global equity markets fell sharply as the human and economic cost of the COVID-19 pandemic mounted. At the
same time, oil prices fell sharply as a price war between Saudi Arabia and Russia threatened to boost supply even as demand was falling. The US bull market came to an abrupt end, while emerging equity markets also fell sharply. As fear of a worldwide recession increased, central banks around the world took aggressive action to support both local markets and the global economy. At the close of the fiscal year, despite the continuing global spread of COVID-19, April saw both equity and credit markets stage a rebound from the severe market shock witnessed in March. In this environment, global equity markets declined for the fiscal year, with developed markets outperforming emerging markets.
Crude oil prices were stable for most of 2019, with volatility increasing at the beginning of 2020. Brent and West Texas Intermediate oil prices declined from approximately $70 and $60 per barrel, to approximately $20 and $25, respectively, per barrel.1 Prices declined steeply during the first quarter of 2020 due to concerns of extreme demand destruction brought on by COVID-19-related lockdowns. OPEC production cuts and global well shut-ins will help to alleviate the build in supply, while demand has already started its recovery. Natural gas prices declined from approximately $2.60 per thousand cubic feet at the beginning of the fiscal year to approximately $1.90 per thousand cubic feet by the end of the fiscal year.1 While energy stocks as a group fell over the fiscal year, a disconnect between energy stocks and oil prices was evident, as energy equities experienced greater declines relative to oil prices, particularly when looking at the higher level of futures prices for the commodity.
During the fiscal year, the Fund underperformed the MSCI World Energy Index, its style-specific benchmark, as a result of security selection in and overweight exposure to the oil and gas equipment and services industry.
Additionally, underweight exposure to the oil and gas storage and transportation industry, which outperformed the style-specific benchmark, detracted from the Fund’s relative performance. Conversely, out-of-benchmark exposure to the specialty chemicals and commodity chemicals industries benefited the Fund’s relative performance, as these industries outperformed the style-specific benchmark.
Top individual detractors from the Fund’s performance for the fiscal year included Suncor Energy and Occidental Petroleum. Shares of Suncor and Occidental declined during the fiscal year due to the COVID-19-related commodity price shock, which impacted all areas of the energy complex, hitting transportation fuels particularly hard. Although shares underperformed during the fiscal year, we still saw significant value in business lines that both these companies operate in.
During the fiscal year, top individual contributors to the Fund’s performance included Range Resources and Cabot Oil & Gas. Although share prices declined over the fiscal year, these holdings showed relatively strong performance. Range Resources, an independent oil and gas exploration and production (E&P) company, has a premium land position in the Marcellus Shale. We still felt comfortable with the upside return potential from where the stock was trading at the close of the fiscal year. Cabot Oil & Gas is a low-cost natural gas producer that we believe should benefit from the associated gas production losses resulting from the COVID-19 impact on the oil patch.
At the end of the fiscal year, relative to the style-specific benchmark, the Fund had overweight exposures to the independent E&P, oilfield equipment and services and specialty chemicals industries. This positioning reflects our opinion of the areas with the best upside potential. Conversely, the Fund had significant underweight exposures to the integrated oil and gas and the oil and gas storage and transportation industries relative to the style-specific benchmark.
With a very low oil price level at the end of the fiscal year, it was our view that the industry required a much higher commodity price level in order to encourage reinvestment in the business. At the close of the fiscal year, we saw a significant disconnect in the underlying cash flow generation potential of companies within the Fund relative to their current stock price. This was evident in the many holdings that experienced share buybacks and strong cash flow over the course of the last two fiscal years. Overall, we believe E&P companies are spending prudently in the current oil environment and the price multiples are cheap compared to historical levels.
We continue to focus on companies that we believe have high-quality assets and free cash flow, led by capable management teams. We have used market volatility to increase the
4 Invesco Energy Fund
Fund’s core positions, and we believe that we’ve positioned the Fund for a return to an appreciation of long-term company fundamentals.
While oil prices may be headline news, the Fund is intended to be a long-term investment.
As always, thank you for your continued investment in Invesco Energy Fund.
Portfolio manager:
Effective June 5, 2020, Kevin Holt became manager of the Fund.
The views and opinions expressed in management’s discussion of Fund performance are those of Invesco Advisers, Inc. These views and opinions are subject to change at any time based on factors such as market and economic conditions. These views and opinions may not be relied upon as investment advice or recommendations, or as an offer for a particular security. The information is not a complete analysis of every aspect of any market, country, industry, security or the Fund. Statements of fact are from sources considered reliable, but Invesco Advisers, Inc. makes no representation or warranty as to their completeness or accuracy. Although historical performance is no guarantee of future results, these insights may help you understand our investment management philosophy.
See important Fund and, if applicable, index disclosures later in this report.
5 Invesco Energy Fund
Your Fund’s Long-Term Performance
Results of a $10,000 Investment – Oldest Share Class(es)
Fund and index data from 4/30/10
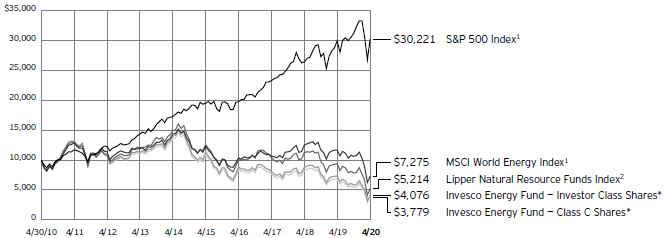
| 1 | Source: RIMES Technologies Corp. |
| * It is | Invesco’s policy to chart the Fund’s oldest share class(es). Because Investor Class shares do not have a sales charge, we also show the oldest share class with a sales charge, Class C shares. |
Past performance cannot guarantee future results.
The data shown in the chart include reinvested distributions, applicable sales charges and Fund expenses including management
fees. Index results include reinvested dividends, but they do not reflect sales charges. Performance of the peer group, if applicable, reflects fund expenses and management fees;
performance of a market index does not. Performance shown in the chart does not reflect deduction of taxes a shareholder would pay on Fund distributions or sale of Fund shares.
6 Invesco Energy Fund
| | | | |
| Average Annual Total Returns | |
| As of 4/30/20, including maximum applicable sales charges | |
| |
| Class A Shares | | | | |
| Inception (3/28/02) | | | 0.62 | % |
| 10 Years | | | -9.10 | |
5 Years | | | -19.51 | |
1 Year | | | -47.38 | |
| |
| Class C Shares | | | | |
| Inception (2/14/00) | | | 2.36 | % |
| 10 Years | | | -9.27 | |
5 Years | | | -19.20 | |
1 Year | | | -45.27 | |
| |
| Class Y Shares | | | | |
| Inception (10/3/08) | | | -5.95 | % |
| 10 Years | | | -8.36 | |
5 Years | | | -18.39 | |
1 Year | | | -44.17 | |
| |
| Investor Class Shares | | | | |
| Inception (1/19/84) | | | 4.70 | % |
| 10 Years | | | -8.58 | |
5 Years | | | -18.58 | |
1 Year | | | -44.30 | |
| |
| Class R5 Shares | | | | |
| Inception (1/31/06) | | | -4.86 | % |
| 10 Years | | | -8.22 | |
5 Years | | | -18.23 | |
1 Year | | | -44.03 | |
| |
| Class R6 Shares | | | | |
| 10 Years | | | -8.46 | % |
5 Years | | | -18.36 | |
1 Year | | | -44.02 | |
| Performance includes litigation proceeds. Had these proceeds not been received, total returns would have been lower. | |
Class R6 shares incepted on April 4, 2017. Performance shown prior to that date is that of Class A shares and includes the 12b-1 fees applicable to Class A shares.
The performance data quoted represent past performance and cannot guarantee future results; current performance may be lower or higher. Please visit invesco.com/ performance for the most recent month-end performance. Performance figures reflect reinvested distributions, changes in net asset value and the effect of the maximum sales charge unless otherwise stated. Performance figures do not reflect deduction of taxes a shareholder would pay on Fund distributions or sale of Fund shares. Investment return and principal value will fluctuate so that you may have a gain or loss when you sell shares.
Class A share performance reflects the maximum 5.50% sales charge, and Class C share performance reflects the applicable contingent deferred sales charge (CDSC) for the period involved. The CDSC on Class C shares is 1% for the first year after purchase. Class Y, Investor Class, Class R5
and Class R6 shares do not have a front-end sales charge or a CDSC; therefore, performance is at net asset value.
The performance of the Fund’s share classes will differ primarily due to different sales charge structures and class expenses.
Fund performance reflects any applicable fee waivers and/or expense reimbursements. Had the adviser not waived fees and/or reimbursed expenses currently or in the past, returns would have been lower. See current prospectus for more information.
7 Invesco Energy Fund
Invesco Energy Fund’s investment objective is long-term growth of capital.
| ∎ | | Unless otherwise stated, information presented in this report is as of April 30, 2020, and is based on total net assets. |
| ∎ | | Unless otherwise noted, all data provided by Invesco. |
| ∎ | | To access your Fund’s reports/prospectus, visit invesco.com/fundreports. |
About indexes used in this report
| ∎ | | The S&P 500® Index is an unmanaged index considered representative of the US stock market. |
| ∎ | | The MSCI World Energy Index is designed to capture the performance of energy stocks across developed market countries. The index is computed using the net return, which withholds applicable taxes for non-resident investors. |
| ∎ | | The Lipper Natural Resource Funds Index is an unmanaged index considered representative of natural resource funds tracked by Lipper. |
| ∎ | | The Fund is not managed to track the performance of any particular index, including the index(es) described here, and consequently, the performance of the Fund may deviate significantly from the performance of the index(es). |
| ∎ | | A direct investment cannot be made in an index. Unless otherwise indicated, index results include reinvested dividends, and they do not reflect sales charges. Performance of the peer group, if applicable, reflects fund expenses; performance of a market index does not. |
Liquidity Risk Management Program
The Securities and Exchange Commission has adopted Rule 22e-4 under the Investment Company Act of 1940 (the “Liquidity Rule”) in order to promote effective liquidity risk management throughout the open-end investment company industry, thereby reducing the risk that funds will be unable to meet their redemption obligations and mitigating dilution of the interests of fund shareholders. The Fund has adopted and implemented a liquidity risk management program in accordance with the Liquidity Rule (the “Program”). The Program is reasonably designed to assess and manage the Fund’s liquidity risk, which is the risk that the Fund could not meet redemption requests without significant dilution of remaining investors’ interests in the Fund. The Board of Trustees of the Fund (the “Board”) has appointed Invesco Advisers, Inc. (“Invesco”), the Fund’s investment adviser, as the Program’s administrator, and Invesco has delegated oversight of the Program to the Liquidity Risk Management Committee (the “Committee”), which is composed of senior representatives from relevant business groups at Invesco.
As required by the Liquidity Rule, the Program includes policies and procedures providing for an assessment, no less frequently than annually, of the Fund’s liquidity risk that takes into account, as relevant to the Fund’s liquidity risk: (1) the Fund’s investment strategy and liquidity of portfolio investments during both normal and reasonably foreseeable stressed conditions; (2) short-term and long-term cash flow projections for the Fund during both normal and reasonably foreseeable stressed conditions; and (3) the Fund’s holdings of cash and cash equivalents and any borrowing arrangements. The Liquidity Rule also requires the classification of the Fund’s investments into categories that reflect the assessment of their relative liquidity under current market conditions. The Fund classifies its investments into one of four categories defined in the Liquidity Rule: “Highly Liquid,” “Moderately Liquid,” “Less Liquid” and “Illiquid.” Funds that are not invested primarily in “Highly Liquid Investments” that are assets (cash or investments that are reasonably expected to be convertible into cash within three business days without significantly changing the market value of the investment) are required to establish a “Highly Liquid Investment Minimum” (“HLIM”), which is the minimum percentage of net assets that must be invested in Highly Liquid Investments. Funds with HLIMs have procedures for addressing HLIM shortfalls, including reporting to the Board and the SEC (on a non-public basis) as required by the Program and the Liquidity Rule. In addition, the Fund may not acquire an investment if, immediately after the acquisition, over 15% of the Fund’s net assets would consist of “Illiquid Investments” that are assets (an investment that cannot reasonably be expected to be sold or disposed of in current market conditions in seven calendar days or less without the sale or disposition significantly changing the market value of the investment). The Liquidity Rule and the Program also require reporting to the Board and the SEC (on a non-public basis) if a Fund’s holdings of Illiquid Investments exceed 15% of the Fund’s assets.
At a meeting held on March 30-April 1, 2020, the Committee presented a report to the Board that addressed the operation of the Program and assessed the
Program’s adequacy and effectiveness of implementation (the “Report”). The Report covered the period from December 1, 2018 through December 31, 2019 (the “Program Reporting Period”).
The Report stated, in relevant part, that during the Program Reporting Period:
| ∎ | | The Program, as adopted and implemented, remained reasonably designed to assess and manage the Fund’s liquidity risk and was operated effectively to achieve that goal; |
| ∎ | | The Fund’s investment strategy remained appropriate for an open-end fund; |
| ∎ | | The Fund was able to meet requests for redemption without significant dilution of remaining investors’ interests in the Fund; |
| ∎ | | The Fund did not breach the 15% limit on Illiquid Investments; and |
| ∎ | | The Fund primarily held Highly Liquid Investments and therefore has not adopted an HLIM. |
|
| This report must be accompanied or preceded by a currently effective Fund prospectus, which contains more complete information, including sales charges and expenses. Investors should read it carefully before investing. |
NOT FDIC INSURED | MAY LOSE VALUE | NO BANK GUARANTEE
8 Invesco Energy Fund
Fund Information
Portfolio Composition
| | | | | |
| By industry | | % of total net assets |
Integrated Oil & Gas | | | | 35.04 | % |
Oil & Gas Exploration & Production | | | | 33.48 | |
Oil & Gas Equipment & Services | | | | 8.66 | |
Specialty Chemicals | | | | 3.84 | |
Oil & Gas Refining & Marketing | | | | 3.47 | |
Diversified Metals & Mining | | | | 2.91 | |
Commodity Chemicals | | | | 2.47 | |
Oil & Gas Storage & Transportation | | | | 2.30 | |
Oil & Gas Drilling | | | | 2.15 | |
Money Market Funds Plus Other Assets Less Liabilities | | | | 5.68 | |
Top 10 Equity Holdings*
| | | | | | | |
| | | | | % of total net assets |
1. | | Chevron Corp. | | | | 6.36 | % |
2. | | Canadian Natural Resources Ltd. | | | | 5.70 | |
3. | | Noble Energy, Inc. | | | | 5.28 | |
4. | | BP PLC, ADR | | | | 5.28 | |
5. | | Suncor Energy, Inc. | | | | 5.08 | |
6. | | Royal Dutch Shell PLC, Class A, ADR | | | | 4.51 | |
7. | | Hess Corp. | | | | 4.44 | |
8. | | PrairieSky Royalty Ltd. | | | | 4.35 | |
9. | | TOTAL S.A. | | | | 4.19 | |
10. | | Exxon Mobil Corp. | | | | 4.12 | |
The Fund’s holdings are subject to change, and there is no assurance that the Fund will continue to hold any particular security.
* Excluding money market fund holdings, if any.
Data presented here are as of April 30, 2020.
9 Invesco Energy Fund
Schedule of Investments(a)
April 30, 2020
| | | | | | | | |
| | | Shares | | | Value | |
Common Stocks & Other Equity Interests–94.32% | |
Commodity Chemicals–2.47% | | | | | | | | |
LG Chem Ltd. (South Korea) | | | 15,822 | | | $ | 4,915,478 | |
|
| Diversified Metals & Mining–2.91% | |
Glencore PLC (Switzerland)(b) | | | 1,587,183 | | | | 2,946,208 | |
Turquoise Hill Resources Ltd. (Mongolia)(b) | | | 5,625,410 | | | | 2,840,832 | |
| | | | | | | | 5,787,040 | |
| | |
| Integrated Oil & Gas–35.04% | | | | | | | | |
BP PLC, ADR (United Kingdom) | | | 441,608 | | | | 10,510,270 | |
Chevron Corp. | | | 137,593 | | | | 12,658,556 | |
Exxon Mobil Corp. | | | 176,667 | | | | 8,209,716 | |
Galp Energia SGPS S.A. (Portugal) | | | 535,516 | | | | 6,177,210 | |
Occidental Petroleum Corp. | | | 287,614 | | | | 4,774,392 | |
Royal Dutch Shell PLC, Class A, ADR (United Kingdom) | | | 270,901 | | | | 8,974,950 | |
Suncor Energy, Inc. (Canada) | | | 567,094 | | | | 10,111,910 | |
TOTAL S.A. (France) | | | 231,690 | | | | 8,354,124 | |
| | | | | | | | 69,771,128 | |
| | |
| Oil & Gas Drilling–2.15% | | | | | | | | |
Helmerich & Payne, Inc. | | | 216,511 | | | | 4,280,422 | |
| |
| Oil & Gas Equipment & Services–8.66% | | | | | |
Baker Hughes Co., Class A | | | 358,173 | | | | 4,996,513 | |
Halliburton Co. | | | 481,442 | | | | 5,055,141 | |
Oceaneering International, Inc.(b) | | | 261,685 | | | | 1,345,061 | |
Tenaris S.A., ADR (Luxembourg) | | | 423,553 | | | | 5,794,205 | |
Tidewater, Inc., Series A, Wts., expiring 07/31/2023(b) | | | 24,724 | | | | 23,582 | |
Tidewater, Inc., Series B, Wts., expiring 07/31/2023(b) | | | 26,728 | | | | 26,461 | |
| | | | | | | | 17,240,963 | |
| |
| Oil & Gas Exploration & Production–33.48% | | | | | |
Cabot Oil & Gas Corp. | | | 250,616 | | | | 5,418,318 | |
| | | | | | | | |
| | | Shares | | | Value | |
| Oil & Gas Exploration & Production–(continued) | |
Canadian Natural Resources Ltd. (Canada) | | | 677,776 | | | $ | 11,350,234 | |
Concho Resources, Inc. | | | 93,271 | | | | 5,290,331 | |
Devon Energy Corp. | | | 624,942 | | | | 7,793,027 | |
Hess Corp. | | | 181,573 | | | | 8,831,711 | |
Laredo Petroleum, Inc.(b) | | | 757,499 | | | | 825,674 | |
Matador Resources Co.(b) | | | 227,407 | | | | 1,600,945 | |
Noble Energy, Inc. | | | 1,071,681 | | | | 10,513,191 | |
PrairieSky Royalty Ltd. (Canada) | | | 1,184,918 | | | | 8,665,875 | |
Range Resources Corp. | | | 1,095,282 | | | | 6,385,494 | |
| | | | | | | | 66,674,800 | |
| |
| Oil & Gas Refining & Marketing–3.47% | | | | | |
Phillips 66 | | | 94,533 | | | | 6,916,980 | |
| |
| Oil & Gas Storage & Transportation–2.30% | | | | | |
Plains All American Pipeline L.P. | | | 518,698 | | | | 4,580,103 | |
| | |
| Specialty Chemicals–3.84% | | | | | | | | |
Albemarle Corp. | | | 124,577 | | | | 7,652,765 | |
Total Common Stocks & Other Equity Interests (Cost $401,147,457) | | | | 187,819,679 | |
| | |
| Money Market Funds–5.08% | | | | | | | | |
Invesco Government & Agency Portfolio, Institutional Class, 0.20%(c)(d) | | | 3,580,599 | | | | 3,580,599 | |
Invesco Liquid Assets Portfolio, Institutional Class, 0.60%(c)(d) | | | 2,447,680 | | | | 2,449,148 | |
Invesco Treasury Portfolio, Institutional Class, 0.10%(c)(d) | | | 4,092,113 | | | | 4,092,113 | |
Total Money Market Funds (Cost $10,121,263) | | | | 10,121,860 | |
TOTAL INVESTMENTS IN
SECURITIES–99.40%
(Cost $411,268,720) | | | | 197,941,539 | |
OTHER ASSETS LESS LIABILITIES–0.60% | | | | 1,200,054 | |
NET ASSETS–100.00% | | | | | | $ | 199,141,593 | |
Investment Abbreviations:
ADR - American Depositary Receipt
Wts. - Warrants
Notes to Schedule of Investments:
| (a) | Industry and/or sector classifications used in this report are generally according to the Global Industry Classification Standard, which was developed by and is the exclusive property and a service mark of MSCI Inc. and Standard & Poor’s. |
| (b) | Non-income producing security. |
| (c) | Affiliated issuer. The issuer and/or the Fund is a wholly-owned subsidiary of Invesco Ltd., or is affiliated by having an investment adviser that is under common control of Invesco Ltd. The table below shows the Fund’s transactions in, and earnings from, its investments in affiliates for the fiscal year ended April 30, 2020. |
| | | | | | | | | | | | | | | | | | | | | | | | | | | | |
| | | Value
April 30, 2019 | | | Purchases at Cost | | | Proceeds from Sales | | | Change in
Unrealized
Appreciation | | | Realized
Gain | | | Value April 30, 2020 | | | Dividend
Income | |
Investments in Affiliated Money Market Funds: | | | | | | | | | | | | | | | | | | | | | | | | | | | | |
Invesco Government & Agency Portfolio, Institutional Class | | | $1,909,297 | | | | $27,926,404 | | | | $(26,255,102 | ) | | | $ - | | | | $ - | | | | $ 3,580,599 | | | | $14,087 | |
| |
Invesco Liquid Assets Portfolio, Institutional Class | | | 1,363,780 | | | | 19,713,500 | | | | (18,629,681 | ) | | | 597 | | | | 952 | | | | 2,449,148 | | | | 11,562 | |
| |
Invesco Treasury Portfolio, Institutional Class | | | 2,182,054 | | | | 31,915,890 | | | | (30,005,831 | ) | | | - | | | | - | | | | 4,092,113 | | | | 15,447 | |
| |
Total | | | $5,455,131 | | | | $79,555,794 | | | | $(74,890,614 | ) | | | $597 | | | | $952 | | | | $10,121,860 | | | | $41,096 | |
| |
| (d) | The rate shown is the 7-day SEC standardized yield as of April 30, 2020. |
See accompanying Notes to Financial Statements which are an integral part of the financial statements.
10 Invesco Energy Fund
Statement of Assets and Liabilities
April 30, 2020
| | | | |
Assets: | | | | |
Investments in securities, at value
(Cost $401,147,457) | | $ | 187,819,679 | |
Investments in affiliated money market funds, at value (Cost $10,121,263) | | | 10,121,860 | |
Cash | | | 719 | |
Foreign currencies, at value (Cost $125,193) | | | 123,456 | |
Receivable for: | | | | |
Investments sold | | | 831,653 | |
Fund shares sold | | | 742,408 | |
Dividends | | | 103,796 | |
Investment for trustee deferred compensation and retirement plans | | | 223,043 | |
Other assets | | | 44,938 | |
Total assets | | | 200,011,552 | |
| |
Liabilities: | | | | |
Payable for: | | | | |
Fund shares reacquired | | | 310,013 | |
Accrued fees to affiliates | | | 189,190 | |
Accrued trustees’ and officers’ fees and benefits | | | 475 | |
Accrued other operating expenses | | | 124,352 | |
Trustee deferred compensation and retirement plans | | | 245,929 | |
Total liabilities | | | 869,959 | |
Net assets applicable to shares outstanding | | $ | 199,141,593 | |
| |
Net assets consist of: | | | | |
Shares of beneficial interest | | $ | 712,352,238 | |
Distributable earnings (loss) | | | (513,210,645 | ) |
| | | $ | 199,141,593 | |
| | | | |
Net Assets: | | | | |
Class A | | $ | 121,101,553 | |
Class C | | $ | 13,868,113 | |
Class Y | | $ | 14,398,235 | |
Investor Class | | $ | 47,045,908 | |
Class R5 | | $ | 2,370,660 | |
Class R6 | | $ | 357,124 | |
Shares outstanding, no par value, with an unlimited number of shares authorized:
| | | | |
Class A | | | 10,493,717 | |
Class C | | | 1,411,637 | |
Class Y | | | 1,247,173 | |
Investor Class | | | 4,094,282 | |
Class R5 | | | 200,328 | |
Class R6 | | | 30,198 | |
Class A: | | | | |
Net asset value per share | | $ | 11.54 | |
Maximum offering price per share
(Net asset value of $11.54 ÷ 94.50%) | | $ | 12.21 | |
Class C: | | | | |
Net asset value and offering price per share | | $ | 9.82 | |
Class Y: | | | | |
Net asset value and offering price per share | | $ | 11.54 | |
Investor Class: | | | | |
Net asset value and offering price per share | | $ | 11.49 | |
Class R5: | | | | |
Net asset value and offering price per share | | $ | 11.83 | |
Class R6: | | | | |
Net asset value and offering price per share | | $ | 11.83 | |
See accompanying Notes to Financial Statements which are an integral part of the financial statements.
11 Invesco Energy Fund
Statement of Operations
For the year ended April 30, 2020
| | | | |
Investment income: | | | | |
Dividends (net of foreign withholding taxes of $658,240) | | $ | 11,659,017 | |
| |
Dividends from affiliated money market funds | | | 41,096 | |
| |
Total investment income | | | 11,700,113 | |
| |
| |
Expenses: | | | | |
Advisory fees | | | 2,269,824 | |
| |
Administrative services fees | | | 48,299 | |
| |
Custodian fees | | | 16,282 | |
| |
Distribution fees: | | | | |
Class A | | | 446,017 | |
| |
Class C | | | 219,443 | |
| |
Investor Class | | | 180,100 | |
| |
Transfer agent fees – A, C, Y and Investor Class | | | 1,018,428 | |
| |
Transfer agent fees – R5 | | | 4,009 | |
| |
Transfer agent fees – R6 | | | 459 | |
| |
Trustees’ and officers’ fees and benefits | | | 20,897 | |
| |
Registration and filing fees | | | 81,512 | |
| |
Reports to shareholders | | | 84,468 | |
| |
Professional services fees | | | 57,907 | |
| |
Other | | | 13,317 | |
| |
Total expenses | | | 4,460,962 | |
| |
Less: Fees waived and/or expense offset arrangement(s) | | | (12,977 | ) |
| |
Net expenses | | | 4,447,985 | |
| |
Net investment income | | | 7,252,128 | |
| |
| |
Realized and unrealized gain (loss) from: | | | | |
Net realized gain (loss) from: | | | | |
Investment securities | | | (128,736,438 | ) |
| |
Foreign currencies | | | (5,303 | ) |
| |
| | | (128,741,741 | ) |
| |
Change in net unrealized appreciation (depreciation) of: | | | | |
Investment securities | | | (39,420,593 | ) |
| |
Foreign currencies | | | 1,589 | |
| |
| | | (39,419,004 | ) |
| |
Net realized and unrealized gain (loss) | | | (168,160,745 | ) |
| |
Net increase (decrease) in net assets resulting from operations | | $ | (160,908,617 | ) |
| |
See accompanying Notes to Financial Statements which are an integral part of the financial statements.
12 Invesco Energy Fund
Statement of Changes in Net Assets
For the years ended April 30, 2020 and 2019
| | | | | | | | |
| | | 2020 | | | 2019 | |
Operations: | | | | | | | | |
Net investment income | | $ | 7,252,128 | | | $ | 6,087,231 | |
| |
Net realized gain (loss) | | | (128,741,741 | ) | | | (33,229,827 | ) |
| |
Change in net unrealized appreciation (depreciation) | | | (39,419,004 | ) | | | (68,984,373 | ) |
| |
Net increase (decrease) in net assets resulting from operations | | | (160,908,617 | ) | | | (96,126,969 | ) |
| |
| | |
Distributions to shareholders from distributable earnings: | | | | | | | | |
Class A | | | (2,840,957 | ) | | | (6,036,516 | ) |
| |
Class C | | | (273,589 | ) | | | (1,224,241 | ) |
| |
Class Y | | | (430,547 | ) | | | (1,152,559 | ) |
| |
Investor Class | | | (1,179,125 | ) | | | (2,607,774 | ) |
| |
Class R5 | | | (70,758 | ) | | | (184,086 | ) |
| |
Class R6 | | | (9,338 | ) | | | (11,017 | ) |
| |
Total distributions from distributable earnings | | | (4,804,314 | ) | | | (11,216,193 | ) |
| |
| | |
Share transactions–net: | | | | | | | | |
Class A | | | (29,634,848 | ) | | | (20,349,179 | ) |
| |
Class C | | | (7,447,719 | ) | | | (42,670,624 | ) |
| |
Class Y | | | (10,082,858 | ) | | | (6,390,142 | ) |
| |
Investor Class | | | (10,795,182 | ) | | | (14,783,040 | ) |
| |
Class R5 | | | (1,548,796 | ) | | | (665,191 | ) |
| |
Class R6 | | | 140,389 | | | | 350,070 | |
| |
Net increase (decrease) in net assets resulting from share transactions | | | (59,369,014 | ) | | | (84,508,106 | ) |
| |
Net increase (decrease) in net assets | | | (225,081,945 | ) | | | (191,851,268 | ) |
| |
| | |
Net assets: | | | | | | | | |
Beginning of year | | | 424,223,538 | | | | 616,074,806 | |
| |
End of year | | $ | 199,141,593 | | | $ | 424,223,538 | |
| |
See accompanying Notes to Financial Statements which are an integral part of the financial statements.
13 Invesco Energy Fund
Financial Highlights
The following schedule presents financial highlights for a share of the Fund outstanding throughout the periods indicated.
| | | | | | | | | | | | | | | | | | | | | | | | | | | | | | | | | | | | | | | | | | | | | | | | | | | | | | | | | | | | | | | | | | | | | | |
| | | | | | | | | | | | | | | | | | | | | | | Ratio of | | Ratio of | | | | |
| | | | | | | | | | | | | | | | | | | | | | | expenses | | expenses | | | | |
| | | | | | | Net gains | | | | | | | | | | | | | | | | to average | | to average net | | | | |
| | | | | | | (losses) | | | | | | | | | | | | | | | | net assets | | assets without | | Ratio of net | | |
| | | Net asset | | | | on securities | | | | Dividends | | Distributions | | | | | | | | | | with fee waivers | | fee waivers | | investment | | |
| | | value, | | Net | | (both | | Total from | | from net | | from net | | | | Net asset | | | | Net assets, | | and/or | | and/or | | income | | |
| | | beginning | | investment | | realized and | | investment | | investment | | realized | | Total | | value, end | | Total | | end of period | | expenses | | expenses | | to average | | Portfolio |
| | | of period | | income(a) | | unrealized) | | operations | | income | | gains | | distributions | | of period | | return (b) | | (000’s omitted) | | absorbed | | absorbed | | net assets | | turnover (c) |
Class A | | | | | | | | | | | | | | | | | | | | | | | | | | | | | | | | | | | | | | | | | | | | | | | | | | | | | | | | | | | | | | | | | | | | | | |
Year ended 04/30/20 | | | $ | 21.05 | | | | $ | 0.41 | | | | $ | (9.64 | ) | | | $ | (9.23 | ) | | | $ | (0.28 | ) | | | $ | – | | | | $ | (0.28 | ) | | | $ | 11.54 | | | | | (44.30 | )% | | | $ | 121,102 | | | | | 1.45 | %(d) | | | | 1.45 | %(d) | | | | 2.42 | %(d) | | | | 16 | % |
Year ended 04/30/19 | | | | 25.91 | | | | | 0.29 | | | | | (4.61 | ) | | | | (4.32 | ) | | | | (0.54 | ) | | | | – | | | | | (0.54 | ) | | | | 21.05 | | | | | (16.48 | ) | | | | 248,396 | | | | | 1.32 | | | | | 1.32 | | | | | 1.25 | | | | | 17 | |
Year ended 04/30/18 | | | | 24.54 | | | |
| 0.49
| (e)
| | | | 1.44 | | | | | 1.93 | | | | | (0.56 | ) | | | | – | | | | | (0.56 | ) | | | | 25.91 | | | | | 8.08 | | | | | 323,247 | | | | | 1.33 | | | | | 1.33 | | | | | 2.07 | (e) | | | | 9 | |
Year ended 04/30/17 | | | | 27.04 | | | | | 0.22 | | | | | (2.41 | ) | | | | (2.19 | ) | | | | (0.31 | ) | | | | – | | | | | (0.31 | ) | | | | 24.54 | | | | | (8.29 | ) | | | | 393,998 | | | | | 1.27 | | | | | 1.27 | | | | | 0.84 | | | | | 22 | |
Year ended 04/30/16 | | | | 35.41 | | | | | 0.27 | | | | | (8.28 | )(f) | | | | (8.01 | ) | | | | (0.15 | ) | | | | (0.21 | ) | | | | (0.36 | ) | | | | 27.04 | | | | | (22.45 | )(f) | | | | 521,910 | | | | | 1.26 | | | | | 1.27 | | | | | 1.05 | | | | | 22 | |
Class C | | | | | | | | | | | | | | | | | | | | | | | | | | | | | | | | | | | | | | | | | | | | | | | | | | | | | | | | | | | | | | | | | | | | | | |
Year ended 04/30/20 | | | | 17.99 | | | | | 0.24 | | | | | (8.22 | ) | | | | (7.98 | ) | | | | (0.19 | ) | | | | – | | | | | (0.19 | ) | | | | 9.82 | | | | | (44.72 | ) | | | | 13,868 | | | | | 2.20 | (d) | | | | 2.20 | (d) | | | | 1.67 | (d) | | | | 16 | |
Year ended 04/30/19 | | | | 22.17 | | | | | 0.10 | | | | | (3.93 | ) | | | | (3.83 | ) | | | | (0.35 | ) | | | | – | | | | | (0.35 | ) | | | | 17.99 | | | | | (17.14 | ) | | | | 33,036 | | | | | 2.07 | | | | | 2.07 | | | | | 0.50 | | | | | 17 | |
Year ended 04/30/18 | | | | 20.88 | | | | | 0.26 | (e) | | | | 1.24 | | | | | 1.50 | | | | | (0.21 | ) | | | | – | | | | | (0.21 | ) | | | | 22.17 | | | | | 7.29 | | | | | 92,349 | | | | | 2.08 | | | | | 2.08 | | | | | 1.32 | (e) | | | | 9 | |
Year ended 04/30/17 | | | | 23.05 | | | | | 0.02 | | | | | (2.07 | ) | | | | (2.05 | ) | | | | (0.12 | ) | | | | – | | | | | (0.12 | ) | | | | 20.88 | | | | | (8.97 | ) | | | | 120,722 | | | | | 2.02 | | | | | 2.02 | | | | | 0.09 | | | | | 22 | |
Year ended 04/30/16 | | | | 30.39 | | | | | 0.06 | | | | | (7.11 | )(f) | | | | (7.05 | ) | | | | (0.08 | ) | | | | (0.21 | ) | | | | (0.29 | ) | | | | 23.05 | | | | | (23.03 | )(f) | | | | 156,964 | | | | | 2.01 | | | | | 2.02 | | | | | 0.30 | | | | | 22 | |
Class Y | | | | | | | | | | | | | | | | | | | | | | | | | | | | | | | | | | | | | | | | | | | | | | | | | | | | | | | | | | | | | | | | | | | | | | |
Year ended 04/30/20 | | | | 21.04 | | | | | 0.45 | | | | | (9.64 | ) | | | | (9.19 | ) | | | | (0.31 | ) | | | | – | | | | | (0.31 | ) | | | | 11.54 | | | | | (44.17 | ) | | | | 14,398 | | | | | 1.20 | (d) | | | | 1.20 | (d) | | | | 2.67 | (d) | | | | 16 | |
Year ended 04/30/19 | | | | 25.93 | | | | | 0.35 | | | | | (4.63 | ) | | | | (4.28 | ) | | | | (0.61 | ) | | | | – | | | | | (0.61 | ) | | | | 21.04 | | | | | (16.29 | ) | | | | 38,550 | | | | | 1.07 | | | | | 1.07 | | | | | 1.50 | | | | | 17 | |
Year ended 04/30/18 | | | | 24.63 | | | | | 0.55 | (e) | | | | 1.43 | | | | | 1.98 | | | | | (0.68 | ) | | | | – | | | | | (0.68 | ) | | | | 25.93 | | | | | 8.34 | | | | | 56,061 | | | | | 1.08 | | | | | 1.08 | | | | | 2.32 | (e) | | | | 9 | |
Year ended 04/30/17 | | | | 27.12 | | | | | 0.29 | | | | | (2.41 | ) | | | | (2.12 | ) | | | | (0.37 | ) | | | | – | | | | | (0.37 | ) | | | | 24.63 | | | | | (8.03 | ) | | | | 63,783 | | | | | 1.02 | | | | | 1.02 | | | | | 1.09 | | | | | 22 | |
Year ended 04/30/16 | | | | 35.47 | | | | | 0.34 | | | | | (8.31 | )(f) | | | | (7.97 | ) | | | | (0.17 | ) | | | | (0.21 | ) | | | | (0.38 | ) | | | | 27.12 | | | | | (22.28 | )(f) | | | | 50,706 | | | | | 1.01 | | | | | 1.02 | | | | | 1.30 | | | | | 22 | |
Investor Class | | | | | | | | | | | | | | | | | | | | | | | | | | | | | | | | | | | | | | | | | | | | | | | | | | | | | | | | | | | | | | | | | | | | | | |
Year ended 04/30/20 | | | | 20.96 | | | | | 0.40 | | | | | (9.59 | ) | | | | (9.19 | ) | | | | (0.28 | ) | | | | – | | | | | (0.28 | ) | | | | 11.49 | | | | | (44.30 | ) | | | | 47,046 | | | |
| 1.45
| (d)
| | |
| 1.45
| (d)
| | |
| 2.42
| (d)
| | | | 16 | |
Year ended 04/30/19 | | | | 25.80 | | | | | 0.29 | | | | | (4.59 | ) | | | | (4.30 | ) | | | | (0.54 | ) | | | | – | | | | | (0.54 | ) | | | | 20.96 | | | | | (16.47 | ) | | | | 97,716 | | | | | 1.32 | | | | | 1.32 | | | | | 1.25 | | | | | 17 | |
Year ended 04/30/18 | | | | 24.44 | | | | | 0.49 | (e) | | | | 1.43 | | | | | 1.92 | | | | | (0.56 | ) | | | | – | | | | | (0.56 | ) | | | | 25.80 | | | | | 8.07 | | | | | 136,141 | | | | | 1.33 | | | | | 1.33 | | | | | 2.07 | (e) | | | | 9 | |
Year ended 04/30/17 | | | | 26.93 | | | | | 0.22 | | | | | (2.40 | ) | | | | (2.18 | ) | | | | (0.31 | ) | | | | – | | | | | (0.31 | ) | | | | 24.44 | | | | | (8.29 | ) | | | | 159,402 | | | | | 1.27 | | | | | 1.27 | | | | | 0.84 | | | | | 22 | |
Year ended 04/30/16 | | | | 35.27 | | | | | 0.27 | | | | | (8.25 | )(f) | | | | (7.98 | ) | | | | (0.15 | ) | | | | (0.21 | ) | | | | (0.36 | ) | | | | 26.93 | | | | | (22.45 | )(f) | | | | 210,374 | | | | | 1.26 | | | | | 1.27 | | | | | 1.05 | | | | | 22 | |
Class R5 | | | | | | | | | | | | | | | | | | | | | | | | | | | | | | | | | | | | | | | | | | | | | | | | | | | | | | | | | | | | | | | | | | | | | | |
Year ended 04/30/20 | | | | 21.54 | | | | | 0.50 | | | | | (9.87 | ) | | | | (9.37 | ) | | | | (0.34 | ) | | | | — | | | | | (0.34 | ) | | | | 11.83 | | | | | (44.03 | ) | | | | 2,371 | | | | | 0.96 | (d) | | | | 0.96 | (d) | | | | 2.91 | (d) | | | | 16 | |
Year ended 04/30/19 | | | | 26.53 | | | | | 0.40 | | | | | (4.73 | ) | | | | (4.33 | ) | | | | (0.66 | ) | | | | — | | | | | (0.66 | ) | | | | 21.54 | | | | | (16.12 | ) | | | | 6,052 | | | | | 0.90 | | | | | 0.90 | | | | | 1.67 | | | | | 17 | |
Year ended 04/30/18 | | | | 25.23 | | | | | 0.61 | (e) | | | | 1.46 | | | | | 2.07 | | | | | (0.77 | ) | | | | — | | | | | (0.77 | ) | | | | 26.53 | | | | | 8.51 | | | | | 8,092 | | | | | 0.91 | | | | | 0.91 | | | | | 2.49 | (e) | | | | 9 | |
Year ended 04/30/17 | | | | 27.77 | | | | | 0.34 | | | | | (2.46 | ) | | | | (2.12 | ) | | | | (0.42 | ) | | | | — | | | | | (0.42 | ) | | | | 25.23 | | | | | (7.88 | ) | | | | 8,871 | | | | | 0.86 | | | | | 0.86 | | | | | 1.25 | | | | | 22 | |
Year ended 04/30/16 | | | | 36.24 | | | | | 0.40 | | | | | (8.48 | )(f) | | | | (8.08 | ) | | | | (0.18 | ) | | | | (0.21 | ) | | | | (0.39 | ) | | | | 27.77 | | | | | (22.10 | )(f) | | | | 22,298 | | | | | 0.84 | | | | | 0.85 | | | | | 1.47 | | | | | 22 | |
Class R6 | | | | | | | | | | | | | | | | | | | | | | | | | | | | | | | | | | | | | | | | | | | | | | | | | | | | | | | | | | | | | | | | | | | | | | |
Year ended 04/30/20 | | | | 21.53 | | | | | 0.49 | | | | | (9.85 | ) | | | | (9.36 | ) | | | | (0.34 | ) | | | | – | | | | | (0.34 | ) | | | | 11.83 | | | | | (44.00 | ) | | | | 357 | | | | | 0.96 | (d) | | | | 0.96 | (d) | | | | 2.91 | (d) | | | | 16 | |
Year ended 04/30/19 | | | | 26.52 | | | | | 0.39 | | | | | (4.72 | ) | | | | (4.33 | ) | | | | (0.66 | ) | | | | – | | | | | (0.66 | ) | | | | 21.53 | | | | | (16.11 | ) | | | | 473 | | | | | 0.89 | | | | | 0.89 | | | | | 1.68 | | | | | 17 | |
Year ended 04/30/18 | | | | 25.23 | | | | | 0.62 | (e) | | | | 1.46 | | | | | 2.08 | | | | | (0.79 | ) | | | | – | | | | | (0.79 | ) | | | | 26.52 | | | | | 8.55 | | | | | 185 | | | | | 0.90 | | | | | 0.90 | | | | | 2.50 | (e) | | | | 9 | |
Year ended 04/30/17(g) | | | | 26.31 | | | | | 0.03 | | | | | (1.11 | ) | | | | (1.08 | ) | | | | – | | | | | – | | | | | – | | | | | 25.23 | | | | | (4.11 | ) | | | | 10 | | | | | 0.81 | (h) | | | | 0.81 | (h) | | | | 1.30 | (h) | | | | 22 | |
| (a) | Calculated using average shares outstanding. |
| (b) | Includes adjustments in accordance with accounting principles generally accepted in the United States of America and as such, the net asset value for financial reporting purposes and the returns based upon those net asset values may differ from the net asset value and returns for shareholder transactions. Does not include sales charges and is not annualized for periods less than one year, if applicable. |
| (c) | Portfolio turnover is calculated at the fund level and is not annualized for periods less than one year, if applicable. |
| (d) | Ratios are based on average daily net assets (000’s omitted) of $178,407, $21,944, $25,789, $72,040 , $4,003 and $460 for Class A, Class C, Class Y, Investor Class, Class R5 and Class R6 shares, respectively. |
| (e) | Net investment income (loss) per share and the ratio of net investment income (loss) to average net assets includes significant dividends received during the period. Net investment income (loss) per share and the ratio of net investment income (loss) to average net assets excluding the significant dividends are $0.32 and 0.87%, $0.09 and 0.12%, $0.38 and 1.12%, $0.32 and 0.87%, $0.44 and 1.29% and $0.45 and 1.30% for Class A, Class C, Class Y, Investor Class, Class R5 and Class R6 shares, respectively. |
| (f) | Includes litigation proceeds received during the period. Had these litigation proceeds not been received, Net gains (losses) on securities (both realized and unrealized) per share would have been $(8.35), $(7.18), $(8.38), $(8.32) and $(8.55) for Class A, Class C, Class Y, Investor Class and Class R5 shares, respectively. Total returns would have been lower. |
| (g) | Commencement date of April 4, 2017. |
See accompanying Notes to Financial Statements which are an integral part of the financial statements.
14 Invesco Energy Fund
Notes to Financial Statements
April 30, 2020
NOTE 1–Significant Accounting Policies
Invesco Energy Fund (the “Fund”) is a series portfolio of AIM Sector Funds (Invesco Sector Funds) (the “Trust”). The Trust is a Delaware statutory trust registered under the Investment Company Act of 1940, as amended (the “1940 Act”), as an open-end series management investment company authorized to issue an unlimited number of shares of beneficial interest. Information presented in these financial statements pertains only to the Fund. Matters affecting the Fund or each class will be voted on exclusively by the shareholders of the Fund or each class.
The Fund’s investment objective is long-term growth of capital.
The Fund currently consists of six different classes of shares: Class A, Class C, Class Y, Investor Class, Class R5 and Class R6. Class Y and Investor Class shares are available only to certain investors. Class A shares are sold with a front-end sales charge unless certain waiver criteria are met and under certain circumstances load waived shares may be subject to contingent deferred sales charges (“CDSC”). Class C shares are sold with a CDSC. Class Y, Investor Class, Class R5 and Class R6 shares are sold at net asset value. Class C shares held for ten years after purchase are eligible for automatic conversion into Class A shares of the same Fund (the “Conversion Feature”). The automatic conversion pursuant to the Conversion Feature will generally occur at the end of the month following the tenth anniversary after a purchase of Class C shares.
The Fund is an investment company and accordingly follows the investment company accounting and reporting guidance in accordance with Financial Accounting Standards Board Accounting Standards Codification Topic 946, Financial Services – Investment Companies.
The following is a summary of the significant accounting policies followed by the Fund in the preparation of its financial statements.
| A. | Security Valuations – Securities, including restricted securities, are valued according to the following policy. |
A security listed or traded on an exchange (except convertible securities) is valued at its last sales price or official closing price as of the close of the customary trading session on the exchange where the security is principally traded, or lacking any sales or official closing price on a particular day, the security may be valued at the closing bid price on that day. Securities traded in the over-the-counter market are valued based on prices furnished by independent pricing services or market makers. When such securities are valued by an independent pricing service they may be considered fair valued. Futures contracts are valued at the final settlement price set by an exchange on which they are principally traded. Listed options are valued at the mean between the last bid and asked prices from the exchange on which they are principally traded. Options not listed on an exchange are valued by an independent source at the mean between the last bid and asked prices. For purposes of determining net asset value (“NAV”) per share, futures and option contracts generally are valued 15 minutes after the close of the customary trading session of the New York Stock Exchange (“NYSE”).
Investments in open-end and closed-end registered investment companies that do not trade on an exchange are valued at the end-of-day net asset value per share. Investments in open-end and closed-end registered investment companies that trade on an exchange are valued at the last sales price or official closing price as of the close of the customary trading session on the exchange where the security is principally traded.
Debt obligations (including convertible securities) and unlisted equities are fair valued using an evaluated quote provided by an independent pricing service. Evaluated quotes provided by the pricing service may be determined without exclusive reliance on quoted prices, and may reflect appropriate factors such as institution-size trading in similar groups of securities, developments related to specific securities, dividend rate (for unlisted equities), yield (for debt obligations), quality, type of issue, coupon rate (for debt obligations), maturity (for debt obligations), individual trading characteristics and other market data. Pricing services generally value debt obligations assuming orderly transactions of institutional round lot size, but a fund may hold or transact in the same securities in smaller, odd lot sizes. Odd lots often trade at lower prices than institutional round lots. Debt obligations are subject to interest rate and credit risks. In addition, all debt obligations involve some risk of default with respect to interest and/or principal payments.
Foreign securities’ (including foreign exchange contracts) prices are converted into U.S. dollar amounts using the applicable exchange rates as of the close of the NYSE. If market quotations are available and reliable for foreign exchange-traded equity securities, the securities will be valued at the market quotations. Because trading hours for certain foreign securities end before the close of the NYSE, closing market quotations may become unreliable. If between the time trading ends on a particular security and the close of the customary trading session on the NYSE, events occur that the investment adviser determines are significant and make the closing price unreliable, the Fund may fair value the security. If the event is likely to have affected the closing price of the security, the security will be valued at fair value in good faith using procedures approved by the Board of Trustees. Adjustments to closing prices to reflect fair value may also be based on a screening process of an independent pricing service to indicate the degree of certainty, based on historical data, that the closing price in the principal market where a foreign security trades is not the current value as of the close of the NYSE. Foreign securities’ prices meeting the approved degree of certainty that the price is not reflective of current value will be priced at the indication of fair value from the independent pricing service. Multiple factors may be considered by the independent pricing service in determining adjustments to reflect fair value and may include information relating to sector indices, American Depositary Receipts and domestic and foreign index futures. Foreign securities may have additional risks including exchange rate changes, potential for sharply devalued currencies and high inflation, political and economic upheaval, the relative lack of issuer information, relatively low market liquidity and the potential lack of strict financial and accounting controls and standards.
Securities for which market prices are not provided by any of the above methods may be valued based upon quotes furnished by independent sources. The last bid price may be used to value equity securities. The mean between the last bid and asked prices is used to value debt obligations, including corporate loans.
Securities for which market quotations are not readily available or became unreliable are valued at fair value as determined in good faith by or under the supervision of the Trust’s officers following procedures approved by the Board of Trustees. Issuer specific events, market trends, bid/asked quotes of brokers and information providers and other market data may be reviewed in the course of making a good faith determination of a security’s fair value.
The Fund may invest in securities that are subject to interest rate risk, meaning the risk that the prices will generally fall as interest rates rise and, conversely, the prices will generally rise as interest rates fall. Specific securities differ in their sensitivity to changes in interest rates depending on their individual characteristics. Changes in interest rates may result in increased market volatility, which may affect the value and/or liquidity of certain Fund investments.
Valuations change in response to many factors including the historical and prospective earnings of the issuer, the value of the issuer’s assets, general market conditions which are not specifically related to the particular issuer, such as real or perceived adverse economic conditions, changes in the general outlook for revenues or corporate earnings, changes in interest or currency rates, regional or global instability, natural or environmental disasters, widespread disease or other public health issues, war, acts of terrorism or adverse investor sentiment generally and market liquidity. Because of the inherent uncertainties of valuation, the values reflected in the financial statements may materially differ from the value received upon actual sale of those investments.
| B. | Securities Transactions and Investment Income – Securities transactions are accounted for on a trade date basis. Realized gains or losses on sales are computed on the basis of specific identification of the securities sold. Interest income (net of withholding tax, if any) is recorded on an accrual basis from settlement date. Dividend income (net of withholding tax, if any) is recorded on the ex-dividend date. |
The Fund may periodically participate in litigation related to Fund investments. As such, the Fund may receive proceeds from litigation settlements. Any proceeds received are included in the Statement of Operations as realized gain (loss) for investments no longer held and as unrealized gain (loss) for investments still held.
Brokerage commissions and mark ups are considered transaction costs and are recorded as an increase to the cost basis of securities purchased and/or a reduction of proceeds on a sale of securities. Such transaction costs are included in the determination of net realized and unrealized gain (loss) from investment
15 Invesco Energy Fund
securities reported in the Statement of Operations and the Statement of Changes in Net Assets and the net realized and unrealized gains (losses) on securities per share in the Financial Highlights. Transaction costs are included in the calculation of the Fund’s net asset value and, accordingly, they reduce the Fund’s total returns. These transaction costs are not considered operating expenses and are not reflected in net investment income reported in the Statement of Operations and the Statement of Changes in Net Assets, or the net investment income per share and the ratios of expenses and net investment income reported in the Financial Highlights, nor are they limited by any expense limitation arrangements between the Fund and the investment adviser.
The Fund allocates income and realized and unrealized capital gains and losses to a class based on the relative net assets of each class.
| C. | Country Determination – For the purposes of making investment selection decisions and presentation in the Schedule of Investments, the investment adviser may determine the country in which an issuer is located and/or credit risk exposure based on various factors. These factors include the laws of the country under which the issuer is organized, where the issuer maintains a principal office, the country in which the issuer derives 50% or more of its total revenues and the country that has the primary market for the issuer’s securities, as well as other criteria. Among the other criteria that may be evaluated for making this determination are the country in which the issuer maintains 50% or more of its assets, the type of security, financial guarantees and enhancements, the nature of the collateral and the sponsor organization. Country of issuer and/or credit risk exposure has been determined to be the United States of America, unless otherwise noted. |
| D. | Distributions – Distributions from net investment income and net realized capital gain, if any, are generally declared and paid annually and recorded on the ex-dividend date. The Fund may elect to treat a portion of the proceeds from redemptions as distributions for federal income tax purposes. |
| E. | Federal Income Taxes – The Fund intends to comply with the requirements of Subchapter M of the Internal Revenue Code of 1986, as amended (the “Internal Revenue Code”), necessary to qualify as a regulated investment company and to distribute substantially all of the Fund’s taxable earnings to shareholders. As such, the Fund will not be subject to federal income taxes on otherwise taxable income (including net realized capital gain) that is distributed to shareholders. Therefore, no provision for federal income taxes is recorded in the financial statements. |
The Fund recognizes the tax benefits of uncertain tax positions only when the position is more likely than not to be sustained. Management has analyzed the Fund’s uncertain tax positions and concluded that no liability for unrecognized tax benefits should be recorded related to uncertain tax positions. Management is not aware of any tax positions for which it is reasonably possible that the total amounts of unrecognized tax benefits will change materially in the next 12 months.
The Fund files tax returns in the U.S. Federal jurisdiction and certain other jurisdictions. Generally, the Fund is subject to examinations by such taxing authorities for up to three years after the filing of the return for the tax period.
| F. | Expenses – Fees provided for under the Rule 12b-1 plan of a particular class of the Fund are charged to the operations of such class. Transfer agency fees and expenses and other shareholder recordkeeping fees and expenses attributable to Class R5 and Class R6 are allocated to each share class based on relative net assets. Sub-accounting fees attributable to Class R5 are charged to the operations of the class. Transfer agency fees and expenses and other shareholder recordkeeping fees and expenses relating to all other classes are allocated among those classes based on relative net assets. All other expenses are allocated among the classes based on relative net assets. |
| G. | Accounting Estimates – The preparation of financial statements in conformity with accounting principles generally accepted in the United States of America (“GAAP”) requires management to make estimates and assumptions that affect the reported amounts of assets and liabilities at the date of the financial statements and the reported amounts of revenues and expenses during the reporting period including estimates and assumptions related to taxation. Actual results could differ from those estimates by a significant amount. In addition, the Fund monitors for material events or transactions that may occur or become known after the period-end date and before the date the financial statements are released to print. |
| H. | Indemnifications – Under the Trust’s organizational documents, each Trustee, officer, employee or other agent of the Trust is indemnified against certain liabilities that may arise out of the performance of their duties to the Fund. Additionally, in the normal course of business, the Fund enters into contracts, including the Fund’s servicing agreements, that contain a variety of indemnification clauses. The Fund’s maximum exposure under these arrangements is unknown as this would involve future claims that may be made against the Fund that have not yet occurred. The risk of material loss as a result of such indemnification claims is considered remote. |
| I. | Foreign Currency Translations – Foreign currency is valued at the close of the NYSE based on quotations posted by banks and major currency dealers. Portfolio securities and other assets and liabilities denominated in foreign currencies are translated into U.S. dollar amounts at the date of valuation. Purchases and sales of portfolio securities (net of foreign taxes withheld on disposition) and income items denominated in foreign currencies are translated into U.S. dollar amounts on the respective dates of such transactions. The Fund does not separately account for the portion of the results of operations resulting from changes in foreign exchange rates on investments and the fluctuations arising from changes in market prices of securities held. The combined results of changes in foreign exchange rates and the fluctuation of market prices on investments (net of estimated foreign tax withholding) are included with the net realized and unrealized gain or loss from investments in the Statement of Operations. Reported net realized foreign currency gains or losses arise from (1) sales of foreign currencies, (2) currency gains or losses realized between the trade and settlement dates on securities transactions, and (3) the difference between the amounts of dividends, interest, and foreign withholding taxes recorded on the Fund’s books and the U.S. dollar equivalent of the amounts actually received or paid. Net unrealized foreign currency gains and losses arise from changes in the fair values of assets and liabilities, other than investments in securities at fiscal period end, resulting from changes in exchange rates. |
The Fund may invest in foreign securities, which may be subject to foreign taxes on income, gains on investments or currency repatriation, a portion of which may be recoverable. Foreign taxes, if any, are recorded based on the tax regulations and rates that exist in the foreign markets in which the Fund invests and are shown in the Statement of Operations.
| J. | Forward Foreign Currency Contracts – The Fund may engage in foreign currency transactions either on a spot (i.e. for prompt delivery and settlement) basis, or through forward foreign currency contracts, to manage or minimize currency or exchange rate risk. |
The Fund may also enter into forward foreign currency contracts for the purchase or sale of a security denominated in a foreign currency in order to “lockin” the U.S. dollar price of that security, or the Fund may also enter into forward foreign currency contracts that do not provide for physical settlement of the two currencies, but instead are settled by a single cash payment calculated as the difference between the agreed upon exchange rate and the spot rate at settlement based upon an agreed upon notional amount (non-deliverable forwards). The Fund will set aside liquid assets in an amount equal to the daily mark-to-market obligation for forward foreign currency contracts.
A forward foreign currency contract is an obligation between two parties (“Counterparties”) to purchase or sell a specific currency for an agreed-upon price at a future date. The use of forward foreign currency contracts does not eliminate fluctuations in the price of the underlying securities the Fund owns or intends to acquire but establishes a rate of exchange in advance. Fluctuations in the value of these contracts are measured by the difference in the contract date and reporting date exchange rates and are recorded as unrealized appreciation (depreciation) until the contracts are closed. When the contracts are closed, realized gains (losses) are recorded. Realized and unrealized gains (losses) on the contracts are included in the Statement of Operations. The primary risks associated with forward foreign currency contracts include failure of the Counterparty to meet the terms of the contract and the value of the foreign currency changing unfavorably. These risks may be in excess of the amounts reflected in the Statement of Assets and Liabilities.
| K. | Other Risks - The Fund’s investments are concentrated in a comparatively narrow segment of the economy, which may make the Fund more volatile. |
The businesses in which the Fund invests may be adversely affected by foreign, federal or state regulations governing energy production, distribution and sale. Although individual security selection drives the performance of the Fund, short-term fluctuations in commodity prices may cause price fluctuations in its shares.
16 Invesco Energy Fund
NOTE 2–Advisory Fees and Other Fees Paid to Affiliates
The Trust has entered into a master investment advisory agreement with Invesco Advisers, Inc. (the “Adviser” or “Invesco”). Under the terms of the investment advisory agreement, the Fund accrues daily and pays monthly an advisory fee to the Adviser based on the annual rate of the Fund’s average daily net assets as follows:
| | | | |
| Average Daily Net Assets | | Rate | |
First $350 million | | | 0.750 | % |
Next $350 million | | | 0.650 | % |
Next $1.3 billion | | | 0.550 | % |
Next $2 billion | | | 0.450 | % |
Next $2 billion | | | 0.400 | % |
Next $2 billion | | | 0.375 | % |
Over $8 billion | | | 0.350 | % |
For the year ended April 30, 2020, the effective advisory fee rate incurred by the Fund was 0.75%.
Under the terms of a master sub-advisory agreement between the Adviser and each of Invesco Asset Management Deutschland GmbH, Invesco Asset Management Limited, Invesco Asset Management (Japan) Limited, Invesco Hong Kong Limited, Invesco Senior Secured Management, Inc. and Invesco Canada Ltd. (collectively, the “Affiliated Sub-Advisers”) the Adviser, not the Fund, will pay 40% of the fees paid to the Adviser to any such Affiliated Sub-Adviser(s) that provide(s) discretionary investment management services to the Fund based on the percentage of assets allocated to such Affiliated Sub-Adviser(s).
The Adviser has contractually agreed, through at least June 30, 2021, to waive advisory fees and/or reimburse expenses of all shares to the extent necessary to limit total annual fund operating expenses after fee waiver and/or expense reimbursement (excluding certain items discussed below) of Class A, Class C, Class Y, Investor Class, Class R5 and Class R6 shares to 2.00%, 2.75%, 1.75%, 2.00%, 1.75% and 1.75%, respectively, of average daily net assets (the “expense limits”). In determining the Adviser’s obligation to waive advisory fees and/or reimburse expenses, the following expenses are not taken into account, and could cause the total annual fund operating expenses after fee waivers and/or expense reimbursement to exceed the numbers reflected above: (1) interest; (2) taxes; (3) dividend expense on short sales; (4) extraordinary or non-routine items, including litigation expenses; and (5) expenses that the Fund has incurred but did not actually pay because of an expense offset arrangement. Unless Invesco continues the fee waiver agreement, it will terminate on June 30, 2021. During its term, the fee waiver agreement cannot be terminated or amended to increase the expense limits or reduce the advisory fee waiver without approval of the Board of Trustees. The Adviser did not waive fees and/or reimburse expenses during the period under these expense limits.
Further, the Adviser has contractually agreed, through at least June 30, 2022, to waive the advisory fee payable by the Fund in an amount equal to 100% of the net advisory fees the Adviser receives from the affiliated money market funds on investments by the Fund of uninvested cash in such affiliated money market funds.
For the year ended April 30, 2020, the Adviser waived advisory fees of $3,010.
The Trust has entered into a master administrative services agreement with Invesco pursuant to which the Fund has agreed to pay Invesco for certain administrative costs incurred in providing accounting services to the Fund. For the year ended April 30, 2020, expenses incurred under the agreement are shown in the Statement of Operations as Administrative services fees. Invesco has entered into a sub-administration agreement whereby State Street Bank and Trust Company (“SSB”) serves as fund accountant and provides certain administrative services to the Fund. Pursuant to a custody agreement with the Trust on behalf of the Fund, SSB also serves as the Fund’s custodian.
The Trust has entered into a transfer agency and service agreement with Invesco Investment Services, Inc. (“IIS”) pursuant to which the Fund has agreed to pay IIS a fee for providing transfer agency and shareholder services to the Fund and reimburse IIS for certain expenses incurred by IIS in the course of providing such services. IIS may make payments to intermediaries that provide omnibus account services, sub-accounting services and/or networking services. All fees payable by IIS to intermediaries that provide omnibus account services or sub-accounting services are charged back to the Fund, subject to certain limitations approved by the Trust’s Board of Trustees. For the year ended April 30, 2020, expenses incurred under the agreement are shown in the Statement of Operations as Transfer agent fees.
The Trust has entered into master distribution agreements with Invesco Distributors, Inc. (“IDI”) to serve as the distributor for the Class A, Class C, Class Y, Investor Class, Class R5 and Class R6 shares of the Fund. The Trust has adopted plans pursuant to Rule 12b-1 under the 1940 Act with respect to the Fund’s Class A, Class C and Investor Class shares (collectively, the “Plans”). The Fund, pursuant to the Plans, pays IDI compensation at the annual rate of 0.25% of the Fund’s average daily net assets of Class A shares and 1.00% of the average daily net assets of Class C shares. The Fund, pursuant to the Investor Class Plan, reimburses IDI for its allocated share of expenses incurred pursuant to the Investor Class Plan for the period, up to a maximum annual rate of 0.25% of the average daily net assets of Investor Class shares. The fees are accrued daily and paid monthly. Of the Plan payments, up to 0.25% of the average daily net assets of each class of shares may be paid to furnish continuing personal shareholder services to customers who purchase and own shares of such classes. Any amounts not paid as a service fee under the Plans would constitute an asset-based sales charge. Rules of the Financial Industry Regulatory Authority (“FINRA”) impose a cap on the total sales charges, including asset-based sales charges, that may be paid by any class of shares of the Fund. For the year ended April 30, 2020, expenses incurred under the Plans are shown in the Statement of Operations as Distribution fees.
Front-end sales commissions and CDSC (collectively, the “sales charges”) are not recorded as expenses of the Fund. Front-end sales commissions are deducted from proceeds from the sales of Fund shares prior to investment in Class A shares of the Fund. CDSC are deducted from redemption proceeds prior to remittance to the shareholder. During the year ended April 30, 2020, IDI advised the Fund that IDI retained $38,338 in front-end sales commissions from the sale of Class A shares and $3,304 and $1,619 from Class A and Class C shares, respectively, for CDSC imposed upon redemptions by shareholders.
For the year ended April 30, 2020, the Fund incurred $884 in brokerage commissions with Invesco Capital Markets, Inc., an affiliate of the Adviser and IDI, for portfolio transactions executed on behalf of the Fund.
Certain officers and trustees of the Trust are officers and directors of the Adviser, IIS and/or IDI.
NOTE 3–Additional Valuation Information
GAAP defines fair value as the price that would be received to sell an asset or paid to transfer a liability in an orderly transaction between market participants at the measurement date, under current market conditions. GAAP establishes a hierarchy that prioritizes the inputs to valuation methods, giving the highest priority to readily available unadjusted quoted prices in an active market for identical assets (Level 1) and the lowest priority to significant unobservable inputs (Level 3), generally when market prices are not readily available or are unreliable. Based on the valuation inputs, the securities or other investments are tiered into one of three levels. Changes in valuation methods may result in transfers in or out of an investment’s assigned level:
| | |
| Level 1 – | | Prices are determined using quoted prices in an active market for identical assets. |
| Level 2 – | | Prices are determined using other significant observable inputs. Observable inputs are inputs that other market participants may use in pricing a security. These may include quoted prices for similar securities, interest rates, prepayment speeds, credit risk, yield curves, loss severities, default rates, discount rates, volatilities and others. |
17 Invesco Energy Fund
| | |
| Level 3 – | | Prices are determined using significant unobservable inputs. In situations where quoted prices or observable inputs are unavailable (for example, when there is little or no market activity for an investment at the end of the period), unobservable inputs may be used. Unobservable inputs reflect the Fund’s own assumptions about the factors market participants would use in determining fair value of the securities or instruments and would be based on the best available information. |
The following is a summary of the tiered valuation input levels, as of April 30, 2020. The level assigned to the securities valuations may not be an indication of the risk or liquidity associated with investing in those securities. Because of the inherent uncertainties of valuation, the values reflected in the financial statements may materially differ from the value received upon actual sale of those investments.
| | | | | | | | | | | | | | | | |
| | | Level 1 | | | Level 2 | | | Level 3 | | | Total | |
Investments in Securities | | | | | | | | | | | | | | | | |
| |
Common Stocks & Other Equity Interests | | | $165,426,659 | | | | $22,393,020 | | | | $– | | | | $187,819,679 | |
| |
Money Market Funds | | | 10,121,860 | | | | – | | | | – | | | | 10,121,860 | |
| |
Total Investments | | | $175,548,519 | | | | $22,393,020 | | | | $– | | | | $197,941,539 | |
| |
NOTE 4–Expense Offset Arrangement(s)
The expense offset arrangement is comprised of transfer agency credits which result from balances in demand deposit accounts used by the transfer agent for clearing shareholder transactions. For the year ended April 30, 2020, the Fund received credits from this arrangement, which resulted in the reduction of the Fund’s total expenses of $9,967.
NOTE 5–Trustees’ and Officers’ Fees and Benefits
Trustees’ and Officers’ Fees and Benefits include amounts accrued by the Fund to pay remuneration to certain Trustees and Officers of the Fund. Trustees have the option to defer compensation payable by the Fund, and Trustees’ and Officers’ Fees and Benefits also include amounts accrued by the Fund to fund such deferred compensation amounts. Those Trustees who defer compensation have the option to select various Invesco Funds in which their deferral accounts shall be deemed to be invested. Finally, certain current Trustees were eligible to participate in a retirement plan that provided for benefits to be paid upon retirement to Trustees over a period of time based on the number of years of service. The Fund may have certain former Trustees who also participate in a retirement plan and receive benefits under such plan. Trustees’ and Officers’ Fees and Benefits include amounts accrued by the Fund to fund such retirement benefits. Obligations under the deferred compensation and retirement plans represent unsecured claims against the general assets of the Fund.
NOTE 6–Cash Balances
The Fund is permitted to temporarily carry a negative or overdrawn balance in its account with SSB, the custodian bank. Such balances, if any at period-end, are shown in the Statement of Assets and Liabilities under the payable caption Amount due custodian. To compensate the custodian bank for such overdrafts, the overdrawn Fund may either (1) leave funds as a compensating balance in the account so the custodian bank can be compensated by earning the additional interest; or (2) compensate by paying the custodian bank at a rate agreed upon by the custodian bank and Invesco, not to exceed the contractually agreed upon rate. The Fund may not purchase additional securities when any borrowings from banks or broker-dealers exceed 5% of the Fund’s total assets, or when any borrowings from an Invesco Fund are outstanding.
NOTE 7–Distributions to Shareholders and Tax Components of Net Assets
Tax Character of Distributions to Shareholders Paid During the Fiscal Years Ended April 30, 2020 and 2019:
| | | | | | | | |
| | | 2020 | | | 2019 | |
| |
Ordinary income | | $ | 4,804,314 | | | $ | 11,216,193 | |
| |
Tax Components of Net Assets at Period-End:
| | | | |
| | | 2020 | |
| |
Undistributed ordinary income | | $ | 2,821,304 | |
| |
Net unrealized appreciation (depreciation) – investments | | | (216,943,152 | ) |
| |
Net unrealized appreciation (depreciation) - foreign currencies | | | (1,797 | ) |
| |
Temporary book/tax differences | | | (224,799 | ) |
| |
Capital loss carryforward | | | (298,862,201 | ) |
| |
Shares of beneficial interest | | | 712,352,238 | |
| |
Total net assets | | $ | 199,141,593 | |
| |
The difference between book-basis and tax-basis unrealized appreciation (depreciation) is due to differences in the timing of recognition of gains and losses on investments for tax and book purposes. The Fund’s net unrealized appreciation (depreciation) difference is attributable primarily to wash sales and partnership adjustments.
The temporary book/tax differences are a result of timing differences between book and tax recognition of income and/or expenses. The Fund’s temporary book/tax differences are the result of the trustee deferral of compensation and retirement plan benefits.
Capital loss carryforward is calculated and reported as of a specific date. Results of transactions and other activity after that date may affect the amount of capital loss carryforward actually available for the Fund to utilize. The ability to utilize capital loss carryforward in the future may be limited under the Internal Revenue Code and related regulations based on the results of future transactions.
18 Invesco Energy Fund
The Fund has a capital loss carryforward as of April 30, 2020, as follows:
| | | | | | | | | | | | |
| Capital Loss Carryforward* | |
| Expiration | | Short-Term | | | Long-Term | | | Total | |
Not subject to expiration | | $ | 14,114,536 | | | $ | 284,747,665 | | | $ | 298,862,201 | |
| |
| * | Capital loss carryforward is reduced for limitations, if any, to the extent required by the Internal Revenue Code and may be further limited depending upon a variety of factors, including the realization of net unrealized gains or losses as of the date of any reorganization. |
NOTE 8–Investment Transactions
The aggregate amount of investment securities (other than short-term securities, U.S. Treasury obligations and money market funds, if any) purchased and sold by the Fund during the year ended April 30, 2020 was $48,909,138 and $114,299,045, respectively. Cost of investments, including any derivatives, on a tax basis includes the adjustments for financial reporting purposes as of the most recently completed federal income tax reporting period-end.
| | | | |
| Unrealized Appreciation (Depreciation) of Investments on a Tax Basis | |
| |
Aggregate unrealized appreciation of investments | | $ | 78,919 | |
| |
Aggregate unrealized (depreciation) of investments | | | (217,022,071 | ) |
| |
Net unrealized appreciation (depreciation) of investments | | $ | (216,943,152 | ) |
| |
Cost of investments for tax purposes is $414,884,691.
NOTE 9–Reclassification of Permanent Differences
Primarily as a result of differing book/tax treatment of passive foreign investment companies and partnership reclass, on April 30, 2020, undistributed net investment income was decreased by $351,665, undistributed net realized gain (loss) was increased by $348,150 and shares of beneficial interest was increased by $3,515. This reclassification had no effect on the net assets of the Fund.
NOTE 10–Share Information
| | | | | | | | | | | | | | | | |
| | | Summary of Share Activity | |
| |
| | | Year ended | | | Year ended | |
| | | April 30, 2020(a) | | | April 30, 2019 | |
| | | Shares | | | Amount | | | Shares | | | Amount | |
| |
Sold: | | | | | | | | | | | | | | | | |
Class A | | | 2,571,914 | | | $ | 33,183,715 | | | | 1,464,416 | | | $ | 34,132,389 | |
| |
Class C | | | 438,690 | | | | 4,916,508 | | | | 236,293 | | | | 4,670,105 | |
| |
Class Y | | | 401,217 | | | | 6,062,809 | | | | 1,091,434 | | | | 26,784,693 | |
| |
Investor Class | | | 728,308 | | | | 9,831,497 | | | | 565,514 | | | | 13,139,156 | |
| |
Class R5 | | | 78,175 | | | | 1,133,675 | | | | 100,263 | | | | 2,443,016 | |
| |
Class R6 | | | 22,344 | | | | 399,123 | | | | 26,104 | | | | 585,421 | |
| |
| | | | |
Issued as reinvestment of dividends: | | | | | | | | | | | | | | | | |
Class A | | | 150,438 | | | | 2,643,200 | | | | 291,586 | | | | 5,645,072 | |
| |
Class C | | | 15,642 | | | | 234,472 | | | | 65,943 | | | | 1,094,000 | |
| |
Class Y | | | 20,797 | | | | 364,981 | | | | 47,535 | | | | 918,856 | |
| |
Investor Class | | | 64,785 | | | | 1,133,096 | | | | 129,930 | | | | 2,503,751 | |
| |
Class R5 | | | 3,923 | | | | 70,530 | | | | 9,257 | | | | 183,021 | |
| |
Class R6 | | | 511 | | | | 9,175 | | | | 545 | | | | 10,764 | |
| |
| | | | |
Automatic conversion of Class C shares to Class A shares: | | | | | | | | | | | | | | | | |
Class A | | | 156,538 | | | | 2,709,341 | | | | 1,275,937 | | | | 25,590,990 | |
| |
Class C | | | (183,578 | ) | | | (2,709,341 | ) | | | (1,489,808 | ) | | | (25,590,990 | ) |
| |
| | | | |
Reacquired: | | | | | | | | | | | | | | | | |
Class A | | | (4,185,125 | ) | | | (68,171,104 | ) | | | (3,705,917 | ) | | | (85,717,630 | ) |
| |
Class C | | | (695,203 | ) | | | (9,889,358 | ) | | | (1,142,265 | ) | | | (22,843,739 | ) |
| |
Class Y | | | (1,007,003 | ) | | | (16,510,648 | ) | | | (1,468,924 | ) | | | (34,093,691 | ) |
| |
Investor Class | | | (1,361,486 | ) | | | (21,759,775 | ) | | | (1,309,220 | ) | | | (30,425,947 | ) |
| |
Class R5 | | | (162,680 | ) | | | (2,753,001 | ) | | | (133,548 | ) | | | (3,291,228 | ) |
| |
Class R6 | | | (14,614 | ) | | | (267,909 | ) | | | (11,686 | ) | | | (246,115 | ) |
| |
Net increase (decrease) in share activity | | | (2,956,407 | ) | | $ | (59,369,014 | ) | | | (3,956,611 | ) | | $ | (84,508,106 | ) |
| |
| (a) | There are entities that are record owners of more than 5% of the outstanding shares of the Fund and in the aggregate own 26% of the outstanding shares of the Fund. IDI has an agreement with these entities to sell Fund shares. The Fund, Invesco and/or Invesco affiliates may make payments to these entities, which are considered to be related to the Fund, for providing services to the Fund, Invesco and/or Invesco affiliates including but not limited to services such as securities brokerage, distribution, third party record keeping and account servicing. The Fund has no knowledge as to whether all or any portion of the shares owned of record by these entities are also owned beneficially. |
19 Invesco Energy Fund
NOTE 11–Coronavirus (COVID-19) Pandemic
During the first quarter of 2020, the World Health Organization declared COVID-19 to be a public health emergency. COVID-19 has led to increased short-term market volatility and may have adverse long-term effects on U.S. and world economies and markets in general. COVID-19 may adversely impact the Fund’s ability to achieve its investment objective. Because of the uncertainties on valuation, the global economy and business operations, values reflected in these financial statements may materially differ from the value received upon actual sales of those investments.
The extent of the impact on the performance of the Fund and its investments will depend on future developments, including the duration and spread of the COVID-19 outbreak, related restrictions and advisories, and the effects on the financial markets and economy overall, all of which are highly uncertain and cannot be predicted.
20 Invesco Energy Fund
Report of Independent Registered Public Accounting Firm
To the Board of Trustees of AIM Sector Funds (Invesco Sector Funds) and Shareholders of Invesco Energy Fund
Opinion on the Financial Statements
We have audited the accompanying statement of assets and liabilities, including the schedule of investments, of Invesco Energy Fund (one of the funds constituting AIM Sector Funds (Invesco Sector Funds), referred to hereafter as the “Fund”) as of April 30, 2020, the related statement of operations for the year ended April 30, 2020, the statement of changes in net assets for each of the two years in the period ended April 30, 2020, including the related notes, and the financial highlights for each of the periods indicated therein (collectively referred to as the “financial statements”). In our opinion, the financial statements present fairly, in all material respects, the financial position of the Fund as of April 30, 2020, the results of its operations for the year then ended, the changes in its net assets for each of the two years in the period ended April 30, 2020 and the financial highlights for each of the periods indicated therein in conformity with accounting principles generally accepted in the United States of America.
Basis for Opinion
These financial statements are the responsibility of the Fund’s management. Our responsibility is to express an opinion on the Fund’s financial statements based on our audits. We are a public accounting firm registered with the Public Company Accounting Oversight Board (United States) (PCAOB) and are required to be independent with respect to the Fund in accordance with the U.S. federal securities laws and the applicable rules and regulations of the Securities and Exchange Commission and the PCAOB.
We conducted our audits of these financial statements in accordance with the standards of the PCAOB. Those standards require that we plan and perform the audit to obtain reasonable assurance about whether the financial statements are free of material misstatement, whether due to error or fraud.
Our audits included performing procedures to assess the risks of material misstatement of the financial statements, whether due to error or fraud, and performing procedures that respond to those risks. Such procedures included examining, on a test basis, evidence regarding the amounts and disclosures in the financial statements. Our audits also included evaluating the accounting principles used and significant estimates made by management, as well as evaluating the overall presentation of the financial statements. Our procedures included confirmation of securities owned as of April 30, 2020 by correspondence with the custodian and transfer agent. We believe that our audits provide a reasonable basis for our opinion.
/s/ PricewaterhouseCoopers LLP
Houston, Texas
June 26, 2020
We have served as the auditor of one or more of the investment companies in the Invesco group of investment companies since at least 1995. We have not been able to determine the specific year we began serving as auditor.
21 Invesco Energy Fund
Calculating your ongoing Fund expenses
Example
As a shareholder of the Fund, you incur two types of costs: (1) transaction costs, which may include sales charges (loads) on purchase payments or contingent deferred sales charges on redemptions, if any; and (2) ongoing costs, including management fees, distribution and/or service (12b-1) fees, and other Fund expenses. This example is intended to help you understand your ongoing costs (in dollars) of investing in the Fund and to compare these costs with ongoing costs of investing in other mutual funds. The example is based on an investment of $1,000 invested at the beginning of the period and held for the entire period November 1, 2019 through April 30, 2020.
Actual expenses
The table below provides information about actual account values and actual expenses. You may use the information in this table, together with the amount you invested, to estimate the expenses that you paid over the period. Simply divide your account value by $1,000 (for example, an $8,600 account value divided by $1,000 = 8.6), then multiply the result by the number in the table under the heading entitled “Actual Expenses Paid During Period” to estimate the expenses you paid on your account during this period.
Hypothetical example for comparison purposes
The table below also provides information about hypothetical account values and hypothetical expenses based on the Fund’s actual expense ratio and an assumed rate of return of 5% per year before expenses, which is not the Fund’s actual return.
The hypothetical account values and expenses may not be used to estimate the actual ending account balance or expenses you paid for the period. You may use this information to compare the ongoing costs of investing in the Fund and other funds. To do so, compare this 5% hypothetical example with the 5% hypothetical examples that appear in the shareholder reports of the other funds.
Please note that the expenses shown in the table are meant to highlight your ongoing costs only and do not reflect any transaction costs, such as sales charges (loads) on purchase payments or contingent deferred sales charges on redemptions, if any. Therefore, the hypothetical information is useful in comparing ongoing costs only, and will not help you determine the relative total costs of owning different funds. In addition, if these transaction costs were included, your costs would have been higher.
| | | | | | | | | | | | | | | | | | | | | | | | |
| | | Beginning
Account Value (11/01/19) | | | ACTUAL | | | HYPOTHETICAL (5% annual return before expenses) | | | Annualized
Expense
Ratio | |
| | | Ending
Account Value (04/30/20)1 | | | Expenses
Paid During Period2 | | | Ending
Account Value (04/30/20) | | | Expenses
Paid During Period2 | |
Class A | | | $1,000.00 | | | | $697.90 | | | | $6.21 | | | | $1,017.55 | | | | $7.37 | | | | 1.47% | |
Class C | | | 1,000.00 | | | | 695.50 | | | | 9.36 | | | | 1,013.82 | | | | 11.12 | | | | 2.22 | |
Class Y | | | 1,000.00 | | | | 698.80 | | | | 5.15 | | | | 1,018.80 | | | | 6.12 | | | | 1.22 | |
Investor Class | | | 1,000.00 | | | | 698.20 | | | | 6.21 | | | | 1,017.55 | | | | 7.37 | | | | 1.47 | |
Class R5 | | | 1,000.00 | | | | 699.70 | | | | 4.10 | | | | 1,020.04 | | | | 4.87 | | | | 0.97 | |
Class R6 | | | 1,000.00 | | | | 699.60 | | | | 4.10 | | | | 1,020.04 | | | | 4.87 | | | | 0.97 | |
| 1 | The actual ending account value is based on the actual total return of the Fund for the period November 1, 2019 through April 30, 2020, after actual expenses and will differ from the hypothetical ending account value which is based on the Fund’s expense ratio and a hypothetical annual return of 5% before expenses. |
| 2 | Expenses are equal to the Fund’s annualized expense ratio as indicated above multiplied by the average account value over the period, multiplied by 182/366 to reflect the most recent fiscal half year. |
22 Invesco Energy Fund
Tax Information
Form 1099-DIV, Form 1042-S and other year–end tax information provide shareholders with actual calendar year amounts that should be included in their tax returns. Shareholders should consult their tax advisers.
The following distribution information is being provided as required by the Internal Revenue Code or to meet a specific state’s requirement.
The Fund designates the following amounts or, if subsequently determined to be different, the maximum amount allowable for its fiscal year ended April 30, 2020:
| | | | | | | | |
| | Federal and State Income Tax | | | | | | |
| | Qualified Dividend Income* | | | 84.85 | % | | |
| | Corporate Dividends Received Deduction* | | | 100.00 | % | | |
| | U.S. Treasury Obligations* | | | 0.00 | % | | |
| |
| | * The above percentages are based on ordinary income dividends paid to shareholders during the Fund’s fiscal year. |
23 Invesco Energy Fund
Trustees and Officers
The address of each trustee and officer is AIM Sector Funds (Invesco Sector Funds) (the “Trust”), 11 Greenway Plaza, Suite 1000, Houston, Texas 77046-1173. The trustees serve for the life of the Trust, subject to their earlier death, incapacitation, resignation, retirement or removal as more specifically provided in the Trust’s organizational documents. Each officer serves for a one year term or until their successors are elected and qualified. Column two below includes length of time served with predecessor entities, if any.
| | | | | | | | | | |
Name, Year of Birth and Position(s) Held with the Trust | | Trustee and/or Officer Since | | | Principal Occupation(s) During Past 5 Years | | Number of Funds in Fund Complex Overseen by Trustee | | Other Directorship(s) Held by Trustee During Past 5 Years |
| Interested Trustee | | | | | | | | | | |
| Martin L. Flanagan1 – 1960 Trustee and Vice Chair | | | 2007 | | | Executive Director, Chief Executive Officer and President, Invesco Ltd. (ultimate parent of Invesco and a global investment management firm); Trustee and Vice Chair, The Invesco Funds; Vice Chair, Investment Company Institute; and Member of Executive Board, SMU Cox School of Business Formerly: Advisor to the Board, Invesco Advisers, Inc. (formerly known as Invesco Institutional (N.A.), Inc.); Chairman and Chief Executive Officer, Invesco Advisers, Inc. (registered investment adviser); Director, Chairman, Chief Executive Officer and President, Invesco Holding Company (US), Inc. (formerly IVZ Inc.) (holding company), Invesco Group Services, Inc. (service provider) and Invesco North American Holdings, Inc. (holding company); Director, Chief Executive Officer and President, Invesco Holding Company Limited (parent of Invesco and a global investment management firm); Director, Invesco Ltd.; Chairman, Investment Company Institute and President, Co-Chief Executive Officer, Co-President, Chief Operating Officer and Chief Financial Officer, Franklin Resources, Inc. (global investment management organization) | | 203 | | None |
| 1 | Mr. Flanagan is considered an interested person (within the meaning of Section 2(a)(19) of the 1940 Act) of the Trust because he is an officer of the Adviser to the Trust, and an officer and a director of Invesco Ltd., ultimate parent of the Adviser. |
T-1 Invesco Energy Fund
Trustees and Officers–(continued)
| | | | | | | | |
Name, Year of Birth and
Position(s) Held with the Trust | | Trustee and/or Officer Since | | Principal Occupation(s) During Past 5 Years | | Number of
Funds in Fund Complex Overseen by Trustee | | Other
Directorship(s) Held by Trustee During Past 5 Years |
Independent Trustees | | | | | | | | |
Bruce L. Crockett – 1944 Trustee and Chair | | 2003 | | Chairman, Crockett Technologies Associates (technology consulting company) Formerly: Director, Captaris (unified messaging provider); Director, President and Chief Executive Officer, COMSAT Corporation; Chairman, Board of Governors of INTELSAT (international communications company); ACE Limited (insurance company); Independent Directors Council and Investment Company Institute: Member of the Audit Committee, Investment Company Institute; Member of the Executive Committee and Chair of the Governance Committee, Independent Directors Council | | 203 | | Director and Chairman of the Audit Committee, ALPS (Attorneys Liability Protection Society) (insurance company); Director and Member of the Audit Committee and Compensation Committee, Ferroglobe PLC (metallurgical company) |
David C. Arch – 1945 Trustee | | 2010 | | Chairman of Blistex Inc. (consumer health care products manufacturer); Member, World Presidents’ Organization | | 203 | | Board member of the Illinois Manufacturers’ Association |
Beth Ann Brown – 1968 Trustee | | 2019 | | Independent Consultant Formerly: Head of Intermediary Distribution, Managing Director, Strategic Relations, Managing Director, Head of National Accounts, Senior Vice President, National Account Manager and Senior Vice President, Key Account Manager, Columbia Management Investment Advisers LLC; Vice President, Key Account Manager, Liberty Funds Distributor, Inc.; and Trustee of certain Oppenheimer Funds | | 203 | | Director, Board of Directors of Caron Engineering Inc.; Advisor, Board of Advisors of Caron Engineering Inc.; President and Director, Acton Shapleigh Youth Conservation Corps (non - profit); and Vice President and Director of Grahamtastic Connection (non- profit) |
Jack M. Fields – 1952 Trustee | | 2003 | | Chief Executive Officer, Twenty First Century Group, Inc. (government affairs company); and Chairman, Discovery Learning Alliance (non-profit) Formerly: Owner and Chief Executive Officer, Dos Angeles Ranch L.P. (cattle, hunting, corporate entertainment); Director, Insperity, Inc. (formerly known as Administaff) (human resources provider); Chief Executive Officer, Texana Timber LP (sustainable forestry company); Director of Cross Timbers Quail Research Ranch (non-profit); and member of the U.S. House of Representatives | | 203 | | Member, Board of Directors of Baylor College of Medicine |
T-2 Invesco Energy Fund
Trustees and Officers–(continued)
| | | | | | | | |
Name, Year of Birth and
Position(s) Held with the Trust | | Trustee and/or Officer Since | | Principal Occupation(s) During Past 5 Years | | Number of
Funds in Fund Complex Overseen by Trustee | | Other
Directorship(s) Held by Trustee During Past 5 Years |
Independent Trustees—(continued) |
Cynthia Hostetler –1962 Trustee | | 2017 | | Non-Executive Director and Trustee of a number of public and private business corporations Formerly: Director, Aberdeen Investment Funds (4 portfolios); Head of Investment Funds and Private Equity, Overseas Private Investment Corporation; President, First Manhattan Bancorporation, Inc.; Attorney, Simpson Thacher & Bartlett LLP | | 203 | | Vulcan Materials Company (construction materials company); Trilinc Global Impact Fund; Genesee & Wyoming, Inc. (railroads); Artio Global Investment LLC (mutual fund complex); Edgen Group, Inc. (specialized energy and infrastructure products distributor); Investment Company Institute (professional organization); Independent Directors Council (professional organization) |
Eli Jones – 1961 Trustee | | 2016 | | Professor and Dean, Mays Business School - Texas A&M University Formerly: Professor and Dean, Walton College of Business, University of Arkansas and E.J. Ourso College of Business, Louisiana State University; Director, Arvest Bank | | 229 | | Insperity, Inc. (formerly known as Administaff) (human resources provider) |
Elizabeth Krentzman – 1959 Trustee | | 2019 | | Formerly: Principal and Chief Regulatory Advisor for Asset Management Services and U.S. Mutual Fund Leader of Deloitte & Touche LLP; General Counsel of the Investment Company Institute (trade association); National Director of the Investment Management Regulatory Consulting Practice, Principal, Director and Senior Manager of Deloitte & Touche LLP; Assistant Director of the Division of Investment Management - Office of Disclosure and Investment Adviser Regulation of the U.S. Securities and Exchange Commission and various positions with the Division of Investment Management – Office of Regulatory Policy of the U.S. Securities and Exchange Commission; Associate at Ropes & Gray LLP; Advisory Board Member of the Securities and Exchange Commission Historical Society; and Trustee of certain Oppenheimer Funds | | 203 | | Trustee of the University of Florida National Board Foundation and Audit Committee Member; Member of the Cartica Funds Board of Directors (private investment funds); Member of the University of Florida Law Center Association, Inc. Board of Trustees and Audit Committee Member |
Anthony J. LaCava, Jr. – 1956 Trustee | | 2019 | | Formerly: Director and Member of the Audit Committee, Blue Hills Bank (publicly traded financial institution) and Managing Partner, KPMG LLP | | 203 | | Blue Hills Bank; Chairman, Bentley University; Member, Business School Advisory Council; and Nominating Committee KPMG LLP |
Prema Mathai-Davis – 1950 Trustee | | 2003 | | Retired Co-Owner & Partner of Quantalytics Research, LLC, (a FinTech Investment Research Platform for the Self-Directed Investor) | | 203 | | None |
T-3 Invesco Energy Fund
Trustees and Officers–(continued)
| | | | | | | | |
Name, Year of Birth and
Position(s) Held with the Trust | | Trustee and/or Officer Since | | Principal Occupation(s) During Past 5 Years | | Number of
Funds in Fund Complex Overseen by Trustee | | Other
Directorship(s) Held by Trustee During Past 5 Years |
Independent Trustees—(continued) |
Joel W. Motley – 1952 Trustee | | 2019 | | Director of Office of Finance, Federal Home Loan Bank System; Member of the Vestry of Trinity Wall Street; Managing Director of Carmona Motley Inc. (privately held financial advisor); Member of the Council on Foreign Relations and its Finance and Budget Committee; Chairman Emeritus of Board of Human Rights Watch and Member of its Investment Committee; and Member of Investment Committee and Board of Historic Hudson Valley (non-profit cultural organization) Formerly: Managing Director of Public Capital Advisors, LLC (privately held financial advisor); Managing Director of Carmona Motley Hoffman, Inc. (privately held financial advisor); Trustee of certain Oppenheimer Funds; and Director of Columbia Equity Financial Corp. (privately held financial advisor) | | 203 | | Member of Board of Greenwall Foundation (bioethics research foundation) and its Investment Committee; Member of Board of Friends of the LRC (non-profit legal advocacy); Board Member and Investment Committee Member of Pulizer Center for Crisis Reporting (non-profit journalism) |
Teresa M. Ressel – 1962 Trustee | | 2017 | | Non-executive director and trustee of a number of public and private business corporations Formerly: Chief Financial Officer, Olayan America, The Olayan Group (international investor/commercial/industrial); Chief Executive Officer, UBS Securities LLC; Group Chief Operating Officer, Americas, UBS AG; Assistant Secretary for Management & Budget and CFO, US Department of the Treasury | | 203 | | Atlantic Power Corporation (power generation company); ON Semiconductor Corp. (semiconductor supplier) |
Ann Barnett Stern – 1957 Trustee | | 2017 | | President and Chief Executive Officer, Houston Endowment Inc. (private philanthropic institution) Formerly: Executive Vice President and General Counsel, Texas Children’s Hospital; Attorney, Beck, Redden and Secrest, LLP; Business Law Instructor, University of St. Thomas; Attorney, Andrews & Kurth LLP | | 203 | | Federal Reserve Bank of Dallas |
Robert C. Troccoli – 1949 Trustee | | 2016 | | Retired Formerly: Adjunct Professor, University of Denver – Daniels College of Business; Senior Partner, KPMG LLP | | 203 | | None |
Daniel S. Vandivort –1954 Trustee | | 2019 | | Treasurer, Chairman of the Audit and Finance Committee, and Trustee, Board of Trustees, Huntington Disease Foundation of America; and President, Flyway Advisory Services LLC (consulting and property management) Formerly: Trustee and Governance Chair, of certain Oppenheimer Funds | | 203 | | Chairman and Lead Independent Director, Chairman of the Audit Committee, and Director, Board of Directors, Value Line Funds |
James D. Vaughn – 1945 Trustee | | 2019 | | Retired Formerly: Managing Partner, Deloitte & Touche LLP; Trustee and Chairman of the Audit Committee, Schroder Funds; Board Member, Mile High United Way, Boys and Girls Clubs, Boy Scouts, Colorado Business Committee for the Arts, Economic Club of Colorado and Metro Denver Network (economic development corporation); and Trustee of certain Oppenheimer Funds | | 203 | | Board member and Chairman of Audit Committee of AMG National Trust Bank; Trustee and Investment Committee member, University of South Dakota Foundation; Board member, Audit Committee Member and past Board Chair, Junior Achievement (non-profit) |
Christopher L. Wilson – 1957 Trustee, Vice Chair and Chair Designate | | 2017 | | Retired Formerly: Director, TD Asset Management USA Inc. (mutual fund complex) (22 portfolios); Managing Partner, CT2, LLC (investing and consulting firm); President/Chief Executive Officer, Columbia Funds, Bank of America Corporation; President/Chief Executive Officer, CDC IXIS Asset Management Services, Inc.; Principal & Director of Operations, Scudder Funds, Scudder, Stevens & Clark, Inc.; Assistant Vice President, Fidelity Investments | | 203 | | ISO New England, Inc. (non-profit organization managing regional electricity market) |
T-4 Invesco Energy Fund
Trustees and Officers–(continued)
| | | | | | | | |
Name, Year of Birth and
Position(s) Held with the Trust | | Trustee and/or Officer Since | | Principal Occupation(s) During Past 5 Years | | Number of
Funds in Fund Complex Overseen by Trustee | | Other
Directorship(s) Held by Trustee During Past 5 Years |
Officers | | | | | | | | |
Sheri Morris – 1964 President, Principal Executive Officer and Treasurer | | 2003 | | Head of Global Fund Services, Invesco Ltd.; President, Principal Executive Officer and Treasurer, The Invesco Funds; Vice President, Invesco Advisers, Inc. (formerly known as Invesco Institutional (N.A.), Inc.) (registered investment adviser); and Vice President, Invesco Exchange-Traded Fund Trust, Invesco Exchange-Traded Fund Trust II, Invesco India Exchange-Traded Fund Trust, Invesco Actively Managed Exchange-Traded Fund Trust, Invesco Actively Managed Exchange-Traded Commodity Fund Trust and Invesco Exchange-Traded Self-Indexed Fund Trust; and Vice President, OppenheimerFunds, Inc. Formerly: Vice President and Principal Financial Officer, The Invesco Funds; Vice President, Invesco AIM Advisers, Inc., Invesco AIM Capital Management, Inc. and Invesco AIM Private Asset Management, Inc.; Assistant Vice President and Assistant Treasurer, The Invesco Funds and Assistant Vice President, Invesco Advisers, Inc., Invesco AIM Capital Management, Inc. and Invesco AIM Private Asset Management, Inc.; and Treasurer, Invesco Exchange-Traded Fund Trust, Invesco Exchange-Traded Fund Trust II, Invesco India Exchange-Traded Fund Trust and Invesco Actively Managed Exchange-Traded Fund Trust | | N/A | | N/A |
Russell C. Burk – 1958 Senior Vice President and Senior Officer | | 2005 | | Senior Vice President and Senior Officer, The Invesco Funds | | N/A | | N/A |
Jeffrey H. Kupor – 1968 Senior Vice President, Chief Legal Officer and Secretary | | 2018 | | Head of Legal of the Americas, Invesco Ltd.; Senior Vice President and Secretary, Invesco Advisers, Inc. (formerly known as Invesco Institutional (N.A.), Inc.) (registered investment adviser); Senior Vice President and Secretary, Invesco Distributors, Inc. (formerly known as Invesco AIM Distributors, Inc.); Vice President and Secretary, Invesco Investment Services, Inc. (formerly known as Invesco AIM Investment Services, Inc.) Senior Vice President, Chief Legal Officer and Secretary, The Invesco Funds; Secretary and General Counsel, Invesco Investment Advisers LLC (formerly known as Van Kampen Asset Management); Secretary and General Counsel, Invesco Capital Markets, Inc. (formerly known as Van Kampen Funds Inc.) and Chief Legal Officer, Invesco Exchange-Traded Fund Trust, Invesco Exchange-Traded Fund Trust II, Invesco India Exchange-Traded Fund Trust, Invesco Actively Managed Exchange-Traded Fund Trust, Invesco Actively Managed Exchange-Traded Commodity Fund Trust and Invesco Exchange-Traded Self-Indexed Fund Trust; Secretary, Invesco Indexing LLC; Secretary, W.L. Ross & Co., LLC Formerly: Secretary and Vice President, Jemstep, Inc.; Head of Legal, Worldwide Institutional, Invesco Ltd.; Secretary and General Counsel, INVESCO Private Capital Investments, Inc.; Senior Vice President, Secretary and General Counsel, Invesco Management Group, Inc. (formerly known as Invesco AIM Management Group, Inc.); Assistant Secretary, INVESCO Asset Management (Bermuda) Ltd.; Secretary and General Counsel, Invesco Private Capital, Inc.; Assistant Secretary and General Counsel, INVESCO Realty, Inc.; Secretary and General Counsel, Invesco Senior Secured Management, Inc.; and Secretary, Sovereign G./P. Holdings Inc. | | N/A | | N/A |
Andrew R. Schlossberg – 1974 Senior Vice President | | 2019 | | Head of the Americas and Senior Managing Director, Invesco Ltd.; Director and Senior Vice President, Invesco Advisers, Inc. (formerly known as Invesco Institutional (N.A.), Inc.) (registered investment adviser); Director and Chairman, Invesco Investment Services, Inc. (formerly known as Invesco AIM Investment Services, Inc.) (registered transfer agent); Senior Vice President, The Invesco Funds; Director, Invesco Investment Advisers LLC (formerly known as Van Kampen Asset Management); Director, President and Chairman, Invesco Insurance Agency, Inc. Formerly: Director, Invesco UK Limited; Director and Chief Executive, Invesco Asset Management Limited and Invesco Fund Managers Limited; Assistant Vice President, The Invesco Funds; Senior Vice President, Invesco Advisers, Inc. (formerly known as Invesco Institutional (N.A.), Inc.) (registered investment adviser); Director and Chief Executive, Invesco Administration Services Limited and Invesco Global Investment Funds Limited; Director, Invesco Distributors, Inc.; Head of EMEA, Invesco Ltd.; President, Invesco Actively Managed Exchange-Traded Commodity Fund Trust, Invesco Actively Managed Exchange-Traded Fund Trust, Invesco Exchange-Traded Fund Trust, Invesco Exchange-Traded Fund Trust II and Invesco India Exchange-Traded Fund Trust; Managing Director and Principal Executive Officer, Invesco Capital Management LLC | | N/A | | N/A |
T-5 Invesco Energy Fund
Trustees and Officers–(continued)
| | | | | | | | |
Name, Year of Birth and
Position(s) Held with the Trust | | Trustee and/or Officer Since | | Principal Occupation(s) During Past 5 Years | | Number of
Funds in Fund Complex Overseen by Trustee | | Other
Directorship(s) Held by Trustee During Past 5 Years |
Officers—(continued) |
| John M. Zerr – 1962 Senior Vice President | | 2006 | | Chief Operating Officer of the Americas; Senior Vice President, Invesco Advisers, Inc. (formerly known as Invesco Institutional (N.A.), Inc.) (registered investment adviser); Senior Vice President, Invesco Distributors, Inc. (formerly known as Invesco AIM Distributors, Inc.); Director and Vice President, Invesco Investment Services, Inc. (formerly known as Invesco AIM Investment Services, Inc.) Senior Vice President, The Invesco Funds; Managing Director, Invesco Capital Management LLC; Director, Invesco Investment Advisers LLC (formerly known as Van Kampen Asset Management); Senior Vice President, Invesco Capital Markets, Inc. (formerly known as Van Kampen Funds Inc.); Manager, Invesco Indexing LLC; Manager, Invesco Specialized Products, LLC; Director and Senior Vice President, Invesco Insurance Agency, Inc.; Member, Invesco Canada Funds Advisory Board; Director, President and Chief Executive Officer, Invesco Corporate Class Inc. (corporate mutual fund company); and Director, Chairman, President and Chief Executive Officer, Invesco Canada Ltd. (formerly known as Invesco Trimark Ltd./Invesco Trimark Ltèe) (registered investment adviser and registered transfer agent); President, Invesco, Inc.; President, Invesco Global Direct Real Estate Feeder GP Ltd.; President, Invesco IP Holdings(Canada) Ltd; President, Invesco Global Direct Real Estate GP Ltd.; President, Invesco Financial Services Ltd. / Services Financiers Invesco Ltée; and President, Trimark Investments Ltd./Placements Trimark Ltée Formerly: Director and Senior Vice President, Invesco Management Group, Inc. (formerly known as Invesco AIM Management Group, Inc.); Secretary and General Counsel, Invesco Management Group, Inc. (formerly known as Invesco AIM Management Group, Inc.); Secretary, Invesco Investment Services, Inc. (formerly known as Invesco AIM Investment Services, Inc.); Chief Legal Officer and Secretary, The Invesco Funds; Secretary and General Counsel, Invesco Investment Advisers LLC (formerly known as Van Kampen Asset Management); Secretary and General Counsel, Invesco Capital Markets, Inc. (formerly known as Van Kampen Funds Inc.); Chief Legal Officer, Invesco Exchange-Traded Fund Trust, Invesco Exchange-Traded Fund Trust II, Invesco India Exchange-Traded Fund Trust, Invesco Actively Managed Exchange-Traded Fund Trust, Invesco Actively Managed Exchange-Traded Commodity Fund Trust and Invesco Exchange-Traded Self-Indexed Fund Trust; Secretary, Invesco Indexing LLC; Director, Secretary, General Counsel and Senior Vice President, Van Kampen Exchange Corp.; Director, Vice President and Secretary, IVZ Distributors, Inc. (formerly known as INVESCO Distributors, Inc.); Director and Vice President, INVESCO Funds Group, Inc.; Director and Vice President, Van Kampen Advisors Inc.; Director, Vice President, Secretary and General Counsel, Van Kampen Investor Services Inc.;Director and Secretary, Invesco Distributors, Inc. (formerly known as Invesco AIM Distributors, Inc.); Director, Senior Vice President, General Counsel and Secretary, Invesco AIM Advisers, Inc. and Van Kampen Investments Inc.; Director, Vice President and Secretary, Fund Management Company; Director, Senior Vice President, Secretary, General Counsel and Vice President, Invesco AIM Capital Management, Inc.; Chief Operating Officer and General Counsel, Liberty Ridge Capital, Inc. (an investment adviser) | | N/A | | N/A |
| Gregory G. McGreevey – 1962 Senior Vice President | | 2012 | | Senior Managing Director, Invesco Ltd.; Director, Chairman, President, and Chief Executive Officer, Invesco Advisers, Inc. (formerly known as Invesco Institutional (N.A.), Inc.) (registered investment adviser); Director, Invesco Mortgage Capital, Inc. and Invesco Senior Secured Management, Inc.; and Senior Vice President, The Invesco Funds; and President, SNW Asset Management Corporation and Invesco Managed Accounts, LLC Formerly: Senior Vice President, Invesco Management Group, Inc. and Invesco Advisers, Inc.; Assistant Vice President, The Invesco Funds | | N/A | | N/A |
Kelli Gallegos – 1970 Vice President, Principal Financial Officer and Assistant Treasurer | | 2008 | | Principal Financial and Accounting Officer – Investments Pool, Invesco Specialized Products, LLC; Vice President, Principal Financial Officer and Assistant Treasurer, The Invesco Funds; Principal Financial and Accounting Officer – Pooled Investments, Invesco Capital Management LLC; Vice President and Treasurer, Invesco Exchange-Traded Fund Trust, Invesco Exchange-Traded Fund Trust II, Invesco India Exchange-Traded Fund Trust, Invesco Actively Managed Exchange-Traded Fund Trust, Invesco Actively Managed Exchange-Traded Commodity Fund Trust and Invesco Exchange-Traded Self-Indexed Fund Trust; Vice President, Invesco Advisers, Inc. Formerly: Assistant Treasurer, Invesco Specialized Products, LLC; Assistant Treasurer, Invesco Exchange-Traded Fund Trust, Invesco Exchange-Traded Fund Trust II, Invesco India Exchange-Traded Fund Trust, Invesco Actively Managed Exchange-Traded Fund Trust, Invesco Actively Managed Exchange-Traded Commodity Fund Trust and Invesco Exchange-Traded Self-Indexed Fund Trust; Assistant Treasurer, Invesco Capital Management LLC; Assistant Vice President, The Invesco Funds | | N/A | | N/A |
T-6 Invesco Energy Fund
Trustees and Officers–(continued)
| | | | | | | | |
Name, Year of Birth and
Position(s) Held with the Trust | | Trustee and/or Officer Since | | Principal Occupation(s) During Past 5 Years | | Number of
Funds in Fund Complex Overseen by Trustee | | Other
Directorship(s) Held by Trustee During Past 5 Years |
Officers—(continued) |
Crissie M. Wisdom – 1969 Anti-Money Laundering Compliance Officer | | 2013 | | Anti-Money Laundering and OFAC Compliance Officer for Invesco U.S. entities including: Invesco Advisers, Inc. and its affiliates, Invesco Capital Markets, Inc., Invesco Distributors, Inc., Invesco Investment Services, Inc., The Invesco Funds, Invesco Capital Management, LLC, Invesco Trust Company; OppenheimerFunds Distributor, Inc., and Fraud Prevention Manager for Invesco Investment Services, Inc. | | N/A | | N/A |
Todd F. Kuehl – 1969 Chief Compliance Officer | | 2020 | | Chief Compliance Officer, Invesco Advisers, Inc. (registered investment adviser); and Chief Compliance Officer, The Invesco Funds Formerly: Managing Director and Chief Compliance Officer, Legg Mason (Mutual Funds);Chief Compliance Officer, Legg Mason Private Portfolio Group (registered investment adviser) | | N/A | | N/A |
The Statement of Additional Information of the Trust includes additional information about the Fund’s Trustees and is available upon request, without charge, by calling 1.800.959.4246. Please refer to the Fund’s Statement of Additional Information for information on the Fund’s sub-advisers.
| | | | | | |
Office of the Fund 11 Greenway Plaza, Suite 1000 Houston, TX 77046-1173 Counsel to the Fund Stradley Ronon Stevens & Young, LLP 2005 Market Street, Suite 2600 Philadelphia, PA 19103-7018 | | Investment Adviser Invesco Advisers, Inc. 1555 Peachtree Street, N.E. Atlanta, GA 30309 Counsel to the Independent Trustees Goodwin Procter LLP 901 New York Avenue, N.W. Washington, D.C. 20001 | | Distributor Invesco Distributors, Inc. 11 Greenway Plaza, Suite 1000 Houston, TX 77046-1173 Transfer Agent Invesco Investment Services, Inc. 11 Greenway Plaza, Suite 1000 Houston, TX 77046-1173 | | Auditors PricewaterhouseCoopers LLP 1000 Louisiana Street, Suite 5800 Houston, TX 77002-5678 Custodian State Street Bank and Trust Company 225 Franklin Street Boston, MA 02110-2801 |
T-7 Invesco Energy Fund
(This page intentionally left blank)

Go paperless with eDelivery
Visit invesco.com/edelivery to enjoy the convenience and security of anytime electronic access to your investment documents.
With eDelivery, you can elect to have any or all of the following materials delivered straight to your inbox to download, save and print from your own computer:
| ∎ | | Fund reports and prospectuses |
Invesco mailing information
Send general correspondence to Invesco Investment Services, Inc., P.O. Box 219078, Kansas City, MO 64121-9078.
Important notice regarding delivery of security holder documents
To reduce Fund expenses, only one copy of most shareholder documents may be mailed to shareholders with multiple accounts at the same address (Householding). Mailing of your shareholder documents may be householded indefinitely unless you instruct us otherwise. If you do not want the mailing of these documents to be combined with those for other members of your household, please contact Invesco Investment Services, Inc. at 800 959 4246 or contact your financial institution. We will begin sending you individual copies for each account within 30 days after receiving your request.
Fund holdings and proxy voting information
The Fund provides a complete list of its holdings four times in each fiscal year, at the quarter-ends. For the second and fourth quarters, the list appears in the Fund’s semiannual and annual reports to shareholders. For the first and third quarters, the Fund files the lists with the Securities and Exchange Commission (SEC) as an exhibit to its reports on Form N-PORT. The most recent list of portfolio holdings is available at invesco.com/completeqtrholdings. Shareholders can also look up the Fund’s Form N-PORT filings on the SEC website, sec.gov. The SEC file numbers for the Fund are shown below.
A description of the policies and procedures that the Fund uses to determine how to vote proxies relating to portfolio securities is available without charge, upon request, from our Client Services department at 800 959 4246, or at invesco.com/ proxyguidelines. The information is also available on the SEC website, sec.gov.
| | |
Information regarding how the Fund voted proxies related to its portfolio securities during the most recent 12-month period ended June 30 is available at invesco.com/proxysearch. This information is also available on the SEC website, sec.gov. Invesco Advisers, Inc. is an investment adviser; it provides investment advisory services to individual and institutional clients and does not sell securities. Invesco Distributors, Inc. is the US distributor for Invesco Ltd.’s retail mutual funds, exchange-traded funds and institutional money market funds. Both are wholly owned, indirect subsidiaries of Invesco Ltd. | |  |
| | | | |
| SEC file numbers: 811-03826 and 002-85905 | | Invesco Distributors, Inc. | | I-ENE-AR-1 |
| | | | |
| | |
 | | Annual Report to Shareholders | | April 30, 2020 |
| | |
| | Invesco Gold & Precious Metals Fund |
| | Nasdaq: |
| | A: IGDAX ∎ C: IGDCX ∎ Y: IGDYX ∎ Investor: FGLDX ∎ R6: IGDSX |

|
Beginning on January 1, 2021, as permitted by regulations adopted by the Securities and Exchange Commission, paper copies of the Fund’s shareholder reports will no longer be sent by mail, unless you specifically request paper copies of the reports from the Fund or from your financial intermediary, such as a broker-dealer or bank. Instead, the reports will be made available on the Fund’s website, and you will be notified by mail each time a report is posted and provided with a website link to access the report. |
|
If you already elected to receive shareholder reports electronically, you will not be affected by this change and you need not take any action. You may elect to receive shareholder reports and other communications from the Fund electronically by contacting your financial intermediary (such as a broker-dealer or bank) or, if you are a direct investor, by enrolling at invesco.com/edelivery. |
|
You may elect to receive all future reports in paper free of charge. If you invest through a financial intermediary, you can contact your financial intermediary to request that you continue to receive paper copies of your shareholder reports. If you invest directly with the Fund, you can call (800) 959-4246 to let the Fund know you wish to continue receiving paper copies of your shareholder reports. Your election to receive reports in paper will apply to all funds held with your financial intermediary or all funds held with the fund complex if you invest directly with the Fund. |
Letters to Shareholders
| | |

Andrew Schlossberg | | Dear Shareholders: |
| | This annual report includes information about your Fund, including performance data and a complete list of its investments as of the close of the reporting period. Inside is a discussion of how your Fund was managed and the factors that affected its performance during the reporting period. |
| | Global equities and fixed-income securities faced a tumultuous environment during the reporting period. This was particularly true in the later stages of the period as a pandemic gripped the world and unsettled markets. At the onset of the reporting period, global equity markets were buoyed by a more accommodative stance from central banks. Despite US-China trade concerns and signs of slowing global growth, which led to some market volatility along the way, the second and third quarters of 2019 were relatively calm. In the final months of 2019, better-than-expected third quarter corporate earnings and initial agreement of the phase one US-China trade deal provided a favorable backdrop for equities and impressive fourth quarter global equity returns. |
The first quarter of 2020 proved to be a wild roller-coaster ride as the year began with US investors treated to equity gains culminating in record highs on February 19, 2020. The first half of the quarter, however, belied the impact the coronavirus (COVID-19) would have on markets in a world faced with shuttered businesses and global lockdowns. Equity markets began to sell off in late February and plummeted in March. The speed and depth of market declines and reversals during the month made March 2020 one of the most volatile months on record. While equities languished, government bonds largely performed as expected as central banks cut interest rates, which lowered bond yields but sent bond prices soaring. Like equities, however, corporate bond prices fell due to the impact of diminished corporate profits. Commodity prices, sans gold, largely declined during the first quarter. Oil prices suffered steep declines losing more than half their value in March amid a demand slump due to both COVID-19 and a supply glut from the Russia-Saudi Arabi oil-price war.
In response to the financial and economic hardships caused by the pandemic, central banks and governments around the world responded with fiscal and monetary stimulus. The US Federal Reserve cut interest rates to near zero (0.00-0.25%) and announced an unprecedented quantitative easing program. The US administration also passed a $2.2 trillion economic-relief package – the largest in US history. Most major economies outside of the US provided liquidity in the bond and equity markets in the form of fiscal policy and quantitative easing.
Massive global fiscal and monetary responses prompted a significant market rebound in April, with the S&P 500 Index recording one of its best monthly performances ever, despite macroeconomic data that illustrated the enormous economic cost of the shutdowns – more than 30 million US workers have lost their jobs and the US economy contracted at a 5.0% annualized rate (second estimate) for the first quarter of 2020. The final month of the reporting period also proved less volatile than March as markets attempted to normalize. As markets and investors attempt to adapt to a new normal, we’ll see how the interplay of interest rates, economic data, geopolitics and a host of other factors affect US and overseas equity and fixed income markets.
Investor uncertainty and market volatility, such as we witnessed during the reporting period, are unfortunate facts of life when it comes to investing. That’s why Invesco encourages investors to work with a professional financial adviser who can stress the importance of starting to save and invest early and the importance of adhering to a disciplined investment plan. A financial adviser who knows your unique financial situation, investment goals and risk tolerance can be an invaluable partner as you seek to achieve your financial goals. Financial advisers can also offer a long-term perspective when markets are volatile and time-tested advice and guidance when your financial situation or investment goals change.
Visit our website for more information on your investments
Our website, invesco.com/us, offers a wide range of market insights and investment perspectives. On the website, you’ll find detailed information about our funds, including performance, holdings and portfolio manager commentaries. You can access information about your account by completing a simple, secure online registration. To do so, select “Log In” on the right side of the homepage, and then select “Register for Individual Account Access.”
In addition to the resources accessible on our website and through our mobile app, you can obtain timely updates to help you stay informed about the markets and the economy by connecting with Invesco on Twitter, LinkedIn or Facebook. You can access our blog at blog.invesco.us.com. Our goal is to provide you the information you want, when and where you want it.
Finally, I’m pleased to share with you Invesco’s commitment to both the Principles for Responsible Investment and to considering environmental, social and governance issues in our robust investment process. I invite you to learn more at invesco.com/esg.
Have questions?
For questions about your account, contact an Invesco client services representative at 800 959 4246.
All of us at Invesco look forward to serving your investment management needs. Thank you for investing with us.
Sincerely,

Andrew Schlossberg
Head of the Americas,
Senior Managing Director, Invesco Ltd.
| | |
| 2 | | Invesco Gold & Precious Metals Fund |
| | |

Bruce Crockett | | Dear Shareholders: |
| | Among the many important lessons I’ve learned in more than 40 years in a variety of business endeavors is the value of a trusted advocate. |
| | As independent chair of the Invesco Funds Board, I can assure you that the members of the Board are strong advocates for the interests of investors in Invesco’s mutual funds. We work hard to represent your interests through oversight of the quality of the investment management services your funds receive and other matters important to your investment, including but not limited to: |
| | ∎ Ensuring that Invesco offers a diverse lineup of mutual funds that your financial adviser can use to strive to meet your financial needs as your investment goals change over time. ∎ Monitoring how the portfolio management teams of the Invesco funds are performing in light of changing economic and market conditions. ∎ Assessing each portfolio management team’s investment performance within the context of the investment strategy described in the fund’s prospectus. |
| ∎ | | Monitoring for potential conflicts of interests that may impact the nature of the services that your funds receive. |
We believe one of the most important services we provide our fund shareholders is the annual review of the funds’ advisory and sub-advisory contracts with Invesco Advisers and its affiliates. This review is required by the Investment Company Act of 1940 and focuses on the nature and quality of the services Invesco provides as the adviser to the Invesco funds and the reasonableness of the fees that it charges for those services. Each year, we spend months carefully reviewing information received from Invesco and a variety of independent sources, such as performance and fee data prepared by Lipper, Inc. (a subsidiary of Broadridge Financial Solutions, Inc.), an independent, third-party firm widely recognized as a leader in its field. We also meet with our independent legal counsel and other independent advisers to review and help us assess the information that we have received. Our goal is to assure that you receive quality investment management services for a reasonable fee.
I trust the measures outlined above provide assurance that you have a worthy advocate when it comes to choosing the Invesco Funds.
On behalf of the Board, we look forward to continuing to represent your interests and serving your needs.
Sincerely,

Bruce L. Crockett
Independent Chair
Invesco Funds Board of Trustees
| | |
| 3 | | Invesco Gold & Precious Metals Fund |
Management’s Discussion of Fund Performance
| | | | |
Performance summary | |
For the fiscal year ended April 30, 2020, Class A shares of Invesco Gold & Precious Metals Fund (the Fund), at net asset value (NAV), underperformed the Philadelphia Gold & Silver Index (price only), the Fund’s style-specific benchmark. | |
Your Fund’s long-term performance appears later in this report. | |
Fund vs. Indexes | |
Total returns, April 30, 2019 to April 30, 2020, at net asset value (NAV). Performance shown does not include applicable contingent deferred sales charges (CDSC) or front-end sales charges, which would have reduced performance. | |
| |
Class A Shares | | | 40.84 | % |
| |
Class C Shares | | | 39.76 | |
| |
Class Y Shares | | | 41.35 | |
| |
Investor Class Shares | | | 40.90 | |
| |
Class R6 Shares | | | 41.81 | |
| |
S&P 500 Indexq (Broad Market Index) | | | 0.86 | |
| |
Philadelphia Gold & Silver Index (price only)∎ (Style-Specific Index) | | | 59.75 | |
| |
Lipper Precious Metals Equity Funds Index◆ (Peer Group Index) | | | 51.67 | |
|
Source(s): qRIMES Technologies Corp.; ∎FactSet Research Systems Inc.; ◆Lipper Inc. | |
Market conditions and your Fund
Global equity markets faced volatility in the second and third quarters of 2019, hampered by ongoing US and China trade issues, potential for new tariffs and weakening global economic growth. Disagreement within the UK regarding its withdrawal from the European Union increased uncertainty for the UK and eurozone economies.
Much of 2019 showed slowing manufacturing activity and declining business investment, which was evidence that trade tensions were stifling economic growth across both developed and emerging markets. Global recession concerns caused a sharp equity sell-off in August 2019, as investors crowded into asset classes perceived as safe havens, including US Treasuries and gold.
Third quarter macroeconomic and geopolitical issues mostly abated during the fourth quarter, providing a favorable backdrop for global equity returns. In response to third quarter economic weakness, central banks maintained accommodative policies, with the US Federal Reserve cutting interest rates in October 2019 and the European Central Bank restarting net purchases in its asset purchase program in November. Better economic data and signs of progress in US and China trade talks also supported global equities. The UK’s general election in December delivered a decisive victory to the conservative party, reaffirming the original Brexit vote and the UK’s eventual exit from the European Union.
Global equity markets started 2020 well, buoyed by positive economic data and the phase one signing of the US and China trade deal. However, initial optimism was dampened by the outbreak of the new coronavirus (COVID-19) that swiftly spread from China to other global regions. Global equity markets fell sharply as the human and economic cost of the COVID-19 pandemic mounted. At the same time, oil prices fell sharply as a price
war between Saudi Arabia and Russia threatened to boost supply even as demand was falling. The US bull market came to an abrupt end, while emerging equity markets also fell sharply. As fear of a worldwide recession increased, central banks around the world took aggressive action to support both local markets and the global economy. At the close of the fiscal year, despite the continuing global spread of COVID-19, April saw both equity and credit markets stage a rebound from the severe market shock witnessed in March. In this environment, global equity markets declined for the fiscal year, with developed markets outperforming emerging markets.
During the fiscal year, the Fund’s underperformance relative to the Philadelphia Gold & Silver Index (price only), the Fund’s style-specific benchmark, was driven by a combination of stock selection and market allocation. Specifically, stock selection in and out-of-benchmark exposure to diversified metals and mining equities, as well as stock selection in gold equities, detracted from the Fund’s relative performance. Conversely, the Fund’s underweight exposure to copper equities and lack of exposure to silver equities, areas of relative weakness in the style-specific benchmark, contributed to the Fund’s relative performance.
During the fiscal year, the top individual contributors to the Fund’s performance included Canada-based Barrick Gold and US-based Newmont. Shares of these gold mining companies rose as gold bullion prices increased approximately 32% over the fiscal year.1
Conversely, Turquoise Hill Resources and Glencore were the largest individual detractors from the Fund’s performance for the fiscal year. Shares of Turquoise Hill Resources declined following a development update for the underground project at its Oyu Tolgoi mine. The company communicated a range of potential delays and cost overruns to the project
schedule and budget. While we were disappointed after a site trip completed in September 2019, we believe the market reaction was excessive and the current share price does not reflect the company’s long-term intrinsic value. Our thesis remained unchanged and we believe significant value remains in the Oyu Tolgoi mine, which is expected to generate strong free cash flow. Further, we believe the company will benefit from the eventual electrification of the global vehicle fleet through its exposure to copper. Shares of Glencore declined after the company reported quarterly losses in February 2020. Glencore’s strong liquidity position and resilient business model makes the company well-positioned to navigate the current macroeconomic challenges.
At the close of the fiscal year, relative to the style-specific benchmark, the Fund had exposure to gold bullion ETFs, the diversified metals and mining industry and the precious metals and minerals mining industry – exposure the Fund’s style-specific benchmark lacked. Conversely, the Fund had underweight exposures to silver and copper mining equities relative to the style-specific benchmark.
At the close of the fiscal year, we maintained a constructive outlook for gold and precious metal prices given the historically low interest rate environment and increased geopolitical risks, though we expect further volatility given uncertainty associated with these factors. Based on our marginal cost analysis, at the close of the fiscal year, we saw more upside potential in gold equities than in gold bullion and the Fund’s weighting in gold bullion ETFs remained fairly low. We are comfortable with the Fund’s exposure to base metals through holdings of copper mining equities and diversified metals and mining equities. We have maintained our discipline of selling stocks when they hit our target price and recycling cash proceeds to find new investments. We continue to focus on what we believe to be top-tier companies with good management teams. This has led us to seek better opportunities among the mid-cap and junior miners compared to their large-cap counterparts.
Thank you for your continued investment in Invesco Gold & Precious Metals Fund.
1 Source: Bloomberg
The views and opinions expressed in management’s discussion of Fund performance are those of Invesco Advisers, Inc. These views and opinions are subject to change at any time based on factors such as market and economic conditions. These views and opinions may not be relied upon as investment advice or recommendations, or as an offer for a particular security. The information is not a complete analysis of every aspect of any market, country, industry, security or the Fund. Statements of fact are from sources considered reliable, but Invesco Advisers, Inc. makes no representation or warranty as to their
| | |
| 4 | | Invesco Gold & Precious Metals Fund |
completeness or accuracy. Although historical performance is no guarantee of future results, these insights may help you understand our investment management philosophy.
See important Fund and, if applicable, index disclosures later in this report.
| | |
| 5 | | Invesco Gold & Precious Metals Fund |
Your Fund’s Long-Term Performance
Results of a $10,000 Investment – Oldest Share Class(es)
Fund and index data from 4/30/10

| 1 | Source: RIMES Technologies Corp. |
| 3 | Source: FactSet Research Systems Inc. |
| *It | is Invesco’s policy to chart the Fund’s oldest share class(es). Because Investor Class shares do not have a sales charge, we also show the oldest share class with a sales charge, Class C shares. |
Past performance cannot guarantee future results.
The data shown in the chart include reinvested distributions, applicable sales charges and Fund expenses including management
fees. Index results include reinvested dividends, but they do not reflect sales charges. Performance of the peer group, if applicable, reflects fund expenses and management fees;
performance of a market index does not. Performance shown in the chart does not reflect deduction of taxes a shareholder would pay on Fund distributions or sale of Fund shares.
| | |
| 6 | | Invesco Gold & Precious Metals Fund |
| | | | |
Average Annual Total Returns | |
As of 4/30/20, including maximum applicable sales charges | |
| |
Class A Shares | | | | |
| |
Inception (3/28/02) | | | 5.63 | % |
| |
10 Years | | | -4.25 | |
| |
5 Years | | | 4.29 | |
| |
1 Year | | | 33.24 | |
| |
Class C Shares | | | | |
| |
Inception (2/14/00) | | | 6.89 | % |
| |
10 Years | | | -4.45 | |
| |
5 Years | | | 4.64 | |
| |
1 Year | | | 38.76 | |
| |
Class Y Shares | | | | |
| |
Inception (10/3/08) | | | 1.80 | % |
| |
10 Years | | | -3.48 | |
| |
5 Years | | | 5.74 | |
| |
1 Year | | | 41.35 | |
| |
Investor Class Shares | | | | |
| |
Inception (1/19/84) | | | 0.74 | % |
| |
10 Years | | | -3.72 | |
| |
5 Years | | | 5.48 | |
| |
1 Year | | | 40.90 | |
| |
Class R6 Shares | | | | |
| |
10 Years | | | -3.57 | % |
| |
5 Years | | | 5.79 | |
| |
1 Year | | | 41.81 | |
Class R6 shares incepted on April 4, 2017. Performance shown prior to that date is that of Class A shares and includes the 12b-1 fees applicable to Class A shares.
The performance data quoted represent past performance and cannot guarantee future results; current performance may be lower or higher. Please visit invesco.com/ performance for the most recent month-end performance. Performance figures reflect reinvested distributions, changes in net asset value and the effect of the maximum sales charge unless otherwise stated. Performance figures do not reflect deduction of taxes a shareholder would pay on Fund distributions or sale of Fund shares. Investment return and principal value will fluctuate so that you may have a gain or loss when you sell shares.
Class A share performance reflects the maximum 5.50% sales charge, and Class C share performance reflects the applicable contingent deferred sales charge (CDSC) for the period involved. The CDSC on Class C shares is 1% for the first year after purchase. Class Y, Investor Class and Class R6 shares do not have a front-end sales charge or a CDSC; therefore, performance is at net asset value.
The performance of the Fund’s share classes will differ primarily due to different sales charge structures and class expenses.
Fund performance reflects any applicable fee waivers and/or expense reimbursements.
Had the adviser not waived fees and/or reimbursed expenses currently or in the past, returns would have been lower. See current prospectus for more information.
| | |
| 7 | | Invesco Gold & Precious Metals Fund |
Invesco Gold & Precious Metals Fund’s investment objective is long-term growth of capital.
| ∎ | | Unless otherwise stated, information presented in this report is as of April 30, 2020, and is based on total net assets. |
| ∎ | | Unless otherwise noted, all data provided by Invesco. |
| ∎ | | To access your Fund’s reports/prospectus, visit invesco.com/fundreports. |
About indexes used in this report
| ∎ | | The S&P 500® Index is an unmanaged index considered representative of the US stock market. |
| ∎ | | The Philadelphia Gold & Silver Index (price only) is a capitalization-weighted, price-only index on the Philadelphia Stock Exchange that includes the leading companies involved in mining gold and silver. |
| ∎ | | The Lipper Precious Metals Equity Funds Index is an unmanaged index considered representative of precious metals funds tracked by Lipper. |
| ∎ | | The Fund is not managed to track the performance of any particular index, including the index(es) described here, and consequently, the performance of the Fund may deviate significantly from the performance of the index(es). |
| ∎ | | A direct investment cannot be made in an index. Unless otherwise indicated, index results include reinvested dividends, and they do not reflect sales charges. Performance of the peer group, if applicable, reflects fund expenses; performance of a market index does not. |
Liquidity Risk Management Program
The Securities and Exchange Commission has adopted Rule 22e-4 under the Investment Company Act of 1940 (the “Liquidity Rule”) in order to promote effective liquidity risk management throughout the open-end investment company industry, thereby reducing the risk that funds will be unable to meet their redemption obligations and mitigating dilution of the interests of fund shareholders. The Fund has adopted and implemented a liquidity risk management program in accordance with the Liquidity Rule (the “Program”). The Program is reasonably designed to assess and manage the Fund’s liquidity risk, which is the risk that the Fund could not meet redemption requests without significant dilution of remaining investors’ interests in the Fund. The Board of Trustees of the Fund (the “Board”) has appointed Invesco Advisers, Inc. (“Invesco”), the Fund’s investment adviser, as the Program’s administrator, and Invesco has delegated oversight of the Program to the Liquidity Risk Management Committee (the “Committee”), which is composed of senior representatives from relevant business groups at Invesco.
As required by the Liquidity Rule, the Program includes policies and procedures
providing for an assessment, no less frequently than annually, of the Fund’s liquidity risk that takes into account, as relevant to the Fund’s liquidity risk: (1) the Fund’s investment strategy and liquidity of portfolio investments during both normal and reasonably foreseeable stressed conditions; (2) short-term and long-term cash flow projections for the Fund during both normal and reasonably foreseeable stressed conditions; and (3) the Fund’s holdings of cash and cash equivalents and any borrowing arrangements. The Liquidity Rule also requires the classification of the Fund’s investments into categories that reflect the assessment of their relative liquidity under current market conditions. The Fund classifies its investments into one of four categories defined in the Liquidity Rule: “Highly Liquid,” “Moderately Liquid,” “Less Liquid” and “Illiquid.” Funds that are not invested primarily in “Highly Liquid Investments” that are assets (cash or investments that are reasonably expected to be convertible into cash within three business days without significantly changing the market value of the investment) are required to establish a “Highly Liquid Investment Minimum” (“HLIM”), which is the minimum percentage of net assets that must be invested in Highly Liquid Investments. Funds with HLIMs have procedures for addressing HLIM shortfalls, including reporting to the Board and the SEC (on a non-public basis) as required by the Program and the Liquidity Rule. In addition, the Fund may not acquire an investment if, immediately after the acquisition, over 15% of the Fund’s net assets would consist of “Illiquid Investments” that are assets (an investment that cannot reasonably be expected to be sold or disposed of in current market conditions in seven calendar days or less without the sale or disposition significantly changing the market value of the investment). The Liquidity Rule and the Program also require reporting to the Board and the SEC (on a non-public basis) if a Fund’s holdings of Illiquid Investments exceed 15% of the Fund’s assets.
At a meeting held on March 30-April 1, 2020, the Committee presented a report to the Board that addressed the operation of the Program and assessed the Program’s adequacy and effectiveness of implementation (the “Report”). The Report
|
This report must be accompanied or preceded by a currently effective Fund prospectus, which contains more complete information, including sales charges and expenses. Investors should read it carefully before investing. |
NOT FDIC INSURED | MAY LOSE VALUE | NO BANK GUARANTEE
covered the period from December 1, 2018 through December 31, 2019 (the “Program Reporting Period”).
The Report stated, in relevant part, that during the Program Reporting Period:
| ∎ | | The Program, as adopted and implemented, remained reasonably designed to assess and manage the Fund’s liquidity risk and was operated effectively to achieve that goal; |
| ∎ | | The Fund’s investment strategy remained appropriate for an open-end fund; |
| ∎ | | The Fund was able to meet requests for redemption without significant dilution of remaining investors’ interests in the Fund; |
| ∎ | | The Fund did not breach the 15% limit on Illiquid Investments; and |
| ∎ | | The Fund primarily held Highly Liquid Investments and therefore has not adopted an HLIM. |
| | |
| 8 | | Invesco Gold & Precious Metals Fund |
Fund Information
| | | | | | |
| Portfolio Composition | | | | |
| By industry | | % of total net assets |
| |
Gold | | | 83.21 | % |
Diversified Metals & Mining | | | 5.60 | |
Precious Metals & Minerals | | | 3.87 | |
Exchange-Traded Fund | | | 3.82 | |
Copper | | | 1.75 | |
Money Market Funds Plus Other Assets Less Liabilities | | | 1.75 | |
| |
| Top 10 Equity Holdings* | | | | |
| | |
| | | | | % of total net assets |
| | |
| 1. | | Newmont Corp. | | | 6.80 | % |
| 2. | | Barrick Gold Corp. | | | 6.79 | |
| 3. | | Kinross Gold Corp. | | | 6.47 | |
| 4. | | Franco-Nevada Corp. | | | 5.76 | |
| 5. | | Torex Gold Resources, Inc. | | | 5.47 | |
| 6. | | B2Gold Corp. | | | 5.33 | |
| 7. | | Sandstorm Gold Ltd. | | | 5.11 | |
| 8. | | Wheaton Precious Metals Corp. | | | 5.05 | |
| 9. | | Agnico Eagle Mines Ltd. | | | 4.57 | |
| 10. | | Lundin Gold, Inc. | | | 4.38 | |
The Fund’s holdings are subject to change, and there is no assurance that the Fund will continue to hold any particular security.
* Excluding money market fund holdings, if any.
Data presented here are as of April 30, 2020.
| | |
| 9 | | Invesco Gold & Precious Metals Fund |
Schedule of Investments
April 30, 2020
| | | | | | |
| | | Shares | | | Value |
Common Stocks & Other Equity Interests–98.25% |
Australia–3.53% | | | | | | |
Bellevue Gold Ltd.(a) | | | 3,204,480 | | | $ 1,178,684 |
Cardinal Resources Ltd.(a) | | | 9,329,307 | | | 2,312,304 |
Gold Road Resources Ltd.(a) | | | 2,621,055 | | | 2,657,232 |
New Century Resources Ltd.(a) | | | 2,151,184 | | | 213,832 |
Northern Star Resources Ltd. | | | 255,335 | | | 2,046,807 |
| | | | | | | 8,408,859 |
| | |
Canada–68.90% | | | | | | |
Agnico Eagle Mines Ltd. | | | 185,895 | | | 10,908,319 |
Alamos Gold, Inc., Class A | | | 1,110,335 | | | 8,942,028 |
B2Gold Corp. | | | 2,515,022 | | | 12,720,108 |
Barrick Gold Corp. | | | 629,029 | | | 16,178,626 |
Chesapeake Gold Corp.(a) | | | 632,320 | | | 1,321,923 |
Franco-Nevada Corp. | | | 103,801 | | | 13,733,246 |
INV Metals, Inc.(a) | | | 2,621,042 | | | 659,050 |
Ivanhoe Mines Ltd., Class A(a) | | | 2,596,982 | | | 5,447,888 |
Kinross Gold Corp.(a) | | | 2,337,631 | | | 15,433,621 |
Kirkland Lake Gold Ltd. | | | 106,966 | | | 4,421,728 |
Lundin Gold, Inc.(a) | | | 1,401,515 | | | 10,441,259 |
Osisko Mining, Inc.(a) | | | 1,099,753 | | | 2,765,283 |
Premier Gold Mines Ltd.(a) | | | 3,350,839 | | | 4,164,626 |
Pretium Resources, Inc.(a) | | | 876,136 | | | 6,690,848 |
Progress Minerals, Inc. (Acquired 06/26/2018;
Cost $1,215,733)(a)(b)(c)(d) | | | 6,474,020 | | | 416,733 |
Reunion Gold Corp.(a) | | | 6,496,007 | | | 420,016 |
Roxgold, Inc.(a) | | | 4,198,093 | | | 3,769,975 |
Rubicon Minerals Corp.(a) | | | 2,500,956 | | | 1,925,736 |
Sabina Gold & Silver Corp.(a) | | | 2,666,984 | | | 3,755,371 |
Sandstorm Gold Ltd.(a) | | | 1,568,662 | | | 12,182,360 |
SEMAFO, Inc.(a) | | | 836,150 | | | 2,102,464 |
TMAC Resources, Inc.(a)(b) | | | 775,267 | | | 824,308 |
Torex Gold Resources, Inc.(a) | | | 915,619 | | | 13,030,937 |
Wheaton Precious Metals Corp. | | | 318,865 | | | 12,040,342 |
| | | | | | | 164,296,795 |
| | |
Egypt–1.19% | | | | | | |
Centamin PLC | | | 1,475,800 | | | 2,840,802 |
| | | | | | | | |
| | | Shares | | | Value | |
| |
Ivory Coast–3.46% | | | | | | | | |
Endeavour Mining Corp.(a) | | | 459,022 | | | $ | 8,264,012 | |
| |
| | |
Mexico–2.16% | | | | | | | | |
Fresnillo PLC | | | 573,672 | | | | 5,146,643 | |
| |
| | |
Mongolia–2.24% | | | | | | | | |
Turquoise Hill Resources Ltd.(a) | | | 10,920,565 | | | | 5,334,950 | |
| |
| | |
Switzerland–0.53% | | | | | | | | |
Glencore PLC(a) | | | 687,718 | | | | 1,276,576 | |
| |
| | |
United States–14.49% | | | | | | | | |
Boart Longyear Ltd.(a) | | | 26,944 | | | | 12,320 | |
| |
Boart Longyear Ltd., Wts., expiring 09/13/2024(a) | | | 37,293 | | | | 292 | |
| |
iShares® Gold Trust - ETF(a) | | | 564,600 | | | | 9,095,706 | |
| |
Newmont Corp. | | | 272,727 | | | | 16,221,802 | |
| |
SPDR ® Gold Trust–ETF(a) | | | 58,000 | | | | 9,210,400 | |
| |
| | | | | | | 34,540,520 | |
| |
| | |
Zambia–1.75% | | | | | | | | |
First Quantum Minerals Ltd. | | | 681,904 | | | | 4,164,075 | |
| |
Total Common Stocks & Other Equity Interests
(Cost $214,075,745) | | | | 234,273,232 | |
| |
| | |
Money Market Funds–1.92% | | | | | | | | |
Invesco Government & Agency Portfolio, Institutional Class, 0.20%(d)(e) | | | 1,767,687 | | | | 1,767,687 | |
| |
Invesco Liquid Assets Portfolio, Institutional Class, 0.60%(d)(e) | | | 777,782 | | | | 778,248 | |
| |
Invesco Treasury Portfolio, Institutional Class, 0.10%(d)(e) | | | 2,020,213 | | | | 2,020,213 | |
| |
Total Money Market Funds
(Cost $4,566,110) | | | | 4,566,148 | |
| |
TOTAL INVESTMENTS IN SECURITIES–100.17%
(Cost $218,641,855) | | | | 238,839,380 | |
| |
OTHER ASSETS LESS LIABILITIES–(0.17)% | | | | (403,784 | ) |
| |
NET ASSETS–100.00% | | | $ | 238,435,596 | |
| |
|
Investment Abbreviations: |
|
ETF – Exchange-Traded Fund |
SPDR – Standard & Poor’s Depositary Receipt |
Wts. – Warrants |
See accompanying Notes to Financial Statements which are an integral part of the financial statements.
| | |
| 10 | | Invesco Gold & Precious Metals Fund |
Notes to Schedule of Investments:
| (a) | Non-income producing security. |
| (b) | Security purchased or received in a transaction exempt from registration under the Securities Act of 1933, as amended (the “1933 Act”). The security may be resold pursuant to an exemption from registration under the 1933 Act, typically to qualified institutional buyers. The aggregate value of these securities at April 30, 2020 was $1,241,041, which represented less than 1% of the Fund’s Net Assets. |
| (c) | Security valued using significant unobservable inputs (Level 3). See Note 3. |
| (d) | Affiliated issuer. The issuer is affiliated by having an investment adviser that is under common control of Invesco Ltd. and/or the Investment Company Act of 1940, as amended (the “1940 Act”), defines “affiliated person” to include an issuer of which a fund holds 5% or more of the outstanding voting securities. The Fund has not owned enough of the outstanding voting securities of the issuer to have control (as defined in the 1940 Act) of that issuer. The table below shows the Fund’s transactions in, and earnings from, its investments in affiliates for the fiscal year ended April 30, 2020. |
| | | | | | | | | | | | | | | | | | | | | | | | | | | | | | | | |
| | | | | | | | | Change in | | | | | | |
| | | | | | | | | Unrealized | | | | | | |
| | | Value | | Purchases | | Proceeds | | Appreciation | | Realized | | Value | | Dividend |
| | | April 30, 2019 | | at Cost | | from Sales | | (Depreciation) | | Gain | | April 30, 2020 | | Income |
Investments in Affiliated Money Market Funds: | | | | | | | | | | | | | | | | | | | | | | | | | | | | | | | | |
Invesco Government & Agency Portfolio, Institutional Class | | | $ | 456,375 | | | | $ | 17,681,269 | | | | $ | (16,369,957) | | | | $ | - | | | | $ | - | | | | $ | 1,767,687 | | | $16,720 |
Invesco Liquid Assets Portfolio, Institutional Class | | | | 326,126 | | | | | 12,261,831 | | | | | (11,809,994 | ) | | | | 38 | | | | | 247 | | | | | 778,248 | | | 11,685 |
Invesco Treasury Portfolio, Institutional Class | | | | 521,572 | | | | | 20,207,165 | | | | | (18,708,524 | ) | | | | - | | | | | - | | | | | 2,020,213 | | | 18,569 |
Investments in Other Affiliates: | | | | | | | | | | | | | | | | | | | | | | | | | | | | | | | | |
Progress Minerals, Inc. | | | | 1,208,110 | | | | | - | | | | | - | | | | | (791,377 | ) | | | | - | | | | | 416,733 | | | - |
Total | | | $ | 2,512,183 | | | | $ | 50,150,265 | | | | $ | (46,888,475 | ) | | | $ | (791,339 | ) | | | $ | 247 | | | | $ | 4,982,881 | | | $46,974 |
| (e) | The rate shown is the 7-day SEC standardized yield as of April 30, 2020. |
See accompanying Notes to Financial Statements which are an integral part of the financial statements.
| | |
| 11 | | Invesco Gold & Precious Metals Fund |
Statement of Assets and Liabilities
April 30, 2020
| | | | |
Assets: | | | | |
Investments in securities, at value
(Cost $212,860,012) | | $ | 233,856,499 | |
| |
Investments in affiliates, at value
(Cost $5,781,843) | | | 4,982,881 | |
| |
Foreign currencies, at value (Cost $14,643) | | | 14,587 | |
| |
Receivable for: | | | | |
Fund shares sold | | | 357,791 | |
| |
Dividends | | | 173,505 | |
| |
Investment for trustee deferred compensation and retirement plans | | | 90,365 | |
| |
Other assets | | | 38,970 | |
| |
Total assets | | | 239,514,598 | |
| |
| |
Liabilities: | | | | |
Payable for: | | | | |
Fund shares reacquired | | | 422,477 | |
| |
Accrued fees to affiliates | | | 167,770 | |
| |
Accrued trustees’ and officers’ fees and benefits | | | 220 | |
| |
Accrued other operating expenses | | | 389,071 | |
| |
Trustee deferred compensation and retirement plans | | | 99,464 | |
| |
Total liabilities | | | 1,079,002 | |
| |
Net assets applicable to shares outstanding | | $ | 238,435,596 | |
| |
| |
Net assets consist of: | | | | |
Shares of beneficial interest | | $ | 437,718,007 | |
| |
Distributable earnings (loss) | | | (199,282,411 | ) |
| |
| | $ | 238,435,596 | |
| |
| | | | |
Net Assets: | | | | |
Class A | | $ | 122,664,743 | |
| |
Class C | | $ | 19,732,672 | |
| |
Class Y | | $ | 34,203,635 | |
| |
Investor Class | | $ | 61,558,375 | |
| |
Class R6 | | $ | 276,171 | |
| |
|
Shares outstanding, no par value, with an unlimited number of shares authorized: | |
| |
Class A | | | 26,127,787 | |
| |
Class C | | | 4,248,535 | |
| |
Class Y | | | 7,095,634 | |
| |
Investor Class | | | 13,037,374 | |
| |
Class R6 | | | 56,980 | |
| |
Class A: | | | | |
Net asset value per share | | $ | 4.69 | |
| |
Maximum offering price per share
(Net asset value of $4.69 ÷ 94.50%) | | $ | 4.96 | |
| |
Class C: | | | | |
Net asset value and offering price per share | | $ | 4.64 | |
| |
Class Y: | | | | |
Net asset value and offering price per share | | $ | 4.82 | |
| |
Investor Class: | | | | |
Net asset value and offering price per share | | $ | 4.72 | |
| |
Class R6: | | | | |
Net asset value and offering price per share | | $ | 4.85 | |
| |
See accompanying Notes to Financial Statements which are an integral part of the financial statements.
| | |
| 12 | | Invesco Gold & Precious Metals Fund |
Statement of Operations
For the year ended April 30, 2020
| | | | |
Investment income: | | | | |
Dividends (net of foreign withholding taxes of $98,776) | | $ | 1,003,400 | |
| |
Dividends from affiliates | | | 46,974 | |
| |
Total investment income | | | 1,050,374 | |
| |
| |
Expenses: | | | | |
Advisory fees | | | 1,617,461 | |
| |
Administrative services fees | | | 31,765 | |
| |
Custodian fees | | | 18,772 | |
| |
Distribution fees: | | | | |
Class A | | | 267,657 | |
| |
Class C | | | 168,411 | |
| |
Investor Class | | | 144,936 | |
| |
Transfer agent fees – A, C, Y and Investor | | | 636,740 | |
| |
Transfer agent fees – R6 | | | 188 | |
| |
Trustees’ and officers’ fees and benefits | | | 18,817 | |
| |
Registration and filing fees | | | 64,174 | |
| |
Reports to shareholders | | | 35,419 | |
| |
Professional services fees | | | 51,275 | |
| |
Other | | | 300,980 | |
| |
Total expenses | | | 3,356,595 | |
| |
Less: Fees waived and/or expense offset arrangement(s) | | | (9,782 | ) |
| |
Net expenses | | | 3,346,813 | |
| |
Net investment income (loss) | | | (2,296,439 | ) |
| |
| |
Realized and unrealized gain (loss) from: | | | | |
Net realized gain (loss) from: | | | | |
Investment securities | | | (946,413 | ) |
| |
Foreign currencies | | | (11,609 | ) |
| |
| | | (958,022 | ) |
| |
Change in net unrealized appreciation of: | | | | |
Investment securities | | | 74,574,251 | |
| |
Foreign currencies | | | 1,071 | |
| |
| | | 74,575,322 | |
| |
Net realized and unrealized gain | | | 73,617,300 | |
| |
Net increase in net assets resulting from operations | | $ | 71,320,861 | |
| |
See accompanying Notes to Financial Statements which are an integral part of the financial statements.
| | |
| 13 | | Invesco Gold & Precious Metals Fund |
Statement of Changes in Net Assets
For the years ended April 30, 2020 and 2019
| | | | | | | | |
| | | 2020 | | | 2019 | |
| |
Operations: | | | | | | | | |
Net investment income (loss) | | $ | (2,296,439 | ) | | $ | (1,741,586 | ) |
| |
Net realized gain (loss) | | | (958,022 | ) | | | (11,112,617 | ) |
| |
Change in net unrealized appreciation (depreciation) | | | 74,575,322 | | | | (14,843,386 | ) |
| |
Net increase (decrease) in net assets resulting from operations | | | 71,320,861 | | | | (27,697,589 | ) |
| |
| | |
Share transactions–net: | | | | | | | | |
Class A | | | (4,417,165 | ) | | | (9,719,980 | ) |
| |
Class C | | | (177,085 | ) | | | (7,585,965 | ) |
| |
Class Y | | | (6,469,748 | ) | | | (3,145,358 | ) |
| |
Investor Class | | | (8,576,398 | ) | | | (8,693,917 | ) |
| |
Class R6 | | | 81,368 | | | | (388,489 | ) |
| |
Net increase (decrease) in net assets resulting from share transactions | | | (19,559,028 | ) | | | (29,533,709 | ) |
| |
Net increase (decrease) in net assets | | | 51,761,833 | | | | (57,231,298 | ) |
| |
| | |
Net assets: | | | | | | | | |
Beginning of year | | | 186,673,763 | | | | 243,905,061 | |
| |
End of year | | $ | 238,435,596 | | | $ | 186,673,763 | |
| |
See accompanying Notes to Financial Statements which are an integral part of the financial statements.
| | |
| 14 | | Invesco Gold & Precious Metals Fund |
Financial Highlights
The following schedule presents financial highlights for a share of the Fund outstanding throughout the periods indicated.
| | | | | | | | | | | | | | | | | | | | | | | | | | | | | | | | | | | | | | | | | | | | | | | | | | | | | | | | | | | | |
| | | | | | | | | | | | | | | | | | | Ratio of | | Ratio of | | | | |
| | | | | | | | | | | | | | | | | | | expenses | | expenses | | | | |
| | | | | | | Net gains | | | | | | | | | | | | to average | | to average net | | Ratio of net | | |
| | | | | | | (losses) | | | | | | | | | | | | net assets | | assets without | | investment | | |
| | | Net asset | | Net | | on securities | | | | Dividends | | | | | | | | with fee waivers | | fee waivers | | income | | |
| | | value, | | investment | | (both | | Total from | | from net | | Net asset | | | | Net assets, | | and/or | | and/or | | (loss) | | |
| | | beginning | | income | | realized and | | investment | | investment | | value, end | | Total | | end of period | | expenses | | expenses | | to average | | Portfolio |
| | | of period | | (loss)(a) | | unrealized) | | operations | | income | | of period | | return (b) | | (000’s omitted) | | absorbed | | absorbed | | net assets | | turnover (c) |
Class A | | | | | | | | | | | | | | | | | | | | | | | | | | | | | | | | | | | | | | | | | | | | | | | | | | | | | | | | | | | | |
Year ended 04/30/20 | | | $ | 3.33 | | | | $ | (0.04 | ) | | | $ | 1.40 | | | | $ | 1.36 | | | | $ | – | | | | $ | 4.69 | | | | | 40.84 | % | | | $ | 122,665 | | | | | 1.54 | %(d) | | | | 1.54 | %(d) | | | | (1.05 | )%(d) | | | | 16 | % |
Year ended 04/30/19 | | | | 3.78 | | | | | (0.03 | ) | | | | (0.42 | ) | | | | (0.45 | ) | | | | – | | | | | 3.33 | | | | | (11.90 | ) | | | | 91,266 | | | | | 1.47 | | | | | 1.47 | | | | | (0.82 | ) | | | | 16 | |
Year ended 04/30/18 | | | | 4.16 | | | | | (0.04 | ) | | | | (0.27 | ) | | | | (0.31 | ) | | | | (0.07 | ) | | | | 3.78 | | | | | (7.55 | ) | | | | 113,737 | | | | | 1.43 | | | | | 1.43 | | | | | (1.00 | ) | | | | 20 | |
Year ended 04/30/17 | | | | 5.05 | | | | | (0.05 | ) | | | | (0.46 | ) | | | | (0.51 | ) | | | | (0.38 | ) | | | | 4.16 | | | | | (9.90 | ) | | | | 145,269 | | | | | 1.41 | | | | | 1.42 | | | | | (1.00 | ) | | | | 28 | |
Year ended 04/30/16 | | | | 4.00 | | | | | (0.03 | ) | | | | 1.08 | | | | | 1.05 | | | | | – | | | | | 5.05 | | | | | 26.25 | | | | | 160,494 | | | | | 1.54 | | | | | 1.54 | | | | | (0.90 | ) | | | | 23 | |
Class C | | | | | | | | | | | | | | | | | | | | | | | | | | | | | | | | | | | | | | | | | | | | | | | | | | | | | | | | | | | | |
Year ended 04/30/20 | | | | 3.32 | | | | | (0.07 | ) | | | | 1.39 | | | | | 1.32 | | | | | – | | | | | 4.64 | | | | | 39.76 | | | | | 19,733 | | | | | 2.29 | (d) | | | | 2.29 | (d) | | | | (1.80 | )(d) | | | | 16 | |
Year ended 04/30/19 | | | | 3.79 | | | | | (0.05 | ) | | | | (0.42 | ) | | | | (0.47 | ) | | | | – | | | | | 3.32 | | | | | (12.40 | ) | | | | 14,345 | | | | | 2.22 | | | | | 2.22 | | | | | (1.57 | ) | | | | 16 | |
Year ended 04/30/18 | | | | 4.20 | | | | | (0.07 | ) | | | | (0.29 | ) | | | | (0.36 | ) | | | | (0.05 | ) | | | | 3.79 | | | | | (8.51 | ) | | | | 24,859 | | | | | 2.18 | | | | | 2.18 | | | | | (1.75 | ) | | | | 20 | |
Year ended 04/30/17 | | | | 5.07 | | | | | (0.09 | ) | | | | (0.45 | ) | | | | (0.54 | ) | | | | (0.33 | ) | | | | 4.20 | | | | | (10.53 | ) | | | | 31,563 | | | | | 2.16 | | | | | 2.17 | | | | | (1.75 | ) | | | | 28 | |
Year ended 04/30/16 | | | | 4.05 | | | | | (0.06 | ) | | | | 1.08 | | | | | 1.02 | | | | | – | | | | | 5.07 | | | | | 25.19 | | | | | 36,157 | | | | | 2.29 | | | | | 2.29 | | | | | (1.65 | ) | | | | 23 | |
Class Y | | | | | | | | | | | | | | | | | | | | | | | | | | | | | | | | | | | | | | | | | | | | | | | | | | | | | | | | | | | | |
Year ended 04/30/20 | | | | 3.41 | | | | | (0.03 | ) | | | | 1.44 | | | | | 1.41 | | | | | – | | | | | 4.82 | | | | | 41.35 | | | | | 34,204 | | | | | 1.29 | (d) | | | | 1.29 | (d) | | | | (0.80 | )(d) | | | | 16 | |
Year ended 04/30/19 | | | | 3.86 | | | | | (0.02 | ) | | | | (0.43 | ) | | | | (0.45 | ) | | | | – | | | | | 3.41 | | | | | (11.66 | ) | | | | 30,122 | | | | | 1.22 | | | | | 1.22 | | | | | (0.57 | ) | | | | 16 | |
Year ended 04/30/18 | | | | 4.24 | | | | | (0.03 | ) | | | | (0.28 | ) | | | | (0.31 | ) | | | | (0.07 | ) | | | | 3.86 | | | | | (7.30 | ) | | | | 37,373 | | | | | 1.18 | | | | | 1.18 | | | | | (0.75 | ) | | | | 20 | |
Year ended 04/30/17 | | | | 5.15 | | | | | (0.04 | ) | | | | (0.47 | ) | | | | (0.51 | ) | | | | (0.40 | ) | | | | 4.24 | | | | | (9.75 | ) | | | | 45,797 | | | | | 1.16 | | | | | 1.17 | | | | | (0.75 | ) | | | | 28 | |
Year ended 04/30/16 | | | | 4.07 | | | | | (0.02 | ) | | | | 1.10 | | | | | 1.08 | | | | | – | | | | | 5.15 | | | | | 26.54 | | | | | 42,446 | | | | | 1.29 | | | | | 1.29 | | | | | (0.65 | ) | | | | 23 | |
Investor Class | | | | | | | | | | | | | | | | | | | | | | | | | | | | | | | | | | | | | | | | | | | | | | | | | | | | | | | | | | | | |
Year ended 04/30/20 | | | | 3.35 | | | | | (0.04 | ) | | | | 1.41 | | | | | 1.37 | | | | | – | | | | | 4.72 | | | | | 40.90 | | | | | 61,558 | | | | | 1.54 | (d) | | | | 1.54 | (d) | | | | (1.05 | )(d) | | | | 16 | |
Year ended 04/30/19 | | | | 3.80 | | | | | (0.03 | ) | | | | (0.42 | ) | | | | (0.45 | ) | | | | – | | | | | 3.35 | | | | | (11.84 | ) | | | | 50,815 | | | | | 1.47 | | | | | 1.47 | | | | | (0.82 | ) | | | | 16 | |
Year ended 04/30/18 | | | | 4.19 | | | | | (0.04 | ) | | | | (0.28 | ) | | | | (0.32 | ) | | | | (0.07 | ) | | | | 3.80 | | | | | (7.73 | ) | | | | 67,393 | | | | | 1.43 | | | | | 1.43 | | | | | (1.00 | ) | | | | 20 | |
Year ended 04/30/17 | | | | 5.08 | | | | | (0.05 | ) | | | | (0.46 | ) | | | | (0.51 | ) | | | | (0.38 | ) | | | | 4.19 | | | | | (9.84 | ) | | | | 78,703 | | | | | 1.41 | | | | | 1.42 | | | | | (1.00 | ) | | | | 28 | |
Year ended 04/30/16 | | | | 4.02 | | | | | (0.03 | ) | | | | 1.09 | | | | | 1.06 | | | | | – | | | | | 5.08 | | | | | 26.37 | | | | | 97,678 | | | | | 1.54 | | | | | 1.54 | | | | | (0.90 | ) | | | | 23 | |
Class R6 | | | | | | | | | | | | | | | | | | | | | | | | | | | | | | | | | | | | | | | | | | | | | | | | | | | | | | | | | | | | |
Year ended 04/30/20 | | | | 3.42 | | | | | (0.03 | ) | | | | 1.46 | | | | | 1.43 | | | | | – | | | | | 4.85 | | | | | 41.81 | | | | | 276 | | | | | 1.09 | (d) | | | | 1.09 | (d) | | | | (0.60 | )(d) | | | | 16 | |
Year ended 04/30/19 | | | | 3.86 | | | | | (0.01 | ) | | | | (0.43 | ) | | | | (0.44 | ) | | | | – | | | | | 3.42 | | | | | (11.40 | ) | | | | 126 | | | | | 0.98 | | | | | 0.98 | | | | | (0.33 | ) | | | | 16 | |
Year ended 04/30/18 | | | | 4.25 | | | | | (0.02 | ) | | | | (0.29 | ) | | | | (0.31 | ) | | | | (0.08 | ) | | | | 3.86 | | | | | (7.45 | ) | | | | 543 | | | | | 0.99 | | | | | 0.99 | | | | | (0.56 | ) | | | | 20 | |
Year ended 04/30/17(e) | | | | 4.57 | | | | | (0.00 | ) | | | | (0.32 | ) | | | | (0.32 | ) | | | | – | | | | | 4.25 | | | | | (7.00 | ) | | | | 9 | | | | | 0.97 | (f) | | | | 0.97 | (f) | | | | (0.56 | )(f) | | | | 28 | |
| (a) | Calculated using average shares outstanding. |
| (b) | Includes adjustments in accordance with accounting principles generally accepted in the United States of America and as such, the net asset value for financial reporting purposes and the returns based upon those net asset values may differ from the net asset value and returns for shareholder transactions. Does not include sales charges and is not annualized for periods less than one year, if applicable. |
| (c) | Portfolio turnover is calculated at the fund level and is not annualized for periods less than one year, if applicable. |
| (d) | Ratios are based on average daily net assets (000’s omitted) of $107,063, $16,841, $33,590, $57,975 and $193 for Class A, Class C, Class Y, Investor Class and Class R6 shares, respectively. |
| (e) | Commencement date of April 4, 2017. |
See accompanying Notes to Financial Statements which are an integral part of the financial statements.
| | |
| 15 | | Invesco Gold & Precious Metals Fund |
Notes to Financial Statements
April 30, 2020
NOTE 1–Significant Accounting Policies
Invesco Gold & Precious Metals Fund (the “Fund”) is a series portfolio of AIM Sector Funds (Invesco Sector Funds) (the “Trust”). The Trust is a Delaware statutory trust registered under the Investment Company Act of 1940, as amended (the “1940 Act”), as an open-end series management investment company authorized to issue an unlimited number of shares of beneficial interest. Information presented in these financial statements pertains only to the Fund. Matters affecting the Fund or each class will be voted on exclusively by the shareholders of the Fund or each class.
The Fund’s investment objective is long-term growth of capital.
The Fund currently consists of five different classes of shares: Class A, Class C, Class Y, Investor Class and Class R6. Class Y and Investor Class shares are available only to certain investors. Class A shares are sold with a front-end sales charge unless certain waiver criteria are met. Under certain circumstances, load waived shares may be subject to contingent deferred sales charges (“CDSC”). Class C shares are sold with a CDSC. Class Y, Investor Class and Class R6 shares are sold at net asset value. Class C shares held for ten years after purchase are eligible for automatic conversion into Class A shares of the same Fund (the “Conversion Feature”). The automatic conversion pursuant to the Conversion Feature will generally occur at the end of the month following the tenth anniversary after a purchase of Class C shares.
The Fund is an investment company and accordingly follows the investment company accounting and reporting guidance in accordance with Financial Accounting Standards Board Accounting Standards Codification Topic 946, Financial Services – Investment Companies.
The following is a summary of the significant accounting policies followed by the Fund in the preparation of its financial statements.
| A. | Security Valuations – Securities, including restricted securities, are valued according to the following policy. |
A security listed or traded on an exchange (except convertible securities) is valued at its last sales price or official closing price as of the close of the customary trading session on the exchange where the security is principally traded, or lacking any sales or official closing price on a particular day, the security may be valued at the closing bid price on that day. Securities traded in the over-the-counter market are valued based on prices furnished by independent pricing services or market makers. When such securities are valued by an independent pricing service they may be considered fair valued. Futures contracts are valued at the final settlement price set by an exchange on which they are principally traded. Listed options are valued at the mean between the last bid and asked prices from the exchange on which they are principally traded. Options not listed on an exchange are valued by an independent source at the mean between the last bid and asked prices. For purposes of determining net asset value (“NAV”) per share, futures and option contracts generally are valued 15 minutes after the close of the customary trading session of the New York Stock Exchange (“NYSE”).
Investments in open-end and closed-end registered investment companies that do not trade on an exchange are valued at the end-of-day net asset value per share. Investments in open-end and closed-end registered investment companies that trade on an exchange are valued at the last sales price or official closing price as of the close of the customary trading session on the exchange where the security is principally traded.
Debt obligations (including convertible securities) and unlisted equities are fair valued using an evaluated quote provided by an independent pricing service. Evaluated quotes provided by the pricing service may be determined without exclusive reliance on quoted prices, and may reflect appropriate factors such as institution-size trading in similar groups of securities, developments related to specific securities, dividend rate (for unlisted equities), yield (for debt obligations), quality, type of issue, coupon rate (for debt obligations), maturity (for debt obligations), individual trading characteristics and other market data. Pricing services generally value debt obligations assuming orderly transactions of institutional round lot size, but a fund may hold or transact in the same securities in smaller, odd lot sizes. Odd lots often trade at lower prices than institutional round lots. Debt obligations are subject to interest rate and credit risks. In addition, all debt obligations involve some risk of default with respect to interest and/or principal payments.
Foreign securities’ (including foreign exchange contracts) prices are converted into U.S. dollar amounts using the applicable exchange rates as of the close of the NYSE. If market quotations are available and reliable for foreign exchange-traded equity securities, the securities will be valued at the market quotations. Because trading hours for certain foreign securities end before the close of the NYSE, closing market quotations may become unreliable. If between the time trading ends on a particular security and the close of the customary trading session on the NYSE, events occur that the investment adviser determines are significant and make the closing price unreliable, the Fund may fair value the security. If the event is likely to have affected the closing price of the security, the security will be valued at fair value in good faith using procedures approved by the Board of Trustees. Adjustments to closing prices to reflect fair value may also be based on a screening process of an independent pricing service to indicate the degree of certainty, based on historical data, that the closing price in the principal market where a foreign security trades is not the current value as of the close of the NYSE. Foreign securities’ prices meeting the approved degree of certainty that the price is not reflective of current value will be priced at the indication of fair value from the independent pricing service. Multiple factors may be considered by the independent pricing service in determining adjustments to reflect fair value and may include information relating to sector indices, American Depositary Receipts and domestic and foreign index futures. Foreign securities may have additional risks including exchange rate changes, potential for sharply devalued currencies and high inflation, political and economic upheaval, the relative lack of issuer information, relatively low market liquidity and the potential lack of strict financial and accounting controls and standards.
Securities for which market prices are not provided by any of the above methods may be valued based upon quotes furnished by independent sources. The last bid price may be used to value equity securities. The mean between the last bid and asked prices is used to value debt obligations, including corporate loans.
Securities for which market quotations are not readily available or became unreliable are valued at fair value as determined in good faith by or under the supervision of the Trust’s officers following procedures approved by the Board of Trustees. Issuer specific events, market trends, bid/asked quotes of brokers and information providers and other market data may be reviewed in the course of making a good faith determination of a security’s fair value.
The Fund may invest in securities that are subject to interest rate risk, meaning the risk that the prices will generally fall as interest rates rise and, conversely, the prices will generally rise as interest rates fall. Specific securities differ in their sensitivity to changes in interest rates depending on their individual characteristics. Changes in interest rates may result in increased market volatility, which may affect the value and/or liquidity of certain Fund investments.
Valuations change in response to many factors including the historical and prospective earnings of the issuer, the value of the issuer’s assets, general market conditions which are not specifically related to the particular issuer, such as real or perceived adverse economic conditions, changes in the general outlook for revenues or corporate earnings, changes in interest or currency rates, regional or global instability, natural or environmental disasters, widespread disease or other public health issues, war, acts of terrorism or adverse investor sentiment generally and market liquidity. Because of the inherent uncertainties of valuation, the values reflected in the financial statements may materially differ from the value received upon actual sale of those investments.
| B. | Securities Transactions and Investment Income – Securities transactions are accounted for on a trade date basis. Realized gains or losses on sales are computed on the basis of specific identification of the securities sold. Interest income (net of withholding tax, if any) is recorded on an accrual basis from settlement date. Dividend income (net of withholding tax, if any) is recorded on the ex-dividend date. |
The Fund may periodically participate in litigation related to Fund investments. As such, the Fund may receive proceeds from litigation settlements. Any proceeds received are included in the Statement of Operations as realized gain (loss) for investments no longer held and as unrealized gain (loss) for investments still held.
Brokerage commissions and mark ups are considered transaction costs and are recorded as an increase to the cost basis of securities purchased and/or a reduction of proceeds on a sale of securities. Such transaction costs are included in the determination of net realized and unrealized gain (loss) from investment
| | |
| 16 | | Invesco Gold & Precious Metals Fund |
securities reported in the Statement of Operations and the Statement of Changes in Net Assets and the net realized and unrealized gains (losses) on securities per share in the Financial Highlights. Transaction costs are included in the calculation of the Fund’s net asset value and, accordingly, they reduce the Fund’s total returns. These transaction costs are not considered operating expenses and are not reflected in net investment income reported in the Statement of Operations and the Statement of Changes in Net Assets, or the net investment income per share and the ratios of expenses and net investment income reported in the Financial Highlights, nor are they limited by any expense limitation arrangements between the Fund and the investment adviser.
The Fund allocates income and realized and unrealized capital gains and losses to a class based on the relative net assets of each class.
| C. | Country Determination – For the purposes of making investment selection decisions and presentation in the Schedule of Investments, the investment adviser may determine the country in which an issuer is located and/or credit risk exposure based on various factors. These factors include the laws of the country under which the issuer is organized, where the issuer maintains a principal office, the country in which the issuer derives 50% or more of its total revenues and the country that has the primary market for the issuer’s securities, as well as other criteria. Among the other criteria that may be evaluated for making this determination are the country in which the issuer maintains 50% or more of its assets, the type of security, financial guarantees and enhancements, the nature of the collateral and the sponsor organization. Country of issuer and/or credit risk exposure has been determined to be the United States of America, unless otherwise noted. |
| D. | Distributions – Distributions from net investment income and net realized capital gain, if any, are generally declared and paid annually and recorded on the ex-dividend date. The Fund may elect to treat a portion of the proceeds from redemptions as distributions for federal income tax purposes. |
| E. | Federal Income Taxes – The Fund intends to comply with the requirements of Subchapter M of the Internal Revenue Code of 1986, as amended (the “Internal Revenue Code”), necessary to qualify as a regulated investment company and to distribute substantially all of the Fund’s taxable earnings to shareholders. As such, the Fund will not be subject to federal income taxes on otherwise taxable income (including net realized capital gain) that is distributed to shareholders. Therefore, no provision for federal income taxes is recorded in the financial statements. |
The Fund recognizes the tax benefits of uncertain tax positions only when the position is more likely than not to be sustained. Management has analyzed the Fund’s uncertain tax positions and concluded that no liability for unrecognized tax benefits should be recorded related to uncertain tax positions. Management is not aware of any tax positions for which it is reasonably possible that the total amounts of unrecognized tax benefits will change materially in the next 12 months.
The Fund files tax returns in the U.S. Federal jurisdiction and certain other jurisdictions. Generally, the Fund is subject to examinations by such taxing authorities for up to three years after the filing of the return for the tax period.
| F. | Expenses – Fees provided for under the Rule 12b-1 plan of a particular class of the Fund are charged to the operations of such class. Transfer agency fees and expenses and other shareholder recordkeeping fees and expenses attributable to Class R6 are charged to such class. Transfer agency fees and expenses and other shareholder recordkeeping fees and expenses relating to all other classes are allocated among those classes based on relative net assets. All other expenses are allocated among the classes based on relative net assets. |
| G. | Accounting Estimates – The preparation of financial statements in conformity with accounting principles generally accepted in the United States of America (“GAAP”) requires management to make estimates and assumptions that affect the reported amounts of assets and liabilities at the date of the financial statements and the reported amounts of revenues and expenses during the reporting period including estimates and assumptions related to taxation. Actual results could differ from those estimates by a significant amount. In addition, the Fund monitors for material events or transactions that may occur or become known after the period-end date and before the date the financial statements are released to print. |
| H. | Indemnifications – Under the Trust’s organizational documents, each Trustee, officer, employee or other agent of the Trust is indemnified against certain liabilities that may arise out of the performance of their duties to the Fund. Additionally, in the normal course of business, the Fund enters into contracts, including the Fund’s servicing agreements, that contain a variety of indemnification clauses. The Fund’s maximum exposure under these arrangements is unknown as this would involve future claims that may be made against the Fund that have not yet occurred. The risk of material loss as a result of such indemnification claims is considered remote. |
| I. | Foreign Currency Translations – Foreign currency is valued at the close of the NYSE based on quotations posted by banks and major currency dealers. Portfolio securities and other assets and liabilities denominated in foreign currencies are translated into U.S. dollar amounts at the date of valuation. Purchases and sales of portfolio securities (net of foreign taxes withheld on disposition) and income items denominated in foreign currencies are translated into U.S. dollar amounts on the respective dates of such transactions. The Fund does not separately account for the portion of the results of operations resulting from changes in foreign exchange rates on investments and the fluctuations arising from changes in market prices of securities held. The combined results of changes in foreign exchange rates and the fluctuation of market prices on investments (net of estimated foreign tax withholding) are included with the net realized and unrealized gain or loss from investments in the Statement of Operations. Reported net realized foreign currency gains or losses arise from (1) sales of foreign currencies, (2) currency gains or losses realized between the trade and settlement dates on securities transactions, and (3) the difference between the amounts of dividends, interest, and foreign withholding taxes recorded on the Fund’s books and the U.S. dollar equivalent of the amounts actually received or paid. Net unrealized foreign currency gains and losses arise from changes in the fair values of assets and liabilities, other than investments in securities at fiscal period end, resulting from changes in exchange rates. |
The Fund may invest in foreign securities, which may be subject to foreign taxes on income, gains on investments or currency repatriation, a portion of which may be recoverable. Foreign taxes, if any, are recorded based on the tax regulations and rates that exist in the foreign markets in which the Fund invests and are shown in the Statement of Operations.
| J. | Forward Foreign Currency Contracts – The Fund may engage in foreign currency transactions either on a spot (i.e. for prompt delivery and settlement) basis, or through forward foreign currency contracts, to manage or minimize currency or exchange rate risk. |
The Fund may also enter into forward foreign currency contracts for the purchase or sale of a security denominated in a foreign currency in order to “lock in” the U.S. dollar price of that security, or the Fund may also enter into forward foreign currency contracts that do not provide for physical settlement of the two currencies, but instead are settled by a single cash payment calculated as the difference between the agreed upon exchange rate and the spot rate at settlement based upon an agreed upon notional amount (non-deliverable forwards). The Fund will set aside liquid assets in an amount equal to the daily mark-to-market obligation for forward foreign currency contracts.
A forward foreign currency contract is an obligation between two parties (“Counterparties”) to purchase or sell a specific currency for an agreed-upon price at a future date. The use of forward foreign currency contracts does not eliminate fluctuations in the price of the underlying securities the Fund owns or intends to acquire but establishes a rate of exchange in advance. Fluctuations in the value of these contracts are measured by the difference in the contract date and reporting date exchange rates and are recorded as unrealized appreciation (depreciation) until the contracts are closed. When the contracts are closed, realized gains (losses) are recorded. Realized and unrealized gains (losses) on the contracts are included in the Statement of Operations. The primary risks associated with forward foreign currency contracts include failure of the Counterparty to meet the terms of the contract and the value of the foreign currency changing unfavorably. These risks may be in excess of the amounts reflected in the Statement of Assets and Liabilities.
| K. | Other Risks - The Fund’s investments are concentrated in a comparatively narrow segment of the economy, which may make the Fund more volatile. |
The Fund may invest a large percentage of its assets in a limited number of securities or other instruments, which could negatively affect the value of the Fund. Fluctuations in the price of gold and precious metals may affect the profitability of companies in the gold and precious metals sector. Changes in the political or economic conditions of countries where companies in the gold and precious metals sector are located may have a direct effect on the price of gold and precious metals.
| | |
| 17 | | Invesco Gold & Precious Metals Fund |
NOTE 2–Advisory Fees and Other Fees Paid to Affiliates
The Trust has entered into a master investment advisory agreement with Invesco Advisers, Inc. (the “Adviser” or “Invesco”). Under the terms of the investment advisory agreement, the Fund accrues daily and pays monthly an advisory fee to the Adviser based on the annual rate of the Fund’s average daily net assets as follows:
| | | | |
| Average Daily Net Assets | | Rate | |
First $ 350 million | | | 0.750 | % |
Next $350 million | | | 0.650 | % |
Next $1.3 billion | | | 0.550 | % |
Next $2 billion | | | 0.450 | % |
Next $2 billion | | | 0.400 | % |
Next $2 billion | | | 0.375 | % |
Over $8 billion | | | 0.350 | % |
For the year ended April 30, 2020, the effective advisory fee rate incurred by the Fund was 0.75%.
Under the terms of a master sub-advisory agreement between the Adviser and each of Invesco Asset Management Deutschland GmbH, Invesco Asset Management Limited, Invesco Asset Management (Japan) Limited, Invesco Hong Kong Limited, Invesco Senior Secured Management, Inc. and Invesco Canada Ltd. (collectively, the “Affiliated Sub-Advisers”) the Adviser, not the Fund, will pay 40% of the fees paid to the Adviser to any such Affiliated Sub-Adviser(s) that provide(s) discretionary investment management services to the Fund based on the percentage of assets allocated to such Affiliated Sub-Adviser(s).
The Adviser has contractually agreed, through at least June 30, 2020, to waive advisory fees and/or reimburse expenses of all shares to the extent necessary to limit total annual fund operating expenses after fee waiver and/or expense reimbursement (excluding certain items discussed below) of Class A, Class C, Class Y, Investor Class and Class R6 shares to 2.00%, 2.75%, 1.75%, 2.00% and 1.75%, respectively, of average daily net assets (the “expense limits”). In determining the Adviser’s obligation to waive advisory fees and/or reimburse expenses, the following expenses are not taken into account, and could cause the total annual fund operating expenses after fee waivers and/or expense reimbursement to exceed the numbers reflected above: (1) interest; (2) taxes; (3) dividend expense on short sales; (4) extraordinary or non-routine items, including litigation expenses; and (5) expenses that the Fund has incurred but did not actually pay because of an expense offset arrangement. Unless Invesco continues the fee waiver agreement, it will terminate on June 30, 2020. During its term, the fee waiver agreement cannot be terminated or amended to increase the expense limits or reduce the advisory fee waiver without approval of the Board of Trustees. The Adviser did not waive fees and/or reimburse expenses during the period under these expense limits.
Further, the Adviser has contractually agreed, through at least June 30, 2021, to waive the advisory fee payable by the Fund in an amount equal to 100% of the net advisory fees the Adviser receives from the affiliated money market funds on investments by the Fund of uninvested cash in such affiliated money market funds.
For the year ended April 30, 2020, the Adviser waived advisory fees of $3,385.
The Trust has entered into a master administrative services agreement with Invesco pursuant to which the Fund has agreed to pay Invesco for certain administrative costs incurred in providing accounting services to the Fund. For the year ended April 30, 2020, expenses incurred under the agreement are shown in the Statement of Operations as Administrative services fees. Invesco has entered into a sub-administration agreement whereby State Street Bank and Trust Company (“SSB”) serves as fund accountant and provides certain administrative services to the Fund. Pursuant to a custody agreement with the Trust on behalf of the Fund, SSB also serves as the Fund’s custodian.
The Trust has entered into a transfer agency and service agreement with Invesco Investment Services, Inc. (“IIS”) pursuant to which the Fund has agreed to pay IIS a fee for providing transfer agency and shareholder services to the Fund and reimburse IIS for certain expenses incurred by IIS in the course of providing such services. IIS may make payments to intermediaries that provide omnibus account services, sub-accounting services and/or networking services. All fees payable by IIS to intermediaries that provide omnibus account services or sub-accounting services are charged back to the Fund, subject to certain limitations approved by the Trust’s Board of Trustees. For the year ended April 30, 2020, expenses incurred under the agreement are shown in the Statement of Operations as Transfer agent fees.
The Trust has entered into master distribution agreements with Invesco Distributors, Inc. (“IDI”) to serve as the distributor for the Class A, Class C, Class Y, Investor Class and Class R6 shares of the Fund. The Trust has adopted plans pursuant to Rule 12b-1 under the 1940 Act with respect to the Fund’s Class A, Class C and Investor Class shares (collectively, the “Plans”). The Fund, pursuant to the Plans, pays IDI compensation at the annual rate of 0.25% of the Fund’s average daily net assets of Class A shares, 1.00% of the average daily net assets of Class C shares and 0.25% of the average daily net assets of Investor Class shares. The fees are accrued daily and paid monthly. Of the Plan payments, up to 0.25% of the average daily net assets of each class of shares may be paid to furnish continuing personal shareholder services to customers who purchase and own shares of such classes. Any amounts not paid as a service fee under the Plans would constitute an asset-based sales charge. Rules of the Financial Industry Regulatory Authority (“FINRA”) impose a cap on the total sales charges, including asset-based sales charges, that may be paid by any class of shares of the Fund. For the year ended April 30, 2020, expenses incurred under the Plan are shown in the Statement of Operations as Distribution fees.
Front-end sales commissions and CDSC (collectively, the “sales charges”) are not recorded as expenses of the Fund. Front-end sales commissions are deducted from proceeds from the sales of Fund shares prior to investment in Class A shares of the Fund. CDSC are deducted from redemption proceeds prior to remittance to the shareholder. During the year ended April 30, 2020, IDI advised the Fund that IDI retained $36,971 in front-end sales commissions from the sale of Class A shares and $277 and $2,464 from Class A and Class C shares, respectively, for CDSC imposed upon redemptions by shareholders.
Certain officers and trustees of the Trust are officers and directors of the Adviser, IIS and/or IDI.
NOTE 3–Additional Valuation Information
GAAP defines fair value as the price that would be received to sell an asset or paid to transfer a liability in an orderly transaction between market participants at the measurement date, under current market conditions. GAAP establishes a hierarchy that prioritizes the inputs to valuation methods, giving the highest priority to readily available unadjusted quoted prices in an active market for identical assets (Level 1) and the lowest priority to significant unobservable inputs (Level 3), generally when market prices are not readily available or are unreliable. Based on the valuation inputs, the securities or other investments are tiered into one of three levels. Changes in valuation methods may result in transfers in or out of an investment’s assigned level:
| | |
| Level 1 – | | Prices are determined using quoted prices in an active market for identical assets. |
| Level 2 – | | Prices are determined using other significant observable inputs. Observable inputs are inputs that other market participants may use in pricing a security. These may include quoted prices for similar securities, interest rates, prepayment speeds, credit risk, yield curves, loss severities, default rates, discount rates, volatilities and others. |
| Level 3 – | | Prices are determined using significant unobservable inputs. In situations where quoted prices or observable inputs are unavailable (for example, when there is little or no market activity for an investment at the end of the period), unobservable inputs may be used. Unobservable inputs reflect the Fund’s own assumptions about the factors market participants would use in determining fair value of the securities or instruments and would be based on the best available information. |
| | |
| 18 | | Invesco Gold & Precious Metals Fund |
The following is a summary of the tiered valuation input levels, as of April 30, 2020. The level assigned to the securities valuations may not be an indication of the risk or liquidity associated with investing in those securities. Because of the inherent uncertainties of valuation, the values reflected in the financial statements may materially differ from the value received upon actual sale of those investments.
| | | | | | | | | | | | | | | | | | | | |
| | | Level 1 | | Level 2 | | Level 3 | | Total |
Investments in Securities | | | | | | | | | | | | | | | | | | | | |
Australia | | | $ | 2,312,304 | | | | $ | 6,096,555 | | | | $ | – | | | | $ | 8,408,859 | |
Canada | | | | 163,880,062 | | | | | – | | | | | 416,733 | | | | | 164,296,795 | |
Egypt | | | | – | | | | | 2,840,802 | | | | | – | | | | | 2,840,802 | |
Ivory Coast | | | | 8,264,012 | | | | | – | | | | | – | | | | | 8,264,012 | |
Mexico | | | | – | | | | | 5,146,643 | | | | | – | | | | | 5,146,643 | |
Mongolia | | | | 5,334,950 | | | | | – | | | | | – | | | | | 5,334,950 | |
Switzerland | | | | – | | | | | 1,276,576 | | | | | – | | | | | 1,276,576 | |
United States | | | | 34,528,200 | | | | | 12,320 | | | | | – | | | | | 34,540,520 | |
Zambia | | | | 4,164,075 | | | | | – | | | | | – | | | | | 4,164,075 | |
Money Market Funds | | | | 4,566,148 | | | | | – | | | | | – | | | | | 4,566,148 | |
Total Investments | | | $ | 223,049,751 | | | | $ | 15,372,896 | | | | $ | 416,733 | | | | $ | 238,839,380 | |
NOTE 4–Expense Offset Arrangement(s)
The expense offset arrangement is comprised of transfer agency credits which result from balances in demand deposit accounts used by the transfer agent for clearing shareholder transactions. For the year ended April 30, 2020, the Fund received credits from this arrangement, which resulted in the reduction of the Fund’s total expenses of $6,397.
NOTE 5–Trustees’ and Officers’ Fees and Benefits
Trustees’ and Officers’ Fees and Benefits include amounts accrued by the Fund to pay remuneration to certain Trustees and Officers of the Fund. Trustees have the option to defer compensation payable by the Fund, and Trustees’ and Officers’ Fees and Benefits also include amounts accrued by the Fund to fund such deferred compensation amounts. Those Trustees who defer compensation have the option to select various Invesco Funds in which their deferral accounts shall be deemed to be invested. Finally, certain current Trustees were eligible to participate in a retirement plan that provided for benefits to be paid upon retirement to Trustees over a period of time based on the number of years of service. The Fund may have certain former Trustees who also participate in a retirement plan and receive benefits under such plan. Trustees’ and Officers’ Fees and Benefits include amounts accrued by the Fund to fund such retirement benefits. Obligations under the deferred compensation and retirement plans represent unsecured claims against the general assets of the Fund.
NOTE 6–Cash Balances
The Fund is permitted to temporarily carry a negative or overdrawn balance in its account with SSB, the custodian bank. Such balances, if any at period-end, are shown in the Statement of Assets and Liabilities under the payable caption Amount due custodian. To compensate the custodian bank for such overdrafts, the overdrawn Fund may either (1) leave funds as a compensating balance in the account so the custodian bank can be compensated by earning the additional interest; or (2) compensate by paying the custodian bank at a rate agreed upon by the custodian bank and Invesco, not to exceed the contractually agreed upon rate. The Fund may not purchase additional securities when any borrowings from banks or broker-dealers exceed 5% of the Fund’s total assets, or when any borrowings from an Invesco Fund are outstanding.
NOTE 7–Distributions to Shareholders and Tax Components of Net Assets
Tax Character of Distributions to Shareholders Paid During the Fiscal Years Ended April 30, 2020 and 2019:
| | | | | | | | |
| | |
| | | 2020 | | | 2019 | |
| |
Ordinary income | | | $– | | | | $– | |
| |
| | |
Tax Components of Net Assets at Period-End: | | | | | | | | |
| |
| | | 2020 | |
| |
Undistributed ordinary income | | | $ 9,454,907 | |
| |
Net unrealized appreciation (depreciation) – investments | | | (1,012,668) | |
| |
Net unrealized appreciation - foreign currencies | | | 1,069 | |
| |
Temporary book/tax differences | | | (90,075) | |
| |
Capital loss carryforward | | | (207,635,644) | |
| |
Shares of beneficial interest | | | 437,718,007 | |
| |
Total net assets | | | $ 238,435,596 | |
| |
The difference between book-basis and tax-basis unrealized appreciation (depreciation) is due to differences in the timing of recognition of gains and losses on investments for tax and book purposes. The Fund’s net unrealized appreciation (depreciation) difference is attributable primarily to wash sales and passive foreign investment companies.
The temporary book/tax differences are a result of timing differences between book and tax recognition of income and/or expenses. The Fund’s temporary book/tax differences are the result of the trustee deferral of compensation and retirement plan benefits.
Capital loss carryforward is calculated and reported as of a specific date. Results of transactions and other activity after that date may affect the amount of capital loss carryforward actually available for the Fund to utilize. The ability to utilize capital loss carryforward in the future may be limited under the Internal Revenue Code and related regulations based on the results of future transactions.
| | |
| 19 | | Invesco Gold & Precious Metals Fund |
The Fund has a capital loss carryforward as of April 30, 2020, as follows:
| | | | | | | | | | | | |
| Capital Loss Carryforward* | |
| Expiration | | Short-Term | | | Long-Term | | | Total | |
Not subject to expiration | | $ | 2,565,558 | | | $ | 205,070,086 | | | $ | 207,635,644 | |
| * | Capital loss carryforward is reduced for limitations, if any, to the extent required by the Internal Revenue Code and may be further limited depending upon a variety of factors, including the realization of net unrealized gains or losses as of the date of any reorganization. |
NOTE 8–Investment Transactions
The aggregate amount of investment securities (other than short-term securities, U.S. Treasury obligations and money market funds, if any) purchased and sold by the Fund during the year ended April 30, 2020 was $34,589,203 and $59,473,937, respectively. Cost of investments, including any derivatives, on a tax basis includes the adjustments for financial reporting purposes as of the most recently completed federal income tax reporting period-end.
| | | | |
| Unrealized Appreciation (Depreciation) of Investments on a Tax Basis | |
| |
Aggregate unrealized appreciation of investments | | $ | 43,740,828 | |
| |
Aggregate unrealized (depreciation) of investments | | | (44,753,496 | ) |
| |
Net unrealized appreciation (depreciation) of investments | | $ | (1,012,668 | ) |
| |
Cost of investments for tax purposes is $239,852,048.
NOTE 9–Reclassification of Permanent Differences
Primarily as a result of differing book/tax treatment of passive foreign investment companies, on April 30, 2020, undistributed net investment income (loss) was increased by $8,991,190, undistributed net realized gain (loss) was decreased by $8,697,971 and shares of beneficial interest was decreased by $293,219. This reclassification had no effect on the net assets of the Fund.
NOTE 10–Share Information
| | | | | | | | | | | | | | | | |
| | | Summary of Share Activity | |
| |
| | | Year ended | | | Year ended | |
| | | April 30, 2020(a) | | | April 30, 2019 | |
| | | Shares | | | Amount | | | Shares | | | Amount | |
| |
Sold: | | | | | | | | | | | | | | | | |
Class A | | | 7,951,647 | | | $ | 32,427,270 | | | | 5,324,677 | | | $ | 18,031,730 | |
| |
Class C | | | 1,138,508 | | | | 4,698,178 | | | | 611,475 | | | | 2,096,303 | |
| |
Class Y | | | 2,435,460 | | | | 10,200,630 | | | | 3,860,343 | | | | 13,317,900 | |
| |
Investor Class | | | 1,353,203 | | | | 5,584,570 | | | | 1,434,168 | | | | 4,820,782 | |
| |
Class R6 | | | 24,243 | | | | 98,946 | | | | 40,702 | | | | 150,620 | |
| |
| | | | |
Automatic conversion of Class C shares to Class A shares: | | | | | | | | | | | | | | | | |
Class A | | | 180,083 | | | | 760,395 | | | | 1,024,704 | | | | 3,456,388 | |
| |
Class C | | | (181,301 | ) | | | (760,395 | ) | | | (1,024,817 | ) | | | (3,456,388 | ) |
| |
| | | | |
Reacquired: | | | | | | | | | | | | | | | | |
Class A | | | (9,415,223 | ) | | | (37,604,830 | ) | | | (9,062,490 | ) | | | (31,208,098 | ) |
| |
Class C | | | (1,030,243 | )�� | | | (4,114,868 | ) | | | (1,817,475 | ) | | | (6,225,880 | ) |
| |
Class Y | | | (4,170,562 | ) | | | (16,670,378 | ) | | | (4,714,293 | ) | | | (16,463,258 | ) |
| |
Investor Class | | | (3,485,495 | ) | | | (14,160,968 | ) | | | (4,005,931 | ) | | | (13,514,699 | ) |
| |
Class R6 | | | (4,238 | ) | | | (17,578 | ) | | | (144,275 | ) | | | (539,109 | ) |
| |
Net increase (decrease) in share activity | | | (5,203,918 | ) | | $ | (19,559,028 | ) | | | (8,473,212 | ) | | $ | (29,533,709 | ) |
| |
| (a) | There are entities that are record owners of more than 5% of the outstanding shares of the Fund and in the aggregate own 26% of the outstanding shares of the Fund. IDI has an agreement with these entities to sell Fund shares. The Fund, Invesco and/or Invesco affiliates may make payments to these entities, which are considered to be related to the Fund, for providing services to the Fund, Invesco and/or Invesco affiliates including but not limited to services such as securities brokerage, distribution, third party record keeping and account servicing. The Fund has no knowledge as to whether all or any portion of the shares owned of record by these entities are also owned beneficially. |
NOTE 11–Coronavirus (COVID-19) Pandemic
During the first quarter of 2020, the World Health Organization declared COVID-19 to be a public health emergency. COVID-19 has led to increased short-term market volatility and may have adverse long-term effects on U.S. and world economies and markets in general. COVID-19 may adversely impact the Fund’s ability to achieve its investment objective. Because of the uncertainties on valuation, the global economy and business operations, values reflected in these financial statements may materially differ from the value received upon actual sales of those investments.
The extent of the impact on the performance of the Fund and its investments will depend on future developments, including the duration and spread of the COVID-19 outbreak, related restrictions and advisories, and the effects on the financial markets and economy overall, all of which are highly uncertain and cannot be predicted.
NOTE 12–Subsequent Event
The Board of Trustees of the Fund unanimously approved an Agreement and Plan of Reorganization (the “Agreement”) pursuant to which the Fund would transfer all of its assets and liabilities to Invesco Oppenheimer Gold & Special Minerals Fund (the “Acquiring Fund”).
| | |
| 20 | | Invesco Gold & Precious Metals Fund |
The reorganization consummated on May 15, 2020. Upon closing of the reorganization, shareholders of the Fund received shares of the Acquiring Fund in exchange for their shares of the Fund, and the Fund will liquidate and cease operations.
| | |
| 21 | | Invesco Gold & Precious Metals Fund |
Report of Independent Registered Public Accounting Firm
To the Board of Trustees of AIM Sector Funds (Invesco Sector Funds) and Shareholders of Invesco Gold & Precious Metals Fund
Opinion on the Financial Statements
We have audited the accompanying statement of assets and liabilities, including the schedule of investments, of Invesco Gold & Precious Metals Fund (one of the funds constituting AIM Sector Funds (Invesco Sector Funds), referred to hereafter as the “Fund”) as of April 30, 2020, the related statement of operations for the year ended April 30, 2020, the statement of changes in net assets for each of the two years in the period ended April 30, 2020, including the related notes, and the financial highlights for each of the periods indicated therein (collectively referred to as the “financial statements”). In our opinion, the financial statements present fairly, in all material respects, the financial position of the Fund as of April 30, 2020, the results of its operations for the year then ended, the changes in its net assets for each of the two years in the period ended April 30, 2020 and the financial highlights for each of the periods indicated therein in conformity with accounting principles generally accepted in the United States of America.
Basis for Opinion
These financial statements are the responsibility of the Fund’s management. Our responsibility is to express an opinion on the Fund’s financial statements based on our audits. We are a public accounting firm registered with the Public Company Accounting Oversight Board (United States) (PCAOB) and are required to be independent with respect to the Fund in accordance with the U.S. federal securities laws and the applicable rules and regulations of the Securities and Exchange Commission and the PCAOB.
We conducted our audits of these financial statements in accordance with the standards of the PCAOB. Those standards require that we plan and perform the audit to obtain reasonable assurance about whether the financial statements are free of material misstatement, whether due to error or fraud.
Our audits included performing procedures to assess the risks of material misstatement of the financial statements, whether due to error or fraud, and performing procedures that respond to those risks. Such procedures included examining, on a test basis, evidence regarding the amounts and disclosures in the financial statements. Our audits also included evaluating the accounting principles used and significant estimates made by management, as well as evaluating the overall presentation of the financial statements. Our procedures included confirmation of securities owned as of April 30, 2020 by correspondence with the custodian and transfer agent. We believe that our audits provide a reasonable basis for our opinion.
/s/ PricewaterhouseCoopers LLP
Houston, Texas
June 26, 2020
We have served as the auditor of one or more of the investment companies in the Invesco group of investment companies since at least 1995. We have not been able to determine the specific year we began serving as auditor.
| | |
| 22 | | Invesco Gold & Precious Metals Fund |
Calculating your ongoing Fund expenses
Example
As a shareholder of the Fund, you incur two types of costs: (1) transaction costs, which may include sales charges (loads) on purchase payments or contingent deferred sales charges on redemptions, if any; and (2) ongoing costs, including management fees, distribution and/or service (12b-1) fees, and other Fund expenses. This example is intended to help you understand your ongoing costs (in dollars) of investing in the Fund and to compare these costs with ongoing costs of investing in other mutual funds. The example is based on an investment of $1,000 invested at the beginning of the period and held for the entire period November 1, 2019 through April 30, 2020.
Actual expenses
The table below provides information about actual account values and actual expenses. You may use the information in this table, together with the amount you invested, to estimate the expenses that you paid over the period. Simply divide your account value by $1,000 (for example, an $8,600 account value divided by $1,000 = 8.6), then multiply the result by the number in the table under the heading entitled “Actual Expenses Paid During Period” to estimate the expenses you paid on your account during this period.
Hypothetical example for comparison purposes
The table below also provides information about hypothetical account values and hypothetical expenses based on the Fund’s actual expense ratio and an assumed rate of return of 5% per year before expenses, which is not the Fund’s actual return.
The hypothetical account values and expenses may not be used to estimate the actual ending account balance or expenses you paid for the period. You may use this information to compare the ongoing costs of investing in the Fund and other funds. To do so, compare this 5% hypothetical example with the 5% hypothetical examples that appear in the shareholder reports of the other funds.
Please note that the expenses shown in the table are meant to highlight your ongoing costs only and do not reflect any transaction costs, such as sales charges (loads) on purchase payments or contingent deferred sales charges on redemptions, if any. Therefore, the hypothetical information is useful in comparing ongoing costs only, and will not help you determine the relative total costs of owning different funds. In addition, if these transaction costs were included, your costs would have been higher.
| | | | | | | | | | | | |
| | | | | | | | | HYPOTHETICAL | | |
| | | | | | | | | (5% annual return before | | |
| | | | | ACTUAL | | expenses) | | |
| | | Beginning | | Ending | | Expenses | | Ending | | Expenses | | Annualized |
| | | Account Value | | Account Value | | Paid During | | Account Value | | Paid During | | Expense |
| | | (11/01/19) | | (04/30/20)1 | | Period2 | | (04/30/20) | | Period2 | | Ratio |
Class A | | $1,000.00 | | $1,127.40 | | $8.20 | | $1,017.16 | | $7.77 | | 1.55% |
Class C | | 1,000.00 | | 1,123.50 | | 12.14 | | 1,013.43 | | 11.51 | | 2.30 |
Class Y | | 1,000.00 | | 1,128.80 | | 6.88 | | 1,018.40 | | 6.52 | | 1.30 |
Investor Class | | 1,000.00 | | 1,129.20 | | 8.15 | | 1,017.21 | | 7.72 | | 1.54 |
Class R6 | | 1,000.00 | | 1,133.20 | | 6.10 | | 1,019.14 | | 5.77 | | 1.15 |
| 1 | The actual ending account value is based on the actual total return of the Fund for the period November 1, 2019 through April 30, 2020, after actual expenses and will differ from the hypothetical ending account value which is based on the Fund’s expense ratio and a hypothetical annual return of 5% before expenses. |
| 2 | Expenses are equal to the Fund’s annualized expense ratio as indicated above multiplied by the average account value over the period, multiplied by 182/366 to reflect the most recent fiscal half year. |
| | |
| 23 | | Invesco Gold & Precious Metals Fund |
Trustees and Officers
The address of each trustee and officer is AIM Sector Funds (Invesco Sector Funds) (the “Trust”), 11 Greenway Plaza, Suite 1000, Houston, Texas 77046-1173. The trustees serve for the life of the Trust, subject to their earlier death, incapacitation, resignation, retirement or removal as more specifically provided in the Trust’s organizational documents. Each officer serves for a one year term or until their successors are elected and qualified. Column two below includes length of time served with predecessor entities, if any.
| | | | | | | | |
| | | | | | | Number of | | Other |
| | | Trustee | | | | Funds in | | Directorship(s) |
| Name, Year of Birth and | | and/or | | | | Fund Complex | | Held by Trustee |
| Position(s) | | Officer | | Principal Occupation(s) | | Overseen by | | During Past 5 |
| Held with the Trust | | Since | | During Past 5 Years | | Trustee | | Years |
Interested Trustee | | | | | | | | |
Martin L. Flanagan1 – 1960 Trustee and Vice Chair | | 2007 | | Executive Director, Chief Executive Officer and President, Invesco Ltd. (ultimate parent of Invesco and a global investment management firm); Trustee and Vice Chair, The Invesco Funds; Vice Chair, Investment Company Institute; and Member of Executive Board, SMU Cox School of Business Formerly: Advisor to the Board, Invesco Advisers, Inc. (formerly known as Invesco Institutional (N.A.), Inc.); Chairman and Chief Executive Officer, Invesco Advisers, Inc. (registered investment adviser); Director, Chairman, Chief Executive Officer and President, Invesco Holding Company (US), Inc. (formerly IVZ Inc.) (holding company), Invesco Group Services, Inc. (service provider) and Invesco North American Holdings, Inc. (holding company); Director, Chief Executive Officer and President, Invesco Holding Company Limited (parent of Invesco and a global investment management firm); Director, Invesco Ltd.; Chairman, Investment Company Institute and President, Co-Chief Executive Officer, Co-President, Chief Operating Officer and Chief Financial Officer, Franklin Resources, Inc. (global investment management organization) | | 203 | | None |
| 1 | Mr. Flanagan is considered an interested person (within the meaning of Section 2(a)(19) of the 1940 Act) of the Trust because he is an officer of the Adviser to the Trust, and an officer and a director of Invesco Ltd., ultimate parent of the Adviser. |
| | |
| T-1 | | Invesco Gold & Precious Metals Fund |
Trustees and Officers–(continued)
| | | | | | | | |
| | | | | | | Number of | | |
| | | | | | | Funds | | Other |
| | | Trustee | | | | in | | Directorship(s) |
| Name, Year of Birth and | | and/or | | | | Fund Complex | | Held by Trustee |
| Position(s) | | Officer | | Principal Occupation(s) | | Overseen by | | During Past 5 |
| Held with the Trust | | Since | | During Past 5 Years | | Trustee | | Years |
Independent Trustees | | | | |
Bruce L. Crockett – 1944 Trustee and Chair | | 2003 | | Chairman, Crockett Technologies Associates (technology consulting company) Formerly: Director, Captaris (unified messaging provider); Director, President and Chief Executive Officer, COMSAT Corporation; Chairman, Board of Governors of INTELSAT (international communications company); ACE Limited (insurance company); Independent Directors Council and Investment Company Institute: Member of the Audit Committee, Investment Company Institute; Member of the Executive Committee and Chair of the Governance Committee, Independent Directors Council | | 203 | | Director and Chairman of the Audit Committee, ALPS (Attorneys Liability Protection Society) (insurance company); Director and Member of the Audit Committee and Compensation Committee, Ferroglobe PLC (metallurgical company) |
David C. Arch – 1945 Trustee | | 2010 | | Chairman of Blistex Inc. (consumer health care products manufacturer); Member, World Presidents’ Organization | | 203 | | Board member of the Illinois Manufacturers’ Association |
Beth Ann Brown – 1968 Trustee | | 2019 | | Independent Consultant Formerly: Head of Intermediary Distribution, Managing Director, Strategic Relations, Managing Director, Head of National Accounts, Senior Vice President, National Account Manager and Senior Vice President, Key Account Manager, Columbia Management Investment Advisers LLC; Vice President, Key Account Manager, Liberty Funds Distributor, Inc.; and Trustee of certain Oppenheimer Funds | | 203 | | Director, Board of Directors of Caron Engineering Inc.; Advisor, Board of Advisors of Caron Engineering Inc.; President and Director, Acton Shapleigh Youth Conservation Corps (non-profit); and Vice President and Director of Grahamtastic Connection (non-profit) |
Jack M. Fields – 1952 Trustee | | 2003 | | Chief Executive Officer, Twenty First Century Group, Inc. (government affairs company); and Chairman, Discovery Learning Alliance (non-profit) Formerly: Owner and Chief Executive Officer, Dos Angeles Ranch L.P. (cattle, hunting, corporate entertainment); Director, Insperity, Inc. (formerly known as Administaff) (human resources provider); Chief Executive Officer, Texana Timber LP (sustainable forestry company); Director of Cross Timbers Quail Research Ranch (non-profit); and member of the U.S. House of Representatives | | 203 | | Member, Board of Directors of Baylor College of Medicine |
| | |
| T-2 | | Invesco Gold & Precious Metals Fund |
Trustees and Officers–(continued)
| | | | | | | | |
Name, Year of Birth and Position(s) Held with the Trust | | Trustee and/or Officer Since | | Principal Occupation(s) During Past 5 Years | | Number of
Funds in Fund Complex Overseen by Trustee | | Other Directorship(s) Held by Trustee During Past 5 Years |
Independent Trustees-(continued) | | | | |
Cynthia Hostetler – 1962 Trustee | | 2017 | | Non-Executive Director and Trustee of a number of public and private business corporations Formerly: Director, Aberdeen Investment Funds (4 portfolios); Head of Investment Funds and Private Equity, Overseas Private Investment Corporation; President, First Manhattan Bancorporation, Inc.; Attorney, Simpson Thacher & Bartlett LLP | | 203 | | Vulcan Materials Company (construction materials company); Trilinc Global Impact Fund; Genesee & Wyoming, Inc. (railroads); Artio Global Investment LLC (mutual fund complex); Edgen Group, Inc. (specialized energy and infrastructure products distributor); Investment Company Institute (professional organization); Independent Directors Council (professional organization) |
Eli Jones – 1961 Trustee | | 2016 | | Professor and Dean, Mays Business School - Texas A&M University Formerly: Professor and Dean, Walton College of Business, University of Arkansas and E.J. Ourso College of Business, Louisiana State University; Director, Arvest Bank | | 229 | | Insperity, Inc. (formerly known as Administaff) (human resources provider) |
Elizabeth Krentzman – 1959 Trustee | | 2019 | | Formerly: Principal and Chief Regulatory Advisor for Asset Management Services and U.S. Mutual Fund Leader of Deloitte & Touche LLP; General Counsel of the Investment Company Institute (trade association); National Director of the Investment Management Regulatory Consulting Practice, Principal, Director and Senior Manager of Deloitte & Touche LLP; Assistant Director of the Division of Investment Management - Office of Disclosure and Investment Adviser Regulation of the U.S. Securities and Exchange Commission and various positions with the Division of Investment Management – Office of Regulatory Policy of the U.S. Securities and Exchange Commission; Associate at Ropes & Gray LLP; Advisory Board Member of the Securities and Exchange Commission Historical Society; and Trustee of certain Oppenheimer Funds | | 203 | | Trustee of the University of Florida National Board Foundation and Audit Committee Member; Member of the Cartica Funds Board of Directors (private investment funds); Member of the University of Florida Law Center Association, Inc. Board of Trustees and Audit Committee Member |
Anthony J. LaCava, Jr. – 1956 Trustee | | 2019 | | Formerly: Director and Member of the Audit Committee, Blue Hills Bank (publicly traded financial institution) and Managing Partner, KPMG LLP | | 203 | | Blue Hills Bank; Chairman, Bentley University; Member, Business School Advisory Council; and Nominating Committee KPMG LLP |
| Prema Mathai-Davis – 1950 Trustee | | 2003 | | Retired Co-Owner & Partner of Quantalytics Research, LLC, (a FinTech Investment Research Platform for the Self-Directed Investor) | | 203 | | None |
| | |
| T-3 | | Invesco Gold & Precious Metals Fund |
Trustees and Officers–(continued)
| | | | | | | | |
Name, Year of Birth and Position(s) Held with the Trust | | Trustee and/or Officer Since | | Principal Occupation(s) During Past 5 Years | | Number of Funds in Fund Complex Overseen by Trustee | | Other Directorship(s) Held by Trustee During Past 5 Years |
Independent Trustees-(continued) | | | | |
Joel W. Motley – 1952 Trustee | | 2019 | | Director of Office of Finance, Federal Home Loan Bank System; Member of the Vestry of Trinity Wall Street; Managing Director of Carmona Motley Inc. (privately held financial advisor); Member of the Council on Foreign Relations and its Finance and Budget Committee; Chairman Emeritus of Board of Human Rights Watch and Member of its Investment Committee; and Member of Investment Committee and Board of Historic Hudson Valley (non-profit cultural organization) Formerly: Managing Director of Public Capital Advisors, LLC (privately held financial advisor); Managing Director of Carmona Motley Hoffman, Inc. (privately held financial advisor); Trustee of certain Oppenheimer Funds; and Director of Columbia Equity Financial Corp. (privately held financial advisor) | | 203 | | Member of Board of Greenwall Foundation (bioethics research foundation) and its Investment Committee; Member of Board of Friends of the LRC (non-profit legal advocacy); Board Member and Investment Committee Member of Pulizer Center for Crisis Reporting (non-profit journalism) |
Teresa M. Ressel – 1962 Trustee | | 2017 | | Non-executive director and trustee of a number of public and private business corporations Formerly: Chief Financial Officer, Olayan America, The Olayan Group (international investor/commercial/industrial); Chief Executive Officer, UBS Securities LLC; Group Chief Operating Officer, Americas, UBS AG; Assistant Secretary for Management & Budget and CFO, US Department of the Treasury | | 203 | | Atlantic Power Corporation (power generation company); ON Semiconductor Corp. (semiconductor supplier) |
Ann Barnett Stern – 1957 Trustee | | 2017 | | President and Chief Executive Officer, Houston Endowment Inc. (private philanthropic institution) Formerly: Executive Vice President and General Counsel, Texas Children’s Hospital; Attorney, Beck, Redden and Secrest, LLP; Business Law Instructor, University of St. Thomas; Attorney, Andrews & Kurth LLP | | 203 | | Federal Reserve Bank of Dallas |
Robert C. Troccoli – 1949 Trustee | | 2016 | | Retired Formerly: Adjunct Professor, University of Denver – Daniels College of Business; Senior Partner, KPMG LLP | | 203 | | None |
Daniel S. Vandivort –1954 Trustee | | 2019 | | Treasurer, Chairman of the Audit and Finance Committee, and Trustee, Board of Trustees, Huntington Disease Foundation of America; and President, Flyway Advisory Services LLC (consulting and property management) Formerly: Trustee and Governance Chair, of certain Oppenheimer Funds | | 203 | | Chairman and Lead Independent Director, Chairman of the Audit Committee, and Director, Board of Directors, Value Line Funds |
James D. Vaughn – 1945 Trustee | | 2019 | | Retired Formerly: Managing Partner, Deloitte & Touche LLP; Trustee and Chairman of the Audit Committee, Schroder Funds; Board Member, Mile High United Way, Boys and Girls Clubs, Boy Scouts, Colorado Business Committee for the Arts, Economic Club of Colorado and Metro Denver Network (economic development corporation); and Trustee of certain Oppenheimer Funds | | 203 | | Board member and Chairman of Audit Committee of AMG National Trust Bank; Trustee and Investment Committee member, University of South Dakota Foundation; Board member, Audit Committee Member and past Board Chair, Junior Achievement (non-profit) |
Christopher L. Wilson - 1957 Trustee, Vice Chair and Chair Designate | | 2017 | | Retired Formerly: Director, TD Asset Management USA Inc. (mutual fund complex) (22 portfolios); Managing Partner, CT2, LLC (investing and consulting firm); President/Chief Executive Officer, Columbia Funds, Bank of America Corporation; President/Chief Executive Officer, CDC IXIS Asset Management Services, Inc.; Principal & Director of Operations, Scudder Funds, Scudder, Stevens & Clark, Inc.; Assistant Vice President, Fidelity Investments | | 203 | | ISO New England, Inc. (non-profit organization managing regional electricity market) |
| | |
| T-4 | | Invesco Gold & Precious Metals Fund |
Trustees and Officers–(continued)
| | | | | | | | |
Name, Year of Birth and Position(s) Held with the Trust | | Trustee and/or Officer Since | | Principal Occupation(s) During Past 5 Years | | Number of Funds in Fund Complex Overseen by Trustee | | Other Directorship(s) Held by Trustee During Past 5 Years |
Officers | | | | | | | | |
Sheri Morris – 1964 President, Principal Executive Officer and Treasurer | | 2003 | | Head of Global Fund Services, Invesco Ltd.; President, Principal Executive Officer and Treasurer, The Invesco Funds; Vice President, Invesco Advisers, Inc. (formerly known as Invesco Institutional (N.A.), Inc.) (registered investment adviser); and Vice President, Invesco Exchange-Traded Fund Trust, Invesco Exchange-Traded Fund Trust II, Invesco India Exchange-Traded Fund Trust, Invesco Actively Managed Exchange-Traded Fund Trust, Invesco Actively Managed Exchange-Traded Commodity Fund Trust and Invesco Exchange-Traded Self-Indexed Fund Trust; and Vice President, OppenheimerFunds, Inc. Formerly: Vice President and Principal Financial Officer, The Invesco Funds; Vice President, Invesco AIM Advisers, Inc., Invesco AIM Capital Management, Inc. and Invesco AIM Private Asset Management, Inc.; Assistant Vice President and Assistant Treasurer, The Invesco Funds and Assistant Vice President, Invesco Advisers, Inc., Invesco AIM Capital Management, Inc. and Invesco AIM Private Asset Management, Inc.; and Treasurer, Invesco Exchange-Traded Fund Trust, Invesco Exchange-Traded Fund Trust II, Invesco India Exchange-Traded Fund Trust and Invesco Actively Managed Exchange-Traded Fund Trust | | N/A | | N/A |
Russell C. Burk – 1958 Senior Vice President and Senior Officer | | 2005 | | Senior Vice President and Senior Officer, The Invesco Funds | | N/A | | N/A |
Jeffrey H. Kupor – 1968 Senior Vice President, Chief Legal Officer and Secretary | | 2018 | | Head of Legal of the Americas, Invesco Ltd.; Senior Vice President and Secretary, Invesco Advisers, Inc. (formerly known as Invesco Institutional (N.A.), Inc.) (registered investment adviser); Senior Vice President and Secretary, Invesco Distributors, Inc. (formerly known as Invesco AIM Distributors, Inc.); Vice President and Secretary, Invesco Investment Services, Inc. (formerly known as Invesco AIM Investment Services, Inc.) Senior Vice President, Chief Legal Officer and Secretary, The Invesco Funds; Secretary and General Counsel, Invesco Investment Advisers LLC (formerly known as Van Kampen Asset Management); Secretary and General Counsel, Invesco Capital Markets, Inc. (formerly known as Van Kampen Funds Inc.) and Chief Legal Officer, Invesco Exchange-Traded Fund Trust, Invesco Exchange-Traded Fund Trust II, Invesco India Exchange-Traded Fund Trust, Invesco Actively Managed Exchange-Traded Fund Trust, Invesco Actively Managed Exchange-Traded Commodity Fund Trust and Invesco Exchange-Traded Self-Indexed Fund Trust; Secretary, Invesco Indexing LLC; Secretary, W.L. Ross & Co., LLC Formerly: Secretary and Vice President, Jemstep, Inc.; Head of Legal, Worldwide Institutional, Invesco Ltd.; Secretary and General Counsel, INVESCO Private Capital Investments, Inc.; Senior Vice President, Secretary and General Counsel, Invesco Management Group, Inc. (formerly known as Invesco AIM Management Group, Inc.); Assistant Secretary, INVESCO Asset Management (Bermuda) Ltd.; Secretary and General Counsel, Invesco Private Capital, Inc.; Assistant Secretary and General Counsel, INVESCO Realty, Inc.; Secretary and General Counsel, Invesco Senior Secured Management, Inc.; and Secretary, Sovereign G./P. Holdings Inc. | | N/A | | N/A |
Andrew R. Schlossberg – 1974 Senior Vice President | | 2019 | | Head of the Americas and Senior Managing Director, Invesco Ltd.; Director and Senior Vice President, Invesco Advisers, Inc. (formerly known as Invesco Institutional (N.A.), Inc.) (registered investment adviser); Director and Chairman, Invesco Investment Services, Inc. (formerly known as Invesco AIM Investment Services, Inc.) (registered transfer agent); Senior Vice President, The Invesco Funds; Director, Invesco Investment Advisers LLC (formerly known as Van Kampen Asset Management); Director, President and Chairman, Invesco Insurance Agency, Inc. Formerly: Director, Invesco UK Limited; Director and Chief Executive, Invesco Asset Management Limited and Invesco Fund Managers Limited; Assistant Vice President, The Invesco Funds; Senior Vice President, Invesco Advisers, Inc. (formerly known as Invesco Institutional (N.A.), Inc.) (registered investment adviser); Director and Chief Executive, Invesco Administration Services Limited and Invesco Global Investment Funds Limited; Director, Invesco Distributors, Inc.; Head of EMEA, Invesco Ltd.; President, Invesco Actively Managed Exchange-Traded Commodity Fund Trust, Invesco Actively Managed Exchange-Traded Fund Trust, Invesco Exchange-Traded Fund Trust, Invesco Exchange-Traded Fund Trust II and Invesco India Exchange-Traded Fund Trust; Managing Director and Principal Executive Officer, Invesco Capital Management LLC | | N/A | | N/A |
| | |
| T-5 | | Invesco Gold & Precious Metals Fund |
Trustees and Officers–(continued)
| | | | | | | | |
Name, Year of Birth and Position(s) Held with the Trust | | Trustee and/or Officer Since | | Principal Occupation(s) During Past 5 Years | | Number of Funds in Fund Complex Overseen by Trustee | | Other Directorship(s) Held by Trustee During Past 5 Years |
Officers-(continued) | | | | | | | | |
John M. Zerr – 1962 Senior Vice President | | 2006 | | Chief Operating Officer of the Americas; Senior Vice President, Invesco Advisers, Inc. (formerly known as Invesco Institutional (N.A.), Inc.) (registered investment adviser); Senior Vice President, Invesco Distributors, Inc. (formerly known as Invesco AIM Distributors, Inc.); Director and Vice President, Invesco Investment Services, Inc. (formerly known as Invesco AIM Investment Services, Inc.) Senior Vice President, The Invesco Funds; Managing Director, Invesco Capital Management LLC; Director, Invesco Investment Advisers LLC (formerly known as Van Kampen Asset Management); Senior Vice President, Invesco Capital Markets, Inc. (formerly known as Van Kampen Funds Inc.); Manager, Invesco Indexing LLC; Manager, Invesco Specialized Products, LLC; Director and Senior Vice President, Invesco Insurance Agency, Inc.; Member, Invesco Canada Funds Advisory Board; Director, President and Chief Executive Officer, Invesco Corporate Class Inc. (corporate mutual fund company); and Director, Chairman, President and Chief Executive Officer, Invesco Canada Ltd. (formerly known as Invesco Trimark Ltd./Invesco Trimark Ltèe) (registered investment adviser and registered transfer agent); President, Invesco, Inc.; President, Invesco Global Direct Real Estate Feeder GP Ltd.; President, Invesco IP Holdings(Canada) Ltd; President, Invesco Global Direct Real Estate GP Ltd.; President, Invesco Financial Services Ltd. / Services Financiers Invesco Ltée; and President, Trimark Investments Ltd./Placements Trimark Ltée Formerly: Director and Senior Vice President, Invesco Management Group, Inc. (formerly known as Invesco AIM Management Group, Inc.); Secretary and General Counsel, Invesco Management Group, Inc. (formerly known as Invesco AIM Management Group, Inc.); Secretary, Invesco Investment Services, Inc. (formerly known as Invesco AIM Investment Services, Inc.); Chief Legal Officer and Secretary, The Invesco Funds; Secretary and General Counsel, Invesco Investment Advisers LLC (formerly known as Van Kampen Asset Management); Secretary and General Counsel, Invesco Capital Markets, Inc. (formerly known as Van Kampen Funds Inc.); Chief Legal Officer, Invesco Exchange-Traded Fund Trust, Invesco Exchange-Traded Fund Trust II, Invesco India Exchange-Traded Fund Trust, Invesco Actively Managed Exchange-Traded Fund Trust, Invesco Actively Managed Exchange-Traded Commodity Fund Trust and Invesco Exchange-Traded Self-Indexed Fund Trust; Secretary, Invesco Indexing LLC; Director, Secretary, General Counsel and Senior Vice President, Van Kampen Exchange Corp.; Director, Vice President and Secretary, IVZ Distributors, Inc. (formerly known as INVESCO Distributors, Inc.); Director and Vice President, INVESCO Funds Group, Inc.; Director and Vice President, Van Kampen Advisors Inc.; Director, Vice President, Secretary and General Counsel, Van Kampen Investor Services Inc.; Director and Secretary, Invesco Distributors, Inc. (formerly known as Invesco AIM Distributors, Inc.); Director, Senior Vice President, General Counsel and Secretary, Invesco AIM Advisers, Inc. and Van Kampen Investments Inc.; Director, Vice President and Secretary, Fund Management Company; Director, Senior Vice President, Secretary, General Counsel and Vice President, Invesco AIM Capital Management, Inc.; Chief Operating Officer and General Counsel, Liberty Ridge Capital, Inc. (an investment adviser) | | N/A | | N/A |
Gregory G. McGreevey – 1962 Senior Vice President | | 2012 | | Senior Managing Director, Invesco Ltd.; Director, Chairman, President, and Chief Executive Officer, Invesco Advisers, Inc. (formerly known as Invesco Institutional (N.A.), Inc.) (registered investment adviser); Director, Invesco Mortgage Capital, Inc. and Invesco Senior Secured Management, Inc.; and Senior Vice President, The Invesco Funds; and President, SNW Asset Management Corporation and Invesco Managed Accounts, LLC Formerly: Senior Vice President, Invesco Management Group, Inc. and Invesco Advisers, Inc.; Assistant Vice President, The Invesco Funds | | N/A | | N/A |
Kelli Gallegos – 1970 Vice President, Principal Financial Officer and Assistant Treasurer | | 2008 | | Principal Financial and Accounting Officer – Investments Pool, Invesco Specialized Products, LLC; Vice President, Principal Financial Officer and Assistant Treasurer, The Invesco Funds; Principal Financial and Accounting Officer – Pooled Investments, Invesco Capital Management LLC; Vice President and Treasurer, Invesco Exchange-Traded Fund Trust, Invesco Exchange-Traded Fund Trust II, Invesco India Exchange-Traded Fund Trust, Invesco Actively Managed Exchange-Traded Fund Trust, Invesco Actively Managed Exchange-Traded Commodity Fund Trust and Invesco Exchange-Traded Self-Indexed Fund Trust; Vice President, Invesco Advisers, Inc. Formerly: Assistant Treasurer, Invesco Specialized Products, LLC; Assistant Treasurer, Invesco Exchange-Traded Fund Trust, Invesco Exchange-Traded Fund Trust II, Invesco India Exchange-Traded Fund Trust, Invesco Actively Managed Exchange-Traded Fund Trust, Invesco Actively Managed Exchange-Traded Commodity Fund Trust and Invesco Exchange-Traded Self-Indexed Fund Trust; Assistant Treasurer, Invesco Capital Management LLC; Assistant Vice President, The Invesco Funds | | N/A | | N/A |
| | |
| T-6 | | Invesco Gold & Precious Metals Fund |
Trustees and Officers–(continued)
| | | | | | | | |
Name, Year of Birth and Position(s) Held with the Trust | | Trustee and/or Officer Since | | Principal Occupation(s) During Past 5 Years | | Number of Funds in Fund Complex Overseen by Trustee | | Other Directorship(s) Held by Trustee During Past 5 Years |
Officers-(continued) | | | | | | | | |
Crissie M. Wisdom – 1969 Anti-Money Laundering Compliance Officer | | 2013 | | Anti-Money Laundering and OFAC Compliance Officer for Invesco U.S. entities including: Invesco Advisers, Inc. and its affiliates, Invesco Capital Markets, Inc., Invesco Distributors, Inc., Invesco Investment Services, Inc., The Invesco Funds, Invesco Capital Management, LLC, Invesco Trust Company; OppenheimerFunds Distributor, Inc., and Fraud Prevention Manager for Invesco Investment Services, Inc. | | N/A | | N/A |
Todd F. Kuehl – 1969 Chief Compliance Officer | | 2020 | | Chief Compliance Officer, Invesco Advisers, Inc. (registered investment adviser); and Chief Compliance Officer, The Invesco Funds Formerly: Managing Director and Chief Compliance Officer, Legg Mason (Mutual Funds); Chief Compliance Officer, Legg Mason Private Portfolio Group (registered investment adviser) | | N/A | | N/A |
The Statement of Additional Information of the Trust includes additional information about the Fund’s Trustees and is available upon request, without charge, by calling 1.800.959.4246. Please refer to the Fund’s Statement of Additional Information for information on the Fund’s sub-advisers.
| | | | | | |
| Office of the Fund | | Investment Adviser | | Distributor | | Auditors |
| 11 Greenway Plaza, Suite 1000 | | Invesco Advisers, Inc. | | Invesco Distributors, Inc. | | PricewaterhouseCoopers LLP |
| Houston, TX 77046-1173 | | 1555 Peachtree Street, N.E. | | 11 Greenway Plaza, Suite 1000 | | 1000 Louisiana Street, Suite 5800 |
| | Atlanta, GA 30309 | | Houston, TX 77046-1173 | | Houston, TX 77002-5678 |
| | | |
| Counsel to the Fund | | Counsel to the Independent Trustees | | Transfer Agent | | Custodian |
| Stradley Ronon Stevens & Young, LLP | | Goodwin Procter LLP | | Invesco Investment Services, Inc. | | State Street Bank and Trust Company |
| 2005 Market Street, Suite 2600 | | 901 New York Avenue, N.W. | | 11 Greenway Plaza, Suite 1000 | | 225 Franklin Street |
| Philadelphia, PA 19103-7018 | | Washington, D.C. 20001 | | Houston, TX 77046-1173 | | Boston, MA 02110-2801 |
| | |
| T-7 | | Invesco Gold & Precious Metals Fund |
(This page intentionally left blank)

Go paperless with eDelivery
Visit invesco.com/edelivery to enjoy the convenience and security of anytime electronic access to your investment documents.
With eDelivery, you can elect to have any or all of the following materials delivered straight to your inbox to download, save and print from your own computer:
| ∎ | | Fund reports and prospectuses |
Invesco mailing information
Send general correspondence to Invesco Investment Services, Inc., P.O. Box 219078, Kansas City, MO 64121-9078.
Important notice regarding delivery of security holder documents
To reduce Fund expenses, only one copy of most shareholder documents may be mailed to shareholders with multiple accounts at the same address (Householding). Mailing of your shareholder documents may be householded indefinitely unless you instruct us otherwise. If you do not want the mailing of these documents to be combined with those for other members of your household, please contact Invesco Investment Services, Inc. at 800 959 4246 or contact your financial institution. We will begin sending you individual copies for each account within 30 days after receiving your request.
Fund holdings and proxy voting information
| | |
| The Fund provides a complete list of its holdings four times in each fiscal year, at the quarter-ends. For the second and fourth quarters, the list appears in the Fund’s semiannual and annual reports to shareholders. For the first and third quarters, the Fund files the lists with the Securities and Exchange Commission (SEC) as an exhibit to its reports on Form N-PORT. The most recent list of portfolio holdings is available at invesco.com/completeqtrholdings. Shareholders can also look up the Fund’s Form N-PORT filings on the SEC website, sec.gov. The SEC file numbers for the Fund are shown below. |
A description of the policies and procedures that the Fund uses to determine how to vote proxies relating to portfolio securities is available without charge, upon request, from our Client Services department at 800 959 4246, or at invesco.com/proxyguidelines. The information is also available on the SEC website, sec.gov. |
Information regarding how the Fund voted proxies related to its portfolio securities during the most recent 12-month period ended June 30 is available at invesco.com/proxysearch. This information is also available on the SEC website, sec.gov. | |  |
Invesco Advisers, Inc. is an investment adviser; it provides investment advisory services to individual and institutional clients and does not sell securities. Invesco Distributors, Inc. is the US distributor for Invesco Ltd.’s retail mutual funds, exchange-traded funds and institutional money market funds. Both are wholly owned, indirect subsidiaries of Invesco Ltd. |
| | | | |
| SEC file numbers: 811-03826 and 002-85905 | | Invesco Distributors, Inc. | | I-GPM-AR-1 |
| | | | |
| | |
 | | Annual Report to Shareholders | | April 30, 2020 |
| | |
| | Invesco Small Cap Value Fund |
| | Nasdaq: |
| | A: VSCAX ∎ C: VSMCX ∎ R: VSRAX ∎ Y: VSMIX ∎ R6: SMVSX |

|
| Beginning on January 1, 2021, as permitted by regulations adopted by the Securities and Exchange Commission, paper copies of the Fund’s shareholder reports will no longer be sent by mail, unless you specifically request paper copies of the reports from the Fund or from your financial intermediary, such as a broker-dealer or bank. Instead, the reports will be made available on the Fund’s website, and you will be notified by mail each time a report is posted and provided with a website link to access the report. |
|
| If you already elected to receive shareholder reports electronically, you will not be affected by this change and you need not take any action. You may elect to receive shareholder reports and other communications from the Fund electronically by contacting your financial intermediary (such as a broker-dealer or bank) or, if you are a direct investor, by enrolling at invesco.com/edelivery. |
|
| You may elect to receive all future reports in paper free of charge. If you invest through a financial intermediary, you can contact your financial intermediary to request that you continue to receive paper copies of your shareholder reports. If you invest directly with the Fund, you can call (800) 959-4246 to let the Fund know you wish to continue receiving paper copies of your shareholder reports. Your election to receive reports in paper will apply to all funds held with your financial intermediary or all funds held with the fund complex if you invest directly with the Fund. |
Letters to Shareholders
| | |

Andrew Schlossberg | | Dear Shareholders: |
| | This annual report includes information about your Fund, including performance data and a complete list of its investments as of the close of the reporting period. Inside is a discussion of how your Fund was managed and the factors that affected its performance during the reporting period. |
| | Global equities and fixed-income securities faced a tumultuous environment during the reporting period. This was particularly true in the later stages of the period as a pandemic gripped the world and unsettled markets. At the onset of the reporting period, global equity markets were buoyed by a more accommodative stance from central banks. Despite US-China trade concerns and signs of slowing global growth, which led to some market volatility along the way, the second and third quarters of 2019 were relatively calm. In the final months of 2019, better-than-expected third quarter corporate earnings and initial agreement of the phase one US-China trade deal provided a favorable backdrop for equities and impressive fourth quarter global equity returns. |
The first quarter of 2020 proved to be a wild roller-coaster ride as the year began with US investors treated to equity gains culminating in record highs on February 19, 2020. The first half of the quarter, however, belied the impact the coronavirus (COVID-19) would have on markets in a world faced with shuttered businesses and global lockdowns. Equity markets began to sell off in late February and plummeted in March. The speed and depth of market declines and reversals during the month made March 2020 one of the most volatile months on record. While equities languished, government bonds largely performed as expected as central banks cut interest rates, which lowered bond yields but sent bond prices soaring. Like equities, however, corporate bond prices fell due to the impact of diminished corporate profits. Commodity prices, sans gold, largely declined during the first quarter. Oil prices suffered steep declines losing more than half their value in March amid a demand slump due to both COVID-19 and a supply glut from the Russia-Saudi Arabi oil-price war. |
In response to the financial and economic hardships caused by the pandemic, central banks and governments around the world responded with fiscal and monetary stimulus. The US Federal Reserve cut interest rates to near zero (0.00-0.25%) and announced an unprecedented quantitative easing program. The US administration also passed a $2.2 trillion economic-relief package – the largest in US history. Most major economies outside of the US provided liquidity in the bond and equity markets in the form of fiscal policy and quantitative easing. |
Massive global fiscal and monetary responses prompted a significant market rebound in April, with the S&P 500 Index recording one of its best monthly performances ever, despite macroeconomic data that illustrated the enormous economic cost of the shutdowns – more than 30 million US workers have lost their jobs and the US economy contracted at a 5.0% annualized rate (second estimate) for the first quarter of 2020. The final month of the reporting period also proved less volatile than March as markets attempted to normalize. As markets and investors attempt to adapt to a new normal, we’ll see how the interplay of interest rates, economic data, geopolitics and a host of other factors affect US and overseas equity and fixed income markets. |
Investor uncertainty and market volatility, such as we witnessed during the reporting period, are unfortunate facts of life when it comes to investing. That’s why Invesco encourages investors to work with a professional financial adviser who can stress the importance of starting to save and invest early and the importance of adhering to a disciplined investment plan. A financial adviser who knows your unique financial situation, investment goals and risk tolerance can be an invaluable partner as you seek to achieve your financial goals. Financial advisers can also offer a long-term perspective when markets are volatile and time-tested advice and guidance when your financial situation or investment goals change. |
|
| Visit our website for more information on your investments |
| Our website, invesco.com/us, offers a wide range of market insights and investment perspectives. On the website, you’ll find detailed information about our funds, including performance, holdings and portfolio manager commentaries. You can access information about your account by completing a simple, secure online registration. To do so, select “Log In” on the right side of the homepage, and then select “Register for Individual Account Access.” |
In addition to the resources accessible on our website and through our mobile app, you can obtain timely updates to help you stay informed about the markets and the economy by connecting with Invesco on Twitter, LinkedIn or Facebook. You can access our blog at blog.invesco.us.com. Our goal is to provide you the information you want, when and where you want it. Finally, I’m pleased to share with you Invesco’s commitment to both the Principles for Responsible Investment and to considering environmental, social and governance issues in our robust investment process. I invite you to learn more at invesco.com/esg. |
|
| Have questions? |
| For questions about your account, contact an Invesco client services representative at 800 959 4246. |
All of us at Invesco look forward to serving your investment management needs. Thank you for investing with us. |
|
Sincerely, |

Andrew Schlossberg
Head of the Americas,
Senior Managing Director, Invesco Ltd.
2 Invesco Small Cap Value Fund
| | |

Bruce Crockett | | Dear Shareholders: |
| | Among the many important lessons I’ve learned in more than 40 years in a variety of business endeavors is the value of a trusted advocate. As independent chair of the Invesco Funds Board, I can assure you that the members of the Board are strong advocates for the interests of investors in Invesco’s mutual funds. We work hard to represent your interests through oversight of the quality of the investment management services your funds receive and other matters important to your investment, including but not limited to: |
| | ∎ Ensuring that Invesco offers a diverse lineup of mutual funds that your financial adviser can use to strive to meet your financial needs as your investment goals change over time. |
| | ∎ Monitoring how the portfolio management teams of the Invesco funds are performing in light of changing economic and market conditions. |
| | ∎ Assessing each portfolio management team’s investment performance within the context of the investment strategy described in the fund’s prospectus. |
| ∎ | | Monitoring for potential conflicts of interests that may impact the nature of the services that your funds receive. |
We believe one of the most important services we provide our fund shareholders is the annual review of the funds’ advisory and sub-advisory contracts with Invesco Advisers and its affiliates. This review is required by the Investment Company Act of 1940 and focuses on the nature and quality of the services Invesco provides as the adviser to the Invesco funds and the reasonableness of the fees that it charges for those services. Each year, we spend months carefully reviewing information received from Invesco and a variety of independent sources, such as performance and fee data prepared by Lipper, Inc. (a subsidiary of Broadridge Financial Solutions, Inc.), an independent, third-party firm widely recognized as a leader in its field. We also meet with our independent legal counsel and other independent advisers to review and help us assess the information that we have received. Our goal is to assure that you receive quality investment management services for a reasonable fee.
I trust the measures outlined above provide assurance that you have a worthy advocate when it comes to choosing the Invesco Funds.
On behalf of the Board, we look forward to continuing to represent your interests and serving your needs.
Sincerely,

Bruce L. Crockett
Independent Chair
Invesco Funds Board of Trustees
3 Invesco Small Cap Value Fund
Management’s Discussion of Fund Performance
|
Performance summary |
For the fiscal year ended April 30, 2020, Class A shares of Invesco Small Cap Value Fund (the Fund), at net asset value (NAV), underperformed the Russell 2000 Value Index, the Fund’s style-specific benchmark. Your Fund’s long-term performance appears later in this report. |
Fund vs. Indexes |
Total returns, April 30, 2019 to April 30, 2020, at net asset value (NAV). Performance shown does not include applicable contingent deferred sales charges (CDSC) or front-end sales charges, which would have reduced performance. |
| | | | |
Class A Shares | | | -30.02 | % |
| Class C Shares | | | -30.50 | |
| Class R Shares | | | -30.27 | |
| Class Y Shares | | | -29.79 | |
| Class R6 Shares | | | -29.71 | |
| S&P 500 Index▼ (Broad Market Index) | | | 0.86 | |
| Russell 2000 Value Index▼ (Style-Specific Index) | | | -23.84 | |
| Lipper Small-Cap Value Funds Index∎ (Peer Group Index) | | | -24.46 | |
| Source(s): ▼RIMES Technologies Corp.; ∎Lipper Inc. | | | | |
Market conditions and your Fund
The fiscal year proved to be another increasingly volatile period for US equities. Although the S&P 500 Index, considered representative of the US stock market, posted modest gains for the second quarter of 2019, US equities experienced increased volatility. After four consecutive months of rising stock prices, markets sold off in May 2019, along with bond yields and oil prices, as investors weighed the impact of the lingering trade war between the US and China, as well as potential tariffs imposed on Mexico.
Key issues that concerned investors in the second quarter of 2019 carried over into the third quarter. The US-China trade conflict worried investors and stifled business investment, even as the US Federal Reserve (the Fed) cut interest rates by 0.25% in July and again in September 2019.1 This environment, combined with evidence of slowing global economic growth, fueled market volatility in August 2019.
Macroeconomic issues that concerned investors in the third quarter of 2019 mostly abated during the fourth quarter, providing the backdrop for strong equity market returns. The US economy rose higher than expected, at 2.1% during the third quarter of 2019.2 During its October meeting, the Fed cut interest rates again by 0.25% based on business investment and exports remaining weak.1
During the first quarter of 2020, as the spread of the new coronavirus disrupted travel and suppressed consumer activity, investors became increasingly concerned about the global economy. At the same time, oil prices fell sharply as a price war between Saudi Arabia and Russia threatened to boost supply even as demand was falling. Beginning in late February, equity markets declined sharply and quickly, ushering in the first bear market since the financial crisis of 2008.
Though the equity market stabilized some-what toward the end of March, all sectors declined during the downturn. Cyclical sectors, where company performance tends to be closely linked to macroeconomic changes in the business cycle, were the hardest hit.
Within the Russell 2000 Value Index, all sectors posted losses during the fiscal year except for information technology (IT). The energy, communication services and materials sectors posted the largest declines.
During the fiscal year, we continued to use our intrinsic value strategy, seeking to create wealth by maintaining a long-term investment horizon and investing in companies trading at a significant discount to our estimate of their intrinsic value. We believe intrinsic value represents the fair economic worth of a business. Since our application of this strategy is highly disciplined and relatively unique, it is important to understand the benefits and limitations of our process. First, the investment strategy is intended to preserve capital while growing it at above-market rates over the long term. Second, our investments have little in common with popular stock market indexes and most of our peers. And third, the Fund’s short-term relative performance will naturally be different from stock market indexes and peers since we typically structure the Fund’s portfolio significantly differently than these benchmarks.
Drivers of Fund performance were mainly stock-specific during the fiscal year. However, the Fund’s lack of exposure to the more defensive/yield-oriented sectors, such as utilities, hurt the Fund’s performance relative to the Russell 2000 Value Index as these sectors performed well for much of the fiscal year. Select holdings in the industrials and materials sectors contributed the most to the Fund’s overall performance, while select holdings in financials and materials sectors were the largest detractors.
Industrial company Univar Solutions was the largest contributor to the Fund’s performance during the fiscal year. The company is a global chemical and ingredient distributor and provider of value-added services and a new addition to the Fund for the first quarter of 2020. Another industrial company, Builders FirstSource, was also a large contributor to the Fund’s performance. The company is a manufacturer and supplier of building materials whose shares rose after management reported solid financial results for the first three quarters of the fiscal year, driven by improving housing demand and growth of its higher margin value-added products. Materials company Element Solutions also contributed to the Fund’s performance during the fiscal year. Element Solutions was a new investment for the Fund during the first quarter of 2020. The company’s operating businesses formulate a broad range of solutions that enhance the performance of everyday use products within industries such as electronic circuitry, communication infrastructure and automotive systems.
Financial services companies MGIC Investment and Radian Group were among the largest detractors from the Fund’s overall performance during the fiscal year. MGIC Investment is a private mortgage insurance company whose shares declined along with other financial stocks exposed to consumer credit toward the end of the fiscal year. Radian Group also provides mortgage insurance and services to the real estate and mortgage finance industries. The company’s shares also fell during the market turmoil in the first quarter of 2020. Materials company Allegheny Technologies was another large detractor from the Fund’s performance during the fiscal year. The company manufactures specialty metal alloys for aerospace, energy, medical and industrial markets. We sold our position in Allegheny Technologies before the close of the fiscal year to fund what we believed to be more attractive investment opportunities else-where.
We believe the single most important indicator of how the Fund is positioned for potential future success is not our recent investment results nor popular statistical measures, but rather the difference between current market price and the Fund’s estimated intrinsic value — the aggregate business value of the portfolio based on our estimate of intrinsic value for each individual holding.
At the end of the fiscal year, the difference between the market price and the estimated intrinsic value of the Fund was very attractive, according to our estimation. While there is no assurance that market value will ever reflect our estimate of the Fund’s intrinsic value, we believe the gap between price and estimated intrinsic value may provide above-average capital appreciation. We will continue to work hard to protect and grow the Fund’s estimated intrinsic value.
4 Invesco Small Cap Value Fund
We thank you for your investment in Invesco Small Cap Value Fund and for sharing our long-term investment perspective.
| 1 | Source: US Federal Reserve |
| 2 | Source: US Bureau of Economic Analysis |
Portfolio Managers:
Jonathan Edwards - Lead
Jonathan Mueller
The views and opinions expressed in management’s discussion of Fund performance are those of Invesco Advisers, Inc. These views and opinions are subject to change at any time based on factors such as market and economic conditions. These views and opinions may not be relied upon as investment advice or recommendations, or as an offer for a particular security. The information is not a complete analysis of every aspect of any market, country, industry, security or the Fund. Statements of fact are from sources considered reliable, but Invesco Advisers, Inc. makes no representation or warranty as to their completeness or accuracy. Although historical performance is no guarantee of future results, these insights may help you understand our investment management philosophy.
See important Fund and, if applicable, index disclosures later in this report.
5 Invesco Small Cap Value Fund
Your Fund’s Long-Term Performance
Results of a $10,000 Investment — Oldest Share Class(es)
Fund and index data from 4/30/10
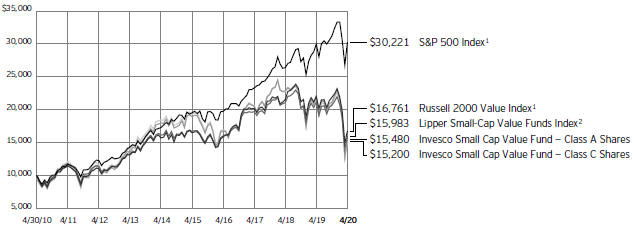
| 1 | Source: RIMES Technologies Corp. |
Past performance cannot guarantee future results.
The data shown in the chart include reinvested distributions, applicable sales charges and Fund expenses including management
fees. Index results include reinvested dividends, but they do not reflect sales charges. Performance of the peer group, if applicable, reflects fund expenses and management fees;
performance of a market index does not. Performance shown in the chart does not reflect deduction of taxes a shareholder would pay on Fund distributions or sale of Fund shares.
6 Invesco Small Cap Value Fund
| | | | |
Average Annual Total Returns | | | | |
As of 4/30/20, including maximum applicable sales charges | | | | |
| |
| Class A Shares | | | | |
| Inception (6/21/99) | | | 7.38 | % |
| 10 Years | | | 4.47 | |
5 Years | | | -5.06 | |
1 Year | | | -33.87 | |
| Class C Shares | | | | |
| Inception (6/21/99) | | | 7.28 | % |
| 10 Years | | | 4.28 | |
5 Years | | | -4.70 | |
1 Year | | | -31.17 | |
| Class R Shares | | | | |
| 10 Years | | | 4.79 | % |
5 Years | | | -4.24 | |
1 Year | | | -30.27 | |
| Class Y Shares | | | | |
| Inception (8/12/05) | | | 6.00 | % |
| 10 Years | | | 5.32 | |
5 Years | | | -3.74 | |
1 Year | | | -29.79 | |
| Class R6 Shares | | | | |
| 10 Years | | | 5.19 | % |
5 Years | | | -3.74 | |
1 Year | | | -29.71 | |
Effective June 1, 2010, Class A, Class C and Class I shares of the predecessor fund, VanKampen Small Cap Value Fund, advised by VanKampen Asset Management were reorganized into Class A, Class C and Class Y shares, respectively, of Invesco VanKampen Small Cap Value Fund (renamed Invesco Small Cap Value Fund). Returns shown above, prior to June 1, 2010, for Class A, Class C and Class Y shares are blended returns of the predecessor fund and Invesco Small Cap Value Fund. Share class returns will differ from the predecessor fund because of different expenses.
Class R shares incepted on April 17, 2020. Performance shown prior to that date is that of the Fund’s and predecessor fund’s Class A shares and includes the 12b-1 fees applicable to Class A shares. Class R6 shares incepted on February 7, 2017. Performance shown prior to that date is that of the Fund’s and the predecessor fund’s Class A shares and includes the 12b-1 fees applicable to Class A shares.
The performance data quoted represent past performance and cannot guarantee future results; current performance may be lower or higher. Please visit invesco.com/ performance for the most recent month-end performance. Performance figures reflect reinvested distributions, changes in net asset value and the effect of the maximum sales charge unless otherwise stated. Performance figures do not reflect deduction of taxes a shareholder would pay on Fund distributions or sale of Fund shares.
Investment return and principal value will fluctuate so that you may have a gain or loss when you sell shares.
Class A share performance reflects the maximum 5.50% sales charge, and Class C share performance reflects the applicable contingent deferred sales charge (CDSC) for the period involved. The CDSC on Class C shares is 1% for the first year after purchase. Class R, Class Y and Class R6 shares do not have a front-end sales charge or a CDSC; therefore, performance is at net asset value.
The performance of the Fund’s share classes will differ primarily due to different sales charge structures and class expenses.
Fund performance reflects any applicable fee waivers and/or expense reimbursements. Had the adviser not waived fees and/or reimbursed expenses currently or in the past, returns would have been lower. See current prospectus for more information.
7 Invesco Small Cap Value Fund
Invesco Small Cap Value Fund’s investment objective is long-term growth of capital.
| ∎ | | Unless otherwise stated, information presented in this report is as of April 30, 2020, and is based on total net assets. |
| ∎ | | Unless otherwise noted, all data provided by Invesco. |
| ∎ | | To access your Fund’s reports/prospectus, visit invesco.com/fundreports. |
About indexes used in this report
| ∎ | | The S&P 500® Index is an unmanaged index considered representative of the US stock market. |
| ∎ | | The Russell 2000® Value Index is an unmanaged index considered representative of small-cap value stocks. The Russell 2000 Value Index is a trademark/service mark of the Frank Russell Co. Russell® is a trademark of the Frank Russell Co. |
| ∎ | | The Lipper Small-Cap Value Funds Index is an unmanaged index considered representative of small-cap value funds tracked by Lipper. |
| ∎ | | The Fund is not managed to track the performance of any particular index, including the index(es) described here, and consequently, the performance of the Fund may deviate significantly from the performance of the index(es). |
| ∎ | | A direct investment cannot be made in an index. Unless otherwise indicated, index results include reinvested dividends, and they do not reflect sales charges. Performance of the peer group, if applicable, reflects fund expenses; performance of a market index does not. |
Liquidity Risk Management Program
The Securities and Exchange Commission has adopted Rule 22e-4 under the Investment Company Act of 1940 (the “Liquidity Rule”) in order to promote effective liquidity risk management throughout the open-end investment company industry, thereby reducing the risk that funds will be unable to meet their redemption obligations and mitigating dilution of the interests of fund shareholders. The Fund has adopted and implemented a liquidity risk management program in accordance with the Liquidity Rule (the “Program”). The Program is reasonably designed to assess and manage the Fund’s liquidity risk, which is the risk that the Fund could not meet redemption requests without significant dilution of remaining investors’ interests in the Fund. The Board of Trustees of the Fund (the “Board”) has appointed Invesco Advisers, Inc. (“Invesco”), the Fund’s investment adviser, as the Program’s administrator, and Invesco has delegated oversight of the Program to the Liquidity Risk Management Committee (the “Committee”), which is composed of senior representatives from relevant business groups at Invesco.
As required by the Liquidity Rule, the Program includes policies and procedures providing for an assessment, no less frequently than annually, of the Fund’s liquidity risk that takes into account, as relevant to the Fund’s liquidity risk: (1) the Fund’s investment strategy and liquidity of portfolio investments during both normal and reasonably foreseeable stressed conditions; (2) short-term and long-term cash flow projections for the Fund during both normal and reasonably foreseeable stressed conditions; and (3) the Fund’s holdings of cash and cash equivalents and any borrowing arrangements. The Liquidity Rule also requires the classification of the Fund’s investments into categories that reflect the assessment of their relative liquidity under current market conditions. The Fund classifies its investments into one of four categories defined in the Liquidity Rule: “Highly Liquid,” “Moderately Liquid,” “Less Liquid” and “Illiquid.” Funds that are not invested primarily in “Highly Liquid Investments” that are assets (cash or investments that are reasonably expected to be convertible into cash within three business days without significantly changing the market value of the investment) are required to establish a “Highly Liquid Investment Minimum” (“HLIM”), which is the minimum percentage of net assets that must be invested in Highly Liquid Investments. Funds with HLIMs have procedures for addressing HLIM shortfalls, including reporting to the Board and the SEC (on a non-public basis) as required by the Program and the Liquidity Rule. In addition, the Fund may not acquire an investment if, immediately after the acquisition, over 15% of the Fund’s net assets would consist of “Illiquid Investments” that are assets (an investment that cannot reasonably be expected to be sold or disposed of in current market conditions in seven calendar days or less without the sale or disposition significantly changing the market value of the investment). The Liquidity Rule and the Program also require reporting to the Board and the SEC (on a non-public basis) if a Fund’s holdings of Illiquid Investments exceed 15% of the Fund’s assets.
At a meeting held on March 30-April 1, 2020, the Committee presented a report to the Board that addressed the operation of the Program and assessed the
Program’s adequacy and effectiveness of implementation (the “Report”). The Report covered the period from December 1, 2018 through December 31, 2019 (the “Program Reporting Period”).
The Report stated, in relevant part, that during the Program Reporting Period:
| ∎ | | The Program, as adopted and implemented, remained reasonably designed to assess and manage the Fund’s liquidity risk and was operated effectively to achieve that goal; |
| ∎ | | The Fund’s investment strategy remained appropriate for an open-end fund; |
| ∎ | | The Fund was able to meet requests for redemption without significant dilution of remaining investors’ interests in the Fund; |
| ∎ | | The Fund did not breach the 15% limit on Illiquid Investments; and |
| ∎ | | The Fund primarily held Highly Liquid Investments and therefore has not adopted an HLIM. |
|
This report must be accompanied or preceded by a currently effective Fund prospectus, which contains more complete information, including sales charges and expenses. Investors should read it carefully before investing. |
|
| NOT FDIC INSURED | MAY LOSE VALUE | NO BANK GUARANTEE |
8 Invesco Small Cap Value Fund
Fund Information
Portfolio Composition
| | | | | |
| By sector | | % of total net assets |
| |
Industrials | | | | 34.07 | % |
Financials | | | | 19.84 | |
Materials | | | | 14.76 | |
Consumer Discretionary | | | | 9.64 | |
Information Technology | | | | 8.04 | |
Consumer Staples | | | | 6.16 | |
Energy | | | | 4.66 | |
Utilities | | | | 0.54 | |
Money Market Funds Plus Other Assets Less Liabilities | | | | 2.29 | |
Top 10 Equity Holdings*
| | | | | | | |
| | | | | % of total net assets |
| | |
1. | | AECOM | | | | 4.32 | % |
2. | | Flex Ltd. | | | | 3.33 | |
3. | | Univar Solutions, Inc. | | | | 3.32 | |
4. | | Energizer Holdings, Inc. | | | | 3.22 | |
5. | | LKQ Corp. | | | | 3.11 | |
6. | | Owens Corning | | | | 3.04 | |
7. | | Spectrum Brands Holdings, Inc. | | | | 2.94 | |
8. | | Huntsman Corp. | | | | 2.79 | |
9. | | Dana, Inc. | | | | 2.73 | |
10. | | BorgWarner, Inc. | | | | 2.69 | |
The Fund’s holdings are subject to change, and there is no assurance that the Fund will continue to hold any particular security.
| * | Excluding money market fund holdings, if any. |
Data presented here are as of April 30, 2020.
9 Invesco Small Cap Value Fund
Schedule of Investments(a)
April 30, 2020
| | | | | | |
| | | Shares | | | Value |
Common Stocks & Other Equity Interests–97.70% |
Agricultural & Farm Machinery–1.97% |
AGCO Corp. | | | 336,587 | | | $ 17,785,257 |
|
Auto Parts & Equipment–6.21% |
Aptiv PLC(b) | | | 97,226 | | | 6,762,069 |
BorgWarner, Inc. | | | 853,104 | | | 24,373,181 |
Dana, Inc.(b) | | | 2,146,896 | | | 24,689,304 |
Motorcar Parts of America, Inc.(b) | | | 24,831 | | | 353,345 |
| | | | | | | 56,177,899 |
|
Building Products–6.65% |
Builders FirstSource, Inc.(b) | | | 684,278 | | | 12,556,501 |
JELD-WEN Holding, Inc.(b) | | | 1,480,095 | | | 18,797,207 |
Masco Corp. | | | 20,944 | | | 859,542 |
Masonite International Corp.(b) | | | 7,191 | | | 424,844 |
Owens Corning | | | 635,279 | | | 27,545,697 |
| | | | | | | 60,183,791 |
|
Construction & Engineering–4.37% |
AECOM(b) | | | 1,078,122 | | | 39,092,704 |
Valmont Industries, Inc. | | | 3,653 | | | 428,278 |
| | | | | | | 39,520,982 |
|
Construction Machinery & Heavy Trucks–1.25% |
Astec Industries, Inc. | | | 282,500 | | | 11,331,075 |
|
Consumer Finance–1.50% |
SLM Corp. | | | 1,631,853 | | | 13,609,654 |
| | |
Distributors–3.11% | | | | | | |
LKQ Corp.(b) | | | 1,077,768 | | | 28,183,633 |
|
Diversified Chemicals–5.72% |
Chemours Co. (The) | | | 971,337 | | | 11,393,783 |
Eastman Chemical Co. | | | 250,500 | | | 15,157,755 |
Huntsman Corp. | | | 1,501,684 | | | 25,243,308 |
| | | | | | | 51,794,846 |
|
Diversified Metals & Mining–0.00% |
Ferroglobe Representation & Warranty Insurance Trust(b)(c) | | | 1,203,948 | | | 0 |
|
Electrical Components & Equipment–1.97% |
nVent Electric PLC | | | 957,700 | | | 17,861,105 |
Electronic Equipment & Instruments–2.04% |
API Group Corp.(b)(d) | | | 1,824,400 | | | 18,426,440 |
Electronic Manufacturing Services–4.04% |
Flex Ltd.(b) | | | 3,085,323 | | | 30,112,753 |
Jabil, Inc. | | | 152,300 | | | 4,331,412 |
Sanmina Corp.(b) | | | 74,723 | | | 2,072,069 |
| | | | | | | 36,516,234 |
|
Environmental & Facilities Services–0.65% |
Team, Inc.(b) | | | 954,863 | | | 5,891,505 |
| | |
Homebuilding–0.31% | | | | | | |
M/I Homes, Inc.(b) | | | 93,200 | | | 2,372,872 |
| | | | | | |
| | | Shares | | | Value |
|
Homebuilding–(continued) |
TopBuild Corp.(b) | | | 4,860 | | | $ 452,903 |
| | | | | | | 2,825,775 |
|
Household Products–6.16% |
Energizer Holdings, Inc. | | | 747,917 | | | 29,138,846 |
Spectrum Brands Holdings, Inc. | | | 617,395 | | | 26,585,029 |
| | | | | | | 55,723,875 |
|
Human Resource & Employment Services–2.63% |
Insperity, Inc. | | | 264,300 | | | 12,609,753 |
ManpowerGroup, Inc. | | | 68,601 | | | 5,092,938 |
TrueBlue, Inc.(b) | | | 393,402 | | | 6,109,533 |
| | | | | | | 23,812,224 |
|
Independent Power Producers & Energy Traders–0.54% |
Vistra Energy Corp. | | | 251,100 | | | 4,906,494 |
|
Industrial Conglomerates–0.81% |
Carlisle Cos., Inc. | | | 60,702 | | | 7,342,514 |
|
Industrial Machinery–4.83% |
Columbus McKinnon Corp. | | | 225,300 | | | 6,101,124 |
Crane Co. | | | 302,500 | | | 16,471,125 |
Timken Co. (The) | | | 563,110 | | | 21,161,674 |
| | | | | | | 43,733,923 |
|
Investment Banking & Brokerage–0.92% |
Evercore, Inc., Class A | | | 138,100 | | | 7,125,960 |
Greenhill & Co., Inc. | | | 30,932 | | | 330,044 |
Stifel Financial Corp. | | | 20,270 | | | 897,556 |
| | | | | | | 8,353,560 |
|
Life & Health Insurance–4.21% |
Athene Holding Ltd., Class A(b) | | | 689,900 | | | 18,627,300 |
CNO Financial Group, Inc. | | | 1,381,415 | | | 19,422,695 |
| | | | | | | 38,049,995 |
|
Oil & Gas Equipment & Services–0.91% |
Helix Energy Solutions Group, Inc.(b) | | | 2,136,081 | | | 5,425,646 |
NexTier Oilfield Solutions, Inc.(b) | | | 1,210,811 | | | 2,809,081 |
| | | | | | | 8,234,727 |
|
Oil & Gas Exploration & Production–3.38% |
Noble Energy, Inc. | | | 748,953 | | | 7,347,229 |
Northern Oil and Gas, Inc.(b) | | | 6,585,508 | | | 5,513,387 |
Parsley Energy, Inc., Class A | | | 1,875,203 | | | 17,720,669 |
| | | | | | | 30,581,285 |
|
Oil & Gas Refining & Marketing–0.37% |
HollyFrontier Corp. | | | 102,400 | | | 3,383,296 |
|
Other Diversified Financial Services–2.08% |
Equitable Holdings, Inc. | | | 1,024,700 | | | 18,772,504 |
|
Paper Packaging–2.61% |
Sealed Air Corp. | | | 825,568 | | | 23,602,989 |
|
Regional Banks–7.62% |
First Horizon National Corp. | | | 2,486,710 | | | 22,579,327 |
Sterling Bancorp | | | 1,167,800 | | | 14,398,974 |
See accompanying Notes to Financial Statements which are an integral part of the financial statements.
10 Invesco Small Cap Value Fund
| | | | | | |
| | | Shares | | | Value |
Regional Banks–(continued) | | | | | | |
TCF Financial Corp. | | | 515,400 | | | $ 15,302,226 |
Western Alliance Bancorporation | | | 463,400 | | | 16,626,792 |
| | | | | | | 68,907,319 |
|
Research & Consulting Services–0.14% |
Resources Connection, Inc. | | | 115,492 | | | 1,256,553 |
|
Semiconductor Equipment–1.77% |
Kulicke & Soffa Industries, Inc. (Singapore) | | | 667,277 | | | 15,994,630 |
|
Specialty Chemicals–4.41% |
Axalta Coating Systems Ltd(b) | | | 618,000 | | | 12,199,320 |
Celanese Corp. | | | 24,900 | | | 2,068,443 |
Element Solutions, Inc.(b) | | | 1,290,100 | | | 13,223,525 |
Kraton Corp.(b) | | | 797,922 | | | 12,455,562 |
| | | | | | | 39,946,850 |
|
Steel–2.01% |
Carpenter Technology Corp. | | | 820,430 | | | 18,188,933 |
|
Technology Distributors–0.20% |
Insight Enterprises, Inc.(b) | | | 33,622 | | | 1,825,338 |
|
Thrifts & Mortgage Finance–3.52% |
Axos Financial, Inc.(b) | | | 931,165 | | | 21,463,353 |
MGIC Investment Corp. | | | 1,241,554 | | | 9,075,760 |
Radian Group, Inc. | | | 86,416 | | | 1,294,512 |
| | | | | | | 31,833,625 |
| | | | | | | | |
| | | Shares | | | Value | |
| |
Trading Companies & Distributors–8.79% | |
AerCap Holdings N.V. (Ireland)(b) | | | 102,500 | | | $ | 2,882,300 | |
| |
Beacon Roofing Supply, Inc.(b) | | | 675,666 | | | | 14,864,652 | |
| |
BMC Stock Holdings, Inc.(b) | | | 461,676 | | | | 9,810,615 | |
| |
DXP Enterprises, Inc.(b) | | | 164,891 | | | | 2,460,174 | |
| |
Univar Solutions, Inc.(b) | | | 2,070,800 | | | | 30,068,016 | |
| |
WESCO International, Inc.(b) | | | 753,316 | | | | 19,488,285 | |
| |
| | | | | | | 79,574,042 | |
| |
Total Common Stocks & Other Equity Interests
(Cost $1,054,775,253) | | | | 884,132,872 | |
| |
|
Money Market Funds–3.97% | |
Invesco Government & Agency Portfolio,
Institutional Class, 0.20%(e)(f) | | | 11,727,183 | | | | 11,727,183 | |
| |
Invesco Liquid Assets Portfolio, Institutional
Class, 0.60%(e)(f) | | | 10,735,456 | | | | 10,741,897 | |
| |
Invesco Treasury Portfolio, Institutional
Class, 0.10%(e)(f) | | | 13,402,495 | | | | 13,402,495 | |
| |
Total Money Market Funds
(Cost $35,864,389) | | | | 35,871,575 | |
| |
TOTAL INVESTMENTS IN SECURITIES–101.67%
(Cost $1,090,639,642) 920,004,447 | |
| |
OTHER ASSETS LESS LIABILITIES–(1.67)% | | | | (15,071,620 | ) |
| |
NET ASSETS–100.00% | | | $ | 904,932,827 | |
| |
Notes to Schedule of Investments:
| (a) | Industry and/or sector classifications used in this report are generally according to the Global Industry Classification Standard, which was developed by and is the exclusive property and a service mark of MSCI Inc. and Standard & Poor’s. |
| (b) | Non-income producing security. |
| (c) | Security valued using significant unobservable inputs (Level 3). See Note 3. |
| (d) | Security purchased or received in a transaction exempt from registration under the Securities Act of 1933, as amended (the “1933 Act”). The security may be resold pursuant to an exemption from registration under the 1933 Act, typically to qualified institutional buyers. The value of this security at April 30, 2020 represented 2.04% of the Fund’s Net Assets. |
| (e) | Affiliated issuer. The issuer and/or the Fund is a wholly-owned subsidiary of Invesco Ltd., or is affiliated by having an investment adviser that is under common control of Invesco Ltd. The table below shows the Fund’s transactions in, and earnings from, its investments in affiliates for the fiscal year ended April 30, 2020. |
| | | | | | | | | | | | | | | | | | | | | | | | | | | | |
| | | Value April 30, 2019 | | | Purchases at Cost | | | Proceeds from Sales | | | Change in Unrealized Appreciation | | | Realized Gain (Loss) | | | Value April 30, 2020 | | | Dividend Income | |
Investments in Affiliated Money Market Funds: | | | | | | | | | | | | | | | | | | | | | | | | | | | | |
Invesco Government & Agency Portfolio, Institutional Class | | $ | 9,518,896 | | | $ | 158,022,185 | | | $ | (155,813,898 | ) | | | $ - | | | | $ - | | | $ | 11,727,183 | | | $ | 204,275 | |
Invesco Liquid Assets Portfolio, Institutional Class | | | 6,800,574 | | | | 113,709,040 | | | | (109,764,743 | ) | | | 5,236 | | | | (8,210 | ) | | | 10,741,897 | | | | 164,571 | |
Invesco Treasury Portfolio, Institutional Class | | | 10,878,738 | | | | 178,403,557 | | | | (175,879,800 | ) | | | - | | | | - | | | | 13,402,495 | | | | 227,892 | |
Total | | $ | 27,198,208 | | | $ | 450,134,782 | | | $ | (441,458,441 | ) | | | $5,236 | | | | $(8,210 | ) | | $ | 35,871,575 | | | $ | 596,738 | |
| (f) | The rate shown is the 7-day SEC standardized yield as of April 30, 2020. |
See accompanying Notes to Financial Statements which are an integral part of the financial statements.
11 Invesco Small Cap Value Fund
Statement of Assets and Liabilities
April 30, 2020
| | | | |
Assets: | | | | |
Investments in securities, at value
(Cost $ 1,054,775,253) | | $ | 884,132,872 | |
| |
Investments in affiliated money market funds, at value (Cost $ 35,864,389) | | | 35,871,575 | |
| |
Cash | | | 1,717 | |
| |
Receivable for: | | | | |
Investments sold | | | 5,810,130 | |
| |
Fund shares sold | | | 1,829,285 | |
| |
Dividends | | | 194,114 | |
| |
Investment for trustee deferred compensation and retirement plans | | | 233,144 | |
| |
Other assets | | | 48,923 | |
| |
Total assets | | | 928,121,760 | |
| |
| |
Liabilities: | | | | |
Payable for: | | | | |
Investments purchased | | | 19,960,512 | |
| |
Fund shares reacquired | | | 2,173,209 | |
| |
Accrued fees to affiliates | | | 630,125 | |
| |
Accrued trustees’ and officers’ fees and benefits | | | 1,334 | |
| |
Accrued other operating expenses | | | 161,774 | |
| |
Trustee deferred compensation and retirement plans | | | 261,979 | |
| |
Total liabilities | | | 23,188,933 | |
| |
Net assets applicable to shares outstanding | | $ | 904,932,827 | |
| |
| |
Net assets consist of: | | | | |
Shares of beneficial interest | | $ | 1,257,834,347 | |
| |
Distributable earnings (loss) | | | (352,901,520 | ) |
| |
| | $ | 904,932,827 | |
| |
| | | | |
Net Assets: | | | | |
Class A | | $ | 372,448,180 | |
| |
Class C | | $ | 10,133,305 | |
| |
Class R | | $ | 3,866,139 | |
| |
Class Y | | $ | 457,857,039 | |
| |
Class R6 | | $ | 60,628,164 | |
| |
|
Shares outstanding, no par value, with an unlimited number of shares authorized: | |
Class A | | | 38,715,467 | |
| |
Class C | | | 1,698,836 | |
| |
Class R | | | 402,121 | |
| |
Class Y | | | 44,677,320 | |
| |
Class R6 | | | 5,878,747 | |
| |
Class A: | | | | |
Net asset value per share | | $ | 9.62 | |
| |
Maximum offering price per share (Net asset value of $9.62 ÷ 94.50%) | | $ | 10.18 | |
| |
Class C: | | | | |
Net asset value and offering price per share | | $ | 5.96 | |
| |
Class R: | | | | |
Net asset value and offering price per share | | $ | 9.61 | |
| |
Class Y: | | | | |
Net asset value and offering price per share | | $ | 10.25 | |
| |
Class R6: | | | | |
Net asset value and offering price per share | | $ | 10.31 | |
| |
See accompanying Notes to Financial Statements which are an integral part of the financial statements.
12 Invesco Small Cap Value Fund
Statement of Operations
For the year ended April 30, 2020
| | | | |
| |
Investment income: | | | | |
Dividends | | $ | 15,772,137 | |
| |
Dividends from affiliated money market funds | | | 596,738 | |
| |
Total investment income | | | 16,368,875 | |
| |
| |
Expenses: | | | | |
Advisory fees | | | 8,262,214 | |
| |
Administrative services fees | | | 194,498 | |
| |
Custodian fees | | | 17,940 | |
| |
Distribution fees: | | | | |
Class A | | | 1,324,485 | |
| |
Class C | | | 138,674 | |
| |
Class R | | | 525 | |
| |
Transfer agent fees – A, C, R and Y | | | 2,253,976 | |
| |
Transfer agent fees – R6 | | | 8,849 | |
| |
Trustees’ and officers’ fees and benefits | | | 31,683 | |
| |
Registration and filing fees | | | 76,390 | |
| |
Reports to shareholders | | | 135,377 | |
| |
Professional services fees | | | 61,472 | |
| |
Other | | | 40,370 | |
| |
Total expenses | | | 12,546,453 | |
| |
Less: Fees waived and/or expense offset arrangement(s) | | | (41,910 | ) |
| |
Net expenses | | | 12,504,543 | |
| |
Net investment income | | | 3,864,332 | |
| |
| |
Realized and unrealized gain (loss) from: | | | | |
Net realized gain (loss) from investment securities (includes net gains from securities sold to affiliates of $ 2,531,127) | | | (137,691,191 | ) |
| |
Change in net unrealized appreciation (depreciation) of investment securities | | | (254,623,721 | ) |
| |
Net realized and unrealized gain (loss) | | | (392,314,912 | ) |
| |
Net increase (decrease) in net assets resulting from operations | | $ | (388,450,580 | ) |
| |
See accompanying Notes to Financial Statements which are an integral part of the financial statements.
13 Invesco Small Cap Value Fund
Statement of Changes in Net Assets
For the years ended April 30, 2020 and 2019
| | | | | | | | |
| | | 2020 | | | 2019 | |
| | |
Operations: | | | | | | | | |
Net investment income (loss) | | $ | 3,864,332 | | | $ | (1,779,758 | ) |
| |
Net realized gain (loss) | | | (137,691,191 | ) | | | 85,150,289 | |
| |
Change in net unrealized appreciation (depreciation) | | | (254,623,721 | ) | | | (198,347,184 | ) |
| |
Net increase (decrease) in net assets resulting from operations | | | (388,450,580 | ) | | | (114,976,653 | ) |
| |
| | |
Distributions to shareholders from distributable earnings: | | | | | | | | |
Class A | | | (14,362,363 | ) | | | (132,802,646 | ) |
| |
Class C | | | (556,893 | ) | | | (14,194,064 | ) |
| |
Class Y | | | (16,631,631 | ) | | | (177,702,688 | ) |
| |
Class R6 | | | (1,687,217 | ) | | | (7,472,773 | ) |
| |
Total distributions from distributable earnings | | | (33,238,104 | ) | | | (332,172,171 | ) |
| |
| | |
Share transactions–net: | | | | | | | | |
Class A | | | (111,203,767 | ) | | | (101,574,893 | ) |
| |
Class C | | | (7,786,632 | ) | | | (34,019,574 | ) |
| |
Class R | | | 3,414,878 | | | | – | |
| |
Class Y | | | (197,788,556 | ) | | | (276,425,272 | ) |
| |
Class R6 | | | 14,526,805 | | | | 49,772,898 | |
| |
Net increase (decrease) in net assets resulting from share transactions | | | (298,837,272 | ) | | | (362,246,841 | ) |
| |
Net increase (decrease) in net assets | | | (720,525,956 | ) | | | (809,395,665 | ) |
| |
| | |
Net assets: | | | | | | | | |
Beginning of year | | | 1,625,458,783 | | | | 2,434,854,448 | |
| |
End of year | | $ | 904,932,827 | | | $ | 1,625,458,783 | |
| |
See accompanying Notes to Financial Statements which are an integral part of the financial statements.
14 Invesco Small Cap Value Fund
Financial Highlights
The following schedule presents financial highlights for a share of the Fund outstanding throughout the periods indicated.
| | | | | | | | | | | | | | | | | | | | | | | | | | | | | | | | | | | | | | | | | | | | | | | | | | | | | | | | |
| | | Net asset
value,
beginning
of period | | | Net investment income (loss)(a) | | | Net gains (losses) on securities (both realized and unrealized) | | | Total from
investment operations | | | Dividends from net investment income | | | Distributions
from net
realized
gains | | | Total
distributions | | | Net asset
value, end
of period | | | Total
return (b) | | | Net assets,
end of period
(000’s omitted) | | | Ratio of expenses to average net assets with fee waivers and/or expenses absorbed | | | Ratio of expenses to average net assets without fee waivers and/or expenses absorbed | | | Ratio of net investment income (loss) to average net assets | | | Portfolio turnover (c) | |
Class A | | | | | | | | | | | | | | | | | | | | | | | | | | | | | | | | | | | | | | | | | | | | | | | | | | | | | | | | |
Year ended 04/30/20 | | $ | 14.10 | | | $ | 0.02 | | | $ | (4.14 | ) | | $ | (4.12 | ) | | $ | – | | | $ | (0.36 | ) | | $ | (0.36 | ) | | $ | 9.62 | | | | (30.02 | )% | | $ | 372,448 | | | | 1.13 | %(d) | | | 1.13 | %(d) | | | 0.16 | %(d) | | | 47 | % |
Year ended 04/30/19 | | | 18.53 | | | | (0.04 | ) | | | (1.22 | ) | | | (1.26 | ) | | | – | | | | (3.17 | ) | | | (3.17 | ) | | | 14.10 | | | | (3.16 | ) | | | 662,115 | | | | 1.12 | | | | 1.12 | | | | (0.22 | ) | | | 43 | |
Year ended 04/30/18 | | | 19.44 | | | | (0.06 | ) | | | 2.31 | | | | 2.25 | | | | – | | | | (3.16 | ) | | | (3.16 | ) | | | 18.53 | | | | 11.32 | | | | 933,986 | | | | 1.12 | | | | 1.12 | | | | (0.31 | ) | | | 28 | |
Year ended 04/30/17 | | | 16.21 | | | | (0.02 | ) | | | 3.60 | | | | 3.58 | | | | (0.03 | ) | | | (0.32 | ) | | | (0.35 | ) | | | 19.44 | | | | 22.14 | | | | 1,094,070 | | | | 1.10 | | | | 1.11 | | | | (0.12 | ) | | | 32 | |
Year ended 04/30/16 | | | 20.33 | | | | 0.04 | | | | (2.37 | ) | | | (2.33 | ) | | | (0.01 | ) | | | (1.78 | ) | | | (1.79 | ) | | | 16.21 | | | | (11.43 | ) | | | 1,320,826 | | | | 1.11 | | | | 1.11 | | | | 0.24 | | | | 45 | |
Class C | | | | | | | | | | | | | | | | | | | | | | | | | | | | | | | | | | | | | | | | | | | | | | | | | | | | | | | | |
Year ended 04/30/20 | | | 8.93 | | | | (0.04 | ) | | | (2.57 | ) | | | (2.61 | ) | | | – | | | | (0.36 | ) | | | (0.36 | ) | | | 5.96 | | | | (30.50 | )(e) | | | 10,133 | | | | 1.84 | (d)(e) | | | 1.84 | (d)(e) | | | (0.55 | )(d)(e) | | | 47 | |
Year ended 04/30/19 | | | 13.29 | | | | (0.11 | ) | | | (1.08 | ) | | | (1.19 | ) | | | – | | | | (3.17 | ) | | | (3.17 | ) | | | 8.93 | | | | (3.98 | ) | | | 22,059 | | | | 1.87 | | | | 1.87 | | | | (0.97 | ) | | | 43 | |
Year ended 04/30/18 | | | 14.83 | | | | (0.15 | ) | | | 1.77 | | | | 1.62 | | | | – | | | | (3.16 | ) | | | (3.16 | ) | | | 13.29 | | | | 10.53 | (e) | | | 76,302 | | | | 1.86 | (e) | | | 1.86 | (e) | | | (1.05 | )(e) | | | 28 | |
Year ended 04/30/17 | | | 12.50 | | | | (0.12 | ) | | | 2.76 | | | | 2.65 | | | | – | | | | (0.32 | ) | | | (0.32 | ) | | | 14.83 | | | | 21.23 | (e) | | | 95,892 | | | | 1.84 | (e) | | | 1.85 | (e) | | | (0.86 | )(e) | | | 32 | |
Year ended 04/30/16 | | | 16.25 | | | | (0.07 | ) | | | (1.90 | ) | | | (1.97 | ) | | | – | | | | (1.78 | ) | | | (1.78 | ) | | | 12.50 | | | | (12.11 | ) | | | 107,647 | | | | 1.86 | | | | 1.86 | | | | (0.51 | ) | | | 45 | |
Class R | | | | | | | | | | | | | | | | | | | | | | | | | | | | | | | | | | | | | | | | | | | | | | | | | | | | | | | | |
Year ended 04/30/20(f) | | | 8.49 | | | | (0.00 | )(g) | | | 1.12 | | | | 1.12 | | | | – | | | | – | | | | – | | | | 9.61 | | | | 13.19 | | | | 3,866 | | | | 1.37 | (d)(h) | | | 1.37 | (d)(h) | | | (0.08 | )(d)(h) | | | 47 | |
Class Y | | | | | | | | | | | | | | | | | | | | | | | | | | | | | | | | | | | | | | | | | | | | | | | | | | | | | | | | |
Year ended 04/30/20 | | | 14.95 | | | | 0.06 | | | | (4.40 | ) | | | (4.34 | ) | | | – | | | | (0.36 | ) | | | (0.36 | ) | | | 10.25 | | | | (29.79 | ) | | | 457,857 | | | | 0.88 | (d) | | | 0.88 | (d) | | | 0.41 | (d) | | | 47 | |
Year ended 04/30/19 | | | 19.37 | | | | 0.01 | | | | (1.26 | ) | | | (1.25 | ) | | | – | | | | (3.17 | ) | | | (3.17 | ) | | | 14.95 | | | | (2.97 | ) | | | 875,875 | | | | 0.87 | | | | 0.87 | | | | 0.03 | | | | 43 | |
Year ended 04/30/18 | | | 20.15 | | | | (0.01 | ) | | | 2.39 | | | | 2.38 | | | | – | | | | (3.16 | ) | | | (3.16 | ) | | | 19.37 | | | | 11.58 | | | | 1,397,754 | | | | 0.87 | | | | 0.87 | | | | (0.06 | ) | | | 28 | |
Year ended 04/30/17 | | | 16.79 | | | | 0.02 | | | | 3.74 | | | | 3.76 | | | | (0.08 | ) | | | (0.32 | ) | | | (0.40 | ) | | | 20.15 | | | | 22.45 | | | | 1,445,051 | | | | 0.85 | | | | 0.86 | | | | 0.13 | | | | 32 | |
Year ended 04/30/16 | | | 20.97 | | | | 0.09 | | | | (2.45 | ) | | | (2.36 | ) | | | (0.04 | ) | | | (1.78 | ) | | | (1.82 | ) | | | 16.79 | | | | (11.19 | ) | | | 1,329,637 | | | | 0.86 | | | | 0.86 | | | | 0.49 | | | | 45 | |
Class R6 | | | | | | | | | | | | | | | | | | | | | | | | | | | | | | | | | | | | | | | | | | | | | | | | | | | | | | | | |
Year ended 04/30/20 | | | 15.02 | | | | 0.08 | | | | (4.43 | ) | | | (4.35 | ) | | | – | | | | (0.36 | ) | | | (0.36 | ) | | | 10.31 | | | | (29.71 | ) | | | 60,628 | | | | 0.70 | (d) | | | 0.70 | (d) | | | 0.59 | (d) | | | 47 | |
Year ended 04/30/19 | | | 19.41 | | | | 0.03 | | | | (1.25 | ) | | | (1.22 | ) | | | – | | | | (3.17 | ) | | | (3.17 | ) | | | 15.02 | | | | (2.80 | ) | | | 65,409 | | | | 0.71 | | | | 0.71 | | | | 0.19 | | | | 43 | |
Year ended 04/30/18 | | | 20.16 | | | | 0.02 | | | | 2.39 | | | | 2.41 | | | | – | | | | (3.16 | ) | | | (3.16 | ) | | | 19.41 | | | | 11.73 | | | | 26,813 | | | | 0.69 | | | | 0.69 | | | | 0.12 | | | | 28 | |
Year ended 04/30/17(f) | | | 20.29 | | | | 0.01 | | | | (0.14 | ) | | | (0.13 | ) | | | – | | | | – | | | | – | | | | 20.16 | | | | (0.64 | ) | | | 469 | | | | 0.72 | (h) | | | 0.72 | (h) | | | 0.26 | (h) | | | 32 | |
| |
| (a) | Calculated using average shares outstanding. |
| (b) | Includes adjustments in accordance with accounting principles generally accepted in the United States of America and as such, the net asset value for financial reporting purposes and the returns based upon those net asset values may differ from the net asset value and returns for shareholder transactions. Does not include sales charges and is not annualized for periods less than one year, if applicable. |
| (c) | Portfolio turnover is calculated at the fund level and is not annualized for periods less than one year, if applicable. For the year ended April 30, 2020, the portfolio turnover calculation excludes the value of securities purchased of $23,823,797 in connection with the acquisition of Invesco Oppenheimer Small Cap Value Fund into the Fund. |
| (d) | Ratios are based on average daily net assets (000’s omitted) of $529,634, $14,506, $3,495, $664,131 and $63,756 for Class A, Class C, Class R, Class Y and Class R6 shares, respectively. |
| (e) | The total return, ratio of expenses to average net assets and ratio of net investment income (loss) to average net assets reflect actual 12b-1 fees of 0.96% for the years ended April 30, 2020 and 0.99% for the years ended April 30, 2018 and 2017, respectively. |
| (f) | Commencement date of April 17, 2020 and February 07, 2017 for Class R and Class R6 shares, respectively. |
| (g) | Amount represents less than $(0.005). |
See accompanying Notes to Financial Statements which are an integral part of the financial statements.
15 Invesco Small Cap Value Fund
Notes to Financial Statements
April 30, 2020
NOTE 1–Significant Accounting Policies
Invesco Small Cap Value Fund (the “Fund”) is a series portfolio of AIM Sector Funds (Invesco Sector Funds) (the “Trust”). The Trust is a Delaware statutory trust registered under the Investment Company Act of 1940, as amended (the “1940 Act”), as an open-end series management investment company authorized to issue an unlimited number of shares of beneficial interest. Information presented in these financial statements pertains only to the Fund. Matters affecting the Fund or each class will be voted on exclusively by the shareholders of the Fund or each class.
The Fund’s investment objective is long-term growth of capital.
The Fund currently consists of five different classes of shares: Class A, Class C, Class R, Class Y and Class R6. On April 17, 2020, the Fund began offering Class R shares. Class Y shares are available only to certain investors. Class A shares are sold with a front-end sales charge unless certain waiver criteria are met. Under certain circumstances, load waived shares may be subject to contingent deferred sales charges (“CDSC”). Class C shares are sold with a CDSC. Class R, Class Y and Class R6 shares are sold at net asset value. Class C shares held for ten years after purchase are eligible for automatic conversion into Class A shares of the same Fund (the “Conversion Feature”). The automatic conversion pursuant to the Conversion Feature will generally occur at the end of the month following the tenth anniversary after a purchase of Class C shares.
The Fund is an investment company and accordingly follows the investment company accounting and reporting guidance in accordance with Financial Accounting Standards Board Accounting Standards Codification Topic 946, Financial Services – Investment Companies.
The following is a summary of the significant accounting policies followed by the Fund in the preparation of its financial statements.
| A. | Security Valuations – Securities, including restricted securities, are valued according to the following policy. |
A security listed or traded on an exchange (except convertible securities) is valued at its last sales price or official closing price as of the close of the customary trading session on the exchange where the security is principally traded, or lacking any sales or official closing price on a particular day, the security may be valued at the closing bid price on that day. Securities traded in the over-the-counter market are valued based on prices furnished by independent pricing services or market makers. When such securities are valued by an independent pricing service they may be considered fair valued. Futures contracts are valued at the final settlement price set by an exchange on which they are principally traded. Listed options are valued at the mean between the last bid and asked prices from the exchange on which they are principally traded. Options not listed on an exchange are valued by an independent source at the mean between the last bid and asked prices. For purposes of determining net asset value (“NAV”) per share, futures and option contracts generally are valued 15 minutes after the close of the customary trading session of the New York Stock Exchange (“NYSE”).
Investments in open-end and closed-end registered investment companies that do not trade on an exchange are valued at the end-of-day net asset value per share. Investments in open-end and closed-end registered investment companies that trade on an exchange are valued at the last sales price or official closing price as of the close of the customary trading session on the exchange where the security is principally traded.
Debt obligations (including convertible securities) and unlisted equities are fair valued using an evaluated quote provided by an independent pricing service. Evaluated quotes provided by the pricing service may be determined without exclusive reliance on quoted prices, and may reflect appropriate factors such as institution-size trading in similar groups of securities, developments related to specific securities, dividend rate (for unlisted equities), yield (for debt obligations), quality, type of issue, coupon rate (for debt obligations), maturity (for debt obligations), individual trading characteristics and other market data. Pricing services generally value debt obligations assuming orderly transactions of institutional round lot size, but a fund may hold or transact in the same securities in smaller, odd lot sizes. Odd lots often trade at lower prices than institutional round lots. Debt obligations are subject to interest rate and credit risks. In addition, all debt obligations involve some risk of default with respect to interest and/or principal payments.
Foreign securities’ (including foreign exchange contracts) prices are converted into U.S. dollar amounts using the applicable exchange rates as of the close of the NYSE. If market quotations are available and reliable for foreign exchange-traded equity securities, the securities will be valued at the market quotations. Because trading hours for certain foreign securities end before the close of the NYSE, closing market quotations may become unreliable. If between the time trading ends on a particular security and the close of the customary trading session on the NYSE, events occur that the investment adviser determines are significant and make the closing price unreliable, the Fund may fair value the security. If the event is likely to have affected the closing price of the security, the security will be valued at fair value in good faith using procedures approved by the Board of Trustees. Adjustments to closing prices to reflect fair value may also be based on a screening process of an independent pricing service to indicate the degree of certainty, based on historical data, that the closing price in the principal market where a foreign security trades is not the current value as of the close of the NYSE. Foreign securities’ prices meeting the approved degree of certainty that the price is not reflective of current value will be priced at the indication of fair value from the independent pricing service. Multiple factors may be considered by the independent pricing service in determining adjustments to reflect fair value and may include information relating to sector indices, American Depositary Receipts and domestic and foreign index futures. Foreign securities may have additional risks including exchange rate changes, potential for sharply devalued currencies and high inflation, political and economic upheaval, the relative lack of issuer information, relatively low market liquidity and the potential lack of strict financial and accounting controls and standards.
Securities for which market prices are not provided by any of the above methods may be valued based upon quotes furnished by independent sources. The last bid price may be used to value equity securities. The mean between the last bid and asked prices is used to value debt obligations, including corporate loans.
Securities for which market quotations are not readily available or became unreliable are valued at fair value as determined in good faith by or under the supervision of the Trust’s officers following procedures approved by the Board of Trustees. Issuer specific events, market trends, bid/asked quotes of brokers and information providers and other market data may be reviewed in the course of making a good faith determination of a security’s fair value.
The Fund may invest in securities that are subject to interest rate risk, meaning the risk that the prices will generally fall as interest rates rise and, conversely, the prices will generally rise as interest rates fall. Specific securities differ in their sensitivity to changes in interest rates depending on their individual characteristics. Changes in interest rates may result in increased market volatility, which may affect the value and/or liquidity of certain Fund investments.
Valuations change in response to many factors including the historical and prospective earnings of the issuer, the value of the issuer’s assets, general market conditions which are not specifically related to the particular issuer, such as real or perceived adverse economic conditions, changes in the general outlook for revenues or corporate earnings, changes in interest or currency rates, regional or global instability, natural or environmental disasters, widespread disease or other public health issues, war, acts of terrorism or adverse investor sentiment generally and market liquidity. Because of the inherent uncertainties of valuation, the values reflected in the financial statements may materially differ from the value received upon actual sale of those investments.
| B. | Securities Transactions and Investment Income – Securities transactions are accounted for on a trade date basis. Realized gains or losses on sales are computed on the basis of specific identification of the securities sold. Interest income (net of withholding tax, if any) is recorded on an accrual basis from settlement date. Dividend income (net of withholding tax, if any) is recorded on the ex-dividend date. |
The Fund may periodically participate in litigation related to Fund investments. As such, the Fund may receive proceeds from litigation settlements. Any proceeds received are included in the Statement of Operations as realized gain (loss) for investments no longer held and as unrealized gain (loss) for investments still held.
Brokerage commissions and mark ups are considered transaction costs and are recorded as an increase to the cost basis of securities purchased and/or a reduction of proceeds on a sale of securities. Such transaction costs are included in the determination of net realized and unrealized gain (loss) from investment
16 Invesco Small Cap Value Fund
securities reported in the Statement of Operations and the Statement of Changes in Net Assets and the net realized and unrealized gains (losses) on securities per share in the Financial Highlights. Transaction costs are included in the calculation of the Fund’s net asset value and, accordingly, they reduce the Fund’s total returns. These transaction costs are not considered operating expenses and are not reflected in net investment income reported in the Statement of Operations and the Statement of Changes in Net Assets, or the net investment income per share and the ratios of expenses and net investment income reported in the Financial Highlights, nor are they limited by any expense limitation arrangements between the Fund and the investment adviser.
The Fund allocates income and realized and unrealized capital gains and losses to a class based on the relative net assets of each class.
| C. | Country Determination – For the purposes of making investment selection decisions and presentation in the Schedule of Investments, the investment adviser may determine the country in which an issuer is located and/or credit risk exposure based on various factors. These factors include the laws of the country under which the issuer is organized, where the issuer maintains a principal office, the country in which the issuer derives 50% or more of its total revenues and the country that has the primary market for the issuer’s securities, as well as other criteria. Among the other criteria that may be evaluated for making this determination are the country in which the issuer maintains 50% or more of its assets, the type of security, financial guarantees and enhancements, the nature of the collateral and the sponsor organization. Country of issuer and/or credit risk exposure has been determined to be the United States of America, unless otherwise noted. |
| D. | Distributions – Distributions from net investment income and net realized capital gain, if any, are generally declared and paid annually and recorded on the ex-dividend date. The Fund may elect to treat a portion of the proceeds from redemptions as distributions for federal income tax purposes. |
| E. | Federal Income Taxes –The Fund intends to comply with the requirements of Subchapter M of the Internal Revenue Code of 1986, as amended (the “Internal Revenue Code”), necessary to qualify as a regulated investment company and to distribute substantially all of the Fund’s taxable earnings to shareholders. As such, the Fund will not be subject to federal income taxes on otherwise taxable income (including net realized capital gain) that is distributed to shareholders. |
Therefore, no provision for federal income taxes is recorded in the financial statements.
The Fund recognizes the tax benefits of uncertain tax positions only when the position is more likely than not to be sustained. Management has analyzed the Fund’s uncertain tax positions and concluded that no liability for unrecognized tax benefits should be recorded related to uncertain tax positions. Management is not aware of any tax positions for which it is reasonably possible that the total amounts of unrecognized tax benefits will change materially in the next 12 months.
The Fund files tax returns in the U.S. Federal jurisdiction and certain other jurisdictions. Generally, the Fund is subject to examinations by such taxing authorities for up to three years after the filing of the return for the tax period.
| F. | Expenses – Fees provided for under the Rule 12b-1 plan of a particular class of the Fund are charged to the operations of such class. Transfer agency fees and expenses and other shareholder recordkeeping fees and expenses attributable to Class R6 are charged to such class. Transfer agency fees and expenses and other shareholder recordkeeping fees and expenses relating to all other classes are allocated among those classes based on relative net assets. All other expenses are allocated among the classes based on relative net assets. |
| G. | Accounting Estimates – The preparation of financial statements in conformity with accounting principles generally accepted in the United States of America (“GAAP”) requires management to make estimates and assumptions that affect the reported amounts of assets and liabilities at the date of the financial statements and the reported amounts of revenues and expenses during the reporting period including estimates and assumptions related to taxation. Actual results could differ from those estimates by a significant amount. In addition, the Fund monitors for material events or transactions that may occur or become known after the period-end date and before the date the financial statements are released to print. |
| H. | Indemnifications – Under the Trust’s organizational documents, each Trustee, officer, employee or other agent of the Trust is indemnified against certain liabilities that may arise out of the performance of their duties to the Fund. Additionally, in the normal course of business, the Fund enters into contracts, including the Fund’s servicing agreements, that contain a variety of indemnification clauses. The Fund’s maximum exposure under these arrangements is unknown as this would involve future claims that may be made against the Fund that have not yet occurred. The risk of material loss as a result of such indemnification claims is considered remote. |
| I. | Foreign Currency Translations – Foreign currency is valued at the close of the NYSE based on quotations posted by banks and major currency dealers. Portfolio securities and other assets and liabilities denominated in foreign currencies are translated into U.S. dollar amounts at the date of valuation. Purchases and sales of portfolio securities (net of foreign taxes withheld on disposition) and income items denominated in foreign currencies are translated into U.S. dollar amounts on the respective dates of such transactions. The Fund does not separately account for the portion of the results of operations resulting from changes in foreign exchange rates on investments and the fluctuations arising from changes in market prices of securities held. The combined results of changes in foreign exchange rates and the fluctuation of market prices on investments (net of estimated foreign tax withholding) are included with the net realized and unrealized gain or loss from investments in the Statement of Operations. Reported net realized foreign currency gains or losses arise from (1) sales of foreign currencies, (2) currency gains or losses realized between the trade and settlement dates on securities transactions, and (3) the difference between the amounts of dividends, interest, and foreign withholding taxes recorded on the Fund’s books and the U.S. dollar equivalent of the amounts actually received or paid. Net unrealized foreign currency gains and losses arise from changes in the fair values of assets and liabilities, other than investments in securities at fiscal period end, resulting from changes in exchange rates. |
The Fund may invest in foreign securities, which may be subject to foreign taxes on income, gains on investments or currency repatriation, a portion of which may be recoverable. Foreign taxes, if any, are recorded based on the tax regulations and rates that exist in the foreign markets in which the Fund invests and are shown in the Statement of Operations.
| J. | Forward Foreign Currency Contracts – The Fund may engage in foreign currency transactions either on a spot (i.e. for prompt delivery and settlement) basis, or through forward foreign currency contracts, to manage or minimize currency or exchange rate risk. |
The Fund may also enter into forward foreign currency contracts for the purchase or sale of a security denominated in a foreign currency in order to “lock in” the U.S. dollar price of that security, or the Fund may also enter into forward foreign currency contracts that do not provide for physical settlement of the two currencies, but instead are settled by a single cash payment calculated as the difference between the agreed upon exchange rate and the spot rate at settlement based upon an agreed upon notional amount (non-deliverable forwards). The Fund will set aside liquid assets in an amount equal to the daily mark-to-market obligation for forward foreign currency contracts.
A forward foreign currency contract is an obligation between two parties (“Counterparties”) to purchase or sell a specific currency for an agreed-upon price at a future date. The use of forward foreign currency contracts does not eliminate fluctuations in the price of the underlying securities the Fund owns or intends to acquire but establishes a rate of exchange in advance. Fluctuations in the value of these contracts are measured by the difference in the contract date and reporting date exchange rates and are recorded as unrealized appreciation (depreciation) until the contracts are closed. When the contracts are closed, realized gains (losses) are recorded. Realized and unrealized gains (losses) on the contracts are included in the Statement of Operations. The primary risks associated with forward foreign currency contracts include failure of the Counterparty to meet the terms of the contract and the value of the foreign currency changing unfavorably. These risks may be in excess of the amounts reflected in the Statement of Assets and Liabilities.
17 Invesco Small Cap Value Fund
NOTE 2–Advisory Fees and Other Fees Paid to Affiliates
The Trust has entered into a master investment advisory agreement with Invesco Advisers, Inc. (the “Adviser” or “Invesco”). Under the terms of the investment advisory agreement, the Fund accrues daily and pays monthly an advisory fee to the Adviser based on the annual rate of the Fund’s average daily net assets as follows:
| | | | |
| Average Daily Net Assets | | Rate | |
First $ 500 million | | | 0.670 | % |
Next $500 million | | | 0.645 | % |
Over $1 billion | | | 0.620 | % |
For the year ended April 30, 2020, the effective advisory fee rate incurred by the Fund was 0.65%.
Under the terms of a master sub-advisory agreement between the Adviser and each of Invesco Asset Management Deutschland GmbH, Invesco Asset Management Limited, Invesco Asset Management (Japan) Limited, Invesco Hong Kong Limited, Invesco Senior Secured Management, Inc. and Invesco Canada Ltd. (collectively, the “Affiliated Sub-Advisers”) the Adviser, not the Fund, will pay 40% of the fees paid to the Adviser to any such Affiliated Sub-Adviser(s) that provide(s) discretionary investment management services to the Fund based on the percentage of assets allocated to such Affiliated Sub-Adviser(s).
Effective April 17, 2020, the Adviser has contractually agreed, through at least May 31, 2021, to waive advisory fees and/or reimburse expenses of all shares to the extent necessary to limit total annual fund operating expenses after fee waiver and/or expense reimbursement (excluding certain items discussed below) of Class A, Class C, Class R, Class Y and Class R6 shares to 1.25%, 2.00%, 1.50%, 1.00% and 0.93%, respectively, of average daily net assets (the “expense limits”). Prior to April 17, 2020, the Adviser had contractually agreed, through at least June 30, 2020, to waive advisory fees and/or reimburse expenses of all shares to the extent necessary to limit total annual fund operating expenses after fee waivers and/or expense reimbursements (excluding certain items discussed below) of Class A, Class C, Class Y and Class R6 shares to 2.00%, 2.75%, 1.75% and 1.75%, respectively, of average daily net assets. In determining the Adviser’s obligation to waive advisory fees and/or reimburse expenses, the following expenses are not taken into account, and could cause the total annual fund operating expenses after fee waiver and/or expense reimbursement to exceed the numbers reflected above: (1) interest; (2) taxes; (3) dividend expense on short sales; (4) extraordinary or non-routine items, including litigation expenses; and (5) expenses that the Fund has incurred but did not actually pay because of an expense offset arrangement. Unless Invesco continues the fee waiver agreement, it will terminate on May 31, 2021. During its term, the fee waiver agreement cannot be terminated or amended to increase the expense limits or reduce the advisory fee waiver without approval of the Board of Trustees. The Adviser did not waive fees and/or reimburse expenses during the period under these expense limits.
Further, the Adviser has contractually agreed, through at least June 30, 2022, to waive the advisory fee payable by the Fund in an amount equal to 100% of the net advisory fees the Adviser receives from the affiliated money market funds on investments by the Fund of uninvested cash in such affiliated money market funds.
For the year ended April 30, 2020, the Adviser waived advisory fees of $39,240.
The Trust has entered into a master administrative services agreement with Invesco pursuant to which the Fund has agreed to pay Invesco for certain administrative costs incurred in providing accounting services to the Fund. For the year ended April 30, 2020, expenses incurred under the agreement are shown in the Statement of Operations as Administrative services fees. Invesco has entered into a sub-administration agreement whereby State Street Bank and Trust Company (“SSB”) serves as fund accountant and provides certain administrative services to the Fund. Pursuant to a custody agreement with the Trust on behalf of the Fund, SSB also serves as the Fund’s custodian.
The Trust has entered into a transfer agency and service agreement with Invesco Investment Services, Inc. (“IIS”) pursuant to which the Fund has agreed to pay IIS a fee for providing transfer agency and shareholder services to the Fund and reimburse IIS for certain expenses incurred by IIS in the course of providing such services. IIS may make payments to intermediaries that provide omnibus account services, sub-accounting services and/or networking services. All fees payable by IIS to intermediaries that provide omnibus account services or sub-accounting services are charged back to the Fund, subject to certain limitations approved by the Trust’s Board of Trustees. For the year ended April 30, 2020, expenses incurred under the agreement are shown in the Statement of Operations as Transfer agent fees.
Shares of the Fund are distributed by Invesco Distributors, Inc. (“IDI”). The Fund has adopted a distribution plan pursuant to Rule 12b-1 under the 1940 Act, and a service plan (collectively, the “Plans”) for Class A, Class C and Class R shares to compensate IDI for the sale, distribution, shareholder servicing and maintenance of shareholder accounts for these shares. Under the Plans, the Fund will incur annual fees of up to 0.25% of Class A average daily net assets, up to 1.00% of Class C average daily net assets and up to 0.50% of Class R average daily net assets. The fees are accrued daily and paid monthly.
With respect to Class C shares, the Fund is authorized to reimburse in future years any distribution related expenses that exceed the maximum annual reimbursement rate for such class, so long as such reimbursement does not cause the Fund to exceed the Class C maximum annual reimbursement rate, respectively. With respect to Class A shares, distribution related expenses that exceed the maximum annual reimbursement rate for such class are not carried forward to future years and the Fund will not reimburse IDI for any such expenses.
For the year ended April 30, 2020, expenses incurred under these agreements are shown in the Statement of Operations as Distribution fees.
Front-end sales commissions and CDSC (collectively, the “sales charges”) are not recorded as expenses of the Fund. Front-end sales commissions are deducted from proceeds from the sales of Fund shares prior to investment in Class A shares of the Fund. CDSC are deducted from redemption proceeds prior to remittance to the shareholder. During the year ended April 30, 2020, IDI advised the Fund that IDI retained $32,286 in front-end sales commissions from the sale of Class A shares and $506 and $135 from Class A and Class C shares, respectively, for CDSC imposed upon redemptions by shareholders.
For the year ended April 30, 2020, the Fund incurred $7,195 in brokerage commissions with Invesco Capital Markets, Inc., an affiliate of the Adviser and IDI, for portfolio transactions executed on behalf of the Fund.
Certain officers and trustees of the Trust are officers and directors of the Adviser, IIS and/or IDI.
NOTE 3–Additional Valuation Information
GAAP defines fair value as the price that would be received to sell an asset or paid to transfer a liability in an orderly transaction between market participants at the measurement date, under current market conditions. GAAP establishes a hierarchy that prioritizes the inputs to valuation methods, giving the highest priority to readily available unadjusted quoted prices in an active market for identical assets (Level 1) and the lowest priority to significant unobservable inputs (Level 3), generally when market prices are not readily available or are unreliable. Based on the valuation inputs, the securities or other investments are tiered into one of three levels. Changes in valuation methods may result in transfers in or out of an investment’s assigned level:
| | | | |
| Level 1 | | - | | Prices are determined using quoted prices in an active market for identical assets. |
| Level 2 | | - | | Prices are determined using other significant observable inputs. Observable inputs are inputs that other market participants may use in pricing a security. These may include quoted prices for similar securities, interest rates, prepayment speeds, credit risk, yield curves, loss severities, default rates, discount rates, volatilities and others. |
| Level 3 | | - | | Prices are determined using significant unobservable inputs. In situations where quoted prices or observable inputs are unavailable (for example, when there is little or no market activity for an investment at the end of the period), unobservable inputs may be used. Unobservable inputs reflect the Fund’s own assumptions about the factors market participants would use in determining fair value of the securities or instruments and would be based on the best available information. |
18 Invesco Small Cap Value Fund
The following is a summary of the tiered valuation input levels, as of April 30, 2020. The level assigned to the securities valuations may not be an indication of the risk or liquidity associated with investing in those securities. Because of the inherent uncertainties of valuation, the values reflected in the financial statements may materially differ from the value received upon actual sale of those investments.
| | | | | | | | | | | | | | | | |
| | | Level 1 | | | Level 2 | | | Level 3 | | | Total | |
Investments in Securities | | | | | | | | | | | | | | | | |
Common Stocks & Other Equity Interests | | | $884,132,872 | | | | $– | | | | $0 | | | | $884,132,872 | |
Money Market Funds | | | 35,871,575 | | | | – | | | | – | | | | 35,871,575 | |
Total Investments | | | $920,004,447 | | | | $– | | | | $0 | | | | $920,004,447 | |
NOTE 4–Security Transactions with Affiliated Funds
The Fund is permitted to purchase or sell securities from or to certain other Invesco Funds under specified conditions outlined in procedures adopted by the Board of Trustees of the Trust. The procedures have been designed to ensure that any purchase or sale of securities by the Fund from or to another fund or portfolio that is or could be considered an affiliate by virtue of having a common investment adviser (or affiliated investment advisers), common Trustees and/or common officers complies with Rule 17a-7 of the 1940 Act. Further, as defined under the procedures, each transaction is effected at the current market price. Pursuant to these procedures, for the year ended April 30, 2020, the Fund engaged in securities sales of $3,293,460, which resulted in net realized gains of $2,531,127.
NOTE 5–Expense Offset Arrangement(s)
The expense offset arrangement is comprised of transfer agency credits which result from balances in demand deposit accounts used by the transfer agent for clearing shareholder transactions. For the year ended April 30, 2020, the Fund received credits from this arrangement, which resulted in the reduction of the Fund’s total expenses of $2,670.
NOTE 6–Trustees’ and Officers’ Fees and Benefits
Trustees’ and Officers’ Fees and Benefits include amounts accrued by the Fund to pay remuneration to certain Trustees and Officers of the Fund. Trustees have the option to defer compensation payable by the Fund, and Trustees’ and Officers’ Fees and Benefits also include amounts accrued by the Fund to fund such deferred compensation amounts. Those Trustees who defer compensation have the option to select various Invesco Funds in which their deferral accounts shall be deemed to be invested. Finally, certain current Trustees were eligible to participate in a retirement plan that provided for benefits to be paid upon retirement to Trustees over a period of time based on the number of years of service. The Fund may have certain former Trustees who also participate in a retirement plan and receive benefits under such plan. Trustees’ and Officers’ Fees and Benefits include amounts accrued by the Fund to fund such retirement benefits. Obligations under the deferred compensation and retirement plans represent unsecured claims against the general assets of the Fund.
NOTE 7–Cash Balances
The Fund is permitted to temporarily carry a negative or overdrawn balance in its account with SSB, the custodian bank. Such balances, if any at period-end, are shown in the Statement of Assets and Liabilities under the payable caption Amount due custodian. To compensate the custodian bank for such overdrafts, the overdrawn Fund may either (1) leave funds as a compensating balance in the account so the custodian bank can be compensated by earning the additional interest; or (2) compensate by paying the custodian bank at a rate agreed upon by the custodian bank and Invesco, not to exceed the contractually agreed upon rate. The Fund may not purchase additional securities when any borrowings from banks or broker-dealers exceed 5% of the Fund’s total assets, or when any borrowings from an Invesco Fund are outstanding.
NOTE 8–Distributions to Shareholders and Tax Components of Net Assets
Tax Character of Distributions to Shareholders Paid During the Fiscal Years Ended April 30, 2020 and 2019:
| | | | | | | | |
| | | 2020 | | | 2019 | |
| |
Ordinary income | | $ | 3,775,639 | | | $ | 22,332,893 | |
| |
Long-term capital gain | | | 29,462,465 | | | | 309,839,278 | |
| |
Total distributions | | $ | 33,238,104 | | | $ | 332,172,171 | |
| |
| | |
| Tax Components of Net Assets at Period-End: | | | | | | | | |
| | |
| | | | | | 2020 | |
| |
Net unrealized appreciation (depreciation) – investments | | | | | | $ | (178,690,554 | ) |
| |
Temporary book/tax differences | | | | | | | (239,232 | ) |
| |
Post-October capital loss deferral | | | | | | | (168,375,417 | ) |
| |
Capital loss carryforward | | | | | | | (5,596,317 | ) |
| |
Shares of beneficial interest | | | | | | | 1,257,834,347 | |
| |
Total net assets | | | | | | $ | 904,932,827 | |
| |
The difference between book-basis and tax-basis unrealized appreciation (depreciation) is due to differences in the timing of recognition of gains and losses on investments for tax and book purposes. The Fund’s net unrealized appreciation (depreciation) difference is attributable primarily to wash sales.
The temporary book/tax differences are a result of timing differences between book and tax recognition of income and/or expenses. The Fund’s temporary book/tax differences are the result of the trustee deferral of compensation and retirement plan benefits.
Capital loss carryforward is calculated and reported as of a specific date. Results of transactions and other activity after that date may affect the amount of capital loss carryforward actually available for the Fund to utilize. The ability to utilize capital loss carryforward in the future may be limited under the Internal Revenue Code and related regulations based on the results of future transactions.
19 Invesco Small Cap Value Fund
The Fund has a capital loss carryforward as of April 30, 2020, as follows:
| | | | | | | | | | | | |
| Capital Loss Carryforward* | |
| Expiration | | Short-Term | | | Long-Term | | | Total | |
Not subject to expiration | | | $5,370,492 | | | | $225,825 | | | | $5,596,317 | |
| * | Capital loss carryforward is reduced for limitations, if any, to the extent required by the Internal Revenue Code and may be further limited depending upon a variety of factors, including the realization of net unrealized gains or losses as of the date of any reorganization. |
NOTE 9–Investment Transactions
The aggregate amount of investment securities (other than short-term securities, U.S. Treasury obligations and money market funds, if any) purchased and sold by the Fund during the year ended April 30, 2020 was $576,228,786 and $872,845,893, respectively. Cost of investments, including any derivatives, on a tax basis includes the adjustments for financial reporting purposes as of the most recently completed federal income tax reporting period-end.
| | | | |
| Unrealized Appreciation (Depreciation) of Investments on a Tax Basis | |
| |
Aggregate unrealized appreciation of investments | | $ | 75,735,915 | |
| |
Aggregate unrealized (depreciation) of investments | | | (254,426,469 | ) |
| |
Net unrealized appreciation (depreciation) of investments | | $ | (178,690,554 | ) |
| |
| |
Cost of investments for tax purposes is $1,098,695,001. | | | | |
NOTE 10–Reclassification of Permanent Differences
Primarily as a result of differing book/tax treatment of distribution redesignation and target merger, on April 30, 2020, undistributed net investment income was decreased by $3,428,935 and undistributed net realized gain (loss) was increased by $3,428,935. Further, as a result of tax deferrals acquired in the reorganization of Invesco Oppenheimer Small Cap Value Fund into the Fund, undistributed net investment income was decreased by $2,719, undistributed net realized gain (loss) was decreased by $7,264,015 and shares of beneficial interest was increased by $7,266,734. These reclassifications had no effect on the net assets or the distributable earnings (loss) of the Fund.
NOTE 11–Share Information
| | | | | | | | | | | | | | | | |
| | | | | | Summary of Share Activity | | | | |
| |
| | | Year ended | | | Year ended | |
| | | April 30, 2020(a) | | | April 30, 2019 | |
| | | Shares | | | Amount | | | Shares | | | Amount | |
| |
Sold: | | | | | | | | | | | | | | | | |
Class A | | | 5,513,281 | | | $ | 65,029,289 | | | | 6,438,723 | | | $ | 99,781,448 | |
| |
Class C | | | 257,674 | | | | 1,809,377 | | | | 291,115 | | | | 2,707,631 | |
| |
Class R | | | 997 | | | | 8,461 | | | | - | | | | - | |
| |
Class Y | | | 10,879,758 | | | | 128,592,730 | | | | 12,975,591 | | | | 209,325,329 | |
| |
Class R6 | | | 2,524,904 | | | | 27,936,888 | | | | 4,523,594 | | | | 75,108,753 | |
| |
| | | | |
Issued as reinvestment of dividends: | | | | | | | | | | | | | | | | |
Class A | | | 968,857 | | | | 13,670,573 | | | | 10,919,128 | | | | 126,771,080 | |
| |
Class C | | | 60,377 | | | | 529,507 | | | | 1,808,563 | | | | 13,347,193 | |
| |
Class Y | | | 982,726 | | | | 14,760,539 | | | | 12,834,262 | | | | 157,989,771 | |
| |
Class R6 | | | 111,445 | | | | 1,682,825 | | | | 601,408 | | | | 7,433,399 | |
| |
| | | | |
Automatic conversion of Class C shares to Class A shares: | | | | | | | | | | | | | | | | |
Class A | | | 545,253 | | | | 6,869,152 | | | | 2,045,445 | | | | 26,511,273 | |
| |
Class C | | | (868,496 | ) | | | (6,869,152 | ) | | | (3,220,634 | ) | | | (26,511,273 | ) |
| |
| | | | |
Issued in connection with acquisitions:(b) | | | | | | | | | | | | | | | | |
Class A | | | 1,439,465 | | | | 12,226,769 | | | | - | | | | - | |
| |
Class C | | | 508,981 | | | | 2,679,898 | | | | - | | | | - | |
| |
Class R | | | 402,791 | | | | 3,420,152 | | | | - | | | | - | |
| |
Class Y | | | 149,197 | | | | 1,349,862 | | | | - | | | | - | |
| |
Class R6 | | | 2,554 | | | | 23,256 | | | | - | | | | - | |
| |
20 Invesco Small Cap Value Fund
| | | | | | | | | | | | | | | | |
| | | | | | Summary of Share Activity | | | | |
| |
| | | Year ended | | | Year ended | |
| | | April 30, 2020(a) | | | April 30, 2019 | |
| | | Shares | | | Amount | | | Shares | | | Amount | |
| |
| | | | |
Reacquired: | | | | | | | | | | | | | | | | |
Class A | | | (16,723,769 | ) | | $ | (208,999,550 | ) | | | (22,831,931 | ) | | $ | (354,638,694 | ) |
| |
Class C | | | (729,153 | ) | | | (5,936,262 | ) | | | (2,151,563 | ) | | | (23,563,125 | ) |
| |
Class R | | | (1,667 | ) | | | (13,735 | ) | | | - | | | | - | |
| |
Class Y | | | (25,902,782 | ) | | | (342,491,687 | ) | | | (39,393,058 | ) | | | (643,740,372 | ) |
| |
Class R6 | | | (1,114,436 | ) | | | (15,116,164 | ) | | | (2,151,890 | ) | | | (32,769,254 | ) |
| |
Net increase (decrease) in share activity | | | (20,992,043 | ) | | $ | (298,837,272 | ) | | | (17,311,247 | ) | | $ | (362,246,841 | ) |
| |
| (a) | There are entities that are record owners of more than 5% of the outstanding shares of the Fund and in the aggregate own 29% of the outstanding shares of the Fund. IDI has an agreement with these entities to sell Fund shares. The Fund, Invesco and/or Invesco affiliates may make payments to these entities, which are considered to be related to the Fund, for providing services to the Fund, Invesco and/or Invesco affiliates including but not limited to services such as securities brokerage, distribution, third party record keeping and account servicing. The Fund has no knowledge as to whether all or any portion of the shares owned of record by these entities are also owned beneficially. |
| (b) | After the close of business on April 17, 2020, the Fund acquired all the net assets of Invesco Oppenheimer Small Cap Value Fund (the “Target Fund”) pursuant to a plan of reorganization approved by the Board of Trustees of the Fund on February 14, 2020. The reorganization was executed in order to reduce overlap and increase efficiencies in the Adviser’s product line. The acquisition was accomplished by a tax-free exchange of 2,502,988 shares of the Fund for 2,861,156 shares outstanding of the Target Fund as of the close of business on April 17, 2020. Shares of the Target Fund were exchanged for the like class of shares of the Fund, based on the relative net asset value of the Target Fund to the net asset value of the Fund on the close of business, April 17, 2020. The Target Fund’s net assets as of the close of business on April 17, 2020 of $19,699,937, including $(6,059,914) of unrealized appreciation (depreciation), were combined with those of the Fund. The net assets of the Fund immediately before the acquisition were $775,042,726 and $794,742,663 immediately after the acquisition. |
The pro forma results of operations for the year ended April 30, 2020 assuming the reorganization had been completed on May 1, 2019, the beginning of the annual reporting period are as follows:
| | | | |
Net investment income | | $ | 3,901,731 | |
| |
Net realized/unrealized gains (losses) | | | (405,370,942 | ) |
| |
Change in net assets resulting from operations | | $ | (401,469,211 | ) |
| |
As the combined investment portfolios have been managed as a single integrated portfolio since the acquisition was completed, it is not practicable to separate the amounts of revenue and earnings of the Target Fund that has been included in the Fund’s Statement of Operations since April 18, 2020.
NOTE 12–Coronavirus (COVID-19) Pandemic
During the first quarter of 2020, the World Health Organization declared COVID-19 to be a public health emergency. COVID-19 has led to increased short-term market volatility and may have adverse long-term effects on U.S. and world economies and markets in general. COVID-19 may adversely impact the Fund’s ability to achieve its investment objective. Because of the uncertainties on valuation, the global economy and business operations, values reflected in these financial statements may materially differ from the value received upon actual sales of those investments.
The extent of the impact on the performance of the Fund and its investments will depend on future developments, including the duration and spread of the COVID-19 outbreak, related restrictions and advisories, and the effects on the financial markets and economy overall, all of which are highly uncertain and cannot be predicted.
21 Invesco Small Cap Value Fund
Report of Independent Registered Public Accounting Firm
To the Board of Trustees of AIM Sector Funds (Invesco Sector Funds) and Shareholders of Invesco Small Cap Value Fund
Opinion on the Financial Statements
We have audited the accompanying statement of assets and liabilities, including the schedule of investments, of Invesco Small Cap Value Fund (one of the funds constituting AIM Sector Funds (Invesco Sector Funds), referred to hereafter as the “Fund”) as of April 30, 2020, the related statement of operations for the year ended April 30, 2020, the statement of changes in net assets for each of the two years in the period ended April 30, 2020, including the related notes, and the financial highlights for each of the periods indicated therein (collectively referred to as the “financial statements”). In our opinion, the financial statements present fairly, in all material respects, the financial position of the Fund as of April 30, 2020, the results of its operations for the year then ended, the changes in its net assets for each of the two years in the period ended April 30, 2020 and the financial highlights for each of the periods indicated therein in conformity with accounting principles generally accepted in the United States of America.
Basis for Opinion
These financial statements are the responsibility of the Fund’s management. Our responsibility is to express an opinion on the Fund’s financial statements based on our audits. We are a public accounting firm registered with the Public Company Accounting Oversight Board (United States) (PCAOB) and are required to be independent with respect to the Fund in accordance with the U.S. federal securities laws and the applicable rules and regulations of the Securities and Exchange Commission and the PCAOB.
We conducted our audits of these financial statements in accordance with the standards of the PCAOB. Those standards require that we plan and perform the audit to obtain reasonable assurance about whether the financial statements are free of material misstatement, whether due to error or fraud.
Our audits included performing procedures to assess the risks of material misstatement of the financial statements, whether due to error or fraud, and performing procedures that respond to those risks. Such procedures included examining, on a test basis, evidence regarding the amounts and disclosures in the financial statements. Our audits also included evaluating the accounting principles used and significant estimates made by management, as well as evaluating the overall presentation of the financial statements. Our procedures included confirmation of securities owned as of April 30, 2020 by correspondence with the custodian, transfer agent and brokers; when replies were not received from brokers, we performed other auditing procedures. We believe that our audits provide a reasonable basis for our opinion.
/s/PricewaterhouseCoopers LLP
Houston, Texas
June 26, 2020
We have served as the auditor of one or more of the investment companies in the Invesco group of investment companies since at least 1995. We have not been able to determine the specific year we began serving as auditor.
22 Invesco Small Cap Value Fund
Calculating your ongoing Fund expenses
Example
As a shareholder of the Fund, you incur two types of costs: (1) transaction costs, which may include sales charges (loads) on purchase payments or contingent deferred sales charges on redemptions, if any; and (2) ongoing costs, including management fees, distribution and/or service (12b-1) fees, and other Fund expenses. This example is intended to help you understand your ongoing costs (in dollars) of investing in the Fund and to compare these costs with ongoing costs of investing in other mutual funds. With the exception of the actual ending account value and expenses of the Class R shares, the example is based on an investment of $1,000 invested at the beginning of the period and held for the entire period November 1, 2019 through April 30, 2020. The actual ending account value and expenses for the Class R shares in the example below are based on an investment of $1,000 invested as of close of business April 17, 2020 (commencement date) and held through April 30, 2020.
Actual expenses
The table below provides information about actual account values and actual expenses. You may use the information in this table, together with the amount you invested, to estimate the expenses that you paid over the period. Simply divide your account value by $1,000 (for example, an $8,600 account value divided by $1,000 = 8.6), then multiply the result by the number in the table under the heading entitled “Actual Expenses Paid During Period” to estimate the expenses you paid on your account during this period (as of close of business April 17, 2020 through April 30, 2020 for the Class R shares). Because the actual ending account value and expense information in the example is not based upon a six month period for the Class R shares, the ending account value and expense information may not provide a meaningful comparison to mutual funds that provide such information for a full six month period.
Hypothetical example for comparison purposes
The table below also provides information about hypothetical account values and hypothetical expenses based on the Fund’s actual expense ratio and an assumed rate of return of 5% per year before expenses, which is not the Fund’s actual return.
The hypothetical account values and expenses may not be used to estimate the actual ending account balance or expenses you paid for the period. You may use this information to compare the ongoing costs of investing in the Fund and other funds. To do so, compare this 5% hypothetical example with the 5% hypothetical examples that appear in the shareholder reports of the other funds.
Please note that the expenses shown in the table are meant to highlight your ongoing costs only and do not reflect any transaction costs, such as sales charges (loads) on purchase payments or contingent deferred sales charges on redemptions, if any. Therefore, the hypothetical information is useful in comparing ongoing costs only, and will not help you determine the relative total costs of owning different funds. In addition, if these transaction costs were included, your costs would have been higher.
| | | | | | | | | | | | |
| | | Beginning Account Value (11/01/19) | | ACTUAL | | HYPOTHETICAL (5% annual return before expenses) | | Annualized Expense Ratio |
| | Ending
Account Value (04/30/20)1 | | Expenses Paid During Period2 | | Ending Account Value (04/30/20) | | Expenses Paid During Period3 |
Class A | | $1,000.00 | | $733.00 | | $4.87 | | $1,019.24 | | $5.67 | | 1.13% |
Class C | | 1,000.00 | | 730.10 | | 7.91 | | 1,015.71 | | 9.22 | | 1.84 |
Class R | | 1,000.00 | | 1,131.90 | | 0.44 | | 1,018.05 | | 6.87 | | 1.37 |
Class Y | | 1,000.00 | | 734.10 | | 3.79 | | 1,020.49 | | 4.42 | | 0.88 |
Class R6 | | 1,000.00 | | 734.70 | | 3.02 | | 1,021.38 | | 3.52 | | 0.70 |
| 1 | The actual ending account value is based on the actual total return of the Funds for the period November 1, 2019, through April 30, 2020 (as of close of business April 17, 2020, through April 30, 2020 for the Class R shares), after actual expenses and will differ from the hypothetical ending account value which is based on the Fund’s expense ratio and a hypothetical annual return of 5% before expenses. |
| 2 | Expenses are equal to each Fund’s annualized expense ratio as indicated above multiplied by the average account value over the period, multiplied by 182/366 to reflect the most recent fiscal half year. For the Class R shares actual expenses are equal to the annualized expense ratio indicated above multiplied by the average account value over the period, multiplied by 11 (as of close of business April 17, 2020, through April 30, 2020)/366. Because the Class R shares have not been in existence for a full six month period, the actual ending account value and expense information shown may not provide a meaningful comparison to fund expense information of classes that show such data for a full six month period and, because the actual ending account value and expense information in the expense example covers a short time period, return and expense data may not be indicative of return and expense data for longer time periods. |
| 3 | Hypothetical expenses are equal to the annualized expense ratio indicated above multiplied by the average account value over the period, multiplied by 182/366 to reflect a one-half year period. The hypothetical ending account value and expenses may be used to compare ongoing costs of investing in Class R shares of each Fund and other funds because such data is based on a full six months period. |
23 Invesco Small Cap Value Fund
Tax Information
Form 1099-DIV, Form 1042-S and other year–end tax information provide shareholders with actual calendar year amounts that should be included in their tax returns. Shareholders should consult their tax advisers.
The following distribution information is being provided as required by the Internal Revenue Code or to meet a specific state’s requirement.
The Fund designates the following amounts or, if subsequently determined to be different, the maximum amount allowable for its fiscal year ended April 30, 2020:
| | | | | | |
Federal and State Income Tax | | | | | | |
Long-term Capital Gain Distributions | | | 29,462,465 | | | |
Qualified Dividend Income* | | | 100.00 | % | | |
Corporate Dividends Received Deduction* | | | 100.00 | % | | |
U.S. Treasury Obligations* | | | 0.00 | % | | |
| | * | The above percentages are based on ordinary income dividends paid to shareholders during the Fund’s fiscal year. |
24 Invesco Small Cap Value Fund
Trustees and Officers
The address of each trustee and officer is AIM Sector Funds (Invesco Sector Funds) (the “Trust”), 11 Greenway Plaza, Suite 1000, Houston, Texas 77046-1173. The trustees serve for the life of the Trust, subject to their earlier death, incapacitation, resignation, retirement or removal as more specifically provided in the Trust’s organizational documents. Each officer serves for a one year term or until their successors are elected and qualified. Column two below includes length of time served with predecessor entities, if any.
| | | | | | | | | | | | |
Name, Year of Birth and
Position(s) Held with the Trust | | Trustee and/or Officer Since | | | Principal Occupation(s) During Past 5 Years | | Number of Funds in Fund Complex
Overseen by
Trustee | | | Other Directorship(s) Held by Trustee During Past 5 Years |
Interested Trustee | | | | | | | | | | | | |
Martin L. Flanagan1 - 1960 Trustee and Vice Chair | | | 2007 | | | Executive Director, Chief Executive Officer and President, Invesco Ltd. (ultimate parent of Invesco and a global investment management firm); Trustee and Vice Chair, The Invesco Funds; Vice Chair, Investment Company Institute; and Member of Executive Board, SMU Cox School of Business Formerly: Advisor to the Board, Invesco Advisers, Inc. (formerly known as Invesco Institutional (N.A.), Inc.); Chairman and Chief Executive Officer, Invesco Advisers, Inc. (registered investment adviser); Director, Chairman, Chief Executive Officer and President, Invesco Holding Company (US), Inc. (formerly IVZ Inc.) (holding company), Invesco Group Services, Inc. (service provider) and Invesco North American Holdings, Inc. (holding company); Director, Chief Executive Officer and President, Invesco Holding Company Limited (parent of Invesco and a global investment management firm); Director, Invesco Ltd.; Chairman, Investment Company Institute and President, Co-Chief Executive Officer, Co-President, Chief Operating Officer and Chief Financial Officer, Franklin Resources, Inc. (global investment management organization) | | | 203 | | | None |
| 1 | Mr. Flanagan is considered an interested person (within the meaning of Section 2(a)(19) of the 1940 Act) of the Trust because he is an officer of the Adviser to the Trust, and an officer and a director of Invesco Ltd., ultimate parent of the Adviser. |
T-1 Invesco Small Cap Value Fund
Trustees and Officers–(continued)
| | | | | | | | |
Name, Year of Birth and
Position(s) Held with the Trust | | Trustee and/or Officer Since | | Principal Occupation(s) During Past 5 Years | | Number of Funds in Fund Complex Overseen by Trustee | | Other Directorship(s) Held by Trustee During Past 5 Years |
Independent Trustees |
Bruce L. Crockett - 1944 Trustee and Chair | | 2003 | | Chairman, Crockett Technologies Associates (technology consulting company) Formerly: Director, Captaris (unified messaging provider); Director, President and Chief Executive Officer, COMSAT Corporation; Chairman, Board of Governors of INTELSAT (international communications company); ACE Limited (insurance company); Independent Directors Council and Investment Company Institute: Member of the Audit Committee, Investment Company Institute; Member of the Executive Committee and Chair of the Governance Committee, Independent Directors Council | | 203 | | Director and Chairman of the Audit Committee, ALPS (Attorneys Liability Protection Society) (insurance company); Director and Member of the Audit Committee and Compensation Committee, Ferroglobe PLC (metallurgical company) |
David C. Arch - 1945 Trustee | | 2010 | | Chairman of Blistex Inc. (consumer health care products manufacturer); Member, World Presidents’ Organization | | 203 | | Board member of the Illinois Manufacturers’ Association |
Beth Ann Brown - 1968 Trustee | | 2019 | | Independent Consultant Formerly: Head of Intermediary Distribution, Managing Director, Strategic Relations, Managing Director, Head of National Accounts, Senior Vice President, National Account Manager and Senior Vice President, Key Account Manager, Columbia Management Investment Advisers LLC; Vice President, Key Account Manager, Liberty Funds Distributor, Inc.; and Trustee of certain Oppenheimer Funds | | 203 | | Director, Board of Directors of Caron Engineering Inc.; Advisor, Board of Advisors of Caron Engineering Inc.; President and Director, Acton Shapleigh Youth Conservation Corps (non - profit); and Vice President and Director of Grahamtastic Connection (non-profit) |
Jack M. Fields - 1952 Trustee | | 2003 | | Chief Executive Officer, Twenty First Century Group, Inc. (government affairs company); and Chairman, Discovery Learning Alliance (non-profit) Formerly: Owner and Chief Executive Officer, Dos Angeles Ranch L.P. (cattle, hunting, corporate entertainment); Director, Insperity, Inc. (formerly known as Administaff) (human resources provider); Chief Executive Officer, Texana Timber LP (sustainable forestry company); Director of Cross Timbers Quail Research Ranch (non-profit); and member of the U.S. House of Representatives | | 203 | | Member, Board of Directors of Baylor College of Medicine |
T-2 Invesco Small Cap Value Fund
Trustees and Officers–(continued)
| | | | | | | | |
Name, Year of Birth and
Position(s) Held with the Trust | | Trustee and/or Officer Since | | Principal Occupation(s) During Past 5 Years | | Number of Funds in Fund Complex Overseen by Trustee | | Other Directorship(s) Held by Trustee During Past 5 Years |
Independent Trustees–(continued) | | | | |
Cynthia Hostetler - 1962 Trustee | | 2017 | | Non-Executive Director and Trustee of a number of public and private business corporations Formerly: Director, Aberdeen Investment Funds (4 portfolios); Head of Investment Funds and Private Equity, Overseas Private Investment Corporation; President, First Manhattan Bancorporation, Inc.; Attorney, Simpson Thacher & Bartlett LLP | | 203 | | Vulcan Materials Company (construction materials company); Trilinc Global Impact Fund; Genesee & Wyoming, Inc. (railroads); Artio Global Investment LLC (mutual fund complex); Edgen Group, Inc. (specialized energy and infrastructure products distributor); Investment Company Institute (professional organization); Independent Directors Council (professional organization) |
Eli Jones - 1961 Trustee | | 2016 | | Professor and Dean, Mays Business School - Texas A&M University Formerly: Professor and Dean, Walton College of Business, University of Arkansas and E.J. Ourso College of Business, Louisiana State University; Director, Arvest Bank | | 229 | | Insperity, Inc. (formerly known as Administaff) (human resources provider) |
Elizabeth Krentzman - 1959 Trustee | | 2019 | | Formerly: Principal and Chief Regulatory Advisor for Asset Management Services and U.S. Mutual Fund Leader of Deloitte & Touche LLP; General Counsel of the Investment Company Institute (trade association); National Director of the Investment Management Regulatory Consulting Practice, Principal, Director and Senior Manager of Deloitte & Touche LLP; Assistant Director of the Division of Investment Management-Office of Disclosure and Investment Adviser Regulation of the U.S. Securities and Exchange Commission and various positions with the Division of Investment Management – Office of Regulatory Policy of the U.S. Securities and Exchange Commission; Associate at Ropes & Gray LLP; Advisory Board Member of the Securities and Exchange Commission Historical Society; and Trustee of certain Oppenheimer Funds | | 203 | | Trustee of the University of Florida National Board Foundation and Audit Committee Member; Member of the Cartica Funds Board of Directors (private investment funds); Member of the University of Florida Law Center Association, Inc. Board of Trustees and Audit Committee Member |
Anthony J. LaCava, Jr. - 1956 Trustee | | 2019 | | Formerly: Director and Member of the Audit Committee, Blue Hills Bank (publicly traded financial institution) and Managing Partner, KPMG LLP | | 203 | | Blue Hills Bank; Chairman, Bentley University; Member, Business School Advisory Council; and Nominating Committee KPMG LLP |
Prema Mathai-Davis - 1950 Trustee | | 2003 | | Retired Co-Owner & Partner of Quantalytics Research, LLC, (a FinTech Investment Research Platform for the Self-Directed Investor) | | 203 | | None |
T-3 Invesco Small Cap Value Fund
Trustees and Officers–(continued)
| | | | | | | | |
Name, Year of Birth and
Position(s) Held with the Trust | | Trustee and/or Officer Since | | Principal Occupation(s) During Past 5 Years | | Number of Funds in Fund Complex Overseen by Trustee | | Other Directorship(s) Held by Trustee During Past 5 Years |
Independent Trustees–(continued) | | | | |
Joel W. Motley - 1952 Trustee | | 2019 | | Director of Office of Finance, Federal Home Loan Bank System; Member of the Vestry of Trinity Wall Street; Managing Director of Carmona Motley Inc. (privately held financial advisor); Member of the Council on Foreign Relations and its Finance and Budget Committee; Chairman Emeritus of Board of Human Rights Watch and Member of its Investment Committee; and Member of Investment Committee and Board of Historic Hudson Valley (non-profit cultural organization) Formerly: Managing Director of Public Capital Advisors, LLC (privately held financial advisor); Managing Director of Carmona Motley Hoffman, Inc. (privately held financial advisor); Trustee of certain Oppenheimer Funds; and Director of Columbia Equity Financial Corp. (privately held financial advisor) | | 203 | | Member of Board of Greenwall Foundation (bioethics research foundation) and its Investment Committee; Member of Board of Friends of the LRC (non-profit legal advocacy); Board Member and Investment Committee Member of Pulizer Center for Crisis Reporting (non-profit journalism) |
Teresa M. Ressel - 1962 Trustee | | 2017 | | Non-executive director and trustee of a number of public and private business corporations Formerly: Chief Financial Officer, Olayan America, The Olayan Group (international investor/commercial/industrial); Chief Executive Officer, UBS Securities LLC; Group Chief Operating Officer, Americas, UBS AG; Assistant Secretary for Management & Budget and CFO, US Department of the Treasury | | 203 | | Atlantic Power Corporation (power generation company); ON Semiconductor Corp. (semiconductor supplier) |
Ann Barnett Stern - 1957 Trustee | | 2017 | | President and Chief Executive Officer, Houston Endowment Inc. (private philanthropic institution) Formerly: Executive Vice President and General Counsel, Texas Children’s Hospital; Attorney, Beck, Redden and Secrest, LLP; Business Law Instructor, University of St. Thomas; Attorney, Andrews & Kurth LLP | | 203 | | Federal Reserve Bank of Dallas |
Robert C. Troccoli - 1949 Trustee | | 2016 | | Retired Formerly: Adjunct Professor, University of Denver – Daniels College of Business; Senior Partner, KPMG LLP | | 203 | | None |
Daniel S. Vandivort -1954 Trustee | | 2019 | | Treasurer, Chairman of the Audit and Finance Committee, and Trustee, Board of Trustees, Huntington Disease Foundation of America; and President, Flyway Advisory Services LLC (consulting and property management) Formerly: Trustee and Governance Chair, of certain Oppenheimer Funds | | 203 | | Chairman and Lead Independent Director, Chairman of the Audit Committee, and Director, Board of Directors, Value Line Funds |
James D. Vaughn - 1945 Trustee | | 2019 | | Retired Formerly: Managing Partner, Deloitte & Touche LLP; Trustee and Chairman of the Audit Committee, Schroder Funds; Board Member, Mile High United Way, Boys and Girls Clubs, Boy Scouts, Colorado Business Committee for the Arts, Economic Club of Colorado and Metro Denver Network (economic development corporation); and Trustee of certain Oppenheimer Funds | | 203 | | Board member and Chairman of Audit Committee of AMG National Trust Bank; Trustee and Investment Committee member, University of South Dakota Foundation; Board member, Audit Committee Member and past Board Chair, Junior Achievement (non-profit) |
Christopher L. Wilson - 1957 Trustee, Vice Chair and Chair Designate | | 2017 | | Retired Formerly: Director, TD Asset Management USA Inc. (mutual fund complex) (22 portfolios); Managing Partner, CT2, LLC (investing and consulting firm); President/Chief Executive Officer, Columbia Funds, Bank of America Corporation; President/Chief Executive Officer, CDC IXIS Asset Management Services, Inc.; Principal & Director of Operations, Scudder Funds, Scudder, Stevens & Clark, Inc.; Assistant Vice President, Fidelity Investments | | 203 | | ISO New England, Inc. (non-profit organization managing regional electricity market) |
T-4 Invesco Small Cap Value Fund
Trustees and Officers–(continued)
| | | | | | | | |
Name, Year of Birth and
Position(s) Held with the Trust | | Trustee and/or Officer Since | | Principal Occupation(s) During Past 5 Years | | Number of Funds in Fund Complex Overseen by Trustee | | Other Directorship(s) Held by Trustee During Past 5 Years |
| Officers | | |
Sheri Morris - 1964 President, Principal Executive Officer and Treasurer | | 2003 | | Head of Global Fund Services, Invesco Ltd.; President, Principal Executive Officer and Treasurer, The Invesco Funds; Vice President, Invesco Advisers, Inc. (formerly known as Invesco Institutional (N.A.), Inc.) (registered investment adviser); and Vice President, Invesco Exchange-Traded Fund Trust, Invesco Exchange-Traded Fund Trust II, Invesco India Exchange-Traded Fund Trust, Invesco Actively Managed Exchange-Traded Fund Trust, Invesco Actively Managed Exchange-Traded Commodity Fund Trust and Invesco Exchange-Traded Self-Indexed Fund Trust; and Vice President, OppenheimerFunds, Inc. Formerly: Vice President and Principal Financial Officer, The Invesco Funds; Vice President, Invesco AIM Advisers, Inc., Invesco AIM Capital Management, Inc. and Invesco AIM Private Asset Management, Inc.; Assistant Vice President and Assistant Treasurer, The Invesco Funds and Assistant Vice President, Invesco Advisers, Inc., Invesco AIM Capital Management, Inc. and Invesco AIM Private Asset Management, Inc.; and Treasurer, Invesco Exchange-Traded Fund Trust, Invesco Exchange-Traded Fund Trust II, Invesco India Exchange-Traded Fund Trust and Invesco Actively Managed Exchange-Traded Fund Trust | | N/A | | N/A |
Russell C. Burk - 1958 Senior Vice President and Senior Officer | | 2005 | | Senior Vice President and Senior Officer, The Invesco Funds | | N/A | | N/A |
Jeffrey H. Kupor - 1968 Senior Vice President, Chief Legal Officer and Secretary | | 2018 | | Head of Legal of the Americas, Invesco Ltd.; Senior Vice President and Secretary, Invesco Advisers, Inc. (formerly known as Invesco Institutional (N.A.), Inc.) (registered investment adviser); Senior Vice President and Secretary, Invesco Distributors, Inc. (formerly known as Invesco AIM Distributors, Inc.); Vice President and Secretary, Invesco Investment Services, Inc. (formerly known as Invesco AIM Investment Services, Inc.) Senior Vice President, Chief Legal Officer and Secretary, The Invesco Funds; Secretary and General Counsel, Invesco Investment Advisers LLC (formerly known as Van Kampen Asset Management); Secretary and General Counsel, Invesco Capital Markets, Inc. (formerly known as Van Kampen Funds Inc.) and Chief Legal Officer, Invesco Exchange-Traded Fund Trust, Invesco Exchange-Traded Fund Trust II, Invesco India Exchange-Traded Fund Trust, Invesco Actively Managed Exchange-Traded Fund Trust, Invesco Actively Managed Exchange-Traded Commodity Fund Trust and Invesco Exchange-Traded Self-Indexed Fund Trust; Secretary, Invesco Indexing LLC; Secretary, W.L. Ross & Co., LLC Formerly: Secretary and Vice President, Jemstep, Inc.; Head of Legal, Worldwide Institutional, Invesco Ltd.; Secretary and General Counsel, INVESCO Private Capital Investments, Inc.; Senior Vice President, Secretary and General Counsel, Invesco Management Group, Inc. (formerly known as Invesco AIM Management Group, Inc.); Assistant Secretary, INVESCO Asset Management (Bermuda) Ltd.; Secretary and General Counsel, Invesco Private Capital, Inc.; Assistant Secretary and General Counsel, INVESCO Realty, Inc.; Secretary and General Counsel, Invesco Senior Secured Management, Inc.; and Secretary, Sovereign G./P. Holdings Inc. | | N/A | | N/A |
Andrew R. Schlossberg - 1974 Senior Vice President | | 2019 | | Head of the Americas and Senior Managing Director, Invesco Ltd.; Director and Senior Vice President, Invesco Advisers, Inc. (formerly known as Invesco Institutional (N.A.), Inc.) (registered investment adviser); Director and Chairman, Invesco Investment Services, Inc. (formerly known as Invesco AIM Investment Services, Inc.) (registered transfer agent); Senior Vice President, The Invesco Funds; Director, Invesco Investment Advisers LLC (formerly known as Van Kampen Asset Management); Director, President and Chairman, Invesco Insurance Agency, Inc. Formerly: Director, Invesco UK Limited; Director and Chief Executive, Invesco Asset Management Limited and Invesco Fund Managers Limited; Assistant Vice President, The Invesco Funds; Senior Vice President, Invesco Advisers, Inc. (formerly known as Invesco Institutional (N.A.), Inc.) (registered investment adviser); Director and Chief Executive, Invesco Administration Services Limited and Invesco Global Investment Funds Limited; Director, Invesco Distributors, Inc.; Head of EMEA, Invesco Ltd.; President, Invesco Actively Managed Exchange-Traded Commodity Fund Trust, Invesco Actively Managed Exchange-Traded Fund Trust, Invesco Exchange-Traded Fund Trust, Invesco Exchange-Traded Fund Trust II and Invesco India Exchange-Traded Fund Trust; Managing Director and Principal Executive Officer, Invesco Capital Management LLC | | N/A | | N/A |
T-5 Invesco Small Cap Value Fund
Trustees and Officers–(continued)
| | | | | | | | |
Name, Year of Birth and
Position(s) Held with the Trust | | Trustee and/or Officer Since | | Principal Occupation(s) During Past 5 Years | | Number of Funds in Fund Complex Overseen by Trustee | | Other Directorship(s) Held by Trustee During Past 5 Years |
| Officers–(continued) | | |
John M. Zerr - 1962 Senior Vice President | | 2006 | | Chief Operating Officer of the Americas; Senior Vice President, Invesco Advisers, Inc. (formerly known as Invesco Institutional (N.A.), Inc.) (registered investment adviser); Senior Vice President, Invesco Distributors, Inc. (formerly known as Invesco AIM Distributors, Inc.); Director and Vice President, Invesco Investment Services, Inc. (formerly known as Invesco AIM Investment Services, Inc.) Senior Vice President, The Invesco Funds; Managing Director, Invesco Capital Management LLC; Director, Invesco Investment Advisers LLC (formerly known as Van Kampen Asset Management); Senior Vice President, Invesco Capital Markets, Inc. (formerly known as Van Kampen Funds Inc.); Manager, Invesco Indexing LLC; Manager, Invesco Specialized Products, LLC; Director and Senior Vice President, Invesco Insurance Agency, Inc.; Member, Invesco Canada Funds Advisory Board; Director, President and Chief Executive Officer, Invesco Corporate Class Inc. (corporate mutual fund company); and Director, Chairman, President and Chief Executive Officer, Invesco Canada Ltd. (formerly known as Invesco Trimark Ltd./Invesco Trimark Ltèe) (registered investment adviser and registered transfer agent); President, Invesco, Inc.; President, Invesco Global Direct Real Estate Feeder GP Ltd.; President, Invesco IP Holdings(Canada) Ltd; President, Invesco Global Direct Real Estate GP Ltd.; President, Invesco Financial Services Ltd. / Services Financiers Invesco Ltée; and President, Trimark Investments Ltd./Placements Trimark Ltée Formerly: Director and Senior Vice President, Invesco Management Group, Inc. (formerly known as Invesco AIM Management Group, Inc.); Secretary and General Counsel, Invesco Management Group, Inc. (formerly known as Invesco AIM Management Group, Inc.); Secretary, Invesco Investment Services, Inc. (formerly known as Invesco AIM Investment Services, Inc.); Chief Legal Officer and Secretary, The Invesco Funds; Secretary and General Counsel, Invesco Investment Advisers LLC (formerly known as Van Kampen Asset Management); Secretary and General Counsel, Invesco Capital Markets, Inc. (formerly known as Van Kampen Funds Inc.); Chief Legal Officer, Invesco Exchange-Traded Fund Trust, Invesco Exchange-Traded Fund Trust II, Invesco India Exchange-Traded Fund Trust, Invesco Actively Managed Exchange-Traded Fund Trust, Invesco Actively Managed Exchange-Traded Commodity Fund Trust and Invesco Exchange-Traded Self-Indexed Fund Trust; Secretary, Invesco Indexing LLC; Director, Secretary, General Counsel and Senior Vice President, Van Kampen Exchange Corp.; Director, Vice President and Secretary, IVZ Distributors, Inc. (formerly known as INVESCO Distributors, Inc.); Director and Vice President, INVESCO Funds Group, Inc.; Director and Vice President, Van Kampen Advisors Inc.; Director, Vice President, Secretary and General Counsel, Van Kampen Investor Services Inc.;Director and Secretary, Invesco Distributors, Inc. (formerly known as Invesco AIM Distributors, Inc.); Director, Senior Vice President, General Counsel and Secretary, Invesco AIM Advisers, Inc. and Van Kampen Investments Inc.; Director, Vice President and Secretary, Fund Management Company; Director, Senior Vice President, Secretary, General Counsel and Vice President, Invesco AIM Capital Management, Inc.; Chief Operating Officer and General Counsel, Liberty Ridge Capital, Inc. (an investment adviser) | | N/A | | N/A |
Gregory G. McGreevey -1962 Senior Vice President | | 2012 | | Senior Managing Director, Invesco Ltd.; Director, Chairman, President, and Chief Executive Officer, Invesco Advisers, Inc. (formerly known as Invesco Institutional (N.A.), Inc.) (registered investment adviser); Director, Invesco Mortgage Capital, Inc. and Invesco Senior Secured Management, Inc.; and Senior Vice President, The Invesco Funds; and President, SNW Asset Management Corporation and Invesco Managed Accounts, LLC Formerly: Senior Vice President, Invesco Management Group, Inc. and Invesco Advisers, Inc.; Assistant Vice President, The Invesco Funds | | N/A | | N/A |
Kelli Gallegos - 1970 Vice President, Principal Financial Officer and Assistant Treasurer | | 2008 | | Principal Financial and Accounting Officer – Investments Pool, Invesco Specialized Products, LLC; Vice President, Principal Financial Officer and Assistant Treasurer, The Invesco Funds; Principal Financial and Accounting Officer – Pooled Investments, Invesco Capital Management LLC; Vice President and Treasurer, Invesco Exchange-Traded Fund Trust, Invesco Exchange-Traded Fund Trust II, Invesco India Exchange-Traded Fund Trust, Invesco Actively Managed Exchange-Traded Fund Trust, Invesco Actively Managed Exchange-Traded Commodity Fund Trust and Invesco Exchange-Traded Self-Indexed Fund Trust; Vice President, Invesco Advisers, Inc. Formerly: Assistant Treasurer, Invesco Specialized Products, LLC; Assistant Treasurer, Invesco Exchange-Traded Fund Trust, Invesco Exchange-Traded Fund Trust II, Invesco India Exchange-Traded Fund Trust, Invesco Actively Managed Exchange-Traded Fund Trust, Invesco Actively Managed Exchange-Traded Commodity Fund Trust and Invesco Exchange-Traded Self-Indexed Fund Trust; Assistant Treasurer, Invesco Capital Management LLC; Assistant Vice President, The Invesco Funds | | N/A | | N/A |
T-6 Invesco Small Cap Value Fund
Trustees and Officers–(continued)
| | | | | | | | |
Name, Year of Birth and
Position(s) Held with the Trust | | Trustee and/or Officer Since | | Principal Occupation(s) During Past 5 Years | | Number of Funds in Fund Complex Overseen by Trustee | | Other Directorship(s) Held by Trustee During Past 5 Years |
| Officers–(continued) | | | | |
Crissie M. Wisdom - 1969 Anti-Money Laundering Compliance Officer | | 2013 | | Anti-Money Laundering and OFAC Compliance Officer for Invesco U.S. entities including: Invesco Advisers, Inc. and its affiliates, Invesco Capital Markets, Inc., Invesco Distributors, Inc., Invesco Investment Services, Inc., The Invesco Funds, Invesco Capital Management, LLC, Invesco Trust Company; OppenheimerFunds Distributor, Inc., and Fraud Prevention Manager for Invesco Investment Services, Inc. | | N/A | | N/A |
Todd F. Kuehl - 1969 Chief Compliance Officer | | 2020 | | Chief Compliance Officer, Invesco Advisers, Inc. (registered investment adviser); and Chief Compliance Officer, The Invesco Funds Formerly: Managing Director and Chief Compliance Officer, Legg Mason (Mutual Funds); Chief Compliance Officer, Legg Mason Private Portfolio Group (registered investment adviser) | | N/A | | N/A |
The Statement of Additional Information of the Trust includes additional information about the Fund’s Trustees and is available upon request, without charge, by calling 1.800.959.4246. Please refer to the Fund’s Statement of Additional Information for information on the Fund’s sub-advisers.
| | | | | | |
| Office of the Fund | | Investment Adviser | | Distributor | | Auditors |
| 11 Greenway Plaza, Suite 1000 | | Invesco Advisers, Inc. | | Invesco Distributors, Inc. | | PricewaterhouseCoopers LLP |
| Houston, TX 77046-1173 | | 1555 Peachtree Street, N.E. | | 11 Greenway Plaza, Suite 1000 | | 1000 Louisiana Street, Suite 5800 |
| | Atlanta, GA 30309 | | Houston, TX 77046-1173 | | Houston, TX 77002-5678 |
| | | |
| Counsel to the Fund | | Counsel to the Independent Trustees | | Transfer Agent | | Custodian |
| Stradley Ronon Stevens & Young, LLP | | Goodwin Procter LLP | | Invesco Investment Services, Inc. | | State Street Bank and Trust Company |
| 2005 Market Street, Suite 2600 | | 901 New York Avenue, N.W. | | 11 Greenway Plaza, Suite 1000 | | 225 Franklin Street |
| Philadelphia, PA 19103-7018 | | Washington, D.C. 20001 | | Houston, TX 77046-1173 | | Boston, MA 02110-2801 |
T-7 Invesco Small Cap Value Fund

Go paperless with eDelivery
Visit invesco.com/edelivery to enjoy the convenience and security of anytime electronic access to your investment documents.
With eDelivery, you can elect to have any or all of the following materials delivered straight to your inbox to download, save and print from your own computer:
| ∎ | | Fund reports and prospectuses |
Invesco mailing information
Send general correspondence to Invesco Investment Services, Inc., P.O. Box 219078, Kansas City, MO 64121-9078.
Important notice regarding delivery of security holder documents
To reduce Fund expenses, only one copy of most shareholder documents may be mailed to shareholders with multiple accounts at the same address (Householding). Mailing of your shareholder documents may be householded indefinitely unless you instruct us otherwise. If you do not want the mailing of these documents to be combined with those for other members of your household, please contact Invesco Investment Services, Inc. at 800 959 4246 or contact your financial institution. We will begin sending you individual copies for each account within 30 days after receiving your request.
Fund holdings and proxy voting information
The Fund provides a complete list of its holdings four times in each fiscal year, at the quarter-ends. For the second and fourth quarters, the list appears in the Fund’s semiannual and annual reports to shareholders. For the first and third quarters, the Fund files the lists with the Securities and Exchange Commission (SEC) as an exhibit to its reports on Form N-PORT. The most recent list of portfolio holdings is available at invesco.com/completeqtrholdings. Shareholders can also look up the Fund’s Form N-PORT filings on the SEC website, sec.gov. The SEC file numbers for the Fund are shown below.
A description of the policies and procedures that the Fund uses to determine how to vote proxies relating to portfolio securities is available without charge, upon request, from our Client Services department at 800 959 4246, or at invesco.com/ proxyguidelines. The information is also available on the SEC website, sec.gov.
| | |
Information regarding how the Fund voted proxies related to its portfolio securities during the most recent 12-month period ended June 30 is available at invesco.com/proxysearch. This information is also available on the SEC website, sec.gov. | | 
|
Invesco Advisers, Inc. is an investment adviser; it provides investment advisory services to individual and institutional clients and does not sell securities. Invesco Distributors, Inc. is the US distributor for Invesco Ltd.’s retail mutual funds, exchange-traded funds and institutional money market funds. Both are wholly owned, indirect subsidiaries of Invesco Ltd. |
| | | | |
SEC file numbers: 811-03826 and 002-85905 | | Invesco Distributors, Inc. | | VK-SCV-AR-1 |
| | |
 | | Annual Report to Shareholders April 30, 2020 |
| | Invesco Technology Fund |
| | Nasdaq: A: ITYAX ∎ C: ITHCX ∎ Y: ITYYX ∎ Investor: FTCHX ∎ R5: FTPIX ∎ R6: FTPSX |

Beginning on January 1, 2021, as permitted by regulations adopted by the Securities and Exchange Commission, paper copies of the Fund’s shareholder reports will no longer be sent by mail, unless you specifically request paper copies of the reports from the Fund or from your financial intermediary, such as a broker-dealer or bank. Instead, the reports will be made available on the Fund’s web- site, and you will be notified by mail each time a report is posted and provided with a website link to access the report.
If you already elected to receive shareholder reports electronically, you will not be affected by this change and you need not take any action. You may elect to receive shareholder reports and other communications from the Fund electronically by contacting your financial intermediary (such as a broker-dealer or bank) or, if you are a direct investor, by enrolling at invesco.com/edelivery.
You may elect to receive all future reports in paper free of charge. If you invest through a financial intermediary, you can contact your financial intermediary to request that you continue to receive paper copies of your shareholder reports. If you invest directly with the Fund, you can call (800) 959-4246 to let the Fund know you wish to continue receiving paper copies of your shareholder reports. Your election to receive reports in paper will apply to all funds held with your financial intermediary or all funds held with the fund complex if you invest directly with the Fund.
Letters to Shareholders
| | |

Andrew Schlossberg | | Dear Shareholders: |
| | This annual report includes information about your Fund, including performance data and a complete list of its investments as of the close of the reporting period. Inside is a discussion of how your Fund was managed and the factors that affected its performance during the reporting period. Global equities and fixed-income securities faced a tumultuous environment during the reporting period. This was particularly true in the later stages of the period as a pandemic gripped the world and unsettled markets. At the onset of the reporting period, global equity markets were buoyed by a more accommodative stance from central banks. Despite US-China trade concerns and signs of slowing global growth, which led to some market volatility along the way, the second and third quarters of 2019 were relatively calm. In the final months of 2019, better-than-expected third quarter corporate earnings and initial agreement of the phase one US-China trade deal provided a favorable backdrop for equities and impressive fourth quarter global equity returns. |
The first quarter of 2020 proved to be a wild roller-coaster ride as the year began with US investors treated to equity gains culminating in record highs on February 19, 2020. The first half of the quarter, however, belied the impact the coronavirus (COVID-19) would have on markets in a world faced with shuttered businesses and global lockdowns. Equity markets began to sell off in late February and plummeted in March. The speed and depth of market declines and reversals during the month made March 2020 one of the most volatile months on record. While equities languished, government bonds largely performed as expected as central banks cut interest rates, which lowered bond yields but sent bond prices soaring. Like equities, however, corporate bond prices fell due to the impact of diminished corporate profits. Commodity prices, sans gold, largely declined during the first quarter. Oil prices suffered steep declines losing more than half their value in March amid a demand slump due to both COVID-19 and a supply glut from the Russia-Saudi Arabi oil-price war.
In response to the financial and economic hardships caused by the pandemic, central banks and governments around the world responded with fiscal and monetary stimulus. The US Federal Reserve cut interest rates to near zero (0.00-0.25%) and announced an unprecedented quantitative easing program. The US administration also passed a $2.2 trillion economic-relief package – the largest in US history. Most major economies outside of the US provided liquidity in the bond and equity markets in the form of fiscal policy and quantitative easing.
Massive global fiscal and monetary responses prompted a significant market rebound in April, with the S&P 500 Index recording one of its best monthly performances ever, despite macroeconomic data that illustrated the enormous economic cost of the shutdowns – more than 30 million US workers have lost their jobs and the US economy contracted at a 5.0% annualized rate (second estimate) for the first quarter of 2020. The final month of the reporting period also proved less volatile than March as markets attempted to normalize. As markets and investors attempt to adapt to a new normal, we’ll see how the interplay of interest rates, economic data, geopolitics and a host of other factors affect US and overseas equity and fixed income markets.
Investor uncertainty and market volatility, such as we witnessed during the reporting period, are unfortunate facts of life when it comes to investing. That’s why Invesco encourages investors to work with a professional financial adviser who can stress the importance of starting to save and invest early and the importance of adhering to a disciplined investment plan. A financial adviser who knows your unique financial situation, investment goals and risk tolerance can be an invaluable partner as you seek to achieve your financial goals. Financial advisers can also offer a long-term perspective when markets are volatile and time-tested advice and guidance when your financial situation or investment goals change.
Visit our website for more information on your investments
Our website, invesco.com/us, offers a wide range of market insights and investment perspectives. On the website, you’ll find detailed information about our funds, including performance, holdings and portfolio manager commentaries. You can access information about your account by completing a simple, secure online registration. To do so, select “Log In” on the right side of the homepage, and then select “Register for Individual Account Access.”
In addition to the resources accessible on our website and through our mobile app, you can obtain timely updates to help you stay informed about the markets and the economy by connecting with Invesco on Twitter, LinkedIn or Facebook. You can access our blog at blog.invesco.us.com. Our goal is to provide you the information you want, when and where you want it.
Finally, I’m pleased to share with you Invesco’s commitment to both the Principles for Responsible Investment and to considering environmental, social and governance issues in our robust investment process. I invite you to learn more at invesco.com/esg.
Have questions?
For questions about your account, contact an Invesco client services representative at 800 959 4246.
All of us at Invesco look forward to serving your investment management needs. Thank you for investing with us.
Sincerely,

Andrew Schlossberg
Head of the Americas,
Senior Managing Director, Invesco Ltd.
2 Invesco Technology Fund
| | |

Bruce Crockett | | Dear Shareholders: Among the many important lessons I’ve learned in more than 40 years in a variety of business endeavors is the value of a trusted advocate. As independent chair of the Invesco Funds Board, I can assure you that the members of the Board are strong advocates for the interests of investors in Invesco’s mutual funds. We work hard to represent your interests through oversight of the quality of the investment management services your funds receive and other matters important to your investment, including but not limited to: ∎ Ensuring that Invesco offers a diverse lineup of mutual funds that your financial adviser can use to strive to meet your financial needs as your investment goals change over time. ∎ Monitoring how the portfolio management teams of the Invesco funds are performing in light of changing economic and market conditions. ∎ Assessing each portfolio management team’s investment performance within the context of the investment strategy described in the fund’s prospectus. |
| ∎ | Monitoring for potential conflicts of interests that may impact the nature of the services that your funds receive. |
We believe one of the most important services we provide our fund shareholders is the annual review of the funds’ advisory and sub-advisory contracts with Invesco Advisers and its affiliates. This review is required by the Investment Company Act of 1940 and focuses on the nature and quality of the services Invesco provides as the adviser to the Invesco funds and the reasonableness of the fees that it charges for those services. Each year, we spend months carefully reviewing information received from Invesco and a variety of independent sources, such as performance and fee data prepared by Lipper, Inc. (a subsidiary of Broadridge Financial Solutions, Inc.), an independent, third-party firm widely recognized as a leader in its field. We also meet with our independent legal counsel and other independent advisers to review and help us assess the information that we have received. Our goal is to assure that you receive quality investment management services for a reasonable fee.
I trust the measures outlined above provide assurance that you have a worthy advocate when it comes to choosing the Invesco Funds.
On behalf of the Board, we look forward to continuing to represent your interests and serving your needs.
Sincerely,

Bruce L. Crockett
Independent Chair
Invesco Funds Board of Trustees
3 Invesco Technology Fund
Management’s Discussion of Fund Performance
| | | | | | |
| | | Performance summary For the fiscal year ended April 30, 2020, Class A shares of Invesco Technology Fund (the Fund), at net asset value (NAV), outperformed the NASDAQ Composite Index, the Fund’s broad market/style-specific benchmark. Your Fund’s long-term performance appears later in this report. | |
| | | Fund vs. Indexes | | | | |
| | Total returns, April 30, 2019 to April 30, 2020, at net asset value (NAV). Performance shown does not include applicable contingent deferred sales charges (CDSC) or front-end sales charges, which would have reduced performance. | |
| | | Class A Shares | | | 11.31% | |
| | | Class C Shares | | | 10.47 | |
| | | Class Y Shares | | | 11.55 | |
| | | Investor Class Shares | | | 11.42 | |
| | | Class R5 Shares | | | 11.74 | |
| | | Class R6 Shares | | | 11.79 | |
| | | NASDAQ Composite Indexq (Broad Market/Style-Specific Index) | | | 10.99 | |
| | | Lipper Science & Technology Funds Index∎ (Peer Group Index) | | | 6.22 | |
| | |
| | | Source(s): qBloomberg L.P.; ∎ Lipper Inc. | | | | |
Market conditions and your Fund
Although the S&P 500 Index, considered representative of the US stock market, posted modest gains for the second quarter of 2019, US equities experienced increased volatility. After four consecutive months of rising stock prices, markets sold off in May 2019, along with bond yields and oil prices, as investors weighed the impact of the lingering trade war between the US and China, as well as potential tariffs imposed on Mexico. In addition, economic data showed a slowing domestic and global economy.
Key issues that concerned investors in the second quarter of 2019 carried over into the third quarter. The US-China trade conflict worried investors and stifled business investment, even as the US Federal Reserve (the Fed) cut interest rates by 0.25% in July and again in September 2019.1 This environment, combined with evidence of slowing global economic growth, fueled market volatility in August 2019. The US Treasury yield curve inverted several times, increasing fears of a possible US recession. As a result, August saw increased risk aversion, with investors crowding into asset classes perceived as safe havens, such as US Treasuries and gold. However, the Fed’s accommodative tone provided some support for risk assets.
Macroeconomic issues that concerned investors in the third quarter of 2019 mostly abated during the fourth quarter, providing the backdrop for strong equity market returns. The US economy rose higher than expected, at 2.1% during the third quarter of 2019.2 During its October meeting, the Fed cut interest rates again by 0.25% based on business investment and exports remaining weak.1 Investors were also encouraged by a resilient US economy and corporate earnings, putting the US equity market on track for its largest annual rise since 2013.
During the first quarter of 2020, as the spread of the new coronavirus (COVID-19) disrupted travel and suppressed consumer activity, investors became increasingly concerned about the global economy. At the same time, oil prices fell sharply as a price war between Saudi Arabia and Russia threatened to boost supply even as demand was falling. Beginning in late February, equity markets declined sharply and quickly, ushering in the first bear market since the financial crisis of 2008. Though the equity market stabilized somewhat toward the end of March, all sectors declined during the downturn. Cyclical sectors, where company performance tends to be closely linked to macroeconomic changes in the business cycle, were the hardest hit. As expected, the US economy reported dismal numbers. At the close of the fiscal year in April, US unemployment numbers continued to climb, with over 30 million Americans seeking unemployment benefits since March 2020.3 In addition, the second gross domestic product estimate for the first quarter of 2020 saw the economy shrink by 5.0%, the sharpest drop since the 2008 financial crisis.2
During the fiscal year, the Fund’s Class A shares, at NAV, posted a double-digit positive return and outperformed the NASDAQ Composite Index, the Fund’s broad market/style-specific benchmark. The Fund’s relative outperformance, at NAV, was driven by entertainment industry holdings, which are largely represented by video game developers within the Fund. The Fund’s lack of exposure to holdings within the banking, communications equipment, media, and hotels, restaurants and leisure industries boosted the Fund’s relative performance, as those industries faced significant headwinds during the fiscal year.
At the individual stock level, Amazon.com was the Fund’s leading absolute contributor for the fiscal year. The e-commerce giant saw
substantial growth in the demand for the largest and underpenetrated categories of food and consumables, especially since social distancing efforts increased after COVID-19 and confined consumers to their homes. Additionally, Amazon.com reported strong fundamentals and growth internationally and in its Amazon Web Services (AWS) segment.
Microsoft was also a key absolute contributor during the fiscal year. The software company’s cloud-based product, Azure, continues to grow rapidly and gain market share. Microsoft was awarded the $10 billion Joint Enterprise Defense Infrastructure (JEDI) contract from the US Department of Defense, further strengthening its competitive position. The company’s improved margins combined with strong growth in core server tools also fueled its continued outperformance.
During the fiscal year, another important absolute contributor was Apple. Despite geopolitical trade concerns and slowing global growth, the technology company beat lowered expectations, reported better margins and modestly raised its forward-looking guidance. The anticipation of the 2020 iPhone cycle, which is expected to include 5G capabilities, also helped push Apple’s share price higher during the fiscal year.
Conversely, stock selection in and overweight allocation to the diversified telecommunication services industry was the leading detractor from the Fund’s performance relative to the broad market/style-specific benchmark for the fiscal year. Stock selection in the software, as well as the semiconductors and semiconductor equipment industries, was also a relative detractor, although overweight allocation relative to the broad market/style-specific benchmark helped offset negative performance in these areas. Finally, the Fund’s underweight allocation to the technology hardware, storage and peripherals industry also detracted from relative performance.
Intelsat was the leading detractor from the Fund’s absolute performance and performance relative to the broad market/style-specific benchmark for the fiscal year. The satellite company owns highly valuable C-Band spectrum, which is required for the rollout of 5G in the US and was poised to substantially benefit from a private auction of the C-Band spectrum. However, the Federal Communications Commission surprised investors when it announced that it would pursue a public auction, which negatively impacted In-telsat’s share price during the fiscal year. We exited our position in Intelsat before the close of the fiscal year.
Broadcom also detracted from the Fund’s performance on an absolute basis during the fiscal year. The chip maker’s share price came under pressure following the US ban on component exports to Chinese telecommunication giant Huawei, which impacted profits and lowered revenue expectations. Later in the fiscal year, Broadcom faced additional headwinds as it withdrew guidance as a result of
4 Invesco Technology Fund
COVID-19 and reported lower-than-expected profits. We exited our position in Broadcom before the close of the fiscal year.
Software company Palo Alto Networks experienced headwinds during the fiscal year after cash flow expectations were reduced due to shorter billing terms, implying a negative impact on longer term cash flow. In addition, product revenue for Palo Alto Networks also missed expectations over the last two quarters, putting additional pressure on the company’s share price. As such, we exited our position in the company before the close of the fiscal year.
At the close of the fiscal year, the Fund was biased toward growth technology, including medical technology, and away from mature technology. We emphasized innovation, transformative technology and opportunities, which we expect to take market share from mature companies, including the game-changing technologies of mobile, security, cloud and medical technology. Though we expect continued volatility as unemployment rates rise and earnings fall, we are looking for signs of the next market phase. We believe increased testing and effective treatments for COVID-19 will help to address the core problem of the pandemic and we are keeping a close eye on developments. We have eliminated or reduced holdings that have experienced a fundamental hit to demand and have an unclear path to the other side. We are opportunistically adding to companies that we believe are more likely to recover quickly or are positioned to benefit from the crisis and massive stimulus. We remain optimistic about technology spending and companies’ need to invest in more robust security solutions and for future growth. In our opinion, the increased pace of health care innovation will continue to drive attractive long-term growth rates due to successful mapping of the human genome and recent productivity improvements, both of which have fostered faster and more effective targeting of promising therapeutics. We attempt to harness multi-year secular trends, which may benefit long-term investors regardless of near-term economic strength.
As we’ve discussed, stocks remain volatile and we caution investors against making investment decisions based on short-term performance.
We thank you for your commitment to Invesco Technology Fund.
1 Source: US Federal Reserve
2 Source: US Bureau of Economic Analysis
3 Source: The Associated Press
Portfolio managers:
Janet Luby
Erik Voss - Lead
The views and opinions expressed in management’s discussion of Fund performance are those of Invesco Advisers, Inc. These views and opinions are subject to change at any time based on factors such as market and economic conditions. These
views and opinions may not be relied upon as investment advice or recommendations, or as an offer for a particular security. The information is not a complete analysis of every aspect of any market, country, industry, security or the Fund. Statements of fact are from sources considered reliable, but Invesco Advisers, Inc. makes no representation or warranty as to their completeness or accuracy. Although historical performance is no guarantee of future results, these insights may help you understand our investment management philosophy.
See important Fund and, if applicable, index disclosures later in this report.
5 Invesco Technology Fund
Your Fund’s Long-Term Performance
Results of a $10,000 Investment – Oldest Share Class(es)
Fund and index data from 4/30/10
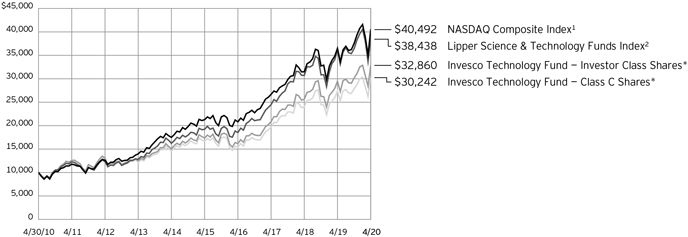
1 Source: Bloomberg L.P.
2 Source: Lipper Inc.
*It is Invesco’s policy to chart the Fund’s oldest share class(es). Because Investor Class shares do not have a sales charge, we also show the oldest share class with a sales charge, Class C shares.
Past performance cannot guarantee future results.
The data shown in the chart include reinvested distributions, applicable sales charges and Fund expenses including management
fees. Index results include reinvested dividends, but they do not reflect sales charges. Performance of the peer group, if applicable, reflects fund expenses and management fees;
performance of a market index does not. Performance shown in the chart does not reflect deduction of taxes a shareholder would pay on Fund distributions or sale of Fund shares.
6 Invesco Technology Fund
| | | | |
Average Annual Total Returns | |
As of 4/30/20, including maximum applicable sales charges | |
| |
Class A Shares | | | | |
Inception (3/28/02) | | | 6.04 | % |
10 Years | | | 11.91 | |
5 Years | | | 12.25 | |
1 Year | | | 5.19 | |
| |
Class C Shares | | | | |
Inception (2/14/00) | | | –0.35 | % |
10 Years | | | 11.70 | |
5 Years | | | 12.68 | |
1 Year | | | 9.49 | |
| |
Class Y Shares | | | | |
Inception (10/3/08) | | | 13.95 | % |
10 Years | | | 12.82 | |
5 Years | | | 13.81 | |
1 Year | | | 11.55 | |
| |
Investor Class Shares | | | | |
Inception (1/19/84) | | | 10.41 | % |
10 Years | | | 12.63 | |
5 Years | | | 13.63 | |
1 Year | | | 11.42 | |
| |
Class R5 Shares | | | | |
Inception (12/21/98) | | | 5.96 | % |
10 Years | | | 13.14 | |
5 Years | | | 14.04 | |
1 Year | | | 11.74 | |
| |
Class R6 Shares | | | | |
10 Years | | | 12.69 | % |
5 Years | | | 13.83 | |
1 Year | | | 11.79 | |
Class R6 shares incepted on April 4, 2017. Performance shown prior to that date is that of Class A shares and includes the 12b-1 fees applicable to Class A shares.
The performance data quoted represent past performance and cannot guarantee future results; current performance may be lower or higher. Please visit invesco.com/ performance for the most recent month-end performance. Performance figures reflect reinvested distributions, changes in net asset value and the effect of the maximum sales charge unless otherwise stated. Performance figures do not reflect deduction of taxes a shareholder would pay on Fund distributions or sale of Fund shares. Investment return and principal value will fluctuate so that you may have a gain or loss when you sell shares.
Class A share performance reflects the maximum 5.50% sales charge, and Class C share performance reflects the applicable contingent deferred sales charge (CDSC) for the period involved. The CDSC on Class C shares is 1% for the first year after purchase. Class Y, Investor Class, Class R5 and Class R6 shares do not have a front-end sales charge or a CDSC; therefore, performance is at net asset value.
The performance of the Fund’s share classes will differ primarily due to different sales charge structures and class expenses.
Fund performance reflects any applicable fee waivers and/or expense reimbursements. Had the adviser not waived fees and/or reimbursed expenses currently or in the past, returns would have been lower. See current prospectus for more information.
7 Invesco Technology Fund
Invesco Technology Fund’s investment objective is long-term growth of capital.
| ∎ | Unless otherwise stated, information presented in this report is as of April 30, 2020, and is based on total net assets. |
| ∎ | Unless otherwise noted, all data provided by Invesco. |
| ∎ | To access your Fund’s reports/prospectus, visit invesco.com/fundreports. |
About indexes used in this report
| ∎ | The NASDAQ Composite Index is a broad-based market index of the common stocks and similar securities listed on the Nasdaq stock market. |
| ∎ | The Lipper Science & Technology Funds Index is an unmanaged index considered representative of science and technology funds tracked by Lipper. |
| ∎ | The S&P 500® Index is an unmanaged index considered representative of the US stock market. |
| ∎ | The Fund is not managed to track the performance of any particular index, including the index(es) described here, and consequently, the performance of the Fund may deviate significantly from the performance of the index(es). |
| ∎ | A direct investment cannot be made in an index. Unless otherwise indicated, index results include reinvested dividends, and they do not reflect sales charges. Performance of the peer group, if applicable, reflects fund expenses; performance of a market index does not. |
Liquidity Risk Management Program
The Securities and Exchange Commission has adopted Rule 22e-4 under the Investment Company Act of 1940 (the “Liquidity Rule”) in order to promote effective liquidity risk management throughout the open-end investment company industry, thereby reducing the risk that funds will be unable to meet their redemption obligations and mitigating dilution of the interests of fund shareholders. The Fund has adopted and implemented a liquidity risk management program in accordance with the Liquidity Rule (the “Program”). The Program is reasonably designed to assess and manage the Fund’s liquidity risk, which is the risk that the Fund could not meet redemption requests without significant dilution of remaining investors’ interests in the Fund. The Board of Trustees of the Fund (the “Board”) has appointed Invesco Advisers, Inc. (“Invesco”), the Fund’s investment adviser, as the Program’s administrator, and Invesco has delegated oversight of the Program to the Liquidity Risk Management Committee (the “Committee”), which is composed of senior representatives from relevant business groups at Invesco.
As required by the Liquidity Rule, the Program includes policies and procedures providing for an assessment, no less fre
quently than annually, of the Fund’s liquidity risk that takes into account, as relevant to the Fund’s liquidity risk: (1) the Fund’s investment strategy and liquidity of portfolio investments during both normal and reasonably foreseeable stressed conditions; (2) short-term and long-term cash flow projections for the Fund during both normal and reasonably foreseeable stressed conditions; and (3) the Fund’s holdings of cash and cash equivalents and any borrowing arrangements. The Liquidity Rule also requires the classification of the Fund’s investments into categories that reflect the assessment of their relative liquidity under current market conditions. The Fund classifies its investments into one of four categories defined in the Liquidity Rule: “Highly Liquid,” “Moderately Liquid,” “Less Liquid” and “Illiquid.” Funds that are not invested primarily in “Highly Liquid Investments” that are assets (cash or investments that are reasonably expected to be convertible into cash within three business days without significantly changing the market value of the investment) are required to establish a “Highly Liquid Investment Minimum” (“HLIM”), which is the minimum percentage of net assets that must be invested in Highly Liquid Investments. Funds with HLIMs have procedures for addressing HLIM shortfalls, including reporting to the Board and the SEC (on a non-public basis) as required by the Program and the Liquidity Rule. In addition, the Fund may not acquire an investment if, immediately after the acquisition, over 15% of the Fund’s net assets would consist of “Illiquid Investments” that are assets (an investment that cannot reasonably be expected to be sold or disposed of in current market conditions in seven calendar days or less without the sale or disposition significantly changing the market value of the investment). The Liquidity Rule and the Program also require reporting to the Board and the SEC (on a non-public basis) if a Fund’s holdings of Illiquid Investments exceed 15% of the Fund’s assets.
At a meeting held on March 30-April 1, 2020, the Committee presented a report to the Board that addressed the operation of the Program and assessed the Program’s adequacy and effectiveness of implementation (the “Report”). The Report covered the period from December 1,
2018 through December 31, 2019 (the “Program Reporting Period”).
The Report stated, in relevant part, that during the Program Reporting Period:
| ∎ | The Program, as adopted and implemented, remained reasonably designed to assess and manage the Fund’s liquidity risk and was operated effectively to achieve that goal; |
| ∎ | The Fund’s investment strategy remained appropriate for an open-end fund; |
| ∎ | The Fund was able to meet requests for redemption without significant dilution of remaining investors’ interests in the Fund; |
| ∎ | The Fund did not breach the 15% limit on Illiquid Investments; and |
| ∎ | The Fund primarily held Highly Liquid Investments and therefore has not adopted an HLIM. |
| | | | |
This report must be accompanied or preceded by a currently effective Fund prospectus, which contains more complete information, including sales charges and expenses. Investors should read it carefully before investing. | | |
NOT FDIC INSURED | MAY LOSE VALUE | NO BANK GUARANTEE | | |
8 Invesco Technology Fund
Fund Information
Portfolio Composition
| | | | | |
By sector | | % of total net assets |
Information Technology | | | | 46.76 | % |
Communication Services | | | | 19.85 | |
Consumer Discretionary | | | | 17.77 | |
Health Care | | | | 12.46 | |
Industrials | | | | 0.82 | |
Money Market Funds Plus Other Assets Less Liabilities | | | | 2.34 | |
Top 10 Equity Holdings*
| | | | | | | |
| | | | | % of total net assets |
1. | | Amazon.com, Inc. | | | | 9.69 | % |
2. | | Microsoft Corp. | | | | 7.12 | |
3. | | Apple, Inc. | | | | 5.69 | |
4. | | Facebook, Inc., Class A | | | | 5.27 | |
5. | | Alphabet, Inc., Class A | | | | 5.17 | |
6. | | Alibaba Group Holding Ltd., ADR | | | | 5.12 | |
7. | | Visa, Inc., Class A | | | | 2.77 | |
8. | | PayPal Holdings, Inc. | | | | 2.74 | |
9. | | Applied Materials, Inc. | | | | 2.46 | |
10. | | salesforce.com, inc. | | | | 2.45 | |
The Fund’s holdings are subject to change, and there is no assurance that the Fund will continue to hold any particular security.
| * | Excluding money market fund holdings, if any. |
Data presented here are as of April 30, 2020.
9 Invesco Technology Fund
Schedule of Investments(a)
April 30, 2020
| | | | | | | | |
| | | Shares | | | Value | |
Common Stocks & Other Equity Interests-97.66% | |
Application Software-8.88% | | | | | | | | |
Adobe, Inc.(b) | | | 40,490 | | | $ | 14,318,884 | |
Citrix Systems, Inc. | | | 35,901 | | | | 5,206,004 | |
RingCentral, Inc., Class A(b) | | | 40,465 | | | | 9,247,466 | |
salesforce.com, inc.(b) | | | 170,597 | | | | 27,628,184 | |
Splunk, Inc.(b) | | | 168,007 | | | | 23,581,323 | |
Synopsys, Inc.(b) | | | 127,126 | | | | 19,974,037 | |
| | | | | | | | 99,955,898 | |
| | |
Biotechnology-0.47% | | | | | | | | |
Moderna, Inc.(b) | | | 114,620 | | | | 5,271,374 | |
| | |
Consumer Electronics-1.41% | | | | | | | | |
Sony Corp. (Japan) | | | 248,200 | | | | 15,923,317 | |
| |
Data Processing & Outsourced Services-11.05% | | | | | |
Fidelity National Information Services, Inc. | | | 118,965 | | | | 15,690,294 | |
Fiserv, Inc.(b) | | | 215,790 | | | | 22,239,317 | |
Mastercard, Inc., Class A | | | 88,805 | | | | 24,418,711 | |
PayPal Holdings, Inc.(b) | | | 251,067 | | | | 30,881,241 | |
Visa, Inc., Class A | | | 174,144 | | | | 31,123,016 | |
| | | | | | | | 124,352,579 | |
| | |
Health Care Equipment-6.39% | | | | | | | | |
Abbott Laboratories | | | 131,924 | | | | 12,148,881 | |
Boston Scientific Corp.(b) | | | 531,363 | | | | 19,915,485 | |
DexCom, Inc.(b) | | | 34,226 | | | | 11,472,555 | |
Intuitive Surgical, Inc.(b) | | | 21,301 | | | | 10,882,255 | |
Teleflex, Inc. | | | 52,316 | | | | 17,546,787 | |
| | | | | | | | 71,965,963 | |
| | |
Health Care Technology-0.16% | | | | | | | | |
Teladoc Health, Inc.(b) | | | 11,304 | | | | 1,860,525 | |
| |
Interactive Home Entertainment-6.99% | | | | | |
Activision Blizzard, Inc. | | | 329,915 | | | | 21,025,483 | |
Electronic Arts, Inc.(b) | | | 128,628 | | | | 14,697,035 | |
Nintendo Co. Ltd. (Japan) | | | 28,000 | | | | 11,595,970 | |
Sea Ltd., ADR (Taiwan)(b) | | | 382,277 | | | | 21,246,956 | |
Take-Two Interactive Software, Inc.(b) | | | 83,279 | | | | 10,080,923 | |
| | | | | | | | 78,646,367 | |
| |
Interactive Media & Services-11.50% | | | | | |
Alphabet, Inc., Class A(b) | | | 43,165 | | | | 58,130,305 | |
Alphabet, Inc., Class C(b) | | | 8,873 | | | | 11,966,660 | |
Facebook, Inc., Class A(b) | | | 290,004 | | | | 59,366,719 | |
| | | | | | | | 129,463,684 | |
| |
Internet & Direct Marketing Retail-16.36% | | | | | |
Alibaba Group Holding Ltd., ADR (China)(b) | | | 284,324 | | | | 57,623,945 | |
Amazon.com, Inc.(b) | | | 44,100 | | | | 109,103,400 | |
Booking Holdings, Inc.(b) | | | 11,777 | | | | 17,436,673 | |
| | | | | | | | 184,164,018 | |
| | | | | | | | |
| | | Shares | | | Value | |
Life Sciences Tools & Services-4.70% | | | | | |
10X Genomics, Inc., Class A(b) | | | 154,170 | | | $ | 12,313,558 | |
Illumina, Inc.(b) | | | 47,157 | | | | 15,044,498 | |
IQVIA Holdings, Inc.(b) | | | 89,318 | | | | 12,735,854 | |
Thermo Fisher Scientific, Inc. | | | 38,364 | | | | 12,839,663 | |
| | | | | | | | 52,933,573 | |
| | |
Managed Health Care-0.73% | | | | | | | | |
UnitedHealth Group, Inc. | | | 28,101 | | | | 8,218,699 | |
| | |
Movies & Entertainment-1.36% | | | | | | | | |
Netflix, Inc.(b) | | | 36,596 | | | | 15,364,831 | |
| | |
Semiconductor Equipment-3.45% | | | | | | | | |
Applied Materials, Inc. | | | 557,532 | | | | 27,698,190 | |
ASML Holding N.V., New York Shares (Netherlands) | | | 38,521 | | | | 11,110,612 | |
| | | | | | | | 38,808,802 | |
| | |
Semiconductors-8.30% | | | | | | | | |
NVIDIA Corp. | | | 92,452 | | | | 27,021,871 | |
QUALCOMM, Inc. | | | 224,770 | | | | 17,682,656 | |
Semtech Corp.(b) | | | 555,577 | | | | 25,134,303 | |
Silicon Motion Technology Corp., ADR (Taiwan) | | | 538,590 | | | | 23,665,645 | |
| | | | | | | | 93,504,475 | |
| | |
Systems Software-9.40% | | | | | | | | |
Microsoft Corp. | | | 446,903 | | | | 80,089,486 | |
ServiceNow, Inc.(b) | | | 73,107 | | | | 25,700,035 | |
| | | | | | | | 105,789,521 | |
|
Technology Hardware, Storage & Peripherals-5.69% | |
Apple, Inc. | | | 217,965 | | | | 64,038,117 | |
| | |
Trucking-0.82% | | | | | | | | |
Lyft, Inc., Class A(b) | | | 280,244 | | | | 9,200,411 | |
Total Common Stocks & Other Equity Interests (Cost $532,079,848) | | | | 1,099,462,154 | |
| | |
Money Market Funds-1.37% | | | | | | | | |
Invesco Government & Agency Portfolio, Institutional Class, 0.20%(c)(d) | | | 5,087,629 | | | | 5,087,629 | |
Invesco Liquid Assets Portfolio, Institutional Class, 0.60%(c)(d) | | | 4,498,238 | | | | 4,500,938 | |
Invesco Treasury Portfolio, Institutional Class, 0.10%(c)(d) | | | 5,814,433 | | | | 5,814,433 | |
Total Money Market Funds (Cost $15,398,617) | | | | 15,403,000 | |
TOTAL INVESTMENTS IN SECURITIES-99.03%
(Cost $547,478,465) | | | | 1,114,865,154 | |
OTHER ASSETS LESS LIABILITIES-0.97% | | | | 10,925,069 | |
NET ASSETS-100.00% | | | | | | $ | 1,125,790,223 | |
Investment Abbreviations:
ADR - American Depositary Receipt
See accompanying Notes to Financial Statements which are an integral part of the financial statements.
10 Invesco Technology Fund
Notes to Schedule of Investments:
| (a) | Industry and/or sector classifications used in this report are generally according to the Global Industry Classification Standard, which was developed by and is the exclusive property and a service mark of MSCI Inc. and Standard & Poor’s. |
| (b) | Non-income producing security. |
| (c) | Affiliated issuer. The issuer and/or the Fund is a wholly-owned subsidiary of Invesco Ltd., or is affiliated by having an investment adviser that is under common control of Invesco Ltd. The table below shows the Fund’s transactions in, and earnings from, its investments in affiliates for the fiscal year ended April 30, 2020. |
| | | | | | | | | | | | | | | | | | | | | | | | | | | | | | | | | | | |
| | | Value
April 30, 2019 | | Purchases at Cost | | Proceeds
from Sales | | Change in
Unrealized
Appreciation | | Realized
Gain
(Loss) | | Value April 30, 2020 | | Dividend
Income |
Investments in Affiliated Money Market Funds: | | | | | | | | | | | | | | | | | | | | | | | | | | | | | | | | | | | |
Invesco Government & Agency Portfolio, Institutional Class | | | | $2,054,969 | | | | | $ 90,436,303 | | | | | $ (87,403,643 | ) | | | | $ - | | | | | $ - | | | | | $ 5,087,629 | | | | | $ 69,274 | |
Invesco Liquid Assets Portfolio, Institutional Class | | | | 1,467,027 | | | | | 65,998,897 | | | | | (62,964,218 | ) | | | | 4,374 | | | | | (5,142 | ) | | | | 4,500,938 | | | | | 56,777 | |
Invesco Treasury Portfolio, Institutional Class | | | | 2,314,434 | | | | | 103,355,774 | | | | | (99,855,775 | ) | | | | - | | | | | - | | | | | 5,814,433 | | | | | 76,572 | |
| Investments Purchased with Cash Collateral from Securities on Loan: | | | | | | | | | | | | | | | | | | | | | | | | | | | | | | | | | | | |
Invesco Government & Agency Portfolio, Institutional Class | | | | 2,798,835 | | | | | 68,651,770 | | | | | (71,450,605 | ) | | | | - | | | | | - | | | | | - | | | | | 239,687 | |
Invesco Liquid Assets Portfolio, Institutional Class | | | | 932,945 | | | | | 21,999,260 | | | | | (22,933,158 | ) | | | | - | | | | | 953 | | | | | - | | | | | 45,748 | |
Total | | | | $9,568,210 | | | | | $350,442,004 | | | | | $(344,607,399 | ) | | | | $4,374 | | | | | $(4,189 | ) | | | | $15,403,000 | | | | | $488,058 | |
| (d) | The rate shown is the 7-day SEC standardized yield as of April 30, 2020. |
See accompanying Notes to Financial Statements which are an integral part of the financial statements.
11 Invesco Technology Fund
Statement of Assets and Liabilities
April 30, 2020
| | | | |
Assets: | | | | |
Investments in securities, at value (Cost $532,079,848) | | | $ 1,099,462,154 | |
Investments in affiliated money market funds, at value (Cost $15,398,617) | | | 15,403,000 | |
Foreign currencies, at value (Cost $293) | | | 293 | |
Receivable for: | | | | |
Investments sold | | | 10,717,203 | |
Fund shares sold | | | 1,366,672 | |
Dividends | | | 490,425 | |
Investment for trustee deferred compensation and retirement plans | | | 204,652 | |
Other assets | | | 55,467 | |
Total assets | | | 1,127,699,866 | |
| |
Liabilities: | | | | |
Payable for: | | | | |
Dividends | | | 182 | |
Fund shares reacquired | | | 841,385 | |
Amount due custodian | | | 35,741 | |
Accrued fees to affiliates | | | 536,225 | |
Accrued trustees’ and officers’ fees and benefits | | | 269 | |
Accrued other operating expenses | | | 268,342 | |
Trustee deferred compensation and retirement plans | | | 227,499 | |
Total liabilities | | | 1,909,643 | |
Net assets applicable to shares outstanding | | | $ 1,125,790,223 | |
| |
Net assets consist of: | | | | |
Shares of beneficial interest | | | $ 551,599,688 | |
Distributable earnings | | | 574,190,535 | |
| | | | $ 1,125,790,223 | |
| | | | |
Net Assets: | | | | |
Class A | | | $ 572,351,195 | |
Class C | | | $ 32,722,887 | |
Class Y | | | $ 36,340,564 | |
Investor Class | | | $ 483,563,498 | |
Class R5 | | | $ 266,655 | |
Class R6 | | | $ 545,424 | |
|
Shares outstanding, no par value, with an unlimited number of shares authorized: | |
Class A | | | 11,367,112 | |
Class C | | | 852,606 | |
Class Y | | | 706,318 | |
Investor Class | | | 9,646,531 | |
Class R5 | | | 4,359 | |
Class R6 | | | 8,910 | |
Class A: | | | | |
Net asset value per share | | | $ 50.35 | |
Maximum offering price per share (Net asset value of $50.35 ÷ 94.50%) | | | $ 53.28 | |
Class C: | | | | |
Net asset value and offering price per share | | | $ 38.38 | |
Class Y: | | | | |
Net asset value and offering price per share | | | $ 51.45 | |
Investor Class: | | | | |
Net asset value and offering price per share | | | $ 50.13 | |
Class R5: | | | | |
Net asset value and offering price per share | | | $ 61.17 | |
Class R6: | | | | |
Net asset value and offering price per share | | | $ 61.21 | |
See accompanying Notes to Financial Statements which are an integral part of the financial statements.
12 Invesco Technology Fund
Statement of Operations
For the year ended April 30, 2020
| | | | |
Investment income: | | | | |
Dividends (net of foreign withholding taxes of $68,429) | | | $ 5,498,385 | |
Dividends from affiliated money market funds (includes securities lending income of $285,435) | | | 488,058 | |
Total investment income | | | 5,986,443 | |
| |
Expenses: | | | | |
Advisory fees | | | 6,437,547 | |
Administrative services fees | | | 138,281 | |
Custodian fees | | | 7,430 | |
Distribution fees - Class A | | | 1,119,295 | |
Distribution fees - Class C | | | 280,843 | |
Distribution fees - Investor Class | | | 716,734 | |
Transfer agent fees - A, C, Y and Investor | | | 2,282,113 | |
Transfer agent fees - R5 | | | 262 | |
Transfer agent fees - R6 | | | 322 | |
Trustees’ and officers’ fees and benefits | | | 27,473 | |
Registration and filing fees | | | 91,294 | |
Reports to shareholders | | | 142,033 | |
Professional services fees | | | 75,793 | |
Other | | | 68,825 | |
Total expenses | | | 11,388,245 | |
Less: Fees waived and/or expense offset arrangement(s) | | | (41,267 | ) |
Net expenses | | | 11,346,978 | |
Net investment income (loss) | | | (5,360,535 | ) |
| |
Realized and unrealized gain (loss) from: | | | | |
Net realized gain from: | | | | |
Investment securities (includes net gains from securities sold to affiliates of $1,254,733) | | | 49,487,774 | |
Foreign currencies | | | 15,610 | |
| | | | 49,503,384 | |
Change in net unrealized appreciation (depreciation) of: | | | | |
Investment securities | | | 64,330,785 | |
Foreign currencies | | | (19,404 | ) |
| | | | 64,311,381 | |
Net realized and unrealized gain | | | 113,814,765 | |
Net increase in net assets resulting from operations | | | $108,454,230 | |
See accompanying Notes to Financial Statements which are an integral part of the financial statements.
13 Invesco Technology Fund
Statement of Changes in Net Assets
For the years ended April 30, 2020 and 2019
| | | | | | | | |
| | | 2020 | | | 2019 | |
Operations: | | | | | | | | |
Net investment income (loss) | | $ | (5,360,535 | ) | | $ | (6,282,149 | ) |
Net realized gain | | | 49,503,384 | | | | 81,193,597 | |
Change in net unrealized appreciation | | | 64,311,381 | | | | 51,310,916 | |
Net increase in net assets resulting from operations | | | 108,454,230 | | | | 126,222,364 | |
| | |
Distributions to shareholders from distributable earnings: | | | | | | | | |
Class A | | | (41,438,833 | ) | | | (29,341,022 | ) |
Class C | | | (3,289,057 | ) | | | (4,044,783 | ) |
Class Y | | | (2,853,254 | ) | | | (2,636,792 | ) |
Investor Class | | | (43,656,636 | ) | | | (33,562,031 | ) |
Class R5 | | | (22,015 | ) | | | (14,556 | ) |
Class R6 | | | (39,211 | ) | | | (2,866 | ) |
Total distributions from distributable earnings | | | (91,299,006 | ) | | | (69,602,050 | ) |
| | |
Share transactions–net: | | | | | | | | |
Class A | | | 118,730,288 | | | | 38,822,626 | |
Class C | | | 4,966,683 | | | | (10,928,886 | ) |
Class Y | | | 3,289,110 | | | | 4,471,260 | |
Investor Class | | | 1,069,484 | | | | (1,318,955 | ) |
Class R5 | | | (7,732 | ) | | | 79,006 | |
Class R6 | | | 60,237 | | | | 357,314 | |
Net increase in net assets resulting from share transactions | | | 128,108,070 | | | | 31,482,365 | |
Net increase in net assets | | | 145,263,294 | | | | 88,102,679 | |
| | |
Net assets: | | | | | | | | |
Beginning of year | | | 980,526,929 | | | | 892,424,250 | |
End of year | | $ | 1,125,790,223 | | | $ | 980,526,929 | |
See accompanying Notes to Financial Statements which are an integral part of the financial statements.
14 Invesco Technology Fund
Financial Highlights
The following schedule presents financial highlights for a share of the Fund outstanding throughout the periods indicated.
| | | | | | | | | | | | | | | | | | | | | | | | | | | | | | | | | | | | | | | | | | | | | | | | | | | | | | | | | | | | |
| | | Net asset
value,
beginning
of period | | Net
investment
income
(loss)(a) | | Net gains
(losses)
on securities
(both
realized and
unrealized) | | Total from
investment
operations | | Distributions
from net
realized
gains | | Net asset
value, end
of period | | Total
return (b) | | Net assets,
end of period
(000’s omitted) | | Ratio of
expenses
to average
net assets
with fee waivers
and/or
expenses
absorbed | | Ratio of
expenses
to average net
assets without
fee waivers
and/ or
expenses
absorbed | | Ratio of net
investment
income
(loss)
to average
net assets | | Portfolio
turnover (c) |
Class A | | | | | | | | | | | | | | | | | | | | | | | | | | | | | | | | | | | | | | | | | | | | | | | | | | | | | | | | | | | | |
Year ended 04/30/20 | | | $ | 49.68 | | | | $ | (0.29 | ) | | | $ | 5.71 | | | | $ | 5.42 | | | | $ | (4.75 | ) | | | $ | 50.35 | | | | | 11.31 | % | | | $ | 572,351 | | | | | 1.19 | %(d) | | | | 1.19 | %(d) | | | | (0.58 | )%(d) | | | | 38 | % |
Year ended 04/30/19 | | | | 46.98 | | | | | (0.34 | ) | | | | 6.66 | | | | | 6.32 | | | | | (3.62 | ) | | | | 49.68 | | | | | 14.87 | | | | | 443,050 | | | | | 1.23 | | | | | 1.23 | | | | | (0.71 | ) | | | | 48 | |
Year ended 04/30/18 | | | | 39.78 | | | | | (0.29 | ) | | | | 9.31 | | | | | 9.02 | | | | | (1.82 | ) | | | | 46.98 | | | | | 22.94 | | | | | 377,444 | | | | | 1.27 | | | | | 1.28 | | | | | (0.63 | ) | | | | 47 | |
Year ended 04/30/17 | | | | 32.99 | | | | | (0.23 | ) | | | | 9.39 | | | | | 9.16 | | | | | (2.37 | ) | | | | 39.78 | | | | | 28.80 | | | | | 310,505 | | | | | 1.43 | | | | | 1.43 | | | | | (0.65 | ) | | | | 49 | |
Year ended 04/30/16 | | | | 37.86 | | | | | (0.26 | ) | | | | (2.09 | ) | | | | (2.35 | ) | | | | (2.52 | ) | | | | 32.99 | | | | | (6.83 | ) | | | | 279,234 | | | | | 1.39 | | | | | 1.39 | | | | | (0.70 | ) | | | | 46 | |
Class C | | | | | | | | | | | | | | | | | | | | | | | | | | | | | | | | | | | | | | | | | | | | | | | | | | | | | | | | | | | | |
Year ended 04/30/20 | | | | 39.21 | | | | | (0.51 | ) | | | | 4.43 | | | | | 3.92 | | | | | (4.75 | ) | | | | 38.38 | | | | | 10.47 | | | | | 32,723 | | | | | 1.94 | (d) | | | | 1.94 | (d) | | | | (1.33 | )(d) | | | | 38 | |
Year ended 04/30/19 | | | | 38.15 | | | | | (0.57 | ) | | | | 5.25 | | | | | 4.68 | | | | | (3.62 | ) | | | | 39.21 | | | | | 13.98 | | | | | 28,217 | | | | | 1.98 | | | | | 1.98 | | | | | (1.46 | ) | | | | 48 | |
Year ended 04/30/18 | | | | 32.84 | | | | | (0.51 | ) | | | | 7.64 | | | | | 7.13 | | | | | (1.82 | ) | | | | 38.15 | | | | | 22.02 | | | | | 39,954 | | | | | 2.02 | | | | | 2.03 | | | | | (1.38 | ) | | | | 47 | |
Year ended 04/30/17 | | | | 27.80 | | | | | (0.42 | ) | | | | 7.83 | | | | | 7.41 | | | | | (2.37 | ) | | | | 32.84 | | | | | 27.85 | | | | | 29,930 | | | | | 2.18 | | | | | 2.18 | | | | | (1.40 | ) | | | | 49 | |
Year ended 04/30/16 | | | | 32.53 | | | | | (0.45 | ) | | | | (1.76 | ) | | | | (2.21 | ) | | | | (2.52 | ) | | | | 27.80 | | | | | (7.53 | ) | | | | 27,898 | | | | | 2.14 | | | | | 2.14 | | | | | (1.45 | ) | | | | 46 | |
Class Y | | | | | | | | | | | | | | | | | | | | | | | | | | | | | | | | | | | | | | | | | | | | | | | | | | | | | | | | | | | | |
Year ended 04/30/20 | | | | 50.55 | | | | | (0.17 | ) | | | | 5.82 | | | | | 5.65 | | | | | (4.75 | ) | | | | 51.45 | | | | | 11.57 | | | | | 36,341 | | | | | 0.94 | (d) | | | | 0.94 | (d) | | | | (0.33 | )(d) | | | | 38 | |
Year ended 04/30/19 | | | | 47.62 | | | | | (0.22 | ) | | | | 6.77 | | | | | 6.55 | | | | | (3.62 | ) | | | | 50.55 | | | | | 15.16 | | | | | 32,658 | | | | | 0.98 | | | | | 0.98 | | | | | (0.46 | ) | | | | 48 | |
Year ended 04/30/18 | | | | 40.21 | | | | | (0.18 | ) | | | | 9.41 | | | | | 9.23 | | | | | (1.82 | ) | | | | 47.62 | | | | | 23.22 | | | | | 27,364 | | | | | 1.02 | | | | | 1.03 | | | | | (0.38 | ) | | | | 47 | |
Year ended 04/30/17 | | | | 33.24 | | | | | (0.14 | ) | | | | 9.48 | | | | | 9.34 | | | | | (2.37 | ) | | | | 40.21 | | | | | 29.13 | | | | | 17,205 | | | | | 1.18 | | | | | 1.18 | | | | | (0.40 | ) | | | | 49 | |
Year ended 04/30/16 | | | | 38.04 | | | | | (0.17 | ) | | | | (2.11 | ) | | | | (2.28 | ) | | | | (2.52 | ) | | | | 33.24 | | | | | (6.61 | ) | | | | 9,256 | | | | | 1.14 | | | | | 1.14 | | | | | (0.45 | ) | | | | 46 | |
Investor Class | | | | | | | | | | | | | | | | | | | | | | | | | | | | | | | | | | | | | | | | | | | | | | | | | | | | | | | | | | | | |
Year ended 04/30/20 | | | | 49.44 | | | | | (0.24 | ) | | | | 5.68 | | | | | 5.44 | | | | | (4.75 | ) | | | | 50.13 | | | | | 11.41 | (e) | | | | 483,563 | | | | | 1.09 | (d)(e) | | | | 1.09 | (d)(e) | | | | (0.48 | )(d)(e) | | | | 38 | |
Year ended 04/30/19 | | | | 46.71 | | | | | (0.28 | ) | | | | 6.63 | | | | | 6.35 | | | | | (3.62 | ) | | | | 49.44 | | | | | 15.02 | (e) | | | | 475,857 | | | | | 1.11 | (e) | | | | 1.11 | (e) | | | | (0.59 | )(e) | | | | 48 | |
Year ended 04/30/18 | | | | 39.53 | | | | | (0.25 | ) | | | | 9.25 | | | | | 9.00 | | | | | (1.82 | ) | | | | 46.71 | | | | | 23.03 | (e) | | | | 447,456 | | | | | 1.19 | (e) | | | | 1.20 | (e) | | | | (0.55 | )(e) | | | | 47 | |
Year ended 04/30/17 | | | | 32.78 | | | | | (0.21 | ) | | | | 9.33 | | | | | 9.12 | | | | | (2.37 | ) | | | | 39.53 | | | | | 28.86 | (e) | | | | 384,283 | | | | | 1.35 | (e) | | | | 1.35 | (e) | | | | (0.57 | )(e) | | | | 49 | |
Year ended 04/30/16 | | | | 37.60 | | | | | (0.22 | ) | | | | (2.08 | ) | | | | (2.30 | ) | | | | (2.52 | ) | | | | 32.78 | | | | | (6.73 | )(e) | | | | 330,298 | | | | | 1.30 | (e) | | | | 1.30 | (e) | | | | (0.61 | )(e) | | | | 46 | |
Class R5 | | | | | | | | | | | | | | | | | | | | | | | | | | | | | | | | | | | | | | | | | | | | | | | | | | | | | | | | | | | | |
Year ended 04/30/20 | | | | 59.18 | | | | | (0.12 | ) | | | | 6.86 | | | | | 6.74 | | | | | (4.75 | ) | | | | 61.17 | | | | | 11.74 | | | | | 267 | | | | | 0.81 | (d) | | | | 0.81 | (d) | | | | (0.20 | )(d) | | | | 38 | |
Year ended 04/30/19 | | | | 55.03 | | | | | (0.16 | ) | | | | 7.93 | | | | | 7.77 | | | | | (3.62 | ) | | | | 59.18 | | | | | 15.34 | | | | | 263 | | | | | 0.81 | | | | | 0.81 | | | | | (0.29 | ) | | | | 48 | |
Year ended 04/30/18 | | | | 46.14 | | | | | (0.11 | ) | | | | 10.82 | | | | | 10.71 | | | | | (1.82 | ) | | | | 55.03 | | | | | 23.44 | | | | | 163 | | | | | 0.85 | | | | | 0.85 | | | | | (0.21 | ) | | | | 47 | |
Year ended 04/30/17 | | | | 37.74 | | | | | (0.05 | ) | | | | 10.82 | | | | | 10.77 | | | | | (2.37 | ) | | | | 46.14 | | | | | 29.45 | | | | | 132 | | | | | 0.92 | | | | | 0.92 | | | | | (0.14 | ) | | | | 49 | |
Year ended 04/30/16 | | | | 42.75 | | | | | (0.08 | ) | | | | (2.41 | ) | | | | (2.49 | ) | | | | (2.52 | ) | | | | 37.74 | | | | | (6.36 | ) | | | | 465 | | | | | 0.87 | | | | | 0.87 | | | | | (0.18 | ) | | | | 46 | |
Class R6 | | | | | | | | | | | | | | | | | | | | | | | | | | | | | | | | | | | | | | | | | | | | | | | | | | | | | | | | | | | | |
Year ended 04/30/20 | | | | 59.20 | | | | | (0.10 | ) | | | | 6.86 | | | | | 6.76 | | | | | (4.75 | ) | | | | 61.21 | | | | | 11.77 | | | | | 545 | | | | | 0.77 | (d) | | | | 0.77 | (d) | | | | (0.16 | )(d) | | | | 38 | |
Year ended 04/30/19 | | | | 55.04 | | | | | (0.15 | ) | | | | 7.93 | | | | | 7.78 | | | | | (3.62 | ) | | | | 59.20 | | | | | 15.36 | | | | | 483 | | | | | 0.80 | | | | | 0.80 | | | | | (0.28 | ) | | | | 48 | |
Year ended 04/30/18 | | | | 46.14 | | | | | (0.11 | ) | | | | 10.83 | | | | | 10.72 | | | | | (1.82 | ) | | | | 55.04 | | | | | 23.47 | | | | | 42 | | | | | 0.85 | | | | | 0.85 | | | | | (0.21 | ) | | | | 47 | |
Year ended 04/30/17(f) | | | | 44.75 | | | | | (0.00 | ) | | | | 1.39 | | | | | 1.39 | | | | | — | | | | | 46.14 | | | | | 3.10 | | | | | 10 | | | | | 0.89 | (g) | | | | 0.89 | (g) | | | | (0.11 | )(g) | | | | 49 | |
| (a) | Calculated using average shares outstanding. |
| (b) | Includes adjustments in accordance with accounting principles generally accepted in the United States of America and as such, the net asset value for financial reporting purposes and the returns based upon those net asset values may differ from the net asset value and returns for shareholder transactions. Does not include sales charges and is not annualized for periods less than one year, if applicable. |
| (c) | Portfolio turnover is calculated at the fund level and is not annualized for periods less than one year, if applicable. For the year ended April 30, 2020, the portfolio turnover calculation excludes the value of securities purchased of $50,768,823 in connection with the acquisition of Invesco Technology Sector Fund into the Fund. |
| (d) | Ratios are based on average daily net assets (000’s omitted) of $447,718, $28,084, $33,554, $469,552 , $264 and $534 for Class A, Class C, Class Y, Investor Class, Class R5 and Class R6 shares, respectively. |
| (e) | The total return, ratio of expenses to average net assets and ratio of net investment income (loss) to average net assets reflect actual 12b-1 fees of 0.15%, 0.13%, 0.17%, 0.17% and 0.16% for the years ended April 30, 2020, 2019, 2018, 2017 and 2016, respectively. |
| (f) | Commencement date of April 4, 2017. |
15 Invesco Technology Fund
Notes to Financial Statements
April 30, 2020
NOTE 1–Significant Accounting Policies
Invesco Technology Fund (the “Fund”) is a series portfolio of AIM Sector Funds (Invesco Sector Funds) (the “Trust”). The Trust is a Delaware statutory trust registered under the Investment Company Act of 1940, as amended (the “1940 Act”), as an open-end series management investment company authorized to issue an unlimited number of shares of beneficial interest. Information presented in these financial statements pertains only to the Fund. Matters affecting the Fund or each class will be voted on exclusively by the shareholders of the Fund or each class.
The Fund’s investment objective is long-term growth of capital.
The Fund currently consists of six different classes of shares: Class A, Class C, Class Y, Investor Class, Class R5 and Class R6. Class Y and Investor Class shares are available only to certain investors. Class A shares are sold with a front-end sales charge unless certain waiver criteria are met and under certain circumstances load waived shares may be subject to contingent deferred sales charges (“CDSC”). Class C shares are sold with a CDSC. Class Y, Investor Class, Class R5 and Class R6 shares are sold at net asset value. Class C shares held for ten years after purchase are eligible for automatic conversion into Class A shares of the same Fund (the “Conversion Feature”). The automatic conversion pursuant to the Conversion Feature will generally occur at the end of the month following the tenth anniversary after a purchase of Class C shares.
The Fund is an investment company and accordingly follows the investment company accounting and reporting guidance in accordance with Financial Accounting Standards Board Accounting Standards Codification Topic 946, Financial Services – Investment Companies.
The following is a summary of the significant accounting policies followed by the Fund in the preparation of its financial statements.
| A. | Security Valuations – Securities, including restricted securities, are valued according to the following policy. |
A security listed or traded on an exchange (except convertible securities) is valued at its last sales price or official closing price as of the close of the customary trading session on the exchange where the security is principally traded, or lacking any sales or official closing price on a particular day, the security may be valued at the closing bid price on that day. Securities traded in the over-the-counter market are valued based on prices furnished by independent pricing services or market makers. When such securities are valued by an independent pricing service they may be considered fair valued. Futures contracts are valued at the final settlement price set by an exchange on which they are principally traded. Listed options are valued at the mean between the last bid and asked prices from the exchange on which they are principally traded. Options not listed on an exchange are valued by an independent source at the mean between the last bid and asked prices. For purposes of determining net asset value (“NAV”) per share, futures and option contracts generally are valued 15 minutes after the close of the customary trading session of the New York Stock Exchange (“NYSE”).
Investments in open-end and closed-end registered investment companies that do not trade on an exchange are valued at the end-of-day net asset value per share. Investments in open-end and closed-end registered investment companies that trade on an exchange are valued at the last sales price or official closing price as of the close of the customary trading session on the exchange where the security is principally traded.
Debt obligations (including convertible securities) and unlisted equities are fair valued using an evaluated quote provided by an independent pricing service. Evaluated quotes provided by the pricing service may be determined without exclusive reliance on quoted prices, and may reflect appropriate factors such as institution-size trading in similar groups of securities, developments related to specific securities, dividend rate (for unlisted equities), yield (for debt obligations), quality, type of issue, coupon rate (for debt obligations), maturity (for debt obligations), individual trading characteristics and other market data. Pricing services generally value debt obligations assuming orderly transactions of institutional round lot size, but a fund may hold or transact in the same securities in smaller, odd lot sizes. Odd lots often trade at lower prices than institutional round lots. Debt obligations are subject to interest rate and credit risks. In addition, all debt obligations involve some risk of default with respect to interest and/or principal payments.
Foreign securities’ (including foreign exchange contracts) prices are converted into U.S. dollar amounts using the applicable exchange rates as of the close of the NYSE. If market quotations are available and reliable for foreign exchange-traded equity securities, the securities will be valued at the market quotations. Because trading hours for certain foreign securities end before the close of the NYSE, closing market quotations may become unreliable. If between the time trading ends on a particular security and the close of the customary trading session on the NYSE, events occur that the investment adviser determines are significant and make the closing price unreliable, the Fund may fair value the security. If the event is likely to have affected the closing price of the security, the security will be valued at fair value in good faith using procedures approved by the Board of Trustees. Adjustments to closing prices to reflect fair value may also be based on a screening process of an independent pricing service to indicate the degree of certainty, based on historical data, that the closing price in the principal market where a foreign security trades is not the current value as of the close of the NYSE. Foreign securities’ prices meeting the approved degree of certainty that the price is not reflective of current value will be priced at the indication of fair value from the independent pricing service. Multiple factors may be considered by the independent pricing service in determining adjustments to reflect fair value and may include information relating to sector indices, American Depositary Receipts and domestic and foreign index futures. Foreign securities may have additional risks including exchange rate changes, potential for sharply devalued currencies and high inflation, political and economic upheaval, the relative lack of issuer information, relatively low market liquidity and the potential lack of strict financial and accounting controls and standards.
Securities for which market prices are not provided by any of the above methods may be valued based upon quotes furnished by independent sources. The last bid price may be used to value equity securities. The mean between the last bid and asked prices is used to value debt obligations, including corporate loans.
Securities for which market quotations are not readily available or became unreliable are valued at fair value as determined in good faith by or under the supervision of the Trust’s officers following procedures approved by the Board of Trustees. Issuer specific events, market trends, bid/asked quotes of brokers and information providers and other market data may be reviewed in the course of making a good faith determination of a security’s fair value.
The Fund may invest in securities that are subject to interest rate risk, meaning the risk that the prices will generally fall as interest rates rise and, conversely, the prices will generally rise as interest rates fall. Specific securities differ in their sensitivity to changes in interest rates depending on their individual characteristics. Changes in interest rates may result in increased market volatility, which may affect the value and/or liquidity of certain Fund investments.
Valuations change in response to many factors including the historical and prospective earnings of the issuer, the value of the issuer’s assets, general market conditions which are not specifically related to the particular issuer, such as real or perceived adverse economic conditions, changes in the general outlook for revenues or corporate earnings, changes in interest or currency rates, regional or global instability, natural or environmental disasters, widespread disease or other public health issues, war, acts of terrorism or adverse investor sentiment generally and market liquidity. Because of the inherent uncertainties of valuation, the values reflected in the financial statements may materially differ from the value received upon actual sale of those investments.
| B. | Securities Transactions and Investment Income – Securities transactions are accounted for on a trade date basis. Realized gains or losses on sales are computed on the basis of specific identification of the securities sold. Interest income (net of withholding tax, if any) is recorded on an accrual basis from settlement date. Dividend income (net of withholding tax, if any) is recorded on the ex-dividend date. |
The Fund may periodically participate in litigation related to Fund investments. As such, the Fund may receive proceeds from litigation settlements. Any proceeds received are included in the Statement of Operations as realized gain (loss) for investments no longer held and as unrealized gain (loss) for investments still held.
Brokerage commissions and mark ups are considered transaction costs and are recorded as an increase to the cost basis of securities purchased and/or a reduction of proceeds on a sale of securities. Such transaction costs are included in the determination of net realized and unrealized gain (loss) from investment
16 Invesco Technology Fund
securities reported in the Statement of Operations and the Statement of Changes in Net Assets and the net realized and unrealized gains (losses) on securities per share in the Financial Highlights. Transaction costs are included in the calculation of the Fund’s net asset value and, accordingly, they reduce the Fund’s total returns. These transaction costs are not considered operating expenses and are not reflected in net investment income reported in the Statement of Operations and the Statement of Changes in Net Assets, or the net investment income per share and the ratios of expenses and net investment income reported in the Financial Highlights, nor are they limited by any expense limitation arrangements between the Fund and the investment adviser.
The Fund allocates income and realized and unrealized capital gains and losses to a class based on the relative net assets of each class.
| C. | Country Determination – For the purposes of making investment selection decisions and presentation in the Schedule of Investments, the investment adviser may determine the country in which an issuer is located and/or credit risk exposure based on various factors. These factors include the laws of the country under which the issuer is organized, where the issuer maintains a principal office, the country in which the issuer derives 50% or more of its total revenues and the country that has the primary market for the issuer’s securities, as well as other criteria. Among the other criteria that may be evaluated for making this determination are the country in which the issuer maintains 50% or more of its assets, the type of security, financial guarantees and enhancements, the nature of the collateral and the sponsor organization. Country of issuer and/or credit risk exposure has been determined to be the United States of America, unless otherwise noted. |
| D. | Distributions – Distributions from net investment income and net realized capital gain, if any, are generally declared and paid annually and recorded on the ex-dividend date. The Fund may elect to treat a portion of the proceeds from redemptions as distributions for federal income tax purposes. |
| E. | Federal Income Taxes – The Fund intends to comply with the requirements of Subchapter M of the Internal Revenue Code of 1986, as amended (the “Internal Revenue Code”), necessary to qualify as a regulated investment company and to distribute substantially all of the Fund’s taxable earnings to shareholders. As such, the Fund will not be subject to federal income taxes on otherwise taxable income (including net realized capital gain) that is distributed to shareholders. |
| | Therefore, no provision for federal income taxes is recorded in the financial statements. |
The Fund recognizes the tax benefits of uncertain tax positions only when the position is more likely than not to be sustained. Management has analyzed the Fund’s uncertain tax positions and concluded that no liability for unrecognized tax benefits should be recorded related to uncertain tax positions. Management is not aware of any tax positions for which it is reasonably possible that the total amounts of unrecognized tax benefits will change materially in the next 12 months.
The Fund files tax returns in the U.S. Federal jurisdiction and certain other jurisdictions. Generally, the Fund is subject to examinations by such taxing authorities for up to three years after the filing of the return for the tax period.
| F. | Expenses – Fees provided for under the Rule 12b-1 plan of a particular class of the Fund are charged to the operations of such class. Transfer agency fees and expenses and other shareholder recordkeeping fees and expenses attributable to Class R5 and Class R6 are allocated to each share class based on relative net assets. Sub-accounting fees attributable to Class R5 are charged to the operations of the class. Transfer agency fees and expenses and other shareholder recordkeeping fees and expenses relating to all other classes are allocated among those classes based on relative net assets. All other expenses are allocated among the classes based on relative net assets. |
| G. | Accounting Estimates – The preparation of financial statements in conformity with accounting principles generally accepted in the United States of America (“GAAP”) requires management to make estimates and assumptions that affect the reported amounts of assets and liabilities at the date of the financial statements and the reported amounts of revenues and expenses during the reporting period including estimates and assumptions related to taxation. Actual results could differ from those estimates by a significant amount. In addition, the Fund monitors for material events or transactions that may occur or become known after the period-end date and before the date the financial statements are released to print. |
| H. | Indemnifications – Under the Trust’s organizational documents, each Trustee, officer, employee or other agent of the Trust is indemnified against certain liabilities that may arise out of the performance of their duties to the Fund. Additionally, in the normal course of business, the Fund enters into contracts, including the Fund’s servicing agreements, that contain a variety of indemnification clauses. The Fund’s maximum exposure under these arrangements is unknown as this would involve future claims that may be made against the Fund that have not yet occurred. The risk of material loss as a result of such indemnification claims is considered remote. |
| I. | Securities Lending – The Fund may lend portfolio securities having a market value up to one-third of the Fund’s total assets. Such loans are secured by collateral equal to no less than the market value of the loaned securities determined daily by the securities lending provider. Such collateral will be cash or debt securities issued or guaranteed by the U.S. Government or any of its sponsored agencies. Cash collateral received in connection with these loans is invested in short-term money market instruments or affiliated money market funds and is shown as such on the Schedule of Investments. The Fund bears the risk of loss with respect to the investment of collateral. It is the Fund’s policy to obtain additional collateral from or return excess collateral to the borrower by the end of the next business day, following the valuation date of the securities loaned. Therefore, the value of the collateral held may be temporarily less than the value of the securities on loan. When loaning securities, the Fund retains certain benefits of owning the securities, including the economic equivalent of dividends or interest generated by the security. Lending securities entails a risk of loss to the Fund if, and to the extent that, the market value of the securities loaned were to increase and the borrower did not increase the collateral accordingly, and the borrower failed to return the securities. The securities loaned are subject to termination at the option of the borrower or the Fund. Upon termination, the borrower will return to the Fund the securities loaned and the Fund will return the collateral. Upon the failure of the borrower to return the securities, collateral may be liquidated and the securities may be purchased on the open market to replace the loaned securities. The Fund could experience delays and costs in gaining access to the collateral and the securities may lose value during the delay which could result in potential losses to the Fund. Some of these losses may be indemnified by the lending agent. The Fund bears the risk of any deficiency in the amount of the collateral available for return to the borrower due to any loss on the collateral invested. Dividends received on cash collateral investments for securities lending transactions, which are net of compensation to counterparties, are included in Dividends from affiliated money market funds on the Statement of Operations. The aggregate value of securities out on loan, if any, is shown as a footnote on the Statement of Assets and Liabilities. |
| J. | Foreign Currency Translations – Foreign currency is valued at the close of the NYSE based on quotations posted by banks and major currency dealers. Portfolio securities and other assets and liabilities denominated in foreign currencies are translated into U.S. dollar amounts at the date of valuation. Purchases and sales of portfolio securities (net of foreign taxes withheld on disposition) and income items denominated in foreign currencies are translated into U.S. dollar amounts on the respective dates of such transactions. The Fund does not separately account for the portion of the results of operations resulting from changes in foreign exchange rates on investments and the fluctuations arising from changes in market prices of securities held. The combined results of changes in foreign exchange rates and the fluctuation of market prices on investments (net of estimated foreign tax withholding) are included with the net realized and unrealized gain or loss from investments in the Statement of Operations. Reported net realized foreign currency gains or losses arise from (1) sales of foreign currencies, (2) currency gains or losses realized between the trade and settlement dates on securities transactions, and (3) the difference between the amounts of dividends, interest, and foreign withholding taxes recorded on the Fund’s books and the U.S. dollar equivalent of the amounts actually received or paid. Net unrealized foreign currency gains and losses arise from changes in the fair values of assets and liabilities, other than investments in securities at fiscal period end, resulting from changes in exchange rates. |
The Fund may invest in foreign securities, which may be subject to foreign taxes on income, gains on investments or currency repatriation, a portion of which may be recoverable. Foreign taxes, if any, are recorded based on the tax regulations and rates that exist in the foreign markets in which the Fund invests and are shown in the Statement of Operations.
17 Invesco Technology Fund
| K. | Forward Foreign Currency Contracts – The Fund may engage in foreign currency transactions either on a spot (i.e. for prompt delivery and settlement) basis, or through forward foreign currency contracts, to manage or minimize currency or exchange rate risk. |
The Fund may also enter into forward foreign currency contracts for the purchase or sale of a security denominated in a foreign currency in order to “lock in” the U.S. dollar price of that security, or the Fund may also enter into forward foreign currency contracts that do not provide for physical settlement of the two currencies, but instead are settled by a single cash payment calculated as the difference between the agreed upon exchange rate and the spot rate at settlement based upon an agreed upon notional amount (non-deliverable forwards). The Fund will set aside liquid assets in an amount equal to the daily mark-to-market obligation for forward foreign currency contracts.
A forward foreign currency contract is an obligation between two parties (“Counterparties”) to purchase or sell a specific currency for an agreed-upon price at a future date. The use of forward foreign currency contracts does not eliminate fluctuations in the price of the underlying securities the Fund owns or intends to acquire but establishes a rate of exchange in advance. Fluctuations in the value of these contracts are measured by the difference in the contract date and reporting date exchange rates and are recorded as unrealized appreciation (depreciation) until the contracts are closed. When the contracts are closed, realized gains (losses) are recorded. Realized and unrealized gains (losses) on the contracts are included in the Statement of Operations. The primary risks associated with forward foreign currency contracts include failure of the Counterparty to meet the terms of the contract and the value of the foreign currency changing unfavorably. These risks may be in excess of the amounts reflected in the Statement of Assets and Liabilities.
| L. | Other Risks - The Fund’s investments are concentrated in a comparatively narrow segment of the economy, which may make the Fund more volatile. |
Many products and services offered in technology-related industries are subject to rapid obsolescence, which may lower the value of the issuers in this sector.
NOTE 2—Advisory Fees and Other Fees Paid to Affiliates
The Trust has entered into a master investment advisory agreement with Invesco Advisers, Inc. (the “Adviser” or “Invesco”). Effective April 17, 2020, under the terms of the investment advisory agreement, the Fund accrues daily and pays monthly an advisory fee to the Adviser based on the annual rate of the Fund’s average daily net assets as follows:
| | | | |
| Average Daily Net Assets | | Rate | |
First $ 500 million | | | 0.670% | |
Next $500 million | | | 0.640% | |
Next $1 billion | | | 0.520% | |
Next $2 billion | | | 0.450% | |
Next $2 billion | | | 0.400% | |
Next $2 billion | | | 0.375% | |
Over $8 billion | | | 0.350% | |
Prior to April 17, 2020, the Fund accrued daily and paid monthly an advisory fee to the Adviser based on the annual rate of the Fund’s average daily net assets as follows:
| | | | |
| Average Daily Net Assets | | Rate | |
First $ 350 million | | | 0.750% | |
Next $350 million | | | 0.650% | |
Next $1.3 billion | | | 0.550% | |
Next $2 billion | | | 0.450% | |
Next $2 billion | | | 0.400% | |
Next $2 billion | | | 0.375% | |
Over $8 billion | | | 0.350% | |
For the year ended April 30, 2020, the effective advisory fee rate incurred by the Fund was 0.66%.
Under the terms of a master sub-advisory agreement between the Adviser and each of Invesco Asset Management Deutschland GmbH, Invesco Asset Management Limited, Invesco Asset Management (Japan) Limited, Invesco Hong Kong Limited, Invesco Senior Secured Management, Inc. and Invesco Canada Ltd. (collectively, the “Affiliated Sub-Advisers”) the Adviser, not the Fund, will pay 40% of the fees paid to the Adviser to any such Affiliated Sub-Adviser(s) that provide(s) discretionary investment management services to the Fund based on the percentage of assets allocated to such Affiliated Sub-Adviser(s).
Effective April 17, 2020, the Adviser has contractually agreed, through at least April 30, 2021, to waive advisory fees and/or reimburse expenses of all shares to the extent necessary to limit total annual fund operating expenses after fee waiver and/or expense reimbursement (excluding certain items discussed below) of Class A, Class C, Class Y, Investor Class, Class R5 and Class R6 shares to 1.22%, 1.92%, 0.97%, 1.22%, 0.97% and 0.97%, respectively, of average daily net assets (the “expense limits”). Prior to April 17, 2020, the Adviser had contractually agreed, through at least June 30, 2020, to waive advisory fees and/or reimburse expenses of all shares to the extent necessary to limit total annual fund operating expenses after fee waiver and/or expense reimbursement (excluding certain items discussed above) of Class A, Class C, Class Y, Investor Class, Class R5 and Class R6 shares to 2.00%, 2.75%, 1.75%, 2.00%, 1.75% and 1.75%, respectively, of average daily net assets. In determining the Adviser’s obligation to waive advisory fees and/or reimburse expenses, the following expenses are not taken into account, and could cause the total annual fund operating expenses after fee waiver and/or expense reimbursement to exceed the numbers reflected above: (1) interest; (2) taxes; (3) dividend expense on short sales; (4) extraordinary or nonroutine items, including litigation expenses; and (5) expenses that the Fund has incurred but did not actually pay because of an expense offset arrangement. Unless Invesco continues the fee waiver agreement, it will terminate on April 30, 2021. During its term, the fee waiver agreement cannot be terminated or amended to increase the expense limits or reduce the advisory fee waiver without approval of the Board of Trustees. The Adviser did not waive fees and/or reimburse expenses during the period under these expense limits.
Further, the Adviser has contractually agreed, through at least June 30, 2022, to waive the advisory fee payable by the Fund in an amount equal to 100% of the net advisory fees the Adviser receives from the affiliated money market funds on investments by the Fund of uninvested cash (excluding investments of cash collateral from securities lending) in such affiliated money market funds.
For the year ended April 30, 2020, the Adviser waived advisory fees of $13,235.
The Trust has entered into a master administrative services agreement with Invesco pursuant to which the Fund has agreed to pay Invesco for certain administrative costs incurred in providing accounting services to the Fund. For the year ended April 30, 2020, expenses incurred under the agreement are shown in the Statement of Operations as Administrative services fees. Invesco has entered into a sub-administration agreement whereby State Street Bank and Trust Company (“SSB”) serves as
18 Invesco Technology Fund
fund accountant and provides certain administrative services to the Fund. Pursuant to a custody agreement with the Trust on behalf of the Fund, SSB also serves as the Fund’s custodian.
The Trust has entered into a transfer agency and service agreement with Invesco Investment Services, Inc. (“IIS”) pursuant to which the Fund has agreed to pay IIS a fee for providing transfer agency and shareholder services to the Fund and reimburse IIS for certain expenses incurred by IIS in the course of providing such services. IIS may make payments to intermediaries that provide omnibus account services, sub-accounting services and/or networking services. All fees payable by IIS to intermediaries that provide omnibus account services or sub-accounting services are charged back to the Fund, subject to certain limitations approved by the Trust’s Board of Trustees. For the year ended April 30, 2020, expenses incurred under the agreement are shown in the Statement of Operations as Transfer agent fees.
The Trust has entered into master distribution agreements with Invesco Distributors, Inc. (“IDI”) to serve as the distributor for the Class A, Class C, Class Y, Investor Class, Class R5 and Class R6 shares of the Fund. The Trust has adopted plans pursuant to Rule 12b-1 under the 1940 Act with respect to the Fund’s Class A, Class C and Investor Class shares (collectively, the “Plans”). The Fund, pursuant to the Plans, reimburses IDI for its allocated share of expenses incurred for the period, up to a maximum annual rate of 0.25% of the average daily net assets of Class A shares, up to 1.00% of the average daily net assets of Class C shares, and up to 0.25% of the average daily net assets of Investor Class shares. The fees are accrued daily and paid monthly. Of the Plan payments, up to 0.25% of the average daily net assets of each class of shares may be paid to furnish continuing personal shareholder services to customers who purchase and own shares of such classes. Any amounts not paid as a service fee under the Plans would constitute an asset-based sales charge. Rules of the Financial Industry Regulatory Authority (“FINRA”) impose a cap on the total sales charges, including asset-based sales charges, that may be paid by any class of shares of the Fund. For the year ended April 30, 2020, expenses incurred under the Plans are shown in the Statement of Operations as Distribution fees.
Front-end sales commissions and CDSC (collectively, the “sales charges”) are not recorded as expenses of the Fund. Front-end sales commissions are deducted from proceeds from the sales of Fund shares prior to investment in Class A shares of the Fund. CDSC are deducted from redemption proceeds prior to remittance to the shareholder. During the year ended April 30, 2020, IDI advised the Fund that IDI retained $92,581 in front-end sales commissions from the sale of Class A shares and $416 and $2,575 from Class A and Class C shares, respectively, for CDSC imposed upon redemptions by shareholders.
For the year ended April 30, 2020, the Fund incurred $1,481 in brokerage commissions with Invesco Capital Markets, Inc., an affiliate of the Adviser and IDI, for portfolio transactions executed on behalf of the Fund.
Certain officers and trustees of the Trust are officers and directors of the Adviser, IIS and/or IDI.
NOTE 3–Additional Valuation Information
GAAP defines fair value as the price that would be received to sell an asset or paid to transfer a liability in an orderly transaction between market participants at the measurement date, under current market conditions. GAAP establishes a hierarchy that prioritizes the inputs to valuation methods, giving the highest priority to readily available unadjusted quoted prices in an active market for identical assets (Level 1) and the lowest priority to significant unobservable inputs (Level 3), generally when market prices are not readily available or are unreliable. Based on the valuation inputs, the securities or other investments are tiered into one of three levels. Changes in valuation methods may result in transfers in or out of an investment’s assigned level:
| | |
| Level 1 – | | Prices are determined using quoted prices in an active market for identical assets. |
| Level 2 – | | Prices are determined using other significant observable inputs. Observable inputs are inputs that other market participants may use in pricing a security. These may include quoted prices for similar securities, interest rates, prepayment speeds, credit risk, yield curves, loss severities, default rates, discount rates, volatilities and others. |
| Level 3 – | | Prices are determined using significant unobservable inputs. In situations where quoted prices or observable inputs are unavailable (for example, when there is little or no market activity for an investment at the end of the period), unobservable inputs may be used. Unobservable inputs reflect the Fund’s own assumptions about the factors market participants would use in determining fair value of the securities or instruments and would be based on the best available information. |
The following is a summary of the tiered valuation input levels, as of April 30, 2020. The level assigned to the securities valuations may not be an indication of the risk or liquidity associated with investing in those securities. Because of the inherent uncertainties of valuation, the values reflected in the financial statements may materially differ from the value received upon actual sale of those investments.
| | | | | | | | | | | | | | | | | | | | |
| | | Level 1 | | Level 2 | | Level 3 | | Total |
Investments in Securities | | | | | | | | | | | | | | | | | | | | |
Common Stocks & Other Equity Interests | | | | $1,071,942,867 | | | | | $27,519,287 | | | | | $– | | | | | $1,099,462,154 | |
Money Market Funds | | | | 15,403,000 | | | | | – | | | | | – | | | | | 15,403,000 | |
Total Investments | | | | $1,087,345,867 | | | | | $27,519,287 | | | | | $– | | | | | $1,114,865,154 | |
NOTE 4–Security Transactions with Affiliated Funds
The Fund is permitted to purchase or sell securities from or to certain other Invesco Funds under specified conditions outlined in procedures adopted by the Board of Trustees of the Trust. The procedures have been designed to ensure that any purchase or sale of securities by the Fund from or to another fund or portfolio that is or could be considered an affiliate by virtue of having a common investment adviser (or affiliated investment advisers), common Trustees and/or common officers complies with Rule 17a-7 of the 1940 Act. Further, as defined under the procedures, each transaction is effected at the current market price. Pursuant to these procedures, for the year ended April 30, 2020, the Fund engaged in securities sales of $2,124,915, which resulted in net realized gains of $1,254,733.
NOTE 5–Expense Offset Arrangement(s)
The expense offset arrangement is comprised of transfer agency credits which result from balances in demand deposit accounts used by the transfer agent for clearing shareholder transactions. For the year ended April 30, 2020, the Fund received credits from this arrangement, which resulted in the reduction of the Fund’s total expenses of $28,032.
NOTE 6–Trustees’ and Officers’ Fees and Benefits
Trustees’ and Officers’ Fees and Benefits include amounts accrued by the Fund to pay remuneration to certain Trustees and Officers of the Fund. Trustees have the option to defer compensation payable by the Fund, and Trustees’ and Officers’ Fees and Benefits also include amounts accrued by the Fund to fund such deferred compensation amounts. Those Trustees who defer compensation have the option to select various Invesco Funds in which their deferral accounts shall be deemed to be invested. Finally, certain current Trustees were eligible to participate in a retirement plan that provided for benefits to be paid upon retirement to Trustees over a period of time based on the number of years of service. The Fund may have certain former Trustees who also participate in a retirement plan and receive benefits under such plan. Trustees’ and Officers’ Fees and Benefits include amounts accrued by the Fund to fund such retirement benefits. Obligations under the deferred compensation and retirement plans represent unsecured claims against the general assets of the Fund.
19 Invesco Technology Fund
NOTE 7–Cash Balances
The Fund is permitted to temporarily carry a negative or overdrawn balance in its account with SSB, the custodian bank. Such balances, if any at period-end, are shown in the Statement of Assets and Liabilities under the payable caption Amount due custodian. To compensate the custodian bank for such overdrafts, the overdrawn Fund may either (1) leave funds as a compensating balance in the account so the custodian bank can be compensated by earning the additional interest; or (2) compensate by paying the custodian bank at a rate agreed upon by the custodian bank and Invesco, not to exceed the contractually agreed upon rate. The Fund may not purchase additional securities when any borrowings from banks or broker-dealers exceed 5% of the Fund’s total assets, or when any borrowings from an Invesco Fund are outstanding.
NOTE 8–Distributions to Shareholders and Tax Components of Net Assets
Tax Character of Distributions to Shareholders Paid During the Fiscal Years Ended April 30, 2020 and 2019:
| | | | | | | | |
| | | 2020 | | | 2019 | |
Long-term capital gain | | | $91,299,006 | | | | $69,602,050 | |
| | |
Tax Components of Net Assets at Period-End: | | | | | | | | |
| | | | | | 2020 | |
Undistributed long-term capital gain | | | | | | | $ 13,458,625 | |
Net unrealized appreciation – investments | | | | | | | 563,048,256 | |
Net unrealized appreciation - foreign currencies | | | | | | | 1,195 | |
Temporary book/tax differences | | | | | | | (206,458 | ) |
Late-Year ordinary loss deferral | | | | | | | (2,111,083 | ) |
Shares of beneficial interest | | | | | | | 551,599,688 | |
Total net assets | | | | | | | $1,125,790,223 | |
The difference between book-basis and tax-basis unrealized appreciation (depreciation) is due to differences in the timing of recognition of gains and losses on investments for tax and book purposes. The Fund’s net unrealized appreciation (depreciation) difference is attributable primarily to wash sales.
The temporary book/tax differences are a result of timing differences between book and tax recognition of income and/or expenses. The Fund’s temporary book/tax differences are the result of the trustee deferral of compensation and retirement plan benefits.
Capital loss carryforward is calculated and reported as of a specific date. Results of transactions and other activity after that date may affect the amount of capital loss carryforward actually available for the Fund to utilize. The ability to utilize capital loss carryforward in the future may be limited under the Internal Revenue Code and related regulations based on the results of future transactions.
The Fund does not have a capital loss carryforward as of April 30, 2020.
NOTE 9–Investment Transactions
The aggregate amount of investment securities (other than short-term securities, U.S. Treasury obligations and money market funds, if any) purchased and sold by the Fund during the year ended April 30, 2020 was $367,757,937 and $434,631,754, respectively. Cost of investments, including any derivatives, on a tax basis includes the adjustments for financial reporting purposes as of the most recently completed federal income tax reporting period-end.
| | | | |
| Unrealized Appreciation (Depreciation) of Investments on a Tax Basis | | | |
Aggregate unrealized appreciation of investments | | | $567,633,024 | |
Aggregate unrealized (depreciation) of investments | | | (4,584,768 | ) |
Net unrealized appreciation of investments | | | $563,048,256 | |
Cost of investments for tax purposes is $551,816,898.
NOTE 10–Reclassification of Permanent Differences
Primarily as a result of differing book/tax treatment of net operating loss, on April 30, 2020, undistributed net investment income (loss) was increased by $5,702,947, undistributed net realized gain was decreased by $21,387 and shares of beneficial interest was decreased by $5,681,560. Further, as a result of tax deferrals acquired in the reorganization of Invesco Technology Sector Fund into the Fund, undistributed net investment income (loss) was decreased by $199,307, undistributed net realized gain was decreased by $259,732 and shares of beneficial interest was increased by $459,039. These reclassifications had no effect on the net assets of the Fund.
NOTE 11–Share Information
| | | | | | | | | | | | | | | | | | |
| | | Summary of Share Activity | |
| | | Year ended April 30, 2020(a) | | | | | Year ended April 30, 2019 | |
| | | Shares | | | Amount | | | | | Shares | | | Amount | |
Sold: | | | | | | | | | | | | | | | | | | |
Class A | | | 1,342,876 | | | | $ 64,521,441 | | | | | | 1,165,594 | | | | $ 57,202,175 | |
Class C | | | 275,787 | | | | 10,322,732 | | | | | | 304,477 | | | | 12,186,625 | |
Class Y | | | 454,191 | | | | 22,597,462 | | | | | | 345,911 | | | | 17,105,926 | |
Investor Class | | | 357,306 | | | | 17,095,081 | | | | | | 352,388 | | | | 17,112,863 | |
Class R5 | | | 989 | | | | 58,491 | | | | | | 1,638 | | | | 92,014 | |
Class R6 | | | 5,036 | | | | 294,925 | | | | | | 7,888 | | | | 384,606 | |
20 Invesco Technology Fund
| | | | | | | | | | | | | | | | |
| | | | | | Summary of Share Activity | | | | |
| | | Year ended
April 30, 2020(a) | | | Year ended April 30, 2019 | |
| | | Shares | | | Amount | | | Shares | | | Amount | |
| | | | |
Issued as reinvestment of dividends: | | | | | | | | | | | | | | | | |
Class A | | | 815,214 | | | | $ 39,407,436 | | | | 669,047 | | | | $ 28,086,552 | |
Class C | | | 83,701 | | | | 3,093,603 | | | | 115,840 | | | | 3,849,363 | |
Class Y | | | 51,986 | | | | 2,566,017 | | | | 57,091 | | | | 2,436,631 | |
Investor Class | | | 859,801 | | | | 41,356,437 | | | | 774,274 | | | | 32,333,688 | |
Class R5 | | | 349 | | | | 20,491 | | | | 268 | | | | 13,395 | |
Class R6 | | | 638 | | | | 37,433 | | | | 41 | | | | 2,057 | |
| | | | |
Automatic conversion of Class C shares to Class A shares: | | | | | | | | | | | | | | | | |
Class A | | | 47,082 | | | | 2,309,544 | | | | 374,011 | | | | 16,430,312 | |
Class C | | | (60,747 | ) | | | (2,309,544 | ) | | | (472,845 | ) | | | (16,430,312 | ) |
| | | | |
Issued in connection with acquisitions:(b) | | | | | | | | | | | | | | | | |
Class A | | | 1,874,069 | | | | 91,992,978 | | | | - | | | | - | |
Class C | | | 43,497 | | | | 1,628,182 | | | | - | | | | - | |
Class Y | | | 95,840 | | | | 4,807,496 | | | | - | | | | - | |
| | | | |
Reacquired: | | | | | | | | | | | | | | | | |
Class A | | | (1,630,997 | ) | | | (79,501,111 | ) | | | (1,324,107 | ) | | | (62,896,413 | ) |
Class C | | | (209,207 | ) | | | (7,768,290 | ) | | | (275,231 | ) | | | (10,534,562 | ) |
Class Y | | | (541,778 | ) | | | (26,681,865 | ) | | | (331,510 | ) | | | (15,071,297 | ) |
Investor Class | | | (1,196,418 | ) | | | (57,382,034 | ) | | | (1,079,268 | ) | | | (50,765,506 | ) |
Class R5 | | | (1,419 | ) | | | (86,714 | ) | | | (436 | ) | | | (26,403 | ) |
Class R6 | | | (4,917 | ) | | | (272,121 | ) | | | (544 | ) | | | (29,349 | ) |
Net increase in share activity | | | 2,662,879 | | | | $128,108,070 | | | | 684,527 | | | | $ 31,482,365 | |
| (a) | There are entities that are record owners of more than 5% of the outstanding shares of the Fund and in the aggregate own 20% of the outstanding shares of the Fund. IDI has an agreement with these entities to sell Fund shares. The Fund, Invesco and/or Invesco affiliates may make payments to these entities, which are considered to be related to the Fund, for providing services to the Fund, Invesco and/or Invesco affiliates including but not limited to services such as securities brokerage, distribution, third party record keeping and account servicing. The Fund has no knowledge as to whether all or any portion of the shares owned of record by these entities are also owned beneficially. |
| (b) | After the close of business on April 17, 2020, the Fund acquired all the net assets of Invesco Technology Sector Fund (the “Target Fund”) pursuant to a plan of reorganization approved by the Board of Trustees of the Fund on February 14, 2020. The reorganization was executed in order to reduce overlap and increase efficiencies in the Adviser’s product line. The acquisition was accomplished by a tax-free exchange of 2,013,406 shares of the Fund for 4,100,576 shares outstanding of the Target Fund as of the close of business on April 17, 2020. Shares of the Target Fund were exchanged for the like class of shares of the Fund, based on the relative net asset value of the Target Fund to the net asset value of the Fund on the close of business, April 17, 2020. The Target Fund’s net assets as of the close of business on April 17, 2020 of $98,428,656, including $46,078,157 of unrealized appreciation, were combined with those of the Fund. The net assets of the Fund immediately before the acquisition were $997,498,351 and $1,095,927,007 immediately after the acquisition. |
The pro forma results of operations for the year ended April 30, 2020 assuming the reorganization had been completed on May 1, 2019, the beginning of the annual reporting period are as follows:
| | | | |
Net investment income (loss) | | $ | (5,922,338 | ) |
Net realized/unrealized gains | | | 122,298,993 | |
Change in net assets resulting from operations | | $ | 116,376,655 | |
As the combined investment portfolios have been managed as a single integrated portfolio since the acquisition was completed, it is not practicable to separate the amounts of revenue and earnings of the Target Fund that has been included in the Fund’s Statement of Operations since April 18, 2020.
NOTE 12—Coronavirus (COVID-19) Pandemic
During the first quarter of 2020, the World Health Organization declared COVID-19 to be a public health emergency. COVID-19 has led to increased short-term market volatility and may have adverse long-term effects on U.S. and world economies and markets in general. COVID-19 may adversely impact the Fund’s ability to achieve its investment objective. Because of the uncertainties on valuation, the global economy and business operations, values reflected in these financial statements may materially differ from the value received upon actual sales of those investments.
The extent of the impact on the performance of the Fund and its investments will depend on future developments, including the duration and spread of the COVID-19 outbreak, related restrictions and advisories, and the effects on the financial markets and economy overall, all of which are highly uncertain and cannot be predicted.
21 Invesco Technology Fund
Report of Independent Registered Public Accounting Firm
To the Board of Trustees of AIM Sector Funds (Invesco Sector Funds) and Shareholders of Invesco Technology Fund
Opinion on the Financial Statements
We have audited the accompanying statement of assets and liabilities, including the schedule of investments, of Invesco Technology Fund (one of the funds constituting AIM Sector Funds (Invesco Sector Funds), referred to hereafter as the “Fund”) as of April 30, 2020, the related statement of operations for the year ended April 30, 2020, the statement of changes in net assets for each of the two years in the period ended April 30, 2020, including the related notes, and the financial highlights for each of the periods indicated therein (collectively referred to as the “financial statements”). In our opinion, the financial statements present fairly, in all material respects, the financial position of the Fund as of April 30, 2020, the results of its operations for the year then ended, the changes in its net assets for each of the two years in the period ended April 30, 2020 and the financial highlights for each of the periods indicated therein in conformity with accounting principles generally accepted in the United States of America.
Basis for Opinion
These financial statements are the responsibility of the Fund’s management. Our responsibility is to express an opinion on the Fund’s financial statements based on our audits. We are a public accounting firm registered with the Public Company Accounting Oversight Board (United States) (PCAOB) and are required to be independent with respect to the Fund in accordance with the U.S. federal securities laws and the applicable rules and regulations of the Securities and Exchange Commission and the PCAOB.
We conducted our audits of these financial statements in accordance with the standards of the PCAOB. Those standards require that we plan and perform the audit to obtain reasonable assurance about whether the financial statements are free of material misstatement, whether due to error or fraud.
Our audits included performing procedures to assess the risks of material misstatement of the financial statements, whether due to error or fraud, and performing procedures that respond to those risks. Such procedures included examining, on a test basis, evidence regarding the amounts and disclosures in the financial statements. Our audits also included evaluating the accounting principles used and significant estimates made by management, as well as evaluating the overall presentation of the financial statements. Our procedures included confirmation of securities owned as of April 30, 2020 by correspondence with the custodian and transfer agent. We believe that our audits provide a reasonable basis for our opinion.
/s/PricewaterhouseCoopers LLP
Houston, Texas
June 26, 2020
We have served as the auditor of one or more of the investment companies in the Invesco group of investment companies since at least 1995. We have not been able to determine the specific year we began serving as auditor.
22 Invesco Technology Fund
Calculating your ongoing Fund expenses
Example
As a shareholder of the Fund, you incur two types of costs: (1) transaction costs, which may include sales charges (loads) on purchase payments or contingent deferred sales charges on redemptions, if any; and (2) ongoing costs, including management fees, distribution and/or service (12b-1) fees, and other Fund expenses. This example is intended to help you understand your ongoing costs (in dollars) of investing in the Fund and to compare these costs with ongoing costs of investing in other mutual funds. The example is based on an investment of $1,000 invested at the beginning of the period and held for the entire period November 1, 2019 through April 30, 2020.
Actual expenses
The table below provides information about actual account values and actual expenses. You may use the information in this table, together with the amount you invested, to estimate the expenses that you paid over the period. Simply divide your account value by $1,000 (for example, an $8,600 account value divided by $1,000 = 8.6), then multiply the result by the number in the table under the heading entitled “Actual Expenses Paid During Period” to estimate the expenses you paid on your account during this period.
Hypothetical example for comparison purposes
The table below also provides information about hypothetical account values and hypothetical expenses based on the Fund’s actual expense ratio and an assumed rate of return of 5% per year before expenses, which is not the Fund’s actual return.
The hypothetical account values and expenses may not be used to estimate the actual ending account balance or expenses you paid for the period. You may use this information to compare the ongoing costs of investing in the Fund and other funds. To do so, compare this 5% hypothetical example with the 5% hypothetical examples that appear in the shareholder reports of the other funds.
Please note that the expenses shown in the table are meant to highlight your ongoing costs only and do not reflect any transaction costs, such as sales charges (loads) on purchase payments or contingent deferred sales charges on redemptions, if any. Therefore, the hypothetical information is useful in comparing ongoing costs only, and will not help you determine the relative total costs of owning different funds. In addition, if these transaction costs were included, your costs would have been higher.
| | | | | | | | | | | | |
| | | Beginning
Account Value
(11/01/19) | | ACTUAL | | HYPOTHETICAL (5% annual return before expenses) | | Annualized
Expense
Ratio |
| | Ending
Account Value
(04/30/20)1 | | Expenses
Paid During
Period2 | | Ending
Account Value
(04/30/20) | | Expenses
Paid During
Period2 |
| Class A | | $1,000.00 | | $1,086.60 | | $6.07 | | $1,019.05 | | $5.87 | | 1.17% |
| Class C | | 1,000.00 | | 1,082.60 | | 9.94 | | 1,015.32 | | 9.62 | | 1.92 |
| Class Y | | 1,000.00 | | 1,088.00 | | 4.78 | | 1,020.29 | | 4.62 | | 0.92 |
| Investor Class | | 1,000.00 | | 1,087.50 | | 5.29 | | 1,019.79 | | 5.12 | | 1.02 |
| Class R5 | | 1,000.00 | | 1,088.80 | | 4.21 | | 1,020.84 | | 4.07 | | 0.81 |
| Class R6 | | 1,000.00 | | 1,088.90 | | 3.95 | | 1,021.08 | | 3.82 | | 0.76 |
| 1 | The actual ending account value is based on the actual total return of the Fund for the period November 1, 2019 through April 30, 2020, after actual expenses and will differ from the hypothetical ending account value which is based on the Fund’s expense ratio and a hypothetical annual return of 5% before expenses. |
| 2 | Expenses are equal to the Fund’s annualized expense ratio as indicated above multiplied by the average account value over the period, multiplied by 182/366 to reflect the most recent fiscal half year. |
23 Invesco Technology Fund
Tax Information
Form 1099-DIV, Form 1042-S and other year–end tax information provide shareholders with actual calendar year amounts that should be included in their tax returns. Shareholders should consult their tax advisers.
The following distribution information is being provided as required by the Internal Revenue Code or to meet a specific state’s requirement.
The Fund designates the following amounts or, if subsequently determined to be different, the maximum amount allowable for its fiscal year ended April 30, 2020:
| | | | | | |
| | | | | | |
| | Federal and State Income Tax | | | | |
| | Long-Term Capital Gain Distributions | | | $91,299,006 | |
| | Qualified Dividend Income* | | | 0 | % |
| | Corporate Dividends Received Deduction* | | | 0 | % |
| | U.S. Treasury Obligations* | | | 0 | % |
| | * | The above percentages are based on ordinary income dividends paid to shareholders during the Fund’s fiscal year. |
24 Invesco Technology Fund
Trustees and Officers
The address of each trustee and officer is AIM Sector Funds (Invesco Sector Funds) (the “Trust”), 11 Greenway Plaza, Suite 1000, Houston, Texas 77046-1173. The trustees serve for the life of the Trust, subject to their earlier death, incapacitation, resignation, retirement or removal as more specifically provided in the Trust’s organizational documents. Each officer serves for a one year term or until their successors are elected and qualified. Column two below includes length of time served with predecessor entities, if any.
| | | | | | | | |
Name, Year of Birth and Position(s) Held with the Trust | | Trustee and/
or Officer
Since | | Principal Occupation(s) During Past 5 Years | | Number of
Funds in
Fund Complex
Overseen by
Trustee | | Other Directorship(s) Held by Trustee During Past 5 Years |
| Interested Trustee | | | | | | | | |
| Martin L. Flanagan1 – 1960 Trustee and Vice Chair | | 2007 | | Executive Director, Chief Executive Officer and President, Invesco Ltd. (ultimate parent of Invesco and a global investment management firm); Trustee and Vice Chair, The Invesco Funds; Vice Chair, Investment Company Institute; and Member of Executive Board, SMU Cox School of Business Formerly: Advisor to the Board, Invesco Advisers, Inc. (formerly known as Invesco Institutional (N.A.), Inc.); Chairman and Chief Executive Officer, Invesco Advisers, Inc. (registered investment adviser); Director, Chairman, Chief Executive Officer and President, Invesco Holding Company (US), Inc. (formerly IVZ Inc.) (holding company), Invesco Group Services, Inc. (service provider) and Invesco North American Holdings, Inc. (holding company); Director, Chief Executive Officer and President, Invesco Holding Company Limited (parent of Invesco and a global investment management firm); Director, Invesco Ltd.; Chairman, Investment Company Institute and President, Co-Chief Executive Officer, Co-President, Chief Operating Officer and Chief Financial Officer, Franklin Resources, Inc. (global investment management organization) | | 203 | | None |
| 1 | Mr. Flanagan is considered an interested person (within the meaning of Section 2(a)(19) of the 1940 Act) of the Trust because he is an officer of the Adviser to the Trust, and an officer and a director of Invesco Ltd., ultimate parent of the Adviser. |
T-1 Invesco Technology Fund
Trustees and Officers–(continued)
| | | | | | | | |
Name, Year of Birth and
Position(s)
Held with the Trust | | Trustee and/or Officer
Since | | Principal Occupation(s)
During Past 5 Years | | Number of
Funds
in
Fund Complex
Overseen by
Trustee | | Other
Directorship(s)
Held by Trustee
During Past 5
Years |
| Independent Trustees | | | | | | | | |
Bruce L. Crockett - 1944
Trustee and Chair | | 2003 | | Chairman, Crockett Technologies Associates (technology consulting company) Formerly: Director, Captaris (unified messaging provider); Director, President and Chief Executive Officer, COMSAT Corporation; Chairman, Board of Governors of INTELSAT (international communications company); ACE Limited (insurance company); Independent Directors Council and Investment Company Institute: Member of the Audit Committee, Investment Company Institute; Member of the Executive Committee and Chair of the Governance Committee, Independent Directors Council | | 203 | | Director and Chairman of the Audit Committee, ALPS (Attorneys Liability Protection Society) (insurance company); Director and Member of the Audit Committee and Compensation Committee, Ferroglobe PLC (metallurgical company) |
David C. Arch - 1945
Trustee | | 2010 | | Chairman of Blistex Inc. (consumer health care products manufacturer); Member, World Presidents’ Organization | | 203 | | Board member of the Illinois Manufacturers’ Association |
Beth Ann Brown - 1968
Trustee | | 2019 | | Independent Consultant Formerly: Head of Intermediary Distribution, Managing Director, Strategic Relations, Managing Director, Head of National Accounts, Senior Vice President, National Account Manager and Senior Vice President, Key Account Manager, Columbia Management Investment Advisers LLC; Vice President, Key Account Manager, Liberty Funds Distributor, Inc.; and Trustee of certain Oppenheimer Funds | | 203 | | Director, Board of Directors of Caron Engineering Inc.; Advisor, Board of Advisors of Caron Engineering Inc.; President and Director, Acton Shapleigh Youth Conservation Corps (non - profit); and Vice President and Director of Grahamtastic Connection (non- profit) |
Jack M. Fields - 1952
Trustee | | 2003 | | Chief Executive Officer, Twenty First Century Group, Inc. (government affairs company); and Chairman, Discovery Learning Alliance (non-profit) Formerly: Owner and Chief Executive Officer, Dos Angeles Ranch L.P. (cattle, hunting, corporate entertainment); Director, Insperity, Inc. (formerly known as Administaff) (human resources provider); Chief Executive Officer, Texana Timber LP (sustainable forestry company); Director of Cross Timbers Quail Research Ranch (non-profit); and member of the U.S. House of Representatives | | 203 | | Member, Board of Directors of Baylor College of Medicine |
T-2 Invesco Technology Fund
Trustees and Officers–(continued)
| | | | | | | | |
Name, Year of Birth and
Position(s)
Held with the Trust | | Trustee and/or Officer
Since | | Principal Occupation(s)
During Past 5 Years | | Number of
Funds
in
Fund Complex
Overseen by
Trustee | | Other
Directorship(s)
Held by Trustee
During Past 5
Years |
| Independent Trustees–(continued) | | | | | | |
Cynthia Hostetler – 1962
Trustee | | 2017 | | Non-Executive Director and Trustee of a number of public and private business corporations Formerly: Director, Aberdeen Investment Funds (4 portfolios); Head of Investment Funds and Private Equity, Overseas Private Investment Corporation; President, First Manhattan Bancorporation, Inc.; Attorney, Simpson Thacher & Bartlett LLP | | 203 | | Vulcan Materials Company (construction materials company); Trilinc Global Impact Fund; Genesee & Wyoming, Inc. (railroads); Artio Global Investment LLC (mutual fund complex); Edgen Group, Inc. (specialized energy and infrastructure products distributor); Investment Company Institute (professional organization); Independent Directors Council (professional organization) |
Eli Jones - 1961
Trustee | | 2016 | | Professor and Dean, Mays Business School - Texas A&M University Formerly: Professor and Dean, Walton College of Business, University of Arkansas and E.J. Ourso College of Business, Louisiana State University; Director, Arvest Bank | | 229 | | Insperity, Inc. (formerly known as Administaff) (human resources provider) |
Elizabeth Krentzman - 1959
Trustee | | 2019 | | Formerly: Principal and Chief Regulatory Advisor for Asset Management Services and U.S. Mutual Fund Leader of Deloitte & Touche LLP; General Counsel of the Investment Company Institute (trade association); National Director of the Investment Management Regulatory Consulting Practice, Principal, Director and Senior Manager of Deloitte & Touche LLP; Assistant Director of the Division of Investment Management - Office of Disclosure and Investment Adviser Regulation of the U.S. Securities and Exchange Commission and various positions with the Division of Investment Management - Office of Regulatory Policy of the U.S. Securities and Exchange Commission; Associate at Ropes & Gray LLP; Advisory Board Member of the Securities and Exchange Commission Historical Society; and Trustee of certain Oppenheimer Funds | | 203 | | Trustee of the University of Florida National Board Foundation and Audit Committee Member; Member of the Cartica Funds Board of Directors (private investment funds); Member of the University of Florida Law Center Association, Inc. Board of Trustees and Audit Committee Member |
Anthony J. LaCava, Jr. - 1956
Trustee | | 2019 | | Formerly: Director and Member of the Audit Committee, Blue Hills Bank (publicly traded financial institution) and Managing Partner, KPMG LLP | | 203 | | Blue Hills Bank; Chairman, Bentley University; Member, Business School Advisory Council; and Nominating Committee KPMG LLP |
Prema Mathai-Davis - 1950
Trustee | | 2003 | | Retired Co-Owner & Partner of Quantalytics Research, LLC, (a FinTech Investment Research Platform for the Self-Directed Investor) | | 203 | | None |
T-3 Invesco Technology Fund
Trustees and Officers–(continued)
| | | | | | | | |
Name, Year of Birth and
Position(s)
Held with the Trust | | Trustee and/or Officer
Since | | Principal Occupation(s)
During Past 5 Years | | Number of
Funds
in
Fund Complex
Overseen by
Trustee | | Other
Directorship(s)
Held by Trustee
During Past 5
Years |
| Independent Trustees–(continued) |
Joel W. Motley - 1952
Trustee | | 2019 | | Director of Office of Finance, Federal Home Loan Bank System; Member of the Vestry of Trinity Wall Street; Managing Director of Carmona Motley Inc. (privately held financial advisor); Member of the Council on Foreign Relations and its Finance and Budget Committee; Chairman Emeritus of Board of Human Rights Watch and Member of its Investment Committee; and Member of Investment Committee and Board of Historic Hudson Valley (non-profit cultural organization) Formerly: Managing Director of Public Capital Advisors, LLC (privately held financial advisor); Managing Director of Carmona Motley Hoffman, Inc. (privately held financial advisor); Trustee of certain Oppenheimer Funds; and Director of Columbia Equity Financial Corp. (privately held financial advisor) | | 203 | | Member of Board of Greenwall Foundation (bioethics research foundation) and its Investment Committee; Member of Board of Friends of the LRC (non-profit legal advocacy); Board Member and Investment Committee Member of Pulizer Center for Crisis Reporting (non-profit journalism) |
Teresa M. Ressel - 1962
Trustee | | 2017 | | Non-executive director and trustee of a number of public and private business corporations Formerly: Chief Financial Officer, Olayan America, The Olayan Group (international investor/commercial/industrial); Chief Executive Officer, UBS Securities LLC; Group Chief Operating Officer, Americas, UBS AG; Assistant Secretary for Management & Budget and CFO, US Department of the Treasury | | 203 | | Atlantic Power Corporation (power generation company); ON Semiconductor Corp. (semiconductor supplier) |
Ann Barnett Stern - 1957
Trustee | | 2017 | | President and Chief Executive Officer, Houston Endowment Inc. (private philanthropic institution) Formerly: Executive Vice President and General Counsel, Texas Children’s Hospital; Attorney, Beck, Redden and Secrest, LLP; Business Law Instructor, University of St. Thomas; Attorney, Andrews & Kurth LLP | | 203 | | Federal Reserve Bank of Dallas |
Robert C. Troccoli - 1949
Trustee | | 2016 | | Retired Formerly: Adjunct Professor, University of Denver - Daniels College of Business; Senior Partner, KPMG LLP | | 203 | | None |
Daniel S. Vandivort - 1954
Trustee | | 2019 | | Treasurer, Chairman of the Audit and Finance Committee, and Trustee, Board of Trustees, Huntington Disease Foundation of America; and President, Flyway Advisory Services LLC (consulting and property management) Formerly: Trustee and Governance Chair, of certain Oppenheimer Funds | | 203 | | Chairman and Lead Independent Director, Chairman of the Audit Committee, and Director, Board of Directors, Value Line Funds |
James D. Vaughn - 1945
Trustee | | 2019 | | Retired Formerly: Managing Partner, Deloitte & Touche LLP; Trustee and Chairman of the Audit Committee, Schroder Funds; Board Member, Mile High United Way, Boys and Girls Clubs, Boy Scouts, Colorado Business Committee for the Arts, Economic Club of Colorado and Metro Denver Network (economic development corporation); and Trustee of certain Oppenheimer Funds | | 203 | | Board member and Chairman of Audit Committee of AMG National Trust Bank; Trustee and Investment Committee member, University of South Dakota Foundation; Board member, Audit Committee Member and past Board Chair, Junior Achievement (non-profit) |
Christopher L. Wilson - 1957
Trustee, Vice Chair and Chair Designate | | 2017 | | Retired Formerly: Director, TD Asset Management USA Inc. (mutual fund complex) (22 portfolios); Managing Partner, CT2, LLC (investing and consulting firm); President/Chief Executive Officer, Columbia Funds, Bank of America Corporation; President/Chief Executive Officer, CDC IXIS Asset Management Services, Inc.; Principal & Director of Operations, Scudder Funds, Scudder, Stevens & Clark, Inc.; Assistant Vice President, Fidelity Investments | | 203 | | ISO New England, Inc. (non-profit organization managing regional electricity market) |
T-4 Invesco Technology Fund
Trustees and Officers–(continued)
| | | | | | | | | | |
Name, Year of Birth and Position(s) Held with the Trust | | Trustee and/or Officer Since | | Principal Occupation(s) During Past 5 Years | | | | Number of Funds in
Fund Complex Overseen by Trustee | | Other Directorship(s) Held by Trustee During Past 5 Years |
| Officers | | | | | | | | | | |
Sheri Morris – 1964 President, Principal Executive Officer and Treasurer | | 2003 | | Head of Global Fund Services, Invesco Ltd.; President, Principal Executive Officer and Treasurer, The Invesco Funds; Vice President, Invesco Advisers, Inc. (formerly known as Invesco Institutional (N.A.), Inc.) (registered investment adviser); and Vice President, Invesco Exchange-Traded Fund Trust, Invesco Exchange-Traded Fund Trust II, Invesco India Exchange-Traded Fund Trust, Invesco Actively Managed Exchange-Traded Fund Trust, Invesco Actively Managed Exchange-Traded Commodity Fund Trust and Invesco Exchange-Traded Self-Indexed Fund Trust; and Vice President, OppenheimerFunds, Inc. Formerly: Vice President and Principal Financial Officer, The Invesco Funds; Vice President, Invesco AIM Advisers, Inc., Invesco AIM Capital Management, Inc. and Invesco AIM Private Asset Management, Inc.; Assistant Vice President and Assistant Treasurer, The Invesco Funds and Assistant Vice President, Invesco Advisers, Inc., Invesco AIM Capital Management, Inc. and Invesco AIM Private Asset Management, Inc.; and Treasurer, Invesco Exchange-Traded Fund Trust, Invesco Exchange-Traded Fund Trust II, Invesco India Exchange-Traded Fund Trust and Invesco Actively Managed Exchange-Traded Fund Trust | | | | N/A | | N/A |
Russell C. Burk – 1958 Senior Vice President and Senior Officer | | 2005 | | Senior Vice President and Senior Officer, The Invesco Funds | | | | N/A | | N/A |
Jeffrey H. Kupor – 1968 Senior Vice President, Chief Legal Officer and Secretary | | 2018 | | Head of Legal of the Americas, Invesco Ltd.; Senior Vice President and Secretary, Invesco Advisers, Inc. (formerly known as Invesco Institutional (N.A.), Inc.) (registered investment adviser); Senior Vice President and Secretary, Invesco Distributors, Inc. (formerly known as Invesco AIM Distributors, Inc.); Vice President and Secretary, Invesco Investment Services, Inc. (formerly known as Invesco AIM Investment Services, Inc.) Senior Vice President, Chief Legal Officer and Secretary, The Invesco Funds; Secretary and General Counsel, Invesco Investment Advisers LLC (formerly known as Van Kampen Asset Management); Secretary and General Counsel, Invesco Capital Markets, Inc. (formerly known as Van Kampen Funds Inc.) and Chief Legal Officer, Invesco Exchange-Traded Fund Trust, Invesco Exchange-Traded Fund Trust II, Invesco India Exchange-Traded Fund Trust, Invesco Actively Managed Exchange-Traded Fund Trust, Invesco Actively Managed Exchange-Traded Commodity Fund Trust and Invesco Exchange-Traded Self-Indexed Fund Trust; Secretary, Invesco Indexing LLC; Secretary, W.L. Ross & Co., LLC Formerly: Secretary and Vice President, Jemstep, Inc.; Head of Legal, Worldwide Institutional, Invesco Ltd.; Secretary and General Counsel, INVESCO Private Capital Investments, Inc.; Senior Vice President, Secretary and General Counsel, Invesco Management Group, Inc. (formerly known as Invesco AIM Management Group, Inc.); Assistant Secretary, INVESCO Asset Management (Bermuda) Ltd.; Secretary and General Counsel, Invesco Private Capital, Inc.; Assistant Secretary and General Counsel, INVESCO Realty, Inc.; Secretary and General Counsel, Invesco Senior Secured Management, Inc.; and Secretary, Sovereign G./P. Holdings Inc. | | | | N/A | | N/A |
Andrew R. Schlossberg – 1974 Senior Vice President | | 2019 | | Head of the Americas and Senior Managing Director, Invesco Ltd.; Director and Senior Vice President, Invesco Advisers, Inc. (formerly known as Invesco Institutional (N.A.), Inc.) (registered investment adviser); Director and Chairman, Invesco Investment Services, Inc. (formerly known as Invesco AIM Investment Services, Inc.) (registered transfer agent); Senior Vice President, The Invesco Funds; Director, Invesco Investment Advisers LLC (formerly known as Van Kampen Asset Management); Director, President and Chairman, Invesco Insurance Agency, Inc. Formerly: Director, Invesco UK Limited; Director and Chief Executive, Invesco Asset Management Limited and Invesco Fund Managers Limited; Assistant Vice President, The Invesco Funds; Senior Vice President, Invesco Advisers, Inc. (formerly known as Invesco Institutional (N.A.), Inc.) (registered investment adviser); Director and Chief Executive, Invesco Administration Services Limited and Invesco Global Investment Funds Limited; Director, Invesco Distributors, Inc.; Head of EMEA, Invesco Ltd.; President, Invesco Actively Managed Exchange-Traded Commodity Fund Trust, Invesco Actively Managed Exchange-Traded Fund Trust, Invesco Exchange-Traded Fund Trust, Invesco Exchange-Traded Fund Trust II and Invesco India Exchange-Traded Fund Trust; Managing Director and Principal Executive Officer, Invesco Capital Management LLC | | | | N/A | | N/A |
T-5 Invesco Technology Fund
Trustees and Officers–(continued)
| | | | | | | | | | | | |
Name, Year of Birth and Position(s) Held with the Trust | | Trustee and/or Officer Since | | Principal Occupation(s) During Past 5 Years | | | | | Number of Funds in Fund Complex Overseen by Trustee | | Other Directorship(s) Held by Trustee During Past 5 Years |
| Officers–(continued) | | | | | | | | | | | | |
John M. Zerr – 1962 Senior Vice President | | 2006 | | Chief Operating Officer of the Americas; Senior Vice President, Invesco Advisers, Inc. (formerly known as Invesco Institutional (N.A.), Inc.) (registered investment adviser); Senior Vice President, Invesco Distributors, Inc. (formerly known as Invesco AIM Distributors, Inc.); Director and Vice President, Invesco Investment Services, Inc. (formerly known as Invesco AIM Investment Services, Inc.) Senior Vice President, The Invesco Funds; Managing Director, Invesco Capital Management LLC; Director, Invesco Investment Advisers LLC (formerly known as Van Kampen Asset Management); Senior Vice President, Invesco Capital Markets, Inc. (formerly known as Van Kampen Funds Inc.); Manager, Invesco Indexing LLC; Manager, Invesco Specialized Products, LLC; Director and Senior Vice President, Invesco Insurance Agency, Inc.; Member, Invesco Canada Funds Advisory Board; Director, President and Chief Executive Officer, Invesco Corporate Class Inc. (corporate mutual fund company); and Director, Chairman, President and Chief Executive Officer, Invesco Canada Ltd. (formerly known as Invesco Trimark Ltd./Invesco Trimark Ltèe) (registered investment adviser and registered transfer agent); President, Invesco, Inc.; President, Invesco Global Direct Real Estate Feeder GP Ltd.; President, Invesco IP Holdings(Canada) Ltd; President, Invesco Global Direct Real Estate GP Ltd.; President, Invesco Financial Services Ltd. / Services Financiers Invesco Ltée; and President, Trimark Investments Ltd./Placements Trimark Ltée Formerly: Director and Senior Vice President, Invesco Management Group, Inc. (formerly known as Invesco AIM Management Group, Inc.); Secretary and General Counsel, Invesco Management Group, Inc. (formerly known as Invesco AIM Management Group, Inc.); Secretary, Invesco Investment Services, Inc. (formerly known as Invesco AIM Investment Services, Inc.); Chief Legal Officer and Secretary, The Invesco Funds; Secretary and General Counsel, Invesco Investment Advisers LLC (formerly known as Van Kampen Asset Management); Secretary and General Counsel, Invesco Capital Markets, Inc. (formerly known as Van Kampen Funds Inc.); Chief Legal Officer, Invesco Exchange-Traded Fund Trust, Invesco Exchange-Traded Fund Trust II, Invesco India Exchange-Traded Fund Trust, Invesco Actively Managed Exchange-Traded Fund Trust, Invesco Actively Managed Exchange-Traded Commodity Fund Trust and Invesco Exchange-Traded Self-Indexed Fund Trust; Secretary, Invesco Indexing LLC; Director, Secretary, General Counsel and Senior Vice President, Van Kampen Exchange Corp.; Director, Vice President and Secretary, IVZ Distributors, Inc. (formerly known as INVESCO Distributors, Inc.); Director and Vice President, INVESCO Funds Group, Inc.; Director and Vice President, Van Kampen Advisors Inc.; Director, Vice President, Secretary and General Counsel, Van Kampen Investor Services Inc.;Director and Secretary, Invesco Distributors, Inc. (formerly known as Invesco AIM Distributors, Inc.); Director, Senior Vice President, General Counsel and Secretary, Invesco AIM Advisers, Inc. and Van Kampen Investments Inc.; Director, Vice President and Secretary, Fund Management Company; Director, Senior Vice President, Secretary, General Counsel and Vice President, Invesco AIM Capital Management, Inc.; Chief Operating Officer and General Counsel, Liberty Ridge Capital, Inc. (an investment adviser) | | | | | | N/A | | N/A |
Gregory G. McGreevey – 1962 Senior Vice President | | 2012 | | Senior Managing Director, Invesco Ltd.; Director, Chairman, President, and Chief Executive Officer, Invesco Advisers, Inc. (formerly known as Invesco Institutional (N.A.), Inc.) (registered investment adviser); Director, Invesco Mortgage Capital, Inc. and Invesco Senior Secured Management, Inc.; and Senior Vice President, The Invesco Funds; and President, SNW Asset Management Corporation and Invesco Managed Accounts, LLC Formerly: Senior Vice President, Invesco Management Group, Inc. and Invesco Advisers, Inc.; Assistant Vice President, The Invesco Funds | | | | | | N/A | | N/A |
Kelli Gallegos – 1970 Vice President, Principal Financial Officer and Assistant Treasurer | | 2008 | | Principal Financial and Accounting Officer – Investments Pool, Invesco Specialized Products, LLC; Vice President, Principal Financial Officer and Assistant Treasurer, The Invesco Funds; Principal Financial and Accounting Officer – Pooled Investments, Invesco Capital Management LLC; Vice President and Treasurer, Invesco Exchange-Traded Fund Trust, Invesco Exchange-Traded Fund Trust II, Invesco India Exchange-Traded Fund Trust, Invesco Actively Managed Exchange-Traded Fund Trust, Invesco Actively Managed Exchange-Traded Commodity Fund Trust and Invesco Exchange-Traded Self-Indexed Fund Trust; Vice President, Invesco Advisers, Inc. Formerly: Assistant Treasurer, Invesco Specialized Products, LLC; Assistant Treasurer, Invesco Exchange-Traded Fund Trust, Invesco Exchange-Traded Fund Trust II, Invesco India Exchange-Traded Fund Trust, Invesco Actively Managed Exchange-Traded Fund Trust, Invesco Actively Managed Exchange-Traded Commodity Fund Trust and Invesco Exchange-Traded Self-Indexed Fund Trust; Assistant Treasurer, Invesco Capital Management LLC; Assistant Vice President, The Invesco Funds | | | | | | N/A | | N/A |
T-6 Invesco Technology Fund
Trustees and Officers–(continued)
| | | | | | | | |
Name, Year of Birth and Position(s) Held with the Trust | | Trustee and/or
Officer Since | | Principal Occupation(s) During Past 5 Years | | Number of
Funds in
Fund Complex
Overseen by
Trustee | | Other Directorship(s) Held by Trustee During Past 5 Years |
| Officers–(continued) | | | | | | | | |
Crissie M. Wisdom – 1969 Anti-Money Laundering Compliance Officer | | 2013 | | Anti-Money Laundering and OFAC Compliance Officer for Invesco U.S. entities including: Invesco Advisers, Inc. and its affiliates, Invesco Capital Markets, Inc., Invesco Distributors, Inc., Invesco Investment Services, Inc., The Invesco Funds, Invesco Capital Management, LLC, Invesco Trust Company; OppenheimerFunds Distributor, Inc., and Fraud Prevention Manager for Invesco Investment Services, Inc. | | N/A | | N/A |
Todd F. Kuehl – 1969 Chief Compliance Officer | | 2020 | | Chief Compliance Officer, Invesco Advisers, Inc. (registered investment adviser); and Chief Compliance Officer, The Invesco Funds Formerly: Managing Director and Chief Compliance Officer, Legg Mason (Mutual Funds); Chief Compliance Officer, Legg Mason Private Portfolio Group (registered investment adviser) | | N/A | | N/A |
The Statement of Additional Information of the Trust includes additional information about the Fund’s Trustees and is available upon request, without charge, by calling 1.800.959.4246. Please refer to the Fund’s Statement of Additional Information for information on the Fund’s sub-advisers.
| | | | | | |
| Office of the Fund | | Investment Adviser | | Distributor | | Auditors |
11 Greenway Plaza, Suite 1000 Houston, TX 77046-1173 | | Invesco Advisers, Inc. 1555 Peachtree Street, N.E. Atlanta, GA 30309 | | Invesco Distributors, Inc. 11 Greenway Plaza, Suite 1000 Houston, TX 77046-1173 | | PricewaterhouseCoopers LLP 1000 Louisiana Street, Suite 5800 Houston, TX 77002-5678 |
| | | |
| Counsel to the Fund | | Counsel to the Independent Trustees | | Transfer Agent | | Custodian |
Stradley Ronon Stevens & Young, LLP 2005 Market Street, Suite 2600 Philadelphia, PA 19103-7018 | | Goodwin Procter LLP 901 New York Avenue, N.W. Washington, D.C. 20001 | | Invesco Investment Services, Inc. 11 Greenway Plaza, Suite 1000 Houston, TX 77046-1173 | | State Street Bank and Trust Company 225 Franklin Street Boston, MA 02110-2801 |
T-7 Invesco Technology Fund

Go paperless with eDelivery
Visit invesco.com/edelivery to enjoy the convenience and security of anytime electronic access to your investment documents.
With eDelivery, you can elect to have any or all of the following materials delivered straight to your inbox to download, save and print from your own computer:
∎ Fund reports and prospectuses
∎ Quarterly statements
∎ Daily confirmations
∎ Tax forms
Invesco mailing information
Send general correspondence to Invesco Investment Services, Inc., P.O. Box 219078, Kansas City, MO 64121-9078.
Important notice regarding delivery of security holder documents
To reduce Fund expenses, only one copy of most shareholder documents may be mailed to shareholders with multiple accounts at the same address (Householding). Mailing of your shareholder documents may be householded indefinitely unless you instruct us otherwise. If you do not want the mailing of these documents to be combined with those for other members of your household, please contact Invesco Investment Services, Inc. at 800 959 4246 or contact your financial institution. We will begin sending you individual copies for each account within 30 days after receiving your request.
Fund holdings and proxy voting information
The Fund provides a complete list of its holdings four times in each fiscal year, at the quarter-ends. For the second and fourth quarters, the list appears in the Fund’s semiannual and annual reports to shareholders. For the first and third quarters, the Fund files the lists with the Securities and Exchange Commission (SEC) as an exhibit to its reports on Form N-PORT. The most recent list of portfolio holdings is available at invesco.com/completeqtrholdings. Shareholders can also look up the Fund’s Form N-PORT filings on the SEC website, sec.gov. The SEC file numbers for the Fund are shown below.
A description of the policies and procedures that the Fund uses to determine how to vote proxies relating to portfolio securities is available without charge, upon request, from our Client Services department at 800 959 4246, or at invesco.com/ proxyguidelines. The information is also available on the SEC website, sec.gov.
| | |
Information regarding how the Fund voted proxies related to its portfolio securities during the most recent 12-month period ended June 30 is available at invesco.com/proxysearch. This information is also available on the SEC website, sec.gov. Invesco Advisers, Inc. is an investment adviser; it provides investment advisory services to individual and institutional clients and does not sell securities. Invesco Distributors, Inc. is the US distributor for Invesco Ltd.’s retail mutual funds, exchange-traded funds and institutional money market funds. Both are wholly owned, indirect subsidiaries of Invesco Ltd. | | 
|
| | | | |
| SEC file numbers: 811-03826 and 002-85905 | | Invesco Distributors, Inc. | | I-TEC-AR-1 |
| | |
 | | Annual Report to Shareholders April 30, 2020 |
| | Invesco Value Opportunities Fund |
| | Nasdaq: A: VVOAX ∎ C: VVOCX ∎ R: VVORX ∎ Y: VVOIX ∎ R5: VVONX ∎ R6: VVOSX |

Beginning on January 1, 2021, as permitted by regulations adopted by the Securities and Exchange Commission, paper copies of the Fund’s shareholder reports will no longer be sent by mail, unless you specifically request paper copies of the reports from the Fund or from your financial intermediary, such as a broker-dealer or bank. Instead, the reports will be made available on the Fund’s website, and you will be notified by mail each time a report is posted and provided with a website link to access the report.
If you already elected to receive shareholder reports electronically, you will not be affected by this change and you need not take any action. You may elect to receive shareholder reports and other communications from the Fund electronically by contacting your financial intermediary (such as a broker-dealer or bank) or, if you are a direct investor, by enrolling at invesco.com/edelivery.
You may elect to receive all future reports in paper free of charge. If you invest through a financial intermediary, you can contact your financial intermediary to request that you continue to receive paper copies of your shareholder reports. If you invest directly with the Fund, you can call (800) 959-4246 to let the Fund know you wish to continue receiving paper copies of your shareholder reports. Your election to receive reports in paper will apply to all funds held with your financial intermediary or all funds held with the fund complex if you invest directly with the Fund.
Letters to Shareholders
| | |

| | Dear Shareholders: This annual report includes information about your Fund, including performance data and a complete list of its investments as of the close of the reporting period. Inside is a discussion of how your Fund was managed and the factors that affected its performance during the reporting period. Global equities and fixed-income securities faced a tumultuous environment during the reporting period. This was particularly true in the later stages of the period as a pandemic gripped the world and unsettled markets. At the onset of the reporting period, global equity markets were buoyed by a more accommodative stance from central banks. Despite US-China trade concerns and signs of slowing global growth, which led to some market volatility along the way, the second and third quarters of 2019 were relatively calm. In the final months of 2019, better-than-expected third quarter corporate earnings and initial agreement of the phase one US-China trade deal provided a favorable backdrop for equities and impressive fourth quarter global equity returns. |
The first quarter of 2020 proved to be a wild roller-coaster ride as the year began with US investors treated to equity gains culminating in record highs on February 19, 2020. The first half of the quarter, however, belied the impact the coronavirus (COVID-19) would have on markets in a world faced with shuttered businesses and global lockdowns. Equity markets began to sell off in late February and plummeted in March. The speed and depth of market declines and reversals during the month made March 2020 one of the most volatile months on record. While equities languished, government bonds largely performed as expected as central banks cut interest rates, which lowered bond yields but sent bond prices soaring. Like equities, however, corporate bond prices fell due to the impact of diminished corporate profits. Commodity prices, sans gold, largely declined during the first quarter. Oil prices suffered steep declines losing more than half their value in March amid a demand slump due to both COVID-19 and a supply glut from the Russia-Saudi Arabi oil-price war.
In response to the financial and economic hardships caused by the pandemic, central banks and governments around the world responded with fiscal and monetary stimulus. The US Federal Reserve cut interest rates to near zero (0.00-0.25%) and announced an unprecedented quantitative easing program. The US administration also passed a $2.2 trillion economic-relief package – the largest in US history. Most major economies outside of the US provided liquidity in the bond and equity markets in the form of fiscal policy and quantitative easing.
Massive global fiscal and monetary responses prompted a significant market rebound in April, with the S&P 500 Index recording one of its best monthly performances ever, despite macroeconomic data that illustrated the enormous economic cost of the shutdowns – more than 30 million US workers have lost their jobs and the US economy contracted at a 5.0% annualized rate (second estimate) for the first quarter of 2020. The final month of the reporting period also proved less volatile than March as markets attempted to normalize. As markets and investors attempt to adapt to a new normal, we’ll see how the interplay of interest rates, economic data, geopolitics and a host of other factors affect US and overseas equity and fixed income markets.
Investor uncertainty and market volatility, such as we witnessed during the reporting period, are unfortunate facts of life when it comes to investing. That’s why Invesco encourages investors to work with a professional financial adviser who can stress the importance of starting to save and invest early and the importance of adhering to a disciplined investment plan. A financial adviser who knows your unique financial situation, investment goals and risk tolerance can be an invaluable partner as you seek to achieve your financial goals. Financial advisers can also offer a long-term perspective when markets are volatile and time-tested advice and guidance when your financial situation or investment goals change.
Visit our website for more information on your investments
Our website, invesco.com/us, offers a wide range of market insights and investment perspectives. On the website, you’ll find detailed information about our funds, including performance, holdings and portfolio manager commentaries. You can access information about your account by completing a simple, secure online registration. To do so, select “Log In” on the right side of the homepage, and then select “Register for Individual Account Access.”
In addition to the resources accessible on our website and through our mobile app, you can obtain timely updates to help you stay informed about the markets and the economy by connecting with Invesco on Twitter, LinkedIn or Facebook. You can access our blog at blog.invesco.us.com. Our goal is to provide you the information you want, when and where you want it.
Finally, I’m pleased to share with you Invesco’s commitment to both the Principles for Responsible Investment and to considering environmental, social and governance issues in our robust investment process. I invite you to learn more at invesco.com/esg.
Have questions?
For questions about your account, contact an Invesco client services representative at 800 959 4246.
All of us at Invesco look forward to serving your investment management needs. Thank you for investing with us.
Sincerely,

Andrew Schlossberg
Head of the Americas,
Senior Managing Director, Invesco Ltd.
2 Invesco Value Opportunities Fund
| | |

| | Dear Shareholders: Among the many important lessons I’ve learned in more than 40 years in a variety of business endeavors is the value of a trusted advocate. As independent chair of the Invesco Funds Board, I can assure you that the members of the Board are strong advocates for the interests of investors in Invesco’s mutual funds. We work hard to represent your interests through oversight of the quality of the investment management services your funds receive and other matters important to your investment, including but not limited to: ∎ Ensuring that Invesco offers a diverse lineup of mutual funds that your financial adviser can use to strive to meet your financial needs as your investment goals change over time. ∎ Monitoring how the portfolio management teams of the Invesco funds are performing in light of changing economic and market conditions. ∎ Assessing each portfolio management team’s investment performance within the context of the investment strategy described in the fund’s prospectus. |
| | ∎ | | Monitoring for potential conflicts of interests that may impact the nature of the services that your funds receive. |
We believe one of the most important services we provide our fund shareholders is the annual review of the funds’ advisory and sub-advisory contracts with Invesco Advisers and its affiliates. This review is required by the Investment Company Act of 1940 and focuses on the nature and quality of the services Invesco provides as the adviser to the Invesco funds and the reasonableness of the fees that it charges for those services. Each year, we spend months carefully reviewing information received from Invesco and a variety of independent sources, such as performance and fee data prepared by Lipper, Inc. (a subsidiary of Broadridge Financial Solutions, Inc.), an independent, third-party firm widely recognized as a leader in its field. We also meet with our independent legal counsel and other independent advisers to review and help us assess the information that we have received. Our goal is to assure that you receive quality investment management services for a reasonable fee.
I trust the measures outlined above provide assurance that you have a worthy advocate when it comes to choosing the Invesco Funds.
On behalf of the Board, we look forward to continuing to represent your interests and serving your needs.
Sincerely,

Bruce L. Crockett
Independent Chair
Invesco Funds Board of Trustees
3 Invesco Value Opportunities Fund
Management’s Discussion of Fund Performance
| | | | |
Performance summary For the fiscal year ended April 30, 2020, Class A shares of Invesco Value Opportunities Fund (the Fund), at net asset value (NAV), underperformed the S&P 1500 Value Index, the Fund’s style-specific benchmark. Your Fund’s long-term performance appears later in this report. Fund vs. Indexes Total returns, April 30, 2019 to April 30, 2020, at net asset value (NAV). Performance shown does not include applicable contingent deferred sales charges (CDSC) or front-end sales charges, which would have reduced performance. | | Fund’s performance versus the S&P 1500 Value Index as these sectors performed well for much of the fiscal year. The Fund’s overweight allocation to energy and underweight allocation to health care also hurt relative returns. Select holdings within the materials and consumer discretionary sectors contributed the most to the Fund’s overall performance, while select holdings in the financials and materials sectors were the largest detractors. Materials companies Crown Holdings and Eastman Chemical were the largest contributors to the Fund’s overall performance during the fiscal year. Crown Holdings is one of the largest manufacturers of aluminum beverage and metal food cans in the world. Shares of the company performed well for much of the fiscal year due to stronger end market demand. However, we exited our position in Crown Holdings before the close of the fiscal year. Eastman Chemical was a new purchase for the Fund during the first quarter of 2020. The company is a global specialty materials company that produces a broad range of products found in items people use every day. Consumer discretionary company Aptiv was also a top contributor to the Fund’s performance during the fiscal year and a new purchase for the Fund during the first quarter of 2020. Aptiv is an auto parts company with technology focused on making mobility safer, greener and more connected. Financial services companies MGIC Investment and Radian Group were among the largest detractors from the Fund’s overall performance during the fiscal year. MGIC Investment is a private mortgage insurance company whose shares declined along with other financial stocks exposed to consumer credit toward the end of the fiscal year. Radian Group also provides mortgage insurance and services to the real estate and mortgage finance industries. The company’s shares also fell during the market turmoil in the first quarter of 2020. Materials company Allegheny Technologies was another large detractor from the Fund’s performance during the fiscal year. The company manufactures specialty metal alloys for aerospace, energy, medical and industrial markets. We sold our position in Allegheny Technologies before the close of the fiscal year to fund what we believed to be more attractive investment opportunities elsewhere. We believe the single most important indicator of how the Fund is positioned for potential future success is not our recent investment results or popular statistical measures, but rather the difference between current market prices and the Fund’s estimated intrinsic value–the aggregate business value of the portfolio based on our estimate of intrinsic value for each individual holding. At the end of the fiscal year, the difference between the market price and the estimated intrinsic value of the Fund was very attractive, according to our estimation. While there is no |
Class A Shares* | | -25.02% |
Class C Shares* | | -25.48 |
Class R Shares* | | -25.16 |
Class Y Shares* | | -24.82 |
Class R5 Shares* | | -24.65 |
Class R6 Shares* | | -24.61 |
S&P 500 Indexq (Broad Market Index) | | 0.86 |
S&P 1500 Value Indexq (Style-Specific Index) | | -8.19 |
Lipper Multi-Cap Value Funds Index∎ (Peer Group Index) | | -15.45 |
Source(s): qRIMES Technologies Corp.; ∎Lipper Inc. | | |
*Performance includes litigation proceeds. Had these proceeds not been received, total returns would have been lower. |
Market conditions and your Fund The fiscal year proved to be another increasingly volatile period for US equities. Although the S&P 500 Index, considered representative of the US stock market, posted modest gains for the second quarter of 2019, US equities experienced increased volatility. After four consecutive months of rising stock prices, markets sold off in May 2019, along with bond yields and oil prices, as investors weighed the impact of the lingering trade war between the US and China, as well as potential tariffs imposed on Mexico. Key issues that concerned investors in the second quarter of 2019 carried over into the third quarter. The US-China trade conflict worried investors and stifled business investment, even as the US Federal Reserve (the Fed) cut interest rates by 0.25% in July and again in September 2019.1 This environment, combined with evidence of slowing global economic growth, fueled market volatility in August 2019. Macroeconomic issues that concerned investors in the third quarter of 2019 mostly abated during the fourth quarter, providing the backdrop for strong equity market returns. The US economy rose higher than expected, at 2.1% during the third quarter of 2019.2 During its October meeting, the Fed cut interest rates again by 0.25% based on business investment and exports remaining weak.1 During the first quarter of 2020, as the spread of the new coronavirus disrupted travel and suppressed consumer activity, investors became increasingly concerned about the global economy. At the same time, oil prices fell sharply as a price war between Saudi Arabia and Russia threatened to boost supply even as demand was falling. Beginning | | in late February, equity markets declined sharply and quickly, ushering in the first bear market since the financial crisis of 2008. Though the equity market stabilized somewhat toward the end of March, all sectors declined during the downturn. Cyclical sectors, where company performance tends to be closely linked to macroeconomic changes in the business cycle, were the hardest hit. Within the S&P 1500 Value Index, sector performance was mixed during the fiscal year. The health care and information technology sectors posted double-digit gains, while the energy, consumer discretionary, financials and industrials sectors posted the biggest losses. During the fiscal year, we continued to use our intrinsic value strategy, seeking to create wealth by maintaining a long-term investment horizon and investing in companies selling at a significant discount to our estimate of their intrinsic value. We believe intrinsic value represents the fair economic worth of a business. Since our application of this strategy is highly disciplined and relatively unique, it is important to understand the benefits and limitations of our process. First, the investment strategy is intended to preserve your capital while growing it at above-market rates over the long term. Second, our investments have little in common with popular stock market indexes and most of our peers. And third, the Fund’s short-term relative performance will naturally be different from stock market indexes and peers since we typically structure the Fund’s portfolio significantly differently than these benchmarks. Drivers of Fund performance were mainly stock-specific during the fiscal year. However, the Fund’s lack of or minimal exposure to the more defensive/yield-oriented sectors, such as consumer staples and utilities, hurt the |
4 Invesco Value Opportunities Fund
assurance that market value will ever reflect our estimate of the Fund’s intrinsic value, we believe the gap between price and estimated intrinsic value may provide above-average capital appreciation.
We will continue to work hard to protect and grow the Fund’s estimated intrinsic value. We thank you for your investment in Invesco Value Opportunities Fund and for sharing our long-term investment perspective.
1 Source: US Federal Reserve
2 Source: US Bureau of Economic Analysis
Portfolio Managers:
Jonathan Edwards - Lead
Jonathan Mueller
The views and opinions expressed in management’s discussion of Fund performance are those of Invesco Advisers, Inc. These views and opinions are subject to change at any time based on factors such as market and economic conditions. These views and opinions may not be relied upon as investment advice or recommendations, or as an offer for a particular security. The information is not a complete analysis of every aspect of any market, country, industry, security or the Fund. Statements of fact are from sources considered reliable, but Invesco Advisers, Inc. makes no representation or warranty as to their completeness or accuracy. Although historical performance is no guarantee of future results, these insights may help you understand our investment management philosophy.
See important Fund and, if applicable, index disclosures later in this report.
5 Invesco Value Opportunities Fund
Your Fund’s Long-Term Performance
Results of a $10,000 Investment – Oldest Share Class(es)
Fund and index data from 4/30/10
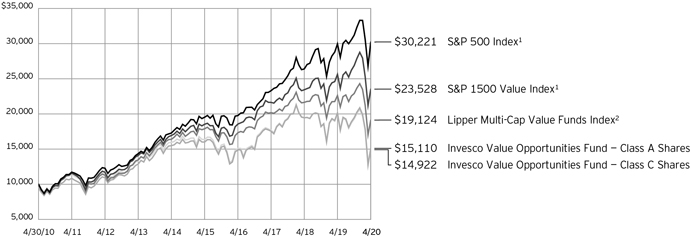
1 Source: RIMES Technologies Corp.
2 Source: Lipper Inc.
Past performance cannot guarantee future results.
The data shown in the chart include reinvested distributions, applicable sales charges and Fund expenses including management
fees. Index results include reinvested dividends, but they do not reflect sales charges. Performance of the peer group, if applicable, reflects fund expenses and management fees;
performance of a market index does not. Performance shown in the chart does not reflect deduction of taxes a shareholder would pay on Fund distributions or sale of Fund shares.
6 Invesco Value Opportunities Fund
| | | | |
Average Annual Total Returns | |
As of 4/30/20, including maximum applicable sales charges | |
Class A Shares | | | | |
Inception (6/25/01) | | | 3.32 | % |
10 Years | | | 4.21 | |
5 Years | | | -2.25 | |
1 Year | | | -29.15 | |
Class C Shares | | | | |
Inception (6/25/01) | | | 3.23 | % |
10 Years | | | 4.08 | |
5 Years | | | -1.82 | |
1 Year | | | -26.21 | |
Class R Shares | | | | |
10 Years | | | 4.56 | % |
5 Years | | | -1.36 | |
1 Year | | | -25.16 | |
Class Y Shares | | | | |
Inception (3/23/05) | | | 3.25 | % |
10 Years | | | 5.06 | |
5 Years | | | -0.90 | |
1 Year | | | -24.82 | |
Class R5 Shares | | | | |
10 Years | | | 5.23 | % |
5 Years | | | -0.74 | |
1 Year | | | -24.65 | |
Class R6 Shares | | | | |
10 Years | | | 4.95 | % |
5 Years | | | -0.86 | |
1 Year | | | -24.61 | |
Performance includes litigation
proceeds. Had these proceeds not
been received, total returns would
have been lower. | |
Effective June 1, 2010, Class A, Class C and Class I shares of the predecessor fund, Van Kampen Value Opportunities Fund, advised by Van Kampen Asset Management were reorganized into Class A, Class C and Class Y shares, respectively, of Invesco Van Kampen Value Opportunities Fund (renamed Invesco Value Opportunities Fund). Returns shown above, prior to June 1, 2010, for Class A, Class C and Class Y shares are blended returns of the predecessor fund and Invesco Value Opportunities Fund. Share class returns will differ from the predecessor fund because of different expenses.
Class R shares incepted on May 23, 2011. Performance shown prior to that date is that of the Fund’s and the predecessor fund’s Class A shares, restated to reflect the higher 12b-1 fees applicable to Class R shares.
Class R5 shares incepted on May 23, 2011. Performance shown prior to that
date is that of the Fund’s and the predecessor fund’s Class A shares and includes the 12b-1 fees applicable to Class A shares.
Class R6 shares incepted on April 4, 2017. Performance shown prior to that date is that of the Fund’s and the predecessor fund’s Class A shares and includes the 12b-1 fees applicable to Class A shares.
The performance data quoted represent past performance and cannot guarantee future results; current performance may be lower or higher. Please visit invesco.com/performance for the most recent month-end performance. Performance figures reflect reinvested distributions, changes in net asset value and the effect of the maximum sales charge unless otherwise stated. Performance figures do not reflect deduction of taxes a shareholder would pay on Fund distributions or sale of Fund shares. Investment return and principal value will fluctuate so that you may have a gain or loss when you sell shares.
Class A share performance reflects the maximum 5.50% sales charge, and Class C share performance reflects the applicable contingent deferred sales charge (CDSC) for the period involved. The CDSC on Class C shares is 1% for the first year after purchase. Class R, Class Y, Class R5 and Class R6 shares do not have a front-end sales charge or a CDSC; therefore, performance is at net asset value.
The performance of the Fund’s share classes will differ primarily due to different sales charge structures and class expenses.
Fund performance reflects any applicable fee waivers and/or expense reimbursements. Had the adviser not waived fees and/or reimbursed expenses currently or in the past, returns would have been lower. See current prospectus for more information.
7 Invesco Value Opportunities Fund
Invesco Value Opportunities Fund’s investment objective is total return through growth of capital and current income.
| ∎ | | Unless otherwise stated, information presented in this report is as of April 30, 2020, and is based on total net assets. |
| ∎ | | Unless otherwise noted, all data provided by Invesco. |
| ∎ | | To access your Fund’s reports/prospectus, visit invesco.com/fundreports. |
About indexes used in this report
| ∎ | | The S&P 500® Index is an unmanaged index considered representative of the US stock market. |
| ∎ | | The S&P 1500® Value Index tracks the performance of US large-, mid- and small- cap value stocks. |
| ∎ | | The Lipper Multi-Cap Value Funds Index is an unmanaged index considered representative of multicap value funds tracked by Lipper. |
| ∎ | | The Fund is not managed to track the performance of any particular index, including the index(es) described here, and consequently, the performance of the Fund may deviate significantly from the performance of the index(es). |
| ∎ | | A direct investment cannot be made in an index. Unless otherwise indicated, index results include reinvested dividends, and they do not reflect sales charges. Performance of the peer group, if applicable, reflects fund expenses; performance of a market index does not. |
Liquidity Risk Management Program
The Securities and Exchange Commission has adopted Rule 22e-4 under the Investment Company Act of 1940 (the “Liquidity Rule”) in order to promote effective liquidity risk management throughout the open-end investment company industry, thereby reducing the risk that funds will be unable to meet their redemption obligations and mitigating dilution of the interests of fund shareholders. The Fund has adopted and implemented a liquidity risk management program in accordance with the Liquidity Rule (the “Program”). The Program is reasonably designed to assess and manage the Fund’s liquidity risk, which is the risk that the Fund could not meet redemption requests without significant dilution of remaining investors’ interests in the Fund. The Board of Trustees of the Fund (the “Board”) has appointed Invesco Advisers, Inc. (“Invesco”), the Fund’s investment adviser, as the Program’s administrator, and Invesco has delegated oversight of the Program to the Liquidity Risk Management Committee (the “Committee”), which is composed of senior representatives from relevant business groups at Invesco.
As required by the Liquidity Rule, the Program includes policies and procedures providing for an assessment, no less fre-
quently than annually, of the Fund’s liquidity risk that takes into account, as relevant to the Fund’s liquidity risk: (1) the Fund’s investment strategy and liquidity of portfolio investments during both normal and reasonably foreseeable stressed conditions; (2) short-term and long-term cash flow projections for the Fund during both normal and reasonably foreseeable stressed conditions; and (3) the Fund’s holdings of cash and cash equivalents and any borrowing arrangements. The Liquidity Rule also requires the classification of the Fund’s investments into categories that reflect the assessment of their relative liquidity under current market conditions. The Fund classifies its investments into one of four categories defined in the Liquidity Rule: “Highly Liquid,” “Moderately Liquid,” “Less Liquid” and “Illiquid.” Funds that are not invested primarily in “Highly Liquid Investments” that are assets (cash or investments that are reasonably expected to be convertible into cash within three business days without significantly changing the market value of the investment) are required to establish a “Highly Liquid Investment Minimum” (“HLIM”), which is the minimum percentage of net assets that must be invested in Highly Liquid Investments. Funds with HLIMs have procedures for addressing HLIM shortfalls, including reporting to the Board and the SEC (on a non-public basis) as required by the Program and the Liquidity Rule. In addition, the Fund may not acquire an investment if, immediately after the acquisition, over 15% of the Fund’s net assets would consist of “Illiquid Investments” that are assets (an investment that cannot reasonably be expected to be sold or disposed of in current market conditions in seven calendar days or less without the sale or disposition significantly changing the market value of the investment). The Liquidity Rule and the Program also require reporting to the Board and the SEC (on a non-public basis) if a Fund’s holdings of Illiquid Investments exceed 15% of the Fund’s assets.
At a meeting held on March 30-April 1, 2020, the Committee presented a report to the Board that addressed the operation of the Program and assessed the Program’s adequacy and effectiveness of implementation (the “Report”). The Re-
port covered the period from December 1, 2018 through December 31, 2019 (the “Program Reporting Period”).
The Report stated, in relevant part, that during the Program Reporting Period:
| ∎ | | The Program, as adopted and implemented, remained reasonably designed to assess and manage the Fund’s liquidity risk and was operated effectively to achieve that goal; |
| ∎ | | The Fund’s investment strategy remained appropriate for an open-end fund; |
| ∎ | | The Fund was able to meet requests for redemption without significant dilution of remaining investors’ interests in the Fund; |
| ∎ | | The Fund did not breach the 15% limit on Illiquid Investments; and |
| ∎ | | The Fund primarily held Highly Liquid Investments and therefore has not adopted an HLIM. |
| | |
This report must be accompanied or preceded by a currently effective Fund prospectus, which contains more complete information, including sales charges and expenses. Investors should read it carefully before investing. | | |
| | | |
| NOT FDIC INSURED | MAY LOSE VALUE | NO BANK GUARANTEE | | |
8 Invesco Value Opportunities Fund
Fund Information
Portfolio Composition
| | |
By sector | | % of total net assets |
Industrials | | 21.51% |
Financials | | 19.95 |
Consumer Discretionary | | 14.31 |
Materials | | 11.50 |
Energy | | 8.43 |
Information Technology | | 8.11 |
Health Care | | 8.06 |
Consumer Staples | | 4.52 |
Utilities | | 0.56 |
Money Market Funds Plus Other Assets Less Liabilities | | 3.05 |
Top 10 Equity Holdings*
| | |
| | | % of total net assets |
1. AECOM | | 4.88% |
2. Anthem, Inc. | | 4.38 |
3. Spectrum Brands Holdings, Inc. | | 4.26 |
4. Oracle Corp. | | 4.08 |
5. Booking Holdings, Inc. | | 4.05 |
6. LKQ Corp. | | 4.01 |
7. Owens Corning | | 3.97 |
8. Goldman Sachs Group, Inc. (The) | | 3.78 |
9. Cigna Corp. | | 3.47 |
10. Flex Ltd. | | 3.28 |
The Fund’s holdings are subject to change, and there is no assurance that the Fund will continue to hold any particular security.
* Excluding money market fund holdings, if any.
Data presented here are as of April 30, 2020.
9 Invesco Value Opportunities Fund
Schedule of Investments(a)
April 30, 2020
| | | | | | | | |
| | | Shares | | | Value | |
Common Stocks & Other Equity Interests–96.95% | |
Agricultural & Farm Machinery–1.60% | | | | | |
AGCO Corp. | | | 153,736 | | | | $ 8,123,410 | |
Auto Parts & Equipment–6.11% | | | | | | | | |
Aptiv PLC(b) | | | 76,938 | | | | 5,351,038 | |
BorgWarner, Inc. | | | 458,784 | | | | 13,107,459 | |
Dana, Inc. | | | 1,086,068 | | | | 12,489,782 | |
| | | | | | | | 30,948,279 | |
Building Products–6.32% | | | | | | | | |
Masco Corp. | | | 290,336 | | | | 11,915,389 | |
Owens Corning | | | 464,002 | | | | 20,119,127 | |
| | | | | | | | 32,034,516 | |
Construction & Engineering–4.88% | | | | | | | | |
AECOM(b) | | | 681,673 | | | | 24,717,463 | |
Consumer Finance–1.73% | | | | | | | | |
SLM Corp. | | | 1,052,300 | | | | 8,776,182 | |
Distributors–4.01% | | | | | | | | |
LKQ Corp.(b) | | | 776,330 | | | | 20,301,030 | |
Diversified Banks–5.39% | | | | | | | | |
Bank of America Corp. | | | 479,594 | | | | 11,534,236 | |
Citigroup, Inc. | | | 325,321 | | | | 15,797,588 | |
| | | | | | | | 27,331,824 | |
Diversified Chemicals–5.84% | | | | | | | | |
Chemours Co. (The) | | | 521,775 | | | | 6,120,421 | |
Eastman Chemical Co. | | | 147,000 | | | | 8,894,970 | |
Huntsman Corp. | | | 867,700 | | | | 14,586,037 | |
| | | | | | | | 29,601,428 | |
Electrical Components & Equipment–2.22% | | | | | |
nVent Electric PLC | | | 603,100 | | | | 11,247,815 | |
Electronic Manufacturing Services–4.03% | | | | | |
Flex Ltd.(b) | | | 1,702,480 | | | | 16,616,205 | |
Jabil, Inc. | | | 133,100 | | | | 3,785,364 | |
| | | | | | | | 20,401,569 | |
Health Care Services–3.47% | | | | | | | | |
Cigna Corp. | | | 89,900 | | | | 17,600,622 | |
Hotels, Resorts & Cruise Lines–0.14% | | | | | |
Norwegian Cruise Line Holdings Ltd.(b) | | | 44,500 | | | | 729,800 | |
Household Products–4.52% | | | | | | | | |
Energizer Holdings, Inc. | | | 33,100 | | | | 1,289,576 | |
Spectrum Brands Holdings, Inc. | | | 501,771 | | | | 21,606,259 | |
| | | | | | | | 22,895,835 | |
Human Resource & Employment Services–0.75% | | | | | |
ManpowerGroup, Inc. | | | 51,000 | | | | 3,786,240 | |
Independent Power Producers & Energy Traders–0.56% | |
Vistra Energy Corp. | | | 145,200 | | | | 2,837,208 | |
Industrial Conglomerates–2.14% | | | | | | | | |
Carlisle Cos., Inc. | | | 89,800 | | | | 10,862,208 | |
| | | | | | | | |
| | | Shares | | | Value | |
Industrial Machinery–3.27% | | | | | | | | |
Crane Co. | | | 167,000 | | | | $ 9,093,150 | |
Timken Co. (The) | | | 198,500 | | | | 7,459,630 | |
| | | | | | | | 16,552,780 | |
Internet & Direct Marketing Retail–4.05% | | | | | |
Booking Holdings, Inc.(b) | | | 13,875 | | | | 20,542,909 | |
Investment Banking & Brokerage–3.78% | | | | | |
Goldman Sachs Group, Inc. (The) | | | 104,300 | | | | 19,130,706 | |
Life & Health Insurance–2.19% | | | | | | | | |
Athene Holding Ltd., Class A(b) | | | 399,900 | | | | 10,797,300 | |
MetLife, Inc. | | | 8,000 | | | | 288,640 | |
| | | | | | | | 11,085,940 | |
Managed Health Care–4.38% | | | | | | | | |
Anthem, Inc. | | | 79,000 | | | | 22,177,670 | |
Oil & Gas Exploration & Production–4.96% | | | | | |
Diamondback Energy, Inc. | | | 146,000 | | | | 6,356,840 | |
Noble Energy, Inc. | | | 670,300 | | | | 6,575,643 | |
Parsley Energy, Inc., Class A | | | 798,300 | | | | 7,543,935 | |
Pioneer Natural Resources Co. | | | 52,000 | | | | 4,644,120 | |
| | | | | | | | 25,120,538 | |
Oil & Gas Refining & Marketing–3.48% | | | | | | | | |
Marathon Petroleum Corp. | | | 399,900 | | | | 12,828,792 | |
Phillips 66 | | | 65,500 | | | | 4,792,635 | |
| | | | | | | | 17,621,427 | |
Other Diversified Financial Services–2.53% | | | | | |
Equitable Holdings, Inc. | | | 700,400 | | | | 12,831,328 | |
Paper Packaging–3.18% | | | | | | | | |
Sealed Air Corp. | | | 563,600 | | | | 16,113,324 | |
Pharmaceuticals–0.21% | | | | | | | | |
Novartis AG (Switzerland) | | | 12,400 | | | | 1,057,795 | |
Regional Banks–3.16% | | | | | | | | |
First Horizon National Corp. | | | 787,400 | | | | 7,149,592 | |
TCF Financial Corp. | | | 298,900 | | | | 8,874,341 | |
| | | | | | | | 16,023,933 | |
Specialty Chemicals–2.48% | | | | | | | | |
Axalta Coating Systems Ltd.(b) | | | 387,600 | | | | 7,651,224 | |
Celanese Corp. | | | 59,200 | | | | 4,917,744 | |
| | | | | | | | 12,568,968 | |
Systems Software–4.08% | | | | | | | | |
Oracle Corp. | | | 390,500 | | | | 20,684,785 | |
Thrifts & Mortgage Finance–1.16% | | | | | | | | |
MGIC Investment Corp. | | | 704,278 | | | | 5,148,272 | |
Radian Group, Inc. | | | 50,090 | | | | 750,348 | |
| | | | | | | | 5,898,620 | |
See accompanying Notes to Financial Statements which are an integral part of the financial statements.
10 Invesco Value Opportunities Fund
| | | | | | | | |
| | | Shares | | | Value | |
Trading Companies & Distributors–0.33% | | | | | |
AerCap Holdings N.V. (Ireland)(b) | | | 58,700 | | | $ | 1,650,644 | |
Total Common Stocks & Other Equity Interests
(Cost $549,019,745) | | | | 491,256,796 | |
Money Market Funds–4.18% | | | | | | | | |
Invesco Government & Agency Portfolio, Institutional Class, 0.20%(c)(d) | | | 7,281,549 | | | | 7,281,549 | |
Invesco Liquid Assets Portfolio, Institutional Class, 0.60%(c)(d) | | | 5,558,104 | | | | 5,561,439 | |
| | | | | | | | |
| | | Shares | | | Value | |
Money Market Funds–(continued) | | | | | |
Invesco Treasury Portfolio, Institutional Class, 0.10%(c)(d) | | | 8,321,771 | | | $ | 8,321,770 | |
Total Money Market Funds (Cost $21,161,447) | | | | 21,164,758 | |
TOTAL INVESTMENTS IN SECURITIES–101.13%
(Cost $570,181,192) | | | | 512,421,554 | |
OTHER ASSETS LESS LIABILITIES—(1.13)% | | | | | | | (5,733,794 | ) |
NET ASSETS–100.00% | | | | | | $ | 506,687,760 | |
Notes to Schedule of Investments:
| (a) | Industry and/or sector classifications used in this report are generally according to the Global Industry Classification Standard, which was developed by and is the exclusive property and a service mark of MSCI Inc. and Standard & Poor’s. |
| (b) | Non-income producing security. |
| (c) | Affiliated issuer. The issuer and/or the Fund is a wholly-owned subsidiary of Invesco Ltd., or is affiliated by having an investment adviser that is under common control of Invesco Ltd. The table below shows the Fund’s transactions in, and earnings from, its investments in affiliates for the fiscal year ended April 30, 2020. |
| | | | | | | | | | | | | | | | | | | | | | | | | | | | | | | | | | | |
| | | Value April 30, 2019 | | Purchases at Cost | | Proceeds from Sales | | Change in Unrealized
Appreciation | | Realized Gain (Loss) | | Value April 30, 2020 | | Dividend
Income |
Investments in Affiliated Money Market Funds: | | | | | | | | | | | | | | | | | | | | | | | | | | | | | | | | | | | |
Invesco Government & Agency Portfolio, Institutional Class | | | $ | 10,283,176 | | | | $ | 54,141,198 | | | | $ | (57,142,825 | ) | | | $ | - | | | | $ | - | | | | $ | 7,281,549 | | | | $ | 139,872 | |
Invesco Liquid Assets Portfolio, Institutional Class | | | | 7,345,219 | | | | | 39,098,677 | | | | | (40,881,112 | ) | | | | 2,136 | | | | | (3,481 | ) | | | | 5,561,439 | | | | | 110,815 | |
Invesco Treasury Portfolio, Institutional Class | | | | 11,752,201 | | | | | 61,875,655 | | | | | (65,306,086 | ) | | | | - | | | | | - | | | | | 8,321,770 | | | | | 156,264 | |
Total | | | $ | 29,380,596 | | | | $ | 155,115,530 | | | | $ | (163,330,023 | ) | | | $ | 2,136 | | | | $ | (3,481 | ) | | | $ | 21,164,758 | | | | $ | 406,951 | |
| (d) | The rate shown is the 7-day SEC standardized yield as of April 30, 2020. |
See accompanying Notes to Financial Statements which are an integral part of the financial statements.
11 Invesco Value Opportunities Fund
Statement of Assets and Liabilities
April 30, 2020
| | | | |
Assets: | | | | |
Investments in securities, at value
(Cost $549,019,745) | | $ | 491,256,796 | |
Investments in affiliated money market funds, at value
(Cost $21,161,447) | | | 21,164,758 | |
Foreign currencies, at value (Cost $648) | | | 699 | |
Receivable for: | | | | |
Investments sold | | | 3,151,408 | |
Fund shares sold | | | 179,712 | |
Dividends | | | 424,652 | |
Investment for trustee deferred compensation and retirement plans | | | 432,073 | |
Other assets | | | 61,515 | |
Total assets | | | 516,671,613 | |
| |
Liabilities: | | | | |
Payable for: | | | | |
Investments purchased | | | 8,545,264 | |
Fund shares reacquired | | | 521,607 | |
Accrued fees to affiliates | | | 275,848 | |
Accrued trustees’ and officers’ fees and benefits | | | 352 | |
Accrued other operating expenses | | | 168,625 | |
Trustee deferred compensation and retirement plans | | | 472,157 | |
Total liabilities | | | 9,983,853 | |
Net assets applicable to shares outstanding | | $ | 506,687,760 | |
| |
Net assets consist of: | | | | |
Shares of beneficial interest | | $ | 635,469,266 | |
Distributable earnings (loss) | | | (128,781,506 | ) |
| | | $ | 506,687,760 | |
| | | | |
Net Assets: | | | | |
Class A | | $ | 440,825,978 | |
Class C | | $ | 10,106,924 | |
Class R | | $ | 6,362,407 | |
Class Y | | $ | 23,759,897 | |
Class R5 | | $ | 406,274 | |
Class R6 | | $ | 25,226,280 | |
|
Shares outstanding, no par value, with an unlimited number of shares authorized: | |
Class A | | | 46,677,892 | |
Class C | | | 1,152,336 | |
Class R | | | 683,568 | |
Class Y | | | 2,504,638 | |
Class R5 | | | 42,430 | |
Class R6 | | | 2,631,558 | |
Class A: | | | | |
Net asset value per share | | $ | 9.44 | |
Maximum offering price per share
(Net asset value of $9.44 ÷ 94.50%) | | $ | 9.99 | |
Class C: | | | | |
Net asset value and offering price per share | | $ | 8.77 | |
Class R: | | | | |
Net asset value and offering price per share | | $ | 9.31 | |
Class Y: | | | | |
Net asset value and offering price per share | | $ | 9.49 | |
Class R5: | | | | |
Net asset value and offering price per share | | $ | 9.58 | |
Class R6: | | | | |
Net asset value and offering price per share | | $ | 9.59 | |
See accompanying Notes to Financial Statements which are an integral part of the financial statements.
12 Invesco Value Opportunities Fund
Statement of Operations
For the year ended April 30, 2020
| | | | |
Investment income: | | | | |
Dividends (net of foreign withholding taxes of $33,676) | | $ | 9,288,873 | |
Dividends from affiliated money market funds (includes securities lending income of $90,868) | | | 497,819 | |
Total investment income | | | 9,786,692 | |
Expenses: | | | | |
Advisory fees | | | 4,443,993 | |
Administrative services fees | | | 99,207 | |
Custodian fees | | | 8,159 | |
Distribution fees: | | | | |
Class A | | | 1,433,316 | |
Class C | | | 122,924 | |
Class R | | | 44,801 | |
Transfer agent fees – A, C, R and Y | | | 1,432,718 | |
Transfer agent fees – R5 | | | 676 | |
Transfer agent fees – R6 | | | 7,402 | |
Trustees’ and officers’ fees and benefits | | | 23,715 | |
Registration and filing fees | | | 89,253 | |
Reports to shareholders | | | 85,015 | |
Professional services fees | | | 44,784 | |
Other | | | 51,934 | |
Total expenses | | | 7,887,897 | |
Less: Fees waived and/or expense offset arrangement(s) | | | (42,201 | ) |
Net expenses | | | 7,845,696 | |
Net investment income | | | 1,940,996 | |
Realized and unrealized gain (loss) from: | | | | |
Net realized gain (loss) from: | | | | |
Investment securities (includes net gains from securities sold to affiliates of $873,263) | | | (67,937,656 | ) |
Foreign currencies | | | (6,140 | ) |
| | | | (67,943,796 | ) |
Change in net unrealized appreciation (depreciation) of: | | | | |
Investment securities | | | (108,891,693 | ) |
Foreign currencies | | | 16,717 | |
| | | | (108,874,976 | ) |
Net realized and unrealized gain (loss) | | | (176,818,772 | ) |
Net increase (decrease) in net assets resulting from operations | | $ | (174,877,776 | ) |
See accompanying Notes to Financial Statements which are an integral part of the financial statements.
13 Invesco Value Opportunities Fund
Statement of Changes in Net Assets
For the years ended April 30, 2020 and 2019
| | | | | | | | |
| | | 2020 | | | 2019 | |
Operations: | | | | | | | | |
Net investment income (loss) | | $ | 1,940,996 | | | $ | (9,990 | ) |
Net realized gain (loss) | | | (67,943,796 | ) | | | 53,175,770 | |
Change in net unrealized appreciation (depreciation) | | | (108,874,976 | ) | | | (28,833,478 | ) |
Net increase (decrease) in net assets resulting from operations | | | (174,877,776 | ) | | | 24,332,302 | |
| | |
Distributions to shareholders from distributable earnings: | | | | | | | | |
Class A | | | (12,166,652 | ) | | | (68,727,018 | ) |
Class C | | | (312,891 | ) | | | (7,256,248 | ) |
Class R | | | (190,220 | ) | | | (1,393,943 | ) |
Class Y | | | (731,512 | ) | | | (4,210,458 | ) |
Class R5 | | | (14,668 | ) | | | (267,250 | ) |
Class R6 | | | (635,605 | ) | | | (3,356,878 | ) |
Total distributions from distributable earnings | | | (14,051,548 | ) | | | (85,211,795 | ) |
| | |
Share transactions–net: | | | | | | | | |
Class A | | | (53,126,304 | ) | | | 41,564,681 | |
Class C | | | (2,968,582 | ) | | | (41,578,892 | ) |
Class R | | | (2,009,859 | ) | | | (905,036 | ) |
Class Y | | | (4,558,923 | ) | | | 1,018,691 | |
Class R5 | | | (1,566,665 | ) | | | (43,992 | ) |
Class R6 | | | 889,449 | | | | 6,374,257 | |
Net increase (decrease) in net assets resulting from share transactions | | | (63,340,884 | ) | | | 6,429,709 | |
Net increase (decrease) in net assets | | | (252,270,208 | ) | | | (54,449,784 | ) |
Net assets: | | | | | | | | |
Beginning of year | | | 758,957,968 | | | | 813,407,752 | |
End of year | | $ | 506,687,760 | | | $ | 758,957,968 | |
See accompanying Notes to Financial Statements which are an integral part of the financial statements.
14 Invesco Value Opportunities Fund
Financial Highlights
The following schedule presents financial highlights for a share of the Fund outstanding throughout the periods indicated.
| | | | | | | | | | | | | | | | | | | | | | | | | | | | | | | | | | | | | | | | | | | | | | | | | | | | | | | | | | | | | | | | | | | | | | |
| | | Net asset value, beginning of period | | Net investment income (loss)(a) | | Net gains (losses) on securities (both realized and unrealized) | | Total from investment operations | | Dividends from net investment income | | Distributions from net realized gains | | Total distributions | | Net asset value, end of period | | Total return (b) | | Net assets, end of period
(000’s omitted) | | Ratio of expenses to average net assets with fee waivers and/or expenses absorbed | | Ratio of expenses to average net assets without fee waivers and/or expenses absorbed | | Ratio of net investment income (loss) to average net assets | | Portfolio turnover (c) |
Class A | | | | | | | | | | | | | | | | | | | | | | | | | | | | | | | | | | | | | | | | | | | | | | | | | | | | | | | | | | | | | | | | | | | | | | |
Year ended 04/30/20 | | | $ | 12.84 | | | | $ | 0.03 | | | | $ | (3.18 | )(d) | | | $ | (3.15 | ) | | | $ | – | | | | $ | (0.25 | ) | | | $ | (0.25 | ) | | | $ | 9.44 | | | | | (25.02 | )%(d) | | | $ | 440,826 | | | | | 1.21 | %(e) | | | | 1.21 | %(e) | | | | 0.27 | %(e) | | | | 41 | % |
Year ended 04/30/19 | | | | 14.24 | | | | | 0.00 | | | | | 0.18 | | | | | 0.18 | | | | | – | | | | | (1.58 | ) | | | | (1.58 | ) | | | | 12.84 | | | | | 3.58 | | | | | 658,685 | | | | | 1.21 | | | | | 1.21 | | | | | 0.02 | | | | | 51 | |
Year ended 04/30/18 | | | | 13.50 | | | | | 0.01 | | | | | 1.48 | | | | | 1.49 | | | | | – | | | | | (0.75 | ) | | | | (0.75 | ) | | | | 14.24 | | | | | 10.87 | | | | | 662,211 | | | | | 1.21 | | | | | 1.21 | | | | | 0.04 | | | | | 30 | |
Year ended 04/30/17 | | | | 11.60 | | | | | 0.01 | | | | | 2.05 | | | | | 2.06 | | | | | (0.02 | ) | | | | (0.14 | ) | | | | (0.16 | ) | | | | 13.50 | | | | | 17.81 | | | | | 645,216 | | | | | 1.26 | | | | | 1.27 | | | | | 0.07 | | | | | 33 | |
Year ended 04/30/16 | | | | 14.45 | | | | | 0.02 | | | | | (1.08 | ) | | | | (1.06 | ) | | | | (0.13 | ) | | | | (1.66 | ) | | | | (1.79 | ) | | | | 11.60 | | | | | (6.93 | ) | | | | 622,026 | | | | | 1.25 | | | | | 1.25 | | | | | 0.17 | | | | | 38 | |
Class C | | | | | | | | | | | | | | | | | | | | | | | | | | | | | | | | | | | | | | | | | | | | | | | | | | | | | | | | | | | | | | | | | | | | | | |
Year ended 04/30/20 | | | | 12.02 | | | | | (0.04 | ) | | | | (2.96 | )(d) | | | | (3.00 | ) | | | | – | | | | | (0.25 | ) | | | | (0.25 | ) | | | | 8.77 | | | | | (25.48 | )(d)(f) | | | | 10,107 | | | | | 1.85 | (e)(f) | | | | 1.85 | (e)(f) | | | | (0.37 | )(e)(f) | | | | 41 | |
Year ended 04/30/19 | | | | 13.54 | | | | | (0.09 | ) | | | | 0.15 | | | | | 0.06 | | | | | – | | | | | (1.58 | ) | | | | (1.58 | ) | | | | 12.02 | | | | | 2.83 | (f) | | | | 17,027 | | | | | 1.92 | (f) | | | | 1.92 | (f) | | | | (0.69 | )(f) | | | | 51 | |
Year ended 04/30/18 | | | | 12.96 | | | | | (0.09 | ) | | | | 1.42 | | | | | 1.33 | | | | | – | | | | | (0.75 | ) | | | | (0.75 | ) | | | | 13.54 | | | | | 10.07 | (f) | | | | 68,174 | | | | | 1.91 | (f) | | | | 1.91 | (f) | | | | (0.66 | )(f) | | | | 30 | |
Year ended 04/30/17 | | | | 11.20 | | | | | (0.08 | ) | | | | 1.98 | | | | | 1.90 | | | | | – | | | | | (0.14 | ) | | | | (0.14 | ) | | | | 12.96 | | | | | 17.00 | (f) | | | | 82,590 | | | | | 1.97 | (f) | | | | 1.98 | (f) | | | | (0.64 | )(f) | | | | 33 | |
Year ended 04/30/16 | | | | 14.07 | | | | | (0.07 | ) | | | | (1.05 | ) | | | | (1.12 | ) | | | | (0.09 | ) | | | | (1.66 | ) | | | | (1.75 | ) | | | | 11.20 | | | | | (7.57 | )(f) | | | | 79,538 | | | | | 1.97 | (f) | | | | 1.97 | (f) | | | | (0.55 | )(f) | | | | 38 | |
Class R | | | | | | | | | | | | | | | | | | | | | | | | | | | | | | | | | | | | | | | | | | | | | | | | | | | | | | | | | | | | | | | | | | | | | | |
Year ended 04/30/20 | | | | 12.69 | | | | | 0.00 | | | | | (3.13 | )(d) | | | | (3.13 | ) | | | | – | | | | | (0.25 | ) | | | | (0.25 | ) | | | | 9.31 | | | | | (25.16 | )(d) | | | | 6,362 | | | | | 1.46 | (e) | | | | 1.46 | (e) | | | | 0.02 | (e) | | | | 41 | |
Year ended 04/30/19 | | | | 14.13 | | | | | (0.03 | ) | | | | 0.17 | | | | | 0.14 | | | | | – | | | | | (1.58 | ) | | | | (1.58 | ) | | | | 12.69 | | | | | 3.32 | | | | | 10,898 | | | | | 1.46 | | | | | 1.46 | | | | | (0.23 | ) | | | | 51 | |
Year ended 04/30/18 | | | | 13.43 | | | | | (0.03 | ) | | | | 1.48 | | | | | 1.45 | | | | | – | | | | | (0.75 | ) | | | | (0.75 | ) | | | | 14.13 | | | | | 10.63 | | | | | 12,955 | | | | | 1.46 | | | | | 1.46 | | | | | (0.21 | ) | | | | 30 | |
Year ended 04/30/17 | | | | 11.55 | | | | | (0.02 | ) | | | | 2.04 | | | | | 2.02 | | | | | – | | | | | (0.14 | ) | | | | (0.14 | ) | | | | 13.43 | | | | | 17.53 | | | | | 14,135 | | | | | 1.51 | | | | | 1.52 | | | | | (0.18 | ) | | | | 33 | |
Year ended 04/30/16 | | | | 14.41 | | | | | (0.01 | ) | | | | (1.07 | ) | | | | (1.08 | ) | | | | (0.12 | ) | | | | (1.66 | ) | | | | (1.78 | ) | | | | 11.55 | | | | | (7.12 | ) | | | | 16,119 | | | | | 1.50 | | | | | 1.50 | | | | | (0.08 | ) | | | | 38 | |
Class Y | | | | | | | | | | | | | | | | | | | | | | | | | | | | | | | | | | | | | | | | | | | | | | | | | | | | | | | | | | | | | | | | | | | | | | |
Year ended 04/30/20 | | | | 12.86 | | | | | 0.06 | | | | | (3.18 | )(d) | | | | (3.12 | ) | | | | – | | | | | (0.25 | ) | | | | (0.25 | ) | | | | 9.49 | | | | | (24.74 | )(d) | | | | 23,760 | | | | | 0.96 | (e) | | | | 0.96 | (e) | | | | 0.52 | (e) | | | | 41 | |
Year ended 04/30/19 | | | | 14.23 | | | | | 0.04 | | | | | 0.17 | | | | | 0.21 | | | | | – | | | | | (1.58 | ) | | | | (1.58 | ) | | | | 12.86 | | | | | 3.80 | | | | | 37,469 | | | | | 0.96 | | | | | 0.96 | | | | | 0.27 | | | | | 51 | |
Year ended 04/30/18 | | | | 13.46 | | | | | 0.04 | | | | | 1.48 | | | | | 1.52 | | | | | – | | | | | (0.75 | ) | | | | (0.75 | ) | | | | 14.23 | | | | | 11.13 | | | | | 39,323 | | | | | 0.96 | | | | | 0.96 | | | | | 0.29 | | | | | 30 | |
Year ended 04/30/17 | | | | 11.56 | | | | | 0.04 | | | | | 2.06 | | | | | 2.10 | | | | | (0.06 | ) | | | | (0.14 | ) | | | | (0.20 | ) | | | | 13.46 | | | | | 18.17 | | | | | 46,105 | | | | | 1.01 | | | | | 1.02 | | | | | 0.32 | | | | | 33 | |
Year ended 04/30/16 | | | | 14.39 | | | | | 0.05 | | | | | (1.08 | ) | | | | (1.03 | ) | | | | (0.14 | ) | | | | (1.66 | ) | | | | (1.80 | ) | | | | 11.56 | | | | | (6.71 | ) | | | | 21,016 | | | | | 1.00 | | | | | 1.00 | | | | | 0.42 | | | | | 38 | |
Class R5 | | | | | | | | | | | | | | | | | | | | | | | | | | | | | | | | | | | | | | | | | | | | | | | | | | | | | | | | | | | | | | | | | | | | | | |
Year ended 04/30/20 | | | | 12.95 | | | | | 0.08 | | | | | (3.20 | )(d) | | | | (3.12 | ) | | | | – | | | | | (0.25 | ) | | | | (0.25 | ) | | | | 9.58 | | | | | (24.57 | )(d) | | | | 406 | | | | | 0.80 | (e) | | | | 0.80 | (e) | | | | 0.68 | (e) | | | | 41 | |
Year ended 04/30/19 | | | | 14.29 | | | | | 0.05 | | | | | 0.19 | | | | | 0.24 | | | | | – | | | | | (1.58 | ) | | | | (1.58 | ) | | | | 12.95 | | | | | 4.01 | | | | | 2,212 | | | | | 0.84 | | | | | 0.84 | | | | | 0.39 | | | | | 51 | |
Year ended 04/30/18 | | | | 13.50 | | | | | 0.06 | | | | | 1.48 | | | | | 1.54 | | | | | – | | | | | (0.75 | ) | | | | (0.75 | ) | | | | 14.29 | | | | | 11.25 | | | | | 2,439 | | | | | 0.84 | | | | | 0.84 | | | | | 0.41 | | | | | 30 | |
Year ended 04/30/17 | | | | 11.60 | | | | | 0.06 | | | | | 2.06 | | | | | 2.12 | | | | | (0.08 | ) | | | | (0.14 | ) | | | | (0.22 | ) | | | | 13.50 | | | | | 18.30 | | | | | 2,456 | | | | | 0.85 | | | | | 0.86 | | | | | 0.48 | | | | | 33 | |
Year ended 04/30/16 | | | | 14.42 | | | | | 0.08 | | | | | (1.09 | ) | | | | (1.01 | ) | | | | (0.15 | ) | | | | (1.66 | ) | | | | (1.81 | ) | | | | 11.60 | | | | | (6.56 | ) | | | | 2,850 | | | | | 0.84 | | | | | 0.84 | | | | | 0.58 | | | | | 38 | |
Class R6 | | | | | | | | | | | | | | | | | | | | | | | | | | | | | | | | | | | | | | | | | | | | | | | | | | | | | | | | | | | | | | | | | | | | | | |
Year ended 04/30/20 | | | | 12.97 | | | | | 0.09 | | | | | (3.22 | )(d) | | | | (3.13 | ) | | | | – | | | | | (0.25 | ) | | | | (0.25 | ) | | | | 9.59 | | | | | (24.61 | )(d) | | | | 25,226 | | | | | 0.75 | (e) | | | | 0.75 | (e) | | | | 0.73 | (e) | | | | 41 | |
Year ended 04/30/19 | | | | 14.31 | | | | | 0.06 | | | | | 0.18 | | | | | 0.24 | | | | | – | | | | | (1.58 | ) | | | | (1.58 | ) | | | | 12.97 | | | | | 4.00 | | | | | 32,666 | | | | | 0.79 | | | | | 0.79 | | | | | 0.44 | | | | | 51 | |
Year ended 04/30/18 | | | | 13.50 | | | | | 0.08 | | | | | 1.48 | | | | | 1.56 | | | | | – | | | | | (0.75 | ) | | | | (0.75 | ) | | | | 14.31 | | | | | 11.40 | | | | | 28,305 | | | | | 0.77 | | | | | 0.77 | | | | | 0.48 | | | | | 30 | |
Year ended 04/30/17(g) | | | | 13.60 | | | | | 0.01 | | | | | (0.11 | ) | | | | (0.10 | ) | | | | – | | | | | – | | | | | – | | | | | 13.50 | | | | | (0.74 | ) | | | | 10 | | | | | 0.76 | (h) | | | | 0.76 | (h) | | | | 0.57 | (h) | | | | 33 | |
| (a) | Calculated using average shares outstanding. |
| (b) | Includes adjustments in accordance with accounting principles generally accepted in the United States of America and as such, the net asset value for financial reporting purposes and the returns based upon those net asset values may differ from the net asset value and returns for shareholder transactions. Does not include sales charges and is not annualized for periods less than one year, if applicable. |
| (c) | Portfolio turnover is calculated at the fund level and is not annualized for periods less than one year, if applicable. |
| (d) | Includes litigation proceeds received during the period. Had these litigation proceeds not been received, Net gains (losses) on securities (both realized and unrealized) per share would have been $(3.28), $(3.06), $(3.23), $(3.28), $(3.30) and $(3.32) for Class A, Class C, Class R, Class Y, Class R5 and Class R6 shares, respectively. Total returns would have been lower |
| (e) | Ratios are based on average daily net assets (000’s omitted) of $573,326, $13,845, $8,960, $32,817, $981 and $29,991 for Class A, Class C, Class R, Class Y, Class R5 and Class R6 shares, respectively. |
| (f) | The total return, ratio of expenses to average net assets and ratio of net investment income (loss) to average net assets reflect actual 12b-1 fees of 0.89%, 0.96%, 0.95%, 0.97% and 0.97% for the years ended April 30, 2020, 2019, 2018, 2017 and 2016, respectively. |
| (g) | Commencement date of April 04, 2017. |
See accompanying Notes to Financial Statements which are an integral part of the financial statements.
15 Invesco Value Opportunities Fund
Notes to Financial Statements
April 30, 2020
NOTE 1–Significant Accounting Policies
Invesco Value Opportunities Fund (the “Fund”) is a series portfolio of AIM Sector Funds (Invesco Sector Funds) (the “Trust”). The Trust is a Delaware statutory trust registered under the Investment Company Act of 1940, as amended (the “1940 Act”), as an open-end series management investment company authorized to issue an unlimited number of shares of beneficial interest. Information presented in these financial statements pertains only to the Fund. Matters affecting the Fund or each class will be voted on exclusively by the shareholders of the Fund or each class.
The Fund’s investment objective is total return through growth of capital and current income.
The Fund currently consists of six different classes of shares: Class A, Class C, Class R, Class Y, Class R5 and Class R6. Class Y shares are available only to certain investors. Class A shares are sold with a front-end sales charge unless certain waiver criteria are met. Under certain circumstances, load waived shares may be subject to contingent deferred sales charges (“CDSC”). Class C shares are sold with a CDSC. Class R, Class Y, Class R5 and Class R6 shares are sold at net asset value. Class C shares held for ten years after purchase are eligible for automatic conversion into Class A shares of the same Fund (the “Conversion Feature”). The automatic conversion pursuant to the Conversion Feature will generally occur at the end of the month following the tenth anniversary after a purchase of Class C shares.
The Fund is an investment company and accordingly follows the investment company accounting and reporting guidance in accordance with Financial Accounting Standards Board Accounting Standards Codification Topic 946, Financial Services – Investment Companies.
The following is a summary of the significant accounting policies followed by the Fund in the preparation of its financial statements.
| A. | Security Valuations – Securities, including restricted securities, are valued according to the following policy. |
A security listed or traded on an exchange (except convertible securities) is valued at its last sales price or official closing price as of the close of the customary trading session on the exchange where the security is principally traded, or lacking any sales or official closing price on a particular day, the security may be valued at the closing bid price on that day. Securities traded in the over-the-counter market are valued based on prices furnished by independent pricing services or market makers. When such securities are valued by an independent pricing service they may be considered fair valued. Futures contracts are valued at the final settlement price set by an exchange on which they are principally traded. Listed options are valued at the mean between the last bid and asked prices from the exchange on which they are principally traded. Options not listed on an exchange are valued by an independent source at the mean between the last bid and asked prices. For purposes of determining net asset value (“NAV”) per share, futures and option contracts generally are valued 15 minutes after the close of the customary trading session of the New York Stock Exchange (“NYSE”).
Investments in open-end and closed-end registered investment companies that do not trade on an exchange are valued at the end-of-day net asset value per share. Investments in open-end and closed-end registered investment companies that trade on an exchange are valued at the last sales price or official closing price as of the close of the customary trading session on the exchange where the security is principally traded.
Debt obligations (including convertible securities) and unlisted equities are fair valued using an evaluated quote provided by an independent pricing service. Evaluated quotes provided by the pricing service may be determined without exclusive reliance on quoted prices, and may reflect appropriate factors such as institution-size trading in similar groups of securities, developments related to specific securities, dividend rate (for unlisted equities), yield (for debt obligations), quality, type of issue, coupon rate (for debt obligations), maturity (for debt obligations), individual trading characteristics and other market data. Pricing services generally value debt obligations assuming orderly transactions of institutional round lot size, but a fund may hold or transact in the same securities in smaller, odd lot sizes. Odd lots often trade at lower prices than institutional round lots. Debt obligations are subject to interest rate and credit risks. In addition, all debt obligations involve some risk of default with respect to interest and/or principal payments.
Foreign securities’ (including foreign exchange contracts) prices are converted into U.S. dollar amounts using the applicable exchange rates as of the close of the NYSE. If market quotations are available and reliable for foreign exchange-traded equity securities, the securities will be valued at the market quotations. Because trading hours for certain foreign securities end before the close of the NYSE, closing market quotations may become unreliable. If between the time trading ends on a particular security and the close of the customary trading session on the NYSE, events occur that the investment adviser determines are significant and make the closing price unreliable, the Fund may fair value the security. If the event is likely to have affected the closing price of the security, the security will be valued at fair value in good faith using procedures approved by the Board of Trustees. Adjustments to closing prices to reflect fair value may also be based on a screening process of an independent pricing service to indicate the degree of certainty, based on historical data, that the closing price in the principal market where a foreign security trades is not the current value as of the close of the NYSE. Foreign securities’ prices meeting the approved degree of certainty that the price is not reflective of current value will be priced at the indication of fair value from the independent pricing service. Multiple factors may be considered by the independent pricing service in determining adjustments to reflect fair value and may include information relating to sector indices, American Depositary Receipts and domestic and foreign index futures. Foreign securities may have additional risks including exchange rate changes, potential for sharply devalued currencies and high inflation, political and economic upheaval, the relative lack of issuer information, relatively low market liquidity and the potential lack of strict financial and accounting controls and standards.
Securities for which market prices are not provided by any of the above methods may be valued based upon quotes furnished by independent sources. The last bid price may be used to value equity securities. The mean between the last bid and asked prices is used to value debt obligations, including corporate loans.
Securities for which market quotations are not readily available or became unreliable are valued at fair value as determined in good faith by or under the supervision of the Trust’s officers following procedures approved by the Board of Trustees. Issuer specific events, market trends, bid/asked quotes of brokers and information providers and other market data may be reviewed in the course of making a good faith determination of a security’s fair value.
The Fund may invest in securities that are subject to interest rate risk, meaning the risk that the prices will generally fall as interest rates rise and, conversely, the prices will generally rise as interest rates fall. Specific securities differ in their sensitivity to changes in interest rates depending on their individual characteristics. Changes in interest rates may result in increased market volatility, which may affect the value and/or liquidity of certain Fund investments.
Valuations change in response to many factors including the historical and prospective earnings of the issuer, the value of the issuer’s assets, general market conditions which are not specifically related to the particular issuer, such as real or perceived adverse economic conditions, changes in the general outlook for revenues or corporate earnings, changes in interest or currency rates, regional or global instability, natural or environmental disasters, widespread disease or other public health issues, war, acts of terrorism or adverse investor sentiment generally and market liquidity. Because of the inherent uncertainties of valuation, the values reflected in the financial statements may materially differ from the value received upon actual sale of those investments.
| B. | Securities Transactions and Investment Income – Securities transactions are accounted for on a trade date basis. Realized gains or losses on sales are computed on the basis of specific identification of the securities sold. Interest income (net of withholding tax, if any) is recorded on an accrual basis from settlement date. Dividend income (net of withholding tax, if any) is recorded on the ex-dividend date. |
The Fund may periodically participate in litigation related to Fund investments. As such, the Fund may receive proceeds from litigation settlements. Any proceeds received are included in the Statement of Operations as realized gain (loss) for investments no longer held and as unrealized gain (loss) for investments still held.
Brokerage commissions and mark ups are considered transaction costs and are recorded as an increase to the cost basis of securities purchased and/or a reduction of proceeds on a sale of securities. Such transaction costs are included in the determination of net realized and unrealized gain (loss) from investment securities reported in the Statement of Operations and the Statement of Changes in Net Assets and the net realized and unrealized gains (losses) on securities per
16 Invesco Value Opportunities Fund
share in the Financial Highlights. Transaction costs are included in the calculation of the Fund’s net asset value and, accordingly, they reduce the Fund’s total returns. These transaction costs are not considered operating expenses and are not reflected in net investment income reported in the Statement of Operations and the Statement of Changes in Net Assets, or the net investment income per share and the ratios of expenses and net investment income reported in the Financial Highlights, nor are they limited by any expense limitation arrangements between the Fund and the investment adviser.
The Fund allocates income and realized and unrealized capital gains and losses to a class based on the relative net assets of each class.
| C. | Country Determination – For the purposes of making investment selection decisions and presentation in the Schedule of Investments, the investment adviser may determine the country in which an issuer is located and/or credit risk exposure based on various factors. These factors include the laws of the country under which the issuer is organized, where the issuer maintains a principal office, the country in which the issuer derives 50% or more of its total revenues and the country that has the primary market for the issuer’s securities, as well as other criteria. Among the other criteria that may be evaluated for making this determination are the country in which the issuer maintains 50% or more of its assets, the type of security, financial guarantees and enhancements, the nature of the collateral and the sponsor organization. Country of issuer and/or credit risk exposure has been determined to be the United States of America, unless otherwise noted. |
| D. | Distributions – Distributions from net investment income and net realized capital gain, if any, are generally declared and paid annually and recorded on the ex-dividend date. The Fund may elect to treat a portion of the proceeds from redemptions as distributions for federal income tax purposes. |
| E. | Federal Income Taxes – The Fund intends to comply with the requirements of Subchapter M of the Internal Revenue Code of 1986, as amended (the “Internal Revenue Code”), necessary to qualify as a regulated investment company and to distribute substantially all of the Fund’s taxable earnings to shareholders. As such, the Fund will not be subject to federal income taxes on otherwise taxable income (including net realized capital gain) that is distributed to shareholders. Therefore, no provision for federal income taxes is recorded in the financial statements. |
The Fund recognizes the tax benefits of uncertain tax positions only when the position is more likely than not to be sustained. Management has analyzed the Fund’s uncertain tax positions and concluded that no liability for unrecognized tax benefits should be recorded related to uncertain tax positions. Management is not aware of any tax positions for which it is reasonably possible that the total amounts of unrecognized tax benefits will change materially in the next 12 months.
The Fund files tax returns in the U.S. Federal jurisdiction and certain other jurisdictions. Generally, the Fund is subject to examinations by such taxing authorities for up to three years after the filing of the return for the tax period.
| F. | Expenses – Fees provided for under the Rule 12b-1 plan of a particular class of the Fund are charged to the operations of such class. Transfer agency fees and expenses and other shareholder recordkeeping fees and expenses attributable to Class R5 and Class R6 are allocated to each share class based on relative net assets. Sub-accounting fees attributable to Class R5 are charged to the operations of the class. Transfer agency fees and expenses and other shareholder recordkeeping fees and expenses relating to all other classes are allocated among those classes based on relative net assets. All other expenses are allocated among the classes based on relative net assets. |
| G. | Accounting Estimates – The preparation of financial statements in conformity with accounting principles generally accepted in the United States of America (“GAAP”) requires management to make estimates and assumptions that affect the reported amounts of assets and liabilities at the date of the financial statements and the reported amounts of revenues and expenses during the reporting period including estimates and assumptions related to taxation. Actual results could differ from those estimates by a significant amount. In addition, the Fund monitors for material events or transactions that may occur or become known after the period-end date and before the date the financial statements are released to print. |
| H. | Indemnifications – Under the Trust’s organizational documents, each Trustee, officer, employee or other agent of the Trust is indemnified against certain liabilities that may arise out of the performance of their duties to the Fund. Additionally, in the normal course of business, the Fund enters into contracts, including the Fund’s servicing agreements, that contain a variety of indemnification clauses. The Fund’s maximum exposure under these arrangements is unknown as this would involve future claims that may be made against the Fund that have not yet occurred. The risk of material loss as a result of such indemnification claims is considered remote. |
| I. | Securities Lending – The Fund may lend portfolio securities having a market value up to one-third of the Fund’s total assets. Such loans are secured by collateral equal to no less than the market value of the loaned securities determined daily by the securities lending provider. Such collateral will be cash or debt securities issued or guaranteed by the U.S. Government or any of its sponsored agencies. Cash collateral received in connection with these loans is invested in short-term money market instruments or affiliated money market funds and is shown as such on the Schedule of Investments. The Fund bears the risk of loss with respect to the investment of collateral. It is the Fund’s policy to obtain additional collateral from or return excess collateral to the borrower by the end of the next business day, following the valuation date of the securities loaned. Therefore, the value of the collateral held may be temporarily less than the value of the securities on loan. When loaning securities, the Fund retains certain benefits of owning the securities, including the economic equivalent of dividends or interest generated by the security. Lending securities entails a risk of loss to the Fund if, and to the extent that, the market value of the securities loaned were to increase and the borrower did not increase the collateral accordingly, and the borrower failed to return the securities. The securities loaned are subject to termination at the option of the borrower or the Fund. Upon termination, the borrower will return to the Fund the securities loaned and the Fund will return the collateral. Upon the failure of the borrower to return the securities, collateral may be liquidated and the securities may be purchased on the open market to replace the loaned securities. The Fund could experience delays and costs in gaining access to the collateral and the securities may lose value during the delay which could result in potential losses to the Fund. Some of these losses may be indemnified by the lending agent. The Fund bears the risk of any deficiency in the amount of the collateral available for return to the borrower due to any loss on the collateral invested. Dividends received on cash collateral investments for securities lending transactions, which are net of compensation to counterparties, are included in Dividends from affiliated money market funds on the Statement of Operations. The aggregate value of securities out on loan, if any, is shown as a footnote on the Statement of Assets and Liabilities. |
| J. | Foreign Currency Translations – Foreign currency is valued at the close of the NYSE based on quotations posted by banks and major currency dealers. Portfolio securities and other assets and liabilities denominated in foreign currencies are translated into U.S. dollar amounts at the date of valuation. Purchases and sales of portfolio securities (net of foreign taxes withheld on disposition) and income items denominated in foreign currencies are translated into U.S. dollar amounts on the respective dates of such transactions. The Fund does not separately account for the portion of the results of operations resulting from changes in foreign exchange rates on investments and the fluctuations arising from changes in market prices of securities held. The combined results of changes in foreign exchange rates and the fluctuation of market prices on investments (net of estimated foreign tax withholding) are included with the net realized and unrealized gain or loss from investments in the Statement of Operations. Reported net realized foreign currency gains or losses arise from (1) sales of foreign currencies, (2) currency gains or losses realized between the trade and settlement dates on securities transactions, and (3) the difference between the amounts of dividends, interest, and foreign withholding taxes recorded on the Fund’s books and the U.S. dollar equivalent of the amounts actually received or paid. Net unrealized foreign currency gains and losses arise from changes in the fair values of assets and liabilities, other than investments in securities at fiscal period end, resulting from changes in exchange rates. |
The Fund may invest in foreign securities, which may be subject to foreign taxes on income, gains on investments or currency repatriation, a portion of which may be recoverable. Foreign taxes, if any, are recorded based on the tax regulations and rates that exist in the foreign markets in which the Fund invests and are shown in the Statement of Operations.
| K. | Forward Foreign Currency Contracts – The Fund may engage in foreign currency transactions either on a spot (i.e. for prompt delivery and settlement) basis, or through forward foreign currency contracts, to manage or minimize currency or exchange rate risk. |
The Fund may also enter into forward foreign currency contracts for the purchase or sale of a security denominated in a foreign currency in order to “lock in” the U.S. dollar price of that security, or the Fund may also enter into forward foreign currency contracts that do not provide for physical settlement of the two
17 Invesco Value Opportunities Fund
currencies, but instead are settled by a single cash payment calculated as the difference between the agreed upon exchange rate and the spot rate at settlement based upon an agreed upon notional amount (non-deliverable forwards). The Fund will set aside liquid assets in an amount equal to the daily mark-to-market obligation for forward foreign currency contracts.
A forward foreign currency contract is an obligation between two parties (“Counterparties”) to purchase or sell a specific currency for an agreed-upon price at a future date. The use of forward foreign currency contracts does not eliminate fluctuations in the price of the underlying securities the Fund owns or intends to acquire but establishes a rate of exchange in advance. Fluctuations in the value of these contracts are measured by the difference in the contract date and reporting date exchange rates and are recorded as unrealized appreciation (depreciation) until the contracts are closed. When the contracts are closed, realized gains (losses) are recorded. Realized and unrealized gains (losses) on the contracts are included in the Statement of Operations. The primary risks associated with forward foreign currency contracts include failure of the Counterparty to meet the terms of the contract and the value of the foreign currency changing unfavorably. These risks may be in excess of the amounts reflected in the Statement of Assets and Liabilities.
NOTE 2—Advisory Fees and Other Fees Paid to Affiliates
The Trust has entered into a master investment advisory agreement with Invesco Advisers, Inc. (the “Adviser” or “Invesco”). Under the terms of the investment advisory agreement, the Fund accrues daily and pays monthly an advisory fee to the Adviser based on the annual rate of the Fund’s average daily net assets as follows:
| | | | |
| Average Daily Net Assets | | Rate | |
First $ 250 million | | | 0.695% | |
Next $250 million | | | 0.670% | |
Next $500 million | | | 0.645% | |
Next $1.5 billion | | | 0.620% | |
Next $2.5 billion | | | 0.595% | |
Next $2.5 billion | | | 0.570% | |
Next $2.5 billion | | | 0.545% | |
Over $10 billion | | | 0.520% | |
For the year ended April 30, 2020, the effective advisory fee rate incurred by the Fund was 0.67%.
Under the terms of a master sub-advisory agreement between the Adviser and each of Invesco Asset Management Deutschland GmbH, Invesco Asset Management Limited, Invesco Asset Management (Japan) Limited, Invesco Hong Kong Limited, Invesco Senior Secured Management, Inc. and Invesco Canada Ltd. (collectively, the “Affiliated Sub-Advisers”) the Adviser, not the Fund, will pay 40% of the fees paid to the Adviser to any such Affiliated Sub-Adviser(s) that provide(s) discretionary investment management services to the Fund based on the percentage of assets allocated to such Affiliated Sub-Adviser(s).
The Adviser has contractually agreed, through at least June 30, 2021, to waive advisory fees and/or reimburse expenses of all shares to the extent necessary to limit total annual fund operating expenses after fee waiver and/or expense reimbursement (excluding certain items discussed above) of Class A, Class C, Class R, Class Y, Class R5 and Class R6 shares to 2.00%, 2.75%, 2.25%, 1.75%, 1.75% and 1.75%, respectively, of average daily net assets (the “expense limits”). In determining the Adviser’s obligation to waive advisory fees and/or reimburse expenses, the following expenses are not taken into account, and could cause the total annual fund operating expenses after fee waiver and/or expense reimbursement to exceed the numbers reflected above: (1) interest; (2) taxes; (3) dividend expense on short sales; (4) extraordinary or non-routine items, including litigation expenses; and (5) expenses that the Fund has incurred but did not actually pay because of an expense offset arrangement. Unless Invesco continues the fee waiver agreement, it will terminate on June 30, 2021. During its term, the fee waiver agreement cannot be terminated or amended to increase the expense limits or reduce the advisory fee waiver without approval of the Board of Trustees. The Adviser did not waive fees and/or reimburse expenses during the period under these expense limits.
Further, the Adviser has contractually agreed, through at least June 30, 2022, to waive the advisory fee payable by the Fund in an amount equal to 100% of the net advisory fees the Adviser receives from the affiliated money market funds on investments by the Fund of uninvested cash (excluding investments of cash collateral from securities lending) in such affiliated money market funds.
For the year ended April 30, 2020, the Adviser waived advisory fees of $26,476.
The Trust has entered into a master administrative services agreement with Invesco pursuant to which the Fund has agreed to pay Invesco for certain administrative costs incurred in providing accounting services to the Fund. For the year ended April 30, 2020, expenses incurred under the agreement are shown in the Statement of Operations as Administrative services fees. Invesco has entered into a sub-administration agreement whereby State Street Bank and Trust Company (“SSB”) serves as fund accountant and provides certain administrative services to the Fund. Pursuant to a custody agreement with the Trust on behalf of the Fund, SSB also serves as the Fund’s custodian.
The Trust has entered into a transfer agency and service agreement with Invesco Investment Services, Inc. (“IIS”) pursuant to which the Fund has agreed to pay IIS a fee for providing transfer agency and shareholder services to the Fund and reimburse IIS for certain expenses incurred by IIS in the course of providing such services. IIS may make payments to intermediaries that provide omnibus account services, sub-accounting services and/or networking services. All fees payable by IIS to intermediaries that provide omnibus account services or sub-accounting services are charged back to the Fund, subject to certain limitations approved by the Trust’s Board of Trustees. For the year ended April 30, 2020, expenses incurred under the agreement are shown in the Statement of Operations as Transfer agent fees.
The Trust has entered into master distribution agreements with Invesco Distributors, Inc. (“IDI”) to serve as the distributor for the Class A, Class C, Class R, Class Y, Class R5 and Class R6 shares of the Fund. The Trust has adopted plans pursuant to Rule 12b-1 under the 1940 Act with respect to the Fund’s Class A, Class C and Class R shares (collectively the “Plan”). The Fund, pursuant to the Plans, reimburses IDI for its allocated share of expenses incurred for the period, up to a maximum annual rate of 0.25% of the average daily net assets of Class A shares and up to a maximum annual rate of 1.00% of the average daily net assets of Class C shares. The Fund pursuant to the Class R Plan, pays IDI compensation at the annual rate of 0.50% of the average daily net assets of Class R shares. The fees are accrued daily and paid monthly. Of the Plan payments, up to 0.25% of the average daily net assets of each class of shares may be paid to furnish continuing personal shareholder services to customers who purchase and own shares of such classes. Any amounts not paid as a service fee under the Plan would constitute an asset-based sales charge. Rules of the Financial Industry Regulatory Authority (“FINRA”) impose a cap on the total sales charges, including asset-based sales charges, that may be paid by any class of shares of the Fund. For the year ended April 30, 2020, expenses incurred under the Plans are shown in the Statement of Operations as Distribution fees.
Front-end sales commissions and CDSC (collectively, the “sales charges”) are not recorded as expenses of the Fund. Front-end sales commissions are deducted from proceeds from the sales of Fund shares prior to investment in Class A shares of the Fund. CDSC are deducted from redemption proceeds prior to remittance to the shareholder. During the year ended April 30, 2020, IDI advised the Fund that IDI retained $51,243 in front-end sales commissions from the sale of Class A shares and $628 and $445 from Class A and Class C shares, respectively, for CDSC imposed upon redemptions by shareholders.
For the year ended April 30, 2020, the Fund incurred $2,968 in brokerage commissions with Invesco Capital Markets, Inc., an affiliate of the Adviser and IDI, for portfolio transactions executed on behalf of the Fund.
Certain officers and trustees of the Trust are officers and directors of the Adviser, IIS and/or IDI.
18 Invesco Value Opportunities Fund
NOTE 3–Additional Valuation Information
GAAP defines fair value as the price that would be received to sell an asset or paid to transfer a liability in an orderly transaction between market participants at the measurement date, under current market conditions. GAAP establishes a hierarchy that prioritizes the inputs to valuation methods, giving the highest priority to readily available unadjusted quoted prices in an active market for identical assets (Level 1) and the lowest priority to significant unobservable inputs (Level 3), generally when market prices are not readily available or are unreliable. Based on the valuation inputs, the securities or other investments are tiered into one of three levels. Changes in valuation methods may result in transfers in or out of an investment’s assigned level:
| | |
| Level 1 - | | Prices are determined using quoted prices in an active market for identical assets. |
| Level 2 - | | Prices are determined using other significant observable inputs. Observable inputs are inputs that other market participants may use in pricing a security. These may include quoted prices for similar securities, interest rates, prepayment speeds, credit risk, yield curves, loss severities, default rates, discount rates, volatilities and others. |
| Level 3 - | | Prices are determined using significant unobservable inputs. In situations where quoted prices or observable inputs are unavailable (for example, when there is little or no market activity for an investment at the end of the period), unobservable inputs may be used. Unobservable inputs reflect the Fund’s own assumptions about the factors market participants would use in determining fair value of the securities or instruments and would be based on the best available information. |
The following is a summary of the tiered valuation input levels, as of April 30, 2020. The level assigned to the securities valuations may not be an indication of the risk or liquidity associated with investing in those securities. Because of the inherent uncertainties of valuation, the values reflected in the financial statements may materially differ from the value received upon actual sale of those investments.
| | | | | | | | | | | | | | | | | | | | |
| | | Level 1 | | Level 2 | | Level 3 | | Total |
Investments in Securities | | | | | | | | | | | | | | | | | | | | |
Common Stocks & Other Equity Interests | | | $ | 490,199,001 | | | | $ | 1,057,795 | | | | $ | – | | | | $ | 491,256,796 | |
Money Market Funds | | | | 21,164,758 | | | | | – | | | | | – | | | | | 21,164,758 | |
Total Investments | | | $ | 511,363,759 | | | | $ | 1,057,795 | | | | $ | – | | | | $ | 512,421,554 | |
NOTE 4–Security Transactions with Affiliated Funds
The Fund is permitted to purchase or sell securities from or to certain other Invesco Funds under specified conditions outlined in procedures adopted by the Board of Trustees of the Trust. The procedures have been designed to ensure that any purchase or sale of securities by the Fund from or to another fund or portfolio that is or could be considered an affiliate by virtue of having a common investment adviser (or affiliated investment advisers), common Trustees and/or common officers complies with Rule 17a-7 of the 1940 Act. Further, as defined under the procedures, each transaction is effected at the current market price. Pursuant to these procedures, for the year ended April 30, 2020, the Fund engaged in securities sales of $2,027,302, which resulted in net realized gains of $873,263.
NOTE 5–Expense Offset Arrangement(s)
The expense offset arrangement is comprised of transfer agency credits which result from balances in demand deposit accounts used by the transfer agent for clearing shareholder transactions. For the year ended April 30, 2020, the Fund received credits from this arrangement, which resulted in the reduction of the Fund’s total expenses of $15,725.
NOTE 6–Trustees’ and Officers’ Fees and Benefits
Trustees’ and Officers’ Fees and Benefits include amounts accrued by the Fund to pay remuneration to certain Trustees and Officers of the Fund. Trustees have the option to defer compensation payable by the Fund, and Trustees’ and Officers’ Fees and Benefits also include amounts accrued by the Fund to fund such deferred compensation amounts. Those Trustees who defer compensation have the option to select various Invesco Funds in which their deferral accounts shall be deemed to be invested. Finally, certain current Trustees were eligible to participate in a retirement plan that provided for benefits to be paid upon retirement to Trustees over a period of time based on the number of years of service. The Fund may have certain former Trustees who also participate in a retirement plan and receive benefits under such plan. Trustees’ and Officers’ Fees and Benefits include amounts accrued by the Fund to fund such retirement benefits. Obligations under the deferred compensation and retirement plans represent unsecured claims against the general assets of the Fund.
NOTE 7–Cash Balances
The Fund is permitted to temporarily carry a negative or overdrawn balance in its account with SSB, the custodian bank. Such balances, if any at period-end, are shown in the Statement of Assets and Liabilities under the payable caption Amount due custodian. To compensate the custodian bank for such overdrafts, the overdrawn Fund may either (1) leave funds as a compensating balance in the account so the custodian bank can be compensated by earning the additional interest; or (2) compensate by paying the custodian bank at a rate agreed upon by the custodian bank and Invesco, not to exceed the contractually agreed upon rate. The Fund may not purchase additional securities when any borrowings from banks or broker-dealers exceed 5% of the Fund’s total assets, or when any borrowings from an Invesco Fund are outstanding.
NOTE 8–Distributions to Shareholders and Tax Components of Net Assets
Tax Character of Distributions to Shareholders Paid During the Fiscal Years Ended April 30, 2020 and 2019:
| | | | | | | | | | |
| | | 2020 | | 2019 |
Ordinary income | | | $ | 3,323,175 | | | | $ | 8,204,810 | |
Long-term capital gain | | | | 10,728,373 | | | | | 77,006,985 | |
Total distributions | | | $ | 14,051,548 | | | | $ | 85,211,795 | |
19 Invesco Value Opportunities Fund
Tax Components of Net Assets at Period-End:
| | | | | |
| | | 2020 |
Undistributed ordinary income | | | $ | 1,801,094 | |
Net unrealized appreciation (depreciation) – investments | | | | (60,825,393 | ) |
Net unrealized appreciation - foreign currencies | | | | 2,410 | |
Temporary book/tax differences | | | | (432,871 | ) |
Capital loss carryforward | | | | (69,326,746 | ) |
Shares of beneficial interest | | | | 635,469,266 | |
Total net assets | | | $ | 506,687,760 | |
The difference between book-basis and tax-basis unrealized appreciation (depreciation) is due to differences in the timing of recognition of gains and losses on investments for tax and book purposes. The Fund’s net unrealized appreciation (depreciation) difference is attributable primarily to wash sales.
The temporary book/tax differences are a result of timing differences between book and tax recognition of income and/or expenses. The Fund’s temporary book/tax differences are the result of the trustee deferral of compensation and retirement plan benefits.
Capital loss carryforward is calculated and reported as of a specific date. Results of transactions and other activity after that date may affect the amount of capital loss carryforward actually available for the Fund to utilize. The ability to utilize capital loss carryforward in the future may be limited under the Internal Revenue Code and related regulations based on the results of future transactions.
The Fund has a capital loss carryforward as of April 30, 2020, as follows:
| | | | | | | | | | | | | | | |
| Capital Loss Carryforward* |
| Expiration | | Short-Term | | Long-Term | | Total |
Not subject to expiration | | | $ | 1,035,838 | | | | $ | 68,290,908 | | | | $ | 69,326,746 | |
| * | Capital loss carryforward is reduced for limitations, if any, to the extent required by the Internal Revenue Code and may be further limited depending upon a variety of factors, including the realization of net unrealized gains or losses as of the date of any reorganization. |
NOTE 9–Investment Transactions
The aggregate amount of investment securities (other than short-term securities, U.S. Treasury obligations and money market funds, if any) purchased and sold by the Fund during the year ended April 30, 2020 was $259,331,057 and $315,686,877, respectively. Cost of investments, including any derivatives, on a tax basis includes the adjustments for financial reporting purposes as of the most recently completed federal income tax reporting period-end.
| | | | | |
| Unrealized Appreciation (Depreciation) of Investments on a Tax Basis |
Aggregate unrealized appreciation of investments | | | | $ 44,137,905 | |
Aggregate unrealized (depreciation) of investments | | | | (104,963,298 | ) |
Net unrealized appreciation (depreciation) of investments | | | | $ (60,825,393 | ) |
Cost of investments for tax purposes is $573,246,947.
NOTE 10–Reclassification of Permanent Differences
Primarily as a result of differing book/tax treatment of distributions, on April 30, 2020, undistributed net investment income was decreased by $110,040 and undistributed net realized gain (loss) was increased by $110,040. This reclassification had no effect on the net assets or the distributable earnings (loss) of the Fund.
NOTE 11–Share Information
| | | | | | | | | | | | | | | | | | | | |
| Summary of Share Activity | |
| | | Year ended
April 30, 2020(a) | | | | | | Year ended
April 30, 2019 | |
| | | Shares | | | Amount | | | | | | Shares | | | Amount | |
Sold: | | | | | | | | | | | | | | | | | | | | |
Class A | | | 2,737,347 | | | $ | 29,957,805 | | | | | | | | 2,997,323 | | | $ | 38,539,069 | |
Class C | | | 188,021 | | | | 1,997,144 | | | | | | | | 261,349 | | | | 3,284,811 | |
Class R | | | 97,864 | | | | 1,101,127 | | | | | | | | 84,122 | | | | 1,110,544 | |
Class Y | | | 848,595 | | | | 10,353,459 | | | | | | | | 1,098,977 | | | | 13,944,039 | |
Class R5 | | | 8,037 | | | | 102,961 | | | | | | | | 20,827 | | | | 293,122 | |
Class R6 | | | 919,288 | | | | 10,270,214 | | | | | | | | 811,481 | | | | 10,686,666 | |
Issued as reinvestment of dividends: | | | | | | | | | | | | | | | | | | | | |
Class A | | | 903,651 | | | | 11,548,662 | | | | | | | | 6,168,261 | | | | 65,568,617 | |
Class C | | | 25,632 | | | | 305,017 | | | | | | | | 682,635 | | | | 6,812,768 | |
Class R | | | 15,094 | | | | 190,179 | | | | | | | | 132,621 | | | | 1,393,851 | |
Class Y | | | 48,213 | | | | 618,089 | | | | | | | | 363,569 | | | | 3,868,374 | |
Class R5 | | | 1,126 | | | | 14,563 | | | | | | | | 24,915 | | | | 266,591 | |
Class R6 | | | 48,392 | | | | 626,679 | | | | | | | | 308,054 | | | | 3,302,335 | |
Automatic conversion of Class C shares to Class A shares: | | | | | | | | | | | | | | | | | | | | |
Class A | | | 155,430 | | | | 1,816,257 | | | | | | | | 3,463,765 | | | | 40,606,720 | |
Class C | | | (166,609 | ) | | | (1,816,257 | ) | | | | | | | (3,690,780 | ) | | | (40,606,720 | ) |
20 Invesco Value Opportunities Fund
| | | | | | | | | | | | | | | | | | | | |
| Summary of Share Activity | |
| | | Year ended
April 30, 2020(a) | | | | | | Year ended
April 30, 2019 | |
| | | Shares | | | Amount | | | | | | Shares | | | Amount | |
Reacquired: | | | | | | | | | | | | | | | | | | | | |
Class A | | | (8,422,923 | ) | | $ | (96,449,028 | ) | | | | | | | (7,830,091 | ) | | $ | (103,149,725 | ) |
Class C | | | (310,746 | ) | | | (3,454,486 | ) | | | | | | | (871,075 | ) | | | (11,069,751 | ) |
Class R | | | (288,336 | ) | | | (3,301,165 | ) | | | | | | | (274,956 | ) | | | (3,409,431 | ) |
Class Y | | | (1,304,916 | ) | | | (15,530,471 | ) | | | | | | | (1,313,108 | ) | | | (16,793,722 | ) |
Class R5 | | | (137,562 | ) | | | (1,684,189 | ) | | | | | | | (45,550 | ) | | | (603,705 | ) |
Class R6 | | | (854,482 | ) | | | (10,007,444 | ) | | | | | | | (579,271 | ) | | | (7,614,744 | ) |
Net increase (decrease) in share activity | | | (5,488,884 | ) | | $ | (63,340,884 | ) | | | | | | | 1,813,068 | | | $ | 6,429,709 | |
| (a) | There are entities that are record owners of more than 5% of the outstanding shares of the Fund and in the aggregate own 30% of the outstanding shares of the Fund. IDI has an agreement with these entities to sell Fund shares. The Fund, Invesco and/or Invesco affiliates may make payments to these entities, which are considered to be related to the Fund, for providing services to the Fund, Invesco and/or Invesco affiliates including but not limited to services such as securities brokerage, distribution, third party record keeping and account servicing. The Fund has no knowledge as to whether all or any portion of the shares owned of record by these entities are also owned beneficially. |
NOTE 12–Coronavirus (COVID-19) Pandemic
During the first quarter of 2020, the World Health Organization declared COVID-19 to be a public health emergency. COVID-19 has led to increased short-term market volatility and may have adverse long-term effects on U.S. and world economies and markets in general. COVID-19 may adversely impact the Fund’s ability to achieve its investment objective. Because of the uncertainties on valuation, the global economy and business operations, values reflected in these financial statements may materially differ from the value received upon actual sales of those investments.
The extent of the impact on the performance of the Fund and its investments will depend on future developments, including the duration and spread of the COVID-19 outbreak, related restrictions and advisories, and the effects on the financial markets and economy overall, all of which are highly uncertain and cannot be predicted.
21 Invesco Value Opportunities Fund
Report of Independent Registered Public Accounting Firm
To the Board of Trustees of AIM Sector Funds (Invesco Sector Funds) and Shareholders of Invesco Value Opportunities Fund
Opinion on the Financial Statements
We have audited the accompanying statement of assets and liabilities, including the schedule of investments, of Invesco Value Opportunities Fund (one of the funds constituting AIM Sector Funds (Invesco Sector Funds), referred to hereafter as the “Fund”) as of April 30, 2020, the related statement of operations for the year ended April 30, 2020, the statement of changes in net assets for each of the two years in the period ended April 30, 2020, including the related notes, and the financial highlights for each of the periods indicated therein (collectively referred to as the “financial statements”). In our opinion, the financial statements present fairly, in all material respects, the financial position of the Fund as of April 30, 2020, the results of its operations for the year then ended, the changes in its net assets for each of the two years in the period ended April 30, 2020 and the financial highlights for each of the periods indicated therein in conformity with accounting principles generally accepted in the United States of America.
Basis for Opinion
These financial statements are the responsibility of the Fund’s management. Our responsibility is to express an opinion on the Fund’s financial statements based on our audits. We are a public accounting firm registered with the Public Company Accounting Oversight Board (United States) (PCAOB) and are required to be independent with respect to the Fund in accordance with the U.S. federal securities laws and the applicable rules and regulations of the Securities and Exchange Commission and the PCAOB.
We conducted our audits of these financial statements in accordance with the standards of the PCAOB. Those standards require that we plan and perform the audit to obtain reasonable assurance about whether the financial statements are free of material misstatement, whether due to error or fraud.
Our audits included performing procedures to assess the risks of material misstatement of the financial statements, whether due to error or fraud, and performing procedures that respond to those risks. Such procedures included examining, on a test basis, evidence regarding the amounts and disclosures in the financial statements. Our audits also included evaluating the accounting principles used and significant estimates made by management, as well as evaluating the overall presentation of the financial statements. Our procedures included confirmation of securities owned as of April 30, 2020 by correspondence with the custodian, transfer agent and brokers; when replies were not received from brokers, we performed other auditing procedures. We believe that our audits provide a reasonable basis for our opinion.
/s/PricewaterhouseCoopers LLP
Houston, Texas
June 26, 2020
We have served as the auditor of one or more of the investment companies in the Invesco group of investment companies since at least 1995. We have not been able to determine the specific year we began serving as auditor.
22 Invesco Value Opportunities Fund
Calculating your ongoing Fund expenses
Example
As a shareholder of the Fund, you incur two types of costs: (1) transaction costs, which may include sales charges (loads) on purchase payments or contingent deferred sales charges on redemptions, if any; and (2) ongoing costs, including management fees, distribution and/or service (12b-1) fees, and other Fund expenses. This example is intended to help you understand your ongoing costs (in dollars) of investing in the Fund and to compare these costs with ongoing costs of investing in other mutual funds. The example is based on an investment of $1,000 invested at the beginning of the period and held for the entire period November 1, 2019 through April 30, 2020.
Actual expenses
The table below provides information about actual account values and actual expenses. You may use the information in this table, together with the amount you invested, to estimate the expenses that you paid over the period. Simply divide your account value by $1,000 (for example, an $8,600 account value divided by $1,000 = 8.6), then multiply the result by the number in the table under the heading entitled “Actual Expenses Paid During Period” to estimate the expenses you paid on your account during this period.
Hypothetical example for comparison purposes
The table below also provides information about hypothetical account values and hypothetical expenses based on the Fund’s actual expense ratio and an assumed rate of return of 5% per year before expenses, which is not the Fund’s actual return.
The hypothetical account values and expenses may not be used to estimate the actual ending account balance or expenses you paid for the period. You may use this information to compare the ongoing costs of investing in the Fund and other funds. To do so, compare this 5% hypothetical example with the 5% hypothetical examples that appear in the shareholder reports of the other funds.
Please note that the expenses shown in the table are meant to highlight your ongoing costs only and do not reflect any transaction costs, such as sales charges (loads) on purchase payments or contingent deferred sales charges on redemptions, if any. Therefore, the hypothetical information is useful in comparing ongoing costs only, and will not help you determine the relative total costs of owning different funds. In addition, if these transaction costs were included, your costs would have been higher.
| | | | | | | | | | | | |
| | | Beginning
Account Value
(11/01/19) | | ACTUAL | | HYPOTHETICAL (5% annual return before expenses) | | Annualized
Expense
Ratio |
| | Ending
Account Value
(04/30/20)1 | | Expenses
Paid During
Period2 | | Ending
Account Value
(04/30/20) | | Expenses
Paid During
Period2 |
| Class A | | $1,000.00 | | $775.80 | | $5.34 | | $1,018.85 | | $6.07 | | 1.21% |
| Class C | | 1,000.00 | | 773.50 | | 8.16 | | 1,015.66 | | 9.27 | | 1.85 |
| Class R | | 1,000.00 | | 775.30 | | 6.40 | | 1,017.65 | | 7.27 | | 1.45 |
| Class Y | | 1,000.00 | | 776.50 | | 4.24 | | 1,020.09 | | 4.82 | | 0.96 |
| Class R5 | | 1,000.00 | | 777.50 | | 3.54 | | 1,020.89 | | 4.02 | | 0.80 |
| Class R6 | | 1,000.00 | | 777.90 | | 3.32 | | 1,021.13 | | 3.77 | | 0.75 |
| 1 | The actual ending account value is based on the actual total return of the Fund for the period November 1, 2019 through April 30, 2020, after actual expenses and will differ from the hypothetical ending account value which is based on the Fund’s expense ratio and a hypothetical annual return of 5% before expenses. |
| 2 | Expenses are equal to the Fund’s annualized expense ratio as indicated above multiplied by the average account value over the period, multiplied by 182/366 to reflect the most recent fiscal half year. |
23 Invesco Value Opportunities Fund
Tax Information
Form 1099-DIV, Form 1042-S and other year–end tax information provide shareholders with actual calendar year amounts that should be included in their tax returns. Shareholders should consult their tax advisers.
The following distribution information is being provided as required by the Internal Revenue Code or to meet a specific state’s requirement.
The Fund designates the following amounts or, if subsequently determined to be different, the maximum amount allowable for its fiscal year ended April 30, 2020:
| | | | | | |
| | | | | | |
| Federal and State Income Tax | | | | |
| Long-Term Capital Gain Distributions | | | $10,728,373 | |
| Qualified Dividend Income* | | | 77.91 | % |
| Corporate Dividends Received Deduction* | | | 76.26 | % |
| U.S. Treasury Obligations* | | | 0.00 | % |
| | * | The above percentages are based on ordinary income dividends paid to shareholders during the Fund’s fiscal year. |
24 Invesco Value Opportunities Fund
Trustees and Officers
The address of each trustee and officer is AIM Sector Funds (Invesco Sector Funds) (the “Trust”), 11 Greenway Plaza, Suite 1000, Houston, Texas 77046-1173. The trustees serve for the life of the Trust, subject to their earlier death, incapacitation, resignation, retirement or removal as more specifically provided in the Trust’s organizational documents. Each officer serves for a one year term or until their successors are elected and qualified. Column two below includes length of time served with predecessor entities, if any.
| | | | | | | | | | |
Name, Year of Birth and Position(s) Held with the Trust | | Trustee and/or
Officer Since | | Principal Occupation(s) During Past 5 Years | | | | Number of
Funds in
Fund Complex
Overseen by
Trustee | | Other Directorship(s) Held by Trustee During Past 5 Years |
| Interested Trustee | | | | | | | | | | |
Martin L. Flanagan1 – 1960 Trustee and Vice Chair | | 2007 | | Executive Director, Chief Executive Officer and President, Invesco Ltd. (ultimate parent of Invesco and a global investment management firm); Trustee and Vice Chair, The Invesco Funds; Vice Chair, Investment Company Institute; and Member of Executive Board, SMU Cox School of Business Formerly: Advisor to the Board, Invesco Advisers, Inc. (formerly known as Invesco Institutional (N.A.), Inc.); Chairman and Chief Executive Officer, Invesco Advisers, Inc. (registered investment adviser); Director, Chairman, Chief Executive Officer and President, Invesco Holding Company (US), Inc. (formerly IVZ Inc.) (holding company), Invesco Group Services, Inc. (service provider) and Invesco North American Holdings, Inc. (holding company); Director, Chief Executive Officer and President, Invesco Holding Company Limited (parent of Invesco and a global investment management firm); Director, Invesco Ltd.; Chairman, Investment Company Institute and President, Co-Chief Executive Officer, Co-President, Chief Operating Officer and Chief Financial Officer, Franklin Resources, Inc. (global investment management organization) | | | | 203 | | None |
| 1 | Mr. Flanagan is considered an interested person (within the meaning of Section 2(a)(19) of the 1940 Act) of the Trust because he is an officer of the Adviser to the Trust, and an officer and a director of Invesco Ltd., ultimate parent of the Adviser. |
T-1 Invesco Value Opportunities Fund
Trustees and Officers–(continued)
| | | | | | | | |
Name, Year of Birth and Position(s) Held with the Trust | | Trustee and/or Officer Since | | Principal Occupation(s) During Past 5 Years | | Number of Funds
in Fund Complex Overseen by Trustee | | Other Directorship(s) Held by Trustee During Past 5 Years |
| Independent Trustees | | | | | | | | |
Bruce L. Crockett - 1944
Trustee and Chair | | 2003 | | Chairman, Crockett Technologies Associates (technology consulting company) Formerly: Director, Captaris (unified messaging provider); Director, President and Chief Executive Officer, COMSAT Corporation; Chairman, Board of Governors of INTELSAT (international communications company); ACE Limited (insurance company); Independent Directors Council and Investment Company Institute: Member of the Audit Committee, Investment Company Institute; Member of the Executive Committee and Chair of the Governance Committee, Independent Directors Council | | 203 | | Director and Chairman of the Audit Committee, ALPS (Attorneys Liability Protection Society) (insurance company); Director and Member of the Audit Committee and Compensation Committee, Ferroglobe PLC (metallurgical company) |
David C. Arch - 1945
Trustee | | 2010 | | Chairman of Blistex Inc. (consumer health care products manufacturer); Member, World Presidents’ Organization | | 203 | | Board member of the Illinois Manufacturers’ Association |
Beth Ann Brown - 1968
Trustee | | 2019 | | Independent Consultant Formerly: Head of Intermediary Distribution, Managing Director, Strategic Relations, Managing Director, Head of National Accounts, Senior Vice President, National Account Manager and Senior Vice President, Key Account Manager, Columbia Management Investment Advisers LLC; Vice President, Key Account Manager, Liberty Funds Distributor, Inc.; and Trustee of certain Oppenheimer Funds | | 203 | | Director, Board of Directors of Caron Engineering Inc.; Advisor, Board of Advisors of Caron Engineering Inc.; President and Director, Acton Shapleigh Youth Conservation Corps (non - profit); and Vice President and Director of Grahamtastic Connection (non-profit) |
Jack M. Fields - 1952
Trustee | | 2003 | | Chief Executive Officer, Twenty First Century Group, Inc. (government affairs company); and Chairman, Discovery Learning Alliance (non-profit) Formerly: Owner and Chief Executive Officer, Dos Angeles Ranch L.P. (cattle, hunting, corporate entertainment); Director, Insperity, Inc. (formerly known as Administaff) (human resources provider); Chief Executive Officer, Texana Timber LP (sustainable forestry company); Director of Cross Timbers Quail Research Ranch (non-profit); and member of the U.S. House of Representatives | | 203 | | Member, Board of Directors of Baylor College of Medicine |
T-2 Invesco Value Opportunities Fund
Trustees and Officers–(continued)
| | | | | | | | |
Name, Year of Birth and Position(s) Held with the Trust | | Trustee and/or Officer Since | | Principal Occupation(s) During Past 5 Years | | Number of Funds
in Fund Complex Overseen by Trustee | | Other Directorship(s) Held by Trustee During Past 5 Years |
| Independent Trustees–(continued) | | | | | | |
Cynthia Hostetler - 1962
Trustee | | 2017 | | Non-Executive Director and Trustee of a number of public and private business corporations Formerly: Director, Aberdeen Investment Funds (4 portfolios); Head of Investment Funds and Private Equity, Overseas Private Investment Corporation; President, First Manhattan Bancorporation, Inc.; Attorney, Simpson Thacher & Bartlett LLP | | 203 | | Vulcan Materials Company (construction materials company); Trilinc Global Impact Fund; Genesee & Wyoming, Inc. (railroads); Artio Global Investment LLC (mutual fund complex); Edgen Group, Inc. (specialized energy and infrastructure products distributor); Investment Company Institute (professional organization); Independent Directors Council (professional organization) |
Eli Jones - 1961
Trustee | | 2016 | | Professor and Dean, Mays Business School - Texas A&M University Formerly: Professor and Dean, Walton College of Business, University of Arkansas and E.J. Ourso College of Business, Louisiana State University; Director, Arvest Bank | | 229 | | Insperity, Inc. (formerly known as Administaff) (human resources provider) |
Elizabeth Krentzman - 1959
Trustee | | 2019 | | Formerly: Principal and Chief Regulatory Advisor for Asset Management Services and U.S. Mutual Fund Leader of Deloitte & Touche LLP; General Counsel of the Investment Company Institute (trade association); National Director of the Investment Management Regulatory Consulting Practice, Principal, Director and Senior Manager of Deloitte & Touche LLP; Assistant Director of the Division of Investment Management - Office of Disclosure and Investment Adviser Regulation of the U.S. Securities and Exchange Commission and various positions with the Division of Investment Management - Office of Regulatory Policy of the U.S. Securities and Exchange Commission; Associate at Ropes & Gray LLP; Advisory Board Member of the Securities and Exchange Commission Historical Society; and Trustee of certain Oppenheimer Funds | | 203 | | Trustee of the University of Florida National Board Foundation and Audit Committee Member; Member of the Cartica Funds Board of Directors (private investment funds); Member of the University of Florida Law Center Association, Inc. Board of Trustees and Audit Committee Member |
Anthony J. LaCava, Jr. - 1956
Trustee | | 2019 | | Formerly: Director and Member of the Audit Committee, Blue Hills Bank (publicly traded financial institution) and Managing Partner, KPMG LLP | | 203 | | Blue Hills Bank; Chairman, Bentley University; Member, Business School Advisory Council; and Nominating Committee KPMG LLP |
Prema Mathai-Davis - 1950
Trustee | | 2003 | | Retired Co-Owner & Partner of Quantalytics Research, LLC, (a FinTech Investment Research Platform for the Self-Directed Investor) | | 203 | | None |
T-3 Invesco Value Opportunities Fund
Trustees and Officers–(continued)
| | | | | | | | |
Name, Year of Birth and Position(s) Held with the Trust | | Trustee and/or Officer Since | | Principal Occupation(s) During Past 5 Years | | Number of Funds
in Fund Complex Overseen by Trustee | | Other Directorship(s) Held by Trustee During Past 5 Years |
| Independent Trustees–(continued) |
Joel W. Motley - 1952
Trustee | | 2019 | | Director of Office of Finance, Federal Home Loan Bank System; Member of the Vestry of Trinity Wall Street; Managing Director of Carmona Motley Inc. (privately held financial advisor); Member of the Council on Foreign Relations and its Finance and Budget Committee; Chairman Emeritus of Board of Human Rights Watch and Member of its Investment Committee; and Member of Investment Committee and Board of Historic Hudson Valley (non-profit cultural organization) Formerly: Managing Director of Public Capital Advisors, LLC (privately held financial advisor); Managing Director of Carmona Motley Hoffman, Inc. (privately held financial advisor); Trustee of certain Oppenheimer Funds; and Director of Columbia Equity Financial Corp. (privately held financial advisor) | | 203 | | Member of Board of Greenwall Foundation (bioethics research foundation) and its Investment Committee; Member of Board of Friends of the LRC (non-profit legal advocacy); Board Member and Investment Committee Member of Pulizer Center for Crisis Reporting (non-profit journalism) |
Teresa M. Ressel - 1962
Trustee | | 2017 | | Non-executive director and trustee of a number of public and private business corporations Formerly: Chief Financial Officer, Olayan America, The Olayan Group (international investor/commercial/industrial); Chief Executive Officer, UBS Securities LLC; Group Chief Operating Officer, Americas, UBS AG; Assistant Secretary for Management & Budget and CFO, US Department of the Treasury | | 203 | | Atlantic Power Corporation (power generation company); ON Semiconductor Corp. (semiconductor supplier) |
Ann Barnett Stern - 1957
Trustee | | 2017 | | President and Chief Executive Officer, Houston Endowment Inc. (private philanthropic institution) Formerly: Executive Vice President and General Counsel, Texas Children’s Hospital; Attorney, Beck, Redden and Secrest, LLP; Business Law Instructor, University of St. Thomas; Attorney, Andrews & Kurth LLP | | 203 | | Federal Reserve Bank of Dallas |
Robert C. Troccoli - 1949
Trustee | | 2016 | | Retired Formerly: Adjunct Professor, University of Denver – Daniels College of Business; Senior Partner, KPMG LLP | | 203 | | None |
Daniel S. Vandivort - 1954
Trustee | | 2019 | | Treasurer, Chairman of the Audit and Finance Committee, and Trustee, Board of Trustees, Huntington Disease Foundation of America; and President, Flyway Advisory Services LLC (consulting and property management) Formerly: Trustee and Governance Chair, of certain Oppenheimer Funds | | 203 | | Chairman and Lead Independent Director, Chairman of the Audit Committee, and Director, Board of Directors, Value Line Funds |
James D. Vaughn - 1945
Trustee | | 2019 | | Retired Formerly: Managing Partner, Deloitte & Touche LLP; Trustee and Chairman of the Audit Committee, Schroder Funds; Board Member, Mile High United Way, Boys and Girls Clubs, Boy Scouts, Colorado Business Committee for the Arts, Economic Club of Colorado and Metro Denver Network (economic development corporation); and Trustee of certain Oppenheimer Funds | | 203 | | Board member and Chairman of Audit Committee of AMG National Trust Bank; Trustee and Investment Committee member, University of South Dakota Foundation; Board member, Audit Committee Member and past Board Chair, Junior Achievement (non-profit) |
Christopher L. Wilson -
1957
Trustee, Vice Chair and
Chair Designate | | 2017 | | Retired Formerly: Director, TD Asset Management USA Inc. (mutual fund complex) (22 portfolios); Managing Partner, CT2, LLC (investing and consulting firm); President/Chief Executive Officer, Columbia Funds, Bank of America Corporation; President/Chief Executive Officer, CDC IXIS Asset Management Services, Inc.; Principal & Director of Operations, Scudder Funds, Scudder, Stevens & Clark, Inc.; Assistant Vice President, Fidelity Investments | | 203 | | ISO New England, Inc. (non-profit organization managing regional electricity market) |
T-4 Invesco Value Opportunities Fund
Trustees and Officers–(continued)
| | | | | | | | |
Name, Year of Birth and Position(s) Held with the Trust | | Trustee and/or Officer Since | | Principal Occupation(s) During Past 5 Years | | Number of Funds in Fund Complex Overseen by Trustee | | Other Directorship(s) Held by Trustee During Past 5 Years |
| Officers | | | | | | | | |
Sheri Morris - 1964
President, Principal Executive Officer and Treasurer | | 2003 | | Head of Global Fund Services, Invesco Ltd.; President, Principal Executive Officer and Treasurer, The Invesco Funds; Vice President, Invesco Advisers, Inc. (formerly known as Invesco Institutional (N.A.), Inc.) (registered investment adviser); and Vice President, Invesco Exchange-Traded Fund Trust, Invesco Exchange-Traded Fund Trust II, Invesco India Exchange-Traded Fund Trust, Invesco Actively Managed Exchange-Traded Fund Trust, Invesco Actively Managed Exchange-Traded Commodity Fund Trust and Invesco Exchange-Traded Self-Indexed Fund Trust; and Vice President, OppenheimerFunds, Inc. Formerly: Vice President and Principal Financial Officer, The Invesco Funds; Vice President, Invesco AIM Advisers, Inc., Invesco AIM Capital Management, Inc. and Invesco AIM Private Asset Management, Inc.; Assistant Vice President and Assistant Treasurer, The Invesco Funds and Assistant Vice President, Invesco Advisers, Inc., Invesco AIM Capital Management, Inc. and Invesco AIM Private Asset Management, Inc.; and Treasurer, Invesco Exchange-Traded Fund Trust, Invesco Exchange-Traded Fund Trust II, Invesco India Exchange-Traded Fund Trust and Invesco Actively Managed Exchange-Traded Fund Trust | | N/A | | N/A |
Russell C. Burk - 1958
Senior Vice President and Senior Officer | | 2005 | | Senior Vice President and Senior Officer, The Invesco Funds | | N/A | | N/A |
Jeffrey H. Kupor - 1968
Senior Vice President, Chief Legal Officer and Secretary | | 2018 | | Head of Legal of the Americas, Invesco Ltd.; Senior Vice President and Secretary, Invesco Advisers, Inc. (formerly known as Invesco Institutional (N.A.), Inc.) (registered investment adviser); Senior Vice President and Secretary, Invesco Distributors, Inc. (formerly known as Invesco AIM Distributors, Inc.); Vice President and Secretary, Invesco Investment Services, Inc. (formerly known as Invesco AIM Investment Services, Inc.) Senior Vice President, Chief Legal Officer and Secretary, The Invesco Funds; Secretary and General Counsel, Invesco Investment Advisers LLC (formerly known as Van Kampen Asset Management); Secretary and General Counsel, Invesco Capital Markets, Inc. (formerly known as Van Kampen Funds Inc.) and Chief Legal Officer, Invesco Exchange-Traded Fund Trust, Invesco Exchange-Traded Fund Trust II, Invesco India Exchange-Traded Fund Trust, Invesco Actively Managed Exchange-Traded Fund Trust, Invesco Actively Managed Exchange-Traded Commodity Fund Trust and Invesco Exchange-Traded Self-Indexed Fund Trust; Secretary, Invesco Indexing LLC; Secretary, W.L. Ross & Co., LLC Formerly: Secretary and Vice President, Jemstep, Inc.; Head of Legal, Worldwide Institutional, Invesco Ltd.; Secretary and General Counsel, INVESCO Private Capital Investments, Inc.; Senior Vice President, Secretary and General Counsel, Invesco Management Group, Inc. (formerly known as Invesco AIM Management Group, Inc.); Assistant Secretary, INVESCO Asset Management (Bermuda) Ltd.; Secretary and General Counsel, Invesco Private Capital, Inc.; Assistant Secretary and General Counsel, INVESCO Realty, Inc.; Secretary and General Counsel, Invesco Senior Secured Management, Inc.; and Secretary, Sovereign G./P. Holdings Inc. | | N/A | | N/A |
Andrew R. Schlossberg - 1974
Senior Vice President | | 2019 | | Head of the Americas and Senior Managing Director, Invesco Ltd.; Director and Senior Vice President, Invesco Advisers, Inc. (formerly known as Invesco Institutional (N.A.), Inc.) (registered investment adviser); Director and Chairman, Invesco Investment Services, Inc. (formerly known as Invesco AIM Investment Services, Inc.) (registered transfer agent); Senior Vice President, The Invesco Funds; Director, Invesco Investment Advisers LLC (formerly known as Van Kampen Asset Management); Director, President and Chairman, Invesco Insurance Agency, Inc. Formerly: Director, Invesco UK Limited; Director and Chief Executive, Invesco Asset Management Limited and Invesco Fund Managers Limited; Assistant Vice President, The Invesco Funds; Senior Vice President, Invesco Advisers, Inc. (formerly known as Invesco Institutional (N.A.), Inc.) (registered investment adviser); Director and Chief Executive, Invesco Administration Services Limited and Invesco Global Investment Funds Limited; Director, Invesco Distributors, Inc.; Head of EMEA, Invesco Ltd.; President, Invesco Actively Managed Exchange-Traded Commodity Fund Trust, Invesco Actively Managed Exchange-Traded Fund Trust, Invesco Exchange-Traded Fund Trust, Invesco Exchange-Traded Fund Trust II and Invesco India Exchange-Traded Fund Trust; Managing Director and Principal Executive Officer, Invesco Capital Management LLC | | N/A | | N/A |
T-5 Invesco Value Opportunities Fund
Trustees and Officers–(continued)
| | | | | | | | | | | | |
Name, Year of Birth and Position(s) Held with the Trust | | Trustee and/or Officer Since | | Principal Occupation(s) During Past 5 Years | | | | | Number of Funds in Fund Complex Overseen by Trustee | | Other Directorship(s) Held by Trustee During Past 5 Years |
| Officers–(continued) | | | | | | | | | | | | |
John M. Zerr - 1962
Senior Vice President | | 2006 | | Chief Operating Officer of the Americas; Senior Vice President, Invesco Advisers, Inc. (formerly known as Invesco Institutional (N.A.), Inc.) (registered investment adviser); Senior Vice President, Invesco Distributors, Inc. (formerly known as Invesco AIM Distributors, Inc.); Director and Vice President, Invesco Investment Services, Inc. (formerly known as Invesco AIM Investment Services, Inc.) Senior Vice President, The Invesco Funds; Managing Director, Invesco Capital Management LLC; Director, Invesco Investment Advisers LLC (formerly known as Van Kampen Asset Management); Senior Vice President, Invesco Capital Markets, Inc. (formerly known as Van Kampen Funds Inc.); Manager, Invesco Indexing LLC; Manager, Invesco Specialized Products, LLC; Director and Senior Vice President, Invesco Insurance Agency, Inc.; Member, Invesco Canada Funds Advisory Board; Director, President and Chief Executive Officer, Invesco Corporate Class Inc. (corporate mutual fund company); and Director, Chairman, President and Chief Executive Officer, Invesco Canada Ltd. (formerly known as Invesco Trimark Ltd./Invesco Trimark Ltèe) (registered investment adviser and registered transfer agent); President, Invesco, Inc.; President, Invesco Global Direct Real Estate Feeder GP Ltd.; President, Invesco IP Holdings(Canada) Ltd; President, Invesco Global Direct Real Estate GP Ltd.; President, Invesco Financial Services Ltd. / Services Financiers Invesco Ltée; and President, Trimark Investments Ltd./Placements Trimark Ltée Formerly: Director and Senior Vice President, Invesco Management Group, Inc. (formerly known as Invesco AIM Management Group, Inc.); Secretary and General Counsel, Invesco Management Group, Inc. (formerly known as Invesco AIM Management Group, Inc.); Secretary, Invesco Investment Services, Inc. (formerly known as Invesco AIM Investment Services, Inc.); Chief Legal Officer and Secretary, The Invesco Funds; Secretary and General Counsel, Invesco Investment Advisers LLC (formerly known as Van Kampen Asset Management); Secretary and General Counsel, Invesco Capital Markets, Inc. (formerly known as Van Kampen Funds Inc.); Chief Legal Officer, Invesco Exchange-Traded Fund Trust, Invesco Exchange-Traded Fund Trust II, Invesco India Exchange-Traded Fund Trust, Invesco Actively Managed Exchange-Traded Fund Trust, Invesco Actively Managed Exchange-Traded Commodity Fund Trust and Invesco Exchange-Traded Self-Indexed Fund Trust; Secretary, Invesco Indexing LLC; Director, Secretary, General Counsel and Senior Vice President, Van Kampen Exchange Corp.; Director, Vice President and Secretary, IVZ Distributors, Inc. (formerly known as INVESCO Distributors, Inc.); Director and Vice President, INVESCO Funds Group, Inc.; Director and Vice President, Van Kampen Advisors Inc.; Director, Vice President, Secretary and General Counsel, Van Kampen Investor Services Inc.;Director and Secretary, Invesco Distributors, Inc. (formerly known as Invesco AIM Distributors, Inc.); Director, Senior Vice President, General Counsel and Secretary, Invesco AIM Advisers, Inc. and Van Kampen Investments Inc.; Director, Vice President and Secretary, Fund Management Company; Director, Senior Vice President, Secretary, General Counsel and Vice President, Invesco AIM Capital Management, Inc.; Chief Operating Officer and General Counsel, Liberty Ridge Capital, Inc. (an investment adviser) | | | | | | N/A | | N/A |
Gregory G. McGreevey - 1962
Senior Vice President | | 2012 | | Senior Managing Director, Invesco Ltd.; Director, Chairman, President, and Chief Executive Officer, Invesco Advisers, Inc. (formerly known as Invesco Institutional (N.A.), Inc.) (registered investment adviser); Director, Invesco Mortgage Capital, Inc. and Invesco Senior Secured Management, Inc.; and Senior Vice President, The Invesco Funds; and President, SNW Asset Management Corporation and Invesco Managed Accounts, LLC Formerly: Senior Vice President, Invesco Management Group, Inc. and Invesco Advisers, Inc.; Assistant Vice President, The Invesco Funds | | | | | | N/A | | N/A |
Kelli Gallegos - 1970
Vice President, Principal Financial Officer and Assistant Treasurer | | 2008 | | Principal Financial and Accounting Officer – Investments Pool, Invesco Specialized Products, LLC; Vice President, Principal Financial Officer and Assistant Treasurer, The Invesco Funds; Principal Financial and Accounting Officer – Pooled Investments, Invesco Capital Management LLC; Vice President and Treasurer, Invesco Exchange-Traded Fund Trust, Invesco Exchange-Traded Fund Trust II, Invesco India Exchange-Traded Fund Trust, Invesco Actively Managed Exchange-Traded Fund Trust, Invesco Actively Managed Exchange-Traded Commodity Fund Trust and Invesco Exchange-Traded Self-Indexed Fund Trust; Vice President, Invesco Advisers, Inc. Formerly: Assistant Treasurer, Invesco Specialized Products, LLC; Assistant Treasurer, Invesco Exchange-Traded Fund Trust, Invesco Exchange-Traded Fund Trust II, Invesco India Exchange-Traded Fund Trust, Invesco Actively Managed Exchange-Traded Fund Trust, Invesco Actively Managed Exchange-Traded Commodity Fund Trust and Invesco Exchange-Traded Self-Indexed Fund Trust; Assistant Treasurer, Invesco Capital Management LLC; Assistant Vice President, The Invesco Funds | | | | | | N/A | | N/A |
T-6 Invesco Value Opportunities Fund
Trustees and Officers–(continued)
| | | | | | | | |
Name, Year of Birth and Position(s) Held with the Trust | | Trustee and/or Officer Since | | Principal Occupation(s) During Past 5 Years | | Number of Funds
in Fund Complex Overseen by Trustee | | Other Directorship(s) Held by Trustee During Past 5 Years |
| Officers—(continued) | | | | | | | | |
Crissie M. Wisdom - 1969 Anti-Money Laundering Compliance Officer | | 2013 | | Anti-Money Laundering and OFAC Compliance Officer for Invesco U.S. entities including: Invesco Advisers, Inc. and its affiliates, Invesco Capital Markets, Inc., Invesco Distributors, Inc., Invesco Investment Services, Inc., The Invesco Funds, Invesco Capital Management, LLC, Invesco Trust Company; OppenheimerFunds Distributor, Inc., and Fraud Prevention Manager for Invesco Investment Services, Inc. | | N/A | | N/A |
Todd F. Kuehl - 1969 Chief Compliance Officer | | 2020 | | Chief Compliance Officer, Invesco Advisers, Inc. (registered investment adviser); and Chief Compliance Officer, The Invesco Funds Formerly: Managing Director and Chief Compliance Officer, Legg Mason (Mutual Funds);Chief Compliance Officer, Legg Mason Private Portfolio Group (registered investment adviser) | | N/A | | N/A |
The Statement of Additional Information of the Trust includes additional information about the Fund’s Trustees and is available upon request, without charge, by calling 1.800.959.4246. Please refer to the Fund’s Statement of Additional Information for information on the Fund’s sub-advisers.
| | | | | | |
| Office of the Fund | | Investment Adviser | | Distributor | | Auditors |
11 Greenway Plaza, Suite 1000 Houston, TX 77046-1173 | | Invesco Advisers, Inc. 1555 Peachtree Street, N.E. Atlanta, GA 30309 | | Invesco Distributors, Inc. 11 Greenway Plaza, Suite 1000 Houston, TX 77046-1173 | | PricewaterhouseCoopers LLP 1000 Louisiana Street, Suite 5800 Houston, TX 77002-5678 |
| | | |
| Counsel to the Fund | | Counsel to the Independent Trustees | | Transfer Agent | | Custodian |
Stradley Ronon Stevens & Young, LLP 2005 Market Street, Suite 2600 Philadelphia, PA 19103-7018 | | Goodwin Procter LLP 901 New York Avenue, N.W. Washington, D.C. 20001 | | Invesco Investment Services, Inc. 11 Greenway Plaza, Suite 1000 Houston, TX 77046-1173 | | State Street Bank and Trust Company 225 Franklin Street Boston, MA 02110-2801 |
T-7 Invesco Value Opportunities Fund

Go paperless with eDelivery
Visit invesco.com/edelivery to enjoy the convenience and security of anytime electronic access to your investment documents.
With eDelivery, you can elect to have any or all of the following materials delivered straight to your inbox to download, save and print from your own computer:
∎ Fund reports and prospectuses
∎ Quarterly statements
∎ Daily confirmations
∎ Tax forms
Invesco mailing information
Send general correspondence to Invesco Investment Services, Inc., P.O. Box 219078, Kansas City, MO 64121-9078.
Important notice regarding delivery of security holder documents
To reduce Fund expenses, only one copy of most shareholder documents may be mailed to shareholders with multiple accounts at the same address (Householding). Mailing of your shareholder documents may be householded indefinitely unless you instruct us otherwise. If you do not want the mailing of these documents to be combined with those for other members of your household, please contact Invesco Investment Services, Inc. at 800 959 4246 or contact your financial institution. We will begin sending you individual copies for each account within 30 days after receiving your request.
Fund holdings and proxy voting information
The Fund provides a complete list of its holdings four times in each fiscal year, at the quarter-ends. For the second and fourth quarters, the list appears in the Fund’s semiannual and annual reports to shareholders. For the first and third quarters, the Fund files the lists with the Securities and Exchange Commission (SEC) as an exhibit to its reports on Form N-PORT. The most recent list of portfolio holdings is available at invesco.com/completeqtrholdings. Shareholders can also look up the Fund’s Form N-PORT filings on the SEC website, sec.gov. The SEC file numbers for the Fund are shown below.
A description of the policies and procedures that the Fund uses to determine how to vote proxies relating to portfolio securities is available without charge, upon request, from our Client Services department at 800 959 4246, or at invesco.com/ proxyguidelines. The information is also available on the SEC website, sec.gov.
| | |
Information regarding how the Fund voted proxies related to its portfolio securities during the most recent 12-month period ended June 30 is available at invesco.com/proxysearch. This information is also available on the SEC website, sec.gov. Invesco Advisers, Inc. is an investment adviser; it provides investment advisory services to individual and institutional clients and does not sell securities. Invesco Distributors, Inc. is the US distributor for Invesco Ltd.’s retail mutual funds, exchange-traded funds and institutional money market funds. Both are wholly owned, indirect subsidiaries of Invesco Ltd. | | 
|
| | | | |
| SEC file numbers: 811-03826 and 002-85905 | | Invesco Distributors, Inc. | | VK-VOPP-AR-1 |
| | |
 | | Shareholder Report for the Six Months Ended 4/30/2020 |
| | Invesco Comstock Select Fund* Beginning on January 1, 2021, as permitted by regulations adopted by the Securities and Exchange Commission, paper copies of the Fund’s shareholder reports will no longer be sent by mail, unless you specifically request paper copies of the reports from the Fund or from your financial intermediary, such as a broker-dealer or bank. Instead, the reports will be made available on the Fund’s website, and you will be notified by mail each time a report is posted and provided with a website link to access the report. If you already elected to receive shareholder reports electronically, you will not be affected by this change and you need not take any action. You may elect to receive shareholder reports and other communications from the Fund electronically by contacting your financial intermediary (such as a broker-dealer or bank) or, if you are a direct investor, by enrolling at invesco.com/edelivery. You may elect to receive all future reports in paper free of charge. If you invest through a financial intermediary, you can contact your financial intermediary to request that you continue to receive paper copies of your shareholder reports. If you invest directly with the Fund, you can call 800 959 4246 to let the Fund know you wish to continue receiving paper copies of your shareholder reports. Your election to receive reports in paper will apply to all funds held with your financial intermediary or all funds held with the fund complex if you invest directly with the Fund. *Prior to the close of business on February 28, 2020, the Fund’s name was Invesco Oppenheimer Value Fund. |
Table of Contents
Class A Shares
AVERAGE ANNUAL TOTAL RETURNS AT 4/30/2020
| | | | | | | | | | | | | | | |
| | | Class A Shares of the Fund | | |
| | | Without Sales Charge | | With Sales Charge | | Russell 1000 Value
Index |
| 1-Year | | | | -17.26% | | | | | -21.80% | | | | | -11.01% | |
| 5-Year | | | | 1.05 | | | | | -0.08 | | | | | 3.90 | |
| 10-Year | | | | 5.96 | | | | | 5.36 | | | | | 8.54 | |
Performance quoted is past performance and cannot guarantee future results; current performance may be lower or higher. Visit invesco.com for the most recent month-end performance. Performance figures reflect reinvested distributions and changes in net asset value (NAV). Investment return and principal value will vary so that you may have a gain or a loss when you sell shares. Fund returns include changes in share price, reinvested distributions and a 5.50% maximum applicable sales charge except where “without sales charge” is indicated. Returns for periods of less than one year are cumulative and not annualized. As the result of a reorganization after the close of business on May 24, 2019, the returns of the Fund for periods on or prior to May 24, 2019 reflect performance of the Oppenheimer predecessor fund. Share class returns will differ from those of the predecessor fund because they have different expenses. Returns do not consider capital gains or income taxes on an individual’s investment. See Fund prospectus and summary prospectus for more information on share classes, sales charges and new fee agreements, if any. Fund literature is available at invesco.com.
2 INVESCO COMSTOCK SELECT FUND
Fund Performance Discussion
PERFORMANCE SUMMARY
The Fund’s Class A shares (without sales charge) returned -19.00% during the 6-month reporting period, underperforming the Russell 1000 Value Index, the Fund’s benchmark (the “Index”), which returned -13.66%. The fiscal year end for the Fund was changed to April 30, 2020.
MARKET CONDITIONS AND YOUR FUND
Although the S&P 500 Index, considered representative of the US stock market, posted modest gains for the second quarter of 2019, US equities experienced increased volatility. After four consecutive months of rising stock prices, markets sold off in May 2019, along with bond yields and oil prices, as investors weighed the impact of the lingering trade war between the US and China, as well as potential tariffs imposed on Mexico. In addition, economic data showed a slowing domestic and global economy.
Key issues that concerned investors in the second quarter of 2019 carried over into the third quarter. The US-China trade conflict worried investors and stifled business investment, even as the US Federal Reserve (the Fed) cut interest rates by 0.25% in July and again in September 2019.1 This environment, combined with evidence of slowing global economic growth, fueled market volatility in August 2019. The US Treasury yield curve inverted several times, increasing fears of a possible US recession.
COMPARISON OF CHANGE IN VALUE OF $10,000 HYPOTHETICAL INVESTMENTS IN:
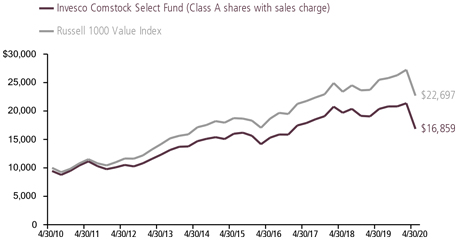
3 INVESCO COMSTOCK SELECT FUND
As a result, August saw increased risk aversion, with investors crowding into asset classes perceived as safe havens, such as US Treasuries and gold. However, the Fed’s accommodative tone provided some support for risk assets.
Macroeconomic issues that concerned investors in the third quarter of 2019 mostly abated during the fourth quarter, providing the backdrop for strong equity market returns. The US economy rose higher than expected, at 2.1% during the third quarter of 2019.2 During its October meeting, the Fed cut interest rates again by 0.25% based on business investment and exports remaining weak.1 Investors were also encouraged by a resilient US economy and corporate earnings, putting the US equity market on track for its largest annual rise since 2013.
During the first quarter of 2020, as the spread of the new coronavirus (“COVID-19”) disrupted travel and suppressed consumer activity, investors became increasingly concerned about the global economy. At the same time, oil prices fell sharply as a price war between Saudi Arabia and Russia threatened to boost supply even as demand was falling. Beginning in late February, equity markets declined sharply and quickly, ushering in the first bear market since the financial crisis of 2008. Though the equity market stabilized somewhat toward the end of March, all sectors declined during the downturn. Cyclical sectors, where company performance tends to be closely linked to macroeconomic changes in the business cycle, were the hardest hit. As
expected, the US economy reported dismal numbers. At the close of the fiscal year in April, US unemployment numbers continued to climb, with over 30 million Americans seeking unemployment benefits since March 2020.3 In addition, the initial gross domestic product estimates for the first quarter of 2020 saw the economy shrink by 4.8%, the sharpest drop since the 2008 financial crisis.2
On the positive side, stock selection within the information technology sector was the largest driver of the Fund’s performance relative to the style-specific benchmark for the fiscal year. Most notably, Microsoft was a top performer within the sector. The company beat earnings estimates in multiple quarters and provided strong guidance. Microsoft has benefited from predictable growth in its cloud business and Azure, as well as sustained demand for Office 365.
Having almost no exposure to real estate also boosted relative returns. Real estate underperformed most sectors, with underperformance mostly driven during the first quarter of 2020.
Cash also assisted relative returns, as would be expected in a negative equity market environment.
On the negative side, stock selection in and overweight exposure to the energy sector was the largest detractor to relative performance. Marathon Oil, Suncor Energy and BP were large detractors on a relative and absolute basis. The energy sector was the worst
4 INVESCO COMSTOCK SELECT FUND
performing sector for the period, as oil prices experienced an unprecedented “double black swan event” with Saudi Arabia and Russia increasing oil supply to gain market share and global demand for oil falling sharply due to the COVID-19 virus. We believe COVID-19 effects should ease, allowing business activity to resume, which should support demand. With respect to supply, oil prices aren’t sustainable at current levels, but we believe it may be many months before the imbalance is corrected. We continue to focus on balance sheets and debt levels for the Fund’s energy holdings.
Stock selection in the consumer discretionary sector also detracted from relative performance. Carnival, a large cruise operator, was a notable detractor as the cruise industry was hit particularly hard by the coronavirus outbreak due to lack of demand for bookings. We sold the position in the stock due to what we perceived to be weak guidance from management for demand going forward, as well as concern for the debt level and lack of revenues.
Financials also hampered relative Fund performance for the period. The precipitous decline in interest rates during the height of the COVID-19 pandemic, from already low levels, weighed heavily on the financials sector. As a result, many bank stocks were trading at valuations last seen at the depth of the 2008 financial crisis. This is despite sweeping changes since that period, such as improved balance sheets, lower leverage and solid capital positions. Given these changes,
we believe banks have rarely been better positioned to withstand a crisis and thus offer compelling value at current valuations.
As of period-end, the Fund had a cyclical bias with overweight exposures in financial, energy and industrial companies relative to its benchmark. The Fund was also overweight technology stocks. Conversely, the Fund was underweight real estate, utilities, communication services, consumer staples and health care relative to its benchmark.
Based on history and our experience, we believe a shift toward value stocks lies on the other side of this fear, momentum and growth-driven market environment. When we are faced with situations such as the current environment, our discipline is to be opportunistic by depending heavily on fundamentals, demanding a deep discount to intrinsic value and maintaining a long-term view.
Thank you for your investment in Invesco Comstock Select Fund and for sharing our long-term investment horizon.
1 Source: US Federal Reserve
2 Source: US Bureau of Economic Analysis
3 Source: The Associated Press
Portfolio Managers: Kevin Holt, Devin Armstrong, Charles DyReyes, James Warwick
5 INVESCO COMSTOCK SELECT FUND
Top Holdings and Allocations
TOP TEN COMMON STOCK HOLDINGS
| | | | |
| Citigroup, Inc. | | | 8.2% | |
| Philip Morris International, Inc. | | | 5.6 | |
| Morgan Stanley | | | 5.1 | |
| AT&T, Inc. | | | 5.0 | |
| Bank of America Corp. | | | 4.3 | |
| Anthem, Inc. | | | 4.2 | |
| Chevron Corp. | | | 4.2 | |
| Microsoft Corp. | | | 3.9 | |
| Intel Corp. | | | 3.9 | |
| QUALCOMM, Inc. | | | 3.7 | |
Holdings and allocations are subject to change and are not buy/sell recommendations. Percentages are as of April 30, 2020, and are based on net assets.
TOP TEN COMMON STOCK INDUSTRIES
| | | | |
| Oil, Gas & Consumable Fuels | | | 15.5% | |
| Commercial Banks | | | 14.5 | |
| Capital Markets | | | 11.0 | |
| Health Care Providers & Services | | | 8.1 | |
| Semiconductors & Semiconductor Equipment | | | 7.6 | |
| Tobacco | | | 5.6 | |
| Pharmaceuticals | | | 5.3 | |
| Diversified Telecommunication Services | | | 5.0 | |
| Software | | | 3.9 | |
| Electrical Equipment | | | 3.8 | |
Holdings and allocations are subject to change and are not buy/sell recommendations. Percentages are as of April 30, 2020, and are based on net assets.
SECTOR ALLOCATION
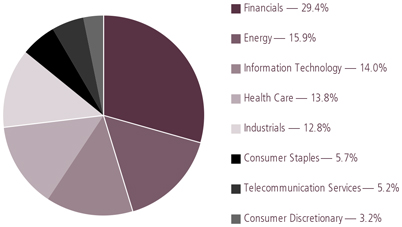
Holdings and allocations are subject to change and are not buy/sell recommendations. Percentages are as of April 30, 2020 and are based on total market value of investments.
For more current Fund holdings, please visit invesco.com.
6 INVESCO COMSTOCK SELECT FUND
Share Class Performance
AVERAGE ANNUAL TOTAL RETURNS WITHOUT SALES CHARGE AS OF 4/30/20
| | | | | | | | |
| | | Inception
Date | | 1-Year | | 5-Year | | 10-Year |
Class A (CGRWX) | | 9/16/85 | | -17.26% | | 1.05% | | 5.96% |
Class C (CGRCX) | | 5/1/96 | | -17.88 | | 0.30 | | 5.17 |
Class R (CGRNX) | | 3/1/01 | | -17.46 | | 0.80 | | 5.69 |
Class Y (CGRYX) | | 12/16/96 | | -17.09 | | 1.29 | | 6.28 |
Class R5 (IOVVX)1 | | 5/24/19 | | -17.00 | | 1.12 | | 5.99 |
Class R6 (OGRIX)2 | | 2/28/12 | | -16.97 | | 1.47 | | 6.453 |
AVERAGE ANNUAL TOTAL RETURNS WITH SALES CHARGE AS OF 4/30/20
| | | | | | | | |
| | | Inception
Date | | 1-Year | | 5-Year | | 10-Year |
Class A (CGRWX) | | 9/16/85 | | -21.80% | | -0.08% | | 5.36% |
Class C (CGRCX) | | 5/1/96 | | -18.51 | | 0.30 | | 5.17 |
Class R (CGRNX) | | 3/1/01 | | -17.46 | | 0.80 | | 5.69 |
Class Y (CGRYX) | | 12/16/96 | | -17.09 | | 1.29 | | 6.28 |
Class R5 (IOVVX)1 | | 5/24/19 | | -17.00 | | 1.12 | | 5.99 |
Class R6 (OGRIX)2 | | 2/28/12 | | -16.97 | | 1.47 | | 6.453 |
1. Class R5 shares’ performance shown prior to the inception date is that of the predecessor fund’s Class A shares at net asset value (NAV) and includes the 12b-1 fees applicable to Class A shares. Class A shares’ performance reflects any applicable fee waivers and/or expense reimbursements.
2. After the close of business on May 24, 2019, Class I shares were reorganized as Class R6 shares.
3. Shows performance since inception.
Performance quoted is past performance and cannot guarantee future results; current performance may be lower or higher. Visit invesco.com for the most recent month-end performance. Performance figures reflect reinvested distributions and changes in net asset value (NAV). Investment return and principal value will vary so that you may have a gain or a loss when you sell shares. Performance shown at NAV does not include the applicable front-end sales charge, which would have reduced the performance. The current maximum initial sales charge for Class A shares is 5.50%, and the contingent deferred sales charge for Class C shares is 1% for the 1-year period. Class R, Class Y, Class R5 and Class R6 shares have no sales charge; therefore, performance is at NAV. Effective after the close of business on May 24, 2019, Class A, Class C, Class R, Class Y, and Class I shares of the predecessor fund were reorganized into Class A, Class C, Class R, Class Y and Class R6 shares respectively, of the Fund. Class R5 shares’ performance shown prior to the inception date is that of the predecessor fund’s Class A shares at NAV and includes the 12b-1 fees applicable to Class A shares. Class A shares’ performance reflects any applicable fee waivers and/or expense reimbursements. Returns shown for Class A, Class C, Class R, Class Y, Class R6 shares are blended returns of the predecessor fund and the Fund. Share class returns will differ from those of the predecessor fund because of different expenses. See Fund prospectus and summary prospectus for more information on share classes, sales charges and new fee agreements, if any. Fund literature is available at invesco.com.
7 INVESCO COMSTOCK SELECT FUND
The Fund’s performance is compared to the performance of the Russell 1000 Value Index. The Russell 1000 Value Index measures the performance of the large-cap value segment of the U.S. equity universe. It includes those Russell 1000 companies with lower price-to-book ratios and lower expected growth values. The Index is unmanaged and cannot be purchased directly by investors. While index comparisons may be useful to provide a benchmark for the Fund’s performance, it must be noted that the Fund’s investments are not limited to the investments comprising the Index. Index performance includes reinvestment of income, but does not reflect transaction costs, fees, expenses or taxes. Index performance is shown for illustrative purposes only as a benchmark for the Fund’s performance, and does not predict or depict performance of the Fund. The Fund’s performance reflects the effects of the Fund’s business and operating expenses.
Liquidity Risk Management Program
The Securities and Exchange Commission has adopted Rule 22e-4 under the Investment Company Act of 1940 (the “Liquidity Rule”) in order to promote effective liquidity risk management throughout the open-end investment company industry, thereby reducing the risk that funds will be unable to meet their redemption obligations and mitigating dilution of the interests of fund shareholders. The Fund has adopted and implemented a liquidity risk management program in accordance with the Liquidity Rule (the “Program”). The Program is reasonably designed to assess and manage the Fund’s liquidity risk, which is the risk that the Fund could not meet redemption requests without significant dilution of remaining investors’ interests in the Fund. The Board of Trustees of the Fund (the “Board”) has appointed Invesco Advisers, Inc. (“Invesco”), the Fund’s investment adviser, as the Program’s administrator, and Invesco has delegated oversight of the Program to the Liquidity Risk Management Committee (the “Committee”), which is composed of senior representatives from relevant business groups at Invesco.
As required by the Liquidity Rule, the Program includes policies and procedures providing for an assessment, no less frequently than annually, of the Fund’s liquidity risk that takes into account, as relevant to the Fund’s liquidity risk: (1) the Fund’s investment strategy and liquidity of portfolio investments during both normal and reasonably foreseeable stressed conditions; (2) short-term and long-term cash flow projections for the Fund during both normal and reasonably foreseeable stressed conditions; and (3) the Fund’s holdings of cash and cash equivalents and any borrowing arrangements. The Liquidity Rule also requires the classification of the Fund’s investments into categories that reflect the assessment of their relative liquidity under current market conditions. The Fund classifies its investments into one of four categories defined in the Liquidity Rule: “Highly Liquid,” “Moderately Liquid,” “Less Liquid” and “Illiquid.” Funds that are not invested primarily in “Highly Liquid Investments” that are assets (cash or investments that are reasonably expected to be convertible into cash within three business days without significantly changing the market value of the investment) are required to establish a “Highly Liquid Investment Minimum” (“HLIM”), which is the minimum percentage of net assets that must be invested in Highly Liquid Investments. Funds with HLIMs have procedures for addressing HLIM shortfalls, including reporting to the Board and the SEC (on a non-public basis) as required by the Program and the Liquidity Rule. In addition, the Fund may not acquire an investment if, immediately after the acquisition, over 15% of the Fund’s net assets would consist of “Illiquid Investments” that are assets (an investment that cannot reasonably be expected to be sold or disposed of in current market conditions in seven calendar days or less without the sale or disposition significantly changing the market value of the investment). The Liquidity Rule and the Program also require reporting
8 INVESCO COMSTOCK SELECT FUND
to the Board and the SEC (on a non-public basis) if a Fund’s holdings of Illiquid Investments exceed 15% of the Fund’s assets.
At a meeting held on March 30-April 1, 2020, the Committee presented a report to the Board that addressed the operation of the Program and assessed the Program’s adequacy and effectiveness of implementation (the “Report”). The Report covered the period from December 1, 2018 through December 31, 2019 (the “Program Reporting Period”).
The Report stated, in relevant part, that during the Program Reporting Period:
| | ● | | The Program, as adopted and implemented, remained reasonably designed to assess and manage the Fund’s liquidity risk and was operated effectively to achieve that goal; |
| | ● | | The Fund’s investment strategy remained appropriate for an open-end fund; |
| | ● | | The Fund was able to meet requests for redemption without significant dilution of remaining investors’ interests in the Fund; |
| | ● | | The Fund did not breach the 15% limit on Illiquid Investments; and |
| | ● | | The Fund primarily held Highly Liquid Investments and therefore has not adopted an HLIM. |
The views and opinions expressed in management’s discussion of Fund performance are those of Invesco Advisers, Inc. These views and opinions are subject to change at any time based on factors such as market and economic conditions. These views and opinions may not be relied upon as investment advice or recommendations, or as an offer for a particular security. The information is not a complete analysis of every aspect of any market, country, industry, security or the Fund. Statements of fact are from sources considered reliable, but Invesco Advisers, Inc. makes no representation or warranty as to their completeness or accuracy. Although historical performance is no guarantee of future results, these insights may help you understand our investment management philosophy.
Before investing, investors should carefully read the prospectus and/or summary prospectus and carefully consider the investment objectives, risks, charges and expenses. For this and more complete information about the fund(s), investors should ask their advisors for a prospectus/summary prospectus or visit invesco.com/fundprospectus.
Shares of Invesco funds are not deposits or obligations of any bank, are not guaranteed by any bank, are not insured by the FDIC or any other agency, and involve investment risks, including the possible loss of the principal amount invested.
9 INVESCO COMSTOCK SELECT FUND
Fund Expenses
Fund Expenses. As a shareholder of the Fund, you incur two types of costs: (1) transaction costs, which may include sales charges (loads) on purchase payments and/or contingent deferred sales charges on redemptions; and (2) ongoing costs, including management fees; distribution and service fees; and other Fund expenses. These examples are intended to help you understand your ongoing costs (in dollars) of investing in the Fund and to compare these costs with the ongoing costs of investing in other mutual funds.
The examples are based on an investment of $1,000.00 invested at the beginning of the period and held for the entire 6-month period ended April 30, 2020.
Actual Expenses. The first section of the table provides information about actual account values and actual expenses. You may use the information in this section for the class of shares you hold, together with the amount you invested, to estimate the expense that you paid over the period. Simply divide your account value by $1,000.00 (for example, an $8,600.00 account value divided by $1,000.00 = 8.60), then multiply the result by the number in the first section under the heading entitled “Expenses Paid During 6 Months Ended April 30, 2020” to estimate the expenses you paid on your account during this period.
Hypothetical Example for Comparison Purposes. The second section of the table provides information about hypothetical account values and hypothetical expenses based on the Fund’s actual expense ratio for each class of shares, and an assumed rate of return of 5% per year for each class before expenses, which is not the Fund’s actual return. The hypothetical account values and expenses may not be used to estimate the actual ending account balance or expenses you paid for the period. You may use this information to compare the ongoing costs of investing in the Fund and other funds. To do so, compare this 5% hypothetical example for the class of shares you hold with the 5% hypothetical examples that appear in the shareholder reports of the other funds.
Please note that the expenses shown in the table are meant to highlight your ongoing costs only and do not reflect any transactional costs, such as front-end or contingent deferred sales charges (loads). Therefore, the “hypothetical” section of the table is useful in comparing ongoing costs only, and will not help you determine the relative total costs of owning different funds. In addition, if these transactional costs were included, your costs would have been higher.
10 INVESCO COMSTOCK SELECT FUND
| | | | | | | | | | | | | | | |
| Actual | | Beginning
Account
Value
November 1, 2019 | | Ending
Account
Value
April 30, 2020 | | Expenses
Paid During
6 Months Ended
April 30, 2020 |
Class A | | | $ | 1,000.00 | | | | $ | 810.00 | | | | $ | 4.20 | |
Class C | | | | 1,000.00 | | | | | 807.10 | | | | | 7.58 | |
Class R | | | | 1,000.00 | | | | | 808.90 | | | | | 5.32 | |
Class Y | | | | 1,000.00 | | | | | 810.50 | | | | | 3.07 | |
Class R5 | | | | 1,000.00 | | | | | 811.20 | | | | | 2.57 | |
Class R6 | | | | 1,000.00 | | | | | 811.20 | | | | | 2.35 | |
| | | |
Hypothetical | | | | | | | | | | | | | | | |
(5% return before expenses) | | | | | | | | | | | | | | | |
Class A | | | | 1,000.00 | | | | | 1,020.24 | | | | | 4.68 | |
Class C | | | | 1,000.00 | | | | | 1,016.51 | | | | | 8.46 | |
Class R | | | | 1,000.00 | | | | | 1,019.00 | | | | | 5.94 | |
Class Y | | | | 1,000.00 | | | | | 1,021.48 | | | | | 3.42 | |
Class R5 | | | | 1,000.00 | | | | | 1,022.03 | | | | | 2.87 | |
Class R6 | | | | 1,000.00 | | | | | 1,022.28 | | | | | 2.62 | |
Expenses are equal to the Fund’s annualized expense ratio for that class, multiplied by the average account value over the period, multiplied by 182/366 (to reflect the one-half year period). Those annualized expense ratios, excluding indirect expenses from affiliated funds, based on the 6-month period ended April 30, 2020 are as follows:
| | | | |
| Class | | Expense Ratios | |
| Class A | | | 0.93 | % |
| Class C | | | 1.68 | |
| Class R | | | 1.18 | |
| Class Y | | | 0.68 | |
| Class R5 | | | 0.57 | |
| Class R6 | | | 0.52 | |
The expense ratios reflect voluntary and/or contractual waivers and/or reimbursements of expenses by the Fund’s Adviser. Some of these undertakings may be modified or terminated at any time, as indicated in the Fund’s prospectus. The “Financial Highlights” tables in the Fund’s financial statements, included in this report, also show the gross expense ratios, without such waivers or reimbursements and reduction to custodian expenses, if applicable.
11 INVESCO COMSTOCK SELECT FUND
SCHEDULE OF INVESTMENTS April 30, 2020
| | | | | | | | |
| | | Shares | | | Value | |
Common Stocks—97.1% | | | | | | | | |
Consumer Discretionary—3.0% | | | | | | | | |
Automobiles—3.0% | | | | | | | | |
General Motors Co. | | | 1,262,378 | | | $ | 28,138,406 | |
Consumer Staples—5.6% | | | | | | | | |
Tobacco—5.6% | | | | | | | | |
Philip Morris | | | | | | | | |
International, Inc. | | | 686,529 | | | | 51,215,063 | |
Energy—15.5% | | | | | | | | |
Oil, Gas & Consumable Fuels—15.5% | | | | | | | | |
BP plc | | | 5,828,042 | | | | 23,012,961 | |
Chevron Corp. | | | 416,385 | | | | 38,307,420 | |
Marathon Oil Corp. | | | 5,043,995 | | | | 30,869,250 | |
Noble Energy, Inc. | | | 2,892,049 | | | | 28,371,001 | |
Suncor Energy, Inc. | | | 1,200,358 | | | | 21,426,390 | |
| | | | | | | 141,987,022 | |
| | | | | | | | |
Financials—28.5% | | | | | | | | |
Capital Markets—11.0% | | | | | | | | |
Bank of New York | | | | | | | | |
Mellon Corp. (The) | | | 606,590 | | | | 22,771,388 | |
Goldman Sachs | | | | | | | | |
Group, Inc. (The) | | | 169,514 | | | | 31,092,258 | |
Morgan Stanley | | | 1,187,495 | | | | 46,822,928 | |
| | | | | | | 100,686,574 | |
| | | | | | | | |
Commercial Banks—14.5% | | | | | | | | |
Bank of America | | | | | | | | |
Corp. | | | 1,654,426 | | | | 39,788,945 | |
Citigroup, Inc. | | | 1,541,992 | | | | 74,879,132 | |
Citizens Financial | | | | | | | | |
Group, Inc. | | | 814,931 | | | | 18,246,305 | |
| | | | | | | 132,914,382 | |
| | | | | | | | |
Insurance—3.0% | | | | | | | | |
American | | | | | | | | |
International Group, | | | | | | | | |
Inc. | | | 1,100,106 | | | | 27,975,696 | |
Health Care—13.4% | | | | | | | | |
Health Care Providers & Services—8.1% | |
Anthem, Inc. | | | 137,447 | | | | 38,585,496 | |
CVS Health Corp. | | | 264,828 | | | | 16,300,163 | |
McKesson Corp. | | | 133,486 | | | | 18,854,898 | |
| | | | | | | 73,740,557 | |
| | | | | | | | |
Pharmaceuticals—5.3% | | | | | | | | |
Bristol-Myers | | | | | | | | |
Squibb Co. | | | 423,668 | | | | 25,763,251 | |
Sanofi | | | 236,761 | | | | 23,163,197 | |
| | | | | | | 48,926,448 | |
| | | | | | | | |
| | | Shares | | | Value | |
Industrials—12.5% | | | | | | | | |
Aerospace & Defense—1.3% | | | | | | | | |
Textron, Inc. | | | 434,770 | | | $ | 11,460,537 | |
Air Freight & Couriers—2.6% | | | | | | | | |
FedEx Corp. | | | 188,854 | | | | 23,941,022 | |
Building Products—1.5% | | | | | | | | |
Johnson Controls | | | | | | | | |
International plc | | | 477,916 | | | | 13,912,135 | |
Electrical Equipment—3.8% | | | | | | | | |
Eaton Corp. plc | | | 189,812 | | | | 15,849,302 | |
Emerson Electric Co. | | | 338,979 | | | | 19,331,972 | |
| | | | | | | 35,181,274 | |
| | | | | | | | |
Machinery—3.3% | | | | | | | | |
Caterpillar, Inc. | | | 258,062 | | | | 30,033,255 | |
Information Technology—13.6% | | | | | | | | |
IT Services—2.1% | | | | | | | | |
Cognizant | | | | | | | | |
Technology | | | | | | | | |
Solutions Corp., | | | | | | | | |
Cl. A | | | 338,037 | | | | 19,612,907 | |
Semiconductors & Semiconductor | | | | | | | | |
Equipment—7.6% | | | | | | | | |
Intel Corp. | | | 598,685 | | | | 35,909,126 | |
QUALCOMM, Inc. | | | 422,923 | | | | 33,271,352 | |
| | | | | | | 69,180,478 | |
| | | | | | | | |
Software—3.9% | | | | | | | | |
Microsoft Corp. | | | 201,053 | | | | 36,030,708 | |
Telecommunication Services—5.0% | | | | | | | | |
Diversified Telecommunication Services—5.0% | |
AT&T, Inc. | | | 1,510,629 | | | | 46,028,866 | |
Total Common Stocks | | | | | | | | |
(Cost $1,008,522,354) | | | | | | | 890,965,330 | |
12 INVESCO COMSTOCK SELECT FUND
| | | | | | | | |
| | | Shares | | | Value | |
Investment Company—2.6% | | | | | | | | |
Invesco Government | | | | | | | | |
& Agency Portfolio, | | | | | | | | |
Institutional Class, 0.20%1,2 (Cost $23,765,041) | | | 23,765,041 | | | $ | 23,765,041 | |
Total Investments, at Value (Cost $1,032,287,395) | | | 99.7% | | | | 914,730,371 | |
Net Other Assets (Liabilities) | | | 0.3 | | | | 2,480,164 | |
| | | | |
Net Assets | | | 100.0% | | | $ | 917,210,535 | |
| | | | |
Footnotes to Schedule of Investments
1. The rate shown is the 7-day SEC standardized yield as of April 30, 2020.
2. Affiliated issuer. The issuer and/or the Fund is affiliated by having an investment adviser that is under common control of Invesco, Ltd. Transactions during the reporting period in which the issuer was an affiliate are as follows:
| | | | | | | | | | | | | | | | |
| | | Shares
October 31, 2019 | | | Gross
Additions | | | Gross
Reductions | | | Shares
April 30, 2020 | |
Investment Company | | | | | | | | | | | | | | | | |
Invesco Government & Agency | | | | | | | | | | | | | | | | |
Portfolio, Institutional Class | | | 50,392,746 | | | | 143,628,413 | | | | 170,256,118 | | | | 23,765,041 | |
| | | | |
| | | Value | | | Income | | | Realized
Gain (Loss) | | | Change in
Unrealized
Gain (Loss) | |
Investment Company | | | | | | | | | | | | | | | | |
Invesco Government & Agency | | | | | | | | | | | | | | | | |
Portfolio, Institutional Class | | $ | 23,765,041 | | | $ | 240,718 | | | $ | — | | | $ | — | |
See accompanying Notes to Financial Statements.
13 INVESCO COMSTOCK SELECT FUND
STATEMENT OF ASSETS AND LIABILITIES April 30, 2020
| | | | |
Assets | | | | |
| |
Investments, at value—see accompanying schedule of investments: | | | | |
| |
Unaffiliated companies (cost $1,008,522,354) | | $ | 890,965,330 | |
| |
Affiliated companies (cost $23,765,041) | | | 23,765,041 | |
| | | | |
| | | | 914,730,371 | |
| |
Cash | | | 999,999 | |
| |
Receivables and other assets: | | | | |
| |
Dividends | | | 2,352,274 | |
| |
Shares of beneficial interest sold | | | 157,852 | |
| |
Other | | | 241,705 | |
| | | | |
Total assets | | | 918,482,201 | |
Liabilities | | | | |
| |
Payables and other liabilities: | | | | |
| |
Shares of beneficial interest redeemed | | | 564,934 | |
| |
Trustees’ compensation | | | 225,040 | |
| |
Transfer and shareholder servicing agent fees | | | 186,668 | |
| |
Shareholder communications | | | 139,849 | |
| |
Distribution and service plan fees | | | 103,145 | |
| |
Advisory fees | | | 12,767 | |
| |
Administration fees | | | 382 | |
| |
Other | | | 38,881 | |
| | | | |
Total liabilities | | | 1,271,666 | |
Net Assets | | $ | 917,210,535 | |
| | | | |
| | | | |
Composition of Net Assets | | | | |
| |
Shares of beneficial interest | | $ | 1,054,377,922 | |
| |
Total accumulated loss | | | (137,167,387) | |
| | | | |
Net Assets | | $ | 917,210,535 | |
| | | | |
14 INVESCO COMSTOCK SELECT FUND
| | | | |
Net Asset Value Per Share | | | | |
Class A Shares: | | | | |
| |
| Net asset value and redemption price per share (based on net assets of $388,557,619 and 18,075,099 shares of beneficial interest outstanding) | | | $21.50 | |
| |
Maximum offering price per share (net asset value plus sales charge of 5.50% of offering price) | | | $22.75 | |
| |
Class C Shares: | | | | |
| Net asset value, redemption price (excludes applicable contingent deferred sales charge) and offering price per share (based on net assets of $27,325,241 and 1,360,699 shares of beneficial interest outstanding) | | | $20.08 | |
| |
Class R Shares: | | | | |
| Net asset value, redemption price and offering price per share (based on net assets of $27,339,536 and 1,309,038 shares of beneficial interest outstanding) | | | $20.89 | |
| |
Class Y Shares: | | | | |
| Net asset value, redemption price and offering price per share (based on net assets of $29,843,423 and 1,345,034 shares of beneficial interest outstanding) | | | $22.19 | |
| |
Class R5 Shares: | | | | |
| Net asset value, redemption price and offering price per share (based on net assets of $6,723 and 313.08 shares of beneficial interest outstanding) | | | $21.47 | |
| |
Class R6 Shares: | | | | |
| Net asset value, redemption price and offering price per share (based on net assets of $444,137,993 and 20,066,329 shares of beneficial interest outstanding) | | | $22.13 | |
See accompanying Notes to Financial Statements.
15 INVESCO COMSTOCK SELECT FUND
STATEMENT
OF OPERATIONS
| | | | | | | | |
| | | Six Months Ended | | | Year Ended | |
| | | April 30, 2020 | | | October 31, 2019 | |
Investment Income | | | | | | | | |
Dividends: | | | | | | | | |
| | |
Unaffiliated companies (net of foreign withholding taxes of $215,598 and $314,418, respectively) | | $ | 17,322,379 | | | $ | 37,461,759 | |
| | |
Affiliated companies | | | 240,718 | | | | 1,242,398 | |
| | |
Interest | | | 5,646 | | | | 20,601 | |
| | | | |
Total investment income | | | 17,568,743 | | | | 38,724,758 | |
Expenses | | | | | | | | |
| | |
Advisory fees | | | 2,766,000 | | | | 6,902,081 | |
| | |
Administration fees | | | 82,798 | | | | 81,516 | |
| | |
Distribution and service plan fees: | | | | | | | | |
| | |
Class A | | | 574,458 | | | | 1,198,225 | |
| | |
Class C | | | 180,211 | | | | 746,694 | |
| | |
Class R | | | 82,225 | | | | 184,283 | |
| | |
Transfer and shareholder servicing agent fees: | | | | | | | | |
| | |
Class A | | | 458,492 | | | | 974,154 | |
| | |
Class C | | | 34,603 | | | | 146,141 | |
| | |
Class R | | | 31,566 | | | | 72,883 | |
| | |
Class Y | | | 47,005 | | | | 136,313 | |
| | |
Class R5 | | | 2 | | | | 3 | |
| | |
Class R6 | | | 13,985 | | | | 154,548 | |
| | |
Shareholder communications: | | | | | | | | |
| | |
Class A | | | 23,858 | | | | 44,164 | |
| | |
Class C | | | 1,799 | | | | 5,411 | |
| | |
Class R | | | 1,644 | | | | 3,119 | |
| | |
Class Y | | | 2,454 | | | | 5,131 | |
| | |
Class R6 | | | 27,321 | | | | 42,131 | |
| | |
Trustees’ compensation | | | 25,770 | | | | 23,248 | |
| | |
Custodian fees and expenses | | | 3,844 | | | | 54,408 | |
| | |
Borrowing fees | | | — | | | | 28,260 | |
| | |
Other | | | 98,967 | | | | 72,555 | |
| | | | |
Total expenses | | | 4,457,002 | | | | 10,875,268 | |
| | |
Less waivers and reimbursements of expenses | | | (179,049 | ) | | | (128,204) | |
| | | | |
Net expenses | | | 4,277,953 | | | | 10,747,064 | |
| | | |
Net Investment Income | | | 13,290,790 | | | | 27,977,694 | |
16 INVESCO COMSTOCK SELECT FUND
| | | | | | | | |
| | | Six Months Ended | | | Year Ended | |
| | | April 30, 2020 | | | October 31, 2019 | |
Realized and Unrealized Gain (Loss) | | | | | | | | |
Net realized gain (loss) on: | | | | | | | | |
| | |
| Investment transactions in unaffiliated companies (includes net gains from securities sold to affiliates of $— and $175,356, respectively) | | $ | (20,939,261 | ) | | | $ 273,471,217 | |
| | |
Foreign currency transactions | | | (32,673 | ) | | | 26,163 | |
| | | | |
Net realized gain (loss) | | | (20,971,934 | ) | | | 273,497,380 | |
Net change in unrealized appreciation/(depreciation) on: | | | | | | | | |
| | |
Investment transactions in unaffiliated companies | | | (204,004,434 | ) | | | (185,596,744 | ) |
| | |
Foreign currency transactions | | | (125 | ) | | | 125 | |
| | | | |
Net change in unrealized appreciation/(depreciation) | | | (204,004,559 | ) | | | (185,596,619 | ) |
Net Increase (Decrease) in Net Assets Resulting from Operations | | $ | (211,685,703 | ) | | | $ 115,878,455 | |
| | | | |
See accompanying Notes to Financial Statements.
17 INVESCO COMSTOCK SELECT FUND
STATEMENT OF CHANGES IN NET ASSETS
| | | | | | | | | | | | |
| | | Six Months Ended
April 30, 2020 | | | Year Ended
October 31, 2019 | | | Year Ended
October 31, 2018 | |
Operations | | | | | | | | | | | | |
| | | |
Net investment income | | $ | 13,290,790 | | | $ | 27,977,694 | | | $ | 32,421,255 | |
| | | |
Net realized gain (loss) | | | (20,971,934 | ) | | | 273,497,380 | | | | 200,794,591 | |
| | | |
Net change in unrealized appreciation/(depreciation) | | | (204,004,559 | ) | | | (185,596,619 | ) | | | (206,639,705 | ) |
| | | | |
Net increase (decrease) in net assets resulting from operations | | | (211,685,703 | ) | | | 115,878,455 | | | | 26,576,141 | |
Dividends and/or Distributions to Shareholders | | | | | | | | | | | | |
| | | |
Distributions to shareholders from distributable earnings: | | | | | | | | | | | | |
| | | |
Class A | | | (119,234,349 | ) | | | (61,845,162 | ) | | | (31,344,141 | ) |
| | | |
Class B | | | — | | | | — | | | | (64,861 | ) |
| | | |
Class C | | | (9,257,960 | ) | | | (11,413,279 | ) | | | (5,929,937 | ) |
| | | |
Class R | | | (8,173,489 | ) | | | (4,727,389 | ) | | | (2,356,965 | ) |
| | | |
Class Y | | | (15,867,545 | ) | | | (8,984,172 | ) | | | (8,149,910 | ) |
| | | |
Class R5 | | | (2,397 | ) | | | (120 | ) | | | — | |
| | | |
Class R6 | | | (122,758,577 | ) | | | (119,301,253 | ) | | | (75,010,485 | ) |
| | | | |
Total distributions from distributable earnings | | | (275,294,317 | ) | | | (206,271,375 | ) | | | (122,856,299 | ) |
Beneficial Interest Transactions | | | | | | | | | | | | |
Net increase (decrease) in net assets resulting from beneficial interest transactions: | | | | | | | | | | | | |
| | | |
Class A | | | 76,804,592 | | | | 44,557,789 | | | | (19,565,781 | ) |
| | | |
Class B | | | — | | | | — | | | | (2,053,946 | ) |
| | | |
Class C | | | 2,955,739 | | | | (49,742,879 | ) | | | (11,438,241 | ) |
| | | |
Class R | | | 5,430,763 | | | | (232,706 | ) | | | (1,804,853 | ) |
| | | |
Class Y | | | (19,457,423 | ) | | | 1,515,165 | | | | (67,395,973 | ) |
| | | |
Class R5 | | | — | | | | 10,000 | | | | — | |
| | | |
Class R6 | | | 9,158,200 | | | | (323,815,201 | ) | | | (239,154,095 | ) |
| | | | |
Total beneficial interest transactions | | | 74,891,871 | | | | (327,707,832 | ) | | | (341,412,889 | ) |
Net Assets | | | | | | | | | | | | |
| | | |
Total decrease | | | (412,088,149 | ) | | | (418,100,752 | ) | | | (437,693,047 | ) |
| | | |
Beginning of period | | | 1,329,298,684 | | | | 1,747,399,436 | | | | 2,185,092,483 | |
| | | | |
End of period | | $ | 917,210,535 | | | $ | 1,329,298,684 | | | $ | 1,747,399,436 | |
| | | | |
See accompanying Notes to Financial Statements.
18 INVESCO COMSTOCK SELECT FUND
FINANCIAL HIGHLIGHTS
| | | | | | | | | | | | | | | | | | | | | | | | |
| Class A | | Six Months
Ended
April 30, 2020 | | | Year Ended
October 31,
2019 | | | Year Ended
October 31,
2018 | | | Year Ended
October 31,
2017 | | | Year Ended
October 31,
2016 | | | Year Ended
October 30,
20151 | |
Per Share Operating Data | | | | | | | | | | | | | | | | | | | | | | | | |
Net asset value, beginning of period | | | $33.81 | | | | $35.63 | | | | $37.62 | | | | $31.66 | | | | $31.64 | | | | $31.50 | |
Income (loss) from investment operations: | | | | | | | | | | | | | | | | | | | | | | | | |
Net investment income2 | | | 0.29 | | | | 0.58 | | | | 0.51 | | | | 0.34 | | | | 0.37 | | | | 0.37 | |
Net realized and unrealized gain (loss) | | | (5.00) | | | | 2.00 | | | | (0.32) | | | | 6.09 | | | | 0.04 | | | | 0.13 | |
Total from investment operations | | | (4.71) | | | | 2.58 | | | | 0.19 | | | | 6.43 | | | | 0.41 | | | | 0.50 | |
Dividends and/or distributions to shareholders: | | | | | | | | | | | | | | | | | | | | | | | | |
Dividends from net investment income | | | (0.29) | | | | (0.56) | | | | (0.52) | | | | (0.47) | | | | (0.39) | | | | (0.36) | |
Distributions from net realized gain | | | (7.31) | | | | (3.84) | | | | (1.66) | | | | 0.00 | | | | 0.00 | | | | 0.00 | |
Total dividends and/or distributions to shareholders | | | (7.60) | | | | (4.40) | | | | (2.18) | | | | (0.47) | | | | (0.39) | | | | (0.36) | |
Net asset value, end of period | | | $21.50 | | | | $33.81 | | | | $35.63 | | | | $37.62 | | | | $31.66 | | | | $31.64 | |
| | | | | | | | | | | | | | | | | | | | | | | | |
| | | | | | | | | | | | | | | | | | | | | | | | |
Total Return, at Net Asset Value3 | | | (19.00)% | | | | 8.66% | | | | 0.35% | | | | 20.41% | | | | 1.33% | | | | 1.58% | |
| | | | | | | | | | | | | | | | | | | | | | | | |
Ratios/Supplemental Data | | | | | | | | | | | | | | | | | | | | | | | | |
Net assets, end of period (in thousands) | | | $388,558 | | | | $524,705 | | | | $500,866 | | | | $548,012 | | | | $514,425 | | | | $563,546 | |
Average net assets (in thousands) | | | $478,689 | | | | $499,873 | | | | $544,841 | | | | $546,267 | | | | $526,331 | | | | $607,740 | |
Ratios to average net assets:4 | | | | | | | | | | | | | | | | | | | | | | | | |
Net investment income | | | 2.17% | | | | 1.79% | | | | 1.37% | | | | 0.97% | | | | 1.21% | | | | 1.14% | |
Expenses excluding specific expenses listed below | | | 0.97% | | | | 0.95% | | | | 0.93% | | | | 0.95% | | | | 0.96% | | | | 0.95% | |
Interest and fees from borrowings | | | 0.00% | | | | 0.00%5 | | | | 0.00%5 | | | | 0.00%5 | | | | 0.00%5 | | | | 0.00%5 | |
Total expenses6 | | | 0.97% | | | | 0.95% | | | | 0.93% | | | | 0.95% | | | | 0.96% | | | | 0.95% | |
| Expenses after payments, waivers and/or reimbursements and reduction to custodian expenses | | | 0.93% | | | | 0.93% | | | | 0.93%7 | | | | 0.94% | | | | 0.96%7 | | | | 0.95%7 | |
Portfolio turnover rate8 | | | 11% | | | | 129% | | | | 45% | | | | 53% | | | | 64% | | | | 51% | |
19 INVESCO COMSTOCK SELECT FUND
FINANCIAL HIGHLIGHTS Continued
1. Represents the last business day of the Fund’s reporting period.
2. Calculated based on the average shares outstanding during the period.
3. Includes adjustments in accordance with accounting principles generally accepted in the United States of America and as such, the net asset value for financial reporting purposes and the returns based upon those net asset values may differ from the net asset value and returns for shareholder transactions. Does not include sales charges and is not annualized for periods less than one year, if applicable.
4. Annualized for periods less than one full year.
5. Less than 0.005%.
6. Total expenses including indirect expenses from fund fees and expenses were as follows:
| | | | | | |
| | | | | | |
Six Months Ended April 30, 2020 | | | 0.97 | % |
Year Ended October 31, 2019 | | | 0.95 | % |
Year Ended October 31, 2018 | | | 0.93 | % |
Year Ended October 31, 2017 | | | 0.95 | % |
Year Ended October 31, 2016 | | | 0.96 | % |
Year Ended October 30, 2015 | | | 0.95 | % |
7. Waiver was less than 0.005%.
8. Portfolio turnover is calculated at the fund level and is not annualized for periods less than one year, if applicable.
See accompanying Notes to Financial Statements.
20 INVESCO COMSTOCK SELECT FUND
| | | | | | | | | | | | | | | | | | | | | | | | |
| Class C | | Six Months
Ended
April 30, 2020 | | | Year Ended
October 31,
2019 | | | Year Ended
October 31,
2018 | | | Year Ended
October 31,
2017 | | | Year Ended
October 31,
2016 | | | Year Ended
October 30,
20151 | |
Per Share Operating Data | | | | | | | | | | | | | | | | | | | | | | | | |
Net asset value, beginning of period | | | $32.01 | | | | $33.95 | | | | $35.96 | | | | $30.32 | | | | $30.32 | | | | $30.19 | |
Income (loss) from investment operations: | | | | | | | | | | | | | | | | | | | | | | | | |
Net investment income2 | | | 0.18 | | | | 0.32 | | | | 0.22 | | | | 0.07 | | | | 0.13 | | | | 0.12 | |
Net realized and unrealized gain (loss) | | | (4.64) | | | | 1.89 | | | | (0.31) | | | | 5.83 | | | | 0.04 | | | | 0.14 | |
Total from investment operations | | | (4.46) | | | | 2.21 | | | | (0.09) | | | | 5.90 | | | | 0.17 | | | | 0.26 | |
Dividends and/or distributions to shareholders: | | | | | | | | | | | | | | | | | | | | | | | | |
Dividends from net investment income | | | (0.16) | | | | (0.31) | | | | (0.26) | | | | (0.26) | | | | (0.17) | | | | (0.13) | |
Distributions from net realized gain | | | (7.31) | | | | (3.84) | | | | (1.66) | | | | 0.00 | | | | 0.00 | | | | 0.00 | |
Total dividends and/or distributions to shareholders | | | (7.47) | | | | (4.15) | | | | (1.92) | | | | (0.26) | | | | (0.17) | | | | (0.13) | |
Net asset value, end of period | | | $20.08 | | | | $32.01 | | | | $33.95 | | | | $35.96 | | | | $30.32 | | | | $30.32 | |
| | | | | | | | | | | | | | | | | | | | | | | | |
| | | | | | | | | | | | | | | | | | | | | | | | |
Total Return, at Net Asset Value3 | | | (19.29)% | | | | 7.86% | | | | (0.44)% | | | | 19.51% | | | | 0.58% | | | | 0.84% | |
| | | | | | | | | | | | | | | | | | | | | | | | |
Ratios/Supplemental Data | | | | | | | | | | | | | | | | | | | | | | | | |
Net assets, end of period (in thousands) | | | $27,325 | | | | $40,759 | | | | $96,108 | | | | $113,203 | | | | $112,170 | | | | $127,437 | |
Average net assets (in thousands) | | | $36,067 | | | | $74,754 | | | | $109,594 | | | | $116,876 | | | | $117,162 | | | | $135,091 | |
Ratios to average net assets:4 | | | | | | | | | | | | | | | | | | | | | | | | |
Net investment income | | | 1.41% | | | | 1.03% | | | | 0.62% | | | | 0.22% | | | | 0.46% | | | | 0.39% | |
Expenses excluding specific expenses listed below | | | 1.73% | | | | 1.69% | | | | 1.69% | | | | 1.70% | | | | 1.71% | | | | 1.70% | |
Interest and fees from borrowings | | | 0.00% | | | | 0.00%5 | | | | 0.00%5 | | | | 0.00%5 | | | | 0.00%5 | | | | 0.00%5 | |
Total expenses6 | | | 1.73% | | | | 1.69% | | | | 1.69% | | | | 1.70% | | | | 1.71% | | | | 1.70% | |
| Expenses after payments, waivers and/or reimbursements and reduction to custodian expenses | | | 1.68% | | | | 1.68% | | | | 1.69%7 | | | | 1.69% | | | | 1.71%7 | | | | 1.70%7 | |
Portfolio turnover rate8 | | | 11% | | | | 129% | | | | 45% | | | | 53% | | | | 64% | | | | 51% | |
21 INVESCO COMSTOCK SELECT FUND
FINANCIAL HIGHLIGHTS Continued
1. Represents the last business day of the Fund’s reporting period.
2. Calculated based on the average shares outstanding during the period.
3. Includes adjustments in accordance with accounting principles generally accepted in the United States of America and as such, the net asset value for financial reporting purposes and the returns based upon those net asset values may differ from the net asset value and returns for shareholder transactions. Does not include sales charges and is not annualized for periods less than one year, if applicable.
4. Annualized for periods less than one full year.
5. Less than 0.005%.
6. Total expenses including indirect expenses from fund fees and expenses were as follows:
| | | | | | |
| | | | | | |
Six Months Ended April 30, 2020 | | | 1.73 | % |
Year Ended October 31, 2019 | | | 1.69 | % |
Year Ended October 31, 2018 | | | 1.69 | % |
Year Ended October 31, 2017 | | | 1.70 | % |
Year Ended October 31, 2016 | | | 1.71 | % |
Year Ended October 30, 2015 | | | 1.70 | % | | |
7. Waiver was less than 0.005%.
8. Portfolio turnover is calculated at the fund level and is not annualized for periods less than one year, if applicable.
See accompanying Notes to Financial Statements.
22 INVESCO COMSTOCK SELECT FUND
| | | | | | | | | | | | | | | | | | | | | | | | |
| Class R | | Six Months
Ended
April 30, 2020 | | | Year Ended
October 31,
2019 | | | Year Ended
October 31,
2018 | | | Year Ended
October 31,
2017 | | | Year Ended
October 31,
2016 | | | Year Ended
October 30,
20151 | |
Per Share Operating Data | | | | | | | | | | | | | | | | | | | | | | | | |
Net asset value, beginning of period | | | $33.04 | | | | $34.91 | | | | $36.91 | | | | $31.08 | | | | $31.06 | | | | $30.92 | |
Income (loss) from investment operations: | | | | | | | | | | | | | | | | | | | | | | | | |
Net investment income2 | | | 0.25 | | | | 0.49 | | | | 0.41 | | | | 0.25 | | | | 0.29 | | | | 0.28 | |
Net realized and unrealized gain (loss) | | | (4.85) | | | | 1.96 | | | | (0.32) | | | | 5.97 | | | | 0.04 | | | | 0.14 | |
Total from investment operations | | | (4.60) | | | | 2.45 | | | | 0.09 | | | | 6.22 | | | | 0.33 | | | | 0.42 | |
Dividends and/or distributions to shareholders: | | | | | | | | | | | | | | | | | | | | | | | | |
Dividends from net investment income | | | (0.24) | | | | (0.48) | | | | (0.43) | | | | (0.39) | | | | (0.31) | | | | (0.28) | |
Distributions from net realized gain | | | (7.31) | | | | (3.84) | | | | (1.66) | | | | 0.00 | | | | 0.00 | | | | 0.00 | |
Total dividends and/or distributions to shareholders | | | (7.55) | | | | (4.32) | | | | (2.09) | | | | (0.39) | | | | (0.31) | | | | (0.28) | |
Net asset value, end of period | | | $20.89 | | | | $33.04 | | | | $34.91 | | | | $36.91 | | | | $31.08 | | | | $31.06 | |
| | | | | | | | | | | | | | | | | | | | | | | | |
| | | | | | | | | | | | | | | | | | | | | | | | |
Total Return, at Net Asset Value3 | | | (19.11)% | | | | 8.41% | | | | 0.08% | | | | 20.10% | | | | 1.11% | | | | 1.35% | |
| | | | | | | | | | | | | | | | | | | | | | | | |
Ratios/Supplemental Data | | | | | | | | | | | | | | | | | | | | | | | | |
Net assets, end of period (in thousands) | | | $27,340 | | | | $36,469 | | | | $38,411 | | | | $42,358 | | | | $38,801 | | | | $50,813 | |
Average net assets (in thousands) | | | $32,938 | | | | $37,382 | | | | $41,775 | | | | $41,429 | | | | $42,959 | | | | $58,025 | |
Ratios to average net assets:4 | | | | | | | | | | | | | | | | | | | | | | | | |
Net investment income | | | 1.92% | | | | 1.54% | | | | 1.12% | | | | 0.73% | | | | 0.96% | | | | 0.89% | |
Expenses excluding specific expenses listed below | | | 1.23% | | | | 1.20% | | | | 1.18% | | | | 1.19% | | | | 1.20% | | | | 1.19% | |
Interest and fees from borrowings | | | 0.00% | | | | 0.00%5 | | | | 0.00%5 | | | | 0.00%5 | | | | 0.00%5 | | | | 0.00%5 | |
Total expenses6 | | | 1.23% | | | | 1.20% | | | | 1.18% | | | | 1.19% | | | | 1.20% | | | | 1.19% | |
| Expenses after payments, waivers and/or reimbursements and reduction to custodian expenses | | | 1.18% | | | | 1.18% | | | | 1.18%7 | | | | 1.18% | | | | 1.20%7 | | | | 1.19%7 | |
Portfolio turnover rate8 | | | 11% | | | | 129% | | | | 45% | | | | 53% | | | | 64% | | | | 51% | |
23 INVESCO COMSTOCK SELECT FUND
FINANCIAL HIGHLIGHTS Continued
1. Represents the last business day of the Fund’s reporting period.
2. Calculated based on the average shares outstanding during the period.
3. Includes adjustments in accordance with accounting principles generally accepted in the United States of America and as such, the net asset value for financial reporting purposes and the returns based upon those net asset values may differ from the net asset value and returns for shareholder transactions. Does not include sales charges and is not annualized for periods less than one year, if applicable.
4. Annualized for periods less than one full year.
5. Less than 0.005%.
6. Total expenses including indirect expenses from fund fees and expenses were as follows:
| | | | | | |
| | | | | | |
Six Months Ended April 30, 2020 | | | 1.23 | % |
Year Ended October 31, 2019 | | | 1.20 | % |
Year Ended October 31, 2018 | | | 1.18 | % |
Year Ended October 31, 2017 | | | 1.19 | % |
Year Ended October 31, 2016 | | | 1.20 | % |
Year Ended October 30, 2015 | | | 1.19 | % | | |
7. Waiver was less than 0.005%.
8. Portfolio turnover is calculated at the fund level and is not annualized for periods less than one year, if applicable.
See accompanying Notes to Financial Statements.
24 INVESCO COMSTOCK SELECT FUND
| | | | | | | | | | | | | | | | | | | | | | | | |
| Class Y | | Six Months
Ended
April 30, 2020 | | | Year Ended
October 31,
2019 | | | Year Ended
October 31,
2018 | | | Year Ended
October 31,
2017 | | | Year Ended
October 31,
2016 | | | Year Ended
October 30,
20151 | |
Per Share Operating Data | | | | | | | | | | | | | | | | | | | | | | | | |
Net asset value, beginning of period | | | $34.70 | | | | $36.44 | | | | $38.43 | | | | $32.33 | | | | $32.29 | | | | $32.14 | |
Income (loss) from investment operations: | | | | | | | | | | | | | | | | | | | | | | | | |
Net investment income2 | | | 0.34 | | | | 0.68 | | | | 0.62 | | | | 0.44 | | | | 0.46 | | | | 0.45 | |
Net realized and unrealized gain (loss) | | | (5.21) | | | | 2.07 | | | | (0.34) | | | | 6.22 | | | | 0.04 | | | | 0.14 | |
Total from investment operations | | | (4.87) | | | | 2.75 | | | | 0.28 | | | | 6.66 | | | | 0.50 | | | | 0.59 | |
Dividends and/or distributions to shareholders: | | | | | | | | | | | | | | | | | | | | | | | | |
Dividends from net investment income | | | (0.33) | | | | (0.65) | | | | (0.61) | | | | (0.56) | | | | (0.46) | | | | (0.44) | |
Distributions from net realized gain | | | (7.31) | | | | (3.84) | | | | (1.66) | | | | 0.00 | | | | 0.00 | | | | 0.00 | |
Total dividends and/or distributions to shareholders | | | (7.64) | | | | (4.49) | | | | (2.27) | | | | (0.56) | | | | (0.46) | | | | (0.44) | |
Net asset value, end of period | | | $22.19 | | | | $34.70 | | | | $36.44 | | | | $38.43 | | | | $32.33 | | | | $32.29 | |
| | | | | | | | | | | | | | | | | | | | | | | | |
| | | | | | | | | | | | | | | | | | | | | | | | |
Total Return, at Net Asset Value3 | | | (18.95)% | | | | 8.97% | | | | 0.55% | | | | 20.71% | | | | 1.61% | | | | 1.83% | |
| | | | | | | | | | | | | | | | | | | | | | | | |
Ratios/Supplemental Data | | | | | | | | | | | | | | | | | | | | | | | | |
Net assets, end of period (in thousands) | | | $29,843 | | | | $70,677 | | | | $72,317 | | | | $142,547 | | | | $111,684 | | | | $107,097 | |
Average net assets (in thousands) | | | $48,711 | | | | $69,931 | | | | $129,699 | | | | $130,558 | | | | $108,450 | | | | $109,382 | |
Ratios to average net assets:4 | | | | | | | | | | | | | | | | | | | | | | | | |
Net investment income | | | 2.41% | | | | 2.03% | | | | 1.61% | | | | 1.20% | | | | 1.47% | | | | 1.38% | |
Expenses excluding specific expenses listed below | | | 0.73% | | | | 0.71% | | | | 0.68% | | | | 0.71% | | | | 0.71% | | | | 0.70% | |
Interest and fees from borrowings | | | 0.00% | | | | 0.00%5 | | | | 0.00%5 | | | | 0.00%5 | | | | 0.00%5 | | | | 0.00%5 | |
Total expenses6 | | | 0.73% | | | | 0.71% | | | | 0.68% | | | | 0.71% | | | | 0.71% | | | | 0.70% | |
| Expenses after payments, waivers and/or reimbursements and reduction to custodian expenses | | | 0.68% | | | | 0.68% | | | | 0.68%7 | | | | 0.69% | | | | 0.71%7 | | | | 0.70%7 | |
Portfolio turnover rate8 | | | 11% | | | | 129% | | | | 45% | | | | 53% | | | | 64% | | | | 51% | |
25 INVESCO COMSTOCK SELECT FUND
FINANCIAL HIGHLIGHTS Continued
1. Represents the last business day of the Fund’s reporting period.
2. Calculated based on the average shares outstanding during the period.
3. Includes adjustments in accordance with accounting principles generally accepted in the United States of America and as such, the net asset value for financial reporting purposes and the returns based upon those net asset values may differ from the net asset value and returns for shareholder transactions. Does not include sales charges and is not annualized for periods less than one year, if applicable.
4. Annualized for periods less than one full year.
5. Less than 0.005%.
6. Total expenses including indirect expenses from fund fees and expenses were as follows:
| | | | | | |
| | | | | | |
Six Months Ended April 30, 2020 | | | 0.73 | % |
Year Ended October 31, 2019 | | | 0.71 | % |
Year Ended October 31, 2018 | | | 0.68 | % |
Year Ended October 31, 2017 | | | 0.71 | % |
Year Ended October 31, 2016 | | | 0.71 | % |
Year Ended October 30, 2015 | | | 0.70 | % | | |
7. Waiver was less than 0.005%.
8. Portfolio turnover is calculated at the fund level and is not annualized for periods less than one year, if applicable.
See accompanying Notes to Financial Statements.
26 INVESCO COMSTOCK SELECT FUND
| | | | | | | | |
| Class R5 | | Six Months
Ended
April 30, 2020 | | | Period
Ended
October 31,
20191 | |
Per Share Operating Data | | | | | | | | |
Net asset value, beginning of period | | | $33.80 | | | | $31.94 | |
Income (loss) from investment operations: | | | | | | | | |
Net investment income2 | | | 0.34 | | | | 0.31 | |
Net realized and unrealized gain (loss) | | | (5.02) | | | | 1.93 | |
Total from investment operations | | | (4.68) | | | | 2.24 | |
Dividends and/or distributions to shareholders: | | | | | | | | |
Dividends from net investment income | | | (0.34) | | | | (0.38) | |
Distributions from net realized gain | | | (7.31) | | | | 0.00 | |
Total dividends and/or distributions to shareholders | | | (7.65) | | | | (0.38) | |
Net asset value, end of period | | | $21.47 | | | | $33.80 | |
| | | | | | | | |
| | | | | | | | |
Total Return, at Net Asset Value3 | | | (18.88)% | | | | 7.03% | |
| | | | | | | | |
Ratios/Supplemental Data | | | | | | | | |
Net assets, end of period (in thousands) | | | $7 | | | | $11 | |
Average net assets (in thousands) | | | $8 | | | | $10 | |
Ratios to average net assets:4 | | | | | | | | |
Net investment income | | | 2.52% | | | | 2.15% | |
Expenses excluding specific expenses listed below | | | 0.57% | | | | 0.57% | |
Interest and fees from borrowings | | | 0.00% | | | | 0.00% | |
Total expenses5 | | | 0.57% | | | | 0.57% | |
Expenses after payments, waivers and/or reimbursements and reduction to custodian expenses | | | 0.57%6 | | | | 0.57%6 | |
Portfolio turnover rate7 | | | 11% | | | | 129% | |
1. For the period from after the close of business on May 24, 2019 (inception of offering) to October 31, 2019.
2. Calculated based on the average shares outstanding during the period.
3. Includes adjustments in accordance with accounting principles generally accepted in the United States of America and as such, the net asset value for financial reporting purposes and the returns based upon those net asset values may differ from the net asset value and returns for shareholder transactions. Does not include sales charges and is not annualized for periods less than one year, if applicable.
4. Annualized for periods less than one full year.
5. Total expenses including indirect expenses from fund fees and expenses were as follows:
| | | | | | |
| | | | | | |
Six Months Ended April 30, 2020 | | | 0.57 | % |
Period Ended October 31, 2019 | | | 0.57 | % |
6. Waiver was less than 0.005%.
7. Portfolio turnover is calculated at the fund level and is not annualized for periods less than one year, if applicable.
See accompanying Notes to Financial Statements.
27 INVESCO COMSTOCK SELECT FUND
FINANCIAL HIGHLIGHTS Continued
| | | | | | | | | | | | | | | | | | | | | | | | |
| Class R6 | | Six Months
Ended
April 30, 2020 | | | Year Ended
October 31,
2019 | | | Year Ended
October 31,
2018 | | | Year Ended
October 31,
2017 | | | Year Ended
October 31,
2016 | | | Year Ended
October 30,
20151 | |
Per Share Operating Data | | | | | | | | | | | | | | | | | | | | | | | | |
Net asset value, beginning of period | | | $34.63 | | | | $36.38 | | | | $38.37 | | | | $32.28 | | | | $32.24 | | | | $32.09 | |
Income (loss) from investment operations: | | | | | | | | | | | | | | | | | | | | | | | | |
Net investment income2 | | | 0.36 | | | | 0.73 | | | | 0.68 | | | | 0.50 | | | | 0.52 | | | | 0.51 | |
Net realized and unrealized gain (loss) | | | (5.19) | | | | 2.06 | | | | (0.33) | | | | 6.21 | | | | 0.04 | | | | 0.14 | |
Total from investment operations | | | (4.83) | | | | 2.79 | | | | 0.35 | | | | 6.71 | | | | 0.56 | | | | 0.65 | |
Dividends and/or distributions to shareholders: | | | | | | | | | | | | | | | | | | | | | | | | |
Dividends from net investment income | | | (0.36) | | | | (0.70) | | | | (0.68) | | | | (0.62) | | | | (0.52) | | | | (0.50) | |
Distributions from net realized gain | | | (7.31) | | | | (3.84) | | | | (1.66) | | | | 0.00 | | | | 0.00 | | | | 0.00 | |
Total dividends and/or distributions to shareholders | | | (7.67) | | | | (4.54) | | | | (2.34) | | | | (0.62) | | | | (0.52) | | | | (0.50) | |
Net asset value, end of period | | | $22.13 | | | | $34.63 | | | | $36.38 | | | | $38.37 | | | | $32.28 | | | | $32.24 | |
| | | | | | | | | | | | | | | | | | | | | | | | |
| | | | | | | | | | | | | | | | | | | | | | | | |
Total Return, at Net Asset Value3 | | | (18.88)% | | | | 9.13% | | | | 0.75% | | | | 20.92% | | | | 1.80% | | | | 2.03% | |
| | | | | | | | | | | | | | | | | | | | | | | | |
Ratios/Supplemental Data | | | | | | | | | | | | | | | | | | | | | | | | |
Net assets, end of period (in thousands) | | | $444,138 | | | | $656,678 | | | | $1,039,697 | | | | $1,336,915 | | | | $1,185,317 | | | | $1,234,068 | |
Average net assets (in thousands) | | | $544,424 | | | | $741,473 | | | | $1,219,109 | | | | $1,298,791 | | | | $1,180,588 | | | | $1,263,026 | |
Ratios to average net assets:4 | | | | | | | | | | | | | | | | | | | | | | | | |
Net investment income | | | 2.58% | | | | 2.20% | | | | 1.78% | | | | 1.39% | | | | 1.65% | | | | 1.57% | |
Expenses excluding specific expenses listed below | | | 0.54% | | | | 0.52% | | | | 0.52% | | | | 0.52% | | | | 0.52% | | | | 0.51% | |
Interest and fees from borrowings | | | 0.00% | | | | 0.00%5 | | | | 0.00%5 | | | | 0.00%5 | | | | 0.00%5 | | | | 0.00%5 | |
Total expenses6 | | | 0.54% | | | | 0.52% | | | | 0.52% | | | | 0.52% | | | | 0.52% | | | | 0.51% | |
| Expenses after payments, waivers and/or reimbursements and reduction to custodian expenses | | | 0.52% | | | | 0.52%7 | | | | 0.52%7 | | | | 0.51% | | | | 0.52%7 | | | | 0.51%7 | |
Portfolio turnover rate8 | | | 11% | | | | 129% | | | | 45% | | | | 53% | | | | 64% | | | | 51% | |
28 INVESCO COMSTOCK SELECT FUND
1. Represents the last business day of the Fund’s reporting period.
2. Calculated based on the average shares outstanding during the period.
3. Includes adjustments in accordance with accounting principles generally accepted in the United States of America and as such, the net asset value for financial reporting purposes and the returns based upon those net asset values may differ from the net asset value and returns for shareholder transactions. Does not include sales charges and is not annualized for periods less than one year, if applicable.
4. Annualized for periods less than one full year.
5. Less than 0.005%.
6. Total expenses including indirect expenses from fund fees and expenses were as follows:
| | | | | | |
| | | | | | |
Six Months Ended April 30, 2020 | | | 0.54 | % |
Year Ended October 31, 2019 | | | 0.52 | % |
Year Ended October 31, 2018 | | | 0.52 | % |
Year Ended October 31, 2017 | | | 0.52 | % |
Year Ended October 31, 2016 | | | 0.52 | % |
Year Ended October 30, 2015 | | | 0.51 | % | | |
7. Waiver was less than 0.005%.
8. Portfolio turnover is calculated at the fund level and is not annualized for periods less than one year, if applicable.
See accompanying Notes to Financial Statements.
29 INVESCO COMSTOCK SELECT FUND
NOTES TO FINANCIAL STATEMENTS April 30, 2020
Note 1 – Significant Accounting Policies
Invesco Comstock Select Fund (the “Fund”), formerly Invesco Oppenheimer Value Fund, is a series portfolio of AIM Sector Funds (Invesco Sector Funds) (the “Trust”). The Trust is a Delaware statutory trust registered under the Investment Company Act of 1940, as amended (the “1940 Act”), as an open-end series management investment company authorized to issue an unlimited number of shares of beneficial interest. Information presented in these financial statements pertains only to the Fund. Matters affecting the Fund or each class will be voted on exclusively by the shareholders of such Fund or each class.
Prior to the close of business on May 24, 2019, the Fund operated as Oppenheimer Value Fund (the “Acquired Fund” or “Predecessor Fund”). The Acquired Fund was reorganized after the close of business on May 24, 2019 (the “Reorganization Date”) through the transfer of all of its assets and liabilities to the Fund (the “Reorganization”).
Effective April 30, 2020, the Fund’s fiscal year end changed from October 31 to April 30.
The Fund’s investment objective is to seek capital appreciation.
The Fund currently consists of six different classes of shares: Class A, Class C, Class R, Class Y, Class R5 and Class R6. Class Y shares are available only to certain investors. Class A shares are sold with a front-end sales charge unless certain waiver criteria are met and under certain circumstances load waived shares may be subject to contingent deferred sales charges (“CDSC”). Class C shares are sold with a CDSC. Class R, Class Y, Class R5 and Class R6 shares are sold at net asset value. Class C shares held for ten years after purchase are eligible for automatic conversion into Class A shares of the same Fund (the “Conversion Feature”). The automatic conversion pursuant to the Conversion Feature will generally occur at the end of the month following the tenth anniversary after a purchase of Class C shares.
The Fund is an investment company and accordingly follows the investment company accounting and reporting guidance in accordance with Financial Accounting Standards Board Accounting Standards Codification Topic 946, Financial Services – Investment Companies.
The following is a summary of the significant accounting policies followed by the Fund in the preparation of its financial statements.
A. Security Valuations – Securities, including restricted securities, are valued according to the following policy.
A security listed or traded on an exchange (except convertible securities) is valued at its last sales price or official closing price as of the close of the customary trading session on the exchange where the security is principally traded, or lacking any sales or official closing price on a particular day, the security may be valued at the closing bid price on that day. Securities traded in the over-the-counter market are valued based on prices furnished by independent pricing services or market makers. When such securities are valued by an independent pricing service they may be considered fair valued. Futures contracts are valued at the final settlement price set by an exchange on which they are principally traded. Listed options are valued at the mean between the last bid and asked prices from the exchange on which they are principally traded. Options not listed on an exchange are valued by an independent source at the mean between the last bid and asked prices. For purposes of determining net asset value (“NAV”) per share, futures and option contracts generally are
30 INVESCO COMSTOCK SELECT FUND
valued 15 minutes after the close of the customary trading session of the New York Stock Exchange (“NYSE”).
Investments in open-end and closed-end registered investment companies that do not trade on an exchange are valued at the end-of-day net asset value per share. Investments in open-end and closed-end registered investment companies that trade on an exchange are valued at the last sales price or official closing price as of the close of the customary trading session on the exchange where the security is principally traded.
Debt obligations (including convertible securities) and unlisted equities are fair valued using an evaluated quote provided by an independent pricing service. Evaluated quotes provided by the pricing service may be determined without exclusive reliance on quoted prices, and may reflect appropriate factors such as institution-size trading in similar groups of securities, developments related to specific securities, dividend rate (for unlisted equities), yield (for debt obligations), quality, type of issue, coupon rate (for debt obligations), maturity (for debt obligations), individual trading characteristics and other market data. Pricing services generally value debt obligations assuming orderly transactions of institutional round lot size, but a fund may hold or transact in the same securities in smaller, odd lot sizes. Odd lots often trade at lower prices than institutional round lots. Debt obligations are subject to interest rate and credit risks. In addition, all debt obligations involve some risk of default with respect to interest and/or principal payments.
Foreign securities’ (including foreign exchange contracts) prices are converted into U.S. dollar amounts using the applicable exchange rates as of the close of the NYSE. If market quotations are available and reliable for foreign exchange-traded equity securities, the securities will be valued at the market quotations. Because trading hours for certain foreign securities end before the close of the NYSE, closing market quotations may become unreliable. If between the time trading ends on a particular security and the close of the customary trading session on the NYSE, events occur that the investment adviser determines are significant and make the closing price unreliable, the Fund may fair value the security. If the event is likely to have affected the closing price of the security, the security will be valued at fair value in good faith using procedures approved by the Board of Trustees. Adjustments to closing prices to reflect fair value may also be based on a screening process of an independent pricing service to indicate the degree of certainty, based on historical data, that the closing price in the principal market where a foreign security trades is not the current value as of the close of the NYSE. Foreign securities’ prices meeting the approved degree of certainty that the price is not reflective of current value will be priced at the indication of fair value from the independent pricing service. Multiple factors may be considered by the independent pricing service in determining adjustments to reflect fair value and may include information relating to sector indices, American Depositary Receipts and domestic and foreign index futures. Foreign securities may have additional risks including exchange rate changes, potential for sharply devalued currencies and high inflation, political and economic upheaval, the relative lack of issuer information, relatively low market liquidity and the potential lack of strict financial and accounting controls and standards.
Securities for which market prices are not provided by any of the above methods may be
31 INVESCO COMSTOCK SELECT FUND
NOTES TO FINANCIAL STATEMENTS Continued
valued based upon quotes furnished by independent sources. The last bid price may be used to value equity securities. The mean between the last bid and asked prices is used to value debt obligations, including corporate loans.
Securities for which market quotations are not readily available or became unreliable are valued at fair value as determined in good faith by or under the supervision of the Trust’s officers following procedures approved by the Board of Trustees. Issuer specific events, market trends, bid/asked quotes of brokers and information providers and other market data may be reviewed in the course of making a good faith determination of a security’s fair value.
The Fund may invest in securities that are subject to interest rate risk, meaning the risk that the prices will generally fall as interest rates rise and, conversely, the prices will generally rise as interest rates fall. Specific securities differ in their sensitivity to changes in interest rates depending on their individual characteristics. Changes in interest rates may result in increased market volatility, which may affect the value and/or liquidity of certain Fund investments.
Valuations change in response to many factors including the historical and prospective earnings of the issuer, the value of the issuer’s assets, general market conditions which are not specifically related to the particular issuer, such as real or perceived adverse economic conditions, changes in the general outlook for revenues or corporate earnings, changes in interest or currency rates, regional or global instability, natural or environmental disasters, widespread disease or other public health issues, war, acts of terrorism or adverse investor sentiment generally and market liquidity. Because of the inherent uncertainties of valuation, the values reflected in the financial statements may materially differ from the value received upon actual sale of those investments.
| B. | Securities Transactions and Investment Income - Securities transactions are accounted for on a trade date basis. Realized gains or losses on sales are computed on the basis of specific identification of the securities sold. Interest income (net of withholding tax, if any) is recorded on the accrual basis from settlement date. Dividend income (net of withholding tax, if any) is recorded on the ex-dividend date. |
The Fund may periodically participate in litigation related to Fund investments. As such, the Fund may receive proceeds from litigation settlements. Any proceeds received are included in the Statement of Operations as realized gain (loss) for investments no longer held and as unrealized gain (loss) for investments still held.
Brokerage commissions and mark ups are considered transaction costs and are recorded as an increase to the cost basis of securities purchased and/or a reduction of proceeds on a sale of securities. Such transaction costs are included in the determination of net realized and unrealized gain (loss) from investment transactions reported in the Statement of Operations and the Statement of Changes in Net Assets and the net realized and unrealized gains (losses) on securities per share in the Financial Highlights. Transaction costs are included in the calculation of the Fund’s net asset value and, accordingly, they reduce the Fund’s total returns. These transaction costs are not considered operating expenses and are not reflected in net investment income reported in the Statement of Operations and the Statement of Changes in Net Assets, or the net investment income per share and the
32 INVESCO COMSTOCK SELECT FUND
ratios of expenses and net investment income reported in the Financial Highlights, nor are they limited by any expense limitation arrangements between the Fund and the investment adviser.
The Fund allocates income and realized and unrealized capital gains and losses to a class based on the relative net assets of each class.
| C. | Country Determination - For the purposes of making investment selection decisions and presentation in the Schedule of Investments, the investment adviser may determine the country in which an issuer is located and/or credit risk exposure based on various factors. These factors include the laws of the country under which the issuer is organized, where the issuer maintains a principal office, the country in which the issuer derives 50% or more of its total revenues and the country that has the primary market for the issuer’s securities, as well as other criteria. Among the other criteria that may be evaluated for making this determination are the country in which the issuer maintains 50% or more of its assets, the type of security, financial guarantees and enhancements, the nature of the collateral and the sponsor organization. |
| D. | Distributions - Dividends and distributions to shareholders, which are determined in accordance with income tax regulations and may differ from accounting principles generally accepted in the United States of America (“GAAP”), are recorded on the ex-dividend date. Income and capital gain distributions, if any, are declared and paid quarterly or at other times as determined necessary by the Adviser. |
| E. | Federal Income Taxes - The Fund intends to comply with the requirements of Subchapter M of the Internal Revenue Code of 1986, as amended (the “Internal Revenue Code”), necessary to qualify as a regulated investment company and to distribute substantially all of the Fund’s taxable earnings to shareholders. As such, the Fund will not be subject to federal income taxes on otherwise taxable income (including net realized capital gain) that is distributed to shareholders. Therefore, no provision for federal income taxes is recorded in the financial statements. |
The Fund recognizes the tax benefits of uncertain tax positions only when the position is more likely than not to be sustained. Management has analyzed the Fund’s uncertain tax positions and concluded that no liability for unrecognized tax benefits should be recorded related to uncertain tax positions. Management is not aware of any tax positions for which it is reasonably possible that the total amounts of unrecognized tax benefits will change materially in the next 12 months.
The Fund files tax returns in the U.S. Federal jurisdiction and certain other jurisdictions. Generally, the Fund is subject to examinations by such taxing authorities for up to three years after the filing of the return for the tax period.
| F. | Expenses - Fees provided for under the Rule 12b-1 plan of a particular class of the Fund are charged to the operations of such class. Accounting fees attributable to Class R5 are charged to the operations of the class. Transfer agency fees and expenses and other shareholder recordkeeping fees and expenses relating to all other classes are allocated among those classes based on relative net assets. All other expenses are allocated among the classes based on relative net assets. |
| G. | Accounting Estimates - The financial statements are prepared on a basis in |
33 INVESCO COMSTOCK SELECT FUND
NOTES TO FINANCIAL STATEMENTS Continued
conformity with accounting principles generally accepted in the United States of America (“GAAP”), which requires management to make estimates and assumptions that affect the reported amounts of assets and liabilities at the date of the financial statements and the reported amounts of revenues and expenses during the reporting period including estimates and assumptions related to taxation. Actual results could differ from those estimates by a significant amount. In addition, the Fund monitors for material events or transactions that may occur or become known after the period-end date and before the date the financial statements are released to print.
| H. | Indemnifications - Under the Trust’s organizational documents, each Trustee, officer, employee or other agent of the Trust is indemnified against certain liabilities that may arise out of the performance of their duties to the Fund. Additionally, in the normal course of business, the Fund enters into contracts, including the Fund’s servicing agreements, that contain a variety of indemnification clauses. The Fund’s maximum exposure under these arrangements is unknown as this would involve future claims that may be made against the Fund that have not yet occurred. The risk of material loss as a result of such indemnification claims is considered remote. |
| I. | Foreign Currency Translations - Foreign currency is valued at the close of the NYSE based on quotations posted by banks and major currency dealers. Portfolio securities and other assets and liabilities denominated in foreign currencies are translated into U.S. dollar amounts at the date of valuation. Purchases and sales of portfolio securities (net of foreign taxes withheld on disposition) and income items denominated in foreign currencies are translated into U.S. dollar amounts on the respective dates of such transactions. The Fund does not separately account for the portion of the results of operations resulting from changes in foreign exchange rates on investments and the fluctuations arising from changes in market prices of securities held. The combined results of changes in foreign exchange rates and the fluctuation of market prices on investments (net of estimated foreign tax withholding) are included with the net realized and unrealized gain or loss from investments in the Statement of Operations. Reported net realized foreign currency gains or losses arise from (1) sales of foreign currencies, (2) currency gains or losses realized between the trade and settlement dates on securities transactions, and (3) the difference between the amounts of dividends, interest, and foreign withholding taxes recorded on the Fund’s books and the U.S. dollar equivalent of the amounts actually received or paid. Net unrealized foreign currency gains and losses arise from changes in the fair values of assets and liabilities, other than investments in securities at fiscal period end, resulting from changes in exchange rates. The Fund may invest in foreign securities, which may be subject to foreign taxes on income, gains on investments or currency repatriation, a portion of which may be recoverable. Foreign taxes, if any, are recorded based on the tax regulations and rates that exist in the foreign markets in which the Fund invests and are shown in the Statement of Operations. |
34 INVESCO COMSTOCK SELECT FUND
Note 2 – Advisory Fees and Other Fees Paid to Affiliates
The Trust has entered into a master investment advisory agreement with Invesco Advisers, Inc. (the “Adviser” or “Invesco”). Under the terms of the investment advisory agreement, the Fund accrues daily and pays monthly an advisory fee to the Adviser based on the annual rate of the Fund’s average daily net assets as follows:
| | | | |
| Fee Schedule* | | |
Up to $300 million | | | 0.625 | % |
Next $100 million | | | 0.500 | |
Next $4.6 billion | | | 0.450 | |
Over $5 billion | | | 0.430 | |
*The advisory fee paid by the Fund shall be reduced by any amounts paid by the Fund under the administrative services agreement with the Adviser.
For the six months ended April 30, 2020, the effective advisory fee rate incurred by the Fund was 0.49%.
Under the terms of a master sub-advisory agreement between the Adviser and each of Invesco Asset Management Deutschland GmbH, Invesco Asset Management Limited, Invesco Asset Management (Japan) Limited, Invesco Hong Kong Limited, Invesco Senior Secured Management, Inc. and Invesco Canada Ltd. and separate sub-advisory agreements with Invesco Capital Management LLC, and Invesco Asset Management (India) Private Limited (collectively, the “Affiliated Sub-Advisers”) the Adviser, not the Fund, will pay 40% of the fees paid to the Adviser to any such Affiliated Sub-Adviser(s) that provide(s) discretionary investment management services to the Fund based on the percentage of assets allocated to such Affiliated Sub-Adviser(s). Invesco has also entered into a Sub-Advisory Agreement with OppenheimerFunds, Inc. to provide discretionary management services to the Fund.
The Adviser has contractually agreed, through August 31, 2021, to waive advisory fees and/or reimburse expenses of all shares to the extent necessary to limit the total annual fund operating expenses after fee waiver and/or expense reimbursement (excluding certain items discussed below) of Class A, Class C, Class R, Class Y, Class R5 and Class R6 shares to 0.93%, 1.68%, 1.18%, 0.68%, 0.57% and 0.52%, respectively, of the Fund’s average daily net assets (the “expense limits”). In determining the Adviser’s obligation to waive advisory fees and/or reimburse expenses, the following expenses are not taken into account, and could cause total annual fund operating expenses after fee waivers and/or expense reimbursement to exceed the numbers reflected above: (1) interest; (2) taxes; (3) dividend expenses on short sales; (4) extraordinary or non-routine items, including litigation expenses; and (5) expenses that the Fund has incurred but did not actually pay because of an expense offset arrangement. Unless Invesco continues the fee waiver agreement, it will terminate on August 31, 2021. During its term, the fee waiver agreement cannot be terminated or amended to increase the expense limits or reduce the advisory fee waiver without approval of the Board of Trustees.
Further, the Adviser has contractually agreed, through at least June 30, 2022, to waive the advisory fee payable by the Fund in an amount equal to 100% of the net advisory fees the Adviser receives from the affiliated money market funds on investments by the Fund of uninvested cash in such affiliated money market funds.
35 INVESCO COMSTOCK SELECT FUND
NOTES TO FINANCIAL STATEMENTS Continued
For the six months ended April 30, 2020, the Adviser waived advisory fees of $18,197 and reimbursed Fund expenses of $86,469, $8,167, $7,473, $10,119 and $48,624 for Class A, Class C, Class R, Class Y and Class R6, respectively.
The Trust has entered into a master administrative services agreement with Invesco pursuant to which the Fund has agreed to pay Invesco for certain administrative costs incurred in providing accounting services to the Fund. For the six months ended April 30, 2020, expenses incurred under the agreement are shown in the Statement of Operations as Administration fees. Additionally, Invesco has entered into service agreements whereby Citibank, N.A. serves as custodian to the Fund.
The Trust has entered into a transfer agency and service agreement with Invesco Investment Services, Inc. (“IIS”) pursuant to which the Fund has agreed to pay IIS a fee for providing transfer agency and shareholder services to the Fund and reimburse IIS for certain expenses incurred by IIS in the course of providing such services. IIS may make payments to intermediaries that provide omnibus account services, sub-accounting services and/or networking services. All fees payable by IIS to intermediaries that provide omnibus account services or sub-accounting services are charged back to the Fund, subject to certain limitations approved by the Trust’s Board of Trustees. For the six months ended April 30, 2020, expenses incurred under these agreements are shown in the Statement of Operations as Transfer and shareholder servicing agent fees.
The Trust has entered into master distribution agreements with Invesco Distributors, Inc. (“IDI”) to serve as the distributor for the Class A, Class C, Class R, Class Y, Class R5 and Class R6 shares of the Fund. The Trust has adopted plans pursuant to Rule 12b-1 under the 1940 Act with respect to the Fund’s Class A, Class C and Class R shares (collectively the “Plan”). The Fund, pursuant to the Class A Plan, reimburses IDI in an amount up to an annual rate of 0.25% of the average daily net assets of Class A shares. The Fund pursuant to the Class C and Class R Plan, pays IDI compensation at the annual rate of 1.00% of the average daily net assets of Class C shares and 0.50% of the average daily net assets of Class R shares. The fees are accrued daily and paid monthly. Of the Plan payments, up to 0.25% of the average daily net assets of each class of shares may be paid to furnish continuing personal shareholder services to customers who purchase and own shares of such classes. Any amounts not paid as a service fee under the Plan would constitute an asset-based sales charge. Rules of the Financial Industry Regulatory Authority (“FINRA”) impose a cap on the total sales charges, including asset-based sales charges, that may be paid by any class of shares of the Fund plans. For the six months ended April 30, 2020, expenses incurred under the plans are shown in the Statement of Operations as Distribution and service plan fees.
Front-end sales commissions and CDSC (collectively, the “sales charges”) are not recorded as expenses of the Fund. Front-end sales commissions are deducted from proceeds from the sales of Fund shares prior to investment in Class A shares of the Fund. CDSC are deducted from redemption proceeds prior to remittance to the shareholder. During the six months ended April 30, 2020, IDI advised the Fund that IDI retained $32,411 in front-end sales commissions from the sale of Class A shares and $685 and $319 from Class A and Class C shares, respectively, for CDSC imposed on redemptions by shareholders.
Certain officers and trustees of the Trust are officers and directors of the Adviser, IIS and/or IDI.
36 INVESCO COMSTOCK SELECT FUND
Note 3 – Additional Valuation Information
GAAP defines fair value as the price that would be received to sell an asset or paid to transfer a liability in an orderly transaction between market participants at the measurement date, under current market conditions. GAAP establishes a hierarchy that prioritizes the inputs to valuation methods, giving the highest priority to readily available unadjusted quoted prices in an active market for identical assets (Level 1) and the lowest priority to significant unobservable inputs (Level 3), generally when market prices are not readily available or are unreliable. Based on the valuation inputs, the securities or other investments are tiered into one of three levels. Changes in valuation methods may result in transfers in or out of an investment’s assigned level:
Level 1 — Prices are determined using quoted prices in an active market for identical assets.
Level 2 — Prices are determined using other significant observable inputs. Observable inputs are inputs that other market participants may use in pricing a security. These may include quoted prices for similar securities, interest rates, prepayment speeds, credit risk, yield curves, loss severities, default rates, discount rates, volatilities and others.
Level 3 — Prices are determined using significant unobservable inputs. In situations where quoted prices or observable inputs are unavailable (for example, when there is little or no market activity for an investment at the end of the period), unobservable inputs may be used. Unobservable inputs reflect the Fund’s own assumptions about the factors market participants would use in determining fair value of the securities or instruments and would be based on the best available information.
The following is a summary of the tiered valuation input levels, as of April 30, 2020. The level assigned to the securities valuations may not be an indication of the risk or liquidity associated with investing in those securities. Because of the inherent uncertainties of valuation, the values reflected in the financial statements may materially differ from the value received upon actual sale of those investments.
| | | | | | | | | | | | | | | | |
| | | Level 1—
Unadjusted
Quoted Prices | | | Level 2—
Other Significant
Observable Inputs | | | Level 3—
Significant
Unobservable
Inputs | | | Value | |
Assets Table | | | | | | | | | | | | | | | | |
Investments, at Value: | | | | | | | | | | | | | | | | |
Common Stocks | | | | | | | | | | | | | | | | |
Consumer Discretionary | | $ | 28,138,406 | | | $ | — | | | $ | — | | | $ | 28,138,406 | |
Consumer Staples | | | 51,215,063 | | | | — | | | | — | | | | 51,215,063 | |
Energy | | | 118,974,061 | | | | 23,012,961 | | | | — | | | | 141,987,022 | |
Financials | | | 261,576,652 | | | | — | | | | — | | | | 261,576,652 | |
Health Care | | | 99,503,808 | | | | 23,163,197 | | | | — | | | | 122,667,005 | |
Industrials | | | 114,528,223 | | | | — | | | | — | | | | 114,528,223 | |
Information Technology | | | 124,824,093 | | | | — | | | | — | | | | 124,824,093 | |
37 INVESCO COMSTOCK SELECT FUND
NOTES TO FINANCIAL STATEMENTS Continued
| | | | | | | | | | | | | | | | |
| | | Level 1—
Unadjusted
Quoted Prices | | | Level 2—
Other Significant
Observable Inputs | | | Level 3—
Significant
Unobservable
Inputs | | | Value | |
Common Stocks (Continued) | | | | | | | | | | | | | | | | |
Telecommunication Services | | $ | 46,028,866 | | | $ | — | | | $ | — | | | $ | 46,028,866 | |
Investment Company | | | 23,765,041 | | | | — | | | | — | | | | 23,765,041 | |
| | | | |
Total Assets | | $ | 868,554,213 | | | $ | 46,176,158 | | | $ | — | | | $ | 914,730,371 | |
| | | | |
Note 4 – Trustee and Officer Fees and Benefits
The Fund has adopted an unfunded retirement plan (the “Plan”) for the Fund’s Independent Trustees. Benefits are based on years of service and fees paid to each Trustee during their period of service. The Plan was frozen with respect to adding new participants effective December 31, 2006 (the “Freeze Date”) and existing Plan Participants as of the Freeze Date will continue to receive accrued benefits under the Plan. Active Independent Trustees as of the Freeze Date have each elected a distribution method with respect to their benefits under the Plan.
During the reporting period, the Fund’s projected benefit obligations, payments to retired Trustees and accumulated liability were as follows:
| | | | |
Projected Benefit Obligations Increased | | $ | 11,790 | |
Payments Made to Retired Trustees | | | — | |
Accumulated Liability as of April 30, 2020 | | | 107,073 | |
Certain trustees have executed Deferred Compensation Agreement(s) pursuant to which they have the option to elect to defer receipt of all or a portion of the annual compensation they are entitled to receive from the Fund. For purposes of determining the amount owed to the Trustee under the plan(s), deferred amounts are treated as though equal dollar amounts had been invested in shares of the Fund or in other Invesco and/or Invesco Oppenheimer funds selected by the Trustee. The Fund purchases shares of the funds selected for deferral by the Trustee in amounts equal to his or her deemed investment, resulting in a Fund asset equal to the deferred compensation liability. Such assets are included as a component of “Other” within the asset section of the Statement of Assets and Liabilities. Deferral of Trustees’ fees under the plan(s) will not affect the net assets of the Fund and will not materially affect the Fund’s assets, liabilities or net investment income per share. Amounts will be deferred until distributed in accordance with the Deferred Compensation Agreement(s).
Note 5 – Cash Balances
The Fund is permitted to temporarily carry a negative or overdrawn balance in its account with Citibank, N.A., the custodian bank. Such balances, if any at period-end, are shown in the Statement of Assets and Liabilities under the payable caption Amount due custodian. To compensate the custodian bank for such overdrafts, the overdrawn Fund may either (1) leave funds as a compensating balance in the account so the custodian bank can be compensated
38 INVESCO COMSTOCK SELECT FUND
by earning the additional interest; or (2) compensate by paying the custodian bank at a rate agreed upon by the custodian bank and Invesco, not to exceed the contractually agreed upon rate. Effective May 5, 2020 the custodian changed to State Street Bank and Trust.
Note 6 – Distributions to Shareholders and Tax Components of Net Assets
Tax Character of Distributions to Shareholders for the Six Months Ended April 30, 2020 and the Fiscal Years Ended October 31, 2019 and October 31, 2018:
| | | | | | | | | | | | |
| | | April 30, 2020 | | | October 31, 2019 | | | October 31, 2018 | |
Ordinary income | | $ | 11,964,234 | | | $ | 37,412,036 | | | $ | 32,084,732 | |
Long-term capital gain | | | 263,330,083 | | | | 168,859,339 | | | | 90,771,567 | |
| | | | |
Total distributions | | $ | 275,294,317 | | | $ | 206,271,375 | | | $ | 122,856,299 | |
| | | | |
Tax Components of Net Assets at Period-End:
| | | | |
| | | 2020 | |
Undistributed ordinary income | | $ | 4,501,610 | |
Net unrealized appreciation - investments | | | (125,496,629 | ) |
Temporary book/tax differences | | | (224,063 | ) |
Capital loss carryforward | | | (15,948,311 | ) |
Shares of beneficial interest | | | 1,054,377,928 | |
| | | | |
Total net assets | | $ | 917,210,535 | |
| | | | |
The difference between book-basis and tax-basis unrealized appreciation (depreciation) is due to differences in the timing of recognition of gains and losses on investments for tax and book purposes. The Fund’s net unrealized appreciation (depreciation) difference is attributable primarily to wash sales.
The temporary book/tax differences are a result of timing differences between book and tax recognition of income and/or expenses. The Fund’s temporary book/tax differences are the result of the trustee deferral of compensation and retirement plan benefits.
Capital loss carryforward is calculated and reported as of a specific date. Results of transactions and other activity after that date may affect the amount of capital loss carryforward actually available for the Fund to utilize. The ability to utilize capital loss carryforwards in the future may be limited under the Internal Revenue Code and related regulations based on the results of future transactions.
The Fund has a capital loss carryforward as of April 30, 2020, which expires as follows:
| | | | | | | | | | | | |
| Capital Loss Carryforward* | |
| Expiration | | Short-Term | | | Long-Term | | | Total | |
Not subject to expiration | | $ | 14,948,283 | | | $ | 1,000,028 | | | $ | 15,948,311 | |
* Capital loss carryforward as of the date listed above is reduced for limitations, if any, to the extent required by the Internal Revenue Code and may be further limited depending upon a variety of factors, including the realization of net unrealized gains or losses as of the date of any reorganization.
39 INVESCO COMSTOCK SELECT FUND
NOTES TO FINANCIAL STATEMENTS Continued
Note 7 – Investment Transactions
The aggregate amount of investment securities (other than short-term securities, U.S. Treasury obligations and money market funds, if any) purchased and sold by the Fund during the six months ended April 30, 2020 was $119,613,449 and $279,534,816, respectively. Cost of investments, including any derivatives, on a tax basis includes the adjustments for financial reporting purposes as of the most recently completed federal income tax reporting period-end.
| | | | |
| Unrealized Appreciation (Depreciation) of Investments on a Tax Basis | |
Aggregate unrealized appreciation of investments | | $ | 78,501,534 | |
Aggregate unrealized (depreciation) of investments | | | (203,998,163 | ) |
| | | | |
Net unrealized depreciation of investments | | $ | (125,496,629 | ) |
| | | | |
Cost of investments for tax purposes is $1,040,227,000.
Note 8 – Reclassification of Permanent Differences
Primarily as a result of differing book/tax treatment of post financial statement adjustments, distribution redesignation and reclass of foreign currency gain/loss to income, on April 30, 2020, undistributed net investment income was decreased by $281,809 and undistributed net realized loss was decreased by $281,809. This reclassification had no effect on the net assets of the Fund.
Note 9 – Share Information
Transactions in shares of beneficial interest were as follows:
| | | | | | | | | | | | | | | | | | | | | | | | |
| | | Six Months Ended April 30,
20201 | | | Year Ended October 31,
20192 | | | Year Ended October 31,
2018 | |
| | | Shares | | | Amount | | | Shares | | | Amount | | | Shares | | | Amount | |
Class A | | | | | | | | | | | | | | | | | | | | | | | | |
Sold | | | 1,118,330 | | | $ | 32,863,057 | | | | 1,060,281 | | | $ | 34,233,028 | | | | 977,275 | | | $ | 36,707,418 | |
Automatic Conversion Class C to Class A Shares | | | 74,255 | | | | 1,950,852 | | | | 1,229,180 | | | | 40,824,573 | | | | — | | | | — | |
Dividends and/or distributions reinvested | | | 4,119,323 | | | | 114,686,768 | | | | 1,923,295 | | | | 59,082,109 | | | | 810,043 | | | | 29,996,457 | |
Redeemed | | | (2,753,772 | ) | | | (72,696,085 | ) | | | (2,753,692 | ) | | | (89,581,921 | ) | | | (2,294,858 | ) | | | (86,269,656 | ) |
| | | | |
Net increase (decrease) | | | 2,558,136 | | | $ | 76,804,592 | | | | 1,459,064 | | | $ | 44,557,789 | | | | (507,540 | ) | | $ | (19,565,781 | ) |
| | | | |
40 INVESCO COMSTOCK SELECT FUND
| | | | | | | | | | | | | | | | | | | | | | | | |
| | | Six Months Ended April 30,
20201 | | Year Ended October 31,
2019 | | | Year Ended October 31,
2018 | |
| | | Shares | | Amount | | | Shares | | | Amount | | | Shares | | | Amount | |
Class B | | | | | | | | | | | | | | | | | | | | | | | | |
Sold | | | — | | | $ | — | | | | — | | | $ | — | | | | 219 | | | $ | 8,165 | |
Dividends and/or distributions reinvested | | | — | | | | — | | | | — | | | | — | | | | 1,731 | | | | 63,058 | |
Redeemed3 | | | — | | | | — | | | | — | | | | — | | | | (57,394) | | | | (2,125,169) | |
| | | | |
Net increase (decrease) | | | — | | | $ | — | | | | — | | | $ | — | | | | (55,444) | | | $ | (2,053,946) | |
| | | | |
| | | | | | | | | | | | | | | | | | | | | | | | |
Class C | | | | | | | | | | | | | | | | | | | | | | | | |
Sold | | | 112,370 | | | $ | 2,732,809 | | | | 222,306 | | | $ | 6,777,040 | | | | 257,267 | | | $ | 9,213,894 | |
Dividends and/or distributions reinvested | | | 346,858 | | | | 9,060,327 | | | | 388,781 | | | | 11,265,659 | | | | 165,335 | | | | 5,835,941 | |
Automatic Conversion Class C to Class A Shares | | | (79,346) | | | | (1,950,852) | | | | (1,297,309) | | | | (40,824,573) | | | | — | | | | — | |
Redeemed | | | (292,349) | | | | (6,886,545) | | | | (871,157) | | | | (26,961,005) | | | | (740,268) | | | | (26,488,076) | |
| | | | |
Net increase (decrease) | | | 87,533 | | | $ | 2,955,739 | | | | (1,557,379) | | | $ | (49,742,879) | | | | (317,666) | | | $ | (11,438,241) | |
| | | | |
| | | | | | | | | | | | | | | | | | | | | | | | |
Class R | | | | | | | | | | | | | | | | | | | | | | | | |
Sold | | | 107,716 | | | $ | 2,704,571 | | | | 146,681 | | | $ | 4,657,337 | | | | 170,566 | | | $ | 6,271,823 | |
Dividends and/or distributions reinvested | | | 298,062 | | | | 8,075,878 | | | | 151,671 | | | | 4,548,819 | | | | 61,844 | | | | 2,244,440 | |
Redeemed | | | (200,471) | | | | (5,349,686) | | | | (294,777) | | | | (9,438,862) | | | | (279,720) | | | | (10,321,116) | |
| | | | |
Net increase (decrease) | | | 205,307 | | | $ | 5,430,763 | | | | 3,575 | | | $ | (232,706) | | | | (47,310) | | | $ | (1,804,853) | |
| | | | |
| | | | | | | | | | | | | | | | | | | | | | | | |
Class Y | | | | | | | | | | | | | | | | | | | | | | | | |
Sold | | | 462,083 | | | $ | 12,039,021 | | | | 562,025 | | | $ | 18,728,830 | | | | 603,670 | | | $ | 23,178,710 | |
Dividends and/or distributions reinvested | | | 538,764 | | | | 15,512,550 | | | | 277,819 | | | | 8,756,144 | | | | 207,450 | | | | 7,844,569 | |
Redeemed | | | (1,692,830) | | | | (47,008,994) | | | | (787,167) | | | | (25,969,809) | | | | (2,536,439) | | | | (98,419,252) | |
| | | | |
Net increase (decrease) | | | (691,983) | | | $ | (19,457,423) | | | | 52,677 | | | $ | 1,515,165 | | | | (1,725,319) | | | $ | (67,395,973) | |
| | | | |
41 INVESCO COMSTOCK SELECT FUND
NOTES TO FINANCIAL STATEMENTS Continued
| | | | | | | | | | | | | | | | | | | | | | | | |
| | | Six Months Ended April 30,
20201 | | Year Ended October 31,
20192 | | | Year Ended October 31,
2018 | |
| | | Shares | | Amount | | | Shares | | | Amount | | | Shares | | | Amount | |
Class R54 | | | | | | | | | | | | | | | | | | | | | | | | |
Sold | | | — | | | $ | — | | | | 313 | | | $ | 10,000 | | | | — | | | $ | — | |
Dividends and/or distributions reinvested | | | — | | | | — | | | | — | | | | — | | | | — | | | | — | |
Redeemed | | | — | | | | — | | | | — | | | | — | | | | — | | | | — | |
| | | | |
Net increase (decrease) | | | — | | | $ | — | | | | 313 | | | $ | 10,000 | | | | — | | | $ | — | |
| | | | |
| | | | | | | | | | | | | | | | | | | | | | | | |
Class R6 | | | | | | | | | | | | | | | | | | | | | | | | |
Sold | | | 47,530 | | | $ | 1,530,832 | | | | 745,176 | | | $ | 24,198,024 | | | | 2,312,102 | | | $ | 88,843,129 | |
Dividends and/or distributions reinvested | | | 4,296,191 | | | | 122,758,577 | | | | 3,803,013 | | | | 119,301,253 | | | | 1,985,017 | | | | 75,010,485 | |
Redeemed | | | (3,242,205) | | | | (115,131,209) | | | | (14,163,335) | | | | (467,314,478) | | | | (10,560,365) | | | | (403,007,709) | |
| | | | |
Net increase (decrease) | | | 1,101,516 | | | $ | 9,158,200 | | | | (9,615,146) | | | $ | (323,815,201) | | | | (6,263,246) | | | $ | (239,154,095) | |
| | | | |
1. 46% of the outstanding shares of the Fund are owned by the Adviser or an affiliate of the Adviser.
2. 42% of the outstanding shares of the Fund are owned by the Adviser or an affiliate of the Adviser.
3. All outstanding Class B shares converted to Class A shares on June 1, 2018.
4. Commencement date after the close of business on May 24, 2019.
Note 10 - Coronavirus (COVID-19) Pandemic
During the first quarter of 2020, the World Health Organization declared COVID-19 to be a public health emergency. COVID-19 has led to increased short-term market volatility and may have adverse long-term effects on U.S. and world economies and markets in general. COVID-19 may adversely impact the Funds’ ability to achieve its investment objectives. Because of the uncertainties on valuation, the global economy and business operations, values reflected in these financial statements may materially differ from the value received upon actual sales of those investments.
The extent of the impact on the performance of the Fund and its investments will depend on future developments, including the duration and spread of the COVID-19 outbreak, related restrictions and advisories, and the effects on the financial markets and economy overall, all of which are highly uncertain and cannot be predicted.
42 INVESCO COMSTOCK SELECT FUND
REPORT OF INDEPENDENT REGISTERED PUBLIC ACCOUNTING FIRM
To the Board of Trustees of AIM Sector Funds (Invesco Sector Funds) and Shareholders of Invesco Comstock Select Fund
Opinion on the Financial Statements
We have audited the accompanying statement of assets and liabilities, including the schedule of investments, of Invesco Comstock Select Fund, formerly Invesco Oppenheimer Value Fund, (one of the funds constituting AIM Sector Funds (Invesco Sector Funds), referred to hereafter as the “Fund”) as of April 30, 2020, the related statements of operations and of changes in net assets, including the related notes, and the financial highlights for each of the periods indicated in the table below (collectively referred to as the “financial statements”). In our opinion, the financial statements present fairly, in all material respects, the financial position of the Fund as of April 30, 2020, the results of its operations, the changes in its net assets and the financial highlights for each of the periods indicated in the table below, in conformity with accounting principles generally accepted in the United States of America.
| | |
Statement of Operations and Statement
of Changes in Net Assets | | Financial Highlights |
| For the period from November 1, 2019 through April 30, 2020 and the year ended October 31, 2019 | | For the period from November 1, 2019 through April 30, 2020 and the year ended October 31, 2019 for Class A, Class C, Class R, Class Y and Class R6 For the period from November 1, 2019 through April 30, 2020 and the period from May 24, 2019 (inception of offering) through October 31, 2019 for Class R5 |
The financial statements of Invesco Comstock Select Fund (formerly Invesco Oppenheimer Value Fund) as of and for the year ended October 31, 2018 and the financial highlights for each of the periods ended on or prior to October 31, 2018 (not presented herein, other than the statement of changes in net assets and the financial highlights) were audited by other auditors whose report dated December 21, 2018 expressed an unqualified opinion on those financial statements and financial highlights.
Basis for Opinion
These financial statements are the responsibility of the Fund’s management. Our responsibility is to express an opinion on the Fund’s financial statements based on our audits. We are a public accounting firm registered with the Public Company Accounting Oversight Board (United States) (PCAOB) and are required to be independent with respect to the Fund in accordance with the U.S. federal securities laws and the applicable rules and regulations of
43 INVESCO COMSTOCK SELECT FUND
REPORT OF INDEPENDENT REGISTERED PUBLIC ACCOUNTING FIRM
the Securities and Exchange Commission and the PCAOB.
We conducted our audits of these financial statements in accordance with the standards of the PCAOB. Those standards require that we plan and perform the audit to obtain reasonable assurance about whether the financial statements are free of material misstatement, whether due to error or fraud.
Our audits included performing procedures to assess the risks of material misstatement of the financial statements, whether due to error or fraud, and performing procedures that respond to those risks. Such procedures included examining, on a test basis, evidence regarding the amounts and disclosures in the financial statements. Our audits also included evaluating the accounting principles used and significant estimates made by management, as well as evaluating the overall presentation of the financial statements. Our procedures included confirmation of securities owned as of April 30, 2020 by correspondence with the custodian and transfer agent. We believe that our audits provide a reasonable basis for our opinion.
/s/PricewaterhouseCoopers LLP
Houston, Texas
June 26, 2020
We have served as the auditor of one or more investment companies in the Invesco group of investment companies since at least 1995. We have not been able to determine the specific year we began serving as auditor.
44 INVESCO COMSTOCK SELECT FUND
TAX INFORMATION
Form 1099-DIV, Form 1042-S and other year–end tax information provide shareholders with actual calendar year amounts that should be included in their tax returns. Shareholders should consult their tax advisers.
The following distribution information is being provided as required by the Internal Revenue
Code or to meet a specific state’s requirement.
The Fund designates the following amounts or, if subsequently determined to be different, the maximum amount allowable for its six months ended April 30, 2020:
| | | | |
Federal and State Income Tax | | | | |
Long-Term Capital Gain Distributions | | $ | 263,330,083 | |
Qualified Dividend Income* | | | 100 | % |
Corporate Dividends Received Deduction* | | | 100 | % |
Qualified Business Income | | | 0.00 | % |
U.S. Treasury Obligations* | | | 0.00 | % |
Tax-Exempt Interest Dividends* | | | 0.00 | % |
* The above percentages are based on ordinary income dividends paid to shareholders during the Fund’s fiscal year.
45 INVESCO COMSTOCK SELECT FUND
PORTFOLIO PROXY VOTING POLICIES AND GUIDELINES;
UPDATES TO SCHEDULE OF INVESTMENTS
Go paperless with eDelivery
Visit invesco.com/edelivery to enjoy the convenience and security of anytime electronic access to your investment documents.
With eDelivery, you can elect to have any or all of the following materials delivered straight to your inbox to download, save and print from your own computer:
● Fund reports and prospectuses
● Quarterly statements
● Daily confirmations
● Tax forms
Invesco mailing information
Send general correspondence to Invesco Investment Services, Inc., P.O. Box 219078, Kansas City, MO 64121-9078.
Important notice regarding delivery of security holder documents
To reduce Fund expenses, only one copy of most shareholder documents may be mailed to shareholders with multiple accounts at the same address (Householding). Mailing of your shareholder documents may be householded indefinitely unless you instruct us otherwise. If you do not want the mailing of these documents to be combined with those for other members of your household, please contact Invesco Investment Services, Inc. at 800 959 4246 or contact your financial institution. We will begin sending you individual copies for each account within 30 days after receiving your request.
Fund holdings and proxy voting information
The Fund provides a complete list of its holdings four times in each fiscal year, at the quarter ends.
For the second and fourth quarters, the lists appear in the Fund’s semiannual and annual reports to shareholders. For the first and third quarters, the Fund files the lists with the Securities and Exchange Commission (SEC) as an exhibit to its reports on Form N-PORT. The most recent list of portfolio holdings is available at invesco.com/completeqtrholdings. Shareholders can also look up the Fund’s Forms N-PORT on the SEC website at sec.gov.
A description of the policies and procedures that the Fund uses to determine how to vote proxies relating to portfolio securities is available without charge, upon request, from our Client Services department at 800 959 4246 or at invesco.com/proxyguidelines. The information is also available on the SEC website, sec.gov.
Information regarding how the Fund voted proxies related to its portfolio securities during the most recent 12-month period ended June 30 is available at invesco.com/proxysearch. The information is also available on the SEC website, sec.gov.
Invesco Advisers, Inc. is an investment adviser; it provides investment advisory services to individual and institutional clients and does not sell securities. Invesco Distributors, Inc. is the US distributor for Invesco Ltd.’s retail mutual funds, exchange-traded funds and institutional money market funds. Both are wholly owned, indirect subsidiaries of Invesco Ltd.
46 INVESCO COMSTOCK SELECT FUND
TRUSTEES AND OFFICERS
The address of each trustee and officer is AIM Sector Funds (Invesco Sector Funds) (the “Trust”), 11 Greenway Plaza, Suite 1000, Houston, Texas 77046-1173. The trustees serve for the life of the Trust, subject to their earlier death, incapacitation, resignation, retirement or removal as more specifically provided in the Trust’s organizational documents. Each officer serves for a one year term or until their successors are elected and qualified. Column two below includes length of time served with predecessor entities, if any.
| | | | | | | | | | |
Name, Year of Birth and
Position(s) Held with the Trust | | Trustee and/or Officer Since | | Principal Occupation(s)
During Past 5 Years | | | | Number of Funds in
Fund Complex
Overseen by Trustee | | Other Directorship(s)
Held by Trustee During
Past 5 Years |
INTERESTED TRUSTEE | | | | | | | | | | |
Martin L. Flanagan 1 — 1960 Trustee and Vice Chair | | 2007 | | Executive Director, Chief Executive Officer and President, Invesco Ltd. (ultimate parent of Invesco and a global investment management firm); Trustee and Vice Chair, The Invesco Funds; Vice Chair, Investment Company Institute; and Member of Executive Board, SMU Cox School of Business Formerly: Advisor to the Board, Invesco Advisers, Inc. (formerly known as Invesco Institutional (N.A.), Inc.); Chairman and Chief Executive Officer, Invesco Advisers, Inc. (registered investment adviser); Director, Chairman, Chief Executive Officer and President, Invesco Holding Company (US), Inc. (formerly IVZ Inc.) (holding company), Invesco Group Services, Inc. (service provider) and Invesco North American Holdings, Inc. (holding company); Director, Chief Executive Officer and President, Invesco Holding Company Limited (parent of Invesco and a global investment management firm); Director, Invesco Ltd.; Chairman, Investment Company Institute and President, Co-Chief Executive Officer, Co-President, Chief Operating Officer and Chief Financial Officer, Franklin Resources, Inc. (global investment management organization) | | | | 203 | | None |
| 1 Mr. Flanagan is considered an interested person (within the meaning of Section 2(a)(19) of the 1940 Act) of the Trust because he is an officer of the Adviser to the Trust, and an officer and a director of Invesco Ltd., ultimate parent of the Adviser. |
47 INVESCO COMSTOCK SELECT FUND
TRUSTEES AND OFFICERS Continued
| | | | | | | | |
Name, Year of Birth and
Position(s) Held with the Trust | | Trustee and/or Officer Since | | Principal Occupation(s)
During Past 5 Years | | Number of Funds in
Fund Complex
Overseen by Trustee | | Other Directorship(s)
Held by Trustee During
Past 5 Years |
INDEPENDENT TRUSTEES | | | | | | | | |
Bruce L. Crockett – 1944 Trustee and Chair | | 2003 | | Chairman, Crockett Technologies Associates (technology consulting company) Formerly: Director, Captaris (unified messaging provider); Director, President and Chief Executive Officer, COMSAT Corporation; Chairman, Board of Governors of INTELSAT (international communications company); ACE Limited (insurance company); Independent Directors Council and Investment Company Institute: Member of the Audit Committee, Investment Company Institute; Member of the Executive Committee and Chair of the Governance Committee, Independent Directors Council | | 203 | | Director and Chairman of the Audit Committee, ALPS (Attorneys Liability Protection Society) (insurance company); Director and Member of the Audit Committee and Compensation Committee, Ferroglobe PLC (metallurgical company) |
David C. Arch – 1945 Trustee | | 2010 | | Chairman of Blistex Inc. (consumer health care products manufacturer); Member, World Presidents’ Organization | | 203 | | Board member of the Illinois Manufacturers’ Association |
Beth Ann Brown – 1968 Trustee | | 2019 | | Independent Consultant Formerly: Head of Intermediary Distribution, Managing Director, Strategic Relations, Managing Director, Head of National Accounts, Senior Vice President, National Account Manager and Senior Vice President, Key Account Manager, Columbia Management Investment Advisers LLC; Vice President, Key Account Manager, Liberty Funds Distributor, Inc.; and Trustee of certain Oppenheimer Funds | | 203 | | Director, Board of Directors of Caron Engineering Inc.; Advisor, Board of Advisors of Caron Engineering Inc.; President and Director, of Acton Shapleigh Youth Conservation Corps (non-profit); and President and Director of Grahamtastic Connection (non-profit) |
Jack M. Fields – 1952 Trustee | | 2003 | | Chief Executive Officer, Twenty First Century Group, Inc. (government affairs company); and Chairman, Discovery Learning Alliance (non-profit) Formerly: Owner and Chief Executive Officer, Dos Angeles Ranch L.P. (cattle, hunting, corporate entertainment); Director, Insperity, Inc. (formerly known as Administaff) (human resources provider); Chief Executive Officer, Texana Timber LP (sustainable forestry company); Director of Cross Timbers Quail Research Ranch (non-profit); and member of the U.S. House of Representatives | | 203 | | Member, Board of Directors of Baylor College of Medicine |
48 INVESCO COMSTOCK SELECT FUND
| | | | | | | | |
Name, Year of Birth and
Position(s) Held with the Trust | | Trustee and/or Officer Since | | Principal Occupation(s)
During Past 5 Years | | Number of Funds in
Fund Complex
Overseen by Trustee | | Other Directorship(s)
Held by Trustee During
Past 5 Years |
| INDEPENDENT TRUSTEES (CONTINUED) | | | | | | | | |
Cynthia Hostetler —1962 Trustee | | 2017 | | Non-Executive Director and Trustee of a number of public and private business corporations Formerly: Director, Aberdeen Investment Funds (4 portfolios); Head of Investment Funds and Private Equity, Overseas Private Investment Corporation; President, First Manhattan Bancorporation, Inc.; Attorney, Simpson Thacher & Bartlett LLP | | 203 | | Vulcan Materials Company (construction materials company); Trilinc Global Impact Fund; Genesee & Wyoming, Inc. (railroads); Artio Global Investment LLC (mutual fund complex); Edgen Group, Inc. (specialized energy and infrastructure products distributor); Investment Company Institute (professional organization); Independent Directors Council (professional organization) |
Eli Jones – 1961 Trustee | | 2016 | | Professor and Dean, Mays Business School - Texas A&M University Formerly: Professor and Dean, Walton College of Business, University of Arkansas and E.J. Ourso College of Business, Louisiana State University; Director, Arvest Bank | | 203 | | Insperity, Inc. (formerly known as Administaff) (human resources provider) |
Elizabeth Krentzman – 1959 Trustee | | 2019 | | Formerly: Principal and Chief Regulatory Advisor for Asset Management Services and U.S. Mutual Fund Leader of Deloitte & Touche LLP; General Counsel of the Investment Company Institute (trade association); National Director of the Investment Management Regulatory Consulting Practice, Principal, Director and Senior Manager of Deloitte & Touche LLP; Assistant Director of the Division of Investment Management - Office of Disclosure and Investment Adviser Regulation of the U.S. Securities and Exchange Commission and various positions with the Division of Investment Management – Office of Regulatory Policy of the U.S. Securities and Exchange Commission; Associate at Ropes & Gray LLP.; and Trustee of certain Oppenheimer Funds | | 203 | | Trustee of the University of Florida National Board Foundation; Member of the Cartica Funds Board of Directors (private investment funds); Member of the University of Florida Law Center Association, Inc. Board of Trustees and Audit Committee Member |
49 INVESCO COMSTOCK SELECT FUND
TRUSTEES AND OFFICERS Continued
| | | | | | | | |
Name, Year of Birth and
Position(s) Held with the Trust | | Trustee and/or Officer Since | | Principal Occupation(s)
During Past 5 Years | | Number of Funds in
Fund Complex
Overseen by Trustee | | Other Directorship(s)
Held by Trustee During
Past 5 Years |
| INDEPENDENT TRUSTEES (CONTINUED) | | | | | | | | |
Anthony J. LaCava, Jr. – 1956 Trustee | | 2019 | | Formerly: Director and Member of the Audit Committee, Blue Hills Bank (publicly traded financial institution) and Managing Partner, KPMG LLP | | 203 | | Blue Hills Bank; Chairman of Bentley University; Member, Business School Advisory Council; and Nominating Committee, KPMG LLP |
Prema Mathai-Davis – 1950 Trustee | | 2003 | | Retired Formerly; Co-Founder & Partner of Quantalytics Research, LLC, (a FinTech Investment Research Platform for the Self- Directed Investor) | | 203 | | None |
Joel W. Motley – 1952 Trustee | | 2019 | | Director of Office of Finance, Federal Home Loan Bank System; Member of the Vestry of Trinity Wall Street; Managing Director of Carmona Motley Hoffman, Inc. (privately held financial advisor); Member of the Council on Foreign Relations and its Finance and Budget Committee; Chairman Emeritus of Board of Human Rights Watch and Member of its Investment Committee; and Member of Investment Committee and Board of Historic Hudson Valley (non-profit cultural organization). Formerly: Managing Director of Public Capital Advisors, LLC (privately held financial advisor); Managing Director of Carmona Motley Hoffman, Inc. (privately held financial advisor); Trustee of certain Oppenheimer Funds; and Director of Columbia Equity Financial Corp. (privately held financial advisor) | | 203 | | Member of Board of Greenwall Foundation (bioethics research foundation) and its Investment Committee; Member of Board of Friends of the LRC (non-profit legal advocacy); Board Member and Investment Committee Member of Pulitzer Center for Crisis Reporting (non-profit journalism) |
Teresa M. Ressel – 1962 Trustee | | 2017 | | Non-executive director and trustee of a number of public and private business corporations Formerly: Chief Financial Officer, Olayan America, The Olayan Group (international investor/commercial/industrial); Chief Executive Officer, UBS Securities LLC; Group Chief Operating Officer, Americas, UBS AG; Assistant Secretary for Management & Budget and CFO, US Department of the Treasury | | 203 | | Atlantic Power Corporation (power generation company); ON Semiconductor Corp. (semiconductor supplier) |
50 INVESCO COMSTOCK SELECT FUND
| | | | | | | | |
Name, Year of Birth and
Position(s) Held with the Trust | | Trustee and/or Officer Since | | Principal Occupation(s)
During Past 5 Years | | Number of Funds in
Fund Complex
Overseen by Trustee | | Other Directorship(s)
Held by Trustee During
Past 5 Years |
| INDEPENDENT TRUSTEES (CONTINUED) | | | | | | | | |
Ann Barnett Stern – 1957 Trustee | | 2017 | | President and Chief Executive Officer, Houston Endowment Inc. (private philanthropic institution) Formerly: Executive Vice President and General Counsel, Texas Children’s Hospital; Attorney, Beck, Redden and Secrest, LLP; Business Law Instructor, University of St. Thomas; Attorney, Andrews & Kurth LLP | | 203 | | Federal Reserve Bank of Dallas |
Robert C. Troccoli – 1949 Trustee | | 2016 | | Retired Formerly: Adjunct Professor, University of Denver – Daniels College of Business, Senior Partner, KPMG LLP | | 203 | | None |
Daniel S. Vandivort –1954 Trustee | | 2019 | | Treasurer, Chairman of the Audit and Finance Committee, and Trustee, Board of Trustees, Huntington Disease Foundation of America; and President, Flyway Advisory Services LLC (consulting and property management). Formerly: Trustee and Governance Chair, of certain Oppenheimer Funds | | 203 | | Chairman and Lead Independent Director, Chairman of the Audit Committee, and Director, Board of Directors, Value Line Funds |
James D. Vaughn – 1945 Trustee | | 2019 | | Retired Formerly: Managing Partner, Deloitte & Touche LLP; Trustee and Chairman of the Audit Committee, Schroder Funds; Board Member, Mile High United Way, Boys and Girls Clubs, Boy Scouts, Colorado Business Committee for the Arts, Economic Club of Colorado and Metro Denver Network (economic development corporation); and Trustee of certain Oppenheimer Funds | | 203 | | Board member and Chairman of Audit Committee of AMG National Trust Bank; Trustee and Investment Committee member, University of South Dakota Foundation; Board member, Audit Committee Member and past Board Chair, Junior Achievement (non-profit) |
Christopher L. Wilson – 1957 Trustee, Vice Chair and Chair Designate | | 2017 | | Retired Formerly: Director, TD Asset Management USA Inc. (mutual fund complex) (22 portfolios); Managing Partner, CT2, LLC (investing and consulting firm); President/Chief Executive Officer, Columbia Funds, Bank of America Corporation; President/Chief Executive Officer, CDC IXIS Asset Management Services, Inc.; | | 203 | | ISO New England, Inc. (non-profit organization managing regional electricity market) |
51 INVESCO COMSTOCK SELECT FUND
TRUSTEES AND OFFICERS Continued
| | | | | | | | |
Name, Year of Birth and
Position(s) Held with the Trust | | Trustee and/or Officer Since | | Principal Occupation(s)
During Past 5 Years | | Number of Funds in
Fund Complex
Overseen by Trustee | | Other Directorship(s)
Held by Trustee During
Past 5 Years |
| INDEPENDENT TRUSTEES (CONTINUED) | | | | | | | | |
Christopher L. Wilson Continued | | | | Principal & Director of Operations, Scudder Funds, Scudder, Stevens & Clark, Inc.; Assistant Vice President, Fidelity Investments | | | | |
52 INVESCO COMSTOCK SELECT FUND
| | | | | | | | |
Name, Year of Birth and
Position(s) Held with the Trust | | Trustee and/or Officer Since | | Principal Occupation(s)
During Past 5 Years | | Number of Funds
in Fund Complex
Overseen by Trustee | | Other Directorship(s)
Held by Trustee During
Past 5 Years |
| OFFICERS | | | | | | | | |
Sheri Morris — 1964 President, Principal Executive Officer and Treasurer | | 2003 | | Head of Global Fund Services, Invesco Ltd.; President, Principal Executive Officer and Treasurer, The Invesco Funds; Vice President, Invesco Advisers, Inc. (formerly known as Invesco Institutional (N.A.), Inc.) (registered investment adviser); and Vice President, Invesco Exchange-Traded Fund Trust, Invesco Exchange-Traded Fund Trust II, Invesco India Exchange-Traded Fund Trust, Invesco Actively Managed Exchange-Traded Fund Trust, Invesco Actively Managed Exchange-Traded Commodity Fund Trust and Invesco Exchange- Traded Self-Indexed Fund Trust, and Vice President, OppenheimerFunds, Inc. Formerly: Vice President and Principal Financial Officer, The Invesco Funds; Vice President, Invesco AIM Advisers, Inc., Invesco AIM Capital Management, Inc. and Invesco AIM Private Asset Management, Inc.; Assistant Vice President and Assistant Treasurer, The Invesco Funds and Assistant Vice President, Invesco Advisers, Inc., Invesco AIM Capital Management, Inc. and Invesco AIM Private Asset Management, Inc.; and Treasurer, Invesco Exchange-Traded Fund Trust, Invesco Exchange-Traded Fund Trust II, Invesco India Exchange-Traded Fund Trust and Invesco Actively Managed Exchange-Traded Fund Trust | | N/A | | N/A |
| | | | | |
Russell C. Burk — 1958 Senior Vice President and Senior Officer | | 2005 | | Senior Vice President and Senior Officer, The Invesco Funds | | N/A | | N/A |
| | | | | |
Jeffrey H. Kupor – 1968 Senior Vice President, Chief Legal Officer and Secretary | | 2018 | | Head of Legal of the Americas, Invesco Ltd.; Senior Vice President and Secretary, Invesco Advisers, Inc. (formerly known as Invesco Institutional (N.A.), Inc.) (registered investment adviser); Senior Vice President and Secretary, Invesco Distributors, Inc. (formerly known as Invesco AIM Distributors, Inc.); Vice President and Secretary, Invesco Investment Services, Inc. (formerly known as Invesco AIM Investment Services, Inc.) Senior Vice President, Chief Legal Officer and Secretary, The Invesco Funds; Secretary and General Counsel, Invesco Investment Advisers LLC (formerly known as Van Kampen Asset Management); Secretary and General Counsel, Invesco Capital Markets, Inc. (formerly known as Van Kampen Funds Inc.) and Chief Legal | | N/A | | N/A |
53 INVESCO COMSTOCK SELECT FUND
TRUSTEES AND OFFICERS Continued
| | | | | | | | |
Name, Year of Birth and
Position(s) Held with the Trust | | Trustee and/or Officer Since | | Principal Occupation(s)
During Past 5 Years | | Number of Funds
in Fund Complex
Overseen by Trustee | | Other Directorship(s)
Held by Trustee During
Past 5 Years |
OFFICERS (CONTINUED) | | | | | | | | |
| Jeffrey H. Kupor (Continued) | | | | Officer, Invesco Exchange-Traded Fund Trust, Invesco Exchange-Traded Fund Trust II, Invesco India Exchange-Traded Fund Trust, Invesco Actively Managed Exchange-Traded Fund Trust, Invesco Actively Managed Exchange- Traded Commodity Fund Trust and Invesco Exchange-Traded Self-Indexed Fund Trust; Secretary, Invesco Indexing LLC; Secretary, W.L. Ross & Co., LLC Formerly: Secretary and Vice President, Jemstep, Inc.; Head of Legal, Worldwide Institutional, Invesco Ltd.; Secretary and General Counsel, INVESCO Private Capital Investments, Inc.; Senior Vice President, Secretary and General Counsel, Invesco Management Group, Inc. (formerly known as Invesco AIM Management Group, Inc.); Assistant Secretary, INVESCO Asset Management (Bermuda) Ltd.; Secretary and General Counsel, Invesco Private Capital, Inc.; Assistant Secretary and General Counsel, INVESCO Realty, Inc.; Secretary and General Counsel, Invesco Senior Secured Management, Inc.; and Secretary, Sovereign G./P. Holdings Inc. | | | | |
Andrew R. Schlossberg – 1974 Senior Vice President | | 2019 | | Head of the Americas and Senior Managing Director, Invesco Ltd.; Director and Senior Vice President, Invesco Advisers, Inc. (formerly known as Invesco Institutional (N.A.), Inc.) (registered investment adviser); Director and Chairman, Invesco Investment Services, Inc. (formerly known as Invesco AIM Investment Services, Inc.) (registered transfer agent); Senior Vice President, The Invesco Funds; Director, Invesco Investment Advisers LLC (formerly known as Van Kampen Asset Management); Director, President and Chairman, Invesco Insurance Agency, Inc. Formerly: Director, Invesco UK Limited; Director and Chief Executive, Invesco Asset Management Limited and Invesco Fund Managers Limited; Assistant Vice President, The Invesco Funds; Senior Vice President, Invesco Advisers, Inc. (formerly known as Invesco Institutional (N.A.), Inc.) (registered investment adviser); Director and Chief Executive, Invesco Administration Services | | N/A | | N/A |
54 INVESCO COMSTOCK SELECT FUND
| | | | | | | | |
Name, Year of Birth and
Position(s) Held with the Trust | | Trustee and/or Officer Since | | Principal Occupation(s)
During Past 5 Years | | Number of Funds
in Fund Complex
Overseen by Trustee | | Other Directorship(s)
Held by Trustee During
Past 5 Years |
OFFICERS (CONTINUED) | | | | | | | | |
| Andrew R. Schlossberg (Continued) | | | | Limited and Invesco Global Investment Funds Limited; Director, Invesco Distributors, Inc.; Head of EMEA, Invesco Ltd.; President, Invesco Actively Managed Exchange-Traded Commodity Fund Trust, Invesco Actively Managed Exchange-Traded Fund Trust, Invesco Exchange-Traded Fund Trust, Invesco Exchange-Traded Fund Trust II and Invesco India Exchange-Traded Fund Trust; Managing Director and Principal Executive Officer, Invesco Capital Management LLC | | | | |
John M. Zerr — 1962 Senior Vice President | | 2006 | | Chief Operating Officer of the Americas; Senior Vice President, Invesco Advisers, Inc. (formerly known as Invesco Institutional (N.A.), Inc.) (registered investment adviser); Senior Vice President, Invesco Distributors, Inc. (formerly known as Invesco AIM Distributors, Inc.); Director and Vice President, Invesco Investment Services, Inc. (formerly known as Invesco AIM Investment Services, Inc.) Senior Vice President, The Invesco Funds; Managing Director, Invesco Capital Management LLC; Director, Invesco Investment Advisers LLC (formerly known as Van Kampen Asset Management); Senior Vice President, Invesco Capital Markets, Inc. (formerly known as Van Kampen Funds Inc.); Manager, Invesco Indexing LLC; Manager, Invesco Specialized Products, LLC; Director and Senior Vice President, Invesco Insurance Agency, Inc.; Member, Invesco Canada Funds Advisory Board; Director, President and Chief Executive Officer, Invesco Corporate Class Inc. (corporate mutual fund company); and Director, Chairman, President and Chief Executive Officer, Invesco Canada Ltd. (formerly known as Invesco Trimark Ltd./Invesco Trimark Ltèe) (registered investment adviser and registered transfer agent); President, Invesco, Inc.; President, Invesco Global Direct Real Estate Feeder GP Ltd.; President, Invesco IP Holdings (Canada) Ltd; President, Invesco Global Direct Real Estate GP Ltd.; President, Invesco Financial Services Ltd. / Services Financiers Invesco Ltée; and President, Trimark Investments Ltd./Placements Trimark Ltée Formerly: Director and Senior Vice President, Invesco Management Group, Inc. (formerly | | N/A | | N/A |
55 INVESCO COMSTOCK SELECT FUND
TRUSTEES AND OFFICERS Continued
| | | | | | | | |
Name, Year of Birth and
Position(s) Held with the Trust | | Trustee and/or Officer Since | | Principal Occupation(s)
During Past 5 Years | | Number of Funds
in Fund Complex
Overseen by Trustee | | Other Directorship(s)
Held by Trustee During
Past 5 Years |
OFFICERS (CONTINUED) | | | | | | | | |
| John M. Zerr (Continued) | | | | known as Invesco AIM Management Group, Inc.); Secretary and General Counsel, Invesco Management Group, Inc. (formerly known as Invesco AIM Management Group, Inc.); Secretary, Invesco Investment Services, Inc. (formerly known as Invesco AIM Investment Services, Inc.); Chief Legal Officer and Secretary, The Invesco Funds; Secretary and General Counsel, Invesco Investment Advisers LLC (formerly known as Van Kampen Asset Management); Secretary and General Counsel, Invesco Capital Markets, Inc. (formerly known as Van Kampen Funds Inc.); Chief Legal Officer, Invesco Exchange-Traded Fund Trust, Invesco Exchange-Traded Fund Trust II, Invesco India Exchange-Traded Fund Trust, Invesco Actively Managed Exchange-Traded Fund Trust, Invesco Actively Managed Exchange- Traded Commodity Fund Trust and Invesco Exchange-Traded Self-Indexed Fund Trust; Secretary, Invesco Indexing LLC; Director, Secretary, General Counsel and Senior Vice President, Van Kampen Exchange Corp.; Director, Vice President and Secretary, IVZ Distributors, Inc. (formerly known as INVESCO Distributors, Inc.); Director and Vice President, INVESCO Funds Group, Inc.; Director and Vice President, Van Kampen Advisors Inc.; Director, Vice President, Secretary and General Counsel, Van Kampen Investor Services Inc.; Director and Secretary, Invesco Distributors, Inc. (formerly known as Invesco AIM Distributors, Inc.); Director, Senior Vice President, General Counsel and Secretary, Invesco AIM Advisers, Inc. and Van Kampen Investments Inc.; Director, Vice President and Secretary, Fund Management Company; Director, Senior Vice President, Secretary, General Counsel and Vice President, Invesco AIM Capital Management, Inc.; Chief Operating Officer and General Counsel, Liberty Ridge Capital, Inc. (an investment adviser) | | | | |
Gregory G. McGreevey — 1962 Senior Vice President | | 2012 | | Senior Managing Director, Invesco Ltd.; Director, Chairman, President, and Chief Executive Officer, Invesco Advisers, Inc. (formerly known as Invesco Institutional (N.A.), Inc.) (registered investment adviser); Director, Invesco Mortgage Capital, Inc. and Invesco Senior Secured Management, Inc.; | | N/A | | N/A |
56 INVESCO COMSTOCK SELECT FUND
| | | | | | | | |
Name, Year of Birth and
Position(s) Held with the Trust | | Trustee and/or Officer Since | | Principal Occupation(s)
During Past 5 Years | | Number of Funds
in Fund Complex
Overseen by Trustee | | Other Directorship(s)
Held by Trustee During
Past 5 Years |
OFFICERS (CONTINUED) | | | | | | | | |
| Gregory G. McGreevey (Continued) | | | | and Senior Vice President, The Invesco Funds; and President, SNW Asset Management Corporation and Invesco Managed Accounts, LLC Formerly: Senior Vice President, Invesco Management Group, Inc. and Invesco Advisers, Inc.; Assistant Vice President, The Invesco Funds | | | | |
Kelli Gallegos – 1970 Vice President, Principal Financial Officer and Assistant Treasurer | | 2008 | | Principal Financial and Accounting Officer – Investments Pool, Invesco Specialized Products, LLC; Vice President, Principal Financial Officer and Assistant Treasurer, The Invesco Funds; Principal Financial and Accounting Officer – Pooled Investments, Invesco Capital Management LLC; Vice President and Treasurer, Invesco Exchange- Traded Fund Trust, Invesco Exchange-Traded Fund Trust II, Invesco India Exchange-Traded Fund Trust, Invesco Actively Managed Exchange-Traded Fund Trust, Invesco Actively Managed Exchange-Traded Commodity Fund Trust and Invesco Exchange-Traded Self- Indexed Fund Trust; Vice President, Invesco Advisers, Inc. Formerly: Assistant Treasurer, Invesco Specialized Products, LLC; Assistant Treasurer, Invesco Exchange-Traded Fund Trust, Invesco Exchange-Traded Fund Trust II, Invesco India Exchange-Traded Fund Trust, Invesco Actively Managed Exchange-Traded Fund Trust, Invesco Actively Managed Exchange-Traded Commodity Fund Trust and Invesco Exchange- Traded Self-Indexed Fund Trust; Assistant Treasurer, Invesco Capital Management LLC; Assistant Vice President, The Invesco Funds | | N/A | | N/A |
Crissie M. Wisdom – 1969 Anti-Money Laundering Compliance Officer | | 2013 | | Anti-Money Laundering and OFAC Compliance Officer for Invesco U.S. entities including; Invesco Advisers, Inc. and its affiliates, Invesco Capital Markets, Inc., Invesco Distributors, Inc., Invesco Investment Services, Inc., The Invesco Funds, Invesco Capital Management, LLC, Invesco Trust Company; and Fraud Prevention Manager for Invesco Investment Services, Inc. | | N/A | | N/A |
57 INVESCO COMSTOCK SELECT FUND
TRUSTEES AND OFFICERS Continued
| | | | | | | | |
Name, Year of Birth and
Position(s) Held with the Trust | | Trustee and/or Officer Since | | Principal Occupation(s)
During Past 5 Years | | Number of Funds
in Fund Complex
Overseen by Trustee | | Other Directorship(s)
Held by Trustee During
Past 5 Years |
OFFICERS (CONTINUED) | | | | | | | | |
Todd F. Kuehl – 1969 Chief Compliance Officer | | 2020 | | Chief Compliance Officer, Invesco Advisers, Inc. (registered investment adviser); and Chief Compliance Officer, The Invesco Funds Formerly: Managing Director and Chief Compliance Officer, Legg Mason (Mutual Funds); Chief Compliance Officer, Legg Mason Private Portfolio Group (registered investment adviser) | | N/A | | N/A |
The Statement of Additional Information of the Trust includes additional information about the Fund’s Trustees and is available upon request, without charge, by calling 1.800.959.4246. Please refer to the Fund’s Statement of Additional Information for information on the Fund’s sub-advisers.
Office of the Fund
11 Greenway Plaza,
Suite 1000
Houston, TX 77046-1173
Counsel to the Fund
Stradley Ronon Stevens & Young,
LLP
2005 Market Street,
Suite 2600
Philadelphia, PA 19103-7018
Investment Adviser
Invesco Advisers, Inc.
1555 Peachtree Street, N.E.
Atlanta, GA 30309
Counsel to the
Independent Trustees
Goodwin Procter LLP
901 New York Avenue, N.W.
Washington, D.C. 20001
Distributor
Invesco Distributors, Inc.
11 Greenway Plaza,
Suite 1000
Houston, TX
77046-1173
Transfer Agent
Invesco Investment
Services, Inc.
11 Greenway Plaza,
Suite 1000
Houston, TX
77046-1173
Auditors
PricewaterhouseCoopers
LLP
1000 Louisiana Street,
Suite 5800
Houston, TX 77002-5021
Custodian
Citibank, N.A.
111 Wall Street
New York, NY 10005
58 INVESCO COMSTOCK SELECT FUND
Invesco recognizes the importance of protecting your personal and financial information when you visit our website located at www.invesco.com (the “Website”). The following information is designed to help you understand the information collection practices at this Website. We will not sell, share or rent your personally identifiable information to others in contravention of this Privacy Policy. When we refer to ourselves as “we” or “Invesco” in this Privacy Policy, we mean our entire company including our affiliates, such as subsidiaries.
By visiting this Website, you are accepting the practices described in this Privacy Policy. If you do not agree to this policy, you may not use this Website. This Privacy Policy is subject to change without notice, from time to time in our sole discretion. You acknowledge that by accessing the Website after we have posted changes to this Privacy Policy, you are agreeing to this Privacy Policy as modified. Please review the Terms of Use1 to learn of other terms and conditions applicable to your use of the Website.
Please note that this Privacy Policy is not an exclusive statement of our privacy principles across all products and services. Other privacy principles or policies may apply depending on the products or services you obtain from Invesco, or the jurisdiction in which you transact with Invesco.
This Privacy Policy was last updated on May 6, 2018.
Information We Collect and Use
We collect personal information you choose to submit to the Website in order to process transactions requested by you and meet our contractual obligations. For example, you can choose to provide your name, contact information, social security number, or tax identification number in connection with accessing your account, or you can choose to provide your personal information when you fill out a secure account question form. Any information collected about you from the Website can, from time to time, be associated with other identifying information we have about you.
In addition, we may gather information about you automatically through your use of the Website, e.g. your IP address, how you navigate the Website, the organization from which you are accessing the Website, and the websites that you access before and after you visit the Website.
When you access the Website, we may also collect information such as unique device identifiers, your screen resolution and other device settings, information about your location, and analytical information about how you use the device from which you are viewing the Website. Where applicable, we may ask your permission before collecting certain information, such as precise geolocation information.
From time to time, we use or augment the personal information we have about you with information obtained from third parties. For example, we use third party information to confirm contact or financial information or to better understand your interests by associating demographic information from third parties with the information you have provided.
How We Use Personal Information
We use your personal information to respond to your inquiries and provide the products and services you request. We also use your information from time to time to deliver the content and services we believe
59 INVESCO COMSTOCK SELECT FUND
| | | | |
| | INVESCO’S PRIVACY POLICY Continued |
| | |
you will find the most relevant and to provide customer service and support.
We also use the information you provide to further develop and improve our products and services. We aggregate and/or de-identify data about visitors to the Website for various business purposes including product and service development and improvement activities.
How We Share Personal Information
We collaborate with other companies and individuals to perform services for us and on our behalf and we collaborate with our affiliates, other companies and individuals with respect to particular products or services (“Providers”). Examples of Providers include data analysis firms, customer service and support providers, email and SMS vendors, and web-hosting and development companies. Some Providers collect information for us or on our behalf on our Website. These Providers can be provided with access to personal information needed to perform their functions.
We reserve the right to disclose your personal information as required by law, when we believe disclosure is necessary to comply with a regulatory requirement, judicial proceeding, court order or legal process served on us, to protect the safety, rights or property of our customers, the public or Invesco or to enforce the Terms of Use.
If we sell or transfer a business unit (such as a subsidiary) or an asset (such as a website) to another company, we will share your personal information with such company. You will receive notice of such an event and the new entity will inform you of any changes to the practices in this Privacy Policy. If the new entity wishes to make additional use of your information, you have the right to decline such use at that time.
We occasionally disclose aggregate or de-identified data that is not personally identifiable with third parties.
Cookies and Other Tools
Invesco and its Providers collect information about you by using cookies, tracking pixels and other technologies. We use this information to better understand, customize and improve user experience with our websites, services and offerings as well as to manage our advertising. For example, we use web analytics services that use these technologies to gather information to help us understand how visitors engage with and navigate our Website, e.g., how and when pages in a site are visited and by how many visitors. We are also able to offer our visitors a more customized, relevant experience on our sites using these technologies by delivering content and functionality based on your preferences and interests.
Depending on their purpose, some cookies will only operate for the length of a single browsing session, while others have a longer life span to ensure that they fulfill their longer-term purposes. Your web browser can be set to allow you to control whether you will accept cookies or reject cookies, to notify you each time a cookie is sent to your browser, or to delete cookies that have already been set. If your browser is set to reject cookies, certain aspects of the Website that are cookie-enabled will not recognize you when you return to the website, and some Website functionality may be lost. The “Help” section of your browser may tell you how to prevent your browser from accepting cookies. To find out more about cookies, visit www.aboutcookies.org.
60 INVESCO COMSTOCK SELECT FUND
Security
No data transmission over the internet can be 100% secure, so Invesco cannot ensure or warrant the security of any information you submit to us on this Website. However, Invesco seeks to protect your personal information from unauthorized access or use when you transact business on our Website using technical, administrative and procedural measures. Invesco makes no representation as to the reasonableness, efficacy, or appropriateness of the measures we use to safeguard such information.
Users are responsible for maintaining the secrecy of their own passwords. If you have reason to believe that your interaction with us is no longer secure (for example, if you feel that the security of any account you might have with us has been compromised), please immediately notify us by contacting us as specified below.
Transfer of Data to Other Countries
Any information you provide to Invesco through use of the Website may be stored and processed, transferred between and accessed from the United States, Canada and other countries which do not guarantee the same level of protection of personal information as the one in which you reside. However, Invesco will handle your personal information in accordance with this Privacy Policy regardless of where your personal information is stored/accessed.
Children’s Privacy
We are committed to protecting the privacy of children. We do not knowingly collect personal information from children under the age of 18. If you are under the age of 18, do not provide us with any personal information.
Contact Us
Please contact us if you have any questions or concerns about your personal information or require assistance in managing your choices.
Invesco Ltd.
1555 Peachtree St. NE
Atlanta, GA 30309
By phone:
(404) 439-3236
By fax:
(404) 962-8288
By email:
Anne.Gerry@invesco.com
Please update your account information by logging in or contact us by email or telephone as specified above to update your account information whenever such information ceases to be complete or accurate.
You may also contact us to:
61 INVESCO COMSTOCK SELECT FUND
| | | | |
| | INVESCO’S PRIVACY POLICY Continued |
| | |
● Request that we amend, rectify, delete or update the personal data we hold about you;
● Where possible (e.g. in relation to marketing) amend or update your choices around processing;
● Request a copy of personal data held by us.
Disclaimer
Where the Website contains links to third-party websites/content/services that are not owned or controlled by Invesco, Invesco is not responsible for how these properties operate or treat your personal information so we recommend that you read the privacy policies and terms associated with these third party properties carefully.
62 INVESCO COMSTOCK SELECT FUND
THIS PAGE INTENTIONALLY LEFT BLANK.
Explore High-Conviction Investing with Invesco

Go paperless with eDelivery
Visit invesco.com/edelivery to enjoy the convenience and security of anytime electronic access to your investment documents.
With eDelivery, you can elect to have any or all of the following materials delivered straight to your inbox to download, save and print from your own computer:
| ◾ | Fund reports and prospectuses |
Invesco mailing information
Send general correspondence to Invesco Investment Services, Inc., P.O. Box 219078, Kansas City, MO 64121-9078.

| | | | |
| | Invesco Distributors, Inc. | | O-VAL-AR-1 06272020 |
| | | | |
 | | Shareholder Report for the | | |
| | Ten Months Ended 4/30/2020 | | |
| | | | |
| | | | |
| | | | |
| | | | |
| | | | |
| | | | |
| | | | |
| | | | |
| | Invesco | | |
| | Oppenheimer | | |
| | Gold & Special | | |
| | Minerals Fund | | |
| | |
| | Beginning on January 1, 2021, as permitted by regulations adopted by the Securities and Exchange Commission, paper copies of the Fund’s shareholder reports will no longer be sent by mail, unless you specifically request paper copies of the reports from the Fund or from your financial intermediary, such as a broker-dealer or bank. Instead, the reports will be made available on the Fund’s website, and you will be notified by mail each time a report is posted and provided with a website link to access the report. | | |
| | |
| | If you already elected to receive shareholder reports electronically, you will not be affected by this change and you need not take any action. You may elect to receive shareholder reports and other communications from the Fund electronically by contacting your financial intermediary (such as a broker-dealer or bank) or, if you are a direct investor, by enrolling at invesco. com/ edelivery. | | |
| | |
| | You may elect to receive all future reports in paper free of charge. If you invest through a financial intermediary, you can contact your financial intermediary to request that you continue to receive paper copies of your shareholder reports. If you invest directly with the Fund, you can call 800 959 4246 to let the Fund know you wish to continue receiving paper copies of your shareholder reports. Your election to receive reports in paper will apply to all funds held with your financial intermediary or all funds held with the fund complex if you invest directly with the Fund. | | |
Table of Contents
Class A Shares
AVERAGE ANNUAL TOTAL RETURNS AT 4/30/20
| | | | | | | | | | | | |
| | | Class A Shares of the Fund | | | | |
| | | Without Sales Charge | | | With Sales Charge | | | MSCI World Index | |
| 1-Year | | | 47.86% | | | | 39.72% | | | | -4.00% | |
| 5-Year | | | 11.49 | | | | 10.24 | | | | 4.92 | |
| 10-Year | | | -3.30 | | | | -3.84 | | | | 7.68 | |
Performance quoted is past performance and cannot guarantee future results; current performance may be lower or higher. Visit invesco. com for the most recent month-end performance. Performance figures reflect reinvested distributions and changes in net asset value (NAV). Investment return and principal value will vary so that you may have a gain or a loss when you sell shares. Fund returns include changes in share price, reinvested distributions and a 5.50% maximum applicable sales charge except where “without sales charge” is indicated. Returns for periods of less than one year are cumulative and not annualized. As the result of a reorganization after the close of business on May 24, 2019, the returns of the Fund for periods on or prior to May 24, 2019 reflect performance of the Oppenheimer predecessor fund. Share class returns will differ from those of the predecessor fund because they have different expenses. Returns do not consider capital gains or income taxes on an individual’s investment. See Fund prospectus and summary prospectus for more information on share classes, sales charges and new fee agreements, if any. Fund literature is available at invesco. com.
2 INVESCO OPPENHEIMER GOLD & SPECIAL MINERALS FUND
Fund Performance Discussion
PERFORMANCE SUMMARY
The Fund’s Class A shares (without sales charge) returned 22.21% during the 10-month reporting period, outperforming the MSCI World Index, the Fund’s benchmark (the “Index”), which returned -4.42%. The fiscal year end for the Fund was changed to April 30, 2020.
MARKET CONDITIONS AND YOUR FUND
The 12-month reporting period ending April 30, 2020 was a tale of two markets. In the first nine months of the reporting period, risk assets around the world climbed steadily as economic growth slowed modestly, central banks reduced interest rates, unemployment hovered near historical lows and inflation remained subdued. However, all of that changed beginning in late February 2020 as the Covid-19 pandemic spread across the world. Travel restrictions and lockdowns caused economic activity to slow dramatically
as risk asset prices collapsed, volatility spiked and unemployment skyrocketed. Central banks responded by cutting interest rates aggressively while governments approved huge fiscal stimulus plans. The capital markets bottomed in late March 2020 and had partially recovered by the end of the reporting period.
Against this backdrop, the Fund’s Class A shares (without sales charge) produced a total return of 47.86% during the one-year period
COMPARISON OF CHANGE IN VALUE OF $10,000 HYPOTHETICAL INVESTMENTS IN:

3 INVESCO OPPENHEIMER GOLD & SPECIAL MINERALS FUND
ending 4/30/20. The Fund outperformed its benchmark, the MSCI World Index, which returned -4.00% during the same period, by more than 5,100 basis points. The Fund also outperformed the S&P 500 Index which returned 1.62% for the same period, although it underperformed the 64.76% total return of the Philadelphia Stock Exchange Gold and Silver Index, which measures the performance of precious metals mining companies. We focus on firms with high-quality reserves, solid prospects for growth, attractive cost structures, sound balance sheets, attractive free cash flow and talented management teams.
MARKET OVERVIEW
Gold mining equities were among the best performing asset classes globally in 2019, and they have been strong performers year to date with a 6.63% total return through April 30, 2020. (For purposes of comparison, the S&P 500 Index declined 9.29% and the MSCI World Index fell 12.24% in the same period.) The strong performance of gold mining equities during the reporting period was due in part to the 32.09% rise in the price of gold. The yellow metal benefited from a variety of factors including rising geopolitical risks, sharply slowing economic growth, falling real interest rates, aggressive rate cuts by the Federal Reserve and other central banks, the prospect of major fiscal stimulus and huge national deficits, and investors seeking potential safe havens amid extreme market turmoil.
FUND PERFORMANCE
The top contributors to Fund performance during the reporting period included Barrick Gold Corp., Newmont Corp. and Northern Star Resources Ltd.
Our position in Barrick Gold Corp. (GOLD), a major gold producer based in Canada, contributed to Fund performance as the stock climbed 106.75% during the period. The company’s strong performance reflects the turnaround implemented by the new management team brought in as part of the merger with Randgold Resources. This team has demonstrated an ability to execute well at the mine site and has also been able to reduce costs at the corporate level. In addition, the company entered a Nevada joint venture with Newmont Corp. last year which is now paying dividends in the form of meaningful cost savings.
Our holdings in Newmont Corp. (NEM), a major gold producer based in the US, also contributed to Fund performance as the share price climbed 98.93% during the period. Newmont has played catch-up recently after underperforming in the wake of the Goldcorp Inc. acquisition in 2019. Management has successfully demonstrated that it can operate the recently acquired assets effectively and while reducing the overall cost of its mining operations.
Our position in Northern Star Resources Ltd. (NST AU), an Australian gold producer, contributed to Fund performance as the stock climbed 60.65% during the period.
4 INVESCO OPPENHEIMER GOLD & SPECIAL MINERALS FUND
The company has continued to deliver strong operational results at its underground mines in Australia. In September of 2018, Northern Star purchased the Pogo Mine in Alaska, thereby making the strategic decision to bring its underground mining expertise to North America. In light of the attractive price the company paid for the asset and the alignment of the acquisition with Northern Star’s strategy of turning around underground operations, shareholders reacted positively by boosting the share price. Management has demonstrated over the past several years that it can deliver consistent operating results and that the company is indeed a low-cost producer. These qualities, in conjunction with a clean balance sheet, have helped the company become a “blue chip” name in the precious metals sector. Northern Star has also expanded its portfolio with the acquisition of 50% of the Kalgoorlie Super Pit in Western Australia. We expect this acquisition to be highly accretive for the company.
The biggest detractors from Fund performance during the reporting period included Dalcian Gold Limited, First Quantum Minerals and OceanaGold Corp.
Our position in Dacian Gold Limited (DCN AU), an Australian gold miner, detracted from Fund performance in the period. The company’s mine went into production in late 2018. Unfortunately, as the miners got further into the ore body, management determined that the grade was lower than expected. This disappointing announcement was followed by an information void, which created a negative
feedback loop. Investors began to question the capability of management, the future economics of the project and the company’s ability to repay its debt. These factors led to a precipitous decline in the share price. The company was re-capitalized during the quarter and is financially well positioned to execute on management’s very conservative mine plan. The new management team has a history of turning around assets and we believe they have a favorable opportunity to do so again with this asset.
Our holdings in First Quantum Minerals Ltd. (FM CN), a Canadian copper and gold producer, also detracted from Fund performance. Operationally, the company is performing very well. The mine is ramping up ahead of schedule in terms of both production volumes and costs. Unfortunately, the copper price has been under pressure in part due to the coronavirus pandemic and the resulting implications for industrial demand of this metal. In addition, the Panamanian government has shut down the company’s flagship asset, Cobre Panama. The company has been able to renegotiate the covenants on its debt and we believe management has a clear runway to make it through the current challenges.
Finally, our position in OceanaGold Corp. (OGC CN), an Australian gold producer, detracted from Fund performance as well. The company’s share price has been under pressure as a result of limited resolution on the mine shutdown in the Philippines. Management is currently working with
5 INVESCO OPPENHEIMER GOLD & SPECIAL MINERALS FUND
the Filipino government to renew the company’s permits, but this process has been challenging. In addition, the company’s New Zealand asset, Waihi, will be processing a limited amount of ore while the team develops new production areas.
STRATEGY & OUTLOOK
The precious metals complex climbed steadily in the first nine months of the reporting period before falling sharply in February-March 2020 and then recovering in April 2020. We believe some investors are increasingly viewing gold and other precious metals as warrants on monetary policy or a potential hedge against competitive currency debasement or adverse geopolitical events. The price of gold swung within a $481 range and ended the period up 32.09% at $1,686 per ounce or $409 above where it started. In our view, macroeconomic crosswinds, relative monetary policy around the world, geopolitical risks and the fallout from the COVID-19 pandemic continue to impact the precious metals sector.
The Federal Reserve lowered the Fed Funds rate by 25 basis points three times in 2019, and then reduced that rate essentially to zero in March 2020 in response to market turmoil. Numerous central banks around the world were also lowering rates in 2019, and have since begun cutting them aggressively in 2020. The prospect of highly accommodative monetary policy has helped support the rally in risk assets since the market bottom in March 2020. The U.S. Dollar Index climbed
by 1.36% during the reporting period, but it is up a more robust 2.73% year to date through April 30, 2020. (A stronger dollar is generally bearish for gold and commodity prices.) However, the Trump administration has enacted multi-trillion-dollar fiscal stimulus programs to stimulate the economy, and more stimulus could be on the way. We believe these programs will increase the annual deficit significantly, which could eventually put downward pressure on the US dollar. The prospect of these developments would be expected to help support prices in the precious metals complex.
The Fund has a growth-at-a-reasonable-price tilt. We favor companies with more resources in the ground, higher quality ore bodies and lower cost structures than we think Wall Street appreciates, partly because these characteristics can lead to upside surprises in production growth, revenue, cash flow and earnings, which in turn can lead to rising net asset values and (potentially) rising stock prices. We like growth, but we will not overpay for it, and we do not chase stocks. We continue to use a contrarian growth strategy, which means we tend to buy companies that we like when they are on sale, and we tend to trim or sell positions when others are buying aggressively.
The Fund manager remains focused on the growth potential of companies, the quality and size of their ore bodies in the ground, their cost structures, the strength of their balance sheets and the quality of their management teams. Moreover, we
6 INVESCO OPPENHEIMER GOLD & SPECIAL MINERALS FUND
concentrate our efforts on analyzing the gold mining equities, and we tend to stay fully invested. Unlike many competitors, “under normal market conditions” or “typically” we do not hold large positions in cash, and we do not own Treasuries in an effort to dampen portfolio volatility. The reasons are simple. We are investors, not short-term traders or market timers. In fact, we believe it is extremely difficult to time the precious metals markets well on a consistent basis. In addition, our skill is in analyzing ore bodies, mines and management teams, and investing in mining companies, not government fixed income securities.
Consistent with our disciplined and contrarian growth strategy, we continue to look for opportunities to buy companies with assets, cost structures and production/earnings growth profiles that we like at valuations that we consider attractive. We believe the core holdings in the portfolio are well-capitalized senior and intermediate producers. The Fund expects to continue to hold most of its assets in gold-related equities. In the remainder of the portfolio, we focus on companies that produce valuable minerals or are otherwise engaged in the mining industry, and that we believe offer attractive revenue and earnings growth at a reasonable price.
Portfolio Manager: Shanquan Li
7 INVESCO OPPENHEIMER GOLD & SPECIAL MINERALS FUND
Top Holdings and Allocations
| | | | |
TOP TEN COMMON STOCK HOLDINGS | |
| Barrick Gold Corp. | | | 5.3 | % |
| Kirkland Lake Gold Ltd. | | | 5.3 | |
| Newmont Corp. | | | 5.2 | |
AngloGold Ashanti Ltd., Sponsored ADR | | | 5.1 | |
| Agnico Eagle Mines Ltd. | | | 5.1 | |
| Evolution Mining Ltd. | | | 5.0 | |
| Gold Fields Ltd., Sponsored ADR | | | 4.7 | |
| Northern Star Resources Ltd. | | | 4.3 | |
| B2Gold Corp. | | | 3.3 | |
| Ivanhoe Mines Ltd., Cl. A | | | 2.9 | |
Holdings and allocations are subject to change and are not buy/sell recommendations. Percentages are as of April 30, 2020, and are based on net assets.
REGIONAL ALLOCATION
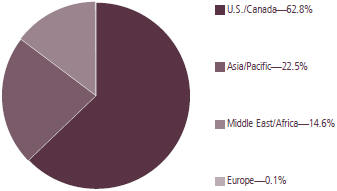
Holdings and allocations are subject to change and are not buy/sell recommendations. Percentages are as of April 30, 2020 and are based on total market value of investments.
For more current Fund holdings, please visit invesco.com.
8 INVESCO OPPENHEIMER GOLD & SPECIAL MINERALS FUND
Share Class Performance
| | | | | | | | | | | | | | | | |
| AVERAGE ANNUAL TOTAL RETURNS WITHOUT SALES CHARGE AS OF 4/30/20 | |
| | | Inception Date | | | 1-Year | | | 5-Year | | | 10-Year | |
| Class A (OPGSX) | | | 7/19/83 | | | | 47.86% | | | | 11.49% | | | | -3.30% | |
| Class C (OGMCX) | | | 11/1/95 | | | | 46.76 | | | | 10.64 | | | | -4.02 | |
| Class R (OGMNX) | | | 3/1/01 | | | | 47.53 | | | | 11.19 | | | | -3.56 | |
| Class Y (OGMYX) | | | 9/7/10 | | | | 48.19 | | | | 11.76 | | | | -4.231 | |
| Class R5 (IOGYX)2 | | | 5/24/19 | | | | 48.39 | | | | 11.57 | | | | -3.26 | |
| Class R6 (OGMIX)3 | | | 10/26/12 | | | | 48.51 | | | | 11.96 | | | | -4.211 | |
| | | | | | | | | | | | | | | | |
| AVERAGE ANNUAL TOTAL RETURNS WITH SALES CHARGE AS OF 4/30/20 | |
| | | Inception Date | | | 1-Year | | | 5-Year | | | 10-Year | |
| Class A (OPGSX) | | | 7/19/83 | | | | 39.72% | | | | 10.24% | | | | -3.84% | |
| Class C (OGMCX) | | | 11/1/95 | | | | 45.76 | | | | 10.64 | | | | -4.02 | |
| Class R (OGMNX) | | | 3/1/01 | | | | 47.53 | | | | 11.19 | | | | -3.56 | |
| Class Y (OGMYX) | | | 9/7/10 | | | | 48.19 | | | | 11.76 | | | | -4.231 | |
| Class R5 (IOGYX)2 | | | 5/24/19 | | | | 48.39 | | | | 11.57 | | | | -3.26 | |
| Class R6 (OGMIX)3 | | | 10/26/12 | | | | 48.51 | | | | 11.96 | | | | -4.211 | |
1. Shows performance since inception.
2. Class R5 shares’ performance shown prior to the inception date (after the close of business on May 24, 2019) is that of the predecessor fund’s Class A shares at net asset value (NAV) and includes the 12b-1 fees applicable to Class A shares. Class A shares’ performance reflects any applicable fee waivers and/or expense reimbursements.
3. Class R6 shares’ returns shown for periods ending on or prior to May 24, 2019 are those of the Class I shares of the predecessor fund.
Performance quoted is past performance and cannot guarantee future results; current performance may be lower or higher. Visit invesco.com for the most recent month-end performance. Performance figures reflect reinvested distributions and changes in net asset value (NAV). Investment return and principal value will vary so that you may have a gain or a loss when you sell shares. Performance shown at NAV does not include the applicable front-end sales charge, which would have reduced the performance. The current maximum initial sales charge for Class A shares is 5.50%, and the contingent deferred sales charge for Class C shares is 1% for the 1-year period. Class R, Class Y, Class R5 and Class R6 shares have no sales charge; therefore, performance is at NAV. Effective after the close of business on May 24, 2019, Class A, Class C, Class R, Class Y, and Class I shares of the predecessor fund were reorganized into Class A, Class C, Class R, Class Y and Class R6 respectively, of the Fund. Class R5 shares’ performance shown prior to the inception date is that of the predecessor fund’s Class A shares at NAV and includes the 12b-1 fees applicable to Class A shares. Class A shares’ performance reflects any applicable fee waivers and/or expense reimbursements. Returns shown for Class A, Class C, Class R, Class Y, Class R5 and Class R6 shares are blended returns of the predecessor fund and the Fund. Share class returns will differ from those of the predecessor fund because of different expenses. See Fund prospectus and
9 INVESCO OPPENHEIMER GOLD & SPECIAL MINERALS FUND
summary prospectus for more information on share classes, sales charges and new fee agreements, if any. Fund literature is available at invesco.com.
The MSCI World Index is an index of issuers listed on the stock exchanges of foreign countries and the United States. It is widely recognized as a measure of global stock market performance. The Index is unmanaged and cannot be purchased directly by investors. While index comparisons may be useful to provide a benchmark for the Fund’s performance, it must be noted that the Fund’s investments are not limited to the investments comprising the Index. Index performance includes reinvestment of income, but does not reflect transaction costs, fees, expenses or taxes. Index performance is shown for illustrative purposes only as a benchmark for the Fund’s performance, and does not predict or depict performance of the Fund. The Fund’s performance reflects the effects of the Fund’s business and operating expenses.
Liquidity Risk Management Program
The Securities and Exchange Commission has adopted Rule 22e-4 under the Investment Company Act of 1940 (the “Liquidity Rule”) in order to promote effective liquidity risk management throughout the open-end investment company industry, thereby reducing the risk that funds will be unable to meet their redemption obligations and mitigating dilution of the interests of fund shareholders. The Fund has adopted and implemented a liquidity risk management program in accordance with the Liquidity Rule (the “Program”). The Program is reasonably designed to assess and manage the Fund’s liquidity risk, which is the risk that the Fund could not meet redemption requests without significant dilution of remaining investors’ interests in the Fund. The Board of Trustees of the Fund (the “Board”) has appointed Invesco Advisers, Inc. (“Invesco”), the Fund’s investment adviser, as the Program’s administrator, and Invesco has delegated oversight of the Program to the Liquidity Risk Management Committee (the “Committee”), which is composed of senior representatives from relevant business groups at Invesco.
As required by the Liquidity Rule, the Program includes policies and procedures providing for an assessment, no less frequently than annually, of the Fund’s liquidity risk that takes into account, as relevant to the Fund’s liquidity risk: (1) the Fund’s investment strategy and liquidity of portfolio investments during both normal and reasonably foreseeable stressed conditions; (2) short-term and long-term cash flow projections for the Fund during both normal and reasonably foreseeable stressed conditions; and (3) the Fund’s holdings of cash and cash equivalents and any borrowing arrangements. The Liquidity Rule also requires the classification of the Fund’s investments into categories that reflect the assessment of their relative liquidity under current market conditions. The Fund classifies its investments into one of four categories defined in the Liquidity Rule: “Highly Liquid,” “Moderately Liquid,” “Less Liquid” and “Illiquid.” Funds that are not invested primarily in “Highly Liquid Investments” that are assets (cash or investments that are reasonably expected to be convertible into cash within three business days without significantly changing the market value of the investment) are required to establish a “Highly Liquid Investment Minimum” (“HLIM”), which is the minimum percentage of net assets that must be invested in Highly Liquid Investments. Funds with HLIMs have procedures for addressing HLIM shortfalls, including reporting to the Board and the SEC (on a non-public basis) as required by the Program and the Liquidity Rule. In addition, the Fund may not acquire an investment if, immediately after the acquisition, over 15% of the Fund’s net assets would consist of “Illiquid Investments” that are assets (an investment that cannot reasonably be expected to be sold or disposed of in current market conditions in seven calendar days or less without the sale or disposition significantly changing
10 INVESCO OPPENHEIMER GOLD & SPECIAL MINERALS FUND
the market value of the investment). The Liquidity Rule and the Program also require reporting to the Board and the SEC (on a non-public basis) if a Fund’s holdings of Illiquid Investments exceed 15% of the Fund’s assets.
At a meeting held on March 30-April 1, 2020, the Committee presented a report to the Board that addressed the operation of the Program and assessed the Program’s adequacy and effectiveness of implementation (the “Report”). The Report covered the period from December 1, 2018 through December 31, 2019 (the “Program Reporting Period”).
The Report stated, in relevant part, that during the Program Reporting Period:
| · | | The Program, as adopted and implemented, remained reasonably designed to assess and manage the Fund’s liquidity risk and was operated effectively to achieve that goal; |
| · | | The Fund’s investment strategy remained appropriate for an open-end fund; |
| · | | The Fund was able to meet requests for redemption without significant dilution of remaining investors’ interests in the Fund; |
| · | | The Fund did not breach the 15% limit on Illiquid Investments; and |
| · | | The Fund primarily held Highly Liquid Investments and therefore has not adopted an HLIM. |
The views and opinions expressed in management’s discussion of Fund performance are those of Invesco Advisers, Inc. These views and opinions are subject to change at any time based on factors such as market and economic conditions. These views and opinions may not be relied upon as investment advice or recommendations, or as an offer for a particular security. The information is not a complete analysis of every aspect of any market, country, industry, security or the Fund. Statements of fact are from sources considered reliable, but Invesco Advisers, Inc. makes no representation or warranty as to their completeness or accuracy. Although historical performance is no guarantee of future results, these insights may help you understand our investment management philosophy.
Before investing, investors should carefully read the prospectus and/or summary prospectus and carefully consider the investment objectives, risks, charges and expenses. For this and more complete information about the fund(s), investors should ask their advisors for a prospectus/summary prospectus or visit invesco. com/fundprospectus.
Shares of Invesco funds are not deposits or obligations of any bank, are not guaranteed by any bank, are not insured by the FDIC or any other agency, and involve investment risks, including the possible loss of the principal amount invested.
11 INVESCO OPPENHEIMER GOLD & SPECIAL MINERALS FUND
Fund Expenses
Fund Expenses. As a shareholder of the Fund, you incur two types of costs: (1) transaction costs, which may include sales charges (loads) on purchase payments and/or contingent deferred sales charges on redemptions; and (2) ongoing costs, including management fees; distribution and service fees; and other Fund expenses. These examples are intended to help you understand your ongoing costs (in dollars) of investing in the Fund and to compare these costs with the ongoing costs of investing in other mutual funds.
The examples are based on an investment of $1,000.00 invested at the beginning of the period and held for the entire 6-month period ended April 30, 2020.
Actual Expenses. The first section of the table provides information about actual account values and actual expenses. You may use the information in this section for the class of shares you hold, together with the amount you invested, to estimate the expense that you paid over the period. Simply divide your account value by $1,000.00 (for example, an $8,600.00 account value divided by $1,000.00 = 8.60), then multiply the result by the number in the first section under the heading entitled “Expenses Paid During 6 Months Ended April 30, 2020” to estimate the expenses you paid on your account during this period.
Hypothetical Example for Comparison Purposes. The second section of the table provides information about hypothetical account values and hypothetical expenses based on the Fund’s actual expense ratio for each class of shares, and an assumed rate of return of 5% per year for each class before expenses, which is not the Fund’s actual return. The hypothetical account values and expenses may not be used to estimate the actual ending account balance or expenses you paid for the period. You may use this information to compare the ongoing costs of investing in the Fund and other funds. To do so, compare this 5% hypothetical example for the class of shares you hold with the 5% hypothetical examples that appear in the shareholder reports of the other funds.
Please note that the expenses shown in the table are meant to highlight your ongoing costs only and do not reflect any transactional costs, such as front-end or contingent deferred sales charges (loads). Therefore, the “hypothetical” section of the table is useful in comparing ongoing costs only, and will not help you determine the relative total costs of owning different funds. In addition, if these transactional costs were included, your costs would have been higher.
12 INVESCO OPPENHEIMER GOLD & SPECIAL MINERALS FUND
| | | | | | | | | | | | | | | |
| Actual | | Beginning Account Value November 1, 2019 | | Ending Account Value April 30, 2020 | | Expenses Paid During 6 Months Ended April 30, 2020 |
| Class A | | | | $ 1,000.00 | | | | $ | 1,130.30 | | | $ 6.21 | |
| Class C | | | | 1,000.00 | | | | | 1,125.90 | | | 10.19 | |
| Class R | | | | 1,000.00 | | | | | 1,128.80 | | | 7.54 | |
| Class Y | | | | 1,000.00 | | | | | 1,131.10 | | | 4.89 | |
| Class R5 | | | | 1,000.00 | | | | | 1,132.60 | | | 3.98 | |
| Class R6 | | | | 1,000.00 | | | | | 1,132.80 | | | 3.93 | |
| | | |
| Hypothetical | | | | | | | | | | | | |
| (5% return before expenses) | | | | | | | | | | | | |
| Class A | | | | 1,000.00 | | | | | 1,019.05 | | | 5.89 | |
| Class C | | | | 1,000.00 | | | | | 1,015.32 | | | 9.67 | |
| Class R | | | | 1,000.00 | | | | | 1,017.80 | | | 7.15 | |
| Class Y | | | | 1,000.00 | | | | | 1,020.29 | | | 4.63 | |
| Class R5 | | | | 1,000.00 | | | | | 1,021.13 | | | 3.78 | |
| Class R6 | | | | 1,000.00 | | | | | 1,021.18 | | | 3.73 | |
Expenses are equal to the Fund’s annualized expense ratio for that class, multiplied by the average account value over the period, multiplied by 182/366 (to reflect the one-half year period). Those annualized expense ratios, excluding indirect expenses from affiliated funds, based on the 6-month period ended April 30, 2020 are as follows:
| | |
| Class | | Expense Ratios |
| Class A | | 1.17% |
| Class C | | 1.92 |
| Class R | | 1.42 |
| Class Y | | 0.92 |
| Class R5 | | 0.75 |
| Class R6 | | 0.74 |
The expense ratios reflect voluntary and/or contractual waivers and/or reimbursements of expenses by the Fund’s Adviser. Some of these undertakings may be modified or terminated at any time, as indicated in the Fund’s prospectus. The “Consolidated Financial Highlights” tables in the Fund’s financial statements, included in this report, also show the gross expense ratios, without such waivers or reimbursements and reduction to custodian expenses, if applicable.
13 INVESCO OPPENHEIMER GOLD & SPECIAL MINERALS FUND
CONSOLIDATED
SCHEDULE OF INVESTMENTS April 30, 2020
| | | | | | | | |
| | | Shares | | | Value | |
| Common Stocks—97.1% | | | | | | | | |
| Materials—97.1% | | | | | | | | |
| Metals & Mining—97.1% | | | | | | | | |
| Adventus Mining Corp.1 | | 2,000,000 | | | $ 1,120,730 | |
| Agnico Eagle Mines Ltd.2 | | 1,276,900 | | | 74,928,492 | |
| Agnico Eagle Mines Ltd.2 | | 900 | | | 52,586 | |
| Alacer Gold Corp.1 | | 6,790,000 | | | 34,829,268 | |
| Alamos Gold, Inc., Cl. A | | 2,545,000 | | | 20,538,150 | |
| AngloGold Ashanti Ltd., Sponsored ADR | | 3,104,000 | | | 75,706,560 | |
| Artemis Gold, Inc.1 | | 394,000 | | | 314,192 | |
| Auryn Resources, Inc.1 | | 2,060,000 | | | 2,224,800 | |
| B2Gold Corp. | | 9,650,000 | | | 48,829,000 | |
| Barrick Gold Corp. | | 3,064,470 | | | 78,818,168 | |
| Bellevue Gold Ltd.1 | | 13,408,772 | | | 4,932,066 | |
| Bushveld Minerals Ltd.1 | | 7,800,000 | | | 1,287,979 | |
| Castile Resources Ltd.1 | | 9,258,721 | | | 984,387 | |
| Chalice Gold Mines Ltd.1 | | 1,978,359 | | | 1,409,329 | |
| Dacian Gold Ltd.1,3 | | 28,199,549 | | | 6,615,445 | |
| De Grey Mining Ltd.1 | | 41,300,000 | | | 9,243,723 | |
| De Grey Mining Ltd., Private Shares1 | | 7,142,857 | | | 1,598,707 | |
| Dundee Precious Metals, Inc. | | 2,180,000 | | | 10,164,302 | |
| Eldorado Gold Corp.1 | | 2,790,502 | | | 26,426,054 | |
| Endeavour Mining Corp.1 | | 40,800 | | | 734,544 | |
| Equinox Gold Corp.1 | | 796,700 | | | 6,658,954 | |
| ERO Copper Corp.1 | | 1,758,200 | | | 20,108,872 | |
| Evolution Mining Ltd. | | 22,778,806 | | | 73,630,157 | |
| Ferroglobe plc1 | | 1,320,000 | | | 679,932 | |
| First Quantum Minerals Ltd. | | 4,352,200 | | | 26,576,889 | |
| Franco-Nevada Corp. | | 124,000 | | | 16,394,040 | |
| Gold Fields Ltd., Sponsored ADR | | 9,438,461 | | | 69,278,304 | |
| Gold Road Resources Ltd.1 | | 19,132,220 | | | 19,396,292 | |
| Golden Star Resources Ltd.1 | | 1,009,195 | | | 2,361,516 | |
| Gran Colombia Gold Corp.1 | | 530,000 | | | 2,231,258 | |
| GT Gold Corp.1 | | 1,589,600 | | | 1,518,853 | |
| Harmony Gold Mining Co. Ltd., Sponsored ADR1 | | 5,700,000 | | | 20,634,000 | |
| IAMGOLD Corp.1 | | 2,680,000 | | | 9,406,800 | |
| IGO Ltd. | | 300,000 | | | 909,801 | |
| Ivanhoe Mines Ltd., Cl. A1 | | 20,510,600 | | | 43,026,655 | |
| K92 Mining, Inc.1 | | 9,109,000 | | | 21,137,304 | |
| Kinross Gold Corp.1 | | 563,994 | | | 3,728,000 | |
| Kirkland Lake Gold Ltd. | | 1,903,367 | | | 78,680,798 | |
| Legend Mining Ltd.1 | | 11,940,095 | | | 1,500,575 | |
| Liberty Gold Corp.1 | | 4,806,000 | | | 4,143,252 | |
| Lion One Metals Ltd.1 | | 4,079,400 | | | 3,663,386 | |
| Lundin Gold, Inc.1 | | 2,537,300 | | | 18,902,835 | |
| MAG Silver Corp.1 | | 433,522 | | | 4,981,168 | |
| Maverix Metals, Inc. | | 638,800 | | | 2,748,958 | |
| Musgrave Minerals Ltd.1 | | 2,500,000 | | | 194,348 | |
| New Pacific Metals Corp.1 | | 311,800 | | | 1,397,774 | |
| Newcrest Mining Ltd. | | 412,147 | | | 7,396,571 | |
14 INVESCO OPPENHEIMER GOLD & SPECIAL MINERALS FUND
| | | | | | | | |
| | | Shares | | | Value | |
| Metals & Mining (Continued) | | | | | | | | |
| Newmont Corp. | | 1,298,887 | | | $ 77,257,799 | |
| Nickel Mines Ltd.1 | | 26,500,000 | | | 9,433,438 | |
| Northern Star Resources Ltd. | | 7,883,045 | | | 63,191,770 | |
| Novagold Resources, Inc.1 | | 130,000 | | | 1,454,700 | |
| Novo Resources Corp.1 | | 920,000 | | | 1,791,156 | |
| OceanaGold Corp.1 | | 140,700 | | | 214,292 | |
| Osino Resources Corp.1,3 | | 4,752,000 | | | 2,935,968 | |
| Osisko Gold Royalties Ltd. | | 1,322,364 | | | 12,099,631 | |
| Pan American Silver Corp. | | 790,000 | | | 16,779,600 | |
| Pantoro Ltd.1 | | 17,100,000 | | | 1,604,422 | |
| Perenti Global Ltd. | | 65,634 | | | 38,458 | |
| Premier Gold Mines Ltd.1 | | 50,000 | | | 62,143 | |
| Pretium Resources, Inc.1 | | 1,451,000 | | | 11,080,951 | |
| Ramelius Resources Ltd. | | 10,285,611 | | | 8,669,937 | |
| Red 5 Ltd.1 | | 23,620,352 | | | 2,891,733 | |
| Regis Resources Ltd. | | 730,000 | | | 2,082,628 | |
| Resolute Mining Ltd.1 | | 15,780,000 | | | 9,388,906 | |
| Roxgold, Inc.1 | | 7,979,000 | | | 7,165,308 | |
| Royal Gold, Inc. | | 174,000 | | | 21,320,220 | |
| Royal Nickel Corp.1 | | 19,350,000 | | | 5,838,572 | |
| Sandstorm Gold Ltd.1 | | 1,570,000 | | | 12,214,600 | |
| Saracen Mineral Holdings Ltd.1 | | 9,050,000 | | | 24,583,912 | |
| Shandong Gold Mining Co. Ltd., Cl. H4 | | 9,050,000 | | | 26,764,757 | |
| Sibanye Stillwater Ltd., ADR1 | | 3,188,791 | | | 25,414,664 | |
| Silver Lake Resources Ltd.1 | | 12,000,000 | | | 14,835,872 | |
| Silvercorp Metals, Inc. | | 875,300 | | | 3,282,493 | |
| SilverCrest Metals, Inc.1,2,5 | | 200,000 | | | 1,297,460 | |
| SilverCrest Metals, Inc.1,2 | | 2,598,900 | | | 16,859,849 | |
| SolGold plc1 | | 19,400,000 | | | 6,623,357 | |
| Spectrum Metals Ltd.1 | | 7,822,000 | | | 745,645 | |
| SSR Mining, Inc.1 | | 1,295,333 | | | 22,655,374 | |
| Talisker Resources Ltd.1 | | 1,716,500 | | | 493,265 | |
| Teranga Gold Corp.1 | | 2,844,500 | | | 19,699,688 | |
| TMAC Resources, Inc.1 | | 1,880,000 | | | 1,998,922 | |
| Torex Gold Resources, Inc.1 | | 1,451,800 | | | 20,661,775 | |
| Trevali Mining Corp., Cl. Common S1 | | 23,149,500 | | | 1,746,253 | |
| Turquoise Hill Resources Ltd.1 | | 1,300,000 | | | 656,500 | |
| Wallbridge Mining Co. Ltd.1 | | 8,232,500 | | | 4,140,055 | |
| Wesdome Gold Mines Ltd.1 | | 5,353,900 | | | 41,001,885 | |
| Westgold Resources Ltd.1 | | 17,241,067 | | | 22,555,972 | |
| Wheaton Precious Metals Corp. | | 813,000 | | | 30,698,880 | |
| Zhaojin Mining Industry Co. Ltd., Cl. H | | | 15,870,000 | | | | 17,856,993 | |
| | | | | | | | |
| Total Common Stocks (Cost $962,558,942) | | | | | | | 1,434,135,577 | |
| | |
| | | Units | | | | |
| Rights, Warrants and Certificates—0.1% | | | | | | | | |
| Osino Resources Corp., Exp. 1/30/221,3,5 | | 160,000 | | | — | |
| Pan American Silver Corp., Exp. 2/22/291 | | 2,300,100 | | | 1,104,048 | |
15 INVESCO OPPENHEIMER GOLD & SPECIAL MINERALS FUND
CONSOLIDATED
SCHEDULE OF INVESTMENTS Continued
| | | | | | | | |
| | | Units | | | Value | |
| Rights, Warrants and Certificates (Continued) | | | | | | | | |
| Royal Nickel Corp. Strike Price 0.5 CAD, Exp. 9/21/211 | | | 2,500,000 | | | $ | 269,406 | |
| Total Rights, Warrants and Certificates (Cost $0) | | | | | | | 1,373,454 | |
| | | | | | | | | | | | | | | | | | | | | | | | |
| | | | | | Exercise Price | | | Expiration Date | | | Notional Amount (000’s) | | | Contracts (000’s) | | | | |
| Exchange-Traded Options Purchased—0.0% | | | | | | | | | | | | | | | | | |
| Anglogold Ashanti Call | | | USD | | | | 16.000 | | | | 7/17/20 | | | | USD 800 | | | | USD 1 | | | | 437,500 | |
| Spider Gold Trust Index Put | | | USD | | | | 153.000 | | | | 5/15/20 | | | | USD 15,300 | | | | USD 1 | | | | 89,000 | |
| Total Exchange-Traded Options Purchased (Cost $479,058) | | | | | | | | | | | | 526,500 | |
| | | | | | | | |
| | | Shares | | | | |
| Investment Companies—4.9% | | | | | | | | |
| Invesco Government & Agency Portfolio, Institutional Class, 0.20%3,6 | | | 70,542,372 | | | | 70,542,372 | |
| iShares Gold Trust1 | | | 80,000 | | | | 1,288,800 | |
| iShares Silver Trust Exchange Traded Fund1 | | | 50,000 | | | | 699,000 | |
Total Investment Companies (Cost $72,533,362) | | | | | | | 72,530,172 | |
| Total Investments, at Value (Cost $1,035,571,362) | | | 102.1% | | | | 1,508,565,703 | |
| Net Other Assets (Liabilities) | | | (2.1) | | | | (31,128,414 | ) |
| Net Assets | | | 100.0% | | | $ | 1,477,437,289 | |
| | | | |
Footnotes to Consolidated Schedule of Investments
1. Non-income producing security.
2. The Fund holds securities which have been issued by the same entity and that trade on separate exchanges.
3. Affiliated issuer. The issuer is affiliated by having an investment adviser that is under common control of Invesco Ltd. and/or the Investment Company Act of 1940, as amended (the “1940 Act”), defines “affiliated person” to include an issuer of which a fund holds 5% or more of the outstanding voting securities. The Fund has not owned enough of the outstanding voting securities of the issuer to have control (as defined in the 1940 Act) of that issuer. Transactions during the reporting period in which the issuer was an affiliate are as follows:
| | | | | | | | | | | | | | | | |
| | | Shares June 30, 2019 | | | Gross Additions | | | Gross Reductions | | | Shares April 30, 2020 | |
| Common Stock | | | | | | | | | | | | | | | | |
| Metals & Mining | | | | | | | | | | | | | | | | |
| Dacian Gold Ltd. | | | 10,990,000 | | | | 17,209,549 | | | | — | | | | 28,199,549 | |
| Osino Resources Corp. | | | — | | | | 4,752,000 | | | | — | | | | 4,752,000 | |
| Wesdome Gold Mines Ltd.a | | | 7,285,100 | | | | 248,800 | | | | 2,180,000 | | | | 5,353,900 | |
| Rights, Warrants and Certificates | | | | | | | | | | | | | | | | |
| Osino Resources Corp., Exp. 1/30/22 | | | — | | | | 160,000 | | | | — | | | | 160,000 | |
| Investment Companies | | | | | | | | | | | | | | | | |
| Invesco Oppenheimer Institutional Government Money Market Fund, Cl. E | | | 12,557,736 | | | | 49,775,277 | | | | 62,333,013 | | | | — | |
| Invesco Government & Agency Portfolio, Institutional Class | | | — | | | | 420,735,576 | | | | 350,193,204 | | | | 70,542,372 | |
16 INVESCO OPPENHEIMER GOLD & SPECIAL MINERALS FUND
Footnotes to Consolidated Schedule of Investments (continued)
| | | | | | | | | | | | | | | | |
| | | Value | | | Income | | | Realized Gain (Loss) | | | Change in Unrealized Gain (Loss) | |
| |
| Common Stock Metals & Mining | | | | | | | | | | | | | | | | |
| Dacian Gold Ltd. | | $ | 6,615,445 | | | $ | — | | | $ | — | | | $ | (1,102,120) | |
| Osino Resources Corp. | | | 2,935,968 | | | | — | | | | — | | | | 250,944 | |
| Wesdome Gold Mines Ltd.a | | | — | a | | | — | | | | 8,152,303 | | | | 13,495,182 | |
| Rights, Warrants and Certificates | | | | | | | | | | | | | | | | |
| Osino Resources Corp., Exp. 1/30/22 | | | — | | | | — | | | | — | | | | — | |
| Investment Companies | | | | | | | | | | | | | | | | |
| Invesco Oppenheimer Institutional Government Money Market Fund, Cl. E | | | — | | | | 54,057 | | | | — | | | | — | |
| Invesco Government & Agency Portfolio, Institutional Class | | | 70,542,372 | | | | 241,408 | | | | — | | | | — | |
| | | | |
| Total | | $ | 80,093,785 | | | $ | 295,465 | | | $ | 8,152,303 | | | $ | 12,644,006 | |
| | | | |
a. This security is no longer an affiliate. Therefore, the value has been excluded from this table.
4. Security purchased or received in a transaction exempt from registration under the Securities Act of 1933, as amended (the “1933 Act”). The security may be resold pursuant to an exemption from registration under the 1933 Act, typically to qualified institutional buyers. The aggregate value of these securities at April 30, 2020 was $26,764,757, which represented 1.81% of the Fund’s Net Assets.
5. The value of this security was determined using significant unobservable inputs. See Note 3 of the accompanying Consolidated Notes.
6. The rate shown is the 7-day SEC standardized yield as of April 30, 2020.
Distribution of investments representing geographic holdings, as a percentage of total investments at value, is as follows:
| | | | | | | | |
| Geographic Holdings | | Value | | | Percent | |
| Canada | | $ | 739,477,365 | | | | 49.0% | |
| Australia | | | 294,671,742 | | | | 19.5 | |
| United States | | | 209,067,907 | | | | 13.9 | |
| South Africa | | | 191,471,028 | | | | 12.7 | |
| China | | | 44,621,750 | | | | 3.0 | |
| Zambia | | | 26,576,888 | | | | 1.8 | |
| United Kingdom | | | 1,287,979 | | | | 0.1 | |
| Ivory Coast | | | 734,544 | | | | 0.0 | |
| Mongolia | | | 656,500 | | | | 0.0 | |
| Total | | $ | 1,508,565,703 | | | | 100.0% | |
| | | | |
| | | | | | | | | | | | | | | | | | |
| Exchange-Traded Options Written at April 30, 2020 | | | | | | | | | | | | | |
| Description | | Exercise Price | | Expiration
Date | | | Number of Contracts (000’s) | | Notional Amount (000’s) | | Premiums Received | | | Value | |
| Agnico-Eagle Mines Put | | USD 45.000 | | | 8/21/20 | | | USD 1 | | USD 4,500 | | $ | 234,006 | | | $ | (130,500 | ) |
| Agnico-Eagle Mines Call | | USD 65.000 | | | 8/21/20 | | | USD 2 | | USD 13,000 | | | 257,682 | | | | (745,000 | ) |
| Agnico-Eagle Mines Call | | USD 50.000 | | | 5/15/20 | | | USD 2 | | USD 10,000 | | | 528,822 | | | | (1,855,000 | ) |
17 INVESCO OPPENHEIMER GOLD & SPECIAL MINERALS FUND
CONSOLIDATED
SCHEDULE OF INVESTMENTS Continued
| | | | | | | | | | | | | | | | | | | | | | | | |
| Exchange-Traded Options Written (Continued) | | | | | | | | | | | | | | | | | |
| Description | | Exercise Price | | | Expiration Date | | | Number of Contracts (000’s) | | | Notional Amount (000’s) | | | Premiums Received | | | Value | |
| Agnico-Eagle Mines Put | | | USD 30.000 | | | | 8/21/20 | | | | USD 1 | | | | USD 3,000 | | | $ | 259,022 | | | $ | (14,000 | ) |
| Alamos Gold Inc. Call | | | USD 7.500 | | | | 9/18/20 | | | | USD 3 | | | | USD 2,250 | | | | 454,379 | | | | (525,000 | ) |
| Alamos Gold Inc. Call | | | USD 10.000 | | | | 9/18/20 | | | | USD 2 | | | | USD 2,000 | | | | 157,922 | | | | (145,000 | ) |
| Alamos Gold Inc. Put | | | USD 7.500 | | | | 9/18/20 | | | | USD 3 | | | | USD 2,250 | | | | 334,154 | | | | (330,000 | ) |
| Anglogold Ashanti Put | | | USD 16.000 | | | | 7/17/20 | | | | USD 1 | | | | USD 1,600 | | | | 140,261 | | | | (32,500 | ) |
| Anglogold Ashanti Call | | | USD 25.000 | | | | 7/17/20 | | | | USD 2 | | | | USD 5,000 | | | | 235,633 | | | | (550,000 | ) |
| Anglogold Ashanti Call | | | USD 22.000 | | | | 7/17/20 | | | | USD 1 | | | | USD 2,200 | | | | 132,211 | | | | (430,000 | ) |
| Anglogold Ashanti Put | | | USD 20.000 | | | | 7/17/20 | | | | USD 1 | | | | USD 2,000 | | | | 206,957 | | | | (102,500 | ) |
| Anglogold Ashanti Call | | | USD 25.000 | | | | 5/15/20 | | | | USD 1 | | | | USD 2,500 | | | | 143,891 | | | | (110,000 | ) |
| B2 Gold Corp. Put | | | USD 5.000 | | | | 10/16/20 | | | | USD 2 | | | | USD 1,000 | | | | 236,882 | | | | (200,000 | ) |
| B2 Gold Corp. Call | | | USD 5.000 | | | | 10/16/20 | | | | USD 4 | | | | USD 2,000 | | | | 105,525 | | | | (430,000 | ) |
| Barrick Gold Corp. Call | | | USD 25.000 | | | | 9/18/20 | | | | USD 1 | | | | USD 2,500 | | | | 131,961 | | | | (345,000 | ) |
| Barrick Gold Corp. Call | | | USD 21.000 | | | | 6/19/20 | | | | USD 2 | | | | USD 4,200 | | | | 204,759 | | | | (1,020,000 | ) |
| Barrick Gold Corp. Call | | | USD 24.000 | | | | 9/18/20 | | | | USD 1 | | | | USD 2,400 | | | | 107,211 | | | | (392,500 | ) |
| Direxion Shares ETF Put | | | USD 55.000 | | | | 6/19/20 | | | | USD 1 | | | | USD 5,500 | | | | 458,951 | | | | (462,000 | ) |
| Direxion Shares ETF Put | | | USD 55.000 | | | | 5/15/20 | | | | USD 1 | | | | USD 5,500 | | | | 178,957 | | | | (228,500 | ) |
| Direxion Shares ETF Put | | | USD 31.000 | | | | 5/15/20 | | | | USD 1 | | | | USD 3,100 | | | | 248,286 | | | | (130,000 | ) |
| Eldorado Gold Corp. Call | | | USD 10.000 | | | | 7/17/20 | | | | USD 4 | | | | USD 4,000 | | | | 487,845 | | | | (490,000 | ) |
| Eldorado Gold Corp. Put | | | USD 6.000 | | | | 7/17/20 | | | | USD 1 | | | | USD 600 | | | | 143,461 | | | | (17,500 | ) |
| Eldorado Gold Corp. Put | | | USD 9.000 | | | | 7/17/20 | | | | USD 2 | | | | USD 1,800 | | | | 261,922 | | | | (325,000 | ) |
| Endeavour Mining Corp. Put | | | CAD 23.000 | | | | 7/17/20 | | | | CAD 1 | | | | CAD 2,300 | | | | 123,622 | | | | (96,986 | ) |
| Equinox Gold Corp. Put | | | USD 10.000 | | | | 6/19/20 | | | | USD 1 | | | | USD 1,000 | | | | 226,961 | | | | (175,000 | ) |
| Franco Nevada Corp. Call | | | USD 120.000 | | | | 7/17/20 | | | | USD 1 | | | | USD 12,000 | | | | 562,151 | | | | (1,730,000 | ) |
| Franco Nevada Corp. Put | | | USD 105.000 | | | | 7/17/20 | | | | USD 1 | | | | USD 10,500 | | | | 321,961 | | | | (157,500 | ) |
| Gold Fields Ltd. Call | | | USD 8.000 | | | | 7/17/20 | | | | USD 3 | | | | USD 2,400 | | | | 213,401 | | | | (223,500 | ) |
| Harmony Gold Mining Call | | | USD 3.000 | | | | 8/21/20 | | | | USD 3 | | | | USD 900 | | | | 161,996 | | | | (300,000 | ) |
| Harmony Gold Mining Call | | | USD 4.000 | | | | 8/21/20 | | | | USD 3 | | | | USD 1,200 | | | | 169,380 | | | | (172,500 | ) |
| Harmony Gold Mining Put | | | USD 4.000 | | | | 8/21/20 | | | | USD 3 | | | | USD 1,200 | | | | 266,878 | | | | (285,000 | ) |
| IAM Gold Corp. Put | | | USD 4.000 | | | | 6/19/20 | | | | USD 2 | | | | USD 800 | | | | 151,919 | | | | (165,000 | ) |
| IAM Gold Corp. Put | | | USD 3.000 | | | | 5/15/20 | | | | USD 2 | | | | USD 600 | | | | 139,522 | | | | (20,000 | ) |
| iShares Silver Trust Put | | | USD 14.000 | | | | 6/19/20 | | | | USD 2 | | | | USD 2,800 | | | | 135,919 | | | | (146,000 | ) |
| Kinross Gold Corp. Put | | | USD 4.500 | | | | 8/21/20 | | | | USD 3 | | | | USD 1,350 | | | | 171,330 | | | | (57,000 | ) |
| Kinross Gold Corp. Call | | | USD 8.000 | | | | 8/21/20 | | | | USD 2 | | | | USD 1,600 | | | | 151,919 | | | | (113,000 | ) |
| Kirkland Lake Gold Ltd. Call | | | CAD 58.000 | | | | 10/16/20 | | | | CAD 1 | | | | CAD 5,800 | | | | 233,583 | | | | (502,892 | ) |
| Kirkland Lake Gold Ltd. Put | | | CAD 46.000 | | | | 7/17/20 | | | | CAD 1 | | | | CAD 4,600 | | | | 196,637 | | | | (98,782 | ) |
| Kirkland Lake Gold Ltd. Call | | | CAD 54.000 | | | | 7/17/20 | | | | CAD 1 | | | | CAD 5,400 | | | | 227,408 | | | | (510,076 | ) |
| Kirkland Lake Gold Ltd. Call | | | CAD 56.000 | | | | 7/17/20 | | | | CAD 1 | | | | CAD 5,600 | | | | 135,359 | | | | (431,050 | ) |
| Kirkland Lake Gold Ltd. Call | | | CAD 50.000 | | | | 7/17/20 | | | | CAD 1 | | | | CAD 5,000 | | | | 169,206 | | | | (713,028 | ) |
18 INVESCO OPPENHEIMER GOLD & SPECIAL MINERALS FUND
| | | | | | | | | | | | | | | | | | | | | | | | |
| Exchange-Traded Options Written (Continued) | | | | | | | | | | | | | | | | | |
| Description | | Exercise Price | | | Expiration Date | | | Number of Contracts (000’s) | | | Notional Amount (000’s) | | | Premiums Received | | | Value | |
| MAG Silver Corp. Call | | | USD 12.500 | | | | 6/19/20 | | | | USD 2 | | | | USD 2,500 | | | $ | 207,918 | | | $ | (155,000 | ) |
| MAG Silver Corp. Put | | | USD 10.000 | | | | 6/19/20 | | | | USD 1 | | | | USD 1,000 | | | | 127,690 | | | | (45,000 | ) |
| Newcrest Mining Ltd. Put | | | AUD 26.500 | | | | 7/16/20 | | | | AUD 1 | | | | AUD 2,650 | | | | 98,378 | | | | (107,196 | ) |
| Newcrest Mining Ltd. Call | | | AUD 32.000 | | | | 7/16/20 | | | | AUD 1 | | | | AUD 1,600 | | | | 40,767 | | | | (26,881 | ) |
| Newmont Mining Corp. Put | | | USD 35.000 | | | | 9/18/20 | | | | USD 1 | | | | USD 3,500 | | | | 300,961 | | | | (38,000 | ) |
| Newmont Mining Corp. Put | | | USD 55.000 | | | | 6/19/20 | | | | USD 1 | | | | USD 5,500 | | | | 322,954 | | | | (202,500 | ) |
| Newmont Mining Corp. Call | | | USD 55.000 | | | | 6/19/20 | | | | USD 1 | | | | USD 5,500 | | | | 103,962 | | | | (632,500 | ) |
| Newmont Mining Corp. Call | | | USD 55.000 | | | | 9/18/20 | | | | USD 1 | | | | USD 5,500 | | | | 267,961 | | | | (875,000 | ) |
| Newmont Mining Corp. Call | | | USD 65.000 | | | | 9/18/20 | | | | USD 1 | | | | USD 6,500 | | | | 142,961 | | | | (432,500 | ) |
| Newmont Mining Corp. Put | | | USD 48.000 | | | | 9/18/20 | | | | USD 1 | | | | USD 4,800 | | | | 187,127 | | | | (202,500 | ) |
| Nova Gold Resources Put | | | USD 10.000 | | | | 12/18/20 | | | | USD 2 | | | | USD 2,000 | | | | 240,041 | | | | (285,000 | ) |
| Osisko Gold Royal Call | | | USD 12.500 | | | | 10/16/20 | | | | USD 2 | | | | USD 2,500 | | | | 149,722 | | | | (150,000 | ) |
| Osisko Gold Royal Put | | | USD 7.500 | | | | 10/16/20 | | | | USD 2 | | | | USD 1,500 | | | | 189,923 | | | | (180,000 | ) |
| Pan-American Silver Put | | | USD 16.000 | | | | 7/17/20 | | | | USD 2 | | | | USD 3,200 | | | | 234,577 | | | | (115,000 | ) |
| Pan-American Silver Call | | | USD 17.000 | | | | 7/17/20 | | | | USD 1 | | | | USD 1,700 | | | | 147,092 | | | | (505,000 | ) |
| Pan-American Silver Call | | | USD 22.000 | | | | 7/17/20 | | �� | | USD 1 | | | | USD 2,200 | | | | 141,211 | | | | (220,000 | ) |
| Pretium Resources Inc. Put | | | CAD 9.000 | | | | 7/17/20 | | | | CAD 1 | | | | CAD 900 | | | | 82,580 | | | | (44,901 | ) |
| Pretium Resources Inc. Call | | | CAD 10.000 | | | | 7/17/20 | | | | CAD 2 | | | | CAD 2,000 | | | | 190,076 | | | | (237,078 | ) |
| Quantum Minerals Ltd. Put | | | CAD 7.000 | | | | 10/16/20 | | | | CAD 1 | | | | CAD 700 | | | | 171,381 | | | | (54,959 | ) |
| Quantum Minerals Ltd. Call | | | CAD 8.000 | | | | 7/17/20 | | | | CAD 2 | | | | CAD 1,600 | | | | 139,796 | | | | (175,294 | ) |
| Quantum Minerals Ltd. Put | | | CAD 7.000 | | | | 7/17/20 | | | | CAD 1 | | | | CAD 700 | | | | 110,322 | | | | (26,940 | ) |
| Quantum Minerals Ltd. Call | | | CAD 10.000 | | | | 10/16/20 | | | | CAD 2 | | | | CAD 2,000 | | | | 176,616 | | | | (125,723 | ) |
| Royal Gold Inc. Call | | | USD 105.000 | | | | 5/15/20 | | | | USD 1 | | | | USD 10,500 | | | | 331,961 | | | | (1,880,000 | ) |
| Sandstorm Gold Ltd. Call | | | USD 10.000 | | | | 9/18/20 | | | | USD 2 | | | | USD 2,000 | | | | 147,922 | | | | (115,000 | ) |
| Sandstorm Gold Ltd. Put | | | USD 7.000 | | | | 9/18/20 | | | | USD 2 | | | | USD 1,400 | | | | 198,223 | | | | (150,000 | ) |
| Sibanye Stillwater Put | | | USD 7.500 | | | | 7/17/20 | | | | USD 1 | | | | USD 750 | | | | 166,958 | | | | (117,500 | ) |
| Sibanye Stillwater Call | | | USD 12.500 | | | | 7/17/20 | | | | USD 1 | | | | USD 1,250 | | | | 112,961 | | | | (35,000 | ) |
| Sibanye Stillwater Call | | | USD 7.500 | | | | 7/17/20 | | | | USD 2 | | | | USD 1,500 | | | | 139,922 | | | | (330,000 | ) |
| Sibanye Stillwater Put | | | USD 10.000 | | | | 7/17/20 | | | | USD 1 | | | | USD 1,000 | | | | 132,961 | | | | (282,500 | ) |
| Spider Gold Trust Put | | | USD 148.000 | | | | 5/15/20 | | | | USD 1 | | | | USD 8,880 | | | | 142,177 | | | | (18,300 | ) |
| SSR Mining Inc. Put | | | USD 11.000 | | | | 9/18/20 | | | | USD 1 | | | | USD 1,100 | | | | 119,971 | | | | (35,000 | ) |
| SSR Mining Inc. Call | | | USD 20.000 | | | | 9/18/20 | | | | USD 1 | | | | USD 2,000 | | | | 116,961 | | | | (150,000 | ) |
19 INVESCO OPPENHEIMER GOLD & SPECIAL MINERALS FUND
CONSOLIDATED
SCHEDULE OF INVESTMENTS Continued
| | | | | | | | | | | | | | | | | | | | | | | | |
| Exchange-Traded Options Written (Continued) | | | | | | | | | | | | | | | | | |
| Description | | Exercise Price | | | Expiration Date | | | Number of Contracts (000’s) | | | Notional Amount (000’s) | | | Premiums Received | | | Value | |
| Torex Gold Resources Inc. Call | | | CAD 23.000 | | | | 7/17/20 | | | | CAD 2 | | | | CAD 4,600 | | | $ | 251,043 | | | $ | (183,196 | ) |
| Torex Gold Resources Inc. Put | | | CAD 17.000 | | | | 7/17/20 | | | | CAD 2 | | | | CAD 3,400 | | | | 255,048 | | | | (158,052 | ) |
| Torex Gold Resources Inc. Call | | | CAD 24.000 | | | | 10/16/20 | | | | CAD 1 | | | | CAD 2,400 | | | | 150,736 | | | | (120,335 | ) |
| Vaneck Vectors ETF Put | | | USD 35.000 | | | | 6/19/20 | | | | USD 1 | | | | USD 3,500 | | | | 166,007 | | | | (164,000 | ) |
| Vaneck Vectors ETF Put | | | USD 37.000 | | | | 5/15/20 | | | | USD 1 | | | | USD 3,700 | | | | 161,958 | | | | (82,500 | ) |
| Vaneck Vectors ETF Put | | | USD 29.000 | | | | 6/19/20 | | | | USD 1 | | | | USD 2,900 | | | | 100,959 | | | | (112,000 | ) |
| Wheaton Precious Metals Call | | | USD 30.000 | | | | 6/19/20 | | | | USD 1 | | | | USD 3,000 | | | | 129,401 | | | | (822,500 | ) |
| Wheaton Precious Metals Call | | | USD 37.000 | | | | 6/19/20 | | | | USD 1 | | | | USD 3,700 | | | | 98,961 | | | | (295,500 | ) |
| Total Exchange-Traded Options Written | | | | | | | | | | | | | | | $ | 16,107,998 | | | $ | (24,795,669 | ) |
| | | | | | | | | | | | | | | | | | | | |
Glossary:
| | |
| Currency abbreviations indicate amounts reporting in currencies |
| AUD | | Australian Dollar |
| CAD | | Canadian Dollar |
| |
| Definitions | | |
| ADR | | American Depositary Receipt |
| ETF | | Exchange Traded Fund |
See accompanying Notes to Consolidated Financial Statements.
20 INVESCO OPPENHEIMER GOLD & SPECIAL MINERALS FUND
CONSOLIDATED STATEMENT OF
ASSETS AND LIABILITIES April 30, 2020
| | | | |
| Assets | | | | |
| Investments, at value—see accompanying consolidated schedule of investments: | | | | |
| Unaffiliated companies (cost $941,918,365) | | $ | 1,428,471,918 | |
| Affiliated companies (cost $93,652,997) | | | 80,093,785 | |
| | | | |
| | | 1,508,565,703 | |
| Cash | | | 1,123,755 | |
| Cash—foreign currencies (cost $115,346) | | | 45,219 | |
| Receivables and other assets: | | | | |
| Shares of beneficial interest sold | | | 3,713,910 | |
| Investments sold | | | 2,302,524 | |
| Dividends | | | 645,161 | |
| Other | | | 232,822 | |
| | | | |
| Total assets | | | 1,516,629,094 | |
| | | | |
| Liabilities | | | | |
| Options written, at value (premiums received $16,107,998) | | | 24,795,669 | |
| Payables and other liabilities: | | | | |
| Investments purchased | | | 8,744,133 | |
| Shares of beneficial interest redeemed | | | 4,122,076 | |
| Transfer and shareholder servicing agent fees | | | 797,604 | |
| Distribution and service plan fees | | | 246,077 | |
| Trustees’ compensation | | | 139,929 | |
| Shareholder communications | | | 131,289 | |
| Advisory fees | | | 27,153 | |
| Administration fees | | | 603 | |
| Other | | | 187,272 | |
| | | | |
| Total liabilities | | | 39,191,805 | |
| | | | |
| Net Assets | | $ | 1,477,437,289 | |
| | | | |
| | | | |
| Composition of Net Assets | | | | |
| Shares of beneficial interest | | $ | 2,494,626,495 | |
| Total accumulated loss | | | (1,017,189,206 | ) |
| | | | |
| Net Assets | | $ | 1,477,437,289 | |
| | | | |
21 INVESCO OPPENHEIMER GOLD & SPECIAL MINERALS FUND
CONSOLIDATED STATEMENT OF
ASSETS AND LIABILITIES Continued
| | | | |
| Net Asset Value Per Share | | | | |
| Class A Shares: | | | | |
| |
| Net asset value and redemption price per share (based on net assets of $705,341,310 and 32,394,603 shares of beneficial interest outstanding) | | $ | 21.77 | |
| |
| Maximum offering price per share (net asset value plus sales charge of 5.50% of offering price) | | $ | 23.04 | |
| |
| Class C Shares: | | | | |
| |
| Net asset value, redemption price (excludes applicable contingent deferred sales charge) and offering price per share (based on net assets of $99,527,790 and 5,057,780 shares of beneficial interest outstanding) | | $ | 19.68 | |
| |
| Class R Shares: | | | | |
| |
| Net asset value, redemption price and offering price per share (based on net assets of $125,315,754 and 6,057,238 shares of beneficial interest outstanding) | | $ | 20.69 | |
| |
| Class Y Shares: | | | | |
| |
| Net asset value, redemption price and offering price per share (based on net assets of $349,289,613 and 16,036,361 shares of beneficial interest outstanding) | | $ | 21.78 | |
| |
| Class R5 Shares: | | | | |
| |
| Net asset value, redemption price and offering price per share (based on net assets of $30,234 and 1,387.65 shares of beneficial interest outstanding) | | $ | 21.79 | |
| |
| Class R6 Shares: | | | | |
| |
| Net asset value, redemption price and offering price per share (based on net assets of $197,932,588 and 9,004,348 shares of beneficial interest outstanding) | | $ | 21.98 | |
See accompanying Notes to Consolidated Financial Statements.
22 INVESCO OPPENHEIMER GOLD & SPECIAL MINERALS FUND
CONSOLIDATED STATEMENT OF
OPERATIONS
| | | | | | | | |
| | | Ten Months Ended April 30, 2020 | | Year Ended June 30, 2019 |
| Investment Income | | | | | | | | |
| Dividends: | | | | | | | | |
| Unaffiliated companies (net of foreign withholding taxes of $602,170 and $317,592, respectively) | | $ | 13,568,143 | | | $ | 10,186,954 | |
| Affiliated companies | | | 295,465 | | | | 434,939 | |
| Interest | | | 8,930 | | | | 2,438 | |
| Total investment income | | | 13,872,538 | | | | 10,624,331 | |
| | | | | | | | |
| Expenses | | | | | | | | |
| Advisory fees | | | 6,941,697 | | | | 6,293,628 | |
| Administration fees | | | 154,209 | | | | 11,908 | |
| Distribution and service plan fees: | | | | | | | | |
| Class A | | | 1,219,197 | | | | 1,044,821 | |
| Class C | | | 759,414 | | | | 1,055,246 | |
| Class R | | | 498,161 | | | | 503,164 | |
| Transfer and shareholder servicing agent fees: | | | | | | | | |
| Class A | | | 1,282,508 | | | | 886,327 | |
| Class C | | | 194,066 | | | | 214,323 | |
| Class R | | | 254,727 | | | | 204,556 | |
| Class Y | | | 629,775 | | | | 337,157 | |
| Class R5 | | | 8 | | | | 1 | |
| Class R6 | | | 43,473 | | | | 31,096 | |
| Shareholder communications: | | | | | | | | |
| Class A | | | 72,098 | | | | 34,058 | |
| Class C | | | 10,829 | | | | 8,726 | |
| Class R | | | 14,215 | | | | 5,101 | |
| Class Y | | | 35,496 | | | | 13,274 | |
| Class R5 | | | 2 | | | | — | |
| Class R6 | | | 19,368 | | | | 5,233 | |
| Custodian fees and expenses | | | 99,560 | | | | 85,916 | |
| Trustees’ compensation | | | 35,981 | | | | 26,363 | |
| Borrowing fees | | | — | | | | 23,851 | |
| Other | | | 144,344 | | | | 147,116 | |
| Total expenses | | | 12,409,128 | | | | 10,931,865 | |
| Less waivers and reimbursements of expenses | | | (337,953 | ) | | | (101,241 | ) |
| Net expenses | | | 12,071,175 | | | | 10,830,624 | |
| | | | | | | | |
| Net Investment Income (Loss) | | | 1,801,363 | | | | (206,293 | ) |
23 INVESCO OPPENHEIMER GOLD & SPECIAL MINERALS FUND
CONSOLIDATED STATEMENT OF
OPERATIONS Continued
| | | | | | | | |
| | | Ten Months Ended April 30, 2020 | | Year Ended June 30, 2019 |
| Realized and Unrealized Gain (Loss) | | | | | | | | |
| Net realized gain (loss) on: | | | | | | | | |
| Investment transactions in: | | | | | | | | |
Unaffiliated companies | | $ | 59,736,257 | | | $ | (17,006,596 | ) |
Affiliated companies | | | 8,152,303 | | | | (5,031,778 | ) |
| Option contracts written | | | 7,462,308 | | | | 2,495,362 | |
| Foreign currency transactions | | | (649,699 | ) | | | (94,789 | ) |
| Net realized gain (loss) | | | 74,701,169 | | | | (19,637,801 | ) |
| Net change in unrealized appreciation/(depreciation) on: | | | | | | | | |
| Investment transactions in: | | | | | | | | |
Unaffiliated companies | | | 149,668,810 | | | | 147,803,063 | |
Affiliated companies | | | 12,644,006 | | | | 14,326,680 | |
| Foreign currency transactions | | | (69,601 | ) | | | (374 | ) |
| Option contracts written | | | (8,244,006 | ) | | | (651,009 | ) |
| Net change in unrealized appreciation/(depreciation) | | | 153,999,209 | | | | 161,478,360 | |
| | | | | | | | |
| Net Increase in Net Assets Resulting from Operations | | $ | 230,501,741 | | | $ | 141,634,266 | |
| | | | |
See accompanying Notes to Consolidated Financial Statements.
24 INVESCO OPPENHEIMER GOLD & SPECIAL MINERALS FUND
CONSOLIDATED
STATEMENT OF CHANGES IN NET ASSETS
| | | | | | | | | | | | |
| | | Ten Months Ended April 30, 2020 | | Year Ended June 30, 2019 | | Year Ended June 30, 2018 |
| Operations | | | | | | | | | | | | |
| Net investment income (loss) | | $ | 1,801,363 | | | $ | (206,293 | ) | | $ | (4,698,053 | ) |
| Net realized gain (loss) | | | 74,701,169 | | | | (19,637,801 | ) | | | 17,357,410 | |
| Net change in unrealized appreciation/(depreciation) | | | 153,999,209 | | | | 161,478,360 | | | | (31,991,535 | ) |
| Net increase (decrease) in net assets resulting from operations | | | 230,501,741 | | | | 141,634,266 | | | | (19,332,178 | ) |
| | | | | | | | | | | | |
| Dividends and/or Distributions to Shareholders | | | | | | | | | | | | |
| Distributions to shareholders from distributable earnings: | | | | | | | | | | | | |
| Class A | | | (1,841,453 | ) | | | — | | | | (15,015,096 | ) |
| Class B | | | — | | | | — | | | | (12,596 | ) |
| Class C | | | — | | | | — | | | | (3,055,344 | ) |
| Class R | | | (133,756 | ) | | | — | | | | (3,538,235 | ) |
| Class Y | | | (1,503,817 | ) | | | — | | | | (4,678,986 | ) |
| Class R5 | | | (75 | ) | | | — | | | | — | |
| Class R6 | | | (983,754 | ) | | | — | | | | (2,554,953 | ) |
| Total distributions from distributable earnings | | | (4,462,855 | ) | | | — | | | | (28,855,210 | ) |
| | | | | | | | | | | | |
| Beneficial Interest Transactions | | | | | | | | | | | | |
| Net increase (decrease) in net assets resulting from beneficial interest transactions: | | | | | | | | | | | | |
| Class A | | | 66,614,819 | | | | (21,157,820 | ) | | | (56,120,555 | ) |
| Class B | | | — | | | | — | | | | (2,841,055 | ) |
| Class C | | | (7,079,595 | ) | | | (45,910,870 | ) | | | (10,261,568 | ) |
| Class R | | | (10,950,941 | ) | | | (15,199,193 | ) | | | (16,322,727 | ) |
| Class Y | | | 72,743,264 | | | | 50,764,653 | | | | 2,019,862 | |
| Class R5 | | | 9,834 | | | | 10,000 | | | | — | |
| Class R6 | | | 31,209,905 | | | | 10,483,870 | | | | 31,655,578 | |
| Total beneficial interest transactions | | | 152,547,286 | | | | (21,009,360 | ) | | | (51,870,465 | ) |
| | | | | | | | | | | | |
| Net Assets | | | | | | | | | | | | |
| Total increase (decrease) | | | 378,586,172 | | | | 120,624,906 | | | | (100,057,853 | ) |
| Beginning of period | | | 1,098,851,117 | | | | 978,226,211 | | | | 1,078,284,064 | |
| End of period | | $ | 1,477,437,289 | | | $ | 1,098,851,117 | | | $ | 978,226,211 | |
| | | | |
See accompanying Notes to Consolidated Financial Statements.
25 INVESCO OPPENHEIMER GOLD & SPECIAL MINERALS FUND
CONSOLIDATED FINANCIAL HIGHLIGHTS
| | | | | | | | | | | | | | | | | | | | | | | | |
| Class A | | Ten Months Ended April 30, 2020 | | | Year Ended June 30, 2019 | | | Year Ended June 30, 2018 | | | Year Ended June 30, 2017 | | | Year Ended June 30, 2016 | | | Year Ended June 30, 2015 | |
| Per Share Operating Data | | | | | | | | | | | | | | | | | | | | | | | | |
| Net asset value, beginning of period | | | $17.87 | | | | $15.51 | | | | $16.28 | | | | $19.82 | | | | $12.63 | | | | $19.89 | |
| Income (loss) from investment operations: | | | | | | | | | | | | | | | | | | | | | | | | |
| Net investment income (loss)1 | | | 0.02 | | | | 0.002 | | | | (0.06) | | | | (0.09) | | | | (0.06) | | | | (0.04) | |
| Net realized and unrealized gain (loss) | | | 3.94 | | | | 2.36 | | | | (0.25) | | | | (2.40) | | | | 7.25 | | | | (6.91) | |
| Total from investment operations | | | 3.96 | | | | 2.36 | | | | (0.31) | | | | (2.49) | | | | 7.19 | | | | (6.95) | |
| Dividends and/or distributions to shareholders: | | | | | | | | | | | | | | | | | | | | | | | | |
| Dividends from net investment income | | | (0.06) | | | | 0.00 | | | | (0.46) | | | | (1.05) | | | | 0.00 | | | | (0.29) | |
| Tax return of capital distribution | | | 0.00 | | | | 0.00 | | | | 0.00 | | | | 0.00 | | | | 0.00 | | | | (0.02) | |
| Total dividends and/or distributions to shareholders | | | (0.06) | | | | 0.00 | | | | (0.46) | | | | (1.05) | | | | 0.00 | | | | (0.31) | |
| Net asset value, end of period | | | $21.77 | | | | $17.87 | | | | $15.51 | | | | $16.28 | | | | $19.82 | | | | $12.63 | |
| | | | |
| | | | | | | | | | | | | | | | | | | | | | | | |
| Total Return, at Net Asset Value3 | | | 22.21% | | | | 15.22% | | | | (1.88)% | | | | (12.12)% | | | | 56.93% | | | | (34.91)% | |
| | | | | | | | | | | | | | | | | | | | | | | | |
| Ratios/Supplemental Data | | | | | | | | | | | | | | | | | | | | | | | | |
| Net assets, end of period (in thousands) | | | $705,341 | | | | $532,925 | | | | $490,065 | | | | $570,847 | | | | $793,452 | | | | $499,903 | |
| Average net assets (in thousands) | | | $606,993 | | | | $436,791 | | | | $534,962 | | | | $671,123 | | | | $501,940 | | | | $630,815 | |
| Ratios to average net assets:4 | | | | | | | | | | | | | | | | | | | | | | | | |
| Net investment income (loss) | | | 0.13% | | | | 0.00%5 | | | | (0.39)% | | | | (0.48)% | | | | (0.44)% | | | | (0.29)% | |
| Expenses excluding specific expenses listed below | | | 1.20% | | | | 1.18% | | | | 1.17% | | | | 1.16% | | | | 1.18% | | | | 1.22% | |
| Interest and fees from borrowings | | | 0.00% | | | | 0.00%5 | | | | 0.00%5 | | | | 0.00%5 | | | | 0.00%5 | | | | 0.00% | |
| Total expenses6 | | | 1.20% | | | | 1.18% | | | | 1.17% | | | | 1.16% | | | | 1.18% | | | | 1.22% | |
| Expenses after payments, waivers and/or reimbursements and reduction to custodian expenses | | | 1.17% | | | | 1.17% | | | | 1.16% | | | | 1.15% | | | | 1.17% | | | | 1.16% | |
| Portfolio turnover rate7 | | | 44% | | | | 35% | | | | 44% | | | | 65% | | | | 69% | | | | 79% | |
26 INVESCO OPPENHEIMER GOLD & SPECIAL MINERALS FUND
1. Calculated based on the average shares outstanding during the period.
2. Less than $0.005 per share.
3. Includes adjustments in accordance with accounting principles generally accepted in the United States of America and as such, the net asset value for financial reporting purposes and the returns based upon those net asset values may differ from the net asset value and returns for shareholder transactions. Does not include sales charges and is not annualized for periods less than one year, if applicable.
4. Annualized for periods less than one full year.
5. Less than 0.005%.
6. Total expenses including indirect expenses from affiliated fund fees and expenses were as follows:
| | | | |
| | Ten Months Ended April 30, 2020 | | 1.20% |
| | Year Ended June 30, 2019 | | 1.18% |
| | Year Ended June 30, 2018 | | 1.17% |
| | Year Ended June 30, 2017 | | 1.16% |
| | Year Ended June 30, 2016 | | 1.18% |
| | Year Ended June 30, 2015 | | 1.22% |
7. Portfolio turnover is calculated at the fund level and is not annualized for periods less than one year, if applicable.
See accompanying Notes to Consolidated Financial Statements.
27 INVESCO OPPENHEIMER GOLD & SPECIAL MINERALS FUND
CONSOLIDATED FINANCIAL HIGHLIGHTS Continued
| | | | | | | | | | | | | | | | | | | | | | | | |
| Class C | | Ten Months Ended April 30, 2020 | | | Year Ended June 30, 2019 | | | Year Ended June 30, 2018 | | | Year Ended June 30, 2017 | | | Year Ended June 30, 2016 | | | Year Ended June 30, 2015 | |
| Per Share Operating Data | | | | | | | | | | | | | | | | | | | | | | | | |
| Net asset value, beginning of period | | | $16.20 | | | | $14.17 | | | | $14.91 | | | | $18.26 | | | | $11.73 | | | | $18.44 | |
| Income (loss) from investment operations: | | | | | | | | | | | | | | | | | | | | | | | | |
| Net investment loss1 | | | (0.09) | | | | (0.10) | | | | (0.17) | | | | (0.20) | | | | (0.14) | | | | (0.15) | |
| Net realized and unrealized gain (loss) | | | 3.57 | | | | 2.13 | | | | (0.22) | | | | (2.21) | | | | 6.67 | | | | (6.37) | |
| Total from investment operations | | | 3.48 | | | | 2.03 | | | | (0.39) | | | | (2.41) | | | | 6.53 | | | | (6.52) | |
| Dividends and/or distributions to shareholders: | | | | | | | | | | | | | | | | | | | | | | | | |
| Dividends from net investment income | | | 0.00 | | | | 0.00 | | | | (0.35) | | | | (0.94) | | | | 0.00 | | | | (0.18) | |
| Tax return of capital distribution | | | 0.00 | | | | 0.00 | | | | 0.00 | | | | 0.00 | | | | 0.00 | | | | (0.01) | |
| Total dividends and/or distributions to shareholders | | | 0.00 | | | | 0.00 | | | | (0.35) | | | | (0.94) | | | | 0.00 | | | | (0.19) | |
| Net asset value, end of period | | | $19.68 | | | | $16.20 | | | | $14.17 | | | | $14.91 | | | | $18.26 | | | | $11.73 | |
| | | | |
| | | | | | | | | | | | | | | | | | | | | | | | |
| Total Return, at Net Asset Value2 | | | 21.48% | | | | 14.33% | | | | (2.62)% | | | | (12.80)% | | | | 55.67% | | | | (35.35)% | |
| | | | | | | | | | | | | | | | | | | | | | | | |
| Ratios/Supplemental Data | | | | | | | | | | | | | | | | | | | | | | | | |
| Net assets, end of period (in thousands) | | | $99,528 | | | | $88,904 | | | | $121,350 | | | | $138,114 | | | | $179,529 | | | | $122,325 | |
| Average net assets (in thousands) | | | $91,057 | | | | $105,744 | | | | $131,364 | | | | $156,883 | | | | $115,882 | | | | $157,102 | |
| Ratios to average net assets:3 | | | | | | | | | | | | | | | | | | | | | | | | |
| Net investment loss | | | (0.62)% | | | | (0.76)% | | | | (1.15)% | | | | (1.22)% | | | | (1.19)% | | | | (1.05)% | |
| Expenses excluding specific expenses listed below | | | 1.96% | | | | 1.93% | | | | 1.93% | | | | 1.92% | | | | 1.94% | | | | 1.98% | |
| Interest and fees from borrowings | | | 0.00% | | | | 0.00%4 | | | | 0.00%4 | | | | 0.00%4 | | | | 0.00%4 | | | | 0.00% | |
| Total expenses5 | | | 1.96% | | | | 1.93% | | | | 1.93% | | | | 1.92% | | | | 1.94% | | | | 1.98% | |
| Expenses after payments, waivers and/or reimbursements and reduction to custodian expenses | | | 1.92% | | | | 1.92% | | | | 1.92% | | | | 1.91% | | | | 1.93% | | | | 1.92% | |
| Portfolio turnover rate6 | | | 44% | | | | 35% | | | | 44% | | | | 65% | | | | 69% | | | | 79% | |
28 INVESCO OPPENHEIMER GOLD & SPECIAL MINERALS FUND
1. Calculated based on the average shares outstanding during the period.
2. Includes adjustments in accordance with accounting principles generally accepted in the United States of America and as such, the net asset value for financial reporting purposes and the returns based upon those net asset values may differ from the net asset value and returns for shareholder transactions. Does not include sales charges and is not annualized for periods less than one year, if applicable.
3. Annualized for periods less than one full year.
4. Less than 0.005%.
5. Total expenses including indirect expenses from affiliated fund fees and expenses were as follows:
| | | | |
| | Ten Months Ended April 30, 2020 | | 1.96% |
| | Year Ended June 30, 2019 | | 1.93% |
| | Year Ended June 30, 2018 | | 1.93% |
| | Year Ended June 30, 2017 | | 1.92% |
| | Year Ended June 30, 2016 | | 1.94% |
| | Year Ended June 30, 2015 | | 1.98% |
6. Portfolio turnover is calculated at the fund level and is not annualized for periods less than one year, if applicable.
See accompanying Notes to Consolidated Financial Statements.
29 INVESCO OPPENHEIMER GOLD & SPECIAL MINERALS FUND
CONSOLIDATED FINANCIAL HIGHLIGHTS Continued
| | | | | | | | | | | | | | | | | | | | | | | | |
| Class R | | Ten Months Ended April 30, 2020 | | | Year Ended June 30, 2019 | | | Year Ended June 30, 2018 | | | Year Ended June 30, 2017 | | | Year Ended June 30, 2016 | | | Year Ended June 30, 2015 | |
| Per Share Operating Data | | | | | | | | | | | | | | | | | | | | | | | | |
| Net asset value, beginning of period | | | $16.98 | | | | $14.77 | | | | $15.54 | | | | $18.98 | | | | $12.12 | | | | $19.11 | |
| Income (loss) from investment operations: | | | | | | | | | | | | | | | | | | | | | | | | |
| Net investment loss1 | | | (0.02) | | | | (0.04) | | | | (0.10) | | | | (0.12) | | | | (0.09) | | | | (0.08) | |
| Net realized and unrealized gain (loss) | | | 3.75 | | | | 2.25 | | | | (0.25) | | | | (2.31) | | | | 6.95 | | | | (6.63) | |
| Total from investment operations | | | 3.73 | | | | 2.21 | | | | (0.35) | | | | (2.43) | | | | 6.86 | | | | (6.71) | |
| Dividends and/or distributions to shareholders: | | | | | | | | | | | | | | | | | | | | | | | | |
| Dividends from net investment income | | | (0.02) | | | | 0.00 | | | | (0.42) | | | | (1.01) | | | | 0.00 | | | | (0.27) | |
| Tax return of capital distribution | | | 0.00 | | | | 0.00 | | | | 0.00 | | | | 0.00 | | | | 0.00 | | | | (0.01) | |
| Total dividends and/or distributions to shareholders | | | (0.02) | | | | 0.00 | | | | (0.42) | | | | (1.01) | | | | 0.00 | | | | (0.28) | |
| Net asset value, end of period | | | $20.69 | | | | $16.98 | | | | $14.77 | | | | $15.54 | | | | $18.98 | | | | $12.12 | |
| | | | |
| | | | | | | | | | | | | | | | | | | | | | | | |
| Total Return, at Net Asset Value2 | | | 21.99% | | | | 14.96% | | | | (2.23)% | | | | (12.34)% | | | | 56.60% | | | | (35.07)% | |
| | | | | | | | | | | | | | | | | | | | | | | | |
| Ratios/Supplemental Data | | | | | | | | | | | | | | | | | | | | | | | | |
| Net assets, end of period (in thousands) | | | $125,316 | | | | $113,589 | | | | $114,608 | | | | $136,979 | | | | $176,396 | | | | $102,624 | |
| Average net assets (in thousands) | | | $119,459 | | | | $100,857 | | | | $128,644 | | | | $158,070 | | | | $108,402 | | | | $123,329 | |
| Ratios to average net assets:3 | | | | | | | | | | | | | | | | | | | | | | | | |
| Net investment loss | | | (0.12)% | | | | (0.25)% | | | | (0.65)% | | | | (0.73)% | | | | (0.70)% | | | | (0.54)% | |
| Expenses excluding specific expenses listed below | | | 1.46% | | | | 1.43% | | | | 1.43% | | | | 1.42% | | | | 1.43% | | | | 1.48% | |
| Interest and fees from borrowings | | | 0.00% | | | | 0.00%4 | | | | 0.00%4 | | | | 0.00%4 | | | | 0.00%4 | | | | 0.00% | |
| Total expenses5 | | | 1.46% | | | | 1.43% | | | | 1.43% | | | | 1.42% | | | | 1.43% | | | | 1.48% | |
| Expenses after payments, waivers and/or reimbursements and reduction to custodian expenses | | | 1.42% | | | | 1.42% | | | | 1.42% | | | | 1.41% | | | | 1.42% | | | | 1.42% | |
| Portfolio turnover rate6 | | | 44% | | | | 35% | | | | 44% | | | | 65% | | | | 69% | | | | 79% | |
30 INVESCO OPPENHEIMER GOLD & SPECIAL MINERALS FUND
1. Calculated based on the average shares outstanding during the period.
2. Includes adjustments in accordance with accounting principles generally accepted in the United States of America and as such, the net asset value for financial reporting purposes and the returns based upon those net asset values may differ from the net asset value and returns for shareholder transactions. Does not include sales charges and is not annualized for periods less than one year, if applicable.
3. Annualized for periods less than one full year.
4. Less than 0.005%.
5. Total expenses including indirect expenses from affiliated fund fees and expenses were as follows:
| | | | |
| | Ten Months Ended April 30, 2020 | | 1.46% |
| | Year Ended June 30, 2019 | | 1.43% |
| | Year Ended June 30, 2018 | | 1.43% |
| | Year Ended June 30, 2017 | | 1.42% |
| | Year Ended June 30, 2016 | | 1.43% |
| | Year Ended June 30, 2015 | | 1.48% |
6. Portfolio turnover is calculated at the fund level and is not annualized for periods less than one year, if applicable.
See accompanying Notes to Consolidated Financial Statements.
31 INVESCO OPPENHEIMER GOLD & SPECIAL MINERALS FUND
CONSOLIDATED FINANCIAL HIGHLIGHTS Continued
| | | | | | | | | | | | | | | | | | | | | | | | |
| Class Y | | Ten Months Ended April 30, 2020 | | | Year Ended June 30, 2019 | | | Year Ended June 30, 2018 | | | Year Ended June 30, 2017 | | | Year Ended June 30, 2016 | | | Year Ended June 30, 2015 |
| Per Share Operating Data | | | | | | | | | | | | | | | | | | | | | | | | |
| Net asset value, beginning of period | | | $17.88 | | | | $15.48 | | | | $16.26 | | | | $19.81 | | | | $12.59 | | | | $19.85 | |
| Income (loss) from investment operations: | | | | | | | | | | | | | | | | | | | | | | | | |
| Net investment income (loss)1 | | | 0.06 | | | | 0.04 | | | | (0.02) | | | | (0.05) | | | | (0.02) | | | | (0.01) | |
| Net realized and unrealized gain (loss) | | | 3.93 | | | | 2.36 | | | | (0.25) | | | | (2.41) | | | | 7.24 | | | | (6.90) | |
| Total from investment operations | | | 3.99 | | | | 2.40 | | | | (0.27) | | | | (2.46) | | | | 7.22 | | | | (6.91) | |
| Dividends and/or distributions to shareholders: | | | | | | | | | | | | | | | | | | | | | | | | |
| Dividends from net investment income | | | (0.09) | | | | 0.00 | | | | (0.51) | | | | (1.09) | | | | 0.00 | | | | (0.34) | |
| Tax return of capital distribution | | | 0.00 | | | | 0.00 | | | | 0.00 | | | | 0.00 | | | | 0.00 | | | | (0.01) | |
| Total dividends and/or distributions to shareholders | | | (0.09) | | | | 0.00 | | | | (0.51) | | | | (1.09) | | | | 0.00 | | | | (0.35) | |
| Net asset value, end of period | | | $21.78 | | | | $17.88 | | | | $15.48 | | | | $16.26 | | | | $19.81 | | | | $12.59 | |
| | | | | | | | | | | | | | | | | | | | | | | | |
| | | | | | | | | | | | | | | | | | | | | | | | | |
| Total Return, at Net Asset Value2 | | | 22.41% | | | | 15.50% | | | | (1.65)% | | | | (11.91)% | | | | 57.35% | | | | (34.74)% | |
| | | | | | | | | | | | | | | | | | | | | | | | |
| Ratios/Supplemental Data | | | | | | | | | | | | | | | | | | | | | | | | |
| Net assets, end of period (in thousands) | | | $349,290 | | | | $229,569 | | | | $147,282 | | | | $152,334 | | | | $146,710 | | | | $102,438 | |
| Average net assets (in thousands) | | | $298,621 | | | | $165,432 | | | | $154,822 | | | | $140,430 | | | | $101,745 | | | | $128,207 | |
| Ratios to average net assets:3 | | | | | | | | | | | | | | | | | | | | | | | | |
| Net investment income (loss) | | | 0.38% | | | | 0.24% | | | | (0.15)% | | | | (0.28)% | | | | (0.19)% | | | | (0.04)% | |
| Expenses excluding specific expenses listed below | | | 0.96% | | | | 0.93% | | | | 0.93% | | | | 0.92% | | | | 0.94% | | | | 0.98% | |
| Interest and fees from borrowings | | | 0.00% | | | | 0.00%4 | | | | 0.00%4 | | | | 0.00%4 | | | | 0.00%4 | | | | 0.00% | |
| Total expenses5 | | | 0.96% | | | | 0.93% | | | | 0.93% | | | | 0.92% | | | | 0.94% | | | | 0.98% | |
| Expenses after payments, waivers and/or reimbursements and reduction to custodian expenses | | | 0.92% | | | | 0.92% | | | | 0.92% | | | | 0.91% | | | | 0.93% | | | | 0.92% | |
| Portfolio turnover rate6 | | | 44% | | | | 35% | | | | 44% | | | | 65% | | | | 69% | | | | 79% | |
32 INVESCO OPPENHEIMER GOLD & SPECIAL MINERALS FUND
1. Calculated based on the average shares outstanding during the period.
2. Includes adjustments in accordance with accounting principles generally accepted in the United States of America and as such, the net asset value for financial reporting purposes and the returns based upon those net asset values may differ from the net asset value and returns for shareholder transactions. Does not include sales charges and is not annualized for periods less than one year, if applicable.
3. Annualized for periods less than one full year.
4. Less than 0.005%.
5. Total expenses including indirect expenses from affiliated fund fees and expenses were as follows:
| | | | | | |
| | Ten Months Ended April 30, 2020 | | 0.96% | | |
| | Year Ended June 30, 2019 | | 0.93% | | |
| | Year Ended June 30, 2018 | | 0.93% | | |
| | Year Ended June 30, 2017 | | 0.92% | | |
| | Year Ended June 30, 2016 | | 0.94% | | |
| | Year Ended June 30, 2015 | | 0.98% | | |
6. Portfolio turnover is calculated at the fund level and is not annualized for periods less than one year, if applicable.
See accompanying Notes to Consolidated Financial Statements.
33 INVESCO OPPENHEIMER GOLD & SPECIAL MINERALS FUND
CONSOLIDATED FINANCIAL HIGHLIGHTS Continued
| | | | | | | | |
| Class R5 | | Ten Months Ended April 30, 2020 | | | Period Ended June 30, 20191 | |
| Per Share Operating Data | | | | | | | | |
| Net asset value, beginning of period | | | $17.87 | | | | $14.75 | |
| Income (loss) from investment operations: | | | | | | | | |
| Net investment income2 | | | 0.08 | | | | 0.01 | |
| Net realized and unrealized gain | | | 3.95 | | | | 3.11 | |
| Total from investment operations | | | 4.03 | | | | 3.12 | |
| Dividends and/or distributions to shareholders: | | | | | | | | |
| Dividends from net investment income | | | (0.11) | | | | 0.00 | |
| Tax return of capital distribution | | | 0.00 | | | | 0.00 | |
| Total dividends and/or distributions to shareholders | | | (0.11) | | | | 0.00 | |
| Net asset value, end of period | | | $21.79 | | | | $17.87 | |
| | | | | | | | |
| | | | | | | | |
| Total Return, at Net Asset Value3 | | | 22.65% | | | | 21.15% | |
| | | | | | | | |
| Ratios/Supplemental Data | | | | | | | | |
| Net assets, end of period (in thousands) | | | $30 | | | | $12 | |
| Average net assets (in thousands) | | | $15 | | | | $11 | |
| Ratios to average net assets:4 | | | | | | | | |
| Net investment income | | | 0.53% | | | | 0.35% | |
| Expenses excluding specific expenses listed below | | | 0.77% | | | | 0.80% | |
| Interest and fees from borrowings | | | 0.00% | | | | 0.00% | |
| Total expenses5 | | | 0.77% | | | | 0.80% | |
| Expenses after payments, waivers and/or reimbursements and reduction to custodian expenses | | | 0.77%6 | | | | 0.80%6 | |
| Portfolio turnover rate7 | | | 44% | | | | 35% | |
1. For the period from after the close of business on May 24, 2019 (inception of offering) to June 30, 2019.
2. Calculated based on the average shares outstanding during the period.
3. Includes adjustments in accordance with accounting principles generally accepted in the United States of America and as such, the net asset value for financial reporting purposes and the returns based upon those net asset values may differ from the net asset value and returns for shareholder transactions. Does not include sales charges and is not annualized for periods less than one year, if applicable.
4. Annualized for periods less than one full year.
5. Total expenses including indirect expenses from affiliated fund fees and expenses were as follows:
| | | | | | |
| | Ten Months Ended April 30, 2020 | | 0.77% | | |
| | Period Ended June 30, 2019 | | 0.80% | | |
6. Waiver was less than 0.005%.
7. Portfolio turnover is calculated at the fund level and is not annualized for periods less than one year, if applicable.
See accompanying Notes to Consolidated Financial Statements.
34 INVESCO OPPENHEIMER GOLD & SPECIAL MINERALS FUND
| | | | | | | | | | | | | | | | | | | | | | | | |
| Class R6 | | Ten Months Ended April 30, 2020 | | | Year Ended June 30, 2019 | | | Year Ended June 30, 2018 | | | Year Ended June 30, 2017 | | | Year Ended June 30, 2016 | | | Year Ended June 30, 2015 |
| Per Share Operating Data | | | | | | | | | | | | | | | | | | | | | | | | |
| Net asset value, beginning of period | | | $18.03 | | | | $15.58 | | | | $16.37 | | | | $19.94 | | | | $12.65 | | | | $19.96 | |
| Income (loss) from investment operations: | | | | | | | | | | | | | | | | | | | | | | | | |
| Net investment income (loss)1 | | | 0.09 | | | | 0.06 | | | | 0.002 | | | | (0.02) | | |
| (0.00)2
|
| | | 0.02 | |
| Net realized and unrealized gain (loss) | | | 3.98 | | | | 2.39 | | | | (0.26) | | | | (2.42) | | | | 7.29 | | | | (6.94) | |
| Total from investment operations | | | 4.07 | | | | 2.45 | | | | (0.26) | | | | (2.44) | | | | 7.29 | | | | (6.92) | |
| Dividends and/or distributions to shareholders: | | | | | | | | | | | | | | | | | | | | | | | | |
| Dividends from net investment income | | | (0.12) | | | | 0.00 | | | | (0.53) | | | | (1.13) | | | | 0.00 | | | | (0.38) | |
| Tax return of capital distribution | | | 0.00 | | | | 0.00 | | | | 0.00 | | | | 0.00 | | | | 0.00 | | | | (0.01) | |
| Total dividends and/or distributions to shareholders | | | (0.12) | | | | 0.00 | | | | (0.53) | | | | (1.13) | | | | 0.00 | | | | (0.39) | |
| Net asset value, end of period | | | $21.98 | | | | $18.03 | | | | $15.58 | | | | $16.37 | | | | $19.94 | | | | $12.65 | |
| | | | | | | | | | | | | | | | | | | | | | | | |
| | | | | | | | | | | | | | | | | | | | | | | | |
| Total Return, at Net Asset Value3 | | | 22.65% | | | | 15.73% | | | | (1.53)% | | | | (11.75)% | | | | 57.63% | | | | (34.62)% | |
| | | | | | | | | | | | | | | | | | | | | | | | |
| Ratios/Supplemental Data | | | | | | | | | | | | | | | | | | | | | | | | |
| Net assets, end of period (in thousands) | | | $197,933 | | | | $133,853 | | | | $104,921 | | | | $77,158 | | | | $69,889 | | | | $39,359 | |
| Average net assets (in thousands) | | | $163,124 | | | | $103,114 | | | | $89,461 | | | | $69,428 | | | | $40,868 | | | | $44,106 | |
| Ratios to average net assets:4 | | | | | | | | | | | | | | | | | | | | | | | | |
| Net investment income (loss) | | | 0.56% | | | | 0.41% | | | | 0.02% | | | | (0.09)% | | | | (0.02)% | | | | 0.16% | |
| Expenses excluding specific expenses listed below | | | 0.74% | | | | 0.76% | | | | 0.75% | | | | 0.73% | | | | 0.75% | | | | 0.78% | |
| Interest and fees from borrowings | | | 0.00% | | | | 0.00%5 | | | | 0.00%5 | | | | 0.00%5 | | | | 0.00%5 | | | | 0.00% | |
| Total expenses6 | | | 0.74% | | | | 0.76% | | | | 0.75% | | | | 0.73% | | | | 0.75% | | | | 0.78% | |
| Expenses after payments, waivers and/or reimbursements and reduction to custodian expenses | | | 0.74%7 | | | | 0.75% | | | | 0.75%7 | | |
| 0.73%7
|
| | | 0.74% | | | | 0.72% | |
| Portfolio turnover rate8 | | | 44% | | | | 35% | | | | 44% | | | | 65% | | | | 69% | | | | 79% | |
35 INVESCO OPPENHEIMER GOLD & SPECIAL MINERALS FUND
CONSOLIDATED FINANCIAL HIGHLIGHTS Continued
1. Calculated based on the average shares outstanding during the period.
2. Less than $0.005 per share.
3. Includes adjustments in accordance with accounting principles generally accepted in the United States of America and as such, the net asset value for financial reporting purposes and the returns based upon those net asset values may differ from the net asset value and returns for shareholder transactions. Does not include sales charges and is not annualized for periods less than one year, if applicable.
4. Annualized for periods less than one full year.
5. Less than 0.005%.
6. Total expenses including indirect expenses from affiliated fund fees and expenses were as follows:
| | | | | | |
| | Ten Months Ended April 30, 2020 | | 0.74% | | |
| | Year Ended June 30, 2019 | | 0.76% | | |
| | Year Ended June 30, 2018 | | 0.75% | | |
| | Year Ended June 30, 2017 | | 0.73% | | |
| | Year Ended June 30, 2016 | | 0.75% | | |
| | Year Ended June 30, 2015 | | 0.78% | | |
7. Waiver was less than 0.005%.
8. Portfolio turnover is calculated at the fund level and is not annualized for periods less than one year, if applicable.
See accompanying Notes to Consolidated Financial Statements.
36 INVESCO OPPENHEIMER GOLD & SPECIAL MINERALS FUND
NOTES TO CONSOLIDATED
FINANCIAL STATEMENTS April 30, 2020
Note 1 - Significant Accounting Policies
Invesco Oppenheimer Gold & Special Minerals Fund (the “Fund”) is a series portfolio of AIM Sector Funds (Invesco Sector Funds) (the “Trust”). The Trust is a Delaware statutory trust registered under the Investment Company Act of 1940, as amended (the “1940 Act”), as an open-end series management investment company authorized to issue an unlimited number of shares of beneficial interest. Information presented in these consolidated financial statements pertains only to the Fund. Matters affecting the Fund or each class will be voted on exclusively by the shareholders of such Fund or each class.
Effective July 31, 2019, the Fund’s fiscal year end changed from June 30 to April 30.
The Fund will seek to gain exposure to the commodity market through investments in the Invesco Oppenheimer Gold & Special Minerals Fund (Cayman) Ltd. (the “Subsidiary”), a wholly-owned and controlled subsidiary by the Fund organized under the laws of the Cayman Islands. The Subsidiary was organized by the Fund to invest in gold bullion and other precious metals, shares of exchange-traded funds that invest in gold bullion (Gold ETFs), commodity-linked derivatives related to gold or other special mineral (including commodity futures, financial futures, options and swap contracts, and certain fixed-income securities and other investments that may serve as margin or collateral for its derivatives positions). The Fund may invest up to 25% of its total assets in the Subsidiary.
The Fund’s investment objective is to seek capital appreciation.
The Fund currently consists of six different classes of shares: Class A, Class C, Class R, Class Y, Class R5 and Class R6. Class Y shares are available only to certain investors. Class A shares are sold with a front-end sales charge unless certain waiver criteria are met and under certain circumstances load waived shares may be subject to contingent deferred sales charges (“CDSC”). Class C shares are sold with a CDSC. Class R, Class Y, Class R5 and Class R6 shares are sold at net asset value. Class C shares held for ten years after purchase are eligible for automatic conversion into Class A shares of the same Fund (the “Conversion Feature”). The automatic conversion pursuant to the Conversion Feature will generally occur at the end of the month following the tenth anniversary after a purchase of Class C shares.
The Fund is an investment company and accordingly follows the investment company accounting and reporting guidance in accordance with Financial Accounting Standards Board Accounting Standards Codification Topic 946, Financial Services – Investment Companies.
The following is a summary of the significant accounting policies followed by the Fund in the preparation of its consolidated financial statements.
A. Security Valuations – Securities, including restricted securities, are valued according to the following policy.
A security listed or traded on an exchange (except convertible securities) is valued at its last sales price or official closing price as of the close of the customary trading session on the exchange where the security is principally traded, or lacking any sales or official closing price on a particular day, the security may be valued at the closing bid price on that day. Securities traded in the over-the-counter market are valued based on prices furnished by independent pricing services or market makers. When such securities are valued by an independent pricing service they may be considered fair valued. Futures contracts are valued
37 INVESCO OPPENHEIMER GOLD & SPECIAL MINERALS FUND
NOTES TO CONSOLIDATED
FINANCIAL STATEMENTS Continued
at the final settlement price set by an exchange on which they are principally traded. Listed options are valued at the mean between the last bid and asked prices from the exchange on which they are principally traded. Options not listed on an exchange are valued by an independent source at the mean between the last bid and asked prices. For purposes of determining net asset value (“NAV”) per share, futures and option contracts generally are valued 15 minutes after the close of the customary trading session of the New York Stock Exchange (“NYSE”).
Investments in open-end and closed-end registered investment companies that do not trade on an exchange are valued at the end-of-day net asset value per share. Investments in open-end and closed-end registered investment companies that trade on an exchange are valued at the last sales price or official closing price as of the close of the customary trading session on the exchange where the security is principally traded.
Debt obligations (including convertible securities) and unlisted equities are fair valued using an evaluated quote provided by an independent pricing service. Evaluated quotes provided by the pricing service may be determined without exclusive reliance on quoted prices, and may reflect appropriate factors such as institution-size trading in similar groups of securities, developments related to specific securities, dividend rate (for unlisted equities), yield (for debt obligations), quality, type of issue, coupon rate (for debt obligations), maturity (for debt obligations), individual trading characteristics and other market data. Pricing services generally value debt obligations assuming orderly transactions of institutional round lot size, but a fund may hold or transact in the same securities in smaller, odd lot sizes. Odd lots often trade at lower prices than institutional round lots. Debt obligations are subject to interest rate and credit risks. In addition, all debt obligations involve some risk of default with respect to interest and/or principal payments.
Foreign securities’ (including foreign exchange contracts) prices are converted into U.S. dollar amounts using the applicable exchange rates as of the close of the NYSE. If market quotations are available and reliable for foreign exchange-traded equity securities, the securities will be valued at the market quotations. Because trading hours for certain foreign securities end before the close of the NYSE, closing market quotations may become unreliable. If between the time trading ends on a particular security and the close of the customary trading session on the NYSE, events occur that the investment adviser determines are significant and make the closing price unreliable, the Fund may fair value the security. If the event is likely to have affected the closing price of the security, the security will be valued at fair value in good faith using procedures approved by the Board of Trustees. Adjustments to closing prices to reflect fair value may also be based on a screening process of an independent pricing service to indicate the degree of certainty, based on historical data, that the closing price in the principal market where a foreign security trades is not the current value as of the close of the NYSE. Foreign securities’ prices meeting the approved degree of certainty that the price is not reflective of current value will be priced at the indication of fair value from the independent pricing service. Multiple factors may be considered by the independent pricing service in determining adjustments to reflect fair value and may include information relating to sector indices, American Depositary Receipts and domestic and foreign index futures. Foreign securities may have
38 INVESCO OPPENHEIMER GOLD & SPECIAL MINERALS FUND
additional risks including exchange rate changes, potential for sharply devalued currencies and high inflation, political and economic upheaval, the relative lack of issuer information, relatively low market liquidity and the potential lack of strict financial and accounting controls and standards.
Securities for which market prices are not provided by any of the above methods may be valued based upon quotes furnished by independent sources. The last bid price may be used to value equity securities. The mean between the last bid and asked prices is used to value debt obligations, including corporate loans.
Securities for which market quotations are not readily available or became unreliable are valued at fair value as determined in good faith by or under the supervision of the Trust’s officers following procedures approved by the Board of Trustees. Issuer specific events, market trends, bid/asked quotes of brokers and information providers and other market data may be reviewed in the course of making a good faith determination of a security’s fair value.
The Fund may invest in securities that are subject to interest rate risk, meaning the risk that the prices will generally fall as interest rates rise and, conversely, the prices will generally rise as interest rates fall. Specific securities differ in their sensitivity to changes in interest rates depending on their individual characteristics. Changes in interest rates may result in increased market volatility, which may affect the value and/or liquidity of certain Fund investments.
Valuations change in response to many factors including the historical and prospective earnings of the issuer, the value of the issuer’s assets, general market conditions which are not specifically related to the particular issuer, such as real or perceived adverse economic conditions, changes in the general outlook for revenues or corporate earnings, changes in interest or currency rates, regional or global instability, natural or environmental disasters, widespread disease or other public health issues, war, acts of terrorism or adverse investor sentiment generally and market liquidity. Because of the inherent uncertainties of valuation, the values reflected in the consolidated financial statements may materially differ from the value received upon actual sale of those investments.
| B. | Securities Transactions and Investment Income - Securities transactions are accounted for on a trade date basis. Realized gains or losses on sales are computed on the basis of specific identification of the securities sold. Interest income (net of withholding tax, if any) is recorded on the accrual basis from settlement date. Dividend income (net of withholding tax, if any) is recorded on the ex-dividend date. |
The Fund may periodically participate in litigation related to Fund investments. As such, the Fund may receive proceeds from litigation settlements. Any proceeds received are included in the Consolidated Statement of Operations as realized gain (loss) for investments no longer held and as unrealized gain (loss) for investments still held.
Brokerage commissions and mark ups are considered transaction costs and are recorded as an increase to the cost basis of securities purchased and/or a reduction of proceeds on a sale of securities. Such transaction costs are included in the determination of net realized and unrealized gain (loss) from investment transactions reported in the Consolidated Statement of Operations and the Consolidated Statement of Changes in Net Assets and
39 INVESCO OPPENHEIMER GOLD & SPECIAL MINERALS FUND
NOTES TO CONSOLIDATED
FINANCIAL STATEMENTS Continued
the net realized and unrealized gains (losses) on securities per share in the Consolidated Financial Highlights. Transaction costs are included in the calculation of the Fund’s net asset value and, accordingly, they reduce the Fund’s total returns. These transaction costs are not considered operating expenses and are not reflected in net investment income reported in the Consolidated Statement of Operations and the Consolidated Statement of Changes in Net Assets, or the net investment income per share and the ratios of expenses and net investment income reported in the Consolidated Financial Highlights, nor are they limited by any expense limitation arrangements between the Fund and the investment adviser.
The Fund allocates income and realized and unrealized capital gains and losses to a class based on the relative net assets of each class.
| C. | Country Determination - For the purposes of making investment selection decisions and presentation in the Consolidated Schedule of Investments, the investment adviser may determine the country in which an issuer is located and/or credit risk exposure based on various factors. These factors include the laws of the country under which the issuer is organized, where the issuer maintains a principal office, the country in which the issuer derives 50% or more of its total revenues and the country that has the primary market for the issuer’s securities, as well as other criteria. Among the other criteria that may be evaluated for making this determination are the country in which the issuer maintains 50% or more of its assets, the type of security, financial guarantees and enhancements, the nature of the collateral and the sponsor organization. |
| D. | Distributions - Dividends and distributions to shareholders, which are determined in accordance with income tax regulations and may differ from accounting principles generally accepted in the United States of America (“GAAP”), are recorded on the ex-dividend date. Income and capital gain distributions, if any, are declared and paid annually or at other times as determined necessary by the Adviser. |
| E. | Federal Income Taxes - The Fund intends to comply with the requirements of Subchapter M of the Internal Revenue Code of 1986, as amended (the “Internal Revenue Code”), necessary to qualify as a regulated investment company and to distribute substantially all of the Fund’s taxable earnings to shareholders. As such, the Fund will not be subject to federal income taxes on otherwise taxable income (including net realized capital gain) that is distributed to shareholders. Therefore, no provision for federal income taxes is recorded in the consolidated financial statements. |
The Fund recognizes the tax benefits of uncertain tax positions only when the position is more likely than not to be sustained. Management has analyzed the Fund’s uncertain tax positions and concluded that no liability for unrecognized tax benefits should be recorded related to uncertain tax positions. Management is not aware of any tax positions for which it is reasonably possible that the total amounts of unrecognized tax benefits will change materially in the next 12 months.
The Subsidiary is classified as a controlled foreign corporation under Subchapter N of the Internal Revenue Code. Therefore, the Fund is required to increase its taxable income by its share of the Subsidiary’s income. Net investment losses of the Subsidiary cannot be deducted by the Fund in the current period nor carried forward to offset taxable income in future periods.
40 INVESCO OPPENHEIMER GOLD & SPECIAL MINERALS FUND
The Fund files tax returns in the U.S. Federal jurisdiction and certain other jurisdictions. Generally, the Fund is subject to examinations by such taxing authorities for up to three years after the filing of the return for the tax period.
| F. | Expenses - Fees provided for under the Rule 12b-1 plan of a particular class of the Fund are charged to the operations of such class. Transfer agency fees and expenses and other shareholder recordkeeping fees and expenses attributable to Class R5 and Class R6 are allocated to each share class based on relative net assets. Sub-accounting fees attributable to Class R5 are charged to the operations of the class. Transfer agency fees and expenses and other shareholder recordkeeping fees and expenses relating to all other classes are allocated among those classes based on relative net assets. All other expenses are allocated among the classes based on relative net assets. |
| G. | Accounting Estimates - The consolidated financial statements are prepared on a basis in conformity with accounting principles generally accepted in the United States of America (“GAAP”), which requires management to make estimates and assumptions that affect the reported amounts of assets and liabilities at the date of the consolidated financial statements and the reported amounts of revenues and expenses during the reporting period including estimates and assumptions related to taxation. Actual results could differ from those estimates by a significant amount. In addition, the Fund monitors for material events or transactions that may occur or become known after the period-end date and before the date the consolidated financial statements are released to print. |
| H. | Indemnifications - Under the Trust’s organizational documents, each Trustee, officer, employee or other agent of the Trust is indemnified against certain liabilities that may arise out of the performance of their duties to the Fund. Additionally, in the normal course of business, the Fund enters into contracts, including the Fund’s servicing agreements, that contain a variety of indemnification clauses. The Fund’s maximum exposure under these arrangements is unknown as this would involve future claims that may be made against the Fund that have not yet occurred. The risk of material loss as a result of such indemnification claims is considered remote. |
| I. | Foreign Currency Translations - Foreign currency is valued at the close of the NYSE based on quotations posted by banks and major currency dealers. Portfolio securities and other assets and liabilities denominated in foreign currencies are translated into U.S. dollar amounts at the date of valuation. Purchases and sales of portfolio securities (net of foreign taxes withheld on disposition) and income items denominated in foreign currencies are translated into U.S. dollar amounts on the respective dates of such transactions. The Fund does not separately account for the portion of the results of operations resulting from changes in foreign exchange rates on investments and the fluctuations arising from changes in market prices of securities held. The combined results of changes in foreign exchange rates and the fluctuation of market prices on investments (net of estimated foreign tax withholding) are included with the net realized and unrealized gain or loss from investments in the Consolidated Statement of Operations. Reported net realized foreign currency gains or losses arise from (1) sales of foreign currencies, (2) currency gains or losses realized between the trade and settlement dates on securities transactions, and (3) the difference between the amounts of dividends, interest, and foreign withholding |
41 INVESCO OPPENHEIMER GOLD & SPECIAL MINERALS FUND
NOTES TO CONSOLIDATED
FINANCIAL STATEMENTS Continued
| | taxes recorded on the Fund’s books and the U.S. dollar equivalent of the amounts actually received or paid. Net unrealized foreign currency gains and losses arise from changes in the fair values of assets and liabilities, other than investments in securities at fiscal period end, resulting from changes in exchange rates. The Fund may invest in foreign securities, which may be subject to foreign taxes on income, gains on investments or currency repatriation, a portion of which may be recoverable. Foreign taxes, if any, are recorded based on the tax regulations and rates that exist in the foreign markets in which the Fund invests and are shown in the Consolidated Statement of Operations. |
| J. | Forward Foreign Currency Contracts - The Fund may engage in foreign currency transactions either on a spot (i.e. for prompt delivery and settlement) basis, or through forward foreign currency contracts, to manage or minimize currency or exchange rate risk. |
The Fund may also enter into forward foreign currency contracts for the purchase or sale of a security denominated in a foreign currency in order to “lock in” the U.S. dollar price of that security, or the Fund may also enter into forward foreign currency contracts that do not provide for physical settlement of the two currencies, but instead are settled by a single cash payment calculated as the difference between the agreed upon exchange rate and the spot rate at settlement based upon an agreed upon notional amount (non-deliverable forwards). The Fund will set aside liquid assets in an amount equal to the daily mark-to-market obligation for forward foreign currency contracts.
A forward foreign currency contract is an obligation between two parties (“Counterparties”) to purchase or sell a specific currency for an agreed-upon price at a future date. The use of forward foreign currency contracts does not eliminate fluctuations in the price of the underlying securities the Fund owns or intends to acquire but establishes a rate of exchange in advance. Fluctuations in the value of these contracts are measured by the difference in the contract date and reporting date exchange rates and are recorded as unrealized appreciation (depreciation) until the contracts are closed. When the contracts are closed, realized gains (losses) are recorded. Realized and unrealized gains (losses) on the contracts are included in the Consolidated Statement of Operations. The primary risks associated with forward foreign currency contracts include failure of the Counterparty to meet the terms of the contract and the value of the foreign currency changing unfavorably. These risks may be in excess of the amounts reflected in the Consolidated Statement of Assets and Liabilities.
| K. | Put Options Purchased and Written - The Fund may purchase and write put options including options on securities indexes, or foreign currency and/or futures contracts. By purchasing a put option, the Fund obtains the right (but not the obligation) to sell the option’s underlying instrument at a fixed strike price. In return for this right, the Fund pays an option premium. The option’s underlying instrument may be a security, securities index, or a futures contract. |
Additionally, the Fund may enter into an option on a swap agreement, also called a “swaption”. A swaption is an option that gives the buyer the right, but not the obligation, to enter into a swap on a future date in exchange for paying a market-based premium. A receiver swaption gives the owner the right to receive the total return of a specified asset, reference rate or index. A payer swaption gives the owner the right to pay the total return
42 INVESCO OPPENHEIMER GOLD & SPECIAL MINERALS FUND
of a specified asset, reference rate, or index. Swaptions also include options that allow an existing swap to be terminated or extended by one of the Counterparties.
Put options may be used by the Fund to hedge securities it owns by locking in a minimum price at which the Fund can sell. If security prices fall, the put option could be exercised to offset all or a portion of the Fund’s resulting losses. At the same time, because the maximum the Fund has at risk is the cost of the option, purchasing put options does not eliminate the potential for the Fund to profit from an increase in the value of the underlying portfolio securities. The Fund may write put options to earn additional income in the form of option premiums if it expects the price of the underlying instrument to remain stable or rise during the option period so that the option will not be exercised. The risk in this strategy is that the price of the underlying securities may decline by an amount greater than the premium received. Put options written are reported as a liability in the Consolidated Statement of Assets and Liabilities. Realized and unrealized gains and losses on put options purchased and put options written are included in the Consolidated Statement of Operations as Net realized gain (loss) from and Change in net unrealized appreciation (depreciation) of Investment securities and Option contracts written, respectively. A risk in buying an option is that the Fund pays a premium whether or not the option is exercised. In addition, there can be no assurance that a liquid secondary market will exist for any option purchased.
| L. | Call Options Purchased and Written - The Fund may write call options and/or buy call options. A covered call option gives the purchaser of such option the right to buy, and the writer the obligation to sell, the underlying security or foreign currency at the stated exercise price during the option period. An uncovered call option exists without the ownership of the underlying security. Options written by the Fund normally will have expiration dates between three and nine months from the date written. The exercise price of a call option may be below, equal to, or above the current market value of the underlying security at the time the option is written. |
When the Fund writes a covered call option, an amount equal to the premium received by the Fund is recorded as an asset and an equivalent liability in the Consolidated Statement of Assets and Liabilities. The amount of the liability is subsequently “marked-to-market” to reflect the current market value of the option written. If a written covered call option expires on the stipulated expiration date, or if the Fund enters into a closing purchase transaction, the Fund realizes a gain (or a loss if the closing purchase transaction exceeds the premium received when the option was written) without regard to any unrealized gain or loss on the underlying security, and the liability related to such option is extinguished. If a written covered call option is exercised, the Fund realizes a gain or a loss from the sale of the underlying security and the proceeds of the sale are increased by the premium originally received. Realized and unrealized gains and losses on call options written are included in the Consolidated Statement of Operations as Net realized gain (loss) from and Change in net unrealized appreciation (depreciation) of Option contracts written. A risk in writing a covered call option is that the Fund gives up the opportunity for profit if the market price of the security increases and the option is exercised. The risk in writing an uncovered call option is that the Fund may incur significant losses if the value of the written
43 INVESCO OPPENHEIMER GOLD & SPECIAL MINERALS FUND
NOTES TO CONSOLIDATED
FINANCIAL STATEMENTS Continued
security exceeds the exercise price of the option.
When the Fund buys a call option, an amount equal to the premium paid by the Fund is recorded as an investment on the Consolidated Statement of Assets and Liabilities. The amount of the investment is subsequently “marked-to-market” to reflect the current value of the option purchased. Realized and unrealized gains and losses on call options purchased are included in the Consolidated Statement of Operations as Net realized gain (loss) from and Change in net unrealized appreciation (depreciation) of Investment securities. A risk in buying an option is that the Fund pays a premium whether or not the option is exercised. In addition, there can be no assurance that a liquid secondary market will exist for any option purchased.
| M. | Leverage Risk - Leverage exists when the Fund can lose more than it originally invests because it purchases or sells an instrument or enters into a transaction without investing an amount equal to the full economic exposure of the instrument or transaction. |
| N. | Other Risks - The Subsidiary will seek to gain exposure to gold bullion and other precious metals, Gold ETFs, commodity-linked derivatives related to gold or other special minerals (including commodity futures, financial futures, options and swap contracts), and certain fixed income securities and other investments that may serve as margin or collateral for its derivatives positions. The Fund is indirectly exposed to the risks associated with the Subsidiary’s investments. The Fund is classified as a “non-diversified” fund under the Investment Company Act of 1940. Accordingly, the Fund may invest a greater portion of its assets in the securities of a single issuer or limited number of issuers than a “diversified” fund. To the extent that the Fund invests a higher percentage of its assets in the securities of a single issuer or limited number of issuers, the Fund is more subject to the risks associated with and developments affecting that issuer or limited number of issuers than a fund that invests more widely. |
Note 2 – Advisory Fees and Other Fees Paid to Affiliates
The Trust has entered into a master investment advisory agreement with Invesco Advisers, Inc. (the “Adviser” or “Invesco”). Under the terms of the investment advisory agreement, the Fund accrues daily and pays monthly an advisory fee to the Adviser based on the annual rate of the Fund’s average daily net assets as follows:
| | |
| Fee Schedule* | | |
| Up to $200 million | | 0.75% |
| Next $200 million | | 0.72 |
| Next $200 million | | 0.69 |
| Next $200 million | | 0.66 |
| Next $2.2 billion | | 0.60 |
| Next $1.0 billion | | 0.59 |
| Next $2.0 billion | | 0.58 |
| Next $4.0 billion | | 0.57 |
| Over $10 billion | | 0.56 |
* The advisory fee paid by the Fund shall be reduced by any amounts paid by the Fund under the administrative services agreement with the Adviser.
44 INVESCO OPPENHEIMER GOLD & SPECIAL MINERALS FUND
For the ten months ended April 30, 2020, the effective advisory fee rate incurred by the Fund was 0.65%.
Under the terms of a master sub-advisory agreement between the Adviser and each of Invesco Asset Management Deutschland GmbH, Invesco Asset Management Limited, Invesco Asset Management (Japan) Limited, Invesco Hong Kong Limited, Invesco Senior Secured Management, Inc. and Invesco Canada Ltd. and separate sub-advisory agreements with Invesco Capital Management LLC, and Invesco Asset Management (India) Private Limited (collectively, the “Affiliated Sub-Advisers”) the Adviser, not the Fund, will pay 40% of the fees paid to the Adviser to any such Affiliated Sub-Adviser(s) that provide(s) discretionary investment management services to the Fund based on the percentage of assets allocated to such Affiliated Sub-Adviser(s). Invesco has also entered into a Sub-Advisory Agreement with OppenheimerFunds, Inc. to provide discretionary management services to the Fund.
Effective on the Reorganization Date, the Adviser has contractually agreed, through May 31, 2021, to waive advisory fees and/or reimburse expenses of all shares to the extent necessary to limit the total annual fund operating expenses after fee waiver and/or expense reimbursement (excluding certain items discussed below) of Class A, Class C, Class R, Class Y, Class R5 and Class R6 shares to 1.17%, 1.92%, 1.42%, 0.92%, 0.80% and 0.75%, respectively, of the Fund’s average daily net assets (the “expense limits”). In determining the Adviser’s obligation to waive advisory fees and/or reimburse expenses, the following expenses are not taken into account, and could cause total annual fund operating expenses after fee waivers and/or expense reimbursement to exceed the numbers reflected above: (1) interest; (2) taxes; (3) dividend expenses on short sales; (4) extraordinary or non-routine items, including litigation expenses; and (5) expenses that the Fund has incurred but did not actually pay because of an expense offset arrangement. Unless Invesco continues the fee waiver agreement, it will terminate on May 31, 2021. During its term, the fee waiver agreement cannot be terminated or amended to increase the expense limits or reduce the advisory fee waiver without approval of the Board of Trustees.
Further, the Adviser has contractually agreed, through at least June 30, 2022, to waive the advisory fee payable by the Fund in an amount equal to 100% of the net advisory fees the Adviser receives from the affiliated money market funds on investments by the Fund of uninvested cash in such affiliated money market funds.
For the ten months ended April 30, 2020, the Adviser waived advisory fees of $19,359 and reimbursed fund expenses of $150,215, $30,585, $40,177, and $97,617 for Class A, Class C, Class R, and Class Y, respectively.
The Trust has entered into a master administrative services agreement with Invesco pursuant to which the Fund has agreed to pay Invesco for certain administrative costs incurred in providing accounting services to the Fund. For the ten months ended April 30, 2020, expenses incurred under the agreement are shown in the Consolidated Statement of Operations as Administration fees. Additionally, Invesco has entered into service agreements whereby JPMorgan Chase Bank serves as custodian to the Fund.
The Trust has entered into a transfer agency and service agreement with Invesco Investment Services, Inc. (“IIS”) pursuant to which the Fund has agreed to pay IIS a fee for providing transfer agency and shareholder services to the Fund and reimburse IIS for certain
45 INVESCO OPPENHEIMER GOLD & SPECIAL MINERALS FUND
NOTES TO CONSOLIDATED
FINANCIAL STATEMENTS Continued
expenses incurred by IIS in the course of providing such services. IIS may make payments to intermediaries that provide omnibus account services, sub-accounting services and/or networking services. All fees payable by IIS to intermediaries that provide omnibus account services or sub-accounting services are charged back to the Fund, subject to certain limitations approved by the Trust’s Board of Trustees. For the ten months ended April 30, 2020, expenses incurred under these agreements are shown in the Consolidated Statement of Operations as Transfer and shareholder servicing agent fees.
The Trust has entered into master distribution agreements with Invesco Distributors, Inc. (“IDI”) to serve as the distributor for the Class A, Class C, Class R, Class Y, Class R5 and Class R6 shares of the Fund. The Trust has adopted plans pursuant to Rule 12b-1 under the 1940 Act with respect to the Fund’s Class A, Class C and Class R shares (collectively the “Plan”). The Fund, pursuant to the Class A Plan, reimburses IDI in an amount up to an annual rate of 0.25% of the average daily net assets of Class A shares. The Fund pursuant to the Class C and Class R Plan, pays IDI compensation at the annual rate of 1.00% of the average daily net assets of Class C shares and 0.50% of the average daily net assets of Class R shares. The fees are accrued daily and paid monthly. Of the Plan payments, up to 0.25% of the average daily net assets of each class of shares may be paid to furnish continuing personal shareholder services to customers who purchase and own shares of such classes. Any amounts not paid as a service fee under the Plan would constitute an asset-based sales charge. Rules of the Financial Industry Regulatory Authority (“FINRA”) impose a cap on the total sales charges, including asset-based sales charges, that may be paid by any class of shares of the Fund plans. For the ten months ended April 30, 2020, expenses incurred under the plans are shown in the Consolidated Statement of Operations as Distribution and service plan fees.
Front-end sales commissions and CDSC (collectively, the “sales charges”) are not recorded as expenses of the Fund. Front-end sales commissions are deducted from proceeds from the sales of Fund shares prior to investment in Class A shares of the Fund. CDSC are deducted from redemption proceeds prior to remittance to the shareholder. During the ten months ended April 30, 2020, IDI advised the Fund that IDI retained $97,613 in front-end sales commissions from the sale of Class A shares and $56,222 and $5,685 from Class A and Class C shares, respectively, for CDSC imposed on redemptions by shareholders.
Certain officers and trustees of the Trust are officers and directors of the Adviser, IIS and/or IDI.
Note 3 – Additional Valuation Information
GAAP defines fair value as the price that would be received to sell an asset or paid to transfer a liability in an orderly transaction between market participants at the measurement date, under current market conditions. GAAP establishes a hierarchy that prioritizes the inputs to valuation methods, giving the highest priority to readily available unadjusted quoted prices in an active market for identical assets (Level 1) and the lowest priority to significant unobservable inputs (Level 3), generally when market prices are not readily available or are unreliable. Based on the valuation inputs, the securities or other investments are tiered into one of three levels. Changes in valuation methods may result in transfers in or out of an
46 INVESCO OPPENHEIMER GOLD & SPECIAL MINERALS FUND
investment’s assigned level:
Level 1 — Prices are determined using quoted prices in an active market for identical assets.
Level 2 — Prices are determined using other significant observable inputs. Observable inputs are inputs that other market participants may use in pricing a security. These may include quoted prices for similar securities, interest rates, prepayment speeds, credit risk, yield curves, loss severities, default rates, discount rates, volatilities and others.
Level 3 — Prices are determined using significant unobservable inputs. In situations where quoted prices or observable inputs are unavailable (for example, when there is little or no market activity for an investment at the end of the period), unobservable inputs may be used. Unobservable inputs reflect the Fund’s own assumptions about the factors market participants would use in determining fair value of the securities or instruments and would be based on the best available information.
The following is a summary of the tiered valuation input levels, as of April 30, 2020. The level assigned to the securities valuations may not be an indication of the risk or liquidity associated with investing in those securities. Because of the inherent uncertainties of valuation, the values reflected in the consolidated financial statements may materially differ from the value received upon actual sale of those investments.
| | | | | | | | | | | | | | | | |
| | | Level 1— Unadjusted Quoted Prices | | | Level 2— Other Significant Observable Inputs | | | Level 3— Significant Unobservable Inputs | | | Value | |
| |
| Assets Table | | | | | | | | | | | | | | | | |
| Investments, at Value: | | | | | | | | | | | | | | | | |
| Common Stocks | | | | | | | | | | | | | | | | |
Materials | | $ | 1,099,867,508 | | | $ | 332,970,609 | | | $ | 1,297,460 | | | $ | 1,434,135,577 | |
| Rights, Warrants and Certificates | | | 1,373,454 | | | | — | | | | 0 | | | | 1,373,454 | |
| Exchange-Traded Options Purchased | | | 526,500 | | | | — | | | | — | | | | 526,500 | |
| Investment Companies | | | 72,530,172 | | | | — | | | | — | | | | 72,530,172 | |
| | | | |
| Total Assets | | $ | 1,174,297,634 | | | $ | 332,970,609 | | | $ | 1,297,460 | | | $ | 1,508,565,703 | |
| | | | |
| | | | |
| Liabilities Table | | | | | | | | | | | | | | | | |
| Other Financial Instruments: | | | | | | | | | | | | | | | | |
| Options written, at value | | $ | (24,795,669 | ) | | $ | — | | | $ | — | | | $ | (24,795,669) | |
| | | | |
| Total Liabilities | | $ | (24,795,669 | ) | | $ | — | | | $ | — | | | $ | (24,795,669) | |
| | | | |
Forward currency exchange contracts and futures contracts, if any, are reported at their unrealized appreciation/depreciation at measurement date, which represents the change in the contract’s value from trade date. All additional assets and liabilities included in the above table are reported at their market value at measurement date.
Note 4 - Derivative Investments
The Fund may enter into an International Swaps and Derivatives Association Master Agreement (“ISDA Master Agreement”) under which a fund may trade OTC derivatives. An OTC transaction entered into under an ISDA Master Agreement typically involves a collateral
47 INVESCO OPPENHEIMER GOLD & SPECIAL MINERALS FUND
NOTES TO CONSOLIDATED
FINANCIAL STATEMENTS Continued
posting arrangement, payment netting provisions and close-out netting provisions. These netting provisions allow for reduction of credit risk through netting of contractual obligations. The enforceability of the netting provisions of the ISDA Master Agreement depends on the governing law of the ISDA Master Agreement, among other factors. For financial reporting purposes, the Fund does not offset OTC derivative assets or liabilities that are subject to ISDA Master Agreements in the Consolidated Statement of Assets and Liabilities.
Value of Derivative Instruments at Period-End
The table below reflects the Fund’s exposure to Counterparties subject to either an ISDA Master Agreement or other agreement for OTC derivative liability transactions as of April 30, 2020:
| | | | | | | | | | | | | | | | |
| | | Asset Derivatives | | | Liability Derivatives | |
| | | Consolidated Statement of Assets and Liabilities Location | | | Value | | Consolidated Statement of Assets and Liabilities Location | | | Value | |
| |
| Equity contracts | | | Investments, at value | | | $ | 526,500 | * | | | Options written, at value | | | $ | 24,795,669 | |
| Derivative Assets/ Liabilities not subject to master netting agreements | | | | | | | (526,500 | ) | | | | | | | (24,795,669) | |
| | | | | | | | | | | | | | | | |
| Total Derivative Assets/Liabilities not subject to master netting agreements | | | | | | $ | — | | | | | | | $ | — | |
| | | | | | | | | | | | | | | | |
*Amounts relate to purchased option contracts and purchased swaption contracts, if any.
Effect of Derivative Investments for the Ten Months Ended April 30, 2020
The tables below summarize the gains (losses) on derivative investments, detailed by primary risk exposure, recognized in earnings during the period:
| | | | | | | | | | | | |
| Amount of Realized Gain or (Loss) Recognized on Derivatives | |
Derivatives Not Accounted for as Hedging Instruments | | Investment transactions in unaffiliated companies* | | Option contracts written | | Total |
| Equity contracts | | $ | 434,459 | | | $ | 7,462,308 | | | $ | 7,896,767 | |
|
| Amount of Change in Unrealized Gain or (Loss) Recognized on Derivatives | |
Derivatives Not Accounted for as Hedging Instruments | | Investment transactions in unaffiliated companies* | | Option contracts written | | Total |
| Equity contracts | | $ | 47,442 | | | $ | (8,244,006 | ) | | $ | (8,196,564 | ) |
*Includes purchased option contracts and purchased swaption contracts, if any.
The table below summarizes the ten month ended average notional value and contracts of
48 INVESCO OPPENHEIMER GOLD & SPECIAL MINERALS FUND
equity options purchased and the two month ended average notional value and contracts of equity options written during the period.
| | | | | | | | |
| | | Equity options purchased | | | Equity options written | |
| Average notional amount | | $ | 11,900,000 | | | $ | 88,403,690 | |
| Average contracts | | | 1,250 | | | | 31,770 | |
Note 5 - Trustee and Officer Fees and Benefits
The Fund has adopted an unfunded retirement plan (the “Plan”) for the Fund’s Independent Trustees. Benefits are based on years of service and fees paid to each Trustee during their period of service. The Plan was frozen with respect to adding new participants effective December 31, 2006 (the “Freeze Date”) and existing Plan Participants as of the Freeze Date will continue to receive accrued benefits under the Plan. Active Independent Trustees as of the Freeze Date have each elected a distribution method with respect to their benefits under the Plan.
During the reporting period, the Fund’s projected benefit obligations, payments to retired Trustees and accumulated liability were as follows:
| | | | |
| Projected Benefit Obligations Increased | | $ | 9,599 | |
| Payments Made to Retired Trustees | | | — | |
| Accumulated Liability as of April 30, 2020 | | | 60,547 | |
Certain trustees have executed Deferred Compensation Agreement(s) pursuant to which they have the option to elect to defer receipt of all or a portion of the annual compensation they are entitled to receive from the Fund. For purposes of determining the amount owed to the Trustee under the plan(s), deferred amounts are treated as though equal dollar amounts had been invested in shares of the Fund or in other Invesco and/or Invesco Oppenheimer funds selected by the Trustee. The Fund purchases shares of the funds selected for deferral by the Trustee in amounts equal to his or her deemed investment, resulting in a Fund asset equal to the deferred compensation liability. Such assets are included as a component of “Other” within the asset section of the Consolidated Statement of Assets and Liabilities. Deferral of Trustees’ fees under the plan(s) will not affect the net assets of the Fund and will not materially affect the Fund’s assets, liabilities or net investment income per share. Amounts will be deferred until distributed in accordance with the Deferred Compensation Agreement(s).
Note 6 – Cash Balances
The Fund is permitted to temporarily carry a negative or overdrawn balance in its account with JPMorgan Chase Bank, the custodian bank. Such balances, if any at period-end, are shown in the Consolidated Statement of Assets and Liabilities under the payable caption Amount due custodian. To compensate the custodian bank for such overdrafts, the overdrawn Fund
49 INVESCO OPPENHEIMER GOLD & SPECIAL MINERALS FUND
NOTES TO CONSOLIDATED
FINANCIAL STATEMENTS Continued
may either (1) leave funds as a compensating balance in the account so the custodian bank can be compensated by earning the additional interest; or (2) compensate by paying the custodian bank at a rate agreed upon by the custodian bank and Invesco, not to exceed the contractually agreed upon rate. Effective May 5, 2020, the custodian changed to State Street Bank and Trust.
Note 7 – Distributions to Shareholders and Tax Components of Net Assets
Tax Character of Distributions to Shareholders for the Ten Months Ended April 30, 2020 and the Fiscal Years Ended June 30, 2019 and June 30, 2018:
| | | | | | | | | | | | |
| | | April 30, 2020 | | | June 30, 2019 | | | June 30, 2018 | |
| Ordinary income | | $ | 4,462,855 | | | $ | — | | | $ | 28,855,210 | |
| Total distributions | | $ | 4,462,855 | | | $ | — | | | $ | 28,855,210 | |
| | | | |
Tax Components of Net Assets at Period-End:
| | | | |
| | | 2020 | |
| Undistributed ordinary income | | $ | 4,914,872 | |
| Net unrealized appreciation (depreciation) - investments | | | 418,041,951 | |
| Net unrealized appreciation (depreciation) - foreign currencies | | | (70,127) | |
| Temporary book/tax differences | | | (138,023) | |
| Capital loss carryforward | | | (1,439,937,879) | |
| Shares of beneficial interest | | | 2,494,626,495 | |
| Total net assets | | $ | 1,477,437,289 | |
| | | | |
The difference between book-basis and tax-basis unrealized appreciation (depreciation) is due to differences in the timing of recognition of gains and losses on investments for tax and book purposes. The Fund’s net unrealized appreciation (depreciation) difference is attributable primarily to mark to market and wash sales.
The temporary book/tax differences are a result of timing differences between book and tax recognition of income and/or expenses. The Fund’s temporary book/tax differences are the result of the trustee deferral of compensation and retirement plan benefits.
Capital loss carryforward is calculated and reported as of a specific date. Results of transactions and other activity after that date may affect the amount of capital loss carryforward actually available for the Fund to utilize. The ability to utilize capital loss carryforwards in the future may be limited under the Internal Revenue Code and related regulations based on the results of future transactions.
The Fund has a capital loss carryforward as of April 30, 2020, which expires as follows:
| | | | | | | | | | | | |
| Capital Loss Carryforward* | |
| Expiration | | Short-Term | | | Long-Term | | | Total | |
| Not subject to expiration | | $ | 407,967,232 | | | $ | 1,031,970,647 | | | $ | 1,439,937,879 | |
* Capital loss carryforward as of the date listed above is reduced for limitations, if any, to the extent required by the
Internal Revenue Code and may be further limited depending upon a variety of factors, including the realization of net
unrealized gains or losses as of the date of any reorganization.
50 INVESCO OPPENHEIMER GOLD & SPECIAL MINERALS FUND
Note 8 – Investment Transactions
The aggregate amount of investment securities (other than short-term securities, U.S. Treasury obligations and money market funds, if any) purchased and sold by the Fund during the ten months ended April 30, 2020 was $685,984,758 and $556,005,503, respectively. Cost of investments, including any derivatives, on a tax basis includes the adjustments for financial reporting purposes as of the most recently completed federal income tax reporting period-end.
| | | | |
| Unrealized Appreciation (Depreciation) of Investments on a Tax Basis | |
| Aggregate unrealized appreciation of investments | | $ | 555,739,465 | |
| Aggregate unrealized (depreciation) of investments | | | (137,767,641) | |
| | | | |
| Net unrealized appreciation of investments | | $ | 417,971,824 | |
| | | | |
Cost of investments for tax purposes is $1,065,842,463.
Note 9 – Reclassification of Permanent Differences
Primarily as a result of differing book/tax treatment of prior year post financial statement adjustments and PFIC reclass, on April 30, 2020, undistributed net investment loss was decreased by $13,681,955, undistributed net realized loss was increased by $10,873,431 and shares of beneficial interest was decreased by $2,808,524. This reclassification had no effect on the net assets of the Fund.
Note 10 – Share Information
Transactions in shares of beneficial interest were as follows:
| | | | | | | | | | | | | | | | | | | | | | | | |
| | | Ten Months Ended April 30, 20201 | | | Year Ended June 30, 20192 | | | Year Ended June 30, 2018 | |
| | | Shares | | | Amount | | | Shares | | | Amount | | | Shares | | | Amount | |
| Class A | | | | | | | | | | | | | | | | | | | | | | | | |
| Sold | | | 15,708,612 | | | $ | 312,533,945 | | | | 9,458,270 | | | $ | 144,671,146 | | | | 8,124,876 | | | $ | 131,219,591 | |
| Automatic Conversion Class C to Class A Shares | | | 381,626 | | | | 7,368,235 | | | | — | | | | — | | | | — | | | | — | |
| Dividends and/or distributions reinvested | | | 90,340 | | | | 1,725,507 | | | | — | | | | — | | | | 923,828 | | | | 14,171,529 | |
| Redeemed | | | (13,612,490 | ) | | | (255,012,868 | ) | | | (11,237,201 | ) | | | (165,828,966 | ) | | | (12,501,998 | ) | | | (201,511,675 | ) |
| Net increase (decrease) | | | 2,568,088 | | | $ | 66,614,819 | | | | (1,778,931 | ) | | $ | (21,157,820 | ) | | | (3,453,294 | ) | | $ | (56,120,555 | ) |
| | | | |
51 INVESCO OPPENHEIMER GOLD & SPECIAL MINERALS FUND
NOTES TO CONSOLIDATED
FINANCIAL STATEMENTS Continued
| | | | | | | | | | | | | | | | | | | | | | | | |
| | | Ten Months Ended April 30, 20201 | | | Year Ended June 30, 20192 | | | Year Ended June 30, 2018 | |
| | | Shares | | | Amount | | | Shares | | | Amount | | | Shares | | | Amount | |
| Class B | | | | | | | | | | | | | | | | | | | | | | | | |
| Sold | | | — | | | $ | — | | | | — | | | $ | — | | | | 1,933 | | | $ | 30,143 | |
| Dividends and/or distributions reinvested | | | — | | | | — | | | | — | | | | — | | | | 806 | | | | 11,726 | |
| Redeemed3 | | | — | | | | — | | | | — | | | | — | | | | (190,342 | ) | | | (2,882,924 | ) |
| Net increase (decrease) | | | — | | | $ | — | | | | — | | | $ | — | | | | (187,603 | ) | | $ | (2,841,055 | ) |
| | | | |
| | | | | | | | | | | | | | | | | | | | | | | | |
| Class C | | | | | | | | | | | | | | | | | | | | | | | | |
| Sold | | | 1,464,868 | | | $ | 25,779,057 | | | | 1,216,119 | | | $ | 16,312,847 | | | | 1,588,420 | | | $ | 23,408,868 | |
| Dividends and/or distributions reinvested | | | — | | | | — | | | | — | | | | — | | | | 202,287 | | | | 2,846,178 | |
| Automatic Conversion Class C to Class A Shares | | | (421,681 | ) | | | (7,368,235 | ) | | | — | | | | — | | | | — | | | | — | |
| Redeemed | | | (1,473,769 | ) | | | (25,490,417 | ) | | | (4,294,484 | ) | | | (62,223,717 | ) | | | (2,486,030 | ) | | | (36,516,614 | ) |
| Net increase (decrease) | | | (430,582 | ) | | $ | (7,079,595 | ) | | | (3,078,365 | ) | | $ | (45,910,870 | ) | | | (695,323 | ) | | $ | (10,261,568 | ) |
| | | | |
| | | | | | | | | | | | | | | | | | | | | | | | |
| Class R | | | | | | | | | | | | | | | | | | | | | | | | |
| Sold | | | 2,838,180 | | | $ | 51,894,302 | | | | 2,255,361 | | | $ | 31,565,148 | | | | 2,961,901 | | | $ | 45,632,841 | |
| Dividends and/or distributions reinvested | | | 7,108 | | | | 129,162 | | | | — | | | | — | | | | 222,740 | | | | 3,260,909 | |
| Redeemed | | | (3,478,097 | ) | | | (62,974,405 | ) | | | (3,323,388 | ) | | | (46,764,341 | ) | | | (4,243,717 | ) | | | (65,216,477 | ) |
| Net increase (decrease) | | | (632,809 | ) | | $ | (10,950,941 | ) | | | (1,068,027 | ) | | $ | (15,199,193 | ) | | | (1,059,076 | ) | | $ | (16,322,727 | ) |
| | | | |
| | | | | | | | | | | | | | | | | | | | | | | | |
| Class Y | | | | | | | | | | | | | | | | | | | | | | | | |
| Sold | | | 12,434,776 | | | $ | 241,097,968 | | | | 10,082,276 | | | $ | 149,305,227 | | | | 5,766,922 | | | $ | 92,733,982 | |
| Dividends and/or distributions reinvested | | | 70,911 | | | | 1,354,399 | | | | — | | | | — | | | | 260,683 | | | | 3,985,837 | |
| Redeemed | | | (9,312,284 | ) | | | (169,709,103 | ) | | | (6,756,704 | ) | | | (98,540,574 | ) | | | (5,878,169 | ) | | | (94,699,957 | ) |
| Net increase (decrease) | | | 3,193,403 | | | $ | 72,743,264 | | | | 3,325,572 | | | $ | 50,764,653 | | | | 149,436 | | | $ | 2,019,862 | |
| | | | |
52 INVESCO OPPENHEIMER GOLD & SPECIAL MINERALS FUND
| | | | | | | | | | | | | | | | | | | | | | | | |
| | | Ten Months Ended April 30, 20201 | | | Year Ended June 30, 20192 | | | Year Ended June 30, 2018 | |
| | | Shares | | | Amount | | | Shares | | | Amount | | | Shares | | | Amount | |
| Class R54 | | | | | | | | | | | | | | | | | | | | | | | | |
| Sold | | | 710 | | | $ | 9,834 | | | | 678 | | | $ | 10,000 | | | | — | | | $ | — | |
| Dividends and/or distributions reinvested | | | — | | | | — | | | | — | | | | — | | | | — | | | | — | |
| Redeemed | | | — | | | | — | | | | — | | | | — | | | | — | | | | — | |
| Net increase (decrease) | | | 710 | | | $ | 9,834 | | | | 678 | | | $ | 10,000 | | | | — | | | $ | — | |
| | | | |
| | | | | | | | | | | | | | | | | | | | | | | | |
| Class R6 | | | | | | | | | | | | | | | | | | | | | | | | |
| Sold | | | 5,660,874 | | | $ | 109,305,126 | | | | 5,773,319 | | | $ | 85,525,000 | | | | 3,847,471 | | | $ | 61,147,391 | |
| Dividends and/or distributions reinvested | | | 49,807 | | | | 958,784 | | | | — | | | | — | | | | 166,122 | | | | 2,554,953 | |
| Redeemed | | | (4,131,957 | ) | | | (79,054,005 | ) | | | (5,082,586 | ) | | | (75,041,130 | ) | | | (1,992,793 | ) | | | (32,046,766 | ) |
| Net increase (decrease) | | | 1,578,724 | | | $ | 31,209,905 | | | | 690,733 | | | $ | 10,483,870 | | | | 2,020,800 | | | $ | 31,655,578 | |
| | | | |
1. There are entities that are record owners of more than 5% of the outstanding shares of the Fund and own 19% of the outstanding shares of the Fund. IDI has an agreement with these entities to sell Fund shares. The Fund, Invesco and/or Invesco affiliates may make payments to these entities, which are considered to be related to the Fund, for providing services to the Fund, Invesco and/or Invesco affiliates, including but not limited to services such as securities brokerage, distribution, third party record keeping and account servicing. The Fund has no knowledge as to whether all or any portion of the shares owned of record by these entities are also owned beneficially.
2. There are entities that are record owners of more than 5% of the outstanding shares of the Fund and own 17% of the outstanding shares of the Fund. IDI has an agreement with these entities to sell Fund shares. The Fund, Invesco and/or Invesco affiliates may make payments to these entities, which are considered to be related to the Fund, for providing services to the Fund, Invesco and/or Invesco affiliates, including but not limited to services such as securities brokerage, distribution, third party record keeping and account servicing. The Fund has no knowledge as to whether all or any portion of the shares owned of record by these entities are also owned beneficially.
3. All outstanding Class B shares converted to Class A shares on June 1, 2018.
4. Commencement date after the close of business on May 24, 2019.
Note 11 – Coronavirus (COVID-19) Pandemic
During the first quarter of 2020, the World Health Organization declared the COVID-19 to be a public health emergency. COVID-19 has led to increased short-term market volatility and may have adverse long-term effects on U.S. and world economies and markets in general. COVID-19 may adversely impact the Funds’ ability to achieve their investment objectives. Because of the uncertainties on valuation, the global economy and business operations, values reflected in these consolidated financial statements may materially differ from the value received upon actual sales of those investments.
The extent of the impact on the performance of the Fund and its investments will depend on future developments, including the duration and spread of the COVID-19 outbreak, related restrictions and advisories, and the effects on the financial markets and economy overall, all of which are highly uncertain and cannot be predicted.
53 INVESCO OPPENHEIMER GOLD & SPECIAL MINERALS FUND
NOTES TO CONSOLIDATED
FINANCIAL STATEMENTS Continued
Note 12 – Significant Event
The Board of Trustees unanimously approved an Agreement and Plan of Reorganization (the “Agreement”) pursuant to which Invesco Oppenheimer Gold & Special Minerals Fund (the “Fund”) would acquire all of the assets and liabilities of Invesco Gold & Precious Metals Fund (the “Target Fund”) in exchange for shares of the Fund.
The Agreement requires approval of the Target Fund’s shareholders and was submitted to the shareholders for their consideration at a meeting held on April 24, 2020. The reorganization was consummated on May 15, 2020. Upon closing of the reorganization, shareholders of the Target Fund will received a corresponding class of shares of the Fund in exchange for their shares of the Target Fund and the Target Fund liquidated and ceased operations.
Note 13 – Subsequent Event
Effective on or about September 30, 2020, the name of the Fund and all references thereto will change from Invesco Oppenheimer Gold & Special Minerals Fund to Invesco Gold & Special Minerals Fund.
54 INVESCO OPPENHEIMER GOLD & SPECIAL MINERALS FUND
REPORT OF INDEPENDENT REGISTERED PUBLIC ACCOUNTING FIRM
To the Board of Trustees of AIM Sector Funds (Invesco Sector Funds) and Shareholders of Invesco Oppenheimer Gold & Special Minerals Fund
Opinion on the Consolidated Financial Statements
We have audited the accompanying consolidated statement of assets and liabilities, including the consolidated schedule of investments, of Invesco Oppenheimer Gold & Special Minerals Fund and its subsidiary (one of the funds constituting AIM Sector Funds (Invesco Sector Funds), referred to hereafter as the “Fund”) as of April 30, 2020, the related consolidated statements of operations and of changes in net assets, including the related notes, and the consolidated financial highlights for each of the periods indicated in the table below (collectively referred to as the “consolidated financial statements”). In our opinion, the consolidated financial statements present fairly, in all material respects, the financial position of the Fund as of April 30, 2020, the results of its operations, the changes in its net assets and the financial highlights for each of the periods indicated in the table below, in conformity with accounting principles generally accepted in the United States of America.
| | |
Consolidated Statement of Operations and Consolidated Statement of Changes in Net Assets | | Consolidated Financial Highlights |
| | |
For the period from July 1, 2019 through April 30, 2020 and the year ended June 30, 2019 | | For the period from July 1, 2019 through April 30, 2020 and the year ended June 30, 2019 for Class A, Class C, Class R, Class Y and Class R6 |
| | |
| | | For the period from July 1, 2019 through April 30, 2020 and the period from May 24, 2019 (inception of offering) through June 30, 2019 for Class R5 |
The consolidated financial statements of Invesco Oppenheimer Gold & Special Minerals Fund as of and for the year ended June 30, 2018 and the consolidated financial highlights for each of the periods ended on or prior to June 30, 2018 (not presented herein, other than the consolidated statement of changes in net assets and the consolidated financial highlights) were audited by other auditors whose report dated August 24, 2018 expressed an unqualified opinion on those consolidated financial statements and consolidated financial highlights.
Basis for Opinion
These consolidated financial statements are the responsibility of the Fund’s management. Our responsibility is to express an opinion on the Fund’s consolidated financial statements based on our audits. We are a public accounting firm registered with the Public Company Accounting Oversight Board (United States) (PCAOB) and are required to be independent with respect to the Fund in accordance with the U.S. federal securities laws and the applicable rules and regulations of the Securities and Exchange Commission and the PCAOB.
We conducted our audits of these consolidated financial statements in accordance with the standards of the PCAOB. Those standards require that we plan and perform the audit to obtain reasonable assurance about whether the consolidated financial statements are free of material misstatement, whether due to error or fraud.
Our audits included performing procedures to assess the risks of material misstatement of the consolidated financial statements, whether due to error or fraud, and performing procedures that respond to those risks. Such procedures included examining, on a test basis, evidence regarding the amounts and disclosures in the
55 INVESCO OPPENHEIMER GOLD & SPECIAL MINERALS FUND
REPORT OF INDEPENDENT REGISTERED PUBLIC ACCOUNTING FIRM
consolidated financial statements. Our audits also included evaluating the accounting principles used and significant estimates made by management, as well as evaluating the overall presentation of the consolidated financial statements. Our procedures included confirmation of securities owned as of April 30, 2020 by correspondence with the custodian, transfer agent and brokers; when replies were not received from brokers, we performed other auditing procedures. We believe that our audits provide a reasonable basis for our opinion.
/s/ PricewaterhouseCoopers LLP
Houston, Texas
June 26, 2020
We have served as the auditor of one or more investment companies in the Invesco group of investment companies since at least 1995. We have not been able to determine the specific year we began serving as auditor.
56 INVESCO OPPENHEIMER GOLD & SPECIAL MINERALS FUND
TAX INFORMATION
Form 1099-DIV, Form 1042-S and other year–end tax information provide shareholders with actual calendar year amounts that should be included in their tax returns. Shareholders should consult their tax advisers.
The following distribution information is being provided as required by the Internal Revenue Code or to meet a specific state’s requirement.
The Fund designates the following amounts or, if subsequently determined to be different, the maximum amount allowable for its ten months ended April 30, 2020:
| | | | |
| Federal and State Income Tax |
| Qualified Dividend Income* | | 100.00% | | |
| Corporate Dividends Received Deduction* | | 47.09% | | |
| Qualified Business Income | | 0.00% | | |
| U.S. Treasury Obligations* | | 0.00% | | |
| Tax-Exempt Interest Dividends* | | 0.00% | | |
* The above percentages are based on ordinary income dividends paid to shareholders during the Fund’s fiscal year.
57 INVESCO OPPENHEIMER GOLD & SPECIAL MINERALS FUND
PORTFOLIO PROXY VOTING POLICIES AND GUIDELINES;
UPDATES TO SCHEDULE OF INVESTMENTS
Go paperless with eDelivery
Visit invesco.com/edelivery to enjoy the convenience and security of anytime electronic access to your investment documents.
With eDelivery, you can elect to have any or all of the following materials delivered straight to your inbox to download, save and print from your own computer:
| · | | Fund reports and prospectuses |
Invesco mailing information
Send general correspondence to Invesco Investment Services, Inc., P.O. Box 219078, Kansas City, MO 64121-9078.
Important notice regarding delivery of security holder documents
To reduce Fund expenses, only one copy of most shareholder documents may be mailed to shareholders with multiple accounts at the same address (Householding). Mailing of your shareholder documents may be householded indefinitely unless you instruct us otherwise. If you do not want the mailing of these documents to be combined with those for other members of your household, please contact Invesco Investment Services, Inc. at 800 959 4246 or contact your financial institution. We will begin sending you individual copies for each account within 30 days after receiving your request.
Fund holdings and proxy voting information
The Fund provides a complete list of its holdings four times in each fiscal year, at the quarter ends. For the second and fourth quarters, the lists appear in the Fund’s semiannual and annual reports to shareholders. For the first and third quarters, the Fund files the lists with the Securities and Exchange Commission (SEC) as an exhibit to its reports on Form N-PORT. The most recent list of portfolio holdings is available at invesco.com/completeqtrholdings. Shareholders can also look up the Fund’s Forms N-PORT on the SEC website at sec.gov.
A description of the policies and procedures that the Fund uses to determine how to vote proxies relating to portfolio securities is available without charge, upon request, from our Client Services department at 800 959 4246 or at invesco.com/proxyguidelines. The information is also available on the SEC website, sec.gov.
Information regarding how the Fund voted proxies related to its portfolio securities during the most recent 12-month period ended June 30 is available at invesco.com/proxysearch. The information is also available on the SEC website, sec.gov.
Invesco Advisers, Inc. is an investment adviser; it provides investment advisory services to individual and institutional clients and does not sell securities. Invesco Distributors, Inc. is the US distributor for Invesco Ltd.’s retail mutual funds, exchange-traded funds and institutional money market funds. Both are wholly owned, indirect subsidiaries of Invesco Ltd.
58 INVESCO OPPENHEIMER GOLD & SPECIAL MINERALS FUND
TRUSTEES AND OFFICERS
The address of each trustee and officer is AIM Sector Funds (Invesco Sector Funds) (the “Trust”), 11 Greenway Plaza, Suite 1000, Houston, Texas 77046-1173. The trustees serve for the life of the Trust, subject to their earlier death, incapacitation, resignation, retirement or removal as more specifically provided in the Trust’s organizational documents. Each officer serves for a one year term or until their successors are elected and qualified. Column two below includes length of time served with predecessor entities, if any.
| | | | | | | | |
| | | | | |
Name, Year of Birth and Position(s) Held with the Trust | | Trustee and/or Officer Since | | Principal Occupation(s) During Past 5 Years | | Number of Funds in Fund Complex Overseen by Trustee | | Other Directorship(s) Held by Trustee During Past 5 Years |
| | | | | |
| INTERESTED TRUSTEE | | | | | | | | |
| | | | | |
Martin L. Flanagan 1 — 1960
Trustee and Vice Chair | | 2007 | | Executive Director, Chief Executive Officer and President, Invesco Ltd.
(ultimate parent of Invesco and a global investment management firm);
Trustee and Vice Chair, The Invesco Funds; Vice Chair, Investment
Company Institute; and Member of Executive Board, SMU Cox School of
Business | | 203 | | None |
| | | | | |
| | | | | Formerly: Advisor to the Board, Invesco Advisers, Inc. (formerly known as
Invesco Institutional (N.A.), Inc.); Chairman and Chief Executive Officer,
Invesco Advisers, Inc. (registered investment adviser); Director, Chairman,
Chief Executive Officer and President, Invesco Holding Company (US), Inc.
(formerly IVZ Inc.) (holding company), Invesco Group Services, Inc. (service
provider) and Invesco North American Holdings, Inc. (holding company);
Director, Chief Executive Officer and President, Invesco Holding Company
Limited (parent of Invesco and a global investment management firm);
Director, Invesco Ltd.; Chairman, Investment Company Institute and
President, Co-Chief Executive Officer, Co-President, Chief Operating Officer
and Chief Financial Officer, Franklin Resources, Inc. (global investment
management organization) | | | | |
| |
1 Mr. Flanagan is considered an interested person (within the meaning of Section 2(a)(19) of the 1940 Act) of the Trust because he is an officer of the Adviser to
the Trust, and an officer and a director of Invesco Ltd., ultimate parent of the Adviser. |
59 INVESCO OPPENHEIMER GOLD & SPECIAL MINERALS FUND
TRUSTEES AND OFFICERS Continued
| | | | | | | | |
| | | | | |
Name, Year of Birth and Position(s) Held with the Trust | | Trustee and/or Officer Since | | Principal Occupation(s) During Past 5 Years | | Number of Funds in Fund Complex Overseen by Trustee | | Other Directorship(s) Held by Trustee During Past 5 Years |
| | | | | |
| INDEPENDENT TRUSTEES | | | | | | | | |
| | | | | |
Bruce L. Crockett – 1944
Trustee and Chair | | 2003 | | Chairman, Crockett Technologies Associates (technology consulting
company) Formerly: Director, Captaris (unified messaging provider); Director, President
and Chief Executive Officer, COMSAT Corporation; Chairman, Board of
Governors of INTELSAT (international communications company); ACE
Limited (insurance company); Independent Directors Council and Investment
Company Institute: Member of the Audit Committee, Investment Company
Institute; Member of the Executive Committee and Chair of the Governance
Committee, Independent Directors Council | | 203 | | Director and
Chairman of the
Audit Committee,
ALPS (Attorneys
Liability Protection
Society) (insurance
company); Director
and Member of the
Audit Committee
and Compensation
Committee,
Ferroglobe PLC
(metallurgical
company) |
| | | | | |
David C. Arch – 1945
Trustee | | 2010 | | Chairman of Blistex Inc. (consumer health care products manufacturer);
Member, World Presidents’ Organization | | 203 | | Board member of
the Illinois
Manufacturers’
Association |
| | | | | |
Beth Ann Brown – 1968
Trustee | | 2019 | | Independent Consultant Formerly: Head of Intermediary Distribution, Managing Director, Strategic
Relations, Managing Director, Head of National Accounts, Senior Vice
President, National Account Manager and Senior Vice President, Key
Account Manager, Columbia Management Investment Advisers LLC; Vice
President, Key Account Manager, Liberty Funds Distributor, Inc.; and Trustee
of certain Oppenheimer Funds | | 203 | | Director, Board of
Directors of Caron
Engineering Inc.;
Advisor, Board of
Advisors of Caron
Engineering Inc.;
President and
Director, of Acton
Shapleigh Youth
Conservation Corps
(non -profit); and
President and
Director of
Grahamtastic
Connection (non-
profit) |
| | | | | |
Jack M. Fields – 1952
Trustee | | 2003 | | Chief Executive Officer, Twenty First Century Group, Inc. (government affairs
company); and Chairman, Discovery Learning Alliance (non-profit) Formerly: Owner and Chief Executive Officer, Dos Angeles Ranch L.P.
(cattle, hunting, corporate entertainment); Director, Insperity, Inc. (formerly
known as Administaff) (human resources provider); Chief Executive Officer,
Texana Timber LP (sustainable forestry company); Director of Cross Timbers
Quail Research Ranch (non-profit); and member of the U.S. House of
Representatives | | 203 | | Member, Board of
Directors of Baylor
College of Medicine |
60 INVESCO OPPENHEIMER GOLD & SPECIAL MINERALS FUND
| | | | | | | | |
| | | | | |
Name, Year of Birth and Position(s) Held with the Trust | | Trustee and/or Officer Since | | Principal Occupation(s) During Past 5 Years | | Number of Funds in Fund Complex Overseen by Trustee | | Other Directorship(s)
Held by Trustee During Past 5 Years |
| | | | | |
INDEPENDENT TRUSTEES
(CONTINUED) | | | | | | | | |
| | | | | |
Cynthia Hostetler —1962
Trustee | | 2017 | | Non-Executive Director and Trustee of a number of public and private
business corporations Formerly: Director, Aberdeen Investment Funds (4 portfolios); Head of
Investment Funds and Private Equity, Overseas Private Investment
Corporation; President, First Manhattan Bancorporation, Inc.; Attorney,
Simpson Thacher & Bartlett LLP | | 203 | | Vulcan Materials
Company
(construction
materials company);
Trilinc Global
Impact Fund;
Genesee &
Wyoming, Inc.
(railroads); Artio
Global Investment
LLC (mutual fund
complex); Edgen
Group, Inc.
(specialized energy
and infrastructure
products
distributor);
Investment
Company Institute
(professional
organization);
Independent
Directors Council
(professional
organization) |
| | | | | |
Eli Jones – 1961
Trustee | | 2016 | | Professor and Dean, Mays Business School - Texas A&M University Formerly: Professor and Dean, Walton College of Business, University of
Arkansas and E.J. Ourso College of Business, Louisiana State University;
Director, Arvest Bank | | 203 | | Insperity, Inc.
(formerly known as
Administaff) (human
resources provider) |
| | | | | |
Elizabeth Krentzman – 1959
Trustee | | 2019 | | Formerly: Principal and Chief Regulatory Advisor for Asset Management
Services and U.S. Mutual Fund Leader of Deloitte & Touche LLP; General
Counsel of the Investment Company Institute (trade association); National
Director of the Investment Management Regulatory Consulting Practice,
Principal, Director and Senior Manager of Deloitte & Touche LLP; Assistant
Director of the Division of Investment Management - Office of Disclosure and
Investment Adviser Regulation of the U.S. Securities and Exchange
Commission and various positions with the Division of Investment
Management – Office of Regulatory Policy of the U.S. Securities and
Exchange Commission; Associate at Ropes & Gray LLP.; and Trustee of
certain Oppenheimer Funds | | 203 | | Trustee of the
University of Florida
National Board
Foundation;
Member of the
Cartica Funds
Board of Directors
(private investment
funds); Member of
the University of
Florida Law Center
Association, Inc.
Board of Trustees
and Audit
Committee Member |
61 INVESCO OPPENHEIMER GOLD & SPECIAL MINERALS FUND
TRUSTEES AND OFFICERS Continued
| | | | | | | | |
| | | | | |
Name, Year of Birth and Position(s) Held with the Trust | | Trustee and/or Officer Since | | Principal Occupation(s) During Past 5 Years | | Number of Funds in Fund Complex Overseen by Trustee | | Other Directorship(s)
Held by Trustee During Past 5 Years |
| | | | | |
INDEPENDENT TRUSTEES
(CONTINUED) | | | | | | | | |
| | | | | |
Anthony J. LaCava, Jr. – 1956
Trustee | | 2019 | | Formerly: Director and Member of the Audit Committee, Blue Hills Bank (publicly traded financial institution) and Managing Partner, KPMG LLP | | 203 | | Blue Hills Bank; Chairman of Bentley University; Member, Business School Advisory Council; and Nominating Committee, KPMG LLP |
| | | | | |
Prema Mathai-Davis – 1950
Trustee | | 2003 | | Retired Formerly; Co-Founder & Partner of Quantalytics Research, LLC, (a FinTech Investment Research Platform for the Self- Directed Investor) | | 203 | | None |
| | | | | |
Joel W. Motley – 1952
Trustee | | 2019 | | Director of Office of Finance, Federal Home Loan Bank System; Member of the Vestry of Trinity Wall Street; Managing Director of Carmona Motley Hoffman, Inc. (privately held financial advisor); Member of the Council on Foreign Relations and its Finance and Budget Committee; Chairman Emeritus of Board of Human Rights Watch and Member of its Investment Committee; and Member of Investment Committee and Board of Historic Hudson Valley (non-profit cultural organization). Formerly: Managing Director of Public Capital Advisors, LLC (privately held financial advisor); Managing Director of Carmona Motley Hoffman, Inc. (privately held financial advisor); Trustee of certain Oppenheimer Funds; and Director of Columbia Equity Financial Corp. (privately held financial advisor) | | 203 | | Member of Board of Greenwall Foundation (bioethics research foundation) and its Investment Committee; Member of Board of Friends of the LRC (non-profit legal advocacy); Board Member and Investment Committee Member of Pulitzer Center for Crisis Reporting (non-profit journalism) |
| | | | | |
Teresa M. Ressel — 1962
Trustee | | 2017 | | Non-executive director and trustee of a number of public and private business corporations Formerly: Chief Financial Officer, Olayan America, The Olayan Group (international investor/commercial/industrial); Chief Executive Officer, UBS Securities LLC; Group Chief Operating Officer, Americas, UBS AG; Assistant Secretary for Management & Budget and CFO, US Department of the Treasury | | 203 | | Atlantic Power Corporation (power generation company); ON Semiconductor Corp. (semiconductor supplier) |
62 INVESCO OPPENHEIMER GOLD & SPECIAL MINERALS FUND
| | | | | | | | |
| | | | | |
Name, Year of Birth and Position(s) Held with the Trust | | Trustee and/or Officer Since | | Principal Occupation(s) During Past 5 Years | | Number of Funds in Fund Complex Overseen by Trustee | | Other Directorship(s)
Held by Trustee During Past 5 Years |
| | | | | |
INDEPENDENT TRUSTEES
(CONTINUED) | | | | | | | | |
| | | | | |
Ann Barnett Stern – 1957
Trustee | | 2017 | | President and Chief Executive Officer, Houston Endowment Inc. (private philanthropic institution) Formerly: Executive Vice President and General Counsel, Texas Children’s Hospital; Attorney, Beck, Redden and Secrest, LLP; Business Law Instructor, University of St. Thomas; Attorney, Andrews & Kurth LLP | | 203 | | Federal Reserve Bank of Dallas |
| | | | | |
Robert C. Troccoli – 1949
Trustee | | 2016 | | Retired Formerly: Adjunct Professor, University of Denver – Daniels College of Business, Senior Partner, KPMG LLP | | 203 | | None |
| | | | | |
| Daniel S. Vandivort –1954 Trustee | | 2019 | | Treasurer, Chairman of the Audit and Finance Committee, and Trustee, Board of Trustees, Huntington Disease Foundation of America; and President, Flyway Advisory Services LLC (consulting and property management). Formerly: Trustee and Governance Chair, of certain Oppenheimer Funds | | 203 | | Chairman and Lead Independent Director, Chairman of the Audit Committee, and Director, Board of Directors, Value Line Funds |
| | | | | |
| James D. Vaughn – 1945 Trustee | | 2019 | | Retired Formerly: Managing Partner, Deloitte & Touche LLP; Trustee and Chairman of the Audit Committee, Schroder Funds; Board Member, Mile High United Way, Boys and Girls Clubs, Boy Scouts, Colorado Business Committee for the Arts, Economic Club of Colorado and Metro Denver Network (economic development corporation); and Trustee of certain Oppenheimer Funds | | 203 | | Board member and Chairman of Audit Committee of AMG National Trust Bank; Trustee and Investment Committee member, University of South Dakota Foundation; Board member, Audit Committee Member and past Board Chair, Junior Achievement (non-profit) |
| | | | | |
Christopher L. Wilson – 1957
Trustee, Vice Chair and Chair Designate | | 2017 | | Retired Formerly: Director, TD Asset Management USA Inc. (mutual fund complex) (22 portfolios); Managing Partner, CT2, LLC (investing and consulting firm); President/Chief Executive Officer, Columbia Funds, Bank of America Corporation; President/Chief Executive Officer, CDC IXIS Asset Management Services, Inc.; | | 203 | | ISO New England, Inc. (non-profit organization managing regional electricity market) |
63 INVESCO OPPENHEIMER GOLD & SPECIAL MINERALS FUND
TRUSTEES AND OFFICERS Continued
| | | | | | | | |
| | | | | |
Name, Year of Birth and Position(s) Held with the Trust | | Trustee and/or Officer Since | | Principal Occupation(s) During Past 5 Years | | Number of Funds in Fund Complex Overseen by Trustee | | Other Directorship(s)
Held by Trustee During Past 5 Years |
| | | | | |
INDEPENDENT TRUSTEES
(CONTINUED) | | | | | | | | |
| | | | | |
Christopher L. Wilson
Continued | | | | Principal & Director of Operations, Scudder Funds, Scudder, Stevens & Clark, Inc.; Assistant Vice President, Fidelity Investments | | | | |
64 INVESCO OPPENHEIMER GOLD & SPECIAL MINERALS FUND
| | | | | | | | |
| | | | | |
Name, Year of Birth and Position(s) Held with the Trust | | Trustee and/or Officer Since | | Principal Occupation(s) During Past 5 Years | | Number of Funds in Fund Complex Overseen by Trustee | | Other Directorship(s)
Held by Trustee During Past 5 Years |
| | | | | |
| OFFICERS | | | | | | | | |
| | | | | |
Sheri Morris — 1964
President, Principal Executive Officer and Treasurer | | 2003 | | Head of Global Fund Services, Invesco Ltd.; President, Principal Executive Officer and Treasurer, The Invesco Funds; Vice President, Invesco Advisers, Inc. (formerly known as Invesco Institutional (N.A.), Inc.) (registered investment adviser); and Vice President, Invesco Exchange-Traded Fund Trust, Invesco Exchange-Traded Fund Trust II, Invesco India Exchange-Traded Fund Trust, Invesco Actively Managed Exchange-Traded Fund Trust, Invesco Actively Managed Exchange-Traded Commodity Fund Trust and Invesco Exchange- Traded Self-Indexed Fund Trust, and Vice President, OppenheimerFunds, Inc. Formerly: Vice President and Principal Financial Officer, The Invesco Funds; Vice President, Invesco AIM Advisers, Inc., Invesco AIM Capital Management, Inc. and Invesco AIM Private Asset Management, Inc.; Assistant Vice President and Assistant Treasurer, The Invesco Funds and Assistant Vice President, Invesco Advisers, Inc., Invesco AIM Capital Management, Inc. and Invesco AIM Private Asset Management, Inc.; and Treasurer, Invesco Exchange-Traded Fund Trust, Invesco Exchange-Traded Fund Trust II, Invesco India Exchange-Traded Fund Trust and Invesco Actively Managed Exchange-Traded Fund Trust | | N/A | | N/A |
| | | | | |
Russell C. Burk — 1958
Senior Vice President and Senior Officer | | 2005 | | Senior Vice President and Senior Officer, The Invesco Funds | | N/A | | N/A |
| | | | | |
Jeffrey H. Kupor – 1968
Senior Vice President, Chief Legal Officer and Secretary | | 2018 | | Head of Legal of the Americas, Invesco Ltd.; Senior Vice President and Secretary, Invesco Advisers, Inc. (formerly known as Invesco Institutional (N.A.), Inc.) (registered investment adviser); Senior Vice President and Secretary, Invesco Distributors, Inc. (formerly known as Invesco AIM Distributors, Inc.); Vice President and Secretary, Invesco Investment Services, Inc. (formerly known as Invesco AIM Investment Services, Inc.) Senior Vice President, Chief Legal Officer and Secretary, The Invesco Funds; Secretary and General Counsel, Invesco Investment Advisers LLC (formerly known as Van Kampen Asset Management); Secretary and General Counsel, Invesco Capital Markets, Inc. (formerly known as Van Kampen Funds Inc.) and Chief Legal | | N/A | | N/A |
65 INVESCO OPPENHEIMER GOLD & SPECIAL MINERALS FUND
TRUSTEES AND OFFICERS Continued
| | | | | | | | |
| | | | | |
Name, Year of Birth and Position(s) Held with the Trust | | Trustee and/or Officer Since | | Principal Occupation(s) During Past 5 Years | | Number of Funds in Fund Complex Overseen by Trustee | | Other Directorship(s) Held by Trustee During Past 5 Years |
| | | | | |
| OFFICERS (CONTINUED) | | | | | | | | |
| | | | | |
| Jeffrey H. Kupor (Continued) | | | | Officer, Invesco Exchange-Traded Fund Trust, Invesco Exchange-Traded Fund Trust II, Invesco India Exchange-Traded Fund Trust, Invesco Actively Managed Exchange-Traded Fund Trust, Invesco Actively Managed Exchange- Traded Commodity Fund Trust and Invesco Exchange-Traded Self-Indexed Fund Trust; Secretary, Invesco Indexing LLC; Secretary, W.L. Ross & Co., LLC Formerly: Secretary and Vice President, Jemstep, Inc.; Head of Legal, Worldwide Institutional, Invesco Ltd.; Secretary and General Counsel, INVESCO Private Capital Investments, Inc.; Senior Vice President, Secretary and General Counsel, Invesco Management Group, Inc. (formerly known as Invesco AIM Management Group, Inc.); Assistant Secretary, INVESCO Asset Management (Bermuda) Ltd.; Secretary and General Counsel, Invesco Private Capital, Inc.; Assistant Secretary and General Counsel, INVESCO Realty, Inc.; Secretary and General Counsel, Invesco Senior Secured Management, Inc.; and Secretary, Sovereign G./P. Holdings Inc. | | | | |
| | | | | |
Andrew R. Schlossberg – 1974
Senior Vice President | | 2019 | | Head of the Americas and Senior Managing Director, Invesco Ltd.; Director and Senior Vice President, Invesco Advisers, Inc. (formerly known as Invesco Institutional (N.A.), Inc.) (registered investment adviser); Director and Chairman, Invesco Investment Services, Inc. (formerly known as Invesco AIM Investment Services, Inc.) (registered transfer agent); Senior Vice President, The Invesco Funds; Director, Invesco Investment Advisers LLC (formerly known as Van Kampen Asset Management); Director, President and Chairman, Invesco Insurance Agency, Inc. Formerly: Director, Invesco UK Limited; Director and Chief Executive, Invesco Asset Management Limited and Invesco Fund Managers Limited; Assistant Vice President, The Invesco Funds; Senior Vice President, Invesco Advisers, Inc. (formerly known as Invesco Institutional (N.A.), Inc.) (registered investment adviser); Director and Chief Executive, Invesco Administration Services | | N/A | | N/A |
66 INVESCO OPPENHEIMER GOLD & SPECIAL MINERALS FUND
| | | | | | | | |
| | | | | |
Name, Year of Birth and Position(s) Held with the Trust | | Trustee and/or Officer Since | | Principal Occupation(s) During Past 5 Years | | Number of Funds in Fund Complex Overseen by Trustee | | Other Directorship(s) Held by Trustee During Past 5 Years |
| | | | | |
| OFFICERS (CONTINUED) | | | | | | | | |
| | | | | |
| Andrew R. Schlossberg (Continued) | | | | Limited and Invesco Global Investment Funds Limited; Director, Invesco Distributors, Inc.; Head of EMEA, Invesco Ltd.; President, Invesco Actively Managed Exchange-Traded Commodity Fund Trust, Invesco Actively Managed Exchange-Traded Fund Trust, Invesco Exchange-Traded Fund Trust, Invesco Exchange-Traded Fund Trust II and Invesco India Exchange-Traded Fund Trust; Managing Director and Principal Executive Officer, Invesco Capital Management LLC | | | | |
| | | | | |
John M. Zerr — 1962
Senior Vice President | | 2006 | | Chief Operating Officer of the Americas; Senior Vice President, Invesco Advisers, Inc. (formerly known as Invesco Institutional (N.A.), Inc.) (registered investment adviser); Senior Vice President, Invesco Distributors, Inc. (formerly known as Invesco AIM Distributors, Inc.); Director and Vice President, Invesco Investment Services, Inc. (formerly known as Invesco AIM Investment Services, Inc.) Senior Vice President, The Invesco Funds; Managing Director, Invesco Capital Management LLC; Director, Invesco Investment Advisers LLC (formerly known as Van Kampen Asset Management); Senior Vice President, Invesco Capital Markets, Inc. (formerly known as Van Kampen Funds Inc.); Manager, Invesco Indexing LLC; Manager, Invesco Specialized Products, LLC; Director and Senior Vice President, Invesco Insurance Agency, Inc.; Member, Invesco Canada Funds Advisory Board; Director, President and Chief Executive Officer, Invesco Corporate Class Inc. (corporate mutual fund company); and Director, Chairman, President and Chief Executive Officer, Invesco Canada Ltd. (formerly known as Invesco Trimark Ltd./Invesco Trimark Ltèe) (registered investment adviser and registered transfer agent); President, Invesco, Inc.; President, Invesco Global Direct Real Estate Feeder GP Ltd.; President, Invesco IP Holdings (Canada) Ltd; President, Invesco Global Direct Real Estate GP Ltd.; President, Invesco Financial Services Ltd. / Services Financiers Invesco Ltée; and President, Trimark Investments Ltd./Placements Trimark Ltée Formerly: Director and Senior Vice President, Invesco Management Group, Inc. (formerly | | N/A | | N/A |
67 INVESCO OPPENHEIMER GOLD & SPECIAL MINERALS FUND
TRUSTEES AND OFFICERS Continued
| | | | | | | | |
| | | | | |
Name, Year of Birth and Position(s) Held with the Trust | | Trustee
and/or
Officer
Since | | Principal Occupation(s) During Past 5 Years | | Number of Funds in Fund Complex Overseen by Trustee | | Other Directorship(s)
Held by Trustee During Past 5 Years |
| | | | | |
| OFFICERS (CONTINUED) | | | | | | | | |
| | | | | |
| John M. Zerr (Continued) | | | | known as Invesco AIM Management Group, Inc.); Secretary and General Counsel, Invesco Management Group, Inc. (formerly known as Invesco AIM Management Group, Inc.); Secretary, Invesco Investment Services, Inc. (formerly known as Invesco AIM Investment Services, Inc.); Chief Legal Officer and Secretary, The Invesco Funds; Secretary and General Counsel, Invesco Investment Advisers LLC (formerly known as Van Kampen Asset Management); Secretary and General Counsel, Invesco Capital Markets, Inc. (formerly known as Van Kampen Funds Inc.); Chief Legal Officer, Invesco Exchange-Traded Fund Trust, Invesco Exchange-Traded Fund Trust II, Invesco India Exchange-Traded Fund Trust, Invesco Actively Managed Exchange-Traded Fund Trust, Invesco Actively Managed Exchange- Traded Commodity Fund Trust and Invesco Exchange-Traded Self-Indexed Fund Trust; Secretary, Invesco Indexing LLC; Director, Secretary, General Counsel and Senior Vice President, Van Kampen Exchange Corp.; Director, Vice President and Secretary, IVZ Distributors, Inc. (formerly known as INVESCO Distributors, Inc.); Director and Vice President, INVESCO Funds Group, Inc.; Director and Vice President, Van Kampen Advisors Inc.; Director, Vice President, Secretary and General Counsel, Van Kampen Investor Services Inc.; Director and Secretary, Invesco Distributors, Inc. (formerly known as Invesco AIM Distributors, Inc.); Director, Senior Vice President, General Counsel and Secretary, Invesco AIM Advisers, Inc. and Van Kampen Investments Inc.; Director, Vice President and Secretary, Fund Management Company; Director, Senior Vice President, Secretary, General Counsel and Vice President, Invesco AIM Capital Management, Inc.; Chief Operating Officer and General Counsel, Liberty Ridge Capital, Inc. (an investment adviser) | | | | |
| | | | | |
| Gregory G. McGreevey - 1962 Senior Vice President | | 2012 | | Senior Managing Director, Invesco Ltd.; Director, Chairman, President, and Chief Executive Officer, Invesco Advisers, Inc. (formerly known as Invesco Institutional (N.A.), Inc.) (registered investment adviser); Director, Invesco Mortgage Capital, Inc. and Invesco Senior Secured Management, Inc.; | | N/A | | N/A |
68 INVESCO OPPENHEIMER GOLD & SPECIAL MINERALS FUND
| | | | | | | | |
| | | | | |
Name, Year of Birth and Position(s) Held with the Trust | | Trustee and/or Officer Since | | Principal Occupation(s) During Past 5 Years | | Number of Funds in Fund Complex Overseen by Trustee | | Other Directorship(s) Held by Trustee During Past 5 Years |
| | | | | |
| OFFICERS (CONTINUED) | | | | | | | | |
| | | | | |
| Gregory G. McGreevey (Continued) | | | | and Senior Vice President, The Invesco Funds; and President, SNW Asset Management Corporation and Invesco Managed Accounts, LLC Formerly: Senior Vice President, Invesco Management Group, Inc. and Invesco Advisers, Inc.; Assistant Vice President, The Invesco Funds | | | | |
| | | | | |
Kelli Gallegos – 1970
Vice President, Principal Financial Officer and Assistant Treasurer | | 2008 | | Principal Financial and Accounting Officer – Investments Pool, Invesco Specialized Products, LLC; Vice President, Principal Financial Officer and Assistant Treasurer, The Invesco Funds; Principal Financial and Accounting Officer – Pooled Investments, Invesco Capital Management LLC; Vice President and Treasurer, Invesco Exchange- Traded Fund Trust, Invesco Exchange-Traded Fund Trust II, Invesco India Exchange-Traded Fund Trust, Invesco Actively Managed Exchange-Traded Fund Trust, Invesco Actively Managed Exchange-Traded Commodity Fund Trust and Invesco Exchange-Traded Self- Indexed Fund Trust; Vice President, Invesco Advisers, Inc. Formerly: Assistant Treasurer, Invesco Specialized Products, LLC; Assistant Treasurer, Invesco Exchange-Traded Fund Trust, Invesco Exchange-Traded Fund Trust II, Invesco India Exchange-Traded Fund Trust, Invesco Actively Managed Exchange-Traded Fund Trust, Invesco Actively Managed Exchange-Traded Commodity Fund Trust and Invesco Exchange- Traded Self-Indexed Fund Trust; Assistant Treasurer, Invesco Capital Management LLC; Assistant Vice President, The Invesco Funds | | N/A | | N/A |
| | | | | |
Crissie M. Wisdom – 1969
Anti-Money Laundering Compliance Officer | | 2013 | | Anti-Money Laundering and OFAC Compliance Officer for Invesco U.S. entities including; Invesco Advisers, Inc. and its affiliates, Invesco Capital Markets, Inc., Invesco Distributors, Inc., Invesco Investment Services, Inc., The Invesco Funds, Invesco Capital Management, LLC, Invesco Trust Company; and Fraud Prevention Manager for Invesco Investment Services, Inc. | | N/A | | N/A |
69 INVESCO OPPENHEIMER GOLD & SPECIAL MINERALS FUND
TRUSTEES AND OFFICERS Continued
| | | | | | | | |
| | | | | |
Name, Year of Birth and Position(s) Held with the Trust | | Trustee and/or Officer Since | | Principal Occupation(s) During Past 5 Years | | Number of Funds in Fund Complex Overseen by Trustee | | Other Directorship(s) Held by Trustee During Past 5 Years |
| | | | | |
| OFFICERS (CONTINUED) | | | | | | | | |
| | | | | |
Todd F. Kuehl – 1969
Chief Compliance Officer | | 2020 | | Chief Compliance Officer, Invesco Advisers, Inc. (registered investment adviser); and Chief Compliance Officer, The Invesco Funds Formerly: Managing Director and Chief Compliance Officer, Legg Mason (Mutual Funds); Chief Compliance Officer, Legg Mason Private Portfolio Group (registered investment adviser) | | N/A | | N/A |
The Statement of Additional Information of the Trust includes additional information about the Fund’s Trustees and is available upon request, without charge, by calling 1.800.959.4246. Please refer to the Fund’s Statement of Additional Information for information on the Fund’s sub-advisers.
| | | | | | | | | | |
| | Office of the Fund 11 Greenway Plaza, Suite 1000 Houston, TX 77046-1173 Counsel to the Fund Stradley Ronon Stevens & Young, LLP 2005 Market Street, Suite 2600 Philadelphia, PA 19103-7018 | | Investment Adviser Invesco Advisers, Inc. 1555 Peachtree Street, N.E. Atlanta, GA 30309 Counsel to the Independent Trustees Goodwin Procter LLP 901 New York Avenue, N.W. Washington, D.C. 20001 | | Distributor Invesco Distributors, Inc. 11 Greenway Plaza, Suite 1000 Houston, TX 77046-1173 Transfer Agent Invesco Investment Services, Inc. 11 Greenway Plaza, Suite 1000 Houston, TX 77046-1173 | | Auditors PricewaterhouseCoopers LLP 1000 Louisiana Street, Suite 5800 Houston, TX 77002-5021 Custodian JPMorgan Chase Bank 4 Chase Metro Tech Center Brooklyn, NY 11245 | | |
70 INVESCO OPPENHEIMER GOLD & SPECIAL MINERALS FUND
Invesco recognizes the importance of protecting your personal and financial information when you visit our website located at www.invesco.com (the “Website”). The following information is designed to help you understand the information collection practices at this Website. We will not sell, share or rent your personally identifiable information to others in contravention of this Privacy Policy. When we refer to ourselves as “we” or “Invesco” in this Privacy Policy, we mean our entire company including our affiliates, such as subsidiaries.
By visiting this Website, you are accepting the practices described in this Privacy Policy. If you do not agree to this policy, you may not use this Website. This Privacy Policy is subject to change without notice, from time to time in our sole discretion. You acknowledge that by accessing the Website after we have posted changes to this Privacy Policy, you are agreeing to this Privacy Policy as modified. Please review the Terms of Use1 to learn of other terms and conditions applicable to your use of the Website.
Please note that this Privacy Policy is not an exclusive statement of our privacy principles across all products and services. Other privacy principles or policies may apply depending on the products or services you obtain from Invesco, or the jurisdiction in which you transact with Invesco.
This Privacy Policy was last updated on May 6, 2018.
Information We Collect and Use
We collect personal information you choose to submit to the Website in order to process transactions requested by you and meet our contractual obligations. For example, you can choose to provide your name, contact information, social security number, or tax identification number in connection with accessing your account, or you can choose to provide your personal information when you fill out a secure account question form. Any information collected about you from the Website can, from time to time, be associated with other identifying information we have about you.
In addition, we may gather information about you automatically through your use of the Website, e.g. your IP address, how you navigate the Website, the organization from which you are accessing the Website, and the websites that you access before and after you visit the Website.
When you access the Website, we may also collect information such as unique device identifiers, your screen resolution and other device settings, information about your location, and analytical information about how you use the device from which you are viewing the Website. Where applicable, we may ask your permission before collecting certain information, such as precise geolocation information.
From time to time, we use or augment the personal information we have about you with information obtained from third parties. For example, we use third party information to confirm contact or financial information or to better understand your interests by associating demographic information from third parties with the information you have provided.
How We Use Personal Information
We use your personal information to respond to your inquiries and provide the products and services you request. We also use your information from time to time to deliver the content and services we believe
1NTD
71 INVESCO OPPENHEIMER GOLD & SPECIAL MINERALS FUND
| | |
| | | INVESCO’S PRIVACY POLICY Continued |
you will find the most relevant and to provide customer service and support.
We also use the information you provide to further develop and improve our products and services. We aggregate and/or de-identify data about visitors to the Website for various business purposes including product and service development and improvement activities.
How We Share Personal Information
We collaborate with other companies and individuals to perform services for us and on our behalf and we collaborate with our affiliates, other companies and individuals with respect to particular products or services (“Providers”). Examples of Providers include data analysis firms, customer service and support providers, email and SMS vendors, and web-hosting and development companies. Some Providers collect information for us or on our behalf on our Website. These Providers can be provided with access to personal information needed to perform their functions.
We reserve the right to disclose your personal information as required by law, when we believe disclosure is necessary to comply with a regulatory requirement, judicial proceeding, court order or legal process served on us, to protect the safety, rights or property of our customers, the public or Invesco or to enforce the Terms of Use.
If we sell or transfer a business unit (such as a subsidiary) or an asset (such as a website) to another company, we will share your personal information with such company. You will receive notice of such an event and the new entity will inform you of any changes to the practices in this Privacy Policy. If the new entity wishes to make additional use of your information, you have the right to decline such use at that time.
We occasionally disclose aggregate or de-identified data that is not personally identifiable with third parties.
Cookies and Other Tools
Invesco and its Providers collect information about you by using cookies, tracking pixels and other technologies. We use this information to better understand, customize and improve user experience with our websites, services and offerings as well as to manage our advertising. For example, we use web analytics services that use these technologies to gather information to help us understand how visitors engage with and navigate our Website, e.g., how and when pages in a site are visited and by how many visitors. We are also able to offer our visitors a more customized, relevant experience on our sites using these technologies by delivering content and functionality based on your preferences and interests.
Depending on their purpose, some cookies will only operate for the length of a single browsing session, while others have a longer life span to ensure that they fulfill their longer-term purposes. Your web browser can be set to allow you to control whether you will accept cookies or reject cookies, to notify you each time a cookie is sent to your browser, or to delete cookies that have already been set. If your browser is set to reject cookies, certain aspects of the Website that are cookie-enabled will not recognize you when you return to the website, and some Website functionality may be lost. The “Help” section of your browser may tell you how to prevent your browser from accepting cookies. To find out more about cookies, visit www.aboutcookies.org.
72 INVESCO OPPENHEIMER GOLD & SPECIAL MINERALS FUND
Security
No data transmission over the internet can be 100% secure, so Invesco cannot ensure or warrant the security of any information you submit to us on this Website. However, Invesco seeks to protect your personal information from unauthorized access or use when you transact business on our Website using technical, administrative and procedural measures. Invesco makes no representation as to the reasonableness, efficacy, or appropriateness of the measures we use to safeguard such information.
Users are responsible for maintaining the secrecy of their own passwords. If you have reason to believe that your interaction with us is no longer secure (for example, if you feel that the security of any account you might have with us has been compromised), please immediately notify us by contacting us as specified below.
Transfer of Data to Other Countries
Any information you provide to Invesco through use of the Website may be stored and processed, transferred between and accessed from the United States, Canada and other countries which do not guarantee the same level of protection of personal information as the one in which you reside. However, Invesco will handle your personal information in accordance with this Privacy Policy regardless of where your personal information is stored/accessed.
Children’s Privacy
We are committed to protecting the privacy of children. We do not knowingly collect personal information from children under the age of 18. If you are under the age of 18, do not provide us with any personal information.
Contact Us
Please contact us if you have any questions or concerns about your personal information or require assistance in managing your choices.
Invesco Ltd.
1555 Peachtree St. NE
Atlanta, GA 30309
By phone:
(404) 439-3236
By fax:
(404) 962-8288
By email:
Anne.Gerry@invesco.com
Please update your account information by logging in or contact us by email or telephone as specified above to update your account information whenever such information ceases to be complete or accurate.
You may also contact us to:
73 INVESCO OPPENHEIMER GOLD & SPECIAL MINERALS FUND
| | |
| | | INVESCO’S PRIVACY POLICY Continued |
| | · | | Request that we amend, rectify, delete or update the personal data we hold about you; |
| | · | | Where possible (e.g. in relation to marketing) amend or update your choices around processing; |
| | · | | Request a copy of personal data held by us. |
Disclaimer
Where the Website contains links to third-party websites/content/services that are not owned or controlled by Invesco, Invesco is not responsible for how these properties operate or treat your personal information so we recommend that you read the privacy policies and terms associated with these third party properties carefully.
74 INVESCO OPPENHEIMER GOLD & SPECIAL MINERALS FUND
THIS PAGE INTENTIONALLY LEFT BLANK.
THIS PAGE INTENTIONALLY LEFT BLANK.
THIS PAGE INTENTIONALLY LEFT BLANK.
THIS PAGE INTENTIONALLY LEFT BLANK.
THIS PAGE INTENTIONALLY LEFT BLANK.
|
Explore High-Conviction Investing with Invesco |

Go paperless with eDelivery |
|
| Visit invesco.com/edelivery to enjoy the convenience and security of anytime electronic access to your investment documents. |
|
With eDelivery, you can elect to have any or all of the following materials delivered straight to your inbox to download, save and print from your own computer: |
∎ Fund reports and prospectuses |
∎ Quarterly statements |
∎ Daily confirmations |
∎ Tax forms |
| Invesco mailing information |
|
| Send general correspondence to Invesco Investment Services, Inc., P.O. Box 219078, Kansas City, MO 64121-9078. |
| | | | |
| |  |
| | |
| Invesco Distributors, Inc. | | O-GSM-AR-1 | | 06272020 |
There were no amendments to the Code of Ethics (the “Code”) that applies to the Registrant’s Principal Executive Officer (“PEO”) and Principal Financial Officer (“PFO”) during the period covered by the report. The Registrant did not grant any waivers, including implicit waivers, from any provisions of the Code to the PEO or PFO during the period covered by this report.
| ITEM 3. | AUDIT COMMITTEE FINANCIAL EXPERT. |
The Board of Trustees has determined that the Registrant has at least one audit committee financial expert serving on its Audit Committee. The Audit Committee financial experts are David C. Arch, Bruce L. Crockett, Cynthia Hostetler, Elizabeth Krentzman, Anthony J. LaCava, Jr., Teresa M. Ressel, Jr. Robert C. Troccoli and James Vaughn. David C. Arch, Bruce L. Crockett, Cynthia Hostetler, Elizabeth Krentzman, Anthony J. LaCava, Jr., Teresa M. Ressel, Jr. Robert C. Troccoli and James Vaughn are “independent” within the meaning of that term as used in Form N-CSR.
| ITEM 4. | PRINCIPAL ACCOUNTANT FEES AND SERVICES. |
During the reporting period, PwC advised the Audit Committee of the following matters for consideration under the SEC’s auditor independence rules. PwC advised the Audit Committee that four PwC Managers each held financial interests either directly or, in the case of one PwC Manager, indirectly through her spouse’s equivalent brokerage account, in investment companies within the Invesco Fund Complex that were inconsistent with the requirements of Rule 2-01(c)(1) of Regulation S-X. PwC noted, among other things, that the impermissible holdings were disposed of by the individuals, the individuals were not in the chain of command of the audit or the audit partners of the Funds, the individuals either did not provide any audit services or did not provide services of any kind to the Registrant or its affiliates , and the investments were not material to the net worth of each individual or their respective immediate family members. PwC considered these mitigating factors in reaching its conclusion. PwC advised the Audit Committee that it believes its objectivity and impartiality has not been adversely affected by these matters as they related to the audit of the Registrant and that it can continue to serve as the independent public accounting firm for the Funds.
On May 24, 2019, certain investment advisor subsidiaries of Invesco Ltd. assumed management responsibility from Oppenheimer Funds, Inc. (“OFI”) for 83 open-end mutual funds and 20 exchange-traded funds (collectively, the “Oppenheimer Funds”). Assumption of management responsibility for the Oppenheimer Funds was accomplished through the reorganization of each Oppenheimer Fund into a new Invesco shell fund (collectively, the “New Invesco Funds”) that did not have pre-existing assets (together, the “Reorganizations”). The Reorganizations were part of the acquisition by Invesco Ltd. (together with its subsidiaries, “Invesco”) of the asset management business of OFI (including the Oppenheimer Funds) from Massachusetts Mutual Life Insurance Company (“MassMutual”), which was also consummated on May 24, 2019 (the “Acquisition”). Subsequent to the Acquisition, MassMutual became a significant shareholder of Invesco, and the Invesco Ltd. board of directors expanded by one director with the addition of a director selected by MassMutual.
Prior to the consummation of the Acquisition and the Reorganizations on May 24, 2019, PwC completed an independence assessment to evaluate the services and relationships with OFI and its affiliates, which became affiliates of Invesco upon the closing of the Acquisition. The assessment identified the following relationship and services that are inconsistent with the auditor independence rules under Rule 2-01 of Regulation S-X (“Rule 2-01”) if provided to an affiliate of an audit client. A retired PwC partner who receives a benefit from PwC that is not fully funded, served as a member of Audit Committee of the Boards of Trustees of certain Oppenheimer Funds prior to the Acquisition (the “Pre-Reorganization
Relationship”). Additionally, PwC provided certain non-audit services including, expert legal services to one Oppenheimer Fund, custody of client assets in connection with payroll services, a non-audit service performed pursuant to a success-based fee, non-audit services in which PwC acted as an advocate on behalf of a MassMutual foreign affiliate and certain employee activities undertaken in connection with the provision of non-audit services for MassMutual and certain MassMutual foreign affiliates (collectively, the “Pre-Reorganization Services”).
PwC and the Audit Committees of the New Invesco Funds each considered the impact that the Pre-Reorganization Relationship and Services have on PwC’s independence with respect to the New Invesco Funds. On the basis of the nature of the relationship and services performed, and in particular the mitigating factors described below, PwC concluded that a reasonable investor, possessing knowledge of all the relevant facts and circumstances regarding the Pre-Reorganization Relationship and Services, would conclude that the Pre-Reorganization Relationship and Services do not impair PwC’s ability to exhibit the requisite objectivity and impartiality to report on the financial statements of the New Invesco Funds for the years ending May 31, 2019 – April 30, 2020 (“PwC’s Conclusion”).
The Audit Committees of the Boards of Trustees of the New Invesco Funds, based upon PwC’s Conclusion and the concurrence of Invesco, considered the relevant facts and circumstances including the mitigating factors described below and, after careful consideration, concluded that PwC is capable of exercising objective and impartial judgment in connection with its audits of the financial statements of the New Invesco Funds that the respective Boards of Trustees oversees.
Mitigating factors that PwC and the Audit Committees considered in reaching their respective conclusions included, among others, the following factors:
| | • | | none of the Pre-Reorganization Relationship or Services created a mutuality of interest between PwC and the New Invesco Funds; |
| | • | | PwC will not act in a management or employee capacity for the New Invesco Funds or their affiliates during any portion of PwC’s professional engagement period; |
| | • | | other than the expert legal services, Pre-Reorganization Services that have been provided to OFI, MassMutual and their affiliates do not have any impact on the financial statements of the New Invesco Funds; |
| | • | | as it relates to the expert legal services, while the service provided by PwC related to litigation involving one Oppenheimer Fund, the impact of the litigation on the Oppenheimer Fund’s financial statements was based upon OFI’s decision, and OFI management represented that the PwC service was not considered a significant component of its decision; |
| | • | | while certain employees of OFI who were involved in the financial reporting process of the Oppenheimer Funds will be employed by Invesco subsequent to the Reorganizations, existing officers of other Invesco Funds will serve as Principal Executive Officer and Principal Financial Officer or equivalent roles for the New Invesco Funds, and are ultimately responsible for the accuracy of all financial statement assertions for the entirety of the financial reporting periods for the New Invesco Funds; |
| | • | | the Pre-Reorganization Services giving rise to the lack of independence were provided to, or entered into with, OFI, MassMutual and their affiliates at a time when PwC had no independence restriction with respect to these entities; |
| | • | | with the exception of the expert legal service provided to one Oppenheimer Fund, none of the Pre-Reorganization Services affected the operations or financial reporting of the New Invesco Funds; |
| | • | | the Pre-Reorganization Services provided by PwC to OFI, MassMutual and their affiliates were performed by persons who were not, and will not be, part of the audit engagement team for the New Invesco Funds; and |
| | • | | the fees associated with the Pre-Reorganization Services were not material to MassMutual, Invesco or PwC. |
(a) to (d)
Fees Billed by PwC Related to the Registrant
PwC billed the Registrant aggregate fees for services rendered to the Registrant for the last two fiscal years as shown in the following table. The Audit Committee rep-approved all audit and non-audit services provided to the Registrant.
| | | | | | | | |
| | | Fees Billed for Services
Rendered to the Registrant for
fiscal year end 2020 | | | Fees Billed for Services Rendered
to the Registrant for fiscal year
end 2019 | |
Audit Fees | | $ | 323,392 | | | $ | 333,858 | |
Audit-Related Fees(1) | | $ | 56,900 | | | $ | 0 | |
Tax Fees(2) | | $ | 174,663 | | | $ | 78,568 | |
All Other Fees | | $ | 0 | | | $ | 0 | |
| | | | | | | | |
Total Fees | | $ | 554,955 | | | $ | 412,426 | |
| (1) | Audit-Related Fees for the fiscal year end April 30, 2020 includes fees billed for reviewing regulatory filings. |
| (2) | Tax Fees for the fiscal year end April 30, 2020 includes fees billed for preparation of U.S. Tax Returns and Taxable Income calculations, including excise tax and year-to-date estimates for various book-to-tax differences. Tax fees for fiscal year end April 30, 2019 includes fees billed for reviewing tax returns and/or services related to tax compliance. |
Fees Billed by PwC Related to Invesco and Invesco Affiliates
PwC billed Invesco Advisers, Inc. (“Invesco”), the Registrant’s adviser, and any entity controlling, controlled by or under common control with Invesco that provides ongoing services to the Registrant (“Invesco Affiliates”) aggregate fees for pre-approved non-audit services rendered to Invesco and Invesco Affiliates for the last two fiscal years as shown in the following table. The Audit Committee pre-approved all non-audit services provided to Invesco and Invesco Affiliates that were required to be pre-approved.
| | | | | | | | |
| | | Fees Billed for Non-Audit
Services Rendered to Invesco
and Invesco Affiliates for fiscal
year end 2020 That Were
Required
to be Pre-Approved
by the Registrant’s
Audit Committee | | | Fees Billed for Non-Audit Services
Rendered to Invesco and Invesco
Affiliates for fiscal year end 2019
That Were Required
to be Pre-Approved
by the Registrant’s
Audit Committee | |
Audit-Related Fees(1) | | $ | 701,000 | | | $ | 690,000 | |
Tax Fees | | $ | 0 | | | $ | 0 | |
All Other Fees | | $ | 0 | | | $ | 0 | |
| | | | | | | | |
Total Fees | | $ | 701,000 | | | $ | 690,000 | |
| (1) | Audit-Related Fees for the fiscal years ended 2020 and 2019 include fees billed related to reviewing controls at a service organization. |
(e)(1)
PRE-APPROVAL OF AUDIT AND NON-AUDIT SERVICES
POLICIES AND PROCEDURES
As adopted by the Audit Committees
of the Invesco Funds (the “Funds”)
Last Amended March 29, 2017
I. Statement of Principles
The Audit Committees (the “Audit Committee”) of the Boards of Trustees of the Funds (the “Board”) have adopted these policies and procedures (the “Procedures”) with respect to the pre-approval of audit and non-audit services to be provided by the Funds’ independent auditor (the “Auditor”) to the Funds, and to the Funds’ investment adviser(s) and any entity controlling, controlled by, or under common control with the investment adviser(s) that provides ongoing services to the Funds (collectively, “Service Affiliates”).
Under Section 202 of the Sarbanes-Oxley Act of 2002, all audit and non-audit services provided to the Funds by the Auditor must be preapproved by the Audit Committee. Rule 2-01 of Regulation S-X requires that the Audit Committee also pre-approve a Service Affiliate’s engagement of the Auditor for non-audit services if the engagement relates directly to the operations and financial reporting of the Funds (a “Service Affiliate’s Covered Engagement”).
These Procedures set forth the procedures and the conditions pursuant to which the Audit Committee may pre-approve audit and non-audit services for the Funds and a Service Affiliate’s Covered Engagement pursuant to rules and regulations of the Securities and Exchange Commission (“SEC”) and other organizations and regulatory bodies applicable to the Funds (“Applicable Rules”).1 They address both general pre-approvals without consideration of specific case-by-case services (“general pre-approvals”) and pre-approvals on a case-by-case basis (“specific pre-approvals”). Any services requiring pre-approval that are not within the scope of general pre-approvals hereunder are subject to specific pre-approval. These Procedures also address the delegation by the Audit Committee of pre-approval authority to the Audit Committee Chair or Vice Chair.
II. Pre-Approval of Fund Audit Services
The annual Fund audit services engagement, including terms and fees, is subject to specific pre-approval by the Audit Committee. Audit services include the annual financial statement audit and other procedures required to be performed by an independent auditor to be able to form an opinion on the Funds’ financial statements. The Audit Committee will receive, review and consider sufficient information concerning a proposed Fund audit engagement to make a reasonable evaluation of the Auditor’s qualifications and independence. The Audit Committee will oversee the Fund audit services engagement as necessary, including approving any changes in terms, audit scope, conditions and fees.
| 1 | Applicable Rules include, for example, New York Stock Exchange (“NYSE”) rules applicable to closed-end funds managed by Invesco and listed on NYSE. |
In addition to approving the Fund audit services engagement at least annually and specifically approving any changes, the Audit Committee may generally or specifically pre-approve engagements for other audit services, which are those services that only an independent auditor reasonably can provide. Other audit services may include services associated with SEC registration statements, periodic reports and other documents filed with the SEC.
III. General and Specific Pre-Approval of Non-Audit Fund Services
The Audit Committee will consider, at least annually, the list of General Pre-Approved Non-Audit Services which list may be terminated or modified at any time by the Audit Committee. To inform the Audit Committee’s review and approval of General Pre-Approved Non-Audit Services, the Funds’ Treasurer (or his or her designee) and Auditor shall provide such information regarding independence or other matters as the Audit Committee may request.
Any services or fee ranges that are not within the scope of General Pre-Approved Non-Audit Services have not received general pre-approval and require specific pre-approval. Each request for specific pre-approval by the Audit Committee for services to be provided by the Auditor to the Funds must be submitted to the Audit Committee by the Funds’ Treasurer (or his or her designee) and must include detailed information about the services to be provided, the fees or fee ranges to be charged, and other relevant information sufficient to allow the Audit Committee to consider whether to pre-approve such engagement, including evaluating whether the provision of such services will impair the independence of the Auditor and is otherwise consistent with Applicable Rules.
IV. Non-Audit Service Types
The Audit Committee may provide either general or specific pre-approval of audit-related, tax or other services, each as described in more detail below.
“Audit-related services” are assurance and related services that are reasonably related to the performance of the audit or review of the Fund’s financial statements or that are traditionally performed by an independent auditor. Audit-related services include, among others, accounting consultations related to accounting, financial reporting or disclosure matters not classified as “Audit services”; assistance with understanding and implementing new accounting and financial reporting guidance from rulemaking authorities; services related to mergers, acquisitions or dispositions; compliance with ratings agency requirements and interfund lending activities; and assistance with internal control reporting requirements.
“Tax services” include, but are not limited to, the review and signing of the Funds’ federal tax returns, the review of required distributions by the Funds and consultations regarding tax matters such as the tax treatment of new investments or the impact of new regulations. The Audit
Committee will not approve proposed services of the Auditor which the Audit Committee believes are to be provided in connection with a service or transaction initially recommended by the Auditor, the sole business purpose of which may be tax avoidance and the tax treatment of which may not be supported in the Internal Revenue Code and related regulations. The Audit Committee will consult with the Funds’ Treasurer (or his or her designee) and may consult with outside counsel or advisers as necessary to ensure the consistency of tax services rendered by the Auditor with the foregoing policy. The Auditor shall not represent any Fund or any Service Affiliate before a tax court, district court or federal court of claims.
Each request to provide tax services under either the general or specific pre-approval of the Audit Committee will include a description from the Auditor in writing of (i) the scope of the service, the fee structure for the engagement, and any side letter or other amendment to the engagement letter, or any other agreement (whether oral, written, or otherwise) between the Auditor and the Funds, relating to the service; and (ii) any compensation arrangement or other agreement, such as a referral agreement, a referral fee or fee-sharing arrangement, between the Auditor (or an affiliate of the Auditor) and any person (other than the Funds or Service Affiliates receiving the services) with respect to the promoting, marketing, or recommending of a transaction covered by the service. The Auditor will also discuss with the Audit Committee the potential effects of the services on the independence of the Auditor, and document the substance of its discussion with the Audit Committee.
The Audit Committee may pre-approve other non-audit services so long as the Audit Committee believes that the service will not impair the independence of the Auditor. Appendix I includes a list of services that the Auditor is prohibited from performing by the SEC rules. Appendix I also includes a list of services that would impair the Auditor’s independence unless the Audit Committee reasonably concludes that the results of the services will not be subject to audit procedures during an audit of the Funds’ financial statements.
V. Pre-Approval of Service Affiliate’s Covered Engagements
Rule 2-01 of Regulation S-X requires that the Audit Committee pre-approve a Service Affiliate’s engagement of the Auditor for non-audit services if the engagement relates directly to the operations and financial reporting of the Funds, defined above as a “Service Affiliate’s Covered Engagement”.
The Audit Committee may provide either general or specific pre-approval of any Service Affiliate’s Covered Engagement, including for audit-related, tax or other services, as described above, if the Audit Committee believes that the provision of the services to a Service Affiliate will not impair the independence of the Auditor with respect to the Funds. Any Service Affiliate’s Covered Engagements that are not within the scope of General Pre-Approved Non-Audit Services have not received general pre-approval and require specific pre-approval.
Each request for specific pre-approval by the Audit Committee of a Service Affiliate’s Covered Engagement must be submitted to the Audit Committee by the Funds’ Treasurer (or his or her
designee) and must include detailed information about the services to be provided, the fees or fee ranges to be charged, a description of the current status of the pre-approval process involving other audit committees in the Invesco investment company complex (as defined in Rule 2-201 of Regulation S-X) with respect to the proposed engagement, and other relevant information sufficient to allow the Audit Committee to consider whether the provision of such services will impair the independence of the Auditor from the Funds. Additionally, the Funds’ Treasurer (or his or her designee) and the Auditor will provide the Audit Committee with a statement that the proposed engagement requires pre-approval by the Audit Committee, the proposed engagement, in their view, will not impair the independence of the Auditor and is consistent with Applicable Rules, and the description of the proposed engagement provided to the Audit Committee is consistent with that presented to or approved by the Invesco audit committee.
Information about all Service Affiliate engagements of the Auditor for non-audit services, whether or not subject to pre-approval by the Audit Committee, shall be provided to the Audit Committee at least quarterly, to allow the Audit Committee to consider whether the provision of such services is compatible with maintaining the Auditor’s independence from the Funds. The Funds’ Treasurer and Auditor shall provide the Audit Committee with sufficiently detailed information about the scope of services provided and the fees for such services, to ensure that the Audit Committee can adequately consider whether the provision of such services is compatible with maintaining the Auditor’s independence from the Funds.
VI. Pre-Approved Fee Levels or Established Amounts
Pre-approved fee levels or ranges for audit and non-audit services to be provided by the Auditor to the Funds, and for a Service Affiliate’s Covered Engagement, under general pre-approval or specific pre-approval will be set periodically by the Audit Committee. Any proposed fees exceeding 110% of the maximum pre-approved fee levels or ranges for such services or engagements will be promptly presented to the Audit Committee and will require specific pre-approval by the Audit Committee before payment of any additional fees is made.
VII. Delegation
The Audit Committee hereby delegates, subject to the dollar limitations set forth below, specific authority to its Chair, or in his or her absence, Vice Chair, to pre-approve audit and non-audit services proposed to be provided by the Auditor to the Funds and/or a Service Affiliate’s Covered Engagement, between Audit Committee meetings. Such delegation does not preclude the Chair or Vice Chair from declining, on a case by case basis, to exercise his or her delegated authority and instead convening the Audit Committee to consider and pre-approve any proposed services or engagements.
Notwithstanding the foregoing, the Audit Committee must pre-approve: (a) any non-audit services to be provided to the Funds for which the fees are estimated to exceed $500,000; (b) any Service Affiliate’s Covered Engagement for which the fees are estimated to exceed $500,000; or (c) any cost increase to any previously approved service or engagement that exceeds the greater of $250,000 or 50% of the previously approved fees up to a maximum increase of $500,000
VIII. Compliance with Procedures
Notwithstanding anything herein to the contrary, failure to pre-approve any services or engagements that are not required to be pre-approved pursuant to the de minimis exception provided for in Rule 2-01(c)(7)(i)(C) of Regulation S-X shall not constitute a violation of these Procedures. The Audit Committee has designated the Funds’ Treasurer to ensure services and engagements are pre-approved in compliance with these Procedures. The Funds’ Treasurer will immediately report to the Chair of the Audit Committee, or the Vice Chair in his or her absence, any breach of these Procedures that comes to the attention of the Funds’ Treasurer or any services or engagements that are not required to be pre-approved pursuant to the de minimis exception provided for in Rule 2-01(c)(7)(i)(C) of Regulation S-X.
On at least an annual basis, the Auditor will provide the Audit Committee with a summary of all non-audit services provided to any entity in the investment company complex (as defined in section 2-01(f)(14) of Regulation S-X, including the Funds and Service Affiliates) that were not pre-approved, including the nature of services provided and the associated fees.
IX. Amendments to Procedures
All material amendments to these Procedures must be approved in advance by the Audit Committee. Non-material amendments to these Procedures may be made by the Legal and Compliance Departments and will be reported to the Audit Committee at the next regularly scheduled meeting of the Audit Committee.
Appendix I
Non-Audit Services That May Impair the Auditor’s Independence
The Auditor is not independent if, at any point during the audit and professional engagement, the Auditor provides the following non-audit services:
| | • | | Broker-dealer, investment adviser, or investment banking services ; |
| | • | | Expert services unrelated to the audit; |
| | • | | Any service or product provided for a contingent fee or a commission; |
| | • | | Services related to marketing, planning, or opining in favor of the tax treatment of confidential transactions or aggressive tax position transactions, a significant purpose of which is tax avoidance; |
| | • | | Tax services for persons in financial reporting oversight roles at the Fund; and |
| | • | | Any other service that the Public Company Oversight Board determines by regulation is impermissible. |
An Auditor is not independent if, at any point during the audit and professional engagement, the Auditor provides the following non-audit services unless it is reasonable to conclude that the results of the services will not be subject to audit procedures during an audit of the Funds’ financial statements:
| | • | | Bookkeeping or other services related to the accounting records or financial statements of the audit client; |
| | • | | Financial information systems design and implementation; |
| | • | | Appraisal or valuation services, fairness opinions, or contribution-in-kind reports; |
| | • | | Actuarial services; and |
| | • | | Internal audit outsourcing services. |
(e)(2) There were no amounts that were pre-approved by the Audit Committee pursuant to the de minimus exception under Rule 2-01 of Regulation S-X.
(f) Not applicable.
(g) In addition to the amounts shown in the tables above, PwC billed Invesco and Invesco Affiliates aggregate fees of $6,726,000 for the fiscal year ended April 30, 2020 and $3,550,000 for the fiscal year ended April 30, 2019 for non-audit services not required to be pre-approved by the Registrant’s Audit Committee. In total, PwC billed the Registrant, Invesco and Invesco Affiliates aggregate non-audit fees of $7,601,663 for the fiscal year ended April 30, 2020 and $4,318,568 for the fiscal year ended April 30, 2019.
PwC provided audit services to the Investment Company complex of approximately $32 million.
(h) The Audit Committee also has considered whether the provision of non-audit services that were rendered to Invesco and Invesco Affiliates that were not required to be pre-approved pursuant to SEC regulations, if any, is compatible with maintaining PwC’s independence.
| ITEM 5. | AUDIT COMMITTEE OF LISTED REGISTRANTS. |
Not applicable.
| ITEM 6. | SCHEDULE OF INVESTMENTS. |
Investments in securities of unaffiliated issuers is included as part of the reports to stockholders filed under Item 1 of this Form.
| ITEM 7. | DISCLOSURE OF PROXY VOTING POLICIES AND PROCEDURES FOR CLOSED-END MANAGEMENT INVESTMENT COMPANIES. |
Not applicable.
| ITEM 8. | PORTFAOLIO MANAGERS OF CLOSED-END MANAGEMENT COMPANIES. |
Not applicable.
| ITEM 9. | PURCHASES OF EQUITY SECURITIES BY CLOSED-END MANAGEMENT INVESTMENT COMPANY AND AFFILIATED PURCHASERS. |
Not applicable.
| ITEM 10. | SUBMISSION OF MATTERS TO A VOTE OF SECURITY HOLDERS. |
None
| ITEM 11. | CONTROLS AND PROCEDURES. |
| | (a) | As of June 17, 2020, an evaluation was performed under the supervision and with the participation of the officers of the Registrant, including the Principal Executive Officer (“PEO”) and Principal Financial Officer (“PFO”), to assess the effectiveness of the Registrant’s disclosure controls and procedures, as that term is defined in Rule 30a-3(c) under the Investment Company Act of 1940 (“Act”), as amended. Based on that evaluation, the Registrant’s officers, including the PEO and PFO, concluded that, as of June 17, 2020, the Registrant’s disclosure controls and procedures were reasonably designed so as to ensure: (1) that information required to be disclosed by the Registrant on Form N-CSR is recorded, processed, summarized and reported within the time periods specified by the rules and forms of the Securities and Exchange Commission; and (2) that material information relating to the Registrant is made known to the PEO and PFO as appropriate to allow timely decisions regarding required disclosure. |
| | (b) | There have been no changes in the Registrant’s internal control over financial reporting (as defined in Rule 30a-3(d) under the Act) that occurred during the period covered by this report that have materially affected, or are reasonably likely to materially affect, the Registrant’s internal control over financial reporting. |
| ITEM 12. | DISCLOSURE OF SECURITIES LENDING ACTIVITIES FOR CLOSED-END MANAGEMENT INVESTMENT COMPANIES. |
Not applicable.
SIGNATURES
Pursuant to the requirements of the Securities Exchange Act of 1934 and the Investment Company Act of 1940, the Registrant has duly caused this report to be signed on its behalf by the undersigned, thereunto duly authorized.
Registrant: AIM Sector Funds (Invesco Sector Funds)
| | |
| By: | | /s/ Sheri Morris |
| | Sheri Morris |
| | Principal Executive Officer |
| |
| Date: | | July 8, 2020 |
Pursuant to the requirements of the Securities and Exchange Act of 1934 and the Investment Company Act of 1940, this report has been signed below by the following persons on behalf of the Registrant and in the capacities and on the dates indicated.
| | |
By: | | /s/ Sheri Morris |
| | Sheri Morris |
| | Principal Executive Officer |
| |
Date: | | July 8, 2020 |
| |
By: | | /s/ Kelli Gallegos |
| | Kelli Gallegos |
| | Principal Financial Officer |
| |
Date: | | July 8, 2020 |