UNITED STATES
SECURITIES AND EXCHANGE COMMISSION
Washington, D.C. 20549
FORM N-CSR
CERTIFIED SHAREHOLDER REPORT OF REGISTERED
MANAGEMENT INVESTMENT COMPANIES
Investment Company Act file number 811-03826
AIM Sector Funds (Invesco Sector Funds)
(Exact name of registrant as specified in charter)
11 Greenway Plaza, Suite 1000 Houston, Texas 77046
(Address of principal executive offices) (Zip code)
Sheri Morris 11 Greenway Plaza, Suite 1000 Houston, Texas 77046
(Name and address of agent for service)
Registrant’s telephone number, including area code: (713) 626-1919
Date of fiscal year end: 04/30
Date of reporting period: 04/30/21
Item 1. Reports to Stockholders.
| (a) | The Registrant’ annual report transmitted to shareholders pursuant to Rule 30e-1 under the Investment Company Act of 1940 is as follows: |
| | | | |
| | |
 | | Annual Report to Shareholders | | April 30, 2021 |
| | |
| | Invesco American Value Fund |
| | Nasdaq: |
| | A: MSAVX ∎ C: MSVCX ∎ R: MSARX ∎ Y: MSAIX ∎ R5: MSAJX ∎ R6: MSAFX |

Management’s Discussion of Fund Performance
|
Performance summary |
For the fiscal year ended April 30, 2021, Class A shares of Invesco American Value Fund (the Fund), at net asset value (NAV), outperformed the Russell Midcap Value Index, the Fund’s style-specific benchmark. Your Fund’s long-term performance appears later in this report. |
Fund vs. Indexes |
Total returns, 4/30/20 to 4/30/21, at net asset value (NAV). Performance shown does not include applicable contingent deferred sales charges (CDSC) or front-end sales charges, which would have reduced performance. |
| | | | |
Class A Shares | | | 62.87 | % |
| Class C Shares | | | 61.76 | |
| Class R Shares | | | 62.48 | |
| Class Y Shares | | | 63.28 | |
| Class R5 Shares | | | 63.51 | |
| Class R6 Shares | | | 63.53 | |
| S&P 500 Index▼ (Broad Market Index) | | | 45.98 | |
| Russell Midcap Value Index▼ (Style-Specific Index) | | | 60.70 | |
| Lipper Mid-Cap Value Funds Index∎ (Peer Group Index) | | | 68.87 | |
| |
| Source(s): ▼RIMES Technologies Corp.; ∎Lipper Inc. | | | | |
Market conditions and your Fund
As many businesses began to shut down in April 2020 due to the pandemic, US unemployment numbers continued to climb, as the economy ground to a halt. However, during the second and into the third quarter of 2020, US stocks largely shrugged off economic uncertainty, social unrest and a resurgence in coronavirus (COVID-19) infections to rally from the market bottom. Investor sentiment improved in response to trillions of dollars in economic stimulus, progress on a COVID-19 vaccine and re-openings in many US regions. In July, the US Federal Reserve (the Fed) extended its emergency stimulus programs, originally scheduled to end in September, to year-end, which provided support to equities. In late August, second-quarter gross domestic product (GDP) fell by 31.4%,1 a record decline. Despite the extreme drop in the economy, the S&P 500 Index not only erased all its losses from the first quarter but made record highs.
Despite a September selloff, US equity markets posted gains in the third quarter as the Fed extended its emergency stimulus programs and changed its inflation target policy, both of which supported equities. Data for both manufacturing and services indicated expansion, a reversal from significant declines earlier in the year. Corporate earnings were also better than anticipated and a gradual decline in new COVID-19 infections in many regions, combined with optimism about progress on a COVID-19 vaccine, further boosted stocks. October saw increased volatility as COVID-19 infection rates rose to record highs in the US and Europe. Investors also became concerned about delayed results from the US presidential election and the real possibility of a contested election, further delaying a clear winner.
US equity markets posted gains in the fourth quarter, as positive news on COVID-19 vaccines and strong corporate earnings outweighed investor concerns about the political disagreement over a fiscal stimulus package and sharply rising COVID-19 infections nationwide. Cyclical sectors like energy and financials led the way, while real estate and consumer staples lagged. Market leadership also shifted during the quarter with value stocks outperforming growth for the first time since the fourth quarter of 2016. While the US economy rebounded significantly since the pandemic began, the recovery appeared to slow in the fourth quarter with employment gains and gross domestic product (GDP) growth down from the third quarter. However, stocks were buoyed by the Fed’s pledge to maintain its accommodative stance and asset purchases, “until substantial further progress has been made” toward employment and inflation targets.
US political unrest and rising COVID-19 infection rates marked the start of the first quarter of 2021. Additionally, retail investors bid up select stocks like GameStop and AMC Theaters, ultimately causing a sharp selloff in late January. Corporate earnings generally beat expectations, but market volatility rose during the quarter as investors worried about rising bond yields and inflation. Despite the Fed’s commitment to an accommodative policy, the 10-year US Treasury yield rose from 0.92% at year-end to 1.63%2 at the fiscal year-end. Approval of a third COVID-19 vaccine boosted investors’ optimism for faster economic recovery. Although March saw increased volatility with consecutive down days in the US stock market, stocks continued to hit all-time highs through April. US stocks had strong returns for the fiscal year, with the S&P 500 Index returning 45.98% for the year.3
All sectors within the Russell Midcap Value Index had positive returns for the fiscal year. Consumer discretionary was the best performing sector, while utilities lagged.
The Fund’s relative outperformance compared to its style-specific benchmark for the year was driven by stock selection and an overweight in financials. Within the sector, strong individual contributors included Ally Financial, an auto and mortgage finance company, and insurers Athene Holding and
Arthur J Gallagher & Co. Ally benefited from a sharp rebound in auto lending following the initial pandemic-related downturn, as well as stronger used-car pricing, low interest rates and a benign credit environment. The Fund held these positions at fiscal year-end.
Stock selection in materials and energy also contributed to the Fund’s relative return. In materials, Freeport-McMoRan was the largest contributor. The stock benefited as copper prices rose steadily during the period, driven by China’s continued demand recovery, a weak US dollar and supply constraints. The company also announced the sale of an undeveloped, non-core project which was viewed favorably by investors. The Fund held Freeport-McMoRan at fiscal year-end.
Within energy, Devon Energy and Parsley Energy were strong individual contributors. During the period, Pioneer Natural Resources announced the acquisition of Parsley Energy, which we believe should lead to higher profitability from increased sales synergies and cost savings. Devon completed its merger with WPX Energy during the fiscal year. The deal significantly expanded Devon’s shale assets and the combined firm is expected to realize greater efficiencies and growth opportunities going forward. We held Devon and Pioneer at the fiscal year-end.
The largest detractor from the Fund’s performance relative to its style-specific benchmark was stock selection in health care and information technology. Centene, a Medicaid-managed care provider was the largest detractor in health care. During the period, Centene Corporation issued weaker than expected guidance due in part to a higher medical loss ratio. Investor concerns about state premium rate adjustments and higher COVID-19 testing and treatment costs also weighed on shares. We maintained our position at year-end.
After delivering very strong performance in 2020, IT stocks came under pressure amid the reversal in leadership in the first quarter of 2021. Within the sector, Ciena and Vontier were detractors from the Fund’s relative performance compared to its style-specific benchmark. Vontier was a new purchase during the period and is an equipment and services provider in the mobility infrastructure and automotive diagnostic tools market. The stock traded lower amid investor concern
2 Invesco American Value Fund
about the company’s ability to drive incremental value through mergers and acquisitions. Ciena reported slightly better than expected results; however, shares declined after management provided a cautious near-term outlook, largely attributable to COVID-19-related headwinds and a pause in customer spending. We held both companies at the fiscal year-end.
Security selection in the utilities sector was another detractor from relative returns, due primarily to FirstEnergy. Shares of the stock dropped sharply after the announcement of an investigation into bribery allegations connected to energy legislation in Ohio. FirstEnergy was not explicitly named but was presumed to be related to the events. Given the potential for prolonged uncertainty created by the investigation, we sold our position in the company during the fiscal year.
The Fund’s cash position, while less than 3% on average during the period detracted from the Fund’s relative return in the strong market environment.
During the fiscal year, we increased the Fund’s exposure to the industrials and consumer discretionary sectors and reduced exposure to the IT, real estate, and health care sectors. At fiscal year-end, the Fund’s largest overweight allocations relative to the Russell Mid Cap Value index were in financials, industrials and consumer staples, while the largest underweight allocations were in the real estate, IT and materials sectors.
We believe the wider distribution of COVID-19 vaccines and ongoing stimulus should help the economic recovery in the coming months. However, a faster-than-expected rise in inflation or a spike in new infections could derail progress. We believe market volatility creates opportunities to invest in companies with attractive valuations and strong fundamentals. We believe that ultimately those valuations and fundamentals will be reflected in those companies’ stock prices.
As always, we are committed to working to achieve positive returns for the Fund’s shareholders through an entire market cycle. Thank you for your continued investment in the Invesco American Value Fund.
| 1 | Source: US Bureau of Economic Analysis |
Portfolio manager(s):
Jeffrey Vancavage
The views and opinions expressed in management’s discussion of Fund performance are those of Invesco Advisers, Inc. These views and opinions are subject to change at any time based on factors such as market and economic conditions. These views and opinions may not be relied upon as investment advice or recommendations, or as an offer for a particular security. The information is not a complete analysis of every aspect of any market, country, industry, security or the Fund. Statements of fact are from sources considered reliable, but Invesco Advisers, Inc. makes no representation or warranty as to their
completeness or accuracy. Although historical performance is no guarantee of future results, these insights may help you understand our investment management philosophy.
See important Fund and, if applicable, index disclosures later in this report.
3 Invesco American Value Fund
Your Fund’s Long-Term Performance
Results of a $10,000 Investment - Oldest Share Class(es)
Fund and index data from 4/30/11
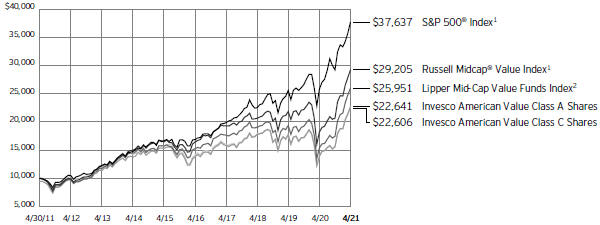
| 1 | Source: RIMES Technologies Corp. |
Past performance cannot guarantee future results.
The data shown in the chart include reinvested distributions, applicable sales charges and Fund expenses including management
fees. Index results include reinvested dividends, but they do not reflect sales charges. Performance of the peer group, if applicable, reflects fund expenses and management fees;
performance of a market index does not. Performance shown in the chart does not reflect deduction of taxes a shareholder would pay on Fund distributions or sale of Fund shares.
4 Invesco American Value Fund
| | | | |
Average Annual Total Returns | |
As of 4/30/21, including maximum applicable sales charges | |
| |
Class A Shares | | | | |
| Inception (10/18/93) | | | 9.22 | % |
| 10 Years | | | 8.51 | |
| 5 Years | | | 9.10 | |
| 1 Year | | | 53.93 | |
| | |
Class C Shares | | | | |
| Inception (10/18/93) | | | 9.20 | % |
| 10 Years | | | 8.50 | |
| 5 Years | | | 9.56 | |
| 1 Year | | | 60.76 | |
| | |
Class R Shares | | | | |
| Inception (3/20/07) | | | 7.25 | % |
| 10 Years | | | 8.86 | |
| 5 Years | | | 10.07 | |
| 1 Year | | | 62.48 | |
| | |
Class Y Shares | | | | |
| Inception (2/7/06) | | | 8.48 | % |
| 10 Years | | | 9.40 | |
| 5 Years | | | 10.62 | |
| 1 Year | | | 63.28 | |
| | |
Class R5 Shares | | | | |
| Inception (6/1/10) | | | 11.35 | % |
| 10 Years | | | 9.54 | |
| 5 Years | | | 10.73 | |
| 1 Year | | | 63.51 | |
| | |
Class R6 Shares | | | | |
| 10 Years | | | 9.54 | % |
| 5 Years | | | 10.80 | |
| 1 Year | | | 63.53 | |
Effective June 1, 2010, Class A, Class C, Class I and Class R shares of the predecessor fund, Van Kampen American Value Fund, advised by Van Kampen Asset Management were reorganized into Class A, Class C, Class Y and Class R shares, respectively, of Invesco Van Kampen American Value Fund (renamed Invesco American Value Fund). Returns shown above, prior to June 1, 2010, for Class A, Class C, Class R and Class Y shares are those for Class A, Class C, Class R and Class I of the predecessor fund. Share class returns will differ from the predecessor fund because of different expenses.
Class R6 shares incepted on September 24, 2012. Performance shown prior to that date is that of the Fund’s Class A shares at net asset value and includes the 12b-1 fees applicable to Class A shares.
The performance data quoted represent past performance and cannot guarantee future results; current performance may be lower or higher. Please visit invesco.com/ performance for the most recent month-end performance. Performance figures reflect reinvested distributions, changes in net asset value and the effect of the maximum sales charge unless otherwise stated. Performance figures do not reflect deduction of taxes a shareholder would pay on Fund distributions or sale of Fund shares.
Investment return and principal value will fluctuate so that you may have a gain or loss when you sell shares.
Class A share performance reflects the maximum 5.50% sales charge, and Class C share performance reflects the applicable contingent deferred sales charge (CDSC) for the period involved. The CDSC on Class C shares is 1% for the first year after purchase. Class R, Class Y, Class R5 and Class R6 shares do not have a front-end sales charge or a CDSC; therefore, performance is at net asset value.
The performance of the Fund’s share classes will differ primarily due to different sales charge structures and class expenses.
Fund performance reflects any applicable fee waivers and/or expense reimbursements. Had the adviser not waived fees and/or reimbursed expenses currently or in the past, returns would have been lower. See current prospectus for more information.
5 Invesco American Value Fund
Supplemental Information
Invesco American Value Fund’s investment objective is long-term capital appreciation.
| ∎ | | Unless otherwise stated, information presented in this report is as of April 30, 2021, and is based on total net assets. |
| ∎ | | Unless otherwise noted, all data is provided by Invesco. |
| ∎ | | To access your Fund’s reports/prospectus, visit invesco.com/fundreports. |
About indexes used in this report
| ∎ | | The S&P 500® Index is an unmanaged index considered representative of the US stock market. |
| ∎ | | The Russell Midcap® Value Index is an unmanaged index considered representative of mid-cap value stocks. The Russell Midcap Value Index is a trademark/service mark of the Frank Russell Co. Russell® is a trademark of the Frank Russell Co. |
| ∎ | | The Lipper Mid-Cap Value Funds Index is an unmanaged index considered representative of mid-cap value funds tracked by Lipper. |
| ∎ | | The Fund is not managed to track the performance of any particular index, including the index(es) described here, and consequently, the performance of the Fund may deviate significantly from the performance of the index(es). |
| ∎ | | A direct investment cannot be made in an index. Unless otherwise indicated, index results include reinvested dividends, and they do not reflect sales charges. Performance of the peer group, if applicable, reflects fund expenses; performance of a market index does not. |
Liquidity Risk Management Program
In compliance with Rule 22e-4 under the Investment Company Act of 1940, as amended (the “Liquidity Rule”), the Fund has adopted and implemented a liquidity risk management program in accordance with the Liquidity Rule (the “Program”). The Program is reasonably designed to assess and manage the Fund’s liquidity risk, which is the risk that the Fund could not meet redemption requests without significant dilution of remaining investors’ interests in the Fund. The Board of Trustees of the Fund (the “Board”) has appointed Invesco Advisers, Inc. (“Invesco”), the Fund’s investment adviser, as the Program’s administrator, and Invesco has delegated oversight of the Program to the Liquidity Risk Management Committee (the “Committee”), which is composed of senior representatives from relevant business groups at Invesco.
As required by the Liquidity Rule, the Program includes policies and procedures providing for an assessment, no less frequently
than annually, of the Fund’s liquidity risk that takes into account, as relevant to the Fund’s liquidity risk: (1) the Fund’s investment strategy and liquidity of portfolio investments during both normal and reasonably foreseeable stressed conditions; (2) short-term and long-term cash flow projections for the Fund during both normal and reasonably foreseeable stressed conditions; and (3) the Fund’s holdings of cash and cash equivalents and any borrowing arrangements. The Liquidity Rule also requires the classification of the Fund’s investments into categories that reflect the assessment of their relative liquidity under current market conditions. The Fund classifies its investments into one of four categories defined in the Liquidity Rule: “Highly Liquid,” “Moderately Liquid,” “Less Liquid,” and “Illiquid.” Funds that are not invested primarily in “Highly Liquid Investments” that are assets (cash or investments that are reasonably expected to be convertible into cash within three business days without significantly changing the market value of the investment) are required to establish a “Highly Liquid Investment Minimum” (“HLIM”), which is the minimum percentage of net assets that must be invested in Highly Liquid Investments. Funds with HLIMs have procedures for addressing HLIM shortfalls, including reporting to the Board and the SEC (on a non-public basis) as required by the Program and the Liquidity Rule. In addition, the Fund may not acquire an investment if, immediately after the acquisition, over 15% of the Fund’s net assets would consist of “Illiquid Investments” that are assets (an investment that cannot reasonably be expected to be sold or disposed of in current market conditions in seven calendar days or less without the sale or disposition significantly changing the market value of the investment). The Liquidity Rule and the Program also require reporting to the Board and the SEC (on a non-public basis) if a Fund’s holdings of Illiquid Investments exceed 15% of the Fund’s assets.
At a meeting held on March 22-24, 2021, the Committee presented a report to the Board that addressed the operation of the Program and assessed the Program’s adequacy and effectiveness of implementation
(the “Report”). The Report covered the period from January 1, 2020 through December 31, 2020 (the “Program Reporting Period”). The Report discussed notable events affecting liquidity over the Program Reporting Period, including the impact of the coronavirus pandemic on the Fund and the overall market. The Report noted that there were no material changes to the Program during the Program Reporting Period.
The Report stated, in relevant part, that during the Program Reporting Period:
| ∎ | | The Program, as adopted and implemented, remained reasonably designed to assess and manage the Fund’s liquidity risk and was operated effectively to achieve that goal; |
| ∎ | | The Fund’s investment strategy remained appropriate for an open-end fund; |
| ∎ | | The Fund was able to meet requests for redemption without significant dilution of remaining investors’ interests in the Fund; |
| ∎ | | The Fund did not breach the 15% limit on Illiquid Investments; and |
| ∎ | | The Fund primarily held Highly Liquid Investments and therefore has not adopted an HLIM. |
|
This report must be accompanied or preceded by a currently effective Fund prospectus, which contains more complete information, including sales charges and expenses. Investors should read it carefully before investing. |
|
| NOT FDIC INSURED | MAY LOSE VALUE | NO BANK GUARANTEE |
6 Invesco American Value Fund
Fund Information
Portfolio Composition
| | |
| By sector | | % of total net assets |
| |
Financials | | 22.08% |
Industrials | | 19.47 |
Consumer Discretionary | | 12.71 |
Health Care | | 7.89 |
Materials | | 6.09 |
Information Technology | | 6.05 |
Real Estate | | 5.86 |
Utilities | | 5.46 |
Energy | | 4.80 |
Consumer Staples | | 4.53 |
Communication Services | | 2.93 |
Money Market Funds Plus Other Assets Less Liabilities | | 2.13 |
Top 10 Equity Holdings*
| | | | | | |
| | | | | | % of total net assets |
| | |
| | 1. | | | Athene Holding Ltd., Class A | | 3.27% |
| | 2. | | | Ally Financial, Inc. | | 3.09 |
| | 3. | | | Voya Financial, Inc. | | 2.94 |
| | 4. | | | Vertiv Holdings Co. | | 2.80 |
| | 5. | | | Arthur J. Gallagher & Co. | | 2.73 |
| | 6. | | | Science Applications International Corp. | | 2.60 |
| | 7. | | | Devon Energy Corp. | | 2.48 |
| | 8. | | | Johnson Controls International PLC | | 2.45 |
| | 9. | | | LKQ Corp. | | 2.45 |
| | 10. | | | Oshkosh Corp. | | 2.41 |
The Fund’s holdings are subject to change, and there is no assurance that
the Fund will continue to hold any particular security.
| * | Excluding money market fund holdings, if any. |
Data presented here are as of April 30, 2021.
7 Invesco American Value Fund
Schedule of Investments(a)
April 30, 2021
| | | | | | | | |
| | | Shares | | | Value | |
Common Stocks & Other Equity Interests–97.87% | |
Agricultural & Farm Machinery–1.92% | |
AGCO Corp. | | | 261,449 | | | $ | 38,150,638 | |
| | |
Airlines–1.40% | | | | | | | | |
Frontier Group Holdings, Inc.(b) | | | 1,317,203 | | | | 27,713,951 | |
|
Apparel, Accessories & Luxury Goods–3.91% | |
Ralph Lauren Corp.(b) | | | 261,056 | | | | 34,796,154 | |
Tapestry, Inc.(b) | | | 894,310 | | | | 42,792,734 | |
| | | | | | | | 77,588,888 | |
| | |
Auto Parts & Equipment–1.94% | | | | | | | | |
Lear Corp. | | | 209,539 | | | | 38,521,650 | |
| | |
Broadcasting–2.93% | | | | | | | | |
Discovery, Inc., Class A(b) | | | 947,184 | | | | 35,670,949 | |
Nexstar Media Group, Inc., Class A | | | 152,309 | | | | 22,451,870 | |
| | | | | | | | 58,122,819 | |
| | |
Building Products–2.45% | | | | | | | | |
Johnson Controls International PLC | | | 781,902 | | | | 48,743,771 | |
| |
Communications Equipment–2.19% | | | | | |
Ciena Corp.(b) | | | 863,550 | | | | 43,583,368 | |
|
Construction Machinery & Heavy Trucks–2.41% | |
Oshkosh Corp. | | | 384,561 | | | | 47,850,925 | |
| | |
Consumer Finance–3.09% | | | | | | | | |
Ally Financial, Inc. | | | 1,190,996 | | | | 61,276,744 | |
| | |
Copper–1.40% | | | | | | | | |
Freeport-McMoRan, Inc. | | | 739,198 | | | | 27,875,157 | |
|
Data Processing & Outsourced Services–1.90% | |
Sabre Corp. | | | 2,518,914 | | | | 37,733,332 | |
| | |
Distributors–2.45% | | | | | | | | |
LKQ Corp.(b) | | | 1,042,850 | | | | 48,711,523 | |
| | |
Diversified Chemicals–2.33% | | | | | | | | |
Eastman Chemical Co. | | | 400,831 | | | | 46,251,889 | |
| | |
Electric Utilities–5.46% | | | | | | | | |
Entergy Corp. | | | 349,256 | | | | 38,170,188 | |
Evergy, Inc. | | | 564,652 | | | | 36,120,789 | |
Exelon Corp. | | | 759,902 | | | | 34,149,996 | |
| | | | | | | | 108,440,973 | |
|
Electrical Components & Equipment–2.80% | |
Vertiv Holdings Co. | | | 2,453,277 | | | | 55,689,388 | |
| |
Electronic Equipment & Instruments–1.96% | | | | | |
Vontier Corp.(b) | | | 1,240,977 | | | | 38,892,219 | |
| | |
Food Distributors–1.97% | | | | | | | | |
Performance Food Group Co.(b) | | | 666,109 | | | | 39,100,598 | |
| | |
Food Retail–1.48% | | | | | | | | |
Casey’s General Stores, Inc. | | | 132,498 | | | | 29,439,731 | |
| | | | | | | | |
| | | Shares | | | Value | |
General Merchandise Stores–2.01% | | | | | |
Dollar Tree, Inc.(b) | | | 348,148 | | | $ | 40,002,205 | |
| | |
Health Care Distributors–1.39% | | | | | | | | |
Henry Schein, Inc.(b) | | | 380,251 | | | | 27,568,198 | |
| | |
Health Care Facilities–2.04% | | | | | | | | |
Encompass Health Corp. | | | 476,931 | | | | 40,472,365 | |
| | |
Health Care Technology–2.68% | | | | | | | | |
Cerner Corp. | | | 319,430 | | | | 23,973,221 | |
Inovalon Holdings, Inc., Class A(b) | | | 966,822 | | | | 29,207,693 | |
| | | | | | | | 53,180,914 | |
| |
Hotels, Resorts & Cruise Lines–2.40% | | | | | |
Wyndham Hotels & Resorts, Inc. | | | 650,742 | | | | 47,575,748 | |
| | |
Industrial Machinery–1.55% | | | | | | | | |
Kennametal, Inc. | | | 768,168 | | | | 30,849,627 | |
| | |
Industrial REITs–2.11% | | | | | | | | |
First Industrial Realty Trust, Inc. | | | 842,014 | | | | 41,907,037 | |
| | |
Insurance Brokers–2.73% | | | | | | | | |
Arthur J. Gallagher & Co. | | | 374,516 | | | | 54,286,094 | |
| |
Investment Banking & Brokerage–1.75% | | | | | |
Stifel Financial Corp. | | | 501,066 | | | | 34,668,757 | |
| | |
Life & Health Insurance–3.27% | | | | | | | | |
Athene Holding Ltd., Class A(b) | | | 1,089,988 | | | | 65,039,584 | |
| | |
Managed Health Care–1.79% | | | | | | | | |
Centene Corp.(b) | | | 575,353 | | | | 35,522,294 | |
| | |
Marine–2.20% | | | | | | | | |
Kirby Corp.(b) | | | 687,126 | | | | 43,769,926 | |
| |
Oil & Gas Exploration & Production–4.80% | | | | | |
Devon Energy Corp. | | | 2,108,659 | | | | 49,300,448 | |
Pioneer Natural Resources Co. | | | 299,627 | | | | 46,091,621 | |
| | | | | | | | 95,392,069 | |
| |
Other Diversified Financial Services–2.94% | | | | | |
Voya Financial, Inc. | | | 860,820 | | | | 58,380,812 | |
| | |
Regional Banks–8.30% | | | | | | | | |
KeyCorp | | | 2,015,188 | | | | 43,850,491 | |
TCF Financial Corp.(b) | | | 927,345 | | | | 42,212,744 | |
Wintrust Financial Corp. | | | 519,022 | | | | 40,016,596 | |
Zions Bancorporation N.A. | | | 696,655 | | | | 38,873,349 | |
| | | | | | | | 164,953,180 | |
| |
Research & Consulting Services–2.60% | | | | | |
Science Applications International Corp. | | | 576,929 | | | | 51,588,991 | |
| | |
Residential REITs–3.75% | | | | | | | | |
American Homes 4 Rent, Class A | | | 982,899 | | | | 36,406,579 | |
UDR, Inc. | | | 820,796 | | | | 38,125,974 | |
| | | | | | | | 74,532,553 | |
See accompanying Notes to Financial Statements which are an integral part of the financial statements.
8 Invesco American Value Fund
| | | | | | | | |
| | | Shares | | | Value | |
Soft Drinks–1.08% | |
Coca-Cola European Partners PLC
(United Kingdom) | | | 378,582 | | | $ | 21,511,029 | |
|
Specialty Chemicals–2.36% | |
W.R. Grace & Co. | | | 683,057 | | | | 46,946,508 | |
|
Trucking–2.13% | |
Knight-Swift Transportation Holdings, Inc. | | | 898,123 | | | | 42,319,556 | |
Total Common Stocks & Other Equity Interests
(Cost $1,330,447,257) | | | | 1,944,155,011 | |
|
Money Market Funds–2.29% | |
Invesco Government & Agency Portfolio, Institutional Class,
0.03%(c)(d) | | | 14,156,744 | | | | 14,156,744 | |
| | | | | | | | |
| | | Shares | | | Value | |
Money Market Funds–(continued) | | | | | |
Invesco Liquid Assets Portfolio, Institutional Class, 0.01%(c)(d) | | | 15,087,204 | | | $ | 15,093,238 | |
Invesco Treasury Portfolio, Institutional Class, 0.01%(c)(d) | | | 16,179,136 | | | | 16,179,136 | |
Total Money Market Funds (Cost $45,425,927) | | | | 45,429,118 | |
TOTAL INVESTMENTS IN SECURITIES–100.16%
(Cost $1,375,873,184) | | | | 1,989,584,129 | |
OTHER ASSETS LESS LIABILITIES—(0.16)% | | | | (3,151,756 | ) |
NET ASSETS–100.00% | | | $ | 1,986,432,373 | |
Investment Abbreviations:
REIT – Real Estate Investment Trust
Notes to Schedule of Investments:
| (a) | Industry and/or sector classifications used in this report are generally according to the Global Industry Classification Standard, which was developed by and is the exclusive property and a service mark of MSCI Inc. and Standard & Poor’s. |
| (b) | Non-income producing security. |
| (c) | Affiliated issuer. The issuer and/or the Fund is a wholly-owned subsidiary of Invesco Ltd., or is affiliated by having an investment adviser that is under common control of Invesco Ltd. The table below shows the Fund’s transactions in, and earnings from, its investments in affiliates for the fiscal year ended April 30, 2021. |
| | | | | | | | | | | | | | | | | | | | | | | | | | | | | | | | | | | |
| | | Value April 30, 2020 | | Purchases at Cost | | Proceeds from Sales | | Change in
Unrealized
Appreciation
(Depreciation) | | Realized
Gain | | Value April 30, 2021 | | Dividend Income |
Investments in Affiliated Money Market Funds: | | | | | | | | | | | | | | | | | | | | | | | | | | | | | | | | | | | |
Invesco Government & Agency Portfolio, Institutional Class | | | $ | 9,614,409 | | | | $ | 130,290,506 | | | | $ | (125,748,171) | | | | $ | - | | | | $ | - | | | | $ | 14,156,744 | | | | $ | 1,179 | |
Invesco Liquid Assets Portfolio, Institutional Class | | | | 13,510,814 | | | | | 93,064,647 | | | | | (91,479,392) | | | | | (4,406) | | | | | 1,575 | | | | | 15,093,238 | | | | | 20,002 | |
Invesco Treasury Portfolio, Institutional Class | | | | 10,987,896 | | | | | 148,903,436 | | | | | (143,712,196) | | | | | - | | | | | - | | | | | 16,179,136 | | | | | 3,821 | |
Investments Purchased with Cash Collateral from Securities on Loan: | | | | | | | | | | | | | | | | | | | | | | | | | | | | | | | | | | | |
Invesco Private Government Fund | | | | 2,982,315 | | | | | 40,437,849 | | | | | (43,420,164) | | | | | - | | | | | - | | | | | - | | | | | 1,042* | |
Invesco Private Prime Fund | | | | - | | | | | 8,584,439 | | | | | (8,584,933) | | | | | - | | | | | 494 | | | | | - | | | | | 549* | |
Total | | | $ | 37,095,434 | | | | $ | 421,280,877 | | | | $ | (412,944,856) | | | | $ | (4,406) | | | | $ | 2,069 | | | | $ | 45,429,118 | | | | $ | 26,593 | |
| | * | Represents the income earned on the investment of cash collateral, which is included in securities lending income on the Statement of Operations. Does not include rebates and fees paid to lending agent or premiums received from borrowers, if any. |
| (d) | The rate shown is the 7-day SEC standardized yield as of April 30, 2021. |
See accompanying Notes to Financial Statements which are an integral part of the financial statements.
9 Invesco American Value Fund
Statement of Assets and Liabilities
April 30, 2021
| | | | |
Assets: | | | | |
Investments in securities, at value
(Cost $1,330,447,257) | | $ | 1,944,155,011 | |
| |
Investments in affiliated money market funds, at value
(Cost $45,425,927) | | | 45,429,118 | |
| |
Receivable for: | | | | |
Fund shares sold | | | 606,117 | |
| |
Dividends | | | 327,735 | |
| |
Investment for trustee deferred compensation and retirement plans | | | 349,138 | |
| |
Other assets | | | 66,252 | |
| |
Total assets | | | 1,990,933,371 | |
| |
| |
Liabilities: | | | | |
Payable for: | | | | |
Fund shares reacquired | | | 1,360,904 | |
| |
Amount due custodian | | | 1,039,556 | |
| |
Accrued fees to affiliates | | | 1,258,784 | |
| |
Accrued other operating expenses | | | 370,932 | |
| |
Trustee deferred compensation and retirement plans | | | 470,822 | |
| |
Total liabilities | | | 4,500,998 | |
| |
Net assets applicable to shares outstanding | | $ | 1,986,432,373 | |
| |
| |
Net assets consist of: | | | | |
Shares of beneficial interest | | $ | 1,368,081,075 | |
| |
Distributable earnings | | | 618,351,298 | |
| |
| | $ | 1,986,432,373 | |
| |
| | | | |
Net Assets: | | | | |
Class A | | $ | 1,630,249,990 | |
| |
Class C | | $ | 64,246,422 | |
| |
Class R | | $ | 66,822,195 | |
| |
Class Y | | $ | 148,860,962 | |
| |
Class R5 | | $ | 12,304,097 | |
| |
Class R6 | | $ | 63,948,707 | |
| |
|
Shares outstanding, no par value, with an unlimited number of shares authorized: | |
Class A | | | 38,852,490 | |
| |
Class C | | | 1,958,327 | |
| |
Class R | | | 1,607,077 | |
| |
Class Y | | | 3,515,550 | |
| |
Class R5 | | | 290,234 | |
| |
Class R6 | | | 1,508,860 | |
| |
Class A: | | | | |
Net asset value per share | | $ | 41.96 | |
| |
Maximum offering price per share
(Net asset value of $41.96 ÷ 94.50%) | | $ | 44.40 | |
| |
Class C: | | | | |
Net asset value and offering price per share | | $ | 32.81 | |
| |
Class R: | | | | |
Net asset value and offering price per share | | $ | 41.58 | |
| |
Class Y: | | | | |
Net asset value and offering price per share | | $ | 42.34 | |
| |
Class R5: | | | | |
Net asset value and offering price per share | | $ | 42.39 | |
| |
Class R6: | | | | |
Net asset value and offering price per share | | $ | 42.38 | |
| |
See accompanying Notes to Financial Statements which are an integral part of the financial statements.
10 Invesco American Value Fund
Statement of Operations
For the year ended April 30, 2021
| | | | |
Investment income: | | | | |
Dividends | | $ | 23,693,335 | |
| |
Dividends from affiliated money market funds (includes securities lending income of $10,136) | | | 35,138 | |
| |
Total investment income | | | 23,728,473 | |
| |
| |
Expenses: | | | | |
Advisory fees | | | 11,250,228 | |
| |
Administrative services fees | | | 225,459 | |
| |
Custodian fees | | | 20,173 | |
| |
Distribution fees: | | | | |
| |
Class A | | | 3,360,539 | |
| |
Class C | | | 630,217 | |
| |
Class R | | | 284,537 | |
| |
Transfer agent fees – A, C, R and Y | | | 3,628,400 | |
| |
Transfer agent fees – R5 | | | 9,389 | |
| |
Transfer agent fees – R6 | | | 23,672 | |
| |
Trustees’ and officers’ fees and benefits | | | 36,605 | |
| |
Registration and filing fees | | | 99,328 | |
| |
Reports to shareholders | | | 229,859 | |
| |
Professional services fees | | | 54,004 | |
| |
Other | | | 43,859 | |
| |
Total expenses | | | 19,896,269 | |
| |
Less: Fees waived, expenses reimbursed and/or expense offset arrangement(s) | | | (330,121 | ) |
| |
Net expenses | | | 19,566,148 | |
| |
Net investment income | | | 4,162,325 | |
| |
| |
Realized and unrealized gain (loss) from: | | | | |
Net realized gain from: | | | | |
Unaffiliated investment securities | | | 153,763,739 | |
| |
Affiliated investment securities | | | 2,069 | |
| |
| | | 153,765,808 | |
| |
Change in net unrealized appreciation (depreciation) of: | | | | |
Unaffiliated investment securities | | | 681,077,632 | |
| |
Affiliated investment securities | | | (4,406 | ) |
| |
| | | 681,073,226 | |
| |
Net realized and unrealized gain | | | 834,839,034 | |
| |
Net increase in net assets resulting from operations | | $ | 839,001,359 | |
| |
See accompanying Notes to Financial Statements which are an integral part of the financial statements.
11 Invesco American Value Fund
Statement of Changes in Net Assets
For the years ended April 30, 2021 and 2020
| | | | | | | | |
| | | 2021 | | | 2020 | |
Operations: | | | | | | | | |
Net investment income | | | $ 4,162,325 | | | | $ 5,812,647 | |
| |
Net realized gain (loss) | | | 153,765,808 | | | | (82,387,814 | ) |
| |
Change in net unrealized appreciation (depreciation) | | | 681,073,226 | | | | (117,274,283 | ) |
| |
Net increase (decrease) in net assets resulting from operations | | | 839,001,359 | | | | (193,849,450 | ) |
| |
| | |
Distributions to shareholders from distributable earnings: | | | | | | | | |
Class A | | | (4,146,689 | ) | | | (24,288,764 | ) |
| |
Class C | | | (94,111 | ) | | | (870,901 | ) |
| |
Class R | | | (135,567 | ) | | | (518,214 | ) |
| |
Class Y | | | (746,364 | ) | | | (4,491,736 | ) |
| |
Class R5 | | | (54,752 | ) | | | (564,068 | ) |
| |
Class R6 | | | (294,940 | ) | | | (2,218,029 | ) |
| |
Total distributions from distributable earnings | | | (5,472,423 | ) | | | (32,951,712 | ) |
| |
| | |
Share transactions–net: | | | | | | | | |
Class A | | | (198,498,005 | ) | | | 468,527,083 | |
| |
Class C | | | (34,173,796 | ) | | | 41,755,082 | |
| |
Class R | | | (12,237,225 | ) | | | 34,074,724 | |
| |
Class Y | | | (85,999,650 | ) | | | 27,656,769 | |
| |
Class R5 | | | (4,378,364 | ) | | | (12,488,212 | ) |
| |
Class R6 | | | (14,224,750 | ) | | | (2,609,087 | ) |
| |
Net increase (decrease) in net assets resulting from share transactions | | | (349,511,790 | ) | | | 556,916,359 | |
| |
Net increase in net assets | | | 484,017,146 | | | | 330,115,197 | |
| |
| | |
Net assets: | | | | | | | | |
Beginning of year | | | 1,502,415,227 | | | | 1,172,300,030 | |
| |
End of year | | | $1,986,432,373 | | | | $1,502,415,227 | |
| |
See accompanying Notes to Financial Statements which are an integral part of the financial statements.
12 Invesco American Value Fund
Financial Highlights
The following schedule presents financial highlights for a share of the Fund outstanding throughout the periods indicated.
| | | | | | | | | | | | | | | | | | | | | | | | | | | | | | | | | | | | | | | | | | | | | | | | | | | | | | | | | | | | | | | | | | | | | | |
| | | Net asset
value,
beginning
of period | | Net investment income (loss)(a) | | Net gains (losses) on securities (both realized and unrealized) | | Total from
investment operations | | Dividends from net investment income | | Distributions
from net
realized
gains | | Total
distributions | | Net asset
value, end
of period | | Total
return (b) | | Net assets,
end of period
(000’s omitted) | | Ratio of expenses to average net assets with fee waivers and/or expenses absorbed | | Ratio of expenses to average net assets without fee waivers and/or expenses absorbed | | Ratio of net investment income (loss) to average net assets | | Portfolio turnover (c) |
Class A | | | | | | | | | | | | | | | | | | | | | | | | | | | | | | | | | | | | | | | | | | | | | | | | | | | | | | | | | | | | | | | | | | | | | | |
Year ended 04/30/21 | | | $ | 25.84 | | | | $ | 0.08 | | | | $ | 16.14 | | | | $ | 16.22 | | | | $ | (0.10 | ) | | | $ | – | | | | $ | (0.10 | ) | | | $ | 41.96 | | | | | 62.87 | % | | | $ | 1,630,250 | | | | | 1.16 | %(d) | | | | 1.18 | %(d) | | | | 0.24 | %(d) | | | | 58 | % |
Year ended 04/30/20 | | | | 34.02 | | | | | 0.17 | | | | | (7.29 | ) | | | | (7.12 | ) | | | | – | | | | | (1.06 | ) | | | | (1.06 | ) | | | | 25.84 | | | | | (21.65 | ) | | | | 1,167,164 | | | | | 1.21 | | | | | 1.21 | | | | | 0.53 | | | | | 38 | |
Year ended 04/30/19 | | | | 38.47 | | | | | 0.13 | | | | | (0.69 | ) | | | | (0.56 | ) | | | | (0.14 | ) | | | | (3.75 | ) | | | | (3.89 | ) | | | | 34.02 | | | | | (0.03 | ) | | | | 871,220 | | | | | 1.19 | | | | | 1.19 | | | | | 0.37 | | | | | 38 | |
Year ended 04/30/18 | | | | 38.52 | | | | | 0.07 | | | | | 4.37 | | | | | 4.44 | | | | | (0.24 | ) | | | | (4.25 | ) | | | | (4.49 | ) | | | | 38.47 | | | | | 12.11 | | | | | 938,346 | | | | | 1.19 | | | | | 1.19 | | | | | 0.19 | | | | | 44 | |
Year ended 04/30/17 | | | | 34.01 | | | | | 0.20 | | | | | 4.70 | | | | | 4.90 | | | | | (0.08 | ) | | | | (0.31 | ) | | | | (0.39 | ) | | | | 38.52 | | | | | 14.40 | | | | | 1,031,600 | | | | | 1.21 | | | | | 1.21 | | | | | 0.53 | | | | | 42 | |
Class C | | | | | | | | | | | | | | | | | | | | | | | | | | | | | | | | | | | | | | | | | | | | | | | | | | | | | | | | | | | | | | | | | | | | | | |
Year ended 04/30/21 | | | | 20.31 | | | | | (0.11 | ) | | | | 12.65 | | | | | 12.54 | | | | | (0.04 | ) | | | | – | | | | | (0.04 | ) | | | | 32.81 | | | | | 61.76 | (e) | | | | 64,246 | | | | | 1.86 | (d)(e) | | | | 1.89 | (d)(e) | | | | (0.46 | )(d)(e) | | | | 58 | |
Year ended 04/30/20 | | | | 27.15 | | | | | (0.05 | ) | | | | (5.73 | ) | | | | (5.78 | ) | | | | – | | | | | (1.06 | ) | | | | (1.06 | ) | | | | 20.31 | | | | | (22.20 | )(e) | | | | 67,089 | | | | | 1.93 | (e) | | | | 1.93 | (e) | | | | (0.19 | )(e) | | | | 38 | |
Year ended 04/30/19 | | | | 31.66 | | | | | (0.11 | ) | | | | (0.65 | ) | | | | (0.76 | ) | | | | – | | | | | (3.75 | ) | | | | (3.75 | ) | | | | 27.15 | | | | | (0.77 | )(e) | | | | 29,562 | | | | | 1.91 | (e) | | | | 1.91 | (e) | | | | (0.35 | )(e) | | | | 38 | |
Year ended 04/30/18 | | | | 32.44 | | | | | (0.17 | ) | | | | 3.64 | | | | | 3.47 | | | | | – | | | | | (4.25 | ) | | | | (4.25 | ) | | | | 31.66 | | | | | 11.30 | (e) | | | | 82,217 | | | | | 1.92 | (e) | | | | 1.92 | (e) | | | | (0.54 | )(e) | | | | 44 | |
Year ended 04/30/17 | | | | 28.83 | | | | | (0.06 | ) | | | | 3.98 | | | | | 3.92 | | | | | – | | | | | (0.31 | ) | | | | (0.31 | ) | | | | 32.44 | | | | | 13.59 | (e) | | | | 98,096 | | | | | 1.94 | (e) | | | | 1.94 | (e) | | | | (0.20 | )(e) | | | | 42 | |
Class R | | | | | | | | | | | | | | | | | | | | | | | | | | | | | | | | | | | | | | | | | | | | | | | | | | | | | | | | | | | | | | | | | | | | | | |
Year ended 04/30/21 | | | | 25.65 | | | | | 0.00 | | | | | 16.01 | | | | | 16.01 | | | | | (0.08 | ) | | | | – | | | | | (0.08 | ) | | | | 41.58 | | | | | 62.48 | | | | | 66,822 | | | | | 1.40 | (d) | | | | 1.43 | (d) | | | | 0.00 | (d) | | | | 58 | |
Year ended 04/30/20 | | | | 33.86 | | | | | 0.09 | | | | | (7.24 | ) | | | | (7.15 | ) | | | | – | | | | | (1.06 | ) | | | | (1.06 | ) | | | | 25.65 | | | | | (21.84 | ) | | | | 51,330 | | | | | 1.46 | | | | | 1.46 | | | | | 0.28 | | | | | 38 | |
Year ended 04/30/19 | | | | 38.24 | | | | | 0.04 | | | | | (0.67 | ) | | | | (0.63 | ) | | | | – | | | | | (3.75 | ) | | | | (3.75 | ) | | | | 33.86 | | | | | (0.28 | ) | | | | 19,979 | | | | | 1.44 | | | | | 1.44 | | | | | 0.12 | | | | | 38 | |
Year ended 04/30/18 | | | | 38.26 | | | | | (0.02 | ) | | | | 4.33 | | | | | 4.31 | | | | | (0.08 | ) | | | | (4.25 | ) | | | | (4.33 | ) | | | | 38.24 | | | | | 11.81 | | | | | 25,189 | | | | | 1.44 | | | | | 1.44 | | | | | (0.06 | ) | | | | 44 | |
Year ended 04/30/17 | | | | 33.80 | | | | | 0.10 | | | | | 4.67 | | | | | 4.77 | | | | | – | | | | | (0.31 | ) | | | | (0.31 | ) | | | | 38.26 | | | | | 14.11 | | | | | 46,937 | | | | | 1.46 | | | | | 1.46 | | | | | 0.28 | | | | | 42 | |
Class Y | | | | | | | | | | | | | | | | | | | | | | | | | | | | | | | | | | | | | | | | | | | | | | | | | | | | | | | | | | | | | | | | | | | | | | |
Year ended 04/30/21 | | | | 26.04 | | | | | 0.16 | | | | | 16.29 | | | | | 16.45 | | | | | (0.15 | ) | | | | – | | | | | (0.15 | ) | | | | 42.34 | | | | | 63.28 | | | | | 148,861 | | | | | 0.91 | (d) | | | | 0.93 | (d) | | | | 0.49 | (d) | | | | 58 | |
Year ended 04/30/20 | | | | 34.28 | | | | | 0.25 | | | | | (7.34 | ) | | | | (7.09 | ) | | | | (0.09 | ) | | | | (1.06 | ) | | | | (1.15 | ) | | | | 26.04 | | | | | (21.46 | ) | | | | 154,826 | | | | | 0.96 | | | | | 0.96 | | | | | 0.78 | | | | | 38 | |
Year ended 04/30/19 | | | | 38.76 | | | | | 0.23 | | | | | (0.71 | ) | | | | (0.48 | ) | | | | (0.25 | ) | | | | (3.75 | ) | | | | (4.00 | ) | | | | 34.28 | | | | | 0.21 | | | | | 155,238 | | | | | 0.94 | | | | | 0.94 | | | | | 0.62 | | | | | 38 | |
Year ended 04/30/18 | | | | 38.80 | | | | | 0.17 | | | | | 4.40 | | | | | 4.57 | | | | | (0.36 | ) | | | | (4.25 | ) | | | | (4.61 | ) | | | | 38.76 | | | | | 12.38 | | | | | 208,223 | | | | | 0.94 | | | | | 0.94 | | | | | 0.44 | | | | | 44 | |
Year ended 04/30/17 | | | | 34.25 | | | | | 0.29 | | | | | 4.73 | | | | | 5.02 | | | | | (0.16 | ) | | | | (0.31 | ) | | | | (0.47 | ) | | | | 38.80 | | | | | 14.66 | | | | | 375,626 | | | | | 0.96 | | | | | 0.96 | | | | | 0.78 | | | | | 42 | |
Class R5 | | | | | | | | | | | | | | | | | | | | | | | | | | | | | | | | | | | | | | | | | | | | | | | | | | | | | | | | | | | | | | | | | | | | | | |
Year ended 04/30/21 | | | | 26.06 | | | | | 0.20 | | | | | 16.30 | | | | | 16.50 | | | | | (0.17 | ) | | | | – | | | | | (0.17 | ) | | | | 42.39 | | | | | 63.44 | | | | | 12,304 | | | | | 0.79 | (d) | | | | 0.79 | (d) | | | | 0.61 | (d) | | | | 58 | |
Year ended 04/30/20 | | | | 34.30 | | | | | 0.28 | | | | | (7.33 | ) | | | | (7.05 | ) | | | | (0.13 | ) | | | | (1.06 | ) | | | | (1.19 | ) | | | | 26.06 | | | | | (21.36 | ) | | | | 10,999 | | | | | 0.86 | | | | | 0.86 | | | | | 0.88 | | | | | 38 | |
Year ended 04/30/19 | | | | 38.80 | | | | | 0.26 | | | | | (0.73 | ) | | | | (0.47 | ) | | | | (0.28 | ) | | | | (3.75 | ) | | | | (4.03 | ) | | | | 34.30 | | | | | 0.27 | | | | | 27,732 | | | | | 0.86 | | | | | 0.86 | | | | | 0.70 | | | | | 38 | |
Year ended 04/30/18 | | | | 38.84 | | | | | 0.20 | | | | | 4.43 | | | | | 4.63 | | | | | (0.42 | ) | | | | (4.25 | ) | | | | (4.67 | ) | | | | 38.80 | | | | | 12.53 | | | | | 62,354 | | | | | 0.86 | | | | | 0.86 | | | | | 0.52 | | | | | 44 | |
Year ended 04/30/17 | | | | 34.29 | | | | | 0.33 | | | | | 4.74 | | | | | 5.07 | | | | | (0.21 | ) | | | | (0.31 | ) | | | | (0.52 | ) | | | | 38.84 | | | | | 14.77 | | | | | 86,569 | | | | | 0.85 | | | | | 0.85 | | | | | 0.89 | | | | | 42 | |
Class R6 | | | | | | | | | | | | | | | | | | | | | | | | | | | | | | | | | | | | | | | | | | | | | | | | | | | | | | | | | | | | | | | | | | | | | | |
Year ended 04/30/21 | | | | 26.05 | | | | | 0.21 | | | | | 16.30 | | | | | 16.51 | | | | | (0.18 | ) | | | | – | | | | | (0.18 | ) | | | | 42.38 | | | | | 63.53 | | | | | 63,949 | | | | | 0.75 | (d) | | | | 0.75 | (d) | | | | 0.65 | (d) | | | | 58 | |
Year ended 04/30/20 | | | | 34.31 | | | | | 0.30 | | | | | (7.34 | ) | | | | (7.04 | ) | | | | (0.16 | ) | | | | (1.06 | ) | | | | (1.22 | ) | | | | 26.05 | | | | | (21.32 | ) | | | | 51,007 | | | | | 0.79 | | | | | 0.79 | | | | | 0.95 | | | | | 38 | |
Year ended 04/30/19 | | | | 38.82 | | | | | 0.29 | | | | | (0.73 | ) | | | | (0.44 | ) | | | | (0.32 | ) | | | | (3.75 | ) | | | | (4.07 | ) | | | | 34.31 | | | | | 0.37 | | | | | 68,568 | | | | | 0.78 | | | | | 0.78 | | | | | 0.78 | | | | | 38 | |
Year ended 04/30/18 | | | | 38.88 | | | | | 0.24 | | | | | 4.42 | | | | | 4.66 | | | | | (0.47 | ) | | | | (4.25 | ) | | | | (4.72 | ) | | | | 38.82 | | | | | 12.59 | | | | | 140,889 | | | | | 0.77 | | | | | 0.77 | | | | | 0.61 | | | | | 44 | |
Year ended 04/30/17 | | | | 34.32 | | | | | 0.37 | | | | | 4.74 | | | | | 5.11 | | | | | (0.24 | ) | | | | (0.31 | ) | | | | (0.55 | ) | | | | 38.88 | | | | | 14.88 | | | | | 165,781 | | | | | 0.76 | | | | | 0.76 | | | | | 0.98 | | | | | 42 | |
| (a) | Calculated using average shares outstanding. |
| (b) | Includes adjustments in accordance with accounting principles generally accepted in the United States of America and as such, the net asset value for financial reporting purposes and the returns based upon those net asset values may differ from the net asset value and returns for shareholder transactions. Does not include sales charges and is not annualized for periods less than one year, if applicable. |
| (c) | Portfolio turnover is calculated at the fund level and is not annualized for periods less than one year, if applicable. For the year ended April 30, 2020, the portfolio turnover calculation excludes the value of securities purchased of $846,125,268 in connection with the acquisition of Invesco Oppenheimer Mid Cap Value Fund into the Fund. |
| (d) | Ratios are based on average daily net assets (000’s omitted) of $1,344,215, $65,937, $56,907, $162,625, $11,574 and $55,362 for Class A, Class C, Class R, Class Y, Class R5 and Class R6 shares, respectively. |
| (e) | The total return, ratio of expenses to average net assets and ratio of net investment income (loss) to average net assets reflect actual 12b-1 fees of 0.96%, 0.97%, 0.97%, 0.97%, and 0.97% for the years ended April 30, 2021, 2020, 2019, 2018 and 2017, respectively. |
See accompanying Notes to Financial Statements which are an integral part of the financial statements.
13 Invesco American Value Fund
Notes to Financial Statements
April 30, 2021
NOTE 1–Significant Accounting Policies
Invesco American Value Fund (the “Fund”) is a series portfolio of AIM Sector Funds (Invesco Sector Funds) (the “Trust”). The Trust is a Delaware statutory trust registered under the Investment Company Act of 1940, as amended (the “1940 Act”), as an open-end series management investment company authorized to issue an unlimited number of shares of beneficial interest. Information presented in these financial statements pertains only to the Fund. Matters affecting the Fund or each class will be voted on exclusively by the shareholders of the Fund or each class.
The Fund’s investment objective is long-term capital appreciation. Prior to October 28, 2019, the Fund’s investment objective was total return through growth of capital and current income.
The Fund currently consists of six different classes of shares: Class A, Class C, Class R, Class Y, Class R5 and Class R6. Class Y shares are available only to certain investors. Class A shares are sold with a front-end sales charge unless certain waiver criteria are met. Under certain circumstances, load waived shares may be subject to contingent deferred sales charges (“CDSC”). Class C shares are sold with a CDSC. Class R, Class Y, Class R5 and Class R6 shares are sold at net asset value. Class C shares held for ten years after purchase are eligible for automatic conversion into Class A shares of the same Fund (the “Conversion Feature”). The automatic conversion pursuant to the Conversion Feature will generally occur at the end of the month following the tenth anniversary after a purchase of Class C shares. Effective November 30, 2020, the automatic conversion pursuant to the Conversion Feature changed from ten years to eight years. The first conversion of Class C shares to Class A shares occurred at the end of December 2020 for all Class C shares that were held for more than eight years as of November 30, 2020.
The Fund is an investment company and accordingly follows the investment company accounting and reporting guidance in accordance with Financial Accounting Standards Board Accounting Standards Codification Topic 946, Financial Services – Investment Companies.
The following is a summary of the significant accounting policies followed by the Fund in the preparation of its financial statements.
| A. | Security Valuations – Securities, including restricted securities, are valued according to the following policy. |
A security listed or traded on an exchange (except convertible securities) is valued at its last sales price or official closing price as of the close of the customary trading session on the exchange where the security is principally traded, or lacking any sales or official closing price on a particular day, the security may be valued at the closing bid price on that day. Securities traded in the over-the-counter market are valued based on prices furnished by independent pricing services or market makers. When such securities are valued by an independent pricing service they may be considered fair valued. Futures contracts are valued at the final settlement price set by an exchange on which they are principally traded. Listed options are valued at the mean between the last bid and asked prices from the exchange on which they are principally traded. Options not listed on an exchange are valued by an independent source at the mean between the last bid and asked prices. For purposes of determining net asset value (“NAV”) per share, futures and option contracts generally are valued 15 minutes after the close of the customary trading session of the New York Stock Exchange (“NYSE”).
Investments in open-end and closed-end registered investment companies that do not trade on an exchange are valued at the end-of-day net asset value per share. Investments in open-end and closed-end registered investment companies that trade on an exchange are valued at the last sales price or official closing price as of the close of the customary trading session on the exchange where the security is principally traded.
Debt obligations (including convertible securities) and unlisted equities are fair valued using an evaluated quote provided by an independent pricing service. Evaluated quotes provided by the pricing service may be determined without exclusive reliance on quoted prices, and may reflect appropriate factors such as institution-size trading in similar groups of securities, developments related to specific securities, dividend rate (for unlisted equities), yield (for debt obligations), quality, type of issue, coupon rate (for debt obligations), maturity (for debt obligations), individual trading characteristics and other market data. Pricing services generally value debt obligations assuming orderly transactions of institutional round lot size, but a fund may hold or transact in the same securities in smaller, odd lot sizes. Odd lots often trade at lower prices than institutional round lots. Debt obligations are subject to interest rate and credit risks. In addition, all debt obligations involve some risk of default with respect to interest and/or principal payments.
Foreign securities’ (including foreign exchange contracts) prices are converted into U.S. dollar amounts using the applicable exchange rates as of the close of the NYSE. If market quotations are available and reliable for foreign exchange-traded equity securities, the securities will be valued at the market quotations. Because trading hours for certain foreign securities end before the close of the NYSE, closing market quotations may become unreliable. If between the time trading ends on a particular security and the close of the customary trading session on the NYSE, events occur that the investment adviser determines are significant and make the closing price unreliable, the Fund may fair value the security. If the event is likely to have affected the closing price of the security, the security will be valued at fair value in good faith using procedures approved by the Board of Trustees. Adjustments to closing prices to reflect fair value may also be based on a screening process of an independent pricing service to indicate the degree of certainty, based on historical data, that the closing price in the principal market where a foreign security trades is not the current value as of the close of the NYSE. Foreign securities’ prices meeting the approved degree of certainty that the price is not reflective of current value will be priced at the indication of fair value from the independent pricing service. Multiple factors may be considered by the independent pricing service in determining adjustments to reflect fair value and may include information relating to sector indices, American Depositary Receipts and domestic and foreign index futures. Foreign securities may have additional risks including exchange rate changes, potential for sharply devalued currencies and high inflation, political and economic upheaval, the relative lack of issuer information, relatively low market liquidity and the potential lack of strict financial and accounting controls and standards.
Securities for which market prices are not provided by any of the above methods may be valued based upon quotes furnished by independent sources. The last bid price may be used to value equity securities. The mean between the last bid and asked prices is used to value debt obligations, including corporate loans.
Securities for which market quotations are not readily available or became unreliable are valued at fair value as determined in good faith by or under the supervision of the Trust’s officers following procedures approved by the Board of Trustees. Issuer specific events, market trends, bid/asked quotes of brokers and information providers and other market data may be reviewed in the course of making a good faith determination of a security’s fair value.
The Fund may invest in securities that are subject to interest rate risk, meaning the risk that the prices will generally fall as interest rates rise and, conversely, the prices will generally rise as interest rates fall. Specific securities differ in their sensitivity to changes in interest rates depending on their individual characteristics. Changes in interest rates may result in increased market volatility, which may affect the value and/or liquidity of certain Fund investments.
Valuations change in response to many factors including the historical and prospective earnings of the issuer, the value of the issuer’s assets, general market conditions which are not specifically related to the particular issuer, such as real or perceived adverse economic conditions, changes in the general outlook for revenues or corporate earnings, changes in interest or currency rates, regional or global instability, natural or environmental disasters, widespread disease or other public health issues, war, acts of terrorism or adverse investor sentiment generally and market liquidity. Because of the inherent uncertainties of valuation, the values reflected in the financial statements may materially differ from the value received upon actual sale of those investments.
| B. | Securities Transactions and Investment Income – Securities transactions are accounted for on a trade date basis. Realized gains or losses on sales are computed on the basis of specific identification of the securities sold. Interest income (net of withholding tax, if any) is recorded on an accrual basis from |
14 Invesco American Value Fund
| | settlement date and includes coupon interest and amortization of premium and accretion of discount on debt securities as applicable. Dividend income (net of withholding tax, if any) is recorded on the ex-dividend date. |
The Fund may periodically participate in litigation related to Fund investments. As such, the Fund may receive proceeds from litigation settlements. Any proceeds received are included in the Statement of Operations as realized gain (loss) for investments no longer held and as unrealized gain (loss) for investments still held.
Brokerage commissions and mark ups are considered transaction costs and are recorded as an increase to the cost basis of securities purchased and/or a reduction of proceeds on a sale of securities. Such transaction costs are included in the determination of net realized and unrealized gain (loss) from investment securities reported in the Statement of Operations and the Statement of Changes in Net Assets and the net realized and unrealized gains (losses) on securities per share in the Financial Highlights. Transaction costs are included in the calculation of the Fund’s net asset value and, accordingly, they reduce the Fund’s total returns. These transaction costs are not considered operating expenses and are not reflected in net investment income reported in the Statement of Operations and the Statement of Changes in Net Assets, or the net investment income per share and the ratios of expenses and net investment income reported in the Financial Highlights, nor are they limited by any expense limitation arrangements between the Fund and the investment adviser.
The Fund allocates income and realized and unrealized capital gains and losses to a class based on the relative net assets of each class.
The Fund recharacterizes distributions received from REIT investments based on information provided by the REIT into the following categories: ordinary income, long-term and short-term capital gains, and return of capital. If information is not available on a timely basis from the REIT, the recharacterization will be based on available information which may include the previous year’s allocation. If new or additional information becomes available from the REIT at a later date, a recharacterization will be made in the following year. The Fund records as dividend income the amount recharacterized as ordinary income and as realized gain the amount recharacterized as capital gain in the Statement of Operations, and the amount recharacterized as return of capital as a reduction of the cost of the related investment. These recharacterizations are reflected in the accompanying financial statements.
| C. | Country Determination – For the purposes of making investment selection decisions and presentation in the Schedule of Investments, the investment adviser may determine the country in which an issuer is located and/or credit risk exposure based on various factors. These factors include the laws of the country under which the issuer is organized, where the issuer maintains a principal office, the country in which the issuer derives 50% or more of its total revenues and the country that has the primary market for the issuer’s securities, as well as other criteria. Among the other criteria that may be evaluated for making this determination are the country in which the issuer maintains 50% or more of its assets, the type of security, financial guarantees and enhancements, the nature of the collateral and the sponsor organization. Country of issuer and/or credit risk exposure has been determined to be the United States of America, unless otherwise noted. |
| D. | Distributions – Distributions from net investment income and net realized capital gain, if any, are generally declared and paid annually and recorded on the ex-dividend date. The Fund may elect to treat a portion of the proceeds from redemptions as distributions for federal income tax purposes. |
| E. | Federal Income Taxes – The Fund intends to comply with the requirements of Subchapter M of the Internal Revenue Code of 1986, as amended (the “Internal Revenue Code”), necessary to qualify as a regulated investment company and to distribute substantially all of the Fund’s taxable earnings to shareholders. As such, the Fund will not be subject to federal income taxes on otherwise taxable income (including net realized capital gain) that is distributed to shareholders. |
Therefore, no provision for federal income taxes is recorded in the financial statements.
The Fund recognizes the tax benefits of uncertain tax positions only when the position is more likely than not to be sustained. Management has analyzed the Fund’s uncertain tax positions and concluded that no liability for unrecognized tax benefits should be recorded related to uncertain tax positions. Management is not aware of any tax positions for which it is reasonably possible that the total amounts of unrecognized tax benefits will change materially in the next 12 months.
The Fund files tax returns in the U.S. Federal jurisdiction and certain other jurisdictions. Generally, the Fund is subject to examinations by such taxing authorities for up to three years after the filing of the return for the tax period.
| F. | Expenses – Fees provided for under the Rule 12b-1 plan of a particular class of the Fund are charged to the operations of such class. Transfer agency fees and expenses and other shareholder recordkeeping fees and expenses attributable to Class R5 and Class R6 are allocated to each share class based on relative net assets. Sub-accounting fees attributable to Class R5 are charged to the operations of the class. Transfer agency fees and expenses and other shareholder recordkeeping fees and expenses relating to all other classes are allocated among those classes based on relative net assets. All other expenses are allocated among the classes based on relative net assets. |
| G. | Accounting Estimates – The preparation of financial statements in conformity with accounting principles generally accepted in the United States of America (“GAAP”) requires management to make estimates and assumptions that affect the reported amounts of assets and liabilities at the date of the financial statements and the reported amounts of revenues and expenses during the reporting period including estimates and assumptions related to taxation. Actual results could differ from those estimates by a significant amount. In addition, the Fund monitors for material events or transactions that may occur or become known after the period-end date and before the date the financial statements are released to print. |
| H. | Indemnifications – Under the Trust’s organizational documents, each Trustee, officer, employee or other agent of the Trust is indemnified against certain liabilities that may arise out of the performance of their duties to the Fund. Additionally, in the normal course of business, the Fund enters into contracts, including the Fund’s servicing agreements, that contain a variety of indemnification clauses. The Fund’s maximum exposure under these arrangements is unknown as this would involve future claims that may be made against the Fund that have not yet occurred. The risk of material loss as a result of such indemnification claims is considered remote. |
| I. | Securities Lending – The Fund may lend portfolio securities having a market value up to one-third of the Fund’s total assets. Such loans are secured by collateral equal to no less than the market value of the loaned securities determined daily by the securities lending provider. Such collateral will be cash or debt securities issued or guaranteed by the U.S. Government or any of its sponsored agencies. Cash collateral received in connection with these loans is invested in short-term money market instruments or affiliated money market funds and is shown as such on the Schedule of Investments. The Fund bears the risk of loss with respect to the investment of collateral. It is the Fund’s policy to obtain additional collateral from or return excess collateral to the borrower by the end of the next business day, following the valuation date of the securities loaned. Therefore, the value of the collateral held may be temporarily less than the value of the securities on loan. When loaning securities, the Fund retains certain benefits of owning the securities, including the economic equivalent of dividends or interest generated by the security. Lending securities entails a risk of loss to the Fund if, and to the extent that, the market value of the securities loaned were to increase and the borrower did not increase the collateral accordingly, and the borrower failed to return the securities. The securities loaned are subject to termination at the option of the borrower or the Fund. Upon termination, the borrower will return to the Fund the securities loaned and the Fund will return the collateral. Upon the failure of the borrower to return the securities, collateral may be liquidated and the securities may be purchased on the open market to replace the loaned securities. The Fund could experience delays and costs in gaining access to the collateral and the securities may lose value during the delay which could result in potential losses to the Fund. Some of these losses may be indemnified by the lending agent. The Fund bears the risk of any deficiency in the amount of the collateral available for return to the borrower due to any loss on the collateral invested. Dividends received on cash collateral investments for securities lending transactions, which are net of compensation to counterparties, are included in Dividends from affiliated money market funds on the Statement of Operations. The aggregate value of securities out on loan, if any, is shown as a footnote on the Statement of Assets and Liabilities. |
| J. | COVID-19 Risk – The COVID-19 strain of coronavirus has resulted in instances of market closures and dislocations, extreme volatility, liquidity constraints and increased trading costs. Efforts to contain its spread have resulted in travel restrictions, disruptions of healthcare systems, business operations and supply |
15 Invesco American Value Fund
| | chains, layoffs, lower consumer demand, and defaults, among other significant economic impacts that have disrupted global economic activity across many industries. Such economic impacts may exacerbate other pre-existing political, social and economic risks locally or globally. |
The ongoing effects of COVID-19 are unpredictable and may result in significant and prolonged effects on the Fund’s performance.
NOTE 2–Advisory Fees and Other Fees Paid to Affiliates
The Trust has entered into a master investment advisory agreement with Invesco Advisers, Inc. (the “Adviser” or “Invesco”). Under the terms of the investment advisory agreement, the Fund accrues daily and pays monthly an advisory fee to the Adviser based on the annual rate of the Fund’s average daily net assets as follows:
| | | | |
| Average Daily Net Assets | | Rate | |
First $ 500 million | | | 0.720% | |
Next $500 million | | | 0.715% | |
Next $1 billion | | | 0.585% | |
Next $4 billion | | | 0.5625% | |
Over $6 billion | | | 0.5425% | |
For the year ended April 30, 2021, the effective advisory fee rate incurred by the Fund was 0.66%.
Under the terms of a master sub-advisory agreement between the Adviser and each of Invesco Asset Management Deutschland GmbH, Invesco Asset Management Limited, Invesco Asset Management (Japan) Limited, Invesco Hong Kong Limited, Invesco Senior Secured Management, Inc. and Invesco Canada Ltd. (collectively, the “Affiliated Sub-Advisers”) the Adviser, not the Fund, will pay 40% of the fees paid to the Adviser to any such Affiliated Sub-Adviser(s) that provide(s) discretionary investment management services to the Fund based on the percentage of assets allocated to such Affiliated Sub-Adviser(s).
The Adviser has contractually agreed, through May 31, 2021, to waive advisory fees and/or reimburse expenses of all shares to the extent necessary to limit total annual fund operating expenses after fee waiver and/or expense reimbursement (excluding certain items discussed below) of Class A, Class C, Class R, Class Y, Class R5 and Class R6 shares to 1.16%, 1.90%, 1.40%, 0.91%, 0.80% and 0.75%, respectively, of the Fund’s average daily net assets (the “expense limits”). Effective June 1, 2021 through at least June 30, 2022, the Adviser has contractually agreed to waive advisory fees and/or reimburse expenses of all shares to the extent necessary to limit total annual fund operating expenses after fee waiver and/or expense reimbursement (excluding certain items discussed below) of Class A, Class C, Class R, Class Y, Class R5 and Class R6 shares to 2.00%, 2.75%, 2.25%, 1.75%, 1.75% and 1.75%, respectively, of the Fund’s average daily net assets. In determining the Adviser’s obligation to waive advisory fees and/or reimburse expenses, the following expenses are not taken into account, and could cause the total annual fund operating expenses after fee waiver and/or expense reimbursement to exceed the numbers reflected above: (1) interest; (2) taxes; (3) dividend expense on short sales; (4) extraordinary or non-routine items, including litigation expenses; and (5) expenses that the Fund has incurred but did not actually pay because of an expense offset arrangement. Unless Invesco continues the fee waiver agreement, it will terminate on June 30, 2022. During its term, the fee waiver agreement cannot be terminated or amended to increase the expense limits or reduce the advisory fee waiver without approval of the Board of Trustees.
Further, the Adviser has contractually agreed, through at least June 30, 2023, to waive the advisory fee payable by the Fund in an amount equal to 100% of the net advisory fees the Adviser receives from the affiliated money market funds on investments by the Fund of uninvested cash (excluding investments of cash collateral from securities lending) in such affiliated money market funds.
For the year ended April 30, 2021, the Adviser waived advisory fees of $32,012 and reimbursed class level expenses of $226,419, $19,104, $15,539, $30,467, $0 and $0 of Class A, Class C, Class R, Class Y, Class R5 and Class R6 shares, respectively.
The Trust has entered into a master administrative services agreement with Invesco pursuant to which the Fund has agreed to pay Invesco for certain administrative costs incurred in providing accounting services to the Fund. For the year ended April 30, 2021, expenses incurred under the agreement are shown in the Statement of Operations as Administrative services fees. Invesco has entered into a sub-administration agreement whereby State Street Bank and Trust Company (“SSB”) serves as fund accountant and provides certain administrative services to the Fund. Pursuant to a custody agreement with the Trust on behalf of the Fund, SSB also serves as the Fund’s custodian.
The Trust has entered into a transfer agency and service agreement with Invesco Investment Services, Inc. (“IIS”) pursuant to which the Fund has agreed to pay IIS a fee for providing transfer agency and shareholder services to the Fund and reimburse IIS for certain expenses incurred by IIS in the course of providing such services. IIS may make payments to intermediaries that provide omnibus account services, sub-accounting services and/or networking services. All fees payable by IIS to intermediaries that provide omnibus account services or sub-accounting services are charged back to the Fund, subject to certain limitations approved by the Trust’s Board of Trustees. For the year ended April 30, 2021, expenses incurred under the agreement are shown in the Statement of Operations as Transfer agent fees.
The Trust has entered into master distribution agreements with Invesco Distributors, Inc.(“IDI”) to serve as the distributor for the Class A, Class C, Class R, Class Y, Class R5 and Class R6 shares of the Fund. The Trust has adopted plans pursuant to Rule 12b-1 under the 1940 Act with respect to the Fund’s Class A, Class C and Class R shares (collectively the “Plans”). The Fund, pursuant to the Plans, reimburses IDI for its allocated share of expenses incurred for the period, up to a maximum annual rate of 0.25% of the average daily net assets of Class A shares, up to 1.00% of the average daily net assets of Class C shares, and up to 0.50% of the average daily net assets of Class R shares. The fees are accrued daily and paid monthly. Of the Plan payments, up to 0.25% of the average daily net assets of each class of shares may be paid to furnish continuing personal shareholder services to customers who purchase and own shares of such classes. Any amounts not paid as a service fee under the Plan would constitute an asset-based sales charge. Rules of the Financial Industry Regulatory Authority (“FINRA”) impose a cap on the total sales charges, including asset-based sales charges, that may be paid by any class of shares of the Fund. For the year ended April 30, 2021, expenses incurred under the Plans are shown in the Statement of Operations as Distribution fees.
Front-end sales commissions and CDSC (collectively, the “sales charges”) are not recorded as expenses of the Fund. Front-end sales commissions are deducted from proceeds from the sales of Fund shares prior to investment in Class A shares of the Fund. CDSC are deducted from redemption proceeds prior to remittance to the shareholder. During the year ended April 30, 2021, IDI advised the Fund that IDI retained $152,614 in front-end sales commissions from the sale of Class A shares and $6,184 and $3,903 from Class A and Class C shares, respectively, for CDSC imposed upon redemptions by shareholders.
For the year ended April 30, 2021, the Fund incurred $46,405 in brokerage commissions with Invesco Capital Markets, Inc., an affiliate of the Adviser and IDI, for portfolio transactions executed on behalf of the Fund.
Certain officers and trustees of the Trust are officers and directors of the Adviser, IIS and/or IDI.
NOTE 3–Additional Valuation Information
GAAP defines fair value as the price that would be received to sell an asset or paid to transfer a liability in an orderly transaction between market participants at the measurement date, under current market conditions. GAAP establishes a hierarchy that prioritizes the inputs to valuation methods, giving the highest priority to readily available unadjusted quoted prices in an active market for identical assets (Level 1) and the lowest priority to significant unobservable inputs (Level 3), generally when market prices are not readily available or are unreliable. Based on the valuation inputs, the securities or other investments are tiered into one of three levels. Changes in valuation methods may result in transfers in or out of an investment’s assigned level:
| | | | |
Level 1 | | – | | Prices are determined using quoted prices in an active market for identical assets. |
16 Invesco American Value Fund
| | | | |
Level 2 | | – | | Prices are determined using other significant observable inputs. Observable inputs are inputs that other market participants may use in pricing a security. These may include quoted prices for similar securities, interest rates, prepayment speeds, credit risk, yield curves, loss severities, default rates, discount rates, volatilities and others. |
Level 3 | | – | | Prices are determined using significant unobservable inputs. In situations where quoted prices or observable inputs are unavailable (for example, when there is little or no market activity for an investment at the end of the period), unobservable inputs may be used. Unobservable inputs reflect the Fund’s own assumptions about the factors market participants would use in determining fair value of the securities or instruments and would be based on the best available information. |
As of April 30, 2021, all of the securities in this Fund were valued based on Level 1 inputs (see the Schedule of Investments for security categories). The level assigned to the securities valuations may not be an indication of the risk or liquidity associated with investing in those securities. Because of the inherent uncertainties of valuation, the values reflected in the financial statements may materially differ from the value received upon actual sale of those investments.
NOTE 4–Expense Offset Arrangement(s)
The expense offset arrangement is comprised of transfer agency credits which result from balances in demand deposit accounts used by the transfer agent for clearing shareholder transactions. For the year ended April 30, 2021, the Fund received credits from this arrangement, which resulted in the reduction of the Fund’s total expenses of $6,580.
NOTE 5–Trustees’ and Officers’ Fees and Benefits
Trustees’ and Officers’ Fees and Benefits include amounts accrued by the Fund to pay remuneration to certain Trustees and Officers of the Fund. Trustees have the option to defer compensation payable by the Fund, and Trustees’ and Officers’ Fees and Benefits also include amounts accrued by the Fund to fund such deferred compensation amounts. Those Trustees who defer compensation have the option to select various Invesco Funds in which their deferral accounts shall be deemed to be invested. Finally, certain current Trustees were eligible to participate in a retirement plan that provided for benefits to be paid upon retirement to Trustees over a period of time based on the number of years of service. The Fund may have certain former Trustees who also participate in a retirement plan and receive benefits under such plan. Trustees’ and Officers’ Fees and Benefits include amounts accrued by the Fund to fund such retirement benefits. Obligations under the deferred compensation and retirement plans represent unsecured claims against the general assets of the Fund.
NOTE 6–Cash Balances
The Fund is permitted to temporarily carry a negative or overdrawn balance in its account with SSB, the custodian bank. Such balances, if any at period-end, are shown in the Statement of Assets and Liabilities under the payable caption Amount due custodian. To compensate the custodian bank for such overdrafts, the overdrawn Fund may either (1) leave funds as a compensating balance in the account so the custodian bank can be compensated by earning the additional interest; or (2) compensate by paying the custodian bank at a rate agreed upon by the custodian bank and Invesco, not to exceed the contractually agreed upon rate. The Fund may not purchase additional securities when any borrowings from banks or broker-dealers exceed 5% of the Fund’s total assets, or when any borrowings from an Invesco Fund are outstanding.
NOTE 7–Distributions to Shareholders and Tax Components of Net Assets
Tax Character of Distributions to Shareholders Paid During the Fiscal Years Ended April 30, 2021 and April 30, 2020:
| | | | | | | | |
| | | 2021 | | | 2020 | |
Ordinary income* | | $ | 5,472,423 | | | $ | 1,163,896 | |
Long-term capital gain | | | – | | | | 31,787,816 | |
Total distributions | | $ | 5,472,423 | | | $ | 32,951,712 | |
| * | Includes short-term capital gain distributions, if any. |
Tax Components of Net Assets at Period-End:
| | | | |
| | | 2021 | |
| |
Undistributed ordinary income | | $ | 48,085,217 | |
| |
Undistributed long-term capital gain | | | 85,338,438 | |
| |
Net unrealized appreciation — investments | | | 589,797,449 | |
| |
Temporary book/tax differences | | | (406,585 | ) |
| |
Capital loss carryforward | | | (104,463,221 | ) |
| |
Shares of beneficial interest | | | 1,368,081,075 | |
| |
Total net assets | | $ | 1,986,432,373 | |
| |
The difference between book-basis and tax-basis unrealized appreciation (depreciation) is due to differences in the timing of recognition of gains and losses on investments for tax and book purposes. The Fund’s net unrealized appreciation (depreciation) difference is attributable primarily to wash sales.
The temporary book/tax differences are a result of timing differences between book and tax recognition of income and/or expenses. The Fund’s temporary book/tax differences are the result of the trustee deferral of compensation and retirement plan benefits.
Capital loss carryforward is calculated and reported as of a specific date. Results of transactions and other activity after that date may affect the amount of capital loss carryforward actually available for the Fund to utilize. The ability to utilize capital loss carryforward in the future may be limited under the Internal Revenue Code and related regulations based on the results of future transactions.
17 Invesco American Value Fund
The Fund has a capital loss carryforward as of April 30, 2021, as follows:
| | | | | | | | | | | | |
| Capital Loss Carryforward* | |
| Expiration | | Short-Term | | | Long-Term | | | Total | |
Not subject to expiration | | $ | 80,062,174 | | | $ | 24,401,047 | | | $ | 104,463,221 | |
| * | Capital loss carryforward is reduced for limitations, if any, to the extent required by the Internal Revenue Code and may be further limited depending upon a variety of factors, including the realization of net unrealized gains or losses as of the date of any reorganization. |
NOTE 8–Investment Transactions
The aggregate amount of investment securities (other than short-term securities, U.S. Government obligations and money market funds, if any) purchased and sold by the Fund during the year ended April 30, 2021 was $917,759,044 and $1,275,629,084, respectively. Cost of investments, including any derivatives, on a tax basis includes the adjustments for financial reporting purposes as of the most recently completed federal income tax reporting period-end.
| | | | |
| Unrealized Appreciation (Depreciation) of Investments on a Tax Basis | |
Aggregate unrealized appreciation of investments | | $ | 589,797,449 | |
Aggregate unrealized (depreciation) of investments | | | — | |
Net unrealized appreciation of investments | | $ | 589,797,449 | |
| | | | | | | | | | | | | | | | |
Cost of investments for tax purposes is $1,399,786,680. | | | | | | | | | | | | | | | | |
| | | | |
NOTE 9–Share Information | | | | | | | | | | | | | | | | |
| | | | | | | | | | | | | | | | |
| | | | | | Summary of Share Activity | | | | |
| |
| | | Year ended | | | Year ended | |
| | | April 30, 2021(a) | | | April 30, 2020 | |
| | | Shares | | | Amount | | | Shares | | | Amount | |
| |
Sold: | | | | | | | | | | | | | | | | |
Class A | | | 2,585,629 | | | $ | 85,684,458 | | | | 1,823,677 | | | $ | 54,440,993 | |
| |
Class C | | | 349,409 | | | | 9,250,105 | | | | 128,877 | | | | 3,081,383 | |
| |
Class R | | | 294,711 | | | | 9,711,425 | | | | 125,562 | | | | 3,611,631 | |
| |
Class Y | | | 830,670 | | | | 27,018,870 | | | | 911,871 | | | | 25,764,118 | |
| |
Class R5 | | | 50,990 | | | | 1,666,035 | | | | 91,826 | | | | 2,923,009 | |
| |
Class R6 | | | 330,842 | | | | 10,668,544 | | | | 428,337 | | | | 12,997,090 | |
| |
| | | | |
Issued as reinvestment of dividends: | | | | | | | | | | | | | | | | |
Class A | | | 111,920 | | | | 3,863,469 | | | | 682,087 | | | | 22,938,603 | |
| |
Class C | | | 3,375 | | | | 91,331 | | | | 31,309 | | | | 829,990 | |
| |
Class R | | | 3,951 | | | | 135,273 | | | | 15,503 | | | | 517,958 | |
| |
Class Y | | | 16,838 | | | | 586,139 | | | | 108,841 | | | | 3,685,363 | |
| |
Class R5 | | | 1,568 | | | | 54,625 | | | | 16,642 | | | | 563,510 | |
| |
Class R6 | | | 8,210 | | | | 285,886 | | | | 64,204 | | | | 2,173,295 | |
| |
| | | | |
Automatic conversion of Class C shares to Class A shares: | | | | | | | | | | | | | | | | |
Class A | | | 612,496 | | | | 20,618,291 | | | | 131,592 | | | | 3,913,285 | |
| |
Class C | | | (781,618 | ) | | | (20,618,291 | ) | | | (166,308 | ) | | | (3,913,285 | ) |
| |
| | | | |
Issued in connection with acquisitions:(b) | | | | | | | | | | | | | | | | |
Class A | | | - | | | | - | | | | 23,172,250 | | | | 580,253,329 | |
| |
Class C | | | - | | | | - | | | | 2,625,561 | | | | 51,703,112 | |
| |
Class R | | | - | | | | - | | | | 1,559,009 | | | | 38,757,955 | |
| |
Class Y | | | - | | | | - | | | | 2,274,623 | | | | 57,406,484 | |
| |
Class R5 | | | - | | | | - | | | | 283 | | | | 7,147 | |
| |
Class R6 | | | - | | | | - | | | | 161,974 | | | | 4,088,710 | |
| |
18 Invesco American Value Fund
| | | | | | | | | | | | | | | | |
| | | | | | Summary of Share Activity | | | | |
| |
| | | Year ended | | | Year ended | |
| | | April 30, 2021(a) | | | April 30, 2020 | |
| | | Shares | | | Amount | | | Shares | | | Amount | |
| |
| | | | |
Reacquired: | | | | | | | | | | | | | | | | |
Class A | | | (9,633,592 | ) | | $ | (308,664,223 | ) | | | (6,245,687 | ) | | $ | (193,019,127 | ) |
| |
Class C | | | (916,175 | ) | | | (22,896,941 | ) | | | (404,776 | ) | | | (9,946,118 | ) |
| |
Class R | | | (692,899 | ) | | | (22,083,923 | ) | | | (288,840 | ) | | | (8,812,820 | ) |
| |
Class Y | | | (3,277,162 | ) | | | (113,604,659 | ) | | | (1,878,805 | ) | | | (59,199,196 | ) |
| |
Class R5 | | | (184,479 | ) | | | (6,099,024 | ) | | | (495,150 | ) | | | (15,981,878 | ) |
| |
Class R6 | | | (788,405 | ) | | | (25,179,180 | ) | | | (695,026 | ) | | | (21,868,182 | ) |
| |
Net increase (decrease) in share activity | | | (11,073,721 | ) | | $ | (349,511,790 | ) | | | 24,179,436 | | | $ | 556,916,359 | |
| |
| (a) | There are entities that are record owners of more than 5% of the outstanding shares of the Fund and in the aggregate own 25% of the outstanding shares of the Fund. IDI has an agreement with these entities to sell Fund shares. The Fund, Invesco and/or Invesco affiliates may make payments to these entities, which are considered to be related to the Fund, for providing services to the Fund, Invesco and/or Invesco affiliates including but not limited to services such as securities brokerage, distribution, third party record keeping and account servicing. The Fund has no knowledge as to whether all or any portion of the shares owned of record by these entities are also owned beneficially. |
| (b) | After the close of business on April 17, 2020, the Fund acquired all the net assets of Invesco Oppenheimer Mid Cap Value Fund (the “Target Fund”) pursuant to a plan of reorganization approved by the Board of Trustees of the Fund on February 14, 2020. The reorganization was executed in order to reduce overlap and increase efficiencies in the Adviser’s product line. The acquisition was accomplished by a tax-free exchange of 29,793,699 shares of the Fund for 21,659,372 shares outstanding of the Target Fund as of the close of business on April 17, 2020. Shares of the Target Fund were exchanged for the like class of shares of the Fund, based on the relative net asset value of the Target Fund to the net asset value of the Fund on the close of business, April 17, 2020. The Target Fund’s net assets as of the close of business on April 17, 2020 of $732,216,736, including $(139,106,066) of unrealized appreciation (depreciation), were combined with those of the Fund. The net assets of the Fund immediately before the acquisition were $735,922,174 and $1,468,138,910 immediately after the acquisition. |
The pro forma results of operations for the year ended April 30, 2020 assuming the reorganization had been completed on May 1, 2019, the beginning of the annual reporting period are as follows:
| | | | |
Net investment income | | $ | 11,514,754 | |
| |
Net realized/unrealized gains (losses) | | | (419,973,271 | ) |
| |
Change in net assets resulting from operations | | $ | (408,458,517 | ) |
| |
As the combined investment portfolios have been managed as a single integrated portfolio since the acquisition was completed, it is not practicable to separate the amounts of revenue and earnings of the Target Fund that has been included in the Fund’s Statement of Operations since April 18, 2020.
19 Invesco American Value Fund
Report of Independent Registered Public Accounting Firm
To the Board of Trustees of AIM Sector Funds (Invesco Sector Funds) and Shareholders of Invesco American Value Fund
Opinion on the Financial Statements
We have audited the accompanying statement of assets and liabilities, including the schedule of investments, of Invesco American Value Fund (one of the funds constituting AIM Sector Funds (Invesco Sector Funds), referred to hereafter as the “Fund”) as of April 30, 2021, the related statement of operations for the year ended April 30, 2021, the statement of changes in net assets for each of the two years in the period ended April 30, 2021, including the related notes, and the financial highlights for each of the five years in the period ended April 30, 2021 (collectively referred to as the “financial statements”). In our opinion, the financial statements present fairly, in all material respects, the financial position of the Fund as of April 30, 2021, the results of its operations for the year then ended, the changes in its net assets for each of the two years in the period ended April 30, 2021 and the financial highlights for each of the five years in the period ended April 30, 2021 in conformity with accounting principles generally accepted in the United States of America.
Basis for Opinion
These financial statements are the responsibility of the Fund’s management. Our responsibility is to express an opinion on the Fund’s financial statements based on our audits. We are a public accounting firm registered with the Public Company Accounting Oversight Board (United States) (PCAOB) and are required to be independent with respect to the Fund in accordance with the U.S. federal securities laws and the applicable rules and regulations of the Securities and Exchange Commission and the PCAOB.
We conducted our audits of these financial statements in accordance with the standards of the PCAOB. Those standards require that we plan and perform the audit to obtain reasonable assurance about whether the financial statements are free of material misstatement, whether due to error or fraud.
Our audits included performing procedures to assess the risks of material misstatement of the financial statements, whether due to error or fraud, and performing procedures that respond to those risks. Such procedures included examining, on a test basis, evidence regarding the amounts and disclosures in the financial statements. Our audits also included evaluating the accounting principles used and significant estimates made by management, as well as evaluating the overall presentation of the financial statements. Our procedures included confirmation of securities owned as of April 30, 2021 by correspondence with the custodian and transfer agent. We believe that our audits provide a reasonable basis for our opinion.
/s/PricewaterhouseCoopers LLP
Houston, Texas
June 24, 2021
We have served as the auditor of one or more investment companies in the Invesco group of investment companies since at least 1995. We have not been able to determine the specific year we began serving as auditor.
20 Invesco American Value Fund
Calculating your ongoing Fund expenses
Example
As a shareholder of the Fund, you incur two types of costs: (1) transaction costs, which may include sales charges (loads) on purchase payments or contingent deferred sales charges on redemptions, if any; and (2) ongoing costs, including management fees, distribution and/or service (12b-1) fees, and other Fund expenses. This example is intended to help you understand your ongoing costs (in dollars) of investing in the Fund and to compare these costs with ongoing costs of investing in other mutual funds. The example is based on an investment of $1,000 invested at the beginning of the period and held for the entire period November 1, 2020 through April 30, 2021.
Actual expenses
The table below provides information about actual account values and actual expenses. You may use the information in this table, together with the amount you invested, to estimate the expenses that you paid over the period. Simply divide your account value by $1,000 (for example, an $8,600 account value divided by $1,000 = 8.6), then multiply the result by the number in the table under the heading entitled “Actual Expenses Paid During Period” to estimate the expenses you paid on your account during this period.
Hypothetical example for comparison purposes
The table below also provides information about hypothetical account values and hypothetical expenses based on the Fund’s actual expense ratio and an assumed rate of return of 5% per year before expenses, which is not the Fund’s actual return.
The hypothetical account values and expenses may not be used to estimate the actual ending account balance or expenses you paid for the period. You may use this information to compare the ongoing costs of investing in the Fund and other funds. To do so, compare this 5% hypothetical example with the 5% hypothetical examples that appear in the shareholder reports of the other funds.
Please note that the expenses shown in the table are meant to highlight your ongoing costs only and do not reflect any transaction costs, such as sales charges (loads) on purchase payments or contingent deferred sales charges on redemptions, if any. Therefore, the hypothetical information is useful in comparing ongoing costs only, and will not help you determine the relative total costs of owning different funds. In addition, if these transaction costs were included, your costs would have been higher.
| | | | | | | | | | | | |
| | | Beginning Account Value
(11/01/20) | | ACTUAL | | HYPOTHETICAL
(5% annual return before
expenses) | | Annualized Expense Ratio |
| | Ending Account Value
(04/30/21)1 | | Expenses Paid During
Period2 | | Ending Account Value
(04/30/21) | | Expenses Paid During
Period2 |
Class A | | $1,000.00 | | $1,451.70 | | $7.05 | | $1,019.04 | | $5.81 | | 1.16% |
Class C | | 1,000.00 | | 1,447.30 | | 11.17 | | 1,015.67 | | 9.20 | | 1.84 |
Class R | | 1,000.00 | | 1,450.10 | | 8.50 | | 1,017.85 | | 7.00 | | 1.40 |
Class Y | | 1,000.00 | | 1,453.70 | | 5.54 | | 1,020.28 | | 4.56 | | 0.91 |
Class R5 | | 1,000.00 | | 1,454.70 | | 4.81 | | 1,020.88 | | 3.96 | | 0.79 |
Class R6 | | 1,000.00 | | 1,454.90 | | 4.57 | | 1,021.08 | | 3.76 | | 0.75 |
| 1 | The actual ending account value is based on the actual total return of the Fund for the period November 1, 2020 through April 30, 2021, after actual expenses and will differ from the hypothetical ending account value which is based on the Fund’s expense ratio and a hypothetical annual return of 5% before expenses. |
| 2 | Expenses are equal to the Fund’s annualized expense ratio as indicated above multiplied by the average account value over the period, multiplied by 181/365 to reflect the most recent fiscal half year. |
21 Invesco American Value Fund
Tax Information
Form 1099-DIV, Form 1042-S and other year–end tax information provide shareholders with actual calendar year amounts that should be included in their tax returns. Shareholders should consult their tax advisers.
The following distribution information is being provided as required by the Internal Revenue Code or to meet a specific state’s requirement.
The Fund designates the following amounts or, if subsequently determined to be different, the maximum amount allowable for its fiscal year ended April 30, 2021:
| | | | | | |
| | | | | | |
Federal and State Income Tax | | | | |
Qualified Dividend Income* | | | 98.75 | % |
Corporate Dividends Received Deduction* | | | 98.68 | % |
Qualified Business Income* | | | 0.06 | % |
Business Interest Income* | | | 0.00 | % |
U.S. Treasury Obligations* | | | 0.00 | % |
| | * | The above percentages are based on ordinary income dividends paid to shareholders during the Fund’s fiscal year. |
22 Invesco American Value Fund
Trustees and Officers
The address of each trustee and officer is AIM Sector Funds (Invesco Sector Funds) (the “Trust”), 11 Greenway Plaza, Suite 1000, Houston, Texas 77046-1173. The trustees serve for the life of the Trust, subject to their earlier death, incapacitation, resignation, retirement or removal as more specifically provided in the Trust’s organizational documents. Each officer serves for a one year term or until their successors are elected and qualified. Column two below includes length of time served with predecessor entities, if any.
| | | | | | | | |
Name, Year of Birth and Position(s) Held with the Trust | | Trustee and/or Officer Since | | Principal Occupation(s) During Past 5 Years | | Number of Funds in
Fund Complex
Overseen by
Trustee | | Other Directorship(s)
Held by Trustee During Past 5 Years |
Interested Trustee | | | | | | | | |
Martin L. Flanagan1 – 1960 Trustee and Vice Chair | | 2007 | | Executive Director, Chief Executive Officer and President, Invesco Ltd. (ultimate parent of Invesco and a global investment management firm); Trustee and Vice Chair, The Invesco Funds; Vice Chair, Investment Company Institute; and Member of Executive Board, SMU Cox School of Business Formerly: Advisor to the Board, Invesco Advisers, Inc. (formerly known as Invesco Institutional (N.A.), Inc.); Chairman and Chief Executive Officer, Invesco Advisers, Inc. (registered investment adviser); Director, Chairman, Chief Executive Officer and President, Invesco Holding Company (US), Inc. (formerly IVZ Inc.) (holding company), Invesco Group Services, Inc. (service provider) and Invesco North American Holdings, Inc. (holding company); Director, Chief Executive Officer and President, Invesco Holding Company Limited (parent of Invesco and a global investment management firm); Director, Invesco Ltd.; Chairman, Investment Company Institute and President, Co-Chief Executive Officer, Co-President, Chief Operating Officer and Chief Financial Officer, Franklin Resources, Inc. (global investment management organization) | | 184 | | None |
| 1 | Mr. Flanagan is considered an interested person (within the meaning of Section 2(a)(19) of the 1940 Act) of the Trust because he is an officer of the Adviser to the Trust, and an officer and a director of Invesco Ltd., ultimate parent of the Adviser. |
T-1 Invesco American Value Fund
Trustees and Officers–(continued)
| | | | | | | | |
Name, Year of Birth and Position(s) Held with the Trust | | Trustee and/or Officer Since | | Principal Occupation(s) During Past 5 Years | | Number of
Funds in Fund Complex
Overseen by
Trustee | | Other Directorship(s) Held by Trustee During Past 5 Years |
Independent Trustees |
Christopher L. Wilson – 1957 Trustee and Chair | | 2017 | | Retired Formerly: Director, TD Asset Management USA Inc. (mutual fund complex) (22 portfolios); Managing Partner, CT2, LLC (investing and consulting firm); President/Chief Executive Officer, Columbia Funds, Bank of America Corporation; President/Chief Executive Officer, CDC IXIS Asset Management Services, Inc.; Principal & Director of Operations, Scudder Funds, Scudder, Stevens & Clark, Inc.; Assistant Vice President, Fidelity Investments | | 184 | | enaible, Inc. (artificial intelligence technology); Director, ISO New England, Inc. (non-profit organization managing regional electricity market) |
Beth Ann Brown – 1968 Trustee | | 2019 | | Independent Consultant Formerly: Head of Intermediary Distribution, Managing Director, Strategic Relations, Managing Director, Head of National Accounts, Senior Vice President, National Account Manager and Senior Vice President, Key Account Manager, Columbia Management Investment Advisers LLC; Vice President, Key Account Manager, Liberty Funds Distributor, Inc.; and Trustee of certain Oppenheimer Funds | | 184 | | Director, Board of Directors of Caron Engineering Inc.; Advisor, Board of Advisors of Caron Engineering Inc.; President and Director, Acton Shapleigh Youth Conservation Corps (non - profit); and President and Director of Grahamtastic Connection (non- profit) |
Jack M. Fields – 1952 Trustee | | 2003 | | Chief Executive Officer, Twenty First Century Group, Inc. (government affairs company); and Board Member, Impact(Ed) (non-profit) Formerly: Owner and Chief Executive Officer, Dos Angeles Ranch L.P. (cattle, hunting, corporate entertainment); Director, Insperity, Inc. (formerly known as Administaff) (human resources provider); Chief Executive Officer, Texana Timber LP (sustainable forestry company); Director of Cross Timbers Quail Research Ranch (non-profit); and member of the U.S. House of Representatives | | 184 | | Member, Board of Directors of Baylor College of Medicine |
Cynthia Hostetler –1962 Trustee | | 2017 | | Non-Executive Director and Trustee of a number of public and private business corporations Formerly: Director, Aberdeen Investment Funds (4 portfolios); Director, Artio Global Investment LLC (mutual fund complex); Director, Edgen Group, Inc. (specialized energy and infrastructure products distributor); Head of Investment Funds and Private Equity, Overseas Private Investment Corporation; President, First Manhattan Bancorporation, Inc.; Attorney, Simpson Thacher & Bartlett LLP | | 184 | | Resideo Technologies, Inc. (smart home technology); Vulcan Materials Company (construction materials company); Trilinc Global Impact Fund; Genesee & Wyoming, Inc. (railroads); Investment Company Institute (professional organization); Independent Directors Council (professional organization); Eisenhower Foundation (non-profit) |
Eli Jones – 1961 Trustee | | 2016 | | Professor and Dean, Mays Business School - Texas A&M University Formerly: Professor and Dean, Walton College of Business, University of Arkansas and E.J. Ourso College of Business, Louisiana State University; Director, Arvest Bank | | 184 | | Insperity, Inc. (formerly known as Administaff) (human resources provider) |
T-2 Invesco American Value Fund
Trustees and Officers–(continued)
| | | | | | | | |
Name, Year of Birth and Position(s) Held with the Trust | | Trustee and/or Officer Since | | Principal Occupation(s) During Past 5 Years | | Number of
Funds in Fund Complex
Overseen by
Trustee | | Other Directorship(s) Held by Trustee During Past 5 Years |
Independent Trustees–(continued) | | | | |
Elizabeth Krentzman – 1959 Trustee | | 2019 | | Formerly: Principal and Chief Regulatory Advisor for Asset Management Services and U.S. Mutual Fund Leader of Deloitte & Touche LLP; General Counsel of the Investment Company Institute (trade association); National Director of the Investment Management Regulatory Consulting Practice, Principal, Director and Senior Manager of Deloitte & Touche LLP; Assistant Director of the Division of Investment Management - Office of Disclosure and Investment Adviser Regulation of the U.S. Securities and Exchange Commission and various positions with the Division of Investment Management – Office of Regulatory Policy of the U.S. Securities and Exchange Commission; Associate at Ropes & Gray LLP; and Trustee of certain Oppenheimer Funds | | 184 | | Trustee of the University of Florida National Board Foundation; Member of the Carita Funds Board of Directors (private investment funds); Member of the University of Florida Law Center Association, Inc. Board of Trustees and Audit Committee Member |
Anthony J. LaCava, Jr. – 1956 Trustee | | 2019 | | Formerly: Director and Member of the Audit Committee, Blue Hills Bank (publicly traded financial institution) and Managing Partner, KPMG LLP | | 184 | | Blue Hills Bank; Chairman, Bentley University; Member, Business School Advisory Council; and Nominating Committee KPMG LLP |
Prema Mathai-Davis – 1950 Trustee | | 2003 | | Retired Formerly: Co-Founder & Partner of Quantalytics Research, LLC, (a FinTech Investment Research Platform for the Self-Directed Investor); Trustee of YWCA Retirement Fund; CEO of YWCA of the USA; Board member of the NY Metropolitan Transportation Authority; Commissioner of the NYC Department of Aging; Board member of Johns Hopkins Bioethics Institute | | 184 | | None |
Joel W. Motley – 1952 Trustee | | 2019 | | Director of Office of Finance, Federal Home Loan Bank System; Managing Director of Carmona Motley Inc. (privately held financial advisor); Member of the Council on Foreign Relations and its Finance and Budget Committee; Chairman Emeritus of Board of Human Rights Watch and Member of its Investment Committee; and Member of Investment Committee and Board of Historic Hudson Valley (non-profit cultural organization) Formerly: Managing Director of Public Capital Advisors, LLC (privately held financial advisor); Managing Director of Carmona Motley Hoffman, Inc. (privately held financial advisor); Trustee of certain Oppenheimer Funds; Director of Columbia Equity Financial Corp. (privately held financial advisor); and Member of the Vestry of Trinity Church Wall Street | | 184 | | Member of Board of Greenwall Foundation (bioethics research foundation) and its Investment Committee; Member of Board of Friends of the LRC (non-profit legal advocacy); Board Member and Investment Committee Member of Pulitzer Center for Crisis Reporting (non-profit journalism) |
Teresa M. Ressel – 1962 Trustee | | 2017 | | Non-executive director and trustee of a number of public and private business corporations Formerly: Chief Executive Officer, UBS Securities LLC (investment banking); Chief Operating Officer, UBS AG Americas (investment banking); Sr. Management Team Olayan America, The Olayan Group (international investor/commercial/industrial); Assistant Secretary for Management & Budget and Designated Chief Financial Officer, U.S. Department of Treasury; Director, Atlantic Power Corporation (power generation company) and ON Semiconductor Corporation (semiconductor manufacturing) | | 184 | | Elucida Oncology (nanotechnology & medical particles company) |
T-3 Invesco American Value Fund
Trustees and Officers–(continued)
| | | | | | | | |
Name, Year of Birth and Position(s) Held with the Trust | | Trustee and/or Officer Since | | Principal Occupation(s) During Past 5 Years | | Number of
Funds in Fund Complex
Overseen by
Trustee | | Other Directorship(s) Held by Trustee During Past 5 Years |
Independent Trustees–(continued) |
Ann Barnett Stern – 1957 Trustee | | 2017 | | President, Chief Executive Officer and Board Member, Houston Endowment, Inc. a private philanthropic institution Formerly: Executive Vice President, Texas Children’s Hospital; Vice President, General Counsel and Corporate Compliance Officer, Texas Children’s Hospital; Attorney at Beck, Redden and Secrest, LLP and Andrews and Kurth LLP | | 184 | | Director and Audit Committee member of Federal Reserve Bank of Dallas; Trustee and Board Chair of Good Reason Houston (nonprofit); Trustee, Vice Chair, Chair of Nomination/Governance Committee, Chair of Personnel Committee of Holdsworth Center (nonprofit); Trustee and Investment Committee member of University of Texas Law School Foundation (nonprofit); Board Member of Greater Houston Partnership |
Robert C. Troccoli – 1949 Trustee | | 2016 | | Retired Formerly: Adjunct Professor, University of Denver – Daniels College of Business; and Managing Partner, KPMG LLP | | 184 | | None |
Daniel S. Vandivort –1954 Trustee | | 2019 | | Trustee, Board of Trustees, Huntington Disease Foundation of America; and President, Flyway Advisory Services LLC (consulting and property management) Formerly: Trustee and Governance Chair, of certain Oppenheimer Funds; and Treasurer, Chairman of the Audit and Finance Committee, Huntington Disease Foundation of America | | 184 | | None |
James D. Vaughn – 1945 Trustee | | 2019 | | Retired Formerly: Managing Partner, Deloitte & Touche LLP; Trustee and Chairman of the Audit Committee, Schroder Funds; Board Member, Mile High United Way, Boys and Girls Clubs, Boy Scouts, Colorado Business Committee for the Arts, Economic Club of Colorado and Metro Denver Network (economic development corporation); and Trustee of certain Oppenheimer Funds | | 184 | | Board member and Chairman of Audit Committee of AMG National Trust Bank; Trustee and Investment Committee member, University of South Dakota Foundation; Board member, Audit Committee Member and past Board Chair, Junior Achievement (non-profit) |
T-4 Invesco American Value Fund
Trustees and Officers–(continued)
| | | | | | | | |
Name, Year of Birth and Position(s) Held with the Trust | | Trustee and/or Officer Since | | Principal Occupation(s) During Past 5 Years | | Number of
Funds in Fund Complex
Overseen by
Trustee | | Other Directorship(s) Held by Trustee During Past 5 Years |
Officers |
Sheri Morris – 1964 President and Principal Executive Officer | | 2003 | | Head of Global Fund Services, Invesco Ltd.; President and Principal Executive Officer, The Invesco Funds; Senior Vice President, Invesco Advisers, Inc. (formerly known as Invesco Institutional (N.A.), Inc.) (registered investment adviser); and Vice President, Invesco Exchange-Traded Fund Trust, Invesco Exchange-Traded Fund Trust II, Invesco India Exchange-Traded Fund Trust, Invesco Actively Managed Exchange-Traded Fund Trust, Invesco Actively Managed Exchange-Traded Commodity Fund Trust and Invesco Exchange-Traded Self-Indexed Fund Trust; and Vice President, OppenheimerFunds, Inc. Formerly: Vice President, Treasurer and Principal Financial Officer, The Invesco Funds; Vice President, Invesco AIM Advisers, Inc., Invesco AIM Capital Management, Inc. and Invesco AIM Private Asset Management, Inc.; Assistant Vice President and Assistant Treasurer, The Invesco Funds; Vice President and Assistant Vice President, Invesco Advisers, Inc.; Assistant Vice President, Invesco AIM Capital Management, Inc. and Invesco AIM Private Asset Management, Inc.; and Treasurer, Invesco Exchange-Traded Fund Trust, Invesco Exchange-Traded Fund Trust II, Invesco India Exchange-Traded Fund Trust and Invesco Actively Managed Exchange-Traded Fund Trust | | N/A | | N/A |
Russell C. Burk – 1958 Senior Vice President and Senior Officer | | 2005 | | Senior Vice President and Senior Officer, The Invesco Funds | | N/A | | N/A |
Jeffrey H. Kupor – 1968 Senior Vice President, Chief Legal Officer and Secretary | | 2018 | | Head of Legal of the Americas, Invesco Ltd.; Senior Vice President and Secretary, Invesco Advisers, Inc. (formerly known as Invesco Institutional (N.A.), Inc.) (registered investment adviser); Senior Vice President and Secretary, Invesco Distributors, Inc. (formerly known as Invesco AIM Distributors, Inc.); Vice President and Secretary, Invesco Investment Services, Inc. (formerly known as Invesco AIM Investment Services, Inc.) Senior Vice President, Chief Legal Officer and Secretary, The Invesco Funds; Secretary and General Counsel, Invesco Investment Advisers LLC (formerly known as Van Kampen Asset Management); Secretary and General Counsel, Invesco Capital Markets, Inc. (formerly known as Van Kampen Funds Inc.) and Chief Legal Officer, Invesco Exchange-Traded Fund Trust, Invesco Exchange-Traded Fund Trust II, Invesco India Exchange-Traded Fund Trust, Invesco Actively Managed Exchange-Traded Fund Trust, Invesco Actively Managed Exchange-Traded Commodity Fund Trust and Invesco Exchange-Traded Self-Indexed Fund Trust; Secretary, Invesco Indexing LLC; Secretary, W.L. Ross & Co., LLC ; Secretary and Vice President, Harbourview Asset Management Corporation; Secretary and Vice President, OppenheimerFunds, Inc. and Invesco Managed Accounts, LLC; Secretary and Senior Vice President, OFI Global Institutional, Inc.; Secretary and Vice President, OFI SteelPath, Inc.; Secretary and Vice President, Oppenheimer Acquisition Corp.; Secretary and Vice President, Shareholder Services, Inc.; Secretary and Vice President, Trinity Investment Management Corporation Formerly: Secretary and Vice President, Jemstep, Inc.; Head of Legal, Worldwide Institutional, Invesco Ltd.; Secretary and General Counsel, INVESCO Private Capital Investments, Inc.; Senior Vice President, Secretary and General Counsel, Invesco Management Group, Inc. (formerly known as Invesco AIM Management Group, Inc.); Assistant Secretary, INVESCO Asset Management (Bermuda) Ltd.; Secretary and General Counsel, Invesco Private Capital, Inc.; Assistant Secretary and General Counsel, INVESCO Realty, Inc.; Secretary and General Counsel, Invesco Senior Secured Management, Inc.; and Secretary, Sovereign G./P. Holdings Inc. | | N/A | | N/A |
T-5 Invesco American Value Fund
Trustees and Officers–(continued)
| | | | | | | | |
Name, Year of Birth and Position(s) Held with the Trust | | Trustee and/or Officer Since | | Principal Occupation(s) During Past 5 Years | | Number of
Funds in Fund Complex
Overseen by
Trustee | | Other Directorship(s) Held by Trustee During Past 5 Years |
Officers–(continued) |
Andrew R. Schlossberg – 1974 Senior Vice President | | 2019 | | Head of the Americas and Senior Managing Director, Invesco Ltd.; Director and Senior Vice President, Invesco Advisers, Inc. (formerly known as Invesco Institutional (N.A.), Inc.) (registered investment adviser); Director and Chairman, Invesco Investment Services, Inc. (formerly known as Invesco AIM Investment Services, Inc.) (registered transfer agent); Senior Vice President, The Invesco Funds; Director, Invesco Investment Advisers LLC (formerly known as Van Kampen Asset Management); Director, President and Chairman, Invesco Insurance Agency, Inc. Formerly: Director, President and Chairman, Invesco Insurance Agency, Inc.; Director, Invesco UK Limited; Director and Chief Executive, Invesco Asset Management Limited and Invesco Fund Managers Limited; Assistant Vice President, The Invesco Funds; Senior Vice President, Invesco Advisers, Inc. (formerly known as Invesco Institutional (N.A.), Inc.) (registered investment adviser); Director and Chief Executive, Invesco Administration Services Limited and Invesco Global Investment Funds Limited; Director, Invesco Distributors, Inc.; Head of EMEA, Invesco Ltd.; President, Invesco Actively Managed Exchange-Traded Commodity Fund Trust, Invesco Actively Managed Exchange-Traded Fund Trust, Invesco Exchange-Traded Fund Trust, Invesco Exchange-Traded Fund Trust II and Invesco India Exchange-Traded Fund Trust; Managing Director and Principal Executive Officer, Invesco Capital Management LLC | | N/A | | N/A |
John M. Zerr – 1962 Senior Vice President | | 2006 | | Chief Operating Officer of the Americas; Senior Vice President, Invesco Advisers, Inc. (formerly known as Invesco Institutional (N.A.), Inc.) (registered investment adviser); Senior Vice President, Invesco Distributors, Inc. (formerly known as Invesco AIM Distributors, Inc.); Director and Vice President, Invesco Investment Services, Inc. (formerly known as Invesco AIM Investment Services, Inc.) Senior Vice President, The Invesco Funds; Managing Director, Invesco Capital Management LLC; Director, Invesco Investment Advisers LLC (formerly known as Van Kampen Asset Management); Senior Vice President, Invesco Capital Markets, Inc. (formerly known as Van Kampen Funds Inc.); Manager, Invesco Indexing LLC; Manager, Invesco Specialized Products, LLC; Member, Invesco Canada Funds Advisory Board; Director, President and Chief Executive Officer, Invesco Corporate Class Inc. (corporate mutual fund company); and Director, Chairman, President and Chief Executive Officer, Invesco Canada Ltd. (formerly known as Invesco Trimark Ltd./Invesco Trimark Ltèe) (registered investment adviser and registered transfer agent); President, Invesco, Inc.; President, Invesco Global Direct Real Estate Feeder GP Ltd.; President, Invesco IP Holdings (Canada) Ltd; President, Invesco Global Direct Real Estate GP Ltd.; President, Invesco Financial Services Ltd. / Services Financiers Invesco Ltée; President, Trimark Investments Ltd./Placements Trimark Ltée and Director and Chairman, Invesco Trust Company Formerly: Director and Senior Vice President, Invesco Insurance Agency, Inc.; Director and Senior Vice President, Invesco Management Group, Inc. (formerly known as Invesco AIM Management Group, Inc.); Secretary and General Counsel, Invesco Management Group, Inc. (formerly known as Invesco AIM Management Group, Inc.); Secretary, Invesco Investment Services, Inc. (formerly known as Invesco AIM Investment Services, Inc.); Chief Legal Officer and Secretary, The Invesco Funds; Secretary and General Counsel, Invesco Investment Advisers LLC (formerly known as Van Kampen Asset Management); Secretary and General Counsel, Invesco Capital Markets, Inc. (formerly known as Van Kampen Funds Inc.); Chief Legal Officer, Invesco Exchange-Traded Fund Trust, Invesco Exchange-Traded Fund Trust II, Invesco India Exchange-Traded Fund Trust, Invesco Actively Managed Exchange-Traded Fund Trust, Invesco Actively Managed Exchange-Traded Commodity Fund Trust and Invesco Exchange-Traded Self-Indexed Fund Trust; Secretary, Invesco Indexing LLC; Director, Secretary, General Counsel and Senior Vice President, Van Kampen Exchange Corp.; Director, Vice President and Secretary, IVZ Distributors, Inc. (formerly known as INVESCO Distributors, Inc.); Director and Vice President, INVESCO Funds Group, Inc.; Director and Vice President, Van Kampen Advisors Inc.; Director, Vice President, Secretary and General Counsel, Van Kampen Investor Services Inc.; Director and Secretary, Invesco Distributors, Inc. (formerly known as Invesco AIM Distributors, Inc.); Director, Senior Vice President, General Counsel and Secretary, Invesco AIM Advisers, Inc. and Van Kampen Investments Inc.; Director, Vice President and Secretary, Fund Management Company; Director, Senior Vice President, Secretary, General Counsel and Vice President, Invesco AIM Capital Management, Inc.; Chief Operating Officer and General Counsel, Liberty Ridge Capital, Inc. (an investment adviser) | | N/A | | N/A |
T-6 Invesco American Value Fund
Trustees and Officers–(continued)
| | | | | | | | |
Name, Year of Birth and Position(s) Held with the Trust | | Trustee and/or Officer Since | | Principal Occupation(s) During Past 5 Years | | Number of
Funds in Fund Complex
Overseen by
Trustee | | Other Directorship(s) Held by Trustee During Past 5 Years |
Officers–(continued) |
Gregory G. McGreevey – 1962 Senior Vice President | | 2012 | | Senior Managing Director, Invesco Ltd.; Director, Chairman, President, and Chief Executive Officer, Invesco Advisers, Inc. (formerly known as Invesco Institutional (N.A.), Inc.) (registered investment adviser); Director, Invesco Mortgage Capital, Inc. and Invesco Senior Secured Management, Inc.; and Senior Vice President, The Invesco Funds; and President, SNW Asset Management Corporation and Invesco Managed Accounts, LLC; Chairman and Director, Invesco Private Capital, Inc.; Chairman and Director, INVESCO Private Capital Investments, Inc.; Chairman and Director, INVESCO Realty, Inc. Chairman and Director, INVESCO Realty, Inc.; and Senior Vice President, Invesco Group Services, Inc. Formerly: Senior Vice President, Invesco Management Group, Inc. and Invesco Advisers, Inc.; Assistant Vice President, The Invesco Funds | | N/A | | N/A |
Adrien Deberghes – 1967 Principal Financial Officer, Treasurer and Vice President | | 2020 | | Head of the Fund Office of the CFO and Fund Administration; Vice President, Invesco Advisers, Inc.; Principal Financial Officer, Treasurer and Vice President, The Invesco Funds; Vice President, Invesco Exchange-Traded Fund Trust, Invesco Exchange-Traded Fund Trust II, Invesco India Exchange-Traded Fund Trust, Invesco Actively Managed Exchange-Traded Fund Trust, Invesco Actively Managed Exchange-Traded Commodity Fund Trust and Invesco Exchange-Traded Self-Indexed Fund Trust Formerly: Senior Vice President and Treasurer, Fidelity Investments | | N/A | | N/A |
Crissie M. Wisdom – 1969 Anti-Money Laundering Compliance Officer | | 2013 | | Anti-Money Laundering and OFAC Compliance Officer for Invesco U.S. entities including: Invesco Advisers, Inc. and its affiliates, Invesco Capital Markets, Inc., Invesco Distributors, Inc., Invesco Investment Services, Inc., The Invesco Funds, Invesco Capital Management, LLC, Invesco Trust Company; and Fraud Prevention Manager for Invesco Investment Services, Inc. | | N/A | | N/A |
Todd F. Kuehl – 1969 Chief Compliance Officer and Senior Vice President | | 2020 | | Chief Compliance Officer, Invesco Advisers, Inc. (registered investment adviser); and Chief Compliance Officer, The Invesco Funds and Senior Vice President Formerly: Managing Director and Chief Compliance Officer, Legg Mason (Mutual Funds); Chief Compliance Officer, Legg Mason Private Portfolio Group (registered investment adviser) | | N/A | | N/A |
Michael McMaster – 1962 Chief Tax Officer, Vice President and Assistant Treasurer | | 2020 | | Head of Global Fund Services Tax; Chief Tax Officer, Vice President and Assistant Treasurer, The Invesco Funds; Vice President, Invesco Advisers, Inc.; Assistant Treasurer, Invesco Capital Management LLC, Assistant Treasurer and Chief Tax Officer, Invesco Exchange-Traded Fund Trust, Invesco Exchange-Traded Fund Trust II, Invesco India Exchange-Traded Fund Trust, Invesco Actively Managed Exchange-Traded Fund Trust, Invesco Actively Managed Exchange-Traded Commodity Fund Trust and Invesco Exchange-Traded Self-Indexed Fund Trust; Assistant Treasurer, Invesco Specialized Products, LLC Formerly: Senior Vice President – Managing Director of Tax Services, U.S. Bank Global Fund Services (GFS) | | N/A | | N/A |
The Statement of Additional Information of the Trust includes additional information about the Fund’s Trustees and is available upon request, without charge, by calling 1.800.959.4246. Please refer to the Fund’s Statement of Additional Information for information on the Fund’s sub-advisers.
| | | | | | |
| Office of the Fund | | Investment Adviser | | Distributor | | Auditors |
| 11 Greenway Plaza, Suite 1000 | | Invesco Advisers, Inc. | | Invesco Distributors, Inc. | | PricewaterhouseCoopers LLP |
| Houston, TX 77046-1173 | | 1555 Peachtree Street, N.E. | | 11 Greenway Plaza, Suite 1000 | | 1000 Louisiana Street, Suite 5800 |
| | Atlanta, GA 30309 | | Houston, TX 77046-1173 | | Houston, TX 77002-5678 |
| | | |
| Counsel to the Fund | | Counsel to the Independent Trustees | | Transfer Agent | | Custodian |
| Stradley Ronon Stevens & Young, LLP | | Goodwin Procter LLP | | Invesco Investment Services, Inc. | | State Street Bank and Trust Company |
| 2005 Market Street, Suite 2600 | | 901 New York Avenue, N.W. | | 11 Greenway Plaza, Suite 1000 | | 225 Franklin Street |
| Philadelphia, PA 19103-7018 | | Washington, D.C. 20001 | | Houston, TX 77046-1173 | | Boston, MA 02110-2801 |
T-7 Invesco American Value Fund
(This page intentionally left blank)
(This page intentionally left blank)

Go paperless with eDelivery
Visit invesco.com/edelivery to enjoy the convenience and security of anytime electronic access to your investment documents.
With eDelivery, you can elect to have any or all of the following materials delivered straight to your inbox to download, save and print from your own computer:
| ∎ | | Fund reports and prospectuses |
Invesco mailing information
Send general correspondence to Invesco Investment Services, Inc., P.O. Box 219078, Kansas City, MO 64121-9078.
Important notice regarding delivery of security holder documents
To reduce Fund expenses, only one copy of most shareholder documents may be mailed to shareholders with multiple accounts at the same address (Householding). Mailing of your shareholder documents may be householded indefinitely unless you instruct us otherwise. If you do not want the mailing of these documents to be combined with those for other members of your household, please contact Invesco Investment Services, Inc. at 800 959 4246 or contact your financial institution. We will begin sending you individual copies for each account within 30 days after receiving your request.
Fund holdings and proxy voting information
The Fund provides a complete list of its portfolio holdings four times each fiscal year, at the end of each fiscal quarter. For the second and fourth quarters, the list appears, respectively, in the Fund’s semiannual and annual reports to shareholders. For the first and third quarters, the Fund files the list with the Securities and Exchange Commission (SEC) as an exhibit to its reports on Form N-PORT. The most recent list of portfolio holdings is available at invesco.com/completeqtrholdings. Shareholders can also look up the Fund’s Form N-PORT filings on the SEC website, sec.gov. The SEC file numbers for the Fund are shown below.
A description of the policies and procedures that the Fund uses to determine how to vote proxies relating to portfolio securities is available without charge, upon request, from our Client Services department at 800 959 4246, or at invesco.com/ corporate/about-us/esg. The information is also available on the SEC website, sec.gov.
| | |
Information regarding how the Fund voted proxies related to its portfolio securities during the most recent 12-month period ended June 30 is available at invesco.com/proxysearch. This information is also available on the SEC website, sec.gov. | |
|
Invesco Advisers, Inc. is an investment adviser; it provides investment advisory services to individual and institutional clients and does not sell securities. Invesco Distributors, Inc. is the US distributor for Invesco Ltd.’s retail mutual funds, exchange-traded funds and institutional money market funds. Both are wholly owned, indirect subsidiaries of Invesco Ltd. |
| | | | |
SEC file numbers: 811-03826 and 002-85905 | | Invesco Distributors, Inc. | | VK-AMVA-AR-1 |
| | | | |
| | |
| | |
 | | Annual Report to Shareholders | | April 30, 2021 |
| | Invesco Comstock Fund |
| | Nasdaq: | | |
| | A: ACSTX ∎ C: ACSYX ∎ R: ACSRX ∎ Y: ACSDX ∎ R5: ACSHX ∎ R6: ICSFX |

Management’s Discussion of Fund Performance
| | | | |
| Performance summary | |
| For the fiscal year ended April 30, 2021, Class A shares of Invesco Comstock Fund (the Fund), at net asset value (NAV), outperformed the Russell 1000 Value Index, the Fund’s style-specific benchmark. | |
Your Fund’s long-term performance appears later in this report. | |
| Fund vs. Indexes | |
| Total returns, 4/30/20 to 4/30/21, at net asset value (NAV). Performance shown does not include applicable contingent deferred sales charges (CDSC) or front-end sales charges, which would have reduced performance. | |
| |
| Class A Shares | | | 56.98 | % |
| Class C Shares | | | 55.77 | |
| Class R Shares | | | 56.50 | |
| Class Y Shares | | | 57.37 | |
| Class R5 Shares | | | 57.39 | |
| Class R6 Shares | | | 57.56 | |
| S&P 500 Indexq (Broad Market Index) | | | 45.98 | |
| Russell 1000 Value Indexq (Style-Specific Index) | | | 45.92 | |
| Lipper Large-Cap Value Funds Index∎ (Peer Group Index) | | | 48.33 | |
| Source(s): qRIMES Technologies Corp.; ∎Lipper Inc. | | | | |
Market conditions and your Fund
As many businesses began to shut down in April 2020 due to the pandemic, US unemployment numbers continued to climb, as the economy ground to a halt. However, during the second and into the third quarter of 2020, US stocks largely shrugged off economic uncertainty, social unrest and a resurgence in coronavirus (COVID-19) infections to rally from the market bottom. Investor sentiment improved in response to trillions of dollars in economic stimulus, progress on a coronavirus vaccine and re-openings in many US regions. In July, the US Federal Reserve (the Fed) extended its emergency stimulus programs, originally scheduled to end in September, to year-end, which provided support to equities. In late August, second-quarter gross domestic product (GDP) fell by 31.4%,1 a record decline. Despite the extreme drop in the economy, the S&P 500 Index not only erased all its losses from the first quarter but made record highs.
Despite a September selloff, US equity markets posted gains in the third quarter as the Fed extended its emergency stimulus programs and changed its inflation target policy, both of which supported equities. Data for both manufacturing and services indicated expansion, a reversal from significant declines earlier in the year. Corporate earnings were also better than anticipated and a gradual decline in new COVID-19 infections in many regions, combined with optimism about progress on a coronavirus vaccine, further boosted stocks. October saw increased volatility as COVID-19 infection rates rose to record highs in the US and Europe. Investors also became concerned about delayed results from the US presidential election and the real possibility of a contested election, further delaying a clear winner.
US equity markets posted gains in the fourth quarter, as positive news on COVID-19 vaccines and strong corporate earnings outweighed investor concerns about the political disagreement over a fiscal stimulus package and sharply rising coronavirus infections nationwide. Cyclical sectors like energy and financials led the way, while real estate and consumer staples lagged. Market leadership also shifted during the quarter with value stocks outperforming growth for the first time since the fourth quarter of 2016. While the US economy rebounded significantly since the pandemic began, the recovery appeared to slow in the fourth quarter with employment gains and GDP growth down from the third quarter. However, stocks were buoyed by the Fed’s pledge to maintain its accommodative stance and asset purchases, “until substantial further progress has been made” toward employment and inflation targets.
US political unrest and rising COVID-19 infection rates marked the start of the first quarter of 2021. Additionally, retail investors bid up select stocks like GameStop and AMC Theaters, ultimately causing a sharp selloff in late January. Corporate earnings generally beat expectations, but market volatility rose during the quarter as investors worried about rising bond yields and inflation. Despite the Federal Reserve’s commitment to an accommodative policy, the 10-year US Treasury yield rose from 0.92% at year-end to 1.63%2 at the fiscal year-end. Approval of a third COVID-19 vaccine boosted investors’ optimism for faster economic recovery. Although March saw increased volatility with consecutive down days in the US stock market, stocks continued to hit all-time highs through April. US stocks had strong returns for the fiscal year, with the S&P 500 Index returning 45.98% for the year.3
On the positive side, strong security selection in the industrials sector was a key contributor
to the Fund’s relative return compared to the Fund’s style-specific index. FedEx was the largest individual contributor, followed by Textron and Johnson Controls International. We invested in FedEx based on its ability to charge higher prices amid a reduction in international air capacity, its lower cost structures resulting from a more efficient fleet and lower operating costs stemming from the integration of TNT Express (not owned), all of which we believe will contribute to an eventual recovery in profit margins.
Strong security selection and an overweight in the financials sector was a notable contributor to relative return for the fiscal year. Citizens Financial Group, Fifth Third Bancorp, Bank of America, Morgan Stanley and American International Group were leading performers the first quarter of 2021. Investor enthusiasm surrounding the approval of three COVID-19 vaccines and the potential for reopening economies pushed yields higher and financial stocks benefited.
Owning Archer-Daniels-Midland that returned over 75% for the period, while not owning Procter & Gamble and Walmart that materially underperformed the sector, were some of the largest contributors.
Strong stock selection in health care contributed to relative returns compared to the Fund’s style-specific index for the fiscal year. Not owning Gilead Sciences and holding HCA Healthcare were the top contributors. HCA Healthcare returned over 83% for the period as the company’s revenue and profits benefited due to the ban being lifted on elective surgeries in the US.
Stock selection and an overweight within information technology was also a large contributor to relative performance for the period. QUALCOMM and NXP Semiconductors were the largest contributors to the Fund’s performance. Technology companies, notably semiconductors, benefited from increased demand as employees in most service sectors worked from home.
A material underweight to real estate and utilities also benefited relative performance for the quarter. Both sectors’ returns lagged the majority of the Russell 1000 Value sectors for the period.
On the negative side, the Fund’s cash position, averaging less than 3% for the period, detracted from relative return compared to the Russell 1000 Value Index, as expected during a strong equity rally.
Stock selection in communication services also hampered relative returns compared to the Fund’s style-specific index. Despite a few stocks held within the sector slightly contributing to relative returns, the Fund’s overall underweight to the sector and lack of holding certain outperforming names detracted from relative returns. We remain materially underweight in the sector due to unattractive valuations, in our view.
We used currency forward contracts during the year for the purpose of hedging currency
2 Invesco Comstock Fund
exposure of non-US-based companies held in the Fund. Derivatives were used solely for hedging. The use of currency forward contracts had a negative impact on the Fund’s performance relative to the Russell 1000 Value Index for the fiscal year.
As we have seen a rotation toward value stocks, we remain cautiously optimistic about the longer-term outlook for the US and global economies. Though the distribution of coronavirus vaccines should provide a measure of stability, we believe equity markets may experience continued volatility due to rising yields, increased COVID-19 infection rates in some US states and a massive resurgence of COVID-19 in India.
Thank you for your investment in the Invesco Comstock Fund and for sharing our long-term investment horizon.
| 1 | Source: US Bureau of Economic Analysis |
Portfolio manager(s):
Devin Armstrong - Lead
Charles DyReyes
Kevin Holt - Lead
James (Jay) Warwick
The views and opinions expressed in management’s discussion of Fund performance are those of Invesco Advisers, Inc. These views and opinions are subject to change at any time based on factors such as market and economic conditions. These views and opinions may not be relied upon as investment advice or recommendations, or as an offer for a particular security. The information is not a complete analysis of every aspect of any market, country, industry, security or the Fund. Statements of fact are from sources considered reliable, but Invesco Advisers, Inc. makes no representation or warranty as to their completeness or accuracy. Although historical performance is no guarantee of future results, these insights may help you understand our investment management philosophy.
See important Fund and, if applicable, index disclosures later in this report.
3 Invesco Comstock Fund
Your Fund’s Long-Term Performance
Results of a $10,000 Investment — Oldest Share Class(es)
Fund and index data from 4/30/11
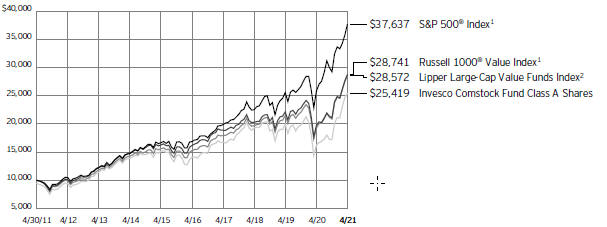
| 1 | Source: RIMES Technologies Corp. |
Past performance cannot guarantee future results.
The data shown in the chart include reinvested distributions, applicable sales charges and Fund expenses including management
fees. Index results include reinvested dividends, but they do not reflect sales charges. Performance of the peer group, if applicable, reflects fund expenses and management fees;
performance of a market index does not. Performance shown in the chart does not reflect deduction of taxes a shareholder would pay on Fund distributions or sale of Fund shares.
4 Invesco Comstock Fund
| | | | |
| Average Annual Total Returns | |
| As of 4/30/21, including maximum applicable sales charges | |
| |
| Class A Shares | | | | |
| Inception (10/7/68) | | | 10.77 | % |
| 10 Years | | | 9.78 | |
5 Years | | | 11.21 | |
1 Year | | | 48.36 | |
| |
| Class C Shares | | | | |
| Inception (10/26/93) | | | 9.82 | % |
| 10 Years | | | 9.74 | |
5 Years | | | 11.65 | |
1 Year | | | 54.77 | |
| |
| Class R Shares | | | | |
| Inception (10/1/02) | | | 9.45 | % |
| 10 Years | | | 10.13 | |
5 Years | | | 12.19 | |
1 Year | | | 56.50 | |
| |
| Class Y Shares | | | | |
| Inception (10/29/04) | | | 8.41 | % |
| 10 Years | | | 10.68 | |
5 Years | | | 12.76 | |
1 Year | | | 57.37 | |
| |
| Class R5 Shares | | | | |
| Inception (6/1/10) | | | 12.61 | % |
| 10 Years | | | 10.78 | |
5 Years | | | 12.83 | |
1 Year | | | 57.39 | |
| |
| Class R6 Shares | | | | |
| 10 Years | | | 10.80 | % |
5 Years | | | 12.94 | |
1 Year | | | 57.56 | |
Effective June 1, 2010, Class A, Class C, Class I and Class R shares of the predecessor fund, Van Kampen Comstock Fund, advised by Van Kampen Asset Management were reorganized into Class A, Class C, Class Y and Class R shares, respectively, of Invesco Van Kampen Comstock Fund (renamed Invesco Comstock Fund). Returns shown above, prior to June 1, 2010, for Class A, Class C, Class R and Class Y shares are those of Class A, Class C, Class R and Class I shares of the predecessor fund. Share class returns will differ from the predecessor fund because of different expenses.
Class R6 shares incepted on September 24, 2012. Performance shown prior to that date is that of the Fund’s Class A shares at net asset value and includes the 12b-1 fees applicable to Class A shares.
The performance data quoted represent past performance and cannot guarantee future results; current performance may be lower or higher. Please visit invesco.com/ performance for the most recent month-end performance. Performance figures reflect reinvested distributions, changes in net asset value and the effect of the maximum sales charge unless otherwise stated. Performance figures do not reflect deduction of taxes a shareholder would pay on Fund distributions or sale of Fund shares.
Investment return and principal value will fluctuate so that you may have a gain or loss when you sell shares.
Class A share performance reflects the maximum 5.50% sales charge, and Class C share performance reflects the applicable contingent deferred sales charge (CDSC) for the period involved. The CDSC on Class C shares is 1% for the first year after purchase. Class R, Class Y, Class R5 and Class R6 shares do not have a front-end sales charge or a CDSC; therefore, performance is at net asset value.
The performance of the Fund’s share classes will differ primarily due to different sales charge structures and class expenses.
Fund performance reflects any applicable fee waivers and/or expense reimbursements. Had the adviser not waived fees and/or reimbursed expenses currently or in the past, returns would have been lower. See current prospectus for more information.
5 Invesco Comstock Fund
Supplemental Information
Invesco Comstock Fund’s investment objective is total return through growth of capital and current income.
| ∎ | | Unless otherwise stated, information presented in this report is as of April 30, 2021, and is based on total net assets. |
| ∎ | | Unless otherwise noted, all data is provided by Invesco. |
| ∎ | | To access your Fund’s reports/prospectus, visit invesco.com/fundreports. |
About indexes used in this report
| ∎ | | The S&P 500® Index is an unmanaged index considered representative of the US stock market. |
| ∎ | | The Russell 1000® Value Index is an unmanaged index considered representative of large-cap value stocks. The Russell 1000 Value Index is a trademark/service mark of the Frank Russell Co. Russell® is a trademark of the Frank Russell Co. |
| ∎ | | The Lipper Large-Cap Value Funds Index is an unmanaged index considered representative of large-cap value funds tracked by Lipper. |
| ∎ | | The Fund is not managed to track the performance of any particular index, including the index(es) described here, and consequently, the performance of the Fund may deviate significantly from the performance of the index(es). |
| ∎ | | A direct investment cannot be made in an index. Unless otherwise indicated, index results include reinvested dividends, and they do not reflect sales charges. Performance of the peer group, if applicable, reflects fund expenses; performance of a market index does not. |
Liquidity Risk Management Program
In compliance with Rule 22e-4 under the Investment Company Act of 1940, as amended (the “Liquidity Rule”), the Fund has adopted and implemented a liquidity risk management program in accordance with the Liquidity Rule (the “Program”). The Program is reasonably designed to assess and manage the Fund’s liquidity risk, which is the risk that the Fund could not meet redemption requests without significant dilution of remaining investors’ interests in the Fund. The Board of Trustees of the Fund (the “Board”) has appointed Invesco Advisers, Inc. (“Invesco”), the Fund’s investment adviser, as the Program’s administrator, and Invesco has delegated oversight of the Program to the Liquidity Risk Management Committee (the “Committee”), which is composed of senior representatives from relevant business groups at Invesco.
As required by the Liquidity Rule, the Program includes policies and procedures providing
for an assessment, no less frequently than annually, of the Fund’s liquidity risk that takes into account, as relevant to the Fund’s liquidity risk: (1) the Fund’s investment strategy and liquidity of portfolio investments during both normal and reasonably foreseeable stressed conditions; (2) short-term and long-term cash flow projections for the Fund during both normal and reasonably foreseeable stressed conditions; and (3) the Fund’s holdings of cash and cash equivalents and any borrowing arrangements. The Liquidity Rule also requires the classification of the Fund’s investments into categories that reflect the assessment of their relative liquidity under current market conditions. The Fund classifies its investments into one of four categories defined in the Liquidity Rule: “Highly Liquid,” “Moderately Liquid,” “Less Liquid,” and “Illiquid.” Funds that are not invested primarily in “Highly Liquid Investments” that are assets (cash or investments that are reasonably expected to be convertible into cash within three business days without significantly changing the market value of the investment) are required to establish a “Highly Liquid Investment Minimum” (“HLIM”), which is the minimum percentage of net assets that must be invested in Highly Liquid Investments. Funds with HLIMs have procedures for addressing HLIM shortfalls, including reporting to the Board and the SEC (on a non-public basis) as required by the Program and the Liquidity Rule. In addition, the Fund may not acquire an investment if, immediately after the acquisition, over 15% of the Fund’s net assets would consist of “Illiquid Investments” that are assets (an investment that cannot reasonably be expected to be sold or disposed of in current market conditions in seven calendar days or less without the sale or disposition significantly changing the market value of the investment). The Liquidity Rule and the Program also require reporting to the Board and the SEC (on a non-public basis) if a Fund’s holdings of Illiquid Investments exceed 15% of the Fund’s assets.
At a meeting held on March 22-24, 2021, the Committee presented a report to the Board that addressed the operation of the
Program and assessed the Program’s adequacy and effectiveness of implementation (the “Report”). The Report covered the period from January 1, 2020 through December 31, 2020 (the “Program Reporting Period”). The Report discussed notable events affecting liquidity over the Program Reporting Period, including the impact of the coronavirus pandemic on the Fund and the overall market. The Report noted that there were no material changes to the Program during the Program Reporting Period.
The Report stated, in relevant part, that during the Program Reporting Period:
| ∎ | | The Program, as adopted and implemented, remained reasonably designed to assess and manage the Fund’s liquidity risk and was operated effectively to achieve that goal; |
| ∎ | | The Fund’s investment strategy remained appropriate for an open-end fund; |
| ∎ | | The Fund was able to meet requests for redemption without significant dilution of remaining investors’ interests in the Fund; |
| ∎ | | The Fund did not breach the 15% limit on Illiquid Investments; and |
| ∎ | | The Fund primarily held Highly Liquid Investments and therefore has not adopted an HLIM. |
|
| This report must be accompanied or preceded by a currently effective Fund prospectus, which contains more complete information, including sales charges and expenses. Investors should read it carefully before investing. |
NOT FDIC INSURED | MAY LOSE VALUE | NO BANK GUARANTEE |
6 Invesco Comstock Fund
Fund Information
Portfolio Composition
| | |
| By sector | | % of total net assets |
Financials | | 25.11% |
Health Care | | 15.24 |
Industrials | | 13.15 |
Information Technology | | 11.43 |
Energy | | 10.25 |
Consumer Staples | | 8.07 |
Materials | | 5.00 |
Consumer Discretionary | | 4.73 |
Communication Services | | 2.72 |
Other Sectors, Each Less than 2% of Net Assets | | 2.93 |
Money Market Funds Plus Other Assets Less Liabilities | | 1.37 |
Top 10 Equity Holdings*
| | | | |
| | | | | % of total net assets |
| 1. | | Citigroup, Inc. | | 3.69% |
| 2. | | Bank of America Corp. | | 3.66 |
| 3. | | Philip Morris International, Inc. | | 2.99 |
| 4. | | American International Group, Inc. | | 2.50 |
| 5. | | Anthem, Inc. | | 2.41 |
| 6. | | HCA Healthcare, Inc. | | 2.34 |
| 7. | | Wells Fargo & Co. | | 2.24 |
| 8. | | General Motors Co. | | 2.12 |
| 9. | | Cisco Systems, Inc. | | 2.08 |
| 10. | | Morgan Stanley | | 2.05 |
The Fund’s holdings are subject to change, and there is no assurance that the Fund will continue to hold any particular security.
* Excluding money market fund holdings, if any.
Data presented here are as of April 30, 2021.
7 Invesco Comstock Fund
Schedule of Investments(a)
April 30, 2021
| | | | | | | | |
| | | Shares | | | Value | |
Common Stocks & Other Equity Interests–98.63% | |
Aerospace & Defense–1.75% | | | | | | | | |
Textron, Inc. | | | 2,643,987 | | | $ | 169,849,725 | |
| | |
Agricultural Products–0.33% | | | | | | | | |
Archer-Daniels-Midland Co. | | | 509,455 | | | | 32,161,894 | |
| | |
Air Freight & Logistics–1.55% | | | | | | | | |
FedEx Corp. | | | 518,952 | | | | 150,656,955 | |
| | |
Application Software–1.03% | | | | | | | | |
CDK Global, Inc. | | | 1,875,345 | | | | 100,499,739 | |
|
Asset Management & Custody Banks–2.44% | |
Bank of New York Mellon Corp. (The) | | | 3,224,640 | | | | 160,845,043 | |
State Street Corp. | | | 900,886 | | | | 75,629,380 | |
| | | | | 236,474,423 | |
| |
Automobile Manufacturers–2.12% | | | | | |
General Motors Co.(b) | | | 3,606,501 | | | | 206,363,987 | |
| | |
Building Products–2.63% | | | | | | | | |
Johnson Controls International PLC | | | 2,881,323 | | | | 179,621,676 | |
Trane Technologies PLC | | | 436,196 | | | | 75,823,951 | |
| | | | | | | | 255,445,627 | |
| | |
Cable & Satellite–1.63% | | | | | | | | |
Comcast Corp., Class A | | | 2,823,957 | | | | 158,565,186 | |
| | |
Casinos & Gaming–1.02% | | | | | | | | |
Las Vegas Sands Corp.(b) | | | 1,621,582 | | | | 99,338,113 | |
| |
Communications Equipment–2.08% | | | | | |
Cisco Systems, Inc. | | | 3,959,878 | | | | 201,597,389 | |
|
Construction Machinery & Heavy Trucks–1.98% | |
Caterpillar, Inc. | | | 842,885 | | | | 192,270,497 | |
| | |
Consumer Finance–0.45% | | | | | | | | |
Capital One Financial Corp. | | | 293,022 | | | | 43,683,720 | |
| | |
Diversified Banks–10.92% | | | | | | | | |
Bank of America Corp. | | | 8,779,066 | | | | 355,815,545 | |
Citigroup, Inc. | | | 5,024,486 | | | | 357,944,383 | |
JPMorgan Chase & Co. | | | 840,129 | | | | 129,220,241 | |
Wells Fargo & Co. | | | 4,826,180 | | | | 217,419,409 | |
| | | | | | | | 1,060,399,578 | |
| | |
Electric Utilities–1.49% | | | | | | | | |
Exelon Corp. | | | 3,230,319 | | | | 145,170,536 | |
|
Electrical Components & Equipment–3.81% | |
Eaton Corp. PLC | | | 1,353,857 | | | | 193,506,781 | |
Emerson Electric Co. | | | 1,947,337 | | | | 176,214,525 | |
| | | | | | | | 369,721,306 | |
| |
Fertilizers & Agricultural Chemicals–2.59% | | | | | |
CF Industries Holdings, Inc. | | | 2,685,148 | | | | 130,578,747 | |
Corteva, Inc. | | | 2,472,196 | | | | 120,544,277 | |
| | | | | | | | 251,123,024 | |
| | | | | | | | |
| | | Shares | | | Value | |
Health Care Distributors–2.34% | | | | | |
Henry Schein, Inc.(b) | | | 1,483,120 | | | $ | 107,526,200 | |
McKesson Corp. | | | 635,976 | | | | 119,283,659 | |
| | | | | | | | 226,809,859 | |
| |
Health Care Equipment–0.30% | | | | | |
Baxter International, Inc. | | | 337,820 | | | | 28,947,796 | |
| | |
Health Care Facilities–3.46% | | | | | | | | |
HCA Healthcare, Inc. | | | 1,130,999 | | | | 227,398,659 | |
Universal Health Services, Inc., Class B | | | 734,502 | | | | 109,007,442 | |
| | | | | | | | 336,406,101 | |
| | |
Health Care Services–1.17% | | | | | | | | |
CVS Health Corp. | | | 1,487,695 | | | | 113,659,898 | |
| | |
Health Care Supplies–0.83% | | | | | | | | |
DENTSPLY SIRONA, Inc. | | | 1,198,533 | | | | 80,912,963 | |
| | |
Hotel & Resort REITs–0.92% | | | | | | | | |
Host Hotels & Resorts, Inc.(b) | | | 4,900,665 | | | | 88,996,076 | |
| |
Hotels, Resorts & Cruise Lines–1.02% | | | | | |
Booking Holdings, Inc.(b) | | | 40,098 | | | | 98,884,876 | |
| |
Industrial Conglomerates–1.43% | | | | | |
General Electric Co. | | | 10,611,396 | | | | 139,221,516 | |
| | |
Integrated Oil & Gas–3.09% | | | | | | | | |
Chevron Corp. | | | 1,742,757 | | | | 179,625,964 | |
Suncor Energy, Inc. (Canada) | | | 5,607,448 | | | | 120,111,536 | |
| | | | | | | | 299,737,500 | |
|
Integrated Telecommunication Services–1.09% | |
AT&T, Inc. | | | 3,368,166 | | | | 105,794,094 | |
| |
Internet & Direct Marketing Retail–0.56% | | | | | |
eBay, Inc. | | | 977,103 | | | | 54,512,576 | |
| |
Investment Banking & Brokerage–3.73% | | | | | |
Goldman Sachs Group, Inc. (The) | | | 467,291 | | | | 162,827,549 | |
Morgan Stanley | | | 2,410,720 | | | | 199,004,936 | |
| | | | | | | | 361,832,485 | |
| |
IT Consulting & Other Services–2.12% | | | | | |
Cognizant Technology Solutions Corp., Class A | | | 2,125,211 | | | | 170,866,965 | |
DXC Technology Co.(b) | | | 1,073,021 | | | | 35,313,121 | |
| | | | | | | | 206,180,086 | |
| | |
Life & Health Insurance–1.01% | | | | | | | | |
MetLife, Inc. | | | 1,542,055 | | | | 98,120,960 | |
| | |
Managed Health Care–2.61% | | | | | | | | |
Anthem, Inc. | | | 615,679 | | | | 233,582,456 | |
UnitedHealth Group, Inc. | | | 49,024 | | | | 19,550,771 | |
| | | | | | | | 253,133,227 | |
| | |
Multi-line Insurance–2.50% | | | | | | | | |
American International Group, Inc. | | | 5,020,951 | | | | 243,265,076 | |
See accompanying Notes to Financial Statements which are an integral part of the financial statements.
8 Invesco Comstock Fund
| | | | | | | | |
| | | Shares | | | Value | |
Oil & Gas Exploration & Production–7.16% | | | | | |
Canadian Natural Resources Ltd. (Canada) | | | 3,199,066 | | | $ | 97,105,441 | |
ConocoPhillips | | | 1,302,549 | | | | 66,612,356 | |
Devon Energy Corp. | | | 5,165,425 | | | | 120,767,637 | |
Hess Corp. | | | 1,680,436 | | | | 125,209,286 | |
Marathon Oil Corp. | | | 12,223,824 | | | | 137,640,258 | |
Pioneer Natural Resources Co. | | | 962,371 | | | | 148,041,531 | |
| | | | | | | | 695,376,509 | |
|
Packaged Foods & Meats–1.51% | |
Kraft Heinz Co. (The) | | | 1,849,527 | | | | 76,366,970 | |
Tyson Foods, Inc., Class A | | | 910,005 | | | | 70,479,887 | |
| | | | | | | | 146,846,857 | |
|
Paper Packaging–1.63% | |
International Paper Co. | | | 2,725,167 | | | | 158,059,686 | |
|
Pharmaceuticals–4.53% | |
Bristol-Myers Squibb Co. | | | 1,907,542 | | | | 119,068,772 | |
Johnson & Johnson | | | 1,041,402 | | | | 169,467,347 | |
Sanofi, ADR (France)(c) | | | 2,899,528 | | | | 151,848,281 | |
| | | | | | | | 440,384,400 | |
| |
Property & Casualty Insurance–1.22% | | | | | |
Allstate Corp. (The) | | | 935,398 | | | | 118,608,466 | |
|
Real Estate Services–0.52% | |
Jones Lang LaSalle, Inc.(b) | | | 269,763 | | | | 50,691,165 | |
| | |
Regional Banks–2.84% | | | | | | | | |
Citizens Financial Group, Inc. | | | 3,080,488 | | | | 142,564,985 | |
Fifth Third Bancorp | | | 3,298,263 | | | | 133,711,582 | |
| | | | | | | | 276,276,567 | |
| | |
Semiconductors–4.64% | | | | | | | | |
Intel Corp. | | | 2,531,483 | | | | 145,636,217 | |
NXP Semiconductors N.V. (Netherlands) | | | 868,919 | | | | 167,275,596 | |
QUALCOMM, Inc. | | | 988,866 | | | | 137,254,601 | |
| | | | | | | | 450,166,414 | |
| | |
Soft Drinks–1.75% | | | | | | | | |
Coca-Cola Co. (The) | | | 3,144,732 | | | | 169,752,633 | |
| | | | | | | | |
| | | Shares | | | Value | |
Specialty Chemicals–0.79% | | | | | | | | |
DuPont de Nemours, Inc. | | | 992,550 | | | $ | 76,535,531 | |
| | |
Systems Software–1.56% | | | | | | | | |
Microsoft Corp. | | | 598,986 | | | | 151,052,289 | |
| | |
Tobacco–4.48% | | | | | | | | |
Altria Group, Inc. | | | 3,020,978 | | | | 144,251,699 | |
Philip Morris International, Inc. | | | 3,057,453 | | | | 290,458,035 | |
| | | | | | | | 434,709,734 | |
Total Common Stocks & Other Equity Interests
(Cost $5,487,842,514) | | | | 9,578,197,039 | |
| | |
Money Market Funds–1.42% | | | | | | | | |
Invesco Government & Agency Portfolio, Institutional
Class, 0.03%(d)(e) | | | 47,711,355 | | | | 47,711,355 | |
Invesco Liquid Assets Portfolio, Institutional Class, 0.01%(d)(e) | | | 35,284,621 | | | | 35,298,735 | |
Invesco Treasury Portfolio, Institutional Class, 0.01%(d)(e) | | | 54,527,262 | | | | 54,527,262 | |
Total Money Market Funds
(Cost $137,521,635) | | | | 137,537,352 | |
TOTAL INVESTMENTS IN SECURITIES (excluding investments purchased with cash collateral from securities on loan)-100.05%
(Cost $5,625,364,149) | | | | | | | 9,715,734,391 | |
|
Investments Purchased with Cash Collateral from Securities on Loan | |
Money Market Funds–0.48% | |
Invesco Private Government Fund, 0.01%(d)(e)(f) | | | 18,814,880 | | | | 18,814,880 | |
Invesco Private Prime Fund, 0.11%(d)(e)(f) | | | 28,211,036 | | | | 28,222,320 | |
Total Investments Purchased with Cash Collateral from Securities on Loan
(Cost $47,037,200) | | | | 47,037,200 | |
TOTAL INVESTMENTS IN SECURITIES-100.53%
(Cost $5,672,401,349) | | | | 9,762,771,591 | |
OTHER ASSETS LESS LIABILITIES-(0.53)% | | | | | | | (51,681,003 | ) |
NET ASSETS-100.00% | | | | | | $ | 9,711,090,588 | |
Investment Abbreviations:
ADR – American Depositary Receipt
REIT – Real Estate Investment Trust
Notes to Schedule of Investments:
| (a) | Industry and/or sector classifications used in this report are generally according to the Global Industry Classification Standard, which was developed by and is the exclusive property and a service mark of MSCI Inc. and Standard & Poor’s. |
| (b) | Non-income producing security. |
| (c) | All or a portion of this security was out on loan at April 30, 2021. |
| (d) | Affiliated issuer. The issuer and/or the Fund is a wholly-owned subsidiary of Invesco Ltd., or is affiliated by having an investment adviser that is under common control of Invesco Ltd. The table below shows the Fund’s transactions in, and earnings from, its investments in affiliates for the fiscal year ended April 30, 2021. |
| | | | | | | | | | | | | | | | | | | | | | | | | | | | | | | | | | | |
| | | Value April 30, 2020 | | Purchases at Cost | | Proceeds from Sales | | Change in
Unrealized
Appreciation
(Depreciation) | | Realized
Gain | | Value April 30, 2021 | | Dividend
Income |
Investments in Affiliated Money Market Funds: | | | | | | | | | | | | | | | | | | | | | | | | | | | | | | | | | | | |
Invesco Government & Agency Portfolio, Institutional Class | | | $ | 69,472,866 | | | | $ | 734,674,487 | | | | $ | (756,435,998 | ) | | | $ | - | | | | $ | - | | | | $ | 47,711,355 | | | | $ | 33,178 | |
Invesco Liquid Assets Portfolio, Institutional Class | | | | 50,852,076 | | | | | 524,767,491 | | | | | (540,311,428 | ) | | | | (30,768 | ) | | | | 21,364 | | | | | 35,298,735 | | | | | 79,216 | |
Invesco Treasury Portfolio, Institutional Class | | | | 79,397,562 | | | | | 839,627,984 | | | | | (864,498,284 | ) | | | | - | | | | | - | | | | | 54,527,262 | | | | | 28,234 | |
See accompanying Notes to Financial Statements which are an integral part of the financial statements.
9 Invesco Comstock Fund
| | | | | | | | | | | | | | | | | | | | | | | | | | | | | | | | | | | |
| | | Value April 30, 2020 | | Purchases at Cost | | Proceeds from Sales | | Change in
Unrealized
Appreciation
(Depreciation) | | Realized
Gain | | Value April 30, 2021 | | Dividend
Income |
Investments Purchased with Cash Collateral from Securities on Loan: | | | | | | | | | | | | | | | | |
Invesco Private Government Fund | | | $ | - | | | | $ | 300,967,391 | | | | $ | (282,152,511 | ) | | | $ | - | | | | $ | - | | | | $ | 18,814,880 | | | | $ | 1,400 | * |
Invesco Private Prime Fund | | | | - | | | | | 322,538,217 | | | | | (294,315,897 | ) | | | | - | | | | | - | | | | | 28,222,320 | | | | | 5,518 | * |
Total | | | $ | 199,722,504 | | | | $ | 2,722,575,570 | | | | $ | (2,737,714,118 | ) | | | $ | (30,768 | ) | | | $ | 21,364 | | | | $ | 184,574,552 | | | | $ | 147,546 | |
| | * | Represents the income earned on the investment of cash collateral, which is included in securities lending income on the Statement of Operations. Does not include rebates and fees paid to lending agent or premiums received from borrowers, if any. |
| (e) | The rate shown is the 7-day SEC standardized yield as of April 30, 2021. |
| (f) | The security has been segregated to satisfy the commitment to return the cash collateral received in securities lending transactions upon the borrower’s return of the securities loaned. See Note 1I. |
| | | | | | | | | | | | | | | | | |
| Open Forward Foreign Currency Contracts |
Settlement Date | | | | Contract to | | Unrealized Appreciation (Depreciation) |
| | Counterparty | | Deliver | | Receive |
Currency Risk | | | | | | | | | | | | | | | | | |
05/28/2021 | | Royal Bank of Canada | | | EUR | 62,067,780 | | | | USD | 74,951,314 | | | | $ | 295,359 | |
| | | | |
Currency Risk | | | | | | | | | | | | | | | | | |
05/28/2021 | | Deutsche Bank AG | | | CAD | 2,958,858 | | | | USD | 2,407,317 | | | | | (29 | ) |
05/28/2021 | | J.P. Morgan Chase Bank, N.A. | | | EUR | 1,451,658 | | | | USD | 1,745,452 | | | | | (622 | ) |
05/28/2021 | | Royal Bank of Canada | | | CAD | 132,399,080 | | | | USD | 106,810,490 | | | | | (910,296 | ) |
Subtotal-Depreciation | | | | | | | | | | | | | | (910,947 | ) |
Total Forward Foreign Currency Contracts | | | | | | | | | | | | | $ | (615,588 | ) |
Abbreviations:
CAD – Canadian Dollar
EUR – Euro
USD – U.S. Dollar
See accompanying Notes to Financial Statements which are an integral part of the financial statements.
10 Invesco Comstock Fund
Statement of Assets and Liabilities
April 30, 2021
| | | | |
Assets: | | | | |
| |
Investments in securities, at value
(Cost $5,487,842,514)* | | $ | 9,578,197,039 | |
Investments in affiliated money market funds, at value
(Cost $184,558,835) | | | 184,574,552 | |
Other investments: | | | | |
Unrealized appreciation on forward foreign currency contracts outstanding | | | 295,359 | |
Foreign currencies, at value
(Cost $616) | | | 619 | |
Receivable for: | | | | |
Investments sold | | | 11,883,432 | |
Fund shares sold | | | 5,521,383 | |
Dividends | | | 10,025,782 | |
Investment for trustee deferred compensation and retirement plans | | | 995,965 | |
Other assets | | | 128,434 | |
Total assets | | | 9,791,622,565 | |
| |
Liabilities: | | | | |
Other investments: | | | | |
Unrealized depreciation on forward foreign currency contracts outstanding | | | 910,947 | |
Payable for: | | | | |
Investments purchased | | | 8,073,311 | |
Fund shares reacquired | | | 15,443,865 | |
Amount due custodian | | | 3,008,874 | |
Collateral upon return of securities loaned | | | 47,037,200 | |
Accrued fees to affiliates | | | 4,005,442 | |
Accrued trustees’ and officers’ fees and benefits | | | 2,032 | |
Accrued other operating expenses | | | 912,338 | |
Trustee deferred compensation and retirement plans | | | 1,137,968 | |
Total liabilities | | | 80,531,977 | |
Net assets applicable to shares outstanding | | $ | 9,711,090,588 | |
| |
Net assets consist of: | | | | |
Shares of beneficial interest | | $ | 5,634,382,042 | |
Distributable earnings | | | 4,076,708,546 | |
| | | $ | 9,711,090,588 | |
| | | | |
Net Assets: | | | | |
| |
Class A | | $ | 5,900,703,886 | |
Class C | | $ | 91,596,836 | |
Class R | | $ | 139,450,673 | |
Class Y | | $ | 1,511,311,938 | |
Class R5 | | $ | 529,915,935 | |
Class R6 | | $ | 1,538,111,320 | |
Shares outstanding, no par value, with an unlimited number of shares authorized: | |
Class A | | | 202,866,906 | |
Class C | | | 3,148,181 | |
Class R | | | 4,793,673 | |
Class Y | | | 51,955,872 | |
Class R5 | | | 18,234,225 | |
Class R6 | | | 52,946,135 | |
Class A: | | | | |
Net asset value per share | | $ | 29.09 | |
Maximum offering price per share
(Net asset value of $29.09 ÷ 94.50%) | | $ | 30.78 | |
Class C: | | | | |
Net asset value and offering price per share | | $ | 29.10 | |
Class R: | | | | |
Net asset value and offering price per share | | $ | 29.09 | |
Class Y: | | | | |
Net asset value and offering price per share | | $ | 29.09 | |
Class R5: | | | | |
Net asset value and offering price per share | | $ | 29.06 | |
Class R6: | | | | |
Net asset value and offering price per share | | $ | 29.05 | |
* At April 30, 2021, a security with a value of $45,760,906 was on loan to brokers. | |
See accompanying Notes to Financial Statements which are an integral part of the financial statements.
11 Invesco Comstock Fund
Statement of Operations
For the year ended April 30, 2021
| | | | |
Investment income: | | | | |
Dividends (net of foreign withholding taxes of $1,468,851) | | $ | 217,291,114 | |
| |
Dividends from affiliates (includes securities lending income of $678,700) | | | 819,329 | |
| |
Total investment income | | | 218,110,443 | |
| |
| |
Expenses: | | | | |
Advisory fees | | | 32,813,714 | |
| |
Administrative services fees | | | 1,100,873 | |
| |
Custodian fees | | | 97,573 | |
| |
Distribution fees: | | | | |
Class A | | | 12,428,257 | |
| |
Class C | | | 888,106 | |
| |
Class R | | | 646,556 | |
| |
Transfer agent fees - A, C, R and Y | | | 10,178,501 | |
| |
Transfer agent fees - R5 | | | 423,973 | |
| |
Transfer agent fees - R6 | | | 144,064 | |
| |
Trustees’ and officers’ fees and benefits | | | 159,221 | |
| |
Registration and filing fees | | | 206,959 | |
| |
Reports to shareholders | | | 635,982 | |
| |
Professional services fees | | | 49,154 | |
| |
Other | | | 180,912 | |
| |
Total expenses | | | 59,953,845 | |
| |
Less: Fees waived and/or expense offset arrangement(s) | | | (213,649 | ) |
| |
Net expenses | | | 59,740,196 | |
| |
Net investment income | | | 158,370,247 | |
| |
| |
Realized and unrealized gain (loss) from: | | | | |
Net realized gain (loss) from: | | | | |
Unaffiliated investment securities | | | 258,207,786 | |
| |
Affiliated investment securities | | | 21,364 | |
| |
Foreign currencies | | | 227,835 | |
| |
Forward foreign currency contracts | | | (25,931,700 | ) |
| |
| | | 232,525,285 | |
| |
Change in net unrealized appreciation (depreciation) of: | | | | |
Unaffiliated investment securities | | | 3,541,509,631 | |
| |
Affiliated investment securities | | | (30,768 | ) |
| |
Foreign currencies | | | (38,975 | ) |
| |
Forward foreign currency contracts | | | 3,036,976 | |
| |
| | | 3,544,476,864 | |
| |
Net realized and unrealized gain | | | 3,777,002,149 | |
| |
Net increase in net assets resulting from operations | | $ | 3,935,372,396 | |
| |
See accompanying Notes to Financial Statements which are an integral part of the financial statements.
12 Invesco Comstock Fund
Statement of Changes in Net Assets
For the years ended April 30, 2021 and 2020
| | | | | | | | |
| | | 2021 | | | 2020 | |
| |
Operations: | | | | | | | | |
Net investment income | | $ | 158,370,247 | | | $ | 250,574,947 | |
| |
Net realized gain | | | 232,525,285 | | | | 2,880,894 | |
| |
Change in net unrealized appreciation (depreciation) | | | 3,544,476,864 | | | | (2,237,358,914 | ) |
| |
Net increase (decrease) in net assets resulting from operations | | | 3,935,372,396 | | | | (1,983,903,073 | ) |
| |
| | |
Distributions to shareholders from distributable earnings: | | | | | | | | |
Class A | | | (109,050,323 | ) | | | (444,075,331 | ) |
| |
Class C | | | (1,346,356 | ) | | | (9,094,284 | ) |
| |
Class R | | | (2,529,044 | ) | | | (13,299,334 | ) |
Class Y | | | (31,208,483 | ) | | | (123,114,106 | ) |
| |
Class R5 | | | (11,931,530 | ) | | | (46,403,655 | ) |
| |
Class R6 | | | (38,369,502 | ) | | | (215,265,417 | ) |
| |
Total distributions from distributable earnings | | | (194,435,238 | ) | | | (851,252,127 | ) |
| |
| | |
Share transactions-net: | | | | | | | | |
Class A | | | (786,522,668 | ) | | | (313,779,950 | ) |
| |
Class C | | | (42,907,613 | ) | | | (27,862,399 | ) |
| |
Class R | | | (48,825,482 | ) | | | (33,881,844 | ) |
| |
Class Y | | | (231,683,538 | ) | | | (178,190,047 | ) |
| |
Class R5 | | | (117,675,123 | ) | | | (78,157,119 | ) |
| |
Class R6 | | | (1,432,702,814 | ) | | | (17,285,863 | ) |
| |
Net increase (decrease) in net assets resulting from share transactions | | | (2,660,317,238 | ) | | | (649,157,222 | ) |
| |
Net increase (decrease) in net assets | | | 1,080,619,920 | | | | (3,484,312,422 | ) |
| |
| | |
Net assets: | | | | | | | | |
Beginning of year | | | 8,630,470,668 | | | | 12,114,783,090 | |
| |
End of year | | $ | 9,711,090,588 | | | $ | 8,630,470,668 | |
| |
See accompanying Notes to Financial Statements which are an integral part of the financial statements.
13 Invesco Comstock Fund
Financial Highlights
The following schedule presents financial highlights for a share of the Fund outstanding throughout the periods indicated.
| | | | | | | | | | | | | | | | | | | | | | | | | | | | | | | | | | | | | | | | | | | | | | | | | | | | | | | | |
| | | | | | | | | | | | | | | | | | | | | | | | | | | | | | | | | Ratio of | | | Ratio of | | | | | | | |
| | | | | | | | | | | | | | | | | | | | | | | | | | | | | | | | | expenses | | | expenses | | | | | | | |
| | | | | | | | | Net gains | | | | | | | | | | | | | | | | | | | | | | | | to average | | | to average net | | | | | | | |
| | | | | | | | | (losses) | | | | | | | | | | | | | | | | | | | | | | | | net assets | | | assets without | | | Ratio of net | | | | |
| | | Net asset | | | | | | on securities | | | | | | Dividends | | | Distributions | | | | | | | | | | | | | | | with fee waivers | | | fee waivers | | | investment | | | | |
| | | value, | | | Net | | | (both | | | Total from | | | from net | | | from net | | | | | | Net asset | | | | | | Net assets, | | | and/or | | | and/or | | | income | | | | |
| | | beginning | | | investment | | | realized and | | | investment | | | investment | | | realized | | | Total | | | value, end | | | Total | | | end of period | | | expenses | | | expenses | | | to average | | | Portfolio | |
| | | of period | | | income(a) | | | unrealized) | | | operations | | | income | | | gains | | | distributions | | | of period | | | return (b) | | | (000’s omitted) | | | absorbed | | | absorbed | | | net assets | | | turnover (c) | |
Class A | | | | | | | | | | | | | | | | | | | | | | | | | | | | | | | | | | | | | | | | | | | | | | | | | | | | | | | | |
Year ended 04/30/21 | | $ | 18.95 | | | $ | 0.40 | | | $ | 10.24 | | | $ | 10.64 | | | $ | (0.50 | ) | | $ | – | | | $ | (0.50 | ) | | $ | 29.09 | | | | 56.89 | % | | $ | 5,900,704 | | | | 0.82 | %(d) | | | 0.82 | %(d) | | | 1.74 | %(d) | | | 19 | % |
Year ended 04/30/20 | | | 25.18 | | | | 0.51 | | | | (4.88 | ) | | | (4.37 | ) | | | (0.52 | ) | | | (1.34 | ) | | | (1.86 | ) | | | 18.95 | | | | (18.76 | ) | | | 4,512,553 | | | | 0.82 | | | | 0.83 | | | | 2.16 | | | | 30 | |
Year ended 04/30/19 | | | 26.67 | | | | 0.46 | | | | 0.23 | | | | 0.69 | | | | (0.41 | ) | | | (1.77 | ) | | | (2.18 | ) | | | 25.18 | | | | 3.51 | | | | 6,350,025 | | | | 0.80 | | | | 0.81 | | | | 1.79 | | | | 23 | |
Year ended 04/30/18 | | | 24.03 | | | | 0.36 | | | | 3.23 | | | | 3.59 | | | | (0.36 | ) | | | (0.59 | ) | | | (0.95 | ) | | | 26.67 | | | | 15.09 | | | | 6,433,646 | | | | 0.81 | | | | 0.81 | | | | 1.38 | | | | 14 | |
Year ended 04/30/17 | | | 21.86 | | | | 0.40 | | | | 3.61 | | | | 4.01 | | | | (0.49 | ) | | | (1.35 | ) | | | (1.84 | ) | | | 24.03 | | | | 18.56 | | | | 6,350,463 | | | | 0.84 | | | | 0.84 | | | | 1.75 | | | | 18 | |
Class C | | | | | | | | | | | | | | | | | | | | | | | | | | | | | | | | | | | | | | | | | | | | | | | | | | | | | | | | |
Year ended 04/30/21 | | | 18.95 | | | | 0.23 | | | | 10.25 | | | | 10.48 | | | | (0.33 | ) | | | – | | | | (0.33 | ) | | | 29.10 | | | | 55.82 | | | | 91,597 | | | | 1.56 | (d)(e) | | | 1.56 | (d)(e) | | | 1.00 | (d)(e) | | | 19 | |
Year ended 04/30/20 | | | 25.16 | | | | 0.35 | | | | (4.87 | ) | | | (4.52 | ) | | | (0.35 | ) | | | (1.34 | ) | | | (1.69 | ) | | | 18.95 | | | | (19.32 | )(e) | | | 96,492 | | | | 1.49 | (e) | | | 1.50 | (e) | | | 1.49 | (e) | | | 30 | |
Year ended 04/30/19 | | | 26.66 | | | | 0.27 | | | | 0.21 | | | | 0.48 | | | | (0.21 | ) | | | (1.77 | ) | | | (1.98 | ) | | | 25.16 | | | | 2.68 | (e) | | | 158,707 | | | | 1.54 | (e) | | | 1.55 | (e) | | | 1.05 | (e) | | | 23 | |
Year ended 04/30/18 | | | 24.02 | | | | 0.16 | | | | 3.24 | | | | 3.40 | | | | (0.17 | ) | | | (0.59 | ) | | | (0.76 | ) | | | 26.66 | | | | 14.24 | (e) | | | 468,225 | | | | 1.55 | (e) | | | 1.55 | (e) | | | 0.64 | (e) | | | 14 | |
Year ended 04/30/17 | | | 21.85 | | | | 0.23 | | | | 3.61 | | | | 3.84 | | | | (0.32 | ) | | | (1.35 | ) | | | (1.67 | ) | | | 24.02 | | | | 17.70 | | | | 511,920 | | | | 1.59 | | | | 1.59 | | | | 1.00 | | | | 18 | |
Class R | | | | | | | | | | | | | | | | | | | | | | | | | | | | | | | | | | | | | | | | | | | | | | | | | | | | | | | | |
Year ended 04/30/21 | | | 18.95 | | | | 0.34 | | | | 10.24 | | | | 10.58 | | | | (0.44 | ) | | | – | | | | (0.44 | ) | | | 29.09 | | | | 56.50 | | | | 139,451 | | | | 1.07 | (d) | | | 1.07 | (d) | | | 1.49 | (d) | | | 19 | |
Year ended 04/30/20 | | | 25.17 | | | | 0.45 | | | | (4.87 | ) | | | (4.42 | ) | | | (0.46 | ) | | | (1.34 | ) | | | (1.80 | ) | | | 18.95 | | | | (18.95 | ) | | | 133,186 | | | | 1.07 | | | | 1.08 | | | | 1.91 | | | | 30 | |
Year ended 04/30/19 | | | 26.67 | | | | 0.40 | | | | 0.21 | | | | 0.61 | | | | (0.34 | ) | | | (1.77 | ) | | | (2.11 | ) | | | 25.17 | | | | 3.20 | | | | 212,843 | | | | 1.05 | | | | 1.06 | | | | 1.54 | | | | 23 | |
Year ended 04/30/18 | | | 24.03 | | | | 0.29 | | | | 3.24 | | | | 3.53 | | | | (0.30 | ) | | | (0.59 | ) | | | (0.89 | ) | | | 26.67 | | | | 14.80 | | | | 265,368 | | | | 1.06 | | | | 1.06 | | | | 1.13 | | | | 14 | |
Year ended 04/30/17 | | | 21.86 | | | | 0.35 | | | | 3.61 | | | | 3.96 | | | | (0.44 | ) | | | (1.35 | ) | | | (1.79 | ) | | | 24.03 | | | | 18.27 | | | | 324,055 | | | | 1.09 | | | | 1.09 | | | | 1.50 | | | | 18 | |
Class Y | | | | | | | | | | | | | | | | | | | | | | | | | | | | | | | | | | | | | | | | | | | | | | | | | | | | | | | | |
Year ended 04/30/21 | | | 18.95 | | | | 0.45 | | | | 10.25 | | | | 10.70 | | | | (0.56 | ) | | | – | | | | (0.56 | ) | | | 29.09 | | | | 57.28 | | | | 1,511,312 | | | | 0.57 | (d) | | | 0.57 | (d) | | | 1.99 | (d) | | | 19 | |
Year ended 04/30/20 | | | 25.18 | | | | 0.57 | | | | (4.88 | ) | | | (4.31 | ) | | | (0.58 | ) | | | (1.34 | ) | | | (1.92 | ) | | | 18.95 | | | | (18.54 | ) | | | 1,179,055 | | | | 0.57 | | | | 0.58 | | | | 2.41 | | | | 30 | |
Year ended 04/30/19 | | | 26.68 | | | | 0.52 | | | | 0.22 | | | | 0.74 | | | | (0.47 | ) | | | (1.77 | ) | | | (2.24 | ) | | | 25.18 | | | | 3.73 | | | | 1,765,456 | | | | 0.55 | | | | 0.56 | | | | 2.04 | | | | 23 | |
Year ended 04/30/18 | | | 24.03 | | | | 0.41 | | | | 3.25 | | | | 3.66 | | | | (0.42 | ) | | | (0.59 | ) | | | (1.01 | ) | | | 26.68 | | | | 15.41 | | | | 1,861,752 | | | | 0.56 | | | | 0.56 | | | | 1.63 | | | | 14 | |
Year ended 04/30/17 | | | 21.86 | | | | 0.46 | | | | 3.61 | | | | 4.07 | | | | (0.55 | ) | | | (1.35 | ) | | | (1.90 | ) | | | 24.03 | | | | 18.86 | | | | 3,334,930 | | | | 0.59 | | | | 0.59 | | | | 2.00 | | | | 18 | |
Class R5 | | | | | | | | | | | | | | | | | | | | | | | | | | | | | | | | | | | | | | | | | | | | | | | | | | | | | | | | |
Year ended 04/30/21 | | | 18.93 | | | | 0.47 | | | | 10.23 | | | | 10.70 | | | | (0.57 | ) | | | – | | | | (0.57 | ) | | | 29.06 | | | | 57.39 | | | | 529,916 | | | | 0.50 | (d) | | | 0.50 | (d) | | | 2.06 | (d) | | | 19 | |
Year ended 04/30/20 | | | 25.16 | | | | 0.58 | | | | (4.87 | ) | | | (4.29 | ) | | | (0.60 | ) | | | (1.34 | ) | | | (1.94 | ) | | | 18.93 | | | | (18.50 | ) | | | 440,298 | | | | 0.50 | | | | 0.51 | | | | 2.48 | | | | 30 | |
Year ended 04/30/19 | | | 26.66 | | | | 0.54 | | | | 0.22 | | | | 0.76 | | | | (0.49 | ) | | | (1.77 | ) | | | (2.26 | ) | | | 25.16 | | | | 3.80 | | | | 665,081 | | | | 0.48 | | | | 0.49 | | | | 2.11 | | | | 23 | |
Year ended 04/30/18 | | | 24.02 | | | | 0.44 | | | | 3.23 | | | | 3.67 | | | | (0.44 | ) | | | (0.59 | ) | | | (1.03 | ) | | | 26.66 | | | | 15.46 | | | | 735,462 | | | | 0.50 | | | | 0.50 | | | | 1.69 | | | | 14 | |
Year ended 04/30/17 | | | 21.85 | | | | 0.48 | | | | 3.62 | | | | 4.10 | | | | (0.58 | ) | | | (1.35 | ) | | | (1.93 | ) | | | 24.02 | | | | 18.98 | | | | 741,550 | | | | 0.51 | | | | 0.51 | | | | 2.08 | | | | 18 | |
Class R6 | | | | | | | | | | | | | | | | | | | | | | | | | | | | | | | | | | | | | | | | | | | | | | | | | | | | | | | | |
Year ended 04/30/21 | | | 18.92 | | | | 0.48 | | | | 10.24 | | | | 10.72 | | | | (0.59 | ) | | | – | | | | (0.59 | ) | | | 29.05 | | | | 57.56 | | | | 1,538,111 | | | | 0.42 | (d) | | | 0.42 | (d) | | | 2.14 | (d) | | | 19 | |
Year ended 04/30/20 | | | 25.16 | | | | 0.60 | | | | (4.88 | ) | | | (4.28 | ) | | | (0.62 | ) | | | (1.34 | ) | | | (1.96 | ) | | | 18.92 | | | | (18.46 | ) | | | 2,268,887 | | | | 0.41 | | | | 0.42 | | | | 2.57 | | | | 30 | |
Year ended 04/30/19 | | | 26.66 | | | | 0.56 | | | | 0.22 | | | | 0.78 | | | | (0.51 | ) | | | (1.77 | ) | | | (2.28 | ) | | | 25.16 | | | | 3.90 | | | | 2,962,672 | | | | 0.39 | | | | 0.40 | | | | 2.20 | | | | 23 | |
Year ended 04/30/18 | | | 24.01 | | | | 0.47 | | | | 3.24 | | | | 3.71 | | | | (0.47 | ) | | | (0.59 | ) | | | (1.06 | ) | | | 26.66 | | | | 15.61 | | | | 2,587,663 | | | | 0.41 | | | | 0.41 | | | | 1.78 | | | | 14 | |
Year ended 04/30/17 | | | 21.85 | | | | 0.50 | | | | 3.61 | | | | 4.11 | | | | (0.60 | ) | | | (1.35 | ) | | | (1.95 | ) | | | 24.01 | | | | 19.05 | | | | 702,678 | | | | 0.41 | | | | 0.41 | | | | 2.18 | | | | 18 | |
| (a) | Calculated using average shares outstanding. |
| (b) | Includes adjustments in accordance with accounting principles generally accepted in the United States of America and as such, the net asset value for financial reporting purposes and the returns based upon those net asset values may differ from the net asset value and returns for shareholder transactions. Does not include sales charges and is not annualized for periods less than one year, if applicable. |
| (c) | Portfolio turnover is calculated at the fund level and is not annualized for periods less than one year, if applicable. |
| (d) | Ratios are based on average daily net assets (000’s omitted) of $4,983,638, $90,017, $129,311, $1,282,051, $477,898 and $1,555,289 for Class A, Class C, Class R, Class Y, Class R5 and Class R6 shares, respectively. |
| (e) | The total return, ratio of expenses to average net assets and ratio of net investment income (loss) to average net assets reflect actual 12b-1 fees of 0.99%, 0.92%, 0.99% and 0.99% for the years ended April 30, 2021, 2020, 2019 and 2018, respectively. |
See accompanying Notes to Financial Statements which are an integral part of the financial statements.
14 Invesco Comstock Fund
Notes to Financial Statements
April 30, 2021
NOTE 1–Significant Accounting Policies
Invesco Comstock Fund (the “Fund”) is a series portfolio of AIM Sector Funds (Invesco Sector Funds) (the “Trust”). The Trust is a Delaware statutory trust registered under the Investment Company Act of 1940, as amended (the “1940 Act”), as an open-end series management investment company authorized to issue an unlimited number of shares of beneficial interest. Information presented in these financial statements pertains only to the Fund. Matters affecting the Fund or each class will be voted on exclusively by the shareholders of the Fund or each class.
The Fund’s investment objective is total return through growth of capital and current income.
The Fund currently consists of six different classes of shares: Class A, Class C, Class R, Class Y, Class R5 and Class R6. Class Y shares are available only to certain investors. Class A shares are sold with a front-end sales charge unless certain waiver criteria are met. Under certain circumstances, load waived shares may be subject to contingent deferred sales charges (“CDSC”). Class C shares are sold with a CDSC. Class R, Class Y, Class R5 and Class R6 shares are sold at net asset value. Class C shares held for ten years after purchase are eligible for automatic conversion into Class A shares of the same Fund (the “Conversion Feature”). The automatic conversion pursuant to the Conversion Feature will generally occur at the end of the month following the tenth anniversary after a purchase of Class C shares. Effective November 30, 2020, the automatic conversion pursuant to the Conversion Feature changed from ten years to eight years. The first conversion of Class C shares to Class A shares occurred at the end of December 2020 for all Class C shares that were held for more than eight years as of November 30, 2020.
The Fund is an investment company and accordingly follows the investment company accounting and reporting guidance in accordance with Financial Accounting Standards Board Accounting Standards Codification Topic 946, Financial Services - Investment Companies.
The following is a summary of the significant accounting policies followed by the Fund in the preparation of its financial statements.
| A. | Security Valuations – Securities, including restricted securities, are valued according to the following policy. |
A security listed or traded on an exchange (except convertible securities) is valued at its last sales price or official closing price as of the close of the customary trading session on the exchange where the security is principally traded, or lacking any sales or official closing price on a particular day, the security may be valued at the closing bid price on that day. Securities traded in the over-the-counter market are valued based on prices furnished by independent pricing services or market makers. When such securities are valued by an independent pricing service they may be considered fair valued. Futures contracts are valued at the final settlement price set by an exchange on which they are principally traded. Listed options are valued at the mean between the last bid and asked prices from the exchange on which they are principally traded. Options not listed on an exchange are valued by an independent source at the mean between the last bid and asked prices. For purposes of determining net asset value (“NAV”) per share, futures and option contracts generally are valued 15 minutes after the close of the customary trading session of the New York Stock Exchange (“NYSE”).
Investments in open-end and closed-end registered investment companies that do not trade on an exchange are valued at the end-of-day net asset value per share. Investments in open-end and closed-end registered investment companies that trade on an exchange are valued at the last sales price or official closing price as of the close of the customary trading session on the exchange where the security is principally traded.
Debt obligations (including convertible securities) and unlisted equities are fair valued using an evaluated quote provided by an independent pricing service. Evaluated quotes provided by the pricing service may be determined without exclusive reliance on quoted prices, and may reflect appropriate factors such as institution-size trading in similar groups of securities, developments related to specific securities, dividend rate (for unlisted equities), yield (for debt obligations), quality, type of issue, coupon rate (for debt obligations), maturity (for debt obligations), individual trading characteristics and other market data. Pricing services generally value debt obligations assuming orderly transactions of institutional round lot size, but a fund may hold or transact in the same securities in smaller, odd lot sizes. Odd lots often trade at lower prices than institutional round lots. Debt obligations are subject to interest rate and credit risks. In addition, all debt obligations involve some risk of default with respect to interest and/or principal payments.
Foreign securities’ (including foreign exchange contracts) prices are converted into U.S. dollar amounts using the applicable exchange rates as of the close of the NYSE. If market quotations are available and reliable for foreign exchange-traded equity securities, the securities will be valued at the market quotations. Because trading hours for certain foreign securities end before the close of the NYSE, closing market quotations may become unreliable. If between the time trading ends on a particular security and the close of the customary trading session on the NYSE, events occur that the investment adviser determines are significant and make the closing price unreliable, the Fund may fair value the security. If the event is likely to have affected the closing price of the security, the security will be valued at fair value in good faith using procedures approved by the Board of Trustees. Adjustments to closing prices to reflect fair value may also be based on a screening process of an independent pricing service to indicate the degree of certainty, based on historical data, that the closing price in the principal market where a foreign security trades is not the current value as of the close of the NYSE. Foreign securities’ prices meeting the approved degree of certainty that the price is not reflective of current value will be priced at the indication of fair value from the independent pricing service. Multiple factors may be considered by the independent pricing service in determining adjustments to reflect fair value and may include information relating to sector indices, American Depositary Receipts and domestic and foreign index futures. Foreign securities may have additional risks including exchange rate changes, potential for sharply devalued currencies and high inflation, political and economic upheaval, the relative lack of issuer information, relatively low market liquidity and the potential lack of strict financial and accounting controls and standards.
Securities for which market prices are not provided by any of the above methods may be valued based upon quotes furnished by independent sources. The last bid price may be used to value equity securities. The mean between the last bid and asked prices is used to value debt obligations, including corporate loans.
Securities for which market quotations are not readily available or became unreliable are valued at fair value as determined in good faith by or under the supervision of the Trust’s officers following procedures approved by the Board of Trustees. Issuer specific events, market trends, bid/asked quotes of brokers and information providers and other market data may be reviewed in the course of making a good faith determination of a security’s fair value.
The Fund may invest in securities that are subject to interest rate risk, meaning the risk that the prices will generally fall as interest rates rise and, conversely, the prices will generally rise as interest rates fall. Specific securities differ in their sensitivity to changes in interest rates depending on their individual characteristics. Changes in interest rates may result in increased market volatility, which may affect the value and/or liquidity of certain Fund investments.
Valuations change in response to many factors including the historical and prospective earnings of the issuer, the value of the issuer’s assets, general market conditions which are not specifically related to the particular issuer, such as real or perceived adverse economic conditions, changes in the general outlook for revenues or corporate earnings, changes in interest or currency rates, regional or global instability, natural or environmental disasters, widespread disease or other public health issues, war, acts of terrorism or adverse investor sentiment generally and market liquidity. Because of the inherent uncertainties of valuation, the values reflected in the financial statements may materially differ from the value received upon actual sale of those investments.
| B. | Securities Transactions and Investment Income – Securities transactions are accounted for on a trade date basis. Realized gains or losses on sales are computed on the basis of specific identification of the securities sold. Interest income (net of withholding tax, if any) is recorded on an accrual basis from settlement date and includes coupon interest and amortization of premium and accretion of discount on debt securities as applicable. Dividend income (net of withholding tax, if any) is recorded on the ex-dividend date. |
The Fund may periodically participate in litigation related to Fund investments. As such, the Fund may receive proceeds from litigation settlements. Any proceeds received are included in the Statement of Operations as realized gain (loss) for investments no longer held and as unrealized gain (loss) for investments still held.
15 Invesco Comstock Fund
Brokerage commissions and mark ups are considered transaction costs and are recorded as an increase to the cost basis of securities purchased and/or a reduction of proceeds on a sale of securities. Such transaction costs are included in the determination of net realized and unrealized gain (loss) from investment securities reported in the Statement of Operations and the Statement of Changes in Net Assets and the net realized and unrealized gains (losses) on securities per share in the Financial Highlights. Transaction costs are included in the calculation of the Fund’s net asset value and, accordingly, they reduce the Fund’s total returns. These transaction costs are not considered operating expenses and are not reflected in net investment income reported in the Statement of Operations and the Statement of Changes in Net Assets, or the net investment income per share and the ratios of expenses and net investment income reported in the Financial Highlights, nor are they limited by any expense limitation arrangements between the Fund and the investment adviser.
The Fund allocates income and realized and unrealized capital gains and losses to a class based on the relative net assets of each class.
| C. | Country Determination – For the purposes of making investment selection decisions and presentation in the Schedule of Investments, the investment adviser may determine the country in which an issuer is located and/or credit risk exposure based on various factors. These factors include the laws of the country under which the issuer is organized, where the issuer maintains a principal office, the country in which the issuer derives 50% or more of its total revenues and the country that has the primary market for the issuer’s securities, as well as other criteria. Among the other criteria that may be evaluated for making this determination are the country in which the issuer maintains 50% or more of its assets, the type of security, financial guarantees and enhancements, the nature of the collateral and the sponsor organization. Country of issuer and/or credit risk exposure has been determined to be the United States of America, unless otherwise noted. |
| D. | Distributions – Distributions from net investment income, if any, are declared and paid quarterly and are recorded on the ex-dividend date. Distributions from net realized capital gain, if any, are generally declared and paid annually and recorded on the ex-dividend date. The Fund may elect to treat a portion of the proceeds from redemptions as distributions for federal income tax purposes. |
| E. | Federal Income Taxes – The Fund intends to comply with the requirements of Subchapter M of the Internal Revenue Code of 1986, as amended (the “Internal Revenue Code”), necessary to qualify as a regulated investment company and to distribute substantially all of the Fund’s taxable earnings to shareholders. As such, the Fund will not be subject to federal income taxes on otherwise taxable income (including net realized capital gain) that is distributed to shareholders. Therefore, no provision for federal income taxes is recorded in the financial statements. |
The Fund recognizes the tax benefits of uncertain tax positions only when the position is more likely than not to be sustained. Management has analyzed the Fund’s uncertain tax positions and concluded that no liability for unrecognized tax benefits should be recorded related to uncertain tax positions. Management is not aware of any tax positions for which it is reasonably possible that the total amounts of unrecognized tax benefits will change materially in the next 12 months.
The Fund files tax returns in the U.S. Federal jurisdiction and certain other jurisdictions. Generally, the Fund is subject to examinations by such taxing authorities for up to three years after the filing of the return for the tax period.
| F. | Expenses – Fees provided for under the Rule 12b-1 plan of a particular class of the Fund are charged to the operations of such class. Transfer agency fees and expenses and other shareholder recordkeeping fees and expenses attributable to Class R5 and Class R6 are allocated to each share class based on relative net assets. Sub-accounting fees attributable to Class R5 are charged to the operations of the class. Transfer agency fees and expenses and other shareholder recordkeeping fees and expenses relating to all other classes are allocated among those classes based on relative net assets. All other expenses are allocated among the classes based on relative net assets. |
| G. | Accounting Estimates – The preparation of financial statements in conformity with accounting principles generally accepted in the United States of America (“GAAP”) requires management to make estimates and assumptions that affect the reported amounts of assets and liabilities at the date of the financial statements and the reported amounts of revenues and expenses during the reporting period including estimates and assumptions related to taxation. Actual results could differ from those estimates by a significant amount. In addition, the Fund monitors for material events or transactions that may occur or become known after the period-end date and before the date the financial statements are released to print. |
| H. | Indemnifications – Under the Trust’s organizational documents, each Trustee, officer, employee or other agent of the Trust is indemnified against certain liabilities that may arise out of the performance of their duties to the Fund. Additionally, in the normal course of business, the Fund enters into contracts, including the Fund’s servicing agreements, that contain a variety of indemnification clauses. The Fund’s maximum exposure under these arrangements is unknown as this would involve future claims that may be made against the Fund that have not yet occurred. The risk of material loss as a result of such indemnification claims is considered remote. |
| I. | Securities Lending – The Fund may lend portfolio securities having a market value up to one-third of the Fund’s total assets. Such loans are secured by collateral equal to no less than the market value of the loaned securities determined daily by the securities lending provider. Such collateral will be cash or debt securities issued or guaranteed by the U.S. Government or any of its sponsored agencies. Cash collateral received in connection with these loans is invested in short-term money market instruments or affiliated money market funds and is shown as such on the Schedule of Investments. The Fund bears the risk of loss with respect to the investment of collateral. It is the Fund’s policy to obtain additional collateral from or return excess collateral to the borrower by the end of the next business day, following the valuation date of the securities loaned. Therefore, the value of the collateral held may be temporarily less than the value of the securities on loan. When loaning securities, the Fund retains certain benefits of owning the securities, including the economic equivalent of dividends or interest generated by the security. Lending securities entails a risk of loss to the Fund if, and to the extent that, the market value of the securities loaned were to increase and the borrower did not increase the collateral accordingly, and the borrower failed to return the securities. The securities loaned are subject to termination at the option of the borrower or the Fund. Upon termination, the borrower will return to the Fund the securities loaned and the Fund will return the collateral. Upon the failure of the borrower to return the securities, collateral may be liquidated and the securities may be purchased on the open market to replace the loaned securities. The Fund could experience delays and costs in gaining access to the collateral and the securities may lose value during the delay which could result in potential losses to the Fund. Some of these losses may be indemnified by the lending agent. The Fund bears the risk of any deficiency in the amount of the collateral available for return to the borrower due to any loss on the collateral invested. Dividends received on cash collateral investments for securities lending transactions, which are net of compensation to counterparties, are included in Dividends from affiliated money market funds on the Statement of Operations. The aggregate value of securities out on loan, if any, is shown as a footnote on the Statement of Assets and Liabilities. |
| J. | Foreign Currency Translations – Foreign currency is valued at the close of the NYSE based on quotations posted by banks and major currency dealers. Portfolio securities and other assets and liabilities denominated in foreign currencies are translated into U.S. dollar amounts at the date of valuation. Purchases and sales of portfolio securities (net of foreign taxes withheld on disposition) and income items denominated in foreign currencies are translated into U.S. dollar amounts on the respective dates of such transactions. The Fund does not separately account for the portion of the results of operations resulting from changes in foreign exchange rates on investments and the fluctuations arising from changes in market prices of securities held. The combined results of changes in foreign exchange rates and the fluctuation of market prices on investments (net of estimated foreign tax withholding) are included with the net realized and unrealized gain or loss from investments in the Statement of Operations. Reported net realized foreign currency gains or losses arise from (1) sales of foreign currencies, (2) currency gains or losses realized between the trade and settlement dates on securities transactions, and (3) the difference between the amounts of dividends, interest, and foreign withholding taxes recorded on the Fund’s books and the U.S. dollar equivalent of the amounts actually received or paid. Net unrealized foreign currency gains and losses arise from changes in the fair values of assets and liabilities, other than investments in securities at fiscal period end, resulting from changes in exchange rates. |
The Fund may invest in foreign securities, which may be subject to foreign taxes on income, gains on investments or currency repatriation, a portion of which may be recoverable. Foreign taxes, if any, are recorded based on the tax regulations and rates that exist in the foreign markets in which the Fund invests and are shown in the Statement of Operations.
16 Invesco Comstock Fund
| K. | Forward Foreign Currency Contracts – The Fund may engage in foreign currency transactions either on a spot (i.e. for prompt delivery and settlement) basis, or through forward foreign currency contracts, to manage or minimize currency or exchange rate risk. |
The Fund may also enter into forward foreign currency contracts for the purchase or sale of a security denominated in a foreign currency in order to “lock in” the U.S. dollar price of that security, or the Fund may also enter into forward foreign currency contracts that do not provide for physical settlement of the two currencies, but instead are settled by a single cash payment calculated as the difference between the agreed upon exchange rate and the spot rate at settlement based upon an agreed upon notional amount (non-deliverable forwards). The Fund will set aside liquid assets in an amount equal to the daily mark-to-market obligation for forward foreign currency contracts.
A forward foreign currency contract is an obligation between two parties (“Counterparties”) to purchase or sell a specific currency for an agreed-upon price at a future date. The use of forward foreign currency contracts does not eliminate fluctuations in the price of the underlying securities the Fund owns or intends to acquire but establishes a rate of exchange in advance. Fluctuations in the value of these contracts are measured by the difference in the contract date and reporting date exchange rates and are recorded as unrealized appreciation (depreciation) until the contracts are closed. When the contracts are closed, realized gains (losses) are recorded. Realized and unrealized gains (losses) on the contracts are included in the Statement of Operations. The primary risks associated with forward foreign currency contracts include failure of the Counterparty to meet the terms of the contract and the value of the foreign currency changing unfavorably. These risks may be in excess of the amounts reflected in the Statement of Assets and Liabilities.
| L. | COVID-19 Risk – The COVID-19 strain of coronavirus has resulted in instances of market closures and dislocations, extreme volatility, liquidity constraints and increased trading costs. Efforts to contain its spread have resulted in travel restrictions, disruptions of healthcare systems, business operations and supply chains, layoffs, lower consumer demand, and defaults, among other significant economic impacts that have disrupted global economic activity across many industries. Such economic impacts may exacerbate other pre-existing political, social and economic risks locally or globally. |
The ongoing effects of COVID-19 are unpredictable and may result in significant and prolonged effects on the Fund’s performance.
NOTE 2–Advisory Fees and Other Fees Paid to Affiliates
The Trust has entered into a master investment advisory agreement with Invesco Advisers, Inc. (the “Adviser” or “Invesco”). Under the terms of the investment advisory agreement, the Fund accrues daily and pays monthly an advisory fee to the Adviser based on the annual rate of the Fund’s average daily net assets as follows:
| | | | |
| Average Daily Net Assets | | Rate | |
First $1 billion | | | 0.500 | % |
Next $1 billion | | | 0.450 | % |
Next $1 billion | | | 0.400 | % |
Over $3 billion | | | 0.350 | % |
For the year ended April 30, 2021, the effective advisory fee rate incurred by the Fund was 0.39%.
Under the terms of a master sub-advisory agreement between the Adviser and each of Invesco Asset Management Deutschland GmbH, Invesco Asset Management Limited, Invesco Asset Management (Japan) Limited, Invesco Hong Kong Limited, Invesco Senior Secured Management, Inc. and Invesco Canada Ltd. (collectively, the “Affiliated Sub-Advisers”) the Adviser, not the Fund, will pay 40% of the fees paid to the Adviser to any such Affiliated Sub-Adviser(s) that provide(s) discretionary investment management services to the Fund based on the percentage of assets allocated to such Affiliated Sub-Adviser(s).
The Adviser has contractually agreed, through at least June 30, 2022, to waive advisory fees and/or reimburse expenses of all shares to the extent necessary to limit total annual fund operating expenses after fee waiver and/or expense reimbursement (excluding certain items discussed below) of Class A, Class C, Class R, Class Y, Class R5 and Class R6 shares to 2.00%, 2.75%, 2.25%, 1.75%, 1.75% and 1.75% respectively, of the Fund’s average daily net assets (the “expense limits”). In determining the Adviser’s obligation to waive advisory fees and/or reimburse expenses, the following expenses are not taken into account, and could cause the total annual fund operating expenses after fee waiver and/or expense reimbursement to exceed the numbers reflected above: (1) interest; (2) taxes; (3) dividend expense on short sales; (4) extraordinary or non-routine items, including litigation expenses; and (5) expenses that the Fund has incurred but did not actually pay because of an expense offset arrangement. Unless Invesco continues the fee waiver agreement, it will terminate on June 30, 2022. During its term, the fee waiver agreement cannot be terminated or amended to increase the expense limits or reduce the advisory fee waiver without approval of the Board of Trustees. The Adviser did not waive fees and/or reimburse expenses during the period under these expense limits.
Further, the Adviser has contractually agreed, through at least June 30, 2023, to waive the advisory fee payable by the Fund in an amount equal to 100% of the net advisory fees the Adviser receives from the affiliated money market funds on investments by the Fund of uninvested cash (excluding investments of cash collateral from securities lending) in such affiliated money market funds.
For the year ended April 30, 2021, the Adviser waived advisory fees of $208,729.
The Trust has entered into a master administrative services agreement with Invesco pursuant to which the Fund has agreed to pay Invesco for certain administrative costs incurred in providing accounting services to the Fund. For the year ended April 30, 2021, expenses incurred under the agreement are shown in the Statement of Operations as Administrative services fees. Invesco has entered into a sub-administration agreement whereby State Street Bank and Trust Company (“SSB”) serves as fund accountant and provides certain administrative services to the Fund. Pursuant to a custody agreement with the Trust on behalf of the Fund, SSB also serves as the Fund’s custodian.
The Trust has entered into a transfer agency and service agreement with Invesco Investment Services, Inc. (“IIS”) pursuant to which the Fund has agreed to pay IIS a fee for providing transfer agency and shareholder services to the Fund and reimburse IIS for certain expenses incurred by IIS in the course of providing such services. IIS may make payments to intermediaries that provide omnibus account services, sub-accounting services and/or networking services. All fees payable by IIS to intermediaries that provide omnibus account services or sub-accounting services are charged back to the Fund, subject to certain limitations approved by the Trust’s Board of Trustees. For the year ended April 30, 2021, expenses incurred under the agreement are shown in the Statement of Operations as Transfer agent fees.
The Trust has entered into master distribution agreements with Invesco Distributors, Inc.(“IDI”) to serve as the distributor for the Class A, Class C, Class R, Class Y, Class R5 and Class R6 shares of the Fund. The Trust has adopted plans pursuant to Rule 12b-1 under the 1940 Act with respect to the Fund’s Class A, Class C and Class R shares (collectively the “Plans”). The Fund, pursuant to the Plans, reimburses IDI for its allocated share of expenses incurred for the period, up to a maximum annual rate of 0.25% of the average daily net assets of Class A shares, up to 1.00% of the average daily net assets of Class C shares, and up to 0.50% of the average daily net assets of Class R shares. The fees are accrued daily and paid monthly. Of the Plan payments, up to 0.25% of the average daily net assets of each class of shares may be paid to furnish continuing personal shareholder services to customers who purchase and own shares of such classes. Any amounts not paid as a service fee under the Plan would constitute an asset-based sales charge. Rules of the Financial Industry Regulatory Authority (“FINRA”) impose a cap on the total sales charges, including asset-based sales charges, that may be paid by any class of shares of the Fund. For the year ended April 30, 2021, expenses incurred under the Plans are shown in the Statement of Operations as Distribution fees.
Front-end sales commissions and CDSC (collectively, the “sales charges”) are not recorded as expenses of the Fund. Front-end sales commissions are deducted from proceeds from the sales of Fund shares prior to investment in Class A shares of the Fund. CDSC are deducted from redemption proceeds prior to remittance to the shareholder. During the year ended April 30, 2021, IDI advised the Fund that IDI retained $365,606 in front-end sales commissions from the sale of Class A shares and $8,002 and $8,309 from Class A and Class C shares, respectively, for CDSC imposed upon redemptions by shareholders.
17 Invesco Comstock Fund
For the year ended April 30, 2021, the Fund incurred $79,752 in brokerage commissions with Invesco Capital Markets, Inc., an affiliate of the Adviser and IDI, for portfolio transactions executed on behalf of the Fund.
Certain officers and trustees of the Trust are officers and directors of the Adviser, IIS and/or IDI.
NOTE 3–Additional Valuation Information
GAAP defines fair value as the price that would be received to sell an asset or paid to transfer a liability in an orderly transaction between market participants at the measurement date, under current market conditions. GAAP establishes a hierarchy that prioritizes the inputs to valuation methods, giving the highest priority to readily available unadjusted quoted prices in an active market for identical assets (Level 1) and the lowest priority to significant unobservable inputs (Level 3), generally when market prices are not readily available or are unreliable. Based on the valuation inputs, the securities or other investments are tiered into one of three levels. Changes in valuation methods may result in transfers in or out of an investment’s assigned level:
| | |
| Level 1 – | | Prices are determined using quoted prices in an active market for identical assets. |
| Level 2 – | | Prices are determined using other significant observable inputs. Observable inputs are inputs that other market participants may use in pricing a security. These may include quoted prices for similar securities, interest rates, prepayment speeds, credit risk, yield curves, loss severities, default rates, discount rates, volatilities and others. |
| Level 3 – | | Prices are determined using significant unobservable inputs. In situations where quoted prices or observable inputs are unavailable (for example, when there is little or no market activity for an investment at the end of the period), unobservable inputs may be used. Unobservable inputs reflect the Fund’s own assumptions about the factors market participants would use in determining fair value of the securities or instruments and would be based on the best available information. |
The following is a summary of the tiered valuation input levels, as of April 30, 2021. The level assigned to the securities valuations may not be an indication of the risk or liquidity associated with investing in those securities. Because of the inherent uncertainties of valuation, the values reflected in the financial statements may materially differ from the value received upon actual sale of those investments.
| | | | | | | | | | | | | | | | |
| | | Level 1 | | | Level 2 | | | Level 3 | | | Total | |
Investments in Securities | | | | | | | | | | | | | | | | |
| |
Common Stocks & Other Equity Interests | | | $9,578,197,039 | | | | $ – | | | | $– | | | | $9,578,197,039 | |
| |
Money Market Funds | | | 137,537,352 | | | | 47,037,200 | | | | – | | | | 184,574,552 | |
| |
Total Investments in Securities | | | 9,715,734,391 | | | | 47,037,200 | | | | – | | | | 9,762,771,591 | |
| |
| | | | |
Other Investments - Assets* | | | | | | | | | | | | | | | | |
| |
Forward Foreign Currency Contracts | | | – | | | | 295,359 | | | | – | | | | 295,359 | |
| |
| | | | |
Other Investments - Liabilities* | | | | | | | | | | | | | | | | |
| |
Forward Foreign Currency Contracts | | | – | | | | (910,947 | ) | | | – | | | | (910,947 | ) |
| |
Total Other Investments | | | – | | | | (615,588 | ) | | | – | | | | (615,588 | ) |
| |
Total Investments | | | $9,715,734,391 | | | | $46,421,612 | | | | $– | | | | $9,762,156,003 | |
| |
| * | Unrealized appreciation (depreciation). |
NOTE 4–Derivative Investments
The Fund may enter into an International Swaps and Derivatives Association Master Agreement (“ISDA Master Agreement”) under which a fund may trade OTC derivatives. An OTC transaction entered into under an ISDA Master Agreement typically involves a collateral posting arrangement, payment netting provisions and close-out netting provisions. These netting provisions allow for reduction of credit risk through netting of contractual obligations. The enforceability of the netting provisions of the ISDA Master Agreement depends on the governing law of the ISDA Master Agreement, among other factors.
For financial reporting purposes, the Fund does not offset OTC derivative assets or liabilities that are subject to ISDA Master Agreements in the Statement of Assets and Liabilities.
Value of Derivative Investments at Period-End
The table below summarizes the value of the Fund’s derivative investments, detailed by primary risk exposure, held as of April 30, 2021:
| | | | |
| | | Value | |
| | | Currency | |
| Derivative Assets | | Risk | |
| |
Unrealized appreciation on forward foreign currency contracts outstanding | | $ | 295,359 | |
| |
Derivatives not subject to master netting agreements | | | – | |
| |
Total Derivative Assets subject to master netting agreements | | $ | 295,359 | |
| |
| |
| | | Value | |
| | | Currency | |
| Derivative Liabilities | | Risk | |
| |
Unrealized depreciation on forward foreign currency contracts outstanding | | $ | (910,947 | ) |
| |
Derivatives not subject to master netting agreements | | | – | |
| |
Total Derivative Liabilities subject to master netting agreements | | $ | (910,947 | ) |
| |
18 Invesco Comstock Fund
Offsetting Assets and Liabilities
The table below reflects the Fund’s exposure to Counterparties subject to either an ISDA Master Agreement or other agreement for OTC derivative transactions as of April 30, 2021.
| | | | | | | | | | | | | | | | | | | | |
| | | Financial
Derivative
Assets | | | Financial
Derivative
Liabilities | | | | | | Collateral
(Received)/Pledged | | | |
| | | Forward Foreign | | | Forward Foreign | | | Net Value of | | | | | | | Net | |
| Counterparty | | Currency Contracts | | | Currency Contracts | | | Derivatives | | | Non-Cash | | Cash | | Amount | |
| |
Deutsche Bank AG | | | $ – | | | | $ (29) | | | | $ (29) | | | $– | | $– | | | $ (29) | |
| |
JP Morgan Chase Bank, N.A. | | | – | | | | (622) | | | | (622) | | | – | | – | | | (622) | |
| |
Royal Bank of Canada | | | 295,359 | | | | (910,296) | | | | (614,937) | | | – | | – | | | (614,937) | |
| |
Total | | | $295,359 | | | | $(910,947) | | | | $(615,588) | | | $– | | $– | | | $(615,588) | |
| |
Effect of Derivative Investments for the year ended April 30, 2021
The table below summarizes the gains (losses) on derivative investments, detailed by primary risk exposure, recognized in earnings during the period:
| | | | | |
| | | Location of Gain (Loss) on |
| | | Statement of Operations |
| | | Currency |
| | | Risk |
Realized Gain (Loss): | | | | | |
Forward foreign currency contracts | | | $ | (25,931,700 | ) |
Change in Net Unrealized Appreciation: | | | | | |
Forward foreign currency contracts | | | | 3,036,976 | |
Total | | | $ | (22,894,724 | ) |
The table below summarizes the average notional value of derivatives held during the period.
| | | | |
| | | Forward | |
| | | Foreign Currency | |
| | | Contracts | |
| |
Average notional value | | | $302,271,311 | |
| |
NOTE 5–Expense Offset Arrangement(s)
The expense offset arrangement is comprised of transfer agency credits which result from balances in demand deposit accounts used by the transfer agent for clearing shareholder transactions. For the year ended April 30, 2021, the Fund received credits from this arrangement, which resulted in the reduction of the Fund’s total expenses of $4,920.
NOTE 6–Trustees’ and Officers’ Fees and Benefits
Trustees’ and Officers’ Fees and Benefits include amounts accrued by the Fund to pay remuneration to certain Trustees and Officers of the Fund. Trustees have the option to defer compensation payable by the Fund, and Trustees’ and Officers’ Fees and Benefits also include amounts accrued by the Fund to fund such deferred compensation amounts. Those Trustees who defer compensation have the option to select various Invesco Funds in which their deferral accounts shall be deemed to be invested. Finally, certain current Trustees were eligible to participate in a retirement plan that provided for benefits to be paid upon retirement to Trustees over a period of time based on the number of years of service. The Fund may have certain former Trustees who also participate in a retirement plan and receive benefits under such plan. Trustees’ and Officers’ Fees and Benefits include amounts accrued by the Fund to fund such retirement benefits. Obligations under the deferred compensation and retirement plans represent unsecured claims against the general assets of the Fund.
NOTE 7–Cash Balances
The Fund is permitted to temporarily carry a negative or overdrawn balance in its account with SSB, the custodian bank. Such balances, if any at period-end, are shown in the Statement of Assets and Liabilities under the payable caption Amount due custodian. To compensate the custodian bank for such overdrafts, the overdrawn Fund may either (1) leave funds as a compensating balance in the account so the custodian bank can be compensated by earning the additional interest; or (2) compensate by paying the custodian bank at a rate agreed upon by the custodian bank and Invesco, not to exceed the contractually agreed upon rate. The Fund may not purchase additional securities when any borrowings from banks or broker-dealers exceed 5% of the Fund’s total assets, or when any borrowings from an Invesco Fund are outstanding.
NOTE 8–Distributions to Shareholders and Tax Components of Net Assets
Tax Character of Distributions to Shareholders Paid During the Fiscal Years Ended April 30, 2021 and April 30, 2020:
| | | | | | | | |
| | |
| | | 2021 | | | 2020 | |
| |
Ordinary income* | | $ | 194,435,213 | | | $ | 283,801,901 | |
| |
Long-term capital gain | | | 24 | | | | 567,450,226 | |
| |
Total distributions | | $ | 194,435,237 | | | $ | 851,252,127 | |
| |
| * | Includes short-term capital gain distributions, if any. |
19 Invesco Comstock Fund
Tax Components of Net Assets at Period-End:
| | | | |
| | | 2021 | |
| |
Undistributed ordinary income | | $ | 42,131,968 | |
| |
Undistributed long-term capital gain | | | 85,024,075 | |
| |
Net unrealized appreciation – investments | | | 3,950,329,652 | |
| |
Net unrealized appreciation - foreign currencies | | | 3 | |
| |
Temporary book/tax differences | | | (777,152 | ) |
| |
Shares of beneficial interest | | | 5,634,382,042 | |
| |
Total net assets | | $ | 9,711,090,588 | |
| |
The difference between book-basis and tax-basis unrealized appreciation (depreciation) is due to differences in the timing of recognition of gains and losses on investments for tax and book purposes. The Fund’s net unrealized appreciation (depreciation) difference is attributable primarily to wash sales.
The temporary book/tax differences are a result of timing differences between book and tax recognition of income and/or expenses. The Fund’s temporary book/tax differences are the result of the trustee deferral of compensation and retirement plan benefits.
Capital loss carryforward is calculated and reported as of a specific date. Results of transactions and other activity after that date may affect the amount of capital loss carryforward actually available for the Fund to utilize. The ability to utilize capital loss carryforward in the future may be limited under the Internal Revenue Code and related regulations based on the results of future transactions.
The Fund does not have a capital loss carryforward as of April 30, 2021.
NOTE 9–Investment Transactions
The aggregate amount of investment securities (other than short-term securities, U.S. Government obligations and money market funds, if any) purchased and sold by the Fund during the year ended April 30, 2021 was $1,591,722,477 and $4,191,532,306, respectively. Cost of investments, including any derivatives, on a tax basis includes the adjustments for financial reporting purposes as of the most recently completed federal income tax reporting period-end.
| | | | |
| Unrealized Appreciation (Depreciation) of Investments on a Tax Basis | |
| |
Aggregate unrealized appreciation of investments | | $ | 3,974,236,576 | |
| |
Aggregate unrealized (depreciation) of investments | | | (23,906,924 | ) |
| |
Net unrealized appreciation of investments | | $ | 3,950,329,652 | |
| |
Cost of investments for tax purposes is $5,811,826,351.
NOTE 10–Reclassification of Permanent Differences
Primarily as a result of differing book/tax treatment of foreign currency transactions, on April 30, 2021, undistributed net investment income was increased by $241,368 and undistributed net realized gain (loss) was decreased by $241,368. This reclassification had no effect on the net assets or the distributable earnings of the Fund.
NOTE 11–Share Information
| | | | | | | | | | | | | | | | |
| | | Summary of Share Activity | |
| |
| | | Year ended | | | Year ended | |
| | | April 30, 2021(a) | | | April 30, 2020 | |
| | | Shares | | | Amount | | | Shares | | | Amount | |
| |
Sold: | | | | | | | | | | | | | | | | |
Class A | | | 10,888,232 | | | $ | 252,063,897 | | | | 14,823,340 | | | $ | 326,476,393 | |
| |
Class C | | | 646,531 | | | | 14,928,101 | | | | 836,730 | | | | 18,364,258 | |
| |
Class R | | | 899,801 | | | | 20,873,066 | | | | 1,147,738 | | | | 25,029,054 | |
| |
Class Y | | | 13,598,852 | | | | 315,877,559 | | | | 13,876,272 | | | | 304,958,289 | |
| |
Class R5 | | | 4,226,964 | | | | 94,872,706 | | | | 4,014,780 | | | | 88,821,947 | |
| |
Class R6 | | | 11,985,297 | | | | 275,892,609 | | | | 28,081,364 | | | | 564,760,935 | |
| |
| | | | |
Issued as reinvestment of dividends: | | | | | | | | | | | | | | | | |
Class A | | | 4,350,988 | | | | 98,958,488 | | | | 17,277,921 | | | | 410,084,725 | |
| |
Class C | | | 54,116 | | | | 1,217,169 | | | | 350,528 | | | | 8,411,761 | |
| |
Class R | | | 112,086 | | | | 2,528,576 | | | | 557,959 | | | | 13,298,890 | |
| |
Class Y | | | 1,170,051 | | | | 26,638,401 | | | | 4,584,324 | | | | 108,588,430 | |
| |
Class R5 | | | 525,697 | | | | 11,925,823 | | | | 1,955,495 | | | | 46,230,230 | |
| |
Class R6 | | | 1,661,476 | | | | 37,588,662 | | | | 9,023,395 | | | | 212,691,539 | |
| |
| | | | |
Automatic conversion of Class C shares to Class A shares: | | | | | | | | | | | | | | | | |
Class A | | | 1,098,587 | | | | 25,139,425 | | | | 580,431 | | | | 13,695,611 | |
| |
Class C | | | (1,098,084 | ) | | | (25,139,425 | ) | | | (580,381 | ) | | | (13,695,611 | ) |
| |
20 Invesco Comstock Fund
| | | | | | | | | | | | | | | | |
| | | Summary of Share Activity | |
| |
| | | Year ended | | | Year ended | |
| | | April 30, 2021(a) | | | April 30, 2020 | |
| | | Shares | | | Amount | | | Shares | | | Amount | |
| |
| | | | |
Reacquired: | | | | | | | | | | | | | | | | |
Class A | | | (51,655,197 | ) | | $ | (1,162,684,478 | ) | | | (46,728,046 | ) | | $ | (1,064,036,679 | ) |
| |
Class C | | | (1,545,393 | ) | | | (33,913,458 | ) | | | (1,823,064 | ) | | | (40,942,807 | ) |
| |
Class R | | | (3,247,096 | ) | | | (72,227,124 | ) | | | (3,131,685 | ) | | | (72,209,788 | ) |
| |
Class Y | | | (25,045,738 | ) | | | (574,199,498 | ) | | | (26,340,785 | ) | | | (591,736,766 | ) |
| |
Class R5 | | | (9,778,494 | ) | | | (224,473,652 | ) | | | (9,143,407 | ) | | | (213,209,296 | ) |
| |
Class R6 | | | (80,597,132 | ) | | | (1,746,184,085 | ) | | | (34,983,680 | ) | | | (794,738,337 | ) |
| |
Net increase (decrease) in share activity | | | (121,748,456 | ) | | $ | (2,660,317,238 | ) | | | (25,620,771 | ) | | $ | (649,157,222 | ) |
| |
| (a) | There are entities that are record owners of more than 5% of the outstanding shares of the Fund and in the aggregate own 43% of the outstanding shares of the Fund. IDI has an agreement with these entities to sell Fund shares. The Fund, Invesco and/or Invesco affiliates may make payments to these entities, which are considered to be related to the Fund, for providing services to the Fund, Invesco and/or Invesco affiliates including but not limited to services such as securities brokerage, distribution, third party record keeping and account servicing. The Fund has no knowledge as to whether all or any portion of the shares owned of record by these entities are also owned beneficially. |
21 Invesco Comstock Fund
Report of Independent Registered Public Accounting Firm
To the Board of Trustees of AIM Sector Funds (Invesco Sector Funds) and Shareholders of Invesco Comstock Fund
Opinion on the Financial Statements
We have audited the accompanying statement of assets and liabilities, including the schedule of investments, of Invesco Comstock Fund (one of the funds constituting AIM Sector Funds (Invesco Sector Funds), referred to hereafter as the “Fund”) as of April 30, 2021, the related statement of operations for the year ended April 30, 2021, the statement of changes in net assets for each of the two years in the period ended April 30, 2021, including the related notes, and the financial highlights for each of the five years in the period ended April 30, 2021 (collectively referred to as the “financial statements”). In our opinion, the financial statements present fairly, in all material respects, the financial position of the Fund as of April 30, 2021, the results of its operations for the year then ended, the changes in its net assets for each of the two years in the period ended April 30, 2021 and the financial highlights for each of the five years in the period ended April 30, 2021 in conformity with accounting principles generally accepted in the United States of America.
Basis for Opinion
These financial statements are the responsibility of the Fund’s management. Our responsibility is to express an opinion on the Fund’s financial statements based on our audits. We are a public accounting firm registered with the Public Company Accounting Oversight Board (United States) (PCAOB) and are required to be independent with respect to the Fund in accordance with the U.S. federal securities laws and the applicable rules and regulations of the Securities and Exchange Commission and the PCAOB.
We conducted our audits of these financial statements in accordance with the standards of the PCAOB. Those standards require that we plan and perform the audit to obtain reasonable assurance about whether the financial statements are free of material misstatement, whether due to error or fraud.
Our audits included performing procedures to assess the risks of material misstatement of the financial statements, whether due to error or fraud, and performing procedures that respond to those risks. Such procedures included examining, on a test basis, evidence regarding the amounts and disclosures in the financial statements. Our audits also included evaluating the accounting principles used and significant estimates made by management, as well as evaluating the overall presentation of the financial statements. Our procedures included confirmation of securities owned as of April 30, 2021 by correspondence with the custodian, transfer agent and brokers; when replies were not received from brokers, we performed other auditing procedures. We believe that our audits provide a reasonable basis for our opinion.
/s/PricewaterhouseCoopers LLP
Houston, Texas
June 24, 2021
We have served as the auditor of one or more investment companies in the Invesco group of investment companies since at least 1995. We have not been able to determine the specific year we began serving as auditor.
22 Invesco Comstock Fund
Calculating your ongoing Fund expenses
Example
As a shareholder of the Fund, you incur two types of costs: (1) transaction costs, which may include sales charges (loads) on purchase payments or contingent deferred sales charges on redemptions, if any; and (2) ongoing costs, including management fees, distribution and/or service (12b-1) fees, and other Fund expenses. This example is intended to help you understand your ongoing costs (in dollars) of investing in the Fund and to compare these costs with ongoing costs of investing in other mutual funds. The example is based on an investment of $1,000 invested at the beginning of the period and held for the entire period November 1, 2020 through April 30, 2021.
Actual expenses
The table below provides information about actual account values and actual expenses. You may use the information in this table, together with the amount you invested, to estimate the expenses that you paid over the period. Simply divide your account value by $1,000 (for example, an $8,600 account value divided by $1,000 = 8.6), then multiply the result by the number in the table under the heading entitled “Actual Expenses Paid During Period” to estimate the expenses you paid on your account during this period.
Hypothetical example for comparison purposes
The table below also provides information about hypothetical account values and hypothetical expenses based on the Fund’s actual expense ratio and an assumed rate of return of 5% per year before expenses, which is not the Fund’s actual return.
The hypothetical account values and expenses may not be used to estimate the actual ending account balance or expenses you paid for the period. You may use this information to compare the ongoing costs of investing in the Fund and other funds. To do so, compare this 5% hypothetical example with the 5% hypothetical examples that appear in the shareholder reports of the other funds.
Please note that the expenses shown in the table are meant to highlight your ongoing costs only and do not reflect any transaction costs, such as sales charges (loads) on purchase payments or contingent deferred sales charges on redemptions, if any. Therefore, the hypothetical information is useful in comparing ongoing costs only, and will not help you determine the relative total costs of owning different funds. In addition, if these transaction costs were included, your costs would have been higher.
| | | | | | | | | | | | | | | | | | | | | | | | | | | | | | |
| | | Beginning
Account Value
(11/01/20) | | ACTUAL | | HYPOTHETICAL (5% annual return before expenses) | | Annualized
Expense
Ratio |
| | Ending
Account Value
(04/30/21)1 | | Expenses
Paid During
Period2 | | Ending
Account Value
(04/30/21) | | Expenses
Paid During
Period2 |
Class A | | $1,000.00 | | $1,476.30 | | $5.03 | | $1,020.73 | | $4.11 | | | | 0.82 | % |
Class C | | 1,000.00 | | 1,470.30 | | 9.55 | | 1,017.06 | | 7.80 | | | | 1.56 | |
Class R | | 1,000.00 | | 1,473.80 | | 6.56 | | 1,019.49 | | 5.36 | | | | 1.07 | |
Class Y | | 1,000.00 | | 1,477.40 | | 3.50 | | 1,021.97 | | 2.86 | | | | 0.57 | |
Class R5 | | 1,000.00 | | 1,477.90 | | 3.07 | | 1,022.32 | | 2.51 | | | | 0.50 | |
Class R6 | | 1,000.00 | | 1,478.80 | | 2.58 | | 1,022.71 | | 2.11 | | | | 0.42 | |
| 1 | The actual ending account value is based on the actual total return of the Fund for the period November 1, 2020 through April 30, 2021, after actual expenses and will differ from the hypothetical ending account value which is based on the Fund’s expense ratio and a hypothetical annual return of 5% before expenses. |
| 2 | Expenses are equal to the Fund’s annualized expense ratio as indicated above multiplied by the average account value over the period, multiplied by 181/365 to reflect the most recent fiscal half year. |
23 Invesco Comstock Fund
Distribution Information
The following table sets forth on a per share basis the distribution that was paid in March 2021. Included in the table is a written statement of the sources of the distribution on a GAAP basis.
| | | | | | | | | | | | | | | | | | | | | | |
| | | | | | | Gain from | | | | |
| | | | | Net Income | | Sale of Securities | | Return of Principal | | Total Distribution |
03/25/2021 | | Class A | | | $ | 0.0827 | | | | $ | 0.0000 | | | | $ | 0.0226 | | | | $ | 0.1054 | |
03/25/2021 | | Class C | | | $ | 0.0351 | | | | $ | 0.0000 | | | | $ | 0.0226 | | | | $ | 0.0577 | |
03/25/2021 | | Class R | | | $ | 0.0662 | | | | $ | 0.0000 | | | | $ | 0.0226 | | | | $ | 0.0888 | |
03/25/2021 | | Class Y | | | $ | 0.0992 | | | | $ | 0.0000 | | | | $ | 0.0226 | | | | $ | 0.1218 | |
03/25/2021 | | Class R5 | | | $ | 0.1043 | | | | $ | 0.0000 | | | | $ | 0.0226 | | | | $ | 0.1269 | |
03/25/2021 | | Class R6 | | | $ | 0.1099 | | | | $ | 0.0000 | | | | $ | 0.0226 | | | | $ | 0.1325 | |
Please note that the information in the preceding chart is for financial accounting purposes only. Shareholders should be aware that the tax treatment of distributions likely differs from GAAP treatment. Form 1099-DIV for the calendar year will report distributions for U.S. federal income tax purposes. This notice is sent to comply with certain U.S. Securities and Exchange Commission requirements.
24 Invesco Comstock Fund
Tax Information
Form 1099-DIV, Form 1042-S and other year-end tax information provide shareholders with actual calendar year amounts that should be included in their tax returns. Shareholders should consult their tax advisers.
The following distribution information is being provided as required by the Internal Revenue Code or to meet a specific state’s requirement.
The Fund designates the following amounts or, if subsequently determined to be different, the maximum amount allowable for its fiscal year ended April 30, 2021:
| | | | | | |
| | | | | | |
| | Federal and State Income Tax | | | | |
| | Long-Term Capital Gain Distributions | | $ | 24 | |
| | Qualified Dividend Income* | | | 100.00 | % |
| | Corporate Dividends Received Deduction* | | | 98.78 | % |
| | Business Interest Income* | | | 0.04 | % |
| | Qualified Business Income* | | | 0.00 | % |
| | U.S. Treasury Obligations* | | | 0.00 | % |
| | |
|
* The above percentages are based on ordinary income dividends paid to shareholders during the Fund’s fiscal year. |
25 Invesco Comstock Fund
Trustees and Officers
The address of each trustee and officer is AIM Sector Funds (Invesco Sector Funds) (the “Trust”), 11 Greenway Plaza, Suite 1000, Houston, Texas 77046-1173. The trustees serve for the life of the Trust, subject to their earlier death, incapacitation, resignation, retirement or removal as more specifically provided in the Trust’s organizational documents. Each officer serves for a one year term or until their successors are elected and qualified. Column two below includes length of time served with predecessor entities, if any.
| | | | | | | | | | |
Name, Year of Birth and Position(s) Held with the Trust | | Trustee
and/or
Officer
Since | | | Principal Occupation(s) During Past 5 Years | | Number of Funds in Fund Complex Overseen by Trustee | | Other Directorship(s) Held by Trustee During Past 5 Years |
| Interested Trustee | | | | | | | | | | |
Martin L. Flanagan1 — 1960 Trustee and Vice Chair | | | 2007 | | | Executive Director, Chief Executive Officer and President, Invesco Ltd. (ultimate parent of Invesco and a global investment management firm); Trustee and Vice Chair, The Invesco Funds; Vice Chair, Investment Company Institute; and Member of Executive Board, SMU Cox School of Business Formerly: Advisor to the Board, Invesco Advisers, Inc. (formerly known as Invesco Institutional (N.A.), Inc.); Chairman and Chief Executive Officer, Invesco Advisers, Inc. (registered investment adviser); Director, Chairman, Chief Executive Officer and President, Invesco Holding Company (US), Inc. (formerly IVZ Inc.) (holding company), Invesco Group Services, Inc. (service provider) and Invesco North American Holdings, Inc. (holding company); Director, Chief Executive Officer and President, Invesco Holding Company Limited (parent of Invesco and a global investment management firm); Director, Invesco Ltd.; Chairman, Investment Company Institute and President, Co-Chief Executive Officer, Co-President, Chief Operating Officer and Chief Financial Officer, Franklin Resources, Inc. (global investment management organization) | | 184 | | None |
| 1 | Mr. Flanagan is considered an interested person (within the meaning of Section 2(a)(19) of the 1940 Act) of the Trust because he is an officer of the Adviser to the Trust, and an officer and a director of Invesco Ltd., ultimate parent of the Adviser. |
T-1 Invesco Comstock Fund
Trustees and Officers–(continued)
| | | | | | | | |
Name, Year of Birth and Position(s) Held with the Trust | | Trustee
and/or
Officer
Since | | Principal Occupation(s) During Past 5 Years | | Number of Funds in Fund Complex Overseen by
Trustee | | Other Directorship(s) Held by Trustee During Past 5 Years |
Independent Trustees | | | | | | | | |
Christopher L. Wilson – 1957 Trustee and Chair | | 2017 | | Retired Formerly: Director, TD Asset Management USA Inc. (mutual fund complex) (22 portfolios); Managing Partner, CT2, LLC (investing and consulting firm); President/Chief Executive Officer, Columbia Funds, Bank of America Corporation; President/Chief Executive Officer, CDC IXIS Asset Management Services, Inc.; Principal & Director of Operations, Scudder Funds, Scudder, Stevens & Clark, Inc.; Assistant Vice President, Fidelity Investments | | 184 | | enaible, Inc. (artificial intelligence technology); Director, ISO New England, Inc. (non-profit organization managing regional electricity market) |
Beth Ann Brown – 1968 Trustee | | 2019 | | Independent Consultant Formerly: Head of Intermediary Distribution, Managing Director, Strategic Relations, Managing Director, Head of National Accounts, Senior Vice President, National Account Manager and Senior Vice President, Key Account Manager, Columbia Management Investment Advisers LLC; Vice President, Key Account Manager, Liberty Funds Distributor, Inc.; and Trustee of certain Oppenheimer Funds | | 184 | | Director, Board of Directors of Caron Engineering Inc.; Advisor, Board of Advisors of Caron Engineering Inc.; President and Director, Acton Shapleigh Youth Conservation Corps (non-profit); and President and Director of Grahamtastic Connection (non-profit) |
Jack M. Fields – 1952 Trustee | | 2003 | | Chief Executive Officer, Twenty First Century Group, Inc. (government affairs company); and Board Member, Impact(Ed) (non-profit) Formerly: Owner and Chief Executive Officer, Dos Angeles Ranch L.P. (cattle, hunting, corporate entertainment); Director, Insperity, Inc. (formerly known as Administaff) (human resources provider); Chief Executive Officer, Texana Timber LP (sustainable forestry company); Director of Cross Timbers Quail Research Ranch (non-profit); and member of the U.S. House of Representatives | | 184 | | Member, Board of Directors of Baylor College of Medicine |
| Cynthia Hostetler – 1962 Trustee | | 2017 | | Non-Executive Director and Trustee of a number of public and private business corporations Formerly: Director, Aberdeen Investment Funds (4 portfolios); Director, Artio Global Investment LLC (mutual fund complex); Director, Edgen Group, Inc. (specialized energy and infrastructure products distributor); Head of Investment Funds and Private Equity, Overseas Private Investment Corporation; President, First Manhattan Bancorporation, Inc.; Attorney, Simpson Thacher & Bartlett LLP | | 184 | | Resideo Technologies, Inc. (smart home technology); Vulcan Materials Company (construction materials company); Trilinc Global Impact Fund; Genesee & Wyoming, Inc. (railroads); Investment Company Institute (professional organization); Independent Directors Council (professional organization);Eisenhower Foundation (non-profit) |
Eli Jones – 1961 Trustee | | 2016 | | Professor and Dean, Mays Business School - Texas A&M University Formerly: Professor and Dean, Walton College of Business, University of Arkansas and E.J. Ourso College of Business, Louisiana State University; Director, Arvest Bank | | 184 | | Insperity, Inc. (formerly known as Administaff) (human resources provider) |
T-2 Invesco Comstock Fund
Trustees and Officers–(continued)
| | | | | | | | |
Name, Year of Birth and Position(s) Held with the Trust | | Trustee
and/or
Officer
Since | | Principal Occupation(s) During Past 5 Years | | Number of Funds in Fund Complex Overseen by
Trustee | | Other Directorship(s) Held by Trustee During Past 5 Years |
Independent Trustees–(continued) |
Elizabeth Krentzman – 1959 Trustee | | 2019 | | Formerly: Principal and Chief Regulatory Advisor for Asset Management Services and U.S. Mutual Fund Leader of Deloitte & Touche LLP; General Counsel of the Investment Company Institute (trade association); National Director of the Investment Management Regulatory Consulting Practice, Principal, Director and Senior Manager of Deloitte & Touche LLP; Assistant Director of the Division of Investment Management - Office of Disclosure and Investment Adviser Regulation of the U.S. Securities and Exchange Commission and various positions with the Division of Investment Management – Office of Regulatory Policy of the U.S. Securities and Exchange Commission; Associate at Ropes & Gray LLP; and Trustee of certain Oppenheimer Funds | | 184 | | Trustee of the University of Florida National Board Foundation; Member of the Carita Funds Board of Directors (private investment funds); Member of the University of Florida Law Center Association, Inc. Board of Trustees and Audit Committee Member |
Anthony J. LaCava, Jr. – 1956 Trustee | | 2019 | | Formerly: Director and Member of the Audit Committee, Blue Hills Bank (publicly traded financial institution) and Managing Partner, KPMG LLP | | 184 | | Blue Hills Bank; Chairman, Bentley University; Member, Business School Advisory Council; and Nominating Committee KPMG LLP |
Prema Mathai-Davis – 1950 Trustee | | 2003 | | Retired Formerly: Co-Founder & Partner of Quantalytics Research, LLC, (a FinTech Investment Research Platform for the Self-Directed Investor); Trustee of YWCA Retirement Fund; CEO of YWCA of the USA; Board member of the NY Metropolitan Transportation Authority; Commissioner of the NYC Department of Aging; Board member of Johns Hopkins Bioethics Institute | | 184 | | None |
Joel W. Motley – 1952 Trustee | | 2019 | | Director of Office of Finance, Federal Home Loan Bank System; Managing Director of Carmona Motley Inc. (privately held financial advisor); Member of the Council on Foreign Relations and its Finance and Budget Committee; Chairman Emeritus of Board of Human Rights Watch and Member of its Investment Committee; and Member of Investment Committee and Board of Historic Hudson Valley (non-profit cultural organization) Formerly: Managing Director of Public Capital Advisors, LLC (privately held financial advisor); Managing Director of Carmona Motley Hoffman, Inc. (privately held financial advisor); Trustee of certain Oppenheimer Funds; Director of Columbia Equity Financial Corp. (privately held financial advisor); and Member of the Vestry of Trinity Church Wall Street | | 184 | | Member of Board of Greenwall Foundation (bioethics research foundation) and its Investment Committee; Member of Board of Friends of the LRC (non-profit legal advocacy); Board Member and Investment Committee Member of Pulitzer Center for Crisis Reporting (non-profit journalism) |
Teresa M. Ressel – 1962 Trustee | | 2017 | | Non-executive director and trustee of a number of public and private business corporations Formerly: Chief Executive Officer, UBS Securities LLC (investment banking); Chief Operating Officer, UBS AG Americas (investment banking); Sr. Management Team Olayan America, The Olayan Group (international investor/commercial/industrial); Assistant Secretary for Management & Budget and Designated Chief Financial Officer, U.S. Department of Treasury; Director, Atlantic Power Corporation (power generation company) and ON Semiconductor Corporation (semiconductor manufacturing) | | 184 | | Elucida Oncology (nanotechnology & medical particles company) |
T-3 Invesco Comstock Fund
Trustees and Officers–(continued)
| | | | | | | | |
Name, Year of Birth and Position(s) Held with the Trust | | Trustee
and/or
Officer
Since | | Principal Occupation(s) During Past 5 Years | | Number of Funds in Fund Complex Overseen by
Trustee | | Other Directorship(s) Held by Trustee During Past 5 Years |
Independent Trustees–(continued) | | | | | | |
| Ann Barnett Stern – 1957 Trustee | | 2017 | | President, Chief Executive Officer and Board Member, Houston Endowment, Inc. a private philanthropic institution Formerly: Executive Vice President, Texas Children’s Hospital; Vice President, General Counsel and Corporate Compliance Officer, Texas Children’s Hospital; Attorney at Beck, Redden and Secrest, LLP and Andrews and Kurth LLP | | 184 | | Director and Audit Committee member of Federal Reserve Bank of Dallas; Trustee and Board Chair of Good Reason Houston (nonprofit); Trustee, Vice Chair, Chair of Nomination/Governance Committee, Chair of Personnel Committee of Holdsworth Center (nonprofit); Trustee and Investment Committee member of University of Texas Law School Foundation (nonprofit); Board Member of Greater Houston Partnership |
| Robert C. Troccoli – 1949 Trustee | | 2016 | | Retired Formerly: Adjunct Professor, University of Denver – Daniels College of Business; and Managing Partner, KPMG LLP | | 184 | | None |
| Daniel S. Vandivort –1954 Trustee | | 2019 | | Trustee, Board of Trustees, Huntington Disease Foundation of America; and President, Flyway Advisory Services LLC (consulting and property management) Formerly: Trustee and Governance Chair, of certain Oppenheimer Funds; and Treasurer, Chairman of the Audit and Finance Committee, Huntington Disease Foundation of America | | 184 | | None |
| James D. Vaughn – 1945 Trustee | | 2019 | | Retired Formerly: Managing Partner, Deloitte & Touche LLP; Trustee and Chairman of the Audit Committee, Schroder Funds; Board Member, Mile High United Way, Boys and Girls Clubs, Boy Scouts, Colorado Business Committee for the Arts, Economic Club of Colorado and Metro Denver Network (economic development corporation); and Trustee of certain Oppenheimer Funds | | 184 | | Board member and Chairman of Audit Committee of AMG National Trust Bank; Trustee and Investment Committee member, University of South Dakota Foundation; Board member, Audit Committee Member and past Board Chair, Junior Achievement (non-profit) |
T-4 Invesco Comstock Fund
Trustees and Officers–(continued)
| | | | | | | | |
Name, Year of Birth and Position(s) Held with the Trust | | Trustee
and/or
Officer
Since | | Principal Occupation(s) During Past 5 Years | | Number of Funds in Fund Complex Overseen by
Trustee | | Other Directorship(s) Held by Trustee During Past 5 Years |
Officers | | | | | | | | |
Sheri Morris – 1964 President and Principal Executive Officer | | 2003 | | Head of Global Fund Services, Invesco Ltd.; President and Principal Executive Officer, The Invesco Funds; Senior Vice President, Invesco Advisers, Inc. (formerly known as Invesco Institutional (N.A.), Inc.) (registered investment adviser); and Vice President, Invesco Exchange-Traded Fund Trust, Invesco Exchange-Traded Fund Trust II, Invesco India Exchange-Traded Fund Trust, Invesco Actively Managed Exchange-Traded Fund Trust, Invesco Actively Managed Exchange-Traded Commodity Fund Trust and Invesco Exchange-Traded Self-Indexed Fund Trust; and Vice President, OppenheimerFunds, Inc. Formerly: Vice President, Treasurer and Principal Financial Officer, The Invesco Funds; Vice President, Invesco AIM Advisers, Inc., Invesco AIM Capital Management, Inc. and Invesco AIM Private Asset Management, Inc.; Assistant Vice President and Assistant Treasurer, The Invesco Funds; Vice President and Assistant Vice President, Invesco Advisers, Inc.; Assistant Vice President, Invesco AIM Capital Management, Inc. and Invesco AIM Private Asset Management, Inc.; and Treasurer, Invesco Exchange-Traded Fund Trust, Invesco Exchange-Traded Fund Trust II, Invesco India Exchange-Traded Fund Trust and Invesco Actively Managed Exchange-Traded Fund Trust | | N/A | | N/A |
Russell C. Burk – 1958 Senior Vice President and Senior Officer | | 2005 | | Senior Vice President and Senior Officer, The Invesco Funds | | N/A | | N/A |
Jeffrey H. Kupor – 1968 Senior Vice President, Chief Legal Officer and Secretary | | 2018 | | Head of Legal of the Americas, Invesco Ltd.; Senior Vice President and Secretary, Invesco Advisers, Inc. (formerly known as Invesco Institutional (N.A.), Inc.) (registered investment adviser); Senior Vice President and Secretary, Invesco Distributors, Inc. (formerly known as Invesco AIM Distributors, Inc.); Vice President and Secretary, Invesco Investment Services, Inc. (formerly known as Invesco AIM Investment Services, Inc.) Senior Vice President, Chief Legal Officer and Secretary, The Invesco Funds; Secretary and General Counsel, Invesco Investment Advisers LLC (formerly known as Van Kampen Asset Management); Secretary and General Counsel, Invesco Capital Markets, Inc. (formerly known as Van Kampen Funds Inc.) and Chief Legal Officer, Invesco Exchange-Traded Fund Trust, Invesco Exchange-Traded Fund Trust II, Invesco India Exchange-Traded Fund Trust, Invesco Actively Managed Exchange-Traded Fund Trust, Invesco Actively Managed Exchange-Traded Commodity Fund Trust and Invesco Exchange-Traded Self-Indexed Fund Trust; Secretary, Invesco Indexing LLC; Secretary, W.L. Ross & Co., LLC ; Secretary and Vice President, Harbourview Asset Management Corporation; Secretary and Vice President, OppenheimerFunds, Inc. and Invesco Managed Accounts, LLC; Secretary and Senior Vice President, OFI Global Institutional, Inc.; Secretary and Vice President, OFI SteelPath, Inc.; Secretary and Vice President, Oppenheimer Acquisition Corp.; Secretary and Vice President, Shareholder Services, Inc.; Secretary and Vice President, Trinity Investment Management Corporation Formerly: Secretary and Vice President, Jemstep, Inc.; Head of Legal, Worldwide Institutional, Invesco Ltd.; Secretary and General Counsel, INVESCO Private Capital Investments, Inc.; Senior Vice President, Secretary and General Counsel, Invesco Management Group, Inc. (formerly known as Invesco AIM Management Group, Inc.); Assistant Secretary, INVESCO Asset Management (Bermuda) Ltd.; Secretary and General Counsel, Invesco Private Capital, Inc.; Assistant Secretary and General Counsel, INVESCO Realty, Inc.; Secretary and General Counsel, Invesco Senior Secured Management, Inc.; and Secretary, Sovereign G./P. Holdings Inc. | | N/A | | N/A |
T-5 Invesco Comstock Fund
Trustees and Officers–(continued)
| | | | | | | | |
Name, Year of Birth and Position(s) Held with the Trust | | Trustee
and/or
Officer
Since | | Principal Occupation(s) During Past 5 Years | | Number of Funds in Fund Complex Overseen by
Trustee | | Other Directorship(s) Held by Trustee During Past 5 Years |
Officers–(continued) | | | | | | | | |
| Andrew R. Schlossberg – 1974 Senior Vice President | | 2019 | | Head of the Americas and Senior Managing Director, Invesco Ltd.; Director and Senior Vice President, Invesco Advisers, Inc. (formerly known as Invesco Institutional (N.A.), Inc.) (registered investment adviser); Director and Chairman, Invesco Investment Services, Inc. (formerly known as Invesco AIM Investment Services, Inc.) (registered transfer agent); Senior Vice President, The Invesco Funds; Director, Invesco Investment Advisers LLC (formerly known as Van Kampen Asset Management); Director, President and Chairman, Invesco Insurance Agency, Inc. Formerly: Director, President and Chairman, Invesco Insurance Agency, Inc.; Director, Invesco UK Limited; Director and Chief Executive, Invesco Asset Management Limited and Invesco Fund Managers Limited; Assistant Vice President, The Invesco Funds; Senior Vice President, Invesco Advisers, Inc. (formerly known as Invesco Institutional (N.A.), Inc.) (registered investment adviser); Director and Chief Executive, Invesco Administration Services Limited and Invesco Global Investment Funds Limited; Director, Invesco Distributors, Inc.; Head of EMEA, Invesco Ltd.; President, Invesco Actively Managed Exchange-Traded Commodity Fund Trust, Invesco Actively Managed Exchange-Traded Fund Trust, Invesco Exchange-Traded Fund Trust, Invesco Exchange-Traded Fund Trust II and Invesco India Exchange-Traded Fund Trust; Managing Director and Principal Executive Officer, Invesco Capital Management LLC | | N/A | | N/A |
John M. Zerr – 1962 Senior Vice President | | 2006 | | Chief Operating Officer of the Americas; Senior Vice President, Invesco Advisers, Inc. (formerly known as Invesco Institutional (N.A.), Inc.) (registered investment adviser); Senior Vice President, Invesco Distributors, Inc. (formerly known as Invesco AIM Distributors, Inc.); Director and Vice President, Invesco Investment Services, Inc. (formerly known as Invesco AIM Investment Services, Inc.) Senior Vice President, The Invesco Funds; Managing Director, Invesco Capital Management LLC; Director, Invesco Investment Advisers LLC (formerly known as Van Kampen Asset Management); Senior Vice President, Invesco Capital Markets, Inc. (formerly known as Van Kampen Funds Inc.); Manager, Invesco Indexing LLC; Manager, Invesco Specialized Products, LLC; Member, Invesco Canada Funds Advisory Board; Director, President and Chief Executive Officer, Invesco Corporate Class Inc. (corporate mutual fund company); and Director, Chairman, President and Chief Executive Officer, Invesco Canada Ltd. (formerly known as Invesco Trimark Ltd./Invesco Trimark Ltèe) (registered investment adviser and registered transfer agent); President, Invesco, Inc.; President, Invesco Global Direct Real Estate Feeder GP Ltd.; President, Invesco IP Holdings(Canada) Ltd; President, Invesco Global Direct Real Estate GP Ltd.; President, Invesco Financial Services Ltd. / Services Financiers Invesco Ltée; President, Trimark Investments Ltd./Placements Trimark Ltée and Director and Chairman, Invesco Trust Company Formerly: Director and Senior Vice President, Invesco Insurance Agency, Inc.; Director and Senior Vice President, Invesco Management Group, Inc. (formerly known as Invesco AIM Management Group, Inc.); Secretary and General Counsel, Invesco Management Group, Inc. (formerly known as Invesco AIM Management Group, Inc.); Secretary, Invesco Investment Services, Inc. (formerly known as Invesco AIM Investment Services, Inc.); Chief Legal Officer and Secretary, The Invesco Funds; Secretary and General Counsel, Invesco Investment Advisers LLC (formerly known as Van Kampen Asset Management); Secretary and General Counsel, Invesco Capital Markets, Inc. (formerly known as Van Kampen Funds Inc.); Chief Legal Officer, Invesco Exchange-Traded Fund Trust, Invesco Exchange-Traded Fund Trust II, Invesco India Exchange-Traded Fund Trust, Invesco Actively Managed Exchange-Traded Fund Trust, Invesco Actively Managed Exchange-Traded Commodity Fund Trust and Invesco Exchange-Traded Self-Indexed Fund Trust; Secretary, Invesco Indexing LLC; Director, Secretary, General Counsel and Senior Vice President, Van Kampen Exchange Corp.; Director, Vice President and Secretary, IVZ Distributors, Inc. (formerly known as INVESCO Distributors, Inc.); Director and Vice President, INVESCO Funds Group, Inc.; Director and Vice President, Van Kampen Advisors Inc.; Director, Vice President, Secretary and General Counsel, Van Kampen Investor Services Inc.;Director and Secretary, Invesco Distributors, Inc. (formerly known as Invesco AIM Distributors, Inc.); Director, Senior Vice President, General Counsel and Secretary, Invesco AIM Advisers, Inc. and Van Kampen Investments Inc.; Director, Vice President and Secretary, Fund Management Company; Director, Senior Vice President, Secretary, General Counsel and Vice President, Invesco AIM Capital Management, Inc.; Chief Operating Officer and General Counsel, Liberty Ridge Capital, Inc. (an investment adviser) | | N/A | | N/A |
T-6 Invesco Comstock Fund
Trustees and Officers–(continued)
| | | | | | | | |
Name, Year of Birth and Position(s) Held with the Trust | | Trustee
and/or
Officer
Since | | Principal Occupation(s) During Past 5 Years | | Number of Funds in Fund Complex Overseen by
Trustee | | Other Directorship(s) Held by Trustee During Past 5 Years |
Officers–(continued) | | | | | | | | |
Gregory G. McGreevey – 1962 Senior Vice President | | 2012 | | Senior Managing Director, Invesco Ltd.; Director, Chairman, President, and Chief Executive Officer, Invesco Advisers, Inc. (formerly known as Invesco Institutional (N.A.), Inc.) (registered investment adviser); Director, Invesco Mortgage Capital, Inc. and Invesco Senior Secured Management, Inc.; and Senior Vice President, The Invesco Funds; and President, SNW Asset Management Corporation and Invesco Managed Accounts, LLC; Chairman and Director, Invesco Private Capital, Inc.; Chairman and Director, INVESCO Private Capital Investments, Inc.; Chairman and Director, INVESCO Realty, Inc. Chairman and Director, INVESCO Realty, Inc.; and Senior Vice President, Invesco Group Services, Inc. Formerly: Senior Vice President, Invesco Management Group, Inc. and Invesco Advisers, Inc.; Assistant Vice President, The Invesco Funds | | N/A | | N/A |
Adrien Deberghes – 1967 Principal Financial Officer, Treasurer and Vice President | | 2020 | | Head of the Fund Office of the CFO and Fund Administration; Vice President, Invesco Advisers, Inc.; Principal Financial Officer, Treasurer and Vice President, The Invesco Funds; Vice President, Invesco Exchange-Traded Fund Trust, Invesco Exchange-Traded Fund Trust II, Invesco India Exchange-Traded Fund Trust, Invesco Actively Managed Exchange-Traded Fund Trust, Invesco Actively Managed Exchange-Traded Commodity Fund Trust and Invesco Exchange-Traded Self-Indexed Fund Trust Formerly: Senior Vice President and Treasurer, Fidelity Investments | | N/A | | N/A |
Crissie M. Wisdom – 1969 Anti-Money Laundering Compliance Officer | | 2013 | | Anti-Money Laundering and OFAC Compliance Officer for Invesco U.S. entities including: Invesco Advisers, Inc. and its affiliates, Invesco Capital Markets, Inc., Invesco Distributors, Inc., Invesco Investment Services, Inc., The Invesco Funds, Invesco Capital Management, LLC, Invesco Trust Company; and Fraud Prevention Manager for Invesco Investment Services, Inc. | | N/A | | N/A |
Todd F. Kuehl – 1969 Chief Compliance Officer and Senior Vice President | | 2020 | | Chief Compliance Officer, Invesco Advisers, Inc. (registered investment adviser); and Chief Compliance Officer, The Invesco Funds and Senior Vice President Formerly: Managing Director and Chief Compliance Officer, Legg Mason (Mutual Funds); Chief Compliance Officer, Legg Mason Private Portfolio Group (registered investment adviser) | | N/A | | N/A |
Michael McMaster – 1962 Chief Tax Officer, Vice President and Assistant Treasurer | | 2020 | | Head of Global Fund Services Tax; Chief Tax Officer, Vice President and Assistant Treasurer, The Invesco Funds; Vice President, Invesco Advisers, Inc.; Assistant Treasurer, Invesco Capital Management LLC, Assistant Treasurer and Chief Tax Officer, Invesco Exchange-Traded Fund Trust, Invesco Exchange-Traded Fund Trust II, Invesco India Exchange-Traded Fund Trust, Invesco Actively Managed Exchange-Traded Fund Trust, Invesco Actively Managed Exchange-Traded Commodity Fund Trust and Invesco Exchange-Traded Self-Indexed Fund Trust; Assistant Treasurer, Invesco Specialized Products, LLC Formerly: Senior Vice President – Managing Director of Tax Services, U.S. Bank Global Fund Services (GFS) | | N/A | | N/A |
The Statement of Additional Information of the Trust includes additional information about the Fund’s Trustees and is available upon request, without charge, by calling 1.800.959.4246. Please refer to the Fund’s Statement of Additional Information for information on the Fund’s sub-advisers.
| | | | | | |
Office of the Fund | | Investment Adviser | | Distributor | | Auditors |
11 Greenway Plaza, Suite 1000 | | Invesco Advisers, Inc. | | Invesco Distributors, Inc. | | PricewaterhouseCoopers LLP |
Houston, TX 77046-1173 | | 1555 Peachtree Street, N.E. | | 11 Greenway Plaza, Suite 1000 | | 1000 Louisiana Street, Suite 5800 |
| | Atlanta, GA 30309 | | Houston, TX 77046-1173 | �� | Houston, TX 77002-5678 |
| | | |
Counsel to the Fund | | Counsel to the Independent Trustees | | Transfer Agent | | Custodian |
Stradley Ronon Stevens & Young, LLP | | Goodwin Procter LLP | | Invesco Investment Services, Inc. | | State Street Bank and Trust Company |
2005 Market Street, Suite 2600 | | 901 New York Avenue, N.W. | | 11 Greenway Plaza, Suite 1000 | | 225 Franklin Street |
Philadelphia, PA 19103-7018 | | Washington, D.C. 20001 | | Houston, TX 77046-1173 | | Boston, MA 02110-2801 |
T-7 Invesco Comstock Fund
(This page intentionally left blank)
(This page intentionally left blank)
(This page intentionally left blank)

Go paperless with eDelivery
Visit invesco.com/edelivery to enjoy the convenience and security of anytime electronic access to your investment documents.
With eDelivery, you can elect to have any or all of the following materials delivered straight to your inbox to download, save and print from your own computer:
| ∎ | | Fund reports and prospectuses |
Invesco mailing information
Send general correspondence to Invesco Investment Services, Inc., P.O. Box 219078, Kansas City, MO 64121-9078.
Important notice regarding delivery of security holder documents
To reduce Fund expenses, only one copy of most shareholder documents may be mailed to shareholders with multiple accounts at the same address (Householding). Mailing of your shareholder documents may be householded indefinitely unless you instruct us otherwise. If you do not want the mailing of these documents to be combined with those for other members of your household, please contact Invesco Investment Services, Inc. at 800 959 4246 or contact your financial institution. We will begin sending you individual copies for each account within 30 days after receiving your request.
Fund holdings and proxy voting information
The Fund provides a complete list of its portfolio holdings four times each fiscal year, at the end of each fiscal quarter. For the second and fourth quarters, the list appears, respectively, in the Fund’s semiannual and annual reports to shareholders. For the first and third quarters, the Fund files the list with the Securities and Exchange Commission (SEC) as an exhibit to its reports on Form N-PORT. The most recent list of portfolio holdings is available at invesco.com/completeqtrholdings. Shareholders can also look up the Fund’s Form N-PORT filings on the SEC website, sec.gov. The SEC file numbers for the Fund are shown below.
A description of the policies and procedures that the Fund uses to determine how to vote proxies relating to portfolio securities is available without charge, upon request, from our Client Services department at 800 959 4246, or at invesco.com/ corporate/about-us/esg. The information is also available on the SEC website, sec.gov.
| | |
Information regarding how the Fund voted proxies related to its portfolio securities during the most recent 12-month period ended June 30 is available at invesco.com/proxysearch. This information is also available on the SEC website, sec.gov. Invesco Advisers, Inc. is an investment adviser; it provides investment advisory services to individual and institutional clients and does not sell securities. Invesco Distributors, Inc. is the US distributor for Invesco Ltd.’s retail mutual funds, exchange-traded funds and institutional money market funds. Both are wholly owned, indirect subsidiaries of Invesco Ltd. | | |
| | | | |
| SEC file numbers: 811-03826 and 002-85905 | | Invesco Distributors, Inc. | | VK-COM-AR-1 |
| | | | |
| | |
 | | Annual Report to Shareholders | | April 30, 2021 |
| | |
| | Invesco Comstock Select Fund |
| | Nasdaq: |
| | A: CGRWX ∎ C: CGRCX ∎ R: CGRNX ∎ Y: CGRYX ∎ R5: IOVVX ∎ R6: OGRIX |

Management’s Discussion of Fund Performance
|
Performance summary |
For the fiscal year ended April 30, 2021, Class A shares of Invesco Comstock Select Fund (the Fund), at net asset value (NAV), outperformed the Russell 1000 Value Index. Your Fund’s long-term performance appears later in this report. |
Fund vs. Indexes |
Total returns, 4/30/20 to 4/30/21, at net asset value (NAV). Performance shown does not include applicable contingent deferred sales charges (CDSC) or front-end sales charges, which would have reduced performance. |
| | | | |
Class A Shares | | | 60.66 | % |
| Class C Shares | | | 59.49 | |
| Class R Shares | | | 60.24 | |
| Class Y Shares | | | 61.10 | |
| Class R5 Shares | | | 61.27 | |
| Class R6 Shares | | | 61.33 | |
| Russell 1000 Value Index▼ | | | 45.92 | |
| Source(s): ▼RIMES Technologies Corp. | | | | |
Market conditions and your Fund
As many businesses began to shut down in April 2020 due to the pandemic, US unemployment numbers continued to climb, as the economy ground to a halt. However, during the second and into the third quarter of 2020, US stocks largely shrugged off economic uncertainty, social unrest and a resurgence in coronavirus infections to rally from the market bottom. Investor sentiment improved in response to trillions of dollars in economic stimulus, progress on a coronavirus vaccine and re-openings in many US regions. In July, the US Federal Reserve (the Fed) extended its emergency stimulus programs, originally scheduled to end in September, to year-end, which provided support to equities. In late August, second-quarter gross domestic product (GDP) fell by 31.4%,1 a record decline. Despite the extreme drop in the economy, the S&P 500 Index not only erased all its losses from the first quarter but made record highs.
Despite a September selloff, US equity markets posted gains in the third quarter as the Fed extended its emergency stimulus programs and changed its inflation target policy, both of which supported equities. Data for both manufacturing and services indicated expansion, a reversal from significant declines earlier in the year. Corporate earnings were also better than anticipated and a gradual decline in new COVID-19 infections in many regions, combined with optimism about progress on a coronavirus vaccine, further boosted stocks. October saw increased volatility as COVID-19 infection rates rose to record highs in the US and Europe. Investors also became concerned about delayed results from the US presidential election and the real possibility of a contested election, further delaying a clear winner.
US equity markets posted gains in the fourth quarter, as positive news on COVID-19 vaccines and strong corporate earnings out-weighed
investor concerns about the political disagreement over a fiscal stimulus package and sharply rising coronavirus infections nationwide. Cyclical sectors like energy and financials led the way, while real estate and consumer staples lagged. Market leadership also shifted during the quarter with value stocks outperforming growth for the first time since the fourth quarter of 2016. While the US economy rebounded significantly since the pandemic began, the recovery appeared to slow in the fourth quarter with employment gains and GDP growth down from the third quarter. However, stocks were buoyed by the Fed’s pledge to maintain its accommodative stance and asset purchases, “until substantial further progress has been made” toward employment and inflation targets.
US political unrest and rising COVID-19 infection rates marked the start of the first quarter. Additionally, retail investors bid up select stocks like GameStop and AMC Theaters, ultimately causing a sharp selloff in late January. Corporate earnings generally beat expectations, but market volatility rose during the quarter as investors worried about rising bond yields and inflation. Despite the Federal Reserve’s commitment to an accommodative policy, the 10-year US Treasury yield rose from 0.92% at year-end to 1.63%2 at the fiscal year-end. Approval of a third COVID-19 vaccine boosted investors’ optimism for faster economic recovery. Although March saw increased volatility with consecutive down days in the US stock market, stocks continued to hit all-time highs through April. US stocks had strong returns for the fiscal year, with the S&P 500 Index returning 45.98% for the year.3
On the positive side, strong security selection in the industrials sector was a key contributor to the Fund’s relative return. FedEx was the largest individual contributor, followed by Textron and Johnson Controls International. We invested in FedEx based on its ability to charge higher prices amid a
reduction in international air capacity, its lower cost structures resulting from a more efficient fleet and lower operating costs stemming from the integration of TNT Express (not owned), all of which we believe will contribute to an eventual recovery in profit margins.
Strong security selection and an overweight in the financials sector was a notable contributor to relative returns. Citizens Financial Group, Bank of America, Morgan Stanley and American International Group were leading performers this quarter. Investor enthusiasm surrounding the approval of three COVID-19 vaccines and the potential for reopening economies pushed yields higher and financial stocks benefited. Morgan Stanley was sold during the period based on strong performance.
Strong stock selection in health care contributed to relative returns. Not owning Johnson & Johnson, Gilead Sciences and Pfizer, and holding HCA Healthcare were the top contributors. HCA Healthcare returned over 83% for the period as the company’s revenue and profits benefited due to the ban being lifted on elective surgeries in the US.
Stock selection within information technology was also a large contributor to relative performance for the period. QUALCOMM and NXP Semiconductors were the largest contributors to the Fund’s performance. QUALCOMM was sold during the period based on strong performance. Technology companies, notably semiconductors, benefited from increased demand as employees in most service sectors worked from home.
Stock selection and an underweight to consumer staples assisted relative performance. Not owning Procter & Gamble and Walmart were the largest contributors, as these are large benchmark holdings and they materially underperformed the sector.
Material underweight to real estate and utilities also benefited relative performance for the quarter. Both sectors’ returns lagged the majority of the Russell 1000 Value sectors for the period.
On the negative side, the Fund’s cash position, averaging only less than 4% for the period, detracted from relative returns, as expected during a strong equity rally.
Stock selection in communication services also hampered relative returns. Many of the benchmark stocks not held in the portfolio that performed well for the period detracted from relative performance. We remain materially underweight in the sector due to unattractive valuations, in our view.
Having no exposure in the materials sector also dampened relative performance. Materials stocks rallied late during the period due to rising commodities and raw materials costs.
As we have seen a rotation toward value stocks, we remain cautiously optimistic about the longer-term outlook for the US and global economies. Though the distribution of coronavirus vaccines should provide a measure of
2 Invesco Comstock Select Fund
stability, we believe equity markets may experience continued volatility due to rising yields, increased COVID-19 infection rates in some US states and a massive resurgence of COVID-19 in India.
Thank you for your investment in the Invesco Comstock Select Fund and for sharing our long-term investment horizon.
| 1 | Source: US Bureau of Economic Analysis |
Portfolio manager(s):
Devin Armstrong - Lead
Charles DyReyes
Kevin Holt - Lead
James (Jay) Warwick
The views and opinions expressed in management’s discussion of Fund performance are those of Invesco Advisers, Inc. These views and opinions are subject to change at any time based on factors such as market and economic conditions. These views and opinions may not be relied upon as investment advice or recommendations, or as an offer for a particular security. The information is not a complete analysis of every aspect of any market, country, industry, security or the Fund. Statements of fact are from sources considered reliable, but Invesco Advisers, Inc. makes no representation or warranty as to their completeness or accuracy. Although historical performance is no guarantee of future results, these insights may help you understand our investment management philosophy.
See important Fund and, if applicable, index disclosures later in this report.
3 Invesco Comstock Select Fund
Your Fund’s Long-Term Performance
Results of a $10,000 Investment – Oldest Share Class(es)
Fund and index data from 4/30/11
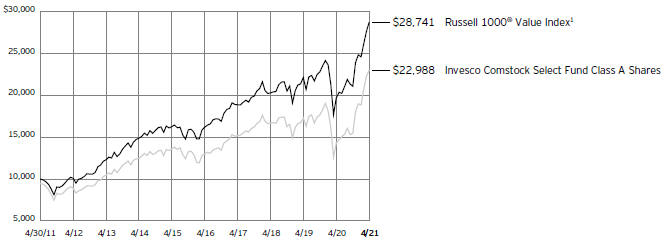
| 1 | Source: RIMES Technologies Corp. |
Past performance cannot guarantee future results.
The data shown in the chart include reinvested distributions, applicable sales charges and Fund expenses including management
fees. Index results include reinvested dividends, but they do not reflect sales charges. Performance of the peer group, if applicable, reflects fund expenses and management fees;
performance of a market index does not. Performance shown in the chart does not reflect deduction of taxes a shareholder would pay on Fund distributions or sale of Fund shares.
4 Invesco Comstock Select Fund
| | | | |
Average Annual Total Returns | |
As of 4/30/21, including maximum applicable sales charges | |
Class A Shares | | | | |
| Inception (9/16/85) | | | 9.64 | % |
| 10 Years | | | 8.68 | |
| 5 Years | | | 10.82 | |
| 1 Year | | | 51.83 | |
Class C Shares | | | | |
| Inception (5/1/96) | | | 7.19 | % |
| 10 Years | | | 8.64 | |
| 5 Years | | | 11.24 | |
| 1 Year | | | 58.49 | |
Class R Shares | | | | |
| Inception (3/1/01) | | | 6.88 | % |
| 10 Years | | | 9.02 | |
| 5 Years | | | 11.79 | |
| 1 Year | | | 60.24 | |
Class Y Shares | | | | |
| Inception (12/16/96) | | | 7.60 | % |
| 10 Years | | | 9.61 | |
| 5 Years | | | 12.35 | |
| 1 Year | | | 61.10 | |
Class R5 Shares | | | | |
| 10 Years | | | 9.37 | % |
| 5 Years | | | 12.23 | |
| 1 Year | | | 61.27 | |
Class R6 Shares | | | | |
| Inception (2/28/12) | | | 11.38 | % |
| 5 Years | | | 12.53 | |
| 1 Year | | | 61.33 | |
Effective May 24, 2019, Class A, Class C, Class R, Class Y and Class I shares of the Oppenheimer Value Fund, (the predecessor fund), were reorganized into Class A, Class C, Class R, Class Y and Class R6 shares, respectively, of the Invesco Oppenheimer Value Fund. Note: The Fund was subsequently renamed the Invesco Comstock Select Fund (the Fund). Returns shown above, for periods ending on or prior to May 24, 2019, for Class A, Class C, Class R, Class Y and Class R6 shares are those for Class A, Class C, Class R, Class Y and Class I shares of the predecessor fund. Share class returns will differ from the predecessor fund because of different expenses.
Class R5 shares incepted on May 24, 2019. Performance shown on and prior to that date is that of the predecessor fund’s Class A shares at net asset value and includes the 12b-1 fees applicable to Class A shares.
The performance data quoted represent past performance and cannot guarantee future results; current performance may be lower or higher. Please visit invesco.com/ performance for the most recent month-end performance. Performance figures reflect reinvested distributions, changes in net asset value and the effect of the maximum sales charge unless otherwise stated. Performance figures do not reflect
deduction of taxes a shareholder would pay on Fund distributions or sale of Fund shares. Investment return and principal value will fluctuate so that you may have a gain or loss when you sell shares.
Class A share performance reflects the maximum 5.50% sales charge, and Class C share performance reflects the applicable contingent deferred sales charge (CDSC) for the period involved. The CDSC on Class C shares is 1% for the first year after purchase. Class R, Class Y, Class R5 and Class R6 shares do not have a front-end sales charge or a CDSC; therefore, performance is at net asset value.
The performance of the Fund’s share classes will differ primarily due to different sales charge structures and class expenses.
Fund performance reflects any applicable fee waivers and/or expense reimbursements. Had the adviser not waived fees and/or reimbursed expenses currently or in the past, returns would have been lower. See current prospectus for more information.
5 Invesco Comstock Select Fund
Supplemental Information
Invesco Comstock Select Fund’s investment objective is to seek capital appreciation.
| ∎ | | Unless otherwise stated, information presented in this report is as of April 30, 2021, and is based on total net assets. |
| ∎ | | Unless otherwise noted, all data is provided by Invesco. |
| ∎ | | To access your Fund’s reports/prospectus, visit invesco.com/fundreports. |
About indexes used in this report
| ∎ | | The Russell 1000® Value Index is an unmanaged index considered representative of large-cap value stocks. The Russell 1000 Value Index is a trademark/service mark of the Frank Russell Co. Russell® is a trademark of the Frank Russell Co. |
| ∎ | | The Fund is not managed to track the performance of any particular index, including the index(es) described here, and consequently, the performance of the Fund may deviate significantly from the performance of the index(es). |
| ∎ | | A direct investment cannot be made in an index. Unless otherwise indicated, index results include reinvested dividends, and they do not reflect sales charges. Performance of the peer group, if applicable, reflects fund expenses; performance of a market index does not. |
Liquidity Risk Management Program
In compliance with Rule 22e-4 under the Investment Company Act of 1940, as amended (the “Liquidity Rule”), the Fund has adopted and implemented a liquidity risk management program in accordance with the Liquidity Rule (the “Program”). The Program is reasonably designed to assess and manage the Fund’s liquidity risk, which is the risk that the Fund could not meet redemption requests without significant dilution of remaining investors’ interests in the Fund. The Board of Trustees of the Fund (the “Board”) has appointed Invesco Advisers, Inc. (“Invesco”), the Fund’s investment adviser, as the Program’s administrator, and Invesco has delegated oversight of the Program to the Liquidity Risk Management Committee (the “Committee”), which is composed of senior representatives from relevant business groups at Invesco.
As required by the Liquidity Rule, the Program includes policies and procedures providing for an assessment, no less frequently than annually, of the Fund’s liquidity risk that takes into account, as relevant to the Fund’s liquidity risk: (1) the Fund’s investment strategy and liquidity of portfolio investments during both normal and reasonably foreseeable stressed conditions; (2) short-term and long-term cash
flow projections for the Fund during both normal and reasonably foreseeable stressed conditions; and (3) the Fund’s holdings of cash and cash equivalents and any borrowing arrangements. The Liquidity Rule also requires the classification of the Fund’s investments into categories that reflect the assessment of their relative liquidity under current market conditions. The Fund classifies its investments into one of four categories defined in the Liquidity Rule: “Highly Liquid,” “Moderately Liquid,” “Less Liquid,” and “Illiquid.” Funds that are not invested primarily in “Highly Liquid Investments” that are assets (cash or investments that are reasonably expected to be convertible into cash within three business days without significantly changing the market value of the investment) are required to establish a “Highly Liquid Investment Minimum” (“HLIM”), which is the minimum percentage of net assets that must be invested in Highly Liquid Investments. Funds with HLIMs have procedures for addressing HLIM shortfalls, including reporting to the Board and the SEC (on a non-public basis) as required by the Program and the Liquidity Rule. In addition, the Fund may not acquire an investment if, immediately after the acquisition, over 15% of the Fund’s net assets would consist of “Illiquid Investments” that are assets (an investment that cannot reasonably be expected to be sold or disposed of in current market conditions in seven calendar days or less without the sale or disposition significantly changing the market value of the investment). The Liquidity Rule and the Program also require reporting to the Board and the SEC (on a non-public basis) if a Fund’s holdings of Illiquid Investments exceed 15% of the Fund’s assets.
At a meeting held on March 22-24, 2021, the Committee presented a report to the Board that addressed the operation of the Program and assessed the Program’s adequacy and effectiveness of implementation (the “Report”). The Report covered the period from January 1, 2020 through December 31, 2020 (the “Program Reporting Period”). The Report discussed notable events affecting liquidity over the Program Reporting Period, including the impact of the coronavirus pandemic on
the Fund and the overall market. The Report noted that there were no material changes to the Program during the Program Reporting Period.
The Report stated, in relevant part, that during the Program Reporting Period:
| ∎ | | The Program, as adopted and implemented, remained reasonably designed to assess and manage the Fund’s liquidity risk and was operated effectively to achieve that goal; |
| ∎ | | The Fund’s investment strategy remained appropriate for an open-end fund; |
| ∎ | | The Fund was able to meet requests for redemption without significant dilution of remaining investors’ interests in the Fund; |
| ∎ | | The Fund did not breach the 15% limit on Illiquid Investments; and |
| ∎ | | The Fund primarily held Highly Liquid Investments and therefore has not adopted an HLIM. |
|
This report must be accompanied or preceded by a currently effective Fund prospectus, which contains more complete information, including sales charges and expenses. Investors should read it carefully before investing. |
|
| NOT FDIC INSURED | MAY LOSE VALUE | NO BANK GUARANTEE |
6 Invesco Comstock Select Fund
Fund Information
Portfolio Composition
| | |
| By sector | | % of total net assets |
| |
Financials | | 23.75% |
Health Care | | 16.82 |
Industrials | | 16.41 |
Information Technology | | 14.28 |
Consumer Staples | | 12.58 |
Energy | | 8.32 |
Consumer Discretionary | | 2.82 |
Utilities | | 2.76 |
Money Market Funds Plus Other Assets Less Liabilities | | 2.26 |
Top 10 Equity Holdings*
| | | | | | |
| | | | | | % of total net assets |
| | |
| | 1. | | | Wells Fargo & Co. | | 5.88% |
| | 2. | | | Citigroup, Inc. | | 5.35 |
| | 3. | | | Anthem, Inc. | | 5.14 |
| | 4. | | | Philip Morris International, Inc. | | 4.96 |
| | 5. | | | Kraft Heinz Co. (The) | | 4.71 |
| | 6. | | | American International Group, Inc. | | 4.06 |
| | 7. | | | Bank of America Corp. | | 3.84 |
| | 8. | | | Suncor Energy, Inc. | | 3.79 |
| | 9. | | | CDK Global, Inc. | | 3.65 |
| | 10. | | | Caterpillar, Inc. | | 3.41 |
The Fund’s holdings are subject to change, and there is no assurance that the Fund will continue to hold any particular security.
| * | Excluding money market fund holdings, if any. |
Data presented here are as of April 30, 2021.
7 Invesco Comstock Select Fund
Schedule of Investments(a)
April 30, 2021
| | | | | | | | |
| | | Shares | | | Value | |
Common Stocks & Other Equity Interests–97.74% | |
Aerospace & Defense–3.21% | | | | | | | | |
Textron, Inc. | | | 334,630 | | | $ | 21,496,631 | |
|
Air Freight & Logistics–2.14% | |
FedEx Corp. | | | 49,380 | | | | 14,335,508 | |
|
Application Software–3.65% | |
CDK Global, Inc. | | | 455,131 | | | | 24,390,470 | |
|
Asset Management & Custody Banks–3.41% | |
Bank of New York Mellon Corp. (The) | | | 457,174 | | | | 22,803,839 | |
|
Automobile Manufacturers–2.82% | |
General Motors Co.(b) | | | 329,117 | | | | 18,832,075 | |
|
Building Products–2.27% | |
Johnson Controls International PLC | | | 243,325 | | | | 15,168,881 | |
|
Construction Machinery & Heavy Trucks–3.41% | |
Caterpillar, Inc. | | | 100,152 | | | | 22,845,673 | |
|
Diversified Banks–15.07% | |
Bank of America Corp. | | | 633,403 | | | | 25,671,823 | |
Citigroup, Inc. | | | 502,220 | | | | 35,778,153 | |
Wells Fargo & Co. | | | 873,275 | | | | 39,341,039 | |
| | | | | | | | 100,791,015 | |
| | |
Electric Utilities–2.76% | | | | | | | | |
Exelon Corp. | | | 411,436 | | | | 18,489,934 | |
|
Electrical Components & Equipment–5.38% | |
Eaton Corp. PLC | | | 96,641 | | | | 13,812,898 | |
Emerson Electric Co. | | | 244,747 | | | | 22,147,156 | |
| | | | | | | | 35,960,054 | |
|
Health Care Distributors–3.06% | |
Henry Schein, Inc.(b) | | | 282,612 | | | | 20,489,370 | |
| | |
Health Care Facilities–6.29% | | | | | | | | |
HCA Healthcare, Inc. | | | 101,593 | | | | 20,426,288 | |
Universal Health Services, Inc., Class B | | | 145,914 | | | | 21,655,097 | |
| | | | | | | | 42,081,385 | |
|
Integrated Oil & Gas–5.30% | |
Chevron Corp. | | | 97,862 | | | | 10,086,636 | |
Suncor Energy, Inc. (Canada) | | | 1,184,154 | | | | 25,364,579 | |
| | | | | | | | 35,451,215 | |
|
IT Consulting & Other Services–3.14% | |
Cognizant Technology Solutions Corp., Class A | | | 261,012 | | | | 20,985,365 | |
| | | | | | | | |
| | | Shares | | | Value | |
Managed Health Care–5.14% | | | | | | | | |
Anthem, Inc. | | | 90,616 | | | $ | 34,378,804 | |
|
Multi-line Insurance–4.06% | |
American International Group, Inc. | | | 560,108 | | | | 27,137,233 | |
|
Oil & Gas Exploration & Production–3.02% | |
Pioneer Natural Resources Co. | | | 131,523 | | | | 20,232,183 | |
|
Packaged Foods & Meats–4.71% | |
Kraft Heinz Co. (The) | | | 763,447 | | | | 31,522,727 | |
|
Pharmaceuticals–2.33% | |
Bristol-Myers Squibb Co. | | | 249,752 | | | | 15,589,520 | |
|
Regional Banks–1.22% | |
Citizens Financial Group, Inc. | | | 176,622 | | | | 8,174,066 | |
|
Semiconductors–5.66% | |
Intel Corp. | | | 304,813 | | | | 17,535,892 | |
NXP Semiconductors N.V. (Netherlands) | | | 105,612 | | | | 20,331,366 | |
| | | | | | | | 37,867,258 | |
|
Soft Drinks–2.90% | |
Coca-Cola Co. (The) | | | 359,602 | | | | 19,411,316 | |
|
Systems Software–1.83% | |
Microsoft Corp. | | | 48,636 | | | | 12,265,026 | |
|
Tobacco–4.96% | |
Philip Morris International, Inc. | | | 349,539 | | | | 33,206,205 | |
Total Common Stocks & Other Equity Interests
(Cost $480,246,680) | | | | 653,905,753 | |
|
Money Market Funds–2.14% | |
Invesco Government & Agency Portfolio, Institutional Class, 0.03%(c)(d) | | | 5,015,602 | | | | 5,015,602 | |
Invesco Liquid Assets Portfolio, Institutional Class, 0.01%(c)(d) | | | 3,581,086 | | | | 3,582,518 | |
Invesco Treasury Portfolio, Institutional Class, 0.01%(c)(d) | | | 5,732,116 | | | | 5,732,116 | |
Total Money Market Funds (Cost $14,330,236) | | | | 14,330,236 | |
TOTAL INVESTMENTS IN
SECURITIES–99.88%
(Cost $494,576,916) | | | | 668,235,989 | |
OTHER ASSETS LESS LIABILITIES—0.12% | | | | | | | 807,206 | |
NET ASSETS–100.00% | | | | | | $ | 669,043,195 | |
See accompanying Notes to Financial Statements which are an integral part of the financial statements.
8 Invesco Comstock Select Fund
Notes to Schedule of Investments:
| (a) | Industry and/or sector classifications used in this report are generally according to the Global Industry Classification Standard, which was developed by and is the exclusive property and a service mark of MSCI Inc. and Standard & Poor’s. |
| (b) | Non-income producing security. |
| (c) | Affiliated issuer. The issuer and/or the Fund is a wholly-owned subsidiary of Invesco Ltd., or is affiliated by having an investment adviser that is under common control of Invesco Ltd. The table below shows the Fund’s transactions in, and earnings from, its investments in affiliates for the fiscal year ended April 30, 2021. |
| | | | | | | | | | | | | | | | | | | | | | | | | | | | |
| | | Value April 30, 2020 | | | Purchases at Cost | | | Proceeds from Sales | | | Change in
Unrealized
Appreciation | | | Realized
Gain
(Loss) | | | Value April 30, 2021 | | | Dividend Income | |
| Investments in Affiliated Money Market Funds: | | | | | | | | | | | | | | | | | | | | | | | | | | | | |
| Invesco Government & Agency Portfolio, Institutional Class | | $ | 23,765,041 | | | $ | 143,482,583 | | | $ | (162,232,022 | ) | | $ | - | | | $ | - | | | $ | 5,015,602 | | | $ | 5,602 | |
| Invesco Liquid Assets Portfolio, Institutional Class | | | - | | | | 85,266,137 | | | | (81,680,225 | ) | | | - | | | | (3,394 | ) | | | 3,582,518 | | | | 7,388 | |
| Invesco Treasury Portfolio, Institutional Class | | | - | | | | 136,425,819 | | | | (130,693,703 | ) | | | - | | | | - | | | | 5,732,116 | | | | 3,343 | |
| Investments Purchased with Cash Collateral from Securities on Loan: | | | | | | | | | | | | | | | | | | | | | | | | | | | | |
| Invesco Private Government Fund | | | - | | | | 9,955,552 | | | | (9,955,552 | ) | | | - | | | | - | | | | - | | | | 6 | * |
Invesco Private Prime Fund | | | - | | | | 14,933,328 | | | | (14,933,328 | ) | | | - | | | | - | | | | - | | | | 49 | * |
Total | | $ | 23,765,041 | | | $ | 390,063,419 | | | $ | (399,494,830 | ) | | $ | - | | | $ | (3,394) | | | $ | 14,330,236 | | | $ | 16,388 | |
| | * | Represents the income earned on the investment of cash collateral, which is included in securities lending income on the Statement of Operations. Does not include rebates and fees paid to lending agent or premiums received from borrowers, if any. |
| (d) | The rate shown is the 7-day SEC standardized yield as of April 30, 2021. |
See accompanying Notes to Financial Statements which are an integral part of the financial statements.
9 Invesco Comstock Select Fund
Statement of Assets and Liabilities
April 30, 2021
| | | | |
Assets: | | | | |
Investments in securities, at value
(Cost $480,246,680) | | $ | 653,905,753 | |
| |
Investments in affiliated money market funds, at value (Cost $14,330,236) | | | 14,330,236 | |
| |
Cash | | | 667,472 | |
| |
Foreign currencies, at value (Cost $245) | | | 262 | |
| |
Receivable for: | | | | |
Fund shares sold | | | 315,758 | |
| |
Dividends | | | 743,143 | |
| |
Investment for trustee deferred compensation and retirement plans | | | 152,402 | |
| |
Other assets | | | 83,800 | |
| |
Total assets | | | 670,198,826 | |
| |
| |
Liabilities: | | | | |
Payable for: | | | | |
Fund shares reacquired | | | 366,358 | |
| |
Accrued fees to affiliates | | | 379,489 | |
| |
Accrued trustees’ and officers’ fees and benefits | | | 70,000 | |
| |
Accrued other operating expenses | | | 187,382 | |
| |
Trustee deferred compensation and retirement plans | | | 152,402 | |
| |
Total liabilities | | | 1,155,631 | |
| |
Net assets applicable to shares outstanding | | $ | 669,043,195 | |
| |
| |
Net assets consist of: | | | | |
Shares of beneficial interest | | $ | 517,298,227 | |
| |
Distributable earnings | | | 151,744,968 | |
| |
| | $ | 669,043,195 | |
| |
| | | | |
Net Assets: | | | | |
Class A | | $ | 546,503,156 | |
| |
Class C | | $ | 30,454,799 | |
| |
Class R | | $ | 39,589,730 | |
| |
Class Y | | $ | 45,878,843 | |
| |
Class R5 | | $ | 10,523 | |
| |
Class R6 | | $ | 6,606,144 | |
| |
|
Shares outstanding, no par value, with an unlimited number of shares authorized: | |
Class A | | | 16,234,634 | |
| |
Class C | | | 968,580 | |
| |
Class R | | | 1,210,557 | |
| |
Class Y | | | 1,320,324 | |
| |
Class R5 | | | 313 | |
| |
Class R6 | | | 190,664 | |
| |
Class A: | | | | |
Net asset value per share | | $ | 33.66 | |
| |
Maximum offering price per share
(Net asset value of $33.66 ÷ 94.50%) | | $ | 35.62 | |
| |
Class C: | | | | |
Net asset value and offering price per share | | $ | 31.44 | |
| |
Class R: | | | | |
Net asset value and offering price per share | | $ | 32.70 | |
| |
Class Y: | | | | |
Net asset value and offering price per share | | $ | 34.75 | |
| |
Class R5: | | | | |
Net asset value and offering price per share | | $ | 33.62 | |
| |
Class R6: | | | | |
Net asset value and offering price per share | | $ | 34.65 | |
| |
See accompanying Notes to Financial Statements which are an integral part of the financial statements.
10 Invesco Comstock Select Fund
Statement of Operations
For the year ended April 30, 2021
| | | | |
Investment income: | | | | |
Dividends (net of foreign withholding taxes of $254,613) | | $ | 17,606,888 | |
| |
Dividends from affiliated money market funds (includes securities lending income of $2,369) | | | 18,702 | |
| |
Total investment income | | | 17,625,590 | |
| |
| |
Expenses: | | | | |
Advisory fees | | | 3,437,750 | |
| |
Administrative services fees | | | 93,771 | |
| |
Custodian fees | | | 13,503 | |
| |
Distribution fees: | | | | |
Class A | | | 1,066,018 | |
| |
Class C | | | 277,638 | |
| |
Class R | | | 158,058 | |
| |
Transfer agent fees – A, C, R and Y | | | 1,130,989 | |
| |
Transfer agent fees – R5 | | | 1 | |
| |
Trustees’ and officers’ fees and benefits | | | 14,710 | |
| |
Registration and filing fees | | | 149,551 | |
| |
Reports to shareholders | | | 89,000 | |
| |
Professional services fees | | | 56,489 | |
| |
Other | | | 3,579 | |
| |
Total expenses | | | 6,491,057 | |
| |
Less: Fees waived, expenses reimbursed and/or expense offset arrangement(s) | | | (680,628 | ) |
| |
Net expenses | | | 5,810,429 | |
| |
Net investment income | | | 11,815,161 | |
| |
| |
Realized and unrealized gain (loss) from: | | | | |
Net realized gain (loss) from: | | | | |
Unaffiliated investment securities | | | 2,201,148 | |
| |
Affiliated investment securities | | | (3,394 | ) |
| |
Foreign currencies | | | 12,436 | |
| |
| | | 2,210,190 | |
| |
Change in net unrealized appreciation of: | | | | |
Unaffiliated investment securities | | | 291,216,097 | |
| |
Foreign currencies | | | 17 | |
| |
| | | 291,216,114 | |
| |
Net realized and unrealized gain | | | 293,426,304 | |
| |
Net increase in net assets resulting from operations | | $ | 305,241,465 | |
| |
See accompanying Notes to Financial Statements which are an integral part of the financial statements.
11 Invesco Comstock Select Fund
Statement of Changes in Net Assets
For the year ended April 30, 2021, period ended April 30, 2020, and the year ended October 31, 2019
| | | | | | | | | | | | |
| | | Year Ended
April 30, 2021 | | | Six Months Ended
April 30, 2020 | | | Year Ended
October 31,
2019 | |
| | | |
Operations: | | | | | | | | | | | | |
Net investment income | | $ | 11,815,161 | | | $ | 13,290,790 | | | $ | 27,977,694 | |
| |
Net realized gain (loss) | | | 2,210,190 | | | | (20,971,934 | ) | | | 273,497,380 | |
| |
Change in net unrealized appreciation (depreciation) | | | 291,216,114 | | | | (204,004,559 | ) | | | (185,596,619 | ) |
| |
Net increase (decrease) in net assets resulting from operations | | | 305,241,465 | | | | (211,685,703 | ) | | | 115,878,455 | |
| |
| | | |
Distributions to shareholders from distributable earnings: | | | | | | | | | | | | |
Class A | | | (11,554,400 | ) | | | (119,234,349 | ) | | | (61,845,162 | ) |
| |
Class C | | | (535,792 | ) | | | (9,257,960 | ) | | | (11,413,279 | ) |
| |
Class R | | | (745,370 | ) | | | (8,173,489 | ) | | | (4,727,389 | ) |
| |
Class Y | | | (981,252 | ) | | | (15,867,545 | ) | | | (8,984,172 | ) |
| |
Class R5 | | | (246 | ) | | | (2,397 | ) | | | (120 | ) |
| |
Class R6 | | | (2,543,782 | ) | | | (122,758,577 | ) | | | (119,301,253 | ) |
| |
Total distributions from distributable earnings | | | (16,360,842 | ) | | | (275,294,317 | ) | | | (206,271,375 | ) |
| |
| | | |
Share transactions–net: | | | | | | | | | | | | |
Class A | | | (45,987,674 | ) | | | 76,804,592 | | | | 44,557,789 | |
| |
Class C | | | (9,129,112 | ) | | | 2,955,739 | | | | (49,742,879 | ) |
| |
Class R | | | (2,240,581 | ) | | | 5,430,763 | | | | (232,706 | ) |
| |
Class Y | | | 38,193 | | | | (19,457,423 | ) | | | 1,515,165 | |
| |
Class R5 | | | – | | | | – | | | | 10,000 | |
| |
Class R6 | | | (479,728,789 | ) | | | 9,158,200 | | | | (323,815,201 | ) |
| |
Net increase (decrease) in net assets resulting from share transactions | | | (537,047,963 | ) | | | 74,891,871 | | | | (327,707,832 | ) |
| |
Net increase (decrease) in net assets | | | (248,167,340 | ) | | | (412,088,149 | ) | | | (418,100,752 | ) |
| |
| | | |
Net assets: | | | | | | | | | | | | |
Beginning of year | | | 917,210,535 | | | | 1,329,298,684 | | | | 1,747,399,436 | |
| |
End of year | | $ | 669,043,195 | | | $ | 917,210,535 | | | $ | 1,329,298,684 | |
| |
See accompanying Notes to Financial Statements which are an integral part of the financial statements.
12 Invesco Comstock Select Fund
Financial Highlights
The following schedule presents financial highlights for a share of the Fund outstanding throughout the periods indicated.
| | | | | | | | | | | | | | | | | | | | | | | | | | | | | | | | | | | | | | | | | | | | | | | | | | | | | | | | |
| | | Net asset
value,
beginning
of period | | | Net investment income (a) | | | Net gains (losses) on securities (both realized and unrealized) | | | Total from
investment operations | | | Dividends from net investment income | | | Distributions
from net
realized
gains | | | Total
distributions | | | Net asset
value, end
of period | | | Total
return (b) | | | Net assets,
end of period
(000’s omitted) | | | Ratio of expenses to average net assets with fee waivers and/or expenses absorbed | | | Ratio of expenses to average net assets without fee waivers and/or expenses absorbed(c) | | | Ratio of net investment income to average net assets | | | Portfolio turnover (d)
| |
Class A | | | | | | | | | | | | | | | | | | | | | | | | | | | | | | | | | | | | | | | | | | | | | | | | | | | | | | | | |
Year ended 04/30/21 | | $ | 21.50 | | | $ | 0.46 | | | $ | 12.39 | | | $ | 12.85 | | | $ | (0.69 | ) | | $ | – | | | $ | (0.69 | ) | | $ | 33.66 | | | | 60.66 | %(e) | | $ | 546,503 | | | | 0.93 | %(e)(f) | | | 1.04 | %(e)(f) | | | 1.75 | %(e)(f) | | | 46 | % |
Six months ended 04/30/20 | | | 33.81 | | | | 0.29 | | | | (5.00 | ) | | | (4.71 | ) | | | (0.29 | ) | | | (7.31 | ) | | | (7.60 | ) | | | 21.50 | | | | (19.00 | ) | | | 388,558 | | | | 0.93 | (g) | | | 0.97 | (g) | | | 2.17 | (g) | | | 11 | |
Year ended 10/31/19 | | | 35.63 | | | | 0.58 | | | | 2.00 | | | | 2.58 | | | | (0.56 | ) | | | (3.84 | ) | | | (4.40 | ) | | | 33.81 | | | | 8.66 | | | | 524,705 | | | | 0.93 | | | | 0.95 | | | | 1.79 | | | | 129 | |
Year ended 10/31/18 | | | 37.62 | | | | 0.51 | | | | (0.32 | ) | | | 0.19 | | | | (0.52 | ) | | | (1.66 | ) | | | (2.18 | ) | | | 35.63 | | | | 0.35 | | | | 500,866 | | | | 0.93 | | | | 0.93 | | | | 1.37 | | | | 45 | |
Year ended 10/31/17 | | | 31.66 | | | | 0.34 | | | | 6.09 | | | | 6.43 | | | | (0.47 | ) | | | – | | | | (0.47 | ) | | | 37.62 | | | | 20.41 | | | | 548,012 | | | | 0.94 | | | | 0.95 | | | | 0.97 | | | | 53 | |
Year ended 10/31/16 | | | 31.64 | | | | 0.37 | | | | 0.04 | | | | 0.41 | | | | (0.39 | ) | | | – | | | | (0.39 | ) | | | 31.66 | | | | 1.33 | | | | 514,425 | | | | 0.96 | | | | 0.96 | | | | 1.21 | | | | 64 | |
Class C | | | | | | | | | | | | | | | | | | | | | | | | | | | | | | | | | | | | | | | | | | | | | | | | | | | | | | | | |
Year ended 04/30/21 | | | 20.08 | | | | 0.24 | | | | 11.58 | | | | 11.82 | | | | (0.46 | ) | | | – | | | | (0.46 | ) | | | 31.44 | | | | 59.49 | | | | 30,455 | | | | 1.68 | (f) | | | 1.80 | (f) | | | 1.00 | (f) | | | 46 | |
Six months ended 04 /30/20 | | | 32.01 | | | | 0.18 | | | | (4.64 | ) | | | (4.46 | ) | | | (0.16 | ) | | | (7.31 | ) | | | (7.47 | ) | | | 20.08 | | | | (19.29 | ) | | | 27,325 | | | | 1.68 | (g) | | | 1.73 | (g) | | | 1.41 | (g) | | | 11 | |
Year ended 10/31/19 | | | 33.95 | | | | 0.32 | | | | 1.89 | | | | 2.21 | | | | (0.31 | ) | | | (3.84 | ) | | | (4.15 | ) | | | 32.01 | | | | 7.86 | | | | 40,759 | | | | 1.68 | | | | 1.69 | | | | 1.03 | | | | 129 | |
Year ended 10/31/18 | | | 35.96 | | | | 0.22 | | | | (0.31 | ) | | | (0.09 | ) | | | (0.26 | ) | | | (1.66 | ) | | | (1.92 | ) | | | 33.95 | | | | (0.44 | ) | | | 96,108 | | | | 1.69 | | | | 1.69 | | | | 0.62 | | | | 45 | |
Year ended 10/31/17 | | | 30.32 | | | | 0.07 | | | | 5.83 | | | | 5.90 | | | | (0.26 | ) | | | – | | | | (0.26 | ) | | | 35.96 | | | | 19.51 | | | | 113,203 | | | | 1.69 | | | | 1.70 | | | | 0.22 | | | | 53 | |
Year ended 10/31/16 | | | 30.32 | | | | 0.13 | | | | 0.04 | | | | 0.17 | | | | (0.17 | ) | | | – | | | | (0.17 | ) | | | 30.32 | | | | 0.58 | | | | 112,170 | | | | 1.71 | | | | 1.71 | | | | 0.46 | | | | 64 | |
Class R | | | | | | | | | | | | | | | | | | | | | | | | | | | | | | | | | | | | | | | | | | | | | | | | | | | | | | | | |
Year ended 04/30/21 | | | 20.89 | | | | 0.38 | | | | 12.04 | | | | 12.42 | | | | (0.61 | ) | | | – | | | | (0.61 | ) | | | 32.70 | | | | 60.24 | | | | 39,590 | | | | 1.18 | (f) | | | 1.30 | (f) | | | 1.50 | (f) | | | 46 | |
Six months ended 04/30/20 | | | 33.04 | | | | 0.25 | | | | (4.85 | ) | | | (4.60 | ) | | | (0.24 | ) | | | (7.31 | ) | | | (7.55 | ) | | | 20.89 | | | | (19.11 | ) | | | 27,340 | | | | 1.18 | (g) | | | 1.23 | (g) | | | 1.92 | (g) | | | 11 | |
Year ended 10/31/19 | | | 34.91 | | | | 0.49 | | | | 1.96 | | | | 2.45 | | | | (0.48 | ) | | | (3.84 | ) | | | (4.32 | ) | | | 33.04 | | | | 8.41 | | | | 36,469 | | | | 1.18 | | | | 1.20 | | | | 1.54 | | | | 129 | |
Year ended 10/31/18 | | | 36.91 | | | | 0.41 | | | | (0.32 | ) | | | 0.09 | | | | (0.43 | ) | | | (1.66 | ) | | | (2.09 | ) | | | 34.91 | | | | 0.08 | | | | 38,411 | | | | 1.18 | | | | 1.18 | | | | 1.12 | | | | 45 | |
Year ended 10/31/17 | | | 31.08 | | | | 0.25 | | | | 5.97 | | | | 6.22 | | | | (0.39 | ) | | | – | | | | (0.39 | ) | | | 36.91 | | | | 20.10 | | | | 42,358 | | | | 1.18 | | | | 1.19 | | | | 0.73 | | | | 53 | |
Year ended 10/31/16 | | | 31.06 | | | | 0.29 | | | | 0.04 | | | | 0.33 | | | | (0.31 | ) | | | – | | | | (0.31 | ) | | | 31.08 | | | | 1.11 | | | | 38,801 | | | | 1.20 | | | | 1.20 | | | | 0.96 | | | | 64 | |
Class Y | | | | | | | | | | | | | | | | | | | | | | | | | | | | | | | | | | | | | | | | | | | | | | | | | | | | | | | | |
Year ended 04/30/21 | | | 22.19 | | | | 0.54 | | | | 12.80 | | | | 13.34 | | | | (0.78 | ) | | | – | | | | (0.78 | ) | | | 34.75 | | | | 61.10 | | | | 45,879 | | | | 0.68 | (f) | | | 0.80 | (f) | | | 2.00 | (f) | | | 46 | |
Six months ended 04/30/20 | | | 34.70 | | | | 0.34 | | | | (5.21 | ) | | | (4.87 | ) | | | (0.33 | ) | | | (7.31 | ) | | | (7.64 | ) | | | 22.19 | | | | (18.95 | ) | | | 29,843 | | | | 0.68 | (g) | | | 0.73 | (g) | | | 2.41 | (g) | | | 11 | |
Year ended 10/31/19 | | | 36.44 | | | | 0.68 | | | | 2.07 | | | | 2.75 | | | | (0.65 | ) | | | (3.84 | ) | | | (4.49 | ) | | | 34.70 | | | | 8.97 | | | | 70,677 | | | | 0.68 | | | | 0.71 | | | | 2.03 | | | | 129 | |
Year ended 10/31/18 | | | 38.43 | | | | 0.62 | | | | (0.34 | ) | | | 0.28 | | | | (0.61 | ) | | | (1.66 | ) | | | (2.27 | ) | | | 36.44 | | | | 0.55 | | | | 72,317 | | | | 0.68 | | | | 0.68 | | | | 1.61 | | | | 45 | |
Year ended 10/31/17 | | | 32.33 | | | | 0.44 | | | | 6.22 | | | | 6.66 | | | | (0.56 | ) | | | – | | | | (0.56 | ) | | | 38.43 | | | | 20.71 | | | | 142,547 | | | | 0.69 | | | | 0.71 | | | | 1.20 | | | | 53 | |
Year ended 10/31/16 | | | 32.29 | | | | 0.46 | | | | 0.04 | | | | 0.50 | | | | (0.46 | ) | | | – | | | | (0.46 | ) | | | 32.33 | | | | 1.61 | | | | 111,684 | | | | 0.71 | | | | 0.71 | | | | 1.47 | | | | 64 | |
Class R5 | | | | | | | | | | | | | | | | | | | | | | | | | | | | | | | | | | | | | | | | | | | | | | | | | | | | | | | | |
Year ended 04/30/21 | | | 21.47 | | | | 0.55 | | | | 12.38 | | | | 12.93 | | | | (0.78 | ) | | | – | | | | (0.78 | ) | | | 33.62 | | | | 61.27 | | | | 11 | | | | 0.57 | (f) | | | 0.60 | (f) | | | 2.11 | (f) | | | 46 | |
Six months ended 04/30/20 | | | 33.80 | | | | 0.34 | | | | (5.02 | ) | | | (4.68 | ) | | | (0.34 | ) | | | (7.31 | ) | | | (7.65 | ) | | | 21.47 | | | | (18.88 | ) | | | 7 | | | | 0.57 | (g) | | | 0.57 | (g) | | | 2.52 | (g) | | | 11 | |
Period ended 10/31/19(h) | | | 31.94 | | | | 0.31 | | | | 1.93 | | | | 2.24 | | | | (0.38 | ) | | | – | | | | (0.38 | ) | | | 33.80 | | | | 7.03 | | | | 11 | | | | 0.57 | (g) | | | 0.57 | (g) | | | 2.15 | (g) | | | 129 | |
Class R6 | | | | | | | | | | | | | | | | | | | | | | | | | | | | | | | | | | | | | | | | | | | | | | | | | | | | | | | | |
Year ended 04/30/21 | | | 22.13 | | | | 0.51 | | | | 12.83 | | | | 13.34 | | | | (0.82 | ) | | | – | | | | (0.82 | ) | | | 34.65 | | | | 61.33 | | | | 6,606 | | | | 0.52 | (f) | | | 0.58 | (f) | | | 2.16 | (f) | | | 46 | |
Six months ended 04/30/20 | | | 34.63 | | | | 0.36 | | | | (5.19 | ) | | | (4.83 | ) | | | (0.36 | ) | | | (7.31 | ) | | | (7.67 | ) | | | 22.13 | | | | (18.88 | ) | | | 444,138 | | | | 0.52 | (g) | | | 0.54 | (g) | | | 2.58 | (g) | | | 11 | |
Year ended 10/31/19 | | | 36.38 | | | | 0.73 | | | | 2.06 | | | | 2.79 | | | | (0.70 | ) | | | (3.84 | ) | | | (4.54 | ) | | | 34.63 | | | | 9.13 | | | | 656,678 | | | | 0.52 | | | | 0.52 | | | | 2.20 | | | | 129 | |
Year ended 10/31/18 | | | 38.37 | | | | 0.68 | | | | (0.33 | ) | | | 0.35 | | | | (0.68 | ) | | | (1.66 | ) | | | (2.34 | ) | | | 36.38 | | | | 0.75 | | | | 1,039,697 | | | | 0.52 | | | | 0.52 | | | | 1.78 | | | | 45 | |
Year ended 10/31/17 | | | 32.28 | | | | 0.50 | | | | 6.21 | | | | 6.71 | | | | (0.62 | ) | | | – | | | | (0.62 | ) | | | 38.37 | | | | 20.92 | | | | 1,336,915 | | | | 0.51 | | | | 0.52 | | | | 1.39 | | | | 53 | |
Year ended 10/31/16 | | | 32.24 | | | | 0.52 | | | | 0.04 | | | | 0.56 | | | | (0.52 | ) | | | – | | | | (0.52 | ) | | | 32.28 | | | | 1.80 | | | | 1,185,317 | | | | 0.52 | | | | 0.52 | | | | 1.65 | | | | 64 | |
| (a) | Calculated using average units outstanding. |
| (b) | Includes adjustments in accordance with accounting principles generally accepted in the United States of America and as such, the net asset value for financial reporting purposes and the returns based upon those net asset values may differ from the net asset value and returns for shareholder transactions. Does not include sales charges and is not annualized for periods less than one year, if applicable. |
| (c) | Does not include indirect expenses from affiliated fund fees and expenses of 0.00% for the six months ended April 30, 2020 and for the years ended October 31, 2019, 2018, 2017 and 2016, respectively. |
| (d) | Portfolio turnover is calculated at the fund level and is not annualized for periods less than one year, if applicable. |
| (e) | The total return, ratio of expenses to average net assets and ratio of net investment income to average net assets reflect actual 12b-1 fees of 0.24% for the year ended April 30, 2021. |
| (f) | Ratios are based on average daily net assets (000’s omitted) of $444,728, $27,764, $31,612, $34,734, $8 and $118,160 for Class A, Class C, Class R, Class Y, Class R5 and Class R6 shares, respectively. |
| (h) | Commencement date after the close of business on May 24, 2019. |
See accompanying Notes to Financial Statements which are an integral part of the financial statements.
13 Invesco Comstock Select Fund
Notes to Financial Statements
April 30, 2021
| NOTE | 1–Significant Accounting Policies |
Invesco Comstock Select Fund (the “Fund”) is a series portfolio of AIM Sector Funds (Invesco Sector Funds) (the “Trust”). The Trust is a Delaware statutory trust registered under the Investment Company Act of 1940, as amended (the “1940 Act”), as an open-end series management investment company authorized to issue an unlimited number of shares of beneficial interest. Information presented in these financial statements pertains only to the Fund. Matters affecting the Fund or each class will be voted on exclusively by the shareholders of the Fund or each class.
The Fund’s investment objective is to seek capital appreciation.
The Fund currently consists of six different classes of shares: Class A, Class C, Class R, Class Y, Class R5 and Class R6. Class Y shares are available only to certain investors. Class A shares are sold with a front-end sales charge unless certain waiver criteria are met. Under certain circumstances, load waived shares may be subject to contingent deferred sales charges (“CDSC”). Class C shares are sold with a CDSC. Class R, Class Y, Class R5 and Class R6 shares are sold at net asset value. Class C shares held for ten years after purchase are eligible for automatic conversion into Class A shares of the same Fund (the “Conversion Feature”). The automatic conversion pursuant to the Conversion Feature will generally occur at the end of the month following the tenth anniversary after a purchase of Class C shares. Effective November 30, 2020, the automatic conversion pursuant to the Conversion Feature changed from ten years to eight years. The first conversion of Class C shares to Class A shares occurred at the end of December 2020 for all Class C shares that were held for more than eight years as of November 30, 2020.
The Fund is an investment company and accordingly follows the investment company accounting and reporting guidance in accordance with Financial Accounting Standards Board Accounting Standards Codification Topic 946, Financial Services – Investment Companies.
The following is a summary of the significant accounting policies followed by the Fund in the preparation of its financial statements.
| A. | Security Valuations –Securities, including restricted securities, are valued according to the following policy. |
A security listed or traded on an exchange (except convertible securities) is valued at its last sales price or official closing price as of the close of the customary trading session on the exchange where the security is principally traded, or lacking any sales or official closing price on a particular day, the security may be valued at the closing bid price on that day. Securities traded in the over-the-counter market are valued based on prices furnished by independent pricing services or market makers. When such securities are valued by an independent pricing service they may be considered fair valued. Futures contracts are valued at the final settlement price set by an exchange on which they are principally traded. Listed options are valued at the mean between the last bid and asked prices from the exchange on which they are principally traded. Options not listed on an exchange are valued by an independent source at the mean between the last bid and asked prices. For purposes of determining net asset value (“NAV”) per share, futures and option contracts generally are valued 15 minutes after the close of the customary trading session of the New York Stock Exchange (“NYSE”).
Investments in open-end and closed-end registered investment companies that do not trade on an exchange are valued at the end-of-day net asset value per share. Investments in open-end and closed-end registered investment companies that trade on an exchange are valued at the last sales price or official closing price as of the close of the customary trading session on the exchange where the security is principally traded.
Debt obligations (including convertible securities) and unlisted equities are fair valued using an evaluated quote provided by an independent pricing service. Evaluated quotes provided by the pricing service may be determined without exclusive reliance on quoted prices, and may reflect appropriate factors such as institution-size trading in similar groups of securities, developments related to specific securities, dividend rate (for unlisted equities), yield (for debt obligations), quality, type of issue, coupon rate (for debt obligations), maturity (for debt obligations), individual trading characteristics and other market data. Pricing services generally value debt obligations assuming orderly transactions of institutional round lot size, but a fund may hold or transact in the same securities in smaller, odd lot sizes. Odd lots often trade at lower prices than institutional round lots. Debt obligations are subject to interest rate and credit risks. In addition, all debt obligations involve some risk of default with respect to interest and/or principal payments.
Foreign securities’ (including foreign exchange contracts) prices are converted into U.S. dollar amounts using the applicable exchange rates as of the close of the NYSE. If market quotations are available and reliable for foreign exchange-traded equity securities, the securities will be valued at the market quotations. Because trading hours for certain foreign securities end before the close of the NYSE, closing market quotations may become unreliable. If between the time trading ends on a particular security and the close of the customary trading session on the NYSE, events occur that the investment adviser determines are significant and make the closing price unreliable, the Fund may fair value the security. If the event is likely to have affected the closing price of the security, the security will be valued at fair value in good faith using procedures approved by the Board of Trustees. Adjustments to closing prices to reflect fair value may also be based on a screening process of an independent pricing service to indicate the degree of certainty, based on historical data, that the closing price in the principal market where a foreign security trades is not the current value as of the close of the NYSE. Foreign securities’ prices meeting the approved degree of certainty that the price is not reflective of current value will be priced at the indication of fair value from the independent pricing service. Multiple factors may be considered by the independent pricing service in determining adjustments to reflect fair value and may include information relating to sector indices, American Depositary Receipts and domestic and foreign index futures. Foreign securities may have additional risks including exchange rate changes, potential for sharply devalued currencies and high inflation, political and economic upheaval, the relative lack of issuer information, relatively low market liquidity and the potential lack of strict financial and accounting controls and standards.
Securities for which market prices are not provided by any of the above methods may be valued based upon quotes furnished by independent sources. The last bid price may be used to value equity securities. The mean between the last bid and asked prices is used to value debt obligations, including corporate loans.
Securities for which market quotations are not readily available or became unreliable are valued at fair value as determined in good faith by or under the supervision of the Trust’s officers following procedures approved by the Board of Trustees. Issuer specific events, market trends, bid/asked quotes of brokers and information providers and other market data may be reviewed in the course of making a good faith determination of a security’s fair value.
The Fund may invest in securities that are subject to interest rate risk, meaning the risk that the prices will generally fall as interest rates rise and, conversely, the prices will generally rise as interest rates fall. Specific securities differ in their sensitivity to changes in interest rates depending on their individual characteristics. Changes in interest rates may result in increased market volatility, which may affect the value and/or liquidity of certain Fund investments.
Valuations change in response to many factors including the historical and prospective earnings of the issuer, the value of the issuer’s assets, general market conditions which are not specifically related to the particular issuer, such as real or perceived adverse economic conditions, changes in the general outlook for revenues or corporate earnings, changes in interest or currency rates, regional or global instability, natural or environmental disasters, widespread disease or other public health issues, war, acts of terrorism or adverse investor sentiment generally and market liquidity. Because of the inherent uncertainties of valuation, the values reflected in the financial statements may materially differ from the value received upon actual sale of those investments.
| B. | Securities Transactions and Investment Income –Securities transactions are accounted for on a trade date basis. Realized gains or losses on sales are computed on the basis of specific identification of the securities sold. Interest income (net of withholding tax, if any) is recorded on an accrual basis from settlement date and includes coupon interest and amortization of premium and accretion of discount on debt securities as applicable. Dividend income (net of withholding tax, if any) is recorded on the ex-dividend date. |
The Fund may periodically participate in litigation related to Fund investments. As such, the Fund may receive proceeds from litigation settlements. Any proceeds received are included in the Statement of Operations as realized gain (loss) for investments no longer held and as unrealized gain (loss) for investments still held.
14 Invesco Comstock Select Fund
Brokerage commissions and mark ups are considered transaction costs and are recorded as an increase to the cost basis of securities purchased and/or a reduction of proceeds on a sale of securities. Such transaction costs are included in the determination of net realized and unrealized gain (loss) from investment securities reported in the Statement of Operations and the Statement of Changes in Net Assets and the net realized and unrealized gains (losses) on securities per share in the Financial Highlights. Transaction costs are included in the calculation of the Fund’s net asset value and, accordingly, they reduce the Fund’s total returns. These transaction costs are not considered operating expenses and are not reflected in net investment income reported in the Statement of Operations and the Statement of Changes in Net Assets, or the net investment income per share and the ratios of expenses and net investment income reported in the Financial Highlights, nor are they limited by any expense limitation arrangements between the Fund and the investment adviser.
The Fund allocates income and realized and unrealized capital gains and losses to a class based on the relative net assets of each class.
| C. | Country Determination – For the purposes of making investment selection decisions and presentation in the Schedule of Investments, the investment adviser may determine the country in which an issuer is located and/or credit risk exposure based on various factors. These factors include the laws of the country under which the issuer is organized, where the issuer maintains a principal office, the country in which the issuer derives 50% or more of its total revenues and the country that has the primary market for the issuer’s securities, as well as other criteria. Among the other criteria that may be evaluated for making this determination are the country in which the issuer maintains 50% or more of its assets, the type of security, financial guarantees and enhancements, the nature of the collateral and the sponsor organization. Country of issuer and/or credit risk exposure has been determined to be the United States of America, unless otherwise noted. |
| D. | Distributions – Distributions from net investment income, if any, are declared and paid quarterly and are recorded on the ex-dividend date. Distributions from net realized capital gain, if any, are generally declared and paid annually and recorded on the ex-dividend date. The Fund may elect to treat a portion of the proceeds from redemptions as distributions for federal income tax purposes. |
| E. | Federal Income Taxes – The Fund intends to comply with the requirements of Subchapter M of the Internal Revenue Code of 1986, as amended (the “Internal Revenue Code”), necessary to qualify as a regulated investment company and to distribute substantially all of the Fund’s taxable earnings to shareholders. As such, the Fund will not be subject to federal income taxes on otherwise taxable income (including net realized capital gain) that is distributed to shareholders. Therefore, no provision for federal income taxes is recorded in the financial statements. |
The Fund recognizes the tax benefits of uncertain tax positions only when the position is more likely than not to be sustained. Management has analyzed the Fund’s uncertain tax positions and concluded that no liability for unrecognized tax benefits should be recorded related to uncertain tax positions. Management is not aware of any tax positions for which it is reasonably possible that the total amounts of unrecognized tax benefits will change materially in the next 12 months.
The Fund files tax returns in the U.S. Federal jurisdiction and certain other jurisdictions. Generally, the Fund is subject to examinations by such taxing authorities for up to three years after the filing of the return for the tax period.
| F. | Expenses – Fees provided for under the Rule 12b-1 plan of a particular class of the Fund are charged to the operations of such class. Transfer agency fees and expenses and other shareholder recordkeeping fees and expenses attributable to Class R5 and Class R6 are allocated to each share class based on relative net assets. Sub-accounting fees attributable to Class R5 are charged to the operations of the class. Transfer agency fees and expenses and other shareholder recordkeeping fees and expenses relating to all other classes are allocated among those classes based on relative net assets. All other expenses are allocated among the classes based on relative net assets. |
| G. | Accounting Estimates – The preparation of financial statements in conformity with accounting principles generally accepted in the United States of America (“GAAP”) requires management to make estimates and assumptions that affect the reported amounts of assets and liabilities at the date of the financial statements and the reported amounts of revenues and expenses during the reporting period including estimates and assumptions related to taxation. Actual results could differ from those estimates by a significant amount. In addition, the Fund monitors for material events or transactions that may occur or become known after the period-end date and before the date the financial statements are released to print. |
| H. | Indemnifications – Under the Trust’s organizational documents, each Trustee, officer, employee or other agent of the Trust is indemnified against certain liabilities that may arise out of the performance of their duties to the Fund. Additionally, in the normal course of business, the Fund enters into contracts, including the Fund’s servicing agreements, that contain a variety of indemnification clauses. The Fund’s maximum exposure under these arrangements is unknown as this would involve future claims that may be made against the Fund that have not yet occurred. The risk of material loss as a result of such indemnification claims is considered remote. |
| I. | Securities Lending – The Fund may lend portfolio securities having a market value up to one-third of the Fund’s total assets. Such loans are secured by collateral equal to no less than the market value of the loaned securities determined daily by the securities lending provider. Such collateral will be cash or debt securities issued or guaranteed by the U.S. Government or any of its sponsored agencies. Cash collateral received in connection with these loans is invested in short-term money market instruments or affiliated money market funds and is shown as such on the Schedule of Investments. The Fund bears the risk of loss with respect to the investment of collateral. It is the Fund’s policy to obtain additional collateral from or return excess collateral to the borrower by the end of the next business day, following the valuation date of the securities loaned. Therefore, the value of the collateral held may be temporarily less than the value of the securities on loan. When loaning securities, the Fund retains certain benefits of owning the securities, including the economic equivalent of dividends or interest generated by the security. Lending securities entails a risk of loss to the Fund if, and to the extent that, the market value of the securities loaned were to increase and the borrower did not increase the collateral accordingly, and the borrower failed to return the securities. The securities loaned are subject to termination at the option of the borrower or the Fund. Upon termination, the borrower will return to the Fund the securities loaned and the Fund will return the collateral. Upon the failure of the borrower to return the securities, collateral may be liquidated and the securities may be purchased on the open market to replace the loaned securities. The Fund could experience delays and costs in gaining access to the collateral and the securities may lose value during the delay which could result in potential losses to the Fund. Some of these losses may be indemnified by the lending agent. The Fund bears the risk of any deficiency in the amount of the collateral available for return to the borrower due to any loss on the collateral invested. Dividends received on cash collateral investments for securities lending transactions, which are net of compensation to counterparties, are included in Dividends from affiliated money market funds on the Statement of Operations. The aggregate value of securities out on loan, if any, is shown as a footnote on the Statement of Assets and Liabilities. |
| J. | Foreign Currency Translations – Foreign currency is valued at the close of the NYSE based on quotations posted by banks and major currency dealers. Portfolio securities and other assets and liabilities denominated in foreign currencies are translated into U.S. dollar amounts at the date of valuation. Purchases and sales of portfolio securities (net of foreign taxes withheld on disposition) and income items denominated in foreign currencies are translated into U.S. dollar amounts on the respective dates of such transactions. The Fund does not separately account for the portion of the results of operations resulting from changes in foreign exchange rates on investments and the fluctuations arising from changes in market prices of securities held. The combined results of changes in foreign exchange rates and the fluctuation of market prices on investments (net of estimated foreign tax withholding) are included with the net realized and unrealized gain or loss from investments in the Statement of Operations. Reported net realized foreign currency gains or losses arise from (1) sales of foreign currencies, (2) currency gains or losses realized between the trade and settlement dates on securities transactions, and (3) the difference between the amounts of dividends, interest, and foreign withholding taxes recorded on the Fund’s books and the U.S. dollar equivalent of the amounts actually received or paid. Net unrealized foreign currency gains and losses arise from changes in the fair values of assets and liabilities, other than investments in securities at fiscal period end, resulting from changes in exchange rates. |
The Fund may invest in foreign securities, which may be subject to foreign taxes on income, gains on investments or currency repatriation, a portion of which may be recoverable. Foreign taxes, if any, are recorded based on the tax regulations and rates that exist in the foreign markets in which the Fund invests and are shown in the Statement of Operations.
15 Invesco Comstock Select Fund
| K. | Forward Foreign Currency Contracts – The Fund may engage in foreign currency transactions either on a spot (i.e. for prompt delivery and settlement) basis, or through forward foreign currency contracts, to manage or minimize currency or exchange rate risk. |
The Fund may also enter into forward foreign currency contracts for the purchase or sale of a security denominated in a foreign currency in order to “lock in” the U.S. dollar price of that security, or the Fund may also enter into forward foreign currency contracts that do not provide for physical settlement of the two currencies, but instead are settled by a single cash payment calculated as the difference between the agreed upon exchange rate and the spot rate at settlement based upon an agreed upon notional amount (non-deliverable forwards). The Fund will set aside liquid assets in an amount equal to the daily mark-to-market obligation for forward foreign currency contracts.
A forward foreign currency contract is an obligation between two parties (“Counterparties”) to purchase or sell a specific currency for an agreed-upon price at a future date. The use of forward foreign currency contracts does not eliminate fluctuations in the price of the underlying securities the Fund owns or intends to acquire but establishes a rate of exchange in advance. Fluctuations in the value of these contracts are measured by the difference in the contract date and reporting date exchange rates and are recorded as unrealized appreciation (depreciation) until the contracts are closed. When the contracts are closed, realized gains (losses) are recorded. Realized and unrealized gains (losses) on the contracts are included in the Statement of Operations. The primary risks associated with forward foreign currency contracts include failure of the Counterparty to meet the terms of the contract and the value of the foreign currency changing unfavorably. These risks may be in excess of the amounts reflected in the Statement of Assets and Liabilities.
| L. | COVID-19 Risk – The COVID-19 strain of coronavirus has resulted in instances of market closures and dislocations, extreme volatility, liquidity constraints and increased trading costs. Efforts to contain its spread have resulted in travel restrictions, disruptions of healthcare systems, business operations and supply chains, layoffs, lower consumer demand, and defaults, among other significant economic impacts that have disrupted global economic activity across many industries. Such economic impacts may exacerbate other pre-existing political, social and economic risks locally or globally. |
The ongoing effects of COVID-19 are unpredictable and may result in significant and prolonged effects on the Fund’s performance.
NOTE 2–Advisory Fees and Other Fees Paid to Affiliates
The Trust has entered into a master investment advisory agreement with Invesco Advisers, Inc. (the “Adviser” or “Invesco”). Under the terms of the investment advisory agreement, the Fund accrues daily and pays monthly an advisory fee to the Adviser based on the annual rate of the Fund’s average daily net assets as follows:
| | | | | | |
| Average Daily Net Assets* | | Rate | |
First $300 million | | | 0.625 | % |
Next $100 million | | | 0.500 | % |
Next $4.6 billion | | | 0.450 | % |
Over $5 billion | | | 0.430 | % |
| * | The advisory fee paid by the Fund shall be reduced by any amounts paid by the Fund under the administrative services agreement with the Adviser. |
For the year ended April 30, 2021, the effective advisory fee rate incurred by the Fund was 0.52%.
Under the terms of a master sub-advisory agreement between the Adviser and each of Invesco Asset Management Deutschland GmbH, Invesco Asset Management Limited, Invesco Asset Management (Japan) Limited, Invesco Hong Kong Limited, Invesco Senior Secured Management, Inc. and Invesco Canada Ltd. and separate sub-advisory agreements with Invesco Capital Management LLC and Invesco Asset Management (India) Private Limited (collectively, the “Affiliated Sub-Advisers”) the Adviser, not the Fund, will pay 40% of the fees paid to the Adviser to any such Affiliated Sub-Adviser(s) that provide(s) discretionary investment management services to the Fund based on the percentage of assets allocated to such Affiliated Sub-Adviser(s). Invesco has also entered into a sub-advisory agreement with OppenheimerFunds, Inc. to provide discretionary management services to the Fund.
The Adviser has contractually agreed, through August 31, 2021, to waive advisory fees and/or reimburse expenses of all shares to the extent necessary to limit total annual fund operating expenses after fee waiver and/or expense reimbursement (excluding certain items discussed below) of Class A, Class C, Class R, Class Y, Class R5 and Class R6 shares to 0.93%, 1.68%, 1.18%, 0.68%, 0.57% and 0.52%, respectively, of the Fund’s average daily net assets (the “expense limits”). Effective September 1, 2021 through at least August 31, 2022, the Adviser has agreed to waive advisory fees and/or reimburse expenses of all shares to the extent necessary to limit total annual fund operating expenses after fee waiver and/or expense reimbursement (excluding certain items discussed below) of Class A, Class C, Class R, Class Y, Class R5 and Class R6 shares to 0.96%, 1.71%, 1.21%, 0.71%, 0.71% and 0.71%, respectively, of the Fund’s average daily net assets. In determining the Adviser’s obligation to waive advisory fees and/or reimburse expenses, the following expenses are not taken into account, and could cause the total annual fund operating expenses after fee waiver and/or expense reimbursement to exceed the numbers reflected above: (1) interest; (2) taxes; (3) dividend expense on short sales; (4) extraordinary or non-routine items, including litigation expenses; and (5) expenses that the Fund has incurred but did not actually pay because of an expense offset arrangement. Unless Invesco continues the fee waiver agreement, it will terminate on August 31, 2022. During its term, the fee waiver agreement cannot be terminated or amended to increase the expense limits or reduce the advisory fee waiver without approval of the Board of Trustees.
Further, the Adviser has contractually agreed, through at least June 30, 2023, to waive the advisory fee payable by the Fund in an amount equal to 100% of the net advisory fees the Adviser receives from the affiliated money market funds on investments by the Fund of uninvested cash (excluding investments of cash collateral from securities lending) in such affiliated money market funds.
For the year ended April 30, 2021, the Adviser waived advisory fees of $15,652 and reimbursed class level expenses of $484,503, $33,052, $37,684, $41,414, $3 and $65,151 of Class A, Class C, Class R, Class Y, Class R5 and Class R6 shares, respectively.
The Trust has entered into a master administrative services agreement with Invesco pursuant to which the Fund has agreed to pay Invesco for certain administrative costs incurred in providing accounting services to the Fund. For the year ended April 30, 2021, expenses incurred under the agreement are shown in the Statement of Operations as Administrative services fees. Invesco has entered into a sub-administration agreement whereby State Street Bank and Trust Company (“SSB”) serves as fund accountant and provides certain administrative services to the Fund. Pursuant to a custody agreement with the Trust on behalf of the Fund, SSB also serves as the Fund’s custodian.
The Trust has entered into a transfer agency and service agreement with Invesco Investment Services, Inc. (“IIS”) pursuant to which the Fund has agreed to pay IIS a fee for providing transfer agency and shareholder services to the Fund and reimburse IIS for certain expenses incurred by IIS in the course of providing such services. IIS may make payments to intermediaries that provide omnibus account services, sub-accounting services and/or networking services. All fees payable by IIS to intermediaries that provide omnibus account services or sub-accounting services are charged back to the Fund, subject to certain limitations approved by the Trust’s Board of Trustees. For the year ended April 30, 2021, expenses incurred under the agreement are shown in the Statement of Operations as Transfer agent fees.
Shares of the Fund are distributed by Invesco Distributors, Inc. (“IDI”). The Fund has adopted a distribution plan pursuant to Rule 12b-1 under the 1940 Act, and a service plan (collectively, the “Plans”) for Class A, Class C and Class R shares to compensate IDI for the sale, distribution, shareholder servicing and maintenance of shareholder accounts for these shares. Under the Plans, the Fund will incur annual fees of up to 0.25% of Class A average daily net assets, up to 1.00% of Class C average daily net assets and up to 0.50% of Class R average daily net assets. The fees are accrued daily and paid monthly.
With respect to Class C shares, the Fund is authorized to reimburse in future years any distribution related expenses that exceed the maximum annual reimbursement rate for such class, so long as such reimbursement does not cause the Fund to exceed the Class C maximum annual reimbursement rate, respectively.
16 Invesco Comstock Select Fund
With respect to Class A shares, distribution related expenses that exceed the maximum annual reimbursement rate for such class are not carried forward to future years and the Fund will not reimburse IDI for any such expenses.
For the year ended April 30, 2021, expenses incurred under these agreements are shown in the Statement of Operations as Distribution fees.
Front-end sales commissions and CDSC (collectively, the “sales charges”) are not recorded as expenses of the Fund. Front-end sales commissions are deducted from proceeds from the sales of Fund shares prior to investment in Class A shares of the Fund. CDSC are deducted from redemption proceeds prior to remittance to the shareholder. During the year ended April 30, 2021, IDI advised the Fund that IDI retained $44,644 in front-end sales commissions from the sale of Class A shares and $939 and $639 from Class A and Class C shares, respectively, for CDSC imposed upon redemptions by shareholders.
For the year ended April 30, 2021, the Fund incurred $1,374 in brokerage commissions with Invesco Capital Markets, Inc., an affiliate of the Adviser and IDI, for portfolio transactions executed on behalf of the Fund.
Certain officers and trustees of the Trust are officers and directors of the Adviser, IIS and/or IDI.
NOTE 3–Additional Valuation Information
GAAP defines fair value as the price that would be received to sell an asset or paid to transfer a liability in an orderly transaction between market participants at the measurement date, under current market conditions. GAAP establishes a hierarchy that prioritizes the inputs to valuation methods, giving the highest priority to readily available unadjusted quoted prices in an active market for identical assets (Level 1) and the lowest priority to significant unobservable inputs (Level 3), generally when market prices are not readily available or are unreliable. Based on the valuation inputs, the securities or other investments are tiered into one of three levels. Changes in valuation methods may result in transfers in or out of an investment’s assigned level:
| | | | |
Level 1 | | - | | Prices are determined using quoted prices in an active market for identical assets. |
Level 2 | | - | | Prices are determined using other significant observable inputs. Observable inputs are inputs that other market participants may use in pricing a security. These may include quoted prices for similar securities, interest rates, prepayment speeds, credit risk, yield curves, loss severities, default rates, discount rates, volatilities and others. |
Level 3 | | - | | Prices are determined using significant unobservable inputs. In situations where quoted prices or observable inputs are unavailable (for example, when there is little or no market activity for an investment at the end of the period), unobservable inputs may be used. Unobservable inputs reflect the Fund’s own assumptions about the factors market participants would use in determining fair value of the securities or instruments and would be based on the best available information. |
As of April 30, 2021, all of the securities in this Fund were valued based on Level 1 inputs (see the Schedule of Investments for security categories). The level assigned to the securities valuations may not be an indication of the risk or liquidity associated with investing in those securities. Because of the inherent uncertainties of valuation, the values reflected in the financial statements may materially differ from the value received upon actual sale of those investments.
NOTE 4–Expense Offset Arrangement(s)
The expense offset arrangement is comprised of transfer agency credits which result from balances in demand deposit accounts used by the transfer agent for clearing shareholder transactions. For the year ended April 30, 2021, the Fund received credits from this arrangement, which resulted in the reduction of the Fund’s total expenses of $3,169.
NOTE 5–Trustees’ and Officers’ Fees and Benefits
Trustees’ and Officers’ Fees and Benefits include amounts accrued by the Fund to pay remuneration to certain Trustees and Officers of the Fund. Trustees have the option to defer compensation payable by the Fund, and Trustees’ and Officers’ Fees and Benefits also include amounts accrued by the Fund to fund such deferred compensation amounts. Those Trustees who defer compensation have the option to select various Invesco Funds in which their deferral accounts shall be deemed to be invested. Finally, certain current Trustees were eligible to participate in a retirement plan that provided for benefits to be paid upon retirement to Trustees over a period of time based on the number of years of service. The Fund may have certain former Trustees who also participate in a retirement plan and receive benefits under such plan. Trustees’ and Officers’ Fees and Benefits include amounts accrued by the Fund to fund such retirement benefits. Obligations under the deferred compensation and retirement plans represent unsecured claims against the general assets of the Fund.
NOTE 6–Cash Balances
The Fund is permitted to temporarily carry a negative or overdrawn balance in its account with SSB, the custodian bank. Prior to May 5, 2020, the custodian was Citibank, N.A. Such balances, if any at period-end, are shown in the Statement of Assets and Liabilities under the payable caption Amount due custodian. To compensate the custodian bank for such overdrafts, the overdrawn Fund may either (1) leave funds as a compensating balance in the account so the custodian bank can be compensated by earning the additional interest; or (2) compensate by paying the custodian bank at a rate agreed upon by the custodian bank and Invesco, not to exceed the contractually agreed upon rate. The Fund may not purchase additional securities when any borrowings from banks or broker-dealers exceed 5% of the Fund’s total assets, or when any borrowings from an Invesco Fund are outstanding.
NOTE 7–Distributions to Shareholders and Tax Components of Net Assets
Tax Character of Distributions to Shareholders Paid During the Year Ended April 30, 2021, Period Ended April 30, 2020 and the Year Ended October 31, 2019:
| | | | | | | | | | | | |
| | | Year Ended
April 30, 2021 | | | Six months Ended
April 30, 2020 | | | Year Ended October 31, 2019 | |
| |
Ordinary income* | | $ | 16,360,842 | | | | $ 11,964,234 | | | | $ 37,412,036 | |
| |
Long-term capital gain | | | – | | | | 263,330,083 | | | | 168,859,339 | |
| |
Total distributions | | $ | 16,360,842 | | | | $275,294,317 | | | | $206,271,375 | |
| |
| * | Includes short-term capital gain distributions, if any. |
17 Invesco Comstock Select Fund
| | | | |
| Tax Components of Net Assets at Period-End: | | | | |
| |
| | | 2021 | |
| |
Net unrealized appreciation – investments | | $ | 173,025,806 | |
| |
Net unrealized appreciation - foreign currencies | | | 17 | |
| |
Temporary book/tax differences | | | (217,831 | ) |
| |
Capital loss carryforward | | | (21,063,024 | ) |
| |
Shares of beneficial interest | | | 517,298,227 | |
| |
Total net assets | | $ | 669,043,195 | |
| |
The difference between book-basis and tax-basis unrealized appreciation (depreciation) is due to differences in the timing of recognition of gains and losses on investments for tax and book purposes. The Fund’s net unrealized appreciation (depreciation) difference is attributable primarily to wash sales.
The temporary book/tax differences are a result of timing differences between book and tax recognition of income and/or expenses. The Fund’s temporary book/tax differences are the result of the trustee deferral of compensation and retirement plan benefits.
Capital loss carryforward is calculated and reported as of a specific date. Results of transactions and other activity after that date may affect the amount of capital loss carryforward actually available for the Fund to utilize. The ability to utilize capital loss carryforward in the future may be limited under the Internal Revenue Code and related regulations based on the results of future transactions.
The Fund has a capital loss carryforward as of April 30, 2021, as follows:
| | | | | | | | | | | | |
| Capital Loss Carryforward* | |
| Expiration | | Short-Term | | | Long-Term | | | Total | |
Not subject to expiration | | $ | 21,063,024 | | | | $- | | | $ | 21,063,024 | |
| * | Capital loss carryforward is reduced for limitations, if any, to the extent required by the Internal Revenue Code and may be further limited depending upon a variety of factors, including the realization of net unrealized gains or losses as of the date of any reorganization. |
NOTE 8–Investment Transactions
The aggregate amount of investment securities (other than short-term securities, U.S. Government obligations and money market funds, if any) purchased and sold by the Fund during the year ended April 30, 2021 was $290,903,932 and $820,948,896, respectively. Cost of investments, including any derivatives, on a tax basis includes the adjustments for financial reporting purposes as of the most recently completed federal income tax reporting period-end.
| | | | |
| Unrealized Appreciation (Depreciation) of Investments on a Tax Basis | |
| |
Aggregate unrealized appreciation of investments | | $ | 175,462,885 | |
| |
Aggregate unrealized (depreciation) of investments | | | (2,437,079 | ) |
| |
Net unrealized appreciation of investments | | $ | 173,025,806 | |
| |
| |
Cost of investments for tax purposes is $495,210,183. | | | | |
NOTE 9–Reclassification of Permanent Differences
Primarily as a result of differing book/tax treatment of distributions, foreign currency transactions and fair fund distributions, on April 30, 2021, undistributed net investment income was increased by $50,230, undistributed net realized gain (loss) was decreased by $18,498 and shares of beneficial interest was decreased by $31,732. This reclassification had no effect on the net assets of the Fund.
NOTE 10–Share Information
| | | | | | | | | | | | | | | | | | | | | | | | |
| | | Summary of Share Activity | |
| |
| | | Year ended | | | Six months ended | | | Year ended | |
| | | April 30, 2021(a) | | | April 30, 2020 | | | October 31, 2019 | |
| | | Shares | | | Amount | | | Shares | | | Amount | | | Shares | | | Amount | |
| |
Sold: | | | | | | | | | | | | | | | | | | | | | | | | |
Class A | | | 1,111,374 | | | $ | 29,792,773 | | | | 1,118,330 | | | $ | 32,863,057 | | | | 1,060,281 | | | $ | 34,233,028 | |
| |
Class C | | | 217,474 | | | | 5,778,591 | | | | 112,370 | | | | 2,732,809 | | | | 222,306 | | | | 6,777,040 | |
| |
Class R | | | 202,383 | | | | 5,300,783 | | | | 107,716 | | | | 2,704,571 | | | | 146,681 | | | | 4,657,337 | |
| |
Class Y | | | 660,759 | | | | 18,061,065 | | | | 462,083 | | | | 12,039,021 | | | | 562,025 | | | | 18,728,830 | |
| |
Class R5(b) | | | - | | | | - | | | | - | | | | - | | | | 313 | | | | 10,000 | |
| |
Class R6 | | | 94,288 | | | | 2,862,540 | | | | 47,530 | | | | 1,530,832 | | | | 745,176 | | | | 24,198,024 | |
| |
| | | | | | |
Issued as reinvestment of dividends: | | | | | | | | | | | | | | | | | | | | | | | | |
Class A | | | 415,403 | | | | 11,014,435 | | | | 4,119,323 | | | | 114,686,768 | | | | 1,923,295 | | | | 59,082,109 | |
| |
Class C | | | 21,154 | | | | 522,559 | | | | 346,858 | | | | 9,060,327 | | | | 388,781 | | | | 11,265,659 | |
| |
Class R | | | 28,780 | | | | 742,928 | | | | 298,062 | | | | 8,075,878 | | | | 151,671 | | | | 4,548,819 | |
| |
Class Y | | | 25,381 | | | | 691,658 | | | | 538,764 | | | | 15,512,550 | | | | 277,819 | | | | 8,756,144 | |
| |
Class R6 | | | 106,861 | | | | 2,543,224 | | | | 4,296,191 | | | | 122,758,577 | | | | 3,803,013 | | | | 119,301,253 | |
| |
18 Invesco Comstock Select Fund
| | | | | | | | | | | | | | | | | | | | | | | | |
| | | Summary of Share Activity | |
| | | Year ended | | | Six months ended | | | Year ended | |
| | | April 30, 2021(a) | | | April 30, 2020 | | | October 31, 2019 | |
| | | Shares | | | Amount | | | Shares | | | Amount | | | Shares | | | Amount | |
| | | | | | |
Automatic conversion of Class C shares to Class A shares: | | | | | | | | | | | | | | | | | | | | | | | | |
Class A | | | 288,507 | | | $ | 7,853,680 | | | | 74,255 | | | $ | 1,950,852 | | | | 1,229,180 | | | $ | 40,824,573 | |
| |
Class C | | | (308,753 | ) | | | (7,853,680 | ) | | | (79,346 | ) | | | (1,950,852 | ) | | | (1,297,309 | ) | | | (40,824,573 | ) |
| |
| | | | | | |
Reacquired: | | | | | | | | | | | | | | | | | | | | | | | | |
Class A | | | (3,655,749 | ) | | | (94,648,562 | ) | | | (2,753,772 | ) | | | (72,696,085 | ) | | | (2,753,692 | ) | | | (89,581,921 | ) |
| |
Class C | | | (321,994 | ) | | | (7,576,582 | ) | | | (292,349 | ) | | | (6,886,545 | ) | | | (871,157 | ) | | | (26,961,005 | ) |
| |
Class R | | | (329,644 | ) | | | (8,284,292 | ) | | | (200,471 | ) | | | (5,349,686 | ) | | | (294,777 | ) | | | (9,438,862 | ) |
| |
Class Y | | | (710,850 | ) | | | (18,714,530 | ) | | | (1,692,830 | ) | | | (47,008,994 | ) | | | (787,167 | ) | | | (25,969,809 | ) |
| |
Class R6 | | | (20,076,814 | ) | | | (485,134,553 | ) | | | (3,242,205 | ) | | | (115,131,209 | ) | | | (14,163,335 | ) | | | (467,314,478 | ) |
| |
Net increase (decrease) in share activity | | | (22,231,440 | ) | | $ | (537,047,963 | ) | | | 3,260,509 | | | $ | 74,891,871 | | | | (9,656,896 | ) | | $ | (327,707,832 | ) |
| |
| (a) | There are entities that are record owners of more than 5% of the outstanding shares of the Fund and in the aggregate own 5% of the outstanding shares of the Fund. IDI has an agreement with these entities to sell Fund shares. The Fund, Invesco and/or Invesco affiliates may make payments to these entities, which are considered to be related to the Fund, for providing services to the Fund, Invesco and/or Invesco affiliates including but not limited to services such as securities brokerage, distribution, third party record keeping and account servicing. The Fund has no knowledge as to whether all or any portion of the shares owned of record by these entities are also owned beneficially. |
| (b) | Commencement date after the close of business on May 24, 2019. |
19 Invesco Comstock Select Fund
Report of Independent Registered Public Accounting Firm
To the Board of Trustees of AIM Sector Funds (Invesco Sector Funds) and Shareholders of Invesco Comstock Select Fund
Opinion on the Financial Statements
We have audited the accompanying statement of assets and liabilities, including the schedule of investments, of Invesco Comstock Select Fund (one of the funds constituting AIM Sector Funds (Invesco Sector Funds), referred to hereafter as the “Fund”) as of April 30, 2021, the related statement of operations for the year ended April 30, 2021, the statement of changes in net assets for the year ended April 30, 2021, the six months ended April 30, 2020 and the year ended October 31, 2019, including the related notes, and the financial highlights for each of the periods indicated in the table below (collectively referred to as the “financial statements”). In our opinion, the financial statements present fairly, in all material respects, the financial position of the Fund as of April 30, 2021, the results of its operations for the year then ended, the changes in its net assets for the year ended April 30, 2021, the six months ended April 30, 2020 and the year ended October 30, 2019, and the financial highlights for each of the periods indicated in the table below, in conformity with accounting principles generally accepted in the United States of America.
|
| Financial Highlights |
| For the year ended April 30, 2021, the six months ended April 30, 2020 and the year ended October 31, 2019 for Class A, Class C, Class R, Class Y, and Class R6 For the year ended April 30, 2021, the six months ended April 30, 2020 and the period of May 24, 2019 (commencement of operations) through October 31, 2019 for Class R5 |
The financial statements of Invesco Comstock Select Fund (formerly known as Oppenheimer Value Fund) as of and for the year ended October 31, 2018 and the financial highlights for each of the periods ended on or prior to October 31, 2018 (not presented herein, other than the financial highlights) were audited by other auditors whose report dated December 21, 2018 expressed an unqualified opinion on those financial statements and financial highlights.
Basis for Opinion
These financial statements are the responsibility of the Fund’s management. Our responsibility is to express an opinion on the Fund’s financial statements based on our audits. We are a public accounting firm registered with the Public Company Accounting Oversight Board (United States) (PCAOB) and are required to be independent with respect to the Fund in accordance with the U.S. federal securities laws and the applicable rules and regulations of the Securities and Exchange Commission and the PCAOB.
We conducted our audits of these financial statements in accordance with the standards of the PCAOB. Those standards require that we plan and perform the audit to obtain reasonable assurance about whether the financial statements are free of material misstatement, whether due to error or fraud.
Our audits included performing procedures to assess the risks of material misstatement of the financial statements, whether due to error or fraud, and performing procedures that respond to those risks. Such procedures included examining, on a test basis, evidence regarding the amounts and disclosures in the financial statements. Our audits also included evaluating the accounting principles used and significant estimates made by management, as well as evaluating the overall presentation of the financial statements. Our procedures included confirmation of securities owned as of April 30, 2021 by correspondence with the custodian and transfer agent. We believe that our audits provide a reasonable basis for our opinion.
/s/PricewaterhouseCoopers LLP
Houston, Texas
June 24, 2021
We have served as the auditor of one or more investment companies in the Invesco group of investment companies since at least 1995. We have not been able to determine the specific year we began serving as auditor.
20 Invesco Comstock Select Fund
Calculating your ongoing Fund expenses
Example
As a shareholder of the Fund, you incur two types of costs: (1) transaction costs, which may include sales charges (loads) on purchase payments or contingent deferred sales charges on redemptions, if any; and (2) ongoing costs, including management fees, distribution and/or service (12b-1) fees, and other Fund expenses. This example is intended to help you understand your ongoing costs (in dollars) of investing in the Fund and to compare these costs with ongoing costs of investing in other mutual funds. The example is based on an investment of $1,000 invested at the beginning of the period and held for the entire period November 1, 2020 through April 30, 2021.
Actual expenses
The table below provides information about actual account values and actual expenses. You may use the information in this table, together with the amount you invested, to estimate the expenses that you paid over the period. Simply divide your account value by $1,000 (for example, an $8,600 account value divided by $1,000 = 8.6), then multiply the result by the number in the table under the heading entitled “Actual Expenses Paid During Period” to estimate the expenses you paid on your account during this period.
Hypothetical example for comparison purposes
The table below also provides information about hypothetical account values and hypothetical expenses based on the Fund’s actual expense ratio and an assumed rate of return of 5% per year before expenses, which is not the Fund’s actual return.
The hypothetical account values and expenses may not be used to estimate the actual ending account balance or expenses you paid for the period. You may use this information to compare the ongoing costs of investing in the Fund and other funds. To do so, compare this 5% hypothetical example with the 5% hypothetical examples that appear in the shareholder reports of the other funds.
Please note that the expenses shown in the table are meant to highlight your ongoing costs only and do not reflect any transaction costs, such as sales charges (loads) on purchase payments or contingent deferred sales charges on redemptions, if any. Therefore, the hypothetical information is useful in comparing ongoing costs only, and will not help you determine the relative total costs of owning different funds. In addition, if these transaction costs were included, your costs would have been higher.
| | | | | | | | | | | | |
| | | Beginning
Account Value
(11/01/20) | | ACTUAL | | HYPOTHETICAL
(5% annual return before
expenses) | | Annualized
Expense Ratio |
| | Ending
Account Value
(04/30/21)1 | | Expenses
Paid During
Period2 | | Ending
Account Value
(04/30/21) | | Expenses
Paid During
Period2 |
Class A | | $1,000.00 | | $1,487.90 | | $5.74 | | $1,020.18 | | $4.66 | | 0.93% |
Class C | | 1,000.00 | | 1,482.00 | | 10.34 | | 1,016.46 | | 8.40 | | 1.68 |
Class R | | 1,000.00 | | 1,485.70 | | 7.27 | | 1,018.94 | | 5.91 | | 1.18 |
Class Y | | 1,000.00 | | 1,490.00 | | 4.20 | | 1,021.42 | | 3.41 | | 0.68 |
Class R5 | | 1,000.00 | | 1,490.00 | | 3.52 | | 1,021.97 | | 2.86 | | 0.57 |
Class R6 | | 1,000.00 | | 1,490.70 | | 3.21 | | 1,022.22 | | 2.61 | | 0.52 |
| 1 | The actual ending account value is based on the actual total return of the Fund for the period November 1, 2020 through April 30, 2021, after actual expenses and will differ from the hypothetical ending account value which is based on the Fund’s expense ratio and a hypothetical annual return of 5% before expenses. |
| 2 | Expenses are equal to the Fund’s annualized expense ratio as indicated above multiplied by the average account value over the period, multiplied by 181/365 to reflect the most recent fiscal half year. |
21 Invesco Comstock Select Fund
Tax Information
Form 1099-DIV, Form 1042-S and other year–end tax information provide shareholders with actual calendar year amounts that should be included in their tax returns. Shareholders should consult their tax advisers.
The following distribution information is being provided as required by the Internal Revenue Code or to meet a specific state’s requirement.
The Fund designates the following amounts or, if subsequently determined to be different, the maximum amount allowable for its fiscal year ended April 30, 2021:
| | | | | | |
| | | | | | |
Federal and State Income Tax | | | | |
Corporate Dividends Received Deduction* | | | 100.00 | % |
Qualified Dividend Income* | | | 100.00 | % |
Qualified Business Income* | | | 0.00 | % |
Business Interest Income* | | | 0.00 | % |
U.S. Treasury Obligations* | | | 0.00 | % |
| | * | The above percentages are based on ordinary income dividends paid to shareholders during the Fund’s fiscal year. |
22 Invesco Comstock Select Fund
Trustees and Officers
The address of each trustee and officer is AIM Sector Funds (Invesco Sector Funds) (the “Trust”), 11 Greenway Plaza, Suite 1000, Houston, Texas 77046-1173. The trustees serve for the life of the Trust, subject to their earlier death, incapacitation, resignation, retirement or removal as more specifically provided in the Trust’s organizational documents. Each officer serves for a one year term or until their successors are elected and qualified. Column two below includes length of time served with predecessor entities, if any.
| | | | | | | | |
Name, Year of Birth and Position(s) Held with the Trust | | Trustee and/or Officer Since | | Principal Occupation(s) During Past 5 Years | | Number of Funds in Fund Complex Overseen by Trustee | | Other Directorship(s) Held by Trustee During Past 5 Years |
Interested Trustee | | | | | | | | |
| | | | | |
Martin L. Flanagan1 - 1960 Trustee and Vice Chair | | 2007 | | Executive Director, Chief Executive Officer and President, Invesco Ltd. (ultimate parent of Invesco and a global investment management firm); Trustee and Vice Chair, The Invesco Funds; Vice Chair, Investment Company Institute; and Member of Executive Board, SMU Cox School of Business Formerly: Advisor to the Board, Invesco Advisers, Inc. (formerly known as Invesco Institutional (N.A.), Inc.); Chairman and Chief Executive Officer, Invesco Advisers, Inc. (registered investment adviser); Director, Chairman, Chief Executive Officer and President, Invesco Holding Company (US), Inc. (formerly IVZ Inc.) (holding company), Invesco Group Services, Inc. (service provider) and Invesco North American Holdings, Inc. (holding company); Director, Chief Executive Officer and President, Invesco Holding Company Limited (parent of Invesco and a global investment management firm); Director, Invesco Ltd.; Chairman, Investment Company Institute and President, Co-Chief Executive Officer, Co-President, Chief Operating Officer and Chief Financial Officer, Franklin Resources, Inc. (global investment management organization) | | 184 | | None |
| 1 | Mr. Flanagan is considered an interested person (within the meaning of Section 2(a)(19) of the 1940 Act) of the Trust because he is an officer of the Adviser to the Trust, and an officer and a director of Invesco Ltd., ultimate parent of the Adviser. |
T-1 Invesco Comstock Select Fund
Trustees and Officers–(continued)
| | | | | | | | |
Name, Year of Birth and Position(s) Held with the Trust | | Trustee and/or Officer Since | | Principal Occupation(s) During Past 5 Years | | Number of Funds in Fund Complex Overseen by Trustee | | Other Directorship(s) Held by Trustee During Past 5 Years |
Independent Trustees | | | | |
| | | | | |
Christopher L. Wilson - 1957 Trustee and Chair | | 2017 | | Retired Formerly: Director, TD Asset Management USA Inc. (mutual fund complex) (22 portfolios); Managing Partner, CT2, LLC (investing and consulting firm); President/Chief Executive Officer, Columbia Funds, Bank of America Corporation; President/Chief Executive Officer, CDC IXIS Asset Management Services, Inc.; Principal & Director of Operations, Scudder Funds, Scudder, Stevens & Clark, Inc.; Assistant Vice President, Fidelity Investments | | 184 | | enaible, Inc. (artificial intelligence technology); Director, ISO New England, Inc. (non-profit organization managing regional electricity market) |
| | | | | |
Beth Ann Brown - 1968 Trustee | | 2019 | | Independent Consultant Formerly: Head of Intermediary Distribution, Managing Director, Strategic Relations, Managing Director, Head of National Accounts, Senior Vice President, National Account Manager and Senior Vice President, Key Account Manager, Columbia Management Investment Advisers LLC; Vice President, Key Account Manager, Liberty Funds Distributor, Inc.; and Trustee of certain Oppenheimer Funds | | 184 | | Director, Board of Directors of Caron Engineering Inc.; Advisor, Board of Advisors of Caron Engineering Inc.; President and Director, Acton Shapleigh Youth Conservation Corps (non - profit); and President and Director of Grahamtastic Connection (non-profit) |
| | | | | |
Jack M. Fields - 1952 Trustee | | 2003 | | Chief Executive Officer, Twenty First Century Group, Inc. (government affairs company); and Board Member, Impact(Ed) (non-profit) Formerly: Owner and Chief Executive Officer, Dos Angeles Ranch L.P. (cattle, hunting, corporate entertainment); Director, Insperity, Inc. (formerly known as Administaff) (human resources provider); Chief Executive Officer, Texana Timber LP (sustainable forestry company); Director of Cross Timbers Quail Research Ranch (non-profit); and member of the U.S. House of Representatives | | 184 | | Member, Board of Directors of Baylor College of Medicine |
| | | | | |
Cynthia Hostetler -1962 Trustee | | 2017 | | Non-Executive Director and Trustee of a number of public and private business corporations Formerly: Director, Aberdeen Investment Funds (4 portfolios); Director, Artio Global Investment LLC (mutual fund complex); Director, Edgen Group, Inc. (specialized energy and infrastructure products distributor); Head of Investment Funds and Private Equity, Overseas Private Investment Corporation; President, First Manhattan Bancorporation, Inc.; Attorney, Simpson Thacher & Bartlett LLP | | 184 | | Resideo Technologies, Inc. (smart home technology); Vulcan Materials Company (construction materials company); Trilinc Global Impact Fund; Genesee & Wyoming, Inc. (railroads); Investment Company Institute (professional organization); Independent Directors Council (professional organization);Eisenhower Foundation (non-profit) |
| | | | | |
Eli Jones - 1961 Trustee | | 2016 | | Professor and Dean, Mays Business School - Texas A&M University Formerly: Professor and Dean, Walton College of Business, University of Arkansas and E.J. Ourso College of Business, Louisiana State University; Director, Arvest Bank | | 184 | | Insperity, Inc. (formerly known as Administaff) (human resources provider) |
T-2 Invesco Comstock Select Fund
Trustees and Officers–(continued)
| | | | | | | | |
Name, Year of Birth and Position(s) Held with the Trust | | Trustee and/or Officer Since | | Principal Occupation(s) During Past 5 Years | | Number of Funds in Fund Complex Overseen by Trustee | | Other Directorship(s) Held by Trustee During Past 5 Years |
Independent Trustees–(continued) | | | | |
| | | | | |
Elizabeth Krentzman - 1959 Trustee | | 2019 | | Formerly: Principal and Chief Regulatory Advisor for Asset Management Services and U.S. Mutual Fund Leader of Deloitte & Touche LLP; General Counsel of the Investment Company Institute (trade association); National Director of the Investment Management Regulatory Consulting Practice, Principal, Director and Senior Manager of Deloitte & Touche LLP; Assistant Director of the Division of Investment Management - Office of Disclosure and Investment Adviser Regulation of the U.S. Securities and Exchange Commission and various positions with the Division of Investment Management - Office of Regulatory Policy of the U.S. Securities and Exchange Commission; Associate at Ropes & Gray LLP; and Trustee of certain Oppenheimer Funds | | 184 | | Trustee of the University of Florida National Board Foundation; Member of the Carita Funds Board of Directors (private investment funds); Member of the University of Florida Law Center Association, Inc. Board of Trustees and Audit Committee Member |
| | | | | |
Anthony J. LaCava, Jr. - 1956 Trustee | | 2019 | | Formerly: Director and Member of the Audit Committee, Blue Hills Bank (publicly traded financial institution) and Managing Partner, KPMG LLP | | 184 | | Blue Hills Bank; Chairman, Bentley University; Member, Business School Advisory Council; and Nominating Committee KPMG LLP |
| | | | | |
Prema Mathai-Davis - 1950 Trustee | | 2003 | | Retired Formerly: Co-Founder & Partner of Quantalytics Research, LLC, (a FinTech Investment Research Platform for the Self-Directed Investor); Trustee of YWCA Retirement Fund; CEO of YWCA of the USA; Board member of the NY Metropolitan Transportation Authority; Commissioner of the NYC Department of Aging; Board member of Johns Hopkins Bioethics Institute | | 184 | | None |
| | | | | |
Joel W. Motley - 1952 Trustee | | 2019 | | Director of Office of Finance, Federal Home Loan Bank System; Managing Director of Carmona Motley Inc. (privately held financial advisor); Member of the Council on Foreign Relations and its Finance and Budget Committee; Chairman Emeritus of Board of Human Rights Watch and Member of its Investment Committee; and Member of Investment Committee and Board of Historic Hudson Valley (non-profit cultural organization) Formerly: Managing Director of Public Capital Advisors, LLC (privately held financial advisor); Managing Director of Carmona Motley Hoffman, Inc. (privately held financial advisor); Trustee of certain Oppenheimer Funds; Director of Columbia Equity Financial Corp. (privately held financial advisor); and Member of the Vestry of Trinity Church Wall Street | | 184 | | Member of Board of Greenwall Foundation (bioethics research foundation) and its Investment Committee; Member of Board of Friends of the LRC (non-profit legal advocacy); Board Member and Investment Committee Member of Pulitzer Center for Crisis Reporting (non-profit journalism) |
| | | | | |
Teresa M. Ressel - 1962 Trustee | | 2017 | | Non-executive director and trustee of a number of public and private business corporations Formerly: Chief Executive Officer, UBS Securities LLC (investment banking); Chief Operating Officer, UBS AG Americas (investment banking); Sr. Management Team Olayan America, The Olayan Group (international investor/commercial/industrial); Assistant Secretary for Management & Budget and Designated Chief Financial Officer, U.S. Department of Treasury; Director, Atlantic Power Corporation (power generation company) and ON Semiconductor Corporation (semiconductor manufacturing) | | 184 | | Elucida Oncology (nanotechnology & medical particles company) |
T-3 Invesco Comstock Select Fund
Trustees and Officers–(continued)
| | | | | | | | |
Name, Year of Birth and Position(s) Held with the Trust | | Trustee and/or Officer Since | | Principal Occupation(s) During Past 5 Years | | Number of Funds in Fund Complex Overseen by Trustee | | Other Directorship(s) Held by Trustee During Past 5 Years |
Independent Trustees–(continued) | | | | |
| | | | | |
Ann Barnett Stern - 1957 Trustee | | 2017 | | President, Chief Executive Officer and Board Member, Houston Endowment, Inc. a private philanthropic institution Formerly: Executive Vice President, Texas Children’s Hospital; Vice President, General Counsel and Corporate Compliance Officer, Texas Children’s Hospital; Attorney at Beck, Redden and Secrest, LLP and Andrews and Kurth LLP | | 184 | | Director and Audit Committee member of Federal Reserve Bank of Dallas; Trustee and Board Chair of Good Reason Houston (nonprofit); Trustee, Vice Chair, Chair of Nomination/Governance Committee, Chair of Personnel Committee of Holdsworth Center (nonprofit); Trustee and Investment Committee member of University of Texas Law School Foundation (nonprofit); Board Member of Greater Houston Partnership |
| | | | | |
Robert C. Troccoli - 1949 Trustee | | 2016 | | Retired Formerly: Adjunct Professor, University of Denver – Daniels College of Business; and Managing Partner, KPMG LLP | | 184 | | None |
| | | | | |
Daniel S. Vandivort -1954 Trustee | | 2019 | | Trustee, Board of Trustees, Huntington Disease Foundation of America; and President, Flyway Advisory Services LLC (consulting and property management) Formerly: Trustee and Governance Chair, of certain Oppenheimer Funds; and Treasurer, Chairman of the Audit and Finance Committee, Huntington Disease Foundation of America | | 184 | | None |
| | | | | |
James D. Vaughn - 1945 Trustee | | 2019 | | Retired Formerly: Managing Partner, Deloitte & Touche LLP; Trustee and Chairman of the Audit Committee, Schroder Funds; Board Member, Mile High United Way, Boys and Girls Clubs, Boy Scouts, Colorado Business Committee for the Arts, Economic Club of Colorado and Metro Denver Network (economic development corporation); and Trustee of certain Oppenheimer Funds | | 184 | | Board member and Chairman of Audit Committee of AMG National Trust Bank; Trustee and Investment Committee member, University of South Dakota Foundation; Board member, Audit Committee Member and past Board Chair, Junior Achievement (non-profit) |
T-4 Invesco Comstock Select Fund
Trustees and Officers–(continued)
| | | | | | | | |
Name, Year of Birth and Position(s) Held with the Trust | | Trustee and/or Officer Since | | Principal Occupation(s) During Past 5 Years | | Number of Funds in Fund Complex Overseen by Trustee | | Other Directorship(s) Held by Trustee During Past 5 Years |
Officers | | | | |
| | | | | |
Sheri Morris – 1964 President and Principal Executive Officer | | 2003 | | Head of Global Fund Services, Invesco Ltd.; President and Principal Executive Officer, The Invesco Funds; Senior Vice President, Invesco Advisers, Inc. (formerly known as Invesco Institutional (N.A.), Inc.) (registered investment adviser); and Vice President, Invesco Exchange-Traded Fund Trust, Invesco Exchange-Traded Fund Trust II, Invesco India Exchange-Traded Fund Trust, Invesco Actively Managed Exchange-Traded Fund Trust, Invesco Actively Managed Exchange-Traded Commodity Fund Trust and Invesco Exchange-Traded Self-Indexed Fund Trust; and Vice President, OppenheimerFunds, Inc. Formerly: Vice President, Treasurer and Principal Financial Officer, The Invesco Funds; Vice President, Invesco AIM Advisers, Inc., Invesco AIM Capital Management, Inc. and Invesco AIM Private Asset Management, Inc.; Assistant Vice President and Assistant Treasurer, The Invesco Funds; Vice President and Assistant Vice President, Invesco Advisers, Inc.; Assistant Vice President, Invesco AIM Capital Management, Inc. and Invesco AIM Private Asset Management, Inc.; and Treasurer, Invesco Exchange-Traded Fund Trust, Invesco Exchange-Traded Fund Trust II, Invesco India Exchange-Traded Fund Trust and Invesco Actively Managed Exchange-Traded Fund Trust | | N/A | | N/A |
| | | | | |
Russell C. Burk–1958 Senior Vice President and Senior Officer | | 2005 | | Senior Vice President and Senior Officer, The Invesco Funds | | N/A | | N/A |
| | | | | |
Jeffrey H. Kupor - 1968 Senior Vice President, Chief Legal Officer and Secretary | | 2018 | | Head of Legal of the Americas, Invesco Ltd.; Senior Vice President and Secretary, Invesco Advisers, Inc. (formerly known as Invesco Institutional (N.A.), Inc.) (registered investment adviser); Senior Vice President and Secretary, Invesco Distributors, Inc. (formerly known as Invesco AIM Distributors, Inc.); Vice President and Secretary, Invesco Investment Services, Inc. (formerly known as Invesco AIM Investment Services, Inc.) Senior Vice President, Chief Legal Officer and Secretary, The Invesco Funds; Secretary and General Counsel, Invesco Investment Advisers LLC (formerly known as Van Kampen Asset Management); Secretary and General Counsel, Invesco Capital Markets, Inc. (formerly known as Van Kampen Funds Inc.) and Chief Legal Officer, Invesco Exchange-Traded Fund Trust, Invesco Exchange-Traded Fund Trust II, Invesco India Exchange-Traded Fund Trust, Invesco Actively Managed Exchange-Traded Fund Trust, Invesco Actively Managed Exchange-Traded Commodity Fund Trust and Invesco Exchange-Traded Self-Indexed Fund Trust; Secretary, Invesco Indexing LLC; Secretary, W.L. Ross & Co., LLC ; Secretary and Vice President, Harbourview Asset Management Corporation; Secretary and Vice President, OppenheimerFunds, Inc. and Invesco Managed Accounts, LLC; Secretary and Senior Vice President, OFI Global Institutional, Inc.; Secretary and Vice President, OFI SteelPath, Inc.; Secretary and Vice President, Oppenheimer Acquisition Corp.; Secretary and Vice President, Shareholder Services, Inc.; Secretary and Vice President, Trinity Investment Management Corporation Formerly: Secretary and Vice President, Jemstep, Inc.; Head of Legal, Worldwide Institutional, Invesco Ltd.; Secretary and General Counsel, INVESCO Private Capital Investments, Inc.; Senior Vice President, Secretary and General Counsel, Invesco Management Group, Inc. (formerly known as Invesco AIM Management Group, Inc.); Assistant Secretary, INVESCO Asset Management (Bermuda) Ltd.; Secretary and General Counsel, Invesco Private Capital, Inc.; Assistant Secretary and General Counsel, INVESCO Realty, Inc.; Secretary and General Counsel, Invesco Senior Secured Management, Inc.; and Secretary, Sovereign G./P. Holdings Inc. | | N/A | | N/A |
T-5 Invesco Comstock Select Fund
Trustees and Officers–(continued)
| | | | | | | | |
Name, Year of Birth and Position(s) Held with the Trust | | Trustee and/or Officer Since | | Principal Occupation(s) During Past 5 Years | | Number of Funds in Fund Complex Overseen by Trustee | | Other Directorship(s) Held by Trustee During Past 5 Years |
Officers–(continued) | | | | |
| | | | | |
Andrew R. Schlossberg - 1974 Senior Vice President | | 2019 | | Head of the Americas and Senior Managing Director, Invesco Ltd.; Director and Senior Vice President, Invesco Advisers, Inc. (formerly known as Invesco Institutional (N.A.), Inc.) (registered investment adviser); Director and Chairman, Invesco Investment Services, Inc. (formerly known as Invesco AIM Investment Services, Inc.) (registered transfer agent); Senior Vice President, The Invesco Funds; Director, Invesco Investment Advisers LLC (formerly known as Van Kampen Asset Management); Director, President and Chairman, Invesco Insurance Agency, Inc. Formerly: Director, President and Chairman, Invesco Insurance Agency, Inc.; Director, Invesco UK Limited; Director and Chief Executive, Invesco Asset Management Limited and Invesco Fund Managers Limited; Assistant Vice President, The Invesco Funds; Senior Vice President, Invesco Advisers, Inc. (formerly known as Invesco Institutional (N.A.), Inc.) (registered investment adviser); Director and Chief Executive, Invesco Administration Services Limited and Invesco Global Investment Funds Limited; Director, Invesco Distributors, Inc.; Head of EMEA, Invesco Ltd.; President, Invesco Actively Managed Exchange-Traded Commodity Fund Trust, Invesco Actively Managed Exchange-Traded Fund Trust, Invesco Exchange-Traded Fund Trust, Invesco Exchange-Traded Fund Trust II and Invesco India Exchange-Traded Fund Trust; Managing Director and Principal Executive Officer, Invesco Capital Management LLC | | N/A | | N/A |
| | | | | |
John M. Zerr – 1962 Senior Vice President | | 2006 | | Chief Operating Officer of the Americas; Senior Vice President, Invesco Advisers, Inc. (formerly known as Invesco Institutional (N.A.), Inc.) (registered investment adviser); Senior Vice President, Invesco Distributors, Inc. (formerly known as Invesco AIM Distributors, Inc.); Director and Vice President, Invesco Investment Services, Inc. (formerly known as Invesco AIM Investment Services, Inc.) Senior Vice President, The Invesco Funds; Managing Director, Invesco Capital Management LLC; Director, Invesco Investment Advisers LLC (formerly known as Van Kampen Asset Management); Senior Vice President, Invesco Capital Markets, Inc. (formerly known as Van Kampen Funds Inc.); Manager, Invesco Indexing LLC; Manager, Invesco Specialized Products, LLC; Member, Invesco Canada Funds Advisory Board; Director, President and Chief Executive Officer, Invesco Corporate Class Inc. (corporate mutual fund company); and Director, Chairman, President and Chief Executive Officer, Invesco Canada Ltd. (formerly known as Invesco Trimark Ltd./Invesco Trimark Ltèe) (registered investment adviser and registered transfer agent); President, Invesco, Inc.; President, Invesco Global Direct Real Estate Feeder GP Ltd.; President, Invesco IP Holdings(Canada) Ltd; President, Invesco Global Direct Real Estate GP Ltd.; President, Invesco Financial Services Ltd. / Services Financiers Invesco Ltée; President, Trimark Investments Ltd./Placements Trimark Ltée and Director and Chairman, Invesco Trust Company | | N/A | | N/A |
| | | | | |
| | | | | Formerly: Director and Senior Vice President, Invesco Insurance Agency, Inc.; Director and Senior Vice President, Invesco Management Group, Inc. (formerly known as Invesco AIM Management Group, Inc.); Secretary and General Counsel, Invesco Management Group, Inc. (formerly known as Invesco AIM Management Group, Inc.); Secretary, Invesco Investment Services, Inc. (formerly known as Invesco AIM Investment Services, Inc.); Chief Legal Officer and Secretary, The Invesco Funds; Secretary and General Counsel, Invesco Investment Advisers LLC (formerly known as Van Kampen Asset Management); Secretary and General Counsel, Invesco Capital Markets, Inc. (formerly known as Van Kampen Funds Inc.); Chief Legal Officer, Invesco Exchange-Traded Fund Trust, Invesco Exchange-Traded Fund Trust II, Invesco India Exchange-Traded Fund Trust, Invesco Actively Managed Exchange-Traded Fund Trust, Invesco Actively Managed Exchange-Traded Commodity Fund Trust and Invesco Exchange-Traded Self-Indexed Fund Trust; Secretary, Invesco Indexing LLC; Director, Secretary, General Counsel and Senior Vice President, Van Kampen Exchange Corp.; Director, Vice President and Secretary, IVZ Distributors, Inc. (formerly known as INVESCO Distributors, Inc.); Director and Vice President, INVESCO Funds Group, Inc.; Director and Vice President, Van Kampen Advisors Inc.; Director, Vice President, Secretary and General Counsel, Van Kampen Investor Services Inc.;Director and Secretary, Invesco Distributors, Inc. (formerly known as Invesco AIM Distributors, Inc.); Director, Senior Vice President, General Counsel and Secretary, Invesco AIM Advisers, Inc. and Van Kampen Investments Inc.; Director, Vice President and Secretary, Fund Management Company; Director, Senior Vice President, Secretary, General Counsel and Vice President, Invesco AIM Capital Management, Inc.; Chief Operating Officer and General Counsel, Liberty Ridge Capital, Inc. (an investment adviser) | | | | |
T-6 Invesco Comstock Select Fund
Trustees and Officers–(continued)
| | | | | | | | |
Name, Year of Birth and Position(s) Held with the Trust | | Trustee and/or Officer Since | | Principal Occupation(s) During Past 5 Years | | Number of Funds in Fund Complex Overseen by Trustee | | Other Directorship(s) Held by Trustee During Past 5 Years |
Officers–(continued) | | | | |
| | | | | |
Gregory G. McGreevey - 1962 Senior Vice President | | 2012 | | Senior Managing Director, Invesco Ltd.; Director, Chairman, President, and Chief Executive Officer, Invesco Advisers, Inc. (formerly known as Invesco Institutional (N.A.), Inc.) (registered investment adviser); Director, Invesco Mortgage Capital, Inc. and Invesco Senior Secured Management, Inc.; and Senior Vice President, The Invesco Funds; and President, SNW Asset Management Corporation and Invesco Managed Accounts, LLC; Chairman and Director, Invesco Private Capital, Inc.; Chairman and Director, INVESCO Private Capital Investments, Inc.; Chairman and Director, INVESCO Realty, Inc. Chairman and Director, INVESCO Realty, Inc.; and Senior Vice President, Invesco Group Services, Inc. Formerly: Senior Vice President, Invesco Management Group, Inc. and Invesco Advisers, Inc.; Assistant Vice President, The Invesco Funds | | N/A | | N/A |
| | | | | |
| Adrien Deberghes - 1967 Principal Financial Officer, Treasurer and Vice President | | 2020 | | Head of the Fund Office of the CFO and Fund Administration; Vice President, Invesco Advisers, Inc.; Principal Financial Officer, Treasurer and Vice President, The Invesco Funds; Vice President, Invesco Exchange-Traded Fund Trust, Invesco Exchange-Traded Fund Trust II, Invesco India Exchange-Traded Fund Trust, Invesco Actively Managed Exchange-Traded Fund Trust, Invesco Actively Managed Exchange-Traded Commodity Fund Trust and Invesco Exchange-Traded Self-Indexed Fund Trust Formerly: Senior Vice President and Treasurer, Fidelity Investments | | N/A | | N/A |
| | | | | |
Crissie M. Wisdom - 1969 Anti-Money Laundering Compliance Officer | | 2013 | | Anti-Money Laundering and OFAC Compliance Officer for Invesco U.S. entities including: Invesco Advisers, Inc. and its affiliates, Invesco Capital Markets, Inc., Invesco Distributors, Inc., Invesco Investment Services, Inc., The Invesco Funds, Invesco Capital Management, LLC, Invesco Trust Company; and Fraud Prevention Manager for Invesco Investment Services, Inc. | | N/A | | N/A |
| | | | | |
Todd F. Kuehl - 1969 Chief Compliance Officer and Senior Vice President | | 2020 | | Chief Compliance Officer, Invesco Advisers, Inc. (registered investment adviser); and Chief Compliance Officer, The Invesco Funds and Senior Vice President Formerly: Managing Director and Chief Compliance Officer, Legg Mason (Mutual Funds); Chief Compliance Officer, Legg Mason Private Portfolio Group (registered investment adviser) | | N/A | | N/A |
| | | | | |
Michael McMaster – 1962 Chief Tax Officer, Vice President and Assistant Treasurer | | 2020 | | Head of Global Fund Services Tax; Chief Tax Officer, Vice President and Assistant Treasurer, The Invesco Funds; Vice President, Invesco Advisers, Inc.; Assistant Treasurer, Invesco Capital Management LLC, Assistant Treasurer and Chief Tax Officer, Invesco Exchange-Traded Fund Trust, Invesco Exchange-Traded Fund Trust II, Invesco India Exchange-Traded Fund Trust, Invesco Actively Managed Exchange-Traded Fund Trust, Invesco Actively Managed Exchange-Traded Commodity Fund Trust and Invesco Exchange-Traded Self-Indexed Fund Trust; Assistant Treasurer, Invesco Specialized Products, LLC Formerly: Senior Vice President – Managing Director of Tax Services, U.S. Bank Global Fund Services (GFS) | | N/A | | N/A |
The Statement of Additional Information of the Trust includes additional information about the Fund’s Trustees and is available upon request, without charge, by calling 1.800.959.4246. Please refer to the Fund’s Statement of Additional Information for information on the Fund’s sub-advisers.
| | | | | | |
| Office of the Fund | | Investment Adviser | | Distributor | | Auditors |
| 11 Greenway Plaza, Suite 1000 | | Invesco Advisers, Inc. | | Invesco Distributors, Inc. | | PricewaterhouseCoopers LLP |
| Houston, TX 77046-1173 | | 1555 Peachtree Street, N.E. | | 11 Greenway Plaza, Suite 1000 | | 1000 Louisiana Street, Suite 5800 |
| | Atlanta, GA 30309 | | Houston, TX 77046-1173 | | Houston, TX 77002-5678 |
| | | |
| Counsel to the Fund | | Counsel to the Independent Trustees | | Transfer Agent | | Custodian |
| Stradley Ronon Stevens & Young, LLP | | Goodwin Procter LLP | | Invesco Investment Services, Inc. | | State Street Bank and Trust Company |
| 2005 Market Street, Suite 2600 | | 901 New York Avenue, N.W. | | 11 Greenway Plaza, Suite 1000 | | 225 Franklin Street |
| Philadelphia, PA 19103-7018 | | Washington, D.C. 20001 | | Houston, TX 77046-1173 | | Boston, MA 02110-2801 |
T-7 Invesco Comstock Select Fund
(This page intentionally left blank)
(This page intentionally left blank)

Go paperless with eDelivery
Visit invesco.com/edelivery to enjoy the convenience and security of anytime electronic access to your investment documents.
With eDelivery, you can elect to have any or all of the following materials delivered straight to your inbox to download, save and print from your own computer:
| ∎ | | Fund reports and prospectuses |
Invesco mailing information
Send general correspondence to Invesco Investment Services, Inc., P.O. Box 219078, Kansas City, MO 64121-9078.
Important notice regarding delivery of security holder documents
To reduce Fund expenses, only one copy of most shareholder documents may be mailed to shareholders with multiple accounts at the same address (Householding). Mailing of your shareholder documents may be householded indefinitely unless you instruct us otherwise. If you do not want the mailing of these documents to be combined with those for other members of your household, please contact Invesco Investment Services, Inc. at 800 959 4246 or contact your financial institution. We will begin sending you individual copies for each account within 30 days after receiving your request.
Fund holdings and proxy voting information
The Fund provides a complete list of its portfolio holdings four times each fiscal year, at the end of each fiscal quarter. For the second and fourth quarters, the list appears, respectively, in the Fund’s semiannual and annual reports to shareholders. For the first and third quarters, the Fund files the list with the Securities and Exchange Commission (SEC) as an exhibit to its reports on Form N-PORT. The most recent list of portfolio holdings is available at invesco.com/completeqtrholdings. Shareholders can also look up the Fund’s Form N-PORT filings on the SEC website, sec.gov. The SEC file numbers for the Fund are shown below.
A description of the policies and procedures that the Fund uses to determine how to vote proxies relating to portfolio securities is available without charge, upon request, from our Client Services department at 800 959 4246, or at invesco.com/ corporate/about-us/esg. The information is also available on the SEC website, sec.gov.
| | |
Information regarding how the Fund voted proxies related to its portfolio securities during the most recent 12-month period ended June 30 is available at invesco.com/proxysearch. This information is also available on the SEC website, sec.gov. | | 
|
Invesco Advisers, Inc. is an investment adviser; it provides investment advisory services to individual and institutional clients and does not sell securities. Invesco Distributors, Inc. is the US distributor for Invesco Ltd.’s retail mutual funds, exchange-traded funds and institutional money market funds. Both are wholly owned, indirect subsidiaries of Invesco Ltd. |
| | | | |
SEC file numbers: 811-03826 and 002-85905 | | Invesco Distributors, Inc. | | O-VAL-AR-1 |
| | | | |
| | |
 | | Annual Report to Shareholders | | April 30, 2021 |
| | |
| | Invesco Dividend Income Fund |
| | Nasdaq: | | |
| | A: IAUTX ∎ C: IUTCX ∎ R: IRTCX ∎ Y: IAUYX ∎ Investor: FSTUX ∎ R5: FSIUX ∎ R6: IFUTX |

Management’s Discussion of Fund Performance
| | | | |
Performance summary | |
For the fiscal year ended April 30, 2021, Class A shares of Invesco Dividend Income Fund (the Fund), at net asset value (NAV), underperformed the Dow Jones U.S. Select Dividend Index, the Fund’s style-specific benchmark. Your Fund’s long-term performance appears later in this report. | |
Fund vs. Indexes Total returns, 4/30/20 to 4/30/21, at net asset value (NAV). Performance shown does not include applicable contingent deferred sales charges (CDSC) or front-end sales charges, which would have reduced performance. | |
Class A Shares | | | 30.23 | % |
Class C Shares | | | 29.29 | |
Class R Shares | | | 29.89 | |
Class Y Shares | | | 30.55 | |
Investor Class Shares | | | 30.25 | |
Class R5 Shares | | | 30.66 | |
Class R6 Shares | | | 30.75 | |
S&P 500 Index▼ (Broad Market Index) | | | 45.98 | |
Dow Jones U.S. Select Dividend Index▼ (Style-Specific Index) | | | 53.35 | |
Russell 1000 Value Index▼ (Style-Specific Index) | | | 45.92 | |
Lipper Equity Income Funds Index∎ (Peer Group Index) | | | 39.41 | |
| |
Source(s): ▼RIMES Technologies Corp.; ∎Lipper Inc. | | | | |
Market conditions and your Fund
As many businesses began to shut down in April 2020 due to the pandemic, US unemployment numbers continued to climb, and the economy ground to a halt. However, during the second and into the third quarter of 2020, US stocks largely shrugged off economic uncertainty, social unrest and a resurgence in coronavirus infections to rally from the market bottom. Investor sentiment improved in response to trillions of dollars in economic stimulus, progress on a coronavirus vaccine and re-openings in many US regions.
Despite a September selloff, US equity markets posted gains in the third quarter as the US Federal Reserve (the Fed) extended its emergency stimulus programs and changed its inflation target policy, both of which supported equities. Data for both manufacturing and services indicated expansion, a reversal from significant declines earlier in the year. Corporate earnings were also better than anticipated and a gradual decline in new COVID-19 infections in many regions, combined with optimism about progress on a coronavirus vaccine, further boosted stocks.
US equity markets posted gains in the fourth quarter, as positive news on COVID-19 vaccines and strong corporate earnings outweighed investor concerns about the political disagreement over a fiscal stimulus package and sharply rising coronavirus infections nationwide. Cyclical sectors like energy and financials led the way, while real estate and consumer staples lagged. Market leadership also shifted during the quarter with value stocks outperforming growth for the first time since the fourth quarter of 2016. While the US economy rebounded significantly since the pandemic began, the recovery appeared to slow in the fourth quarter with employment
gains and gross domestic product (GDP) growth down from the third quarter. However, stocks were buoyed by the Fed’s pledge to maintain its accommodative stance and asset purchases, “until substantial further progress has been made” toward employment and inflation targets.
US political unrest and rising COVID-19 infection rates marked the start of the first quarter of 2021. Additionally, retail investors bid up select stocks like GameStop and AMC Theaters, ultimately causing a sharp selloff in late January. Corporate earnings generally beat expectations, but market volatility rose during the quarter as investors worried about rising bond yields and inflation. Despite the Federal Reserve’s commitment to an accommodative policy, the 10-year US Treasury yield rose from 0.92% at year-end to 1.63%1 at the fiscal year-end. Approval of a third COVID-19 vaccine boosted investors’ optimism for faster economic recovery. Although March saw increased volatility with consecutive down days in the US stock market, stocks continued to hit all-time highs through April. US stocks had strong returns, with the S&P 500 Index returning 45.98% for the fiscal year.2 All major US equity indexes posted large gains for the fiscal year with large-cap growth indexes outperforming large-cap value. Within the S&P 500 Index, financials, materials and industrials were the best-performing sectors for the fiscal year, while utilities and consumer staples were the worst-performing sectors.
During the fiscal year, our management discipline remained unchanged. The Fund continued to prioritize current income and long-term growth of capital by investing in above-market-yielding stocks that may help investors earn income, preserve assets and
build capital. We believe that dividend-paying stocks may provide a conservative foundation for investors’ portfolios, and we seek to enhance the value of dividend investing by identifying above-market-yielding stocks with consistent and defensible dividends. Through fundamental research, we measure the strength and sustainability of a company’s dividend by analyzing its free cash flow potential over the next two to three years. We construct a portfolio that we believe provides above-average dividend income and the potential to build capital over the long term. We seek to manage portfolio risk utilizing careful stock selection, maintaining exposure to multiple sectors and employing a rigorous buy-and-sell discipline.
Holdings in the financials and consumer discretionary sectors made the largest positive contributions to overall fund performance during the fiscal year. Discount store Target was the largest contributor to Fund performance. Target benefited from higher customer spending across its key categories, which improved market share and expanded profitability. As a result of its stronger cash flows, the company announced increases to both the dividend growth rate and the level of share buybacks. Regional bank Regions Financial was also a large contributor to overall performance. Shares of Regions Financial outperformed after reporting better than expected earnings driven by strength in the company’s capital markets business.
Only a few fund holdings posted declines during the fiscal year. Health care companies GlaxoSmithKline and Merck posted small losses and were among the largest detractors from the overall performance. Shares of GlaxoSmithKline underperformed as COVID-19 led to disruptions in their vaccines business, which negatively impacted 2020 results and is expected to impact earnings per share in 2021. Despite these disruptions, the company still reported strong sales performance from key growth drivers in HIV, respiratory, oncology and consumer health care. Merck posted weaker than expected quarterly earnings toward the end of the fiscal year mainly due to pricing headwinds, product mix shifts and inventory write-downs. We expect the company to continue to benefit from its early entry into oncology, strong positions in HIV and immunology, and vaccine growth as the economy reopens.
Within the Dow Jones U.S. Select Dividend Index, the communication services, financials, and materials sectors were the best-performing sectors during the fiscal year, while the health care, utilities and consumer staples sectors posted the smallest gains. The Fund’s underweight position in utilities was the largest contributor to relative performance for the fiscal year. The Fund’s overweight position in consumer staples was the largest detractor from the Fund’s performance versus the Dow Jones U.S. Select Dividend Index. The Fund’s underweight position
2 Invesco Dividend Income Fund
combined with stock selection in the communication services sector also detracted significantly from the Fund’s relative results along with an overweight position in health care and underweight in financials.
Toward the end of the fiscal year, former lead portfolio manager Meggan Walsh announced her intent to retire from Invesco and the industry. Effective March 24, 2021, Peter Santoro joined Invesco as a lead portfolio manager on the Invesco Dividend Income Fund alongside Meggan Walsh and the current team. Peter will work with Meggan to ensure a smooth and successful transition with the team until June 30, 2021, when Meggan will be removed from the Fund as a portfolio manager.
Mr. Santoro comes to Invesco from Colum-bia Threadneedle Investments where he was a senior portfolio manager. We believe Mr. San-toro is well positioned to assume the lead portfolio manager role for the Dividend Value Team given his 25 years of experience in the industry and his experience in managing dividend-focused strategies.
The investment objective of the Fund will remain the same, but we will see enhancements to the investment process over time. As lead portfolio manager, Mr. Santoro will focus on maintaining the success of the team by employing the same basic tenets of the process.
It has been our privilege to manage Invesco Dividend Income Fund, and we thank you for your investment.
1 Source: Bloomberg L.P.
2 Source: Lipper Inc.
Portfolio manager(s):
Robert Botard
Caroline Le Feuvre
Chris McMeans
Peter Santoro - Lead
Meggan Walsh (As of 6/30/21 Ms. Walsh will no longer serve as a portfolio manager.)
The views and opinions expressed in management’s discussion of Fund performance are those of Invesco Advisers, Inc. These views and opinions are subject to change at any time based on factors such as market and economic conditions. These views and opinions may not be relied upon as investment advice or recommendations, or as an offer for a particular security. The information is not a complete analysis of every aspect of any market, country, industry, security or the Fund. Statements of fact are from sources considered reliable, but Invesco Advisers, Inc. makes no representation or warranty as to their completeness or accuracy. Although historical performance is no guarantee of future results, these insights may help you understand our investment management philosophy.
See important Fund and, if applicable, index disclosures later in this report.
3 Invesco Dividend Income Fund
Your Fund’s Long-Term Performance
Results of a $10,000 Investment – Oldest Share Class(es)
Fund and index data from 4/30/11
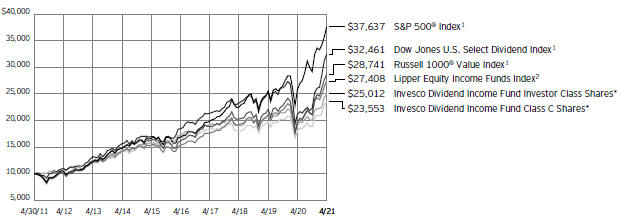
| 1 | Source: RIMES Technologies Corp. |
| * | It is Invesco’s policy to chart the Fund’s oldest share class(es). Because Investor Class shares do not have a sales charge, we also show the oldest share class with a sales charge, Class C shares. |
Past performance cannot guarantee future results.
The data shown in the chart include reinvested distributions, applicable sales charges and Fund expenses including management
fees. Index results include reinvested dividends, but they do not reflect sales charges. Performance of the peer group, if applicable, reflects fund expenses and management fees;
performance of a market index does not. Performance shown in the chart does not reflect deduction of taxes a shareholder would pay on Fund distributions or sale of Fund shares.
4 Invesco Dividend Income Fund
| | | | |
| Average Annual Total Returns | |
| As of 4/30/21, including maximum applicable sales charges | |
| |
| Class A Shares | | | | |
| Inception (3/28/02) | | | 8.17 | % |
| 10 Years | | | 8.98 | |
5 Years | | | 6.38 | |
1 Year | | | 23.06 | |
| |
| Class C Shares | | | | |
| Inception (2/14/00) | | | 4.57 | % |
| 10 Years | | | 8.94 | |
5 Years | | | 6.78 | |
1 Year | | | 28.29 | |
| |
| Class R Shares | | | | |
| 10 Years | | | 9.33 | % |
5 Years | | | 7.33 | |
1 Year | | | 29.89 | |
| |
| Class Y Shares | | | | |
| Inception (10/3/08) | | | 9.43 | % |
| 10 Years | | | 9.88 | |
5 Years | | | 7.85 | |
1 Year | | | 30.55 | |
| |
| Investor Class Shares | | | | |
| Inception (6/2/86) | | | 8.52 | % |
| 10 Years | | | 9.60 | |
5 Years | | | 7.59 | |
1 Year | | | 30.25 | |
| |
| Class R5 Shares | | | | |
| Inception (10/25/05) | | | 8.60 | % |
| 10 Years | | | 9.95 | |
5 Years | | | 7.91 | |
1 Year | | | 30.66 | |
| |
| Class R6 Shares | | | | |
| 10 Years | | | 9.94 | % |
5 Years | | | 8.00 | |
1 Year | | | 30.75 | |
Class R shares incepted on April 17, 2020. Performance shown prior to that date is that of Investor Class shares restated to reflect the higher 12b-1 fees applicable to Class R shares.
Class R6 shares incepted on September 24, 2012. Performance shown prior to that date is that of Investor Class shares at net asset value and includes the 12b-1 fees applicable to Investor Class shares.
The performance data quoted represent past performance and cannot guarantee future results; current performance may be lower or higher. Please visit invesco.com/performance for the most recent month-end performance. Performance figures reflect reinvested distributions, changes in net asset value and the effect of the maximum sales charge unless otherwise stated. Performance figures do not reflect deduction of taxes a shareholder would pay on Fund distributions or sale of Fund shares. Investment return and principal value will fluctuate so that you may have a gain or loss when you sell shares.
Class A share performance reflects the maximum 5.50% sales charge, and Class C share performance reflects the applicable
contingent deferred sales charge (CDSC) for the period involved. The CDSC on Class C shares is 1% for the first year after purchase. Class R, Class Y, Investor Class, Class R5 and Class R6 shares do not have a front-end sales charge or a CDSC; therefore, performance is at net asset value.
The performance of the Fund’s share classes will differ primarily due to different sales charge structures and class expenses.
Fund performance reflects any applicable fee waivers and/or expense reimbursements. Had the adviser not waived fees and/or reimbursed expenses currently or in the past, returns would have been lower. See current prospectus for more information.
5 Invesco Dividend Income Fund
Supplemental Information
Invesco Dividend Income Fund’s investment objective is current income and long-term growth of capital.
| ∎ | | Unless otherwise stated, information presented in this report is as of April 30, 2021, and is based on total net assets. |
| ∎ | | Unless otherwise noted, all data is provided by Invesco. |
| ∎ | | To access your Fund’s reports/prospectus, visit invesco.com/fundreports. |
About indexes used in this report
| ∎ | | The S&P 500® Index is an unmanaged index considered representative of the US stock market. |
| ∎ | | The Dow Jones U.S. Select Dividend™ Index represents the country’s leading stocks by dividend yield. |
| ∎ | | The Russell 1000® Value Index is an unmanaged index considered representative of large-cap value stocks. The Russell 1000 Value Index is a trademark/service mark of the Frank Russell Co. Russell® is a trademark of the Frank Russell Co. |
| ∎ | | The Lipper Equity Income Funds Index is an unmanaged index considered representative of equity income funds tracked by Lipper. |
| ∎ | | The Fund is not managed to track the performance of any particular index, including the index(es) described here, and consequently, the performance of the Fund may deviate significantly from the performance of the index(es). |
| ∎ | | A direct investment cannot be made in an index. Unless otherwise indicated, index results include reinvested dividends, and they do not reflect sales charges. Performance of the peer group, if applicable, reflects fund expenses; performance of a market index does not. |
Liquidity Risk Management Program
In compliance with Rule 22e-4 under the Investment Company Act of 1940, as amended (the “Liquidity Rule”), the Fund has adopted and implemented a liquidity risk management program in accordance with the Liquidity Rule (the “Program”). The Program is reasonably designed to assess and manage the Fund’s liquidity risk, which is the risk that the Fund could not meet redemption requests without significant dilution of remaining investors’ interests in the Fund. The Board of Trustees of the Fund (the “Board”) has appointed Invesco Advisers, Inc. (“Invesco”), the Fund’s investment adviser, as the Program’s administrator, and Invesco has delegated oversight of the Program to the Liquidity Risk Management Committee (the “Committee”), which is composed of senior representatives from relevant business groups at Invesco.
As required by the Liquidity Rule, the Program includes policies and procedures providing for an assessment, no less frequently than annually, of the Fund’s liquidity risk that takes into account, as relevant to the Fund’s liquidity risk: (1) the Fund’s investment strategy and liquidity of portfolio investments during both normal and reasonably foreseeable stressed conditions; (2) short-term and long-term cash flow projections for the Fund during both normal and reasonably foreseeable stressed conditions; and (3) the Fund’s holdings of cash and cash equivalents and any borrowing arrangements. The Liquidity Rule also requires the classification of the Fund’s investments into categories that reflect the assessment of their relative liquidity under current market conditions. The Fund classifies its investments into one of four categories defined in the Liquidity Rule: “Highly Liquid,” “Moderately Liquid,” “Less Liquid,” and “Illiquid.” Funds that are not invested primarily in “Highly Liquid Investments” that are assets (cash or investments that are reasonably expected to be convertible into cash within three business days without significantly changing the market value of the investment) are required to establish a “Highly Liquid Investment Minimum” (“HLIM”), which is the minimum percentage of net assets that must be invested in Highly Liquid Investments. Funds with HLIMs have procedures for addressing HLIM shortfalls, including reporting to the Board and the SEC (on a non-public basis) as required by the Program and the Liquidity Rule. In addition, the Fund may not acquire an investment if, immediately after the acquisition, over 15% of the Fund’s net assets would consist of “Illiquid Investments” that are assets (an investment that cannot reasonably be expected to be sold or disposed of in current market conditions in seven calendar days or less without the sale or disposition significantly changing the market value of the investment). The Liquidity Rule and the Program also require reporting to the Board and the SEC (on a non-public basis) if a Fund’s holdings of Illiquid Investments exceed 15% of the Fund’s assets.
At a meeting held on March 22-24, 2021, the Committee presented a report to the
Board that addressed the operation of the Program and assessed the Program’s adequacy and effectiveness of implementation (the “Report”). The Report covered the period from January 1, 2020 through December 31, 2020 (the “Program Reporting Period”). The Report discussed notable events affecting liquidity over the Program Reporting Period, including the impact of the coronavirus pandemic on the Fund and the overall market. The Report noted that there were no material changes to the Program during the Program Reporting Period.
The Report stated, in relevant part, that during the Program Reporting Period:
| ∎ | | The Program, as adopted and implemented, remained reasonably designed to assess and manage the Fund’s liquidity risk and was operated effectively to achieve that goal; |
| ∎ | | The Fund’s investment strategy remained appropriate for an open-end fund; |
| ∎ | | The Fund was able to meet requests for redemption without significant dilution of remaining investors’ interests in the Fund; |
| ∎ | | The Fund did not breach the 15% limit on Illiquid Investments; and |
| ∎ | | The Fund primarily held Highly Liquid Investments and therefore has not adopted an HLIM. |
|
This report must be accompanied or preceded by a currently effective Fund prospectus, which contains more complete information, including sales charges and expenses. Investors should read it carefully before investing. |
NOT FDIC INSURED | MAY LOSE VALUE | NO BANK GUARANTEE |
6 Invesco Dividend Income Fund
Fund Information
Portfolio Composition
| | | | | |
| By sector | | % of total net assets |
| |
Consumer Staples | | | | 18.41 | % |
Financials | | | | 15.54 | |
Utilities | | | | 14.11 | |
Industrials | | | | 9.97 | |
Health Care | | | | 9.28 | |
Consumer Discretionary | | | | 8.95 | |
Energy | | | | 5.12 | |
Communication Services | | | | 4.34 | |
Materials | | | | 3.86 | |
Information Technology | | | | 3.09 | |
Real Estate | | | | 2.74 | |
Money Market Funds Plus Other Assets Less Liabilities | | | | 4.59 | |
Top 10 Equity Holdings* | | | | | |
| | | % of total net assets |
| |
1. Johnson & Johnson | | | | 3.05 | % |
2. Procter & Gamble Co. (The) | | | | 2.60 | |
3. General Mills, Inc. | | | | 2.58 | |
4. M&T Bank Corp. | | | | 2.57 | |
5. Target Corp. | | | | 2.44 | |
6. Bank of America Corp. | | | | 2.37 | |
7. Lockheed Martin Corp. | | | | 2.37 | |
8. Campbell Soup Co. | | | | 2.35 | |
9. Dominion Energy, Inc. | | | | 2.35 | |
10. Molson Coors Beverage Co., Class B | | | | 2.28 | |
The Fund’s holdings are subject to change, and there is no assurance that the Fund will continue to hold any particular security.
* Excluding money market fund holdings, if any.
Data presented here are as of April 30, 2021.
7 Invesco Dividend Income Fund
Schedule of Investments(a)
April 30, 2021
| | | | | | |
| | | Shares | | | Value |
Common Stocks & Other Equity Interests–95.40% |
Aerospace & Defense–3.15% |
General Dynamics Corp. | | | 163,887 | | | $ 31,176,224 |
Lockheed Martin Corp. | | | 247,367 | | | 94,137,986 |
| | | | | | | 125,314,210 |
|
| Asset Management & Custody Banks–0.50% |
Waddell & Reed Financial, Inc., Class A | | | 791,905 | | | 19,781,787 |
|
| Automobile Manufacturers–1.35% |
Bayerische Motoren Werke AG (Germany) | | | 536,790 | | | 53,804,787 |
| | |
| Brewers–2.28% | | | | | | |
Molson Coors Beverage Co., Class B(b) | | | 1,654,801 | | | 90,931,315 |
|
| Communications Equipment–1.04% |
Cisco Systems, Inc. | | | 812,315 | | | 41,354,957 |
|
| Construction Machinery & Heavy Trucks–1.09% |
Caterpillar, Inc. | | | 190,831 | | | 43,530,459 |
| | |
| Diversified Banks–2.37% | | | | | | |
Bank of America Corp. | | | 2,325,150 | | | 94,238,329 |
| | |
| Electric Utilities–5.52% | | | | | | |
Duke Energy Corp. | | | 487,942 | | | 49,130,880 |
Entergy Corp. | | | 335,914 | | | 36,712,041 |
Exelon Corp. | | | 939,005 | | | 42,198,885 |
Pinnacle West Capital Corp. | | | 395,461 | | | 33,475,774 |
Portland General Electric Co. | | | 1,142,725 | | | 58,118,993 |
| | | | | | | 219,636,573 |
|
| Electrical Components & Equipment–3.12% |
ABB Ltd. (Switzerland) | | | 1,942,794 | | | 63,068,337 |
Emerson Electric Co. | | | 675,916 | | | 61,163,639 |
| | | | | | | 124,231,976 |
| | |
| Food Distributors–1.00% | | | | | | |
Sysco Corp. | | | 470,205 | | | 39,840,470 |
| | |
| Gas Utilities–3.15% | | | | | | |
National Fuel Gas Co. | | | 1,608,470 | | | 79,876,620 |
Southwest Gas Holdings, Inc. | | | 653,293 | | | 45,547,588 |
| | | | | | | 125,424,208 |
| |
| General Merchandise Stores–2.44% | | | |
Target Corp. | | | 467,941 | | | 96,985,452 |
| | |
| Health Care Equipment–0.95% | | | | | | |
Medtronic PLC | | | 287,531 | | | 37,643,558 |
| |
| Home Improvement Retail–1.48% | | | |
Lowe’s Cos., Inc. | | | 299,813 | | | 58,838,301 |
| | |
| Household Products–2.60% | | | | | | |
Procter & Gamble Co. (The) | | | 774,747 | | | 103,366,745 |
| |
| Hypermarkets & Super Centers–1.08% | | | |
Walmart, Inc. | | | 306,039 | | | 42,817,916 |
| | | | | | |
| | | Shares | | | Value |
Industrial Machinery–2.61% | | | | | | |
Kennametal, Inc. | | | 1,220,047 | | | $ 48,997,087 |
Snap-on, Inc. | | | 231,275 | | | 54,950,940 |
| | | | | | | 103,948,027 |
| | |
| Integrated Oil & Gas–3.68% | | | | | | |
Chevron Corp. | | | 354,308 | | | 36,518,526 |
Exxon Mobil Corp. | | | 630,581 | | | 36,094,456 |
TOTAL SE (France)(c) | | | 1,671,803 | | | 74,015,546 |
| | | | | | | 146,628,528 |
|
| Integrated Telecommunication Services–4.34% |
AT&T, Inc. | | | 2,130,444 | | | 66,917,246 |
Deutsche Telekom AG (Germany) | | | 1,430,635 | | | 27,555,270 |
Verizon Communications, Inc. | | | 1,356,547 | | | 78,394,851 |
| | | | | | | 172,867,367 |
| |
| IT Consulting & Other Services–1.49% | | | |
International Business Machines Corp. | | | 418,616 | | | 59,393,238 |
| | |
| Motorcycle Manufacturers–1.53% | | | | | | |
Harley-Davidson, Inc. | | | 1,258,211 | | | 60,859,666 |
| | |
| Multi-line Insurance–1.46% | | | | | | |
Hartford Financial Services Group, Inc. (The) | | | 882,070 | | | 58,181,337 |
| | |
| Multi-Utilities–5.44% | | | | | | |
Dominion Energy, Inc. | | | 1,168,978 | | | 93,401,342 |
National Grid PLC (United Kingdom) | | | 5,334,727 | | | 67,249,998 |
Public Service Enterprise Group, Inc. | | | 425,593 | | | 26,880,454 |
Sempra Energy | | | 210,369 | | | 28,940,463 |
| | | | | | | 216,472,257 |
| |
| Oil & Gas Storage & Transportation–1.43% | | | |
Enbridge, Inc. (Canada) | | | 1,480,307 | | | 57,097,470 |
| | |
| Packaged Foods & Meats–9.21% | | | | | | |
Campbell Soup Co. | | | 1,958,425 | | | 93,514,794 |
Conagra Brands, Inc. | | | 1,115,069 | | | 41,357,909 |
General Mills, Inc. | | | 1,689,036 | | | 102,794,730 |
Kraft Heinz Co. (The) | | | 1,588,058 | | | 65,570,915 |
Nestle S.A. (Switzerland) | | | 531,085 | | | 63,314,652 |
| | | | | | | 366,553,000 |
| | |
| Paper Packaging–2.20% | | | | | | |
International Paper Co. | | | 757,543 | | | 43,937,494 |
Sonoco Products Co. | | | 668,260 | | | 43,744,300 |
| | | | | | | 87,681,794 |
| | |
| Pharmaceuticals–8.34% | | | | | | |
AstraZeneca PLC (United Kingdom) | | | 249,868 | | | 26,619,813 |
Bayer AG (Germany) | | | 530,497 | | | 34,317,198 |
Eli Lilly and Co. | | | 278,610 | | | 50,921,550 |
GlaxoSmithKline PLC (United Kingdom) | | | 2,060,684 | | | 38,116,633 |
Johnson & Johnson | | | 745,397 | | | 121,298,454 |
Merck & Co., Inc. | | | 814,813 | | | 60,703,569 |
| | | | | | | 331,977,217 |
See accompanying Notes to Financial Statements which are an integral part of the financial statements.
8 Invesco Dividend Income Fund
| | | | | | | | |
| | | Shares | | | Value | |
Property & Casualty Insurance–3.28% | | | | | |
Chubb Ltd. | | | 374,968 | | | $ | 64,340,759 | |
Travelers Cos., Inc. (The) | | | 428,525 | | | | 66,275,677 | |
| | | | | | | | 130,616,436 | |
| | |
| Regional Banks–7.94% | | | | | | | | |
Cullen/Frost Bankers, Inc. | | | 484,091 | | | | 58,119,965 | |
Fifth Third Bancorp | | | 1,824,853 | | | | 73,979,541 | |
M&T Bank Corp. | | | 647,314 | | | | 102,074,945 | |
Regions Financial Corp. | | | 3,747,691 | | | | 81,699,664 | |
| | | | | | | | 315,874,115 | |
| | |
| Restaurants–2.16% | | | | | | | | |
McDonald’s Corp. | | | 363,912 | | | | 85,912,345 | |
| | |
| Semiconductors–0.55% | | | | | | | | |
Microchip Technology, Inc. | | | 147,013 | | | | 22,094,584 | |
| | |
| Soft Drinks–2.23% | | | | | | | | |
Coca-Cola Co. (The) | | | 1,642,789 | | | | 88,677,750 | |
| | |
| Specialized REITs–2.74% | | | | | | | | |
Crown Castle International Corp. | | | 324,541 | | | | 61,357,722 | |
Weyerhaeuser Co. | | | 1,233,317 | | | | 47,815,700 | |
| | | | | | | | 109,173,422 | |
| | |
| Specialty Chemicals–1.65% | | | | | | | | |
DuPont de Nemours, Inc. | | | 853,450 | | | | 65,809,529 | |
Total Common Stocks & Other Equity Interests
(Cost $2,786,105,694) | | | | 3,797,559,125 | |
| | |
| | | Principal
Amount | | | | |
U.S. Dollar Denominated Bonds & Notes–0.01% | |
Tobacco–0.01% | | | | | | | | |
Reynolds American, Inc. (United Kingdom), 7.00%, 08/04/2041
(Cost $358,554)(d) | | $ | 354,000 | | | | 458,087 | |
| | | | | | | | |
| | | Shares | | | Value | |
| |
Money Market Funds–4.44% | |
Invesco Government & Agency Portfolio, Institutional Class, 0.03%(e)(f) | | | 53,858,374 | | | | $ 53,858,374 | |
| |
Invesco Liquid Assets Portfolio, Institutional Class, 0.01%(e)(f) | | | 61,328,831 | | | | 61,353,363 | |
| |
Invesco Treasury Portfolio, Institutional Class, 0.01%(e)(f) | | | 61,552,428 | | | | 61,552,428 | |
| |
Total Money Market Funds
(Cost $176,751,140) | | | | 176,764,165 | |
| |
TOTAL INVESTMENTS IN SECURITIES (excluding investments purchased with cash collateral from securities on loan)-99.85%
(Cost $2,963,215,388) | | | | | | | 3,974,781,377 | |
| |
|
Investments Purchased with Cash Collateral from Securities on Loan | |
Money Market Funds–1.96% | | | | | | | | |
Invesco Private Government Fund, 0.01%(e)(f)(g) | | | 31,145,400 | | | | 31,145,400 | |
| |
Invesco Private Prime Fund, 0.11%(e)(f)(g) | | | 46,699,420 | | | | 46,718,100 | |
| |
Total Investments Purchased with Cash Collateral from Securities on Loan
(Cost $77,863,500) | | | | 77,863,500 | |
| |
TOTAL INVESTMENTS IN SECURITIES–101.81%
(Cost $3,041,078,888) | | | | 4,052,644,877 | |
| |
OTHER ASSETS LESS LIABILITIES–(1.81)% | | | | (72,169,527 | ) |
| |
NET ASSETS–100.00% | | | | $3,980,475,350 | |
| |
Investment Abbreviations:
REIT – Real Estate Investment Trust
Notes to Schedule of Investments:
| (a) | Industry and/or sector classifications used in this report are generally according to the Global Industry Classification Standard, which was developed by and is the exclusive property and a service mark of MSCI Inc. and Standard & Poor’s. |
| (b) | Non-income producing security. |
| (c) | All or a portion of this security was out on loan at April 30, 2021. |
| (d) | Security purchased or received in a transaction exempt from registration under the Securities Act of 1933, as amended (the “1933 Act”). The security may be resold pursuant to an exemption from registration under the 1933 Act, typically to qualified institutional buyers. The value of this security at April 30, 2021 represented less than 1% of the Fund’s Net Assets. |
| (e) | Affiliated issuer. The issuer and/or the Fund is a wholly-owned subsidiary of Invesco Ltd., or is affiliated by having an investment adviser that is under common control of Invesco Ltd. The table below shows the Fund’s transactions in, and earnings from, its investments in affiliates for the fiscal year ended April 30, 2021. |
| | | | | | | | | | | | | | | | | | | | | | | | | | | | | | | | | | | |
| | | Value
April 30, 2020 | | Purchases
at Cost | | Proceeds
from Sales | | Change in
Unrealized
Appreciation
(Depreciation) | | Realized
Gain | | Value
April 30, 2021 | | Dividend Income |
| Investments in Affiliated Money Market Funds: | | | | | | | | | | | | | | | | | | | | | | | | | | | | | | | | | | | |
Invesco Government & Agency Portfolio, Institutional Class | | | $ | 113,108,843 | | | | $ | 90,173,983 | | | | $ | (149,424,452 | ) | | | $ | - | | | | $ | - | | | | $ | 53,858,374 | | | | $ | 30,673 | |
Invesco Liquid Assets Portfolio, Institutional Class | | | | 103,684,370 | | | | | 64,409,988 | | | | | (106,731,751 | ) | | | | (30,283 | ) | | | | 21,039 | | | | | 61,353,363 | | | | | 107,132 | |
Invesco Treasury Portfolio, Institutional Class | | | | 129,267,249 | | | | | 103,055,981 | | | | | (170,770,802 | ) | | | | - | | | | | - | | | | | 61,552,428 | | | | | 27,323 | |
See accompanying Notes to Financial Statements which are an integral part of the financial statements.
9 Invesco Dividend Income Fund
| | | | | | | | | | | | | | | | | | | | | | | | | | | | | | | | | | | |
| | | Value
April 30, 2020 | | Purchases
at Cost | | Proceeds
from Sales | | Change in
Unrealized
Appreciation
(Depreciation) | | Realized
Gain | | Value
April 30, 2021 | | Dividend Income |
| Investments Purchased with Cash Collateral from Securities on Loan: | | | | | | | | | | | | | | | | | | | | | | | | | | | | | | | | | | | |
Invesco Private Government Fund | | | $ | - | | | | $ | 163,835,942 | | | | $ | (132,690,542 | ) | | | $ | - | | | | $ | - | | | | $ | 31,145,400 | | | | $ | 1,915 | * |
Invesco Private Prime Fund | | | | - | | | | | 187,358,343 | | | | | (140,644,827 | ) | | | | - | | | | | 4,584 | | | | | 46,718,100 | | | | | 11,539 | * |
Total | | | $ | 346,060,462 | | | | $ | 608,834,237 | | | | $ | (700,262,374 | ) | | | $ | (30,283 | ) | | | $ | 25,623 | | | | $ | 254,627,665 | | | | $ | 178,582 | |
| | * | Represents the income earned on the investment of cash collateral, which is included in securities lending income on the Statement of Operations. Does not include rebates and fees paid to lending agent or premiums received from borrowers, if any. |
| (f) | The rate shown is the 7-day SEC standardized yield as of April 30, 2021. |
| (g) | The security has been segregated to satisfy the commitment to return the cash collateral received in securities lending transactions upon the borrower’s return of the securities loaned. See Note 1I. |
See accompanying Notes to Financial Statements which are an integral part of the financial statements.
10 Invesco Dividend Income Fund
Statement of Assets and Liabilities
April 30, 2021
| | | | |
Assets: | | | | |
Investments in securities, at value
(Cost $2,786,464,248)* | | $ | 3,798,017,212 | |
Investments in affiliated money market funds, at value (Cost $254,614,640) | | | 254,627,665 | |
Foreign currencies, at value
(Cost $2,636,797) | | | 2,635,355 | |
Receivable for: | | | | |
Fund shares sold | | | 1,283,875 | |
| |
Dividends | | | 8,617,401 | |
| |
Interest | | | 5,930 | |
| |
Investment for trustee deferred compensation and retirement plans | | | 365,220 | |
Other assets | | | 84,349 | |
Total assets | | | 4,065,637,007 | |
| |
Liabilities: | | | | |
Payable for: | | | | |
Fund shares reacquired | | | 2,605,612 | |
Amount due custodian | | | 1,694,002 | |
Collateral upon return of securities loaned | | | 77,863,500 | |
Accrued fees to affiliates | | | 1,907,772 | |
Accrued trustees’ and officers’ fees and benefits | | | 57,205 | |
Accrued other operating expenses | | | 583,553 | |
Trustee deferred compensation and retirement plans | | | 450,013 | |
Total liabilities | | | 85,161,657 | |
Net assets applicable to shares outstanding | | $ | 3,980,475,350 | |
| |
Net assets consist of: | | | | |
Shares of beneficial interest | | $ | 2,975,541,577 | |
Distributable earnings | | | 1,004,933,773 | |
| | | $ | 3,980,475,350 | |
| | | | |
Net Assets: | | | | |
Class A | | $ | 2,921,797,707 | |
Class C | | $ | 285,320,523 | |
Class R | | $ | 110,666,881 | |
Class Y | | $ | 344,754,910 | |
Investor Class | | $ | 73,628,084 | |
Class R5 | | $ | 2,337,262 | |
Class R6 | | $ | 241,969,983 | |
|
Shares outstanding, no par value, with an unlimited number of shares authorized: | |
Class A | | | 114,049,464 | |
Class C | | | 10,987,877 | |
Class R | | | 4,320,147 | |
Class Y | | | 13,314,602 | |
Investor Class | | | 2,843,872 | |
Class R5 | | | 91,190 | |
Class R6 | | | 9,433,142 | |
Class A: | | | | |
Net asset value per share | | $ | 25.62 | |
Maximum offering price per share
(Net asset value of $25.62 ÷ 94.50%) | | $ | 27.11 | |
Class C: | | | | |
Net asset value and offering price per share | | $ | 25.97 | |
| |
Class R: | | | | |
Net asset value and offering price per share | | $ | 25.62 | |
| |
Class Y: | | | | |
Net asset value and offering price per share | | $ | 25.89 | |
| |
Investor Class: | | | | |
Net asset value and offering price per share | | $ | 25.89 | |
| |
Class R5: | | | | |
Net asset value and offering price per share | | $ | 25.63 | |
| |
Class R6: | | | | |
Net asset value and offering price per share | | $ | 25.65 | |
| |
| * | At April 30, 2021, a security with a value of $74,143,606 was on loan to brokers. |
See accompanying Notes to Financial Statements which are an integral part of the financial statements.
11 Invesco Dividend Income Fund
Statement of Operations
For the year ended April 30, 2021
| | | | |
Investment income: | | | | |
Dividends (net of foreign withholding taxes of $2,168,185) | | $ | 112,923,723 | |
| |
Dividends from affiliated money market funds (includes securities lending income of $584,587) | | | 749,715 | |
| |
Interest | | | 25,570 | |
| |
Total investment income | | | 113,699,008 | |
| |
| |
Expenses: | | | | |
Advisory fees | | | 19,646,640 | |
| |
Administrative services fees | | | 529,590 | |
| |
Custodian fees | | | 34,034 | |
| |
Distribution fees: | | | | |
Class A | | | 6,289,542 | |
| |
Class C | | | 3,383,605 | |
| |
Class R | | | 512,218 | |
| |
Investor Class | | | 165,256 | |
| |
Transfer agent fees – A, C, R, Y and Investor Class | | | 5,889,437 | |
| |
Transfer agent fees – R5 | | | 2,296 | |
| |
Transfer agent fees – R6 | | | 35,676 | |
| |
Trustees’ and officers’ fees and benefits | | | 83,482 | |
| |
Registration and filing fees | | | 125,780 | |
| |
Reports to shareholders | | | 210,447 | |
| |
Professional services fees | | | 76,196 | |
| |
Other | | | 77,839 | |
| |
Total expenses | | | 37,062,038 | |
| |
Less: Fees waived, expenses reimbursed and/or expense offset arrangement(s) | | | (191,663 | ) |
| |
Net expenses | | | 36,870,375 | |
| |
Net investment income | | | 76,828,633 | |
| |
| |
Realized and unrealized gain (loss) from: | | | | |
Net realized gain from: | | | | |
Unaffiliated investment securities | | | 53,705,545 | |
| |
Affiliated investment securities | | | 25,623 | |
| |
Foreign currencies | | | 371,485 | |
| |
| | | 54,102,653 | |
| |
Change in net unrealized appreciation (depreciation) of: | | | | |
Unaffiliated investment securities | | | 855,252,761 | |
| |
Affiliated investment securities | | | (30,283 | ) |
| |
Foreign currencies | | | (38,902 | ) |
| |
| | | 855,183,576 | |
| |
Net realized and unrealized gain | | | 909,286,229 | |
| |
Net increase in net assets resulting from operations | | $ | 986,114,862 | |
| |
See accompanying Notes to Financial Statements which are an integral part of the financial statements.
12 Invesco Dividend Income Fund
Statement of Changes in Net Assets
For the years ended April 30, 2021 and 2020
| | | | | | | | |
| | | 2021 | | | 2020 | |
| |
Operations: | | | | | | | | |
Net investment income | | $ | 76,828,633 | | | $ | 33,781,292 | |
| |
Net realized gain (loss) | | | 54,102,653 | | | | (38,887,461 | ) |
| |
Change in net unrealized appreciation (depreciation) | | | 855,183,576 | | | | (113,179,834 | ) |
| |
Net increase (decrease) in net assets resulting from operations | | | 986,114,862 | | | | (118,286,003 | ) |
| |
| | |
Distributions to shareholders from distributable earnings: | | | | | | | | |
Class A | | | (57,908,866 | ) | | | (24,658,771 | ) |
| |
Class C | | | (5,002,175 | ) | | | (3,518,028 | ) |
| |
Class R | | | (1,985,230 | ) | | | — | |
| |
Class Y | | | (7,830,142 | ) | | | (7,988,218 | ) |
| |
Investor Class | | | (1,426,555 | ) | | | (2,502,018 | ) |
| |
Class R5 | | | (57,208 | ) | | | (91,517 | ) |
| |
Class R6 | | | (6,126,190 | ) | | | (9,185,465 | ) |
| |
Total distributions from distributable earnings | | | (80,336,366 | ) | | | (47,944,017 | ) |
| |
| | |
Share transactions–net: | | | | | | | | |
Class A | | | (233,960,731 | ) | | | 1,831,924,956 | |
| |
Class C | | | (179,352,772 | ) | | | 248,665,994 | |
| |
Class R | | | (12,010,480 | ) | | | 97,930,979 | |
| |
Class Y | | | (63,925,137 | ) | | | 105,989,387 | |
| |
Investor Class | | | (4,944,485 | ) | | | (5,694,878 | ) |
| |
Class R5 | | | (384,304 | ) | | | 541,771 | |
| |
Class R6 | | | (61,054,215 | ) | | | 21,058,742 | |
| |
Net increase (decrease) in net assets resulting from share transactions | | | (555,632,124 | ) | | | 2,300,416,951 | |
| |
Net increase in net assets | | | 350,146,372 | | | | 2,134,186,931 | |
| |
| | |
Net assets: | | | | | | | | |
Beginning of year | | | 3,630,328,978 | | | | 1,496,142,047 | |
| |
End of year | | $ | 3,980,475,350 | | | $ | 3,630,328,978 | |
| |
See accompanying Notes to Financial Statements which are an integral part of the financial statements.
13 Invesco Dividend Income Fund
Financial Highlights
The following schedule presents financial highlights for a share of the Fund outstanding throughout the periods indicated.
| | | | | | | | | | | | | | | | | | | | | | | | | | | | | | | | | | | | | | | | | | | | | | | | | | | | | | | | | | | | | | | | | | | | | | |
| | | | | | | | | | | | | | | | | | | | | | | Ratio of | | Ratio of | | | | |
| | | | | | | | | | | | | | | | | | | | | | | expenses | | expenses | | | | |
| | | | | | | Net gains | | | | | | | | | | | | | | | | to average | | to average net | | | | |
| | | | | | | (losses) | | | | | | | | | | | | | | | | net assets | | assets without | | Ratio of net | | |
| | | Net asset | | | | on securities | | | | Dividends | | Distributions | | | | | | | | | | with fee waivers | | fee waivers | | investment | | |
| | | value, | | Net | | (both | | Total from | | from net | | from net | | | | Net asset | | | | Net assets, | | and/or | | and/or | | income | | |
| | | beginning | | investment | | realized and | | investment | | investment | | realized | | Total | | value, end | | Total | | end of period | | expenses | | expenses | | to average | | Portfolio |
| | | of period | | income(a) | | unrealized) | | operations | | income | | gains | | distributions | | of period | | return (b) | | (000’s omitted) | | absorbed | | absorbed | | net assets | | turnover (c) |
Class A | |
Year ended 04/30/21 | | | $ | 20.11 | | | | $ | 0.47 | | | | $ | 5.53 | | | | $ | 6.00 | | | | $ | (0.49 | ) | | | $ | – | | | | $ | (0.49 | ) | | | $ | 25.62 | | | | | 30.23 | %(d) | | | $ | 2,921,798 | | | | | 0.97 | %(d)(e) | | | | 0.97 | %(d)(e) | | | | 2.10 | %(d)(e) | | | | 4 | % |
Year ended 04/30/20 | | | | 22.70 | | | | | 0.51 | | | | | (2.33 | ) | | | | (1.82 | ) | | | | (0.52 | ) | | | | (0.25 | ) | | | | (0.77 | ) | | | | 20.11 | | | | | (8.30 | ) | | | | 2,506,397 | | | | | 1.05 | | | | | 1.06 | | | | | 2.31 | | | | | 47 | |
Year ended 04/30/19 | | | | 22.98 | | | | | 0.58 | | | | | 1.45 | | | | | 2.03 | | | | | (0.60 | ) | | | | (1.71 | ) | | | | (2.31 | ) | | | | 22.70 | | | | | 9.51 | | | | | 764,037 | | | | | 1.06 | | | | | 1.06 | | | | | 2.54 | | | | | 4 | |
Year ended 04/30/18 | | | | 23.96 | | | | | 0.51 | | | | | (0.42 | ) | | | | 0.09 | | | | | (0.47 | ) | | | | (0.60 | ) | | | | (1.07 | ) | | | | 22.98 | | | | | 0.21 | | | | | 862,915 | | | | | 1.01 | | | | | 1.02 | | | | | 2.12 | | | | | 11 | |
Year ended 04/30/17 | | | | 22.32 | | | | | 0.41 | | | | | 1.80 | | | | | 2.21 | | | | | (0.41 | ) | | | | (0.16 | ) | | | | (0.57 | ) | | | | 23.96 | | | | | 10.00 | | | | | 1,143,946 | | | | | 1.03 | | | | | 1.05 | | | | | 1.74 | | | | | 6 | |
Class C | |
Year ended 04/30/21 | | | | 20.38 | | | | | 0.30 | | | | | 5.61 | | | | | 5.91 | | | | | (0.32 | ) | | | | – | | | | | (0.32 | ) | | | | 25.97 | | | | | 29.29 | | | | | 285,321 | | | | | 1.73 | (e) | | | | 1.73 | (e) | | | | 1.34 | (e) | | | | 4 | |
Year ended 04/30/20 | | | | 23.01 | | | | | 0.35 | | | | | (2.37 | ) | | | | (2.02 | ) | | | | (0.36 | ) | | | | (0.25 | ) | | | | (0.61 | ) | | | | 20.38 | | | | | (9.02 | ) | | | | 385,968 | | | | | 1.80 | | | | | 1.81 | | | | | 1.56 | | | | | 47 | |
Year ended 04/30/19 | | | | 23.28 | | | | | 0.42 | | | | | 1.46 | | | | | 1.88 | | | | | (0.44 | ) | | | | (1.71 | ) | | | | (2.15 | ) | | | | 23.01 | | | | | 8.65 | | | | | 152,988 | | | | | 1.81 | | | | | 1.81 | | | | | 1.79 | | | | | 4 | |
Year ended 04/30/18 | | | | 24.26 | | | | | 0.33 | | | | | (0.42 | ) | | | | (0.09 | ) | | | | (0.29 | ) | | | | (0.60 | ) | | | | (0.89 | ) | | | | 23.28 | | | | | (0.52 | ) | | | | 236,168 | | | | | 1.76 | | | | | 1.77 | | | | | 1.37 | | | | | 11 | |
Year ended 04/30/17 | | | | 22.60 | | | | | 0.24 | | | | | 1.82 | | | | | 2.06 | | | | | (0.24 | ) | | | | (0.16 | ) | | | | (0.40 | ) | | | | 24.26 | | | | | 9.16 | | | | | 311,194 | | | | | 1.78 | | | | | 1.80 | | | | | 0.99 | | | | | 6 | |
Class R | |
Year ended 04/30/21 | | | | 20.11 | | | | | 0.41 | | | | | 5.53 | | | | | 5.94 | | | | | (0.43 | ) | | | | – | | | | | (0.43 | ) | | | | 25.62 | | | | | 29.89 | | | | | 110,667 | | | | | 1.23 | (e) | | | | 1.23 | (e) | | | | 1.84 | (e) | | | | 4 | |
Period ended 04/30/20(f) | | | | 20.18 | | | | | 0.01 | | | | | (0.08 | ) | | | | (0.07 | ) | | | | – | | | | | – | | | | | – | | | | | 20.11 | | | | | (0.35 | ) | | | | 97,560 | | | | | 1.20 | (g) | | | | 1.21 | (g) | | | | 2.16 | (g) | | | | 47 | |
Class Y | |
Year ended 04/30/21 | | | | 20.32 | | | | | 0.52 | | | | | 5.59 | | | | | 6.11 | | | | | (0.54 | ) | | | | – | | | | | (0.54 | ) | | | | 25.89 | | | | | 30.55 | | | | | 344,755 | | | | | 0.73 | (e) | | | | 0.73 | (e) | | | | 2.34 | (e) | | | | 4 | |
Year ended 04/30/20 | | | | 22.94 | | | | | 0.57 | | | | | (2.36 | ) | | | | (1.79 | ) | | | | (0.58 | ) | | | | (0.25 | ) | | | | (0.83 | ) | | | | 20.32 | | | | | (8.09 | ) | | | | 330,421 | | | | | 0.81 | | | | | 0.82 | | | | | 2.55 | | | | | 47 | |
Year ended 04/30/19 | | | | 23.21 | | | | | 0.65 | | | | | 1.46 | | | | | 2.11 | | | | | (0.67 | ) | | | | (1.71 | ) | | | | (2.38 | ) | | | | 22.94 | | | | | 9.76 | | | | | 248,641 | | | | | 0.81 | | | | | 0.81 | | | | | 2.79 | | | | | 4 | |
Year ended 04/30/18 | | | | 24.19 | | | | | 0.58 | | | | | (0.43 | ) | | | | 0.15 | | | | | (0.53 | ) | | | | (0.60 | ) | | | | (1.13 | ) | | | | 23.21 | | | | | 0.48 | | | | | 444,633 | | | | | 0.76 | | | | | 0.77 | | | | | 2.37 | | | | | 11 | |
Year ended 04/30/17 | | | | 22.53 | | | | | 0.47 | | | | | 1.82 | | | | | 2.29 | | | | | (0.47 | ) | | | | (0.16 | ) | | | | (0.63 | ) | | | | 24.19 | | | | | 10.28 | | | | | 860,105 | | | | | 0.78 | | | | | 0.80 | | | | | 1.99 | | | | | 6 | |
Investor Class | |
Year ended 04/30/21 | | | | 20.31 | | | | | 0.47 | | | | | 5.59 | | | | | 6.06 | | | | | (0.48 | ) | | | | – | | | | | (0.48 | ) | | | | 25.89 | | | | | 30.25 | | | | | 73,628 | | | | | 0.98 | (e) | | | | 0.98 | (e) | | | | 2.09 | (e) | | | | 4 | |
Year ended 04/30/20 | | | | 22.93 | | | | | 0.52 | | | | | (2.37 | ) | | | | (1.85 | ) | | | | (0.52 | ) | | | | (0.25 | ) | | | | (0.77 | ) | | | | 20.31 | | | | | (8.32 | ) | | | | 62,298 | | | | | 1.06 | | | | | 1.07 | | | | | 2.30 | | | | | 47 | |
Year ended 04/30/19 | | | | 23.20 | | | | | 0.59 | | | | | 1.46 | | | | | 2.05 | | | | | (0.61 | ) | | | | (1.71 | ) | | | | (2.32 | ) | | | | 22.93 | | | | | 9.49 | | | | | 76,436 | | | | | 1.06 | | | | | 1.06 | | | | | 2.54 | | | | | 4 | |
Year ended 04/30/18 | | | | 24.18 | | | | | 0.51 | | | | | (0.42 | ) | | | | 0.09 | | | | | (0.47 | ) | | | | (0.60 | ) | | | | (1.07 | ) | | | | 23.20 | | | | | 0.23 | | | | | 79,103 | | | | | 1.01 | | | | | 1.02 | | | | | 2.12 | | | | | 11 | |
Year ended 04/30/17 | | | | 22.52 | | | | | 0.41 | | | | | 1.82 | | | | | 2.23 | | | | | (0.41 | ) | | | | (0.16 | ) | | | | (0.57 | ) | | | | 24.18 | | | | | 10.01 | | | | | 97,228 | | | | | 1.03 | | | | | 1.05 | | | | | 1.74 | | | | | 6 | |
Class R5 | |
Year ended 04/30/21 | | | | 20.11 | | | | | 0.53 | | | | | 5.54 | | | | | 6.07 | | | | | (0.55 | ) | | | | – | | | | | (0.55 | ) | | | | 25.63 | | | | | 30.66 | | | | | 2,337 | | | | | 0.66 | (e) | | | | 0.66 | (e) | | | | 2.41 | (e) | | | | 4 | |
Year ended 04/30/20 | | | | 22.71 | | | | | 0.58 | | | | | (2.34 | ) | | | | (1.76 | ) | | | | (0.59 | ) | | | | (0.25 | ) | | | | (0.84 | ) | | | | 20.11 | | | | | (8.05 | ) | | | | 2,159 | | | | | 0.75 | | | | | 0.76 | | | | | 2.61 | | | | | 47 | |
Year ended 04/30/19 | | | | 22.99 | | | | | 0.65 | | | | | 1.45 | | | | | 2.10 | | | | | (0.67 | ) | | | | (1.71 | ) | | | | (2.38 | ) | | | | 22.71 | | | | | 9.82 | | | | | 1,863 | | | | | 0.77 | | | | | 0.77 | | | | | 2.83 | | | | | 4 | |
Year ended 04/30/18 | | | | 23.97 | | | | | 0.58 | | | | | (0.42 | ) | | | | 0.16 | | | | | (0.54 | ) | | | | (0.60 | ) | | | | (1.14 | ) | | | | 22.99 | | | | | 0.51 | | | | | 1,914 | | | | | 0.72 | | | | | 0.73 | | | | | 2.41 | | | | | 11 | |
Year ended 04/30/17 | | | | 22.32 | | | | | 0.48 | | | | | 1.81 | | | | | 2.29 | | | | | (0.48 | ) | | | | (0.16 | ) | | | | (0.64 | ) | | | | 23.97 | | | | | 10.38 | | | | | 2,376 | | | | | 0.72 | | | | | 0.74 | | | | | 2.05 | | | | | 6 | |
Class R6 | |
Year ended 04/30/21 | | | | 20.13 | | | | | 0.55 | | | | | 5.54 | | | | | 6.09 | | | | | (0.57 | ) | | | | – | | | | | (0.57 | ) | | | | 25.65 | | | | | 30.75 | | | | | 241,970 | | | | | 0.58 | (e) | | | | 0.58 | (e) | | | | 2.49 | (e) | | | | 4 | |
Year ended 04/30/20 | | | | 22.73 | | | | | 0.60 | | | | | (2.34 | ) | | | | (1.74 | ) | | | | (0.61 | ) | | | | (0.25 | ) | | | | (0.86 | ) | | | | 20.13 | | | | | (7.97 | ) | | | | 245,526 | | | | | 0.66 | | | | | 0.67 | | | | | 2.70 | | | | | 47 | |
Year ended 04/30/19 | | | | 23.00 | | | | | 0.67 | | | | | 1.46 | | | | | 2.13 | | | | | (0.69 | ) | | | | (1.71 | ) | | | | (2.40 | ) | | | | 22.73 | | | | | 9.96 | | | | | 252,176 | | | | | 0.69 | | | | | 0.69 | | | | | 2.91 | | | | | 4 | |
Year ended 04/30/18 | | | | 23.98 | | | | | 0.60 | | | | | (0.42 | ) | | | | 0.18 | | | | | (0.56 | ) | | | | (0.60 | ) | | | | (1.16 | ) | | | | 23.00 | | | | | 0.59 | | | | | 322,530 | | | | | 0.64 | | | | | 0.65 | | | | | 2.49 | | | | | 11 | |
Year ended 04/30/17 | | | | 22.34 | | | | | 0.50 | | | | | 1.80 | | | | | 2.30 | | | | | (0.50 | ) | | | | (0.16 | ) | | | | (0.66 | ) | | | | 23.98 | | | | | 10.42 | | | | | 83,352 | | | | | 0.64 | | | | | 0.66 | | | | | 2.13 | | | | | 6 | |
| (a) | Calculated using average shares outstanding. |
| (b) | Includes adjustments in accordance with accounting principles generally accepted in the United States of America and as such, the net asset value for financial reporting purposes and the returns based upon those net asset values may differ from the net asset value and returns for shareholder transactions. Does not include sales charges and is not annualized for periods less than one year, if applicable. |
| (c) | Portfolio turnover is calculated at the fund level and is not annualized for periods less than one year, if applicable. For the year ended April 30, 2020, the portfolio turnover calculation excludes the value of securities purchased of $2,372,954,426 in connection with the acquisitions of Invesco Oppenheimer Dividend Opportunity Fund and Invesco Oppenheimer Equity Income Fund into the Fund. |
| (d) | The total return, ratio of expenses to average net assets and ratio of net investment income to average net assets reflect actual 12b-1 fees of 0.24% for the year ended April 30, 2021. |
| (e) | Ratios are based on average daily net assets (000’s omitted) of $2,641,830, $338,360, $102,444, $321,782, $66,103, $2,296 and $236,439 for Class A, Class C, Class R, Class Y, Investor Class, Class R5 and Class R6 shares, respectively. |
| (f) | Commencement date of April 17, 2020. |
See accompanying Notes to Financial Statements which are an integral part of the financial statements.
14 Invesco Dividend Income Fund
Notes to Financial Statements
April 30, 2021
NOTE 1–Significant Accounting Policies
Invesco Dividend Income Fund (the “Fund”) is a series portfolio of AIM Sector Funds (Invesco Sector Funds) (the “Trust”). The Trust is a Delaware statutory trust registered under the Investment Company Act of 1940, as amended (the “1940 Act”), as an open-end series management investment company authorized to issue an unlimited number of shares of beneficial interest. Information presented in these financial statements pertains only to the Fund. Matters affecting the Fund or each class will be voted on exclusively by the shareholders of the Fund or each class.
The Fund’s investment objective is current income and long-term growth of capital.
The Fund currently consists of seven different classes of shares: Class A, Class C, Class R, Class Y, Investor Class, Class R5 and Class R6. Class Y and Investor Class shares are available only to certain investors. Class A shares are sold with a front-end sales charge unless certain waiver criteria are met. Under certain circumstances, load waived shares may be subject to contingent deferred sales charges (“CDSC”). Class C shares are sold with a CDSC. Class R, Class Y, Investor Class, Class R5 and Class R6 shares are sold at net asset value. Class C shares held for ten years after purchase are eligible for automatic conversion into Class A shares of the same Fund (the “Conversion Feature”). The automatic conversion pursuant to the Conversion Feature will generally occur at the end of the month following the tenth anniversary after a purchase of Class C shares. Effective November 30, 2020, the automatic conversion pursuant to the Conversion Feature changed from ten years to eight years. The first conversion of Class C shares to Class A shares occurred at the end of December 2020 for all Class C shares that were held for more than eight years as of November 30, 2020.
The Fund is an investment company and accordingly follows the investment company accounting and reporting guidance in accordance with Financial Accounting Standards Board Accounting Standards Codification Topic 946, Financial Services – Investment Companies.
The following is a summary of the significant accounting policies followed by the Fund in the preparation of its financial statements.
| A. | Security Valuations – Securities, including restricted securities, are valued according to the following policy. |
A security listed or traded on an exchange (except convertible securities) is valued at its last sales price or official closing price as of the close of the customary trading session on the exchange where the security is principally traded, or lacking any sales or official closing price on a particular day, the security may be valued at the closing bid price on that day. Securities traded in the over-the-counter market are valued based on prices furnished by independent pricing services or market makers. When such securities are valued by an independent pricing service they may be considered fair valued. Futures contracts are valued at the final settlement price set by an exchange on which they are principally traded. Listed options are valued at the mean between the last bid and asked prices from the exchange on which they are principally traded. Options not listed on an exchange are valued by an independent source at the mean between the last bid and asked prices. For purposes of determining net asset value (“NAV”) per share, futures and option contracts generally are valued 15 minutes after the close of the customary trading session of the New York Stock Exchange (“NYSE”).
Investments in open-end and closed-end registered investment companies that do not trade on an exchange are valued at the end-of-day net asset value per share. Investments in open-end and closed-end registered investment companies that trade on an exchange are valued at the last sales price or official closing price as of the close of the customary trading session on the exchange where the security is principally traded.
Debt obligations (including convertible securities) and unlisted equities are fair valued using an evaluated quote provided by an independent pricing service. Evaluated quotes provided by the pricing service may be determined without exclusive reliance on quoted prices, and may reflect appropriate factors such as institution-size trading in similar groups of securities, developments related to specific securities, dividend rate (for unlisted equities), yield (for debt obligations), quality, type of issue, coupon rate (for debt obligations), maturity (for debt obligations), individual trading characteristics and other market data. Pricing services generally value debt obligations assuming orderly transactions of institutional round lot size, but a fund may hold or transact in the same securities in smaller, odd lot sizes. Odd lots often trade at lower prices than institutional round lots. Debt obligations are subject to interest rate and credit risks. In addition, all debt obligations involve some risk of default with respect to interest and/or principal payments.
Foreign securities’ (including foreign exchange contracts) prices are converted into U.S. dollar amounts using the applicable exchange rates as of the close of the NYSE. If market quotations are available and reliable for foreign exchange-traded equity securities, the securities will be valued at the market quotations. Because trading hours for certain foreign securities end before the close of the NYSE, closing market quotations may become unreliable. If between the time trading ends on a particular security and the close of the customary trading session on the NYSE, events occur that the investment adviser determines are significant and make the closing price unreliable, the Fund may fair value the security. If the event is likely to have affected the closing price of the security, the security will be valued at fair value in good faith using procedures approved by the Board of Trustees. Adjustments to closing prices to reflect fair value may also be based on a screening process of an independent pricing service to indicate the degree of certainty, based on historical data, that the closing price in the principal market where a foreign security trades is not the current value as of the close of the NYSE. Foreign securities’ prices meeting the approved degree of certainty that the price is not reflective of current value will be priced at the indication of fair value from the independent pricing service. Multiple factors may be considered by the independent pricing service in determining adjustments to reflect fair value and may include information relating to sector indices, American Depositary Receipts and domestic and foreign index futures. Foreign securities may have additional risks including exchange rate changes, potential for sharply devalued currencies and high inflation, political and economic upheaval, the relative lack of issuer information, relatively low market liquidity and the potential lack of strict financial and accounting controls and standards.
Securities for which market prices are not provided by any of the above methods may be valued based upon quotes furnished by independent sources. The last bid price may be used to value equity securities. The mean between the last bid and asked prices is used to value debt obligations, including corporate loans.
Securities for which market quotations are not readily available or became unreliable are valued at fair value as determined in good faith by or under the supervision of the Trust’s officers following procedures approved by the Board of Trustees. Issuer specific events, market trends, bid/asked quotes of brokers and information providers and other market data may be reviewed in the course of making a good faith determination of a security’s fair value.
The Fund may invest in securities that are subject to interest rate risk, meaning the risk that the prices will generally fall as interest rates rise and, conversely, the prices will generally rise as interest rates fall. Specific securities differ in their sensitivity to changes in interest rates depending on their individual characteristics. Changes in interest rates may result in increased market volatility, which may affect the value and/or liquidity of certain Fund investments.
Valuations change in response to many factors including the historical and prospective earnings of the issuer, the value of the issuer’s assets, general market conditions which are not specifically related to the particular issuer, such as real or perceived adverse economic conditions, changes in the general outlook for revenues or corporate earnings, changes in interest or currency rates, regional or global instability, natural or environmental disasters, widespread disease or other public health issues, war, acts of terrorism or adverse investor sentiment generally and market liquidity. Because of the inherent uncertainties of valuation, the values reflected in the financial statements may materially differ from the value received upon actual sale of those investments.
| B. | Securities Transactions and Investment Income – Securities transactions are accounted for on a trade date basis. Realized gains or losses on sales are computed on the basis of specific identification of the securities sold. Interest income (net of withholding tax, if any) is recorded on an accrual basis from |
15 Invesco Dividend Income Fund
| | settlement date and includes coupon interest and amortization of premium and accretion of discount on debt securities as applicable. Dividend income (net of withholding tax, if any) is recorded on the ex-dividend date. |
The Fund may periodically participate in litigation related to Fund investments. As such, the Fund may receive proceeds from litigation settlements. Any proceeds received are included in the Statement of Operations as realized gain (loss) for investments no longer held and as unrealized gain (loss) for investments still held.
Brokerage commissions and mark ups are considered transaction costs and are recorded as an increase to the cost basis of securities purchased and/or a reduction of proceeds on a sale of securities. Such transaction costs are included in the determination of net realized and unrealized gain (loss) from investment securities reported in the Statement of Operations and the Statement of Changes in Net Assets and the net realized and unrealized gains (losses) on securities per share in the Financial Highlights. Transaction costs are included in the calculation of the Fund’s net asset value and, accordingly, they reduce the Fund’s total returns. These transaction costs are not considered operating expenses and are not reflected in net investment income reported in the Statement of Operations and the Statement of Changes in Net Assets, or the net investment income per share and the ratios of expenses and net investment income reported in the Financial Highlights, nor are they limited by any expense limitation arrangements between the Fund and the investment adviser.
The Fund allocates income and realized and unrealized capital gains and losses to a class based on the relative net assets of each class.
| C. | Country Determination – For the purposes of making investment selection decisions and presentation in the Schedule of Investments, the investment adviser may determine the country in which an issuer is located and/or credit risk exposure based on various factors. These factors include the laws of the country under which the issuer is organized, where the issuer maintains a principal office, the country in which the issuer derives 50% or more of its total revenues and the country that has the primary market for the issuer’s securities, as well as other criteria. Among the other criteria that may be evaluated for making this determination are the country in which the issuer maintains 50% or more of its assets, the type of security, financial guarantees and enhancements, the nature of the collateral and the sponsor organization. Country of issuer and/or credit risk exposure has been determined to be the United States of America, unless otherwise noted. |
| D. | Distributions – Distributions from net investment income, if any, are declared and paid monthly. Distributions from net realized capital gain, if any, are generally declared and paid annually and recorded on the ex-dividend date. The Fund may elect to treat a portion of the proceeds from redemptions as distributions for federal income tax purposes. |
| E. | Federal Income Taxes – The Fund intends to comply with the requirements of Subchapter M of the Internal Revenue Code of 1986, as amended (the “Internal Revenue Code”), necessary to qualify as a regulated investment company and to distribute substantially all of the Fund’s taxable earnings to shareholders. As such, the Fund will not be subject to federal income taxes on otherwise taxable income (including net realized capital gain) that is distributed to shareholders. Therefore, no provision for federal income taxes is recorded in the financial statements. |
The Fund recognizes the tax benefits of uncertain tax positions only when the position is more likely than not to be sustained. Management has analyzed the Fund’s uncertain tax positions and concluded that no liability for unrecognized tax benefits should be recorded related to uncertain tax positions. Management is not aware of any tax positions for which it is reasonably possible that the total amounts of unrecognized tax benefits will change materially in the next 12 months.
The Fund files tax returns in the U.S. Federal jurisdiction and certain other jurisdictions. Generally, the Fund is subject to examinations by such taxing authorities for up to three years after the filing of the return for the tax period.
| F. | Expenses – Fees provided for under the Rule 12b-1 plan of a particular class of the Fund are charged to the operations of such class. Transfer agency fees and expenses and other shareholder recordkeeping fees and expenses attributable to Class R5 and Class R6 are allocated to each share class based on relative net assets. Sub-accounting fees attributable to Class R5 are charged to the operations of the class. Transfer agency fees and expenses and other shareholder recordkeeping fees and expenses relating to all other classes are allocated among those classes based on relative net assets. All other expenses are allocated among the classes based on relative net assets. |
| G. | Accounting Estimates – The preparation of financial statements in conformity with accounting principles generally accepted in the United States of America (“GAAP”) requires management to make estimates and assumptions that affect the reported amounts of assets and liabilities at the date of the financial statements and the reported amounts of revenues and expenses during the reporting period including estimates and assumptions related to taxation. Actual results could differ from those estimates by a significant amount. In addition, the Fund monitors for material events or transactions that may occur or become known after the period-end date and before the date the financial statements are released to print. |
| H. | Indemnifications – Under the Trust’s organizational documents, each Trustee, officer, employee or other agent of the Trust is indemnified against certain liabilities that may arise out of the performance of their duties to the Fund. Additionally, in the normal course of business, the Fund enters into contracts, including the Fund’s servicing agreements, that contain a variety of indemnification clauses. The Fund’s maximum exposure under these arrangements is unknown as this would involve future claims that may be made against the Fund that have not yet occurred. The risk of material loss as a result of such indemnification claims is considered remote. |
| I. | Securities Lending – The Fund may lend portfolio securities having a market value up to one-third of the Fund’s total assets. Such loans are secured by collateral equal to no less than the market value of the loaned securities determined daily by the securities lending provider. Such collateral will be cash or debt securities issued or guaranteed by the U.S. Government or any of its sponsored agencies. Cash collateral received in connection with these loans is invested in short-term money market instruments or affiliated money market funds and is shown as such on the Schedule of Investments. The Fund bears the risk of loss with respect to the investment of collateral. It is the Fund’s policy to obtain additional collateral from or return excess collateral to the borrower by the end of the next business day, following the valuation date of the securities loaned. Therefore, the value of the collateral held may be temporarily less than the value of the securities on loan. When loaning securities, the Fund retains certain benefits of owning the securities, including the economic equivalent of dividends or interest generated by the security. Lending securities entails a risk of loss to the Fund if, and to the extent that, the market value of the securities loaned were to increase and the borrower did not increase the collateral accordingly, and the borrower failed to return the securities. The securities loaned are subject to termination at the option of the borrower or the Fund. Upon termination, the borrower will return to the Fund the securities loaned and the Fund will return the collateral. Upon the failure of the borrower to return the securities, collateral may be liquidated and the securities may be purchased on the open market to replace the loaned securities. The Fund could experience delays and costs in gaining access to the collateral and the securities may lose value during the delay which could result in potential losses to the Fund. Some of these losses may be indemnified by the lending agent. The Fund bears the risk of any deficiency in the amount of the collateral available for return to the borrower due to any loss on the collateral invested. Dividends received on cash collateral investments for securities lending transactions, which are net of compensation to counterparties, are included in Dividends from affiliated money market funds on the Statement of Operations. The aggregate value of securities out on loan, if any, is shown as a footnote on the Statement of Assets and Liabilities. |
| J. | Foreign Currency Translations – Foreign currency is valued at the close of the NYSE based on quotations posted by banks and major currency dealers. Portfolio securities and other assets and liabilities denominated in foreign currencies are translated into U.S. dollar amounts at the date of valuation. Purchases and sales of portfolio securities (net of foreign taxes withheld on disposition) and income items denominated in foreign currencies are translated into U.S. dollar amounts on the respective dates of such transactions. The Fund does not separately account for the portion of the results of operations resulting from changes in foreign exchange rates on investments and the fluctuations arising from changes in market prices of securities held. The combined results of changes in foreign exchange rates and the fluctuation of market prices on investments (net of estimated foreign tax withholding) are included with the net realized and unrealized gain or loss from investments in the Statement of Operations. Reported net realized foreign currency gains or losses arise from (1) sales of foreign currencies, (2) currency gains or losses realized between the trade and settlement dates on securities transactions, and (3) the difference between the amounts of dividends, interest, and foreign withholding taxes recorded on the Fund’s books and the U.S. dollar equivalent of the amounts actually received or paid. Net unrealized |
16 Invesco Dividend Income Fund
| | foreign currency gains and losses arise from changes in the fair values of assets and liabilities, other than investments in securities at fiscal period end, resulting from changes in exchange rates. |
The Fund may invest in foreign securities, which may be subject to foreign taxes on income, gains on investments or currency repatriation, a portion of which may be recoverable. Foreign taxes, if any, are recorded based on the tax regulations and rates that exist in the foreign markets in which the Fund invests and are shown in the Statement of Operations.
| K. | Forward Foreign Currency Contracts – The Fund may engage in foreign currency transactions either on a spot (i.e. for prompt delivery and settlement) basis, or through forward foreign currency contracts, to manage or minimize currency or exchange rate risk. |
The Fund may also enter into forward foreign currency contracts for the purchase or sale of a security denominated in a foreign currency in order to “lock in” the U.S. dollar price of that security, or the Fund may also enter into forward foreign currency contracts that do not provide for physical settlement of the two currencies, but instead are settled by a single cash payment calculated as the difference between the agreed upon exchange rate and the spot rate at settlement based upon an agreed upon notional amount (non-deliverable forwards). The Fund will set aside liquid assets in an amount equal to the daily mark-to-market obligation for forward foreign currency contracts.
A forward foreign currency contract is an obligation between two parties (“Counterparties”) to purchase or sell a specific currency for an agreed-upon price at a future date. The use of forward foreign currency contracts does not eliminate fluctuations in the price of the underlying securities the Fund owns or intends to acquire but establishes a rate of exchange in advance. Fluctuations in the value of these contracts are measured by the difference in the contract date and reporting date exchange rates and are recorded as unrealized appreciation (depreciation) until the contracts are closed. When the contracts are closed, realized gains (losses) are recorded. Realized and unrealized gains (losses) on the contracts are included in the Statement of Operations. The primary risks associated with forward foreign currency contracts include failure of the Counterparty to meet the terms of the contract and the value of the foreign currency changing unfavorably. These risks may be in excess of the amounts reflected in the Statement of Assets and Liabilities.
| L. | COVID-19 Risk - The COVID-19 strain of coronavirus has resulted in instances of market closures and dislocations, extreme volatility, liquidity constraints and increased trading costs. Efforts to contain its spread have resulted in travel restrictions, disruptions of healthcare systems, business operations and supply chains, layoffs, lower consumer demand, and defaults, among other significant economic impacts that have disrupted global economic activity across many industries. Such economic impacts may exacerbate other pre-existing political, social and economic risks locally or globally. |
The ongoing effects of COVID-19 are unpredictable and may result in significant and prolonged effects on the Fund’s performance.
NOTE 2 – Advisory Fees and Other Fees Paid to Affiliates
The Trust has entered into a master investment advisory agreement with Invesco Advisers, Inc. (the “Adviser” or “Invesco”). Under the terms of the investment advisory agreement, the Fund accrues daily and pays monthly an advisory fee to the Adviser based on the annual rate of the Fund’s average daily net assets as follows:
| | |
| Average Daily Net Assets | | Rate |
First $ 500 million | | 0.633% |
Next $500 million | | 0.613% |
Next $600 million | | 0.600% |
Next $400 million | | 0.533% |
Next $2 billion | | 0.450% |
Next $2 billion | | 0.400% |
Next $2 billion | | 0.375% |
Over $8 billion | | 0.350% |
For the year ended April 30, 2021, the effective advisory fee rate incurred by the Fund was 0.53%.
Under the terms of a master sub-advisory agreement between the Adviser and each of Invesco Asset Management Deutschland GmbH, Invesco Asset Management Limited, Invesco Asset Management (Japan) Limited, Invesco Hong Kong Limited, Invesco Senior Secured Management, Inc. and Invesco Canada Ltd. (collectively, the “Affiliated Sub-Advisers”) the Adviser, not the Fund, will pay 40% of the fees paid to the Adviser to any such Affiliated Sub-Adviser(s) that provide(s) discretionary investment management services to the Fund based on the percentage of assets allocated to such Affiliated Sub-Adviser(s).
The Adviser has contractually agreed, through May 31, 2021, to waive advisory fees and/or reimburse expenses of all shares to the extent necessary to limit total annual fund operating expenses after fee waiver and/or expense reimbursement (excluding certain items discussed below) of Class A, Class C, Class R, Class Y, Investor Class, Class R5 and Class R6 shares to 1.05%, 1.80%, 1.30%, 0.80%, 1.05%, 0.66% and 0.61%, respectively, of the Fund’s average daily net assets (the “expense limits”). Effective June 1, 2021 through at least June 30, 2022, the Adviser has contractually agreed to waive advisory fees and/or reimburse expenses of all shares to the extent necessary to limit total annual fund operating expenses after fee waiver and/or expense reimbursement (excluding certain items discussed below) of Class A, Class C, Class R, Class Y, Investor Class, Class R5 and Class R6 shares to 2.00%, 2.75%, 2.25%, 1.75%, 2.00%, 1.75% and 1.75%, respectively, of the Fund’s average daily net assets. In determining the Adviser’s obligation to waive advisory fees and/or reimburse expenses, the following expenses are not taken into account, and could cause the total annual fund operating expenses after fee waivers and/or expense reimbursement to exceed the numbers reflected above: (1) interest; (2) taxes; (3) dividend expense on short sales; (4) extraordinary or non-routine items, including litigation expenses; and (5) expenses that the Fund has incurred but did not actually pay because of an expense offset arrangement. Unless Invesco continues the fee waiver agreement, it will terminate on June 30, 2022. During its term, the fee waiver agreement cannot be terminated or amended to increase the expense limits or reduce the advisory fee waiver without approval of the Board of Trustees.
Further, the Adviser has contractually agreed, through at least June 30, 2023, to waive the advisory fee payable by the Fund in an amount equal to 100% of the net advisory fees the Adviser receives from the affiliated money market funds on investments by the Fund of uninvested cash (excluding investments of cash collateral from securities lending) in such affiliated money market funds.
For the year ended April 30, 2021, the Adviser waived advisory fees of $179,371 and reimbursed class level expenses of $0, $0, $0, $0, $0, $7 and $0 of Class A, Class C, Class R, Class Y, Investor Class, Class R5 and Class R6 shares, respectively.
The Trust has entered into a master administrative services agreement with Invesco pursuant to which the Fund has agreed to pay Invesco for certain administrative costs incurred in providing accounting services to the Fund. For the year ended April 30, 2021, expenses incurred under the agreement are shown in the Statement of Operations as Administrative services fees. Invesco has entered into a sub-administration agreement whereby State Street Bank and Trust Company (“SSB”) serves as fund accountant and provides certain administrative services to the Fund. Pursuant to a custody agreement with the Trust on behalf of the Fund, SSB also serves as the Fund’s custodian.
The Trust has entered into a transfer agency and service agreement with Invesco Investment Services, Inc. (“IIS”) pursuant to which the Fund has agreed to pay IIS a fee for providing transfer agency and shareholder services to the Fund and reimburse IIS for certain expenses incurred by IIS in the course of providing such services. IIS may make payments to intermediaries that provide omnibus account services, sub-accounting services and/or networking services. All fees payable by IIS to
17 Invesco Dividend Income Fund
intermediaries that provide omnibus account services or sub-accounting services are charged back to the Fund, subject to certain limitations approved by the Trust’s Board of Trustees. For the year ended April 30, 2021, expenses incurred under the agreement are shown in the Statement of Operations as Transfer agent fees.
The Trust has entered into master distribution agreements with Invesco Distributors, Inc. (“IDI”) to serve as the distributor for the Class A, Class C, Class R, Investor Class, Class R5 and Class R6 shares of the Fund. The Trust has adopted plans pursuant to Rule 12b-1 under the 1940 Act with respect to the Fund’s Class A, Class C, Class R and Investor Class shares (collectively, the “Plans”). The Fund, pursuant to the Class A Plan, reimburses IDI for its allocated share of expenses incurred for the period, up to a maximum annual rate of 0.25% of the average daily net assets of Class A shares. The Fund pursuant to the Class C Plan, the Class R Plan and the Investor Class Plan, pays IDI compensation at the annual rate of 1.00% of the average daily net assets of Class C shares, at the annual rate of 0.50% of the average daily net assets of Class R shares and at the annual rate of 0.25% of the average daily net assets of the Investor Class shares, respectively. The fees are accrued daily and paid monthly. Of the Plan payments, up to 0.25% of the average daily net assets of each class of shares may be paid to furnish continuing personal shareholder services to customers who purchase and own shares of such classes. Any amounts not paid as a service fee under the Plans would constitute an asset-based sales charge. Rules of the Financial Industry Regulatory Authority (“FINRA”) impose a cap on the total sales charges, including asset-based sales charges, that may be paid by any class of shares of the Fund. For the year ended April 30, 2021, expenses incurred under the Plans are shown in the Statement of Operations as Distribution fees.
Front-end sales commissions and CDSC (collectively, the “sales charges”) are not recorded as expenses of the Fund. Front-end sales commissions are deducted from proceeds from the sales of Fund shares prior to investment in Class A shares of the Fund. CDSC are deducted from redemption proceeds prior to remittance to the shareholder. During the year ended April 30, 2021, IDI advised the Fund that IDI retained $327,500 in front-end sales commissions from the sale of Class A shares and $5,358 and $10,191 from Class A and Class C shares, respectively, for CDSC imposed upon redemptions by shareholders.
For the year ended April 30, 2021, the Fund incurred $9,967 in brokerage commissions with Invesco Capital Markets, Inc., an affiliate of the Adviser and IDI, for portfolio transactions executed on behalf of the Fund.
Certain officers and trustees of the Trust are officers and directors of the Adviser, IIS and/or IDI.
NOTE 3–Additional Valuation Information
GAAP defines fair value as the price that would be received to sell an asset or paid to transfer a liability in an orderly transaction between market participants at the measurement date, under current market conditions. GAAP establishes a hierarchy that prioritizes the inputs to valuation methods, giving the highest priority to readily available unadjusted quoted prices in an active market for identical assets (Level 1) and the lowest priority to significant unobservable inputs (Level 3), generally when market prices are not readily available or are unreliable. Based on the valuation inputs, the securities or other investments are tiered into one of three levels. Changes in valuation methods may result in transfers in or out of an investment’s assigned level:
| | |
| Level 1 – | | Prices are determined using quoted prices in an active market for identical assets. |
| Level 2 – | | Prices are determined using other significant observable inputs. Observable inputs are inputs that other market participants may use in pricing a security. These may include quoted prices for similar securities, interest rates, prepayment speeds, credit risk, yield curves, loss severities, default rates, discount rates, volatilities and others. |
| Level 3 – | | Prices are determined using significant unobservable inputs. In situations where quoted prices or observable inputs are unavailable (for example, when there is little or no market activity for an investment at the end of the period), unobservable inputs may be used. Unobservable inputs reflect the Fund’s own assumptions about the factors market participants would use in determining fair value of the securities or instruments and would be based on the best available information. |
The following is a summary of the tiered valuation input levels, as of April 30, 2021. The level assigned to the securities valuations may not be an indication of the risk or liquidity associated with investing in those securities. Because of the inherent uncertainties of valuation, the values reflected in the financial statements may materially differ from the value received upon actual sale of those investments.
| | | | | | | | | | | | | | | | |
| | | Level 1 | | | Level 2 | | | Level 3 | | | Total | |
| |
Investments in Securities | | | | | | | | | | | | | | | | |
| |
Common Stocks & Other Equity Interests | | | $3,349,496,891 | | | | $448,062,234 | | | | $– | | | | $3,797,559,125 | |
| |
U.S. Dollar Denominated Bonds & Notes | | | – | | | | 458,087 | | | | – | | | | 458,087 | |
| |
Money Market Funds | | | 176,764,165 | | | | 77,863,500 | | | | – | | | | 254,627,665 | |
| |
Total Investments | | | $3,526,261,056 | | | | $526,383,821 | | | | $– | | | | $4,052,644,877 | |
| |
NOTE 4 – Expense Offset Arrangement(s)
The expense offset arrangement is comprised of transfer agency credits which result from balances in demand deposit accounts used by the transfer agent for clearing shareholder transactions. For the year ended April 30, 2021, the Fund received credits from this arrangement, which resulted in the reduction of the Fund’s total expenses of $12,285.
NOTE 5 – Trustees’ and Officers’ Fees and Benefits
Trustees’ and Officers’ Fees and Benefits include amounts accrued by the Fund to pay remuneration to certain Trustees and Officers of the Fund. Trustees have the option to defer compensation payable by the Fund, and Trustees’ and Officers’ Fees and Benefits also include amounts accrued by the Fund to fund such deferred compensation amounts. Those Trustees who defer compensation have the option to select various Invesco Funds in which their deferral accounts shall be deemed to be invested. Finally, certain current Trustees were eligible to participate in a retirement plan that provided for benefits to be paid upon retirement to Trustees over a period of time based on the number of years of service. The Fund may have certain former Trustees who also participate in a retirement plan and receive benefits under such plan. Trustees’ and Officers’ Fees and Benefits include amounts accrued by the Fund to fund such retirement benefits. Obligations under the deferred compensation and retirement plans represent unsecured claims against the general assets of the Fund.
NOTE 6 – Cash Balances
The Fund is permitted to temporarily carry a negative or overdrawn balance in its account with SSB, the custodian bank. Such balances, if any at period-end, are shown in the Statement of Assets and Liabilities under the payable caption Amount due custodian. To compensate the custodian bank for such overdrafts, the overdrawn Fund may either (1) leave funds as a compensating balance in the account so the custodian bank can be compensated by earning the additional interest; or (2) compensate by paying the custodian bank at a rate agreed upon by the custodian bank and Invesco, not to exceed the contractually agreed upon rate. The Fund may not purchase additional securities when any borrowings from banks or broker-dealers exceed 5% of the Fund’s total assets, or when any borrowings from an Invesco Fund are outstanding.
18 Invesco Dividend Income Fund
NOTE 7–Distributions to Shareholders and Tax Components of Net Assets
Tax Character of Distributions to Shareholders Paid During the Fiscal Years Ended April 30, 2021 and April 30, 2020:
| | | | | | | | |
| | | 2021 | | | 2020 | |
| |
Ordinary income* | | $ | 80,336,366 | | | $ | 32,347,017 | |
| |
Long-term capital gain | | | – | | | | 15,597,000 | |
| |
Total distributions | | $ | 80,336,366 | | | $ | 47,944,017 | |
| |
* Includes short-term capital gain distributions, if any.
Tax Components of Net Assets at Period-End:
| | | | | | | | |
| | | | | | 2021 | |
| |
Undistributed ordinary income | | | | | | $ | 11,684,571 | |
| |
Net unrealized appreciation – investments | | | | | | | 993,560,447 | |
| |
Net unrealized appreciation - foreign currencies | | | | | | | 137,297 | |
| |
Temporary book/tax differences | | | | | | | (448,542 | ) |
| |
Shares of beneficial interest | | | | | | | 2,975,541,577 | |
| |
Total net assets | | | | | | $ | 3,980,475,350 | |
| |
The difference between book-basis and tax-basis unrealized appreciation (depreciation) is due to differences in the timing of recognition of gains and losses on investments for tax and book purposes. The Fund’s net unrealized appreciation (depreciation) difference is attributable primarily to wash sales and straddle losses deferred.
The temporary book/tax differences are a result of timing differences between book and tax recognition of income and/or expenses. The Fund’s temporary book/tax differences are the result of the trustee deferral of compensation and retirement plan benefits.
Capital loss carryforward is calculated and reported as of a specific date. Results of transactions and other activity after that date may affect the amount of capital loss carryforward actually available for the Fund to utilize. The ability to utilize capital loss carryforward in the future may be limited under the Internal Revenue Code and related regulations based on the results of future transactions.
The Fund does not have a capital loss carryforward as of April 30, 2021.
NOTE 8 – Investment Transactions
The aggregate amount of investment securities (other than short-term securities, U.S. Government obligations and money market funds, if any) purchased and sold by the Fund during the year ended April 30, 2021 was $128,430,005 and $609,279,114, respectively. Cost of investments, including any derivatives, on a tax basis includes the adjustments for financial reporting purposes as of the most recently completed federal income tax reporting period-end.
| | | | |
| Unrealized Appreciation (Depreciation) of Investments on a Tax Basis | |
| |
Aggregate unrealized appreciation of investments | | $ | 1,006,627,975 | |
| |
Aggregate unrealized (depreciation) of investments | | | (13,067,528 | ) |
| |
Net unrealized appreciation of investments | | $ | 993,560,447 | |
| |
Cost of investments for tax purposes is $3,059,084,430.
NOTE 9 – Reclassification of Permanent Differences
Primarily as a result of differing book/tax treatment of foreign currency transactions and real estate investment trust distributions, on April 30, 2021, undistributed net investment income was increased by $745,459 and undistributed net realized gain (loss) was decreased by $745,459. This reclassification had no effect on the net assets or the distributable earnings of the Fund.
NOTE 10 – Share Information
| | | | | | | | | | | | | | | | |
| | | Summary of Share Activity | |
| |
| | | Year ended | | | Year ended | |
| | | April 30, 2021(a) | | | April 30, 2020 | |
| | | Shares | | | Amount | | | Shares | | | Amount | |
| |
Sold: | | | | | | | | | | | | | | | | |
Class A | | | 7,954,232 | | | $ | 176,626,306 | | | | 3,812,090 | | | $ | 81,632,098 | |
| |
Class C | | | 1,223,560 | | | | 27,257,557 | | | | 554,738 | | | | 11,968,892 | |
| |
Class R | | | 622,003 | | | | 13,816,681 | | | | 11,114 | | | | 224,671 | |
| |
Class Y | | | 2,845,927 | | | | 63,787,665 | | | | 2,055,071 | | | | 44,867,487 | |
| |
Investor Class | | | 79,458 | | | | 1,825,587 | | | | 76,479 | | | | 1,727,207 | |
| |
Class R5 | | | 20,861 | | | | 464,489 | | | | 40,185 | | | | 877,287 | |
| |
Class R6 | | | 1,554,962 | | | | 34,460,763 | | | | 1,913,724 | | | | 41,417,956 | |
| |
19 Invesco Dividend Income Fund
| | | | | | | | | | | | | | | | |
| | | Summary of Share Activity | |
| |
| | | Year ended | | | Year ended | |
| | | April 30, 2021(a) | | | April 30, 2020 | |
| | | Shares | | | Amount | | | Shares | | | Amount | |
| |
| | | | |
Issued as reinvestment of dividends: | | | | | | | | | | | | | | | | |
Class A | | | 2,353,195 | | | $ | 52,078,909 | | | | 981,064 | | | $ | 21,890,282 | |
| |
Class C | | | 205,532 | | | | 4,551,363 | | | | 133,337 | | | | 3,027,051 | |
| |
Class R | | | 89,303 | | | | 1,973,655 | | | | - | | | | - | |
| |
Class Y | | | 271,918 | | | | 6,067,680 | | | | 289,938 | | | | 6,543,541 | |
| |
Investor Class | | | 57,078 | | | | 1,276,666 | | | | 99,503 | | | | 2,242,265 | |
| |
Class R5 | | | 2,560 | | | | 56,690 | | | | 4,103 | | | | 91,461 | |
| |
Class R6 | | | 267,351 | | | | 5,906,050 | | | | 403,535 | | | | 8,995,223 | |
| |
| | | | |
Automatic conversion of Class C shares to Class A shares: | | | | | | | | | | | | | | | | |
Class A | | | 4,564,118 | | | | 102,652,207 | | | | 284,086 | | | | 6,110,263 | |
| |
Class C | | | (4,502,763 | ) | | | (102,652,207 | ) | | | (280,232 | ) | | | (6,110,263 | ) |
| |
| | | | |
Issued in connection with acquisitions:(b) | | | | | | | | | | | | | | | | |
Class A | | | - | | | | - | | | | 94,223,079 | | | | 1,901,350,313 | |
| |
Class C | | | - | | | | - | | | | 13,963,114 | | | | 285,741,496 | |
| |
Class R | | | - | | | | - | | | | 4,873,243 | | | | 98,338,348 | |
| |
Class Y | | | - | | | | - | | | | 8,117,361 | | | | 165,532,230 | |
| |
Class R5 | | | - | | | | - | | | | 873 | | | | 17,631 | |
| |
Class R6 | | | - | | | | - | | | | 1,882,299 | | | | 38,019,462 | |
| |
| | | | |
Reacquired: | | | | | | | | | | | | | | | | |
Class A | | | (25,472,535 | ) | | | (565,318,153 | ) | | | (8,304,445 | ) | | | (179,058,000 | ) |
| |
Class C | | | (4,874,978 | ) | | | (108,509,485 | ) | | | (2,082,082 | ) | | | (45,961,182 | ) |
| |
Class R | | | (1,243,512 | ) | | | (27,800,816 | ) | | | (32,004 | ) | | | (632,040 | ) |
| |
Class Y | | | (6,064,345 | ) | | | (133,780,482 | ) | | | (5,039,052 | ) | | | (110,953,871 | ) |
| |
Investor Class | | | (359,455 | ) | | | (8,046,738 | ) | | | (442,281 | ) | | | (9,664,350 | ) |
| |
Class R5 | | | (39,575 | ) | | | (905,483 | ) | | | (19,865 | ) | | | (444,608 | ) |
| |
Class R6 | | | (4,586,621 | ) | | | (101,421,028 | ) | | | (3,097,835 | ) | | | (67,373,899 | ) |
| |
Net increase (decrease) in share activity | | | (25,031,726 | ) | | $ | (555,632,124 | ) | | | 114,421,140 | | | $ | 2,300,416,951 | |
| |
| (a) | There are entities that are record owners of more than 5% of the outstanding shares of the Fund and in the aggregate own 21% of the outstanding shares of the Fund. IDI has an agreement with these entities to sell Fund shares. The Fund, Invesco and/or Invesco affiliates may make payments to these entities, which are considered to be related to the Fund, for providing services to the Fund, Invesco and/or Invesco affiliates including but not limited to services such as securities brokerage, distribution, third party record keeping and account servicing. The Fund has no knowledge as to whether all or any portion of the shares owned of record by these entities are also owned beneficially. |
| (b) | After the close of business on April 17, 2020, the Fund acquired all the net assets of Invesco Oppenheimer Dividend Opportunity Fund and Invesco Oppenheimer Equity Income Fund pursuant to a plan of reorganization approved by the Board of Trustees of the Fund on February 14, 2020. The reorganization was executed in order to reduce overlap and increase efficiencies in the Adviser’s product line. The acquisition was accomplished by a tax-free exchange of 123,059,969 shares of the Fund for 10,079,523 and 94,493,678 shares outstanding of Invesco Oppenheimer Dividend Opportunity Fund and Invesco Oppenheimer Equity Income Fund, respectively, as of the close of business on April 17, 2020. Shares of Invesco Oppenheimer Dividend Opportunity Fund and Invesco Oppenheimer Equity Income Fund were exchanged for the like class of shares of the Fund, based on the relative net asset value of Invesco Oppenheimer Dividend Opportunity Fund and Invesco Oppenheimer Equity Income Fund to the net asset value of the Fund on the close of business, April 17, 2020. The Invesco Oppenheimer Dividend Opportunity Fund and Invesco Oppenheimer Equity Income Fund’s net assets as of the close of business on April 17, 2020 of $203,484,378 and $2,285,515,102, respectively, including $17,399,010 of unrealized appreciation, were combined with those of the Fund. The net assets of the Fund immediately before the acquisition were $1,175,677,851 and $3,664,677,331 immediately after the acquisition. |
The pro forma results of operations for the year ended April 30, 2020 assuming the reorganization had been completed on May 1, 2019, the beginning of the annual reporting period are as follows:
| | | | |
Net investment income | | $ | 98,767,428 | |
| |
Net realized/unrealized gains | | | (534,309,797 | ) |
| |
Change in net assets resulting from operations | | $ | (435,542,369 | ) |
| |
As the combined investment portfolios have been managed as a single integrated portfolio since the acquisition was completed, it is not practicable to separate the amounts of revenue and earnings of Invesco Oppenheimer Dividend Opportunity Fund and Invesco Oppenheimer Equity Income Fund that have been included in the Fund’s Statement of Operations since April 18, 2020.
20 Invesco Dividend Income Fund
Report of Independent Registered Public Accounting Firm
To the Board of Trustees of AIM Sector Funds (Invesco Sector Funds) and Shareholders of Invesco Dividend Income Fund
Opinion on the Financial Statements
We have audited the accompanying statement of assets and liabilities, including the schedule of investments, of Invesco Dividend Income Fund (one of the funds constituting AIM Sector Funds (Invesco Sector Funds), referred to hereafter as the “Fund”) as of April 30, 2021, the related statement of operations for the year ended April 30, 2021, the statement of changes in net assets for each of the two years in the period ended April 30, 2021, including the related notes, and the financial highlights for each of the periods indicated therein (collectively referred to as the “financial statements”). In our opinion, the financial statements present fairly, in all material respects, the financial position of the Fund as of April 30, 2021, the results of its operations for the year then ended, the changes in its net assets for each of the two years in the period ended April 30, 2021 and the financial highlights for each of the periods indicated therein in conformity with accounting principles generally accepted in the United States of America.
Basis for Opinion
These financial statements are the responsibility of the Fund’s management. Our responsibility is to express an opinion on the Fund’s financial statements based on our audits. We are a public accounting firm registered with the Public Company Accounting Oversight Board (United States) (PCAOB) and are required to be independent with respect to the Fund in accordance with the U.S. federal securities laws and the applicable rules and regulations of the Securities and Exchange Commission and the PCAOB.
We conducted our audits of these financial statements in accordance with the standards of the PCAOB. Those standards require that we plan and perform the audit to obtain reasonable assurance about whether the financial statements are free of material misstatement, whether due to error or fraud.
Our audits included performing procedures to assess the risks of material misstatement of the financial statements, whether due to error or fraud, and performing procedures that respond to those risks. Such procedures included examining, on a test basis, evidence regarding the amounts and disclosures in the financial statements. Our audits also included evaluating the accounting principles used and significant estimates made by management, as well as evaluating the overall presentation of the financial statements. Our procedures included confirmation of securities owned as of April 30, 2021 by correspondence with the custodian and transfer agent. We believe that our audits provide a reasonable basis for our opinion.
/s/ PricewaterhouseCoopers LLP
Houston, Texas
June 24, 2021
We have served as the auditor of one or more investment companies in the Invesco group of investment companies since at least 1995. We have not been able to determine the specific year we began serving as auditor.
21 Invesco Dividend Income Fund
Calculating your ongoing Fund expenses
Example
As a shareholder of the Fund, you incur two types of costs: (1) transaction costs, which may include sales charges (loads) on purchase payments or contingent deferred sales charges on redemptions, if any; and (2) ongoing costs, including management fees, distribution and/or service (12b-1) fees, and other Fund expenses. This example is intended to help you understand your ongoing costs (in dollars) of investing in the Fund and to compare these costs with ongoing costs of investing in other mutual funds. The example is based on an investment of $1,000 invested at the beginning of the period and held for the entire period November 1, 2020 through April 30, 2021.
Actual expenses
The table below provides information about actual account values and actual expenses. You may use the information in this table, together with the amount you invested, to estimate the expenses that you paid over the period. Simply divide your account value by $1,000 (for example, an $8,600 account value divided by $1,000 = 8.6), then multiply the result by the number in the table under the heading entitled “Actual Expenses Paid During Period” to estimate the expenses you paid on your account during this period.
Hypothetical example for comparison purposes
The table below also provides information about hypothetical account values and hypothetical expenses based on the Fund’s actual expense ratio and an assumed rate of return of 5% per year before expenses, which is not the Fund’s actual return.
The hypothetical account values and expenses may not be used to estimate the actual ending account balance or expenses you paid for the period. You may use this information to compare the ongoing costs of investing in the Fund and other funds. To do so, compare this 5% hypothetical example with the 5% hypothetical examples that appear in the shareholder reports of the other funds.
Please note that the expenses shown in the table are meant to highlight your ongoing costs only and do not reflect any transaction costs, such as sales charges (loads) on purchase payments or contingent deferred sales charges on redemptions, if any. Therefore, the hypothetical information is useful in comparing ongoing costs only, and will not help you determine the relative total costs of owning different funds. In addition, if these transaction costs were included, your costs would have been higher.
| | | | | | | | | | | | |
| | | | | ACTUAL | | HYPOTHETICAL
(5% annual return before expenses) | | |
| | | Beginning | | Ending | | Expenses | | Ending | | Expenses | | Annualized |
| | | Account Value | | Account Value | | Paid During | | Account Value | | Paid During | | Expense |
| | | (11/01/20) | | (04/30/21)1 | | Period2 | | (04/30/21) | | Period2 | | Ratio |
Class A | | $1,000.00 | | $1,251.30 | | $5.41 | | $1,019.98 | | $4.86 | | 0.97% |
Class C | | 1,000.00 | | 1,246.80 | | 9.64 | | 1,016.22 | | 8.65 | | 1.73 |
Class R | | 1,000.00 | | 1,249.70 | | 6.86 | | 1,018.70 | | 6.16 | | 1.23 |
Class Y | | 1,000.00 | | 1,252.60 | | 4.08 | | 1,021.17 | | 3.66 | | 0.73 |
Investor Class | | 1,000.00 | | 1,251.50 | | 5.47 | | 1,019.93 | | 4.91 | | 0.98 |
Class R5 | | 1,000.00 | | 1,253.00 | | 3.69 | | 1,021.52 | | 3.31 | | 0.66 |
Class R6 | | 1,000.00 | | 1,253.80 | | 3.24 | | 1,021.92 | | 2.91 | | 0.58 |
| 1 | The actual ending account value is based on the actual total return of the Fund for the period November 1, 2020 through April 30, 2021, after actual expenses and will differ from the hypothetical ending account value which is based on the Fund’s expense ratio and a hypothetical annual return of 5% before expenses. |
| 2 | Expenses are equal to the Fund’s annualized expense ratio as indicated above multiplied by the average account value over the period, multiplied by 181/365 to reflect the most recent fiscal half year. |
22 Invesco Dividend Income Fund
Tax Information
Form 1099-DIV, Form 1042-S and other year–end tax information provide shareholders with actual calendar year amounts that should be included in their tax returns. Shareholders should consult their tax advisers.
The following distribution information is being provided as required by the Internal Revenue Code or to meet a specific state’s requirement.
The Fund designates the following amounts or, if subsequently determined to be different, the maximum amount allowable for its fiscal year ended April 30, 2021:
| | | | | | |
| | | | | | |
| | Federal and State Income Tax | | | | |
| | Qualified Dividend Income* | | | 100.00 | % |
| | Corporate Dividends Received Deduction* | | | 100.00 | % |
| | Business Interest Income* | | | 0.00 | % |
| | Qualified Business Income* | | | 0.00 | % |
| | U.S. Treasury Obligations* | | | 0.00 | % |
* The above percentages are based on ordinary income dividends paid to shareholders during the Fund’s fiscal year.
| | | | | | |
| | | | | | |
| | Non-Resident Alien Shareholders | | | | |
| | Short-Term Capital Gain Distributions | | $ | 39 | |
| | Qualified Interest Income** | | | 0.02 | % |
| |
| | ** The above percentage is based on income dividends paid to shareholders during the Fund’s fiscal year. | |
23 Invesco Dividend Income Fund
Trustees and Officers
The address of each trustee and officer is AIM Sector Funds (Invesco Sector Funds) (the “Trust”), 11 Greenway Plaza, Suite 1000, Houston, Texas 77046-1173. The trustees serve for the life of the Trust, subject to their earlier death, incapacitation, resignation, retirement or removal as more specifically provided in the Trust’s organizational documents. Each officer serves for a one year term or until their successors are elected and qualified. Column two below includes length of time served with predecessor entities, if any.
| | | | | | | | |
Name, Year of Birth and Position(s) Held with the Trust | | Trustee and/or Officer Since | | Principal Occupation(s) During Past 5 Years | | Number of Funds in Fund Complex Overseen by Trustee | | Other Directorship(s) Held by Trustee During Past 5 Years |
Interested Trustee | | | | | | | | |
| Martin L. Flanagan1 – 1960 Trustee and Vice Chair | | 2007 | | Executive Director, Chief Executive Officer and President, Invesco Ltd. (ultimate parent of Invesco and a global investment management firm); Trustee and Vice Chair, The Invesco Funds; Vice Chair, Investment Company Institute; and Member of Executive Board, SMU Cox School of Business Formerly: Advisor to the Board, Invesco Advisers, Inc. (formerly known as Invesco Institutional (N.A.), Inc.); Chairman and Chief Executive Officer, Invesco Advisers, Inc. (registered investment adviser); Director, Chairman, Chief Executive Officer and President, Invesco Holding Company (US), Inc. (formerly IVZ Inc.) (holding company), Invesco Group Services, Inc. (service provider) and Invesco North American Holdings, Inc. (holding company); Director, Chief Executive Officer and President, Invesco Holding Company Limited (parent of Invesco and a global investment management firm); Director, Invesco Ltd.; Chairman, Investment Company Institute and President, Co-Chief Executive Officer, Co-President, Chief Operating Officer and Chief Financial Officer, Franklin Resources, Inc. (global investment management organization) | | 184 | | None |
|
1 Mr. Flanagan is considered an interested person (within the meaning of Section 2(a)(19) of the 1940 Act) of the Trust because he is an officer of the Adviser to the Trust, and an officer and a director of Invesco Ltd., ultimate parent of the Adviser. |
T-1 Invesco Dividend Income Fund
Trustees and Officers–(continued)
| | | | | | | | |
Name, Year of Birth and Position(s) Held with the Trust | | Trustee and/or Officer Since | | Principal Occupation(s) During Past 5 Years | | Number of Funds in Fund Complex Overseen by Trustee | | Other Directorship(s) Held by Trustee During Past 5 Years |
Independent Trustees | | | | | | | | |
Christopher L. Wilson – 1957 Trustee and Chair | | 2017 | | Retired Formerly: Director, TD Asset Management USA Inc. (mutual fund complex) (22 portfolios); Managing Partner, CT2, LLC (investing and consulting firm); President/Chief Executive Officer, Columbia Funds, Bank of America Corporation; President/Chief Executive Officer, CDC IXIS Asset Management Services, Inc.; Principal & Director of Operations, Scudder Funds, Scudder, Stevens & Clark, Inc.; Assistant Vice President, Fidelity Investments | | 184 | | enaible, Inc. (artificial intelligence technology); Director, ISO New England, Inc. (non-profit organization managing regional electricity market) |
Beth Ann Brown – 1968 Trustee | | 2019 | | Independent Consultant Formerly: Head of Intermediary Distribution, Managing Director, Strategic Relations, Managing Director, Head of National Accounts, Senior Vice President, National Account Manager and Senior Vice President, Key Account Manager, Columbia Management Investment Advisers LLC; Vice President, Key Account Manager, Liberty Funds Distributor, Inc.; and Trustee of certain Oppenheimer Funds | | 184 | | Director, Board of Directors of Caron Engineering Inc.; Advisor, Board of Advisors of Caron Engineering Inc.; President and Director, Acton Shapleigh Youth Conservation Corps (non - profit); and President and Director of Grahamtastic Connection (non-profit) |
Jack M. Fields – 1952 Trustee | | 2003 | | Chief Executive Officer, Twenty First Century Group, Inc. (government affairs company); and Board Member, Impact(Ed) (non-profit) Formerly: Owner and Chief Executive Officer, Dos Angeles Ranch L.P. (cattle, hunting, corporate entertainment); Director, Insperity, Inc. (formerly known as Administaff) (human resources provider); Chief Executive Officer, Texana Timber LP (sustainable forestry company); Director of Cross Timbers Quail Research Ranch (non-profit); and member of the U.S. House of Representatives | | 184 | | Member, Board of Directors of Baylor College of Medicine |
Cynthia Hostetler – 1962 Trustee | | 2017 | | Non-Executive Director and Trustee of a number of public and private business corporations Formerly: Director, Aberdeen Investment Funds (4 portfolios); Director, Artio Global Investment LLC (mutual fund complex); Director, Edgen Group, Inc. (specialized energy and infrastructure products distributor); Head of Investment Funds and Private Equity, Overseas Private Investment Corporation; President, First Manhattan Bancorporation, Inc.; Attorney, Simpson Thacher & Bartlett LLP | | 184 | | Resideo Technologies, Inc. (smart home technology); Vulcan Materials Company (construction materials company); Trilinc Global Impact Fund; Genesee & Wyoming, Inc. (railroads); Investment Company Institute (professional organization); Independent Directors Council (professional organization);Eisenhower Foundation (non-profit) |
Eli Jones – 1961 Trustee | | 2016 | | Professor and Dean, Mays Business School - Texas A&M University Formerly: Professor and Dean, Walton College of Business, University of Arkansas and E.J. Ourso College of Business, Louisiana State University; Director, Arvest Bank | | 184 | | Insperity, Inc. (formerly known as Administaff) (human resources provider) |
T-2 Invesco Dividend Income Fund
Trustees and Officers–(continued)
| | | | | | | | |
Name, Year of Birth and Position(s) Held with the Trust | | Trustee and/or Officer Since | | Principal Occupation(s) During Past 5 Years | | Number of Funds in Fund Complex Overseen by Trustee | | Other Directorship(s) Held by Trustee During Past 5 Years |
Independent Trustees–(continued) | | | | |
Elizabeth Krentzman – 1959 Trustee | | 2019 | | Formerly: Principal and Chief Regulatory Advisor for Asset Management Services and U.S. Mutual Fund Leader of Deloitte & Touche LLP; General Counsel of the Investment Company Institute (trade association); National Director of the Investment Management Regulatory Consulting Practice, Principal, Director and Senior Manager of Deloitte & Touche LLP; Assistant Director of the Division of Investment Management - Office of Disclosure and Investment Adviser Regulation of the U.S. Securities and Exchange Commission and various positions with the Division of Investment Management - Office of Regulatory Policy of the U.S. Securities and Exchange Commission; Associate at Ropes & Gray LLP; and Trustee of certain Oppenheimer Funds | | 184 | | Trustee of the University of Florida National Board Foundation; Member of the Carita Funds Board of Directors (private investment funds); Member of the University of Florida Law Center Association, Inc. Board of Trustees and Audit Committee Member |
Anthony J. LaCava, Jr. – 1956 Trustee | | 2019 | | Formerly: Director and Member of the Audit Committee, Blue Hills Bank (publicly traded financial institution) and Managing Partner, KPMG LLP | | 184 | | Blue Hills Bank; Chairman, Bentley University; Member, Business School Advisory Council; and Nominating Committee KPMG LLP |
Prema Mathai-Davis – 1950 Trustee | | 2003 | | Retired Formerly: Co-Founder & Partner of Quantalytics Research, LLC, (a FinTech Investment Research Platform for the Self-Directed Investor); Trustee of YWCA Retirement Fund; CEO of YWCA of the USA; Board member of the NY Metropolitan Transportation Authority; Commissioner of the NYC Department of Aging; Board member of Johns Hopkins Bioethics Institute | | 184 | | None |
Joel W. Motley – 1952 Trustee | | 2019 | | Director of Office of Finance, Federal Home Loan Bank System; Managing Director of Carmona Motley Inc. (privately held financial advisor); Member of the Council on Foreign Relations and its Finance and Budget Committee; Chairman Emeritus of Board of Human Rights Watch and Member of its Investment Committee; and Member of Investment Committee and Board of Historic Hudson Valley (non-profit cultural organization) Formerly: Managing Director of Public Capital Advisors, LLC (privately held financial advisor); Managing Director of Carmona Motley Hoffman, Inc. (privately held financial advisor); Trustee of certain Oppenheimer Funds; Director of Columbia Equity Financial Corp. (privately held financial advisor); and Member of the Vestry of Trinity Church Wall Street | | 184 | | Member of Board of Greenwall Foundation (bioethics research foundation) and its Investment Committee; Member of Board of Friends of the LRC (non-profit legal advocacy); Board Member and Investment Committee Member of Pulitzer Center for Crisis Reporting (non-profit journalism) |
Teresa M. Ressel – 1962 Trustee | | 2017 | | Non-executive director and trustee of a number of public and private business corporations Formerly: Chief Executive Officer, UBS Securities LLC (investment banking); Chief Operating Officer, UBS AG Americas (investment banking); Sr. Management Team Olayan America, The Olayan Group (international investor/commercial/industrial); Assistant Secretary for Management & Budget and Designated Chief Financial Officer, U.S. Department of Treasury; Director, Atlantic Power Corporation (power generation company) and ON Semiconductor Corporation (semiconductor manufacturing) | | 184 | | Elucida Oncology (nanotechnology & medical particles company) |
T-3 Invesco Dividend Income Fund
Trustees and Officers–(continued)
| | | | | | | | |
Name, Year of Birth and Position(s) Held with the Trust | | Trustee and/or Officer Since | | Principal Occupation(s) During Past 5 Years | | Number of Funds in Fund Complex Overseen by Trustee | | Other Directorship(s) Held by Trustee During Past 5 Years |
| | | | | | | | | |
Independent Trustees–(continued) | | | | |
Ann Barnett Stern – 1957 Trustee | | 2017 | | President, Chief Executive Officer and Board Member, Houston Endowment, Inc. a private philanthropic institution Formerly: Executive Vice President, Texas Children’s Hospital; Vice President, General Counsel and Corporate Compliance Officer, Texas Children’s Hospital; Attorney at Beck, Redden and Secrest, LLP and Andrews and Kurth LLP | | 184 | | Director and Audit Committee member of Federal Reserve Bank of Dallas; Trustee and Board Chair of Good Reason Houston (nonprofit); Trustee, Vice Chair, Chair of Nomination/Governance Committee, Chair of Personnel Committee of Holdsworth Center (nonprofit); Trustee and Investment Committee member of University of Texas Law School Foundation (nonprofit); Board Member of Greater Houston Partnership |
Robert C. Troccoli – 1949 Trustee | | 2016 | | Retired Formerly: Adjunct Professor, University of Denver – Daniels College of Business; and Managing Partner, KPMG LLP | | 184 | | None |
Daniel S. Vandivort – 1954 Trustee | | 2019 | | Trustee, Board of Trustees, Huntington Disease Foundation of America; and President, Flyway Advisory Services LLC (consulting and property management) Formerly: Trustee and Governance Chair, of certain Oppenheimer Funds; and Treasurer, Chairman of the Audit and Finance Committee, Huntington Disease Foundation of America | | 184 | | None |
James D. Vaughn – 1945 Trustee | | 2019 | | Retired Formerly: Managing Partner, Deloitte & Touche LLP; Trustee and Chairman of the Audit Committee, Schroder Funds; Board Member, Mile High United Way, Boys and Girls Clubs, Boy Scouts, Colorado Business Committee for the Arts, Economic Club of Colorado and Metro Denver Network (economic development corporation); and Trustee of certain Oppenheimer Funds | | 184 | | Board member and Chairman of Audit Committee of AMG National Trust Bank; Trustee and Investment Committee member, University of South Dakota Foundation; Board member, Audit Committee Member and past Board Chair, Junior Achievement (non-profit) |
T-4 Invesco Dividend Income Fund
Trustees and Officers–(continued)
| | | | | | | | |
Name, Year of Birth and Position(s) Held with the Trust | | Trustee and/or Officer Since | | Principal Occupation(s) During Past 5 Years | | Number of Funds in Fund Complex Overseen by Trustee | | Other Directorship(s) Held by Trustee During Past 5 Years |
Officers | | | | | | | | |
Sheri Morris – 1964 President and Principal Executive Officer | | 2003 | | Head of Global Fund Services, Invesco Ltd.; President and Principal Executive Officer, The Invesco Funds; Senior Vice President, Invesco Advisers, Inc. (formerly known as Invesco Institutional (N.A.), Inc.) (registered investment adviser); and Vice President, Invesco Exchange-Traded Fund Trust, Invesco Exchange-Traded Fund Trust II, Invesco India Exchange-Traded Fund Trust, Invesco Actively Managed Exchange-Traded Fund Trust, Invesco Actively Managed Exchange-Traded Commodity Fund Trust and Invesco Exchange-Traded Self-Indexed Fund Trust; and Vice President, OppenheimerFunds, Inc. Formerly: Vice President, Treasurer and Principal Financial Officer, The Invesco Funds; Vice President, Invesco AIM Advisers, Inc., Invesco AIM Capital Management, Inc. and Invesco AIM Private Asset Management, Inc.; Assistant Vice President and Assistant Treasurer, The Invesco Funds; Vice President and Assistant Vice President, Invesco Advisers, Inc.; Assistant Vice President, Invesco AIM Capital Management, Inc. and Invesco AIM Private Asset Management, Inc.; and Treasurer, Invesco Exchange-Traded Fund Trust, Invesco Exchange-Traded Fund Trust II, Invesco India Exchange-Traded Fund Trust and Invesco Actively Managed Exchange-Traded Fund Trust | | N/A | | N/A |
Russell C. Burk – 1958 Senior Vice President and Senior Officer | | 2005 | | Senior Vice President and Senior Officer, The Invesco Funds | | N/A | | N/A |
Jeffrey H. Kupor – 1968 Senior Vice President, Chief Legal Officer and Secretary | | 2018 | | Head of Legal of the Americas, Invesco Ltd.; Senior Vice President and Secretary, Invesco Advisers, Inc. (formerly known as Invesco Institutional (N.A.), Inc.) (registered investment adviser); Senior Vice President and Secretary, Invesco Distributors, Inc. (formerly known as Invesco AIM Distributors, Inc.); Vice President and Secretary, Invesco Investment Services, Inc. (formerly known as Invesco AIM Investment Services, Inc.) Senior Vice President, Chief Legal Officer and Secretary, The Invesco Funds; Secretary and General Counsel, Invesco Investment Advisers LLC (formerly known as Van Kampen Asset Management); Secretary and General Counsel, Invesco Capital Markets, Inc. (formerly known as Van Kampen Funds Inc.) and Chief Legal Officer, Invesco Exchange-Traded Fund Trust, Invesco Exchange-Traded Fund Trust II, Invesco India Exchange-Traded Fund Trust, Invesco Actively Managed Exchange-Traded Fund Trust, Invesco Actively Managed Exchange-Traded Commodity Fund Trust and Invesco Exchange-Traded Self-Indexed Fund Trust; Secretary, Invesco Indexing LLC; Secretary, W.L. Ross & Co., LLC ; Secretary and Vice President, Harbourview Asset Management Corporation; Secretary and Vice President, OppenheimerFunds, Inc. and Invesco Managed Accounts, LLC; Secretary and Senior Vice President, OFI Global Institutional, Inc.; Secretary and Vice President, OFI SteelPath, Inc.; Secretary and Vice President, Oppenheimer Acquisition Corp.; Secretary and Vice President, Shareholder Services, Inc.; Secretary and Vice President, Trinity Investment Management Corporation Formerly: Secretary and Vice President, Jemstep, Inc.; Head of Legal, Worldwide Institutional, Invesco Ltd.; Secretary and General Counsel, INVESCO Private Capital Investments, Inc.; Senior Vice President, Secretary and General Counsel, Invesco Management Group, Inc. (formerly known as Invesco AIM Management Group, Inc.); Assistant Secretary, INVESCO Asset Management (Bermuda) Ltd.; Secretary and General Counsel, Invesco Private Capital, Inc.; Assistant Secretary and General Counsel, INVESCO Realty, Inc.; Secretary and General Counsel, Invesco Senior Secured Management, Inc.; and Secretary, Sovereign G./P. Holdings Inc. | | N/A | | N/A |
T-5 Invesco Dividend Income Fund
Trustees and Officers–(continued)
| | | | | | | | |
Name, Year of Birth and Position(s) Held with the Trust | | Trustee and/or Officer Since | | Principal Occupation(s) During Past 5 Years | | Number of Funds in Fund Complex Overseen by Trustee | | Other Directorship(s) Held by Trustee During Past 5 Years |
Officers–(continued) | | | | | | | | |
Andrew R. Schlossberg – 1974 Senior Vice President | | 2019 | | Head of the Americas and Senior Managing Director, Invesco Ltd.; Director and Senior Vice President, Invesco Advisers, Inc. (formerly known as Invesco Institutional (N.A.), Inc.) (registered investment adviser); Director and Chairman, Invesco Investment Services, Inc. (formerly known as Invesco AIM Investment Services, Inc.) (registered transfer agent); Senior Vice President, The Invesco Funds; Director, Invesco Investment Advisers LLC (formerly known as Van Kampen Asset Management); Director, President and Chairman, Invesco Insurance Agency, Inc. Formerly: Director, President and Chairman, Invesco Insurance Agency, Inc.; Director, Invesco UK Limited; Director and Chief Executive, Invesco Asset Management Limited and Invesco Fund Managers Limited; Assistant Vice President, The Invesco Funds; Senior Vice President, Invesco Advisers, Inc. (formerly known as Invesco Institutional (N.A.), Inc.) (registered investment adviser); Director and Chief Executive, Invesco Administration Services Limited and Invesco Global Investment Funds Limited; Director, Invesco Distributors, Inc.; Head of EMEA, Invesco Ltd.; President, Invesco Actively Managed Exchange-Traded Commodity Fund Trust, Invesco Actively Managed Exchange-Traded Fund Trust, Invesco Exchange-Traded Fund Trust, Invesco Exchange-Traded Fund Trust II and Invesco India Exchange-Traded Fund Trust; Managing Director and Principal Executive Officer, Invesco Capital Management LLC | | N/A | | N/A |
John M. Zerr – 1962 Senior Vice President | | 2006 | | Chief Operating Officer of the Americas; Senior Vice President, Invesco Advisers, Inc. (formerly known as Invesco Institutional (N.A.), Inc.) (registered investment adviser); Senior Vice President, Invesco Distributors, Inc. (formerly known as Invesco AIM Distributors, Inc.); Director and Vice President, Invesco Investment Services, Inc. (formerly known as Invesco AIM Investment Services, Inc.) Senior Vice President, The Invesco Funds; Managing Director, Invesco Capital Management LLC; Director, Invesco Investment Advisers LLC (formerly known as Van Kampen Asset Management); Senior Vice President, Invesco Capital Markets, Inc. (formerly known as Van Kampen Funds Inc.); Manager, Invesco Indexing LLC; Manager, Invesco Specialized Products, LLC; Member, Invesco Canada Funds Advisory Board; Director, President and Chief Executive Officer, Invesco Corporate Class Inc. (corporate mutual fund company); and Director, Chairman, President and Chief Executive Officer, Invesco Canada Ltd. (formerly known as Invesco Trimark Ltd./Invesco Trimark Ltèe) (registered investment adviser and registered transfer agent); President, Invesco, Inc.; President, Invesco Global Direct Real Estate Feeder GP Ltd.; President, Invesco IP Holdings(Canada) Ltd; President, Invesco Global Direct Real Estate GP Ltd.; President, Invesco Financial Services Ltd. / Services Financiers Invesco Ltée; President, Trimark Investments Ltd./Placements Trimark Ltée and Director and Chairman, Invesco Trust Company | | N/A | | N/A |
| | | | | Formerly: Director and Senior Vice President, Invesco Insurance Agency, Inc.; Director and Senior Vice President, Invesco Management Group, Inc. (formerly known as Invesco AIM Management Group, Inc.); Secretary and General Counsel, Invesco Management Group, Inc. (formerly known as Invesco AIM Management Group, Inc.); Secretary, Invesco Investment Services, Inc. (formerly known as Invesco AIM Investment Services, Inc.); Chief Legal Officer and Secretary, The Invesco Funds; Secretary and General Counsel, Invesco Investment Advisers LLC (formerly known as Van Kampen Asset Management); Secretary and General Counsel, Invesco Capital Markets, Inc. (formerly known as Van Kampen Funds Inc.); Chief Legal Officer, Invesco Exchange-Traded Fund Trust, Invesco Exchange-Traded Fund Trust II, Invesco India Exchange-Traded Fund Trust, Invesco Actively Managed Exchange-Traded Fund Trust, Invesco Actively Managed Exchange-Traded Commodity Fund Trust and Invesco Exchange-Traded Self-Indexed Fund Trust; Secretary, Invesco Indexing LLC; Director, Secretary, General Counsel and Senior Vice President, Van Kampen Exchange Corp.; Director, Vice President and Secretary, IVZ Distributors, Inc. (formerly known as INVESCO Distributors, Inc.); Director and Vice President, INVESCO Funds Group, Inc.; Director and Vice President, Van Kampen Advisors Inc.; Director, Vice President, Secretary and General Counsel, Van Kampen Investor Services Inc.; Director and Secretary, Invesco Distributors, Inc. (formerly known as Invesco AIM Distributors, Inc.); Director, Senior Vice President, General Counsel and Secretary, Invesco AIM Advisers, Inc. and Van Kampen Investments Inc.; Director, Vice President and Secretary, Fund Management Company; Director, Senior Vice President, Secretary, General Counsel and Vice President, Invesco AIM Capital Management, Inc.; Chief Operating Officer and General Counsel, Liberty Ridge Capital, Inc. (an investment adviser) | | | | |
T-6 Invesco Dividend Income Fund
Trustees and Officers–(continued)
| | | | | | | | |
Name, Year of Birth and Position(s) Held with the Trust | | Trustee and/or Officer Since | | Principal Occupation(s) During Past 5 Years | | Number of Funds in Fund Complex Overseen by Trustee | | Other Directorship(s) Held by Trustee During Past 5 Years |
Officers–(continued) | | | | | | | | |
| Gregory G. McGreevey – 1962 Senior Vice President | | 2012 | | Senior Managing Director, Invesco Ltd.; Director, Chairman, President, and Chief Executive Officer, Invesco Advisers, Inc. (formerly known as Invesco Institutional (N.A.), Inc.) (registered investment adviser); Director, Invesco Mortgage Capital, Inc. and Invesco Senior Secured Management, Inc.; and Senior Vice President, The Invesco Funds; and President, SNW Asset Management Corporation and Invesco Managed Accounts, LLC; Chairman and Director, Invesco Private Capital, Inc.; Chairman and Director, INVESCO Private Capital Investments, Inc.; Chairman and Director, INVESCO Realty, Inc. Chairman and Director, INVESCO Realty, Inc.; and Senior Vice President, Invesco Group Services, Inc. Formerly: Senior Vice President, Invesco Management Group, Inc. and Invesco Advisers, Inc.; Assistant Vice President, The Invesco Funds | | N/A | | N/A |
Adrien Deberghes – 1967 Principal Financial Officer, Treasurer and Vice President | | 2020 | | Head of the Fund Office of the CFO and Fund Administration; Vice President, Invesco Advisers, Inc.; Principal Financial Officer, Treasurer and Vice President, The Invesco Funds; Vice President, Invesco Exchange-Traded Fund Trust, Invesco Exchange-Traded Fund Trust II, Invesco India Exchange-Traded Fund Trust, Invesco Actively Managed Exchange-Traded Fund Trust, Invesco Actively Managed Exchange-Traded Commodity Fund Trust and Invesco Exchange-Traded Self-Indexed Fund Trust Formerly: Senior Vice President and Treasurer, Fidelity Investments | | N/A | | N/A |
Crissie M. Wisdom – 1969 Anti-Money Laundering Compliance Officer | | 2013 | | Anti-Money Laundering and OFAC Compliance Officer for Invesco U.S. entities including: Invesco Advisers, Inc. and its affiliates, Invesco Capital Markets, Inc., Invesco Distributors, Inc., Invesco Investment Services, Inc., The Invesco Funds, Invesco Capital Management, LLC, Invesco Trust Company; and Fraud Prevention Manager for Invesco Investment Services, Inc. | | N/A | | N/A |
Todd F. Kuehl – 1969 Chief Compliance Officer and Senior Vice President | | 2020 | | Chief Compliance Officer, Invesco Advisers, Inc. (registered investment adviser); and Chief Compliance Officer, The Invesco Funds and Senior Vice President Formerly: Managing Director and Chief Compliance Officer, Legg Mason (Mutual Funds); Chief Compliance Officer, Legg Mason Private Portfolio Group (registered investment adviser) | | N/A | | N/A |
Michael McMaster – 1962 Chief Tax Officer, Vice President and Assistant Treasurer | | 2020 | | Head of Global Fund Services Tax; Chief Tax Officer, Vice President and Assistant Treasurer, The Invesco Funds; Vice President, Invesco Advisers, Inc.; Assistant Treasurer, Invesco Capital Management LLC, Assistant Treasurer and Chief Tax Officer, Invesco Exchange-Traded Fund Trust, Invesco Exchange-Traded Fund Trust II, Invesco India Exchange-Traded Fund Trust, Invesco Actively Managed Exchange-Traded Fund Trust, Invesco Actively Managed Exchange-Traded Commodity Fund Trust and Invesco Exchange-Traded Self-Indexed Fund Trust; Assistant Treasurer, Invesco Specialized Products, LLC Formerly: Senior Vice President - Managing Director of Tax Services, U.S. Bank Global Fund Services (GFS) | | N/A | | N/A |
The Statement of Additional Information of the Trust includes additional information about the Fund’s Trustees and is available upon request, without charge, by calling 1.800.959.4246. Please refer to the Fund’s Statement of Additional Information for information on the Fund’s sub-advisers.
| | | | | | |
| Office of the Fund | | Investment Adviser | | Distributor | | Auditors |
| 11 Greenway Plaza, Suite 1000 | | Invesco Advisers, Inc. | | Invesco Distributors, Inc. | | PricewaterhouseCoopers LLP |
| Houston, TX 77046-1173 | | 1555 Peachtree Street, N.E. | | 11 Greenway Plaza, Suite 1000 | | 1000 Louisiana Street, Suite 5800 |
| | Atlanta, GA 30309 | | Houston, TX 77046-1173 | | Houston, TX 77002-5678 |
| | | |
| Counsel to the Fund | | Counsel to the Independent Trustees | | Transfer Agent | | Custodian |
| Stradley Ronon Stevens & Young, LLP | | Goodwin Procter LLP | | Invesco Investment Services, Inc. | | State Street Bank and Trust Company |
| 2005 Market Street, Suite 2600 | | 901 New York Avenue, N.W. | | 11 Greenway Plaza, Suite 1000 | | 225 Franklin Street |
| Philadelphia, PA 19103-7018 | | Washington, D.C. 20001 | | Houston, TX 77046-1173 | | Boston, MA 02110-2801 |
T-7 Invesco Dividend Income Fund
(This page intentionally left blank)

Go paperless with eDelivery
Visit invesco.com/edelivery to enjoy the convenience and security of anytime electronic access to your investment documents.
With eDelivery, you can elect to have any or all of the following materials delivered straight to your inbox to download, save and print from your own computer:
| ∎ | | Fund reports and prospectuses |
Invesco mailing information
Send general correspondence to Invesco Investment Services, Inc., P.O. Box 219078, Kansas City, MO 64121-9078.
Important notice regarding delivery of security holder documents
To reduce Fund expenses, only one copy of most shareholder documents may be mailed to shareholders with multiple accounts at the same address (Householding). Mailing of your shareholder documents may be householded indefinitely unless you instruct us otherwise. If you do not want the mailing of these documents to be combined with those for other members of your household, please contact Invesco Investment Services, Inc. at 800 959 4246 or contact your financial institution. We will begin sending you individual copies for each account within 30 days after receiving your request.
Fund holdings and proxy voting information
The Fund provides a complete list of its portfolio holdings four times each fiscal year, at the end of each fiscal quarter. For the second and fourth quarters, the list appears, respectively, in the Fund’s semiannual and annual reports to shareholders. For the first and third quarters, the Fund files the list with the Securities and Exchange Commission (SEC) as an exhibit to its reports on Form N-PORT. The most recent list of portfolio holdings is available at invesco.com/completeqtrholdings. Shareholders can also look up the Fund’s Form N-PORT filings on the SEC website, sec.gov. The SEC file numbers for the Fund are shown below.
A description of the policies and procedures that the Fund uses to determine how to vote proxies relating to portfolio securities is available without charge, upon request, from our Client Services department at 800 959 4246, or at invesco.com/corporate/about-us/esg. The information is also available on the SEC website, sec.gov.
| | |
Information regarding how the Fund voted proxies related to its portfolio securities during the most recent 12-month period ended June 30 is available at invesco.com/proxysearch. This information is also available on the SEC website, sec.gov. Invesco Advisers, Inc. is an investment adviser; it provides investment advisory services to individual and institutional clients and does not sell securities. Invesco Distributors, Inc. is the US distributor for Invesco Ltd.’s retail mutual funds, exchange-traded funds and institutional money market funds. Both are wholly owned, indirect subsidiaries of Invesco Ltd. | | |
| | | | | | |
| SEC file numbers: 811-03826 and 002-85905 | | Invesco Distributors, Inc. | | I-DIVI-AR-1 | | |
| | | | |
| | |
 | | Annual Report to Shareholders | | April 30, 2021 |
| | Invesco Energy Fund |
| | Nasdaq: | | |
| | A: IENAX ∎ C: IEFCX ∎ Y: IENYX ∎ Investor: FSTEX ∎ R5: IENIX ∎ R6: IENSX |

Management’s Discussion of Fund Performance
| | | | |
| Performance summary | |
| For the fiscal year ended April 30, 2021, Class A shares of Invesco Energy Fund (the Fund), at net asset value (NAV), outperformed the MSCI World Energy Index, the Fund’s style-specific benchmark. | |
| Your Fund’s long-term performance appears later in this report. | | | | |
| Fund vs. Indexes | |
| Total returns, 4/30/20 to 4/30/21, at net asset value (NAV). Performance shown does not include applicable contingent deferred sales charges (CDSC) or front-end sales charges, which would have reduced performance. | | | | |
| Class A Shares | | | 37.77 | % |
| Class C Shares | | | 36.87 | |
| Class Y Shares | | | 38.14 | |
| Investor Class Shares | | | 37.85 | |
| Class R5 Shares | | | 38.69 | |
| Class R6 Shares | | | 38.80 | |
| S&P 500 IndexÚ (Broad Market Index) | | | 45.98 | |
| MSCI World Energy IndexÚ (Style-Specific Index) | | | 30.59 | |
| Lipper Natural Resource Funds Index∎ (Peer Group Index) | | | 50.33 | |
| Source(s): ÚRIMES Technologies Corp.; ∎Lipper Inc. | | | | |
Market conditions and your Fund
As many businesses began to shut down in April 2020 due to the pandemic, US unemployment numbers continued to climb, as the economy ground to a halt. However, during the second and into the third quarter of 2020, US stocks largely shrugged off economic uncertainty, social unrest and a resurgence in coronavirus infections to rally from the market bottom. Investor sentiment improved in response to trillions of dollars in economic stimulus, progress on a coronavirus vaccine and re-openings in many US regions. In July, the US Federal Reserve (the Fed) extended its emergency stimulus programs, originally scheduled to end in September, to year-end, which provided support to equities. In late August, second-quarter gross domestic product (GDP) fell by 31.4%,1 a record decline. Despite the extreme drop in the economy, the S&P 500 Index not only erased all its losses from the first quarter but made record highs.
Despite a September selloff, US equity markets posted gains in the third quarter as the Fed extended its emergency stimulus programs and changed its inflation target policy, both of which supported equities. Data for both manufacturing and services indicated expansion, a reversal from significant declines earlier in the year. Corporate earnings were also better than anticipated and a gradual decline in new COVID-19 infections in many regions, combined with optimism about progress on a coronavirus vaccine, further boosted stocks. October saw increased volatility as COVID-19 infection rates rose to record highs in the US and Europe. Investors also became concerned about delayed results from the US presidential election and the real possibility of a contested election, further delaying a clear winner.
US equity markets posted gains in the fourth quarter, as positive news on COVID-19 vaccines and strong corporate earnings outweighed investor concerns about the political disagreement over a fiscal stimulus package and sharply rising coronavirus infections nationwide. Cyclical sectors like energy and financials led the way, while real estate and consumer staples lagged. Market leadership also shifted during the quarter with value stocks outperforming growth for the first time since the fourth quarter of 2016. While the US economy rebounded significantly since the pandemic began, the recovery appeared to slow in the fourth quarter with employment gains and GDP growth down from the third quarter. However, stocks were buoyed by the Fed’s pledge to maintain its accommodative stance and asset purchases, “until substantial further progress has been made” toward employment and inflation targets.
US political unrest and rising COVID-19 infection rates marked the start of the first quarter 2021. Additionally, retail investors bid up select stocks like GameStop and AMC Theaters, ultimately causing a sharp selloff in late January. Corporate earnings generally beat expectations, but market volatility rose during the quarter as investors worried about rising bond yields and inflation. Despite the Federal Reserve’s commitment to an accommodative policy, the 10-year US Treasury yield rose from 0.92% at year-end to 1.63%2 at the fiscal year-end. Approval of a third COVID-19 vaccine boosted investors optimism for faster economic recovery. Although March saw increased volatility with consecutive down days in the US stock market, stocks continued to hit all-time highs through April. US stocks had strong returns for the fiscal year, with the S&P 500 Index returning 45.98% for the year.3
Crude oil prices experienced unprecedented volatility as most countries’ economies came
to a stand-still. Crude prices also experienced an unprecedented “double black swan event” due to Saudi Arabia and Russia increasing supply to gain market share and global demand shocks from the COVID-19 virus. West Texas Intermediary crude was priced in the low $20s at the beginning of the period and recovered to the low-mid $60s by period end. Traditional oil and gas companies’ stock prices were already trading at a historic discount leading up to the pandemic but fell further as oil prices dropped. As oil prices recovered as global economies began to re-open, energy stock prices also recovered. From November of 2020 to the period end, the S&P 500 energy sector was the best performing sector, returning over 75%3 for that 6-month time frame.
The Fund outperformed its style-specific benchmark, the MSCI World Energy Index, for the fiscal year as a result of security selection. On the positive side, stock selection within oil & gas equipment and services was a large contributor. Baker Hughes and Tenaris S.A. were large contributors within the subindustry due to an overweight allocation versus the style-specific benchmark. Also, an overweight to stock selection within oil & gas exploration & production boosted relative performance versus the style-specific benchmark. Devon Energy, Diamondback Energy and Marathon Oil were top contributors within the sub-industry.
On the negative side, an underweight to stock selection within oil & gas refining & marketing was a large detractor. Not owning Marathon Petroleum and Neste were the largest detractors within the sub-industry to relative returns versus the style-specific benchmark. Also, cash which only averaged over 3%, detracted from relative returns. This is to be expected during periods of strong returns.
We continue to focus on companies with solid balance sheets and free cash flow, trading at a relatively low valuation. We remain cautiously optimistic about the longer-term outlook for the US and global economies. Though the distribution of coronavirus vaccines should provide a measure of stability, we believe equity markets and oil prices may experience continued volatility due to rising yields, increased COVID-19 infection rates in some US states and a massive resurgence of COVID-19 in India.
While oil prices may be headline news, the Fund should be considered a long-term investment. As always, thank you for your continued investment in Invesco Energy Fund.
| 1 | Source: US Bureau of Economic Analysis |
Portfolio manager(s):
Kevin Holt - Lead
Umang Khetan
2 Invesco Energy Fund
The views and opinions expressed in management’s discussion of Fund performance are those of Invesco Advisers, Inc. These views and opinions are subject to change at any time based on factors such as market and economic conditions. These views and opinions may not be relied upon as investment advice or recommendations, or as an offer for a particular security. The information is not a complete analysis of every aspect of any market, country, industry, security or the Fund. Statements of fact are from sources considered reliable, but Invesco Advisers, Inc. makes no representation or warranty as to their completeness or accuracy. Although historical performance is no guarantee of future results, these insights may help you understand our investment management philosophy.
See important Fund and, if applicable, index disclosures later in this report.
3 Invesco Energy Fund
Your Fund’s Long-Term Performance
Results of a $10,000 Investment — Oldest Share Class(es)
Fund and index data from 4/30/11
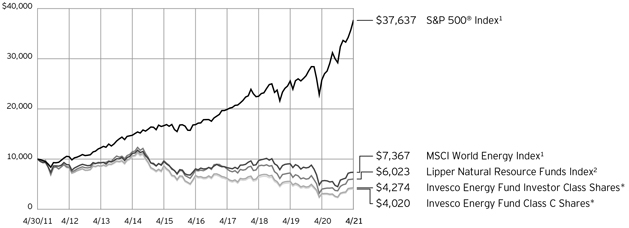
| 1 | Source: RIMES Technologies Corp. |
| * It | is Invesco’s policy to chart the Fund’s oldest share class(es). Because Inventor Class shares do not have a sales charge, we also show the oldest share class with a sales charge, Class C shares. |
Past performance cannot guarantee future results.
The data shown in the chart include reinvested distributions, applicable sales charges and Fund expenses including management
fees. Index results include reinvested dividends, but they do not reflect sales charges. Performance of the peer group, if applicable, reflects fund expenses and management fees;
performance of a market index does not. Performance shown in the chart does not reflect deduction of taxes a shareholder would pay on Fund distributions or sale of Fund shares.
4 Invesco Energy Fund
| | | | |
| Average Annual Total Returns | |
| As of 4/30/21, including maximum applicable sales charges | |
| |
| Class A Shares | | | | |
| Inception (3/28/02) | | | 2.29 | % |
| 10 Years | | | -8.67 | |
5 Years | | | -9.70 | |
1 Year | | | 30.21 | |
| |
| Class C Shares | | | | |
| Inception (2/14/00) | | | 3.88 | % |
| 10 Years | | | -8.71 | |
5 Years | | | -9.34 | |
1 Year | | | 35.87 | |
| |
| Class Y Shares | | | | |
| Inception (10/3/08) | | | -3.03 | % |
| 10 Years | | | -7.93 | |
5 Years | | | -8.44 | |
1 Year | | | 38.14 | |
| |
| Investor Class Shares | | | | |
| Inception (1/19/84) | | | 5.47 | % |
| 10 Years | | | -8.15 | |
5 Years | | | -8.66 | |
1 Year | | | 37.85 | |
| |
| Class R5 Shares | | | | |
| Inception (1/31/06) | | | -2.48 | % |
| 10 Years | | | -7.76 | |
5 Years | | | -8.23 | |
1 Year | | | 38.69 | |
| |
| Class R6 Shares | | | | |
| 10 Years | | | -7.96 | % |
5 Years | | | -8.28 | |
1 Year | | | 38.80 | |
Performance includes litigation proceeds. Had these proceeds not been received, total returns would have been lower.
Class R6 shares incepted on April 4, 2017. Performance shown prior to that date is that of Class A shares at net asset value and includes the 12b-1 fees applicable to Class A shares.
The performance data quoted represent past performance and cannot guarantee future results; current performance may be lower or higher. Please visit invesco.com/ performance for the most recent month-end performance. Performance figures reflect reinvested distributions, changes in net asset value and the effect of the maximum sales charge unless otherwise stated. Performance figures do not reflect deduction of taxes a shareholder would pay on Fund distributions or sale of Fund shares. Investment return and principal value will fluctuate so that you may have a gain or loss when you sell shares.
Class A share performance reflects the maximum 5.50% sales charge, and Class C share performance reflects the applicable contingent deferred sales charge (CDSC) for the period involved. The CDSC on Class C shares is 1% for the first year after purchase. Class Y, Investor Class, Class R5 and Class R6 shares do not have a front-
end sales charge or a CDSC; therefore, performance is at net asset value.
The performance of the Fund’s share classes will differ primarily due to different sales charge structures and class expenses.
Fund performance reflects any applicable fee waivers and/or expense reimbursements. Had the adviser not waived fees and/or reimbursed expenses currently or in the past, returns would have been lower. See current prospectus for more information.
5 Invesco Energy Fund
Supplemental Information
Invesco Energy Fund’s investment objective is long-term growth of capital.
| ∎ | | Unless otherwise stated, information presented in this report is as of April 30, 2021, and is based on total net assets. |
| ∎ | | Unless otherwise noted, all data is provided by Invesco. |
| ∎ | | To access your Fund’s reports/prospectus, visit invesco.com/fundreports. |
About indexes used in this report
| ∎ | | The S&P 500® Index is an unmanaged index considered representative of the US stock market. |
| ∎ | | The MSCI World Energy Index is designed to capture the performance of energy stocks across developed market countries. The index is computed using the net return, which withholds applicable taxes for non-resident investors. |
| ∎ | | The Lipper Natural Resource Funds Index is an unmanaged index considered representative of natural resource funds tracked by Lipper. |
| ∎ | | The Fund is not managed to track the performance of any particular index, including the index(es) described here, and consequently, the performance of the Fund may deviate significantly from the performance of the index(es). |
| ∎ | | A direct investment cannot be made in an index. Unless otherwise indicated, index results include reinvested dividends, and they do not reflect sales charges. Performance of the peer group, if applicable, reflects fund expenses; performance of a market index does not. |
Liquidity Risk Management Program
In compliance with Rule 22e-4 under the Investment Company Act of 1940, as amended (the “Liquidity Rule”), the Fund has adopted and implemented a liquidity risk management program in accordance with the Liquidity Rule (the “Program”). The Program is reasonably designed to assess and manage the Fund’s liquidity risk, which is the risk that the Fund could not meet redemption requests without significant dilution of remaining investors’ interests in the Fund. The Board of Trustees of the Fund (the “Board”) has appointed Invesco Advisers, Inc. (“Invesco”), the Fund’s investment adviser, as the Program’s administrator, and Invesco has delegated oversight of the Program to the Liquidity Risk Management Committee (the “Committee”), which is composed of senior representatives from relevant business groups at Invesco.
As required by the Liquidity Rule, the Program includes policies and procedures providing for an assessment, no less frequently
than annually, of the Fund’s liquidity risk that takes into account, as relevant to the Fund’s liquidity risk: (1) the Fund’s investment strategy and liquidity of portfolio investments during both normal and reasonably foreseeable stressed conditions; (2) short-term and long-term cash flow projections for the Fund during both normal and reasonably foreseeable stressed conditions; and (3) the Fund’s holdings of cash and cash equivalents and any borrowing arrangements. The Liquidity Rule also requires the classification of the Fund’s investments into categories that reflect the assessment of their relative liquidity under current market conditions. The Fund classifies its investments into one of four categories defined in the Liquidity Rule: “Highly Liquid,” “Moderately Liquid,” “Less Liquid,” and “Illiquid.” Funds that are not invested primarily in “Highly Liquid Investments” that are assets (cash or investments that are reasonably expected to be convertible into cash within three business days without significantly changing the market value of the investment) are required to establish a “Highly Liquid Investment Minimum” (“HLIM”), which is the minimum percentage of net assets that must be invested in Highly Liquid Investments. Funds with HLIMs have procedures for addressing HLIM shortfalls, including reporting to the Board and the SEC (on a non-public basis) as required by the Program and the Liquidity Rule. In addition, the Fund may not acquire an investment if, immediately after the acquisition, over 15% of the Fund’s net assets would consist of “Illiquid Investments” that are assets (an investment that cannot reasonably be expected to be sold or disposed of in current market conditions in seven calendar days or less without the sale or disposition significantly changing the market value of the investment). The Liquidity Rule and the Program also require reporting to the Board and the SEC (on a non-public basis) if a Fund’s holdings of Illiquid Investments exceed 15% of the Fund’s assets.
At a meeting held on March 22-24, 2021, the Committee presented a report to the Board that addressed the operation of the Program and assessed the Program’s adequacy and effectiveness of implementation
(the “Report”). The Report covered the period from January 1, 2020 through December 31, 2020 (the “Program Reporting Period”). The Report discussed notable events affecting liquidity over the Program Reporting Period, including the impact of the coronavirus pandemic on the Fund and the overall market. The Report noted that there were no material changes to the Program during the Program Reporting Period.
The Report stated, in relevant part, that during the Program Reporting Period:
| ∎ | | The Program, as adopted and implemented, remained reasonably designed to assess and manage the Fund’s liquidity risk and was operated effectively to achieve that goal; |
| ∎ | | The Fund’s investment strategy remained appropriate for an open-end fund; |
| ∎ | | The Fund was able to meet requests for redemption without significant dilution of remaining investors’ interests in the Fund; |
| ∎ | | The Fund did not breach the 15% limit on Illiquid Investments; and |
| ∎ | | The Fund primarily held Highly Liquid Investments and therefore has not adopted an HLIM. |
|
| This report must be accompanied or preceded by a currently effective Fund prospectus, which contains more complete information, including sales charges and expenses. Investors should read it carefully before investing. |
NOT FDIC INSURED | MAY LOSE VALUE | NO BANK GUARANTEE
6 Invesco Energy Fund
Fund Information
Portfolio Composition
| | |
| By industry | | % of total net assets |
Integrated Oil & Gas | | 42.36% |
Oil & Gas Exploration & Production | | 33.59 |
Oil & Gas Refining & Marketing | | 6.58 |
Oil & Gas Storage & Transportation | | 5.92 |
Investment Companies - Exchange-Traded Fund | | 4.82 |
Oil & Gas Equipment & Services | | 3.77 |
Money Market Funds Plus Other Assets Less Liabilities | | 2.96 |
Top 10 Equity Holdings*
| | | | |
| | | | | % of total net assets |
1. | | Chevron Corp. | | 7.65% |
2. | | Exxon Mobil Corp. | | 7.21 |
3. | | TOTAL SE | | 6.77 |
4. | | ConocoPhillips | | 5.36 |
5. | | Devon Energy Corp. | | 4.47 |
6. | | Pioneer Natural Resources Co. | | 4.42 |
7. | | Equinor ASA | | 4.15 |
8. | | Suncor Energy, Inc. | | 3.83 |
9. | | Cheniere Energy, Inc. | | 3.82 |
10. | | Energy Select Sector SPDR Fund | | 4.82 |
The Fund’s holdings are subject to change, and there is no assurance that the Fund will continue to hold any particular security.
* Excluding money market fund holdings, if any.
Data presented here are as of April 30, 2021.
7 Invesco Energy Fund
Schedule of Investments(a)
April 30, 2021
| | | | | | | | |
| | | Shares | | | Value | |
Common Stocks & Other Equity Interests–92.22% | |
Integrated Oil & Gas–42.36% | | | | | | | | |
BP PLC, ADR (United Kingdom) | | | 327,136 | | | $ | 8,230,742 | |
Cenovus Energy, Inc. (Canada) | | | 1,302,388 | | | | 10,140,221 | |
Chevron Corp. | | | 203,137 | | | | 20,937,331 | |
Eni S.p.A. (Italy) | | | 543,934 | | | | 6,490,168 | |
Equinor ASA (Norway) | | | 562,247 | | | | 11,372,482 | |
Exxon Mobil Corp. | | | 344,729 | | | | 19,732,288 | |
Royal Dutch Shell PLC, Class A, ADR (United Kingdom) | | | 264,499 | | | | 10,050,962 | |
Suncor Energy, Inc. (Canada) | | | 489,619 | | | | 10,472,345 | |
TOTAL SE (France) | | | 418,390 | | | | 18,523,333 | |
| | | | | | | | 115,949,872 | |
| |
Oil & Gas Equipment & Services–3.77% | | | | | |
Baker Hughes Co., Class A | | | 228,343 | | | | 4,585,127 | |
Tenaris S.A., ADR | | | 268,441 | | | | 5,739,269 | |
| | | | | | | | 10,324,396 | |
| |
Oil & Gas Exploration & Production–33.59% | | | | | |
APA Corp. | | | 451,119 | | | | 9,022,380 | |
Cabot Oil & Gas Corp. | | | 244,467 | | | | 4,075,265 | |
Canadian Natural Resources Ltd. (Canada) | | | 272,174 | | | | 8,261,654 | |
Cimarex Energy Co. | | | 152,116 | | | | 10,070,079 | |
ConocoPhillips | | | 286,751 | | | | 14,664,446 | |
Devon Energy Corp. | | | 523,015 | | | | 12,228,091 | |
Diamondback Energy, Inc. | | | 92,460 | | | | 7,556,756 | |
Hess Corp. | | | 83,518 | | | | 6,222,926 | |
Marathon Oil Corp. | | | 687,935 | | | | 7,746,148 | |
Pioneer Natural Resources Co. | | | 78,767 | | | | 12,116,728 | |
| | | | | | | | 91,964,473 | |
| | | | | | | | |
| | | Shares | | | Value | |
Oil & Gas Refining & Marketing–6.58% | | | | | |
Phillips 66 | | | 107,281 | | | $ | 8,680,106 | |
Valero Energy Corp. | | | 126,259 | | | | 9,338,115 | |
| | | | | | | | 18,018,221 | |
| |
Oil & Gas Storage & Transportation–5.92% | | | | | |
Cheniere Energy, Inc.(b) | | | 135,065 | | | | 10,470,239 | |
Plains All American Pipeline L.P. | | | 632,250 | | | | 5,740,830 | |
| | | | | | | | 16,211,069 | |
Total Common Stocks & Other Equity Interests
(Cost $277,700,537) | | | | 252,468,031 | |
| | |
Exchange-Traded Funds–4.82% | | | | | | | | |
Energy Select Sector SPDR Fund
(Cost $ 13,345,061) | | | 267,000 | | | | 13,187,130 | |
| | |
Money Market Funds–3.15% | | | | | | | | |
Invesco Government & Agency Portfolio, Institutional Class, 0.03%(c)(d) | | | 3,040,878 | | | | 3,040,878 | |
Invesco Liquid Assets Portfolio, Institutional Class, 0.01%(c)(d) | | | 2,102,536 | | | | 2,103,377 | |
Invesco Treasury Portfolio, Institutional Class, 0.01%(c)(d) | | | 3,475,289 | | | | 3,475,289 | |
Total Money Market Funds
(Cost $8,619,544) | | | | 8,619,544 | |
TOTAL INVESTMENTS IN SECURITIES–100.19%
(Cost $299,665,142) | | | | 274,274,705 | |
OTHER ASSETS LESS LIABILITIES—(0.19)% | | | | (518,182 | ) |
NET ASSETS–100.00% | | | | | | $ | 273,756,523 | |
Investment Abbreviations:
ADR – American Depositary Receipt
SPDR – Standard & Poor’s Depositary Receipt
Notes to Schedule of Investments:
| (a) | Industry and/or sector classifications used in this report are generally according to the Global Industry Classification Standard, which was developed by and is the exclusive property and a service mark of MSCI Inc. and Standard & Poor’s. |
| (b) | Non-income producing security. |
| (c) | Affiliated issuer. The issuer and/or the Fund is a wholly-owned subsidiary of Invesco Ltd., or is affiliated by having an investment adviser that is under common control of Invesco Ltd. The table below shows the Fund’s transactions in, and earnings from, its investments in affiliates for the fiscal year ended April 30, 2021. |
| | | | | | | | | | | | | | | | | | | | | | | | | | | | |
| | | Value April 30, 2020 | | | Purchases at Cost | | | Proceeds from Sales | | | Change in
Unrealized
Appreciation
(Depreciation) | | | Realized
Gain | | | Value
April 30, 2021 | | | Dividend
Income | |
Investments in Affiliated Money Market Funds: | | | | | | | | | | | | | | | | | | | | | | | | | | | | |
| |
Invesco Government & Agency Portfolio, Institutional Class | | $ | 3,580,599 | | | $ | 19,055,459 | | | $ | (19,595,180 | ) | | $ | - | | | $ | - | | | $ | 3,040,878 | | | $ | 1,220 | |
| |
Invesco Liquid Assets Portfolio, Institutional Class | | | 2,449,148 | | | | 13,611,042 | | | | (13,956,816 | ) | | | (597 | ) | | | 600 | | | | 2,103,377 | | | | 2,684 | |
| |
Invesco Treasury Portfolio, Institutional Class | | | 4,092,113 | | | | 21,777,667 | | | | (22,394,491 | ) | | | - | | | | - | | | | 3,475,289 | | | | 950 | |
| |
Investments Purchased with Cash Collateral from Securities on Loan: | | | | | | | | | | | | | | | | | | | | | | | | | | | | |
| |
Invesco Private Government Fund | | | - | | | | 55,415,376 | | | | (55,415,376 | ) | | | - | | | | - | | | | - | | | | 713 | * |
| |
Invesco Private Prime Fund | | | - | | | | 26,048,802 | | | | (26,049,135 | ) | | | - | | | | 333 | | | | - | | | | 1,149 | * |
| |
Total | | $ | 10,121,860 | | | $ | 135,908,346 | | | $ | (137,410,998 | ) | | $ | (597 | ) | | $ | 933 | | | $ | 8,619,544 | | | $ | 6,716 | |
| |
See accompanying Notes to Financial Statements which are an integral part of the financial statements.
8 Invesco Energy Fund
| | * | Represents the income earned on the investment of cash collateral, which is included in securities lending income on the Statement of Operations. Does not include rebates and fees paid to lending agent or premiums received from borrowers, if any. |
| (d) | The rate shown is the 7-day SEC standardized yield as of April 30, 2021. |
See accompanying Notes to Financial Statements which are an integral part of the financial statements.
9 Invesco Energy Fund
Statement of Assets and Liabilities
April 30, 2021
| | | | |
Assets: | | | | |
Investments in securities, at value
(Cost $291,045,598) | | $ | 265,655,161 | |
Investments in affiliated money market funds, at value (Cost $8,619,544) | | | 8,619,544 | |
Foreign currencies, at value (Cost $111,534) | | | 116,924 | |
Receivable for: | | | | |
Fund shares sold | | | 215,632 | |
Dividends | | | 159,150 | |
Investment for trustee deferred compensation and retirement plans | | | 253,323 | |
Other assets | | | 51,516 | |
Total assets | | | 275,071,250 | |
| |
Liabilities: | | | | |
Payable for: | | | | |
Fund shares reacquired | | | 507,690 | |
Amount due custodian | | | 170,027 | |
Accrued fees to affiliates | | | 233,618 | |
Accrued trustees’ and officers’ fees and benefits | | | 1,853 | |
Accrued other operating expenses | | | 131,529 | |
Trustee deferred compensation and retirement plans | | | 270,010 | |
Total liabilities | | | 1,314,727 | |
Net assets applicable to shares outstanding | | $ | 273,756,523 | |
| |
Net assets consist of: | | | | |
Shares of beneficial interest | | $ | 720,579,340 | |
Distributable earnings (loss) | | | (446,822,817 | ) |
| | | $ | 273,756,523 | |
| | | | |
Net Assets: | | | | |
Class A | | $ | 166,203,998 | |
Class C | | $ | 12,763,448 | |
Class Y | | $ | 29,497,051 | |
Investor Class | | $ | 61,754,127 | |
Class R5 | | $ | 2,488,043 | |
Class R6 | | $ | 1,049,856 | |
Shares outstanding, no par value, with an unlimited number of shares authorized: | |
Class A | | | 10,671,710 | |
Class C | | | 968,500 | |
Class Y | | | 1,891,593 | |
Investor Class | | | 3,982,424 | |
Class R5 | | | 155,324 | |
Class R6 | | | 65,547 | |
Class A: | | | | |
Net asset value per share | | $ | 15.57 | |
Maximum offering price per share
(Net asset value of $15.57 ÷ 94.50%) | | $ | 16.48 | |
Class C: | | | | |
Net asset value and offering price per share | | $ | 13.18 | |
Class Y: | | | | |
Net asset value and offering price per share | | $ | 15.59 | |
Investor Class: | | | | |
Net asset value and offering price per share | | $ | 15.51 | |
Class R5: | | | | |
Net asset value and offering price per share | | $ | 16.02 | |
Class R6: | | | | |
Net asset value and offering price per share | | $ | 16.02 | |
See accompanying Notes to Financial Statements which are an integral part of the financial statements.
10 Invesco Energy Fund
Statement of Operations
For the year ended April 30, 2021
| | | | |
Investment income: | | | | |
Dividends (net of foreign withholding taxes of $447,193) | | $ | 7,506,866 | |
| |
Dividends from affiliated money market funds (includes securities lending income of $47,719) | | | 52,573 | |
| |
Total investment income | | | 7,559,439 | |
| |
| |
Expenses: | | | | |
Advisory fees | | | 1,592,942 | |
| |
Administrative services fees | | | 22,269 | |
| |
Custodian fees | | | 13,762 | |
| |
Distribution fees: | | | | |
Class A | | | 325,374 | |
| |
Class C | | | 125,452 | |
| |
Investor Class | | | 125,801 | |
| |
Transfer agent fees - A, C, Y and Investor Class | | | 876,817 | |
| |
Transfer agent fees - R5 | | | 2,344 | |
| |
Transfer agent fees - R6 | | | 331 | |
| |
Trustees’ and officers’ fees and benefits | | | 25,475 | |
| |
Registration and filing fees | | | 82,203 | |
| |
Reports to shareholders | | | 88,098 | |
| |
Professional services fees | | | 46,947 | |
| |
Other | | | 14,486 | |
| |
Total expenses | | | 3,342,301 | |
| |
Less: Fees waived and/or expense offset arrangement(s) | | | (7,419 | ) |
| |
Net expenses | | | 3,334,882 | |
| |
Net investment income | | | 4,224,557 | |
| |
| |
Realized and unrealized gain (loss) from: | | | | |
Net realized gain (loss) from: | | | | |
Unaffiliated investment securities | | | (121,371,060 | ) |
| |
Affiliated investment securities | | | 933 | |
| |
Foreign currencies | | | 66,904 | |
| |
| | | (121,303,223 | ) |
| |
Change in net unrealized appreciation (depreciation) of: | | | | |
Unaffiliated investment securities | | | 187,937,341 | |
| |
Affiliated investment securities | | | (597 | ) |
| |
Foreign currencies | | | 10,188 | |
| |
| | | 187,946,932 | |
| |
Net realized and unrealized gain | | | 66,643,709 | |
| |
Net increase in net assets resulting from operations | | $ | 70,868,266 | |
| |
See accompanying Notes to Financial Statements which are an integral part of the financial statements.
11 Invesco Energy Fund
Statement of Changes in Net Assets
For the years ended April 30, 2021 and 2020
| | | | | | | | |
| | | 2021 | | | 2020 | |
Operations: | | | | | | | | |
Net investment income | | $ | 4,224,557 | | | $ | 7,252,128 | |
| |
Net realized gain (loss) | | | (121,303,223 | ) | | | (128,741,741 | ) |
| |
Change in net unrealized appreciation (depreciation) | | | 187,946,932 | | | | (39,419,004 | ) |
| |
Net increase (decrease) in net assets resulting from operations | | | 70,868,266 | | | | (160,908,617 | ) |
| |
| | |
Distributions to shareholders from distributable earnings: | | | | | | | | |
Class A | | | (2,747,153 | ) | | | (2,840,957 | ) |
| |
Class C | | | (246,215 | ) | | | (273,589 | ) |
| |
Class Y | | | (358,198 | ) | | | (430,547 | ) |
| |
Investor Class | | | (1,082,664 | ) | | | (1,179,125 | ) |
| |
Class R5 | | | (58,368 | ) | | | (70,758 | ) |
| |
Class R6 | | | (9,193 | ) | | | (9,338 | ) |
| |
Total distributions from distributable earnings | | | (4,501,791 | ) | | | (4,804,314 | ) |
| |
| | |
Share transactions–net: | | | | | | | | |
Class A | | | 3,760,649 | | | | (29,634,848 | ) |
| |
Class C | | | (4,431,573 | ) | | | (7,447,719 | ) |
| |
Class Y | | | 10,016,155 | | | | (10,082,858 | ) |
| |
Investor Class | | | (1,148,508 | ) | | | (10,795,182 | ) |
| |
Class R5 | | | (561,626 | ) | | | (1,548,796 | ) |
| |
Class R6 | | | 613,358 | | | | 140,389 | |
| |
Net increase (decrease) in net assets resulting from share transactions | | | 8,248,455 | | | | (59,369,014 | ) |
| |
Net increase (decrease) in net assets | | | 74,614,930 | | | | (225,081,945 | ) |
| |
| | |
Net assets: | | | | | | | | |
Beginning of year | | | 199,141,593 | | | | 424,223,538 | |
| |
End of year | | $ | 273,756,523 | | | $ | 199,141,593 | |
| |
See accompanying Notes to Financial Statements which are an integral part of the financial statements.
12 Invesco Energy Fund
Financial Highlights
The following schedule presents financial highlights for a share of the Fund outstanding throughout the periods indicated.
| | | | | | | | | | | | | | | | | | | | | | | | | | | | | | | | | | | | | | | | | | | | | | | | |
| | | | | | | | | | | | | | | | | | | | | | | | | | | Ratio of | | | Ratio of | | | | | | | |
| | | | | | | | | | | | | | | | | | | | | | | | | | | expenses | | | expenses | | | | | | | |
| | | | | | | | | Net gains | | | | | | | | | | | | | | | | | | to average | | | to average net | | | | | | | |
| | | | | | | | | (losses) | | | | | | | | | | | | | | | | | | net assets | | | assets without | | | Ratio of net | | | | |
| | | Net asset | | | | | | on securities | | | | | | Dividends | | | | | | | | | | | | with fee waivers | | | fee waivers | | | investment | | | | |
| | | value, | | | Net | | | (both | | | Total from | | | from net | | | Net asset | | | | | | Net assets, | | | and/or | | | and/or | | | income | | | | |
| | | beginning | | | investment | | | realized and | | | investment | | | investment | | | value, end | | | Total | | | end of period | | | expenses | | | expenses | | | to average | | | Portfolio | |
| | | of period | | | income(a) | | | unrealized) | | | operations | | | income | | | of period | | | return(b) | | | (000’s omitted) | | | absorbed | | | absorbed | | | net assets | | | turnover(c) | |
Class A | | | | | | | | | | | | | | | | | | | | | | | | | | | | | | | | | | | | | | | | | | | | | | | | |
Year ended 04/30/21 | | | $11.54 | | | | $0.25 | | | | $ 4.05 | | | | $ 4.30 | | | | $(0.27) | | | | $15.57 | | | | 37.77 | % | | | $166,204 | | | | 1.56 | %(d) | | | 1.56 | %(d) | | | 2.00 | %(d) | | | 68 | % |
Year ended 04/30/20 | | | 21.05 | | | | 0.41 | | | | (9.64 | ) | | | (9.23 | ) | | | (0.28 | ) | | | 11.54 | | | | (44.30 | ) | | | 121,102 | | | | 1.45 | | | | 1.45 | | | | 2.42 | | | | 16 | |
Year ended 04/30/19 | | | 25.91 | | | | 0.29 | | | | (4.61 | ) | | | (4.32 | ) | | | (0.54 | ) | | | 21.05 | | | | (16.48 | ) | | | 248,396 | | | | 1.32 | | | | 1.32 | | | | 1.25 | | | | 17 | |
Year ended 04/30/18 | | | 24.54 | | | | 0.49 | (e) | | | 1.44 | | | | 1.93 | | | | (0.56 | ) | | | 25.91 | | | | 8.08 | | | | 323,247 | | | | 1.33 | | | | 1.33 | | | | 2.07 | (e) | | | 9 | |
Year ended 04/30/17 | | | 27.04 | | | | 0.22 | | | | (2.41 | ) | | | (2.19 | ) | | | (0.31 | ) | | | 24.54 | | | | (8.29 | ) | | | 393,998 | | | | 1.27 | | | | 1.27 | | | | 0.84 | | | | 22 | |
Class C | | | | | | | | | | | | | | | | | | | | | | | | | | | | | | | | | | | | | | | | | | | | | | | | |
Year ended 04/30/21 | | | 9.82 | | | | 0.13 | | | | 3.44 | | | | 3.57 | | | | (0.21 | ) | | | 13.18 | | | | 36.87 | | | | 12,763 | | | | 2.31 | (d) | | | 2.31 | (d) | | | 1.25 | (d) | | | 68 | |
Year ended 04/30/20 | | | 17.99 | | | | 0.24 | | | | (8.22 | ) | | | (7.98 | ) | | | (0.19 | ) | | | 9.82 | | | | (44.72 | ) | | | 13,868 | | | | 2.20 | | | | 2.20 | | | | 1.67 | | | | 16 | |
Year ended 04/30/19 | | | 22.17 | | | | 0.10 | | | | (3.93 | ) | | | (3.83 | ) | | | (0.35 | ) | | | 17.99 | | | | (17.14 | ) | | | 33,036 | | | | 2.07 | | | | 2.07 | | | | 0.50 | | | | 17 | |
Year ended 04/30/18 | | | 20.88 | | | | 0.26 | (e) | | | 1.24 | | | | 1.50 | | | | (0.21 | ) | | | 22.17 | | | | 7.29 | | | | 92,349 | | | | 2.08 | | | | 2.08 | | | | 1.32 | (e) | | | 9 | |
Year ended 04/30/17 | | | 23.05 | | | | 0.02 | | | | (2.07 | ) | | | (2.05 | ) | | | (0.12 | ) | | | 20.88 | | | | (8.97 | ) | | | 120,722 | | | | 2.02 | | | | 2.02 | | | | 0.09 | | | | 22 | |
Class Y | | | | | | | | | | | | | | | | | | | | | | | | | | | | | | | | | | | | | | | | | | | | | | | | |
Year ended 04/30/21 | | | 11.54 | | | | 0.28 | | | | 4.06 | | | | 4.34 | | | | (0.29 | ) | | | 15.59 | | | | 38.14 | | | | 29,497 | | | | 1.31 | (d) | | | 1.31 | (d) | | | 2.25 | (d) | | | 68 | |
Year ended 04/30/20 | | | 21.04 | | | | 0.45 | | | | (9.64 | ) | | | (9.19 | ) | | | (0.31 | ) | | | 11.54 | | | | (44.17 | ) | | | 14,398 | | | | 1.20 | | | | 1.20 | | | | 2.67 | | | | 16 | |
Year ended 04/30/19 | | | 25.93 | | | | 0.35 | | | | (4.63 | ) | | | (4.28 | ) | | | (0.61 | ) | | | 21.04 | | | | (16.29 | ) | | | 38,550 | | | | 1.07 | | | | 1.07 | | | | 1.50 | | | | 17 | |
Year ended 04/30/18 | | | 24.63 | | | | 0.55 | (e) | | | 1.43 | | | | 1.98 | | | | (0.68 | ) | | | 25.93 | | | | 8.34 | | | | 56,061 | | | | 1.08 | | | | 1.08 | | | | 2.32 | (e) | | | 9 | |
Year ended 04/30/17 | | | 27.12 | | | | 0.29 | | | | (2.41 | ) | | | (2.12 | ) | | | (0.37 | ) | | | 24.63 | | | | (8.03 | ) | | | 63,783 | | | | 1.02 | | | | 1.02 | | | | 1.09 | | | | 22 | |
Investor Class | | | | | | | | | | | | | | | | | | | | | | | | | | | | | | | | | | | | | | | | | | | | | | | | |
Year ended 04/30/21 | | | 11.49 | | | | 0.25 | | | | 4.04 | | | | 4.29 | | | | (0.27 | ) | | | 15.51 | | | | 37.85 | | | | 61,754 | | | | 1.56 | (d) | | | 1.56 | (d) | | | 2.00 | (d) | | | 68 | |
Year ended 04/30/20 | | | 20.96 | | | | 0.40 | | | | (9.59 | ) | | | (9.19 | ) | | | (0.28 | ) | | | 11.49 | | | | (44.30 | ) | | | 47,046 | | | | 1.45 | | | | 1.45 | | | | 2.42 | | | | 16 | |
Year ended 04/30/19 | | | 25.80 | | | | 0.29 | | | | (4.59 | ) | | | (4.30 | ) | | | (0.54 | ) | | | 20.96 | | | | (16.47 | ) | | | 97,716 | | | | 1.32 | | | | 1.32 | | | | 1.25 | | | | 17 | |
Year ended 04/30/18 | | | 24.44 | | | | 0.49 | (e) | | | 1.43 | | | | 1.92 | | | | (0.56 | ) | | | 25.80 | | | | 8.07 | | | | 136,141 | | | | 1.33 | | | | 1.33 | | | | 2.07 | (e) | | | 9 | |
Year ended 04/30/17 | | | 26.93 | | | | 0.22 | | | | (2.40 | ) | | | (2.18 | ) | | | (0.31 | ) | | | 24.44 | | | | (8.29 | ) | | | 159,402 | | | | 1.27 | | | | 1.27 | | | | 0.84 | | | | 22 | |
Class R5 | | | | | | | | | | | | | | | | | | | | | | | | | | | | | | | | | | | | | | | | | | | | | | | | |
Year ended 04/30/21 | | | 11.83 | | | | 0.32 | | | | 4.19 | | | | 4.51 | | | | (0.32 | ) | | | 16.02 | | | | 38.69 | | | | 2,488 | | | | 0.99 | (d) | | | 0.99 | (d) | | | 2.57 | (d) | | | 68 | |
Year ended 04/30/20 | | | 21.54 | | | | 0.50 | | | | (9.87 | ) | | | (9.37 | ) | | | (0.34 | ) | | | 11.83 | | | | (44.03 | ) | | | 2,371 | | | | 0.96 | | | | 0.96 | | | | 2.91 | | | | 16 | |
Year ended 04/30/19 | | | 26.53 | | | | 0.40 | | | | (4.73 | ) | | | (4.33 | ) | | | (0.66 | ) | | | 21.54 | | | | (16.12 | ) | | | 6,052 | | | | 0.90 | | | | 0.90 | | | | 1.67 | | | | 17 | |
Year ended 04/30/18 | | | 25.23 | | | | 0.61 | (e) | | | 1.46 | | | | 2.07 | | | | (0.77 | ) | | | 26.53 | | | | 8.51 | | | | 8,092 | | | | 0.91 | | | | 0.91 | | | | 2.49 | (e) | | | 9 | |
Year ended 04/30/17 | | | 27.77 | | | | 0.34 | | | | (2.46 | ) | | | (2.12 | ) | | | (0.42 | ) | | | 25.23 | | | | (7.88 | ) | | | 8,871 | | | | 0.86 | | | | 0.86 | | | | 1.25 | | | | 22 | |
Class R6 | | | | | | | | | | | | | | | | | | | | | | | | | | | | | | | | | | | | | | | | | | | | | | | | |
Year ended 04/30/21 | | | 11.83 | | | | 0.34 | | | | 4.17 | | | | 4.51 | | | | (0.32 | ) | | | 16.02 | | | | 38.69 | | | | 1,050 | | | | 0.99 | (d) | | | 0.99 | (d) | | | 2.57 | (d) | | | 68 | |
Year ended 04/30/20 | | | 21.53 | | | | 0.49 | | | | (9.85 | ) | | | (9.36 | ) | | | (0.34 | ) | | | 11.83 | | | | (44.00 | ) | | | 357 | | | | 0.96 | | | | 0.96 | | | | 2.91 | | | | 16 | |
Year ended 04/30/19 | | | 26.52 | | | | 0.39 | | | | (4.72 | ) | | | (4.33 | ) | | | (0.66 | ) | | | 21.53 | | | | (16.11 | ) | | | 473 | | | | 0.89 | | | | 0.89 | | | | 1.68 | | | | 17 | |
Year ended 04/30/18 | | | 25.23 | | | | 0.62 | (e) | | | 1.46 | | | | 2.08 | | | | (0.79 | ) | | | 26.52 | | | | 8.55 | | | | 185 | | | | 0.90 | | | | 0.90 | | | | 2.50 | (e) | | | 9 | |
Period ended 04/30/17(f) | | | 26.31 | | | | 0.03 | | | | (1.11 | ) | | | (1.08 | ) | | | — | | | | 25.23 | | | | (4.11 | ) | | | 10 | | | | 0.81 | (g) | | | 0.81 | (g) | | | 1.30 | (g) | | | 22 | |
| (a) | Calculated using average shares outstanding. |
| (b) | Includes adjustments in accordance with accounting principles generally accepted in the United States of America and as such, the net asset value for financial reporting purposes and the returns based upon those net asset values may differ from the net asset value and returns for shareholder transactions. Does not include sales charges and is not annualized for periods less than one year, if applicable. |
| (c) | Portfolio turnover is calculated at the fund level and is not annualized for periods less than one year, if applicable. |
| (d) | Ratios are based on average daily net assets (000’s omitted) of $130,149, $12,545, $16,715, $50,320 , $2,344 and $318 for Class A, Class C, Class Y, Investor Class, Class R5 and Class R6 shares, respectively. |
| (e) | Net investment income (loss) per share and the ratio of net investment income (loss) to average net assets includes significant dividends received during the period. Net investment income (loss) per share and the ratio of net investment income (loss) to average net assets excluding the significant dividends are $0.32 and 0.87%, $0.09 and 0.12%, $0.38 and 1.12%, $0.32 and 0.87%, $0.44 and 1.29% and $0.45 and 1.30% for Class A, Class C, Class Y, Investor Class, Class R5 and Class R6 shares, respectively. |
| (f) | Commencement date of April 4, 2017. |
See accompanying Notes to Financial Statements which are an integral part of the financial statements.
13 Invesco Energy Fund
Notes to Financial Statements
April 30, 2021
NOTE 1—Significant Accounting Policies
Invesco Energy Fund (the “Fund”) is a series portfolio of AIM Sector Funds (Invesco Sector Funds) (the “Trust”). The Trust is a Delaware statutory trust registered under the Investment Company Act of 1940, as amended (the “1940 Act”), as an open-end series management investment company authorized to issue an unlimited number of shares of beneficial interest. Information presented in these financial statements pertains only to the Fund. Matters affecting the Fund or each class will be voted on exclusively by the shareholders of the Fund or each class.
The Fund’s investment objective is long-term growth of capital.
The Fund currently consists of six different classes of shares: Class A, Class C, Class Y, Investor Class, Class R5 and Class R6. Class Y and Investor Class shares are available only to certain investors. Class A shares are sold with a front-end sales charge unless certain waiver criteria are met and under certain circumstances load waived shares may be subject to contingent deferred sales charges (“CDSC”). Class C shares are sold with a CDSC. Class Y, Investor Class, Class R5 and Class R6 shares are sold at net asset value. Class C shares held for ten years after purchase are eligible for automatic conversion into Class A shares of the same Fund (the “Conversion Feature”). The automatic conversion pursuant to the Conversion Feature will generally occur at the end of the month following the tenth anniversary after a purchase of Class C shares. Effective November 30, 2020, the automatic conversion pursuant to the Conversion Feature changed from ten years to eight years. The first conversion of Class C shares to Class A shares occurred at the end of December 2020 for all Class C shares that were held for more than eight years as of November 30, 2020.
The Fund is an investment company and accordingly follows the investment company accounting and reporting guidance in accordance with Financial Accounting Standards Board Accounting Standards Codification Topic 946, Financial Services – Investment Companies.
The following is a summary of the significant accounting policies followed by the Fund in the preparation of its financial statements.
| A. | Security Valuations — Securities, including restricted securities, are valued according to the following policy. |
A security listed or traded on an exchange (except convertible securities) is valued at its last sales price or official closing price as of the close of the customary trading session on the exchange where the security is principally traded, or lacking any sales or official closing price on a particular day, the security may be valued at the closing bid price on that day. Securities traded in the over-the-counter market are valued based on prices furnished by independent pricing services or market makers. When such securities are valued by an independent pricing service they may be considered fair valued. Futures contracts are valued at the final settlement price set by an exchange on which they are principally traded. Listed options are valued at the mean between the last bid and asked prices from the exchange on which they are principally traded. Options not listed on an exchange are valued by an independent source at the mean between the last bid and asked prices. For purposes of determining net asset value (“NAV”) per share, futures and option contracts generally are valued 15 minutes after the close of the customary trading session of the New York Stock Exchange (“NYSE”).
Investments in open-end and closed-end registered investment companies that do not trade on an exchange are valued at the end-of-day net asset value per share. Investments in open-end and closed-end registered investment companies that trade on an exchange are valued at the last sales price or official closing price as of the close of the customary trading session on the exchange where the security is principally traded.
Debt obligations (including convertible securities) and unlisted equities are fair valued using an evaluated quote provided by an independent pricing service. Evaluated quotes provided by the pricing service may be determined without exclusive reliance on quoted prices, and may reflect appropriate factors such as institution-size trading in similar groups of securities, developments related to specific securities, dividend rate (for unlisted equities), yield (for debt obligations), quality, type of issue, coupon rate (for debt obligations), maturity (for debt obligations), individual trading characteristics and other market data. Pricing services generally value debt obligations assuming orderly transactions of institutional round lot size, but a fund may hold or transact in the same securities in smaller, odd lot sizes. Odd lots often trade at lower prices than institutional round lots. Debt obligations are subject to interest rate and credit risks. In addition, all debt obligations involve some risk of default with respect to interest and/or principal payments.
Foreign securities’ (including foreign exchange contracts) prices are converted into U.S. dollar amounts using the applicable exchange rates as of the close of the NYSE. If market quotations are available and reliable for foreign exchange-traded equity securities, the securities will be valued at the market quotations. Because trading hours for certain foreign securities end before the close of the NYSE, closing market quotations may become unreliable. If between the time trading ends on a particular security and the close of the customary trading session on the NYSE, events occur that the investment adviser determines are significant and make the closing price unreliable, the Fund may fair value the security. If the event is likely to have affected the closing price of the security, the security will be valued at fair value in good faith using procedures approved by the Board of Trustees. Adjustments to closing prices to reflect fair value may also be based on a screening process of an independent pricing service to indicate the degree of certainty, based on historical data, that the closing price in the principal market where a foreign security trades is not the current value as of the close of the NYSE. Foreign securities’ prices meeting the approved degree of certainty that the price is not reflective of current value will be priced at the indication of fair value from the independent pricing service. Multiple factors may be considered by the independent pricing service in determining adjustments to reflect fair value and may include information relating to sector indices, American Depositary Receipts and domestic and foreign index futures. Foreign securities may have additional risks including exchange rate changes, potential for sharply devalued currencies and high inflation, political and economic upheaval, the relative lack of issuer information, relatively low market liquidity and the potential lack of strict financial and accounting controls and standards.
Securities for which market prices are not provided by any of the above methods may be valued based upon quotes furnished by independent sources. The last bid price may be used to value equity securities. The mean between the last bid and asked prices is used to value debt obligations, including corporate loans.
Securities for which market quotations are not readily available or became unreliable are valued at fair value as determined in good faith by or under the supervision of the Trust’s officers following procedures approved by the Board of Trustees. Issuer specific events, market trends, bid/asked quotes of brokers and information providers and other market data may be reviewed in the course of making a good faith determination of a security’s fair value.
The Fund may invest in securities that are subject to interest rate risk, meaning the risk that the prices will generally fall as interest rates rise and, conversely, the prices will generally rise as interest rates fall. Specific securities differ in their sensitivity to changes in interest rates depending on their individual characteristics. Changes in interest rates may result in increased market volatility, which may affect the value and/or liquidity of certain Fund investments.
Valuations change in response to many factors including the historical and prospective earnings of the issuer, the value of the issuer’s assets, general market conditions which are not specifically related to the particular issuer, such as real or perceived adverse economic conditions, changes in the general outlook for revenues or corporate earnings, changes in interest or currency rates, regional or global instability, natural or environmental disasters, widespread disease or other public health issues, war, acts of terrorism or adverse investor sentiment generally and market liquidity. Because of the inherent uncertainties of valuation, the values reflected in the financial statements may materially differ from the value received upon actual sale of those investments.
| B. | Securities Transactions and Investment Income — Securities transactions are accounted for on a trade date basis. Realized gains or losses on sales are computed on the basis of specific identification of the securities sold. Interest income (net of withholding tax, if any) is recorded on an accrual basis from |
14 Invesco Energy Fund
| | settlement date and includes coupon interest and amortization of premium and accretion of discount on debt securities as applicable. Dividend income (net of withholding tax, if any) is recorded on the ex-dividend date. |
The Fund may periodically participate in litigation related to Fund investments. As such, the Fund may receive proceeds from litigation settlements. Any proceeds received are included in the Statement of Operations as realized gain (loss) for investments no longer held and as unrealized gain (loss) for investments still held.
Brokerage commissions and mark ups are considered transaction costs and are recorded as an increase to the cost basis of securities purchased and/or a reduction of proceeds on a sale of securities. Such transaction costs are included in the determination of net realized and unrealized gain (loss) from investment securities reported in the Statement of Operations and the Statement of Changes in Net Assets and the net realized and unrealized gains (losses) on securities per share in the Financial Highlights. Transaction costs are included in the calculation of the Fund’s net asset value and, accordingly, they reduce the Fund’s total returns. These transaction costs are not considered operating expenses and are not reflected in net investment income reported in the Statement of Operations and the Statement of Changes in Net Assets, or the net investment income per share and the ratios of expenses and net investment income reported in the Financial Highlights, nor are they limited by any expense limitation arrangements between the Fund and the investment adviser.
The Fund allocates income and realized and unrealized capital gains and losses to a class based on the relative net assets of each class.
| C. | Country Determination — For the purposes of making investment selection decisions and presentation in the Schedule of Investments, the investment adviser may determine the country in which an issuer is located and/or credit risk exposure based on various factors. These factors include the laws of the country under which the issuer is organized, where the issuer maintains a principal office, the country in which the issuer derives 50% or more of its total revenues and the country that has the primary market for the issuer’s securities, as well as other criteria. Among the other criteria that may be evaluated for making this determination are the country in which the issuer maintains 50% or more of its assets, the type of security, financial guarantees and enhancements, the nature of the collateral and the sponsor organization. Country of issuer and/or credit risk exposure has been determined to be the United States of America, unless otherwise noted. |
| D. | Distributions – Distributions from net investment income and net realized capital gain, if any, are generally declared and paid annually and recorded on the ex-dividend date. The Fund may elect to treat a portion of the proceeds from redemptions as distributions for federal income tax purposes. |
| E. | Federal Income Taxes – The Fund intends to comply with the requirements of Subchapter M of the Internal Revenue Code of 1986, as amended (the “Internal Revenue Code”), necessary to qualify as a regulated investment company and to distribute substantially all of the Fund’s taxable earnings to shareholders. As such, the Fund will not be subject to federal income taxes on otherwise taxable income (including net realized capital gain) that is distributed to shareholders. Therefore, no provision for federal income taxes is recorded in the financial statements. |
The Fund recognizes the tax benefits of uncertain tax positions only when the position is more likely than not to be sustained. Management has analyzed the Fund’s uncertain tax positions and concluded that no liability for unrecognized tax benefits should be recorded related to uncertain tax positions. Management is not aware of any tax positions for which it is reasonably possible that the total amounts of unrecognized tax benefits will change materially in the next 12 months.
The Fund files tax returns in the U.S. Federal jurisdiction and certain other jurisdictions. Generally, the Fund is subject to examinations by such taxing authorities for up to three years after the filing of the return for the tax period.
| F. | Expenses – Fees provided for under the Rule 12b-1 plan of a particular class of the Fund are charged to the operations of such class. Transfer agency fees and expenses and other shareholder recordkeeping fees and expenses attributable to Class R5 and Class R6 are allocated to each share class based on relative net assets. Sub-accounting fees attributable to Class R5 are charged to the operations of the class. Transfer agency fees and expenses and other shareholder recordkeeping fees and expenses relating to all other classes are allocated among those classes based on relative net assets. All other expenses are allocated among the classes based on relative net assets. |
| G. | Accounting Estimates – The preparation of financial statements in conformity with accounting principles generally accepted in the United States of America (“GAAP”) requires management to make estimates and assumptions that affect the reported amounts of assets and liabilities at the date of the financial statements and the reported amounts of revenues and expenses during the reporting period including estimates and assumptions related to taxation. Actual results could differ from those estimates by a significant amount. In addition, the Fund monitors for material events or transactions that may occur or become known after the period-end date and before the date the financial statements are released to print. |
| H. | Indemnifications – Under the Trust’s organizational documents, each Trustee, officer, employee or other agent of the Trust is indemnified against certain liabilities that may arise out of the performance of their duties to the Fund. Additionally, in the normal course of business, the Fund enters into contracts, including the Fund’s servicing agreements, that contain a variety of indemnification clauses. The Fund’s maximum exposure under these arrangements is unknown as this would involve future claims that may be made against the Fund that have not yet occurred. The risk of material loss as a result of such indemnification claims is considered remote. |
| I. | Securities Lending – The Fund may lend portfolio securities having a market value up to one-third of the Fund’s total assets. Such loans are secured by collateral equal to no less than the market value of the loaned securities determined daily by the securities lending provider. Such collateral will be cash or debt securities issued or guaranteed by the U.S. Government or any of its sponsored agencies. Cash collateral received in connection with these loans is invested in short-term money market instruments or affiliated money market funds and is shown as such on the Schedule of Investments. The Fund bears the risk of loss with respect to the investment of collateral. It is the Fund’s policy to obtain additional collateral from or return excess collateral to the borrower by the end of the next business day, following the valuation date of the securities loaned. Therefore, the value of the collateral held may be temporarily less than the value of the securities on loan. When loaning securities, the Fund retains certain benefits of owning the securities, including the economic equivalent of dividends or interest generated by the security. Lending securities entails a risk of loss to the Fund if, and to the extent that, the market value of the securities loaned were to increase and the borrower did not increase the collateral accordingly, and the borrower failed to return the securities. The securities loaned are subject to termination at the option of the borrower or the Fund. Upon termination, the borrower will return to the Fund the securities loaned and the Fund will return the collateral. Upon the failure of the borrower to return the securities, collateral may be liquidated and the securities may be purchased on the open market to replace the loaned securities. The Fund could experience delays and costs in gaining access to the collateral and the securities may lose value during the delay which could result in potential losses to the Fund. Some of these losses may be indemnified by the lending agent. The Fund bears the risk of any deficiency in the amount of the collateral available for return to the borrower due to any loss on the collateral invested. Dividends received on cash collateral investments for securities lending transactions, which are net of compensation to counterparties, are included in Dividends from affiliated money market funds on the Statement of Operations. The aggregate value of securities out on loan, if any, is shown as a footnote on the Statement of Assets and Liabilities. |
| J. | Foreign Currency Translations — Foreign currency is valued at the close of the NYSE based on quotations posted by banks and major currency dealers. Portfolio securities and other assets and liabilities denominated in foreign currencies are translated into U.S. dollar amounts at the date of valuation. Purchases and sales of portfolio securities (net of foreign taxes withheld on disposition) and income items denominated in foreign currencies are translated into U.S. dollar amounts on the respective dates of such transactions. The Fund does not separately account for the portion of the results of operations resulting from changes in foreign exchange rates on investments and the fluctuations arising from changes in market prices of securities held. The combined results of changes in foreign exchange rates and the fluctuation of market prices on investments (net of estimated foreign tax withholding) are included with the net realized and unrealized gain or loss from investments in the Statement of Operations. Reported net realized foreign currency gains or losses arise from (1) sales of foreign currencies, (2) currency gains or losses realized between the trade and settlement dates on securities transactions, and (3) the difference between the amounts of dividends, interest, and foreign withholding taxes recorded on the Fund’s books and the U.S. dollar equivalent of the amounts actually received or paid. Net unrealized |
15 Invesco Energy Fund
| | foreign currency gains and losses arise from changes in the fair values of assets and liabilities, other than investments in securities at fiscal period end, resulting from changes in exchange rates. |
The Fund may invest in foreign securities, which may be subject to foreign taxes on income, gains on investments or currency repatriation, a portion of which may be recoverable. Foreign taxes, if any, are recorded based on the tax regulations and rates that exist in the foreign markets in which the Fund invests and are shown in the Statement of Operations.
| K. | Forward Foreign Currency Contracts — The Fund may engage in foreign currency transactions either on a spot (i.e. for prompt delivery and settlement) basis, or through forward foreign currency contracts, to manage or minimize currency or exchange rate risk. |
The Fund may also enter into forward foreign currency contracts for the purchase or sale of a security denominated in a foreign currency in order to “lock in” the U.S. dollar price of that security, or the Fund may also enter into forward foreign currency contracts that do not provide for physical settlement of the two currencies, but instead are settled by a single cash payment calculated as the difference between the agreed upon exchange rate and the spot rate at settlement based upon an agreed upon notional amount (non-deliverable forwards). The Fund will set aside liquid assets in an amount equal to the daily mark-to-market obligation for forward foreign currency contracts.
A forward foreign currency contract is an obligation between two parties (“Counterparties”) to purchase or sell a specific currency for an agreed-upon price at a future date. The use of forward foreign currency contracts does not eliminate fluctuations in the price of the underlying securities the Fund owns or intends to acquire but establishes a rate of exchange in advance. Fluctuations in the value of these contracts are measured by the difference in the contract date and reporting date exchange rates and are recorded as unrealized appreciation (depreciation) until the contracts are closed. When the contracts are closed, realized gains (losses) are recorded. Realized and unrealized gains (losses) on the contracts are included in the Statement of Operations. The primary risks associated with forward foreign currency contracts include failure of the Counterparty to meet the terms of the contract and the value of the foreign currency changing unfavorably. These risks may be in excess of the amounts reflected in the Statement of Assets and Liabilities.
| L. | COVID-19 Risk - The COVID-19 strain of coronavirus has resulted in instances of market closures and dislocations, extreme volatility, liquidity constraints and increased trading costs. Efforts to contain its spread have resulted in travel restrictions, disruptions of healthcare systems, business operations and supply chains, layoffs, lower consumer demand, and defaults, among other significant economic impacts that have disrupted global economic activity across many industries. Such economic impacts may exacerbate other pre-existing political, social and economic risks locally or globally. |
The ongoing effects of COVID-19 are unpredictable and may result in significant and prolonged effects on the Fund’s performance.
| M. | Other Risks - The Fund’s investments are concentrated in a comparatively narrow segment of the economy, which may make the Fund more volatile. |
The businesses in which the Fund invests may be adversely affected by foreign, federal or state regulations governing energy production, distribution and sale. Although individual security selection drives the performance of the Fund, short-term fluctuations in commodity prices may cause price fluctuations in its shares.
NOTE 2—Advisory Fees and Other Fees Paid to Affiliates
The Trust has entered into a master investment advisory agreement with Invesco Advisers, Inc. (the “Adviser” or “Invesco”). Under the terms of the investment advisory agreement, the Fund accrues daily and pays monthly an advisory fee to the Adviser based on the annual rate of the Fund’s average daily net assets as follows:
| | | | |
| Average Daily Net Assets | | Rate | |
First $350 million | | | 0.750 | % |
Next $350 million | | | 0.650 | % |
Next $1.3 billion | | | 0.550 | % |
Next $2 billion | | | 0.450 | % |
Next $2 billion | | | 0.400 | % |
Next $2 billion | | | 0.375 | % |
Over $8 billion | | | 0.350 | % |
For the year ended April 30, 2021, the effective advisory fee rate incurred by the Fund was 0.75%.
Under the terms of a master sub-advisory agreement between the Adviser and each of Invesco Asset Management Deutschland GmbH, Invesco Asset Management Limited, Invesco Asset Management (Japan) Limited, Invesco Hong Kong Limited, Invesco Senior Secured Management, Inc. and Invesco Canada Ltd. (collectively, the “Affiliated Sub-Advisers”) the Adviser, not the Fund, will pay 40% of the fees paid to the Adviser to any such Affiliated Sub-Adviser(s) that provide(s) discretionary investment management services to the Fund based on the percentage of assets allocated to such Affiliated Sub-Adviser(s).
The Adviser has contractually agreed, through at least June 30, 2022, to waive advisory fees and/or reimburse expenses of all shares to the extent necessary to limit total annual fund operating expenses after fee waiver and/or expense reimbursement (excluding certain items discussed below) of Class A, Class C, Class Y, Investor Class, Class R5 and Class R6 shares to 2.00%, 2.75%, 1.75%, 2.00%, 1.75% and 1.75%, respectively, of the Fund’s average daily net assets (the “expense limits”). In determining the Adviser’s obligation to waive advisory fees and/or reimburse expenses, the following expenses are not taken into account, and could cause the total annual fund operating expenses after fee waivers and/or expense reimbursement to exceed the numbers reflected above: (1) interest; (2) taxes; (3) dividend expense on short sales; (4) extraordinary or non-routine items, including litigation expenses; and (5) expenses that the Fund has incurred but did not actually pay because of an expense offset arrangement. Unless Invesco continues the fee waiver agreement, it will terminate on June 30, 2022. During its term, the fee waiver agreement cannot be terminated or amended to increase the expense limits or reduce the advisory fee waiver without approval of the Board of Trustees. The Adviser did not waive fees and/or reimburse expenses during the period under these expense limits.
Further, the Adviser has contractually agreed, through at least June 30, 2023, to waive the advisory fee payable by the Fund in an amount equal to 100% of the net advisory fees the Adviser receives from the affiliated money market funds on investments by the Fund of uninvested cash (excluding investments of cash collateral from securities lending) in such affiliated money market funds.
For the year ended April 30, 2021, the Adviser waived advisory fees of $5,680.
The Trust has entered into a master administrative services agreement with Invesco pursuant to which the Fund has agreed to pay Invesco for certain administrative costs incurred in providing accounting services to the Fund. For the year ended April 30, 2021, expenses incurred under the agreement are shown in the Statement of Operations as Administrative services fees. Invesco has entered into a sub-administration agreement whereby State Street Bank and Trust Company (“SSB”) serves as fund accountant and provides certain administrative services to the Fund. Pursuant to a custody agreement with the Trust on behalf of the Fund, SSB also serves as the Fund’s custodian.
The Trust has entered into a transfer agency and service agreement with Invesco Investment Services, Inc. (“IIS”) pursuant to which the Fund has agreed to pay IIS a fee for providing transfer agency and shareholder services to the Fund and reimburse IIS for certain expenses incurred by IIS in the course of providing such services. IIS may make payments to intermediaries that provide omnibus account services, sub-accounting services and/or networking services. All fees payable by IIS to intermediaries that provide omnibus account services or sub-accounting services are charged back to the Fund, subject to certain limitations approved by the Trust’s Board of Trustees. For the year ended April 30, 2021, expenses incurred under the agreement are shown in the Statement of Operations as Transfer agent fees.
16 Invesco Energy Fund
The Trust has entered into master distribution agreements with Invesco Distributors, Inc. (“IDI”) to serve as the distributor for the Class A, Class C, Class Y, Investor Class, Class R5 and Class R6 shares of the Fund. The Trust has adopted plans pursuant to Rule 12b-1 under the 1940 Act with respect to the Fund’s Class A, Class C and Investor Class shares (collectively, the “Plans”). The Fund, pursuant to the Plans, pays IDI compensation at the annual rate of 0.25% of the Fund’s average daily net assets of Class A shares, 1.00% of the average daily net assets of Class C shares and 0.25% of the average daily net assets of Investor Class shares. The fees are accrued daily and paid monthly. Of the Plan payments, up to 0.25% of the average daily net assets of each class of shares may be paid to furnish continuing personal shareholder services to customers who purchase and own shares of such classes. Any amounts not paid as a service fee under the Plans would constitute an asset-based sales charge. Rules of the Financial Industry Regulatory Authority (“FINRA”) impose a cap on the total sales charges, including asset-based sales charges, that may be paid by any class of shares of the Fund. For the year ended April 30, 2021, expenses incurred under the Plans are shown in the Statement of Operations as Distribution fees.
Front-end sales commissions and CDSC (collectively, the “sales charges”) are not recorded as expenses of the Fund. Front-end sales commissions are deducted from proceeds from the sales of Fund shares prior to investment in Class A shares of the Fund. CDSC are deducted from redemption proceeds prior to remittance to the shareholder. During the year ended April 30, 2021, IDI advised the Fund that IDI retained $33,915 in front-end sales commissions from the sale of Class A shares and $82 and $3,132 from Class A and Class C shares, respectively, for CDSC imposed upon redemptions by shareholders.
For the year ended April 30, 2021, the Fund incurred $1,818 in brokerage commissions with Invesco Capital Markets, Inc., an affiliate of the Adviser and IDI, for portfolio transactions executed on behalf of the Fund.
Certain officers and trustees of the Trust are officers and directors of the Adviser, IIS and/or IDI.
NOTE 3—Additional Valuation Information
GAAP defines fair value as the price that would be received to sell an asset or paid to transfer a liability in an orderly transaction between market participants at the measurement date, under current market conditions. GAAP establishes a hierarchy that prioritizes the inputs to valuation methods, giving the highest priority to readily available unadjusted quoted prices in an active market for identical assets (Level 1) and the lowest priority to significant unobservable inputs (Level 3), generally when market prices are not readily available or are unreliable. Based on the valuation inputs, the securities or other investments are tiered into one of three levels. Changes in valuation methods may result in transfers in or out of an investment’s assigned level:
| | |
| Level 1 – | | Prices are determined using quoted prices in an active market for identical assets. |
| Level 2 – | | Prices are determined using other significant observable inputs. Observable inputs are inputs that other market participants may use in pricing a security. These may include quoted prices for similar securities, interest rates, prepayment speeds, credit risk, yield curves, loss severities, default rates, discount rates, volatilities and others. |
| Level 3 – | | Prices are determined using significant unobservable inputs. In situations where quoted prices or observable inputs are unavailable (for example, when there is little or no market activity for an investment at the end of the period), unobservable inputs may be used. Unobservable inputs reflect the Fund’s own assumptions about the factors market participants would use in determining fair value of the securities or instruments and would be based on the best available information. |
The following is a summary of the tiered valuation input levels, as of April 30, 2021. The level assigned to the securities valuations may not be an indication of the risk or liquidity associated with investing in those securities. Because of the inherent uncertainties of valuation, the values reflected in the financial statements may materially differ from the value received upon actual sale of those investments.
| | | | | | | | | | | | | | | | |
| | | Level 1 | | | Level 2 | | | Level 3 | | | Total | |
Investments in Securities | | | | | | | | | | | | | | | | |
| |
Common Stocks & Other Equity Interests | | | $216,082,048 | | | | $36,385,983 | | | | $- | | | | $252,468,031 | |
| |
Exchange-Traded Funds | | | 13,187,130 | | | | - | | | | - | | | | 13,187,130 | |
| |
Money Market Funds | | | 8,619,544 | | | | - | | | | - | | | | 8,619,544 | |
| |
Total Investments | | | $237,888,722 | | | | $36,385,983 | | | | $- | | | | $274,274,705 | |
| |
NOTE 4—Expense Offset Arrangement(s)
The expense offset arrangement is comprised of transfer agency credits which result from balances in demand deposit accounts used by the transfer agent for clearing shareholder transactions. For the year ended April 30, 2021, the Fund received credits from this arrangement, which resulted in the reduction of the Fund’s total expenses of $1,739.
NOTE 5—Trustees’ and Officers’ Fees and Benefits
Trustees’ and Officers’ Fees and Benefits include amounts accrued by the Fund to pay remuneration to certain Trustees and Officers of the Fund. Trustees have the option to defer compensation payable by the Fund, and Trustees’ and Officers’ Fees and Benefits also include amounts accrued by the Fund to fund such deferred compensation amounts. Those Trustees who defer compensation have the option to select various Invesco Funds in which their deferral accounts shall be deemed to be invested. Finally, certain current Trustees were eligible to participate in a retirement plan that provided for benefits to be paid upon retirement to Trustees over a period of time based on the number of years of service. The Fund may have certain former Trustees who also participate in a retirement plan and receive benefits under such plan. Trustees’ and Officers’ Fees and Benefits include amounts accrued by the Fund to fund such retirement benefits. Obligations under the deferred compensation and retirement plans represent unsecured claims against the general assets of the Fund.
NOTE 6—Cash Balances
The Fund is permitted to temporarily carry a negative or overdrawn balance in its account with SSB, the custodian bank. Such balances, if any at period-end, are shown in the Statement of Assets and Liabilities under the payable caption Amount due custodian. To compensate the custodian bank for such overdrafts, the overdrawn Fund may either (1) leave funds as a compensating balance in the account so the custodian bank can be compensated by earning the additional interest; or (2) compensate by paying the custodian bank at a rate agreed upon by the custodian bank and Invesco, not to exceed the contractually agreed upon rate. The Fund may not purchase additional securities when any borrowings from banks or broker-dealers exceed 5% of the Fund’s total assets, or when any borrowings from an Invesco Fund are outstanding.
17 Invesco Energy Fund
NOTE 7—Distributions to Shareholders and Tax Components of Net Assets
Tax Character of Distributions to Shareholders Paid During the Fiscal Years Ended April 30, 2021 and April 30, 2020:
| | | | | | | | |
| | | 2021 | | | 2020 | |
| |
Ordinary income* | | $ | 4,501,791 | | | $ | 4,804,314 | |
| |
| * | Includes short-term capital gain distributions, if any. |
Tax Components of Net Assets at Period-End:
| | | | |
| | | 2021 | |
| |
Undistributed ordinary income | | $ | 2,480,558 | |
| |
Net unrealized appreciation (depreciation) - investments | | | (23,594,877 | ) |
| |
Net unrealized appreciation - foreign currencies | | | 8,391 | |
| |
Temporary book/tax differences | | | (2,438,819 | ) |
| |
Capital loss carryforward | | | (423,278,070 | ) |
| |
Shares of beneficial interest | | | 720,579,340 | |
| |
Total net assets | | $ | 273,756,523 | |
| |
The difference between book-basis and tax-basis unrealized appreciation (depreciation) is due to differences in the timing of recognition of gains and losses on investments for tax and book purposes. The Fund’s net unrealized appreciation (depreciation) difference is attributable primarily to wash sales, MLP and partnership adjustments.
The temporary book/tax differences are a result of timing differences between book and tax recognition of income and/or expenses. The Fund’s temporary book/tax differences are the result of the trustee deferral of compensation and retirement plan benefits.
Capital loss carryforward is calculated and reported as of a specific date. Results of transactions and other activity after that date may affect the amount of capital loss carryforward actually available for the Fund to utilize. The ability to utilize capital loss carryforward in the future may be limited under the Internal Revenue Code and related regulations based on the results of future transactions.
The Fund has a capital loss carryforward as of April 30, 2021, as follows:
| | | | | | | | | | | | |
| Capital Loss Carryforward* | |
| Expiration | | Short-Term | | | Long-Term | | | Total | |
Not subject to expiration | | $ | 10,626,354 | | | $ | 412,651,716 | | | $ | 423,278,070 | |
| |
| * | Capital loss carryforward is reduced for limitations, if any, to the extent required by the Internal Revenue Code and may be further limited depending upon a variety of factors, including the realization of net unrealized gains or losses as of the date of any reorganization. |
NOTE 8—Investment Transactions
The aggregate amount of investment securities (other than short-term securities, U.S. Government obligations and money market funds, if any) purchased and sold by the Fund during the year ended April 30, 2021 was $150,456,001 and $138,734,937, respectively. Cost of investments, including any derivatives, on a tax basis includes the adjustments for financial reporting purposes as of the most recently completed federal income tax reporting period-end.
| | | | |
| Unrealized Appreciation (Depreciation) of Investments on a Tax Basis | |
| |
Aggregate unrealized appreciation of investments | | $ | 22,932,643 | |
| |
Aggregate unrealized (depreciation) of investments | | | (46,527,520 | ) |
| |
Net unrealized appreciation (depreciation) of investments | | $ | (23,594,877 | ) |
| |
Cost of investments for tax purposes is $297,869,582.
NOTE 9—Reclassification of Permanent Differences
Primarily as a result of differing book/tax treatment of foreign currency and partnership reclass, on April 30, 2021, undistributed net investment income was decreased by $57,515, undistributed net realized gain (loss) was increased by $78,868 and shares of beneficial interest was decreased by $21,353. This reclassification had no effect on the net assets of the Fund.
NOTE 10—Share Information
| | | | | | | | | | | | | | | | |
| | | Summary of Share Activity | |
| |
| | | Year ended | | | Year ended | |
| | | April 30, 2021(a) | | | April 30, 2020 | |
| | | Shares | | | Amount | | | Shares | | | Amount | |
| |
Sold: | | | | | | | | | | | | | | | | |
Class A | | | 3,761,298 | | | $ | 49,212,346 | | | | 2,571,914 | | | $ | 33,183,715 | |
| |
Class C | | | 352,700 | | | | 3,959,818 | | | | 438,690 | | | | 4,916,508 | |
| |
Class Y | | | 1,214,683 | | | | 17,175,336 | | | | 401,217 | | | | 6,062,809 | |
| |
Investor Class | | | 1,144,291 | | | | 14,664,796 | | | | 728,308 | | | | 9,831,497 | |
| |
Class R5 | | | 99,777 | | | | 1,299,002 | | | | 78,175 | | | | 1,133,675 | |
| |
Class R6 | | | 109,588 | | | | 1,589,029 | | | | 22,344 | | | | 399,123 | |
| |
18 Invesco Energy Fund
| | | | | | | | | | | | | | | | |
| | | Summary of Share Activity | |
| |
| | | Year ended | | | Year ended | |
| | | April 30, 2021(a) | | | April 30, 2020 | |
| | | Shares | | | Amount | | | Shares | | | Amount | |
| |
Issued as reinvestment of dividends: | | | | | | | | | | | | | | | | |
Class A | | | 201,097 | | | $ | 2,570,024 | | | | 150,438 | | | $ | 2,643,200 | |
| |
Class C | | | 20,180 | | | | 218,957 | | | | 15,642 | | | | 234,472 | |
| |
Class Y | | | 24,151 | | | | 308,887 | | | | 20,797 | | | | 364,981 | |
| |
Investor Class | | | 80,367 | | | | 1,023,068 | | | | 64,785 | | | | 1,133,096 | |
| |
Class R5 | | | 4,443 | | | | 58,289 | | | | 3,923 | | | | 70,530 | |
| |
Class R6 | | | 636 | | | | 8,347 | | | | 511 | | | | 9,175 | |
| |
| | | | |
Automatic conversion of Class C shares to Class A shares: | | | | | | | | | | | | | | | | |
Class A | | | 237,436 | | | | 2,917,949 | | | | 156,538 | | | | 2,709,341 | |
| |
Class C | | | (279,791 | ) | | | (2,917,949 | ) | | | (183,578 | ) | | | (2,709,341 | ) |
| |
| | | | |
Reacquired: | | | | | | | | | | | | | | | | |
Class A | | | (4,021,838 | ) | | | (50,939,670 | ) | | | (4,185,125 | ) | | | (68,171,104 | ) |
| |
Class C | | | (536,226 | ) | | | (5,692,399 | ) | | | (695,203 | ) | | | (9,889,358 | ) |
| |
Class Y | | | (594,414 | ) | | | (7,468,068 | ) | | | (1,007,003 | ) | | | (16,510,648 | ) |
| |
Investor Class | | | (1,336,516 | ) | | | (16,836,372 | ) | | | (1,361,486 | ) | | | (21,759,775 | ) |
| |
Class R5 | | | (149,224 | ) | | | (1,918,917 | ) | | | (162,680 | ) | | | (2,753,001 | ) |
| |
Class R6 | | | (74,875 | ) | | | (984,018 | ) | | | (14,614 | ) | | | (267,909 | ) |
| |
Net increase (decrease) in share activity | | | 257,763 | | | $ | 8,248,455 | | | | (2,956,407 | ) | | $ | (59,369,014 | ) |
| |
| (a) | There are entities that are record owners of more than 5% of the outstanding shares of the Fund and in the aggregate own 24% of the outstanding shares of the Fund. IDI has an agreement with these entities to sell Fund shares. The Fund, Invesco and/or Invesco affiliates may make payments to these entities, which are considered to be related to the Fund, for providing services to the Fund, Invesco and/or Invesco affiliates including but not limited to services such as securities brokerage, distribution, third party record keeping and account servicing. The Fund has no knowledge as to whether all or any portion of the shares owned of record by these entities are also owned beneficially. |
19 Invesco Energy Fund
Report of Independent Registered Public Accounting Firm
To the Board of Trustees of AIM Sector Funds (Invesco Sector Funds) and Shareholders of Invesco Energy Fund
Opinion on the Financial Statements
We have audited the accompanying statement of assets and liabilities, including the schedule of investments, of Invesco Energy Fund (one of the funds constituting AIM Sector Funds (Invesco Sector Funds), referred to hereafter as the “Fund”) as of April 30, 2021, the related statement of operations for the year ended April 30, 2021, the statement of changes in net assets for each of the two years in the period ended April 30, 2021, including the related notes, and the financial highlights for each of the periods indicated therein (collectively referred to as the “financial statements”). In our opinion, the financial statements present fairly, in all material respects, the financial position of the Fund as of April 30,2021, the results of its operations for the year then ended, the changes in its net assets for each of the two years in the period ended April 30, 2021 and the financial highlights for each of the periods indicated therein in conformity with accounting principles generally accepted in the United States of America.
Basis for Opinion
These financial statements are the responsibility of the Fund’s management. Our responsibility is to express an opinion on the Fund’s financial statements based on our audits. We are a public accounting firm registered with the Public Company Accounting Oversight Board (United States) (PCAOB) and are required to be independent with respect to the Fund in accordance with the U.S. federal securities laws and the applicable rules and regulations of the Securities and Exchange Commission and the PCAOB.
We conducted our audits of these financial statements in accordance with the standards of the PCAOB. Those standards require that we plan and perform the audit to obtain reasonable assurance about whether the financial statements are free of material misstatement, whether due to error or fraud.
Our audits included performing procedures to assess the risks of material misstatement of the financial statements, whether due to error or fraud, and performing procedures that respond to those risks. Such procedures included examining, on a test basis, evidence regarding the amounts and disclosures in the financial statements. Our audits also included evaluating the accounting principles used and significant estimates made by management, as well as evaluating the overall presentation of the financial statements. Our procedures included confirmation of securities owned as of April 30, 2021 by correspondence with the custodian and transfer agent. We believe that our audits provide a reasonable basis for our opinion.
/s/ PricewaterhouseCoopers LLP
Houston, Texas
June 24, 2021
We have served as the auditor of one or more investment companies in the Invesco group of investment companies since at least 1995. We have not been able to determine the specific year we began serving as auditor.
20 Invesco Energy Fund
Calculating your ongoing Fund expenses
Example
As a shareholder of the Fund, you incur two types of costs: (1) transaction costs, which may include sales charges (loads) on purchase payments or contingent deferred sales charges on redemptions, if any; and (2) ongoing costs, including management fees, distribution and/or service (12b-1) fees, and other Fund expenses. This example is intended to help you understand your ongoing costs (in dollars) of investing in the Fund and to compare these costs with ongoing costs of investing in other mutual funds. The example is based on an investment of $1,000 invested at the beginning of the period and held for the entire period November 1, 2020 through April 30, 2021.
Actual expenses
The table below provides information about actual account values and actual expenses. You may use the information in this table, together with the amount you invested, to estimate the expenses that you paid over the period. Simply divide your account value by $1,000 (for example, an $8,600 account value divided by $1,000 = 8.6), then multiply the result by the number in the table under the heading entitled “Actual Expenses Paid During Period” to estimate the expenses you paid on your account during this period.
Hypothetical example for comparison purposes
The table below also provides information about hypothetical account values and hypothetical expenses based on the Fund’s actual expense ratio and an assumed rate of return of 5% per year before expenses, which is not the Fund’s actual return.
The hypothetical account values and expenses may not be used to estimate the actual ending account balance or expenses you paid for the period. You may use this information to compare the ongoing costs of investing in the Fund and other funds. To do so, compare this 5% hypothetical example with the 5% hypothetical examples that appear in the shareholder reports of the other funds.
Please note that the expenses shown in the table are meant to highlight your ongoing costs only and do not reflect any transaction costs, such as sales charges (loads) on purchase payments or contingent deferred sales charges on redemptions, if any. Therefore, the hypothetical information is useful in comparing ongoing costs only, and will not help you determine the relative total costs of owning different funds. In addition, if these transaction costs were included, your costs would have been higher.
| | | | | | | | | | | | | | | | | | | | | | | | |
| | | Beginning
Account Value
(11/01/20) | | | ACTUAL | | | HYPOTHETICAL (5% annual return before expenses) | | | Annualized
Expense
Ratio | |
| | Ending
Account Value
(04/30/21)1 | | | Expenses
Paid During
Period2 | | | Ending
Account Value
(04/30/21) | | | Expenses
Paid During
Period2 | |
Class A | | $ | 1,000.00 | | | $ | 1,754.80 | | | $ | 10.18 | | | $ | 1,017.41 | | | $ | 7.45 | | | | 1.49% | |
Class C | | | 1,000.00 | | | | 1,750.10 | | | | 15.21 | | | | 1,013.74 | | | | 11.13 | | | | 2.23 | |
Class Y | | | 1,000.00 | | | | 1,757.70 | | | | 8.55 | | | | 1,018.60 | | | | 6.26 | | | | 1.25 | |
Investor Class | | | 1,000.00 | | | | 1,756.00 | | | | 10.18 | | | | 1,017.41 | | | | 7.45 | | | | 1.49 | |
Class R5 | | | 1,000.00 | | | | 1,760.30 | | | | 6.64 | | | | 1,019.98 | | | | 4.86 | | | | 0.97 | |
Class R6 | | | 1,000.00 | | | | 1,760.40 | | | | 6.64 | | | | 1,019.98 | | | | 4.86 | | | | 0.97 | |
| 1 | The actual ending account value is based on the actual total return of the Fund for the period November 1, 2020 through April 30, 2021, after actual expenses and will differ from the hypothetical ending account value which is based on the Fund’s expense ratio and a hypothetical annual return of 5% before expenses. |
| 2 | Expenses are equal to the Fund’s annualized expense ratio as indicated above multiplied by the average account value over the period, multiplied by 181/365 to reflect the most recent fiscal half year. |
21 Invesco Energy Fund
Tax Information
Form 1099-DIV, Form 1042-S and other year–end tax information provide shareholders with actual calendar year amounts that should be included in their tax returns. Shareholders should consult their tax advisers.
The following distribution information is being provided as required by the Internal Revenue Code or to meet a specific state’s requirement.
The Fund designates the following amounts or, if subsequently determined to be different, the maximum amount allowable for its fiscal year ended April 30, 2021:
| | | | |
Federal and State Income Tax | | | | |
Long-Term Capital Gain Distributions | | $ | 0.00 | |
Qualified Dividend Income* | | | 100.00 | % |
Corporate Dividends Received Deduction* | | | 87.97 | % |
Business Interest Income* | | | 0.00 | % |
Qualified Business Income* | | | 0.00 | % |
U.S. Treasury Obligations* | | | 0.00 | % |
|
*The above percentages are based on ordinary income dividends paid to shareholders during the Fund’s fiscal year. | |
22 Invesco Energy Fund
Trustees and Officers
The address of each trustee and officer is AIM Sector Funds (Invesco Sector Funds) (the “Trust”), 11 Greenway Plaza, Suite 1000, Houston, Texas 77046-1173. The trustees serve for the life of the Trust, subject to their earlier death, incapacitation, resignation, retirement or removal as more specifically provided in the Trust’s organizational documents. Each officer serves for a one year term or until their successors are elected and qualified. Column two below includes length of time served with predecessor entities, if any.
| | | | | | | | | | |
Name, Year of Birth and Position(s) Held with the Trust | | Trustee and/or Officer Since | | | Principal Occupation(s) During Past 5 Years | | Number of Funds in Fund Complex Overseen by Trustee | | Other Directorship(s) Held by Trustee During Past 5 Years |
| Interested Trustee | | | | | | | | | | |
Martin L. Flanagan1 — 1960 Trustee and Vice Chair | | | 2007 | | | Executive Director, Chief Executive Officer and President, Invesco Ltd. (ultimate parent of Invesco and a global investment management firm); Trustee and Vice Chair, The Invesco Funds; Vice Chair, Investment Company Institute; and Member of Executive Board, SMU Cox School of Business Formerly: Advisor to the Board, Invesco Advisers, Inc. (formerly known as Invesco Institutional (N.A.), Inc.); Chairman and Chief Executive Officer, Invesco Advisers, Inc. (registered investment adviser); Director, Chairman, Chief Executive Officer and President, Invesco Holding Company (US), Inc. (formerly IVZ Inc.) (holding company), Invesco Group Services, Inc. (service provider) and Invesco North American Holdings, Inc. (holding company); Director, Chief Executive Officer and President, Invesco Holding Company Limited (parent of Invesco and a global investment management firm); Director, Invesco Ltd.; Chairman, Investment Company Institute and President, Co-Chief Executive Officer, Co-President, Chief Operating Officer and Chief Financial Officer, Franklin Resources, Inc. (global investment management organization) | | 184 | | None |
| 1 | Mr. Flanagan is considered an interested person (within the meaning of Section 2(a)(19) of the 1940 Act) of the Trust because he is an officer of the Adviser to the Trust, and an officer and a director of Invesco Ltd., ultimate parent of the Adviser. |
T-1 Invesco Energy Fund
Trustees and Officers–(continued)
| | | | | | | | |
Name, Year of Birth and Position(s) Held with the Trust | | Trustee and/or Officer Since | | Principal Occupation(s) During Past 5 Years | | Number of
Funds in Fund Complex Overseen by Trustee | | Other Directorship(s) Held by Trustee During Past 5 Years |
Independent Trustees | | | | | | | | |
Christopher L. Wilson – 1957 Trustee and Chair | | 2017 | | Retired Formerly: Director, TD Asset Management USA Inc. (mutual fund complex) (22 portfolios); Managing Partner, CT2, LLC (investing and consulting firm); President/Chief Executive Officer, Columbia Funds, Bank of America Corporation; President/Chief Executive Officer, CDC IXIS Asset Management Services, Inc.; Principal & Director of Operations, Scudder Funds, Scudder, Stevens & Clark, Inc.; Assistant Vice President, Fidelity Investments | | 184 | | enaible, Inc. (artificial intelligence technology); Director, ISO New England, Inc. (non-profit organization managing regional electricity market) |
Beth Ann Brown – 1968 Trustee | | 2019 | | Independent Consultant Formerly: Head of Intermediary Distribution, Managing Director, Strategic Relations, Managing Director, Head of National Accounts, Senior Vice President, National Account Manager and Senior Vice President, Key Account Manager, Columbia Management Investment Advisers LLC; Vice President, Key Account Manager, Liberty Funds Distributor, Inc.; and Trustee of certain Oppenheimer Funds | | 184 | | Director, Board of Directors of Caron Engineering Inc.; Advisor, Board of Advisors of Caron Engineering Inc.; President and Director, Acton Shapleigh Youth Conservation Corps (non - profit); and President and Director of Grahamtastic Connection (non-profit) |
Jack M. Fields – 1952 Trustee | | 2003 | | Chief Executive Officer, Twenty First Century Group, Inc. (government affairs company); and Board Member, Impact(Ed) (non-profit) Formerly: Owner and Chief Executive Officer, Dos Angeles Ranch L.P. (cattle, hunting, corporate entertainment); Director, Insperity, Inc. (formerly known as Administaff) (human resources provider); Chief Executive Officer, Texana Timber LP (sustainable forestry company); Director of Cross Timbers Quail Research Ranch (non-profit); and member of the U.S. House of Representatives | | 184 | | Member, Board of Directors of Baylor College of Medicine |
Cynthia Hostetler —1962 Trustee | | 2017 | | Non-Executive Director and Trustee of a number of public and private business corporations Formerly: Director, Aberdeen Investment Funds (4 portfolios); Director, Artio Global Investment LLC (mutual fund complex); Director, Edgen Group, Inc. (specialized energy and infrastructure products distributor); Head of Investment Funds and Private Equity, Overseas Private Investment Corporation; President, First Manhattan Bancorporation, Inc.; Attorney, Simpson Thacher & Bartlett LLP | | 184 | | Resideo Technologies, Inc. (smart home technology); Vulcan Materials Company (construction materials company); Trilinc Global Impact Fund; Genesee & Wyoming, Inc. (railroads); Investment Company Institute (professional organization); Independent Directors Council (professional organization);Eisenhower Foundation (non-profit) |
Eli Jones – 1961 Trustee | | 2016 | | Professor and Dean, Mays Business School - Texas A&M University Formerly: Professor and Dean, Walton College of Business, University of Arkansas and E.J. Ourso College of Business, Louisiana State University; Director, Arvest Bank | | 184 | | Insperity, Inc. (formerly known as Administaff) (human resources provider) |
T-2 Invesco Energy Fund
Trustees and Officers–(continued)
| | | | | | | | |
Name, Year of Birth and Position(s) Held with the Trust | | Trustee and/or Officer Since | | Principal Occupation(s) During Past 5 Years | | Number of
Funds in Fund Complex Overseen by Trustee | | Other Directorship(s) Held by Trustee During Past 5 Years |
Independent Trustees—(continued) |
Elizabeth Krentzman – 1959 Trustee | | 2019 | | Formerly: Principal and Chief Regulatory Advisor for Asset Management Services and U.S. Mutual Fund Leader of Deloitte & Touche LLP; General Counsel of the Investment Company Institute (trade association); National Director of the Investment Management Regulatory Consulting Practice, Principal, Director and Senior Manager of Deloitte & Touche LLP; Assistant Director of the Division of Investment Management - Office of Disclosure and Investment Adviser Regulation of the U.S. Securities and Exchange Commission and various positions with the Division of Investment Management – Office of Regulatory Policy of the U.S. Securities and Exchange Commission; Associate at Ropes & Gray LLP; and Trustee of certain Oppenheimer Funds | | 184 | | Trustee of the University of Florida National Board Foundation; Member of the Carita Funds Board of Directors (private investment funds); Member of the University of Florida Law Center Association, Inc. Board of Trustees and Audit Committee Member |
Anthony J. LaCava, Jr. – 1956 Trustee | | 2019 | | Formerly: Director and Member of the Audit Committee, Blue Hills Bank (publicly traded financial institution) and Managing Partner, KPMG LLP | | 184 | | Blue Hills Bank; Chairman, Bentley University; Member, Business School Advisory Council; and Nominating Committee KPMG LLP |
Prema Mathai-Davis – 1950 Trustee | | 2003 | | Retired Formerly: Co-Founder & Partner of Quantalytics Research, LLC, (a FinTech Investment Research Platform for the Self-Directed Investor); Trustee of YWCA Retirement Fund; CEO of YWCA of the USA; Board member of the NY Metropolitan Transportation Authority; Commissioner of the NYC Department of Aging; Board member of Johns Hopkins Bioethics Institute | | 184 | | None |
Joel W. Motley – 1952 Trustee | | 2019 | | Director of Office of Finance, Federal Home Loan Bank System; Managing Director of Carmona Motley Inc. (privately held financial advisor); Member of the Council on Foreign Relations and its Finance and Budget Committee; Chairman Emeritus of Board of Human Rights Watch and Member of its Investment Committee; and Member of Investment Committee and Board of Historic Hudson Valley (non-profit cultural organization) Formerly: Managing Director of Public Capital Advisors, LLC (privately held financial advisor); Managing Director of Carmona Motley Hoffman, Inc. (privately held financial advisor); Trustee of certain Oppenheimer Funds; Director of Columbia Equity Financial Corp. (privately held financial advisor); and Member of the Vestry of Trinity Church Wall Street | | 184 | | Member of Board of Greenwall Foundation (bioethics research foundation) and its Investment Committee; Member of Board of Friends of the LRC (non-profit legal advocacy); Board Member and Investment Committee Member of Pulitzer Center for Crisis Reporting (non-profit journalism) |
Teresa M. Ressel — 1962 Trustee | | 2017 | | Non-executive director and trustee of a number of public and private business corporations Formerly: Chief Executive Officer, UBS Securities LLC (investment banking); Chief Operating Officer, UBS AG Americas (investment banking); Sr. Management Team Olayan America, The Olayan Group (international investor/commercial/industrial); Assistant Secretary for Management & Budget and Designated Chief Financial Officer, U.S. Department of Treasury; Director, Atlantic Power Corporation (power generation company) and ON Semiconductor Corporation (semiconductor manufacturing) | | 184 | | Elucida Oncology (nanotechnology & medical particles company) |
T-3 Invesco Energy Fund
Trustees and Officers–(continued)
| | | | | | | | |
Name, Year of Birth and Position(s) Held with the Trust | | Trustee and/or Officer Since | | Principal Occupation(s) During Past 5 Years | | Number of
Funds in Fund Complex Overseen by Trustee | | Other Directorship(s) Held by Trustee During Past 5 Years |
Independent Trustees—(continued) |
Ann Barnett Stern – 1957 Trustee | | 2017 | | President, Chief Executive Officer and Board Member, Houston Endowment, Inc. a private philanthropic institution Formerly: Executive Vice President, Texas Children’s Hospital; Vice President, General Counsel and Corporate Compliance Officer, Texas Children’s Hospital; Attorney at Beck, Redden and Secrest, LLP and Andrews and Kurth LLP | | 184 | | Director and Audit Committee member of Federal Reserve Bank of Dallas; Trustee and Board Chair of Good Reason Houston (nonprofit); Trustee, Vice Chair, Chair of Nomination/Governance Committee, Chair of Personnel Committee of Holdsworth Center (nonprofit); Trustee and Investment Committee member of University of Texas Law School Foundation (nonprofit); Board Member of Greater Houston Partnership |
Robert C. Troccoli – 1949 Trustee | | 2016 | | Retired Formerly: Adjunct Professor, University of Denver – Daniels College of Business; and Managing Partner, KPMG LLP | | 184 | | None |
Daniel S. Vandivort –1954 Trustee | | 2019 | | Trustee, Board of Trustees, Huntington Disease Foundation of America; and President, Flyway Advisory Services LLC (consulting and property management) Formerly: Trustee and Governance Chair, of certain Oppenheimer Funds; and Treasurer, Chairman of the Audit and Finance Committee, Huntington Disease Foundation of America | | 184 | | None |
James D. Vaughn – 1945 Trustee | | 2019 | | Retired Formerly: Managing Partner, Deloitte & Touche LLP; Trustee and Chairman of the Audit Committee, Schroder Funds; Board Member, Mile High United Way, Boys and Girls Clubs, Boy Scouts, Colorado Business Committee for the Arts, Economic Club of Colorado and Metro Denver Network (economic development corporation); and Trustee of certain Oppenheimer Funds | | 184 | | Board member and Chairman of Audit Committee of AMG National Trust Bank; Trustee and Investment Committee member, University of South Dakota Foundation; Board member, Audit Committee Member and past Board Chair, Junior Achievement (non-profit) |
T-4 Invesco Energy Fund
Trustees and Officers–(continued)
| | | | | | | | |
Name, Year of Birth and Position(s) Held with the Trust | | Trustee and/or Officer Since | | Principal Occupation(s) During Past 5 Years | | Number of
Funds in Fund Complex Overseen by Trustee | | Other Directorship(s) Held by Trustee During Past 5 Years |
Officers | | | | | | | | |
Sheri Morris — 1964 President and Principal Executive Officer | | 2003 | | Head of Global Fund Services, Invesco Ltd.; President and Principal Executive Officer, The Invesco Funds; Senior Vice President, Invesco Advisers, Inc. (formerly known as Invesco Institutional (N.A.), Inc.) (registered investment adviser); and Vice President, Invesco Exchange-Traded Fund Trust, Invesco Exchange-Traded Fund Trust II, Invesco India Exchange-Traded Fund Trust, Invesco Actively Managed Exchange-Traded Fund Trust, Invesco Actively Managed Exchange-Traded Commodity Fund Trust and Invesco Exchange-Traded Self-Indexed Fund Trust; and Vice President, OppenheimerFunds, Inc. Formerly: Vice President, Treasurer and Principal Financial Officer, The Invesco Funds; Vice President, Invesco AIM Advisers, Inc., Invesco AIM Capital Management, Inc. and Invesco AIM Private Asset Management, Inc.; Assistant Vice President and Assistant Treasurer, The Invesco Funds; Vice President and Assistant Vice President, Invesco Advisers, Inc.; Assistant Vice President, Invesco AIM Capital Management, Inc. and Invesco AIM Private Asset Management, Inc.; and Treasurer, Invesco Exchange-Traded Fund Trust, Invesco Exchange-Traded Fund Trust II, Invesco India Exchange-Traded Fund Trust and Invesco Actively Managed Exchange-Traded Fund Trust | | N/A | | N/A |
Russell C. Burk — 1958 Senior Vice President and Senior Officer | | 2005 | | Senior Vice President and Senior Officer, The Invesco Funds | | N/A | | N/A |
Jeffrey H. Kupor – 1968 Senior Vice President, Chief Legal Officer and Secretary | | 2018 | | Head of Legal of the Americas, Invesco Ltd.; Senior Vice President and Secretary, Invesco Advisers, Inc. (formerly known as Invesco Institutional (N.A.), Inc.) (registered investment adviser); Senior Vice President and Secretary, Invesco Distributors, Inc. (formerly known as Invesco AIM Distributors, Inc.); Vice President and Secretary, Invesco Investment Services, Inc. (formerly known as Invesco AIM Investment Services, Inc.) Senior Vice President, Chief Legal Officer and Secretary, The Invesco Funds; Secretary and General Counsel, Invesco Investment Advisers LLC (formerly known as Van Kampen Asset Management); Secretary and General Counsel, Invesco Capital Markets, Inc. (formerly known as Van Kampen Funds Inc.) and Chief Legal Officer, Invesco Exchange-Traded Fund Trust, Invesco Exchange-Traded Fund Trust II, Invesco India Exchange-Traded Fund Trust, Invesco Actively Managed Exchange-Traded Fund Trust, Invesco Actively Managed Exchange-Traded Commodity Fund Trust and Invesco Exchange-Traded Self-Indexed Fund Trust; Secretary, Invesco Indexing LLC; Secretary, W.L. Ross & Co., LLC ; Secretary and Vice President, Harbourview Asset Management Corporation; Secretary and Vice President, OppenheimerFunds, Inc. and Invesco Managed Accounts, LLC; Secretary and Senior Vice President, OFI Global Institutional, Inc.; Secretary and Vice President, OFI SteelPath, Inc.; Secretary and Vice President, Oppenheimer Acquisition Corp.; Secretary and Vice President, Shareholder Services, Inc.; Secretary and Vice President, Trinity Investment Management Corporation Formerly: Secretary and Vice President, Jemstep, Inc.; Head of Legal, Worldwide Institutional, Invesco Ltd.; Secretary and General Counsel, INVESCO Private Capital Investments, Inc.; Senior Vice President, Secretary and General Counsel, Invesco Management Group, Inc. (formerly known as Invesco AIM Management Group, Inc.); Assistant Secretary, INVESCO Asset Management (Bermuda) Ltd.; Secretary and General Counsel, Invesco Private Capital, Inc.; Assistant Secretary and General Counsel, INVESCO Realty, Inc.; Secretary and General Counsel, Invesco Senior Secured Management, Inc.; and Secretary, Sovereign G./P. Holdings Inc. | | N/A | | N/A |
T-5 Invesco Energy Fund
Trustees and Officers–(continued)
| | | | | | | | |
Name, Year of Birth and Position(s) Held with the Trust | | Trustee and/or Officer Since | | Principal Occupation(s) During Past 5 Years | | Number of
Funds in Fund Complex Overseen by Trustee | | Other Directorship(s) Held by Trustee During Past 5 Years |
Officers—(continued) |
Andrew R. Schlossberg – 1974 Senior Vice President | | 2019 | | Head of the Americas and Senior Managing Director, Invesco Ltd.; Director and Senior Vice President, Invesco Advisers, Inc. (formerly known as Invesco Institutional (N.A.), Inc.) (registered investment adviser); Director and Chairman, Invesco Investment Services, Inc. (formerly known as Invesco AIM Investment Services, Inc.) (registered transfer agent); Senior Vice President, The Invesco Funds; Director, Invesco Investment Advisers LLC (formerly known as Van Kampen Asset Management); Director, President and Chairman, Invesco Insurance Agency, Inc. Formerly: Director, President and Chairman, Invesco Insurance Agency, Inc.; Director, Invesco UK Limited; Director and Chief Executive, Invesco Asset Management Limited and Invesco Fund Managers Limited; Assistant Vice President, The Invesco Funds; Senior Vice President, Invesco Advisers, Inc. (formerly known as Invesco Institutional (N.A.), Inc.) (registered investment adviser); Director and Chief Executive, Invesco Administration Services Limited and Invesco Global Investment Funds Limited; Director, Invesco Distributors, Inc.; Head of EMEA, Invesco Ltd.; President, Invesco Actively Managed Exchange-Traded Commodity Fund Trust, Invesco Actively Managed Exchange-Traded Fund Trust, Invesco Exchange-Traded Fund Trust, Invesco Exchange-Traded Fund Trust II and Invesco India Exchange-Traded Fund Trust; Managing Director and Principal Executive Officer, Invesco Capital Management LLC | | N/A | | N/A |
John M. Zerr — 1962 Senior Vice President | | 2006 | | Chief Operating Officer of the Americas; Senior Vice President, Invesco Advisers, Inc. (formerly known as Invesco Institutional (N.A.), Inc.) (registered investment adviser); Senior Vice President, Invesco Distributors, Inc. (formerly known as Invesco AIM Distributors, Inc.); Director and Vice President, Invesco Investment Services, Inc. (formerly known as Invesco AIM Investment Services, Inc.) Senior Vice President, The Invesco Funds; Managing Director, Invesco Capital Management LLC; Director, Invesco Investment Advisers LLC (formerly known as Van Kampen Asset Management); Senior Vice President, Invesco Capital Markets, Inc. (formerly known as Van Kampen Funds Inc.); Manager, Invesco Indexing LLC; Manager, Invesco Specialized Products, LLC; Member, Invesco Canada Funds Advisory Board; Director, President and Chief Executive Officer, Invesco Corporate Class Inc. (corporate mutual fund company); and Director, Chairman, President and Chief Executive Officer, Invesco Canada Ltd. (formerly known as Invesco Trimark Ltd./Invesco Trimark Ltèe) (registered investment adviser and registered transfer agent); President, Invesco, Inc.; President, Invesco Global Direct Real Estate Feeder GP Ltd.; President, Invesco IP Holdings(Canada) Ltd; President, Invesco Global Direct Real Estate GP Ltd.; President, Invesco Financial Services Ltd. / Services Financiers Invesco Ltée; President, Trimark Investments Ltd./Placements Trimark Ltée and Director and Chairman, Invesco Trust Company Formerly: Director and Senior Vice President, Invesco Insurance Agency, Inc.; Director and Senior Vice President, Invesco Management Group, Inc. (formerly known as Invesco AIM Management Group, Inc.); Secretary and General Counsel, Invesco Management Group, Inc. (formerly known as Invesco AIM Management Group, Inc.); Secretary, Invesco Investment Services, Inc. (formerly known as Invesco AIM Investment Services, Inc.); Chief Legal Officer and Secretary, The Invesco Funds; Secretary and General Counsel, Invesco Investment Advisers LLC (formerly known as Van Kampen Asset Management); Secretary and General Counsel, Invesco Capital Markets, Inc. (formerly known as Van Kampen Funds Inc.); Chief Legal Officer, Invesco Exchange-Traded Fund Trust, Invesco Exchange-Traded Fund Trust II, Invesco India Exchange-Traded Fund Trust, Invesco Actively Managed Exchange-Traded Fund Trust, Invesco Actively Managed Exchange-Traded Commodity Fund Trust and Invesco Exchange-Traded Self-Indexed Fund Trust; Secretary, Invesco Indexing LLC; Director, Secretary, General Counsel and Senior Vice President, Van Kampen Exchange Corp.; Director, Vice President and Secretary, IVZ Distributors, Inc. (formerly known as INVESCO Distributors, Inc.); Director and Vice President, INVESCO Funds Group, Inc.; Director and Vice President, Van Kampen Advisors Inc.; Director, Vice President, Secretary and General Counsel, Van Kampen Investor Services Inc.;Director and Secretary, Invesco Distributors, Inc. (formerly known as Invesco AIM Distributors, Inc.); Director, Senior Vice President, General Counsel and Secretary, Invesco AIM Advisers, Inc. and Van Kampen Investments Inc.; Director, Vice President and Secretary, Fund Management Company; Director, Senior Vice President, Secretary, General Counsel and Vice President, Invesco AIM Capital Management, Inc.; Chief Operating Officer and General Counsel, Liberty Ridge Capital, Inc. (an investment adviser) | | N/A | | N/A |
T-6 Invesco Energy Fund
Trustees and Officers–(continued)
| | | | | | | | |
Name, Year of Birth and Position(s) Held with the Trust | | Trustee and/or Officer Since | | Principal Occupation(s) During Past 5 Years | | Number of
Funds in Fund Complex Overseen by Trustee | | Other Directorship(s) Held by Trustee During Past 5 Years |
Officers—(continued) |
Gregory G. McGreevey – 1962 Senior Vice President | | 2012 | | Senior Managing Director, Invesco Ltd.; Director, Chairman, President, and Chief Executive Officer, Invesco Advisers, Inc. (formerly known as Invesco Institutional (N.A.), Inc.) (registered investment adviser); Director, Invesco Mortgage Capital, Inc. and Invesco Senior Secured Management, Inc.; and Senior Vice President, The Invesco Funds; and President, SNW Asset Management Corporation and Invesco Managed Accounts, LLC; Chairman and Director, Invesco Private Capital, Inc.; Chairman and Director, INVESCO Private Capital Investments, Inc.; Chairman and Director, INVESCO Realty, Inc. Chairman and Director, INVESCO Realty, Inc.; and Senior Vice President, Invesco Group Services, Inc. Formerly: Senior Vice President, Invesco Management Group, Inc. and Invesco Advisers, Inc.; Assistant Vice President, The Invesco Funds | | N/A | | N/A |
Adrien Deberghes – 1967 Principal Financial Officer, Treasurer and Vice President | | 2020 | | Head of the Fund Office of the CFO and Fund Administration; Vice President, Invesco Advisers, Inc.; Principal Financial Officer, Treasurer and Vice President, The Invesco Funds; Vice President, Invesco Exchange-Traded Fund Trust, Invesco Exchange-Traded Fund Trust II, Invesco India Exchange-Traded Fund Trust, Invesco Actively Managed Exchange-Traded Fund Trust, Invesco Actively Managed Exchange-Traded Commodity Fund Trust and Invesco Exchange-Traded Self-Indexed Fund Trust Formerly: Senior Vice President and Treasurer, Fidelity Investments | | N/A | | N/A |
Crissie M. Wisdom – 1969 Anti-Money Laundering Compliance Officer | | 2013 | | Anti-Money Laundering and OFAC Compliance Officer for Invesco U.S. entities including: Invesco Advisers, Inc. and its affiliates, Invesco Capital Markets, Inc., Invesco Distributors, Inc., Invesco Investment Services, Inc., The Invesco Funds, Invesco Capital Management, LLC, Invesco Trust Company; and Fraud Prevention Manager for Invesco Investment Services, Inc. | | N/A | | N/A |
Todd F. Kuehl – 1969 Chief Compliance Officer and Senior Vice President | | 2020 | | Chief Compliance Officer, Invesco Advisers, Inc. (registered investment adviser); and Chief Compliance Officer, The Invesco Funds and Senior Vice President Formerly: Managing Director and Chief Compliance Officer, Legg Mason (Mutual Funds); Chief Compliance Officer, Legg Mason Private Portfolio Group (registered investment adviser) | | N/A | | N/A |
Michael McMaster – 1962 Chief Tax Officer, Vice President and Assistant Treasurer | | 2020 | | Head of Global Fund Services Tax; Chief Tax Officer, Vice President and Assistant Treasurer, The Invesco Funds; Vice President, Invesco Advisers, Inc.; Assistant Treasurer, Invesco Capital Management LLC, Assistant Treasurer and Chief Tax Officer, Invesco Exchange-Traded Fund Trust, Invesco Exchange-Traded Fund Trust II, Invesco India Exchange-Traded Fund Trust, Invesco Actively Managed Exchange-Traded Fund Trust, Invesco Actively Managed Exchange-Traded Commodity Fund Trust and Invesco Exchange-Traded Self-Indexed Fund Trust; Assistant Treasurer, Invesco Specialized Products, LLC Formerly: Senior Vice President – Managing Director of Tax Services, U.S. Bank Global Fund Services (GFS) | | N/A | | N/A |
The Statement of Additional Information of the Trust includes additional information about the Fund’s Trustees and is available upon request, without charge, by calling 1.800.959.4246. Please refer to the Fund’s Statement of Additional Information for information on the Fund’s sub-advisers.
| | | | | | |
Office of the Fund 11 Greenway Plaza, Suite 1000 Houston, TX 77046-1173 Counsel to the Fund Stradley Ronon Stevens & Young, LLP 2005 Market Street, Suite 2600 Philadelphia, PA 19103-7018 | | Investment Adviser Invesco Advisers, Inc. 1555 Peachtree Street, N.E. Atlanta, GA 30309 Counsel to the Independent Trustees Goodwin Procter LLP 901 New York Avenue, N.W. Washington, D.C. 20001 | | Distributor Invesco Distributors, Inc. 11 Greenway Plaza, Suite 1000 Houston, TX 77046-1173 Transfer Agent Invesco Investment Services, Inc. 11 Greenway Plaza, Suite 1000 Houston, TX 77046-1173 | | Auditors PricewaterhouseCoopers LLP 1000 Louisiana Street, Suite 5800 Houston, TX 77002-5678 Custodian State Street Bank and Trust Company 225 Franklin Street Boston, MA 02110-2801 |
T-7 Invesco Energy Fund
(This page intentionally left blank)
(This page intentionally left blank)

Go paperless with eDelivery
Visit invesco.com/edelivery to enjoy the convenience and security of anytime electronic access to your investment documents. With eDelivery, you can elect to have any or all of the following materials delivered straight to your inbox to download, save and print from your own computer:
| ∎ | | Fund reports and prospectuses |
Invesco mailing information
Send general correspondence to Invesco Investment Services, Inc., P.O. Box 219078, Kansas City, MO 64121-9078.
Important notice regarding delivery of security holder documents
To reduce Fund expenses, only one copy of most shareholder documents may be mailed to shareholders with multiple accounts at the same address (Householding). Mailing of your shareholder documents may be householded indefinitely unless you instruct us otherwise. If you do not want the mailing of these documents to be combined with those for other members of your household, please contact Invesco Investment Services, Inc. at 800 959 4246 or contact your financial institution. We will begin sending you individual copies for each account within 30 days after receiving your request.
Fund holdings and proxy voting information
The Fund provides a complete list of its portfolio holdings four times each fiscal year, at the end of each fiscal quarter. For the second and fourth quarters, the list appears, respectively, in the Fund’s semiannual and annual reports to shareholders. For the first and third quarters, the Fund files the list with the Securities and Exchange Commission (SEC) as an exhibit to its reports on Form N-PORT. The most recent list of portfolio holdings is available at invesco.com/completeqtrholdings. Shareholders can also look up the Fund’s Form N-PORT filings on the SEC website, sec.gov. The SEC file numbers for the Fund are shown below.
A description of the policies and procedures that the Fund uses to determine how to vote proxies relating to portfolio securities is available without charge, upon request, from our Client Services department at 800 959 4246, or at invesco.com/ corporate/about-us/esg. The information is also available on the SEC website, sec.gov.
| | |
Information regarding how the Fund voted proxies related to its portfolio securities during the most recent 12-month period ended June 30 is available at invesco.com/proxysearch. This information is also available on the SEC website, sec.gov. Invesco Advisers, Inc. is an investment adviser; it provides investment advisory services to individual and institutional clients and does not sell securities. Invesco Distributors, Inc. is the US distributor for Invesco Ltd.’s retail mutual funds, exchange-traded funds and institutional money market funds. Both are wholly owned, indirect subsidiaries of Invesco Ltd. | | |
| | | | |
| SEC file numbers: 811-03826 and 002-85905 | | Invesco Distributors, Inc. | | I-ENE-AR-1 |
| | | | |
| | |
 | | Annual Report to Shareholders | | April 30, 2021 |
| | |
| | Invesco Gold & Special Minerals Fund |
| | Nasdaq: |
| | A: OPGSX ∎ C: OGMCX ∎ R: OGMNX ∎ Y: OGMYX ∎ R5: IOGYX ∎ R6: OGMIX |

Management’s Discussion of Fund Performance
|
Performance summary |
For the fiscal year ended April 30, 2021, Class A shares of Invesco Gold & Special Minerals Fund (the Fund), at net asset value (NAV), underperformed the MSCI World Index. Your Fund’s long-term performance appears later in this report. |
Fund vs. Indexes |
Total returns, 4/30/20 to 4/30/21, at net asset value (NAV). Performance shown does not include applicable contingent deferred sales charges (CDSC) or front-end sales charges, which would have reduced performance. |
| | | | |
Class A Shares | | | 29.33 | % |
Class C Shares | | | 28.27 | |
Class R Shares | | | 28.90 | |
Class Y Shares | | | 29.57 | |
Class R5 Shares | | | 29.75 | |
Class R6 Shares | | | 29.79 | |
MSCI World Index▼ | | | 45.33 | |
Source(s): ▼RIMES Technologies Corp. | | | | |
Market conditions and your Fund
The fiscal year ending April 30, 2021, witnessed a steady recovery in asset prices following the pandemic-induced selloff that bottomed in March 2020. Throughout the fiscal year, risk assets around the world climbed steadily as future economic growth prospects improved, central banks kept interest rates near zero and governments embarked on a wave of unprecedented fiscal stimulus. Against this backdrop, the Fund’s Class A shares (without sales charge) produced a total return of 29.33% during the fiscal year.1 The Fund underperformed its benchmark, the MSCI World Index, which returned 45.33% during the same period, after meaningfully outperforming that index during the prior year. We focus on firms with high-quality reserves, solid prospects for growth, attractive cost structures, sound balance sheets, attractive free cash flow and talented management teams.
Gold mining equities, as measured by Philadelphia Gold & Silver Index, were among the best performing asset classes globally in 2016, 2019 and 2020, returning 74.93%, 52.57%, and 36.04% respectively. In contrast, they have been laggards year-to-date with a -0.88% total return through April 30, 2021.1 (For purposes of comparison, the MSCI World Index climbed 9.80% in the same year-to-date period.)1 The performance of the mining equities, as measured by the Philadelphia Gold & Silver Index’s 26.46% return, during the fiscal year meaningfully outpaced the 4.89% rise in the price of gold.1 The yellow metal benefited from a variety of factors including rising geopolitical risks, slowing economic growth, falling real interest rates, aggressive rate cuts by the US Federal Reserve (the Fed) and other central banks, the prospect of major fiscal stimulus, and investors seeking potential safe havens amid extreme market turmoil.
The top contributors to performance during the fiscal year included Ivanhoe Mines, Sibanye-Stillwater and De Grey Mining.
Our position in Ivanhoe Mines, a Canadian producer focused on copper, nickel and Platinum Group Metals (PGMs), contributed to absolute performance on the back of a 197% increase in the share price during the fiscal year.1 The company is an explorer/developer with projects in the Democratic Republic of the Congo (DRC) and South Africa. The share price benefited from the company’s achievement of several key milestones as it moved toward commercial production of its massive Kamoa-Kakula copper project in the DRC. We believe the price of copper helped by moving consistently higher during the fiscal year (up 90%) as market expectations of accelerating economic growth drove demand for the red metal.1
Our holdings in Sibanye-Stillwater, a South African producer of gold, platinum and palladium, also contributed to performance as the share price climbed 147% in the period.1 The market for PGMs tightened throughout the fiscal year, with the platinum price rising 55% while the palladium price climbed 49%.1 We believe these metals are critical to the continuing effort to turn noxious exhaust gases from motor vehicles into their more benign components.
Our position in De Grey Mining also contributed to performance. The company is a small-cap Australian producer focused on gold, silver, zinc and PGMs. The stock price climbed an impressive 317% in the period as the company enjoyed success with the drill bit and made significant progress proving up the size and quality of its reserves.1
The biggest detractors from performance during the fiscal year included Zhaojin Mining, Barrick Gold Corp. and Pure Gold Mining.
Our position in Zhaojin Mining, a Chinese gold producer, detracted from performance as the stock declined 19% in the period.1
Zhaojin faced some operational hiccups and investor sentiment of the company was negatively impacted by a general softness in the gold price during the second half of the fiscal year.
Our holdings in Barrick Gold, a major gold producer based in Canada, also detracted from performance as the stock declined 16% in the period.1 The company continued to rationalize operations following its $18 billion merger with Randgold Resources in 2019, which put some downward pressure on the share price.
Finally, our position in Pure Gold Mining, a Canadian gold miner, detracted from performance despite the fact that the stock climbed 54% during the fiscal year.1 Pure Gold is a small-cap explorer with a brownfield project that is moving toward commercial production in a highly productive mining jurisdiction in Canada.
The precious metals complex climbed higher in the first three months of the fiscal year as gold moved toward its all-time high of $2,063 per ounce on August 6, 2020.1 Over the next seven months, the gold price drifted 18% lower before rebounding slightly by the end of the period. We believe some investors continue to view gold and other precious metals as warrants on monetary policy going off the rails or a potential hedge against competitive currency debasement or adverse geopolitical events. The price of gold swung within a $405 range and ended the period up 4.89% at $1,769 per ounce or $82 above where it started.1 In our view, real interest rates, macroeconomic crosswinds, relative monetary policy around the world, government stimulus and geopolitical risks continue to impact the precious metals sector.
The Fed lowered the Fed Funds rate to zero in March 2020 in response to market turmoil and kept it there throughout the fiscal year. Numerous central banks around the world also lowered rates aggressively in 2020, although some of them have recently started to raise rates in an effort to combat inflation. The prospect of highly accommodative monetary and fiscal policy has helped support the rally in risk assets since the market bottom in March 2020. The U.S. Dollar Index fell by 7.82% during the fiscal year but has reversed course and climbed by 1.49% year-to-date through April 30, 2021.1 (A stronger dollar is generally bearish for gold and commodity prices.) The Biden administration has been working to pass several multitrillion-dollar fiscal stimulus programs to rebuild the economy, address infrastructure and climate change, and assist families. We believe these programs can increase the country’s annual deficit, which could eventually put downward pressure on the US dollar. We believe the prospect of these developments would help support prices in the precious metals complex.
The Fund’s portfolio has a growth-at-a-reasonable-price tilt. We favor companies with
2 Invesco Gold & Special Minerals Fund
more resources in the ground, higher-quality ore bodies and lower cost structures, partly because these characteristics can lead to upside surprises in production growth, revenue, cash flow and earnings, which in turn can lead to rising net asset values and potentially rising stock prices. We continue to use a contrarian growth strategy, which means we tend to buy companies that we like when they are on sale, and we tend to trim or sell positions we find attractive when others are buying aggressively.
Moreover, we concentrate our efforts on analyzing the gold mining equities, and we tend to stay fully invested. Unlike many competitors, we typically do not hold large positions in cash, and we do not own U.S. Treasuries in an effort to dampen portfolio volatility. The reasons are simple. We are investors, not short-term traders or market timers. We believe it is extremely difficult to time the precious metals markets well on a consistent basis. In addition, our skill is in analyzing ore bodies, mines and management teams, and investing in mining companies, not government fixed-income securities.
Consistent with our disciplined and contrarian growth strategy, we continue to look for opportunities to buy companies with assets, cost structures and production/earnings growth profiles that we like at valuations that we consider attractive. We believe the core holdings in the portfolio are well-capitalized senior and intermediate producers. The Fund’s portfolio manager expects to continue to hold most of the Fund’s assets in gold, special minerals and mining-related equities that the investment team believes offer attractive revenue and earnings growth at a reasonable price.
Thank you for investing in Invesco Gold & Special Minerals Fund and sharing our long-term investment horizon.
Portfolio manager(s):
Shanquan Li
The views and opinions expressed in management’s discussion of Fund performance are those of Invesco Advisers, Inc. These views and opinions are subject to change at any time based on factors such as market and economic conditions. These views and opinions may not be relied upon as investment advice or recommendations, or as an offer for a particular security. The information is not a complete analysis of every aspect of any market, country, industry, security or the Fund. Statements of fact are from sources considered reliable, but Invesco Advisers, Inc. makes no representation or warranty as to their completeness or accuracy. Although historical performance is no guarantee of future results, these insights may help you understand our investment management philosophy.
See important Fund and, if applicable, index disclosures later in this report.
3 Invesco Gold & Special Minerals Fund
Your Fund’s Long-Term Performance
Results of a $10,000 Investment – Oldest Share Class(es)
Fund and index data from 4/30/11
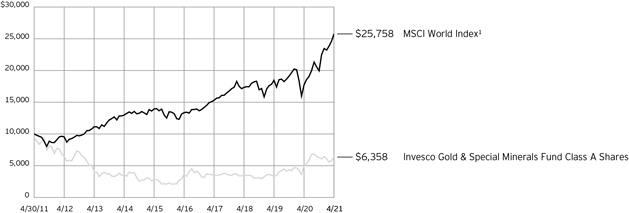
| 1 | Source: RIMES Technologies Corp. |
Past performance cannot guarantee future results.
The data shown in the chart include reinvested distributions, applicable sales charges and Fund expenses including management
fees. Index results include reinvested dividends, but they do not reflect sales charges. Performance of the peer group, if applicable, reflects fund expenses and management fees;
performance of a market index does not. Performance shown in the chart does not reflect deduction of taxes a shareholder would pay on Fund distributions or sale of Fund shares.
4 Invesco Gold & Special Minerals Fund
| | | | |
Average Annual Total Returns | |
As of 4/30/21, including maximum applicable sales charges | |
| |
Class A Shares | | | | |
| Inception (7/19/83) | | | 6.49 | % |
| 10 Years | | | -4.43 | |
| 5 Years | | | 10.34 | |
| 1 Year | | | 22.20 | |
| |
Class C Shares | | | | |
| Inception (11/1/95) | | | 6.67 | % |
| 10 Years | | | -4.46 | |
| 5 Years | | | 10.75 | |
| 1 Year | | | 27.27 | |
| |
Class R Shares | | | | |
| Inception (3/1/01) | | | 9.83 | % |
| 10 Years | | | -4.14 | |
| 5 Years | | | 11.30 | |
| 1 Year | | | 28.90 | |
| |
Class Y Shares | | | | |
| Inception (9/7/10) | | | -1.47 | % |
| 10 Years | | | -3.67 | |
| 5 Years | | | 11.85 | |
| 1 Year | | | 29.57 | |
| |
Class R5 Shares | | | | |
| 10 Years | | | -3.82 | % |
| 5 Years | | | 11.75 | |
| 1 Year | | | 29.75 | |
| |
Class R6 Shares | | | | |
| Inception (10/26/12) | | | -0.73 | % |
| 5 Years | | | 12.06 | |
| 1 Year | | | 29.79 | |
Effective May 24, 2019, Class A, Class C, Class R, Class Y and Class I shares of the Oppenheimer Gold & Special Minerals Fund, (the predecessor fund), were reorganized into Class A, Class C, Class R, Class Y and Class R6 shares, respectively, of the Invesco Oppenheimer Gold & Special Minerals Fund. The Fund was subsequently renamed the Invesco Gold & Special Minerals Fund (the Fund). Returns shown above, for periods ending on or prior to May 24, 2019, for Class A, Class C, Class R, Class Y and Class R6 shares are those for Class A, Class C, Class R, Class Y and Class I shares of the predecessor fund. Share class returns will differ from the predecessor fund because of different expenses.
Class R5 shares incepted on May 24, 2019. Performance shown on and prior to that date is that of the predecessor fund’s Class A shares at the net asset value and includes the 12b-1 fees applicable to Class A shares.
The performance data quoted represent past performance and cannot guarantee future results; current performance may be lower or higher. Please visit invesco.com/ performance for the most recent month-end performance. Performance figures reflect reinvested distributions, changes in net asset value and the effect of the maximum sales charge unless otherwise stated. Performance figures do not reflect deduction
of taxes a shareholder would pay on Fund distributions or sale of Fund shares. Investment return and principal value will fluctuate so that you may have a gain or loss when you sell shares.
Class A share performance reflects the maximum 5.50% sales charge, and Class C share performance reflects the applicable contingent deferred sales charge (CDSC) for the period involved. The CDSC on Class C shares is 1% for the first year after purchase. Class R, Class Y, Class R5 and Class R6 shares do not have a front-end sales charge or a CDSC; therefore, performance is at net asset value.
The performance of the Fund’s share classes will differ primarily due to different sales charge structures and class expenses.
Fund performance reflects any applicable fee waivers and/or expense reimbursements. Had the adviser not waived fees and/or reimbursed expenses currently or in the past, returns would have been lower. See current prospectus for more information.
5 Invesco Gold & Special Minerals Fund
Supplemental Information
Invesco Gold & Special Minerals Fund’s investment objective is to seek capital appreciation.
| ∎ | | Unless otherwise stated, information presented in this report is as of April 30, 2021, and is based on total net assets. |
| ∎ | | Unless otherwise noted, all data is provided by Invesco. |
| ∎ | | To access your Fund’s reports/prospectus, visit invesco.com/fundreports. |
About indexes used in this report
| ∎ | | The MSCI World Index is an unmanaged index considered representative of stocks of developed countries. The index is computed using the net return, which withholds applicable taxes for non-resident investors. |
| ∎ | | The Fund is not managed to track the performance of any particular index, including the index(es) described here, and consequently, the performance of the Fund may deviate significantly from the performance of the index(es). |
| ∎ | | A direct investment cannot be made in an index. Unless otherwise indicated, index results include reinvested dividends, and they do not reflect sales charges. Performance of the peer group, if applicable, reflects fund expenses; performance of a market index does not. |
Liquidity Risk Management Program
In compliance with Rule 22e-4 under the Investment Company Act of 1940, as amended (the “Liquidity Rule”), the Fund has adopted and implemented a liquidity risk management program in accordance with the Liquidity Rule (the “Program”). The Program is reasonably designed to assess and manage the Fund’s liquidity risk, which is the risk that the Fund could not meet redemption requests without significant dilution of remaining investors’ interests in the Fund. The Board of Trustees of the Fund (the “Board”) has appointed Invesco Advisers, Inc. (“Invesco”), the Fund’s investment adviser, as the Program’s administrator, and Invesco has delegated oversight of the Program to the Liquidity Risk Management Committee (the “Committee”), which is composed of senior representatives from relevant business groups at Invesco.
As required by the Liquidity Rule, the Program includes policies and procedures providing for an assessment, no less frequently than annually, of the Fund’s liquidity risk that takes into account, as relevant to the Fund’s liquidity risk: (1) the Fund’s investment strategy and liquidity of portfolio investments during both normal and reasonably foreseeable stressed conditions; (2) short-term and long-term cash
flow projections for the Fund during both normal and reasonably foreseeable stressed conditions; and (3) the Fund’s holdings of cash and cash equivalents and any borrowing arrangements. The Liquidity Rule also requires the classification of the Fund’s investments into categories that reflect the assessment of their relative liquidity under current market conditions. The Fund classifies its investments into one of four categories defined in the Liquidity Rule: “Highly Liquid,” “Moderately Liquid,” “Less Liquid,” and “Illiquid.” Funds that are not invested primarily in “Highly Liquid Investments” that are assets (cash or investments that are reasonably expected to be convertible into cash within three business days without significantly changing the market value of the investment) are required to establish a “Highly Liquid Investment Minimum” (“HLIM”), which is the minimum percentage of net assets that must be invested in Highly Liquid Investments. Funds with HLIMs have procedures for addressing HLIM shortfalls, including reporting to the Board and the SEC (on a non-public basis) as required by the Program and the Liquidity Rule. In addition, the Fund may not acquire an investment if, immediately after the acquisition, over 15% of the Fund’s net assets would consist of “Illiquid Investments” that are assets (an investment that cannot reasonably be expected to be sold or disposed of in current market conditions in seven calendar days or less without the sale or disposition significantly changing the market value of the investment). The Liquidity Rule and the Program also require reporting to the Board and the SEC (on a non-public basis) if a Fund’s holdings of Illiquid Investments exceed 15% of the Fund’s assets.
At a meeting held on March 22-24, 2021, the Committee presented a report to the Board that addressed the operation of the Program and assessed the Program’s adequacy and effectiveness of implementation (the “Report”). The Report covered the period from January 1, 2020 through December 31, 2020 (the “Program Reporting Period”). The Report discussed notable events affecting liquidity over the Program Reporting Period, including the impact of the coronavirus pandemic on
the Fund and the overall market. The Report noted that there were no material changes to the Program during the Program Reporting Period.
The Report stated, in relevant part, that during the Program Reporting Period:
| ∎ | | The Program, as adopted and implemented, remained reasonably designed to assess and manage the Fund’s liquidity risk and was operated effectively to achieve that goal; |
| ∎ | | The Fund’s investment strategy remained appropriate for an open-end fund; |
| ∎ | | The Fund was able to meet requests for redemption without significant dilution of remaining investors’ interests in the Fund; |
| ∎ | | The Fund did not breach the 15% limit on Illiquid Investments; and |
| ∎ | | The Fund primarily held Highly Liquid Investments and therefore has not adopted an HLIM. |
|
This report must be accompanied or preceded by a currently effective Fund prospectus, which contains more complete information, including sales charges and expenses. Investors should read it carefully before investing. |
|
| NOT FDIC INSURED | MAY LOSE VALUE | NO BANK GUARANTEE |
6 Invesco Gold & Special Minerals Fund
Fund Information
Portfolio Composition
| | |
| |
| By industry | | % of total net assets |
| |
Gold | | 87.99% |
Diversified Metals & Mining | | 7.25 |
Precious Metals & Minerals | | 3.13 |
Other Sectors, Each Less than 2% of Net Assets | | 1.92 |
Money Market Funds Plus Other Assets Less Liabilities | | (0.29) |
Top 10 Equity Holdings*
| | | | | | |
| | | | | | % of total net assets |
| | |
| | 1. | | | Newmont Corp. | | 5.30% |
| | 2. | | | Northern Star Resources Ltd. | | 4.78 |
| | 3. | | | AngloGold Ashanti Ltd., ADR | | 4.51 |
| | 4. | | | Evolution Mining Ltd. | | 4.13 |
| | 5. | | | Gold Fields Ltd., ADR | | 4.13 |
| | 6. | | | Barrick Gold Corp. | | 3.79 |
| | 7. | | | Agnico Eagle Mines Ltd. | | 3.74 |
| | 8. | | | Kirkland Lake Gold Ltd. | | 3.62 |
| | 9. | | | Chalice Mining Ltd. | | 3.02 |
| | 10. | | | De Grey Mining Ltd. | | 2.94 |
The Fund’s holdings are subject to change, and there is no assurance that the Fund will continue to hold any particular security.
| * | Excluding money market fund holdings, if any. |
Data presented here are as of April 30, 2021.
7 Invesco Gold & Special Minerals Fund
Consolidated Schedule of Investments
April 30, 2021
| | | | | | | | |
| | | Shares | | | Value | |
Common Stocks & Other Equity Interests–100.29% | |
Australia–25.29% | | | | | | | | |
Alkane Resources Ltd.(a) | | | 10,380,000 | | | $ | 5,877,232 | |
Auteco Minerals Ltd.(a) | | | 16,500,000 | | | | 1,131,437 | |
Bellevue Gold Ltd.(a) | | | 22,733,252 | | | | 16,369,081 | |
Chalice Mining Ltd.(a) | | | 12,941,692 | | | | 68,644,013 | |
De Grey Mining Ltd.(a) | | | 59,907,305 | | | | 66,968,886 | |
E2 Metals Ltd.(a) | | | 551,498 | | | | 130,914 | |
Evolution Mining Ltd. | | | 26,538,806 | | | | 94,029,315 | |
Gold Road Resources Ltd. | | | 24,843,275 | | | | 24,357,858 | |
Jervois Mining Ltd.(a) | | | 1,250,000 | | | | 443,115 | |
Legend Mining Ltd.(a) | | | 47,840,095 | | | | 5,161,977 | |
Lynas Rare Earths Ltd.(a) | | | 330,000 | | | | 1,394,626 | |
Musgrave Minerals Ltd.(a) | | | 23,270,000 | | | | 6,533,238 | |
Newcrest Mining Ltd. | | | 954,968 | | | | 19,382,317 | |
Nickel Mines Ltd. | | | 14,491,112 | | | | 12,686,933 | |
Northern Star Resources Ltd. | | | 13,548,895 | | | | 108,708,300 | |
OceanaGold Corp.(a) | | | 10,890,300 | | | | 18,163,052 | |
Pantoro Ltd.(a) | | | 24,458,979 | | | | 3,946,170 | |
Perseus Mining Ltd.(a) | | | 9,680,000 | | | | 9,066,670 | |
Ramelius Resources Ltd. | | | 25,268,612 | | | | 32,833,695 | |
Red 5 Ltd. (Acquired 08/07/2019 - 03/19/2021; Cost $6,681,534)(a)(b) | | | 38,348,043 | | | | 5,469,801 | |
Silver Lake Resources Ltd.(a) | | | 18,881,900 | | | | 25,172,337 | |
SolGold PLC(a) | | | 19,700,000 | | | | 7,957,980 | |
Sunrise Energy Metals Ltd.(a) | | | 47,436 | | | | 81,142 | |
Vulcan Energy Resources Ltd.(a) | | | 820,000 | | | | 5,241,420 | |
Westgold Resources Ltd.(a)(c) | | | 21,394,853 | | | | 35,381,358 | |
| | | | | | | | 575,132,867 | |
| | |
Brazil–1.57% | | | | | | | | |
Wheaton Precious Metals Corp. | | | 864,035 | | | | 35,701,926 | |
| | |
Canada–49.60% | | | | | | | | |
Abaxx Technologies, Inc.(a) | | | 9,109 | | | | 28,902 | |
Adventus Mining Corp.(a) | | | 4,701,058 | | | | 4,168,859 | |
Agnico Eagle Mines Ltd. | | | 1,361,095 | | | | 84,986,772 | |
Alamos Gold, Inc., Class A | | | 3,041,108 | | | | 24,328,864 | |
Alexco Resource Corp.(a) | | | 2,790,905 | | | | 7,647,080 | |
Americas Gold & Silver Corp.(a) | | | 4,089,400 | | | | 8,816,589 | |
Anaconda Mining, Inc.(a) | | | 220,000 | | | | 118,130 | |
Artemis Gold, Inc.(a) | | | 3,520,191 | | | | 16,639,393 | |
Ascot Resources Ltd.(a) | | | 6,054,053 | | | | 4,334,350 | |
Aya Gold & Silver, Inc.(a) | | | 360,000 | | | | 2,211,284 | |
B2Gold Corp. | | | 9,472,000 | | | | 45,465,600 | |
Barrick Gold Corp.(d) | | | 4,061,499 | | | | 86,306,855 | |
Battle North Gold Corp.(a) | | | 2,940,956 | | | | 6,289,930 | |
Calibre Mining Corp., Class C(a) | | | 5,662,717 | | | | 9,260,108 | |
Centerra Gold, Inc. | | | 140,000 | | | | 1,291,624 | |
Dundee Precious Metals, Inc. | | | 2,600,000 | | | | 18,720,254 | |
Equinox Gold Corp.(a) | | | 3,437,278 | | | | 27,807,579 | |
Fiore Gold Ltd.(a) | | | 3,137,482 | | | | 3,190,703 | |
Franco-Nevada Corp. | | | 73,000 | | | | 10,164,520 | |
Freegold Ventures Ltd.(a) | | | 3,400,000 | | | | 1,936,297 | |
Fury Gold Mines Ltd.(a) | | | 2,835,933 | | | | 3,601,635 | |
Galway Metals, Inc.(a) | | | 5,133,625 | | | | 4,134,799 | |
| | | | | | | | |
| | | Shares | | | Value | |
Canada–(continued) | | | | | | | | |
Galway Metals, Inc.(e) | | | 1,030,000 | | | $ | 788,118 | |
Gran Colombia Gold Corp. | | | 1,010,000 | | | | 4,223,569 | |
Great Bear Resources Ltd.(a) | | | 1,663,515 | | | | 19,813,578 | |
Great Bear Resources Ltd.(e) | | | 20,000 | | | | 214,392 | |
GT Gold Corp.(a) | | | 6,302,188 | | | | 16,612,366 | |
IAMGOLD Corp.(a) | | | 5,559,000 | | | | 17,399,670 | |
Integra Resources Corp.(a) | | | 424,579 | | | | 1,322,977 | |
Ivanhoe Mines Ltd., Class A(a) | | | 7,525,346 | | | | 53,081,194 | |
K92 Mining, Inc.(a) | | | 8,543,030 | | | | 55,741,855 | |
Karora Resources, Inc.(a) | | | 6,977,777 | | | | 21,629,037 | |
Karora Resources, Inc., Wts., expiring 09/21/2021(a) | | | 2,500,000 | | | | 732,213 | |
Kinross Gold Corp. | | | 5,095,925 | | | | 35,875,312 | |
Kirkland Lake Gold Ltd. | | | 2,214,233 | | | | 82,271,506 | |
Liberty Gold Corp.(a) | | | 12,718,000 | | | | 15,417,012 | |
Lion One Metals Ltd.(a) | | | 7,535,842 | | | | 7,479,744 | |
Lion One Metals Ltd., Wts., expiring 08/18/2021 | | | 109,710 | | | | 357 | |
Lion One Metals Ltd., Wts., expiring 08/21/2021(a) | | | 715,515 | | | | 815 | |
Lundin Gold, Inc.(a) | | | 4,338,815 | | | | 42,076,781 | |
MAG Silver Corp.(a) | | | 43,522 | | | | 751,190 | |
Marathon Gold Corp.(a) | | | 1,810,000 | | | | 3,651,955 | |
Maverix Metals, Inc. | | | 1,458,100 | | | | 8,232,692 | |
McEwen Mining, Inc.(a) | | | 5,050,000 | | | | 6,060,000 | |
Minera Alamos, Inc.(a) | | | 11,958,743 | | | | 6,324,031 | |
Montage Gold Corp.(a) | | | 1,289,457 | | | | 891,704 | |
New Found Gold Corp.(a) | | | 610,000 | | | | 3,339,950 | |
New Gold, Inc.(a) | | | 3,980,000 | | | | 6,606,800 | |
Novagold Resources, Inc.(a) | | | 310,000 | | | | 2,786,900 | |
Novo Resources Corp.(a) | | | 1,210,000 | | | | 2,274,010 | |
Orla Mining Ltd.(a) | | | 1,020,000 | | | | 3,676,199 | |
Osino Resources Corp.(a)(c) | | | 7,911,551 | | | | 7,981,388 | |
Osino Resources Corp. | | | 160,000 | | | | 49,777 | |
Osino Resources Corp. | | | 1,000,000 | | | | 48,652 | |
Osisko Gold Royalties Ltd. | | | 2,265,339 | | | | 27,365,295 | |
Pan American Silver Corp. | | | 811,000 | | | | 25,806,020 | |
Pan American Silver Corp., Rts., expiring 02/22/2029(a) | | | 2,300,100 | | | | 2,024,088 | |
Pretium Resources, Inc.(a) | | | 1,220,000 | | | | 12,813,896 | |
Pure Gold Mining, Inc.(a)(c) | | | 21,204,712 | | | | 21,564,406 | |
Roxgold, Inc. | | | 5,600,000 | | | | 9,294,228 | |
Rupert Resources Ltd.(a) | | | 2,537,867 | | | | 10,633,377 | |
Sandstorm Gold Ltd.(a) | | | 3,969,055 | | | | 29,450,388 | |
Sierra Metals, Inc.(a) | | | 2,640,618 | | | | 9,302,262 | |
SilverCrest Metals, Inc.(a) | | | 3,016,667 | | | | 26,137,984 | |
Skeena Resources Ltd.(a) | | | 5,757,344 | | | | 16,768,736 | |
Solaris Resources, Inc.(a) | | | 601,200 | | | | 4,866,729 | |
Sombrero Resources, Inc.(e) | | | 3,028,200 | | | | 1,438,395 | |
SSR Mining, Inc. | | | 1,730,333 | | | | 27,443,081 | |
Tier One Silver, Inc.(e) | | | 3,028,200 | | | | 1,438,395 | |
Torex Gold Resources, Inc.(a) | | | 2,500,000 | | | | 30,264,817 | |
Tudor Gold Corp.(a) | | | 1,669,068 | | | | 4,032,976 | |
Victoria Gold Corp.(a) | | | 785,000 | | | | 8,557,947 | |
Wallbridge Mining Co. Ltd.(a) | | | 18,714,800 | | | | 9,440,000 | |
Wesdome Gold Mines Ltd.(a) | | | 6,525,800 | | | | 48,101,329 | |
See accompanying Notes to Consolidated Financial Statements which are an integral part of the financial statements.
8 Invesco Gold & Special Minerals Fund
| | | | | | | | |
| | | Shares | | | Value | |
Canada–(continued) | | | | | | | | |
Yamana Gold, Inc. | | | 530,000 | | | $ | 2,432,700 | |
| | | | | | | | 1,127,982,920 | |
| | |
China–0.79% | | | | | | | | |
Zhaojin Mining Industry Co. Ltd., H Shares | | | 19,870,000 | | | | 17,997,016 | |
| | |
Ivory Coast–1.58% | | | | | | | | |
Endeavour Mining Corp. | | | 1,726,122 | | | | 35,936,592 | |
| | |
Mongolia–0.62% | | | | | | | | |
Turquoise Hill Resources Ltd.(a) | | | 795,343 | | | | 14,005,990 | |
| | |
Russia–0.17% | | | | | | | | |
Polymetal International PLC | | | 165,000 | | | | 3,407,086 | |
Polyus PJSC, GDR(f) | | | 5,000 | | | | 463,250 | |
| | | | | | | | 3,870,336 | |
| | |
South Africa–7.18% | | | | | | | | |
Gold Fields Ltd., ADR | | | 10,022,241 | | | | 94,008,621 | |
Harmony Gold Mining Co. Ltd., ADR | | | 5,840,000 | | | | 26,513,600 | |
Sibanye Stillwater Ltd., ADR | | | 2,292,587 | | | | 42,756,747 | |
| | | | | | | | 163,278,968 | |
| | |
Tanzania–4.51% | | | | | | | | |
AngloGold Ashanti Ltd., ADR(d) | | | 4,985,100 | | | | 102,593,358 | |
| | |
Turkey–1.09% | | | | | | | | |
Eldorado Gold Corp.(a) | | | 2,501,502 | | | | 24,689,825 | |
| | |
United Kingdom–0.01% | | | | | | | | |
Greatland Gold PLC(a) | | | 1,000,000 | | | | 303,846 | |
| | | | | | | | |
| | | Shares | | | Value | |
United States–7.88% | | | | | | | | |
Argonaut Gold, Inc.(a) | | | 1,890,769 | | | $ | 4,153,338 | |
Coeur Mining, Inc.(a) | | | 1,020,000 | | | | 8,241,600 | |
Danimer Scientific, Inc.(a) | | | 58,000 | | | | 1,481,900 | |
Freeport-McMoRan, Inc. | | | 3,000 | | | | 113,130 | |
Gatos Silver, Inc.(a) | | | 130,000 | | | | 1,492,400 | |
Hecla Mining Co. | | | 730,000 | | | | 4,314,300 | |
MP Materials Corp.(a) | | | 265,000 | | | | 7,960,600 | |
Newmont Corp. | | | 1,930,614 | | | | 120,489,620 | |
Perpetua Resources Corp.(a) | | | 285,100 | | | | 2,175,681 | |
Royal Gold, Inc. | | | 257,000 | | | | 28,748,020 | |
| | | | | | | | 179,170,589 | |
| | |
Zambia–0.00% | | | | | | | | |
First Quantum Minerals Ltd. | | | 2,000 | | | | 46,097 | |
Total Common Stocks & Other Equity Interests
(Cost $1,528,548,055) | | | | 2,280,710,330 | |
| | |
Money Market Funds–0.23% | | | | | | | | |
Invesco Government & Agency Portfolio, Institutional Class,
0.03%(c)(g) | | | 1,863,720 | | | | 1,863,720 | |
Invesco Liquid Assets Portfolio, Institutional Class, 0.01%(c)(g) | | | 1,326,421 | | | | 1,326,952 | |
Invesco Treasury Portfolio, Institutional Class, 0.01%(c)(g) | | | 2,129,966 | | | | 2,129,966 | |
Total Money Market Funds
(Cost $5,320,638) | | | | 5,320,638 | |
TOTAL INVESTMENTS IN SECURITIES–100.52%
(Cost $1,533,868,693) | | | | 2,286,030,968 | |
OTHER ASSETS LESS LIABILITIES–(0.52)% | | | | | | | (11,785,499 | ) |
NET ASSETS–100.00% | | | | | | $ | 2,274,245,469 | |
Investment Abbreviations:
ADR – American Depositary Receipt
GDR – Global Depositary Receipt
Rts. – Rights
Wts. – Warrants
Notes to Consolidated Schedule of Investments:
| (a) | Non-income producing security. |
| (b) | Restricted security. The value of this security at April 30, 2021 represented less than 1% of the Fund’s Net Assets. |
| (c) | Affiliated issuer. The issuer is affiliated by having an investment adviser that is under common control of Invesco Ltd. and/or the Investment Company Act of 1940, as amended (the “1940 Act”), defines “affiliated person” to include an issuer of which a fund holds 5% or more of the outstanding voting securities. The Fund has not owned enough of the outstanding voting securities of the issuer to have control (as defined in the 1940 Act) of that issuer. The table below shows the Fund’s transactions in, and earnings from, its investments in affiliates for the fiscal year ended April 30, 2021. |
| | | | | | | | | | | | | | | | | | | | | | | | | | | | |
| | | Value April 30, 2020 | | | Purchases at Cost | | | Proceeds from Sales | | | Change in
Unrealized
Appreciation
(Depreciation) | | | Realized Gain (Loss) | | | Value April 30, 2021 | | | Dividend Income | |
| Investments in Affiliated Money Market Funds: | | | | | | | | | | | | | | | | | | | | | | | | | | | | |
Invesco Government & Agency Portfolio, Institutional Class | | $ | 70,542,372 | | | $ | 210,263,106 | | | $ | (278,941,758 | ) | | $ | - | | | $ | - | | | $ | 1,863,720 | | | $ | 9,592 | |
Invesco Liquid Assets Portfolio, Institutional Class | | | - | | | | 145,187,782 | | | | (143,856,177 | ) | | | - | | | | (4,653 | ) | | | 1,326,952 | | | | 12,026 | |
Invesco Treasury Portfolio, Institutional Class | | | - | | | | 233,075,283 | | | | (230,945,317 | ) | | | - | | | | - | | | | 2,129,966 | | | | 4,603 | |
| Investments in Other Affiliates: | | | | | | | | | | | | | | | | | | | | | | | | | | | | |
Dacian Gold Ltd. | | | 6,615,445 | | | | - | | | | (7,132,013 | ) | | | 13,810,156 | | | | (13,293,588 | ) | | | - | | | | - | |
Osino Resources Corp. | | | 2,935,968 | | | | 2,594,997 | | | | - | | | | 2,450,423 | | | | - | | | | 7,981,388 | | | | - | |
Pure Gold Mining, Inc. | | | - | | | | 34,908,299 | | | | - | | | | (13,343,893 | ) | | | - | | | | 21,564,406 | | | | - | |
Westgold Resources Ltd. | | | 22,555,972 | | | | 6,699,212 | | | | - | | | | 6,126,174 | | | | - | | | | 35,381,358 | | | | - | |
Total | | $ | 102,649,757 | | | $ | 632,728,679 | | | $ | (660,875,265 | ) | | $ | 9,042,860 | | | $ | (13,298,241 | ) | | $ | 70,247,790 | | | $ | 26,221 | |
See accompanying Notes to Consolidated Financial Statements which are an integral part of the financial statements.
9 Invesco Gold & Special Minerals Fund
| (d) | All or a portion of the value pledged and/or designated as collateral to cover margin requirements for open options contracts. See Note 1K and Note 1L. |
| (e) | Security valued using significant unobservable inputs (Level 3). See Note 3. |
| (f) | Security purchased or received in a transaction exempt from registration under the Securities Act of 1933, as amended (the “1933 Act”). The security may be resold pursuant to an exemption from registration under the 1933 Act, typically to qualified institutional buyers. The value of this security at April 30, 2021 represented less than 1% of the Fund’s Net Assets. |
| (g) | The rate shown is the 7-day SEC standardized yield as of April 30, 2021. |
| | | | | | | | | | | | | | | | | | | | | | | | | | | | | | | | |
| Open Exchange-Traded Equity Options Written | |
| |
| | | | | | | | | | | | | | | | | | | | | | | | Unrealized | |
| | | Type of | | | Expiration | | | Number of | | | Exercise | | | Premiums | | | Notional | | | | | | Appreciation | |
| Description | | Contract | | | Date | | | Contracts | | | Price | | | Received | | | Value* | | | Value | | | (Depreciation) | |
| |
Equity Risk | | | | | | | | | | | | | | | | | | | | | | | | | | | | | | | | |
| |
Agnico Eagle Mines Ltd. | | | Call | | | | 05/21/2021 | | | | 3,000 | | | | $100.00 | | | $ | (323,433 | ) | | | $30,000,000 | | | $ | (7,500 | ) | | $ | 315,933 | |
| |
Agnico Eagle Mines Ltd. | | | Call | | | | 09/17/2021 | | | | 1,000 | | | | 80.00 | | | | (130,022 | ) | | | 8,000,000 | | | | (75,000 | ) | | | 55,022 | |
| |
Alamos Gold, Inc. | | | Call | | | | 06/18/2021 | | | | 5,000 | | | | 12.50 | | | | (200,943 | ) | | | 6,250,000 | | | | (25,000 | ) | | | 175,943 | |
| |
AngloGold Ashanti Ltd. | | | Call | | | | 07/16/2021 | | | | 5,000 | | | | 30.00 | | | | (628,807 | ) | | | 15,000,000 | | | | (50,000 | ) | | | 578,807 | |
| |
B2Gold Corp. | | | Call | | | | 07/16/2021 | | | | 5,000 | | | | 7.50 | | | | (204,427 | ) | | | 3,750,000 | | | | (25,000 | ) | | | 179,427 | |
| |
Coeur Mining, Inc. | | | Call | | | | 06/18/2021 | | | | 3,000 | | | | 14.00 | | | | (267,987 | ) | | | 4,200,000 | | | | (15,000 | ) | | | 252,987 | |
| |
Dundee Precious Metals, Inc. | | | Call | | | | 10/15/2021 | | | | 2,000 | | | CAD | 11.00 | | | | (92,848 | ) | | CAD | 2,200,000 | | | | (52,882 | ) | | | 39,966 | |
| |
Eldorado Gold Corp. | | | Call | | | | 07/16/2021 | | | | 12,000 | | | | 14.00 | | | | (1,256,653 | ) | | | 16,800,000 | | | | (120,000 | ) | | | 1,136,653 | |
| |
Endeavour Mining Corp. | | | Call | | | | 10/15/2021 | | | | 5,000 | | | CAD | 32.00 | | | | (658,481 | ) | | CAD | 16,000,000 | | | | (294,919 | ) | | | 363,562 | |
| |
Equinox Gold Corp. | | | Call | | | | 07/16/2021 | | | | 4,000 | | | | 17.50 | | | | (143,114 | ) | | | 7,000,000 | | | | (10,000 | ) | | | 133,114 | |
| |
Franco-Nevada Corp. | | | Call | | | | 07/16/2021 | | | | 700 | | | | 160.00 | | | | (96,595 | ) | | | 11,200,000 | | | | (73,500 | ) | | | 23,095 | |
| |
Gold Fields Ltd. | | | Call | | | | 07/16/2021 | | | | 12,398 | | | | 12.00 | | | | (743,922 | ) | | | 14,877,600 | | | | (247,960 | ) | | | 495,962 | |
| |
Gold Fields, Ltd. | | | Call | | | | 10/15/2021 | | | | 3,000 | | | | 13.00 | | | | (160,943 | ) | | | 3,900,000 | | | | (105,000 | ) | | | 55,943 | |
| |
Harmony Gold Mining Co. Ltd. | | | Call | | | | 08/20/2021 | | | | 5,000 | | | | 8.00 | | | | (249,166 | ) | | | 4,000,000 | | | | (50,000 | ) | | | 199,166 | |
| |
Hecla Mining Co. | | | Call | | | | 06/18/2021 | | | | 4,004 | | | | 8.00 | | | | (196,153 | ) | | | 3,203,200 | | | | (44,044 | ) | | | 152,109 | |
| |
IAMGOLD Corp. | | | Call | | | | 06/18/2021 | | | | 6,000 | | | | 4.00 | | | | (275,780 | ) | | | 2,400,000 | | | | (45,000 | ) | | | 230,780 | |
| |
Kinross Gold Corp. | | | Call | | | | 05/21/2021 | | | | 6,000 | | | | 10.00 | | | | (245,780 | ) | | | 6,000,000 | | | | (6,000 | ) | | | 239,780 | |
| |
Kirkland Lake Gold Ltd. | | | Call | | | | 07/16/2021 | | | | 1,000 | | | CAD | 62.00 | | | | (121,236 | ) | | CAD | 6,200,000 | | | | (12,204 | ) | | | 109,032 | |
| |
Kirkland Lake Gold Ltd. | | | Call | | | | 07/16/2021 | | | | 1,000 | | | CAD | 54.00 | | | | (89,646 | ) | | CAD | 5,400,000 | | | | (46,780 | ) | | | 42,866 | |
| |
Lundin Gold, Inc. | | | Call | | | | 07/16/2021 | | | | 3,000 | | | CAD | 16.00 | | | | (77,247 | ) | | CAD | 4,800,000 | | | | (19,526 | ) | | | 57,721 | |
| |
McEwen Mining, Inc. | | | Call | | | | 05/21/2021 | | | | 2,191 | | | | 2.00 | | | | (38,579 | ) | | | 438,200 | | | | (5,477 | ) | | | 33,102 | |
| |
MP Materials Corp. | | | Call | | | | 09/17/2021 | | | | 2,000 | | | | 50.00 | | | | (358,927 | ) | | | 10,000,000 | | | | (270,000 | ) | | | 88,927 | |
| |
New Gold, Inc. | | | Call | | | | 11/19/2021 | | | | 1,000 | | | | 3.00 | | | | (16,965 | ) | | | 300,000 | | | | (10,000 | ) | | | 6,965 | |
| |
Newmont Corp. | | | Call | | | | 06/18/2021 | | | | 2,000 | | | | 80.00 | | | | (248,923 | ) | | | 16,000,000 | | | | (16,000 | ) | | | 232,923 | |
| |
Newmont Corp. | | | Call | | | | 12/17/2021 | | | | 2,000 | | | | 80.00 | | | | (432,926 | ) | | | 16,000,000 | | | | (238,000 | ) | | | 194,926 | |
| |
Pan American Silver Corp. | | | Call | | | | 10/15/2021 | | | | 2,000 | | | | 44.00 | | | | (313,927 | ) | | | 8,800,000 | | | | (185,000 | ) | | | 128,927 | |
| |
Royal Gold, Inc. | | | Call | | | | 07/16/2021 | | | | 1,000 | | | | 140.00 | | | | (112,964 | ) | | | 14,000,000 | | | | (37,500 | ) | | | 75,464 | |
| |
Sandstorm Gold, Ltd. | | | Call | | | | 09/17/2021 | | | | 1,000 | | | | 9.00 | | | | (54,963 | ) | | | 900,000 | | | | (35,000 | ) | | | 19,963 | |
| |
Sibanye Stillwater Ltd. | | | Call | | | | 07/16/2021 | | | | 18,000 | | | | 20.00 | | | | (2,507,785 | ) | | | 36,000,000 | | | | (2,295,000 | ) | | | 212,785 | |
| |
Sibanye Stillwater, Ltd. | | | Call | | | | 07/16/2021 | | | | 4,000 | | | | 25.00 | | | | (412,808 | ) | | | 10,000,000 | | | | (130,000 | ) | | | 282,808 | |
| |
SSR Mining, Inc. | | | Call | | | | 06/18/2021 | | | | 4,000 | | | | 21.00 | | | | (665,508 | ) | | | 8,400,000 | | | | (40,000 | ) | | | 625,508 | |
| |
Turquoise Hill Resources Ltd. | | | Call | | | | 06/18/2021 | | | | 7,600 | | | | 17.00 | | | | (1,038,529 | ) | | | 12,920,000 | | | | (1,425,000 | ) | | | (386,471 | ) |
| |
Wesdome Gold Mines Ltd. | | | Call | | | | 07/16/2021 | | | | 2,000 | | | CAD | 12.00 | | | | (60,108 | ) | | CAD | 2,400,000 | | | | (8,136 | ) | | | 51,972 | |
| |
Wheaton Precious Metals Corp. | | | Call | | | | 06/18/2021 | | | | 5,000 | | | | 55.00 | | | | (798,433 | ) | | | 27,500,000 | | | | (55,000 | ) | | | 743,433 | |
| |
Subtotal – Equity Call Options Written | | | | | | | | (13,224,528 | ) | | | | | | | (6,075,428 | ) | | | 7,149,100 | |
| |
See accompanying Notes to Consolidated Financial Statements which are an integral part of the financial statements.
10 Invesco Gold & Special Minerals Fund
| | | | | | | | | | | | | | | | | | | | | | | | | | | | | | | | |
| Open Exchange-Traded Equity Options Written–(continued) | |
| |
| | | | | | | | | | | | | | | | | | | | | | | | Unrealized | |
| | | Type of | | | Expiration | | | Number of | | | Exercise | | | Premiums | | | Notional | | | | | | Appreciation | |
| Description | | Contract | | | Date | | | Contracts | | | Price | | | Received | | | Value* | | | Value | | | (Depreciation) | |
| |
Equity Risk | | | | | | | | | | | | | | | | | | | | | | | | | | | | | | | | |
| |
Agnico Eagle Mines Ltd. | | | Put | | | | 05/21/2021 | | | | 2,000 | | | | $55.00 | | | $ | (299,171 | ) | | | $11,000,000 | | | $ | (25,000 | ) | | $ | 274,171 | |
| |
Alamos Gold, Inc. | | | Put | | | | 06/18/2021 | | | | 4,000 | | | | 7.50 | | | | (312,432 | ) | | | 3,000,000 | | | | (130,000 | ) | | | 182,432 | |
| |
AngloGold Ashanti Ltd. | | | Put | | | | 07/16/2021 | | | | 2,000 | | | | 20.00 | | | | (373,924 | ) | | | 4,000,000 | | | | (230,000 | ) | | | 143,924 | |
| |
B2Gold Corp. | | | Put | | | | 07/16/2021 | | | | 3,000 | | | | 5.00 | | | | (179,109 | ) | | | 1,500,000 | | | | (172,500 | ) | | | 6,609 | |
| |
Centerra Gold, Inc. | | | Put | | | | 07/16/2021 | | | | 2,000 | | | CAD | 13.00 | | | | (158,755 | ) | | CAD | 2,600,000 | | | | (349,835 | ) | | | (191,080 | ) |
| |
Coeur Mining, Inc. | | | Put | | | | 06/18/2021 | | | | 1,000 | | | | 7.00 | | | | (101,962 | ) | | | 700,000 | | | | (25,000 | ) | | | 76,962 | |
| |
Coeur Mining, Inc. | | | Put | | | | 09/17/2021 | | | | 1,000 | | | | 8.00 | | | | (109,964 | ) | | | 800,000 | | | | (120,000 | ) | | | (10,036 | ) |
| |
Danimer Scientific, Inc. | | | Put | | | | 08/20/2021 | | | | 1,500 | | | | 30.00 | | | | (495,269 | ) | | | 4,500,000 | | | | (1,147,500 | ) | | | (652,231 | ) |
| |
Eldorado Gold Corp. | | | Put | | | | 07/16/2021 | | | | 3,000 | | | | 10.00 | | | | (348,022 | ) | | | 3,000,000 | | | | (277,500 | ) | | | 70,522 | |
| |
Endeavour Mining Corp. | | | Put | | | | 10/15/2021 | | | | 1,000 | | | CAD | 22.00 | | | | (103,441 | ) | | CAD | 2,200,000 | | | | (117,968 | ) | | | (14,527 | ) |
| |
Equinox Gold Corp. | | | Put | | | | 07/16/2021 | | | | 4,000 | | | | 7.50 | | | | (195,471 | ) | | | 3,000,000 | | | | (150,000 | ) | | | 45,471 | |
| |
First Quantum Minerals Ltd. | | | Put | | | | 07/16/2021 | | | | 1,000 | | | CAD | 18.00 | | | | (83,208 | ) | | CAD | 1,800,000 | | | | (14,644 | ) | | | 68,564 | |
| |
Freeport-McMoRan, Inc. | | | Put | | | | 11/19/2021 | | | | 1,000 | | | | 27.00 | | | | (140,963 | ) | | | 2,700,000 | | | | (122,000 | ) | | | 18,963 | |
| |
Hecla Mining Co. | | | Put | | | | 06/18/2021 | | | | 3,000 | | | | 5.00 | | | | (184,889 | ) | | | 1,500,000 | | | | (48,000 | ) | | | 136,889 | |
| |
IAMGOLD Corp. | | | Put | | | | 06/18/2021 | | | | 5,000 | | | | 3.00 | | | | (160,818 | ) | | | 1,500,000 | | | | (87,500 | ) | | | 73,318 | |
| |
Kinross Gold Corp. | | | Put | | | | 05/21/2021 | | | | 5,000 | | | | 7.00 | | | | (374,813 | ) | | | 3,500,000 | | | | (130,000 | ) | | | 244,813 | |
| |
Lundin Gold, Inc. | | | Put | | | | 07/16/2021 | | | | 2,000 | | | CAD | 9.00 | | | | (96,388 | ) | | CAD | 1,800,000 | | | | (17,899 | ) | | | 78,489 | |
| |
MAG Silver Corp. | | | Put | | | | 06/18/2021 | | | | 2,000 | | | | 15.00 | | | | (252,175 | ) | | | 3,000,000 | | | | (90,000 | ) | | | 162,175 | |
| |
McEwen Mining, Inc. | | | Put | | | | 05/21/2021 | | | | 6,098 | | | | 2.00 | | | | (552,782 | ) | | | 1,219,600 | | | | (426,860 | ) | | | 125,922 | |
| |
MP Materials Corp. | | | Put | | | | 06/18/2021 | | | | 2,000 | | | | 30.00 | | | | (481,399 | ) | | | 6,000,000 | | | | (700,000 | ) | | | (218,601 | ) |
| |
New Gold, Inc. | | | Put | | | | 05/21/2021 | | | | 4,000 | | | | 2.00 | | | | (174,284 | ) | | | 800,000 | | | | (140,000 | ) | | | 34,284 | |
| |
Newmont Corp. | | | Put | | | | 06/18/2021 | | | | 1,200 | | | | 55.00 | | | | (186,556 | ) | | | 6,600,000 | | | | (44,400 | ) | | | 142,156 | |
| |
Newmont Corp. | | | Put | | | | 12/17/2021 | | | | 1,000 | | | | 50.00 | | | | (169,053 | ) | | | 5,000,000 | | | | (150,500 | ) | | | 18,553 | |
| |
Pan American Silver Corp. | | | Put | | | | 10/15/2021 | | | | 1,000 | | | | 26.00 | | | | (122,914 | ) | | | 2,600,000 | | | | (139,000 | ) | | | (16,086 | ) |
| |
Piedmont Lithium, Ltd. | | | Put | | | | 08/20/2021 | | | | 1,000 | | | | 35.00 | | | | (282,891 | ) | | | 3,500,000 | | | | (85,000 | ) | | | 197,891 | |
| |
Sandstorm Gold, Ltd. | | | Put | | | | 06/18/2021 | | | | 3,000 | | | | 6.00 | | | | (189,890 | ) | | | 1,800,000 | | | | (22,500 | ) | | | 167,390 | |
| |
Sibanye Stillwater Ltd. | | | Put | | | | 07/16/2021 | | | | 1,000 | | | | 10.00 | | | | (46,963 | ) | | | 1,000,000 | | | | (7,500 | ) | | | 39,463 | |
| |
Sibanye Stillwater, Ltd. | | | Put | | | | 10/15/2021 | | | | 2,000 | | | | 15.00 | | | | (225,918 | ) | | | 3,000,000 | | | | (260,000 | ) | | | (34,082 | ) |
| |
SSR Mining, Inc. | | | Put | | | | 06/18/2021 | | | | 3,000 | | | | 16.00 | | | | (437,303 | ) | | | 4,800,000 | | | | (352,500 | ) | | | 84,803 | |
| |
Turquoise Hill Resources, Ltd. | | | Put | | | | 12/17/2021 | | | | 1,000 | | | | 13.00 | | | | (107,964 | ) | | | 1,300,000 | | | | (120,000 | ) | | | (12,036 | ) |
| |
Wesdome Gold Mines Ltd. | | | Put | | | | 07/16/2021 | | | | 3,000 | | | CAD | 8.00 | | | | (109,979 | ) | | CAD | 2,400,000 | | | | (61,018 | ) | | | 48,961 | |
| |
Wheaton Precious Metals Corp. | | | Put | | | | 06/18/2021 | | | | 4,000 | | | | 35.00 | | | | (769,546 | ) | | | 14,000,000 | | | | (84,000 | ) | | | 685,546 | |
| |
Yamana Gold, Inc. | | | Put | | | | 07/16/2021 | | | | 1,000 | | | | 4.00 | | | | (33,963 | ) | | | 400,000 | | | | (9,500 | ) | | | 24,463 | |
| |
Subtotal – Equity Put Options Written | | | | | | | | | | | | (7,862,179 | ) | | | | | | | (5,858,124 | ) | | | 2,004,055 | |
| |
Total Open Exchange-Traded Equity Options Written | | | $ | (21,086,707 | ) | | | | | | $ | (11,933,552 | ) | | $ | 9,153,155 | |
| |
| * | Notional Value is calculated by multiplying the Number of Contracts by the Exercise Price by the multiplier. |
Abbreviations:
CAD – Canadian Dollar
See accompanying Notes to Consolidated Financial Statements which are an integral part of the financial statements.
11 Invesco Gold & Special Minerals Fund
Consolidated Statement of Assets and Liabilities
April 30, 2021
| | | | |
Assets: | | | | |
Investments in securities, at value
(Cost $1,458,124,860) | | $ | 2,215,783,178 | |
| |
Investments in affiliates, at value
(Cost $75,743,833) | | | 70,247,790 | |
| |
Cash | | | 363,175 | |
| |
Foreign currencies, at value
(Cost $1,645,077) | | | 1,644,416 | |
| |
Receivable for: | | | | |
Investments sold | | | 10,133,247 | |
| |
Fund shares sold | | | 2,413,136 | |
| |
Dividends | | | 486,139 | |
| |
Investment for trustee deferred compensation and retirement plans | | | 200,185 | |
| |
Other assets | | | 233,143 | |
| |
Total assets | | | 2,301,504,409 | |
| |
| |
Liabilities: | | | | |
Other investments: | | | | |
Options written, at value (premiums received $21,086,707) | | | 11,933,552 | |
| |
Payable for: | | | | |
Investments purchased | | | 9,384,496 | |
| |
Fund shares reacquired | | | 3,855,546 | |
| |
Accrued fees to affiliates | | | 1,239,359 | |
| |
Accrued trustees’ and officers’ fees and benefits | | | 42,856 | |
| |
Accrued other operating expenses | | | 583,417 | |
| |
Trustee deferred compensation and retirement plans | | | 219,714 | |
| |
Total liabilities | | | 27,258,940 | |
| |
Net assets applicable to shares outstanding | | $ | 2,274,245,469 | |
| |
| |
Net assets consist of: | | | | |
Shares of beneficial interest | | $ | 3,039,297,406 | |
| |
Distributable earnings (loss) | | | (765,051,937 | ) |
| |
| | $ | 2,274,245,469 | |
| |
| | | | |
Net Assets: | | | | |
Class A | | $ | 1,098,007,203 | |
| |
Class C | | $ | 128,089,479 | |
| |
Class R | | $ | 153,231,785 | |
| |
Class Y | | $ | 600,958,407 | |
| |
Class R5 | | $ | 141,480 | |
| |
Class R6 | | $ | 293,817,115 | |
| |
|
Shares outstanding, no par value, with an unlimited number of shares authorized: | |
Class A | | | 39,632,172 | |
| |
Class C | | | 5,127,271 | |
| |
Class R | | | 5,821,242 | |
| |
Class Y | | | 21,701,013 | |
| |
Class R5 | | | 5,110 | |
| |
Class R6 | | | 10,517,077 | |
| |
Class A: | | | | |
Net asset value per share | | $ | 27.70 | |
| |
Maximum offering price per share
(Net asset value of $27.70 ÷ 94.50%) | | $ | 29.31 | |
| |
Class C: | | | | |
Net asset value and offering price per share | | $ | 24.98 | |
| |
Class R: | | | | |
Net asset value and offering price per share | | $ | 26.32 | |
| |
Class Y: | | | | |
Net asset value and offering price per share | | $ | 27.69 | |
| |
Class R5: | | | | |
Net asset value and offering price per share | | $ | 27.69 | |
| |
Class R6: | | | | |
Net asset value and offering price per share | | $ | 27.94 | |
| |
See accompanying Notes to Consolidated Financial Statements which are an integral part of the financial statements.
12 Invesco Gold & Special Minerals Fund
Consolidated Statement of Operations
For the year ended April 30, 2021
| | | | |
Investment income: | | | | |
Dividends (net of foreign withholding taxes of $2,781,371) | | $ | 25,000,677 | |
| |
Non-cash dividend income | | | 2,876,790 | |
| |
Dividends from affiliated money market funds | | | 26,221 | |
| |
Total investment income | | | 27,903,688 | |
| |
| |
Expenses: | | | | |
Advisory fees | | | 12,903,678 | |
| |
Administrative services fees | | | 318,027 | |
| |
Custodian fees | | | 115,649 | |
| |
Distribution fees: | | | | |
Class A | | | 2,607,790 | |
| |
Class C | | | 1,399,200 | |
| |
Class R | | | 790,569 | |
| |
Transfer agent fees – A, C, R and Y | | | 3,544,147 | |
| |
Transfer agent fees – R5 | | | 46 | |
| |
Transfer agent fees – R6 | | | 89,181 | |
| |
Trustees’ and officers’ fees and benefits | | | 50,232 | |
| |
Registration and filing fees | | | 229,385 | |
| |
Reports to shareholders | | | 156,000 | |
| |
Professional services fees | | | 86,273 | |
| |
Other | | | 59,780 | |
| |
Total expenses | | | 22,349,957 | |
| |
Less: Fees waived and/or expense offset arrangement(s) | | | (21,850 | ) |
| |
Net expenses | | | 22,328,107 | |
| |
Net investment income | | | 5,575,581 | |
| |
| |
Realized and unrealized gain (loss) from: | | | | |
Net realized gain (loss) from: | | | | |
Unaffiliated investment securities | | | 158,938,289 | |
| |
Affiliated investment securities | | | (13,298,241 | ) |
| |
Foreign currencies | | | (424,892 | ) |
| |
Forward foreign currency contracts | | | 63,870 | |
| |
Option contracts written | | | 66,027,382 | |
| |
| | | 211,306,408 | |
| |
Change in net unrealized appreciation of: | | | | |
Unaffiliated investment securities | | | 233,877,199 | |
| |
Affiliated investment securities | | | 9,042,860 | |
| |
Foreign currencies | | | 67,955 | |
| |
Option contracts written | | | 17,840,826 | |
| |
| | | 260,828,840 | |
| |
Net realized and unrealized gain | | | 472,135,248 | |
| |
Net increase in net assets resulting from operations | | $ | 477,710,829 | |
| |
See accompanying Notes to Consolidated Financial Statements which are an integral part of the financial statements.
13 Invesco Gold & Special Minerals Fund
Consolidated Statement of Changes in Net Assets
For the year ended April 30, 2021, period ended April 30, 2020, and the year ended June 30, 2019
| | | | | | | | | | | | |
| | | Year Ended | | | Ten Months Ended | | | Year Ended | |
| | | April 30, 2021 | | | April 30, 2020 | | | June 30, 2019 | |
| |
Operations: | | | | | | | | | | | | |
Net investment income (loss) | | $ | 5,575,581 | | | | $ 1,801,363 | | | $ | (206,293 | ) |
| |
Net realized gain (loss) | | | 211,306,408 | | | | 74,701,169 | | | | (19,637,801 | ) |
| |
Change in net unrealized appreciation | | | 260,828,840 | | | | 153,999,209 | | | | 161,478,360 | |
| |
Net increase in net assets resulting from operations | | | 477,710,829 | | | | 230,501,741 | | | | 141,634,266 | |
| |
| | | |
Distributions to shareholders from distributable earnings: | | | | | | | | | | | | |
Class A | | | (16,822,355 | ) | | | (1,841,453 | ) | | | – | |
| |
Class C | | | (1,536,875 | ) | | | – | | | | – | |
| |
Class R | | | (2,060,872 | ) | | | (133,756 | ) | | | – | |
| |
Class Y | | | (11,199,660 | ) | | | (1,503,817 | ) | | | – | |
| |
Class R5 | | | (1,530 | ) | | | (75 | ) | | | – | |
| |
Class R6 | | | (5,793,423 | ) | | | (983,754 | ) | | | – | |
| |
Total distributions from distributable earnings | | | (37,414,715 | ) | | | (4,462,855 | ) | | | – | |
| |
| | | |
Share transactions–net: | | | | | | | | | | | | |
Class A | | | 170,567,638 | | | | 66,614,819 | | | | (21,157,820 | ) |
| |
Class C | | | (1,689,031 | ) | | | (7,079,595 | ) | | | (45,910,870 | ) |
| |
Class R | | | (6,346,893 | ) | | | (10,950,941 | ) | | | (15,199,193 | ) |
| |
Class Y | | | 151,457,870 | | | | 72,743,264 | | | | 50,764,653 | |
| |
Class R5 | | | 97,792 | | | | 9,834 | | | | 10,000 | |
| |
Class R6 | | | 42,424,690 | | | | 31,209,905 | | | | 10,483,870 | |
| |
Net increase (decrease) in net assets resulting from share transactions | | | 356,512,066 | | | | 152,547,286 | | | | (21,009,360 | ) |
| |
Net increase in net assets | | | 796,808,180 | | | | 378,586,172 | | | | 120,624,906 | |
| |
| | | |
Net assets: | | | | | | | | | | | | |
Beginning of year | | | 1,477,437,289 | | | | 1,098,851,117 | | | | 978,226,211 | |
| |
End of year | | $ | 2,274,245,469 | | | | $1,477,437,289 | | | $ | 1,098,851,117 | |
| |
See accompanying Notes to Consolidated Financial Statements which are an integral part of the financial statements.
14 Invesco Gold & Special Minerals Fund
Consolidated Financial Highlights
The following schedule presents financial highlights for a share of the Fund outstanding throughout the periods indicated.
| | | | | | | | | | | | | | | | | | | | | | | | | | | | | | | | | | | | | | | | | | | | | | | | | | | | | | | | | | | | |
| | | Net asset
value,
beginning
of period | | Net
investment
income
(loss)(a) | | Net gains
(losses)
on securities
(both
realized and
unrealized) | | Total from
investment
operations | | Dividends
from net
investment
income | | Net asset
value, end
of period | | Total
return(b) | | Net assets,
end of period
(000’s omitted) | | Ratio of expenses
to average
net assets
with
fee waivers
and/or
expenses
absorbed | | Ratio of expenses
to average net
assets without
fee waivers
and/or
expenses
absorbed | | Ratio of net
investment
income
(loss)
to average
net assets | | Portfolio
turnover (c) |
Class A | | | | | | | | | | | | | | | | | | | | | | | | | | | | | | | | | | | | | | | | | | | | | | | | | | | | | | | | | | | | |
Year ended 04/30/21 | | | $ | 21.77 | | | | $ | 0.06 | | | | $ | 6.30 | | | | $ | 6.36 | | | | $ | (0.43 | ) | | | $ | 27.70 | | | | | 29.28 | %(d) | | | $ | 1,098,007 | | | | | 1.05 | %(d)(e) | | | | 1.05 | %(d)(e) | | | | 0.21 | %(d)(e) | | | | 43 | % |
Ten months ended 04/30/20 | | | | 17.87 | | | | | 0.02 | | | | | 3.94 | | | | | 3.96 | | | | | (0.06 | ) | | | | 21.77 | | | | | 22.21 | | | | | 705,341 | | | | | 1.17 | | | | | 1.20 | | | | | 0.13 | | | | | 44 | |
Year ended 06/30/19 | | | | 15.51 | | | | | 0.00 | | | | | 2.36 | | | | | 2.36 | | | | | – | | | | | 17.87 | | | | | 15.22 | | | | | 532,925 | | | | | 1.17 | | | | | 1.18 | | | | | 0.00 | | | | | 35 | |
Year ended 06/30/18 | | | | 16.28 | | | | | (0.06 | ) | | | | (0.25 | ) | | | | (0.31 | ) | | | | (0.46 | ) | | | | 15.51 | | | | | (1.88 | ) | | | | 490,065 | | | | | 1.16 | | | | | 1.17 | | | | | (0.39 | ) | | | | 44 | |
Year ended 06/30/17 | | | | 19.82 | | | | | (0.09 | ) | | | | (2.40 | ) | | | | (2.49 | ) | | | | (1.05 | ) | | | | 16.28 | | | | | (12.12 | ) | | | | 570,847 | | | | | 1.15 | | | | | 1.16 | | | | | (0.48 | ) | | | | 65 | |
Year ended 06/30/16 | | | | 12.63 | | | | | (0.06 | ) | | | | 7.25 | | | | | 7.19 | | | | | – | | | | | 19.82 | | | | | 56.93 | | | | | 793,452 | | | | | 1.17 | | | | | 1.18 | | | | | (0.44 | ) | | | | 69 | |
Class C | | | | | | | | | | | | | | | | | | | | | | | | | | | | | | | | | | | | | | | | | | | | | | | | | | | | | | | | | | | | |
Year ended 04/30/21 | | | | 19.68 | | | | | (0.14 | ) | | | | 5.70 | | | | | 5.56 | | | | | (0.26 | ) | | | | 24.98 | | | | | 28.27 | | | | | 128,089 | | | | | 1.81 | (e) | | | | 1.81 | (e) | | | | (0.55 | )(e) | | | | 43 | |
Ten months ended 04/30/20 | | | | 16.20 | | | | | (0.09 | ) | | | | 3.57 | | | | | 3.48 | | | | | – | | | | | 19.68 | | | | | 21.48 | | | | | 99,528 | | | | | 1.92 | | | | | 1.96 | | | | | (0.62 | ) | | | | 44 | |
Year ended 06/30/19 | | | | 14.17 | | | | | (0.10 | ) | | | | 2.13 | | | | | 2.03 | | | | | – | | | | | 16.20 | | | | | 14.33 | | | | | 88,904 | | | | | 1.92 | | | | | 1.93 | | | | | (0.76 | ) | | | | 35 | |
Year ended 06/30/18 | | | | 14.91 | | | | | (0.17 | ) | | | | (0.22 | ) | | | | (0.39 | ) | | | | (0.35 | ) | | | | 14.17 | | | | | (2.62 | ) | | | | 121,350 | | | | | 1.92 | | | | | 1.93 | | | | | (1.15 | ) | | | | 44 | |
Year ended 06/30/17 | | | | 18.26 | | | | | (0.20 | ) | | | | (2.21 | ) | | | | (2.41 | ) | | | | (0.94 | ) | | | | 14.91 | | | | | (12.80 | ) | | | | 138,114 | | | | | 1.91 | | | | | 1.92 | | | | | (1.22 | ) | | | | 65 | |
Year ended 06/30/16 | | | | 11.73 | | | | | (0.14 | ) | | | | 6.67 | | | | | 6.53 | | | | | – | | | | | 18.26 | | | | | 55.67 | | | | | 179,529 | | | | | 1.93 | | | | | 1.94 | | | | | (1.19 | ) | | | | 69 | |
Class R | | | | | | | | | | | | | | | | | | | | | | | | | | | | | | | | | | | | | | | | | | | | | | | | | | | | | | | | | | | | |
Year ended 04/30/21 | | | | 20.69 | | | | | (0.01 | ) | | | | 5.98 | | | | | 5.97 | | | | | (0.34 | ) | | | | 26.32 | | | | | 28.90 | | | | | 153,232 | | | | | 1.31 | (e) | | | | 1.31 | (e) | | | | (0.05 | )(e) | | | | 43 | |
Ten months ended 04/30/20 | | | | 16.98 | | | | | (0.02 | ) | | | | 3.75 | | | | | 3.73 | | | | | (0.02 | ) | | | | 20.69 | | | | | 21.99 | | | | | 125,316 | | | | | 1.42 | | | | | 1.46 | | | | | (0.12 | ) | | | | 44 | |
Year ended 06/30/19 | | | | 14.77 | | | | | (0.04 | ) | | | | 2.25 | | | | | 2.21 | | | | | – | | | | | 16.98 | | | | | 14.96 | | | | | 113,589 | | | | | 1.42 | | | | | 1.43 | | | | | (0.25 | ) | | | | 35 | |
Year ended 06/30/18 | | | | 15.54 | | | | | (0.10 | ) | | | | (0.25 | ) | | | | (0.35 | ) | | | | (0.42 | ) | | | | 14.77 | | | | | (2.23 | ) | | | | 114,608 | | | | | 1.42 | | | | | 1.43 | | | | | (0.65 | ) | | | | 44 | |
Year ended 06/30/17 | | | | 18.98 | | | | | (0.12 | ) | | | | (2.31 | ) | | | | (2.43 | ) | | | | (1.01 | ) | | | | 15.54 | | | | | (12.34 | ) | | | | 136,979 | | | | | 1.41 | | | | | 1.42 | | | | | (0.73 | ) | | | | 65 | |
Year ended 06/30/16 | | | | 12.12 | | | | | (0.09 | ) | | | | 6.95 | | | | | 6.86 | | | | | – | | | | | 18.98 | | | | | 56.60 | | | | | 176,396 | | | | | 1.42 | | | | | 1.43 | | | | | (0.70 | ) | | | | 69 | |
Class Y | | | | | | | | | | | | | | | | | | | | | | | | | | | | | | | | | | | | | | | | | | | | | | | | | | | | | | | | | | | | |
Year ended 04/30/21 | | | | 21.78 | | | | | 0.12 | | | | | 6.31 | | | | | 6.43 | | | | | (0.52 | ) | | | | 27.69 | | | | | 29.57 | | | | | 600,958 | | | | | 0.81 | (e) | | | | 0.81 | (e) | | | | 0.45 | (e) | | | | 43 | |
Ten months ended 04/30/20 | | | | 17.88 | | | | | 0.06 | | | | | 3.93 | | | | | 3.99 | | | | | (0.09 | ) | | | | 21.78 | | | | | 22.41 | | | | | 349,290 | | | | | 0.92 | | | | | 0.96 | | | | | 0.38 | | | | | 44 | |
Year ended 06/30/19 | | | | 15.48 | | | | | 0.04 | | | | | 2.36 | | | | | 2.40 | | | | | – | | | | | 17.88 | | | | | 15.50 | | | | | 229,569 | | | | | 0.92 | | | | | 0.93 | | | | | 0.24 | | | | | 35 | |
Year ended 06/30/18 | | | | 16.26 | | | | | (0.02 | ) | | | | (0.25 | ) | | | | (0.27 | ) | | | | (0.51 | ) | | | | 15.48 | | | | | (1.65 | ) | | | | 147,282 | | | | | 0.92 | | | | | 0.93 | | | | | (0.15 | ) | | | | 44 | |
Year ended 06/30/17 | | | | 19.81 | | | | | (0.05 | ) | | | | (2.41 | ) | | | | (2.46 | ) | | | | (1.09 | ) | | | | 16.26 | | | | | (11.91 | ) | | | | 152,334 | | | | | 0.91 | | | | | 0.92 | | | | | (0.28 | ) | | | | 65 | |
Year ended 06/30/16 | | | | 12.59 | | | | | (0.02 | ) | | | | 7.24 | | | | | 7.22 | | | | | – | | | | | 19.81 | | | | | 57.35 | | | | | 146,710 | | | | | 0.93 | | | | | 0.94 | | | | | (0.19 | ) | | | | 69 | |
Class R5 | | | | | | | | | | | | | | | | | | | | | | | | | | | | | | | | | | | | | | | | | | | | | | | | | | | | | | | | | | | | |
Year ended 04/30/21 | | | | 21.79 | | | | | 0.16 | | | | | 6.31 | | | | | 6.47 | | | | | (0.57 | ) | | | | 27.69 | | | | | 29.75 | | | | | 141 | | | | | 0.69 | (e) | | | | 0.69 | (e) | | | | 0.57 | (e) | | | | 43 | |
Ten months ended 04/30/20 | | | | 17.87 | | | | | 0.08 | | | | | 3.95 | | | | | 4.03 | | | | | (0.11 | ) | | | | 21.79 | | | | | 22.65 | | | | | 30 | | | | | 0.77 | | | | | 0.77 | | | | | 0.53 | | | | | 44 | |
Period ended 06/30/19(f) | | | | 14.75 | | | | | 0.01 | | | | | 3.11 | | | | | 3.12 | | | | | – | | | | | 17.87 | | | | | 21.15 | | | | | 12 | | | | | 0.80 | (g) | | | | 0.80 | (g) | | | | 0.35 | (g) | | | | 35 | |
Class R6 | | | | | | | | | | | | | | | | | | | | | | | | | | | | | | | | | | | | | | | | | | | | | | | | | | | | | | | | | | | | |
Year ended 04/30/21 | | | | 21.98 | | | | | 0.16 | | | | | 6.37 | | | | | 6.53 | | | | | (0.57 | ) | | | | 27.94 | | | | | 29.79 | | | | | 293,817 | | | | | 0.66 | (e) | | | | 0.66 | (e) | | | | 0.60 | (e) | | | | 43 | |
Ten months ended 04/30/20 | | | | 18.03 | | | | | 0.09 | | | | | 3.98 | | | | | 4.07 | | | | | (0.12 | ) | | | | 21.98 | | | | | 22.65 | | | | | 197,933 | | | | | 0.74 | | | | | 0.74 | | | | | 0.56 | | | | | 44 | |
Year ended 06/30/19 | | | | 15.58 | | | | | 0.06 | | | | | 2.39 | | | | | 2.45 | | | | | – | | | | | 18.03 | | | | | 15.73 | | | | | 133,853 | | | | | 0.75 | | | | | 0.76 | | | | | 0.41 | | | | | 35 | |
Year ended 06/30/18 | | | | 16.37 | | | | | 0.00 | | | | | (0.26 | ) | | | | (0.26 | ) | | | | (0.53 | ) | | | | 15.58 | | | | | (1.53 | ) | | | | 104,921 | | | | | 0.75 | | | | | 0.75 | | | | | 0.02 | | | | | 44 | |
Year ended 06/30/17 | | | | 19.94 | | | | | (0.02 | ) | | | | (2.42 | ) | | | | (2.44 | ) | | | | (1.13 | ) | | | | 16.37 | | | | | (11.75 | ) | | | | 77,158 | | | | | 0.73 | | | | | 0.73 | | | | | (0.09 | ) | | | | 65 | |
Year ended 06/30/16 | | | | 12.65 | | | | | (0.00 | ) | | | | 7.29 | | | | | 7.29 | | | | | – | | | | | 19.94 | | | | | 57.63 | | | | | 69,889 | | | | | 0.74 | | | | | 0.75 | | | | | (0.02 | ) | | | | 69 | |
| (a) | Calculated using average shares outstanding. |
| (b) | Includes adjustments in accordance with accounting principles generally accepted in the United States of America and as such, the net asset value for financial reporting purposes and the returns based upon those net asset values may differ from the net asset value and returns for shareholder transactions. Does not include sales charges and is not annualized for periods less than one year, if applicable. |
| (c) | Portfolio turnover is calculated at the fund level and is not annualized for periods less than one year, if applicable. For the year ended April 30, 2021, the portfolio turnover calculation excludes the value of securities purchased of $210,653,892 and sold of $9,084,044 in the effort to realign the Fund’s portfolio holdings after the reorganization of Invesco Gold & Precious Metals Fund into the Fund. |
| (d) | The total return, ratio of expenses to average net assets and ratio of net investment income (loss) to average net assets reflect actual 12b-1 fees of 0.24% for the year ended April 30, 2021. |
| (e) | Ratios are based on average daily net assets (000’s omitted) of $1,079,139, $139,920, $158,114, $563,428, $76 and $273,172 for Class A, Class C, Class R, Class Y, Class R5 and Class R6 shares, respectively. |
| (f) | Commencement date after the close of business on May 24, 2019. |
See accompanying Notes to Consolidated Financial Statements which are an integral part of the financial statements.
15 Invesco Gold & Special Minerals Fund
Notes to Consolidated Financial Statements
April 30, 2021
NOTE 1–Significant Accounting Policies
Invesco Gold & Special Minerals Fund, formerly Invesco Oppenheimer Gold & Special Minerals Fund, (the “Fund”) is a series portfolio of AIM Sector Funds (Invesco Sector Funds) (the “Trust”). The Trust is a Delaware statutory trust registered under the Investment Company Act of 1940, as amended (the “1940 Act”), as an open-end series management investment company authorized to issue an unlimited number of shares of beneficial interest. Information presented in these consolidated financial statements pertains only to the Fund. Matters affecting the Fund or each class will be voted on exclusively by the shareholders of the Fund or each class.
The Fund will seek to gain exposure to the commodity market through investments in the Invesco Gold & Special Minerals Fund (Cayman) Ltd. (the “Subsidiary”), a wholly-owned and controlled subsidiary by the Fund organized under the laws of the Cayman Islands. The Subsidiary was organized by the Fund to invest in gold bullion and other precious metals, shares of exchange-traded funds that invest in gold bullion (Gold ETFs), commodity linked derivatives related to gold or other special mineral (including commodity futures, financial futures, options and swap contracts, and certain fixed-income securities and other investments that may serve as margin or collateral for its derivatives positions). The Fund may invest up to 25% of its total assets in the Subsidiary.
The Fund’s investment objective is to seek capital appreciation.
The Fund currently consists of six different classes of shares: Class A, Class C, Class R, Class Y, Class R5 and Class R6. Class Y shares are available only to certain investors. Class A shares are sold with a front-end sales charge unless certain waiver criteria are met. Under certain circumstances, load waived shares may be subject to contingent deferred sales charges (“CDSC”). Class C shares are sold with a CDSC. Class R, Class Y, Class R5 and Class R6 shares are sold at net asset value. Class C shares held for ten years after purchase are eligible for automatic conversion into Class A shares of the same Fund (the “Conversion Feature”). The automatic conversion pursuant to the Conversion Feature will generally occur at the end of the month following the tenth anniversary after a purchase of Class C shares. Effective November 30, 2020, the automatic conversion pursuant to the Conversion Feature changed from ten years to eight years. The first conversion of Class C shares to Class A shares occurred at the end of December 2020 for all Class C shares that were held for more than eight years as of November 30, 2020.
The Fund is an investment company and accordingly follows the investment company accounting and reporting guidance in accordance with Financial Accounting Standards Board Accounting Standards Codification Topic 946, Financial Services – Investment Companies.
The following is a summary of the significant accounting policies followed by the Fund in the preparation of its consolidated financial statements.
| A. | Security Valuations – Securities, including restricted securities, are valued according to the following policy. |
A security listed or traded on an exchange (except convertible securities) is valued at its last sales price or official closing price as of the close of the customary trading session on the exchange where the security is principally traded, or lacking any sales or official closing price on a particular day, the security may be valued at the closing bid price on that day. Securities traded in the over-the-counter market are valued based on prices furnished by independent pricing services or market makers. When such securities are valued by an independent pricing service they may be considered fair valued. Futures contracts are valued at the final settlement price set by an exchange on which they are principally traded. Listed options are valued at the mean between the last bid and asked prices from the exchange on which they are principally traded. Options not listed on an exchange are valued by an independent source at the mean between the last bid and asked prices. For purposes of determining net asset value (“NAV”) per share, futures and option contracts generally are valued 15 minutes after the close of the customary trading session of the New York Stock Exchange (“NYSE”).
Investments in open-end and closed-end registered investment companies that do not trade on an exchange are valued at the end-of-day net asset value per share. Investments in open-end and closed-end registered investment companies that trade on an exchange are valued at the last sales price or official closing price as of the close of the customary trading session on the exchange where the security is principally traded.
Debt obligations (including convertible securities) and unlisted equities are fair valued using an evaluated quote provided by an independent pricing service. Evaluated quotes provided by the pricing service may be determined without exclusive reliance on quoted prices, and may reflect appropriate factors such as institution-size trading in similar groups of securities, developments related to specific securities, dividend rate (for unlisted equities), yield (for debt obligations), quality, type of issue, coupon rate (for debt obligations), maturity (for debt obligations), individual trading characteristics and other market data. Pricing services generally value debt obligations assuming orderly transactions of institutional round lot size, but a fund may hold or transact in the same securities in smaller, odd lot sizes. Odd lots often trade at lower prices than institutional round lots. Debt obligations are subject to interest rate and credit risks. In addition, all debt obligations involve some risk of default with respect to interest and/or principal payments.
Foreign securities’ (including foreign exchange contracts) prices are converted into U.S. dollar amounts using the applicable exchange rates as of the close of the NYSE. If market quotations are available and reliable for foreign exchange-traded equity securities, the securities will be valued at the market quotations. Because trading hours for certain foreign securities end before the close of the NYSE, closing market quotations may become unreliable. If between the time trading ends on a particular security and the close of the customary trading session on the NYSE, events occur that the investment adviser determines are significant and make the closing price unreliable, the Fund may fair value the security. If the event is likely to have affected the closing price of the security, the security will be valued at fair value in good faith using procedures approved by the Board of Trustees. Adjustments to closing prices to reflect fair value may also be based on a screening process of an independent pricing service to indicate the degree of certainty, based on historical data, that the closing price in the principal market where a foreign security trades is not the current value as of the close of the NYSE. Foreign securities’ prices meeting the approved degree of certainty that the price is not reflective of current value will be priced at the indication of fair value from the independent pricing service. Multiple factors may be considered by the independent pricing service in determining adjustments to reflect fair value and may include information relating to sector indices, American Depositary Receipts and domestic and foreign index futures. Foreign securities may have additional risks including exchange rate changes, potential for sharply devalued currencies and high inflation, political and economic upheaval, the relative lack of issuer information, relatively low market liquidity and the potential lack of strict financial and accounting controls and standards.
Securities for which market prices are not provided by any of the above methods may be valued based upon quotes furnished by independent sources. The last bid price may be used to value equity securities. The mean between the last bid and asked prices is used to value debt obligations, including corporate loans.
Securities for which market quotations are not readily available or became unreliable are valued at fair value as determined in good faith by or under the supervision of the Trust’s officers following procedures approved by the Board of Trustees. Issuer specific events, market trends, bid/asked quotes of brokers and information providers and other market data may be reviewed in the course of making a good faith determination of a security’s fair value.
The Fund may invest in securities that are subject to interest rate risk, meaning the risk that the prices will generally fall as interest rates rise and, conversely, the prices will generally rise as interest rates fall. Specific securities differ in their sensitivity to changes in interest rates depending on their individual characteristics. Changes in interest rates may result in increased market volatility, which may affect the value and/or liquidity of certain Fund investments.
Valuations change in response to many factors including the historical and prospective earnings of the issuer, the value of the issuer’s assets, general market conditions which are not specifically related to the particular issuer, such as real or perceived adverse economic conditions, changes in the general outlook for revenues or corporate earnings, changes in interest or currency rates, regional or global instability, natural or environmental disasters, widespread disease or other public health issues, war, acts of terrorism or adverse investor sentiment generally and market liquidity. Because of the inherent uncertainties of valuation, the values reflected in the consolidated financial statements may materially differ from the value received upon actual sale of those investments.
| B. | Securities Transactions and Investment Income – Securities transactions are accounted for on a trade date basis. Realized gains or losses on sales are computed on the basis of specific identification of the securities sold. Interest income (net of withholding tax, if any) is recorded on an accrual basis from |
16 Invesco Gold & Special Minerals Fund
settlement date and includes coupon interest and amortization of premium and accretion of discount on debt securities as applicable. Dividend income (net of withholding tax, if any) is recorded on the ex-dividend date.
The Fund may periodically participate in litigation related to Fund investments. As such, the Fund may receive proceeds from litigation settlements. Any proceeds received are included in the Consolidated Statement of Operations as realized gain (loss) for investments no longer held and as unrealized gain (loss) for investments still held.
Brokerage commissions and mark ups are considered transaction costs and are recorded as an increase to the cost basis of securities purchased and/or a reduction of proceeds on a sale of securities. Such transaction costs are included in the determination of net realized and unrealized gain (loss) from investment securities reported in the Consolidated Statement of Operations and the Consolidated Statement of Changes in Net Assets and the net realized and unrealized gains (losses) on securities per share in the Consolidated Financial Highlights. Transaction costs are included in the calculation of the Fund’s net asset value and, accordingly, they reduce the Fund’s total returns. These transaction costs are not considered operating expenses and are not reflected in net investment income reported in the Consolidated Statement of Operations and the Consolidated Statement of Changes in Net Assets, or the net investment income per share and the ratios of expenses and net investment income reported in the Consolidated Financial Highlights, nor are they limited by any expense limitation arrangements between the Fund and the investment adviser.
The Fund allocates income and realized and unrealized capital gains and losses to a class based on the relative net assets of each class.
| C. | Country Determination – For the purposes of making investment selection decisions and presentation in the Consolidated Schedule of Investments, the investment adviser may determine the country in which an issuer is located and/or credit risk exposure based on various factors. These factors include the laws of the country under which the issuer is organized, where the issuer maintains a principal office, the country in which the issuer derives 50% or more of its total revenues and the country that has the primary market for the issuer’s securities, as well as other criteria. Among the other criteria that may be evaluated for making this determination are the country in which the issuer maintains 50% or more of its assets, the type of security, financial guarantees and enhancements, the nature of the collateral and the sponsor organization. Country of issuer and/or credit risk exposure has been determined to be the United States of America, unless otherwise noted. |
| D. | Distributions – Distributions from net investment income and net realized capital gain, if any, are generally declared and paid annually and recorded on the ex-dividend date. The Fund may elect to treat a portion of the proceeds from redemptions as distributions for federal income tax purposes. |
| E. | Federal Income Taxes – The Fund intends to comply with the requirements of Subchapter M of the Internal Revenue Code of 1986, as amended (the “Internal Revenue Code”), necessary to qualify as a regulated investment company and to distribute substantially all of the Fund’s taxable earnings to shareholders. As such, the Fund will not be subject to federal income taxes on otherwise taxable income (including net realized capital gain) that is distributed to shareholders. Therefore, no provision for federal income taxes is recorded in the consolidated financial statements. |
The Fund recognizes the tax benefits of uncertain tax positions only when the position is more likely than not to be sustained. Management has analyzed the Fund’s uncertain tax positions and concluded that no liability for unrecognized tax benefits should be recorded related to uncertain tax positions. Management is not aware of any tax positions for which it is reasonably possible that the total amounts of unrecognized tax benefits will change materially in the next 12 months.
The Subsidiary is classified as a controlled foreign corporation under Subchapter N of the Internal Revenue Code. Therefore, the Fund is required to increase its taxable income by its share of the Subsidiary’s income. Net investment losses of the Subsidiary cannot be deducted by the Fund in the current period nor carried forward to offset taxable income in future periods.
The Fund files tax returns in the U.S. Federal jurisdiction and certain other jurisdictions. Generally the Fund is subject to examinations by such taxing authorities for up to three years after the filing of the return for the tax period.
| F. | Expenses – Fees provided for under the Rule 12b-1 plan of a particular class of the Fund are charged to the operations of such class. Transfer agency fees and expenses and other shareholder recordkeeping fees and expenses attributable to Class R5 and Class R6 are allocated to each share class based on relative net assets. Sub-accounting fees attributable to Class R5 are charged to the operations of the class. Transfer agency fees and expenses and other shareholder recordkeeping fees and expenses relating to all other classes are allocated among those classes based on relative net assets. All other expenses are allocated among the classes based on relative net assets. |
| G. | Accounting Estimates – The financial statements are prepared on a consolidated basis in conformity with accounting principles generally accepted in the United States of America (“GAAP”), which requires management to make estimates and assumptions that affect the reported amounts of assets and liabilities at the date of the financial statements and the reported amounts of revenues and expenses during the reporting period including estimates and assumptions related to taxation. Actual results could differ from those estimates by a significant amount. The accompanying financial statements reflect the financial position of the Fund and its Subsidiary and the results of operations on a consolidated basis. All inter-company accounts and transactions have been eliminated in consolidation. |
In addition, the Fund monitors for material events or transactions that may occur or become known after the period-end date and before the date the consolidated financial statements are released to print.
| H. | Indemnifications – Under the Trust’s organizational documents, each Trustee, officer, employee or other agent of the Trust is indemnified against certain liabilities that may arise out of the performance of their duties to the Fund. Additionally, in the normal course of business, the Fund enters into contracts, including the Fund’s servicing agreements, that contain a variety of indemnification clauses. The Fund’s maximum exposure under these arrangements is unknown as this would involve future claims that may be made against the Fund that have not yet occurred. The risk of material loss as a result of such indemnification claims is considered remote. |
| I. | Foreign Currency Translations – Foreign currency is valued at the close of the NYSE based on quotations posted by banks and major currency dealers. Portfolio securities and other assets and liabilities denominated in foreign currencies are translated into U.S. dollar amounts at the date of valuation. Purchases and sales of portfolio securities (net of foreign taxes withheld on disposition) and income items denominated in foreign currencies are translated into U.S. dollar amounts on the respective dates of such transactions. The Fund does not separately account for the portion of the results of operations resulting from changes in foreign exchange rates on investments and the fluctuations arising from changes in market prices of securities held. The combined results of changes in foreign exchange rates and the fluctuation of market prices on investments (net of estimated foreign tax withholding) are included with the net realized and unrealized gain or loss from investments in the Consolidated Statement of Operations. Reported net realized foreign currency gains or losses arise from (1) sales of foreign currencies, (2) currency gains or losses realized between the trade and settlement dates on securities transactions, and (3) the difference between the amounts of dividends, interest, and foreign withholding taxes recorded on the Fund’s books and the U.S. dollar equivalent of the amounts actually received or paid. Net unrealized foreign currency gains and losses arise from changes in the fair values of assets and liabilities, other than investments in securities at fiscal period end, resulting from changes in exchange rates. |
The Fund may invest in foreign securities, which may be subject to foreign taxes on income, gains on investments or currency repatriation, a portion of which may be recoverable. Foreign taxes, if any, are recorded based on the tax regulations and rates that exist in the foreign markets in which the Fund invests and are shown in the Consolidated Statement of Operations.
| J. | Forward Foreign Currency Contracts – The Fund may engage in foreign currency transactions either on a spot (i.e. for prompt delivery and settlement) basis, or through forward foreign currency contracts, to manage or minimize currency or exchange rate risk. |
The Fund may also enter into forward foreign currency contracts for the purchase or sale of a security denominated in a foreign currency in order to “lock in” the U.S. dollar price of that security, or the Fund may also enter into forward foreign currency contracts that do not provide for physical settlement of the two currencies, but instead are settled by a single cash payment calculated as the difference between the agreed upon exchange rate and the spot rate at settlement
17 Invesco Gold & Special Minerals Fund
based upon an agreed upon notional amount (non-deliverable forwards). The Fund will set aside liquid assets in an amount equal to the daily mark-to-market obligation for forward foreign currency contracts.
A forward foreign currency contract is an obligation between two parties (“Counterparties”) to purchase or sell a specific currency for an agreed-upon price at a future date. The use of forward foreign currency contracts does not eliminate fluctuations in the price of the underlying securities the Fund owns or intends to acquire but establishes a rate of exchange in advance. Fluctuations in the value of these contracts are measured by the difference in the contract date and reporting date exchange rates and are recorded as unrealized appreciation (depreciation) until the contracts are closed. When the contracts are closed, realized gains (losses) are recorded. Realized and unrealized gains (losses) on the contracts are included in the Consolidated Statement of Operations. The primary risks associated with forward foreign currency contracts include failure of the Counterparty to meet the terms of the contract and the value of the foreign currency changing unfavorably. These risks may be in excess of the amounts reflected in the Consolidated Statement of Assets and Liabilities.
| K. | Call Options Purchased and Written – The Fund may write covered call options and/or buy call options. A covered call option gives the purchaser of such option the right to buy, and the writer the obligation to sell, the underlying security or foreign currency at the stated exercise price during the option period. Options written by the Fund normally will have expiration dates between three and nine months from the date written. The exercise price of a call option may be below, equal to, or above the current market value of the underlying security at the time the option is written. |
Additionally, the Fund may enter into an option on a swap agreement, also called a “swaption”. A swaption is an option that gives the buyer the right, but not the obligation, to enter into a swap on a future date in exchange for paying a market-based premium. A receiver swaption gives the owner the right to receive the total return of a specified asset, reference rate or index. Swaptions also include options that allow an existing swap to be terminated or extended by one of the Counterparties.
When the Fund writes a covered call option, an amount equal to the premium received by the Fund is recorded as an asset and an equivalent liability in the Consolidated Statement of Assets and Liabilities. The amount of the liability is subsequently “marked-to-market” to reflect the current market value of the option written. If a written covered call option expires on the stipulated expiration date, or if the Fund enters into a closing purchase transaction, the Fund realizes a gain (or a loss if the closing purchase transaction exceeds the premium received when the option was written) without regard to any unrealized gain or loss on the underlying security, and the liability related to such option is extinguished. If a written covered call option is exercised, the Fund realizes a gain or a loss from the sale of the underlying security and the proceeds of the sale are increased by the premium originally received. Realized and unrealized gains and losses on call options written are included in the Consolidated Statement of Operations as Net realized gain (loss) from and Change in net unrealized appreciation (depreciation) of Option contracts written. A risk in writing a covered call option is that the Fund gives up the opportunity for profit if the market price of the security increases and the option is exercised.
When the Fund buys a call option, an amount equal to the premium paid by the Fund is recorded as an investment on the Consolidated Statement of Assets and Liabilities. The amount of the investment is subsequently “marked-to-market” to reflect the current value of the option purchased. Realized and unrealized gains and losses on call options purchased are included in the Consolidated Statement of Operations as Net realized gain (loss) from and Change in net unrealized appreciation (depreciation) of Investment securities. A risk in buying an option is that the Fund pays a premium whether or not the option is exercised. In addition, there can be no assurance that a liquid secondary market will exist for any option purchased.
| L. | Put Options Purchased and Written – The Fund may purchase and write put options including options on securities indexes, or foreign currency and/or futures contracts. By purchasing a put option, the Fund obtains the right (but not the obligation) to sell the option’s underlying instrument at a fixed strike price. In return for this right, the Fund pays an option premium. The option’s underlying instrument may be a security, securities index, or a futures contract. Put options may be used by the Fund to hedge securities it owns by locking in a minimum price at which the Fund can sell. If security prices fall, the put option could be exercised to offset all or a portion of the Fund’s resulting losses. At the same time, because the maximum the Fund has at risk is the cost of the option, purchasing put options does not eliminate the potential for the Fund to profit from an increase in the value of the underlying portfolio securities. The Fund may write put options to earn additional income in the form of option premiums if it expects the price of the underlying instrument to remain stable or rise during the option period so that the option will not be exercised. The risk in this strategy is that the price of the underlying securities may decline by an amount greater than the premium received. Put options written are reported as a liability in the Consolidated Statement of Assets and Liabilities. Realized and unrealized gains and losses on put options purchased and put options written are included in the Consolidated Statement of Operations as Net realized gain (loss) from and Change in net unrealized appreciation (depreciation) of Investment securities and Option contracts written, respectively. A risk in buying an option is that the Fund pays a premium whether or not the option is exercised. In addition, there can be no assurance that a liquid secondary market will exist for any option purchased. |
| M. | Leverage Risk – Leverage exists when the Fund can lose more than it originally invests because it purchases or sells an instrument or enters into a transaction without investing an amount equal to the full economic exposure of the instrument or transaction. |
| N. | COVID-19 Risk – The COVID-19 strain of coronavirus has resulted in instances of market closures and dislocations, extreme volatility, liquidity constraints and increased trading costs. Efforts to contain its spread have resulted in travel restrictions, disruptions of healthcare systems, business operations and supply chains, layoffs, lower consumer demand, and defaults, among other significant economic impacts that have disrupted global economic activity across many industries. Such economic impacts may exacerbate other pre-existing political, social and economic risks locally or globally. |
The ongoing effects of COVID-19 are unpredictable and may result in significant and prolonged effects on the Fund’s performance.
| O. | Other Risks – The Subsidiary will seek to gain exposure to gold bullion and other precious metals, Gold ETFs, commodity-linked derivatives related to gold or other special minerals (including commodity futures, financial futures, options and swap contracts), and certain fixed income securities and other investments that may serve as margin or collateral for its derivatives positions. The Fund is indirectly exposed to the risks associated with the Subsidiary’s investments. |
The Fund is classified as a “non-diversified” fund under the Investment Company Act of 1940. Accordingly, the Fund may invest a greater portion of its assets in the securities of a single issuer or limited number of issuers than a “diversified” fund. To the extent that the Fund invests a higher percentage of its assets in the securities of a single issuer or limited number of issuers, the Fund is more subject to the risks associated with and developments affecting that issuer or limited number of issuers than a fund that invests more widely.
18 Invesco Gold & Special Minerals Fund
NOTE 2–Advisory Fees and Other Fees Paid to Affiliates
The Trust has entered into a master investment advisory agreement with Invesco Advisers, Inc. (the “Adviser” or “Invesco”). Effective May 15, 2020, under the terms of the investment advisory agreement, the Fund accrues daily and pays monthly an advisory fee to the Adviser based on the annual rate of the Fund’s average daily net assets as follows:
| | | | | | |
| Average Daily Net Assets* | | Rate | |
Up to $200 million | | | 0.750 | % |
Next $150 million | | | 0.720 | % |
Next $350 million | | | 0.680 | % |
Next $1.3 billion | | | 0.560 | % |
Next $2 billion | | | 0.460 | % |
Next $2 billion | | | 0.410 | % |
Next $2 billion | | | 0.385 | % |
Next $8 billion | | | 0.360 | % |
| * | The advisory fee paid by the Fund shall be reduced by any amounts paid by the Fund under the administrative services agreement with the Adviser. |
Prior to May 15, 2020, the Fund accrued daily and paid monthly an advisory fee to the Adviser based on the annual rate of the Fund’s average daily net assets as follows:
| | | | | | |
| Average Daily Net Assets | | Rate | |
Up to $200 million | | | 0.750 | % |
Next $200 million | | | 0.720 | % |
Next $200 million | | | 0.690 | % |
Next $200 million | | | 0.660 | % |
Next $2.2 billion | | | 0.600 | % |
Next $1 billion | | | 0.590 | % |
Next $2 billion | | | 0.580 | % |
Next $4 billion | | | 0.570 | % |
Over $10 billion | | | 0.560 | % |
For the year ended April 30, 2021, the effective advisory fee rate incurred by the Fund was 0.58%.
Under the terms of a master sub-advisory agreement between the Adviser and each of Invesco Asset Management Deutschland GmbH, Invesco Asset Management Limited, Invesco Asset Management (Japan) Limited, Invesco Hong Kong Limited, Invesco Senior Secured Management, Inc. and Invesco Canada Ltd. and separate sub-advisory agreements with Invesco Capital Management LLC and Invesco Asset Management (India) Private Limited (collectively, the “Affiliated Sub-Advisers”) the Adviser, not the Fund, will pay 40% of the fees paid to the Adviser to any such Affiliated Sub-Adviser(s) that provide(s) discretionary investment management services to the Fund based on the percentage of assets allocated to such Affiliated Sub-Adviser(s). Invesco has also entered into a sub-advisory agreement with OppenheimerFunds, Inc. to provide discretionary management services to the Fund.
The Adviser has contractually agreed, through May 31, 2021, to waive advisory fees and/or reimburse expenses of all shares to the extent necessary to limit total annual fund operating expenses after fee waiver and/or expense reimbursement (excluding certain items discussed below) of Class A, Class C, Class R, Class Y, Class R5 and Class R6 shares to 1.17%, 1.92%, 1.42%, 0.92%, 0.80% and 0.75%, respectively, of the Fund’s average daily net assets (the “expense limits”). Effective June 1, 2021 through at least June 30, 2022, the Adviser has contractually agreed to waive advisory fees and/or reimburse expenses of all shares to the extent necessary to limit total annual fund operating expenses after fee waiver and/or expense reimbursement (excluding certain items discussed below) of Class A, Class C, Class R, Class Y, Class R5 and Class R6 shares to 2.00%, 2.75%, 2.25%, 1.75%, 1.75% and 1.75%, respectively, of the Fund’s average daily net assets. In determining the Adviser’s obligation to waive advisory fees and/or reimburse expenses, the following expenses are not taken into account, and could cause the total annual fund operating expenses after fee waivers and/or expense reimbursement to exceed the numbers reflected above: (1) interest; (2) taxes; (3) dividend expense on short sales; (4) extraordinary or non-routine items, including litigation expenses; and (5) expenses that the Fund has incurred but did not actually pay because of an expense offset arrangement. Unless Invesco continues the fee waiver agreement, it will terminate on June 30, 2022. During its term, the fee waiver agreement cannot be terminated or amended to increase the expense limits or reduce the advisory fee waiver without approval of the Board of Trustees.
Further, the Adviser has contractually agreed, through at least June 30, 2023, to waive the advisory fee payable by the Fund in an amount equal to 100% of the net advisory fees the Adviser receives from the affiliated money market funds on investments by the Fund of uninvested cash in such affiliated money market funds.
For the year ended April 30, 2021, the Adviser waived advisory fees of $17,010.
The Trust has entered into a master administrative services agreement with Invesco pursuant to which the Fund has agreed to pay Invesco for certain administrative costs incurred in providing accounting services to the Fund. For the year ended April 30, 2021, expenses incurred under the agreement are shown in the Consolidated Statement of Operations as Administrative services fees. Invesco has entered into a sub-administration agreement whereby State Street Bank and Trust Company (“SSB”) serves as fund accountant and provides certain administrative services to the Fund. Pursuant to a custody agreement with the Trust on behalf of the Fund, SSB also serves as the Fund’s custodian.
The Trust has entered into a transfer agency and service agreement with Invesco Investment Services, Inc. (“IIS”) pursuant to which the Fund has agreed to pay IIS a fee for providing transfer agency and shareholder services to the Fund and reimburse IIS for certain expenses incurred by IIS in the course of providing such services. IIS may make payments to intermediaries that provide omnibus account services, sub-accounting services and/or networking services. All fees payable by IIS to intermediaries that provide omnibus account services or sub-accounting services are charged back to the Fund, subject to certain limitations approved by the Trust’s Board of Trustees. For the year ended April 30, 2021, expenses incurred under the agreement are shown in the Consolidated Statement of Operations as Transfer agent fees.
The Trust has entered into master distribution agreements with Invesco Distributors, Inc. (“IDI”) to serve as the distributor for the Class A, Class C, Class R, Class Y, Class R5 and Class R6 shares of the Fund. The Trust has adopted plans pursuant to Rule 12b-1 under the 1940 Act with respect to the Fund’s Class A, Class C and Class R shares (collectively, the “Plans”). The Fund, pursuant to the Class A Plan, reimburses IDI for its allocated share of expenses incurred for the period, up to a maximum annual rate of 0.25% of the average daily net assets of Class A shares. The Fund pursuant to the Class C and Class R Plan, pays IDI compensation at the
19 Invesco Gold & Special Minerals Fund
annual rate of 1.00% of the average daily net assets of Class C shares and 0.50% of the average daily net assets of Class R shares. The fees are accrued daily and paid monthly. Of the Plan payments, up to 0.25% of the average daily net assets of each class of shares may be paid to furnish continuing personal shareholder services to customers who purchase and own shares of such classes. Any amounts not paid as a service fee under the Plans would constitute an asset-based sales charge. Rules of the Financial Industry Regulatory Authority (“FINRA”) impose a cap on the total sales charges, including asset-based sales charges, that may be paid by any class of shares of the Fund. For the year ended April 30, 2021, expenses incurred under the Plans are shown in the Consolidated Statement of Operations as Distribution fees.
Front-end sales commissions and CDSC (collectively, the “sales charges”) are not recorded as expenses of the Fund. Front-end sales commissions are deducted from proceeds from the sales of Fund shares prior to investment in Class A shares of the Fund. CDSC are deducted from redemption proceeds prior to remittance to the shareholder. During the year ended April 30, 2021, IDI advised the Fund that IDI retained $233,009 in front-end sales commissions from the sale of Class A shares and $14,022 and $24,941 from Class A and Class C shares, respectively, for CDSC imposed upon redemptions by shareholders.
For the year ended April 30, 2021, the Fund incurred $9,198 in brokerage commissions with Invesco Capital Markets, Inc., an affiliate of the Adviser and IDI, for portfolio transactions executed on behalf of the Fund.
Certain officers and trustees of the Trust are officers and directors of the Adviser, IIS and/or IDI.
NOTE 3–Additional Valuation Information
GAAP defines fair value as the price that would be received to sell an asset or paid to transfer a liability in an orderly transaction between market participants at the measurement date, under current market conditions. GAAP establishes a hierarchy that prioritizes the inputs to valuation methods, giving the highest priority to readily available unadjusted quoted prices in an active market for identical assets (Level 1) and the lowest priority to significant unobservable inputs (Level 3), generally when market prices are not readily available or are unreliable. Based on the valuation inputs, the securities or other investments are tiered into one of three levels. Changes in valuation methods may result in transfers in or out of an investment’s assigned level:
| | | | |
Level 1 | | - | | Prices are determined using quoted prices in an active market for identical assets. |
Level 2 | | - | | Prices are determined using other significant observable inputs. Observable inputs are inputs that other market participants may use in pricing a security. These may include quoted prices for similar securities, interest rates, prepayment speeds, credit risk, yield curves, loss severities, default rates, discount rates, volatilities and others. |
Level 3 | | - | | Prices are determined using significant unobservable inputs. In situations where quoted prices or observable inputs are unavailable (for example, when there is little or no market activity for an investment at the end of the period), unobservable inputs may be used. Unobservable inputs reflect the Fund’s own assumptions about the factors market participants would use in determining fair value of the securities or instruments and would be based on the best available information. |
The following is a summary of the tiered valuation input levels, as of April 30, 2021. The level assigned to the securities valuations may not be an indication of the risk or liquidity associated with investing in those securities. Because of the inherent uncertainties of valuation, the values reflected in the consolidated financial statements may materially differ from the value received upon actual sale of those investments.
| | | | | | | | | | | | | | | | | | | | |
| | | Level 1 | | Level 2 | | Level 3 | | Total |
Investments in Securities | | | | | | | | | | | | | | | | | | | | |
Australia | | | | $ 18,163,052 | | | | | $556,969,815 | | | | | $ – | | | | | $ 575,132,867 | |
Brazil | | | | 35,701,926 | | | | | – | | | | | – | | | | | 35,701,926 | |
Canada | | | | 1,123,112,315 | | | | | 991,305 | | | | | 3,879,300 | | | | | 1,127,982,920 | |
China | | | | – | | | | | 17,997,016 | | | | | – | | | | | 17,997,016 | |
Ivory Coast | | | | 35,936,592 | | | | | – | | | | | – | | | | | 35,936,592 | |
Mongolia | | | | 14,005,990 | | | | | – | | | | | – | | | | | 14,005,990 | |
Russia | | | | 463,250 | | | | | 3,407,086 | | | | | – | | | | | 3,870,336 | |
South Africa | | | | 163,278,968 | | | | | – | | | | | – | | | | | 163,278,968 | |
Tanzania | | | | 102,593,358 | | | | | – | | | | | – | | | | | 102,593,358 | |
Turkey | | | | 24,689,825 | | | | | – | | | | | – | | | | | 24,689,825 | |
United Kingdom | | | | – | | | | | 303,846 | | | | | – | | | | | 303,846 | |
United States | | | | 179,170,589 | | | | | – | | | | | – | | | | | 179,170,589 | |
Zambia | | | | 46,097 | | | | | – | | | | | – | | | | | 46,097 | |
Money Market Funds | | | | 5,320,638 | | | | | – | | | | | – | | | | | 5,320,638 | |
Total Investments in Securities | | | | 1,702,482,600 | | | | | 579,669,068 | | | | | 3,879,300 | | | | | 2,286,030,968 | |
| | | | |
Other Investments – Liabilities* | | | | | | | | | | | | | | | | | | | | |
Options Written | | | | (11,933,552 | ) | | | | – | | | | | – | | | | | (11,933,552 | ) |
Total Investments | | | | $1,690,549,048 | | | | | $579,669,068 | | | | | $3,879,300 | | | | | $2,274,097,416 | |
| * | Options written are shown at value. |
NOTE 4–Derivative Investments
The Fund may enter into an ISDA Master Agreement under which a fund may trade OTC derivatives. An OTC transaction entered into under an ISDA Master Agreement typically involves a collateral posting arrangement, payment netting provisions and close-out netting provisions. These netting provisions allow for reduction of credit risk through netting of contractual obligations. The enforceability of the netting provisions of the ISDA Master Agreement depends on the governing law of the ISDA Master Agreement, among other factors.
For financial reporting purposes, the Fund does not offset OTC derivative assets or liabilities that are subject to ISDA Master Agreements in the Consolidated Statement of Assets and Liabilities.
20 Invesco Gold & Special Minerals Fund
Value of Derivative Investments at Period-End
The table below summarizes the value of the Fund’s derivative investments, detailed by primary risk exposure, held as of April 30, 2021:
| | | | |
| | | Value | |
| | | Equity | |
| Derivative Liabilities | | Risk | |
| |
Options written, at value – Exchange-Traded | | $ | (11,933,552 | ) |
| |
Derivatives not subject to master netting agreements | | | 11,933,552 | |
| |
Total Derivative Liabilities subject to master netting agreements | | $ | – | |
| |
Effect of Derivative Investments for the year ended April 30, 2021
The table below summarizes the gains (losses) on derivative investments, detailed by primary risk exposure, recognized in earnings during the period:
| | | | | | | | | | | | |
| | | Location of Gain (Loss) on | |
| | | Consolidated Statement of Operations | |
| | | Currency | | | Equity | | | | |
| | | Risk | | | Risk | | | Total | |
| |
Realized Gain: | | | | | | | | | | | | |
Forward foreign currency contracts | | $ | 63,870 | | | $ | – | | | $ | 63,870 | |
| |
Options purchased(a) | | | – | | | | 59,410 | | | | 59,410 | |
| |
Options written | | | – | | | | 66,027,382 | | | | 66,027,382 | |
| |
Change in Net Unrealized Appreciation (Depreciation): | | | | | | | | | | | | |
Options purchased(a) | | | – | | | | (47,442 | ) | | | (47,442 | ) |
| |
Options written | | | – | | | | 17,840,826 | | | | 17,840,826 | |
| |
Total | | $ | 63,870 | | | $ | 83,880,176 | | | $ | 83,944,046 | |
| |
| (a) | Options purchased are included in the net realized gain (loss) from investment securities and the change in net unrealized appreciation (depreciation) on investment securities. |
The table below summarizes the average notional value of derivatives held during the period.
| | | | | | | | | | |
| | | Forward Foreign Currency Contracts | | Options Written |
Average notional value | | | $ | 7,210,230 | | | | $ | 396,416,737 | |
Average Contracts | | | | – | | | | | 193,859 | |
NOTE 5–Expense Offset Arrangement(s)
The expense offset arrangement is comprised of transfer agency credits which result from balances in demand deposit accounts used by the transfer agent for clearing shareholder transactions. For the year ended April 30, 2021, the Fund received credits from this arrangement, which resulted in the reduction of the Fund’s total expenses of $4,840.
NOTE 6–Trustees’ and Officers’ Fees and Benefits
Trustees’ and Officers’ Fees and Benefits include amounts accrued by the Fund to pay remuneration to certain Trustees and Officers of the Fund. Trustees have the option to defer compensation payable by the Fund, and Trustees’ and Officers’ Fees and Benefits also include amounts accrued by the Fund to fund such deferred compensation amounts. Those Trustees who defer compensation have the option to select various Invesco Funds in which their deferral accounts shall be deemed to be invested. Finally, certain current Trustees were eligible to participate in a retirement plan that provided for benefits to be paid upon retirement to Trustees over a period of time based on the number of years of service. The Fund may have certain former Trustees who also participate in a retirement plan and receive benefits under such plan. Trustees’ and Officers’ Fees and Benefits include amounts accrued by the Fund to fund such retirement benefits. Obligations under the deferred compensation and retirement plans represent unsecured claims against the general assets of the Fund.
NOTE 7–Cash Balances
The Fund is permitted to temporarily carry a negative or overdrawn balance in its account with SSB, the custodian bank. Such balances, if any at period-end, are shown in the Consolidated Statement of Assets and Liabilities under the payable caption Amount due custodian. To compensate the custodian bank for such overdrafts, the overdrawn Fund may either (1) leave funds as a compensating balance in the account so the custodian bank can be compensated by earning the additional interest; or (2) compensate by paying the custodian bank at a rate agreed upon by the custodian bank and Invesco, not to exceed the contractually agreed upon rate. The Fund may not purchase additional securities when any borrowings from banks or broker-dealers exceed 5% of the Fund’s total assets, or when any borrowings from an Invesco Fund are outstanding.
21 Invesco Gold & Special Minerals Fund
NOTE 8–Distributions to Shareholders and Tax Components of Net Assets
Tax Character of Distributions to Shareholders Paid During the Year Ended April 30, 2021, Period Ended April 30, 2020 and the Year Ended June 30, 2019:
| | | | | | |
| | | | | | | |
| | | Year Ended | | Ten months Ended | | Year Ended |
| | | April 30, 2021 | | April 30, 2020 | | June 30, 2019 |
|
Ordinary income* | | $37,414,715 | | $4,462,855 | | $– |
|
| * | Includes short-term capital gain distributions, if any. |
Tax Components of Net Assets at Period-End:
| | | | |
| | | 2021 | |
| |
Undistributed ordinary income | | $ | 72,597,051 | |
| |
Net unrealized appreciation – investments | | | 664,311,867 | |
| |
Net unrealized appreciation (depreciation) - foreign currencies | | | (3,138 | ) |
| |
Temporary book/tax differences | | | (219,901 | ) |
| |
Capital loss carryforward | | | (1,501,737,816 | ) |
| |
Shares of beneficial interest | | | 3,039,297,406 | |
| |
Total net assets | | $ | 2,274,245,469 | |
| |
The difference between book-basis and tax-basis unrealized appreciation (depreciation) is due to differences in the timing of recognition of gains and losses on investments for tax and book purposes. The Fund’s net unrealized appreciation (depreciation) difference is attributable primarily to wash sales and passive foreign investment companies.
The temporary book/tax differences are a result of timing differences between book and tax recognition of income and/or expenses. The Fund’s temporary book/tax differences are the result of the trustee deferral of compensation and retirement plan benefits.
Capital loss carryforward is calculated and reported as of a specific date. Results of transactions and other activity after that date may affect the amount of capital loss carryforward actually available for the Fund to utilize. The ability to utilize capital loss carryforward in the future may be limited under the Internal Revenue Code and related regulations based on the results of future transactions.
The Fund has a capital loss carryforward as of April 30, 2021, as follows:
| | | | | | | | | | | | |
| Capital Loss Carryforward* | |
| |
| Expiration | | Short-Term | | | Long-Term | | | Total | |
| |
Not subject to expiration | | $ | 285,245,475 | | | $ | 1,216,492,341 | | | $ | 1,501,737,816 | |
| |
| * | Capital loss carryforward is reduced for limitations, if any, to the extent required by the Internal Revenue Code and may be further limited depending upon a variety of factors, including the realization of net unrealized gains or losses as of the date of any reorganization. |
NOTE 9–Investment Transactions
The aggregate amount of investment securities (other than short-term securities, U.S. Government obligations and money market funds, if any) purchased and sold by the Fund during the year ended April 30, 2021 was $1,098,800,274 and $869,354,576, respectively. Cost of investments, including any derivatives, on a tax basis includes the adjustments for financial reporting purposes as of the most recently completed federal income tax reporting period-end.
| | | | |
| Unrealized Appreciation (Depreciation) of Investments on a Tax Basis | |
| |
Aggregate unrealized appreciation of investments | | $ | 736,731,225 | |
| |
Aggregate unrealized (depreciation) of investments | | | (72,419,358 | ) |
| |
Net unrealized appreciation of investments | | $ | 664,311,867 | |
| |
Cost of investments for tax purposes is $1,609,785,549.
NOTE 10–Reclassification of Permanent Differences
Primarily as a result of differing book/tax treatment of passive foreign investment companies, on April 30, 2021, undistributed net investment income was increased by $69,486,826, undistributed net realized gain (loss) was decreased by $69,481,029 and shares of beneficial interest was decreased by $5,797. Further, as a result of tax deferrals acquired in the reorganization of Invesco Gold & Precious Metals Fund into the Fund, undistributed net investment income was decreased by $16,792,158, undistributed net realized gain (loss) was decreased by $207,620,359 and shares of beneficial interest was increased by $224,412,517. These reclassifications had no effect on the net assets of the Fund.
22 Invesco Gold & Special Minerals Fund
NOTE 11–Share Information
| | | | | | | | | | | | | | | | | | | | | | | | |
| | | | | | Summary of Share Activity | | | | | | | |
| |
| | | Year ended | | | Ten months ended | | | Year ended | |
| | | April 30, 2021(a) | | | April 30, 2020 | | | June 30, 2019 | |
| | | Shares | | | Amount | | | Shares | | | Amount | | | Shares | | | Amount | |
| |
Sold: | | | | | | | | | | | | | | | | | | | | | | | | |
Class A | | | 14,603,639 | | | $ | 399,590,651 | | | | 15,708,612 | | | $ | 312,533,945 | | | | 9,458,270 | | | $ | 144,671,146 | |
| |
Class C | | | 2,120,991 | | | | 52,669,940 | | | | 1,464,868 | | | | 25,779,057 | | | | 1,216,119 | | | | 16,312,847 | |
| |
Class R | | | 2,959,594 | | | | 75,771,617 | | | | 2,838,180 | | | | 51,894,302 | | | | 2,255,361 | | | | 31,565,148 | |
| |
Class Y | | | 13,800,015 | | | | 377,934,617 | | | | 12,434,776 | | | | 241,097,968 | | | | 10,082,276 | | | | 149,305,227 | |
| |
Class R5(b) | | | 4,699 | | | | 125,563 | | | | 710 | | | | 9,834 | | | | 678 | | | | 10,000 | |
�� | |
Class R6 | | | 7,456,435 | | | | 206,169,922 | | | | 5,660,874 | | | | 109,305,126 | | | | 5,773,319 | | | | 85,525,000 | |
| |
| | | | | | |
Issued as reinvestment of dividends: | | | | | | | | | | | | | | | | | | | | | | | | |
Class A | | | 566,245 | | | | 15,305,611 | | | | 90,340 | | | | 1,725,507 | | | | - | | | | - | |
| |
Class C | | | 54,516 | | | | 1,332,910 | | | | - | | | | - | | | | - | | | | - | |
| |
Class R | | | 80,092 | | | | 2,059,159 | | | | 7,108 | | | | 129,162 | | | | - | | | | - | |
| |
Class Y | | | 332,113 | | | | 8,967,039 | | | | 70,911 | | | | 1,354,399 | | | | - | | | | - | |
| |
Class R5(b) | | | 42 | | | | 1,144 | | | | - | | | | - | | | | - | | | | - | |
| |
Class R6 | | | 212,446 | | | | 5,782,795 | | | | 49,807 | | | | 958,784 | | | | - | | | | - | |
| |
| | | | | | |
Automatic conversion of Class C shares to Class A shares: | | | | | | | | | | | | | | | | | | | | | | | | |
Class A | | | 1,139,121 | | | | 31,753,536 | | | | 381,626 | | | | 7,368,235 | | | | - | | | | - | |
| |
Class C | | | (1,261,153 | ) | | | (31,753,536 | ) | | | (421,681 | ) | | | (7,368,235 | ) | | | - | | | | - | |
| |
| | | | | | |
Issued in connection with acquisitions:(c) | | | | | | | | | | | | | | | | | | | | | | | | |
Class A | | | 8,323,236 | | | | 198,839,437 | | | | - | | | | - | | | | - | | | | - | |
| |
Class C | | | 999,656 | | | | 21,575,827 | | | | - | | | | - | | | | - | | | | - | |
| |
Class Y | | | 1,533,657 | | | | 36,655,632 | | | | - | | | | - | | | | - | | | | - | |
| |
Class R6 | | | 12,562 | | | | 303,046 | | | | - | | | | - | | | | - | | | | - | |
| |
| | | | | | |
Reacquired: | | | | | | | | | | | | | | | | | | | | | | | | |
Class A | | | (17,394,672 | ) | | | (474,921,597 | ) | | | (13,612,490 | ) | | | (255,012,868 | ) | | | (11,237,201 | ) | | | (165,828,966 | ) |
| |
Class C | | | (1,844,519 | ) | | | (45,514,172 | ) | | | (1,473,769 | ) | | | (25,490,417 | ) | | | (4,294,484 | ) | | | (62,223,717 | ) |
| |
Class R | | | (3,275,682 | ) | | | (84,177,669 | ) | | | (3,478,097 | ) | | | (62,974,405 | ) | | | (3,323,388 | ) | | | (46,764,341 | ) |
| |
Class Y | | | (10,001,133 | ) | | | (272,099,418 | ) | | | (9,312,284 | ) | | | (169,709,103 | ) | | | (6,756,704 | ) | | | (98,540,574 | ) |
| |
Class R5(b) | | | (1,019 | ) | | | (28,915 | ) | | | - | | | | - | | | | - | | | | - | |
| |
Class R6 | | | (6,168,714 | ) | | | (169,831,073 | ) | | | (4,131,957 | ) | | | (79,054,005 | ) | | | (5,082,586 | ) | | | (75,041,130 | ) |
| |
Net increase (decrease) in share activity | | | 14,252,167 | | | $ | 356,512,066 | | | | 6,277,534 | | | $ | 152,547,286 | | | | (1,908,340 | ) | | $ | (21,009,360 | ) |
| |
| (a) | There are entities that are record owners of more than 5% of the outstanding shares of the Fund and in the aggregate own 31% of the outstanding shares of the Fund. IDI has an agreement with these entities to sell Fund shares. The Fund, Invesco and/or Invesco affiliates may make payments to these entities, which are considered to be related to the Fund, for providing services to the Fund, Invesco and/or Invesco affiliates including but not limited to services such as securities brokerage, distribution, third party record keeping and account servicing. The Fund has no knowledge as to whether all or any portion of the shares owned of record by these entities are also owned beneficially. |
| (b) | Commencement date after the close of business on May 24, 2019. |
| (c) | After the close of business on May 15, 2020, the Fund acquired all the net assets of Invesco Gold & Precious Metals Fund (the “Target Fund”) pursuant to a plan of reorganization approved by the Board of Trustees of the Fund on February 14, 2020. The reorganization was executed in order to reduce overlap and increase efficiencies in the Adviser’s product line. The acquisition was accomplished by a tax-free exchange of 10,869,111 shares of the Fund for 52,648,312 shares outstanding of the Target Fund as of the close of business on May 15, 2020. Shares of the Target Fund were exchanged for the like class of shares of the Fund, based on the relative net asset value of the Target Fund to the net asset value of the Fund on the close of business, May 15, 2020. The Target Fund’s net assets as of the close of business on May 15, 2020 of $257,373,942, including $36,247,875 of unrealized appreciation (depreciation), were combined with those of the Fund. The net assets of the Fund immediately before the acquisition were $1,643,781,611 and $1,901,155,553 immediately after the acquisition. |
The pro forma results of operations for the year ended April 30, 2021 assuming the reorganization had been completed on May 1, 2020, the beginning of the annual reporting period are as follows:
| | | | |
Net investment income | | $ | 5,352,394 | |
| |
Net realized/unrealized gains | | | 494,842,403 | |
| |
Change in net assets resulting from operations | | $ | 500,194,797 | |
| |
As the combined investment portfolios have been managed as a single integrated portfolio since the acquisition was completed, it is not practicable to separate the amounts of revenue and earnings of the Target Fund that has been included in the Fund’s Consolidated Statement of Operations since May 16, 2020.
23 Invesco Gold & Special Minerals Fund
Report of Independent Registered Public Accounting Firm
To the Board of Trustees of AIM Sector Funds (Invesco Sector Funds) and Shareholders of Invesco Gold & Special Minerals Fund
Opinion on the Financial Statements
We have audited the accompanying consolidated statement of assets and liabilities, including the consolidated schedule of investments, of Invesco Gold & Special Minerals Fund and its subsidiary (one of the funds constituting AIM Sector Funds (Invesco Sector Funds), referred to hereafter as the “Fund”) as of April 30, 2021, the related consolidated statement of operations for the year ended April 30, 2021, the consolidated statement of changes in net assets for the year ended April 30, 2021, the ten months ended April 30, 2020 and the year ended June 30, 2019, including the related notes, and the consolidated financial highlights for each of the periods indicated in the table below (collectively referred to as the “consolidated financial statements”). In our opinion, the consolidated financial statements present fairly, in all material respects, the financial position of the Fund as of April 30, 2021, the results of its operations for the year then ended, the changes in its net assets for the year ended April 30, 2021, the ten months ended April 30, 2020 and the year ended June 30, 2019, and the financial highlights for each of the periods indicated in the table below, in conformity with accounting principles generally accepted in the United States of America.
|
| Consolidated Financial Highlights |
| For the year ended April 30, 2021, the ten months ended April 30, 2020 and the year ended June 30, 2019 for Class A, Class C, Class R, Class Y, and Class R6 For the year ended April 30, 2021, the ten months ended April 30, 2020 and the period of May 24, 2019 (commencement of operations) through June 30, 2019 for Class R5 |
The consolidated financial statements of Invesco Gold & Special Minerals Fund (formerly known as Oppenheimer Gold & Special Minerals Fund) as of and for the year ended June 30, 2018 and the consolidated financial highlights for each of the periods ended on or prior to June 30, 2018 (not presented herein, other than the consolidated financial highlights) were audited by other auditors whose report dated August 24, 2018 expressed an unqualified opinion on those consolidated financial statements and consolidated financial highlights.
Basis for Opinion
These consolidated financial statements are the responsibility of the Fund’s management. Our responsibility is to express an opinion on the Fund’s consolidated financial statements based on our audits. We are a public accounting firm registered with the Public Company Accounting Oversight Board (United States) (PCAOB) and are required to be independent with respect to the Fund in accordance with the U.S. federal securities laws and the applicable rules and regulations of the Securities and Exchange Commission and the PCAOB.
We conducted our audits of these consolidated financial statements in accordance with the standards of the PCAOB. Those standards require that we plan and perform the audit to obtain reasonable assurance about whether the consolidated financial statements are free of material misstatement, whether due to error or fraud.
Our audits included performing procedures to assess the risks of material misstatement of the consolidated financial statements, whether due to error or fraud, and performing procedures that respond to those risks. Such procedures included examining, on a test basis, evidence regarding the amounts and disclosures in the consolidated financial statements. Our audits also included evaluating the accounting principles used and significant estimates made by management, as well as evaluating the overall presentation of the consolidated financial statements. Our procedures included confirmation of securities owned as of April 30, 2021 by correspondence with the custodian, transfer agent and brokers; when replies were not received from brokers, we performed other auditing procedures. We believe that our audits provide a reasonable basis for our opinion.
/s/PricewaterhouseCoopers LLP
Houston, Texas
June 24, 2021
We have served as the auditor of one or more investment companies in the Invesco group of investment companies since at least 1995. We have not been able to determine the specific year we began serving as auditor.
24 Invesco Gold & Special Minerals Fund
Calculating your ongoing Fund expenses
Example
As a shareholder of the Fund, you incur two types of costs: (1) transaction costs, which may include sales charges (loads) on purchase payments or contingent deferred sales charges on redemptions, if any; and (2) ongoing costs, including management fees, distribution and/or service (12b-1) fees, and other Fund expenses. This example is intended to help you understand your ongoing costs (in dollars) of investing in the Fund and to compare these costs with ongoing costs of investing in other mutual funds. The example is based on an investment of $1,000 invested at the beginning of the period and held for the entire period November 1, 2020 through April 30, 2021.
Actual expenses
The table below provides information about actual account values and actual expenses. You may use the information in this table, together with the amount you invested, to estimate the expenses that you paid over the period. Simply divide your account value by $1,000 (for example, an $8,600 account value divided by $1,000 = 8.6), then multiply the result by the number in the table under the heading entitled “Actual Expenses Paid During Period” to estimate the expenses you paid on your account during this period.
Hypothetical example for comparison purposes
The table below also provides information about hypothetical account values and hypothetical expenses based on the Fund’s actual expense ratio and an assumed rate of return of 5% per year before expenses, which is not the Fund’s actual return.
The hypothetical account values and expenses may not be used to estimate the actual ending account balance or expenses you paid for the period. You may use this information to compare the ongoing costs of investing in the Fund and other funds. To do so, compare this 5% hypothetical example with the 5% hypothetical examples that appear in the shareholder reports of the other funds.
Please note that the expenses shown in the table are meant to highlight your ongoing costs only and do not reflect any transaction costs, such as sales charges (loads) on purchase payments or contingent deferred sales charges on redemptions, if any. Therefore, the hypothetical information is useful in comparing ongoing costs only, and will not help you determine the relative total costs of owning different funds. In addition, if these transaction costs were included, your costs would have been higher.
| | | | | | | | | | | | |
| | | Beginning Account Value
(11/01/20) | | ACTUAL | | HYPOTHETICAL
(5% annual return before
expenses) | | Annualized Expense Ratio |
| | Ending Account Value
(04/30/21)1 | | Expenses Paid During
Period | | Ending Account Value
(04/30/21)2 | | Expenses Paid During
Period2 |
Class A | | $1,000.00 | | $1,010.90 | | $5.19 | | $1,019.64 | | $5.21 | | 1.04% |
Class C | | 1,000.00 | | 1,006.90 | | 8.96 | | 1,015.87 | | 9.00 | | 1.80 |
Class R | | 1,000.00 | | 1,009.40 | | 6.48 | | 1,018.35 | | 6.51 | | 1.30 |
Class Y | | 1,000.00 | | 1,011.80 | | 3.99 | | 1,020.83 | | 4.01 | | 0.80 |
Class R5 | | 1,000.00 | | 1,012.70 | | 3.49 | | 1,021.32 | | 3.51 | | 0.70 |
Class R6 | | 1,000.00 | | 1,012.70 | | 3.29 | | 1,021.52 | | 3.31 | | 0.66 |
| 1 | The actual ending account value is based on the actual total return of the Fund for the period November 1, 2020 through April 30, 2021, after actual expenses and will differ from the hypothetical ending account value which is based on the Fund’s expense ratio and a hypothetical annual return of 5% before expenses. |
| 2 | Expenses are equal to the Fund’s annualized expense ratio as indicated above multiplied by the average account value over the period, multiplied by 181/365 to reflect the most recent fiscal half year. |
25 Invesco Gold & Special Minerals Fund
Tax Information
Form 1099-DIV, Form 1042-S and other year–end tax information provide shareholders with actual calendar year amounts that should be included in their tax returns. Shareholders should consult their tax advisers.
The following distribution information is being provided as required by the Internal Revenue Code or to meet a specific state’s requirement.
The Fund designates the following amounts or, if subsequently determined to be different, the maximum amount allowable for its fiscal year ended April 30, 2021:
| | | | | | |
| | | | | | |
Federal and State Income Tax | | | | |
Qualified Dividend Income for Reduced Tax Rate* | | | 33.28 | % |
Qualified Business Income* | | | 0.00 | % |
Corporate Dividends Received Deduction* | | | 4.63 | % |
Business Interest Income* | | | 0.02 | % |
U.S. Treasury Obligations* | | | 0.00 | % |
* The above percentages are based on ordinary income dividends paid to shareholders during the Fund’s fiscal year.
26 Invesco Gold & Special Minerals Fund
Trustees and Officers
The address of each trustee and officer is AIM Sector Funds (Invesco Sector Funds) (the “Trust”), 11 Greenway Plaza, Suite 1000, Houston, Texas 77046-1173. The trustees serve for the life of the Trust, subject to their earlier death, incapacitation, resignation, retirement or removal as more specifically provided in the Trust’s organizational documents. Each officer serves for a one year term or until their successors are elected and qualified. Column two below includes length of time served with predecessor entities, if any.
| | | | | | | | | | | | | | |
| | | | | | | | | | | Number of | | | Other |
| | | | | Trustee | | | | | | Funds in | | | Directorship(s) |
| Name, Year of Birth and | | | | and/or | | | | | | Fund Complex | | | Held by Trustee |
| Position(s) | | | | Officer | | Principal Occupation(s) | | | | Overseen by | | | During Past 5 |
| Held with the Trust | | | | Since | | During Past 5 Years | | | | Trustee | | | Years |
Interested Trustee | | | | | | | | | | | | | | |
Martin L. Flanagan1 - 1960 Trustee and Vice Chair | | | | 2007 | | Executive Director, Chief Executive Officer and President, Invesco Ltd. (ultimate parent of Invesco and a global investment management firm); Trustee and Vice Chair, The Invesco Funds; Vice Chair, Investment Company Institute; and Member of Executive Board, SMU Cox School of Business | | | | | 184 | | | None |
| | | | | | | |
| | | | | | | Formerly: Advisor to the Board, Invesco Advisers, Inc. (formerly known as Invesco Institutional (N.A.), Inc.); Chairman and Chief Executive Officer, Invesco Advisers, Inc. (registered investment adviser); Director, Chairman, Chief Executive Officer and President, Invesco Holding Company (US), Inc. (formerly IVZ Inc.) (holding company), Invesco Group Services, Inc. (service provider) and Invesco North American Holdings, Inc. (holding company); Director, Chief Executive Officer and President, Invesco Holding Company Limited (parent of Invesco and a global investment management firm); Director, Invesco Ltd.; Chairman, Investment Company Institute and President, Co-Chief Executive Officer, Co-President, Chief Operating Officer and Chief Financial Officer, Franklin Resources, Inc. (global investment management organization) | | | | | | | | |
| 1 | Mr. Flanagan is considered an interested person (within the meaning of Section 2(a)(19) of the 1940 Act) of the Trust because he is an officer of the Adviser to the Trust, and an officer and a director of Invesco Ltd., ultimate parent of the Adviser. |
T-1 Invesco Gold & Special Minerals Fund
Trustees and Officers–(continued)
| | | | | | | | | | | | |
| | | | | | | | | | | Number of | | Other |
| | | | | Trustee | | | | | | Funds in | | Directorship(s) |
| Name, Year of Birth and | | | | and/or | | | | | | Fund Complex | | Held by Trustee |
| Position(s) | | | | Officer | | Principal Occupation(s) | | | | Overseen by | | During Past 5 |
| Held with the Trust | | | | Since | | During Past 5 Years | | | | Trustee | | Years |
Independent Trustees | | | | | | | | |
Christopher L. Wilson - 1957 Trustee and Chair | | | | 2017 | | Retired Formerly: Director, TD Asset Management USA Inc. (mutual fund complex) (22 portfolios); Managing Partner, CT2, LLC (investing and consulting firm); President/Chief Executive Officer, Columbia Funds, Bank of America Corporation; President/Chief Executive Officer, CDC IXIS Asset Management Services, Inc.; Principal & Director of Operations, Scudder Funds, Scudder, Stevens & Clark, Inc.; Assistant Vice President, Fidelity Investments | | | | 184 | | enaible, Inc. (artificial intelligence technology); Director, ISO New England, Inc. (non-profit organization managing regional electricity market) |
Beth Ann Brown - 1968 Trustee | | | | 2019 | | Independent Consultant Formerly: Head of Intermediary Distribution, Managing Director, Strategic Relations, Managing Director, Head of National Accounts, Senior Vice President, National Account Manager and Senior Vice President, Key Account Manager, Columbia Management Investment Advisers LLC; Vice President, Key Account Manager, Liberty Funds Distributor, Inc.; and Trustee of certain Oppenheimer Funds | | | | 184 | | Director, Board of Directors of Caron Engineering Inc.; Advisor, Board of Advisors of Caron Engineering Inc.; President and Director, Acton Shapleigh Youth Conservation Corps (non - profit); and President and Director of Grahamtastic Connection (non-profit) |
Jack M. Fields - 1952 Trustee | | | | 2003 | | Chief Executive Officer, Twenty First Century Group, Inc. (government affairs company); and Board Member, Impact(Ed) (non-profit) Formerly: Owner and Chief Executive Officer, Dos Angeles Ranch L.P. (cattle, hunting, corporate entertainment); Director, Insperity, Inc. (formerly known as Administaff) (human resources provider); Chief Executive Officer, Texana Timber LP (sustainable forestry company); Director of Cross Timbers Quail Research Ranch (non-profit); and member of the U.S. House of Representatives | | | | 184 | | Member, Board of Directors of Baylor College of Medicine |
Cynthia Hostetler - 1962 Trustee | | | | 2017 | | Non-Executive Director and Trustee of a number of public and private business corporations Formerly: Director, Aberdeen Investment Funds (4 portfolios); Director, Artio Global Investment LLC (mutual fund complex); Director, Edgen Group, Inc. (specialized energy and infrastructure products distributor); Head of Investment Funds and Private Equity, Overseas Private Investment Corporation; President, First Manhattan Bancorporation, Inc.; Attorney, Simpson Thacher & Bartlett LLP | | | | 184 | | Resideo Technologies, Inc. (smart home technology); Vulcan Materials Company (construction materials company); Trilinc Global Impact Fund; Genesee & Wyoming, Inc. (railroads); Investment Company Institute (professional organization); Independent Directors Council (professional organization);Eisenhower Foundation (non-profit) |
Eli Jones - 1961 Trustee | | | | 2016 | | Professor and Dean, Mays Business School - Texas A&M University Formerly: Professor and Dean, Walton College of Business, University of Arkansas and E.J. Ourso College of Business, Louisiana State University; Director, Arvest Bank | | | | 184 | | Insperity, Inc. (formerly known as Administaff) (human resources provider) |
T-2 Invesco Gold & Special Minerals Fund
Trustees and Officers–(continued)
| | | | | | | | | | | | |
| | | | | | | | | | | Number of | | Other |
| | | | | Trustee | | | | | | Funds in | | Directorship(s) |
| Name, Year of Birth and | | | | and/or | | | | | | Fund Complex | | Held by Trustee |
| Position(s) | | | | Officer | | Principal Occupation(s) | | | | Overseen by | | During Past 5 |
| Held with the Trust | | | | Since | | During Past 5 Years | | | | Trustee | | Years |
Independent Trustees–(continued) | | | | | | | | |
Elizabeth Krentzman - 1959 Trustee | | | | 2019 | | Formerly: Principal and Chief Regulatory Advisor for Asset Management Services and U.S. Mutual Fund Leader of Deloitte & Touche LLP; General Counsel of the Investment Company Institute (trade association); National Director of the Investment Management Regulatory Consulting Practice, Principal, Director and Senior Manager of Deloitte & Touche LLP; Assistant Director of the Division of Investment Management - Office of Disclosure and Investment Adviser Regulation of the U.S. Securities and Exchange Commission and various positions with the Division of Investment Management – Office of Regulatory Policy of the U.S. Securities and Exchange Commission; Associate at Ropes & Gray LLP; and Trustee of certain Oppenheimer Funds | | | | 184 | | Trustee of the University of Florida National Board Foundation; Member of the Carita Funds Board of Directors (private investment funds); Member of the University of Florida Law Center Association, Inc. Board of Trustees and Audit Committee Member |
Anthony J. LaCava, Jr. - 1956 Trustee | | | | 2019 | | Formerly: Director and Member of the Audit Committee, Blue Hills Bank (publicly traded financial institution) and Managing Partner, KPMG LLP | | | | 184 | | Blue Hills Bank; Chairman, Bentley University; Member, Business School Advisory Council; and Nominating Committee KPMG LLP |
Prema Mathai-Davis - 1950 Trustee | | | | 2003 | | Retired Formerly: Co-Founder & Partner of Quantalytics Research, LLC, (a FinTech Investment Research Platform for the Self-Directed Investor); Trustee of YWCA Retirement Fund; CEO of YWCA of the USA; Board member of the NY Metropolitan Transportation Authority; Commissioner of the NYC Department of Aging; Board member of Johns Hopkins Bioethics Institute | | | | 184 | | None |
Joel W. Motley - 1952 Trustee | | | | 2019 | | Director of Office of Finance, Federal Home Loan Bank System; Managing Director of Carmona Motley Inc. (privately held financial advisor); Member of the Council on Foreign Relations and its Finance and Budget Committee; Chairman Emeritus of Board of Human Rights Watch and Member of its Investment Committee; and Member of Investment Committee and Board of Historic Hudson Valley (non-profit cultural organization) Formerly: Managing Director of Public Capital Advisors, LLC (privately held financial advisor); Managing Director of Carmona Motley Hoffman, Inc. (privately held financial advisor); Trustee of certain Oppenheimer Funds; Director of Columbia Equity Financial Corp. (privately held financial advisor); and Member of the Vestry of Trinity Church Wall Street | | | | 184 | | Member of Board of Greenwall Foundation (bioethics research foundation) and its Investment Committee; Member of Board of Friends of the LRC (non-profit legal advocacy); Board Member and Investment Committee Member of Pulitzer Center for Crisis Reporting (non-profit journalism) |
Teresa M. Ressel - 1962 Trustee | | | | 2017 | | Non-executive director and trustee of a number of public and private business corporations Formerly: Chief Executive Officer, UBS Securities LLC (investment banking); Chief Operating Officer, UBS AG Americas (investment banking); Sr. Management Team Olayan America, The Olayan Group (international investor/commercial/industrial); Assistant Secretary for Management & Budget and Designated Chief Financial Officer, U.S. Department of Treasury; Director, Atlantic Power Corporation (power generation company) and ON Semiconductor Corporation (semiconductor manufacturing) | | | | 184 | | Elucida Oncology (nanotechnology & medical particles company) |
T-3 Invesco Gold & Special Minerals Fund
Trustees and Officers–(continued)
| | | | | | | | | | | | |
| | | | | | | | | | | Number of | | Other |
| | | | | Trustee | | | | | | Funds in | | Directorship(s) |
| Name, Year of Birth and | | | | and/or | | | | | | Fund Complex | | Held by Trustee |
| Position(s) | | | | Officer | | Principal Occupation(s) | | | | Overseen by | | During Past 5 |
| Held with the Trust | | | | Since | | During Past 5 Years | | | | Trustee | | Years |
Independent Trustees–(continued) | | | | | | | | |
Ann Barnett Stern - 1957 Trustee | | | | 2017 | | President, Chief Executive Officer and Board Member, Houston Endowment, Inc. a private philanthropic institution Formerly: Executive Vice President, Texas Children’s Hospital; Vice President, General Counsel and Corporate Compliance Officer, Texas Children’s Hospital; Attorney at Beck, Redden and Secrest, LLP and Andrews and Kurth LLP | | | | 184 | | Director and Audit Committee member of Federal Reserve Bank of Dallas; Trustee and Board Chair of Good Reason Houston (nonprofit); Trustee, Vice Chair, Chair of Nomination/Governance Committee, Chair of Personnel Committee of Holdsworth Center (nonprofit); Trustee and Investment Committee member of University of Texas Law School Foundation (nonprofit); Board Member of Greater Houston Partnership |
Robert C. Troccoli - 1949 Trustee | | | | 2016 | | Retired Formerly: Adjunct Professor, University of Denver – Daniels College of Business; and Managing Partner, KPMG LLP | | | | 184 | | None |
Daniel S. Vandivort - 1954 Trustee | | | | 2019 | | Trustee, Board of Trustees, Huntington Disease Foundation of America; and President, Flyway Advisory Services LLC (consulting and property management) Formerly: Trustee and Governance Chair, of certain Oppenheimer Funds; and Treasurer, Chairman of the Audit and Finance Committee, Huntington Disease Foundation of America | | | | 184 | | None |
James D. Vaughn - 1945 Trustee | | | | 2019 | | Retired Formerly: Managing Partner, Deloitte & Touche LLP; Trustee and Chairman of the Audit Committee, Schroder Funds; Board Member, Mile High United Way, Boys and Girls Clubs, Boy Scouts, Colorado Business Committee for the Arts, Economic Club of Colorado and Metro Denver Network (economic development corporation); and Trustee of certain Oppenheimer Funds | | | | 184 | | Board member and Chairman of Audit Committee of AMG National Trust Bank; Trustee and Investment Committee member, University of South Dakota Foundation; Board member, Audit Committee Member and past Board Chair, Junior Achievement (non-profit) |
T-4 Invesco Gold & Special Minerals Fund
Trustees and Officers–(continued)
| | | | | | | | | | | | |
| | | | | | | | | | | Number of | | Other |
| | | | | Trustee | | | | | | Funds in | | Directorship(s) |
| Name, Year of Birth and | | | | and/or | | | | | | Fund Complex | | Held by Trustee |
| Position(s) | | | | Officer | | Principal Occupation(s) | | | | Overseen by | | During Past 5 |
| Held with the Trust | | | | Since | | During Past 5 Years | | | | Trustee | | Years |
Officers | | | | | | | | |
Sheri Morris - 1964 President and Principal Executive Officer | | | | 2003 | | Head of Global Fund Services, Invesco Ltd.; President and Principal Executive Officer, The Invesco Funds; Senior Vice President, Invesco Advisers, Inc. (formerly known as Invesco Institutional (N.A.), Inc.) (registered investment adviser); and Vice President, Invesco Exchange-Traded Fund Trust, Invesco Exchange-Traded Fund Trust II, Invesco India Exchange-Traded Fund Trust, Invesco Actively Managed Exchange-Traded Fund Trust, Invesco Actively Managed Exchange-Traded Commodity Fund Trust and Invesco Exchange-Traded Self-Indexed Fund Trust; and Vice President, OppenheimerFunds, Inc. | | | | N/A | | N/A |
| | | | | | | |
| | | | | | | Formerly: Vice President, Treasurer and Principal Financial Officer, The Invesco Funds; Vice President, Invesco AIM Advisers, Inc., Invesco AIM Capital Management, Inc. and Invesco AIM Private Asset Management, Inc.; Assistant Vice President and Assistant Treasurer, The Invesco Funds; Vice President and Assistant Vice President, Invesco Advisers, Inc.; Assistant Vice President, Invesco AIM Capital Management, Inc. and Invesco AIM Private Asset Management, Inc.; and Treasurer, Invesco Exchange-Traded Fund Trust, Invesco Exchange-Traded Fund Trust II, Invesco India Exchange-Traded Fund Trust and Invesco Actively Managed Exchange-Traded Fund Trust | | | | | | |
Russell C. Burk - 1958 Senior Vice President and Senior Officer | | | | 2005 | | Senior Vice President and Senior Officer, The Invesco Funds | | | | N/A | | N/A |
Jeffrey H. Kupor - 1968 Senior Vice President, Chief Legal Officer and Secretary | | | | 2018 | | Head of Legal of the Americas, Invesco Ltd.; Senior Vice President and Secretary, Invesco Advisers, Inc. (formerly known as Invesco Institutional (N.A.), Inc.) (registered investment adviser); Senior Vice President and Secretary, Invesco Distributors, Inc. (formerly known as Invesco AIM Distributors, Inc.); Vice President and Secretary, Invesco Investment Services, Inc. (formerly known as Invesco AIM Investment Services, Inc.) Senior Vice President, Chief Legal Officer and Secretary, The Invesco Funds; Secretary and General Counsel, Invesco Investment Advisers LLC (formerly known as Van Kampen Asset Management); Secretary and General Counsel, Invesco Capital Markets, Inc. (formerly known as Van Kampen Funds Inc.) and Chief Legal Officer, Invesco Exchange-Traded Fund Trust, Invesco Exchange-Traded Fund Trust II, Invesco India Exchange-Traded Fund Trust, Invesco Actively Managed Exchange-Traded Fund Trust, Invesco Actively Managed Exchange-Traded Commodity Fund Trust and Invesco Exchange-Traded Self-Indexed Fund Trust; Secretary, Invesco Indexing LLC; Secretary, W.L. Ross & Co., LLC ; Secretary and Vice President, Harbourview Asset Management Corporation; Secretary and Vice President, OppenheimerFunds, Inc. and Invesco Managed Accounts, LLC; Secretary and Senior Vice President, OFI Global Institutional, Inc.; Secretary and Vice President, OFI SteelPath, Inc.; Secretary and Vice President, Oppenheimer Acquisition Corp.; Secretary and Vice President, Shareholder Services, Inc.; Secretary and Vice President, Trinity Investment Management Corporation Formerly: Secretary and Vice President, Jemstep, Inc.; Head of Legal, Worldwide Institutional, Invesco Ltd.; Secretary and General Counsel, INVESCO Private Capital Investments, Inc.; Senior Vice President, Secretary and General Counsel, Invesco Management Group, Inc. (formerly known as Invesco AIM Management Group, Inc.); Assistant Secretary, INVESCO Asset Management (Bermuda) Ltd.; Secretary and General Counsel, Invesco Private Capital, Inc.; Assistant Secretary and General Counsel, INVESCO Realty, Inc.; Secretary and General Counsel, Invesco Senior Secured Management, Inc.; and Secretary, Sovereign G./P. Holdings Inc. | | | | N/A | | N/A |
T-5 Invesco Gold & Special Minerals Fund
Trustees and Officers–(continued)
| | | | | | | | | | | | |
| | | | | | | | | | | Number of | | Other |
| | | | | Trustee | | | | | | Funds in | | Directorship(s) |
| Name, Year of Birth and | | | | and/or | | | | | | Fund Complex | | Held by Trustee |
| Position(s) | | | | Officer | | Principal Occupation(s) | | | | Overseen by | | During Past 5 |
| Held with the Trust | | | | Since | | During Past 5 Years | | | | Trustee | | Years |
Officers–(continued) | | | | | | | | |
Andrew R. Schlossberg - 1974 Senior Vice President | | | | 2019 | | Head of the Americas and Senior Managing Director, Invesco Ltd.; Director and Senior Vice President, Invesco Advisers, Inc. (formerly known as Invesco Institutional (N.A.), Inc.) (registered investment adviser); Director and Chairman, Invesco Investment Services, Inc. (formerly known as Invesco AIM Investment Services, Inc.) (registered transfer agent); Senior Vice President, The Invesco Funds; Director, Invesco Investment Advisers LLC (formerly known as Van Kampen Asset Management); Director, President and Chairman, Invesco Insurance Agency, Inc. | | | | N/A | | N/A |
| | | | | | | |
| | | | | | | Formerly: Director, President and Chairman, Invesco Insurance Agency, Inc.; Director, Invesco UK Limited; Director and Chief Executive, Invesco Asset Management Limited and Invesco Fund Managers Limited; Assistant Vice President, The Invesco Funds; Senior Vice President, Invesco Advisers, Inc. (formerly known as Invesco Institutional (N.A.), Inc.) (registered investment adviser); Director and Chief Executive, Invesco Administration Services Limited and Invesco Global Investment Funds Limited; Director, Invesco Distributors, Inc.; Head of EMEA, Invesco Ltd.; President, Invesco Actively Managed Exchange-Traded Commodity Fund Trust, Invesco Actively Managed Exchange-Traded Fund Trust, Invesco Exchange-Traded Fund Trust, Invesco Exchange-Traded Fund Trust II and Invesco India Exchange-Traded Fund Trust; Managing Director and Principal Executive Officer, Invesco Capital Management LLC | | | | | | |
John M. Zerr - 1962 Senior Vice President | | | | 2006 | | Chief Operating Officer of the Americas; Senior Vice President, Invesco Advisers, Inc. (formerly known as Invesco Institutional (N.A.), Inc.) (registered investment adviser); Senior Vice President, Invesco Distributors, Inc. (formerly known as Invesco AIM Distributors, Inc.); Director and Vice President, Invesco Investment Services, Inc. (formerly known as Invesco AIM Investment Services, Inc.) Senior Vice President, The Invesco Funds; Managing Director, Invesco Capital Management LLC; Director, Invesco Investment Advisers LLC (formerly known as Van Kampen Asset Management); Senior Vice President, Invesco Capital Markets, Inc. (formerly known as Van Kampen Funds Inc.); Manager, Invesco Indexing LLC; Manager, Invesco Specialized Products, LLC; Member, Invesco Canada Funds Advisory Board; Director, President and Chief Executive Officer, Invesco Corporate Class Inc. (corporate mutual fund company); and Director, Chairman, President and Chief Executive Officer, Invesco Canada Ltd. (formerly known as Invesco Trimark Ltd./Invesco Trimark Ltèe) (registered investment adviser and registered transfer agent); President, Invesco, Inc.; President, Invesco Global Direct Real Estate Feeder GP Ltd.; President, Invesco IP Holdings(Canada) Ltd; President, Invesco Global Direct Real Estate GP Ltd.; President, Invesco Financial Services Ltd. / Services Financiers Invesco Ltée; President, Trimark Investments Ltd./Placements Trimark Ltée and Director and Chairman, Invesco Trust Company | | | | N/A | | N/A |
| | | | | | | Formerly: Director and Senior Vice President, Invesco Insurance Agency, Inc.; Director and Senior Vice President, Invesco Management Group, Inc. (formerly known as Invesco AIM Management Group, Inc.); Secretary and General Counsel, Invesco Management Group, Inc. (formerly known as Invesco AIM Management Group, Inc.); Secretary, Invesco Investment Services, Inc. (formerly known as Invesco AIM Investment Services, Inc.); Chief Legal Officer and Secretary, The Invesco Funds; Secretary and General Counsel, Invesco Investment Advisers LLC (formerly known as Van Kampen Asset Management); Secretary and General Counsel, Invesco Capital Markets, Inc. (formerly known as Van Kampen Funds Inc.); Chief Legal Officer, Invesco Exchange-Traded Fund Trust, Invesco Exchange-Traded Fund Trust II, Invesco India Exchange-Traded Fund Trust, Invesco Actively Managed Exchange-Traded Fund Trust, Invesco Actively Managed Exchange-Traded Commodity Fund Trust and Invesco Exchange-Traded Self-Indexed Fund Trust; Secretary, Invesco Indexing LLC; Director, Secretary, General Counsel and Senior Vice President, Van Kampen Exchange Corp.; Director, Vice President and Secretary, IVZ Distributors, Inc. (formerly known as INVESCO Distributors, Inc.); Director and Vice President, INVESCO Funds Group, Inc.; Director and Vice President, Van Kampen Advisors Inc.; Director, Vice President, Secretary and General Counsel, Van Kampen Investor Services Inc.; Director and Secretary, Invesco Distributors, Inc. (formerly known as Invesco AIM Distributors, Inc.); Director, Senior Vice President, General Counsel and Secretary, Invesco AIM Advisers, Inc. and Van Kampen Investments Inc.; Director, Vice President and Secretary, Fund Management Company; Director, Senior Vice President, Secretary, General Counsel and Vice President, Invesco AIM Capital Management, Inc.; Chief Operating Officer and General Counsel, Liberty Ridge Capital, Inc. (an investment adviser) | | | | | | |
T-6 Invesco Gold & Special Minerals Fund
Trustees and Officers–(continued)
| | | | | | | | | | | | |
| | | | | | | | | | | Number of | | Other |
| | | | | Trustee | | | | | | Funds in | | Directorship(s) |
| Name, Year of Birth and | | | | and/or | | | | | | Fund Complex | | Held by Trustee |
| Position(s) | | | | Officer | | Principal Occupation(s) | | | | Overseen by | | During Past 5 |
| Held with the Trust | | | | Since | | During Past 5 Years | | | | Trustee | | Years |
Officers–(continued) | | | | | | | | |
Gregory G. McGreevey - 1962 Senior Vice President | | | | 2012 | | Senior Managing Director, Invesco Ltd.; Director, Chairman, President, and Chief Executive Officer, Invesco Advisers, Inc. (formerly known as Invesco Institutional (N.A.), Inc.) (registered investment adviser); Director, Invesco Mortgage Capital, Inc. and Invesco Senior Secured Management, Inc.; and Senior Vice President, The Invesco Funds; and President, SNW Asset Management Corporation and Invesco Managed Accounts, LLC; Chairman and Director, Invesco Private Capital, Inc.; Chairman and Director, INVESCO Private Capital Investments, Inc.; Chairman and Director, INVESCO Realty, Inc. Chairman and Director, INVESCO Realty, Inc.; and Senior Vice President, Invesco Group Services, Inc. | | | | N/A | | N/A |
| | | | | | | |
| | | | | | | Formerly: Senior Vice President, Invesco Management Group, Inc. and Invesco Advisers, Inc.; Assistant Vice President, The Invesco Funds | | | | | | |
Adrien Deberghes - 1967 Principal Financial Officer, Treasurer and Vice President | | | | 2020 | | Head of the Fund Office of the CFO and Fund Administration; Vice President, Invesco Advisers, Inc.; Principal Financial Officer, Treasurer and Vice President, The Invesco Funds; Vice President, Invesco Exchange-Traded Fund Trust, Invesco Exchange-Traded Fund Trust II, Invesco India Exchange-Traded Fund Trust, Invesco Actively Managed Exchange-Traded Fund Trust, Invesco Actively Managed Exchange-Traded Commodity Fund Trust and Invesco Exchange-Traded Self-Indexed Fund Trust | | | | N/A | | N/A |
| | | | | | | |
| | | | | | | Formerly: Senior Vice President and Treasurer, Fidelity Investments | | | | | | |
Crissie M. Wisdom - 1969 Anti-Money Laundering Compliance Officer | | | | 2013 | | Anti-Money Laundering and OFAC Compliance Officer for Invesco U.S. entities including: Invesco Advisers, Inc. and its affiliates, Invesco Capital Markets, Inc., Invesco Distributors, Inc., Invesco Investment Services, Inc., The Invesco Funds, Invesco Capital Management, LLC, Invesco Trust Company; and Fraud Prevention Manager for Invesco Investment Services, Inc. | | | | N/A | | N/A |
Todd F. Kuehl - 1969 Chief Compliance Officer and Senior Vice President | | | | 2020 | | Chief Compliance Officer, Invesco Advisers, Inc. (registered investment adviser); and Chief Compliance Officer, The Invesco Funds and Senior Vice President Formerly: Managing Director and Chief Compliance Officer, Legg Mason (Mutual Funds); Chief Compliance Officer, Legg Mason Private Portfolio Group (registered investment adviser) | | | | N/A | | N/A |
Michael McMaster - 1962 Chief Tax Officer, Vice President and Assistant Treasurer | | | | 2020 | | Head of Global Fund Services Tax; Chief Tax Officer, Vice President and Assistant Treasurer, The Invesco Funds; Vice President, Invesco Advisers, Inc.; Assistant Treasurer, Invesco Capital Management LLC, Assistant Treasurer and Chief Tax Officer, Invesco Exchange-Traded Fund Trust, Invesco Exchange-Traded Fund Trust II, Invesco India Exchange-Traded Fund Trust, Invesco Actively Managed Exchange-Traded Fund Trust, Invesco Actively Managed Exchange-Traded Commodity Fund Trust and Invesco Exchange-Traded Self-Indexed Fund Trust; Assistant Treasurer, Invesco Specialized Products, LLC Formerly: Senior Vice President – Managing Director of Tax Services, U.S. Bank Global Fund Services (GFS) | | | | N/A | | N/A |
The Statement of Additional Information of the Trust includes additional information about the Fund’s Trustees and is available upon request, without charge, by calling 1.800.959.4246. Please refer to the Fund’s Statement of Additional Information for information on the Fund’s sub-advisers.
| | | | | | |
| Office of the Fund | | Investment Adviser | | Distributor | | Auditors |
| 11 Greenway Plaza, Suite 1000 | | Invesco Advisers, Inc. | | Invesco Distributors, Inc. | | PricewaterhouseCoopers LLP |
| Houston, TX 77046-1173 | | 1555 Peachtree Street, N.E. | | 11 Greenway Plaza, Suite 1000 | | 1000 Louisiana Street, Suite 5800 |
| | Atlanta, GA 30309 | | Houston, TX 77046-1173 | | Houston, TX 77002-5678 |
| | | |
| Counsel to the Fund | | Counsel to the Independent Trustees | | Transfer Agent | | Custodian |
| Stradley Ronon Stevens & Young, LLP | | Goodwin Procter LLP | | Invesco Investment Services, Inc. | | State Street Bank and Trust Company |
| 2005 Market Street, Suite 2600 | | 901 New York Avenue, N.W. | | 11 Greenway Plaza, Suite 1000 | | 225 Franklin Street |
| Philadelphia, PA 19103-7018 | | Washington, D.C. 20001 | | Houston, TX 77046-1173 | | Boston, MA 02110-2801 |
T-7 Invesco Gold & Special Minerals Fund
(This page intentionally left blank)
(This page intentionally left blank)

Go paperless with eDelivery
Visit invesco.com/edelivery to enjoy the convenience and security of anytime electronic access to your investment documents.
With eDelivery, you can elect to have any or all of the following materials delivered straight to your inbox to download, save and print from your own computer:
∎ Fund reports and prospectuses
∎ Quarterly statements
∎ Daily confirmations
∎ Tax forms
Invesco mailing information
Send general correspondence to Invesco Investment Services, Inc., P.O. Box 219078, Kansas City, MO 64121-9078.
Important notice regarding delivery of security holder documents
To reduce Fund expenses, only one copy of most shareholder documents may be mailed to shareholders with multiple accounts at the same address (Householding). Mailing of your shareholder documents may be householded indefinitely unless you instruct us otherwise. If you do not want the mailing of these documents to be combined with those for other members of your household, please contact Invesco Investment Services, Inc. at 800 959 4246 or contact your financial institution. We will begin sending you individual copies for each account within 30 days after receiving your request.
Fund holdings and proxy voting information
The Fund provides a complete list of its portfolio holdings four times each fiscal year, at the end of each fiscal quarter. For the second and fourth quarters, the list appears, respectively, in the Fund’s semiannual and annual reports to shareholders. For the first and third quarters, the Fund files the list with the Securities and Exchange Commission (SEC) as an exhibit to its reports on Form N-PORT. The most recent list of portfolio holdings is available at invesco.com/completeqtrholdings. Shareholders can also look up the Fund’s Form N-PORT filings on the SEC website, sec.gov. The SEC file numbers for the Fund are shown below.
A description of the policies and procedures that the Fund uses to determine how to vote proxies relating to portfolio securities is available without charge, upon request, from our Client Services department at 800 959 4246, or at invesco.com/corporate/about-us/esg. The information is also available on the SEC website, sec.gov.
| | |
Information regarding how the Fund voted proxies related to its portfolio securities during the most recent 12-month period ended June 30 is available at invesco.com/proxysearch. This information is also available on the SEC website, sec.gov. Invesco Advisers, Inc. is an investment adviser; it provides investment advisory services to individual and institutional clients and does not sell securities. Invesco Distributors, Inc. is the US distributor for Invesco Ltd.’s retail mutual funds, exchange-traded funds and institutional money market funds. Both are wholly owned, indirect subsidiaries of Invesco Ltd. | | |
| | | | |
| SEC file numbers: 811-03826 and 002-85905 | | Invesco Distributors, Inc. | | O-GSM-AR-1 |
| | | | |
| | |
 | | Annual Report to Shareholders | | April 30, 2021 |
| | |
| | Invesco Small Cap Value Fund |
| | Nasdaq: |
| | A: VSCAX ∎ C: VSMCX ∎ R: VSRAX ∎ Y: VSMIX ∎ R6: SMVSX |

Management’s Discussion of Fund Performance
|
Performance summary |
For the fiscal year ended April 30, 2021, Class A shares of Invesco Small Cap Value Fund (the Fund), at net asset value (NAV), outperformed the Russell 2000 Value Index, the Fund’s style-specific benchmark. Your Fund’s long-term performance appears later in this report. |
Fund vs. Indexes |
Total returns, 4/30/20 to 4/30/21, at net asset value (NAV). Performance shown does not include applicable contingent deferred sales charges (CDSC) or front-end sales charges, which would have reduced performance. |
| | | | |
Class A Shares | | | 117.30 | % |
| Class C Shares | | | 115.93 | |
| Class R Shares | | | 116.81 | |
| Class Y Shares | | | 117.78 | |
| Class R6 Shares | | | 118.25 | |
| S&P 500 Index▼ (Broad Market Index) | | | 45.98 | |
| Russell 2000 Value Index▼ (Style-Specific Index) | | | 78.96 | |
| Lipper Small-Cap Value Funds Index∎ (Peer Group Index) | | | 76.46 | |
| Source(s): ▼RIMES Technologies Corp.;∎Lipper Inc. | | | | |
Market conditions and your Fund
As many businesses began to shut down in April 2020 due to the pandemic, US unemployment numbers continued to climb, and the economy ground to a halt. However, during the second and into the third quarter of 2020, US stocks largely shrugged off economic uncertainty, social unrest and a resurgence in coronavirus infections to rally from the market bottom. Investor sentiment improved in response to trillions of dollars in economic stimulus, progress on a coronavirus vaccine and re-openings in many US regions.
Despite a September selloff, US equity markets posted gains in the third quarter as the US Federal Reserve (the Fed) extended its emergency stimulus programs and changed its inflation target policy, both of which supported equities. Data for both manufacturing and services indicated expansion, a reversal from significant declines earlier in the year. Corporate earnings were also better than anticipated and a gradual decline in new COVID-19 infections in many regions, combined with optimism about progress on a coronavirus vaccine, further boosted stocks.
US equity markets posted gains in the fourth quarter, as positive news on COVID-19 vaccines and strong corporate earnings outweighed investor concerns about the political disagreement over a fiscal stimulus package and sharply rising coronavirus infections nationwide. Cyclical sectors like energy and financials led the way, while real estate and consumer staples lagged. Market leadership also shifted during the quarter with value stocks outperforming growth for the first time since the fourth quarter of 2016. While the US economy rebounded significantly since the pandemic began, the recovery appeared to slow in the fourth quarter with employment gains and gross domestic product (GDP) growth down from the third quarter. However, stocks were buoyed by the Fed’s pledge
to maintain its accommodative stance and asset purchases, “until substantial further progress has been made” toward employment and inflation targets.
US political unrest and rising COVID-19 infection rates marked the start of the first quarter of 2021. Additionally, retail investors bid up select stocks like GameStop and AMC Theaters, ultimately causing a sharp selloff in late January. Corporate earnings generally beat expectations, but market volatility rose during the quarter as investors worried about rising bond yields and inflation. Despite the Federal Reserve’s commitment to an accommodative policy, the 10-year US Treasury yield rose from 0.92% at year-end to 1.63%1 at the fiscal year-end. Approval of a third COVID-19 vaccine boosted investors’ optimism for faster economic recovery. Although March saw increased volatility with consecutive down days in the US stock market, stocks continued to hit all-time highs through April. US stocks had strong returns, with the S&P 500 Index returning 45.98% for the fiscal year.2 All major US equity indexes posted large gains for the fiscal year. Within the Russell 2000 Value Index, all sectors posted very strong gains during the year. Consumer discretionary, materials and industrials posted the largest gains, while utilities posted the smallest gains.
During the fiscal year, we continued to use our intrinsic value strategy, seeking to create wealth by maintaining a long-term investment horizon and investing in companies selling at a significant discount to our estimate of their intrinsic value. We believe intrinsic value represents the fair economic worth of a business. Since our application of this strategy is highly disciplined and relatively unique, it is important to understand the benefits and limitations of our process. First, the investment strategy is intended to preserve your capital while growing it at above-market rates over the long term. Second, our investments have
little in common with popular stock market indexes and most of our peers. And third, the Fund’s short-term relative performance will naturally be different from stock market indexes and peers since we typically structure the portfolio significantly differently than these benchmarks.
Drivers of Fund performance were mainly stock-specific during the year. However, the Fund’s underweight positions in real estate/ REITs and utilities helped the Fund’s relative performance versus the Russell 2000 Value Index as these sectors underperformed. Select holdings within the industrials and consumer staples sectors contributed the most to absolute Fund performance. Very few Fund holdings declined during the fiscal year. Select holdings in energy and financials were small detractors.
Industrial company WESCO International was the largest contributor to overall Fund performance during the fiscal year. WESCO is a leading distributor of electrical and other industrial products. The company is now the largest industrial distributor in the U.S. after completing its acquisition of Anixter in June of 2020. Shares of WESCO outperformed as management delivered strong results post the merger with Anixter and increased their long-term merger synergy and cash flow targets. Consumer staples company Spectrum Brands Holdings was also a large contributor to absolute Fund performance. Shares of the global consumer products company rose after management reported solid financial results throughout the year.
Energy company Northern Oil and Gas was one of the few detractors from absolute Fund performance during the fiscal year. The company is an oil & gas exploration company with operations in North Dakota and Montana. Financial services company SLM also detracted from the overall performance. SLM is the largest student lender in the U.S. We sold our investment in the company during the fiscal year to fund more attractive opportunities.
We believe the single most important indicator of how the Fund is positioned for potential future success is not our recent investment results or popular statistical measures, but rather the difference between current market prices and the Fund’s estimated intrinsic value - the aggregate business value of the portfolio based on our estimate of intrinsic value for each holding.
At the end of the year, the difference between the market price and the estimated intrinsic value of the Fund was attractive, according to our estimation. While there is no assurance that market value will ever reflect our estimate of the Fund’s intrinsic value, we believe the gap between price and estimated intrinsic value may provide above-average capital appreciation. We will continue to work hard to protect and grow the Fund’s estimated intrinsic value.
2 �� Invesco Small Cap Value Fund
We thank you for your investment in Invesco Small Cap Value Fund and for sharing our long-term investment perspective.
Portfolio manager(s):
Jonathan Edwards - Lead
Jonathan Mueller
The views and opinions expressed in management’s discussion of Fund performance are those of Invesco Advisers, Inc. These views and opinions are subject to change at any time based on factors such as market and economic conditions. These views and opinions may not be relied upon as investment advice or recommendations, or as an offer for a particular security. The information is not a complete analysis of every aspect of any market, country, industry, security or the Fund. Statements of fact are from sources considered reliable, but Invesco Advisers, Inc. makes no representation or warranty as to their completeness or accuracy. Although historical performance is no guarantee of future results, these insights may help you understand our investment management philosophy.
See important Fund and, if applicable, index disclosures later in this report.
3 Invesco Small Cap Value Fund
Your Fund’s Long-Term Performance
Results of a $10,000 Investment – Oldest Share Class(es)
Fund and index data from 4/30/11
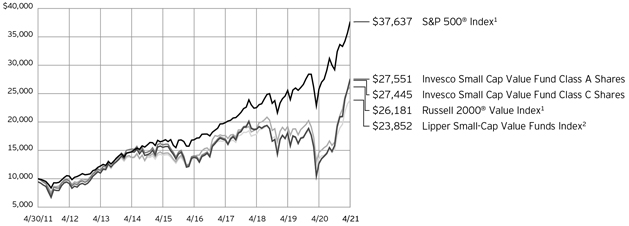
| 1 | Source: RIMES Technologies Corp. |
Past performance cannot guarantee future results.
The data shown in the chart include reinvested distributions, applicable sales charges and Fund expenses including management
fees. Index results include reinvested dividends, but they do not reflect sales charges. Performance of the peer group, if applicable, reflects fund expenses and management fees;
performance of a market index does not. Performance shown in the chart does not reflect deduction of taxes a shareholder would pay on Fund distributions or sale of Fund shares.
4 Invesco Small Cap Value Fund
| | | | |
Average Annual Total Returns | |
As of 4/30/21, including maximum applicable sales charges | |
Class A Shares | | | | |
| Inception (6/21/99) | | | 10.90 | % |
| 10 Years | | | 10.67 | |
| 5 Years | | | 13.61 | |
| 1 Year | | | 105.35 | |
Class C Shares | | | | |
| Inception (6/21/99) | | | 10.88 | % |
| 10 Years | | | 10.62 | |
| 5 Years | | | 14.06 | |
| 1 Year | | | 114.93 | |
Class R Shares | | | | |
| 10 Years | | | 11.01 | % |
| 5 Years | | | 14.59 | |
| 1 Year | | | 116.81 | |
Class Y Shares | | | | |
| Inception (8/12/05) | | | 10.97 | % |
| 10 Years | | | 11.57 | |
| 5 Years | | | 15.18 | |
| 1 Year | | | 117.78 | |
Class R6 Shares | | | | |
| 10 Years | | | 11.48 | % |
| 5 Years | | | 15.28 | |
| 1 Year | | | 118.25 | |
Effective June 1, 2010, Class A, Class C and Class I shares of the predecessor fund, Van Kampen Small Cap Value Fund, advised by Van Kampen Asset Management were reorganized into Class A, Class C and Class Y shares, respectively, of Invesco Van Kampen Small Cap Value Fund (renamed Invesco Small Cap Value Fund). Returns shown above, prior to June 1, 2010, for Class A, Class C and Class Y shares are those for Class A, Class C and Class I shares of the predecessor fund. Share class returns will differ from the predecessor fund because of different expenses.
Class R shares incepted on April 17, 2020. Performance shown prior to that date is that of the Fund’s Class A shares at net asset value restated to reflect the higher 12b-1 fees applicable to Class R shares.
Class R6 shares incepted on February 7, 2017. Performance shown prior to that date is that of the Fund’s Class A shares at net asset value and includes the 12b-1 fees applicable to Class A shares.
The performance data quoted represent past performance and cannot guarantee future results; current performance may be lower or higher. Please visit invesco.com/ performance for the most recent month-end performance. Performance figures reflect reinvested distributions, changes in net asset value and the effect of the maximum sales charge unless otherwise stated. Performance figures do not reflect deduction of taxes a shareholder would pay on Fund distributions or sale of Fund shares. Investment return and principal value will
fluctuate so that you may have a gain or loss when you sell shares.
Class A share performance reflects the maximum 5.50% sales charge, and Class C share performance reflects the applicable contingent deferred sales charge (CDSC) for the period involved. The CDSC on Class C shares is 1% for the first year after purchase. Class Y and Class R6 shares do not have a front-end sales charge or a CDSC; therefore, performance is at net asset value.
The performance of the Fund’s share classes will differ primarily due to different sales charge structures and class expenses.
Fund performance reflects any applicable fee waivers and/or expense reimbursements. Had the adviser not waived fees and/or reimbursed expenses currently or in the past, returns would have been lower. See current prospectus for more information.
5 Invesco Small Cap Value Fund
Supplemental Information
Invesco Small Cap Value Fund’s investment objective is long-term growth of capital.
| ∎ | | Unless otherwise stated, information presented in this report is as of April 30, 2021, and is based on total net assets. |
| ∎ | | Unless otherwise noted, all data is provided by Invesco. |
| ∎ | | To access your Fund’s reports/prospectus, visit invesco.com/fundreports. |
About indexes used in this report
| ∎ | | The S&P 500® Index is an unmanaged index considered representative of the US stock market. |
| ∎ | | The Russell 2000® Value Index is an unmanaged index considered representative of small-cap value stocks. The Russell 2000 Value Index is a trademark/service mark of the Frank Russell Co. Russell® is a trademark of the Frank Russell Co. |
| ∎ | | The Lipper Small-Cap Value Funds Index is an unmanaged index considered representative of small-cap value funds tracked by Lipper. |
| ∎ | | The Fund is not managed to track the performance of any particular index, including the index(es) described here, and consequently, the performance of the Fund may deviate significantly from the performance of the index(es). |
| ∎ | | A direct investment cannot be made in an index. Unless otherwise indicated, index results include reinvested dividends, and they do not reflect sales charges. Performance of the peer group, if applicable, reflects fund expenses; performance of a market index does not. |
Liquidity Risk Management Program
In compliance with Rule 22e-4 under the Investment Company Act of 1940, as amended (the “Liquidity Rule”), the Fund has adopted and implemented a liquidity risk management program in accordance with the Liquidity Rule (the “Program”). The Program is reasonably designed to assess and manage the Fund’s liquidity risk, which is the risk that the Fund could not meet redemption requests without significant dilution of remaining investors’ interests in the Fund. The Board of Trustees of the Fund (the “Board”) has appointed Invesco Advisers, Inc. (“Invesco”), the Fund’s investment adviser, as the Program’s administrator, and Invesco has delegated oversight of the Program to the Liquidity Risk Management Committee (the “Committee”), which is composed of senior representatives from relevant business groups at Invesco.
As required by the Liquidity Rule, the Program includes policies and procedures providing for an assessment, no less
frequently than annually, of the Fund’s liquidity risk that takes into account, as relevant to the Fund’s liquidity risk: (1) the Fund’s investment strategy and liquidity of portfolio investments during both normal and reasonably foreseeable stressed conditions; (2) short-term and long-term cash flow projections for the Fund during both normal and reasonably foreseeable stressed conditions; and (3) the Fund’s holdings of cash and cash equivalents and any borrowing arrangements. The Liquidity Rule also requires the classification of the Fund’s investments into categories that reflect the assessment of their relative liquidity under current market conditions. The Fund classifies its investments into one of four categories defined in the Liquidity Rule: “Highly Liquid,” “Moderately Liquid,” “Less Liquid,” and “Illiquid.” Funds that are not invested primarily in “Highly Liquid Investments” that are assets (cash or investments that are reasonably expected to be convertible into cash within three business days without significantly changing the market value of the investment) are required to establish a “Highly Liquid Investment Minimum” (“HLIM”), which is the minimum percentage of net assets that must be invested in Highly Liquid Investments. Funds with HLIMs have procedures for addressing HLIM shortfalls, including reporting to the Board and the SEC (on a non-public basis) as required by the Program and the Liquidity Rule. In addition, the Fund may not acquire an investment if, immediately after the acquisition, over 15% of the Fund’s net assets would consist of “Illiquid Investments” that are assets (an investment that cannot reasonably be expected to be sold or disposed of in current market conditions in seven calendar days or less without the sale or disposition significantly changing the market value of the investment). The Liquidity Rule and the Program also require reporting to the Board and the SEC (on a non-public basis) if a Fund’s holdings of Illiquid Investments exceed 15% of the Fund’s assets.
At a meeting held on March 22-24, 2021, the Committee presented a report to the Board that addressed the operation of the Program and assessed the Program’s adequacy and effectiveness of
implementation (the “Report”). The Report covered the period from January 1, 2020 through December 31, 2020 (the “Program Reporting Period”). The Report discussed notable events affecting liquidity over the Program Reporting Period, including the impact of the coronavirus pandemic on the Fund and the overall market. The Report noted that there were no material changes to the Program during the Program Reporting Period.
The Report stated, in relevant part, that during the Program Reporting Period:
| ∎ | | The Program, as adopted and implemented, remained reasonably designed to assess and manage the Fund’s liquidity risk and was operated effectively to achieve that goal; |
| ∎ | | The Fund’s investment strategy remained appropriate for an open-end fund; |
| ∎ | | The Fund was able to meet requests for redemption without significant dilution of remaining investors’ interests in the Fund; |
| ∎ | | The Fund did not breach the 15% limit on Illiquid Investments; and |
| ∎ | | The Fund primarily held Highly Liquid Investments and therefore has not adopted an HLIM. |
|
This report must be accompanied or preceded by a currently effective Fund prospectus, which contains more complete information, including sales charges and expenses. Investors should read it carefully before investing. |
|
| NOT FDIC INSURED | MAY LOSE VALUE | NO BANK GUARANTEE |
6 Invesco Small Cap Value Fund
Fund Information
Portfolio Composition
| | |
| By sector | | % of total net assets |
| |
Industrials | | 35.62% |
Financials | | 20.38 |
Consumer Discretionary | | 12.52 |
Materials | | 12.28 |
Energy | | 7.34 |
Consumer Staples | | 5.64 |
Other Sectors, Each Less than 2% of Net Assets | | 3.92 |
Money Market Funds Plus Other Assets Less Liabilities | | 2.30 |
Top 10 Equity Holdings*
| | | | | | |
| | | | | | % of total net assets |
| | |
| | 1. | | | ManpowerGroup, Inc. | | 3.56% |
| | 2. | | | TCF Financial Corp. | | 3.51 |
| | 3. | | | Athene Holding Ltd., Class A | | 3.51 |
| | 4. | | | Sterling Bancorp | | 3.31 |
| | 5. | | | US Foods Holding Corp. | | 3.09 |
| | 6. | | | Univar Solutions, Inc. | | 3.02 |
| | 7. | | | AECOM | | 3.00 |
| | 8. | | | Travel + Leisure Co. | | 2.87 |
| | 9. | | | Hilton Grand Vacations, Inc. | | 2.80 |
| | 10. | | | Huntsman Corp. | | 2.74 |
The Fund’s holdings are subject to change, and there is no assurance that the Fund will continue to hold any particular security.
| * | Excluding money market fund holdings, if any. |
Data presented here are as of April 30, 2021.
7 Invesco Small Cap Value Fund
Schedule of Investments(a)
April 30, 2021
| | | | | | | | |
| | | Shares | | | Value | |
Common Stocks & Other Equity Interests–97.70% | |
Aerospace & Defense–2.74% | | | | | | | | |
PAE, Inc.(b) | | | 964,100 | | | $ | 8,647,977 | |
Parsons Corp.(b) | | | 795,900 | | | | 35,282,247 | |
| | | | | | | | 43,930,224 | |
|
Auto Parts & Equipment–3.20% | |
Dana, Inc. | | | 1,326,896 | | | | 33,570,469 | |
Modine Manufacturing Co.(b) | | | 970,500 | | | | 15,799,740 | |
Motorcar Parts of America, Inc.(b) | | | 20,331 | | | | 439,149 | |
Visteon Corp.(b) | | | 12,100 | | | | 1,473,901 | |
| | | | | | | | 51,283,259 | |
|
Building Products–1.59% | |
JELD-WEN Holding, Inc.(b) | | | 872,695 | | | | 25,456,513 | |
| | |
Commodity Chemicals–0.51% | | | | | | | | |
Orion Engineered Carbons S.A. (Germany) | | | 409,100 | | | | 8,124,726 | |
|
Communications Equipment–0.18% | |
Ciena Corp.(b) | | | 57,500 | | | | 2,902,025 | |
|
Construction & Engineering–3.14% | |
AECOM(b) | | | 725,722 | | | | 48,209,712 | |
API Group Corp.(b)(c) | | | 35,100 | | | | 746,226 | |
Concrete Pumping Holdings, Inc.(b) | | | 176,043 | | | | 1,431,230 | |
| | | | | | | | 50,387,168 | |
|
Construction Machinery & Heavy Trucks–0.86% | |
Astec Industries, Inc. | | | 65,800 | | | | 4,935,658 | |
REV Group, Inc. | | | 485,800 | | | | 8,860,992 | |
| | | | | | | | 13,796,650 | |
|
Distributors–1.81% | |
LKQ Corp.(b) | | | 620,483 | | | | 28,982,761 | |
|
Diversified Chemicals–2.74% | |
Huntsman Corp. | | | 1,531,384 | | | | 43,904,779 | |
| | |
Education Services–0.93% | | | | | | | | |
Stride, Inc.(b) | | | 520,100 | | | | 14,890,463 | |
|
Electrical Components & Equipment–2.22% | |
nVent Electric PLC | | | 1,170,600 | | | | 35,644,770 | |
|
Electronic Manufacturing Services–1.76% | |
Flex Ltd.(b) | | | 24,023 | | | | 418,000 | |
Jabil, Inc. | | | 516,468 | | | | 27,073,253 | |
Sanmina Corp.(b) | | | 17,823 | | | | 727,891 | |
| | | | | | | | 28,219,144 | |
|
Food Distributors–3.09% | |
US Foods Holding Corp.(b) | | | 1,195,400 | | | | 49,561,284 | |
|
Health Care Facilities–1.98% | |
Universal Health Services, Inc., Class B | | | 213,600 | | | | 31,700,376 | |
|
Hotels, Resorts & Cruise Lines–5.67% | |
Hilton Grand Vacations, Inc.(b) | | | 1,008,400 | | | | 44,934,304 | |
| | | | | | | | |
| | | Shares | | | Value | |
Hotels, Resorts & Cruise Lines–(continued) | |
Travel + Leisure Co. | | | 713,600 | | | $ | 46,048,608 | |
| | | | | | | | 90,982,912 | |
|
Household Products–2.56% | |
Energizer Holdings, Inc. | | | 15,449 | | | | 761,636 | |
Spectrum Brands Holdings, Inc. | | | 456,695 | | | | 40,253,097 | |
| | | | | | | | 41,014,733 | |
|
Human Resource & Employment Services–4.97% | |
Kelly Services, Inc., Class A(b) | | | 549,210 | | | | 13,757,710 | |
ManpowerGroup, Inc. | | | 472,301 | | | | 57,096,468 | |
TrueBlue, Inc.(b) | | | 311,702 | | | | 8,821,167 | |
| | | | | | | | 79,675,345 | |
|
Industrial Conglomerates–0.59% | |
Carlisle Cos., Inc. | | | 49,302 | | | | 9,448,728 | |
|
Industrial Machinery–3.27% | |
Columbus McKinnon Corp. | | | 13,500 | | | | 668,385 | |
Crane Co. | | | 379,300 | | | | 35,676,958 | |
Welbilt, Inc.(b) | | | 720,200 | | | | 16,089,268 | |
| | | | | | | | 52,434,611 | |
|
Investment Banking & Brokerage–0.12% | |
Evercore, Inc., Class A | | | 11,000 | | | | 1,541,430 | |
Greenhill & Co., Inc. | | | 24,632 | | | | 373,914 | |
| | | | | | | | 1,915,344 | |
|
Life & Health Insurance–4.87% | |
Athene Holding Ltd., Class A(b) | | | 943,100 | | | | 56,274,777 | |
CNO Financial Group, Inc. | | | 857,515 | | | | 21,892,358 | |
| | | | | | | | 78,167,135 | |
|
Multi-Sector Holdings–0.10% | |
Peridot Acquisition Corp., Class A(b) | | | 156,815 | | | | 1,605,786 | |
|
Office Services & Supplies–0.67% | |
Interface, Inc. | | | 578,500 | | | | 7,427,940 | |
Steelcase, Inc., Class A | | | 238,000 | | | | 3,284,400 | |
| | | | | | | | 10,712,340 | |
|
Oil & Gas Equipment & Services–1.11% | |
Helix Energy Solutions Group, Inc.(b) | | | 3,367,281 | | | | 14,445,636 | |
NexTier Oilfield Solutions, Inc.(b) | | | 961,811 | | | | 3,452,901 | |
| | | | | | | | 17,898,537 | |
|
Oil & Gas Exploration & Production–5.70% | |
ARC Resources Ltd. (Canada) | | | 1,278,400 | | | | 8,039,728 | |
Devon Energy Corp. | | | 677,900 | | | | 15,849,302 | |
Diamondback Energy, Inc. | | | 374,800 | | | | 30,632,404 | |
Northern Oil and Gas, Inc.(b) | | | 1,172,680 | | | | 16,980,407 | |
Pioneer Natural Resources Co. | | | 129,617 | | | | 19,938,983 | |
| | | | | | | | 91,440,824 | |
|
Oil & Gas Refining & Marketing–0.52% | |
HollyFrontier Corp. | | | 240,600 | | | | 8,421,000 | |
|
Other Diversified Financial Services–1.83% | |
Equitable Holdings, Inc. | | | 860,100 | | | | 29,441,223 | |
See accompanying Notes to Financial Statements which are an integral part of the financial statements.
8 Invesco Small Cap Value Fund
| | | | | | | | |
| | | Shares | | | Value | |
|
Paper Packaging–1.66% | |
Sealed Air Corp. | | | 539,668 | | | $ | 26,659,599 | |
|
Regional Banks–10.83% | |
First Horizon Corp. | | | 1,688,010 | | | | 30,873,703 | |
Great Western Bancorp, Inc. | | | 1,013,300 | | | | 33,489,565 | |
Sterling Bancorp | | | 2,111,100 | | | | 53,051,943 | |
TCF Financial Corp. | | | 1,239,100 | | | | 56,403,832 | |
| | | | | | | | 173,819,043 | |
|
Research & Consulting Services–5.35% | |
KBR, Inc. | | | 1,082,600 | | | | 42,827,656 | |
Nielsen Holdings PLC | | | 1,628,600 | | | | 41,773,590 | |
Resources Connection, Inc. | | | 91,492 | | | | 1,290,952 | |
| | | | | | | | 85,892,198 | |
|
Restaurants–0.92% | |
Elior Group S.A. (France)(b)(c) | | | 932,500 | | | | 7,721,150 | |
Marston’s PLC (United Kingdom) | | | 5,241,614 | | | | 7,021,688 | |
| | | | | | | | 14,742,838 | |
|
Specialty Chemicals–5.85% | |
Avient Corp. | | | 15,310 | | | | 777,289 | |
Axalta Coating Systems Ltd.(b) | | | 928,200 | | | | 29,600,298 | |
Element Solutions, Inc. | | | 1,653,100 | | | | 36,169,828 | |
Kraton Corp.(b) | | | 765,722 | | | | 27,382,219 | |
| | | | | | | | 93,929,634 | |
|
Steel–1.52% | |
Carpenter Technology Corp. | | | 644,530 | | | | 24,408,351 | |
|
Thrifts & Mortgage Finance–2.62% | |
MGIC Investment Corp. | | | 1,808,442 | | | | 27,560,656 | |
| | | | | | | | |
| | | Shares | | | Value | |
|
Thrifts & Mortgage Finance–(continued) | |
Radian Group, Inc. | | | 587,248 | | | $ | 14,469,791 | |
| | | | | | | | 42,030,447 | |
|
Trading Companies & Distributors–10.18% | |
AerCap Holdings N.V. (Ireland)(b) | | | 662,700 | | | | 38,602,275 | |
Beacon Roofing Supply, Inc.(b) | | | 512,166 | | | | 28,850,311 | |
DXP Enterprises, Inc.(b) | | | 227,991 | | | | 6,673,297 | |
Univar Solutions, Inc.(b) | | | 2,072,900 | | | | 48,402,215 | |
WESCO International, Inc.(b) | | | 445,716 | | | | 40,881,071 | |
| | | | | | | | 163,409,169 | |
|
Trucking–0.04% | |
National Express Group PLC (United Kingdom)(b) | | | 165,825 | | | | 685,958 | |
Total Common Stocks & Other Equity Interests
(Cost $1,113,360,811) | | | | 1,567,519,897 | |
|
Money Market Funds–3.00% | |
Invesco Government & Agency Portfolio, Institutional Class, 0.03%(d)(e) | | | 16,011,462 | | | | 16,011,462 | |
Invesco Liquid Assets Portfolio, Institutional Class, 0.01%(d)(e) | | | 13,796,126 | | | | 13,801,645 | |
Invesco Treasury Portfolio, Institutional Class, 0.01%(d)(e) | | | 18,298,813 | | | | 18,298,813 | |
Total Money Market Funds
(Cost $48,111,920) | | | | 48,111,920 | |
| |
TOTAL INVESTMENTS IN SECURITIES-100.70%
(Cost $1,161,472,731) | | | | 1,615,631,817 | |
OTHER ASSETS LESS LIABILITIES–(0.70)% | | | | | | | (11,168,348 | ) |
NET ASSETS-100.00% | | | | | | $ | 1,604,463,469 | |
Notes to Schedule of Investments:
| (a) | Industry and/or sector classifications used in this report are generally according to the Global Industry Classification Standard, which was developed by and is the exclusive property and a service mark of MSCI Inc. and Standard & Poor’s. |
| (b) | Non-income producing security. |
| (c) | Security purchased or received in a transaction exempt from registration under the Securities Act of 1933, as amended (the “1933 Act”). The security may be resold pursuant to an exemption from registration under the 1933 Act, typically to qualified institutional buyers. The aggregate value of these securities at April 30, 2021 was $8,467,376, which represented less than 1% of the Fund’s Net Assets. |
| (d) | Affiliated issuer. The issuer and/or the Fund is a wholly-owned subsidiary of Invesco Ltd., or is affiliated by having an investment adviser that is under common control of Invesco Ltd. The table below shows the Fund’s transactions in, and earnings from, its investments in affiliates for the fiscal year ended April 30, 2021. |
| | | | | | | | | | | | | | | | | | | | | | | | | | | | |
| | | Value April 30, 2020 | | | Purchases at Cost | | | Proceeds from Sales | | | Change in
Unrealized
Appreciation
(Depreciation) | | | Realized
Gain | | | Value April 30, 2021 | | | Dividend Income | |
Investments in Affiliated Money Market Funds: | | | | | | | | | | | | | | | | | | | | | | | | | | | | |
Invesco Government & Agency Portfolio, Institutional Class | | $ | 11,727,183 | | | $ | 169,672,090 | | | $ | (165,387,811 | ) | | $ | - | | | $ | - | | | $ | 16,011,462 | | | $ | 3,083 | |
Invesco Liquid Assets Portfolio, Institutional Class | | | 10,741,897 | | | | 121,194,350 | | | | (118,134,151 | ) | | | (7,186 | ) | | | 6,735 | | | | 13,801,645 | | | | 9,332 | |
Invesco Treasury Portfolio, Institutional Class | | | 13,402,495 | | | | 193,910,959 | | | | (189,014,641 | ) | | | - | | | | - | | | | 18,298,813 | | | | 2,191 | |
Investments Purchased with Cash Collateral from Securities on Loan: | | | | | | | | | | | | | | | | | | | | | | | | | | | | |
Invesco Private Government Fund | | | - | | | | 45,755,589 | | | | (45,755,589 | ) | | | - | | | | - | | | | - | | | | 349 | * |
Invesco Private Prime Fund | | | - | | | | 18,239,936 | | | | (18,240,377 | ) | | | - | | | | 441 | | | | - | | | | 1,360 | * |
Total | | $ | 35,871,575 | | | $ | 548,772,924 | | | $ | (536,532,569 | ) | | $ | (7,186 | ) | | $ | 7,176 | | | $ | 48,111,920 | | | $ | 16,315 | |
| * | Represents the income earned on the investment of cash collateral, which is included in securities lending income on the Statement of Operations. Does not include rebates and fees paid to lending agent or premiums received from borrowers, if any. |
| (e) | The rate shown is the 7-day SEC standardized yield as of April 30, 2021. |
See accompanying Notes to Financial Statements which are an integral part of the financial statements.
9 Invesco Small Cap Value Fund
Statement of Assets and Liabilities
April 30, 2021
| | | | |
Assets: | | | | |
Investments in securities, at value
(Cost $1,113,360,811) | | $ | 1,567,519,897 | |
| |
Investments in affiliated money market funds, at value (Cost $48,111,920) | | | 48,111,920 | |
| |
Foreign currencies, at value
(Cost $33,548) | | | 34,079 | |
| |
Receivable for: | | | | |
Investments sold | | | 7,787,223 | |
| |
Fund shares sold | | | 7,857,099 | |
| |
Dividends | | | 353,965 | |
| |
Investment for trustee deferred compensation and retirement plans | | | 277,833 | |
| |
Other assets | | | 64,422 | |
| |
Total assets | | | 1,632,006,438 | |
| |
| |
Liabilities: | | | | |
Payable for: | | | | |
Investments purchased | | | 22,179,652 | |
| |
Fund shares reacquired | | | 3,368,628 | |
| |
Amount due custodian | | | 795,640 | |
| |
Accrued fees to affiliates | | | 706,555 | |
| |
Accrued trustees’ and officers’ fees and benefits | | | 1,661 | |
| |
Accrued other operating expenses | | | 185,250 | |
| |
Trustee deferred compensation and retirement plans | | | 305,583 | |
| |
Total liabilities | | | 27,542,969 | |
| |
Net assets applicable to shares outstanding | | $ | 1,604,463,469 | |
| |
| |
Net assets consist of: | | | | |
Shares of beneficial interest | | $ | 1,076,396,816 | |
| |
Distributable earnings | | | 528,066,653 | |
| |
| | $ | 1,604,463,469 | |
| |
| | | | |
Net Assets: | | | | |
Class A | | $ | 687,427,602 | |
| |
Class C | | $ | 17,597,566 | |
| |
Class R | | $ | 9,139,975 | |
| |
Class Y | | $ | 812,018,945 | |
| |
Class R6 | | $ | 78,279,381 | |
| |
|
Shares outstanding, no par value, with an unlimited number of shares authorized: | |
Class A | | | 32,991,490 | |
| |
Class C | | | 1,369,235 | |
| |
Class R | | | 439,655 | |
| |
Class Y | | | 36,529,354 | |
| |
Class R6 | | | 3,496,849 | |
| |
Class A: | | | | |
Net asset value per share | | $ | 20.84 | |
| |
Maximum offering price per share
(Net asset value of $20.84 ÷ 94.50%) | | $ | 22.05 | |
| |
Class C: | | | | |
Net asset value and offering price per share | | $ | 12.85 | |
| |
Class R: | | | | |
Net asset value and offering price per share | | $ | 20.79 | |
| |
Class Y: | | | | |
Net asset value and offering price per share | | $ | 22.23 | |
| |
Class R6: | | | | |
Net asset value and offering price per share | | $ | 22.39 | |
| |
See accompanying Notes to Financial Statements which are an integral part of the financial statements.
10 Invesco Small Cap Value Fund
Statement of Operations
For the year ended April 30, 2021
| | | | |
| |
Investment income: | | | | |
Dividends (net of foreign withholding taxes of $4,260) | | $ | 15,241,350 | |
| |
Dividends from affiliated money market funds (includes securities lending income of $27,329) | | | 41,935 | |
| |
Total investment income | | | 15,283,285 | |
| |
| |
Expenses: | | | | |
Advisory fees | | | 7,349,531 | |
| |
Administrative services fees | | | 136,664 | |
| |
Custodian fees | | | 19,359 | |
| |
Distribution fees: | | | | |
Class A | | | 1,197,822 | |
| |
Class C | | | 112,604 | |
| |
Class R | | | 29,324 | |
| |
Transfer agent fees – A, C, R and Y | | | 1,828,933 | |
| |
Transfer agent fees – R6 | | | 13,654 | |
| |
Trustees’ and officers’ fees and benefits | | | 39,275 | |
| |
Registration and filing fees | | | 89,643 | |
| |
Reports to shareholders | | | 124,765 | |
| |
Professional services fees | | | 45,041 | |
| |
Other | | | 17,265 | |
| |
Total expenses | | | 11,003,880 | |
| |
Less: Fees waived and/or expense offset arrangement(s) | | | (18,692 | ) |
| |
Net expenses | | | 10,985,188 | |
| |
Net investment income | | | 4,298,097 | |
| |
| |
Realized and unrealized gain (loss) from: | | | | |
Net realized gain (loss) from: | | | | |
Unaffiliated investment securities | | | 256,126,614 | |
| |
Affiliated investment securities | | | 7,176 | |
| |
Foreign currencies | | | (24,000 | ) |
| |
| | | 256,109,790 | |
| |
Change in net unrealized appreciation (depreciation) of: | | | | |
Unaffiliated investment securities | | | 624,801,467 | |
| |
Affiliated investment securities | | | (7,186 | ) |
| |
Foreign currencies | | | 1,600 | |
| |
| | | 624,795,881 | |
| |
Net realized and unrealized gain | | | 880,905,671 | |
| |
Net increase in net assets resulting from operations | | $ | 885,203,768 | |
| |
See accompanying Notes to Financial Statements which are an integral part of the financial statements.
11 Invesco Small Cap Value Fund
Statement of Changes in Net Assets
For the years ended April 30, 2021 and 2020
| | | | | | | | |
| | | 2021 | | | 2020 | |
| | |
Operations: | | | | | | | | |
Net investment income | | $ | 4,298,097 | | | $ | 3,864,332 | |
| |
Net realized gain (loss) | | | 256,109,790 | | | | (137,691,191 | ) |
| |
Change in net unrealized appreciation (depreciation) | | | 624,795,881 | | | | (254,623,721 | ) |
| |
Net increase (decrease) in net assets resulting from operations | | | 885,203,768 | | | | (388,450,580 | ) |
| |
| | |
Distributions to shareholders from distributable earnings: | | | | | | | | |
Class A | | | (1,584,440 | ) | | | (14,362,363 | ) |
| |
Class C | | | (19,674 | ) | | | (556,893 | ) |
| |
Class R | | | (13,957 | ) | | | – | |
| |
Class Y | | | (2,371,084 | ) | | | (16,631,631 | ) |
| |
Class R6 | | | (246,440 | ) | | | (1,687,217 | ) |
| |
Total distributions from distributable earnings | | | (4,235,595 | ) | | | (33,238,104 | ) |
| |
| | |
Share transactions–net: | | | | | | | | |
Class A | | | (61,901,801 | ) | | | (111,203,767 | ) |
| |
Class C | | | (1,686,975 | ) | | | (7,786,632 | ) |
| |
Class R | | | 628,552 | | | | 3,414,878 | |
| |
Class Y | | | (93,737,040 | ) | | | (197,788,556 | ) |
| |
Class R6 | | | (24,740,267 | ) | | | 14,526,805 | |
| |
Net increase (decrease) in net assets resulting from share transactions | | | (181,437,531 | ) | | | (298,837,272 | ) |
| |
Net increase (decrease) in net assets | | | 699,530,642 | | | | (720,525,956 | ) |
| |
| | |
Net assets: | | | | | | | | |
Beginning of year | | | 904,932,827 | | | | 1,625,458,783 | |
| |
End of year | | $ | 1,604,463,469 | | | $ | 904,932,827 | |
| |
See accompanying Notes to Financial Statements which are an integral part of the financial statements.
12 Invesco Small Cap Value Fund
Financial Highlights
The following schedule presents financial highlights for a share of the Fund outstanding throughout the periods indicated.
| | | | | | | | | | | | | | | | | | | | | | | | | | | | | | | | | | | | | | | | | | | | | | | | | | | | | | | | |
| | | Net asset
value,
beginning
of period | | | Net investment income (loss)(a) | | | Net gains (losses) on securities (both realized and unrealized) | | | Total from
investment operations | | | Dividends from net investment income | | | Distributions
from net
realized
gains | | | Total
distributions | | | Net asset
value, end
of period | | | Total
return (b) | | | Net assets,
end of period
(000’s omitted) | | | Ratio of expenses to average net assets with fee waivers and/or expenses absorbed | | | Ratio of expenses to average net assets without fee waivers and/or expenses absorbed | | | Ratio of net investment income (loss) to average net assets | | | Portfolio turnover (c) | |
Class A | | | | | | | | | | | | | | | | | | | | | | | | | | | | | | | | | | | | | | | | | | | | | | | | | | | | | | | | |
Year ended 04/30/21 | | $ | 9.62 | | | $ | 0.03 | | | $ | 11.24 | | | $ | 11.27 | | | $ | (0.05 | ) | | $ | – | | | $ | (0.05 | ) | | $ | 20.84 | | | | 117.30 | % | | $ | 687,428 | | | | 1.12 | %(d) | | | 1.12 | %(d) | | | 0.24 | %(d) | | | 71 | % |
Year ended 04/30/20 | | | 14.10 | | | | 0.02 | | | | (4.14 | ) | | | (4.12 | ) | | | – | | | | (0.36 | ) | | | (0.36 | ) | | | 9.62 | | | | (30.02 | ) | | | 372,448 | | | | 1.13 | | | | 1.13 | | | | 0.16 | | | | 47 | |
Year ended 04/30/19 | | | 18.53 | | | | (0.04 | ) | | | (1.22 | ) | | | (1.26 | ) | | | – | | | | (3.17 | ) | | | (3.17 | ) | | | 14.10 | | | | (3.16 | ) | | | 662,115 | | | | 1.12 | | | | 1.12 | | | | (0.22 | ) | | | 43 | |
Year ended 04/30/18 | | | 19.44 | | | | (0.06 | ) | | | 2.31 | | | | 2.25 | | | | – | | | | (3.16 | ) | | | (3.16 | ) | | | 18.53 | | | | 11.32 | | | | 933,986 | | | | 1.12 | | | | 1.12 | | | | (0.31 | ) | | | 28 | |
Year ended 04/30/17 | | | 16.21 | | | | (0.02 | ) | | | 3.60 | | | | 3.58 | | | | (0.03 | ) | | | (0.32 | ) | | | (0.35 | ) | | | 19.44 | | | | 22.14 | | | | 1,094,070 | | | | 1.10 | | | | 1.11 | | | | (0.12 | ) | | | 32 | |
Class C | | | | | | | | | | | | | | | | | | | | | | | | | | | | | | | | | | | | | | | | | | | | | | | | | | | | | | | | |
Year ended 04/30/21 | | | 5.96 | | | | (0.04 | ) | | | 6.94 | | | | 6.90 | | | | (0.01 | ) | | | – | | | | (0.01 | ) | | | 12.85 | | | | 115.93 | (e) | | | 17,598 | | | | 1.81 | (d)(e) | | | 1.81 | (d)(e) | | | (0.45 | )(d)(e) | | | 71 | |
Year ended 04/30/20 | | | 8.93 | | | | (0.04 | ) | | | (2.57 | ) | | | (2.61 | ) | | | – | | | | (0.36 | ) | | | (0.36 | ) | | | 5.96 | | | | (30.50 | )(e) | | | 10,133 | | | | 1.84 | (e) | | | 1.84 | (e) | | | (0.55 | )(e) | | | 47 | |
Year ended 04/30/19 | | | 13.29 | | | | (0.11 | ) | | | (1.08 | ) | | | (1.19 | ) | | | – | | | | (3.17 | ) | | | (3.17 | ) | | | 8.93 | | | | (3.98 | ) | | | 22,059 | | | | 1.87 | | | | 1.87 | | | | (0.97 | ) | | | 43 | |
Year ended 04/30/18 | | | 14.83 | | | | (0.15 | ) | | | 1.77 | | | | 1.62 | | | | – | | | | (3.16 | ) | | | (3.16 | ) | | | 13.29 | | | | 10.53 | (e) | | | 76,302 | | | | 1.86 | (e) | | | 1.86 | (e) | | | (1.05 | )(e) | | | 28 | |
Year ended 04/30/17 | | | 12.50 | | | | (0.12 | ) | | | 2.76 | | | | 2.65 | | | | – | | | | (0.32 | ) | | | (0.32 | ) | | | 14.83 | | | | 21.23 | (e) | | | 95,892 | | | | 1.84 | (e) | | | 1.85 | (e) | | | (0.86 | )(e) | | | 32 | |
Class R | | | | | | | | | | | | | | | | | | | | | | | | | | | | | | | | | | | | | | | | | | | | | | | | | | | | | | | | |
Year ended 04/30/21 | | | 9.61 | | | | (0.00 | )(f) | | | 11.21 | | | | 11.21 | | | | (0.03 | ) | | | – | | | | (0.03 | ) | | | 20.79 | | | | 116.81 | | | | 9,140 | | | | 1.37 | (d) | | | 1.37 | (d) | | | (0.01 | )(d) | | | 71 | |
Period ended 04/30/20(g) | | | 8.49 | | | | (0.00 | )(f) | | | 1.12 | | | | 1.12 | | | | – | | | | – | | | | – | | | | 9.61 | | | | 13.19 | | | | 3,866 | | | | 1.37 | (h) | | | 1.37 | (h) | | | (0.08 | )(h) | | | 47 | |
Class Y | | | | | | | | | | | | | | | | | | | | | | | | | | | | | | | | | | | | | | | | | | | | | | | | | | | | | | | | |
Year ended 04/30/21 | | | 10.25 | | | | 0.07 | | | | 11.98 | | | | 12.05 | | | | (0.07 | ) | | | – | | | | (0.07 | ) | | | 22.23 | | | | 117.78 | | | | 812,019 | | | | 0.87 | (d) | | | 0.87 | (d) | | | 0.49 | (d) | | | 71 | |
Year ended 04/30/20 | | | 14.95 | | | | 0.06 | | | | (4.40 | ) | | | (4.34 | ) | | | – | | | | (0.36 | ) | | | (0.36 | ) | | | 10.25 | | | | (29.79 | ) | | | 457,857 | | | | 0.88 | | | | 0.88 | | | | 0.41 | | | | 47 | |
Year ended 04/30/19 | | | 19.37 | | | | 0.01 | | | | (1.26 | ) | | | (1.25 | ) | | | – | | | | (3.17 | ) | | | (3.17 | ) | | | 14.95 | | | | (2.97 | ) | | | 875,875 | | | | 0.87 | | | | 0.87 | | | | 0.03 | | | | 43 | |
Year ended 04/30/18 | | | 20.15 | | | | (0.01 | ) | | | 2.39 | | | | 2.38 | | | | – | | | | (3.16 | ) | | | (3.16 | ) | | | 19.37 | | | | 11.58 | | | | 1,397,754 | | | | 0.87 | | | | 0.87 | | | | (0.06 | ) | | | 28 | |
Year ended 04/30/17 | | | 16.79 | | | | 0.02 | | | | 3.74 | | | | 3.76 | | | | (0.08 | ) | | | (0.32 | ) | | | (0.40 | ) | | | 20.15 | | | | 22.45 | | | | 1,445,051 | | | | 0.85 | | | | 0.86 | | | | 0.13 | | | | 32 | |
Class R6 | | | | | | | | | | | | | | | | | | | | | | | | | | | | | | | | | | | | | | | | | | | | | | | | | | | | | | | | |
Year ended 04/30/21 | | | 10.31 | | | | 0.09 | | | | 12.07 | | | | 12.16 | | | | (0.08 | ) | | | – | | | | (0.08 | ) | | | 22.39 | | | | 118.25 | | | | 78,279 | | | | 0.73 | (d) | | | 0.73 | (d) | | | 0.63 | (d) | | | 71 | |
Year ended 04/30/20 | | | 15.02 | | | | 0.08 | | | | (4.43 | ) | | | (4.35 | ) | | | – | | | | (0.36 | ) | | | (0.36 | ) | | | 10.31 | | | | (29.71 | ) | | | 60,628 | | | | 0.70 | | | | 0.70 | | | | 0.59 | | | | 47 | |
Year ended 04/30/19 | | | 19.41 | | | | 0.03 | | | | (1.25 | ) | | | (1.22 | ) | | | – | | | | (3.17 | ) | | | (3.17 | ) | | | 15.02 | | | | (2.80 | ) | | | 65,409 | | | | 0.71 | | | | 0.71 | | | | 0.19 | | | | 43 | |
Year ended 04/30/18 | | | 20.16 | | | | 0.02 | | | | 2.39 | | | | 2.41 | | | | – | | | | (3.16 | ) | | | (3.16 | ) | | | 19.41 | | | | 11.73 | | | | 26,813 | | | | 0.69 | | | | 0.69 | | | | 0.12 | | | | 28 | |
Period ended 04/30/17(g) | | | 20.29 | | | | 0.01 | | | | (0.14 | ) | | | (0.13 | ) | | | – | | | | – | | | | – | | | | 20.16 | | | | (0.64 | ) | | | 469 | | | | 0.72 | (h) | | | 0.72 | (h) | | | 0.26 | (h) | | | 32 | |
| (a) | Calculated using average shares outstanding. |
| (b) | Includes adjustments in accordance with accounting principles generally accepted in the United States of America and as such, the net asset value for financial reporting purposes and the returns based upon those net asset values may differ from the net asset value and returns for shareholder transactions. Does not include sales charges and is not annualized for periods less than one year, if applicable. |
| (c) | Portfolio turnover is calculated at the fund level and is not annualized for periods less than one year, if applicable. For the year ended April 30, 2020, the portfolio turnover calculation excludes the value of securities purchased of $23,823,797 in connection with the acquisition of Invesco Oppenheimer Small Cap Value Fund into the Fund. |
| (d) | Ratios are based on average daily net assets (000’s omitted) of $479,806, $11,955, $5,865, $572,986 and $54,312 for Class A, Class C, Class R, Class Y and Class R6 shares, respectively. |
| (e) | The total return, ratio of expenses to average net assets and ratio of net investment income (loss) to average net assets reflect actual 12b-1 fees of 0.94% for the year ended April 31, 2021, 0.96% for the year ended April 30, 2020 and 0.99% for the years ended April 30, 2018 and 2017, respectively. |
| (f) | Amount represents less than $(0.005). |
| (g) | Commencement date of April 17, 2020 and February 07, 2017 for Class R and Class R6 shares, respectively. |
See accompanying Notes to Financial Statements which are an integral part of the financial statements.
13 Invesco Small Cap Value Fund
Notes to Financial Statements
April 30, 2021
NOTE 1–Significant Accounting Policies
Invesco Small Cap Value Fund (the “Fund”) is a series portfolio of AIM Sector Funds (Invesco Sector Funds) (the “Trust”). The Trust is a Delaware statutory trust registered under the Investment Company Act of 1940, as amended (the “1940 Act”), as an open-end series management investment company authorized to issue an unlimited number of shares of beneficial interest. Information presented in these financial statements pertains only to the Fund. Matters affecting the Fund or each class will be voted on exclusively by the shareholders of the Fund or each class.
The Fund’s investment objective is long-term growth of capital.
The Fund currently consists of five different classes of shares: Class A, Class C, Class R, Class Y and Class R6. Class Y shares are available only to certain investors. Class A shares are sold with a front-end sales charge unless certain waiver criteria are met. Under certain circumstances, load waived shares may be subject to contingent deferred sales charges (“CDSC”). Class C shares are sold with a CDSC. Class R, Class Y and Class R6 shares are sold at net asset value. Class C shares held for ten years after purchase are eligible for automatic conversion into Class A shares of the same Fund (the “Conversion Feature”). The automatic conversion pursuant to the Conversion Feature will generally occur at the end of the month following the tenth anniversary after a purchase of Class C shares. Effective November 30, 2020, the automatic conversion pursuant to the Conversion Feature changed from ten years to eight years. The first conversion of Class C shares to Class A shares occurred at the end of December 2020 for all Class C shares that were held for more than eight years as of November 30, 2020.
The Fund is an investment company and accordingly follows the investment company accounting and reporting guidance in accordance with Financial Accounting Standards Board Accounting Standards Codification Topic 946, Financial Services – Investment Companies.
The following is a summary of the significant accounting policies followed by the Fund in the preparation of its financial statements.
| A. | Security Valuations – Securities, including restricted securities, are valued according to the following policy. |
A security listed or traded on an exchange (except convertible securities) is valued at its last sales price or official closing price as of the close of the customary trading session on the exchange where the security is principally traded, or lacking any sales or official closing price on a particular day, the security may be valued at the closing bid price on that day. Securities traded in the over-the-counter market are valued based on prices furnished by independent pricing services or market makers. When such securities are valued by an independent pricing service they may be considered fair valued. Futures contracts are valued at the final settlement price set by an exchange on which they are principally traded. Listed options are valued at the mean between the last bid and asked prices from the exchange on which they are principally traded. Options not listed on an exchange are valued by an independent source at the mean between the last bid and asked prices. For purposes of determining net asset value (“NAV”) per share, futures and option contracts generally are valued 15 minutes after the close of the customary trading session of the New York Stock Exchange (“NYSE”).
Investments in open-end and closed-end registered investment companies that do not trade on an exchange are valued at the end-of-day net asset value per share. Investments in open-end and closed-end registered investment companies that trade on an exchange are valued at the last sales price or official closing price as of the close of the customary trading session on the exchange where the security is principally traded.
Debt obligations (including convertible securities) and unlisted equities are fair valued using an evaluated quote provided by an independent pricing service. Evaluated quotes provided by the pricing service may be determined without exclusive reliance on quoted prices, and may reflect appropriate factors such as institution-size trading in similar groups of securities, developments related to specific securities, dividend rate (for unlisted equities), yield (for debt obligations), quality, type of issue, coupon rate (for debt obligations), maturity (for debt obligations), individual trading characteristics and other market data. Pricing services generally value debt obligations assuming orderly transactions of institutional round lot size, but a fund may hold or transact in the same securities in smaller, odd lot sizes. Odd lots often trade at lower prices than institutional round lots. Debt obligations are subject to interest rate and credit risks. In addition, all debt obligations involve some risk of default with respect to interest and/or principal payments.
Foreign securities’ (including foreign exchange contracts) prices are converted into U.S. dollar amounts using the applicable exchange rates as of the close of the NYSE. If market quotations are available and reliable for foreign exchange-traded equity securities, the securities will be valued at the market quotations. Because trading hours for certain foreign securities end before the close of the NYSE, closing market quotations may become unreliable. If between the time trading ends on a particular security and the close of the customary trading session on the NYSE, events occur that the investment adviser determines are significant and make the closing price unreliable, the Fund may fair value the security. If the event is likely to have affected the closing price of the security, the security will be valued at fair value in good faith using procedures approved by the Board of Trustees. Adjustments to closing prices to reflect fair value may also be based on a screening process of an independent pricing service to indicate the degree of certainty, based on historical data, that the closing price in the principal market where a foreign security trades is not the current value as of the close of the NYSE. Foreign securities’ prices meeting the approved degree of certainty that the price is not reflective of current value will be priced at the indication of fair value from the independent pricing service. Multiple factors may be considered by the independent pricing service in determining adjustments to reflect fair value and may include information relating to sector indices, American Depositary Receipts and domestic and foreign index futures. Foreign securities may have additional risks including exchange rate changes, potential for sharply devalued currencies and high inflation, political and economic upheaval, the relative lack of issuer information, relatively low market liquidity and the potential lack of strict financial and accounting controls and standards.
Securities for which market prices are not provided by any of the above methods may be valued based upon quotes furnished by independent sources. The last bid price may be used to value equity securities. The mean between the last bid and asked prices is used to value debt obligations, including corporate loans.
Securities for which market quotations are not readily available or became unreliable are valued at fair value as determined in good faith by or under the supervision of the Trust’s officers following procedures approved by the Board of Trustees. Issuer specific events, market trends, bid/asked quotes of brokers and information providers and other market data may be reviewed in the course of making a good faith determination of a security’s fair value.
The Fund may invest in securities that are subject to interest rate risk, meaning the risk that the prices will generally fall as interest rates rise and, conversely, the prices will generally rise as interest rates fall. Specific securities differ in their sensitivity to changes in interest rates depending on their individual characteristics. Changes in interest rates may result in increased market volatility, which may affect the value and/or liquidity of certain Fund investments.
Valuations change in response to many factors including the historical and prospective earnings of the issuer, the value of the issuer’s assets, general market conditions which are not specifically related to the particular issuer, such as real or perceived adverse economic conditions, changes in the general outlook for revenues or corporate earnings, changes in interest or currency rates, regional or global instability, natural or environmental disasters, widespread disease or other public health issues, war, acts of terrorism or adverse investor sentiment generally and market liquidity. Because of the inherent uncertainties of valuation, the values reflected in the financial statements may materially differ from the value received upon actual sale of those investments.
| B. | Securities Transactions and Investment Income – Securities transactions are accounted for on a trade date basis. Realized gains or losses on sales are computed on the basis of specific identification of the securities sold. Interest income (net of withholding tax, if any) is recorded on an accrual basis from settlement date and includes coupon interest and amortization of premium and accretion of discount on debt securities as applicable. Dividend income (net of withholding tax, if any) is recorded on the ex-dividend date. |
The Fund may periodically participate in litigation related to Fund investments. As such, the Fund may receive proceeds from litigation settlements. Any proceeds received are included in the Statement of Operations as realized gain (loss) for investments no longer held and as unrealized gain (loss) for investments still held.
14 Invesco Small Cap Value Fund
Brokerage commissions and mark ups are considered transaction costs and are recorded as an increase to the cost basis of securities purchased and/or a reduction of proceeds on a sale of securities. Such transaction costs are included in the determination of net realized and unrealized gain (loss) from investment securities reported in the Statement of Operations and the Statement of Changes in Net Assets and the net realized and unrealized gains (losses) on securities per share in the Financial Highlights. Transaction costs are included in the calculation of the Fund’s net asset value and, accordingly, they reduce the Fund’s total returns. These transaction costs are not considered operating expenses and are not reflected in net investment income reported in the Statement of Operations and the Statement of Changes in Net Assets, or the net investment income per share and the ratios of expenses and net investment income reported in the Financial Highlights, nor are they limited by any expense limitation arrangements between the Fund and the investment adviser.
The Fund allocates income and realized and unrealized capital gains and losses to a class based on the relative net assets of each class.
| C. | Country Determination – For the purposes of making investment selection decisions and presentation in the Schedule of Investments, the investment adviser may determine the country in which an issuer is located and/or credit risk exposure based on various factors. These factors include the laws of the country under which the issuer is organized, where the issuer maintains a principal office, the country in which the issuer derives 50% or more of its total revenues and the country that has the primary market for the issuer’s securities, as well as other criteria. Among the other criteria that may be evaluated for making this determination are the country in which the issuer maintains 50% or more of its assets, the type of security, financial guarantees and enhancements, the nature of the collateral and the sponsor organization. Country of issuer and/or credit risk exposure has been determined to be the United States of America, unless otherwise noted. |
| D. | Distributions – Distributions from net investment income and net realized capital gain, if any, are generally declared and paid annually and recorded on the ex-dividend date. The Fund may elect to treat a portion of the proceeds from redemptions as distributions for federal income tax purposes. |
| E. | Federal Income Taxes – The Fund intends to comply with the requirements of Subchapter M of the Internal Revenue Code of 1986, as amended (the “Internal Revenue Code”), necessary to qualify as a regulated investment company and to distribute substantially all of the Fund’s taxable earnings to shareholders. As such, the Fund will not be subject to federal income taxes on otherwise taxable income (including net realized capital gain) that is distributed to shareholders. Therefore, no provision for federal income taxes is recorded in the financial statements. |
The Fund recognizes the tax benefits of uncertain tax positions only when the position is more likely than not to be sustained. Management has analyzed the Fund’s uncertain tax positions and concluded that no liability for unrecognized tax benefits should be recorded related to uncertain tax positions. Management is not aware of any tax positions for which it is reasonably possible that the total amounts of unrecognized tax benefits will change materially in the next 12 months.
The Fund files tax returns in the U.S. Federal jurisdiction and certain other jurisdictions. Generally, the Fund is subject to examinations by such taxing authorities for up to three years after the filing of the return for the tax period.
| F. | Expenses – Fees provided for under the Rule 12b-1 plan of a particular class of the Fund are charged to the operations of such class. Transfer agency fees and expenses and other shareholder recordkeeping fees and expenses attributable to Class R6 are charged to such class. Transfer agency fees and expenses and other shareholder recordkeeping fees and expenses relating to all other classes are allocated among those classes based on relative net assets. All other expenses are allocated among the classes based on relative net assets. |
| G. | Accounting Estimates – The preparation of financial statements in conformity with accounting principles generally accepted in the United States of America (“GAAP”) requires management to make estimates and assumptions that affect the reported amounts of assets and liabilities at the date of the financial statements and the reported amounts of revenues and expenses during the reporting period including estimates and assumptions related to taxation. Actual results could differ from those estimates by a significant amount. In addition, the Fund monitors for material events or transactions that may occur or become known after the period-end date and before the date the financial statements are released to print. |
| H. | Indemnifications – Under the Trust’s organizational documents, each Trustee, officer, employee or other agent of the Trust is indemnified against certain liabilities that may arise out of the performance of their duties to the Fund. Additionally, in the normal course of business, the Fund enters into contracts, including the Fund’s servicing agreements, that contain a variety of indemnification clauses. The Fund’s maximum exposure under these arrangements is unknown as this would involve future claims that may be made against the Fund that have not yet occurred. The risk of material loss as a result of such indemnification claims is considered remote. |
| I. | Securities Lending – The Fund may lend portfolio securities having a market value up to one-third of the Fund’s total assets. Such loans are secured by collateral equal to no less than the market value of the loaned securities determined daily by the securities lending provider. Such collateral will be cash or debt securities issued or guaranteed by the U.S. Government or any of its sponsored agencies. Cash collateral received in connection with these loans is invested in short-term money market instruments or affiliated money market funds and is shown as such on the Schedule of Investments. The Fund bears the risk of loss with respect to the investment of collateral. It is the Fund’s policy to obtain additional collateral from or return excess collateral to the borrower by the end of the next business day, following the valuation date of the securities loaned. Therefore, the value of the collateral held may be temporarily less than the value of the securities on loan. When loaning securities, the Fund retains certain benefits of owning the securities, including the economic equivalent of dividends or interest generated by the security. Lending securities entails a risk of loss to the Fund if, and to the extent that, the market value of the securities loaned were to increase and the borrower did not increase the collateral accordingly, and the borrower failed to return the securities. The securities loaned are subject to termination at the option of the borrower or the Fund. Upon termination, the borrower will return to the Fund the securities loaned and the Fund will return the collateral. Upon the failure of the borrower to return the securities, collateral may be liquidated and the securities may be purchased on the open market to replace the loaned securities. The Fund could experience delays and costs in gaining access to the collateral and the securities may lose value during the delay which could result in potential losses to the Fund. Some of these losses may be indemnified by the lending agent. The Fund bears the risk of any deficiency in the amount of the collateral available for return to the borrower due to any loss on the collateral invested. Dividends received on cash collateral investments for securities lending transactions, which are net of compensation to counterparties, are included in Dividends from affiliated money market funds on the Statement of Operations. The aggregate value of securities out on loan, if any, is shown as a footnote on the Statement of Assets and Liabilities. |
| J. | Foreign Currency Translations – Foreign currency is valued at the close of the NYSE based on quotations posted by banks and major currency dealers. Portfolio securities and other assets and liabilities denominated in foreign currencies are translated into U.S. dollar amounts at the date of valuation. Purchases and sales of portfolio securities (net of foreign taxes withheld on disposition) and income items denominated in foreign currencies are translated into U.S. dollar amounts on the respective dates of such transactions. The Fund does not separately account for the portion of the results of operations resulting from changes in foreign exchange rates on investments and the fluctuations arising from changes in market prices of securities held. The combined results of changes in foreign exchange rates and the fluctuation of market prices on investments (net of estimated foreign tax withholding) are included with the net realized and unrealized gain or loss from investments in the Statement of Operations. Reported net realized foreign currency gains or losses arise from (1) sales of foreign currencies, (2) currency gains or losses realized between the trade and settlement dates on securities transactions, and (3) the difference between the amounts of dividends, interest, and foreign withholding taxes recorded on the Fund’s books and the U.S. dollar equivalent of the amounts actually received or paid. Net unrealized foreign currency gains and losses arise from changes in the fair values of assets and liabilities, other than investments in securities at fiscal period end, resulting from changes in exchange rates. |
The Fund may invest in foreign securities, which may be subject to foreign taxes on income, gains on investments or currency repatriation, a portion of which may be recoverable. Foreign taxes, if any, are recorded based on the tax regulations and rates that exist in the foreign markets in which the Fund invests and are shown in the Statement of Operations.
15 Invesco Small Cap Value Fund
| K. | Forward Foreign Currency Contracts — The Fund may engage in foreign currency transactions either on a spot (i.e. for prompt delivery and settlement) basis, or through forward foreign currency contracts, to manage or minimize currency or exchange rate risk. |
The Fund may also enter into forward foreign currency contracts for the purchase or sale of a security denominated in a foreign currency in order to “lock in” the U.S. dollar price of that security, or the Fund may also enter into forward foreign currency contracts that do not provide for physical settlement of the two currencies, but instead are settled by a single cash payment calculated as the difference between the agreed upon exchange rate and the spot rate at settlement based upon an agreed upon notional amount (non-deliverable forwards). The Fund will set aside liquid assets in an amount equal to the daily mark-to-market obligation for forward foreign currency contracts.
A forward foreign currency contract is an obligation between two parties (“Counterparties”) to purchase or sell a specific currency for an agreed-upon price at a future date. The use of forward foreign currency contracts does not eliminate fluctuations in the price of the underlying securities the Fund owns or intends to acquire but establishes a rate of exchange in advance. Fluctuations in the value of these contracts are measured by the difference in the contract date and reporting date exchange rates and are recorded as unrealized appreciation (depreciation) until the contracts are closed. When the contracts are closed, realized gains (losses) are recorded. Realized and unrealized gains (losses) on the contracts are included in the Statement of Operations. The primary risks associated with forward foreign currency contracts include failure of the Counterparty to meet the terms of the contract and the value of the foreign currency changing unfavorably. These risks may be in excess of the amounts reflected in the Statement of Assets and Liabilities.
| L. | COVID-19 Risk - The COVID-19 strain of coronavirus has resulted in instances of market closures and dislocations, extreme volatility, liquidity constraints and increased trading costs. Efforts to contain its spread have resulted in travel restrictions, disruptions of healthcare systems, business operations and supply chains, layoffs, lower consumer demand, and defaults, among other significant economic impacts that have disrupted global economic activity across many industries. Such economic impacts may exacerbate other pre-existing political, social and economic risks locally or globally. |
The ongoing effects of COVID-19 are unpredictable and may result in significant and prolonged effects on the Fund’s performance.
NOTE 2–Advisory Fees and Other Fees Paid to Affiliates
The Trust has entered into a master investment advisory agreement with Invesco Advisers, Inc. (the “Adviser” or “Invesco”). Under the terms of the investment advisory agreement, the Fund accrues daily and pays monthly an advisory fee to the Adviser based on the annual rate of the Fund’s average daily net assets as follows:
| | | | | | |
| Average Daily Net Assets | | Rate | |
First $ 500 million | | | 0.670 | % |
Next $ 500 million | | | 0.645 | % |
Over $ 1 billion | | | 0.620 | % |
For the year ended April 30, 2021, the effective advisory fee rate incurred by the Fund was 0.65%.
Under the terms of a master sub-advisory agreement between the Adviser and each of Invesco Asset Management Deutschland GmbH, Invesco Asset Management Limited, Invesco Asset Management (Japan) Limited, Invesco Hong Kong Limited, Invesco Senior Secured Management, Inc. and Invesco Canada Ltd. (collectively, the “Affiliated Sub-Advisers”) the Adviser, not the Fund, will pay 40% of the fees paid to the Adviser to any such Affiliated Sub-Adviser(s) that provide(s) discretionary investment management services to the Fund based on the percentage of assets allocated to such Affiliated Sub-Adviser(s).
The Adviser has contractually agreed, through May 31, 2021, to waive advisory fees and/or reimburse expenses of all shares to the extent necessary to limit total annual fund operating expenses after fee waiver and/or expense reimbursement (excluding certain items discussed below) of Class A, Class C, Class R, Class Y and Class R6 shares to 1.25%, 2.00%, 1.50%, 1.00% and 0.93%, respectively, of the Fund’s average daily net assets (the “expense limits”). Effective June 1, 2021 through at least June 30, 2022, the Adviser has contractually agreed to waive advisory fees and/or reimburse expenses of all shares to the extent necessary to limit total annual fund operating expenses after fee waiver and/or expense reimbursement (excluding certain items discussed below) of Class A, Class C, Class R, Class Y and Class R6 shares to 2.00%, 2.75%, 2.25%, 1.75% and 1.75%, respectively, of the Fund’s average daily net assets. In determining the Adviser’s obligation to waive advisory fees and/or reimburse expenses, the following expenses are not taken into account, and could cause the total annual fund operating expenses after fee waiver and/or expense reimbursement to exceed the numbers reflected above: (1) interest; (2) taxes; (3) dividend expense on short sales; (4) extraordinary or non-routine items, including litigation expenses; and (5) expenses that the Fund has incurred but did not actually pay because of an expense offset arrangement. Unless Invesco continues the fee waiver agreement, it will terminate on June 30, 2022. During its term, the fee waiver agreement cannot be terminated or amended to increase the expense limits or reduce the advisory fee waiver without approval of the Board of Trustees. The Adviser did not waive fees and/or reimburse expenses during the period under these expense limits.
Further, the Adviser has contractually agreed, through at least June 30, 2023, to waive the advisory fee payable by the Fund in an amount equal to 100% of the net advisory fees the Adviser receives from the affiliated money market funds on investments by the Fund of uninvested cash (excluding investments of cash collateral from securities lending) in such affiliated money market funds.
For the year ended April 30, 2021, the Adviser waived advisory fees of $18,474.
The Trust has entered into a master administrative services agreement with Invesco pursuant to which the Fund has agreed to pay Invesco for certain administrative costs incurred in providing accounting services to the Fund. For the year ended April 30, 2021, expenses incurred under the agreement are shown in the Statement of Operations as Administrative services fees. Invesco has entered into a sub-administration agreement whereby State Street Bank and Trust Company (“SSB”) serves as fund accountant and provides certain administrative services to the Fund. Pursuant to a custody agreement with the Trust on behalf of the Fund, SSB also serves as the Fund’s custodian.
The Trust has entered into a transfer agency and service agreement with Invesco Investment Services, Inc. (“IIS”) pursuant to which the Fund has agreed to pay IIS a fee for providing transfer agency and shareholder services to the Fund and reimburse IIS for certain expenses incurred by IIS in the course of providing such services. IIS may make payments to intermediaries that provide omnibus account services, sub-accounting services and/or networking services. All fees payable by IIS to intermediaries that provide omnibus account services or sub-accounting services are charged back to the Fund, subject to certain limitations approved by the Trust’s Board of Trustees. For the year ended April 30, 2021, expenses incurred under the agreement are shown in the Statement of Operations as Transfer agent fees.
The Trust has entered into master distribution agreements with Invesco Distributors, Inc.(“IDI”) to serve as the distributor for the Class A, Class C, Class R, Class Y and Class R6 shares of the Fund. The Trust has adopted plans pursuant to Rule 12b-1 under the 1940 Act with respect to the Fund’s Class A, Class C and Class R shares (collectively the “Plan”). The Fund, pursuant to the Plans, reimburses IDI for its allocated share of expenses incurred for the period, up to a maximum annual rate of 0.25% of the average daily net assets of Class A shares and up to a maximum annual rate of 1.00% of the average daily net assets of Class C shares. The Fund pursuant to the Class R Plan, pays IDI compensation at the annual rate of 0.50% of the average daily net assets of Class R shares. The fees are accrued daily and paid monthly. Of the Plan payments, up to 0.25% of the average daily net assets of each class of shares may be paid to furnish continuing personal shareholder services to customers who purchase and own shares of such classes. Any amounts not paid as a service fee under the Plan would constitute an asset-based sales charge. Rules of the Financial Industry Regulatory Authority (“FINRA”) impose a cap on the total sales charges, including asset-based sales charges, that may be paid by any class of shares of the Fund. For the year ended April 30, 2021, expenses incurred under the Plans are shown in the Statement of Operations as Distribution fees.
Front-end sales commissions and CDSC (collectively, the “sales charges”) are not recorded as expenses of the Fund. Front-end sales commissions are deducted from proceeds from the sales of Fund shares prior to investment in Class A shares of the Fund. CDSC are deducted from redemption proceeds prior to remittance to the
16 Invesco Small Cap Value Fund
shareholder. During the year ended April 30, 2021, IDI advised the Fund that IDI retained $44,644 in front-end sales commissions from the sale of Class A shares and $939 and $639 from Class A and Class C shares, respectively, for CDSC imposed upon redemptions by shareholders.
For the year ended April 30, 2021, the Fund incurred $3,023 in brokerage commissions with Invesco Capital Markets, Inc., an affiliate of the Adviser and IDI, for portfolio transactions executed on behalf of the Fund.
Certain officers and trustees of the Trust are officers and directors of the Adviser, IIS and/or IDI.
NOTE 3–Additional Valuation Information
GAAP defines fair value as the price that would be received to sell an asset or paid to transfer a liability in an orderly transaction between market participants at the measurement date, under current market conditions. GAAP establishes a hierarchy that prioritizes the inputs to valuation methods, giving the highest priority to readily available unadjusted quoted prices in an active market for identical assets (Level 1) and the lowest priority to significant unobservable inputs (Level 3), generally when market prices are not readily available or are unreliable. Based on the valuation inputs, the securities or other investments are tiered into one of three levels. Changes in valuation methods may result in transfers in or out of an investment’s assigned level:
| | | | |
Level 1 | | - | | Prices are determined using quoted prices in an active market for identical assets. |
Level 2 | | - | | Prices are determined using other significant observable inputs. Observable inputs are inputs that other market participants may use in pricing a security. These may include quoted prices for similar securities, interest rates, prepayment speeds, credit risk, yield curves, loss severities, default rates, discount rates, volatilities and others. |
Level 3 | | - | | Prices are determined using significant unobservable inputs. In situations where quoted prices or observable inputs are unavailable (for example, when there is little or no market activity for an investment at the end of the period), unobservable inputs may be used. Unobservable inputs reflect the Fund’s own assumptions about the factors market participants would use in determining fair value of the securities or instruments and would be based on the best available information. |
The following is a summary of the tiered valuation input levels, as of April 30, 2021. The level assigned to the securities valuations may not be an indication of the risk or liquidity associated with investing in those securities. Because of the inherent uncertainties of valuation, the values reflected in the financial statements may materially differ from the value received upon actual sale of those investments.
| | | | | | | | | | | | | | | | |
| | | Level 1 | | | Level 2 | | | Level 3 | | | Total | |
Investments in Securities | | | | | | | | | | | | | | | | |
Common Stocks & Other Equity Interests | | | $1,552,091,101 | | | | $15,428,796 | | | | $– | | | | $1,567,519,897 | |
Money Market Funds | | | 48,111,920 | | | | – | | | | – | | | | 48,111,920 | |
Total Investments | | | $1,600,203,021 | | | | $15,428,796 | | | | $– | | | | $1,615,631,817 | |
NOTE 4–Expense Offset Arrangement(s)
The expense offset arrangement is comprised of transfer agency credits which result from balances in demand deposit accounts used by the transfer agent for clearing shareholder transactions. For the year ended April 30, 2021, the Fund received credits from this arrangement, which resulted in the reduction of the Fund’s total expenses of $218.
NOTE 5–Trustees’ and Officers’ Fees and Benefits
Trustees’ and Officers’ Fees and Benefits include amounts accrued by the Fund to pay remuneration to certain Trustees and Officers of the Fund. Trustees have the option to defer compensation payable by the Fund, and Trustees’ and Officers’ Fees and Benefits also include amounts accrued by the Fund to fund such deferred compensation amounts. Those Trustees who defer compensation have the option to select various Invesco Funds in which their deferral accounts shall be deemed to be invested. Finally, certain current Trustees were eligible to participate in a retirement plan that provided for benefits to be paid upon retirement to Trustees over a period of time based on the number of years of service. The Fund may have certain former Trustees who also participate in a retirement plan and receive benefits under such plan. Trustees’ and Officers’ Fees and Benefits include amounts accrued by the Fund to fund such retirement benefits. Obligations under the deferred compensation and retirement plans represent unsecured claims against the general assets of the Fund.
NOTE 6–Cash Balances
The Fund is permitted to temporarily carry a negative or overdrawn balance in its account with SSB, the custodian bank. Such balances, if any at period-end, are shown in the Statement of Assets and Liabilities under the payable caption Amount due custodian. To compensate the custodian bank for such overdrafts, the overdrawn Fund may either (1) leave funds as a compensating balance in the account so the custodian bank can be compensated by earning the additional interest; or (2) compensate by paying the custodian bank at a rate agreed upon by the custodian bank and Invesco, not to exceed the contractually agreed upon rate. The Fund may not purchase additional securities when any borrowings from banks or broker-dealers exceed 5% of the Fund’s total assets, or when any borrowings from an Invesco Fund are outstanding.
NOTE 7–Distributions to Shareholders and Tax Components of Net Assets
Tax Character of Distributions to Shareholders Paid During the Fiscal Years Ended April 30, 2021 and April 30, 2020:
| | | | | | | | |
| | | 2021 | | | 2020 | |
| |
Ordinary income* | | $ | 4,235,595 | | | $ | 3,775,639 | |
| |
Long-term capital gain | | | – | | | | 29,462,465 | |
| |
Total distributions | | $ | 4,235,595 | | | $ | 33,238,104 | |
| |
| * | Includes short-term capital gain distributions, if any. |
17 Invesco Small Cap Value Fund
| | | | |
| Tax Components of Net Assets at Period-End: | | | | |
| |
| | | 2021 | |
| |
Undistributed ordinary income | | $ | 82,663,126 | |
| |
Net unrealized appreciation – investments | | | 452,912,178 | |
| |
Net unrealized appreciation - foreign currencies | | | 1,600 | |
| |
Temporary book/tax differences | | | (204,298 | ) |
| |
Capital loss carryforward | | | (7,305,953 | ) |
| |
Shares of beneficial interest | | | 1,076,396,816 | |
| |
Total net assets | | $ | 1,604,463,469 | |
| |
The difference between book-basis and tax-basis unrealized appreciation (depreciation) is due to differences in the timing of recognition of gains and losses on investments for tax and book purposes. The Fund’s net unrealized appreciation (depreciation) difference is attributable primarily to wash sales.
The temporary book/tax differences are a result of timing differences between book and tax recognition of income and/or expenses. The Fund’s temporary book/tax differences are the result of the trustee deferral of compensation and retirement plan benefits.
Capital loss carryforward is calculated and reported as of a specific date. Results of transactions and other activity after that date may affect the amount of capital loss carryforward actually available for the Fund to utilize. The ability to utilize capital loss carryforward in the future may be limited under the Internal Revenue Code and related regulations based on the results of future transactions.
The Fund has a capital loss carryforward as of April 30, 2021, as follows:
| | | | | | | | | | | | |
| Capital Loss Carryforward* | |
| Expiration | | Short-Term | | | Long-Term | | | Total | |
Not subject to expiration | | $ | 6,186,470 | | | $ | 1,119,483 | | | $ | 7,305,953 | |
| * | Capital loss carryforward is reduced for limitations, if any, to the extent required by the Internal Revenue Code and may be further limited depending upon a variety of factors, including the realization of net unrealized gains or losses as of the date of any reorganization. |
NOTE 8–Investment Transactions
The aggregate amount of investment securities (other than short-term securities, U.S. Government obligations and money market funds, if any) purchased and sold by the Fund during the year ended April 30, 2021 was $773,018,880 and $970,381,680, respectively. Cost of investments, including any derivatives, on a tax basis includes the adjustments for financial reporting purposes as of the most recently completed federal income tax reporting period-end.
| | | | |
| Unrealized Appreciation (Depreciation) of Investments on a Tax Basis | |
| |
Aggregate unrealized appreciation of investments | | $ | 474,404,691 | |
| |
Aggregate unrealized (depreciation) of investments | | | (21,492,513 | ) |
| |
Net unrealized appreciation of investments | | $ | 452,912,178 | |
| |
| |
Cost of investments for tax purposes is $1,162,719,639. | | | | |
NOTE 9–Reclassification of Permanent Differences
Primarily as a result of differing book/tax treatment of foreign currency transactions, on April 30, 2021, undistributed net investment income was decreased by $24,001 and undistributed net realized gain was increased by $24,001. This reclassification had no effect on the net assets or the distributable earnings of the Fund.
NOTE 10–Share Information
| | | | | | | | | | | | | | | | |
| | | | | | Summary of Share Activity | | | | |
| |
| | | Year ended | | | Year ended | |
| | | April 30, 2021(a) | | | April 30, 2020 | |
| | | Shares | | | Amount | | | Shares | | | Amount | |
| |
Sold: | | | | | | | | | | | | | | | | |
Class A | | | 6,227,887 | | | $ | 98,369,182 | | | | 5,513,281 | | | $ | 65,029,289 | |
| |
Class C | | | 561,486 | | | | 5,724,965 | | | | 257,674 | | | | 1,809,377 | |
| |
Class R | | | 117,727 | | | | 1,782,219 | | | | 997 | | | | 8,461 | |
| |
Class Y | | | 19,071,538 | | | | 311,052,778 | | | | 10,879,758 | | | | 128,592,730 | |
| |
Class R6 | | | 1,774,422 | | | | 29,608,981 | | | | 2,524,904 | | | | 27,936,888 | |
| |
| | | | |
Issued as reinvestment of dividends: | | | | | | | | | | | | | | | | |
Class A | | | 96,777 | | | | 1,487,466 | | | | 968,857 | | | | 13,670,573 | |
| |
Class C | | | 1,976 | | | | 18,775 | | | | 60,377 | | | | 529,507 | |
| |
Class R | | | 909 | | | | 13,957 | | | | - | | | | - | |
| |
Class Y | | | 120,209 | | | | 1,969,029 | | | | 982,726 | | | | 14,760,539 | |
| |
Class R6 | | | 14,850 | | | | 244,727 | | | | 111,445 | | | | 1,682,825 | |
| |
| | | | |
Automatic conversion of Class C shares to Class A shares: | | | | | | | | | | | | | | | | |
Class A | | | 303,835 | | | | 4,046,391 | | | | 545,253 | | | | 6,869,152 | |
| |
Class C | | | (491,149 | ) | | | (4,046,391 | ) | | | (868,496 | ) | | | (6,869,152 | ) |
| |
18 Invesco Small Cap Value Fund
| | | | | | | | | | | | | | | | |
| | | | | | Summary of Share Activity | | | | |
| |
| | | Year ended | | | Year ended | |
| | | April 30, 2021(a) | | | April 30, 2020 | |
| | | Shares | | | Amount | | | Shares | | | Amount | |
| | | | |
Issued in connection with acquisitions:(b) | | | | | | | | | | | | | | | | |
Class A | | | - | | | $ | - | | | | 1,439,465 | | | $ | 12,226,769 | |
| |
Class C | | | - | | | | - | | | | 508,981 | | | | 2,679,898 | |
| |
Class R | | | - | | | | - | | | | 402,791 | | | | 3,420,152 | |
| |
Class Y | | | - | | | | - | | | | 149,197 | | | | 1,349,862 | |
| |
Class R6 | | | - | | | | - | | | | 2,554 | | | | 23,256 | |
| |
| | | | |
Reacquired: | | | | | | | | | | | | | | | | |
Class A | | | (12,352,476 | ) | | | (165,804,840 | ) | | | (16,723,769 | ) | | | (208,999,550 | ) |
| |
Class C | | | (401,914 | ) | | | (3,384,324 | ) | | | (729,153 | ) | | | (5,936,262 | ) |
| |
Class R | | | (81,102 | ) | | | (1,167,624 | ) | | | (1,667 | ) | | | (13,735 | ) |
| |
Class Y | | | (27,339,713 | ) | | | (406,758,847 | ) | | | (25,902,782 | ) | | | (342,491,687 | ) |
| |
Class R6 | | | (4,171,170 | ) | | | (54,593,975 | ) | | | (1,114,436 | ) | | | (15,116,164 | ) |
| |
Net increase (decrease) in share activity | | | (16,545,908 | ) | | $ | (181,437,531 | ) | | | (20,992,043 | ) | | $ | (298,837,272 | ) |
| |
| (a) | There are entities that are record owners of more than 5% of the outstanding shares of the Fund and in the aggregate own 29% of the outstanding shares of the Fund. IDI has an agreement with these entities to sell Fund shares. The Fund, Invesco and/or Invesco affiliates may make payments to these entities, which are considered to be related to the Fund, for providing services to the Fund, Invesco and/or Invesco affiliates including but not limited to services such as securities brokerage, distribution, third party record keeping and account servicing. The Fund has no knowledge as to whether all or any portion of the shares owned of record by these entities are also owned beneficially. |
| (b) | After the close of business on April 17, 2020, the Fund acquired all the net assets of Invesco Oppenheimer Small Cap Value Fund (the “Target Fund”) pursuant to a plan of reorganization approved by the Board of Trustees of the Fund on February 14, 2020. The reorganization was executed in order to reduce overlap and increase efficiencies in the Adviser’s product line. The acquisition was accomplished by a tax-free exchange of 2,502,988 shares of the Fund for 2,861,156 shares outstanding of the Target Fund as of the close of business on April 17, 2020. Shares of the Target Fund were exchanged for the like class of shares of the Fund, based on the relative net asset value of the Target Fund to the net asset value of the Fund on the close of business, April 17, 2020. The Target Fund’s net assets as of the close of business on April 17, 2020 of $19,699,937, including $(6,059,914) of unrealized appreciation (depreciation), were combined with those of the Fund. The net assets of the Fund immediately before the acquisition were $775,042,726 and $794,742,663 immediately after the acquisition. |
The pro forma results of operations for the year ended April 30, 2020 assuming the reorganization had been completed on May 1, 2019, the beginning of the annual reporting period are as follows:
| | | | |
Net investment income | | $ | 3,901,731 | |
| |
Net realized/unrealized gains (losses) | | | (405,370,942 | ) |
| |
Change in net assets resulting from operations | | $ | (401,469,211 | ) |
| |
As the combined investment portfolios have been managed as a single integrated portfolio since the acquisition was completed, it is not practicable to separate the amounts of revenue and earnings of the Target Fund that has been included in the Fund’s Statement of Operations since April 18, 2020.
19 Invesco Small Cap Value Fund
Report of Independent Registered Public Accounting Firm
To the Board of Trustees of AIM Sector Funds (Invesco Sector Funds) and Shareholders of Invesco Small Cap Value Fund
Opinion on the Financial Statements
We have audited the accompanying statement of assets and liabilities, including the schedule of investments, of Invesco Small Cap Value Fund (one of the funds constituting AIM Sector Funds (Invesco Sector Funds), referred to hereafter as the “Fund”) as of April 30, 2021, the related statement of operations for the year ended April 30, 2021, the statement of changes in net assets for each of the two years in the period ended April 30, 2021, including the related notes, and the financial highlights for each of the periods indicated therein (collectively referred to as the “financial statements”). In our opinion, the financial statements present fairly, in all material respects, the financial position of the Fund as of April 30, 2021, the results of its operations for the year then ended, the changes in its net assets for each of the two years in the period ended April 30, 2021 and the financial highlights for each of the periods indicated therein in conformity with accounting principles generally accepted in the United States of America.
Basis for Opinion
These financial statements are the responsibility of the Fund’s management. Our responsibility is to express an opinion on the Fund’s financial statements based on our audits. We are a public accounting firm registered with the Public Company Accounting Oversight Board (United States) (PCAOB) and are required to be independent with respect to the Fund in accordance with the U.S. federal securities laws and the applicable rules and regulations of the Securities and Exchange Commission and the PCAOB.
We conducted our audits of these financial statements in accordance with the standards of the PCAOB. Those standards require that we plan and perform the audit to obtain reasonable assurance about whether the financial statements are free of material misstatement, whether due to error or fraud.
Our audits included performing procedures to assess the risks of material misstatement of the financial statements, whether due to error or fraud, and performing procedures that respond to those risks. Such procedures included examining, on a test basis, evidence regarding the amounts and disclosures in the financial statements. Our audits also included evaluating the accounting principles used and significant estimates made by management, as well as evaluating the overall presentation of the financial statements. Our procedures included confirmation of securities owned as of April 30, 2021 by correspondence with the custodian, transfer agent and brokers; when replies were not received from brokers, we performed other auditing procedures. We believe that our audits provide a reasonable basis for our opinion.
/s/PricewaterhouseCoopers LLP
Houston, Texas
June 24, 2021
We have served as the auditor of one or more investment companies in the Invesco group of investment companies since at least 1995. We have not been able to determine the specific year we began serving as auditor.
20 Invesco Small Cap Value Fund
Calculating your ongoing Fund expenses
Example
As a shareholder of the Fund, you incur two types of costs: (1) transaction costs, which may include sales charges (loads) on purchase payments or contingent deferred sales charges on redemptions, if any; and (2) ongoing costs, including management fees, distribution and/or service (12b-1) fees, and other Fund expenses. This example is intended to help you understand your ongoing costs (in dollars) of investing in the Fund and to compare these costs with ongoing costs of investing in other mutual funds. The example is based on an investment of $1,000 invested at the beginning of the period and held for the entire period November 1, 2020 through April 30, 2021.
Actual expenses
The table below provides information about actual account values and actual expenses. You may use the information in this table, together with the amount you invested, to estimate the expenses that you paid over the period. Simply divide your account value by $1,000 (for example, an $8,600 account value divided by $1,000 = 8.6), then multiply the result by the number in the table under the heading entitled “Actual Expenses Paid During Period” to estimate the expenses you paid on your account during this period.
Hypothetical example for comparison purposes
The table below also provides information about hypothetical account values and hypothetical expenses based on the Fund’s actual expense ratio and an assumed rate of return of 5% per year before expenses, which is not the Fund’s actual return.
The hypothetical account values and expenses may not be used to estimate the actual ending account balance or expenses you paid for the period. You may use this information to compare the ongoing costs of investing in the Fund and other funds. To do so, compare this 5% hypothetical example with the 5% hypothetical examples that appear in the shareholder reports of the other funds.
Please note that the expenses shown in the table are meant to highlight your ongoing costs only and do not reflect any transaction costs, such as sales charges (loads) on purchase payments or contingent deferred sales charges on redemptions, if any. Therefore, the hypothetical information is useful in comparing ongoing costs only, and will not help you determine the relative total costs of owning different funds. In addition, if these transaction costs were included, your costs would have been higher.
| | | | | | | | | | | | |
| | | Beginning Account Value
(11/01/20) | | ACTUAL | | HYPOTHETICAL
(5% annual return before
expenses) | | Annualized Expense Ratio |
| | Ending Account Value
(04/30/21)1 | | Expenses Paid During
Period2 | | Ending Account Value
(04/30/21) | | Expenses Paid During
Period2 |
Class A | | $1,000.00 | | $1,737.70 | | $7.47 | | $1,019.34 | | $5.51 | | 1.10% |
Class C | | 1,000.00 | | 1,732.10 | | 12.46 | | 1,015.67 | | 9.20 | | 1.84 |
Class R | | 1,000.00 | | 1,736.30 | | 9.16 | | 1,018.10 | | 6.76 | | 1.35 |
Class Y | | 1,000.00 | | 1,739.90 | | 5.77 | | 1,020.58 | | 4.26 | | 0.85 |
Class R6 | | 1,000.00 | | 1,741.60 | | 4.83 | | 1,021.27 | | 3.56 | | 0.71 |
| 1 | The actual ending account value is based on the actual total return of the Fund for the period November 1, 2020 through April 30, 2021, after actual expenses and will differ from the hypothetical ending account value which is based on the Fund’s expense ratio and a hypothetical annual return of 5% before expenses. |
| 2 | Expenses are equal to the Fund’s annualized expense ratio as indicated above multiplied by the average account value over the period, multiplied by 181/365 to reflect the most recent fiscal half year. |
21 Invesco Small Cap Value Fund
Tax Information
Form 1099-DIV, Form 1042-S and other year–end tax information provide shareholders with actual calendar year amounts that should be included in their tax returns. Shareholders should consult their tax advisers.
The following distribution information is being provided as required by the Internal Revenue Code or to meet a specific state’s requirement.
The Fund designates the following amounts or, if subsequently determined to be different, the maximum amount allowable for its fiscal year ended April 30, 2021:
| | | | | | |
| | | | | | |
Federal and State Income Tax | | | | |
Qualified Dividend Income* | | | 17.39 | % |
Corporate Dividends Received Deduction* | | | 16.53 | % |
Business Interest Income* | | | 0.01 | % |
Qualified Business Income* | | | 0.00 | % |
U.S. Treasury Obligations* | | | 0.00 | % |
| | * | The above percentages are based on ordinary income dividends paid to shareholders during the Fund’s fiscal year. |
22 Invesco Small Cap Value Fund
Trustees and Officers
The address of each trustee and officer is AIM Sector Funds (Invesco Sector Funds) (the “Trust”), 11 Greenway Plaza, Suite 1000, Houston, Texas 77046-1173. The trustees serve for the life of the Trust, subject to their earlier death, incapacitation, resignation, retirement or removal as more specifically provided in the Trust’s organizational documents. Each officer serves for a one year term or until their successors are elected and qualified. Column two below includes length of time served with predecessor entities, if any.
| | | | | | | | | | | | |
Name, Year of Birth and
Position(s) Held with the Trust | | Trustee and/or
Officer Since | | | Principal Occupation(s) During Past 5 Years | | Number of
Funds in
Fund Complex
Overseen by
Trustee | | | Other Directorship(s) Held by Trustee During Past 5 Years |
Interested Trustee | | | | | | | | | | | | |
Martin L. Flanagan1 – 1960 Trustee and Vice Chair | | | 2007 | | | Executive Director, Chief Executive Officer and President, Invesco Ltd. (ultimate parent of Invesco and a global investment management firm); Trustee and Vice Chair, The Invesco Funds; Vice Chair, Investment Company Institute; and Member of Executive Board, SMU Cox School of Business Formerly: Advisor to the Board, Invesco Advisers, Inc. (formerly known as Invesco Institutional (N.A.), Inc.); Chairman and Chief Executive Officer, Invesco Advisers, Inc. (registered investment adviser); Director, Chairman, Chief Executive Officer and President, Invesco Holding Company (US), Inc. (formerly IVZ Inc.) (holding company), Invesco Group Services, Inc. (service provider) and Invesco North American Holdings, Inc. (holding company); Director, Chief Executive Officer and President, Invesco Holding Company Limited (parent of Invesco and a global investment management firm); Director, Invesco Ltd.; Chairman, Investment Company Institute and President, Co-Chief Executive Officer, Co-President, Chief Operating Officer and Chief Financial Officer, Franklin Resources, Inc. (global investment management organization) | | | 184 | | | None |
| 1 | Mr. Flanagan is considered an interested person (within the meaning of Section 2(a)(19) of the 1940 Act) of the Trust because he is an officer of the Adviser to the Trust, and an officer and a director of Invesco Ltd., ultimate parent of the Adviser. |
T-1 Invesco Small Cap Value Fund
Trustees and Officers–(continued)
| | | | | | | | |
Name, Year of Birth and
Position(s) Held with the Trust | | Trustee and/or Officer Since | | Principal Occupation(s) During Past 5 Years | | Number of Funds in Fund Complex Overseen by Trustee | | Other Directorship(s) Held by Trustee During Past 5 Years |
Independent Trustees |
Christopher L. Wilson – 1957 Trustee and Chair | | 2017 | | Retired Formerly: Director, TD Asset Management USA Inc. (mutual fund complex) (22 portfolios); Managing Partner, CT2, LLC (investing and consulting firm); President/Chief Executive Officer, Columbia Funds, Bank of America Corporation; President/Chief Executive Officer, CDC IXIS Asset Management Services, Inc.; Principal & Director of Operations, Scudder Funds, Scudder, Stevens & Clark, Inc.; Assistant Vice President, Fidelity Investments | | 184 | | enaible, Inc. (artificial intelligence technology); Director, ISO New England, Inc. (non-profit organization managing regional electricity market) |
Beth Ann Brown – 1968 Trustee | | 2019 | | Independent Consultant Formerly: Head of Intermediary Distribution, Managing Director, Strategic Relations, Managing Director, Head of National Accounts, Senior Vice President, National Account Manager and Senior Vice President, Key Account Manager, Columbia Management Investment Advisers LLC; Vice President, Key Account Manager, Liberty Funds Distributor, Inc.; and Trustee of certain Oppenheimer Funds | | 184 | | Director, Board of Directors of Caron Engineering Inc.; Advisor, Board of Advisors of Caron Engineering Inc.; President and Director, Acton Shapleigh Youth Conservation Corps (non - profit); and President and Director of Grahamtastic Connection (non-profit) |
Jack M. Fields – 1952 Trustee | | 2003 | | Chief Executive Officer, Twenty First Century Group, Inc. (government affairs company); and Board Member, Impact(Ed) (non-profit) Formerly: Owner and Chief Executive Officer, Dos Angeles Ranch L.P. (cattle, hunting, corporate entertainment); Director, Insperity, Inc. (formerly known as Administaff) (human resources provider); Chief Executive Officer, Texana Timber LP (sustainable forestry company); Director of Cross Timbers Quail Research Ranch (non-profit); and member of the U.S. House of Representatives | | 184 | | Member, Board of Directors of Baylor College of Medicine |
Cynthia Hostetler –1962 Trustee | | 2017 | | Non-Executive Director and Trustee of a number of public and private business corporations Formerly: Director, Aberdeen Investment Funds (4 portfolios); Director, Artio Global Investment LLC (mutual fund complex); Director, Edgen Group, Inc. (specialized energy and infrastructure products distributor); Head of Investment Funds and Private Equity, Overseas Private Investment Corporation; President, First Manhattan Bancorporation, Inc.; Attorney, Simpson Thacher & Bartlett LLP | | 184 | | Resideo Technologies, Inc. (smart home technology); Vulcan Materials Company (construction materials company); Trilinc Global Impact Fund; Genesee & Wyoming, Inc. (railroads); Investment Company Institute (professional organization); Independent Directors Council (professional organization); Eisenhower Foundation (non-profit) |
Eli Jones – 1961 Trustee | | 2016 | | Professor and Dean, Mays Business School - Texas A&M University Formerly: Professor and Dean, Walton College of Business, University of Arkansas and E.J. Ourso College of Business, Louisiana State University; Director, Arvest Bank | | 184 | | Insperity, Inc. (formerly known as Administaff) (human resources provider) |
T-2 Invesco Small Cap Value Fund
Trustees and Officers–(continued)
| | | | | | | | |
Name, Year of Birth and
Position(s) Held with the Trust | | Trustee and/or Officer Since | | Principal Occupation(s) During Past 5 Years | | Number of Funds in Fund Complex Overseen by Trustee | | Other Directorship(s) Held by Trustee During Past 5 Years |
Independent Trustees–(continued) | | | | |
Elizabeth Krentzman – 1959 Trustee | | 2019 | | Formerly: Principal and Chief Regulatory Advisor for Asset Management Services and U.S. Mutual Fund Leader of Deloitte & Touche LLP; General Counsel of the Investment Company Institute (trade association); National Director of the Investment Management Regulatory Consulting Practice, Principal, Director and Senior Manager of Deloitte & Touche LLP; Assistant Director of the Division of Investment Management - Office of Disclosure and Investment Adviser Regulation of the U.S. Securities and Exchange Commission and various positions with the Division of Investment Management – Office of Regulatory Policy of the U.S. Securities and Exchange Commission; Associate at Ropes & Gray LLP; and Trustee of certain Oppenheimer Funds | | 184 | | Trustee of the University of Florida National Board Foundation; Member of the Carita Funds Board of Directors (private investment funds); Member of the University of Florida Law Center Association, Inc. Board of Trustees and Audit Committee Member |
Anthony J. LaCava, Jr. – 1956 Trustee | | 2019 | | Formerly: Director and Member of the Audit Committee, Blue Hills Bank (publicly traded financial institution) and Managing Partner, KPMG LLP | | 184 | | Blue Hills Bank; Chairman, Bentley University; Member, Business School Advisory Council; and Nominating Committee KPMG LLP |
Prema Mathai-Davis – 1950 Trustee | | 2003 | | Retired Formerly: Co-Founder & Partner of Quantalytics Research, LLC, (a FinTech Investment Research Platform for the Self-Directed Investor); Trustee of YWCA Retirement Fund; CEO of YWCA of the USA; Board member of the NY Metropolitan Transportation Authority; Commissioner of the NYC Department of Aging; Board member of Johns Hopkins Bioethics Institute | | 184 | | None |
Joel W. Motley – 1952 Trustee | | 2019 | | Director of Office of Finance, Federal Home Loan Bank System; Managing Director of Carmona Motley Inc. (privately held financial advisor); Member of the Council on Foreign Relations and its Finance and Budget Committee; Chairman Emeritus of Board of Human Rights Watch and Member of its Investment Committee; and Member of Investment Committee and Board of Historic Hudson Valley (non-profit cultural organization) Formerly: Managing Director of Public Capital Advisors, LLC (privately held financial advisor); Managing Director of Carmona Motley Hoffman, Inc. (privately held financial advisor); Trustee of certain Oppenheimer Funds; Director of Columbia Equity Financial Corp. (privately held financial advisor); and Member of the Vestry of Trinity Church Wall Street | | 184 | | Member of Board of Greenwall Foundation (bioethics research foundation) and its Investment Committee; Member of Board of Friends of the LRC (non-profit legal advocacy); Board Member and Investment Committee Member of Pulitzer Center for Crisis Reporting (non-profit journalism) |
Teresa M. Ressel – 1962 Trustee | | 2017 | | Non-executive director and trustee of a number of public and private business corporations Formerly: Chief Executive Officer, UBS Securities LLC (investment banking); Chief Operating Officer, UBS AG Americas (investment banking); Sr. Management Team Olayan America, The Olayan Group (international investor/commercial/industrial); Assistant Secretary for Management & Budget and Designated Chief Financial Officer, U.S. Department of Treasury; Director, Atlantic Power Corporation (power generation company) and ON Semiconductor Corporation (semiconductor manufacturing) | | 184 | | Elucida Oncology (nanotechnology & medical particles company) |
T-3 Invesco Small Cap Value Fund
Trustees and Officers–(continued)
| | | | | | | | |
Name, Year of Birth and
Position(s) Held with the Trust | | Trustee
and/or
Officer
Since | | Principal Occupation(s) During Past 5 Years | | Number of Funds in Fund Complex Overseen by Trustee | | Other Directorship(s) Held by Trustee During Past 5 Years |
Independent Trustees–(continued) |
Ann Barnett Stern – 1957 Trustee | | 2017 | | President, Chief Executive Officer and Board Member, Houston Endowment, Inc. a private philanthropic institution Formerly: Executive Vice President, Texas Children’s Hospital; Vice President, General Counsel and Corporate Compliance Officer, Texas Children’s Hospital; Attorney at Beck, Redden and Secrest, LLP and Andrews and Kurth LLP | | 184 | | Director and Audit Committee member of Federal Reserve Bank of Dallas; Trustee and Board Chair of Good Reason Houston (nonprofit); Trustee, Vice Chair, Chair of Nomination/Governance Committee, Chair of Personnel Committee of Holdsworth Center (nonprofit); Trustee and Investment Committee member of University of Texas Law School Foundation (nonprofit); Board Member of Greater Houston Partnership |
Robert C. Troccoli – 1949 Trustee | | 2016 | | Retired Formerly: Adjunct Professor, University of Denver – Daniels College of Business; and Managing Partner, KPMG LLP | | 184 | | None |
Daniel S. Vandivort –1954 Trustee | | 2019 | | Trustee, Board of Trustees, Huntington Disease Foundation of America; and President, Flyway Advisory Services LLC (consulting and property management) Formerly: Trustee and Governance Chair, of certain Oppenheimer Funds; and Treasurer, Chairman of the Audit and Finance Committee, Huntington Disease Foundation of America | | 184 | | None |
James D. Vaughn – 1945 Trustee | | 2019 | | Retired Formerly: Managing Partner, Deloitte & Touche LLP; Trustee and Chairman of the Audit Committee, Schroder Funds; Board Member, Mile High United Way, Boys and Girls Clubs, Boy Scouts, Colorado Business Committee for the Arts, Economic Club of Colorado and Metro Denver Network (economic development corporation); and Trustee of certain Oppenheimer Funds | | 184 | | Board member and Chairman of Audit Committee of AMG National Trust Bank; Trustee and Investment Committee member, University of South Dakota Foundation; Board member, Audit Committee Member and past Board Chair, Junior Achievement (non-profit) |
T-4 Invesco Small Cap Value Fund
Trustees and Officers–(continued)
| | | | | | | | |
Name, Year of Birth and
Position(s) Held with the Trust | | Trustee
and/or
Officer
Since | | Principal Occupation(s) During Past 5 Years | | Number of Funds in Fund Complex
Overseen by
Trustee | | Other Directorship(s) Held by Trustee During Past 5 Years |
Officers |
Sheri Morris – 1964 President and Principal Executive Officer | | 2003 | | Head of Global Fund Services, Invesco Ltd.; President and Principal Executive Officer, The Invesco Funds; Senior Vice President, Invesco Advisers, Inc. (formerly known as Invesco Institutional (N.A.), Inc.) (registered investment adviser); and Vice President, Invesco Exchange-Traded Fund Trust, Invesco Exchange-Traded Fund Trust II, Invesco India Exchange-Traded Fund Trust, Invesco Actively Managed Exchange-Traded Fund Trust, Invesco Actively Managed Exchange-Traded Commodity Fund Trust and Invesco Exchange-Traded Self-Indexed Fund Trust; and Vice President, OppenheimerFunds, Inc. Formerly: Vice President, Treasurer and Principal Financial Officer, The Invesco Funds; Vice President, Invesco AIM Advisers, Inc., Invesco AIM Capital Management, Inc. and Invesco AIM Private Asset Management, Inc.; Assistant Vice President and Assistant Treasurer, The Invesco Funds; Vice President and Assistant Vice President, Invesco Advisers, Inc.; Assistant Vice President, Invesco AIM Capital Management, Inc. and Invesco AIM Private Asset Management, Inc.; and Treasurer, Invesco Exchange-Traded Fund Trust, Invesco Exchange-Traded Fund Trust II, Invesco India Exchange-Traded Fund Trust and Invesco Actively Managed Exchange-Traded Fund Trust | | N/A | | N/A |
Russell C. Burk – 1958 Senior Vice President and Senior Officer | | 2005 | | Senior Vice President and Senior Officer, The Invesco Funds | | N/A | | N/A |
Jeffrey H. Kupor – 1968 Senior Vice President, Chief Legal Officer and Secretary | | 2018 | | Head of Legal of the Americas, Invesco Ltd.; Senior Vice President and Secretary, Invesco Advisers, Inc. (formerly known as Invesco Institutional (N.A.), Inc.) (registered investment adviser); Senior Vice President and Secretary, Invesco Distributors, Inc. (formerly known as Invesco AIM Distributors, Inc.); Vice President and Secretary, Invesco Investment Services, Inc. (formerly known as Invesco AIM Investment Services, Inc.) Senior Vice President, Chief Legal Officer and Secretary, The Invesco Funds; Secretary and General Counsel, Invesco Investment Advisers LLC (formerly known as Van Kampen Asset Management); Secretary and General Counsel, Invesco Capital Markets, Inc. (formerly known as Van Kampen Funds Inc.) and Chief Legal Officer, Invesco Exchange-Traded Fund Trust, Invesco Exchange-Traded Fund Trust II, Invesco India Exchange-Traded Fund Trust, Invesco Actively Managed Exchange-Traded Fund Trust, Invesco Actively Managed Exchange-Traded Commodity Fund Trust and Invesco Exchange-Traded Self-Indexed Fund Trust; Secretary, Invesco Indexing LLC; Secretary, W.L. Ross & Co., LLC ; Secretary and Vice President, Harbourview Asset Management Corporation; Secretary and Vice President, OppenheimerFunds, Inc. and Invesco Managed Accounts, LLC; Secretary and Senior Vice President, OFI Global Institutional, Inc.; Secretary and Vice President, OFI SteelPath, Inc.; Secretary and Vice President, Oppenheimer Acquisition Corp.; Secretary and Vice President, Shareholder Services, Inc.; Secretary and Vice President, Trinity Investment Management Corporation Formerly: Secretary and Vice President, Jemstep, Inc.; Head of Legal, Worldwide Institutional, Invesco Ltd.; Secretary and General Counsel, INVESCO Private Capital Investments, Inc.; Senior Vice President, Secretary and General Counsel, Invesco Management Group, Inc. (formerly known as Invesco AIM Management Group, Inc.); Assistant Secretary, INVESCO Asset Management (Bermuda) Ltd.; Secretary and General Counsel, Invesco Private Capital, Inc.; Assistant Secretary and General Counsel, INVESCO Realty, Inc.; Secretary and General Counsel, Invesco Senior Secured Management, Inc.; and Secretary, Sovereign G./P. Holdings Inc. | | N/A | | N/A |
T-5 Invesco Small Cap Value Fund
Trustees and Officers–(continued)
| | | | | | | | |
Name, Year of Birth and
Position(s) Held with the Trust | | Trustee
and/or
Officer
Since | | Principal Occupation(s) During Past 5 Years | | Number of
Funds in Fund Complex
Overseen by
Trustee | | Other Directorship(s) Held by Trustee During Past 5 Years |
Officers–(continued) |
Andrew R. Schlossberg – 1974 Senior Vice President | | 2019 | | Head of the Americas and Senior Managing Director, Invesco Ltd.; Director and Senior Vice President, Invesco Advisers, Inc. (formerly known as Invesco Institutional (N.A.), Inc.) (registered investment adviser); Director and Chairman, Invesco Investment Services, Inc. (formerly known as Invesco AIM Investment Services, Inc.) (registered transfer agent); Senior Vice President, The Invesco Funds; Director, Invesco Investment Advisers LLC (formerly known as Van Kampen Asset Management); Director, President and Chairman, Invesco Insurance Agency, Inc. Formerly: Director, President and Chairman, Invesco Insurance Agency, Inc.; Director, Invesco UK Limited; Director and Chief Executive, Invesco Asset Management Limited and Invesco Fund Managers Limited; Assistant Vice President, The Invesco Funds; Senior Vice President, Invesco Advisers, Inc. (formerly known as Invesco Institutional (N.A.), Inc.) (registered investment adviser); Director and Chief Executive, Invesco Administration Services Limited and Invesco Global Investment Funds Limited; Director, Invesco Distributors, Inc.; Head of EMEA, Invesco Ltd.; President, Invesco Actively Managed Exchange-Traded Commodity Fund Trust, Invesco Actively Managed Exchange-Traded Fund Trust, Invesco Exchange-Traded Fund Trust, Invesco Exchange-Traded Fund Trust II and Invesco India Exchange-Traded Fund Trust; Managing Director and Principal Executive Officer, Invesco Capital Management LLC | | N/A | | N/A |
John M. Zerr – 1962 Senior Vice President | | 2006 | | Chief Operating Officer of the Americas; Senior Vice President, Invesco Advisers, Inc. (formerly known as Invesco Institutional (N.A.), Inc.) (registered investment adviser); Senior Vice President, Invesco Distributors, Inc. (formerly known as Invesco AIM Distributors, Inc.); Director and Vice President, Invesco Investment Services, Inc. (formerly known as Invesco AIM Investment Services, Inc.) Senior Vice President, The Invesco Funds; Managing Director, Invesco Capital Management LLC; Director, Invesco Investment Advisers LLC (formerly known as Van Kampen Asset Management); Senior Vice President, Invesco Capital Markets, Inc. (formerly known as Van Kampen Funds Inc.); Manager, Invesco Indexing LLC; Manager, Invesco Specialized Products, LLC; Member, Invesco Canada Funds Advisory Board; Director, President and Chief Executive Officer, Invesco Corporate Class Inc. (corporate mutual fund company); and Director, Chairman, President and Chief Executive Officer, Invesco Canada Ltd. (formerly known as Invesco Trimark Ltd./Invesco Trimark Ltèe) (registered investment adviser and registered transfer agent); President, Invesco, Inc.; President, Invesco Global Direct Real Estate Feeder GP Ltd.; President, Invesco IP Holdings(Canada) Ltd; President, Invesco Global Direct Real Estate GP Ltd.; President, Invesco Financial Services Ltd. / Services Financiers Invesco Ltée; President, Trimark Investments Ltd./Placements Trimark Ltée and Director and Chairman, Invesco Trust Company Formerly: Director and Senior Vice President, Invesco Insurance Agency, Inc.; Director and Senior Vice President, Invesco Management Group, Inc. (formerly known as Invesco AIM Management Group, Inc.); Secretary and General Counsel, Invesco Management Group, Inc. (formerly known as Invesco AIM Management Group, Inc.); Secretary, Invesco Investment Services, Inc. (formerly known as Invesco AIM Investment Services, Inc.); Chief Legal Officer and Secretary, The Invesco Funds; Secretary and General Counsel, Invesco Investment Advisers LLC (formerly known as Van Kampen Asset Management); Secretary and General Counsel, Invesco Capital Markets, Inc. (formerly known as Van Kampen Funds Inc.); Chief Legal Officer, Invesco Exchange-Traded Fund Trust, Invesco Exchange-Traded Fund Trust II, Invesco India Exchange-Traded Fund Trust, Invesco Actively Managed Exchange-Traded Fund Trust, Invesco Actively Managed Exchange-Traded Commodity Fund Trust and Invesco Exchange-Traded Self-Indexed Fund Trust; Secretary, Invesco Indexing LLC; Director, Secretary, General Counsel and Senior Vice President, Van Kampen Exchange Corp.; Director, Vice President and Secretary, IVZ Distributors, Inc. (formerly known as INVESCO Distributors, Inc.); Director and Vice President, INVESCO Funds Group, Inc.; Director and Vice President, Van Kampen Advisors Inc.; Director, Vice President, Secretary and General Counsel, Van Kampen Investor Services Inc.; Director and Secretary, Invesco Distributors, Inc. (formerly known as Invesco AIM Distributors, Inc.); Director, Senior Vice President, General Counsel and Secretary, Invesco AIM Advisers, Inc. and Van Kampen Investments Inc.; Director, Vice President and Secretary, Fund Management Company; Director, Senior Vice President, Secretary, General Counsel and Vice President, Invesco AIM Capital Management, Inc.; Chief Operating Officer and General Counsel, Liberty Ridge Capital, Inc. (an investment adviser) | | N/A | | N/A |
T-6 Invesco Small Cap Value Fund
Trustees and Officers–(continued)
| | | | | | | | |
Name, Year of Birth and
Position(s) Held with the Trust | | Trustee
and/or
Officer
Since | | Principal Occupation(s) During Past 5 Years | | Number of
Funds in Fund Complex
Overseen by
Trustee | | Other Directorship(s) Held by Trustee During Past 5 Years |
Officers–(continued) |
Gregory G. McGreevey – 1962 Senior Vice President | | 2012 | | Senior Managing Director, Invesco Ltd.; Director, Chairman, President, and Chief Executive Officer, Invesco Advisers, Inc. (formerly known as Invesco Institutional (N.A.), Inc.) (registered investment adviser); Director, Invesco Mortgage Capital, Inc. and Invesco Senior Secured Management, Inc.; and Senior Vice President, The Invesco Funds; and President, SNW Asset Management Corporation and Invesco Managed Accounts, LLC; Chairman and Director, Invesco Private Capital, Inc.; Chairman and Director, INVESCO Private Capital Investments, Inc.; Chairman and Director, INVESCO Realty, Inc. Chairman and Director, INVESCO Realty, Inc.; and Senior Vice President, Invesco Group Services, Inc. Formerly: Senior Vice President, Invesco Management Group, Inc. and Invesco Advisers, Inc.; Assistant Vice President, The Invesco Funds | | N/A | | N/A |
Adrien Deberghes – 1967 Principal Financial Officer, Treasurer and Vice President | | 2020 | | Head of the Fund Office of the CFO and Fund Administration; Vice President, Invesco Advisers, Inc.; Principal Financial Officer, Treasurer and Vice President, The Invesco Funds; Vice President, Invesco Exchange-Traded Fund Trust, Invesco Exchange-Traded Fund Trust II, Invesco India Exchange-Traded Fund Trust, Invesco Actively Managed Exchange-Traded Fund Trust, Invesco Actively Managed Exchange-Traded Commodity Fund Trust and Invesco Exchange-Traded Self-Indexed Fund Trust Formerly: Senior Vice President and Treasurer, Fidelity Investments | | N/A | | N/A |
Crissie M. Wisdom – 1969 Anti-Money Laundering Compliance Officer | | 2013 | | Anti-Money Laundering and OFAC Compliance Officer for Invesco U.S. entities including: Invesco Advisers, Inc. and its affiliates, Invesco Capital Markets, Inc., Invesco Distributors, Inc., Invesco Investment Services, Inc., The Invesco Funds, Invesco Capital Management, LLC, Invesco Trust Company; and Fraud Prevention Manager for Invesco Investment Services, Inc. | | N/A | | N/A |
Todd F. Kuehl – 1969 Chief Compliance Officer and Senior Vice President | | 2020 | | Chief Compliance Officer, Invesco Advisers, Inc. (registered investment adviser); and Chief Compliance Officer, The Invesco Funds and Senior Vice President Formerly: Managing Director and Chief Compliance Officer, Legg Mason (Mutual Funds); Chief Compliance Officer, Legg Mason Private Portfolio Group (registered investment adviser) | | N/A | | N/A |
Michael McMaster – 1962 Chief Tax Officer, Vice President and Assistant Treasurer | | 2020 | | Head of Global Fund Services Tax; Chief Tax Officer, Vice President and Assistant Treasurer, The Invesco Funds; Vice President, Invesco Advisers, Inc.; Assistant Treasurer, Invesco Capital Management LLC, Assistant Treasurer and Chief Tax Officer, Invesco Exchange-Traded Fund Trust, Invesco Exchange-Traded Fund Trust II, Invesco India Exchange-Traded Fund Trust, Invesco Actively Managed Exchange-Traded Fund Trust, Invesco Actively Managed Exchange-Traded Commodity Fund Trust and Invesco Exchange-Traded Self-Indexed Fund Trust; Assistant Treasurer, Invesco Specialized Products, LLC Formerly: Senior Vice President – Managing Director of Tax Services, U.S. Bank Global Fund Services (GFS) | | N/A | | N/A |
The Statement of Additional Information of the Trust includes additional information about the Fund’s Trustees and is available upon request, without charge, by calling 1.800.959.4246. Please refer to the Fund’s Statement of Additional Information for information on the Fund’s sub-advisers.
| | | | | | |
| Office of the Fund | | Investment Adviser | | Distributor | | Auditors |
| 11 Greenway Plaza, Suite 1000 | | Invesco Advisers, Inc. | | Invesco Distributors, Inc. | | PricewaterhouseCoopers LLP |
| Houston, TX 77046-1173 | | 1555 Peachtree Street, N.E. | | 11 Greenway Plaza, Suite 1000 | | 1000 Louisiana Street, Suite 5800 |
| | Atlanta, GA 30309 | | Houston, TX 77046-1173 | | Houston, TX 77002-5678 |
| | | |
| Counsel to the Fund | | Counsel to the Independent Trustees | | Transfer Agent | | Custodian |
| Stradley Ronon Stevens & Young, LLP | | Goodwin Procter LLP | | Invesco Investment Services, Inc. | | State Street Bank and Trust Company |
| 2005 Market Street, Suite 2600 | | 901 New York Avenue, N.W. | | 11 Greenway Plaza, Suite 1000 | | 225 Franklin Street |
| Philadelphia, PA 19103-7018 | | Washington, D.C. 20001 | | Houston, TX 77046-1173 | | Boston, MA 02110-2801 |
T-7 Invesco Small Cap Value Fund
(This page intentionally left blank)
(This page intentionally left blank)

Go paperless with eDelivery
Visit invesco.com/edelivery to enjoy the convenience and security of anytime electronic access to your investment documents.
With eDelivery, you can elect to have any or all of the following materials delivered straight to your inbox to download, save and print from your own computer:
| ∎ | | Fund reports and prospectuses |
Invesco mailing information
Send general correspondence to Invesco Investment Services, Inc., P.O. Box 219078, Kansas City, MO 64121-9078.
Important notice regarding delivery of security holder documents
To reduce Fund expenses, only one copy of most shareholder documents may be mailed to shareholders with multiple accounts at the same address (Householding). Mailing of your shareholder documents may be householded indefinitely unless you instruct us otherwise. If you do not want the mailing of these documents to be combined with those for other members of your household, please contact Invesco Investment Services, Inc. at 800 959 4246 or contact your financial institution. We will begin sending you individual copies for each account within 30 days after receiving your request.
Fund holdings and proxy voting information
The Fund provides a complete list of its portfolio holdings four times each fiscal year, at the end of each fiscal quarter. For the second and fourth quarters, the list appears, respectively, in the Fund’s semiannual and annual reports to shareholders. For the first and third quarters, the Fund files the list with the Securities and Exchange Commission (SEC) as an exhibit to its reports on Form N-PORT. The most recent list of portfolio holdings is available at invesco.com/completeqtrholdings. Shareholders can also look up the Fund’s Form N-PORT filings on the SEC website, sec.gov. The SEC file numbers for the Fund are shown below.
A description of the policies and procedures that the Fund uses to determine how to vote proxies relating to portfolio securities is available without charge, upon request, from our Client Services department at 800 959 4246, or at invesco.com/ corporate/about-us/esg. The information is also available on the SEC website, sec.gov.
| | |
Information regarding how the Fund voted proxies related to its portfolio securities during the most recent 12-month period ended June 30 is available at invesco.com/proxysearch. This information is also available on the SEC website, sec.gov. | |
|
Invesco Advisers, Inc. is an investment adviser; it provides investment advisory services to individual and institutional clients and does not sell securities. Invesco Distributors, Inc. is the US distributor for Invesco Ltd.’s retail mutual funds, exchange-traded funds and institutional money market funds. Both are wholly owned, indirect subsidiaries of Invesco Ltd. |
| | | | |
SEC file numbers: 811-03826 and 002-85905 | | Invesco Distributors, Inc. | | VK-SCV-AR-1 |
| | |
 | | Annual Report to Shareholders April 30, 2021 |
| | Invesco Technology Fund |
| | Nasdaq: A: ITYAX ∎ C: ITHCX ∎ Y: ITYYX ∎ Investor: FTCHX ∎ R5: FTPIX ∎ R6: FTPSX |

Management’s Discussion of Fund Performance
| | | | | | |
| | | Performance summary For the fiscal year ended April 30, 2021, Class A shares of Invesco Technology Fund (the Fund), at net asset value (NAV), underperformed the NASDAQ Composite Index, the Fund’s broad market/style-specific benchmark. Your Fund’s long-term performance appears later in this report. | |
| | | Fund vs. Indexes | | | | |
| | Total returns, 4/30/20 to 4/30/21, at net asset value (NAV). Performance shown does not include applicable contingent deferred sales charges (CDSC) or front-end sales charges, which would have reduced performance. | |
| | | Class A Shares | | | 54.40% | |
| | | Class C Shares | | | 53.20 | |
| | | Class Y Shares | | | 54.78 | |
| | | Investor Class Shares | | | 54.56 | |
| | | Class R5 Shares | | | 54.88 | |
| | | Class R6 Shares | | | 54.93 | |
| | | NASDAQ Composite Indexq (Broad Market/Style-Specific Index) | | | 58.30 | |
| | | Lipper Science & Technology Funds Index∎ (Peer Group Index) | | | 69.50 | |
| | |
| | | Source(s): qBloomberg L.P.; ∎Lipper Inc. | | | | |
Market conditions and your Fund
As many businesses began to shut down in April 2020 due to the pandemic, US unemployment numbers continued to climb, as the economy ground to a halt. However, during the second and into the third quarter of 2020, US stocks largely shrugged off economic uncertainty, social unrest and a resurgence in coronavirus (COVID 19) infections to rally from the market bottom. Investor sentiment improved in response to trillions of dollars in economic stimulus, progress on a coronavirus vaccine and re-openings in many US regions. In July, the US Federal Reserve (the Fed) extended its emergency stimulus programs, originally scheduled to end in September, to year-end, which provided support to equities. In late August, second-quarter gross domestic product (GDP) fell by 31.4%,¹ a record decline. Despite the extreme drop in the economy, the S&P 500 Index not only erased all its losses from the first quarter but made record highs.
Despite a September selloff, US equity markets posted gains in the third quarter as the Fed extended its emergency stimulus programs and changed its inflation target policy, both of which supported equities. Data for both manufacturing and services indicated expansion, a reversal from significant declines earlier in the year. Corporate earnings were also better than anticipated and a gradual decline in new COVID-19 infections in many regions, combined with optimism about progress on a coronavirus vaccine, further boosted stocks. October saw increased volatility as COVID-19 infection rates rose to record highs in the US and Europe. Investors also became concerned about delayed results from the US presidential election and the real possibility of a contested election, further delaying a clear winner.
US equity markets posted gains in the fourth quarter, as positive news on COVID-19
vaccines and strong corporate earnings outweighed investor concerns about the political disagreement over a fiscal stimulus package and sharply rising coronavirus infections nationwide. Cyclical sectors like energy and financials led the way, while real estate and consumer staples lagged. Market leadership also shifted during the quarter with value stocks outperforming growth for the first time since the fourth quarter of 2016. While the US economy rebounded significantly since the pandemic began, the recovery appeared to slow in the fourth quarter with employment gains and GDP growth down from the third quarter. However, stocks were buoyed by the Fed’s pledge to maintain its accommodative stance and asset purchases, “until substantial further progress has been made” toward employment and inflation targets.
US political unrest and rising COVID-19 infection rates marked the start of the first quarter of 2021. Additionally, retail investors bid up select stocks like GameStop and AMC Theaters, ultimately causing a sharp selloff in late January 2021. Corporate earnings generally beat expectations, but market volatility rose during the quarter as investors worried about rising bond yields and inflation. Despite the Federal Reserve’s commitment to an accommodative policy, the 10-year US Treasury yield rose from 0.92% at year-end to 1.63%² at the fiscal year-end. Approval of a third COVID-19 vaccine boosted investors’ optimism for faster economic recovery. Although March saw increased volatility with consecutive down days in the US stock market, stocks continued to hit all-time highs through April 2021. US stocks had strong returns for the fiscal year, with the S&P 500 Index returning 45.98% for the year.³
Given this landscape, the Fund produced a strong, double-digit return but underper-formed its style-specific benchmark during the fiscal year. Performance was driven by both stock selection and market allocation.
The leading relative detractor was underweight exposure in the automobile industry, which was predominantly driven by names not owned in the Fund that delivered massive returns during the year, including Tesla. Stock selection in the IT services and health care equipment & supplies industries was also a key detractor during the period. Alternatively, leading contributors included stock selection and overweight exposure in semiconductors & semiconductor equipment as well as stock selection and underweight exposure in the biotechnology industry. Stock selection in the entertainment and life sciences tools & services industries also provided a tailwind during the fiscal year.
Top individual detractors from absolute Fund performance included Reata Pharmaceuticals, Wex and StoneCo. Reata Pharmaceuticals and Wex were sold during the fiscal year.
Reata Pharmaceuticals was added to the Fund due to promising Phase 3 trial results for two lead drugs, one targeting a rare brain disease and the other a rare kidney disease. Reata also has several additional drugs in the pipeline in the later phases of its trials that are delivering promising results. Recently, the pharmaceutical company has come under pressure due to uncertainty around whether the U.S. Food and Drug Administration will recommend approval of its lead drug candidate in 2021.
Wex is a financial technology solutions provider offering payment processing and information management services for vehicle fleets, corporate payments, and health care. Wex was added to the portfolio as a recovery-linked business and to capture a growing shift towards more efficient business payment solutions. As COVID-19 began to take its toll on the economy resulting in persistently low gas prices, lower miles driven, significantly lower reservations for hotels booked online, and slower growth in healthcare savings accounts as unemployment spiked, the company’s results fell short of expectations.
StoneCo provides end-to-end, cloud-based technology to facilitate e-commerce across online, in-store and mobile channels. The Brazil-based company experienced headwinds during the year linked to persistently high COVID-19 rates and how rapidly a new COVID-19 variant was spreading within the country’s borders. This has prompted fears of a broader economic shutdown, which would cause a sharp economic contraction. Despite the lockdown in 2020, StoneCo managed to gain substantial market share, which is promising for its prospects.
Top individual contributors to the Fund’s absolute performance during the year included Applied Materials, Sea Limited and Apple.
Applied Materials makes capital equipment used to manufacture semiconductor chips, liquid crystal displays, and light-emitting diodes (LEDs). The near-term cyclical recovery
2 Invesco Technology Fund
and long-term digital transformation are driving demand for semiconductor chips. Semiconductor chip content is growing in vehicles, equipment, consumer goods, and technology hardware. Semiconductor manufacturer capital spending has curtailed in recent years, leading to lean inventories and chip shortages. Governments globally are looking to onshore and expand semiconductor manufacturing capacity as a way to protect economic prosperity, innovation, and national security. We believe Applied Materials has and will continue to be a prime beneficiary of this increase in capital spending and long-term digital transformation.
Sea Limited, the leading internet platform in Southeast Asia and Taiwan, also benefited from mandated and voluntary social distancing measures through its digital entertainment, e-commerce and digital payments business units. During the second and third quarters of 2020, Sea’s sales and profits were up near 100%. Additionally, Free Fire, Sea’s self-developed battle royale game for mobile devices has been quite successful — particularly in markets that tend to have lower-end mobile devices, an important strategical move for Sea — earning the title as the highest-grossing mobile game in Latin America and Southeast Asia in 2019 and well into 2020.
Apple delivered strong results throughout the year partially driven by the shutdown, which kept sales robust as people purchased devices to maintain contact with loved ones. Stimulus payments also helped keep demand for the iPhone strong despite a late launch of the iPhone 12. Additionally, the tech giant saw an increase in sales of its wearable devices and other services, which experienced double-digit year-over-year revenue increases in both divisions.
We expect continued volatility as the global economy ebbs and flows between high COVID-19 infection rates and lockdowns while vaccinations support a reopening and a return to normalcy. In our view, interest rates are likely to remain low by historic standards and economic growth is likely to remain muted on a full-year basis, although some quarters will benefit from easy comparisons versus the lockdowns of 2020. We believe this is a ripe environment for equities in general as pent-up demand further propels the cyclical recovery. However, value industries lack pricing power in the face of globalization, overcapacity and increased efficiencies mostly due to technological changes. Therefore, we believe growth will continue to outperform. As ever, we believe change is the fuel for growth and our positioning will be active within the unfolding vaccine-related opportunities to go back outside yet balanced with secular growers. We continue to seek to identify “share-takers,” companies that can gain market share through technology-enabled advantages in their business models and from disruptive shifts in enterprise and consumer behavior.
Thank you for your commitment to the Invesco Technology Fund and for sharing our long-term investment horizon.
1 Source: US Bureau of Economic Analysis
2 Source: Bloomberg L.P.
3 Source: Lipper Inc.
Portfolio manager(s):
Janet Luby
Erik Voss - Lead
The views and opinions expressed in management’s discussion of Fund performance are those of Invesco Advisers, Inc. These views and opinions are subject to change at any time based on factors such as market and economic conditions. These views and opinions may not be relied upon as investment advice or recommendations, or as an offer for a particular security. The information is not a complete analysis of every aspect of any market, country, industry, security or the Fund. Statements of fact are from sources considered reliable, but Invesco Advisers, Inc. makes no representation or warranty as to their completeness or accuracy. Although historical performance is no guarantee of future results, these insights may help you understand our investment management philosophy.
See important Fund and, if applicable, index disclosures later in this report.
3 Invesco Technology Fund
Your Fund’s Long-Term Performance
Results of a $10,000 Investment — Oldest Share Class(es)
Fund and index data from 4/30/11
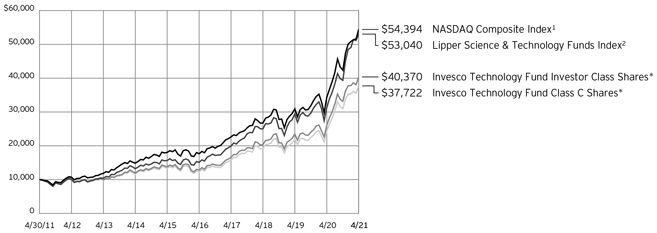
1 Source: Bloomberg L.P.
2 Source: Lipper Inc.
*It is Invesco’s policy to chart the Fund’s oldest share class(es). Because Investor Class shares do not have a sales charge, we also show the oldest share class with a sales charge, Class C shares.
Past performance cannot guarantee future results.
The data shown in the chart include reinvested distributions, applicable sales charges and Fund expenses including management
fees. Index results include reinvested dividends, but they do not reflect sales charges. Performance of the peer group, if applicable, reflects fund expenses and management fees;
performance of a market index does not. Performance shown in the chart does not reflect deduction of taxes a shareholder would pay on Fund distributions or sale of Fund shares.
4 Invesco Technology Fund
| | | | |
Average Annual Total Returns | |
As of 4/30/21, including maximum applicable sales charges | |
| |
Class A Shares | | | | |
Inception (3/28/02) | | | 8.15 | % |
10 Years | | | 14.23 | |
5 Years | | | 24.18 | |
1 Year | | | 45.91 | |
| |
Class C Shares | | | | |
Inception (2/14/00) | | | 1.80 | % |
10 Years | | | 14.20 | |
5 Years | | | 24.64 | |
1 Year | | | 52.20 | |
| |
Class Y Shares | | | | |
Inception (10/3/08) | | | 16.76 | % |
10 Years | | | 15.17 | |
5 Years | | | 25.91 | |
1 Year | | | 54.78 | |
| |
Investor Class Shares | | | | |
Inception (1/19/84) | | | 11.41 | % |
10 Years | | | 14.98 | |
5 Years | | | 25.71 | |
1 Year | | | 54.56 | |
| |
Class R5 Shares | | | | |
Inception (12/21/98) | | | 7.78 | % |
10 Years | | | 15.45 | |
5 Years | | | 26.11 | |
1 Year | | | 54.88 | |
| |
Class R6 Shares | | | | |
10 Years | | | 15.07 | % |
5 Years | | | 26.02 | |
1 Year | | | 54.93 | |
Class R6 shares incepted on April 4, 2017. Performance shown prior to that date is that of Class A shares at net asset value and includes the 12b-1 fees applicable to Class A shares.
The performance data quoted represent past performance and cannot guarantee future results; current performance may be lower or higher. Please visit invesco.com/ performance for the most recent month-end performance. Performance figures reflect reinvested distributions, changes in net asset value and the effect of the maximum sales charge unless otherwise stated. Performance figures do not reflect deduction of taxes a shareholder would pay on Fund distributions or sale of Fund shares. Investment return and principal value will fluctuate so that you may have a gain or loss when you sell shares.
Class A share performance reflects the maximum 5.50% sales charge, and Class C share performance reflects the applicable contingent deferred sales charge (CDSC) for the period involved. The CDSC on Class C shares is 1% for the first year after purchase. Class Y, Investor Class, Class R5 and Class R6 shares do not have a front-end sales charge or a CDSC; therefore, performance is at net asset value.
The performance of the Fund’s share classes will differ primarily due to different sales charge structures and class expenses.
Fund performance reflects any applicable fee waivers and/or expense reimbursements. Had the adviser not waived fees and/or reimbursed expenses currently or in the past, returns would have been lower. See current prospectus for more information.
5 Invesco Technology Fund
Supplemental Information
Invesco Technology Fund’s investment objective is long-term growth of capital.
| ∎ | Unless otherwise stated, information presented in this report is as of April 30, 2021, and is based on total net assets. |
| ∎ | Unless otherwise noted, all data is provided by Invesco. |
| ∎ | To access your Fund’s reports/prospectus, visit invesco.com/fundreports. |
About indexes used in this report
| ∎ | The NASDAQ Composite Index is a broad-based market index of the common stocks and similar securities listed on the Nasdaq stock market. |
| ∎ | The Lipper Science & Technology Funds Index is an unmanaged index considered representative of science and technology funds tracked by Lipper. |
| ∎ | The Fund is not managed to track the performance of any particular index, including the index(es) described here, and consequently, the performance of the Fund may deviate significantly from the performance of the index(es). |
| ∎ | A direct investment cannot be made in an index. Unless otherwise indicated, index results include reinvested dividends, and they do not reflect sales charges. Performance of the peer group, if applicable, reflects fund expenses; performance of a market index does not. |
Liquidity Risk Management Program
In compliance with Rule 22e-4 under the Investment Company Act of 1940, as amended (the “Liquidity Rule”), the Fund has adopted and implemented a liquidity risk management program in accordance with the Liquidity Rule (the “Program”). The Program is reasonably designed to assess and manage the Fund’s liquidity risk, which is the risk that the Fund could not meet redemption requests without significant dilution of remaining investors’ interests in the Fund. The Board of Trustees of the Fund (the “Board”) has appointed Invesco Advisers, Inc. (“Invesco”), the Fund’s investment adviser, as the Program’s administrator, and Invesco has delegated oversight of the Program to the Liquidity Risk Management Committee (the “Committee”), which is composed of senior representatives from relevant business groups at Invesco.
As required by the Liquidity Rule, the Program includes policies and procedures providing for an assessment, no less frequently than annually, of the Fund’s liquidity risk that takes into account, as relevant to the Fund’s liquidity risk: (1) the Fund’s investment strategy and liquidity of portfolio investments during both normal
and reasonably foreseeable stressed conditions; (2) short-term and long-term cash flow projections for the Fund during both normal and reasonably foreseeable stressed conditions; and (3) the Fund’s holdings of cash and cash equivalents and any borrowing arrangements. The Liquidity Rule also requires the classification of the Fund’s investments into categories that reflect the assessment of their relative liquidity under current market conditions. The Fund classifies its investments into one of four categories defined in the Liquidity Rule: “Highly Liquid,” “Moderately Liquid,” “Less Liquid,” and “Illiquid.” Funds that are not invested primarily in “Highly Liquid Investments” that are assets (cash or investments that are reasonably expected to be convertible into cash within three business days without significantly changing the market value of the investment) are required to establish a “Highly Liquid Investment Minimum” (“HLIM”), which is the minimum percentage of net assets that must be invested in Highly Liquid Investments. Funds with HLIMs have procedures for addressing HLIM shortfalls, including reporting to the Board and the SEC (on a non-public basis) as required by the Program and the Liquidity Rule. In addition, the Fund may not acquire an investment if, immediately after the acquisition, over 15% of the Fund’s net assets would consist of “Illiquid Investments” that are assets (an investment that cannot reasonably be expected to be sold or disposed of in current market conditions in seven calendar days or less without the sale or disposition significantly changing the market value of the investment). The Liquidity Rule and the Program also require reporting to the Board and the SEC (on a non-public basis) if a Fund’s holdings of Illiquid Investments exceed 15% of the Fund’s assets.
At a meeting held on March 22-24, 2021, the Committee presented a report to the Board that addressed the operation of the Program and assessed the Program’s adequacy and effectiveness of implementation (the “Report”). The Report covered the period from January 1, 2020 through December 31, 2020 (the “Program Reporting Period”). The Report discussed notable events affecting liquidity over the
Program Reporting Period, including the impact of the coronavirus pandemic on the Fund and the overall market. The Report noted that there were no material changes to the Program during the Program Reporting Period.
The Report stated, in relevant part, that during the Program Reporting Period:
| ∎ | The Program, as adopted and implemented, remained reasonably designed to assess and manage the Fund’s liquidity risk and was operated effectively to achieve that goal; |
| ∎ | The Fund’s investment strategy remained appropriate for an open-end fund; |
| ∎ | The Fund was able to meet requests for redemption without significant dilution of remaining investors’ interests in the Fund; |
| ∎ | The Fund did not breach the 15% limit on Illiquid Investments; and |
| ∎ | The Fund primarily held Highly Liquid Investments and therefore has not adopted an HLIM. |
| | | | |
This report must be accompanied or preceded by a currently effective Fund prospectus, which contains more complete information, including sales charges and expenses. Investors should read it carefully before investing. | | |
NOT FDIC INSURED | MAY LOSE VALUE | NO BANK GUARANTEE | | |
6 Invesco Technology Fund
Fund Information
Portfolio Composition
| | | | | |
By sector | | % of total net assets |
Information Technology | | | | 50.45 | % |
Consumer Discretionary | | | | 17.92 | |
Communication Services | | | | 17.90 | |
Health Care | | | | 10.73 | |
Industrials | | | | 2.05 | |
Money Market Funds Plus Other Assets Less Liabilities | | | | 0.95 | |
Top 10 Equity Holdings*
| | | | | | | |
| | | | | % of total net assets |
1. | | Amazon.com, Inc. | | | | 7.54 | % |
2. | | Applied Materials, Inc. | | | | 7.16 | |
3. | | Microsoft Corp. | | | | 6.26 | |
4. | | Alphabet, Inc., Class A | | | | 5.09 | |
5. | | Apple, Inc. | | | | 4.94 | |
6. | | NVIDIA Corp. | | | | 4.27 | |
7. | | QUALCOMM, Inc. | | | | 3.85 | |
8. | | Facebook, Inc., Class A | | | | 3.82 | |
9. | | RingCentral, Inc., Class A | | | | 3.59 | |
10. | | Sony Group Corp. | | | | 3.58 | |
The Fund’s holdings are subject to change, and there is no assurance that the Fund will
| continue | to hold any particular security. |
* Excluding money market fund holdings, if any.
Data presented here are as of April 30, 2021.
7 Invesco Technology Fund
Schedule of Investments(a)
April 30, 2021
| | | | | | | | |
| | | Shares | | | Value | |
Common Stocks & Other Equity Interests–99.05% | |
Application Software–6.27% | | | | | | | | |
DocuSign, Inc.(b) | | | 80,326 | | | $ | 17,907,878 | |
RingCentral, Inc., Class A(b) | | | 196,449 | | | | 62,657,409 | |
Synopsys, Inc.(b) | | | 117,298 | | | | 28,979,644 | |
| | | | | | | | 109,544,931 | |
| | |
Automobile Manufacturers–0.66% | | | | | | | | |
General Motors Co.(b) | | | 202,620 | | | | 11,593,916 | |
| | |
Biotechnology–0.69% | | | | | | | | |
BeiGene Ltd., ADR (China)(b) | | | 35,032 | | | | 12,034,893 | |
| |
Consumer Electronics–3.58% | | | | | |
Sony Group Corp. (Japan) | | | 624,600 | | | | 62,512,729 | |
| |
Data Processing & Outsourced Services–6.93% | | | | | |
Mastercard, Inc., Class A | | | 109,129 | | | | 41,693,826 | |
PayPal Holdings, Inc.(b) | | | 223,389 | | | | 58,592,701 | |
StoneCo Ltd., Class A (Brazil)(b) | | | 321,675 | | | | 20,793,072 | |
| | | | | | | | 121,079,599 | |
| | |
Health Care Equipment–3.08% | | | | | | | | |
Abbott Laboratories | | | 72,511 | | | | 8,707,121 | |
Intuitive Surgical, Inc.(b) | | | 18,472 | | | | 15,978,280 | |
Teleflex, Inc. | | | 68,749 | | | | 29,045,077 | |
| | | | | | | | 53,730,478 | |
| | |
Health Care Technology–0.12% | | | | | | | | |
GoodRx Holdings, Inc., Class A(b) | | | 53,523 | | | | 2,141,455 | |
| |
Hotels, Resorts & Cruise Lines–2.39% | | | | | |
Booking Holdings, Inc.(b) | | | 16,921 | | | | 41,728,540 | |
| |
Interactive Home Entertainment–6.28% | | | | | |
Activision Blizzard, Inc. | | | 273,286 | | | | 24,920,950 | |
Electronic Arts, Inc. | | | 73,032 | | | | 10,376,387 | |
Nintendo Co. Ltd. (Japan) | | | 51,400 | | | | 29,448,014 | |
Sea Ltd., ADR (Taiwan)(b) | | | 139,084 | | | | 35,124,273 | |
Take-Two Interactive Software, Inc.(b) | | | 56,110 | | | | 9,840,572 | |
| | | | | | | | 109,710,196 | |
| |
Interactive Media & Services–10.79% | | | | | |
Alphabet, Inc., Class A(b) | | | 37,780 | | | | 88,915,230 | |
Facebook, Inc., Class A(b) | | | 205,186 | | | | 66,701,865 | |
Kuaishou Technology (China)(b)(c) | | | 248,100 | | | | 7,980,147 | |
ZoomInfo Technologies, Inc., Class A(b) | | | 480,051 | | | | 24,895,445 | |
| | | | | | | | 188,492,687 | |
| |
Internet & Direct Marketing Retail–11.29% | | | | | |
Alibaba Group Holding Ltd., ADR (China)(b) | | | 141,275 | | | | 32,627,461 | |
Amazon.com, Inc.(b) | | | 37,969 | | | | 131,654,470 | |
Farfetch Ltd., Class A (United Kingdom)(b) | | | 307,666 | | | | 15,072,557 | |
MercadoLibre, Inc. (Argentina)(b) | | | 11,380 | | | | 17,877,753 | |
| | | | | | | | 197,232,241 | |
| |
Internet Services & Infrastructure–2.00% | | | | | |
GDS Holdings Ltd., ADR (China)(b) | | | 104,648 | | | | 8,682,644 | |
| | | | | | | | |
| | | Shares | | | Value | |
Internet Services & Infrastructure–(continued) | | | | | |
Twilio, Inc., Class A(b) | | | 71,416 | | | $ | 26,266,805 | |
| | | | | | | | 34,949,449 | |
| |
Life Sciences Tools & Services–6.84% | | | | | |
10X Genomics, Inc., Class A(b) | | | 156,265 | | | | 30,909,217 | |
Avantor, Inc.(b) | | | 1,072,754 | | | | 34,371,038 | |
IQVIA Holdings, Inc.(b) | | | 212,964 | | | | 49,980,521 | |
Thermo Fisher Scientific, Inc. | | | 9,110 | | | | 4,283,796 | |
| | | | | | | | 119,544,572 | |
| |
Movies & Entertainment–0.83% | | | | | |
Netflix, Inc.(b) | | | 28,257 | | | | 14,509,122 | |
| | |
Semiconductor Equipment–9.91% | | | | | | | | |
Applied Materials, Inc. | | | 942,938 | | | | 125,137,302 | |
ASML Holding N.V., New York Shares (Netherlands)(d) | | | 74,151 | | | | 48,057,263 | |
| | | | | | | | 173,194,565 | |
| | |
Semiconductors–9.12% | | | | | | | | |
NVIDIA Corp. | | | 124,363 | | | | 74,665,058 | |
QUALCOMM, Inc. | | | 484,590 | | | | 67,261,092 | |
Semtech Corp.(b) | | | 257,982 | | | | 17,475,701 | |
| | | | | | | | 159,401,851 | |
| | |
Systems Software–11.28% | | | | | | | | |
KnowBe4, Inc., Class A(b) | | | 283,768 | | | | 6,520,989 | |
Microsoft Corp. | | | 433,289 | | | | 109,266,820 | |
Palo Alto Networks, Inc.(b) | | | 98,555 | | | | 34,828,351 | |
ServiceNow, Inc.(b) | | | 91,790 | | | | 46,479,702 | |
| | | | | | | | 197,095,862 | |
|
Technology Hardware, Storage & Peripherals–4.94% | |
Apple, Inc. | | | 656,048 | | | | 86,244,070 | |
| | |
Trucking–2.05% | | | | | | | | |
Uber Technologies, Inc.(b) | | | 654,036 | | | | 35,821,552 | |
Total Common Stocks & Other Equity Interests
(Cost $817,188,279) | | | | 1,730,562,708 | |
| | |
Money Market Funds–0.99% | | | | | | | | |
Invesco Government & Agency Portfolio, Institutional Class, 0.03%(e)(f) | | | 5,850,425 | | | | 5,850,425 | |
Invesco Liquid Assets Portfolio, Institutional Class, 0.01%(e)(f) | | | 4,755,627 | | | | 4,757,529 | |
Invesco Treasury Portfolio, Institutional Class, 0.01%(e)(f) | | | 6,686,199 | | | | 6,686,199 | |
Total Money Market Funds (Cost $17,293,477) | | | | 17,294,153 | |
TOTAL INVESTMENTS IN SECURITIES
(excluding investments purchased with cash collateral from securities on loan)-100.04%
(Cost $834,481,756) | | | | 1,747,856,861 | |
Investments Purchased with Cash Collateral from Securities on Loan | |
Money Market Funds–2.84% | | | | | | | | |
Invesco Private Government Fund, 0.01%(e)(f)(g) | | | 19,842,453 | | | | 19,842,453 | |
See accompanying Notes to Financial Statements which are an integral part of the financial statements.
8 Invesco Technology Fund
| | | | | | | | |
| | | Shares | | | Value | |
| |
Money Market Funds–(continued) | | | | | | | | |
Invesco Private Prime Fund, 0.11%(e)(f)(g) | | | 29,751,778 | | | $ | 29,763,679 | |
| |
Total Investments Purchased with Cash Collateral from Securities on Loan (Cost $49,606,132) | | | | | | | 49,606,132 | |
| |
TOTAL INVESTMENTS IN SECURITIES–102.88%
(Cost $884,087,888) | | | | 1,797,462,993 | |
| |
OTHER ASSETS LESS LIABILITIES—(2.88)% | | | | (50,399,819 | ) |
| |
NET ASSETS–100.00% | | | $ | 1,747,063,174 | |
| |
Investment Abbreviations:
ADR – American Depositary Receipt
Notes to Schedule of Investments:
| (a) | Industry and/or sector classifications used in this report are generally according to the Global Industry Classification Standard, which was developed by and is the exclusive property and a service mark of MSCI Inc. and Standard & Poor’s. |
| (b) | Non-income producing security. |
| (c) | Security purchased or received in a transaction exempt from registration under the Securities Act of 1933, as amended (the “1933 Act”). The security may be resold pursuant to an exemption from registration under the 1933 Act, typically to qualified institutional buyers. The value of this security at April 30, 2021 represented less than 1% of the Fund’s Net Assets. |
| (d) | All or a portion of this security was out on loan at April 30, 2021. |
| (e) | Affiliated issuer. The issuer and/or the Fund is a wholly-owned subsidiary of Invesco Ltd., or is affiliated by having an investment adviser that is under common control of Invesco Ltd. The table below shows the Fund’s transactions in, and earnings from, its investments in affiliates for the fiscal year ended April 30, 2021. |
| | | | | | | | | | | | | | | | | | | | | | | | | | | | | | | | | | | |
| | | Value
April 30, 2020 | | Purchases
at Cost | | Proceeds from
Sales | | Change in
Unrealized
Appreciation
(Depreciation) | | Realized
Gain | | Value
April 30, 2021 | | Dividend Income |
Investments in Affiliated Money Market Funds: | | | | | | | | | | | | | | | | | | | | | | | | | | | | | | | | | | | |
Invesco Government & Agency Portfolio, Institutional Class | | | | $ 5,087,629 | | | | | $126,482,879 | | | | | $(125,720,084) | | | | | $ — | | | | | $ 1 | | | | | $ 5,850,425 | | | | | $ 2,272 | |
Invesco Liquid Assets Portfolio, Institutional Class | | | | 4,500,938 | | | | | 90,344,913 | | | | | (90,087,598 | ) | | | | (3,707 | ) | | | | 2,983 | | | | | 4,757,529 | | | | | 6,413 | |
Invesco Treasury Portfolio, Institutional Class | | | | 5,814,433 | | | | | 144,551,861 | | | | | (143,680,097 | ) | | | | — | | | | | 2 | | | | | 6,686,199 | | | | | 1,809 | |
| Investments Purchased with Cash Collateral from Securities on Loan: | | | | | | | | | | | | | | | | | | | | | | | | | | | | | | | | | | | |
Invesco Private Government Fund | | | | — | | | | | 122,548,787 | | | | | (102,706,334 | ) | | | | — | | | | | — | | | | | 19,842,453 | | | | | 1,189 | * |
Invesco Private Prime Fund | | | | — | | | | | 125,519,288 | | | | | (95,757,517 | ) | | | | — | | | | | 1,908 | | | | | 29,763,679 | | | | | 5,592 | * |
Total | | | | $15,403,000 | | | | | $609,447,728 | | | | | $(557,951,630) | | | | | $(3,707 | ) | | | | $4,894 | | | | | $66,900,285 | | | | | $17,275 | |
| | * | Represents the income earned on the investment of cash collateral, which is included in securities lending income on the Statement of Operations. Does not include rebates and fees paid to lending agent or premiums received from borrowers, if any. |
| (f) | The rate shown is the 7-day SEC standardized yield as of April 30, 2021. |
| (g) | The security has been segregated to satisfy the commitment to return the cash collateral received in securities lending transactions upon the borrower’s return of the securities loaned. See Note 1I. |
See accompanying Notes to Financial Statements which are an integral part of the financial statements.
9 Invesco Technology Fund
Statement of Assets and Liabilities
April 30, 2021
| | | | |
Assets: | | | | |
Investments in securities, at value
(Cost $817,188,279)* | | | $1,730,562,708 | |
Investments in affiliated money market funds, at value
(Cost $66,899,609) | | | 66,900,285 | |
Foreign currencies, at value (Cost $284) | | | 296 | |
Receivable for: | | | | |
Investments sold | | | 1,408,290 | |
Fund shares sold | | | 386,987 | |
Dividends | | | 705,109 | |
Investment for trustee deferred compensation and retirement plans | | | 222,543 | |
Other assets | | | 69,632 | |
Total assets | | | 1,800,255,850 | |
| |
Liabilities: | | | | |
Payable for: | | | | |
Fund shares reacquired | | | 1,154,523 | |
Amount due custodian | | | 847,363 | |
Collateral upon return of securities loaned | | | 49,606,132 | |
Accrued fees to affiliates | | | 882,533 | |
Accrued trustees’ and officers’ fees and benefits | | | 1,583 | |
Accrued other operating expenses | | | 455,033 | |
Trustee deferred compensation and retirement plans | | | 245,509 | |
Total liabilities | | | 53,192,676 | |
Net assets applicable to shares outstanding | | | $1,747,063,174 | |
| |
Net assets consist of: | | | | |
Shares of beneficial interest | | | $662,681,428 | |
Distributable earnings | | | 1,084,381,746 | |
| | | | $1,747,063,174 | |
| | | | |
Net Assets: | | | | |
Class A | | $ | 927,620,412 | |
Class C | | $ | 56,565,512 | |
Class Y | | $ | 62,294,201 | |
Investor Class | | $ | 698,142,524 | |
Class R5 | | $ | 793,831 | |
Class R6 | | $ | 1,646,694 | |
|
Shares outstanding, no par value, with an unlimited number of shares authorized: | |
Class A | | | 12,794,689 | |
Class C | | | 1,055,544 | |
Class Y | | | 837,399 | |
Investor Class | | | 9,664,863 | |
Class R5 | | | 8,869 | |
Class R6 | | | 18,379 | |
Class A: | | | | |
Net asset value per share | | $ | 72.50 | |
Maximum offering price per share
(Net asset value of $72.50 ÷ 94.50%) | | $ | 76.72 | |
Class C: | | | | |
Net asset value and offering price per share | | $ | 53.59 | |
Class Y: | | | | |
Net asset value and offering price per share | | $ | 74.39 | |
Investor Class: | | | | |
Net asset value and offering price per share | | $ | 72.24 | |
Class R5: | | | | |
Net asset value and offering price per share | | $ | 89.51 | |
Class R6: | | | | |
Net asset value and offering price per share | | $ | 89.60 | |
| * | At April 30, 2021, a security with a value of $47,576,373 was on loan to brokers. |
See accompanying Notes to Financial Statements which are an integral part of the financial statements.
10 Invesco Technology Fund
Statement of Operations
For the year ended April 30, 2021
| | | | |
Investment income: | | | | |
Dividends (net of foreign withholding taxes of $103,579) | | | $ 5,762,155 | |
Dividends from affiliated money market funds (includes securities lending income of $121,782) | | | 132,276 | |
Total investment income | | | 5,894,431 | |
| |
Expenses: | | | | |
Advisory fees | | | 9,241,502 | |
Administrative services fees | | | 213,362 | |
Custodian fees | | | 44,264 | |
Distribution fees - Class A | | | 1,970,083 | |
Distribution fees - Class C | | | 502,597 | |
Distribution fees - Investor Class | | | 908,203 | |
Transfer agent fees - A, C, Y and Investor | | | 2,737,736 | |
Transfer agent fees - R5 | | | 508 | |
Transfer agent fees - R6 | | | 706 | |
Trustees’ and officers’ fees and benefits | | | 45,171 | |
Registration and filing fees | | | 100,252 | |
Reports to shareholders | | | 452,445 | |
Professional services fees | | | 63,358 | |
Other | | | 36,309 | |
Total expenses | | | 16,316,496 | |
Less: Fees waived and/or expense offset arrangement(s) | | | (20,006 | ) |
Net expenses | | | 16,296,490 | |
Net investment income (loss) | | | (10,402,059 | ) |
| |
Realized and unrealized gain (loss) from: | | | | |
Net realized gain from: | | | | |
Unaffiliated investment securities (includes net gains (losses) from securities sold to affiliates of $(7,045,828)) | | | 284,167,486 | |
Affiliated investment securities | | | 4,894 | |
Foreign currencies | | | 47,249 | |
| | | | 284,219,629 | |
Change in net unrealized appreciation (depreciation) of: | | | | |
Unaffiliated investment securities | | | 345,992,123 | |
Affiliated investment securities | | | (3,707 | ) |
Foreign currencies | | | 3,353 | |
| | | | 345,991,769 | |
Net realized and unrealized gain | | | 630,211,398 | |
Net increase in net assets resulting from operations | | | $619,809,339 | |
See accompanying Notes to Financial Statements which are an integral part of the financial statements.
11 Invesco Technology Fund
Statement of Changes in Net Assets
For the years ended April 30, 2021 and 2020
| | | | | | | | |
| | | 2021 | | | 2020 | |
Operations: | | | | | | | | |
Net investment income (loss) | | $ | (10,402,059) | | | $ | (5,360,535) | |
Net realized gain | | | 284,219,629 | | | | 49,503,384 | |
Change in net unrealized appreciation | | | 345,991,769 | | | | 64,311,381 | |
Net increase in net assets resulting from operations | | | 619,809,339 | | | | 108,454,230 | |
| | |
Distributions to shareholders from distributable earnings: | | | | | | | | |
Class A | | | (56,594,444 | ) | | | (41,438,833 | ) |
Class C | | | (5,130,047 | ) | | | (3,289,057 | ) |
Class Y | | | (3,571,098 | ) | | | (2,853,254 | ) |
Investor Class | | | (44,227,833 | ) | | | (43,656,636 | ) |
Class R5 | | | (38,272 | ) | | | (22,015 | ) |
Class R6 | | | (56,434 | ) | | | (39,211 | ) |
Total distributions from distributable earnings | | | (109,618,128 | ) | | | (91,299,006 | ) |
| | |
Share transactions–net: | | | | | | | | |
Class A | | | 90,630,656 | | | | 118,730,288 | |
Class C | | | 9,021,317 | | | | 4,966,683 | |
Class Y | | | 8,626,013 | | | | 3,289,110 | |
Investor Class | | | 1,616,279 | | | | 1,069,484 | |
Class R5 | | | 377,574 | | | | (7,732 | ) |
Class R6 | | | 809,901 | | | | 60,237 | |
Net increase in net assets resulting from share transactions | | | 111,081,740 | | | | 128,108,070 | |
Net increase in net assets | | | 621,272,951 | | | | 145,263,294 | |
| | |
Net assets: | | | | | | | | |
Beginning of year | | | 1,125,790,223 | | | | 980,526,929 | |
End of year | | $ | 1,747,063,174 | | | $ | 1,125,790,223 | |
See accompanying Notes to Financial Statements which are an integral part of the financial statements.
12 Invesco Technology Fund
Financial Highlights
The following schedule presents financial highlights for a share of the Fund outstanding throughout the periods indicated.
| | | | | | | | | | | | | | | | | | | | | | | | | | | | | | | | | | | | | | | | | | | | | | | | | | | | | | | | | | | | |
| | | Net asset
value,
beginning
of period | | Net
investment
income
(loss)(a) | | Net gains
(losses)
on securities
(both
realized and
unrealized) | | Total from
investment
operations | | Distributions
from net
realized
gains | | Net asset
value, end
of period | | Total
return (b) | | Net assets,
end of period
(000’s omitted) | | Ratio of
expenses
to average
net assets
with fee waivers
and/or
expenses
absorbed | | Ratio of
expenses
to average net
assets without
fee waivers
and/ or
expenses
absorbed | | Ratio of net
investment
income
(loss)
to average
net assets | | Portfolio
turnover (c) |
Class A | | | | | | | | | | | | | | | | | | | | | | | | | | | | | | | | | | | | | | | | | | | | | | | | | | | | | | | | | | | | |
Year ended 04/30/21 | | | $ | 50.35 | | | | $ | (0.46 | ) | | | $ | 27.38 | | | | $ | 26.92 | | | | $ | (4.77 | ) | | | $ | 72.50 | | | | | 54.37 | % | | | $ | 927,620 | | | | | 1.10 | %(d) | | | | 1.10 | %(d) | | | | (0.71 | )%(d) | | | | 59 | % |
Year ended 04/30/20 | | | | 49.68 | | | | | (0.29 | ) | | | | 5.71 | | | | | 5.42 | | | | | (4.75 | ) | | | | 50.35 | | | | | 11.31 | | | | | 572,351 | | | | | 1.19 | | | | | 1.19 | | | | | (0.58 | ) | | | | 38 | |
Year ended 04/30/19 | | | | 46.98 | | | | | (0.34 | ) | | | | 6.66 | | | | | 6.32 | | | | | (3.62 | ) | | | | 49.68 | | | | | 14.87 | | | | | 443,050 | | | | | 1.23 | | | | | 1.23 | | | | | (0.71 | ) | | | | 48 | |
Year ended 04/30/18 | | | | 39.78 | | | | | (0.29 | ) | | | | 9.31 | | | | | 9.02 | | | | | (1.82 | ) | | | | 46.98 | | | | | 22.94 | | | | | 377,444 | | | | | 1.27 | | | | | 1.28 | | | | | (0.63 | ) | | | | 47 | |
Year ended 04/30/17 | | | | 32.99 | | | | | (0.23 | ) | | | | 9.39 | | | | | 9.16 | | | | | (2.37 | ) | | | | 39.78 | | | | | 28.80 | | | | | 310,505 | | | | | 1.43 | | | | | 1.43 | | | | | (0.65 | ) | | | | 49 | |
Class C | | | | | | | | | | | | | | | | | | | | | | | | | | | | | | | | | | | | | | | | | | | | | | | | | | | | | | | | | | | | |
Year ended 04/30/21 | | | | 38.38 | | | | | (0.72 | ) | | | | 20.70 | | | | | 19.98 | | | | | (4.77 | ) | | | | 53.59 | | | | | 53.20 | (e) | | | | 56,566 | | | | | 1.84 | (d)(e) | | | | 1.84 | (d)(e) | | | | (1.45 | )(d)(e) | | | | 59 | |
Year ended 04/30/20 | | | | 39.21 | | | | | (0.51 | ) | | | | 4.43 | | | | | 3.92 | | | | | (4.75 | ) | | | | 38.38 | | | | | 10.47 | | | | | 32,723 | | | | | 1.94 | | | | | 1.94 | | | | | (1.33 | ) | | | | 38 | |
Year ended 04/30/19 | | | | 38.15 | | | | | (0.57 | ) | | | | 5.25 | | | | | 4.68 | | | | | (3.62 | ) | | | | 39.21 | | | | | 13.98 | | | | | 28,217 | | | | | 1.98 | | | | | 1.98 | | | | | (1.46 | ) | | | | 48 | |
Year ended 04/30/18 | | | | 32.84 | | | | | (0.51 | ) | | | | 7.64 | | | | | 7.13 | | | | | (1.82 | ) | | | | 38.15 | | | | | 22.02 | | | | | 39,954 | | | | | 2.02 | | | | | 2.03 | | | | | (1.38 | ) | | | | 47 | |
Year ended 04/30/17 | | | | 27.80 | | | | | (0.42 | ) | | | | 7.83 | | | | | 7.41 | | | | | (2.37 | ) | | | | 32.84 | | | | | 27.85 | | | | | 29,930 | | | | | 2.18 | | | | | 2.18 | | | | | (1.40 | ) | | | | 49 | |
Class Y | | | | | | | | | | | | | | | | | | | | | | | | | | | | | | | | | | | | | | | | | | | | | | | | | | | | | | | | | | | | |
Year ended 04/30/21 | | | | 51.45 | | | | | (0.31 | ) | | | | 28.02 | | | | | 27.71 | | | | | (4.77 | ) | | | | 74.39 | | | | | 54.75 | | | | | 62,294 | | | | | 0.85 | (d) | | | | 0.85 | (d) | | | | (0.46 | )(d) | | | | 59 | |
Year ended 04/30/20 | | | | 50.55 | | | | | (0.17 | ) | | | | 5.82 | | | | | 5.65 | | | | | (4.75 | ) | | | | 51.45 | | | | | 11.57 | | | | | 36,341 | | | | | 0.94 | | | | | 0.94 | | | | | (0.33 | ) | | | | 38 | |
Year ended 04/30/19 | | | | 47.62 | | | | | (0.22 | ) | | | | 6.77 | | | | | 6.55 | | | | | (3.62 | ) | | | | 50.55 | | | | | 15.16 | | | | | 32,658 | | | | | 0.98 | | | | | 0.98 | | | | | (0.46 | ) | | | | 48 | |
Year ended 04/30/18 | | | | 40.21 | | | | | (0.18 | ) | | | | 9.41 | | | | | 9.23 | | | | | (1.82 | ) | | | | 47.62 | | | | | 23.22 | | | | | 27,364 | | | | | 1.02 | | | | | 1.03 | | | | | (0.38 | ) | | | | 47 | |
Year ended 04/30/17 | | | | 33.24 | | | | | (0.14 | ) | | | | 9.48 | | | | | 9.34 | | | | | (2.37 | ) | | | | 40.21 | | | | | 29.13 | | | | | 17,205 | | | | | 1.18 | | | | | 1.18 | | | | | (0.40 | ) | | | | 49 | |
Investor Class | | | | | | | | | | | | | | | | | | | | | | | | | | | | | | | | | | | | | | | | | | | | | | | | | | | | | | | | | | | | |
Year ended 04/30/21 | | | | 50.13 | | | | | (0.39 | ) | | | | 27.27 | | | | | 26.88 | | | | | (4.77 | ) | | | | 72.24 | | | | | 54.53 | (f) | | | | 698,143 | | | | | 1.00 | (d)(f) | | | | 1.00 | (d)(f) | | | | (0.61 | )(d)(f) | | | | 59 | |
Year ended 04/30/20 | | | | 49.44 | | | | | (0.24 | ) | | | | 5.68 | | | | | 5.44 | | | | | (4.75 | ) | | | | 50.13 | | | | | 11.41 | (f) | | | | 483,563 | | | | | 1.09 | (f) | | | | 1.09 | (f) | | | | (0.48 | )(f) | | | | 38 | |
Year ended 04/30/19 | | | | 46.71 | | | | | (0.28 | ) | | | | 6.63 | | | | | 6.35 | | | | | (3.62 | ) | | | | 49.44 | | | | | 15.02 | (f) | | | | 475,857 | | | | | 1.11 | (f) | | | | 1.11 | (f) | | | | (0.59 | )(f) | | | | 48 | |
Year ended 04/30/18 | | | | 39.53 | | | | | (0.25 | ) | | | | 9.25 | | | | | 9.00 | | | | | (1.82 | ) | | | | 46.71 | | | | | 23.03 | (f) | | | | 447,456 | | | | | 1.19 | (f) | | | | 1.20 | (f) | | | | (0.55 | )(f) | | | | 47 | |
Year ended 04/30/17 | | | | 32.78 | | | | | (0.21 | ) | | | | 9.33 | | | | | 9.12 | | | | | (2.37 | ) | | | | 39.53 | | | | | 28.86 | (f) | | | | 384,283 | | | | | 1.35 | (f) | | | | 1.35 | (f) | | | | (0.57 | )(f) | | | | 49 | |
Class R5 | | | | | | | | | | | | | | | | | | | | | | | | | | | | | | | | | | | | | | | | | | | | | | | | | | | | | | | | | | | | |
Year ended 04/30/21 | | | | 61.17 | | | | | (0.32 | ) | | | | 33.43 | | | | | 33.11 | | | | | (4.77 | ) | | | | 89.51 | | | | | 54.88 | | | | | 794 | | | | | 0.77 | (d) | | | | 0.77 | (d) | | | | (0.38 | )(d) | | | | 59 | |
Year ended 04/30/20 | | | | 59.18 | | | | | (0.12 | ) | | | | 6.86 | | | | | 6.74 | | | | | (4.75 | ) | | | | 61.17 | | | | | 11.74 | | | | | 267 | | | | | 0.81 | | | | | 0.81 | | | | | (0.20 | ) | | | | 38 | |
Year ended 04/30/19 | | | | 55.03 | | | | | (0.16 | ) | | | | 7.93 | | | | | 7.77 | | | | | (3.62 | ) | | | | 59.18 | | | | | 15.34 | | | | | 263 | | | | | 0.81 | | | | | 0.81 | | | | | (0.29 | ) | | | | 48 | |
Year ended 04/30/18 | | | | 46.14 | | | | | (0.11 | ) | | | | 10.82 | | | | | 10.71 | | | | | (1.82 | ) | | | | 55.03 | | | | | 23.44 | | | | | 163 | | | | | 0.85 | | | | | 0.85 | | | | | (0.21 | ) | | | | 47 | |
Year ended 04/30/17 | | | | 37.74 | | | | | (0.05 | ) | | | | 10.82 | | | | | 10.77 | | | | | (2.37 | ) | | | | 46.14 | | | | | 29.45 | | | | | 132 | | | | | 0.92 | | | | | 0.92 | | | | | (0.14 | ) | | | | 49 | |
Class R6 | | | | | | | | | | | | | | | | | | | | | | | | | | | | | | | | | | | | | | | | | | | | | | | | | | | | | | | | | | | | |
Year ended 04/30/21 | | | | 61.21 | | | | | (0.29 | ) | | | | 33.45 | | | | | 33.16 | | | | | (4.77 | ) | | | | 89.60 | | | | | 54.93 | | | | | 1,647 | | | | | 0.74 | (d) | | | | 0.74 | (d) | | | | (0.35 | )(d) | | | | 59 | |
Year ended 04/30/20 | | | | 59.20 | | | | | (0.10 | ) | | | | 6.86 | | | | | 6.76 | | | | | (4.75 | ) | | | | 61.21 | | | | | 11.77 | | | | | 545 | | | | | 0.77 | | | | | 0.77 | | | | | (0.16 | ) | | | | 38 | |
Year ended 04/30/19 | | | | 55.04 | | | | | (0.15 | ) | | | | 7.93 | | | | | 7.78 | | | | | (3.62 | ) | | | | 59.20 | | | | | 15.36 | | | | | 483 | | | | | 0.80 | | | | | 0.80 | | | | | (0.28 | ) | | | | 48 | |
Year ended 04/30/18 | | | | 46.14 | | | | | (0.11 | ) | | | | 10.83 | | | | | 10.72 | | | | | (1.82 | ) | | | | 55.04 | | | | | 23.47 | | | | | 42 | | | | | 0.85 | | | | | 0.85 | | | | | (0.21 | ) | | | | 47 | |
Period ended 04/30/17(g) | | | | 44.75 | | | | | (0.00 | ) | | | | 1.39 | | | | | 1.39 | | | | | — | | | | | 46.14 | | | | | 3.10 | | | | | 10 | | | | | 0.89 | (h) | | | | 0.89 | (h) | | | | (0.11 | )(h) | | | | 49 | |
| (a) | Calculated using average shares outstanding. |
| (b) | Includes adjustments in accordance with accounting principles generally accepted in the United States of America and as such, the net asset value for financial reporting purposes and the returns based upon those net asset values may differ from the net asset value and returns for shareholder transactions. Does not include sales charges and is not annualized for periods less than one year, if applicable. |
| (c) | Portfolio turnover is calculated at the fund level and is not annualized for periods less than one year, if applicable. For the year ended April 30, 2020, the portfolio turnover calculation excludes the value of securities purchased of $50,768,823 in the effort to realign the Fund’s portfolio holdings after the reorganization of Invesco Technology Sector Fund into the Fund. |
| (d) | Ratios are based on average daily net assets (000’s omitted) of $792,436, $50,574, $51,289, $621,811 , $507 and $980 for Class A, Class C, Class Y, Investor Class, Class R5 and Class R6 shares, respectively. |
| (e) | The total return, ratio of expenses to average net assets and ratio of net investment income (loss) to average net assets reflect actual 12b-1 fees of 0.99% for the year ended April 30, 2021. |
| (f) | The total return, ratio of expenses to average net assets and ratio of net investment income (loss) to average net assets reflect actual 12b-1 fees of 0.15%, 0.15%, 0.13% 0.17% and 0.17% for the years ended April 30, 2021, 2020, 2019, 2018 and 2017, respectively. |
| (g) | Commencement date of April 4, 2017. |
See accompanying Notes to Financial Statements which are an integral part of the financial statements.
13 Invesco Technology Fund
Notes to Financial Statements
April 30, 2021
NOTE 1—Significant Accounting Policies
Invesco Technology Fund (the “Fund”) is a series portfolio of AIM Sector Funds (Invesco Sector Funds) (the “Trust”). The Trust is a Delaware statutory trust registered under the Investment Company Act of 1940, as amended (the “1940 Act”), as an open-end series management investment company authorized to issue an unlimited number of shares of beneficial interest. The Fund is classified as non-diversified. The Fund’s classification changed from diversified to non-diversified during the period. Information presented in these financial statements pertains only to the Fund. Matters affecting the Fund or each class will be voted on exclusively by the shareholders of the Fund or each class.
The Fund’s investment objective is long-term growth of capital.
The Fund currently consists of six different classes of shares: Class A, Class C, Class Y, Investor Class, Class R5 and Class R6. Class Y and Investor Class shares are available only to certain investors. Class A shares are sold with a front-end sales charge unless certain waiver criteria are met and under certain circumstances load waived shares may be subject to contingent deferred sales charges (“CDSC”). Class C shares are sold with a CDSC. Class Y, Investor Class, Class R5 and Class R6 shares are sold at net asset value. Class C shares held for ten years after purchase are eligible for automatic conversion into Class A shares of the same Fund (the “Conversion Feature”). The automatic conversion pursuant to the Conversion Feature will generally occur at the end of the month following the tenth anniversary after a purchase of Class C shares. Effective November 30, 2020, the automatic conversion pursuant to the Conversion Feature changed from ten years to eight years. The first conversion of Class C shares to Class A shares occurred at the end of December 2020 for all Class C shares that were held for more than eight years as of November 30, 2020.
The Fund is an investment company and accordingly follows the investment company accounting and reporting guidance in accordance with Financial Accounting Standards Board Accounting Standards Codification Topic 946, Financial Services – Investment Companies.
The following is a summary of the significant accounting policies followed by the Fund in the preparation of its financial statements.
| A. | Security Valuations — Securities, including restricted securities, are valued according to the following policy. |
A security listed or traded on an exchange (except convertible securities) is valued at its last sales price or official closing price as of the close of the customary trading session on the exchange where the security is principally traded, or lacking any sales or official closing price on a particular day, the security may be valued at the closing bid price on that day. Securities traded in the over-the-counter market are valued based on prices furnished by independent pricing services or market makers. When such securities are valued by an independent pricing service they may be considered fair valued. Futures contracts are valued at the final settlement price set by an exchange on which they are principally traded. Listed options are valued at the mean between the last bid and asked prices from the exchange on which they are principally traded. Options not listed on an exchange are valued by an independent source at the mean between the last bid and asked prices. For purposes of determining net asset value (“NAV”) per share, futures and option contracts generally are valued 15 minutes after the close of the customary trading session of the New York Stock Exchange (“NYSE”).
Investments in open-end and closed-end registered investment companies that do not trade on an exchange are valued at the end-of-day net asset value per share. Investments in open-end and closed-end registered investment companies that trade on an exchange are valued at the last sales price or official closing price as of the close of the customary trading session on the exchange where the security is principally traded.
Debt obligations (including convertible securities) and unlisted equities are fair valued using an evaluated quote provided by an independent pricing service. Evaluated quotes provided by the pricing service may be determined without exclusive reliance on quoted prices, and may reflect appropriate factors such as institution-size trading in similar groups of securities, developments related to specific securities, dividend rate (for unlisted equities), yield (for debt obligations), quality, type of issue, coupon rate (for debt obligations), maturity (for debt obligations), individual trading characteristics and other market data. Pricing services generally value debt obligations assuming orderly transactions of institutional round lot size, but a fund may hold or transact in the same securities in smaller, odd lot sizes. Odd lots often trade at lower prices than institutional round lots. Debt obligations are subject to interest rate and credit risks. In addition, all debt obligations involve some risk of default with respect to interest and/or principal payments.
Foreign securities’ (including foreign exchange contracts) prices are converted into U.S. dollar amounts using the applicable exchange rates as of the close of the NYSE. If market quotations are available and reliable for foreign exchange-traded equity securities, the securities will be valued at the market quotations. Because trading hours for certain foreign securities end before the close of the NYSE, closing market quotations may become unreliable. If between the time trading ends on a particular security and the close of the customary trading session on the NYSE, events occur that the investment adviser determines are significant and make the closing price unreliable, the Fund may fair value the security. If the event is likely to have affected the closing price of the security, the security will be valued at fair value in good faith using procedures approved by the Board of Trustees. Adjustments to closing prices to reflect fair value may also be based on a screening process of an independent pricing service to indicate the degree of certainty, based on historical data, that the closing price in the principal market where a foreign security trades is not the current value as of the close of the NYSE. Foreign securities’ prices meeting the approved degree of certainty that the price is not reflective of current value will be priced at the indication of fair value from the independent pricing service. Multiple factors may be considered by the independent pricing service in determining adjustments to reflect fair value and may include information relating to sector indices, American Depositary Receipts and domestic and foreign index futures. Foreign securities may have additional risks including exchange rate changes, potential for sharply devalued currencies and high inflation, political and economic upheaval, the relative lack of issuer information, relatively low market liquidity and the potential lack of strict financial and accounting controls and standards.
Securities for which market prices are not provided by any of the above methods may be valued based upon quotes furnished by independent sources. The last bid price may be used to value equity securities. The mean between the last bid and asked prices is used to value debt obligations, including corporate loans.
Securities for which market quotations are not readily available or became unreliable are valued at fair value as determined in good faith by or under the supervision of the Trust’s officers following procedures approved by the Board of Trustees. Issuer specific events, market trends, bid/asked quotes of brokers and information providers and other market data may be reviewed in the course of making a good faith determination of a security’s fair value.
The Fund may invest in securities that are subject to interest rate risk, meaning the risk that the prices will generally fall as interest rates rise and, conversely, the prices will generally rise as interest rates fall. Specific securities differ in their sensitivity to changes in interest rates depending on their individual characteristics. Changes in interest rates may result in increased market volatility, which may affect the value and/or liquidity of certain Fund investments.
Valuations change in response to many factors including the historical and prospective earnings of the issuer, the value of the issuer’s assets, general market conditions which are not specifically related to the particular issuer, such as real or perceived adverse economic conditions, changes in the general outlook for revenues or corporate earnings, changes in interest or currency rates, regional or global instability, natural or environmental disasters, widespread disease or other public health issues, war, acts of terrorism or adverse investor sentiment generally and market liquidity. Because of the inherent uncertainties of valuation, the values reflected in the financial statements may materially differ from the value received upon actual sale of those investments.
| B. | Securities Transactions and Investment Income — Securities transactions are accounted for on a trade date basis. Realized gains or losses on sales are computed on the basis of specific identification of the securities sold. Interest income (net of withholding tax, if any) is recorded on an accrual basis from |
14 Invesco Technology Fund
| | settlement date and includes coupon interest and amortization of premium and accretion of discount on debt securities as applicable. Dividend income (net of withholding tax, if any) is recorded on the ex-dividend date. |
The Fund may periodically participate in litigation related to Fund investments. As such, the Fund may receive proceeds from litigation settlements. Any proceeds received are included in the Statement of Operations as realized gain (loss) for investments no longer held and as unrealized gain (loss) for investments still held.
Brokerage commissions and mark ups are considered transaction costs and are recorded as an increase to the cost basis of securities purchased and/or a reduction of proceeds on a sale of securities. Such transaction costs are included in the determination of net realized and unrealized gain (loss) from investment securities reported in the Statement of Operations and the Statement of Changes in Net Assets and the net realized and unrealized gains (losses) on securities per share in the Financial Highlights. Transaction costs are included in the calculation of the Fund’s net asset value and, accordingly, they reduce the Fund’s total returns. These transaction costs are not considered operating expenses and are not reflected in net investment income reported in the Statement of Operations and the Statement of Changes in Net Assets, or the net investment income per share and the ratios of expenses and net investment income reported in the Financial Highlights, nor are they limited by any expense limitation arrangements between the Fund and the investment adviser.
The Fund allocates income and realized and unrealized capital gains and losses to a class based on the relative net assets of each class.
| C. | Country Determination — For the purposes of making investment selection decisions and presentation in the Schedule of Investments, the investment adviser may determine the country in which an issuer is located and/or credit risk exposure based on various factors. These factors include the laws of the country under which the issuer is organized, where the issuer maintains a principal office, the country in which the issuer derives 50% or more of its total revenues and the country that has the primary market for the issuer’s securities, as well as other criteria. Among the other criteria that may be evaluated for making this determination are the country in which the issuer maintains 50% or more of its assets, the type of security, financial guarantees and enhancements, the nature of the collateral and the sponsor organization. Country of issuer and/or credit risk exposure has been determined to be the United States of America, unless otherwise noted. |
| D. | Distributions – Distributions from net investment income and net realized capital gain, if any, are generally declared and paid annually and recorded on the ex-dividend date. The Fund may elect to treat a portion of the proceeds from redemptions as distributions for federal income tax purposes. |
| E. | Federal Income Taxes – The Fund intends to comply with the requirements of Subchapter M of the Internal Revenue Code of 1986, as amended (the “Internal Revenue Code”), necessary to qualify as a regulated investment company and to distribute substantially all of the Fund’s taxable earnings to shareholders. As such, the Fund will not be subject to federal income taxes on otherwise taxable income (including net realized capital gain) that is distributed to shareholders. |
Therefore, no provision for federal income taxes is recorded in the financial statements.
The Fund recognizes the tax benefits of uncertain tax positions only when the position is more likely than not to be sustained. Management has analyzed the Fund’s uncertain tax positions and concluded that no liability for unrecognized tax benefits should be recorded related to uncertain tax positions. Management is not aware of any tax positions for which it is reasonably possible that the total amounts of unrecognized tax benefits will change materially in the next 12 months.
The Fund files tax returns in the U.S. Federal jurisdiction and certain other jurisdictions. Generally, the Fund is subject to examinations by such taxing authorities for up to three years after the filing of the return for the tax period.
| F. | Expenses – Fees provided for under the Rule 12b-1 plan of a particular class of the Fund are charged to the operations of such class. Transfer agency fees and expenses and other shareholder recordkeeping fees and expenses attributable to Class R5 and Class R6 are allocated to each share class based on relative net assets. Sub-accounting fees attributable to Class R5 are charged to the operations of the class. Transfer agency fees and expenses and other shareholder recordkeeping fees and expenses relating to all other classes are allocated among those classes based on relative net assets. All other expenses are allocated among the classes based on relative net assets. |
| G. | Accounting Estimates – The preparation of financial statements in conformity with accounting principles generally accepted in the United States of America (“GAAP”) requires management to make estimates and assumptions that affect the reported amounts of assets and liabilities at the date of the financial statements and the reported amounts of revenues and expenses during the reporting period including estimates and assumptions related to taxation. Actual results could differ from those estimates by a significant amount. In addition, the Fund monitors for material events or transactions that may occur or become known after the period-end date and before the date the financial statements are released to print. |
| H. | Indemnifications – Under the Trust’s organizational documents, each Trustee, officer, employee or other agent of the Trust is indemnified against certain liabilities that may arise out of the performance of their duties to the Fund. Additionally, in the normal course of business, the Fund enters into contracts, including the Fund’s servicing agreements, that contain a variety of indemnification clauses. The Fund’s maximum exposure under these arrangements is unknown as this would involve future claims that may be made against the Fund that have not yet occurred. The risk of material loss as a result of such indemnification claims is considered remote. |
| I. | Securities Lending – The Fund may lend portfolio securities having a market value up to one-third of the Fund’s total assets. Such loans are secured by collateral equal to no less than the market value of the loaned securities determined daily by the securities lending provider. Such collateral will be cash or debt securities issued or guaranteed by the U.S. Government or any of its sponsored agencies. Cash collateral received in connection with these loans is invested in short-term money market instruments or affiliated money market funds and is shown as such on the Schedule of Investments. The Fund bears the risk of loss with respect to the investment of collateral. It is the Fund’s policy to obtain additional collateral from or return excess collateral to the borrower by the end of the next business day, following the valuation date of the securities loaned. Therefore, the value of the collateral held may be temporarily less than the value of the securities on loan. When loaning securities, the Fund retains certain benefits of owning the securities, including the economic equivalent of dividends or interest generated by the security. Lending securities entails a risk of loss to the Fund if, and to the extent that, the market value of the securities loaned were to increase and the borrower did not increase the collateral accordingly, and the borrower failed to return the securities. The securities loaned are subject to termination at the option of the borrower or the Fund. Upon termination, the borrower will return to the Fund the securities loaned and the Fund will return the collateral. Upon the failure of the borrower to return the securities, collateral may be liquidated and the securities may be purchased on the open market to replace the loaned securities. The Fund could experience delays and costs in gaining access to the collateral and the securities may lose value during the delay which could result in potential losses to the Fund. Some of these losses may be indemnified by the lending agent. The Fund bears the risk of any deficiency in the amount of the collateral available for return to the borrower due to any loss on the collateral invested. Dividends received on cash collateral investments for securities lending transactions, which are net of compensation to counterparties, are included in Dividends from affiliated money market funds on the Statement of Operations. The aggregate value of securities out on loan, if any, is shown as a footnote on the Statement of Assets and Liabilities. |
| J. | Foreign Currency Translations — Foreign currency is valued at the close of the NYSE based on quotations posted by banks and major currency dealers. Portfolio securities and other assets and liabilities denominated in foreign currencies are translated into U.S. dollar amounts at the date of valuation. Purchases and sales of portfolio securities (net of foreign taxes withheld on disposition) and income items denominated in foreign currencies are translated into U.S. dollar amounts on the respective dates of such transactions. The Fund does not separately account for the portion of the results of operations resulting from changes in foreign exchange rates on investments and the fluctuations arising from changes in market prices of securities held. The combined results of changes in foreign exchange rates and the fluctuation of market prices on investments (net of estimated foreign tax withholding) are included with the net realized and unrealized gain or loss from investments in the Statement of Operations. Reported net realized foreign currency gains or losses arise from (1) sales of foreign currencies, (2) currency gains or losses realized between the trade and settlement dates on securities transactions, and (3) the difference between the amounts of dividends, interest, and foreign withholding taxes recorded on the Fund’s books and the U.S. dollar equivalent of the amounts actually received or paid. Net unrealized |
15 Invesco Technology Fund
foreign currency gains and losses arise from changes in the fair values of assets and liabilities, other than investments in securities at fiscal period end, resulting from changes in exchange rates.
The Fund may invest in foreign securities, which may be subject to foreign taxes on income, gains on investments or currency repatriation, a portion of which may be recoverable. Foreign taxes, if any, are recorded based on the tax regulations and rates that exist in the foreign markets in which the Fund invests and are shown in the Statement of Operations.
K. Forward Foreign Currency Contracts — The Fund may engage in foreign currency transactions either on a spot (i.e. for prompt delivery and settlement) basis, or through forward foreign currency contracts, to manage or minimize currency or exchange rate risk.
| | The Fund may also enter into forward foreign currency contracts for the purchase or sale of a security denominated in a foreign currency in order to “lock in” the U.S. dollar price of that security, or the Fund may also enter into forward foreign currency contracts that do not provide for physical settlement of the two currencies, but instead are settled by a single cash payment calculated as the difference between the agreed upon exchange rate and the spot rate at settlement based upon an agreed upon notional amount (non-deliverable forwards). The Fund will set aside liquid assets in an amount equal to the daily mark-to-market obligation for forward foreign currency contracts. |
A forward foreign currency contract is an obligation between two parties (“Counterparties”) to purchase or sell a specific currency for an agreed-upon price at a future date. The use of forward foreign currency contracts does not eliminate fluctuations in the price of the underlying securities the Fund owns or intends to acquire but establishes a rate of exchange in advance. Fluctuations in the value of these contracts are measured by the difference in the contract date and reporting date exchange rates and are recorded as unrealized appreciation (depreciation) until the contracts are closed. When the contracts are closed, realized gains (losses) are recorded. Realized and unrealized gains (losses) on the contracts are included in the Statement of Operations. The primary risks associated with forward foreign currency contracts include failure of the Counterparty to meet the terms of the contract and the value of the foreign currency changing unfavorably. These risks may be in excess of the amounts reflected in the Statement of Assets and Liabilities.
| L. | COVID-19 Risk - The COVID-19 strain of coronavirus has resulted in instances of market closures and dislocations, extreme volatility, liquidity constraints and increased trading costs. Efforts to contain its spread have resulted in travel restrictions, disruptions of healthcare systems, business operations and supply chains, layoffs, lower consumer demand, and defaults, among other significant economic impacts that have disrupted global economic activity across many industries. Such economic impacts may exacerbate other pre-existing political, social and economic risks locally or globally. |
The ongoing effects of COVID-19 are unpredictable and may result in significant and prolonged effects on the Fund’s performance.
| M. | Other Risks - The Fund’s investments are concentrated in a comparatively narrow segment of the economy, which may make the Fund more volatile. |
Many products and services offered in technology-related industries are subject to rapid obsolescence, which may lower the value of the issuers in this sector. The Fund is non-diversified and may invest in securities of fewer issuers than if it were diversified. Thus, the value of the Fund’s shares may vary more widely and the Fund may be subject to greater market and credit risk than if the Fund invested more broadly.
NOTE 2—Advisory Fees and Other Fees Paid to Affiliates
The Trust has entered into a master investment advisory agreement with Invesco Advisers, Inc. (the “Adviser” or “Invesco”). Under the terms of the investment advisory agreement, the Fund accrues daily and pays monthly an advisory fee to the Adviser based on the annual rate of the Fund’s average daily net assets as follows:
| | | | |
| Average Daily Net Assets | | Rate | |
First $ 500 million | | | 0.670% | |
Next $500 million | | | 0.640% | |
Next $1 billion | | | 0.520% | |
Next $2 billion | | | 0.450% | |
Next $2 billion | | | 0.400% | |
Next $2 billion | | | 0.375% | |
Over $8 billion | | | 0.350% | |
For the year ended April 30, 2021, the effective advisory fee rate incurred by the Fund was 0.61%.
Under the terms of a master sub-advisory agreement between the Adviser and each of Invesco Asset Management Deutschland GmbH, Invesco Asset Management Limited, Invesco Asset Management (Japan) Limited, Invesco Hong Kong Limited, Invesco Senior Secured Management, Inc. and Invesco Canada Ltd. (collectively, the “Affiliated Sub-Advisers”) the Adviser, not the Fund, will pay 40% of the fees paid to the Adviser to any such Affiliated Sub-Adviser(s) that provide(s) discretionary investment management services to the Fund based on the percentage of assets allocated to such Affiliated Sub-Adviser(s).
The Adviser has contractually agreed, through April 30, 2021, to waive advisory fees and/or reimburse expenses of all shares to the extent necessary to limit total annual fund operating expenses after fee waiver and/or expense reimbursement (excluding certain items discussed below) of Class A, Class C, Class Y, Investor Class, Class R5 and Class R6 shares to 1.22%, 1.92%, 0.97%, 1.22%, 0.97% and 0.97%, respectively, of the Fund’s average daily net assets (the “expense limits”). Effective May 1, 2021 the Adviser has contractually agreed, through at least June 30, 2022, to waive advisory fees and/or reimburse expenses of all shares to the extent necessary to limit total annual fund operating expenses after fee waiver and/or expense reimbursement (excluding certain items discussed below) of Class A, Class C, Class Y, Investor Class, Class R5 and Class R6 shares to 2.00%, 2.75%, 1.75%, 2.00%, 1.75% and 1.75%, respectively, of the Fund’s average daily net assets (the “expense limits”). In determining the Adviser’s obligation to waive advisory fees and/or reimburse expenses, the following expenses are not taken into account, and could cause the total annual fund operating expenses after fee waiver and/or expense reimbursement to exceed the numbers reflected above: (1) interest; (2) taxes; (3) dividend expense on short sales; (4) extraordinary or nonroutine items, including litigation expenses; and (5) expenses that the Fund has incurred but did not actually pay because of an expense offset arrangement. Unless Invesco continues the fee waiver agreement, it will terminate on June 30, 2022. During its term, the fee waiver agreement cannot be terminated or amended to increase the expense limits or reduce the advisory fee waiver without approval of the Board of Trustees. The Adviser did not waive fees and/or reimburse expenses during the period under these expense limits.
Further, the Adviser has contractually agreed, through at least June 30, 2023, to waive the advisory fee payable by the Fund in an amount equal to 100% of the net advisory fees the Adviser receives from the affiliated money market funds on investments by the Fund of uninvested cash (excluding investments of cash collateral from securities lending) in such affiliated money market funds.
For the year ended April 30, 2021, the Adviser waived advisory fees of $14,134.
The Trust has entered into a master administrative services agreement with Invesco pursuant to which the Fund has agreed to pay Invesco for certain administrative costs incurred in providing accounting services to the Fund. For the year ended April 30, 2021, expenses incurred under the agreement are shown in the Statement of Operations as Administrative services fees. Invesco has entered into a sub-administration agreement whereby State Street Bank and Trust Company (“SSB”) serves as fund accountant and provides certain administrative services to the Fund. Pursuant to a custody agreement with the Trust on behalf of the Fund, SSB also serves as the Fund’s custodian.
The Trust has entered into a transfer agency and service agreement with Invesco Investment Services, Inc. (“IIS”) pursuant to which the Fund has agreed to pay IIS a fee for providing transfer agency and shareholder services to the Fund and reimburse IIS for certain expenses incurred by IIS in the course of providing such services.
16 Invesco Technology Fund
IIS may make payments to intermediaries that provide omnibus account services, sub-accounting services and/or networking services. All fees payable by IIS to intermediaries that provide omnibus account services or sub-accounting services are charged back to the Fund, subject to certain limitations approved by the Trust’s Board of Trustees. For the year ended April 30, 2021, expenses incurred under the agreement are shown in the Statement of Operations as Transfer agent fees.
The Trust has entered into master distribution agreements with Invesco Distributors, Inc. (“IDI”) to serve as the distributor for the Class A, Class C, Class Y, Investor Class, Class R5 and Class R6 shares of the Fund. The Trust has adopted plans pursuant to Rule 12b-1 under the 1940 Act with respect to the Fund’s Class A, Class C and Investor Class shares (collectively, the “Plans”). The Fund, pursuant to the Plans, reimburses IDI for its allocated share of expenses incurred for the period, up to a maximum annual rate of 0.25% of the average daily net assets of Class A shares, up to 1.00% of the average daily net assets of Class C shares, and up to 0.25% of the average daily net assets of Investor Class shares. The fees are accrued daily and paid monthly. Of the Plan payments, up to 0.25% of the average daily net assets of each class of shares may be paid to furnish continuing personal shareholder services to customers who purchase and own shares of such classes. Any amounts not paid as a service fee under the Plans would constitute an asset-based sales charge. Rules of the Financial Industry Regulatory Authority (“FINRA”) impose a cap on the total sales charges, including asset-based sales charges, that may be paid by any class of shares of the Fund. For the year ended April 30, 2021, expenses incurred under the Plans are shown in the Statement of Operations as Distribution fees.
Front-end sales commissions and CDSC (collectively, the “sales charges”) are not recorded as expenses of the Fund. Front-end sales commissions are deducted from proceeds from the sales of Fund shares prior to investment in Class A shares of the Fund. CDSC are deducted from redemption proceeds prior to remittance to the shareholder. During the year ended April 30, 2021, IDI advised the Fund that IDI retained $210,556 in front-end sales commissions from the sale of Class A shares and $1,734 and $1,886 from Class A and Class C shares, respectively, for CDSC imposed upon redemptions by shareholders.
For the year ended April 30, 2021, the Fund incurred $10,791 in brokerage commissions with Invesco Capital Markets, Inc., an affiliate of the Adviser and IDI, for portfolio transactions executed on behalf of the Fund.
Certain officers and trustees of the Trust are officers and directors of the Adviser, IIS and/or IDI.
NOTE 3—Additional Valuation Information
GAAP defines fair value as the price that would be received to sell an asset or paid to transfer a liability in an orderly transaction between market participants at the measurement date, under current market conditions. GAAP establishes a hierarchy that prioritizes the inputs to valuation methods, giving the highest priority to readily available unadjusted quoted prices in an active market for identical assets (Level 1) and the lowest priority to significant unobservable inputs (Level 3), generally when market prices are not readily available or are unreliable. Based on the valuation inputs, the securities or other investments are tiered into one of three levels. Changes in valuation methods may result in transfers in or out of an investment’s assigned level:
| | |
| Level 1 – | | Prices are determined using quoted prices in an active market for identical assets. |
| Level 2 – | | Prices are determined using other significant observable inputs. Observable inputs are inputs that other market participants may use in pricing a security. These may include quoted prices for similar securities, interest rates, prepayment speeds, credit risk, yield curves, loss severities, default rates, discount rates, volatilities and others. |
| Level 3 – | | Prices are determined using significant unobservable inputs. In situations where quoted prices or observable inputs are unavailable (for example, when there is little or no market activity for an investment at the end of the period), unobservable inputs may be used. Unobservable inputs reflect the Fund’s own assumptions about the factors market participants would use in determining fair value of the securities or instruments and would be based on the best available information. |
The following is a summary of the tiered valuation input levels, as of April 30, 2021. The level assigned to the securities valuations may not be an indication of the risk or liquidity associated with investing in those securities. Because of the inherent uncertainties of valuation, the values reflected in the financial statements may materially differ from the value received upon actual sale of those investments.
| | | | | | | | | | | | | | | | |
| | | Level 1 | | | Level 2 | | | Level 3 | | | Total | |
Investments in Securities | | | | | | | | | | | | | | | | |
Common Stocks & Other Equity Interests | | $ | 1,630,621,818 | | | $ | 99,940,890 | | | $ | — | | | $ | 1,730,562,708 | |
Money Market Funds | | | 17,294,153 | | | | 49,606,132 | | | | — | | | | 66,900,285 | |
Total Investments | | $ | 1,647,915,971 | | | $ | 149,547,022 | | | $ | — | | | $ | 1,797,462,993 | |
NOTE 4—Security Transactions with Affiliated Funds
The Fund is permitted to purchase or sell securities from or to certain other Invesco Funds under specified conditions outlined in procedures adopted by the Board of Trustees of the Trust. The procedures have been designed to ensure that any purchase or sale of securities by the Fund from or to another fund or portfolio that is or could be considered an affiliate by virtue of having a common investment adviser (or affiliated investment advisers), common Trustees and/or common officers complies with Rule 17a-7 of the 1940 Act. Further, as defined under the procedures, each transaction is effected at the current market price. Pursuant to these procedures, for the year ended April 30, 2021, the Fund engaged in securities sales of $14,774,087, which resulted in net realized gains (losses) of $(7,045,828).
NOTE 5—Expense Offset Arrangement(s)
The expense offset arrangement is comprised of transfer agency credits which result from balances in demand deposit accounts used by the transfer agent for clearing shareholder transactions. For the year ended April 30, 2021, the Fund received credits from this arrangement, which resulted in the reduction of the Fund’s total expenses of $5,872.
NOTE 6—Trustees’ and Officers’ Fees and Benefits
Trustees’ and Officers’ Fees and Benefits include amounts accrued by the Fund to pay remuneration to certain Trustees and Officers of the Fund. Trustees have the option to defer compensation payable by the Fund, and Trustees’ and Officers’ Fees and Benefits also include amounts accrued by the Fund to fund such deferred compensation amounts. Those Trustees who defer compensation have the option to select various Invesco Funds in which their deferral accounts shall be deemed to be invested. Finally, certain current Trustees were eligible to participate in a retirement plan that provided for benefits to be paid upon retirement to Trustees over a period of time based on the number of years of service. The Fund may have certain former Trustees who also participate in a retirement plan and receive benefits under such plan. Trustees’ and Officers’ Fees and Benefits include amounts accrued by the Fund to fund such retirement benefits. Obligations under the deferred compensation and retirement plans represent unsecured claims against the general assets of the Fund.
NOTE 7—Cash Balances
The Fund is permitted to temporarily carry a negative or overdrawn balance in its account with SSB, the custodian bank. Such balances, if any at period-end, are shown in the Statement of Assets and Liabilities under the payable caption Amount due custodian. To compensate the custodian bank for such overdrafts, the overdrawn Fund
17 Invesco Technology Fund
may either (1) leave funds as a compensating balance in the account so the custodian bank can be compensated by earning the additional interest; or (2) compensate by paying the custodian bank at a rate agreed upon by the custodian bank and Invesco, not to exceed the contractually agreed upon rate. The Fund may not purchase additional securities when any borrowings from banks or broker-dealers exceed 5% of the Fund’s total assets, or when any borrowings from an Invesco Fund are outstanding.
NOTE 8—Distributions to Shareholders and Tax Components of Net Assets
Tax Character of Distributions to Shareholders Paid During the Fiscal Years Ended April 30, 2021 and April 30, 2020:
| | | | | | | | |
| | | 2021 | | | 2020 | |
Ordinary income | | $ | 17,482,335 | | | $ | — | |
Long-term capital gain | | | 92,135,793 | | | | 91,299,006 | |
Total distributions | | | $109,618,128 | | | $ | 91,299,006 | |
Tax Components of Net Assets at Period-End:
| | | | |
| | | 2021 | |
Undistributed ordinary income | | $ | 4,616,762 | |
Undistributed long-term capital gain | | | 169,162,688 | |
Net unrealized appreciation — investments | | | 910,761,545 | |
Net unrealized appreciation—foreign currencies | | | 4,548 | |
Temporary book/tax differences | | | (163,797 | ) |
Shares of beneficial interest | | | 662,681,428 | |
Total net assets | | | $1,747,063,174 | |
The difference between book-basis and tax-basis unrealized appreciation (depreciation) is due to differences in the timing of recognition of gains and losses on investments for tax and book purposes. The Fund’s net unrealized appreciation (depreciation) difference is attributable primarily to wash sales.
The temporary book/tax differences are a result of timing differences between book and tax recognition of income and/or expenses. The Fund’s temporary book/tax differences are the result of the trustee deferral of compensation and retirement plan benefits.
Capital loss carryforward is calculated and reported as of a specific date. Results of transactions and other activity after that date may affect the amount of capital loss carryforward actually available for the Fund to utilize. The ability to utilize capital loss carryforward in the future may be limited under the Internal Revenue Code and related regulations based on the results of future transactions.
The Fund does not have a capital loss carryforward as of April 30, 2021.
NOTE 9—Investment Transactions
The aggregate amount of investment securities (other than short-term securities, U.S. Government obligations and money market funds, if any) purchased and sold by the Fund during the year ended April 30, 2021 was $875,988,862 and $874,652,680, respectively. Cost of investments, including any derivatives, on a tax basis includes the adjustments for financial reporting purposes as of the most recently completed federal income tax reporting period-end.
| | | | |
| Unrealized Appreciation (Depreciation) of Investments on a Tax Basis | | | |
Aggregate unrealized appreciation of investments | | $ | 921,468,641 | |
Aggregate unrealized (depreciation) of investments | | | (10,707,096 | ) |
Net unrealized appreciation of investments | | $ | 910,761,545 | |
Cost of investments for tax purposes is $886,701,448.
NOTE 10—Reclassification of Permanent Differences
Primarily as a result of differing book/tax treatment of net operating loss, on April 30, 2021, undistributed net investment income (loss) was increased by $12,555,803 and undistributed net realized gain was decreased by $12,555,803. Further, as a result of tax deferrals acquired in the reorganization of Invesco Technology Sector Fund into the Fund, and . These reclassifications had no effect on the net assets or the distributable earnings of the Fund.
NOTE 11—Share Information
| | | | | | | | | | | | | | | | | | |
| | | Summary of Share Activity | |
| | | Year ended April 30, 2021(a) | | | | | Year ended April 30, 2020 | |
| | | Shares | | | Amount | | | | | Shares | | | Amount | |
Sold: | | | | | | | | | | | | | | | | | | |
Class A | | | 2,424,624 | | | $ | 155,662,427 | | | | | | 1,342,876 | | | $ | 64,521,441 | |
Class C | | | 581,568 | | | | 27,717,028 | | | | | | 275,787 | | | | 10,322,732 | |
Class Y | | | 328,857 | | | | 22,058,618 | | | | | | 454,191 | | | | 22,597,462 | |
Investor Class | | | 393,364 | | | | 25,231,915 | | | | | | 357,306 | | | | 17,095,081 | |
Class R5 | | | 4,867 | | | | 406,156 | | | | | | 989 | | | | 58,491 | |
Class R6 | | | 18,141 | | | | 1,545,267 | | | | | | 5,036 | | | | 294,925 | |
18 Invesco Technology Fund
| | | | | | | | | | | | | | | | |
| | | Summary of Share Activity | |
| | | Year ended
April 30, 2021(a) | | | Year ended April 30, 2020 | |
| | | Shares | | | Amount | | | Shares | | | Amount | |
| | | | |
Issued as reinvestment of dividends: | | | | | | | | | | | | | | | | |
Class A | | | 805,806 | | | | $ 53,328,295 | | | | 815,214 | | | | $ 39,407,436 | |
Class C | | | 99,475 | | | | 4,879,329 | | | | 83,701 | | | | 3,093,603 | |
Class Y | | | 47,373 | | | | 3,213,783 | | | | 51,986 | | | | 2,566,017 | |
Investor Class | | | 638,359 | | | | 42,074,205 | | | | 859,801 | | | | 41,356,437 | |
Class R5 | | | 450 | | | | 36,743 | | | | 349 | | | | 20,491 | |
Class R6 | | | 669 | | | | 54,649 | | | | 638 | | | | 37,433 | |
| | | | |
Automatic conversion of Class C shares to Class A shares: | | | | | | | | | | | | | | | | |
Class A | | | 147,275 | | | | 9,862,474 | | | | 47,082 | | | | 2,309,544 | |
Class C | | | (197,768 | ) | | | (9,862,474 | ) | | | (60,747 | ) | | | (2,309,544 | ) |
| | | | |
Issued in connection with acquisitions:(b) | | | | | | | | | | | | | | | | |
Class A | | | — | | | | — | | | | 1,874,069 | | | | 91,992,978 | |
Class C | | | — | | | | — | | | | 43,497 | | | | 1,628,182 | |
Class Y | | | — | | | | — | | | | 95,840 | | | | 4,807,496 | |
| | | | |
Reacquired: | | | | | | | | | | | | | | | | |
Class A | | | (1,950,128 | ) | | | (128,222,540 | ) | | | (1,630,997 | ) | | | (79,501,111 | ) |
Class C | | | (280,337 | ) | | | (13,712,566 | ) | | | (209,207 | ) | | | (7,768,290 | ) |
Class Y | | | (245,149 | ) | | | (16,646,388 | ) | | | (541,778 | ) | | | (26,681,865 | ) |
Investor Class | | | (1,013,391 | ) | | | (65,689,841 | ) | | | (1,196,418 | ) | | | (57,382,034 | ) |
Class R5 | | | (807 | ) | | | (65,325 | ) | | | (1,419 | ) | | | (86,714 | ) |
Class R6 | | | (9,341 | ) | | | (790,015 | ) | | | (4,917 | ) | | | (272,121 | ) |
Net increase in share activity | | | 1,793,907 | | | | $111,081,740 | | | | 2,662,879 | | | | $128,108,070 | |
| (a) | There are entities that are record owners of more than 5% of the outstanding shares of the Fund and in the aggregate own 20% of the outstanding shares of the Fund. IDI has an agreement with these entities to sell Fund shares. The Fund, Invesco and/or Invesco affiliates may make payments to these entities, which are considered to be related to the Fund, for providing services to the Fund, Invesco and/or Invesco affiliates including but not limited to services such as securities brokerage, distribution, third party record keeping and account servicing. The Fund has no knowledge as to whether all or any portion of the shares owned of record by these entities are also owned beneficially. |
| (b) | After the close of business on April 17, 2020, the Fund acquired all the net assets of Invesco Technology Sector Fund (the “Target Fund”) pursuant to a plan of reorganization approved by the Board of Trustees of the Fund on February 14, 2020. The reorganization was executed in order to reduce overlap and increase efficiencies in the Adviser’s product line. The acquisition was accomplished by a tax-free exchange of 2,013,406 shares of the Fund for 4,100,576 shares outstanding of the Target Fund as of the close of business on April 17, 2020. Shares of the Target Fund were exchanged for the like class of shares of the Fund, based on the relative net asset value of the Target Fund to the net asset value of the Fund on the close of business, April 17, 2020. The Target Fund’s net assets as of the close of business on April 17, 2020 of $98,428,656, including $46,078,157 of unrealized appreciation, were combined with those of the Fund. The net assets of the Fund immediately before the acquisition were $997,498,351 and $1,095,927,007 immediately after the acquisition. |
The pro forma results of operations for the year ended April 30, 2020 assuming the reorganization had been completed on May 1, 2019, the beginning of the annual reporting period are as follows:
| | | | |
Net investment income (loss) | | $ | (5,922,338 | ) |
Net realized/unrealized gains | | | 122,298,993 | |
Change in net assets resulting from operations | | | 116,376,655 | |
As the combined investment portfolios have been managed as a single integrated portfolio since the acquisition was completed, it is not practicable to separate the amounts of revenue and earnings of the Target Fund that has been included in the Fund’s Statement of Operations since May 16, 2020.
19 Invesco Technology Fund
Report of Independent Registered Public Accounting Firm
To the Board of Trustees of AIM Sector Funds (Invesco Sector Funds) and Shareholders of Invesco Technology Fund
Opinion on the Financial Statements
We have audited the accompanying statement of assets and liabilities, including the schedule of investments, of Invesco Technology Fund (one of the funds constituting AIM Sector Funds (Invesco Sector Funds), referred to hereafter as the “Fund”) as of April 30, 2021, the related statement of operations for the year ended April 30, 2021, the statement of changes in net assets for each of the two years in the period ended April 30, 2021, including the related notes, and the financial highlights for each of the periods indicated therein (collectively referred to as the “financial statements”). In our opinion, the financial statements present fairly, in all material respects, the financial position of the Fund as of April 30, 2021, the results of its operations for the year then ended, the changes in its net assets for each of the two years in the period ended April 30, 2021 and the financial highlights for each of the periods indicated therein in conformity with accounting principles generally accepted in the United States of America.
Basis for Opinion
These financial statements are the responsibility of the Fund’s management. Our responsibility is to express an opinion on the Fund’s financial statements based on our audits. We are a public accounting firm registered with the Public Company Accounting Oversight Board (United States) (PCAOB) and are required to be independent with respect to the Fund in accordance with the U.S. federal securities laws and the applicable rules and regulations of the Securities and Exchange Commission and the PCAOB.
We conducted our audits of these financial statements in accordance with the standards of the PCAOB. Those standards require that we plan and perform the audit to obtain reasonable assurance about whether the financial statements are free of material misstatement, whether due to error or fraud.
Our audits included performing procedures to assess the risks of material misstatement of the financial statements, whether due to error or fraud, and performing procedures that respond to those risks. Such procedures included examining, on a test basis, evidence regarding the amounts and disclosures in the financial statements. Our audits also included evaluating the accounting principles used and significant estimates made by management, as well as evaluating the overall presentation of the financial statements. Our procedures included confirmation of securities owned as of April 30, 2021 by correspondence with the custodian and transfer agent. We believe that our audits provide a reasonable basis for our opinion.
/s/PricewaterhouseCoopers LLP
Houston, Texas
June 24, 2021
We have served as the auditor of one or more investment companies in the Invesco group of investment companies since at least 1995. We have not been able to determine the specific year we began serving as auditor.
20 Invesco Technology Fund
Calculating your ongoing Fund expenses
Example
As a shareholder of the Fund, you incur two types of costs: (1) transaction costs, which may include sales charges (loads) on purchase payments or contingent deferred sales charges on redemptions, if any; and (2) ongoing costs, including management fees, distribution and/or service (12b-1) fees, and other Fund expenses. This example is intended to help you understand your ongoing costs (in dollars) of investing in the Fund and to compare these costs with ongoing costs of investing in other mutual funds. The example is based on an investment of $1,000 invested at the beginning of the period and held for the entire period November 1, 2020 through April 30, 2021.
Actual expenses
The table below provides information about actual account values and actual expenses. You may use the information in this table, together with the amount you invested, to estimate the expenses that you paid over the period. Simply divide your account value by $1,000 (for example, an $8,600 account value divided by $1,000 = 8.6), then multiply the result by the number in the table under the heading entitled “Actual Expenses Paid During Period” to estimate the expenses you paid on your account during this period.
Hypothetical example for comparison purposes
The table below also provides information about hypothetical account values and hypothetical expenses based on the Fund’s actual expense ratio and an assumed rate of return of 5% per year before expenses, which is not the Fund’s actual return.
The hypothetical account values and expenses may not be used to estimate the actual ending account balance or expenses you paid for the period. You may use this information to compare the ongoing costs of investing in the Fund and other funds. To do so, compare this 5% hypothetical example with the 5% hypothetical examples that appear in the shareholder reports of the other funds.
Please note that the expenses shown in the table are meant to highlight your ongoing costs only and do not reflect any transaction costs, such as sales charges (loads) on purchase payments or contingent deferred sales charges on redemptions, if any. Therefore, the hypothetical information is useful in comparing ongoing costs only, and will not help you determine the relative total costs of owning different funds. In addition, if these transaction costs were included, your costs would have been higher.
| | | | | | | | | | | | |
| | | | | ACTUAL | | HYPOTHETICAL (5% annual return before expenses) | | |
| | Beginning
Account Value
(11/01/20) | | Ending
Account Value
(04/30/21)1 | | Expenses
Paid During
Period2 | | Ending
Account Value
(04/30/21) | | Expenses
Paid During
Period2 | | Annualized
Expense
Ratio |
| Class A | | $1,000.00 | | $1,216.60 | | $6.05 | | $1,019.34 | | $5.51 | | 1.10% |
| Class C | | 1,000.00 | | 1,212.10 | | 9.98 | | 1,015.77 | | 9.10 | | 1.82 |
| Class Y | | 1,000.00 | | 1,218.10 | | 4.62 | | 1,020.63 | | 4.21 | | 0.84 |
| Investor Class | | 1,000.00 | | 1,217.20 | | 5.50 | | 1,019.84 | | 5.01 | | 1.00 |
| Class R5 | | 1,000.00 | | 1,218.30 | | 4.29 | | 1,020.93 | | 3.91 | | 0.78 |
| Class R6 | | 1,000.00 | | 1,218.60 | | 4.13 | | 1,021.08 | | 3.76 | | 0.75 |
| 1 | The actual ending account value is based on the actual total return of the Fund for the period November 1, 2020 through April 30, 2021, after actual expenses and will differ from the hypothetical ending account value which is based on the Fund’s expense ratio and a hypothetical annual return of 5% before expenses. |
| 2 | Expenses are equal to the Fund’s annualized expense ratio as indicated above multiplied by the average account value over the period, multiplied by 181/365 to reflect the most recent fiscal half year. |
21 Invesco Technology Fund
Tax Information
Form 1099-DIV, Form 1042-S and other year–end tax information provide shareholders with actual calendar year amounts that should be included in their tax returns. Shareholders should consult their tax advisers.
The following distribution information is being provided as required by the Internal Revenue Code or to meet a specific state’s requirement.
The Fund designates the following amounts or, if subsequently determined to be different, the maximum amount allowable for its fiscal year ended April 30, 2021:
| | | | | | |
| | | | | | |
| | Federal and State Income Tax | | | | |
| | Long-Term Capital Gain Distributions | | | $92,135,793 | |
| | Qualified Dividend Income* | | | 24.21 | % |
| | Corporate Dividends Received Deduction* | | | 20.18 | % |
| | Business Interest Income* | | | 0.03 | % |
| | Qualified Business Income* | | | 0.00 | % |
| | U.S. Treasury Obligations* | | | 0.00 | % |
| | * | The above percentages are based on ordinary income dividends paid to shareholders during the Fund’s fiscal year. |
| | | | | | |
| | | | | | |
| | Non-Resident Alien Shareholders | | | | |
| | Short-Term Capital Gain Distributions | | | $17,482,335 | |
22 Invesco Technology Fund
Trustees and Officers
The address of each trustee and officer is AIM Sector Funds (Invesco Sector Funds) (the “Trust”), 11 Greenway Plaza, Suite 1000, Houston, Texas 77046-1173. The trustees serve for the life of the Trust, subject to their earlier death, incapacitation, resignation, retirement or removal as more specifically provided in the Trust’s organizational documents. Each officer serves for a one year term or until their successors are elected and qualified . Column two below includes length of time served with predecessor entities, if any.
| | | | | | | | |
Name, Year of Birth and Position(s) Held with the Trust | | Trustee and/or
Officer Since | | Principal Occupation(s) During Past 5 Years | | Number of
Funds in
Fund Complex
Overseen by
Trustee | | Other Directorship(s) Held by Trustee During Past 5 Years |
| Interested Trustee | | | | | | | | |
Martin L. Flanagan1 — 1960 Trustee and Vice Chair | | 2007 | | Executive Director, Chief Executive Officer and President, Invesco Ltd. (ultimate parent of Invesco and a global investment management firm); Trustee and Vice Chair, The Invesco Funds; Vice Chair, Investment Company Institute; and Member of Executive Board, SMU Cox School of Business Formerly: Advisor to the Board, Invesco Advisers, Inc. (formerly known as Invesco Institutional (N.A.), Inc.); Chairman and Chief Executive Officer, Invesco Advisers, Inc. (registered investment adviser); Director, Chairman, Chief Executive Officer and President, Invesco Holding Company (US), Inc. (formerly IVZ Inc.) (holding company), Invesco Group Services, Inc. (service provider) and Invesco North American Holdings, Inc. (holding company); Director, Chief Executive Officer and President, Invesco Holding Company Limited (parent of Invesco and a global investment management firm); Director, Invesco Ltd.; Chairman, Investment Company Institute and President, Co-Chief Executive Officer, Co-President, Chief Operating Officer and Chief Financial Officer, Franklin Resources, Inc. (global investment management organization) | | 184 | | None |
| 1 | Mr. Flanagan is considered an interested person (within the meaning of Section 2(a)(19) of the 1940 Act) of the Trust because he is an officer of the Adviser to the Trust, and an officer and a director of Invesco Ltd., ultimate parent of the Adviser. |
T-1 Invesco Technology Fund
Trustees and Officers—(continued)
| | | | | | | | |
Name, Year of Birth and
Position(s)
Held with the Trust | | Trustee and/or Officer
Since | | Principal Occupation(s)
During Past 5 Years | | Number of
Funds
in
Fund Complex
Overseen by
Trustee | | Other
Directorship(s)
Held by Trustee
During Past 5
Years |
| Independent Trustees | | | | | | | | |
Christopher L. Wilson – 1957 Trustee and Chair | | 2017 | | Retired Formerly: Director, TD Asset Management USA Inc. (mutual fund complex) (22 portfolios); Managing Partner, CT2, LLC (investing and consulting firm); President/Chief Executive Officer, Columbia Funds, Bank of America Corporation; President/Chief Executive Officer, CDC IXIS Asset Management Services, Inc.; Principal & Director of Operations, Scudder Funds, Scudder, Stevens & Clark, Inc.; Assistant Vice President, Fidelity Investments | | 184 | | enaible, Inc. (artificial intelligence technology); Director, ISO New England, Inc. (non-profit organization managing regional electricity market) |
Beth Ann Brown – 1968 Trustee | | 2019 | | Independent Consultant Formerly: Head of Intermediary Distribution, Managing Director, Strategic Relations, Managing Director, Head of National Accounts, Senior Vice President, National Account Manager and Senior Vice President, Key Account Manager, Columbia Management Investment Advisers LLC; Vice President, Key Account Manager, Liberty Funds Distributor, Inc.; and Trustee of certain Oppenheimer Funds | | 184 | | Director, Board of Directors of Caron Engineering Inc.; Advisor, Board of Advisors of Caron Engineering Inc.; President and Director, Acton Shapleigh Youth Conservation Corps (non - profit); and President and Director of Grahamtastic Connection (non- profit) |
Jack M. Fields – 1952 Trustee | | 2003 | | Chief Executive Officer, Twenty First Century Group, Inc. (government affairs company); and Board Member, Impact(Ed) (non-profit) Formerly: Owner and Chief Executive Officer, Dos Angeles Ranch L.P. (cattle, hunting, corporate entertainment); Director, Insperity, Inc. (formerly known as Administaff) (human resources provider); Chief Executive Officer, Texana Timber LP (sustainable forestry company); Director of Cross Timbers Quail Research Ranch (non-profit); and member of the U.S. House of Representatives | | 184 | | Member, Board of Directors of Baylor College of Medicine |
Cynthia Hostetler —1962 Trustee | | 2017 | | Non-Executive Director and Trustee of a number of public and private business corporations Formerly: Director, Aberdeen Investment Funds (4 portfolios); Director, Artio Global Investment LLC (mutual fund complex); Director, Edgen Group, Inc. (specialized energy and infrastructure products distributor); Head of Investment Funds and Private Equity, Overseas Private Investment Corporation; President, First Manhattan Bancorporation, Inc.; Attorney, Simpson Thacher & Bartlett LLP | | 184 | | Resideo Technologies, Inc. (smart home technology); Vulcan Materials Company (construction materials company); Trilinc Global Impact Fund; Genesee & Wyoming, Inc. (railroads); Investment Company Institute (professional organization); Independent Directors Council (professional organization);Eisenhower Foundation (non-profit) |
Eli Jones – 1961 Trustee | | 2016 | | Professor and Dean, Mays Business School—Texas A&M University Formerly: Professor and Dean, Walton College of Business, University of Arkansas and E.J. Ourso College of Business, Louisiana State University; Director, Arvest Bank | | 184 | | Insperity, Inc. (formerly known as Administaff) (human resources provider) |
T-2 Invesco Technology Fund
Trustees and Officers—(continued)
| | | | | | | | |
Name, Year of Birth and
Position(s)
Held with the Trust | | Trustee and/or Officer
Since | | Principal Occupation(s)
During Past 5 Years | | Number of
Funds
in
Fund Complex
Overseen by
Trustee | | Other
Directorship(s)
Held by Trustee
During Past 5
Years |
| Independent Trustees—(continued) | | | | | | |
Elizabeth Krentzman – 1959 Trustee | | 2019 | | Formerly: Principal and Chief Regulatory Advisor for Asset Management Services and U.S. Mutual Fund Leader of Deloitte & Touche LLP; General Counsel of the Investment Company Institute (trade association); National Director of the Investment Management Regulatory Consulting Practice, Principal, Director and Senior Manager of Deloitte & Touche LLP; Assistant Director of the Division of Investment Management—Office of Disclosure and Investment Adviser Regulation of the U.S. Securities and Exchange Commission and various positions with the Division of Investment Management – Office of Regulatory Policy of the U.S. Securities and Exchange Commission; Associate at Ropes & Gray LLP; and Trustee of certain Oppenheimer Funds | | 184 | | Trustee of the University of Florida National Board Foundation; Member of the Carita Funds Board of Directors (private investment funds); Member of the University of Florida Law Center Association, Inc. Board of Trustees and Audit Committee Member |
Anthony J. LaCava, Jr. – 1956 Trustee | | 2019 | | Formerly: Director and Member of the Audit Committee, Blue Hills Bank (publicly traded financial institution) and Managing Partner, KPMG LLP | | 184 | | Blue Hills Bank; Chairman, Bentley University; Member, Business School Advisory Council; and Nominating Committee KPMG LLP |
Prema Mathai-Davis – 1950 Trustee | | 2003 | | Retired Formerly: Co-Founder & Partner of Quantalytics Research, LLC, (a FinTech Investment Research Platform for the Self-Directed Investor); Trustee of YWCA Retirement Fund; CEO of YWCA of the USA; Board member of the NY Metropolitan Transportation Authority; Commissioner of the NYC Department of Aging; Board member of Johns Hopkins Bioethics Institute | | 184 | | None |
Joel W. Motley – 1952 Trustee | | 2019 | | Director of Office of Finance, Federal Home Loan Bank System; Managing Director of Carmona Motley Inc. (privately held financial advisor); Member of the Council on Foreign Relations and its Finance and Budget Committee; Chairman Emeritus of Board of Human Rights Watch and Member of its Investment Committee; and Member of Investment Committee and Board of Historic Hudson Valley (non-profit cultural organization) Formerly: Managing Director of Public Capital Advisors, LLC (privately held financial advisor); Managing Director of Carmona Motley Hoffman, Inc. (privately held financial advisor); Trustee of certain Oppenheimer Funds; Director of Columbia Equity Financial Corp. (privately held financial advisor); and Member of the Vestry of Trinity Church Wall Street | | 184 | | Member of Board of Greenwall Foundation (bioethics research foundation) and its Investment Committee; Member of Board of Friends of the LRC (non-profit legal advocacy); Board Member and Investment Committee Member of Pulitzer Center for Crisis Reporting (non-profit journalism) |
Teresa M. Ressel — 1962 Trustee | | 2017 | | Non-executive director and trustee of a number of public and private business corporations Formerly: Chief Executive Officer, UBS Securities LLC (investment banking); Chief Operating Officer, UBS AG Americas (investment banking); Sr. Management Team Olayan America, The Olayan Group (international investor/commercial/industrial); Assistant Secretary for Management & Budget and Designated Chief Financial Officer, U.S. Department of Treasury; Director, Atlantic Power Corporation (power generation company) and ON Semiconductor Corporation (semiconductor manufacturing) | | 184 | | Elucida Oncology (nanotechnology & medical particles company) |
T-3 Invesco Technology Fund
Trustees and Officers—(continued)
| | | | | | | | |
Name, Year of Birth and
Position(s)
Held with the Trust | | Trustee and/or Officer
Since | | Principal Occupation(s)
During Past 5 Years | | Number of
Funds
in
Fund Complex
Overseen by
Trustee | | Other
Directorship(s)
Held by Trustee
During Past 5
Years |
| Independent Trustees—(continued) |
Ann Barnett Stern – 1957 Trustee | | 2017 | | President, Chief Executive Officer and Board Member, Houston Endowment, Inc. a private philanthropic institution Formerly: Executive Vice President, Texas Children’s Hospital; Vice President, General Counsel and Corporate Compliance Officer, Texas Children’s Hospital; Attorney at Beck, Redden and Secrest, LLP and Andrews and Kurth LLP | | 184 | | Director and Audit Committee member of Federal Reserve Bank of Dallas; Trustee and Board Chair of Good Reason Houston (nonprofit); Trustee, Vice Chair, Chair of Nomination/Governance Committee, Chair of Personnel Committee of Holdsworth Center (nonprofit); Trustee and Investment Committee member of University of Texas Law School Foundation (nonprofit); Board Member of Greater Houston Partnership |
Robert C. Troccoli – 1949 Trustee | | 2016 | | Retired Formerly: Adjunct Professor, University of Denver – Daniels College of Business; and Managing Partner, KPMG LLP | | 184 | | None |
Daniel S. Vandivort –1954 Trustee | | 2019 | | Trustee, Board of Trustees, Huntington Disease Foundation of America; and President, Flyway Advisory Services LLC (consulting and property management) Formerly: Trustee and Governance Chair, of certain Oppenheimer Funds; and Treasurer, Chairman of the Audit and Finance Committee, Huntington Disease Foundation of America | | 184 | | None |
| James D. Vaughn – 1945 Trustee | | 2019 | | Retired Formerly: Managing Partner, Deloitte & Touche LLP; Trustee and Chairman of the Audit Committee, Schroder Funds; Board Member, Mile High United Way, Boys and Girls Clubs, Boy Scouts, Colorado Business Committee for the Arts, Economic Club of Colorado and Metro Denver Network (economic development corporation); and Trustee of certain Oppenheimer Funds | | 184 | | Board member and Chairman of Audit Committee of AMG National Trust Bank; Trustee and Investment Committee member, University of South Dakota Foundation; Board member, Audit Committee Member and past Board Chair, Junior Achievement (non-profit) |
T-4 Invesco Technology Fund
Trustees and Officers—(continued)
| | | | | | | | | | |
Name, Year of Birth and Position(s) Held with the Trust | | Trustee and/or Officer Since | | Principal Occupation(s) During Past 5 Years | | | | Number of Funds in Fund Complex Overseen by Trustee | | Other Directorship(s) Held by Trustee During Past 5 Years |
| Officers | | | | | | | | | | |
Sheri Morris — 1964 President and Principal Executive Officer | | 2003 | | Head of Global Fund Services, Invesco Ltd.; President and Principal Executive Officer, The Invesco Funds; Senior Vice President, Invesco Advisers, Inc. (formerly known as Invesco Institutional (N.A.), Inc.) (registered investment adviser); and Vice President, Invesco Exchange-Traded Fund Trust, Invesco Exchange-Traded Fund Trust II, Invesco India Exchange-Traded Fund Trust, Invesco Actively Managed Exchange-Traded Fund Trust, Invesco Actively Managed Exchange-Traded Commodity Fund Trust and Invesco Exchange-Traded Self-Indexed Fund Trust; and Vice President, OppenheimerFunds, Inc. Formerly: Vice President, Treasurer and Principal Financial Officer, The Invesco Funds; Vice President, Invesco AIM Advisers, Inc., Invesco AIM Capital Management, Inc. and Invesco AIM Private Asset Management, Inc.; Assistant Vice President and Assistant Treasurer, The Invesco Funds; Vice President and Assistant Vice President, Invesco Advisers, Inc.; Assistant Vice President, Invesco AIM Capital Management, Inc. and Invesco AIM Private Asset Management, Inc.; and Treasurer, Invesco Exchange-Traded Fund Trust, Invesco Exchange-Traded Fund Trust II, Invesco India Exchange-Traded Fund Trust and Invesco Actively Managed Exchange-Traded Fund Trust | | | | N/A | | N/A |
Russell C. Burk — 1958 Senior Vice President and Senior Officer | | 2005 | | Senior Vice President and Senior Officer, The Invesco Funds | | | | N/A | | N/A |
Jeffrey H. Kupor – 1968 Senior Vice President, Chief Legal Officer and Secretary | | 2018 | | Head of Legal of the Americas, Invesco Ltd.; Senior Vice President and Secretary, Invesco Advisers, Inc. (formerly known as Invesco Institutional (N.A.), Inc.) (registered investment adviser); Senior Vice President and Secretary, Invesco Distributors, Inc. (formerly known as Invesco AIM Distributors, Inc.); Vice President and Secretary, Invesco Investment Services, Inc. (formerly known as Invesco AIM Investment Services, Inc.) Senior Vice President, Chief Legal Officer and Secretary, The Invesco Funds; Secretary and General Counsel, Invesco Investment Advisers LLC (formerly known as Van Kampen Asset Management); Secretary and General Counsel, Invesco Capital Markets, Inc. (formerly known as Van Kampen Funds Inc.) and Chief Legal Officer, Invesco Exchange-Traded Fund Trust, Invesco Exchange-Traded Fund Trust II, Invesco India Exchange-Traded Fund Trust, Invesco Actively Managed Exchange-Traded Fund Trust, Invesco Actively Managed Exchange-Traded Commodity Fund Trust and Invesco Exchange-Traded Self-Indexed Fund Trust; Secretary, Invesco Indexing LLC; Secretary, W.L. Ross & Co., LLC ; Secretary and Vice President, Harbourview Asset Management Corporation; Secretary and Vice President, OppenheimerFunds, Inc. and Invesco Managed Accounts, LLC; Secretary and Senior Vice President, OFI Global Institutional, Inc.; Secretary and Vice President, OFI SteelPath, Inc.; Secretary and Vice President, Oppenheimer Acquisition Corp.; Secretary and Vice President, Shareholder Services, Inc.; Secretary and Vice President, Trinity Investment Management Corporation Formerly: Secretary and Vice President, Jemstep, Inc.; Head of Legal, Worldwide Institutional, Invesco Ltd.; Secretary and General Counsel, INVESCO Private Capital Investments, Inc.; Senior Vice President, Secretary and General Counsel, Invesco Management Group, Inc. (formerly known as Invesco AIM Management Group, Inc.); Assistant Secretary, INVESCO Asset Management (Bermuda) Ltd.; Secretary and General Counsel, Invesco Private Capital, Inc.; Assistant Secretary and General Counsel, INVESCO Realty, Inc.; Secretary and General Counsel, Invesco Senior Secured Management, Inc.; and Secretary, Sovereign G./P. Holdings Inc. | | | | N/A | | N/A |
T-5 Invesco Technology Fund
Trustees and Officers—(continued)
| | | | | | | | | | |
Name, Year of Birth and Position(s) Held with the Trust | | Trustee and/or Officer Since | | Principal Occupation(s) During Past 5 Years | | | | Number of Funds in
Fund Complex Overseen by Trustee | | Other Directorship(s) Held by Trustee During Past 5 Years |
| Officers—(continued) | | | | | | | | | | |
Andrew R. Schlossberg – 1974 Senior Vice President | | 2019 | | Head of the Americas and Senior Managing Director, Invesco Ltd.; Director and Senior Vice President, Invesco Advisers, Inc. (formerly known as Invesco Institutional (N.A.), Inc.) (registered investment adviser); Director and Chairman, Invesco Investment Services, Inc. (formerly known as Invesco AIM Investment Services, Inc.) (registered transfer agent); Senior Vice President, The Invesco Funds; Director, Invesco Investment Advisers LLC (formerly known as Van Kampen Asset Management); Director, President and Chairman, Invesco Insurance Agency, Inc. Formerly: Director, President and Chairman, Invesco Insurance Agency, Inc.; Director, Invesco UK Limited; Director and Chief Executive, Invesco Asset Management Limited and Invesco Fund Managers Limited; Assistant Vice President, The Invesco Funds; Senior Vice President, Invesco Advisers, Inc. (formerly known as Invesco Institutional (N.A.), Inc.) (registered investment adviser); Director and Chief Executive, Invesco Administration Services Limited and Invesco Global Investment Funds Limited; Director, Invesco Distributors, Inc.; Head of EMEA, Invesco Ltd.; President, Invesco Actively Managed Exchange-Traded Commodity Fund Trust, Invesco Actively Managed Exchange-Traded Fund Trust, Invesco Exchange-Traded Fund Trust, Invesco Exchange-Traded Fund Trust II and Invesco India Exchange-Traded Fund Trust; Managing Director and Principal Executive Officer, Invesco Capital Management LLC | | | | N/A | | N/A |
John M. Zerr — 1962 Senior Vice President | | 2006 | | Chief Operating Officer of the Americas; Senior Vice President, Invesco Advisers, Inc. (formerly known as Invesco Institutional (N.A.), Inc.) (registered investment adviser); Senior Vice President, Invesco Distributors, Inc. (formerly known as Invesco AIM Distributors, Inc.); Director and Vice President, Invesco Investment Services, Inc. (formerly known as Invesco AIM Investment Services, Inc.) Senior Vice President, The Invesco Funds; Managing Director, Invesco Capital Management LLC; Director, Invesco Investment Advisers LLC (formerly known as Van Kampen Asset Management); Senior Vice President, Invesco Capital Markets, Inc. (formerly known as Van Kampen Funds Inc.); Manager, Invesco Indexing LLC; Manager, Invesco Specialized Products, LLC; Member, Invesco Canada Funds Advisory Board; Director, President and Chief Executive Officer, Invesco Corporate Class Inc. (corporate mutual fund company); and Director, Chairman, President and Chief Executive Officer, Invesco Canada Ltd. (formerly known as Invesco Trimark Ltd./Invesco Trimark Ltèe) (registered investment adviser and registered transfer agent); President, Invesco, Inc.; President, Invesco Global Direct Real Estate Feeder GP Ltd.; President, Invesco IP Holdings(Canada) Ltd; President, Invesco Global Direct Real Estate GP Ltd.; President, Invesco Financial Services Ltd. / Services Financiers Invesco Ltée; President, Trimark Investments Ltd./Placements Trimark Ltée and Director and Chairman, Invesco Trust Company Formerly: Director and Senior Vice President, Invesco Insurance Agency, Inc.; Director and Senior Vice President, Invesco Management Group, Inc. (formerly known as Invesco AIM Management Group, Inc.); Secretary and General Counsel, Invesco Management Group, Inc. (formerly known as Invesco AIM Management Group, Inc.); Secretary, Invesco Investment Services, Inc. (formerly known as Invesco AIM Investment Services, Inc.); Chief Legal Officer and Secretary, The Invesco Funds; Secretary and General Counsel, Invesco Investment Advisers LLC (formerly known as Van Kampen Asset Management); Secretary and General Counsel, Invesco Capital Markets, Inc. (formerly known as Van Kampen Funds Inc.); Chief Legal Officer, Invesco Exchange-Traded Fund Trust, Invesco Exchange-Traded Fund Trust II, Invesco India Exchange-Traded Fund Trust, Invesco Actively Managed Exchange-Traded Fund Trust, Invesco Actively Managed Exchange-Traded Commodity Fund Trust and Invesco Exchange-Traded Self-Indexed Fund Trust; Secretary, Invesco Indexing LLC; Director, Secretary, General Counsel and Senior Vice President, Van Kampen Exchange Corp.; Director, Vice President and Secretary, IVZ Distributors, Inc. (formerly known as INVESCO Distributors, Inc.); Director and Vice President, INVESCO Funds Group, Inc.; Director and Vice President, Van Kampen Advisors Inc.; Director, Vice President, Secretary and General Counsel, Van Kampen Investor Services Inc.;Director and Secretary, Invesco Distributors, Inc. (formerly known as Invesco AIM Distributors, Inc.); Director, Senior Vice President, General Counsel and Secretary, Invesco AIM Advisers, Inc. and Van Kampen Investments Inc.; Director, Vice President and Secretary, Fund Management Company; Director, Senior Vice President, Secretary, General Counsel and Vice President, Invesco AIM Capital Management, Inc.; Chief Operating Officer and General Counsel, Liberty Ridge Capital, Inc. (an investment adviser) | | | | N/A | | N/A |
T-6 Invesco Technology Fund
Trustees and Officers—(continued)
| | | | | | | | | | |
Name, Year of Birth and Position(s) Held with the Trust | | Trustee and/or Officer Since | | Principal Occupation(s) During Past 5 Years | | | | Number of Funds in
Fund Complex Overseen by Trustee | | Other Directorship(s) Held by Trustee During Past 5 Years |
| Officers—(continued) | | | | | | | | | | |
Gregory G. McGreevey—1962 Senior Vice President | | 2012 | | Senior Managing Director, Invesco Ltd.; Director, Chairman, President, and Chief Executive Officer, Invesco Advisers, Inc. (formerly known as Invesco Institutional (N.A.), Inc.) (registered investment adviser); Director, Invesco Mortgage Capital, Inc. and Invesco Senior Secured Management, Inc.; and Senior Vice President, The Invesco Funds; and President, SNW Asset Management Corporation and Invesco Managed Accounts, LLC; Chairman and Director, Invesco Private Capital, Inc.; Chairman and Director, INVESCO Private Capital Investments, Inc.; Chairman and Director, INVESCO Realty, Inc. Chairman and Director, INVESCO Realty, Inc.; and Senior Vice President, Invesco Group Services, Inc. Formerly: Senior Vice President, Invesco Management Group, Inc. and Invesco Advisers, Inc.; Assistant Vice President, The Invesco Funds | | | | N/A | | N/A |
Adrien Deberghes- 1967 Principal Financial Officer, Treasurer and Vice President | | 2020 | | Head of the Fund Office of the CFO and Fund Administration; Vice President, Invesco Advisers, Inc.; Principal Financial Officer, Treasurer and Vice President, The Invesco Funds; Vice President, Invesco Exchange-Traded Fund Trust, Invesco Exchange-Traded Fund Trust II, Invesco India Exchange-Traded Fund Trust, Invesco Actively Managed Exchange-Traded Fund Trust, Invesco Actively Managed Exchange-Traded Commodity Fund Trust and Invesco Exchange-Traded Self-Indexed Fund Trust Formerly: Senior Vice President and Treasurer, Fidelity Investments | | | | N/A | | N/A |
Crissie M. Wisdom – 1969 Anti-Money Laundering Compliance Officer | | 2013 | | Anti-Money Laundering and OFAC Compliance Officer for Invesco U.S. entities including: Invesco Advisers, Inc. and its affiliates, Invesco Capital Markets, Inc., Invesco Distributors, Inc., Invesco Investment Services, Inc., The Invesco Funds, Invesco Capital Management, LLC, Invesco Trust Company; and Fraud Prevention Manager for Invesco Investment Services, Inc. | | | | N/A | | N/A |
Todd F. Kuehl – 1969 Chief Compliance Officer and Senior Vice President | | 2020 | | Chief Compliance Officer, Invesco Advisers, Inc. (registered investment adviser); and Chief Compliance Officer, The Invesco Funds and Senior Vice President Formerly: Managing Director and Chief Compliance Officer, Legg Mason (Mutual Funds); Chief Compliance Officer, Legg Mason Private Portfolio Group (registered investment adviser) | | | | N/A | | N/A |
Michael McMaster — 1962 Chief Tax Officer, Vice President and Assistant Treasurer | | 2020 | | Head of Global Fund Services Tax; Chief Tax Officer, Vice President and Assistant Treasurer, The Invesco Funds; Vice President, Invesco Advisers, Inc.; Assistant Treasurer, Invesco Capital Management LLC, Assistant Treasurer and Chief Tax Officer, Invesco Exchange-Traded Fund Trust, Invesco Exchange-Traded Fund Trust II, Invesco India Exchange-Traded Fund Trust, Invesco Actively Managed Exchange-Traded Fund Trust, Invesco Actively Managed Exchange-Traded Commodity Fund Trust and Invesco Exchange-Traded Self-Indexed Fund Trust; Assistant Treasurer, Invesco Specialized Products, LLC Formerly: Senior Vice President – Managing Director of Tax Services, U.S. Bank Global Fund Services (GFS) | | | | N/A | | N/A |
The Statement of Additional Information of the Trust includes additional information about the Fund’s Trustees and is available upon request, without charge, by calling 1.800.959.4246. Please refer to the Fund’s Statement of Additional Information for information on the Fund’s sub-advisers.
| | | | | | |
| Office of the Fund | | Investment Adviser | | Distributor | | Auditors |
11 Greenway Plaza, Suite 1000 Houston, TX 77046-1173 | | Invesco Advisers, Inc. 1555 Peachtree Street, N.E. Atlanta, GA 30309 | | Invesco Distributors, Inc. 11 Greenway Plaza, Suite 1000 Houston, TX 77046-1173 | | PricewaterhouseCoopers LLP 1000 Louisiana Street, Suite 5800 Houston, TX 77002-5678 |
| | | |
| Counsel to the Fund | | Counsel to the Independent Trustees | | Transfer Agent | | Custodian |
Stradley Ronon Stevens & Young, LLP 2005 Market Street, Suite 2600 Philadelphia, PA 19103-7018 | | Goodwin Procter LLP 901 New York Avenue, N.W. Washington, D.C. 20001 | | Invesco Investment Services, Inc. 11 Greenway Plaza, Suite 1000 Houston, TX 77046-1173 | | State Street Bank and Trust Company 225 Franklin Street Boston, MA 02110-2801 |
T-7 Invesco Technology Fund
Proxy Results
A Virtual Special Meeting (“Meeting”) of Shareholders of Invesco Technology Fund was held on January 22, 2021 subsequently adjourned to February 19, 2021 and February 23, 2021. The Meeting on February 23, 2021 was held for the following purpose: (1) Approval of changing the Fund’s sub-classification from “diversified” to “non-diversified” and approve the elimination of a related fundamental investment restriction.
The February 23, 2021 results of the voting on the above matter were as follows:
| | | | | | | | |
| | | Matters | | Votes For | | Votes Against | | Votes
Abstain |
| (1) | | Approval of changing the Fund’s sub-classification from “diversified” to “non-diversified” and approve the elimination of a related fundamental investment restriction | | 8,388,090.02 | | 950,658.39 | | 922,860.05 |
T-8 Invesco Technology Fund
(This page intentionally left blank)

Go paperless with eDelivery
Visit invesco.com/edelivery to enjoy the convenience and security of anytime electronic access to your investment documents.
With eDelivery, you can elect to have any or all of the following materials delivered straight to your inbox to download, save and print from your own computer:
∎ Fund reports and prospectuses
∎ Quarterly statements
∎ Daily confirmations
∎ Tax forms
Invesco mailing information
Send general correspondence to Invesco Investment Services, Inc., P.O. Box 219078, Kansas City, MO 64121-9078.
Important notice regarding delivery of security holder documents
To reduce Fund expenses, only one copy of most shareholder documents may be mailed to shareholders with multiple accounts at the same address (Householding). Mailing of your shareholder documents may be householded indefinitely unless you instruct us otherwise. If you do not want the mailing of these documents to be combined with those for other members of your household, please contact Invesco Investment Services, Inc. at 800 959 4246 or contact your financial institution. We will begin sending you individual copies for each account within 30 days after receiving your request.
Fund holdings and proxy voting information
The Fund provides a complete list of its portfolio holdings four times each fiscal year, at the end of each fiscal quarter. For the second and fourth quarters, the list appears, respectively, in the Fund’s semiannual and annual reports to shareholders. For the first and third quarters, the Fund files the list with the Securities and Exchange Commission (SEC) as an exhibit to its reports on Form N-PORT. The most recent list of portfolio holdings is available at invesco.com/completeqtrholdings. Shareholders can also look up the Fund’s Form N-PORT filings on the SEC website, sec.gov. The SEC file numbers for the Fund are shown below.
A description of the policies and procedures that the Fund uses to determine how to vote proxies relating to portfolio securities is available without charge, upon request, from our Client Services department at 800 959 4246, or at invesco.com/ corporate/about-us/esg. The information is also available on the SEC website, sec.gov.
| | |
Information regarding how the Fund voted proxies related to its portfolio securities during the most recent 12-month period ended June 30 is available at invesco.com/proxysearch. This information is also available on the SEC website, sec.gov. Invesco Advisers, Inc. is an investment adviser; it provides investment advisory services to individual and institutional clients and does not sell securities. Invesco Distributors, Inc. is the US distributor for Invesco Ltd.’s retail mutual funds, exchange-traded funds and institutional money market funds. Both are wholly owned, indirect subsidiaries of Invesco Ltd. | | 
|
| | | | |
| SEC file numbers: 811-03826 and 002-85905 | | Invesco Distributors, Inc. | | I-TEC-AR-1 |
| | |
 | | Annual Report to Shareholders April 30, 2021 |
| | Invesco Value Opportunities Fund |
| | Nasdaq: A: VVOAX ∎ C: VVOCX ∎ R: VVORX ∎ Y: VVOIX ∎ R5: VVONX ∎ R6: VVOSX |

Management’s Discussion of Fund Performance
| | |
Performance summary For the fiscal year ended April 30, 2021, Class A shares of Invesco Value Opportunities Fund (the Fund), at net asset value (NAV), outperformed the S&P 1500 Value Index, the Fund’s style-specific benchmark. Your Fund’s long-term performance appears later in this report. Fund vs. Indexes Total returns, 4/30/20 to 4/30/21, at net asset value (NAV). Performance shown does not include applicable contingent deferred sales charges (CDSC) or front-end sales charges, which would have reduced performance. |
Class A Shares | | 84.15% |
Class C Shares | | 82.90 |
Class R Shares | | 83.57 |
Class Y Shares | | 84.67 |
Class R5 Shares | | 84.90 |
Class R6 Shares | | 84.81 |
S&P 500 Indexq (Broad Market Index) | | 45.98 |
S&P 1500 Value Indexq (Style-Specific Index) | | 43.80 |
Lipper Multi-Cap Value Funds Index∎ (Peer Group Index) | | 54.83 |
Source(s): qRIMES Technologies Corp.; ∎Lipper Inc. | | |
Market conditions and your Fund
As many businesses began to shut down in April 2020 due to the pandemic, US unemployment numbers continued to climb, and the economy ground to a halt. However, during the second and into the third quarter of 2020, US stocks largely shrugged off economic uncertainty, social unrest and a resurgence in coronavirus (COVID-19) infections to rally from the market bottom. Investor sentiment improved in response to trillions of dollars in economic stimulus, progress on a coronavirus vaccine and re-openings in many US regions.
Despite a September selloff, US equity markets posted gains in the third quarter as the US Federal Reserve (the Fed) extended its emergency stimulus programs and changed its inflation target policy, both of which supported equities. Data for both manufacturing and services indicated expansion, a reversal from significant declines earlier in the year. Corporate earnings were also better than anticipated and a gradual decline in new COVID-19 infections in many regions, combined with optimism about progress on a coronavirus vaccine, further boosted stocks.
US equity markets posted gains in the fourth quarter, as positive news on COVID-19 vaccines and strong corporate earnings outweighed investor concerns about the political disagreement over a fiscal stimulus package and sharply rising coronavirus infections nationwide. Cyclical sectors like energy and financials led the way, while real estate and consumer staples lagged. Market leadership also shifted during the quarter with value stocks outperforming growth for the first time since the fourth quarter of 2016. While the US economy rebounded significantly since the pandemic began, the recovery appeared to slow in the fourth quarter with employment gains and gross domestic product (GDP)
growth down from the third quarter. However, stocks were buoyed by the Fed’s pledge to maintain its accommodative stance and asset purchases, “until substantial further progress has been made” toward employment and inflation targets.
US political unrest and rising COVID-19 infection rates marked the start of the first quarter of 2021. Additionally, retail investors bid up select stocks like GameStop and AMC Theaters, ultimately causing a sharp selloff in late January. Corporate earnings generally beat expectations, but market volatility rose during the quarter as investors worried about rising bond yields and inflation. Despite the Fed’s commitment to an accommodative policy, the 10-year US Treasury yield rose from 0.92% at year-end to 1.63%1 at the fiscal year-end. Approval of a third COVID-19 vaccine boosted investors’ optimism for faster economic recovery. Although March saw increased volatility with consecutive down days in the US stock market, stocks continued to hit all-time highs through April. US stocks had strong returns, with the S&P 500 Index returning 45.98% for the fiscal year.2 All major US equity indexes posted large gains for the fiscal year. Within the S&P 1500 Value Index, all sectors posted double-digit gains during the year. Consumer discretionary, industrials and materials posted the largest gains, while utilities, health care and consumer staples posted the smallest gains.
During the fiscal year, we continued to use our intrinsic value strategy, seeking to create wealth by maintaining a long-term investment horizon and investing in companies selling at a significant discount to our estimate of their intrinsic value. We believe intrinsic value represents the fair economic worth of a business. Since our application of this strategy is highly disciplined and relatively unique, it is important to understand the benefits and limitations of our process. First, the investment
strategy is intended to preserve your capital while growing it at above-market rates over the long term. Second, our investments have little in common with popular stock market indexes and most of our peers. And third, the Fund’s short-term relative performance will naturally be different from stock market indexes and peers since we typically structure the portfolio significantly differently than these benchmarks.
The Fund outperformed the S&P 1500 Value Index during the fiscal year. Drivers of Fund performance were mainly stock-specific during the year. However, the Fund’s underweight positions in health care, consumer staples and utilities helped the Fund’s relative performance versus the S&P 1500 Value Index as these sectors underperformed. Select holdings within the consumer staples and financials sectors contributed the most to absolute Fund performance. Very few Fund holdings declined during the fiscal year. Select holdings in health care and energy were small detractors.
Consumer staples company Spectrum Brands was the largest contributor to absolute Fund performance during the year. Shares of the global consumer products company rose after management reported solid financial results throughout the year. Financial services companies Athene and Goldman Sachs were also large contributors to absolute performance. Athene is a leading retirement services company that issues, reinsures and acquires retirement savings products. Goldman Sachs is a leading global investment banking firm. Shares of both companies rose along with the financial services sector in general.
Health care company Centene and energy company Royal Dutch Shell were among the only detractors from absolute Fund performance during the year. Centene is a managed-care organization focused on government-sponsored health care plans. We purchased the company during the fourth quarter of 2020 and it posted a small loss since then. Royal Dutch Shell is an integrated oil and gas company that explores, produces, and refines oil around the world. Shares of the company posted a small loss during the fiscal year.
We believe the single most important indicator of how the Fund is positioned for potential future success is not our recent investment results or popular statistical measures, but rather the difference between current market prices and the Fund’s estimated intrinsic value – the aggregate business value of the portfolio based on our estimate of intrinsic value for each holding.
At the end of the year, the difference between the market price and the estimated intrinsic value of the Fund was attractive, according to our estimation. While there is no assurance that market value will ever reflect our estimate of the Fund’s intrinsic value, we believe the gap between price and estimated
2 Invesco Value Opportunities Fund
intrinsic value may provide above-average capital appreciation.
We will continue to work hard to protect and grow the Fund’s estimated intrinsic value. We thank you for your investment in Invesco Value Opportunities Fund and for sharing our long-term investment perspective.
1 Source: Bloomberg L.P.
2 Source: Lipper Inc.
Portfolio manager(s):
Jonathan Edwards - Lead
Jonathan Mueller
The views and opinions expressed in management’s discussion of Fund performance are those of Invesco Advisers, Inc. These views and opinions are subject to change at any time based on factors such as market and economic conditions. These views and opinions may not be relied upon as investment advice or recommendations, or as an offer for a particular security. The information is not a complete analysis of every aspect of any market, country, industry, security or the Fund. Statements of fact are from sources considered reliable, but Invesco Advisers, Inc. makes no representation or warranty as to their completeness or accuracy. Although historical performance is no guarantee of future results, these insights may help you understand our investment management philosophy.
See important Fund and, if applicable, index disclosures later in this report.
3 Invesco Value Opportunities Fund
Your Fund’s Long-Term Performance
Results of a $10,000 Investment — Oldest Share Class(es)
Fund and index data from 4/30/11
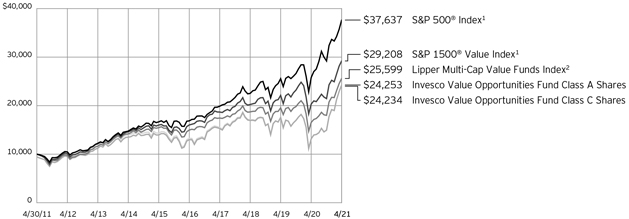
1 Source: RIMES Technologies Corp.
2 Source: Lipper Inc.
Past performance cannot guarantee future results.
The data shown in the chart include reinvested distributions, applicable sales charges and Fund expenses including management
fees. Index results include reinvested dividends, but they do not reflect sales charges. Performance of the peer group, if applicable, reflects fund expenses and management fees;
performance of a market index does not. Performance shown in the chart does not reflect deduction of taxes a shareholder would pay on Fund distributions or sale of Fund shares.
4 Invesco Value Opportunities Fund
| | | | |
Average Annual Total Returns As of 4/30/21, including maximum applicable sales charges | |
Class A Shares | | | | |
Inception (6/25/01) | | | 6.37 | % |
10 Years | | | 9.26 | |
5 Years | | | 12.03 | |
1 Year | | | 74.01 | |
Class C Shares | | | | |
Inception (6/25/01) | | | 6.36 | % |
10 Years | | | 9.26 | |
5 Years | | | 12.54 | |
1 Year | | | 81.90 | |
Class R Shares | | | | |
10 Years | | | 9.61 | % |
5 Years | | | 13.04 | |
1 Year | | | 83.57 | |
Class Y Shares | | | | |
Inception (3/23/05) | | | 7.04 | % |
10 Years | | | 10.15 | |
5 Years | | | 13.61 | |
1 Year | | | 84.67 | |
Class R5 Shares | | | | |
10 Years | | | 10.37 | % |
5 Years | | | 13.78 | |
1 Year | | | 84.90 | |
Class R6 Shares | | | | |
10 Years | | | 10.08 | % |
5 Years | | | 13.72 | |
1 Year | | | 84.81 | |
Performance includes litigation proceeds. Had these proceeds not been received, total returns would have been lower.
Effective June 1, 2010, Class A, Class C and Class I shares of the predecessor fund, Van Kampen Value Opportunities Fund, advised by Van Kampen Asset Management were reorganized into Class A, Class C and Class Y shares, respectively, of Invesco Van Kampen Value Opportunities Fund (renamed Invesco Value Opportunities Fund). Returns shown above, prior to June 1, 2010, for Class A, Class C and Class Y shares are those for Class A, Class C and Class I shares of the predecessor fund. Share class returns will differ from the predecessor fund because of different expenses.
Class R shares incepted on May 23, 2011. Performance shown prior to that date is that of the Fund’s Class A shares at net asset value, restated to reflect the higher 12b-1 fees applicable to Class R shares.
Class R5 shares incepted on May 23, 2011. Performance shown prior to that date is that of the Fund’s Class A shares at net asset value and includes the 12b-1 fees applicable to Class A shares.
Class R6 shares incepted on April 4, 2017. Performance shown prior to that date is that of the Fund’s Class A shares at net asset value and includes the 12b-1 fees applicable to Class A shares.
The performance data quoted represent past performance and cannot guarantee future results; current performance may be lower or higher. Please visit invesco.com/ performance for the most recent month-end performance. Performance figures reflect reinvested distributions, changes in net asset value and the effect of the maximum sales charge unless otherwise stated. Performance figures do not reflect deduction of taxes a shareholder would pay on Fund distributions or sale of Fund shares. Investment return and principal value will fluctuate so that you may have a gain or loss when you sell shares.
Class A share performance reflects the maximum 5.50% sales charge, and Class C share performance reflects the applicable contingent deferred sales charge (CDSC) for the period involved. The CDSC on Class C shares is 1% for the first year after purchase. Class R, Class Y, Class R5 and Class R6 shares do not have a front-end sales charge or a CDSC; therefore, performance is at net asset value.
The performance of the Fund’s share classes will differ primarily due to different sales charge structures and class expenses.
Fund performance reflects any applicable fee waivers and/or expense reimbursements. Had the adviser not waived fees and/or reimbursed expenses currently or in the past, returns would have been lower. See current prospectus for more information.
5 Invesco Value Opportunities Fund
Supplemental Information
Invesco Value Opportunities Fund’s investment objective is total return through growth of capital and current income.
| ∎ | | Unless otherwise stated, information presented in this report is as of April 30, 2021, and is based on total net assets. |
| ∎ | | Unless otherwise noted, all data is provided by Invesco. |
| ∎ | | To access your Fund’s reports/prospectus, visit invesco.com/fundreports. |
About indexes used in this report
| ∎ | | The S&P 500® Index is an unmanaged index considered representative of the US stock market. |
| ∎ | | The S&P 1500® Value Index tracks the performance of US large-, mid- and small-cap value stocks. |
| ∎ | | The Lipper Multi-Cap Value Funds Index is an unmanaged index considered representative of multi-cap value funds tracked by Lipper. |
| ∎ | | The Fund is not managed to track the performance of any particular index, including the index(es) described here, and consequently, the performance of the Fund may deviate significantly from the performance of the index(es). |
| ∎ | | A direct investment cannot be made in an index. Unless otherwise indicated, index results include reinvested dividends, and they do not reflect sales charges. Performance of the peer group, if applicable, reflects fund expenses; performance of a market index does not. |
Liquidity Risk Management Program
In compliance with Rule 22e-4 under the Investment Company Act of 1940, as amended (the “Liquidity Rule”), the Fund has adopted and implemented a liquidity risk management program in accordance with the Liquidity Rule (the “Program”). The Program is reasonably designed to assess and manage the Fund’s liquidity risk, which is the risk that the Fund could not meet redemption requests without significant dilution of remaining investors’ interests in the Fund. The Board of Trustees of the Fund (the “Board”) has appointed Invesco Advisers, Inc. (“Invesco”), the Fund’s investment adviser, as the Program’s administrator, and Invesco has delegated oversight of the Program to the Liquidity Risk Management Committee (the “Committee”), which is composed of senior representatives from relevant business groups at Invesco.
As required by the Liquidity Rule, the Program includes policies and procedures providing for an assessment, no less frequently than annually, of the Fund’s liquidity risk that takes into account, as
relevant to the Fund’s liquidity risk: (1) the Fund’s investment strategy and liquidity of portfolio investments during both normal and reasonably foreseeable stressed conditions; (2) short-term and long-term cash flow projections for the Fund during both normal and reasonably foreseeable stressed conditions; and (3) the Fund’s holdings of cash and cash equivalents and any borrowing arrangements. The Liquidity Rule also requires the classification of the Fund’s investments into categories that reflect the assessment of their relative liquidity under current market conditions. The Fund classifies its investments into one of four categories defined in the Liquidity Rule: “Highly Liquid,” “Moderately Liquid,” “Less Liquid,” and “Illiquid.” Funds that are not invested primarily in “Highly Liquid Investments” that are assets (cash or investments that are reasonably expected to be convertible into cash within three business days without significantly changing the market value of the investment) are required to establish a “Highly Liquid Investment Minimum” (“HLIM”), which is the minimum percentage of net assets that must be invested in Highly Liquid Investments. Funds with HLIMs have procedures for addressing HLIM shortfalls, including reporting to the Board and the SEC (on a non-public basis) as required by the Program and the Liquidity Rule. In addition, the Fund may not acquire an
investment if, immediately after the acquisition, over 15% of the Fund’s net assets would consist of “Illiquid Investments” that are assets (an investment that cannot reasonably be expected to be sold or disposed of in current market conditions in seven calendar days or less without the sale or disposition significantly changing the market value of the investment). The Liquidity Rule and the Program also require reporting to the Board and the SEC (on a non-public basis) if a Fund’s holdings of Illiquid Investments exceed 15% of the Fund’s assets.
At a meeting held on March 22-24, 2021, the Committee presented a report to the Board that addressed the operation of the Program and assessed the Program’s adequacy and effectiveness of implementation (the “Report”). The Report covered
the period from January 1, 2020 through December 31, 2020 (the “Program Reporting Period”). The Report discussed notable events affecting liquidity over the Program Reporting Period, including the impact of the coronavirus pandemic on the Fund and the overall market. The Report noted that there were no material changes to the Program during the Program Reporting Period.
The Report stated, in relevant part, that during the Program Reporting Period:
| ∎ | | The Program, as adopted and implemented, remained reasonably designed to assess and manage the Fund’s liquidity risk and was operated effectively to achieve that goal; |
| ∎ | | The Fund’s investment strategy remained appropriate for an open-end fund; |
| ∎ | | The Fund was able to meet requests for redemption without significant dilution of remaining investors’ interests in the Fund; |
| ∎ | | The Fund did not breach the 15% limit on Illiquid Investments; and |
| ∎ | | The Fund primarily held Highly Liquid Investments and therefore has not adopted an HLIM. |
| | |
| This report must be accompanied or preceded by a currently effective Fund prospectus, which contains more complete information, including sales charges and expenses. Investors should read it carefully before investing. | | |
| | | |
| NOT FDIC INSURED | MAY LOSE VALUE | NO BANK GUARANTEE | | |
6 Invesco Value Opportunities Fund
Fund Information
Portfolio Composition
| | | | | |
| By sector | | % of total net assets |
| |
Industrials | | | | 24.01 | % |
Financials | | | | 23.76 | |
Consumer Discretionary | | | | 13.79 | |
Energy | | | | 11.49 | |
Health Care | | | | 8.37 | |
Materials | | | | 8.05 | |
Consumer Staples | | | | 5.72 | |
Information Technology | | | | 3.90 | |
Money Market Funds Plus Other Assets Less Liabilities | | | | 0.91 | |
Top 10 Equity Holdings*
| | | | | | | |
| | | | | % of total net assets |
| | |
1. | | Goldman Sachs Group, Inc. (The) | | | | 3.95 | % |
2. | | Wells Fargo & Co. | | | | 3.84 | |
3. | | Booking Holdings, Inc. | | | | 3.83 | |
4. | | ManpowerGroup, Inc. | | | | 3.78 | |
5. | | Athene Holding Ltd., Class A | | | | 3.71 | |
6. | | Citigroup, Inc. | | | | 3.43 | |
7. | | AECOM | | | | 3.30 | |
8. | | Oracle Corp. | | | | 3.16 | |
9. | | Univar Solutions, Inc. | | | | 3.16 | |
10. | | Anthem, Inc. | | | | 3.10 | |
The Fund’s holdings are subject to change, and there is no assurance that the Fund will continue to hold any particular security.
| * | Excluding money market fund holdings, if any. |
Data presented here are as of April 30, 2021.
7 Invesco Value Opportunities Fund
Schedule of Investments(a)
April 30, 2021
| | | | | | | | |
| | | Shares | | | Value | |
Common Stocks & Other Equity Interests–99.09% | |
Auto Parts & Equipment–2.46% | | | | | | | | |
Dana, Inc. | | | 854,768 | | | $ | 21,625,631 | |
Building Products–0.01% | | | | | | | | |
Builders FirstSource, Inc.(b) | | | 1,700 | | | | 82,739 | |
Construction & Engineering–3.30% | | | | | | | | |
AECOM(b) | | | 437,273 | | | | 29,048,045 | |
Consumer Finance–0.03% | | | | | | | | |
SLM Corp. | | | 13,100 | | | | 257,546 | |
Distributors–1.65% | | | | | | | | |
LKQ Corp.(b) | | | 309,900 | | | | 14,475,429 | |
Diversified Banks–7.27% | | | | | | | | |
Citigroup, Inc. | | | 422,921 | | | | 30,128,892 | |
Wells Fargo & Co. | | | 749,600 | | | | 33,769,480 | |
| | | | | | | | 63,898,372 | |
Diversified Chemicals–2.51% | | | | | | | | |
Huntsman Corp. | | | 768,900 | | | | 22,044,363 | |
Electrical Components & Equipment–2.08% | | | | | |
nVent Electric PLC | | | 599,400 | | | | 18,251,730 | |
Electronic Manufacturing Services–0.74% | | | | | |
Jabil, Inc. | | | 124,178 | | | | 6,509,411 | |
Food Distributors–3.04% | | | | | | | | |
US Foods Holding Corp.(b) | | | 645,400 | | | | 26,758,284 | |
Health Care Facilities–1.01% | | | | | | | | |
Universal Health Services, Inc., Class B | | | 60,000 | | | | 8,904,600 | |
Health Care Services–2.32% | | | | | | | | |
Cigna Corp. | | | 82,100 | | | | 20,443,721 | |
Hotels, Resorts & Cruise Lines–7.00% | | | | | |
Booking Holdings, Inc.(b) | | | 13,675 | | | | 33,723,644 | |
Norwegian Cruise Line Holdings Ltd.(b) | | | 44,300 | | | | 1,375,515 | |
Travel + Leisure Co. | | | 409,900 | | | | 26,450,847 | |
| | | | | | | | 61,550,006 | |
Household Products–2.68% | | | | | | | | |
Energizer Holdings, Inc. | | | 7,454 | | | | 367,482 | |
Spectrum Brands Holdings, Inc. | | | 263,071 | | | | 23,187,078 | |
| | | | | | | | 23,554,560 | |
Human Resource & Employment Services–3.78% | | | | | |
ManpowerGroup, Inc. | | | 275,000 | | | | 33,244,750 | |
Industrial Conglomerates–0.64% | | | | | | | | |
Carlisle Cos., Inc. | | | 29,200 | | | | 5,596,180 | |
Industrial Machinery–2.29% | | | | | | | | |
Crane Co. | | | 214,100 | | | | 20,138,246 | |
Integrated Oil & Gas–3.50% | | | | | | | | |
BP PLC, ADR (United Kingdom) | | | 524,900 | | | | 13,206,484 | |
| | | | | | | | |
| | | Shares | | | Value | |
Integrated Oil & Gas–(continued) | | | | | | | | |
Royal Dutch Shell PLC, Class A, ADR (United Kingdom) | | | 461,800 | | | $ | 17,548,400 | |
| | | | | | | | 30,754,884 | |
Internet & Direct Marketing Retail–2.69% | | | | | |
Alibaba Group Holding Ltd. (China)(b) | | | 817,600 | | | | 23,618,472 | |
Investment Banking & Brokerage–3.95% | | | | | |
Goldman Sachs Group, Inc. (The) | | | 99,700 | | | | 34,740,465 | |
Life & Health Insurance–4.78% | | | | | | | | |
Athene Holding Ltd., Class A(b) | | | 546,800 | | | | 32,627,556 | |
MetLife, Inc. | | | 7,900 | | | | 502,677 | |
Prudential Financial, Inc. | | | 88,800 | | | | 8,911,968 | |
| | | | | | | | 42,042,201 | |
Managed Health Care–5.03% | | | | | | | | |
Anthem, Inc. | | | 71,900 | | | | 27,278,141 | |
Centene Corp.(b) | | | 275,300 | | | | 16,997,022 | |
| | | | | | | | 44,275,163 | |
Oil & Gas Exploration & Production–4.40% | | | | | |
Devon Energy Corp. | | | 179,000 | | | | 4,185,020 | |
Diamondback Energy, Inc. | | | 225,600 | | | | 18,438,288 | |
Pioneer Natural Resources Co. | | | 104,404 | | | | 16,060,467 | |
| | | | | | | | 38,683,775 | |
Oil & Gas Refining & Marketing–3.59% | | | | | |
Marathon Petroleum Corp. | | | 393,600 | | | | 21,903,840 | |
Phillips 66 | | | 120,000 | | | | 9,709,200 | |
| | | | | | | | 31,613,040 | |
Other Diversified Financial Services–2.68% | | | | | |
Equitable Holdings, Inc. | | | 689,400 | | | | 23,598,162 | |
Paper Packaging–1.76% | | | | | | | | |
Sealed Air Corp. | | | 312,600 | | | | 15,442,440 | |
Regional Banks–2.64% | | | | | | | | |
TCF Financial Corp.(b) | | | 510,600 | | | | 23,242,512 | |
Research & Consulting Services–5.42% | | | | | |
KBR, Inc. | | | 604,500 | | | | 23,914,020 | |
Nielsen Holdings PLC | | | 926,600 | | | | 23,767,290 | |
| | | | | | | | 47,681,310 | |
Specialty Chemicals–3.78% | | | | | | | | |
Axalta Coating Systems Ltd.(b) | | | 555,500 | | | | 17,714,895 | |
Element Solutions, Inc. | | | 711,600 | | | | 15,569,808 | |
| | | | | | | | 33,284,703 | |
Systems Software–3.16% | | | | | | | | |
Oracle Corp. | | | 366,900 | | | | 27,807,351 | |
Thrifts & Mortgage Finance–2.40% | | | | | | | | |
MGIC Investment Corp. | | | 738,358 | | | | 11,252,576 | |
Radian Group, Inc. | | | 401,203 | | | | 9,885,642 | |
| | | | | | | | 21,138,218 | |
See accompanying Notes to Financial Statements which are an integral part of the financial statements.
8 Invesco Value Opportunities Fund
| | | | | | | | |
| | | Shares | | | Value | |
Trading Companies & Distributors–6.50% | | | | | |
AerCap Holdings N.V. (Ireland)(b) | | | 364,600 | | | $ | 21,237,950 | |
Univar Solutions, Inc.(b) | | | 1,188,600 | | | | 27,753,810 | |
WESCO International, Inc.(b) | | | 89,000 | | | | 8,163,080 | |
| | | | | | | | 57,154,840 | |
Total Common Stocks & Other Equity Interests
(Cost $611,828,698) | | | | 871,461,149 | |
Money Market Funds–3.62% | | | | | | | | |
Invesco Government & Agency Portfolio, Institutional Class, 0.03%(c)(d) | | | 11,006,765 | | | | 11,006,765 | |
| | | | | | | | |
| | | Shares | | | Value | |
Money Market Funds–(continued) | | | | | |
Invesco Liquid Assets Portfolio, Institutional Class, 0.01%(c)(d) | | | 8,218,929 | | | $ | 8,222,217 | |
Invesco Treasury Portfolio, Institutional Class, 0.01%(c)(d) | | | 12,579,160 | | | | 12,579,160 | |
Total Money Market Funds (Cost $31,806,521) | | | | 31,808,142 | |
TOTAL INVESTMENTS IN
SECURITIES – 102.71%
(Cost $643,635,219) | | | | 903,269,291 | |
OTHER ASSETS LESS
LIABILITIES — (2.71)% | | | | (23,846,522 | ) |
NET ASSETS–100.00% | | | | | | $ | 879,422,769 | |
Investment Abbreviations:
ADR – American Depositary Receipt
Notes to Schedule of Investments:
| (a) | Industry and/or sector classifications used in this report are generally according to the Global Industry Classification Standard, which was developed by and is the exclusive property and a service mark of MSCI Inc. and Standard & Poor’s. |
| (b) | Non-income producing security. |
| (c) | Affiliated issuer. The issuer and/or the Fund is a wholly-owned subsidiary of Invesco Ltd., or is affiliated by having an investment adviser that is under common control of Invesco Ltd. The table below shows the Fund’s transactions in, and earnings from, its investments in affiliates for the fiscal year ended April 30, 2021. |
| | | | | | | | | | | | | | | | | | | | | | | | | | | | |
| | | Value
April 30, 2020 | | | Purchases
at Cost | | | Proceeds
from Sales | | | Change in
Unrealized
Appreciation
(Depreciation) | | | Realized
Gain | | | Value
April 30, 2021 | | | Dividend Income | |
Investments in Affiliated Money Market Funds: | | | | | | | | | | | | | | | | | | | | | | | | | | | | |
Invesco Government & Agency Portfolio, Institutional Class | | $ | 7,281,549 | | | $ | 49,927,402 | | | $ | (46,202,186 | ) | | $ | - | | | $ | - | | | $ | 11,006,765 | | | $ | 1,890 | |
Invesco Liquid Assets Portfolio, Institutional Class | | | 5,561,439 | | | | 35,662,429 | | | | (33,001,561 | ) | | | (1,690 | ) | | | 1,600 | | | | 8,222,217 | | | | 4,416 | |
Invesco Treasury Portfolio, Institutional Class | | | 8,321,770 | | | | 57,059,888 | | | | (52,802,498 | ) | | | - | | | | - | | | | 12,579,160 | | | | 1,431 | |
Total | | $ | 21,164,758 | | | $ | 142,649,719 | | | $ | (132,006,245 | ) | | $ | (1,690 | ) | | $ | 1,600 | | | $ | 31,808,142 | | | $ | 7,737 | |
| (d) | The rate shown is the 7-day SEC standardized yield as of April 30, 2021. |
See accompanying Notes to Financial Statements which are an integral part of the financial statements.
9 Invesco Value Opportunities Fund
Statement of Assets and Liabilities
April 30, 2021
| | | | |
Assets: | | | | |
Investments in securities, at value
(Cost $611,828,698) | | $ | 871,461,149 | |
Investments in affiliated money market funds, at value
(Cost $31,806,521) | | | 31,808,142 | |
Foreign currencies, at value (Cost $646) | | | 685 | |
Receivable for: | | | | |
Fund shares sold | | | 979,847 | |
Dividends | | | 389,125 | |
Investment for trustee deferred compensation and retirement plans | | | 501,365 | |
Other assets | | | 68,301 | |
Total assets | | | 905,208,614 | |
| |
Liabilities: | | | | |
Payable for: | | | | |
Investments purchased | | | 23,683,054 | |
Fund shares reacquired | | | 509,513 | |
Amount due custodian | | | 453,809 | |
Accrued fees to affiliates | | | 432,146 | |
Accrued trustees’ and officers’ fees and benefits | | | 969 | |
Accrued other operating expenses | | | 170,637 | |
Trustee deferred compensation and retirement plans | | | 535,717 | |
Total liabilities | | | 25,785,845 | |
Net assets applicable to shares outstanding | | $ | 879,422,769 | |
| |
Net assets consist of: | | | | |
Shares of beneficial interest | | $ | 614,154,206 | |
Distributable earnings | | | 265,268,563 | |
| | | $ | 879,422,769 | |
| | | | |
Net Assets: | | | | |
Class A | | $ | 726,801,301 | |
Class C | | $ | 12,906,272 | |
Class R | | $ | 10,384,910 | |
Class Y | | $ | 81,115,276 | |
Class R5 | | $ | 714,244 | |
Class R6 | | $ | 47,500,766 | |
|
Shares outstanding, no par value, with an unlimited number of shares authorized: | |
Class A | | | 41,911,027 | |
Class C | | | 804,805 | |
Class R | | | 607,640 | |
Class Y | | | 4,656,632 | |
Class R5 | | | 40,628 | |
Class R6 | | | 2,698,616 | |
Class A: | | | | |
Net asset value per share | | $ | 17.34 | |
Maximum offering price per share
(Net asset value of $17.34 ÷ 94.50%) | | $ | 18.35 | |
Class C: | | | | |
Net asset value and offering price per share | | $ | 16.04 | |
Class R: | | | | |
Net asset value and offering price per share | | $ | 17.09 | |
Class Y: | | | | |
Net asset value and offering price per share | | $ | 17.42 | |
Class R5: | | | | |
Net asset value and offering price per share | | $ | 17.58 | |
Class R6: | | | | |
Net asset value and offering price per share | | $ | 17.60 | |
See accompanying Notes to Financial Statements which are an integral part of the financial statements.
10 Invesco Value Opportunities Fund
Statement of Operations
For the year ended April 30, 2021
| | | | |
Investment income: | | | | |
Dividends | | $ | 10,520,719 | |
Dividends from affiliated money market funds | | | 7,737 | |
Total investment income | | | 10,528,456 | |
Expenses: | | | | |
Advisory fees | | | 4,247,389 | |
Administrative services fees | | | 77,284 | |
Custodian fees | | | 8,592 | |
Distribution fees: | | | | |
Class A | | | 1,360,929 | |
Class C | | | 102,031 | |
Class R | | | 37,589 | |
Transfer agent fees— A, C, R and Y | | | 1,361,207 | |
Transfer agent fees — R5 | | | 532 | |
Transfer agent fees — R6 | | | 12,281 | |
Trustees’ and officers’ fees and benefits | | | 32,106 | |
Registration and filing fees | | | 87,924 | |
Reports to shareholders | | | 104,493 | |
Professional services fees | | | 42,437 | |
Other | | | 33,528 | |
Total expenses | | | 7,508,322 | |
Less: Fees waived and/or expense offset arrangement(s) | | | (13,262 | ) |
Net expenses | | | 7,495,060 | |
Net investment income | | | 3,033,396 | |
Realized and unrealized gain (loss) from: | | | | |
Net realized gain from: | | | | |
Unaffiliated investment securities | | | 75,471,429 | |
Affiliated investment securities | | | 1,600 | |
Foreign currencies | | | 14,308 | |
| | | | 75,487,337 | |
Change in net unrealized appreciation (depreciation) of: | | | | |
Unaffiliated investment securities | | | 317,395,400 | |
Affiliated investment securities | | | (1,690 | ) |
Foreign currencies | | | 386 | |
| | | | 317,394,096 | |
Net realized and unrealized gain | | | 392,881,433 | |
Net increase in net assets resulting from operations | | $ | 395,914,829 | |
See accompanying Notes to Financial Statements which are an integral part of the financial statements.
11 Invesco Value Opportunities Fund
Statement of Changes in Net Assets
For the years ended April 30, 2021 and 2020
| | | | | | | | |
| | | 2021 | | | 2020 | |
Operations: | | | | | | | | |
Net investment income | | $ | 3,033,396 | | | $ | 1,940,996 | |
Net realized gain (loss) | | | 75,487,337 | | | | (67,943,796 | ) |
Change in net unrealized appreciation (depreciation) | | | 317,394,096 | | | | (108,874,976 | ) |
Net increase (decrease) in net assets resulting from operations | | | 395,914,829 | | | | (174,877,776 | ) |
| | |
Distributions to shareholders from distributable earnings: | | | | | | | | |
Class A | | | (1,438,862 | ) | | | (12,166,652 | ) |
Class C | | | - | | | | (312,891 | ) |
Class R | | | - | | | | (190,220 | ) |
Class Y | | | (175,795 | ) | | | (731,512 | ) |
Class R5 | | | (3,771 | ) | | | (14,668 | ) |
Class R6 | | | (246,332 | ) | | | (635,605 | ) |
Total distributions from distributable earnings | | | (1,864,760 | ) | | | (14,051,548 | ) |
| | |
Share transactions–net: | | | | | | | | |
Class A | | | (54,716,345 | ) | | | (53,126,304 | ) |
Class C | | | (3,891,646 | ) | | | (2,968,582 | ) |
Class R | | | (707,566 | ) | | | (2,009,859 | ) |
Class Y | | | 36,447,060 | | | | (4,558,923 | ) |
Class R5 | | | (26,905 | ) | | | (1,566,665 | ) |
Class R6 | | | 1,580,342 | | | | 889,449 | |
Net increase (decrease) in net assets resulting from share transactions | | | (21,315,060 | ) | | | (63,340,884 | ) |
Net increase (decrease) in net assets | | | 372,735,009 | | | | (252,270,208 | ) |
Net assets: | | | | | | | | |
Beginning of year | | | 506,687,760 | | | | 758,957,968 | |
End of year | | $ | 879,422,769 | | | $ | 506,687,760 | |
See accompanying Notes to Financial Statements which are an integral part of the financial statements.
12 Invesco Value Opportunities Fund
Financial Highlights
The following schedule presents financial highlights for a share of the Fund outstanding throughout the periods indicated.
| | | | | | | | | | | | | | | | | | | | | | | | | | | | | | | | | | | | | | | | | | | | | | | | | | | | | | | | | | | | | | | | | | | | | | |
| | | Net asset value, beginning of period | | Net investment income (loss)(a) | | Net gains (losses) on securities (both realized and unrealized) | | Total from investment operations | | Dividends from net investment income | | Distributions from net realized gains | | Total distributions | | Net asset value, end of period | | Total return (b) | | Net assets, end of period
(000’s omitted) | | Ratio of expenses to average net assets with fee waivers and/or expenses absorbed | | Ratio of expenses to average net assets without fee waivers and/or expenses absorbed | | Ratio of net investment income (loss) to average net assets | | Portfolio turnover (c) |
Class A | | | | | | | | | | | | | | | | | | | | | | | | | | | | | | | | | | | | | | | | | | | | | | | | | | | | | | | | | | | | | | | | | | | | | | |
Year ended 04/30/21 | | | $ | 9.44 | | | | $ | 0.06 | | | | $ | 7.87 | | | | $ | 7.93 | | | | $ | (0.03 | ) | | | $ | - | | | | $ | (0.03 | ) | | | $ | 17.34 | | | | | 84.15 | % | | | $ | 726,801 | | | | | 1.22 | %(d) | | | | 1.22 | %(d) | | | | 0.45 | %(d) | | | | 62 | % |
Year ended 04/30/20 | | | | 12.84 | | | | | 0.03 | | | | | (3.18 | )(e) | | | | (3.15 | ) | | | | - | | | | | (0.25 | ) | | | | (0.25 | ) | | | | 9.44 | | | | | (25.02 | )(e) | | | | 440,826 | | | | | 1.21 | | | | | 1.21 | | | | | 0.27 | | | | | 41 | |
Year ended 04/30/19 | | | | 14.24 | | | | | 0.00 | | | | | 0.18 | | | | | 0.18 | | | | | - | | | | | (1.58 | ) | | | | (1.58 | ) | | | | 12.84 | | | | | 3.58 | | | | | 658,685 | | | | | 1.21 | | | | | 1.21 | | | | | 0.02 | | | | | 51 | |
Year ended 04/30/18 | | | | 13.50 | | | | | 0.01 | | | | | 1.48 | | | | | 1.49 | | | | | - | | | | | (0.75 | ) | | | | (0.75 | ) | | | | 14.24 | | | | | 10.87 | | | | | 662,211 | | | | | 1.21 | | | | | 1.21 | | | | | 0.04 | | | | | 30 | |
Year ended 04/30/17 | | | | 11.60 | | | | | 0.01 | | | | | 2.05 | | | | | 2.06 | | | | | (0.02 | ) | | | | (0.14 | ) | | | | (0.16 | ) | | | | 13.50 | | | | | 17.81 | | | | | 645,216 | | | | | 1.26 | | | | | 1.27 | | | | | 0.07 | | | | | 33 | |
Class C | | | | | | | | | | | | | | | | | | | | | | | | | | | | | | | | | | | | | | | | | | | | | | | | | | | | | | | | | | | | | | | | | | | | | | |
Year ended 04/30/21 | | | | 8.77 | | | | | (0.02 | ) | | | | 7.29 | | | | | 7.27 | | | | | - | | | | | - | | | | | - | | | | | 16.04 | | | | | 82.90 | (f) | | | | 12,906 | | | | | 1.89 | (d)(f) | | | | 1.89 | (d)(f) | | | | (0.22 | )(d)(f) | | | | 62 | |
Year ended 04/30/20 | | | | 12.02 | | | | | (0.04 | ) | | | | (2.96 | )(e) | | | | (3.00 | ) | | | | - | | | | | (0.25 | ) | | | | (0.25 | ) | | | | 8.77 | | | | | (25.48 | )(e)(f) | | | | 10,107 | | | | | 1.85 | (f) | | | | 1.85 | (f) | | | | (0.37 | )(f) | | | | 41 | |
Year ended 04/30/19 | | | | 13.54 | | | | | (0.09 | ) | | | | 0.15 | | | | | 0.06 | | | | | - | | | | | (1.58 | ) | | | | (1.58 | ) | | | | 12.02 | | | | | 2.83 | (f) | | | | 17,027 | | | | | 1.92 | (f) | | | | 1.92 | (f) | | | | (0.69 | )(f) | | | | 51 | |
Year ended 04/30/18 | | | | 12.96 | | | | | (0.09 | ) | | | | 1.42 | | | | | 1.33 | | | | | - | | | | | (0.75 | ) | | | | (0.75 | ) | | | | 13.54 | | | | | 10.07 | (f) | | | | 68,174 | | | | | 1.91 | (f) | | | | 1.91 | (f) | | | | (0.66 | )(f) | | | | 30 | |
Year ended 04/30/17 | | | | 11.20 | | | | | (0.08 | ) | | | | 1.98 | | | | | 1.90 | | | | | - | | | | | (0.14 | ) | | | | (0.14 | ) | | | | 12.96 | | | | | 17.00 | (f) | | | | 82,590 | | | | | 1.97 | (f) | | | | 1.98 | (f) | | | | (0.64 | )(f) | | | | 33 | |
Class R | | | | | | | | | | | | | | | | | | | | | | | | | | | | | | | | | | | | | | | | | | | | | | | | | | | | | | | | | | | | | | | | | | | | | | |
Year ended 04/30/21 | | | | 9.31 | | | | | 0.03 | | | | | 7.75 | | | | | 7.78 | | | | | - | | | | | - | | | | | - | | | | | 17.09 | | | | | 83.57 | | | | | 10,385 | | | | | 1.47 | (d) | | | | 1.47 | (d) | | | | 0.20 | (d) | | | | 62 | |
Year ended 04/30/20 | | | | 12.69 | | | | | 0.00 | | | | | (3.13 | )(e) | | | | (3.13 | ) | | | | - | | | | | (0.25 | ) | | | | (0.25 | ) | | | | 9.31 | | | | | (25.16 | )(e) | | | | 6,362 | | | | | 1.46 | | | | | 1.46 | | | | | 0.02 | | | | | 41 | |
Year ended 04/30/19 | | | | 14.13 | | | | | (0.03 | ) | | | | 0.17 | | | | | 0.14 | | | | | - | | | | | (1.58 | ) | | | | (1.58 | ) | | | | 12.69 | | | | | 3.32 | | | | | 10,898 | | | | | 1.46 | | | | | 1.46 | | | | | (0.23 | ) | | | | 51 | |
Year ended 04/30/18 | | | | 13.43 | | | | | (0.03 | ) | | | | 1.48 | | | | | 1.45 | | | | | - | | | | | (0.75 | ) | | | | (0.75 | ) | | | | 14.13 | | | | | 10.63 | | | | | 12,955 | | | | | 1.46 | | | | | 1.46 | | | | | (0.21 | ) | | | | 30 | |
Year ended 04/30/17 | | | | 11.55 | | | | | (0.02 | ) | | | | 2.04 | | | | | 2.02 | | | | | - | | | | | (0.14 | ) | | | | (0.14 | ) | | | | 13.43 | | | | | 17.53 | | | | | 14,135 | | | | | 1.51 | | | | | 1.52 | | | | | (0.18 | ) | | | | 33 | |
Class Y | | | | | | | | | | | | | | | | | | | | | | | | | | | | | | | | | | | | | | | | | | | | | | | | | | | | | | | | | | | | | | | | | | | | | | |
Year ended 04/30/21 | | | | 9.49 | | | | | 0.09 | | | | | 7.91 | | | | | 8.00 | | | | | (0.07 | ) | | | | - | | | | | (0.07 | ) | | | | 17.42 | | | | | 84.48 | | | | | 81,115 | | | | | 0.97 | (d) | | | | 0.97 | (d) | | | | 0.70 | (d) | | | | 62 | |
Year ended 04/30/20 | | | | 12.86 | | | | | 0.06 | | | | | (3.18 | )(e) | | | | (3.12 | ) | | | | - | | | | | (0.25 | ) | | | | (0.25 | ) | | | | 9.49 | | | | | (24.74 | )(e) | | | | 23,760 | | | | | 0.96 | | | | | 0.96 | | | | | 0.52 | | | | | 41 | |
Year ended 04/30/19 | | | | 14.23 | | | | | 0.04 | | | | | 0.17 | | | | | 0.21 | | | | | - | | | | | (1.58 | ) | | | | (1.58 | ) | | | | 12.86 | | | | | 3.80 | | | | | 37,469 | | | | | 0.96 | | | | | 0.96 | | | | | 0.27 | | | | | 51 | |
Year ended 04/30/18 | | | | 13.46 | | | | | 0.04 | | | | | 1.48 | | | | | 1.52 | | | | | - | | | | | (0.75 | ) | | | | (0.75 | ) | | | | 14.23 | | | | | 11.13 | | | | | 39,323 | | | | | 0.96 | | | | | 0.96 | | | | | 0.29 | | | | | 30 | |
Year ended 04/30/17 | | | | 11.56 | | | | | 0.04 | | | | | 2.06 | | | | | 2.10 | | | | | (0.06 | ) | | | | (0.14 | ) | | | | (0.20 | ) | | | | 13.46 | | | | | 18.17 | | | | | 46,105 | | | | | 1.01 | | | | | 1.02 | | | | | 0.32 | | | | | 33 | |
Class R5 | | | | | | | | | | | | | | | | | | | | | | | | | | | | | | | | | | | | | | | | | | | | | | | | | | | | | | | | | | | | | | | | | | | | | | |
Year ended 04/30/21 | | | | 9.58 | | | | | 0.11 | | | | | 7.98 | | | | | 8.09 | | | | | (0.09 | ) | | | | - | | | | | (0.09 | ) | | | | 17.58 | | | | | 84.70 | | | | | 714 | | | | | 0.84 | (d) | | | | 0.84 | (d) | | | | 0.83 | (d) | | | | 62 | |
Year ended 04/30/20 | | | | 12.95 | | | | | 0.08 | | | | | (3.20 | )(e) | | | | (3.12 | ) | | | | - | | | | | (0.25 | ) | | | | (0.25 | ) | | | | 9.58 | | | | | (24.57 | )(e) | | | | 406 | | | | | 0.80 | | | | | 0.80 | | | | | 0.68 | | | | | 41 | |
Year ended 04/30/19 | | | | 14.29 | | | | | 0.05 | | | | | 0.19 | | | | | 0.24 | | | | | - | | | | | (1.58 | ) | | | | (1.58 | ) | | | | 12.95 | | | | | 4.01 | | | | | 2,212 | | | | | 0.84 | | | | | 0.84 | | | | | 0.39 | | | | | 51 | |
Year ended 04/30/18 | | | | 13.50 | | | | | 0.06 | | | | | 1.48 | | | | | 1.54 | | | | | - | | | | | (0.75 | ) | | | | (0.75 | ) | | | | 14.29 | | | | | 11.25 | | | | | 2,439 | | | | | 0.84 | | | | | 0.84 | | | | | 0.41 | | | | | 30 | |
Year ended 04/30/17 | | | | 11.60 | | | | | 0.06 | | | | | 2.06 | | | | | 2.12 | | | | | (0.08 | ) | | | | (0.14 | ) | | | | (0.22 | ) | | | | 13.50 | | | | | 18.30 | | | | | 2,456 | | | | | 0.85 | | | | | 0.86 | | | | | 0.48 | | | | | 33 | |
Class R6 | | | | | | | | | | | | | | | | | | | | | | | | | | | | | | | | | | | | | | | | | | | | | | | | | | | | | | | | | | | | | | | | | | | | | | |
Year ended 04/30/21 | | | | 9.59 | | | | | 0.11 | | | | | 8.00 | | | | | 8.11 | | | | | (0.10 | ) | | | | - | | | | | (0.10 | ) | | | | 17.60 | | | | | 84.81 | | | | | 47,501 | | | | | 0.78 | (d) | | | | 0.78 | (d) | | | | 0.89 | (d) | | | | 62 | |
Year ended 04/30/20 | | | | 12.97 | | | | | 0.09 | | | | | (3.22 | )(e) | | | | (3.13 | ) | | | | - | | | | | (0.25 | ) | | | | (0.25 | ) | | | | 9.59 | | | | | (24.61 | )(e) | | | | 25,226 | | | | | 0.75 | | | | | 0.75 | | | | | 0.73 | | | | | 41 | |
Year ended 04/30/19 | | | | 14.31 | | | | | 0.06 | | | | | 0.18 | | | | | 0.24 | | | | | - | | | | | (1.58 | ) | | | | (1.58 | ) | | | | 12.97 | | | | | 4.00 | | | | | 32,666 | | | | | 0.79 | | | | | 0.79 | | | | | 0.44 | | | | | 51 | |
Year ended 04/30/18 | | | | 13.50 | | | | | 0.08 | | | | | 1.48 | | | | | 1.56 | | | | | - | | | | | (0.75 | ) | | | | (0.75 | ) | | | | 14.31 | | | | | 11.40 | | | | | 28,305 | | | | | 0.77 | | | | | 0.77 | | | | | 0.48 | | | | | 30 | |
Period ended 04/30/17(g) | | | | 13.60 | | | | | 0.01 | | | | | (0.11 | ) | | | | (0.10 | ) | | | | - | | | | | - | | | | | - | | | | | 13.50 | | | | | (0.74 | ) | | | | 10 | | | | | 0.76 | (h) | | | | 0.76 | (h) | | | | 0.57 | (h) | | | | 33 | |
| (a) | Calculated using average shares outstanding. |
| (b) | Includes adjustments in accordance with accounting principles generally accepted in the United States of America and as such, the net asset value for financial reporting purposes and the returns based upon those net asset values may differ from the net asset value and returns for shareholder transactions. Does not include sales charges and is not annualized for periods less than one year, if applicable. |
| (c) | Portfolio turnover is calculated at the fund level and is not annualized for periods less than one year, if applicable. |
| (d) | Ratios are based on average daily net assets (000’s omitted) of $544,372, $11,041, $7,518, $33,104, $532 and $32,873 for Class A, Class C, Class R, Class Y, Class R5 and Class R6 shares, respectively. |
| (e) | Includes litigation proceeds received during the period. Had these litigation proceeds not been received, Net gains (losses) on securities (both realized and unrealized) per share would have been $(3.28), $(3.06), $(3.23), $(3.28), $(3.30) and $(3.32) for Class A, Class C, Class R, Class Y, Class R5 and Class R6 shares, respectively. Total returns would have been lower. |
| (f) | The total return, ratio of expenses to average net assets and ratio of net investment income (loss) to average net assets reflect actual 12b-1 fees of 0.92, 0.89%, 0.96%, 0.95% and 0.97% for the years ended April 30, 2021, 2020, 2019, 2018 and 2017, respectively. |
| (g) | Commencement date of April 04, 2017. |
See accompanying Notes to Financial Statements which are an integral part of the financial statements.
13 Invesco Value Opportunities Fund
Notes to Financial Statements
April 30, 2021
NOTE 1–Significant Accounting Policies
Invesco Value Opportunities Fund (the “Fund”) is a series portfolio of AIM Sector Funds (Invesco Sector Funds) (the “Trust”). The Trust is a Delaware statutory trust registered under the Investment Company Act of 1940, as amended (the “1940 Act”), as an open-end series management investment company authorized to issue an unlimited number of shares of beneficial interest. Information presented in these financial statements pertains only to the Fund. Matters affecting the Fund or each class will be voted on exclusively by the shareholders of the Fund or each class.
The Fund’s investment objective is total return through growth of capital and current income.
The Fund currently consists of six different classes of shares: Class A, Class C, Class R, Class Y, Class R5 and Class R6. Class Y shares are available only to certain investors. Class A shares are sold with a front-end sales charge unless certain waiver criteria are met. Under certain circumstances, load waived shares may be subject to contingent deferred sales charges (“CDSC”). Class C shares are sold with a CDSC. Class R, Class Y, Class R5 and Class R6 shares are sold at net asset value. Class C shares held for ten years after purchase are eligible for automatic conversion into Class A shares of the same Fund (the “Conversion Feature”). The automatic conversion pursuant to the Conversion Feature will generally occur at the end of the month following the tenth anniversary after a purchase of Class C shares. Effective November 30, 2020, the automatic conversion pursuant to the Conversion Feature changed from ten years to eight years. The first conversion of Class C shares to Class A shares occurred at the end of December 2020 for all Class C shares that were held for more than eight years as of November 30, 2020.
The Fund is an investment company and accordingly follows the investment company accounting and reporting guidance in accordance with Financial Accounting Standards Board Accounting Standards Codification Topic 946, Financial Services – Investment Companies.
| The | following is a summary of the significant accounting policies followed by the Fund in the preparation of its financial statements. |
| A. | Security Valuations – Securities, including restricted securities, are valued according to the following policy. |
A security listed or traded on an exchange (except convertible securities) is valued at its last sales price or official closing price as of the close of the customary trading session on the exchange where the security is principally traded, or lacking any sales or official closing price on a particular day, the security may be valued at the closing bid price on that day. Securities traded in the over-the-counter market are valued based on prices furnished by independent pricing services or market makers. When such securities are valued by an independent pricing service they may be considered fair valued. Futures contracts are valued at the final settlement price set by an exchange on which they are principally traded. Listed options are valued at the mean between the last bid and asked prices from the exchange on which they are principally traded. Options not listed on an exchange are valued by an independent source at the mean between the last bid and asked prices. For purposes of determining net asset value (“NAV”) per share, futures and option contracts generally are valued 15 minutes after the close of the customary trading session of the New York Stock Exchange (“NYSE”).
Investments in open-end and closed-end registered investment companies that do not trade on an exchange are valued at the end-of-day net asset value per share. Investments in open-end and closed-end registered investment companies that trade on an exchange are valued at the last sales price or official closing price as of the close of the customary trading session on the exchange where the security is principally traded.
Debt obligations (including convertible securities) and unlisted equities are fair valued using an evaluated quote provided by an independent pricing service. Evaluated quotes provided by the pricing service may be determined without exclusive reliance on quoted prices, and may reflect appropriate factors such as institution-size trading in similar groups of securities, developments related to specific securities, dividend rate (for unlisted equities), yield (for debt obligations), quality, type of issue, coupon rate (for debt obligations), maturity (for debt obligations), individual trading characteristics and other market data. Pricing services generally value debt obligations assuming orderly transactions of institutional round lot size, but a fund may hold or transact in the same securities in smaller, odd lot sizes. Odd lots often trade at lower prices than institutional round lots. Debt obligations are subject to interest rate and credit risks. In addition, all debt obligations involve some risk of default with respect to interest and/or principal payments.
Foreign securities’ (including foreign exchange contracts) prices are converted into U.S. dollar amounts using the applicable exchange rates as of the close of the NYSE. If market quotations are available and reliable for foreign exchange-traded equity securities, the securities will be valued at the market quotations. Because trading hours for certain foreign securities end before the close of the NYSE, closing market quotations may become unreliable. If between the time trading ends on a particular security and the close of the customary trading session on the NYSE, events occur that the investment adviser determines are significant and make the closing price unreliable, the Fund may fair value the security. If the event is likely to have affected the closing price of the security, the security will be valued at fair value in good faith using procedures approved by the Board of Trustees. Adjustments to closing prices to reflect fair value may also be based on a screening process of an independent pricing service to indicate the degree of certainty, based on historical data, that the closing price in the principal market where a foreign security trades is not the current value as of the close of the NYSE. Foreign securities’ prices meeting the approved degree of certainty that the price is not reflective of current value will be priced at the indication of fair value from the independent pricing service. Multiple factors may be considered by the independent pricing service in determining adjustments to reflect fair value and may include information relating to sector indices, American Depositary Receipts and domestic and foreign index futures. Foreign securities may have additional risks including exchange rate changes, potential for sharply devalued currencies and high inflation, political and economic upheaval, the relative lack of issuer information, relatively low market liquidity and the potential lack of strict financial and accounting controls and standards.
Securities for which market prices are not provided by any of the above methods may be valued based upon quotes furnished by independent sources. The last bid price may be used to value equity securities. The mean between the last bid and asked prices is used to value debt obligations, including corporate loans.
Securities for which market quotations are not readily available or became unreliable are valued at fair value as determined in good faith by or under the supervision of the Trust’s officers following procedures approved by the Board of Trustees. Issuer specific events, market trends, bid/asked quotes of brokers and information providers and other market data may be reviewed in the course of making a good faith determination of a security’s fair value.
The Fund may invest in securities that are subject to interest rate risk, meaning the risk that the prices will generally fall as interest rates rise and, conversely, the prices will generally rise as interest rates fall. Specific securities differ in their sensitivity to changes in interest rates depending on their individual characteristics. Changes in interest rates may result in increased market volatility, which may affect the value and/or liquidity of certain Fund investments.
Valuations change in response to many factors including the historical and prospective earnings of the issuer, the value of the issuer’s assets, general market conditions which are not specifically related to the particular issuer, such as real or perceived adverse economic conditions, changes in the general outlook for revenues or corporate earnings, changes in interest or currency rates, regional or global instability, natural or environmental disasters, widespread disease or other public health issues, war, acts of terrorism or adverse investor sentiment generally and market liquidity. Because of the inherent uncertainties of valuation, the values reflected in the financial statements may materially differ from the value received upon actual sale of those investments.
| B. | Securities Transactions and Investment Income – Securities transactions are accounted for on a trade date basis. Realized gains or losses on sales are computed on the basis of specific identification of the securities sold. Interest income (net of withholding tax, if any) is recorded on an accrual basis from settlement date and includes coupon interest and amortization of premium and accretion of discount on debt securities as applicable. Dividend income (net of withholding tax, if any) is recorded on the ex-dividend date. |
The Fund may periodically participate in litigation related to Fund investments. As such, the Fund may receive proceeds from litigation settlements. Any proceeds received are included in the Statement of Operations as realized gain (loss) for investments no longer held and as unrealized gain (loss) for investments still held.
14 Invesco Value Opportunities Fund
Brokerage commissions and mark ups are considered transaction costs and are recorded as an increase to the cost basis of securities purchased and/or a reduction of proceeds on a sale of securities. Such transaction costs are included in the determination of net realized and unrealized gain (loss) from investment securities reported in the Statement of Operations and the Statement of Changes in Net Assets and the net realized and unrealized gains (losses) on securities per share in the Financial Highlights. Transaction costs are included in the calculation of the Fund’s net asset value and, accordingly, they reduce the Fund’s total returns. These transaction costs are not considered operating expenses and are not reflected in net investment income reported in the Statement of Operations and the Statement of Changes in Net Assets, or the net investment income per share and the ratios of expenses and net investment income reported in the Financial Highlights, nor are they limited by any expense limitation arrangements between the Fund and the investment adviser.
The Fund allocates income and realized and unrealized capital gains and losses to a class based on the relative net assets of each class.
| C. | Country Determination – For the purposes of making investment selection decisions and presentation in the Schedule of Investments, the investment adviser may determine the country in which an issuer is located and/or credit risk exposure based on various factors. These factors include the laws of the country under which the issuer is organized, where the issuer maintains a principal office, the country in which the issuer derives 50% or more of its total revenues and the country that has the primary market for the issuer’s securities, as well as other criteria. Among the other criteria that may be evaluated for making this determination are the country in which the issuer maintains 50% or more of its assets, the type of security, financial guarantees and enhancements, the nature of the collateral and the sponsor organization. Country of issuer and/or credit risk exposure has been determined to be the United States of America, unless otherwise noted. |
| D. | Distributions – Distributions from net investment income and net realized capital gain, if any, are generally declared and paid annually and recorded on the ex-dividend date. The Fund may elect to treat a portion of the proceeds from redemptions as distributions for federal income tax purposes. |
| E. | Federal Income Taxes – The Fund intends to comply with the requirements of Subchapter M of the Internal Revenue Code of 1986, as amended (the “Internal Revenue Code”), necessary to qualify as a regulated investment company and to distribute substantially all of the Fund’s taxable earnings to shareholders. As such, the Fund will not be subject to federal income taxes on otherwise taxable income (including net realized capital gain) that is distributed to shareholders. Therefore, no provision for federal income taxes is recorded in the financial statements. |
The Fund recognizes the tax benefits of uncertain tax positions only when the position is more likely than not to be sustained. Management has analyzed the Fund’s uncertain tax positions and concluded that no liability for unrecognized tax benefits should be recorded related to uncertain tax positions. Management is not aware of any tax positions for which it is reasonably possible that the total amounts of unrecognized tax benefits will change materially in the next 12 months.
The Fund files tax returns in the U.S. Federal jurisdiction and certain other jurisdictions. Generally, the Fund is subject to examinations by such taxing authorities for up to three years after the filing of the return for the tax period.
| F. | Expenses – Fees provided for under the Rule 12b-1 plan of a particular class of the Fund are charged to the operations of such class. Transfer agency fees and expenses and other shareholder recordkeeping fees and expenses attributable to Class R5 and Class R6 are allocated to each share class based on relative net assets. Sub-accounting fees attributable to Class R5 are charged to the operations of the class. Transfer agency fees and expenses and other shareholder recordkeeping fees and expenses relating to all other classes are allocated among those classes based on relative net assets. All other expenses are allocated among the classes based on relative net assets. |
| G. | Accounting Estimates – The preparation of financial statements in conformity with accounting principles generally accepted in the United States of America (“GAAP”) requires management to make estimates and assumptions that affect the reported amounts of assets and liabilities at the date of the financial statements and the reported amounts of revenues and expenses during the reporting period including estimates and assumptions related to taxation. Actual results could differ from those estimates by a significant amount. In addition, the Fund monitors for material events or transactions that may occur or become known after the period-end date and before the date the financial statements are released to print. |
| H. | Indemnifications – Under the Trust’s organizational documents, each Trustee, officer, employee or other agent of the Trust is indemnified against certain liabilities that may arise out of the performance of their duties to the Fund. Additionally, in the normal course of business, the Fund enters into contracts, including the Fund’s servicing agreements, that contain a variety of indemnification clauses. The Fund’s maximum exposure under these arrangements is unknown as this would involve future claims that may be made against the Fund that have not yet occurred. The risk of material loss as a result of such indemnification claims is considered remote. |
| I. | Foreign Currency Translations – Foreign currency is valued at the close of the NYSE based on quotations posted by banks and major currency dealers. Portfolio securities and other assets and liabilities denominated in foreign currencies are translated into U.S. dollar amounts at the date of valuation. Purchases and sales of portfolio securities (net of foreign taxes withheld on disposition) and income items denominated in foreign currencies are translated into U.S. dollar amounts on the respective dates of such transactions. The Fund does not separately account for the portion of the results of operations resulting from changes in foreign exchange rates on investments and the fluctuations arising from changes in market prices of securities held. The combined results of changes in foreign exchange rates and the fluctuation of market prices on investments (net of estimated foreign tax withholding) are included with the net realized and unrealized gain or loss from investments in the Statement of Operations. Reported net realized foreign currency gains or losses arise from (1) sales of foreign currencies, (2) currency gains or losses realized between the trade and settlement dates on securities transactions, and (3) the difference between the amounts of dividends, interest, and foreign withholding taxes recorded on the Fund’s books and the U.S. dollar equivalent of the amounts actually received or paid. Net unrealized foreign currency gains and losses arise from changes in the fair values of assets and liabilities, other than investments in securities at fiscal period end, resulting from changes in exchange rates. |
The Fund may invest in foreign securities, which may be subject to foreign taxes on income, gains on investments or currency repatriation, a portion of which may be recoverable. Foreign taxes, if any, are recorded based on the tax regulations and rates that exist in the foreign markets in which the Fund invests and are shown in the Statement of Operations.
| J. | Forward Foreign Currency Contracts – The Fund may engage in foreign currency transactions either on a spot (i.e. for prompt delivery and settlement) basis, or through forward foreign currency contracts, to manage or minimize currency or exchange rate risk. |
The Fund may also enter into forward foreign currency contracts for the purchase or sale of a security denominated in a foreign currency in order to “lock in” the U.S. dollar price of that security, or the Fund may also enter into forward foreign currency contracts that do not provide for physical settlement of the two currencies, but instead are settled by a single cash payment calculated as the difference between the agreed upon exchange rate and the spot rate at settlement based upon an agreed upon notional amount (non-deliverable forwards). The Fund will set aside liquid assets in an amount equal to the daily mark-to-market obligation for forward foreign currency contracts.
A forward foreign currency contract is an obligation between two parties (“Counterparties”) to purchase or sell a specific currency for an agreed-upon price at a future date. The use of forward foreign currency contracts does not eliminate fluctuations in the price of the underlying securities the Fund owns or intends to acquire but establishes a rate of exchange in advance. Fluctuations in the value of these contracts are measured by the difference in the contract date and reporting date exchange rates and are recorded as unrealized appreciation (depreciation) until the contracts are closed. When the contracts are closed, realized gains (losses) are recorded. Realized and unrealized gains (losses) on the contracts are included in the Statement of Operations. The primary risks associated with forward foreign currency contracts include failure of the Counterparty to meet the terms of the contract and the value of the foreign currency changing unfavorably. These risks may be in excess of the amounts reflected in the Statement of Assets and Liabilities.
| K. | COVID-19 Risk - The COVID-19 strain of coronavirus has resulted in instances of market closures and dislocations, extreme volatility, liquidity constraints and increased trading costs. Efforts to contain its spread have resulted in travel restrictions, disruptions of healthcare systems, business operations and supply |
15 Invesco Value Opportunities Fund
| | chains, layoffs, lower consumer demand, and defaults, among other significant economic impacts that have disrupted global economic activity across many industries. Such economic impacts may exacerbate other pre-existing political, social and economic risks locally or globally. |
The ongoing effects of COVID-19 are unpredictable and may result in significant and prolonged effects on the Fund��s performance.
NOTE 2–Advisory Fees and Other Fees Paid to Affiliates
The Trust has entered into a master investment advisory agreement with Invesco Advisers, Inc. (the “Adviser” or “Invesco”). Under the terms of the investment advisory agreement, the Fund accrues daily and pays monthly an advisory fee to the Adviser based on the annual rate of the Fund’s average daily net assets as follows:
| | | | | | |
| Average Daily Net Assets | | Rate | |
First $ 250 million | | | 0.695 | % |
Next $250 million | | | 0.670 | % |
Next $500 million | | | 0.645 | % |
Next $1.5 billion | | | 0.620 | % |
Next $2.5 billion | | | 0.595 | % |
Next $2.5 billion | | | 0.570 | % |
Next $2.5 billion | | | 0.545 | % |
Over $10 billion | | | 0.520 | % |
For the year ended April 30, 2021, the effective advisory fee rate incurred by the Fund was 0.67%.
Under the terms of a master sub-advisory agreement between the Adviser and each of Invesco Asset Management Deutschland GmbH, Invesco Asset Management Limited, Invesco Asset Management (Japan) Limited, Invesco Hong Kong Limited, Invesco Senior Secured Management, Inc. and Invesco Canada Ltd. (collectively, the “Affiliated Sub-Advisers”) the Adviser, not the Fund, will pay 40% of the fees paid to the Adviser to any such Affiliated Sub-Adviser(s) that provide(s) discretionary investment management services to the Fund based on the percentage of assets allocated to such Affiliated Sub-Adviser(s).
The Adviser has contractually agreed, through at least June 30, 2022, to waive advisory fees and/or reimburse expenses of all shares to the extent necessary to limit total annual fund operating expenses after fee waiver and/or expense reimbursement (excluding certain items discussed above) of Class A, Class C, Class R, Class Y, Class R5 and Class R6 shares to 2.00%, 2.75%, 2.25%, 1.75%, 1.75% and 1.75%, respectively, of the Fund’s average daily net assets (the “expense limits”). In determining the Adviser’s obligation to waive advisory fees and/or reimburse expenses, the following expenses are not taken into account, and could cause the total annual fund operating expenses after fee waiver and/or expense reimbursement to exceed the numbers reflected above: (1) interest; (2) taxes; (3) dividend expense on short sales; (4) extraordinary or non-routine items, including litigation expenses; and (5) expenses that the Fund has incurred but did not actually pay because of an expense offset arrangement. Unless Invesco continues the fee waiver agreement, it will terminate on June 30, 2022. During its term, the fee waiver agreement cannot be terminated or amended to increase the expense limits or reduce the advisory fee waiver without approval of the Board of Trustees. The Adviser did not waive fees and/or reimburse expenses during the period under these expense limits.
Further, the Adviser has contractually agreed, through at least June 30, 2023, to waive the advisory fee payable by the Fund in an amount equal to 100% of the net advisory fees the Adviser receives from the affiliated money market funds on investments by the Fund of uninvested cash in such affiliated money market funds.
For the year ended April 30, 2021, the Adviser waived advisory fees of $10,448.
The Trust has entered into a master administrative services agreement with Invesco pursuant to which the Fund has agreed to pay Invesco for certain administrative costs incurred in providing accounting services to the Fund. For the year ended April 30, 2021, expenses incurred under the agreement are shown in the Statement of Operations as Administrative services fees. Invesco has entered into a sub-administration agreement whereby State Street Bank and Trust Company (“SSB”) serves as fund accountant and provides certain administrative services to the Fund. Pursuant to a custody agreement with the Trust on behalf of the Fund, SSB also serves as the Fund’s custodian.
The Trust has entered into a transfer agency and service agreement with Invesco Investment Services, Inc. (“IIS”) pursuant to which the Fund has agreed to pay IIS a fee for providing transfer agency and shareholder services to the Fund and reimburse IIS for certain expenses incurred by IIS in the course of providing such services. IIS may make payments to intermediaries that provide omnibus account services, sub-accounting services and/or networking services. All fees payable by IIS to intermediaries that provide omnibus account services or sub-accounting services are charged back to the Fund, subject to certain limitations approved by the Trust’s Board of Trustees. For the year ended April 30, 2021, expenses incurred under the agreement are shown in the Statement of Operations as Transfer agent fees.
The Trust has entered into master distribution agreements with Invesco Distributors, Inc.(“IDI”) to serve as the distributor for the Class A, Class C, Class R, Class Y, Class R5 and Class R6 shares of the Fund. The Trust has adopted plans pursuant to Rule 12b-1 under the 1940 Act with respect to the Fund’s Class A, Class C and Class R shares (collectively the “Plan”). The Fund, pursuant to the Plans, reimburses IDI for its allocated share of expenses incurred for the period, up to a maximum annual rate of 0.25% of the average daily net assets of Class A shares and up to a maximum annual rate of 1.00% of the average daily net assets of Class C shares. The Fund pursuant to the Class R Plan, pays IDI compensation at the annual rate of 0.50% of the average daily net assets of Class R shares. The fees are accrued daily and paid monthly. Of the Plan payments, up to 0.25% of the average daily net assets of each class of shares may be paid to furnish continuing personal shareholder services to customers who purchase and own shares of such classes. Any amounts not paid as a service fee under the Plan would constitute an asset-based sales charge. Rules of the Financial Industry Regulatory Authority (“FINRA”) impose a cap on the total sales charges, including asset-based sales charges, that may be paid by any class of shares of the Fund. For the year ended April 30, 2021, expenses incurred under the Plans are shown in the Statement of Operations as Distribution fees.
Front-end sales commissions and CDSC (collectively, the “sales charges”) are not recorded as expenses of the Fund. Front-end sales commissions are deducted from proceeds from the sales of Fund shares prior to investment in Class A shares of the Fund. CDSC are deducted from redemption proceeds prior to remittance to the shareholder. During the year ended April 30, 2021, IDI advised the Fund that IDI retained $41,712 in front-end sales commissions from the sale of Class A shares and $4,964 and $296 from Class A and Class C shares, respectively, for CDSC imposed upon redemptions by shareholders.
For the year ended April 30, 2021, the Fund incurred $7,854 in brokerage commissions with Invesco Capital Markets, Inc., an affiliate of the Adviser and IDI, for portfolio transactions executed on behalf of the Fund.
Certain officers and trustees of the Trust are officers and directors of the Adviser, IIS and/or IDI.
NOTE 3–Additional Valuation Information
GAAP defines fair value as the price that would be received to sell an asset or paid to transfer a liability in an orderly transaction between market participants at the measurement date, under current market conditions. GAAP establishes a hierarchy that prioritizes the inputs to valuation methods, giving the highest priority to readily available unadjusted quoted prices in an active market for identical assets (Level 1) and the lowest priority to significant unobservable inputs (Level 3), generally when market prices are not readily available or are unreliable. Based on the valuation inputs, the securities or other investments are tiered into one of three levels. Changes in valuation methods may result in transfers in or out of an investment’s assigned level:
| | |
| Level 1 – | | Prices are determined using quoted prices in an active market for identical assets. |
16 Invesco Value Opportunities Fund
| | |
| Level 2 – | | Prices are determined using other significant observable inputs. Observable inputs are inputs that other market participants may use in pricing a security. These may include quoted prices for similar securities, interest rates, prepayment speeds, credit risk, yield curves, loss severities, default rates, discount rates, volatilities and others. |
| Level 3 – | | Prices are determined using significant unobservable inputs. In situations where quoted prices or observable inputs are unavailable (for example, when there is little or no market activity for an investment at the end of the period), unobservable inputs may be used. Unobservable inputs reflect the Fund’s own assumptions about the factors market participants would use in determining fair value of the securities or instruments and would be based on the best available information. |
The following is a summary of the tiered valuation input levels, as of April 30, 2021. The level assigned to the securities valuations may not be an indication of the risk or liquidity associated with investing in those securities. Because of the inherent uncertainties of valuation, the values reflected in the financial statements may materially differ from the value received upon actual sale of those investments.
| | | | | | | | | | | | | | | | |
| | | Level 1 | | | Level 2 | | | Level 3 | | | Total | |
Investments in Securities | | | | | | | | | | | | | | | | |
Common Stocks & Other Equity Interests | | $ | 847,842,677 | | | $ | 23,618,472 | | | | $– | | | $ | 871,461,149 | |
Money Market Funds | | | 31,808,142 | | | | – | | | | – | | | | 31,808,142 | |
Total Investments | | $ | 879,650,819 | | | $ | 23,618,472 | | | | $– | | | $ | 903,269,291 | |
NOTE 4–Expense Offset Arrangement(s)
The expense offset arrangement is comprised of transfer agency credits which result from balances in demand deposit accounts used by the transfer agent for clearing shareholder transactions. For the year ended April 30, 2021, the Fund received credits from this arrangement, which resulted in the reduction of the Fund’s total expenses of $2,814.
NOTE 5–Trustees’ and Officers’ Fees and Benefits
Trustees’ and Officers’ Fees and Benefits include amounts accrued by the Fund to pay remuneration to certain Trustees and Officers of the Fund. Trustees have the option to defer compensation payable by the Fund, and Trustees’ and Officers’ Fees and Benefits also include amounts accrued by the Fund to fund such deferred compensation amounts. Those Trustees who defer compensation have the option to select various Invesco Funds in which their deferral accounts shall be deemed to be invested. Finally, certain current Trustees were eligible to participate in a retirement plan that provided for benefits to be paid upon retirement to Trustees over a period of time based on the number of years of service. The Fund may have certain former Trustees who also participate in a retirement plan and receive benefits under such plan. Trustees’ and Officers’ Fees and Benefits include amounts accrued by the Fund to fund such retirement benefits. Obligations under the deferred compensation and retirement plans represent unsecured claims against the general assets of the Fund.
NOTE 6–Cash Balances
The Fund is permitted to temporarily carry a negative or overdrawn balance in its account with SSB, the custodian bank. Such balances, if any at period-end, are shown in the Statement of Assets and Liabilities under the payable caption Amount due custodian. To compensate the custodian bank for such overdrafts, the overdrawn Fund may either (1) leave funds as a compensating balance in the account so the custodian bank can be compensated by earning the additional interest; or (2) compensate by paying the custodian bank at a rate agreed upon by the custodian bank and Invesco, not to exceed the contractually agreed upon rate. The Fund may not purchase additional securities when any borrowings from banks or broker-dealers exceed 5% of the Fund’s total assets, or when any borrowings from an Invesco Fund are outstanding.
NOTE 7–Distributions to Shareholders and Tax Components of Net Assets
Tax Character of Distributions to Shareholders Paid During the Fiscal Years Ended April 30, 2021 and April 30, 2020:
| | | | | | | | |
| | | 2021 | | | 2020 | |
Ordinary income* | | $ | 1,864,760 | | | $ | 3,323,175 | |
Long-term capital gain | | | — | | | | 10,728,373 | |
Total distributions | | $ | 1,864,760 | | | $ | 14,051,548 | |
| * | Includes short-term capital gain distributions, if any. |
Tax Components of Net Assets at Period-End:
| | | | |
| | | 2021 | |
Undistributed ordinary income | | $ | 8,573,295 | |
Net unrealized appreciation – investments | | | 257,048,855 | |
Net unrealized appreciation – foreign currencies | | | 2,796 | |
Temporary book/tax differences | | | (356,383 | ) |
Shares of beneficial interest | | | 614,154,206 | |
Total net assets | | $ | 879,422,769 | |
The difference between book-basis and tax-basis unrealized appreciation (depreciation) is due to differences in the timing of recognition of gains and losses on investments for tax and book purposes. The Fund’s net unrealized appreciation (depreciation) difference is attributable primarily to wash sales.
The temporary book/tax differences are a result of timing differences between book and tax recognition of income and/or expenses. The Fund’s temporary book/tax differences are the result of the trustee deferral of compensation and retirement plan benefits.
Capital loss carryforward is calculated and reported as of a specific date. Results of transactions and other activity after that date may affect the amount of capital loss carryforward actually available for the Fund to utilize. The ability to utilize capital loss carryforward in the future may be limited under the Internal Revenue Code and related regulations based on the results of future transactions.
The Fund does not have a capital loss carryforward as of April 30, 2021.
17 Invesco Value Opportunities Fund
NOTE 8–Investment Transactions
The aggregate amount of investment securities (other than short-term securities, U.S. Government obligations and money market funds, if any) purchased and sold by the Fund during the year ended April 30, 2021 was $382,154,611 and $394,576,837, respectively. Cost of investments, including any derivatives, on a tax basis includes the adjustments for financial reporting purposes as of the most recently completed federal income tax reporting period-end.
| | | | |
| Unrealized Appreciation (Depreciation) of Investments on a Tax Basis | |
Aggregate unrealized appreciation of investments | | | $263,277,719 | |
Aggregate unrealized (depreciation) of investments | | | (6,228,864 | ) |
Net unrealized appreciation of investments | | | $257,048,855 | |
Cost of investments for tax purposes is $646,220,436.
NOTE 9–Reclassification of Permanent Differences
Primarily as a result of differing book/tax treatment of foreign currency transactions and fair fund distributions transaction, on April 30, 2021, undistributed net investment income was increased by $132,621 and undistributed net realized gain was decreased by $132,621. This reclassification had no effect on the net assets or the distributable earnings of the Fund.
NOTE 10–Share Information
| | | | | | | | | | | | | | | | | | | | |
| Summary of Share Activity | |
| | | Year ended April 30, 2021(a) | | | | | | Year ended April 30, 2020 | |
| | | Shares | | | Amount | | | | | | Shares | | | Amount | |
Sold: | | | | | | | | | | | | | | | | | | | | |
Class A | | | 2,870,748 | | | $ | 39,414,520 | | | | | | | | 2,737,347 | | | $ | 29,957,805 | |
Class C | | | 221,764 | | | | 2,934,318 | | | | | | | | 188,021 | | | | 1,997,144 | |
Class R | | | 153,622 | | | | 2,028,168 | | | | | | | | 97,864 | | | | 1,101,127 | |
Class Y | | | 2,822,923 | | | | 45,071,238 | | | | | | | | 848,595 | | | | 10,353,459 | |
Class R5 | | | 373 | | | | 4,296 | | | | | | | | 8,037 | | | | 102,961 | |
Class R6 | | | 969,048 | | | | 13,100,519 | | | | | | | | 919,288 | | | | 10,270,214 | |
Issued as reinvestment of dividends: | | | | | | | | | | | | | | | | | | | | |
Class A | | | 100,360 | | | | 1,347,839 | | | | | | | | 903,651 | | | | 11,548,662 | |
Class C | | | – | | | | – | | | | | | | | 25,632 | | | | 305,017 | |
Class R | | | – | | | | – | | | | | | | | 15,094 | | | | 190,179 | |
Class Y | | | 11,097 | | | | 149,592 | | | | | | | | 48,213 | | | | 618,089 | |
Class R5 | | | 275 | | | | 3,734 | | | | | | | | 1,126 | | | | 14,563 | |
Class R6 | | | 17,601 | | | | 239,545 | | | | | | | | 48,392 | | | | 626,679 | |
Automatic conversion of Class C shares to Class A shares: | | | | | | | | | | | | | | | | | | | | |
Class A | | | 277,655 | | | | 3,624,976 | | | | | | | | 155,430 | | | | 1,816,257 | |
Class C | | | (299,635 | ) | | | (3,624,976 | ) | | | | | | | (166,609 | ) | | | (1,816,257 | ) |
Reacquired: | | | | | | | | | | | | | | | | | | | | |
Class A | | | (8,015,628 | ) | | | (99,103,680 | ) | | | | | | | (8,422,923 | ) | | | (96,449,028 | ) |
Class C | | | (269,660 | ) | | | (3,200,988 | ) | | | | | | | (310,746 | ) | | | (3,454,486 | ) |
Class R | | | (229,550 | ) | | | (2,735,734 | ) | | | | | | | (288,336 | ) | | | (3,301,165 | ) |
Class Y | | | (682,026 | ) | | | (8,773,770 | ) | | | | | | | (1,304,916 | ) | | | (15,530,471 | ) |
Class R5 | | | (2,450 | ) | | | (34,935 | ) | | | | | | | (137,562 | ) | | | (1,684,189 | ) |
Class R6 | | | (919,591 | ) | | | (11,759,722 | ) | | | | | | | (854,482 | ) | | | (10,007,444 | ) |
Net increase (decrease) in share activity | | | (2,973,074 | ) | | $ | (21,315,060 | ) | | | | | | | (5,488,884 | ) | | $ | (63,340,884 | ) |
| (a) | There are entities that are record owners of more than 5% of the outstanding shares of the Fund and in the aggregate own 29% of the outstanding shares of the Fund. IDI has an agreement with these entities to sell Fund shares. The Fund, Invesco and/or Invesco affiliates may make payments to these entities, which are considered to be related to the Fund, for providing services to the Fund, Invesco and/or Invesco affiliates including but not limited to services such as securities brokerage, distribution, third party record keeping and account servicing. The Fund has no knowledge as to whether all or any portion of the shares owned of record by these entities are also owned beneficially. |
18 Invesco Value Opportunities Fund
Report of Independent Registered Public Accounting Firm
To the Board of Trustees of AIM Sector Funds (Invesco Sector Funds) and Shareholders of Invesco Value Opportunities Fund
Opinion on the Financial Statements
We have audited the accompanying statement of assets and liabilities, including the schedule of investments, of Invesco Value Opportunities Fund (one of the funds constituting AIM Sector Funds (Invesco Sector Funds), referred to hereafter as the “Fund”) as of April 30, 2021, the related statement of operations for the year ended April 30, 2021, the statement of changes in net assets for each of the two years in the period ended April 30, 2021, including the related notes, and the financial highlights for each of the periods indicated therein (collectively referred to as the “financial statements”). In our opinion, the financial statements present fairly, in all material respects, the financial position of the Fund as of April 30, 2021, the results of its operations for the year then ended, the changes in its net assets for each of the two years in the period ended April 30, 2021 and the financial highlights for each of the periods indicated therein in conformity with accounting principles generally accepted in the United States of America.
Basis for Opinion
These financial statements are the responsibility of the Fund’s management. Our responsibility is to express an opinion on the Fund’s financial statements based on our audits. We are a public accounting firm registered with the Public Company Accounting Oversight Board (United States) (PCAOB) and are required to be independent with respect to the Fund in accordance with the U.S. federal securities laws and the applicable rules and regulations of the Securities and Exchange Commission and the PCAOB.
We conducted our audits of these financial statements in accordance with the standards of the PCAOB. Those standards require that we plan and perform the audit to obtain reasonable assurance about whether the financial statements are free of material misstatement, whether due to error or fraud.
Our audits included performing procedures to assess the risks of material misstatement of the financial statements, whether due to error or fraud, and performing procedures that respond to those risks. Such procedures included examining, on a test basis, evidence regarding the amounts and disclosures in the financial statements. Our audits also included evaluating the accounting principles used and significant estimates made by management, as well as evaluating the overall presentation of the financial statements. Our procedures included confirmation of securities owned as of April 30, 2021 by correspondence with the custodian, transfer agent and brokers; when replies were not received from brokers, we performed other auditing procedures. We believe that our audits provide a reasonable basis for our opinion.
/s/PricewaterhouseCoopers LLP
Houston, Texas
June 24, 2021
We have served as the auditor of one or more investment companies in the Invesco group of investment companies since at least 1995. We have not been able to determine the specific year we began serving as auditor.
19 Invesco Value Opportunities Fund
Calculating your ongoing Fund expenses
Example
As a shareholder of the Fund, you incur two types of costs: (1) transaction costs, which may include sales charges (loads) on purchase payments or contingent deferred sales charges on redemptions, if any; and (2) ongoing costs, including management fees, distribution and/or service (12b-1) fees, and other Fund expenses. This example is intended to help you understand your ongoing costs (in dollars) of investing in the Fund and to compare these costs with ongoing costs of investing in other mutual funds. The example is based on an investment of $1,000 invested at the beginning of the period and held for the entire period November 1, 2020 through April 30, 2021.
Actual expenses
The table below provides information about actual account values and actual expenses. You may use the information in this table, together with the amount you invested, to estimate the expenses that you paid over the period. Simply divide your account value by $1,000 (for example, an $8,600 account value divided by $1,000 = 8.6), then multiply the result by the number in the table under the heading entitled “Actual Expenses Paid During Period” to estimate the expenses you paid on your account during this period.
Hypothetical example for comparison purposes
The table below also provides information about hypothetical account values and hypothetical expenses based on the Fund’s actual expense ratio and an assumed rate of return of 5% per year before expenses, which is not the Fund’s actual return.
The hypothetical account values and expenses may not be used to estimate the actual ending account balance or expenses you paid for the period. You may use this information to compare the ongoing costs of investing in the Fund and other funds. To do so, compare this 5% hypothetical example with the 5% hypothetical examples that appear in the shareholder reports of the other funds.
Please note that the expenses shown in the table are meant to highlight your ongoing costs only and do not reflect any transaction costs, such as sales charges (loads) on purchase payments or contingent deferred sales charges on redemptions, if any. Therefore, the hypothetical information is useful in comparing ongoing costs only, and will not help you determine the relative total costs of owning different funds. In addition, if these transaction costs were included, your costs would have been higher.
| | | | | | | | | | | | |
| | | Beginning
Account Value
(11/01/20) | | ACTUAL | | HYPOTHETICAL (5% annual return before expenses) | | Annualized
Expense
Ratio |
| | Ending
Account Value
(04/30/21)1 | | Expenses
Paid During
Period2 | | Ending
Account Value
(04/30/21) | | Expenses
Paid During
Period2 |
| Class A | | $1,000.00 | | $1,621.60 | | $7.61 | | $1,018.99 | | $5.86 | | 1.17% |
| Class C | | 1,000.00 | | 1,616.90 | | 11.61 | | 1,015.92 | | 8.95 | | 1.79 |
| Class R | | 1,000.00 | | 1,618.40 | | 9.22 | | 1,017.75 | | 7.10 | | 1.42 |
| Class Y | | 1,000.00 | | 1,624.00 | | 5.99 | | 1,020.23 | | 4.61 | | 0.92 |
| Class R5 | | 1,000.00 | | 1,623.40 | | 5.40 | | 1,020.68 | | 4.16 | | 0.83 |
| Class R6 | | 1,000.00 | | 1,624.50 | | 4.88 | | 1,021.08 | | 3.76 | | 0.75 |
| 1 | The actual ending account value is based on the actual total return of the Fund for the period November 1, 2020 through April 30, 2021, after actual expenses and will differ from the hypothetical ending account value which is based on the Fund’s expense ratio and a hypothetical annual return of 5% before expenses. |
| 2 | Expenses are equal to the Fund’s annualized expense ratio as indicated above multiplied by the average account value over the period, multiplied by 181/365 to reflect the most recent fiscal half year. |
20 Invesco Value Opportunities Fund
Tax Information
Form 1099-DIV, Form 1042-S and other year–end tax information provide shareholders with actual calendar year amounts that should be included in their tax returns. Shareholders should consult their tax advisers.
The following distribution information is being provided as required by the Internal Revenue Code or to meet a specific state’s requirement.
The Fund designates the following amounts or, if subsequently determined to be different, the maximum amount allowable for its fiscal year ended April 30, 2021:
| | | | | | |
| | | | | | |
Federal and State Income Tax | | | | |
Qualified Business Income* | | | 0.00 | % |
Qualified Dividend Income* | | | 100.00 | % |
Corporate Dividends Received Deduction* | | | 100.00 | % |
Business Interest Income* | | | 0.00 | % |
U.S. Treasury Obligations* | | | 0.00 | % |
| | |
* The above percentages are based on ordinary income dividends paid to shareholders during the Fund’s fiscal year. |
21 Invesco Value Opportunities Fund
Trustees and Officers
The address of each trustee and officer is AIM Sector Funds (Invesco Sector Funds) (the “Trust”), 11 Greenway Plaza, Suite 1000, Houston, Texas 77046-1173. The trustees serve for the life of the Trust, subject to their earlier death, incapacitation, resignation, retirement or removal as more specifically provided in the Trust’s organizational documents. Each officer serves for a one year term or until their successors are elected and qualified. Column two below includes length of time served with predecessor entities, if any.
| | | | | | | | | | |
Name, Year of Birth and Position(s) Held with the Trust | | Trustee and/ or Officer Since | | Principal Occupation(s) During Past 5 Years | | | | Number of
Funds in
Fund Complex
Overseen by
Trustee | | Other Directorship(s) Held by Trustee During Past 5 Years |
| Interested Trustee | | | | | | | | | | |
Martin L. Flanagan1 – 1960 Trustee and Vice Chair | | 2007 | | Executive Director, Chief Executive Officer and President, Invesco Ltd. (ultimate parent of Invesco and a global investment management firm); Trustee and Vice Chair, The Invesco Funds; Vice Chair, Investment Company Institute; and Member of Executive Board, SMU Cox School of Business Formerly: Advisor to the Board, Invesco Advisers, Inc. (formerly known as Invesco Institutional (N.A.), Inc.); Chairman and Chief Executive Officer, Invesco Advisers, Inc. (registered investment adviser); Director, Chairman, Chief Executive Officer and President, Invesco Holding Company (US), Inc. (formerly IVZ Inc.) (holding company), Invesco Group Services, Inc. (service provider) and Invesco North American Holdings, Inc. (holding company); Director, Chief Executive Officer and President, Invesco Holding Company Limited (parent of Invesco and a global investment management firm); Director, Invesco Ltd.; Chairman, Investment Company Institute and President, Co-Chief Executive Officer, Co-President, Chief Operating Officer and Chief Financial Officer, Franklin Resources, Inc. (global investment management organization) | | | | 184 | | None |
| 1 | Mr. Flanagan is considered an interested person (within the meaning of Section 2(a)(19) of the 1940 Act) of the Trust because he is an officer of the Adviser to the Trust, and an officer and a director of Invesco Ltd., ultimate parent of the Adviser. |
T-1 Invesco Value Opportunities Fund
Trustees and Officers–(continued)
| | | | | | | | |
Name, Year of Birth and Position(s) Held with the Trust | | Trustee and/or Officer
Since | | Principal Occupation(s) During Past 5 Years | | Number of
Funds
in Fund Complex Overseen by Trustee | | Other Directorship(s) Held by Trustee During Past 5 Years |
| Independent Trustees | | | | | | | | |
Christopher L. Wilson – 1957 Trustee and Chair | | 2017 | | Retired Formerly: Director, TD Asset Management USA Inc. (mutual fund complex) (22 portfolios); Managing Partner, CT2, LLC (investing and consulting firm); President/Chief Executive Officer, Columbia Funds, Bank of America Corporation; President/Chief Executive Officer, CDC IXIS Asset Management Services, Inc.; Principal & Director of Operations, Scudder Funds, Scudder, Stevens & Clark, Inc.; Assistant Vice President, Fidelity Investments | | 184 | | enaible, Inc. (artificial intelligence technology); Director, ISO New England, Inc. (non-profit organization managing regional electricity market) |
| Beth Ann Brown – 1968 Trustee | | 2019 | | Independent Consultant Formerly: Head of Intermediary Distribution, Managing Director, Strategic Relations, Managing Director, Head of National Accounts, Senior Vice President, National Account Manager and Senior Vice President, Key Account Manager, Columbia Management Investment Advisers LLC; Vice President, Key Account Manager, Liberty Funds Distributor, Inc.; and Trustee of certain Oppenheimer Funds | | 184 | | Director, Board of Directors of Caron Engineering Inc.; Advisor, Board of Advisors of Caron Engineering Inc.; President and Director, Acton Shapleigh Youth Conservation Corps (non - profit); and President and Director of Grahamtastic Connection (non- profit) |
| Jack M. Fields – 1952 Trustee | | 2003 | | Chief Executive Officer, Twenty First Century Group, Inc. (government affairs company); and Board Member, Impact(Ed) (non-profit) Formerly: Owner and Chief Executive Officer, Dos Angeles Ranch L.P. (cattle, hunting, corporate entertainment); Director, Insperity, Inc. (formerly known as Administaff) (human resources provider); Chief Executive Officer, Texana Timber LP (sustainable forestry company); Director of Cross Timbers Quail Research Ranch (non-profit); and member of the U.S. House of Representatives | | 184 | | Member, Board of Directors of Baylor College of Medicine |
| Cynthia Hostetler – 1962 Trustee | | 2017 | | Non-Executive Director and Trustee of a number of public and private business corporations Formerly: Director, Aberdeen Investment Funds (4 portfolios); Director, Artio Global Investment LLC (mutual fund complex); Director, Edgen Group, Inc. (specialized energy and infrastructure products distributor); Head of Investment Funds and Private Equity, Overseas Private Investment Corporation; President, First Manhattan Bancorporation, Inc.; Attorney, Simpson Thacher & Bartlett LLP | | 184 | | Resideo Technologies, Inc. (smart home technology); Vulcan Materials Company (construction materials company); Trilinc Global Impact Fund; Genesee & Wyoming, Inc. (railroads); Investment Company Institute (professional organization); Independent Directors Council (professional organization);Eisenhower Foundation (non-profit) |
Eli Jones – 1961 Trustee | | 2016 | | Professor and Dean, Mays Business School—Texas A&M University Formerly: Professor and Dean, Walton College of Business, University of Arkansas and E.J. Ourso College of Business, Louisiana State University; Director, Arvest Bank | | 184 | | Insperity, Inc. (formerly known as Administaff) (human resources provider) |
T-2 Invesco Value Opportunities Fund
Trustees and Officers–(continued)
| | | | | | | | |
Name, Year of Birth and Position(s) Held with the Trust | | Trustee and/or Officer
Since | | Principal Occupation(s) During Past 5 Years | | Number of
Funds
in Fund Complex Overseen by Trustee | | Other Directorship(s) Held by Trustee During Past 5 Years |
| Independent Trustees–(continued) |
Elizabeth Krentzman – 1959 Trustee | | 2019 | | Formerly: Principal and Chief Regulatory Advisor for Asset Management Services and U.S. Mutual Fund Leader of Deloitte & Touche LLP; General Counsel of the Investment Company Institute (trade association); National Director of the Investment Management Regulatory Consulting Practice, Principal, Director and Senior Manager of Deloitte & Touche LLP; Assistant Director of the Division of Investment Management—Office of Disclosure and Investment Adviser Regulation of the U.S. Securities and Exchange Commission and various positions with the Division of Investment Management – Office of Regulatory Policy of the U.S. Securities and Exchange Commission; Associate at Ropes & Gray LLP; and Trustee of certain Oppenheimer Funds | | 184 | | Trustee of the University of Florida National Board Foundation; Member of the Carita Funds Board of Directors (private investment funds); Member of the University of Florida Law Center Association, Inc. Board of Trustees and Audit Committee Member |
Anthony J. LaCava, Jr. – 1956 Trustee | | 2019 | | Formerly: Director and Member of the Audit Committee, Blue Hills Bank (publicly traded financial institution) and Managing Partner, KPMG LLP | | 184 | | Blue Hills Bank; Chairman, Bentley University; Member, Business School Advisory Council; and Nominating Committee KPMG LLP |
Prema Mathai-Davis – 1950 Trustee | | 2003 | | Retired Formerly: Co-Founder & Partner of Quantalytics Research, LLC, (a FinTech Investment Research Platform for the Self-Directed Investor); Trustee of YWCA Retirement Fund; CEO of YWCA of the USA; Board member of the NY Metropolitan Transportation Authority; Commissioner of the NYC Department of Aging; Board member of Johns Hopkins Bioethics Institute | | 184 | | None |
Joel W. Motley – 1952 Trustee | | 2019 | | Director of Office of Finance, Federal Home Loan Bank System; Managing Director of Carmona Motley Inc. (privately held financial advisor); Member of the Council on Foreign Relations and its Finance and Budget Committee; Chairman Emeritus of Board of Human Rights Watch and Member of its Investment Committee; and Member of Investment Committee and Board of Historic Hudson Valley (non-profit cultural organization) Formerly: Managing Director of Public Capital Advisors, LLC (privately held financial advisor); Managing Director of Carmona Motley Hoffman, Inc. (privately held financial advisor); Trustee of certain Oppenheimer Funds; Director of Columbia Equity Financial Corp. (privately held financial advisor); and Member of the Vestry of Trinity Church Wall Street | | 184 | | Member of Board of Greenwall Foundation (bioethics research foundation) and its Investment Committee; Member of Board of Friends of the LRC (non-profit legal advocacy); Board Member and Investment Committee Member of Pulitzer Center for Crisis Reporting (non-profit journalism) |
Teresa M. Ressel – 1962 Trustee | | 2017 | | Non-executive director and trustee of a number of public and private business corporations Formerly: Chief Executive Officer, UBS Securities LLC (investment banking); Chief Operating Officer, UBS AG Americas (investment banking); Sr. Management Team Olayan America, The Olayan Group (international investor/commercial/industrial); Assistant Secretary for Management & Budget and Designated Chief Financial Officer, U.S. Department of Treasury; Director, Atlantic Power Corporation (power generation company) and ON Semiconductor Corporation (semiconductor manufacturing) | | 184 | | Elucida Oncology (nanotechnology & medical particles company) |
T-3 Invesco Value Opportunities Fund
Trustees and Officers–(continued)
| | | | | | | | |
Name, Year of Birth and Position(s) Held with the Trust | | Trustee and/or Officer Since | | Principal Occupation(s) During Past 5 Years | | Number of Funds
in Fund Complex Overseen by Trustee | | Other Directorship(s) Held by Trustee During Past 5 Years |
| Independent Trustees–(continued) | | | | | | |
Ann Barnett Stern – 1957
Trustee | | 2017 | | President, Chief Executive Officer and Board Member, Houston Endowment, Inc. a private philanthropic institution Formerly: Executive Vice President, Texas Children’s Hospital; Vice President, General Counsel and Corporate Compliance Officer, Texas Children’s Hospital; Attorney at Beck, Redden and Secrest, LLP and Andrews and Kurth LLP | | 184 | | Director and Audit Committee member of Federal Reserve Bank of Dallas; Trustee and Board Chair of Good Reason Houston (nonprofit); Trustee, Vice Chair, Chair of Nomination/Governance Committee, Chair of Personnel Committee of Holdsworth Center (nonprofit); Trustee and Investment Committee member of University of Texas Law School Foundation (nonprofit); Board Member of Greater Houston Partnership |
Robert C. Troccoli – 1949
Trustee | | 2016 | | Retired Formerly: Adjunct Professor, University of Denver – Daniels College of Business; and Managing Partner, KPMG LLP | | 184 | | None |
Daniel S. Vandivort – 1954
Trustee | | 2019 | | Trustee, Board of Trustees, Huntington Disease Foundation of America; and President, Flyway Advisory Services LLC (consulting and property management) Formerly: Trustee and Governance Chair, of certain Oppenheimer Funds; and Treasurer, Chairman of the Audit and Finance Committee, Huntington Disease Foundation of America | | 184 | | None |
James D. Vaughn – 1945
Trustee | | 2019 | | Retired Formerly: Managing Partner, Deloitte & Touche LLP; Trustee and Chairman of the Audit Committee, Schroder Funds; Board Member, Mile High United Way, Boys and Girls Clubs, Boy Scouts, Colorado Business Committee for the Arts, Economic Club of Colorado and Metro Denver Network (economic development corporation); and Trustee of certain Oppenheimer Funds | | 184 | | Board member and Chairman of Audit Committee of AMG National Trust Bank; Trustee and Investment Committee member, University of South Dakota Foundation; Board member, Audit Committee Member and past Board Chair, Junior Achievement (non-profit) |
T-4 Invesco Value Opportunities Fund
Trustees and Officers–(continued)
| | | | | | | | |
Name, Year of Birth and
Position(s) Held with the Trust | | Trustee and/or Officer
Since | | Principal Occupation(s) During Past 5 Years | | Number of
Funds in Fund Complex
Overseen by
Trustee | | Other Directorship(s) Held by Trustee During Past 5 Years |
| Officers | | | | | | | | |
| Sheri Morris – 1964 President and Principal Executive Officer | | 2003 | | Head of Global Fund Services, Invesco Ltd.; President and Principal Executive Officer, The Invesco Funds; Senior Vice President, Invesco Advisers, Inc. (formerly known as Invesco Institutional (N.A.), Inc.) (registered investment adviser); and Vice President, Invesco Exchange-Traded Fund Trust, Invesco Exchange-Traded Fund Trust II, Invesco India Exchange-Traded Fund Trust, Invesco Actively Managed Exchange-Traded Fund Trust, Invesco Actively Managed Exchange-Traded Commodity Fund Trust and Invesco Exchange-Traded Self-Indexed Fund Trust; and Vice President, OppenheimerFunds, Inc. Formerly: Vice President, Treasurer and Principal Financial Officer, The Invesco Funds; Vice President, Invesco AIM Advisers, Inc., Invesco AIM Capital Management, Inc. and Invesco AIM Private Asset Management, Inc.; Assistant Vice President and Assistant Treasurer, The Invesco Funds; Vice President and Assistant Vice President, Invesco Advisers, Inc.; Assistant Vice President, Invesco AIM Capital Management, Inc. and Invesco AIM Private Asset Management, Inc.; and Treasurer, Invesco Exchange-Traded Fund Trust, Invesco Exchange-Traded Fund Trust II, Invesco India Exchange-Traded Fund Trust and Invesco Actively Managed Exchange-Traded Fund Trust | | N/A | | N/A |
| Russell C. Burk – 1958 Senior Vice President and Senior Officer | | 2005 | | Senior Vice President and Senior Officer, The Invesco Funds | | N/A | | N/A |
| Jeffrey H. Kupor – 1968 Senior Vice President, Chief Legal Officer and Secretary | | 2018 | | Head of Legal of the Americas, Invesco Ltd.; Senior Vice President and Secretary, Invesco Advisers, Inc. (formerly known as Invesco Institutional (N.A.), Inc.) (registered investment adviser); Senior Vice President and Secretary, Invesco Distributors, Inc. (formerly known as Invesco AIM Distributors, Inc.); Vice President and Secretary, Invesco Investment Services, Inc. (formerly known as Invesco AIM Investment Services, Inc.) Senior Vice President, Chief Legal Officer and Secretary, The Invesco Funds; Secretary and General Counsel, Invesco Investment Advisers LLC (formerly known as Van Kampen Asset Management); Secretary and General Counsel, Invesco Capital Markets, Inc. (formerly known as Van Kampen Funds Inc.) and Chief Legal Officer, Invesco Exchange-Traded Fund Trust, Invesco Exchange-Traded Fund Trust II, Invesco India Exchange-Traded Fund Trust, Invesco Actively Managed Exchange-Traded Fund Trust, Invesco Actively Managed Exchange-Traded Commodity Fund Trust and Invesco Exchange-Traded Self-Indexed Fund Trust; Secretary, Invesco Indexing LLC; Secretary, W.L. Ross & Co., LLC ; Secretary and Vice President, Harbourview Asset Management Corporation; Secretary and Vice President, OppenheimerFunds, Inc. and Invesco Managed Accounts, LLC; Secretary and Senior Vice President, OFI Global Institutional, Inc.; Secretary and Vice President, OFI SteelPath, Inc.; Secretary and Vice President, Oppenheimer Acquisition Corp.; Secretary and Vice President, Shareholder Services, Inc.; Secretary and Vice President, Trinity Investment Management Corporation Formerly: Secretary and Vice President, Jemstep, Inc.; Head of Legal, Worldwide Institutional, Invesco Ltd.; Secretary and General Counsel, INVESCO Private Capital Investments, Inc.; Senior Vice President, Secretary and General Counsel, Invesco Management Group, Inc. (formerly known as Invesco AIM Management Group, Inc.); Assistant Secretary, INVESCO Asset Management (Bermuda) Ltd.; Secretary and General Counsel, Invesco Private Capital, Inc.; Assistant Secretary and General Counsel, INVESCO Realty, Inc.; Secretary and General Counsel, Invesco Senior Secured Management, Inc.; and Secretary, Sovereign G./P. Holdings Inc. | | N/A | | N/A |
T-5 Invesco Value Opportunities Fund
Trustees and Officers–(continued)
| | | | | | | | |
Name, Year of Birth and
Position(s) Held with the Trust | | Trustee and/or
Officer
Since | | Principal Occupation(s) During Past 5 Years | | Number of
Funds in Fund Complex
Overseen by
Trustee | | Other Directorship(s) Held by Trustee During Past 5 Years |
| Officers–(continued) | | | | | | |
| Andrew R. Schlossberg – 1974 Senior Vice President | | 2019 | | Head of the Americas and Senior Managing Director, Invesco Ltd.; Director and Senior Vice President, Invesco Advisers, Inc. (formerly known as Invesco Institutional (N.A.), Inc.) (registered investment adviser); Director and Chairman, Invesco Investment Services, Inc. (formerly known as Invesco AIM Investment Services, Inc.) (registered transfer agent); Senior Vice President, The Invesco Funds; Director, Invesco Investment Advisers LLC (formerly known as Van Kampen Asset Management); Director, President and Chairman, Invesco Insurance Agency, Inc. Formerly: Director, President and Chairman, Invesco Insurance Agency, Inc.; Director, Invesco UK Limited; Director and Chief Executive, Invesco Asset Management Limited and Invesco Fund Managers Limited; Assistant Vice President, The Invesco Funds; Senior Vice President, Invesco Advisers, Inc. (formerly known as Invesco Institutional (N.A.), Inc.) (registered investment adviser); Director and Chief Executive, Invesco Administration Services Limited and Invesco Global Investment Funds Limited; Director, Invesco Distributors, Inc.; Head of EMEA, Invesco Ltd.; President, Invesco Actively Managed Exchange-Traded Commodity Fund Trust, Invesco Actively Managed Exchange-Traded Fund Trust, Invesco Exchange-Traded Fund Trust, Invesco Exchange-Traded Fund Trust II and Invesco India Exchange-Traded Fund Trust; Managing Director and Principal Executive Officer, Invesco Capital Management LLC | | N/A | | N/A |
John M. Zerr – 1962 Senior Vice President | | 2006 | | Chief Operating Officer of the Americas; Senior Vice President, Invesco Advisers, Inc. (formerly known as Invesco Institutional (N.A.), Inc.) (registered investment adviser); Senior Vice President, Invesco Distributors, Inc. (formerly known as Invesco AIM Distributors, Inc.); Director and Vice President, Invesco Investment Services, Inc. (formerly known as Invesco AIM Investment Services, Inc.) Senior Vice President, The Invesco Funds; Managing Director, Invesco Capital Management LLC; Director, Invesco Investment Advisers LLC (formerly known as Van Kampen Asset Management); Senior Vice President, Invesco Capital Markets, Inc. (formerly known as Van Kampen Funds Inc.); Manager, Invesco Indexing LLC; Manager, Invesco Specialized Products, LLC; Member, Invesco Canada Funds Advisory Board; Director, President and Chief Executive Officer, Invesco Corporate Class Inc. (corporate mutual fund company); and Director, Chairman, President and Chief Executive Officer, Invesco Canada Ltd. (formerly known as Invesco Trimark Ltd./Invesco Trimark Ltèe) (registered investment adviser and registered transfer agent); President, Invesco, Inc.; President, Invesco Global Direct Real Estate Feeder GP Ltd.; President, Invesco IP Holdings(Canada) Ltd; President, Invesco Global Direct Real Estate GP Ltd.; President, Invesco Financial Services Ltd. / Services Financiers Invesco Ltée; President, Trimark Investments Ltd./Placements Trimark Ltée and Director and Chairman, Invesco Trust Company Formerly: Director and Senior Vice President, Invesco Insurance Agency, Inc.; Director and Senior Vice President, Invesco Management Group, Inc. (formerly known as Invesco AIM Management Group, Inc.); Secretary and General Counsel, Invesco Management Group, Inc. (formerly known as Invesco AIM Management Group, Inc.); Secretary, Invesco Investment Services, Inc. (formerly known as Invesco AIM Investment Services, Inc.); Chief Legal Officer and Secretary, The Invesco Funds; Secretary and General Counsel, Invesco Investment Advisers LLC (formerly known as Van Kampen Asset Management); Secretary and General Counsel, Invesco Capital Markets, Inc. (formerly known as Van Kampen Funds Inc.); Chief Legal Officer, Invesco Exchange-Traded Fund Trust, Invesco Exchange-Traded Fund Trust II, Invesco India Exchange-Traded Fund Trust, Invesco Actively Managed Exchange-Traded Fund Trust, Invesco Actively Managed Exchange-Traded Commodity Fund Trust and Invesco Exchange-Traded Self-Indexed Fund Trust; Secretary, Invesco Indexing LLC; Director, Secretary, General Counsel and Senior Vice President, Van Kampen Exchange Corp.; Director, Vice President and Secretary, IVZ Distributors, Inc. (formerly known as INVESCO Distributors, Inc.); Director and Vice President, INVESCO Funds Group, Inc.; Director and Vice President, Van Kampen Advisors Inc.; Director, Vice President, Secretary and General Counsel, Van Kampen Investor Services Inc.; Director and Secretary, Invesco Distributors, Inc. (formerly known as Invesco AIM Distributors, Inc.); Director, Senior Vice President, General Counsel and Secretary, Invesco AIM Advisers, Inc. and Van Kampen Investments Inc.; Director, Vice President and Secretary, Fund Management Company; Director, Senior Vice President, Secretary, General Counsel and Vice President, Invesco AIM Capital Management, Inc.; Chief Operating Officer and General Counsel, Liberty Ridge Capital, Inc. (an investment adviser) | | N/A | | N/A |
T-6 Invesco Value Opportunities Fund
Trustees and Officers–(continued)
| | | | | | | | |
Name, Year of Birth and
Position(s) Held with the Trust | | Trustee and/or
Officer
Since | | Principal Occupation(s) During Past 5 Years | | Number of
Funds in Fund Complex
Overseen by
Trustee | | Other Directorship(s) Held by Trustee During Past 5 Years |
| Officers–(continued) | | | | | | |
Gregory G. McGreevey – 1962 Senior Vice President | | 2012 | | Senior Managing Director, Invesco Ltd.; Director, Chairman, President, and Chief Executive Officer, Invesco Advisers, Inc. (formerly known as Invesco Institutional (N.A.), Inc.) (registered investment adviser); Director, Invesco Mortgage Capital, Inc. and Invesco Senior Secured Management, Inc.; and Senior Vice President, The Invesco Funds; and President, SNW Asset Management Corporation and Invesco Managed Accounts, LLC; Chairman and Director, Invesco Private Capital, Inc.; Chairman and Director, INVESCO Private Capital Investments, Inc.; Chairman and Director, INVESCO Realty, Inc. Chairman and Director, INVESCO Realty, Inc.; and Senior Vice President, Invesco Group Services, Inc. Formerly: Senior Vice President, Invesco Management Group, Inc. and Invesco Advisers, Inc.; Assistant Vice President, The Invesco Funds | | N/A | | N/A |
| Adrien Deberghes – 1967 Principal Financial Officer, Treasurer and Vice President | | 2020 | | Head of the Fund Office of the CFO and Fund Administration; Vice President, Invesco Advisers, Inc.; Principal Financial Officer, Treasurer and Vice President, The Invesco Funds; Vice President, Invesco Exchange-Traded Fund Trust, Invesco Exchange-Traded Fund Trust II, Invesco India Exchange-Traded Fund Trust, Invesco Actively Managed Exchange-Traded Fund Trust, Invesco Actively Managed Exchange-Traded Commodity Fund Trust and Invesco Exchange-Traded Self-Indexed Fund Trust Formerly: Senior Vice President and Treasurer, Fidelity Investments | | N/A | | N/A |
| Crissie M. Wisdom – 1969 Anti-Money Laundering Compliance Officer | | 2013 | | Anti-Money Laundering and OFAC Compliance Officer for Invesco U.S. entities including: Invesco Advisers, Inc. and its affiliates, Invesco Capital Markets, Inc., Invesco Distributors, Inc., Invesco Investment Services, Inc., The Invesco Funds, Invesco Capital Management, LLC, Invesco Trust Company; and Fraud Prevention Manager for Invesco Investment Services, Inc. | | N/A | | N/A |
Todd F. Kuehl – 1969 Chief Compliance Officer and Senior Vice President | | 2020 | | Chief Compliance Officer, Invesco Advisers, Inc. (registered investment adviser); and Chief Compliance Officer, The Invesco Funds and Senior Vice President Formerly: Managing Director and Chief Compliance Officer, Legg Mason (Mutual Funds); Chief Compliance Officer, Legg Mason Private Portfolio Group (registered investment adviser) | | N/A | | N/A |
Michael McMaster – 1962 Chief Tax Officer, Vice President and Assistant Treasurer | | 2020 | | Head of Global Fund Services Tax; Chief Tax Officer, Vice President and Assistant Treasurer, The Invesco Funds; Vice President, Invesco Advisers, Inc.; Assistant Treasurer, Invesco Capital Management LLC, Assistant Treasurer and Chief Tax Officer, Invesco Exchange-Traded Fund Trust, Invesco Exchange-Traded Fund Trust II, Invesco India Exchange-Traded Fund Trust, Invesco Actively Managed Exchange-Traded Fund Trust, Invesco Actively Managed Exchange-Traded Commodity Fund Trust and Invesco Exchange-Traded Self-Indexed Fund Trust; Assistant Treasurer, Invesco Specialized Products, LLC Formerly: Senior Vice President – Managing Director of Tax Services, U.S. Bank Global Fund Services (GFS) | | N/A | | N/A |
The Statement of Additional Information of the Trust includes additional information about the Fund’s Trustees and is available upon request, without charge, by calling 1.800.959.4246. Please refer to the Fund’s Statement of Additional Information for information on the Fund’s sub-advisers.
| | | | | | |
| Office of the Fund | | Investment Adviser | | Distributor | | Auditors |
11 Greenway Plaza, Suite 1000 Houston, TX 77046-1173 | | Invesco Advisers, Inc. 1555 Peachtree Street, N.E. Atlanta, GA 30309 | | Invesco Distributors, Inc. 11 Greenway Plaza, Suite 1000 Houston, TX 77046-1173 | | PricewaterhouseCoopers LLP 1000 Louisiana Street, Suite 5800 Houston, TX 77002-5678 |
| | | |
| Counsel to the Fund | | Counsel to the Independent Trustees | | Transfer Agent | | Custodian |
Stradley Ronon Stevens & Young, LLP 2005 Market Street, Suite 2600 Philadelphia, PA 19103-7018 | | Goodwin Procter LLP 901 New York Avenue, N.W. Washington, D.C. 20001 | | Invesco Investment Services, Inc. 11 Greenway Plaza, Suite 1000 Houston, TX 77046-1173 | | State Street Bank and Trust Company 225 Franklin Street Boston, MA 02110-2801 |
T-7 Invesco Value Opportunities Fund
(This page intentionally left blank)
(This page intentionally left blank)
(This page intentionally left blank)

Go paperless with eDelivery
Visit invesco.com/edelivery to enjoy the convenience and security of anytime electronic access to your investment documents.
With eDelivery, you can elect to have any or all of the following materials delivered straight to your inbox to download, save and print from your own computer:
| ∎ | | Fund reports and prospectuses |
Invesco mailing information
Send general correspondence to Invesco Investment Services, Inc., P.O. Box 219078, Kansas City, MO 64121-9078.
Important notice regarding delivery of security holder documents
To reduce Fund expenses, only one copy of most shareholder documents may be mailed to shareholders with multiple accounts at the same address (Householding). Mailing of your shareholder documents may be householded indefinitely unless you instruct us otherwise. If you do not want the mailing of these documents to be combined with those for other members of your household, please contact Invesco Investment Services, Inc. at 800 959 4246 or contact your financial institution. We will begin sending you individual copies for each account within 30 days after receiving your request.
Fund holdings and proxy voting information
The Fund provides a complete list of its portfolio holdings four times each fiscal year, at the end of each fiscal quarter. For the second and fourth quarters, the list appears, respectively, in the Fund’s semiannual and annual reports to shareholders. For the first and third quarters, the Fund files the list with the Securities and Exchange Commission (SEC) as an exhibit to its reports on Form N-PORT. The most recent list of portfolio holdings is available at invesco.com/completeqtrholdings. Shareholders can also look up the Fund’s Form N-PORT filings on the SEC website, sec.gov. The SEC file numbers for the Fund are shown below.
A description of the policies and procedures that the Fund uses to determine how to vote proxies relating to portfolio securities is available without charge, upon request, from our Client Services department at 800 959 4246, or at invesco.com/ corporate/about-us/esg. The information is also available on the SEC website, sec.gov.
| | |
Information regarding how the Fund voted proxies related to its portfolio securities during the most recent 12-month period ended June 30 is available at invesco.com/proxysearch. This information is also available on the SEC website, sec.gov. | |
|
Invesco Advisers, Inc. is an investment adviser; it provides investment advisory services to individual and institutional clients and does not sell securities. Invesco Distributors, Inc. is the US distributor for Invesco Ltd.’s retail mutual funds, exchange-traded funds and institutional money market funds. Both are wholly owned, indirect subsidiaries of Invesco Ltd. |
| | | | |
| SEC file numbers: 811-03826 and 002-85905 | | Invesco Distributors, Inc. | | VK-VOPP-AR-1 |
There were no amendments to the Code of Ethics (the “Code”) that applies to the Registrant’s Principal Executive Officer (“PEO”) and Principal Financial Officer (“PFO”) during the period covered by the report. The Registrant did not grant any waivers, including implicit waivers, from any provisions of the Code to the PEO or PFO during the period covered by this report.
| ITEM 3. | AUDIT COMMITTEE FINANCIAL EXPERT. |
The Board of Trustees has determined that the Registrant has at least one audit committee financial expert serving on its Audit Committee. The Audit Committee financial experts are Cynthia Hostetler, Anthony J. LaCava, Jr., Dr. Eli Jones, Ann Barnett Stern, Robert C. Troccoli, James Vaughn and Christopher L. Wilson. Cynthia Hostetler, Anthony J. LaCava, Jr., Dr. Eli Jones, Ann Barnett Stern, Robert C. Troccoli, James Vaughn and Christopher L. Wilson are “independent” within the meaning of that term as used in Form N-CSR.
| ITEM 4. | PRINCIPAL ACCOUNTANT FEES AND SERVICES. |
Pursuant to PCAOB Rule 3526, PricewaterhouseCoopers LLC (“PwC”) advised the Registrant’s Audit Committee of the following matters identified between May 1, 2020 to June 24, 2021 that may be reasonably thought to bear on PwC’s independence. PwC advised the Audit Committee that one PwC Manager and one PwC Associate each held financial interests either directly or, in the case of the PwC Manager, indirectly through their spouse’s brokerage account, in investment companies within the Invesco Fund Complex that were inconsistent with the requirements of Rule 2-01(c)(1) of Regulation S-X. In reporting the matters to the Audit Committee, PwC noted, among other things, that the impermissible holdings were disposed of by the individuals, the individuals were not in the chain of command of the audit or the audit partners of the Funds, the individuals either did not provide any audit services (or in the case of the PwC Associate, the individual did not have decision-making responsibility for matters that materially affected the audit and their audit work was reviewed by team members at least two levels higher than the individual), or did not provide services of any kind to the Registrant or its affiliates, and the financial interests were not material to the net worth of each individual or their respective immediate family members and senior leadership of the Funds’ audit engagement team was unaware of the impermissible holdings until after the matters were confirmed to be independence exceptions or individuals ceased providing services. Based on the mitigating factors noted above, PwC advised the Audit Committee that it concluded that its objectivity and impartiality with respect to all issues encompassed within the audit engagement has not been impaired and it believes that a reasonable investor with knowledge of all relevant facts and circumstances for the violations would conclude PwC is capable of exercising objective and impartial judgment on all issues encompassed within the audits of the financial statements of the Funds in the Registrant for the impacted periods.
(a) to (d)
Fees Billed by PwC Related to the Registrant
PwC billed the Registrant aggregate fees for services rendered to the Registrant for the last two fiscal years as shown in the following table. The Audit Committee pre-approved all audit and non-audit services provided to the Registrant.
| | | | | | | | |
| | | Fees Billed for
Services Rendered to
the Registrant for
fiscal year end 2021 | | | Fees Billed for
Services Rendered to
the Registrant for
fiscal year end 2020 | |
Audit Fees | | $ | 300,950 | | | $ | 323,392 | |
Audit-Related Fees(1) | | $ | 13,872 | | | $ | 56,900 | |
Tax Fees(2) | | $ | 218,860 | | | $ | 174,663 | |
All Other Fees | | $ | 0 | | | $ | 0 | |
| | | | | | | | |
Total Fees | | $ | 533,682 | | | $ | 554,955 | |
| | (1) | Audit-Related Fees for the fiscal years ended April 30, 2021 and April 30, 2020 includes fees billed for reviewing regulatory filings. |
| | (2) | Tax Fees for the fiscal years ended April 30, 2021 and April 30, 2020 includes fees billed for preparation of U.S. Tax Returns and Taxable Income calculations, including excise tax and year-to-date estimates for various book-to-tax differences. |
Fees Billed by PwC Related to Invesco and Invesco Affiliates
PwC billed Invesco Advisers, Inc. (“Invesco”), the Registrant’s adviser, and any entity controlling, controlled by or under common control with Invesco that provides ongoing services to the Registrant (“Invesco Affiliates”) aggregate fees for pre-approved non-audit services rendered to Invesco and Invesco Affiliates for the last two fiscal years as shown in the following table. The Audit Committee pre-approved all non-audit services provided to Invesco and Invesco Affiliates that were required to be pre-approved.
| | | | | | | | |
| | | Fees Billed for
Non-Audit Services
Rendered to Invesco
and Invesco Affiliates
for fiscal year end
2021 That Were
Required
to be Pre-Approved
by the Registrant’s
Audit Committee | | | Fees Billed for
Non-Audit Services
Rendered to Invesco
and Invesco
Affiliates for fiscal year
end 2020 That Were
Required
to be Pre-Approved
by the Registrant’s
Audit Committee | |
Audit-Related Fees(1) | | $ | 793,000 | | | $ | 701,000 | |
Tax Fees | | $ | 0 | | | $ | 0 | |
All Other Fees | | $ | 0 | | | $ | 0 | |
| | | | | | | | |
Total Fees | | $ | 793,000 | | | $ | 701,000 | |
| (1) | Audit-Related Fees for the fiscal years ended 2021 and 2020 include fees billed related to reviewing controls at a service organization. |
(e)(1)
PRE-APPROVAL OF AUDIT AND NON-AUDIT SERVICES
POLICIES AND PROCEDURES
As adopted by the Audit Committees
of the Invesco Funds (the “Funds”)
Last Amended March 29, 2017
| | I. | Statement of Principles |
The Audit Committees (the “Audit Committee”) of the Boards of Trustees of the Funds (the “Board”) have adopted these policies and procedures (the “Procedures”) with respect to the pre-approval of audit and non-audit services to be provided by the Funds’ independent auditor (the “Auditor”) to the Funds, and to the Funds’ investment adviser(s) and any entity controlling, controlled by, or under common control with the investment adviser(s) that provides ongoing services to the Funds (collectively, “Service Affiliates”).
Under Section 202 of the Sarbanes-Oxley Act of 2002, all audit and non-audit services provided to the Funds by the Auditor must be preapproved by the Audit Committee. Rule 2-01 of Regulation S-X requires that the Audit Committee also pre-approve a Service Affiliate’s engagement of the Auditor for non-audit services if the engagement relates directly to the operations and financial reporting of the Funds (a “Service Affiliate’s Covered Engagement”).
These Procedures set forth the procedures and the conditions pursuant to which the Audit Committee may pre-approve audit and non-audit services for the Funds and a Service Affiliate’s Covered Engagement pursuant to rules and regulations of the Securities and Exchange Commission (“SEC”) and other organizations and regulatory bodies applicable to the Funds (“Applicable Rules”).1 They address both general pre-approvals without consideration of specific case-by-case services (“general pre-approvals”) and pre-approvals on a case-by-case basis (“specific pre-approvals”). Any services requiring pre-approval that are not within the scope of general pre-approvals hereunder are subject to specific pre-approval. These Procedures also address the delegation by the Audit Committee of pre-approval authority to the Audit Committee Chair or Vice Chair.
| | II. | Pre-Approval of Fund Audit Services |
The annual Fund audit services engagement, including terms and fees, is subject to specific pre-approval by the Audit Committee. Audit services include the annual financial statement audit and other procedures required to be performed by an independent auditor to be able to form an opinion on the Funds’ financial statements. The Audit Committee will receive, review and consider sufficient information concerning a proposed Fund audit engagement to make a reasonable evaluation of the Auditor’s qualifications and independence. The Audit Committee will oversee the Fund audit services engagement as necessary, including approving any changes in terms, audit scope, conditions and fees.
In addition to approving the Fund audit services engagement at least annually and specifically approving any changes, the Audit Committee may generally or specifically pre-approve engagements for other audit services, which are those services that only an independent auditor reasonably can provide. Other audit services may include services associated with SEC registration statements, periodic reports and other documents filed with the SEC.
| 1 | Applicable Rules include, for example, New York Stock Exchange (“NYSE”) rules applicable to closed-end funds managed by Invesco and listed on NYSE. |
| | III. | General and Specific Pre-Approval of Non-Audit Fund Services |
The Audit Committee will consider, at least annually, the list of General Pre-Approved Non-Audit Services which list may be terminated or modified at any time by the Audit Committee. To inform the Audit Committee’s review and approval of General Pre-Approved Non-Audit Services, the Funds’ Treasurer (or his or her designee) and Auditor shall provide such information regarding independence or other matters as the Audit Committee may request.
Any services or fee ranges that are not within the scope of General Pre-Approved Non-Audit Services have not received general pre-approval and require specific pre-approval. Each request for specific pre-approval by the Audit Committee for services to be provided by the Auditor to the Funds must be submitted to the Audit Committee by the Funds’ Treasurer (or his or her designee) and must include detailed information about the services to be provided, the fees or fee ranges to be charged, and other relevant information sufficient to allow the Audit Committee to consider whether to pre-approve such engagement, including evaluating whether the provision of such services will impair the independence of the Auditor and is otherwise consistent with Applicable Rules.
| | IV. | Non-Audit Service Types |
The Audit Committee may provide either general or specific pre-approval of audit-related, tax or other services, each as described in more detail below.
“Audit-related services” are assurance and related services that are reasonably related to the performance of the audit or review of the Fund’s financial statements or that are traditionally performed by an independent auditor. Audit-related services include, among others, accounting consultations related to accounting, financial reporting or disclosure matters not classified as “Audit services”; assistance with understanding and implementing new accounting and financial reporting guidance from rulemaking authorities; services related to mergers, acquisitions or dispositions; compliance with ratings agency requirements and interfund lending activities; and assistance with internal control reporting requirements.
“Tax services” include, but are not limited to, the review and signing of the Funds’ federal tax returns, the review of required distributions by the Funds and consultations regarding tax matters such as the tax treatment of new investments or the impact of new regulations. The Audit Committee will not approve proposed services of the Auditor which the Audit Committee believes are to be provided in connection with a service or transaction initially recommended by the Auditor, the sole business purpose of which may be tax avoidance and the tax treatment of which may not be supported in the Internal Revenue Code and related regulations. The Audit Committee will consult with the Funds’ Treasurer (or his or her designee) and may consult with outside counsel or advisers as necessary to ensure the consistency of tax services rendered by the Auditor with the foregoing policy. The Auditor shall not represent any Fund or any Service Affiliate before a tax court, district court or federal court of claims.
Each request to provide tax services under either the general or specific pre-approval of the Audit Committee will include a description from the Auditor in writing of (i) the scope of the service, the fee structure for the engagement, and any side letter or other amendment to the engagement letter, or any other agreement (whether oral, written, or otherwise) between the Auditor and the Funds, relating to the service; and (ii) any compensation arrangement or other agreement, such as a referral agreement, a referral fee or fee-sharing arrangement, between the Auditor (or an affiliate of the Auditor) and any person (other than the
Funds or Service Affiliates receiving the services) with respect to the promoting, marketing, or recommending of a transaction covered by the service. The Auditor will also discuss with the Audit Committee the potential effects of the services on the independence of the Auditor, and document the substance of its discussion with the Audit Committee.
The Audit Committee may pre-approve other non-audit services so long as the Audit Committee believes that the service will not impair the independence of the Auditor. Appendix I includes a list of services that the Auditor is prohibited from performing by the SEC rules. Appendix I also includes a list of services that would impair the Auditor’s independence unless the Audit Committee reasonably concludes that the results of the services will not be subject to audit procedures during an audit of the Funds’ financial statements.
| | V. | Pre-Approval of Service Affiliate’s Covered Engagements |
Rule 2-01 of Regulation S-X requires that the Audit Committee pre-approve a Service Affiliate’s engagement of the Auditor for non-audit services if the engagement relates directly to the operations and financial reporting of the Funds, defined above as a “Service Affiliate’s Covered Engagement”.
The Audit Committee may provide either general or specific pre-approval of any Service Affiliate’s Covered Engagement, including for audit-related, tax or other services, as described above, if the Audit Committee believes that the provision of the services to a Service Affiliate will not impair the independence of the Auditor with respect to the Funds. Any Service Affiliate’s Covered Engagements that are not within the scope of General Pre-Approved Non-Audit Services have not received general pre-approval and require specific pre-approval.
Each request for specific pre-approval by the Audit Committee of a Service Affiliate’s Covered Engagement must be submitted to the Audit Committee by the Funds’ Treasurer (or his or her designee) and must include detailed information about the services to be provided, the fees or fee ranges to be charged, a description of the current status of the pre-approval process involving other audit committees in the Invesco investment company complex (as defined in Rule 2-201 of Regulation S-X) with respect to the proposed engagement, and other relevant information sufficient to allow the Audit Committee to consider whether the provision of such services will impair the independence of the Auditor from the Funds. Additionally, the Funds’ Treasurer (or his or her designee) and the Auditor will provide the Audit Committee with a statement that the proposed engagement requires pre-approval by the Audit Committee, the proposed engagement, in their view, will not impair the independence of the Auditor and is consistent with Applicable Rules, and the description of the proposed engagement provided to the Audit Committee is consistent with that presented to or approved by the Invesco audit committee.
Information about all Service Affiliate engagements of the Auditor for non-audit services, whether or not subject to pre-approval by the Audit Committee, shall be provided to the Audit Committee at least quarterly, to allow the Audit Committee to consider whether the provision of such services is compatible with maintaining the Auditor’s independence from the Funds. The Funds’ Treasurer and Auditor shall provide the Audit Committee with sufficiently detailed information about the scope of services provided and the fees for such services, to ensure that the Audit Committee can adequately consider whether the provision of such services is compatible with maintaining the Auditor’s independence from the Funds.
| | VI. | Pre-Approved Fee Levels or Established Amounts |
Pre-approved fee levels or ranges for audit and non-audit services to be provided by the Auditor to the Funds, and for a Service Affiliate’s Covered Engagement, under general pre-approval or specific pre-
approval will be set periodically by the Audit Committee. Any proposed fees exceeding 110% of the maximum pre-approved fee levels or ranges for such services or engagements will be promptly presented to the Audit Committee and will require specific pre-approval by the Audit Committee before payment of any additional fees is made.
The Audit Committee hereby delegates, subject to the dollar limitations set forth below, specific authority to its Chair, or in his or her absence, Vice Chair, to pre-approve audit and non-audit services proposed to be provided by the Auditor to the Funds and/or a Service Affiliate’s Covered Engagement, between Audit Committee meetings. Such delegation does not preclude the Chair or Vice Chair from declining, on a case by case basis, to exercise his or her delegated authority and instead convening the Audit Committee to consider and pre-approve any proposed services or engagements.
Notwithstanding the foregoing, the Audit Committee must pre-approve: (a) any non-audit services to be provided to the Funds for which the fees are estimated to exceed $500,000; (b) any Service Affiliate’s Covered Engagement for which the fees are estimated to exceed $500,000; or (c) any cost increase to any previously approved service or engagement that exceeds the greater of $250,000 or 50% of the previously approved fees up to a maximum increase of $500,000.
| | VIII. | Compliance with Procedures |
Notwithstanding anything herein to the contrary, failure to pre-approve any services or engagements that are not required to be pre-approved pursuant to the de minimis exception provided for in Rule 2-01(c)(7)(i)(C) of Regulation S-X shall not constitute a violation of these Procedures. The Audit Committee has designated the Funds’ Treasurer to ensure services and engagements are pre-approved in compliance with these Procedures. The Funds’ Treasurer will immediately report to the Chair of the Audit Committee, or the Vice Chair in his or her absence, any breach of these Procedures that comes to the attention of the Funds’ Treasurer or any services or engagements that are not required to be pre-approved pursuant to the de minimis exception provided for in Rule 2-01(c)(7)(i)(C) of Regulation S-X.
On at least an annual basis, the Auditor will provide the Audit Committee with a summary of all non-audit services provided to any entity in the investment company complex (as defined in section 2-01(f)(14) of Regulation S-X, including the Funds and Service Affiliates) that were not pre-approved, including the nature of services provided and the associated fees.
| | IX. | Amendments to Procedures |
All material amendments to these Procedures must be approved in advance by the Audit Committee. Non-material amendments to these Procedures may be made by the Legal and Compliance Departments and will be reported to the Audit Committee at the next regularly scheduled meeting of the Audit Committee.
Appendix I
Non-Audit Services That May Impair the Auditor’s Independence
The Auditor is not independent if, at any point during the audit and professional engagement, the Auditor provides the following non-audit services:
| | • | | Broker-dealer, investment adviser, or investment banking services ; |
| | • | | Expert services unrelated to the audit; |
| | • | | Any service or product provided for a contingent fee or a commission; |
| | • | | Services related to marketing, planning, or opining in favor of the tax treatment of confidential transactions or aggressive tax position transactions, a significant purpose of which is tax avoidance; |
| | • | | Tax services for persons in financial reporting oversight roles at the Fund; and |
| | • | | Any other service that the Public Company Oversight Board determines by regulation is impermissible. |
An Auditor is not independent if, at any point during the audit and professional engagement, the Auditor provides the following non-audit services unless it is reasonable to conclude that the results of the services will not be subject to audit procedures during an audit of the Funds’ financial statements:
| | • | | Bookkeeping or other services related to the accounting records or financial statements of the audit client; |
| | • | | Financial information systems design and implementation; |
| | • | | Appraisal or valuation services, fairness opinions, or contribution-in-kind reports; |
| | • | | Actuarial services; and |
| | • | | Internal audit outsourcing services. |
(e)(2) There were no amounts that were pre-approved by the Audit Committee pursuant to the de minimus exception under Rule 2-01 of Regulation S-X.
(f) Not applicable.
(g) In addition to the amounts shown in the tables above, PwC billed Invesco and Invesco Affiliates aggregate fees of $7,776,000 for the fiscal year ended April 30, 2021 and $6,726,000 for the fiscal year ended April 30, 2020. In total, PwC billed the Registrant, Invesco and Invesco Affiliates aggregate non-audit fees of $8,787,860 for the fiscal year ended April 30, 2021 and $7,601,663 for the fiscal year ended April 30, 2020.
PwC provided audit services to the Investment Company complex of approximately $32 million.
(h) The Audit Committee also has considered whether the provision of non-audit services that were rendered to Invesco and Invesco Affiliates that were not required to be pre-approved pursuant to SEC regulations, if any, is compatible with maintaining PwC’s independence.
| ITEM 5. | AUDIT COMMITTEE OF LISTED REGISTRANTS. |
Not applicable.
| ITEM 6. | SCHEDULE OF INVESTMENTS. |
Investments in securities of unaffiliated issuers is included as part of the reports to stockholders filed under Item 1 of this Form.
| ITEM 7. | DISCLOSURE OF PROXY VOTING POLICIES AND PROCEDURES FOR CLOSED-END MANAGEMENT INVESTMENT COMPANIES. |
Not applicable.
| ITEM 8. | PORTFOLIO MANAGERS OF CLOSED-END MANAGEMENT INVESTMENT COMPANIES. |
Not applicable.
| ITEM 9. | PURCHASES OF EQUITY SECURITIES BY CLOSED-END MANAGEMENT INVESTMENT COMPANY AND AFFILIATED PURCHASERS. |
Not applicable.
| ITEM 10. | SUBMISSION OF MATTERS TO A VOTE OF SECURITY HOLDERS. |
None.
| ITEM 11. | CONTROLS AND PROCEDURES. |
| | (a) | As of June 18, 2021, an evaluation was performed under the supervision and with the participation of the officers of the Registrant, including the PEO and PFO, to assess the effectiveness of the Registrant’s disclosure controls and procedures, as that term is defined in Rule 30a-3(c) under the Investment Company Act of 1940 (the “Act”), as amended. Based on that evaluation, the Registrant’s officers, including the PEO and PFO, concluded that, as of June 18, 2021, the Registrant’s disclosure controls and procedures were reasonably designed to ensure: (1) that information required to be disclosed by the Registrant on Form N-CSR is recorded, processed, summarized and reported within the time periods specified by the rules and forms of the Securities and Exchange Commission; and (2) that material information relating to the Registrant is made known to the PEO and PFO as appropriate to allow timely decisions regarding required disclosure. |
| | (b) | There have been no changes in the Registrant’s internal control over financial reporting (as defined in Rule 30a-3(d) under the Act) that occurred during the period covered by this report that have materially affected, or are reasonably likely to materially affect, the Registrant’s internal control over financial reporting. |
| ITEM 12. | DISCLOSURE OF SECURITIES LENDING ACTIVITIES FOR CLOSED-END MANAGEMENT INVESTMENT COMPANIES |
Not applicable.
SIGNATURES
Pursuant to the requirements of the Securities Exchange Act of 1934 and the Investment Company Act of 1940, the Registrant has duly caused this report to be signed on its behalf by the undersigned, thereunto duly authorized.
Registrant: AIM Sector Funds (Invesco Sector Funds)
| | |
| By: | | /s/ Sheri Morris |
| | Sheri Morris |
| | Principal Executive Officer |
| |
| Date: | | July 8, 2021 |
Pursuant to the requirements of the Securities and Exchange Act of 1934 and the Investment Company Act of 1940, this report has been signed below by the following persons on behalf of the Registrant and in the capacities and on the dates indicated.
| | |
| By: | | /s/ Sheri Morris |
| | Sheri Morris |
| | Principal Executive Officer |
| |
| Date: | | July 8, 2021 |
| |
| By: | | /s/ Adrien Deberghes |
| | Adrien Deberghes |
| | Principal Financial Officer |
| |
| Date: | | July 8, 2021 |