UNITED STATES
SECURITIES AND EXCHANGE COMMISSION
Washington, D.C. 20549
FORM N-CSR
CERTIFIED SHAREHOLDER REPORT OF REGISTERED
MANAGEMENT INVESTMENT COMPANIES
Investment Company Act file Number _811-3835_
Value Line Centurion Fund, Inc.
(Exact name of registrant as specified in charter)
220 East 42nd Street, New York, N.Y. 10017
(Address of principal executive offices) (Zip Code)
Registrant’s telephone number, including area code: 212-907-1500
Date of fiscal year end: December 31, 2007
Date of reporting period: December 31, 2007
Item I. Reports to Stockholders.
A copy of the Annual Report to Stockholders for the period ended 12/31/07 is included with this Form.
| Annual Report | |||
| n Value Line Centurion Fund, Inc. | To Contractowners |

Portfolio Manager
Long-term growth of capital
November 15, 1983
$291,948,575
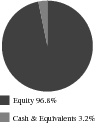
(Percentage of Total Net Assets)
| Company | | Percentage of Total Net Assets | ||||
|---|---|---|---|---|---|---|
| Potash Corporation of Saskatchewan, Inc. | 1.13 | % | ||||
| Agrium, Inc. | 1.11 | % | ||||
| Monsanto Co. | 1.07 | % | ||||
| McDermott International, Inc. | 1.05 | % | ||||
| ANSYS, Inc. | 1.05 | % | ||||
| Textron, Inc. | 1.05 | % | ||||
| Amazon.com, Inc. | 1.05 | % | ||||
| Robbins & Myers, Inc. | 1.04 | % | ||||
| Fresh Del Monte Produce, Inc. | 1.04 | % | ||||
| FTI Consulting, Inc. | 1.03 | % | ||||
| • | It is important to consider the Fund’s investment objectives, risks, fees and expenses before investing. All funds involve some risk, including possible loss of the principal amount invested. |
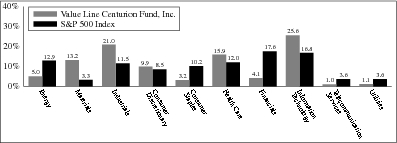
| • | The S&P 500 Index is an unmanaged index of 500 primarily large cap U.S. stocks that is generally considered to be representative of U.S. stock market activity. Index returns are provided for comparative purposes. Please note that the index is unmanaged and not available for direct investment and its returns do not reflect the fees and expenses that have been deducted from the Fund. |
VALUE LINE CENTURION FUND, INC. | 1 |
| Annual Report | |||
| n Value Line Centurion Fund, Inc. | To Contractowners |
| | 1 Yr | | 3 Yrs | | 5 Yrs | | 10 Yrs | | Since Inception 11/15/1983 | | | | |||||||||||||||||
|---|---|---|---|---|---|---|---|---|---|---|---|---|---|---|---|---|---|---|---|---|---|---|---|---|---|---|---|---|---|
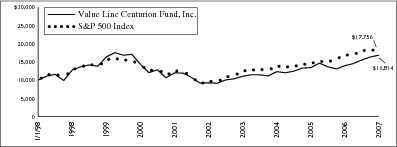
| Value Line Centurion Fund, Inc. | 20.72 | % | 11.01 | % | 12.76 | % | 5.33 | % | 10.40 | % | |||||||||||||||||||
| S&P 500 Index | 5.49 | % | 8.62 | % | 12.83 | % | 5.91 | % | 12.23 | % | |||||||||||||||||||
All performance data quoted is historical and the results represent past performance and neither guarantee nor predict future investment results. To obtain performance data current to the most recent month (available within 7 business days of the most recent month end), please call us at (800) 221-3253 or visit our website at www.guardianinvestor.com. Current performance may be higher or lower than the performance quoted here. Investment return and principal value will fluctuate so that an investor’s shares, when redeemed, may be worth more or less than the original cost.
2 | VALUE LINE CENTURION FUND, INC. |
| Annual Report | |||
| n Value Line Centurion Fund, Inc. | To Contractowners |
| | Beginning Account Value July 1, 2007 | | Ending Account Value December 31, 2007 | | Expenses Paid During Period* | | Annualized Expense Ratio | |||||||||||
|---|---|---|---|---|---|---|---|---|---|---|---|---|---|---|---|---|---|---|
| Actual | $ | 1,000 | $ | 1,083.71 | $ | 4.15 | 0.79 | % | ||||||||||
| Hypothetical (5% return before expenses) | $ | 1,000 | $ | 1,021.22 | $ | 4.02 | 0.79 | % | ||||||||||
| * | Expenses are equal to the Fund’s annualized expense ratio multiplied by the average account value over the period, multiplied by 184/365 (to reflect the Fund’s most recent fiscal half-year). This expense ratio may differ from the expense ratio shown in the financial highlights. |
VALUE LINE CENTURION FUND, INC. | 3 |
| n Value Line Centurion Fund, Inc. |
| Shares | | | Value | |||||||||
|---|---|---|---|---|---|---|---|---|---|---|---|---|
Aerospace/Defense — 1.9% | ||||||||||||
| 441,000 | Bombardier, Inc. Class B * | $ | 2,646,888 | |||||||||
| 21,000 | Precision Castparts Corp. | 2,912,700 | ||||||||||
| 5,559,588 | ||||||||||||
Auto Parts — 0.9% | ||||||||||||
| 125,000 | LKQ Corp. * | 2,627,500 | ||||||||||
Beverage–Soft Drink — 2.0% | ||||||||||||
| 48,000 | Coca-Cola Co. (The) | 2,945,760 | ||||||||||
| 90,000 | PepsiAmericas, Inc. | 2,998,800 | ||||||||||
| 5,944,560 | ||||||||||||
Biotechnology — 0.9% | ||||||||||||
| 29,000 | Invitrogen Corp. * | 2,708,890 | ||||||||||
Building Materials — 2.8% | ||||||||||||
| 46,000 | Dynamic Materials Corp. | 2,709,400 | ||||||||||
| 18,000 | Fluor Corp. | 2,622,960 | ||||||||||
| 29,000 | Jacobs Engineering Group, Inc. * | 2,772,690 | ||||||||||
| 8,105,050 | ||||||||||||
Chemical–Basic — 2.3% | ||||||||||||
| 45,000 | Agrium, Inc. | 3,249,450 | ||||||||||
| 23,000 | Potash Corporation of Saskatchewan, Inc. | 3,311,080 | ||||||||||
| 6,560,530 | ||||||||||||
Chemical–Diversified — 1.1% | ||||||||||||
| 28,000 | Monsanto Co. | 3,127,320 | ||||||||||
Chemical–Specialty — 1.0% | ||||||||||||
| 31,000 | Mosaic Co. (The) * | 2,924,540 | ||||||||||
Computer & Peripherals — 4.7% | ||||||||||||
| 15,000 | Apple, Inc. * | 2,971,200 | ||||||||||
| 147,000 | EMC Corp. * | 2,723,910 | ||||||||||
| 115,000 | Seagate Technology | 2,932,500 | ||||||||||
| 43,000 | Sigma Designs, Inc. * | 2,373,600 | ||||||||||
| 87,000 | Western Digital Corp. * | 2,628,270 | ||||||||||
| 13,629,480 | ||||||||||||
Computer Software & Services — 5.8% | ||||||||||||
| 74,000 | ANSYS, Inc. * | 3,068,040 | ||||||||||
| 75,000 | BMC Software, Inc. * | 2,673,000 | ||||||||||
| 106,000 | CA, Inc. | 2,644,700 | ||||||||||
| 104,000 | Jack Henry & Associates, Inc. | 2,531,360 | ||||||||||
| 81,000 | Microsoft Corp. | 2,883,600 | ||||||||||
| 132,000 | Oracle Corp. * | 2,980,560 | ||||||||||
| 16,781,260 | ||||||||||||
Diversified Companies — 3.1% | ||||||||||||
| 52,000 | McDermott International, Inc. * | 3,069,560 | ||||||||||
| 43,000 | Textron, Inc. | 3,065,900 | ||||||||||
| 32,000 | Valmont Industries, Inc. | 2,851,840 | ||||||||||
| 8,987,300 | ||||||||||||
Drug — 6.7% | ||||||||||||
| 31,000 | Covance, Inc. * | 2,685,220 | ||||||||||
| 67,000 | LifeCell Corp. * | 2,888,370 | ||||||||||
| 47,000 | Merck & Co., Inc. | 2,731,170 | ||||||||||
| 46,000 | Novo Nordisk A/S ADR | 2,983,560 | ||||||||||
| 47,000 | Onyx Pharmaceuticals, Inc. * | 2,614,140 | ||||||||||
| 60,000 | OSI Pharmaceuticals, Inc. * | 2,910,600 | ||||||||||
| 81,000 | Perrigo Co. | 2,835,810 | ||||||||||
| 19,648,870 | ||||||||||||
Educational Services — 3.6% | ||||||||||||
| 36,000 | Apollo Group, Inc. Class A * | $ | 2,525,400 | |||||||||
| 53,000 | DeVry, Inc. | 2,753,880 | ||||||||||
| 120,000 | Learning Tree International, Inc. * | 2,755,200 | ||||||||||
| 15,000 | Strayer Education, Inc. | 2,558,700 | ||||||||||
| 10,593,180 | ||||||||||||
Electrical Equipment — 1.8% | ||||||||||||
| 88,000 | FLIR Systems, Inc. * | 2,754,400 | ||||||||||
| 26,000 | Garmin Ltd. | 2,522,000 | ||||||||||
| 5,276,400 | ||||||||||||
Electronics — 1.9% | ||||||||||||
| 77,000 | Cubic Corp. | 3,018,400 | ||||||||||
| 30,000 | MEMC Electronic Materials, Inc. * | 2,654,700 | ||||||||||
| 5,673,100 | ||||||||||||
Entertainment Technology — 2.0% | ||||||||||||
| 60,000 | Dolby Laboratories, Inc. Class A * | 2,983,200 | ||||||||||
| 127,000 | Zoran Corp. * | 2,858,770 | ||||||||||
| 5,841,970 | ||||||||||||
Environmental — 1.0% | ||||||||||||
| 48,000 | Stericycle, Inc. * | 2,851,200 | ||||||||||
Financial Services–Diversified — 2.0% | ||||||||||||
| 88,000 | Janus Capital Group, Inc. | 2,890,800 | ||||||||||
| 59,000 | Nasdaq Stock Market, Inc. * | 2,919,910 | ||||||||||
| 5,810,710 | ||||||||||||
Food Processing — 1.0% | ||||||||||||
| 90,000 | Fresh Del Monte Produce, Inc. * | 3,022,200 | ||||||||||
Health Care Information Systems — 1.0% | ||||||||||||
| 117,000 | Eclipsys Corp. * | 2,961,270 | ||||||||||
Industrial Services — 1.0% | ||||||||||||
| 49,000 | FTI Consulting, Inc. * | 3,020,360 | ||||||||||
Information Services — 0.9% | ||||||||||||
| 43,000 | IHS, Inc. Class A * | 2,604,080 | ||||||||||
Insurance–Life — 1.0% | ||||||||||||
| 46,000 | AFLAC, Inc. | 2,880,980 | ||||||||||
Internet — 5.0% | ||||||||||||
| 33,000 | Amazon.com, Inc. * | 3,057,120 | ||||||||||
| 85,000 | eBay, Inc. * | 2,821,150 | ||||||||||
| 106,700 | Global Sources Ltd. * | 3,011,074 | ||||||||||
| 4,000 | Google, Inc. Class A * | 2,765,920 | ||||||||||
| 25,000 | Priceline.com, Inc. * | 2,871,500 | ||||||||||
| 14,526,764 | ||||||||||||
Machinery — 7.9% | ||||||||||||
| 41,000 | AGCO Corp. * | 2,787,180 | ||||||||||
| 30,000 | Bucyrus International, Inc. Class A | 2,981,700 | ||||||||||
| 44,000 | CNH Global N.V. | 2,896,080 | ||||||||||
| 32,000 | Deere & Co. | 2,979,840 | ||||||||||
| 29,000 | Flowserve Corp. | 2,789,800 | ||||||||||
| 38,000 | Lindsay Corp. | 2,686,220 | ||||||||||
| 61,000 | Manitowoc Company, Inc. (The) | 2,978,630 | ||||||||||
| 40,000 | Robbins & Myers, Inc. | 3,025,200 | ||||||||||
| 23,124,650 | ||||||||||||
Medical Services — 0.9% | ||||||||||||
| 31,000 | WellPoint, Inc. * | 2,719,630 | ||||||||||
4 | See notes to financial statements. |
| n Value Line Centurion Fund, Inc. |
| Shares | | | Value | |||||||||
|---|---|---|---|---|---|---|---|---|---|---|---|---|
Medical Supplies — 4.7% | ||||||||||||
| 55,000 | ArthroCare Corp. * | $ | 2,642,750 | |||||||||
| 42,000 | Charles River Laboratories International, Inc. * | 2,763,600 | ||||||||||
| 46,000 | IDEXX Laboratories, Inc. * | 2,696,980 | ||||||||||
| 9,000 | Intuitive Surgical, Inc. * | 2,920,500 | ||||||||||
| 51,000 | Kinetic Concepts, Inc. * | 2,731,560 | ||||||||||
| 13,755,390 | ||||||||||||
Metals & Mining Diversified — 2.9% | ||||||||||||
| 83,000 | AMCOL International Corp. | 2,990,490 | ||||||||||
| 37,000 | BHP Billiton Ltd. ADR | 2,591,480 | ||||||||||
| 27,000 | Southern Copper Corp. | 2,838,510 | ||||||||||
| 8,420,480 | ||||||||||||
Natural Gas–Diversified — 2.0% | ||||||||||||
| 50,000 | Southwestern Energy Co. * | 2,786,000 | ||||||||||
| 83,000 | Williams Companies, Inc. (The) | 2,969,740 | ||||||||||
| 5,755,740 | ||||||||||||
Oilfield Services/Equipment — 2.9% | ||||||||||||
| 62,000 | Cameron International Corp. * | 2,984,060 | ||||||||||
| 22,000 | Core Laboratories N.V. * | 2,743,840 | ||||||||||
| 39,000 | National-Oilwell Varco, Inc. * | 2,864,940 | ||||||||||
| 8,592,840 | ||||||||||||
Packaging & Container — 1.9% | ||||||||||||
| 61,000 | Owens-Illinois, Inc. * | 3,019,500 | ||||||||||
| 93,000 | Packaging Corp. of America | 2,622,600 | ||||||||||
| 5,642,100 | ||||||||||||
Paper & Forest Products — 0.8% | ||||||||||||
| 155,000 | Glatfelter | 2,373,050 | ||||||||||
Pharmacy Services — 1.0% | ||||||||||||
| 41,000 | Express Scripts, Inc. * | 2,993,000 | ||||||||||
Power — 1.0% | ||||||||||||
| 22,000 | SunPower Corp. Class A * | 2,868,580 | ||||||||||
Precision Instrument — 2.8% | ||||||||||||
| 68,000 | Axsys Technologies, Inc. * | 2,492,200 | ||||||||||
| 85,000 | National Instruments Corp. | 2,833,050 | ||||||||||
| 35,000 | Waters Corp. * | 2,767,450 | ||||||||||
| 8,092,700 | ||||||||||||
Retail–Automotive — 1.0% | ||||||||||||
| 66,000 | Copart, Inc. * | 2,808,300 | ||||||||||
Retail–Special Lines — 2.8% | ||||||||||||
| 51,000 | Best Buy Co., Inc. | 2,685,150 | ||||||||||
| 65,000 | Fossil, Inc. * | 2,728,700 | ||||||||||
| 45,000 | GameStop Corp. Class A * | 2,794,950 | ||||||||||
| 8,208,800 | ||||||||||||
Securities Brokerage — 1.0% | ||||||||||||
| 117,000 | Charles Schwab Corp. (The) | 2,989,350 | ||||||||||
Semiconductor — 3.0% | ||||||||||||
| 80,000 | Cypress Semiconductor Corp. * | 2,882,400 | ||||||||||
| 87,500 | NVIDIA Corp. * | 2,976,750 | ||||||||||
| 85,000 | Texas Instruments, Inc. | 2,839,000 | ||||||||||
| 8,698,150 | ||||||||||||
Shoe — 1.0% | ||||||||||||
| 18,000 | Deckers Outdoor Corp. * | 2,791,080 | ||||||||||
Telecommunication Services — 1.0% | ||||||||||||
| 30,000 | Telefonica S.A. ADR | 2,927,700 | ||||||||||
Telecommunications Equipment — 1.9% | ||||||||||||
| 162,000 | Foundry Networks, Inc. * | $ | 2,838,240 | |||||||||
| 70,000 | Nokia Oyj ADR | 2,687,300 | ||||||||||
| 5,525,540 | ||||||||||||
Wireless Networking — 0.9% | ||||||||||||
| 24,000 | Research In Motion Ltd. * | 2,721,600 | ||||||||||
Total Common Stocks And Total Investment Securities — 96.8% (Cost $244,431,588) | $ | 282,675,782 | ||||||||||
| Principal Amount | | | Value | |||||||||
|---|---|---|---|---|---|---|---|---|---|---|---|---|
Repurchase Agreements — 3.1% | ||||||||||||
| $9,100,000 | With Morgan Stanley, 0.95%, dated 12/31/07, due 1/2/08, delivery value $9,100,480 (collateralized by $6,515,000 U.S. Treasury Notes 9.125%, due 5/15/18, with a value of $9,291,817) | $ | 9,100,000 | |||||||||
Total Repurchase Agreements (Cost $9,100,000) | 9,100,000 | |||||||||||
Cash And Other Assets In Excess Of Liabilities — (0.1%) | 172,793 | |||||||||||
Net Assets — 100.0% | $ | 291,948,575 | ||||||||||
Net Asset Value Per Outstanding Share ($291,948,575 ÷ 13,670,817 shares outstanding) | $ | 21.36 | ||||||||||
| * | Non-income producing. |
| ADR | American Depositary Receipt |
See notes to financial statements. | 5 |
December 31, 2007
ASSETS: | ||||||
| Investment securities, at value (cost — $244,431,588) | $ | 282,675,782 | ||||
| Repurchase agreements (cost — $9,100,000) | 9,100,000 | |||||
| Cash | 31,114 | |||||
| Receivable for securities sold | 8,315,176 | |||||
| Interest and dividends receivable | 160,369 | |||||
| Receivable for capital shares sold | 39,240 | |||||
Total Assets | 300,321,681 | |||||
LIABILITIES: | ||||||
| Payable for securities purchased | 7,935,651 | |||||
| Payable for capital shares repurchased | 235,809 | |||||
| Accrued expenses: | ||||||
| Advisory fee | 124,999 | |||||
| Service and distribution plan fees | 62,507 | |||||
| Directors’ fees and expenses | 5,035 | |||||
| Other | 9,105 | |||||
Total Liabilities | 8,373,106 | |||||
Net Assets | $ | 291,948,575 | ||||
NET ASSETS CONSIST OF: | ||||||
| Capital stock, at $1.00 par value | ||||||
| (authorized 50,000,000, outstanding | ||||||
| 13,670,817 shares) | $ | 13,670,817 | ||||
| Additional paid-in capital | 195,794,775 | |||||
| Accumulated net realized gain on investments | 44,238,789 | |||||
| Net unrealized appreciation of investments | 38,244,194 | |||||
Net Assets | $ | 291,948,575 | ||||
Net Asset Value Per Outstanding Share | ||||||
| ($291,948,575 ÷ 13,670,817 shares outstanding) | $ | 21.36 |
For the Year Ended
December 31, 2007
INVESTMENT INCOME: | ||||||
| Dividends(net of foreign withholding tax of $25,947) | $ | 1,642,688 | ||||
| Interest | 364,221 | |||||
Total Income | 2,006,909 | |||||
Expenses: | ||||||
| Advisory fee | 1,441,520 | |||||
| Service and distribution plan fees | 1,153,216 | |||||
| Auditing and legal fees | 81,225 | |||||
| Custodian fees | 50,291 | |||||
| Directors’ fees and expenses | 21,699 | |||||
| Printing | 2,600 | |||||
| Other | 4,401 | |||||
Total Expenses Before Custody Credits and Waivers | 2,754,952 | |||||
| Less: Service and Distribution Plan Fees Waived | (486,071 | ) | ||||
| Less: Custody Credits | (4,590 | ) | ||||
Net Expenses | 2,264,291 | |||||
Net Investment Loss | (257,382 | ) | ||||
NET REALIZED AND UNREALIZED GAIN/(LOSS) ON INVESTMENTS AND FOREIGN EXCHANGE TRANSACTIONS: | ||||||
| Net realized gain | 44,471,759 | |||||
| Change in net unrealized appreciation/(depreciation) | 9,887,849 | |||||
Net Realized Gain and Change in Net Unrealized Appreciation/(Depreciation) on Investments and Foreign Exchange Transactions | 54,359,608 | |||||
NET INCREASE IN NET ASSETS FROM OPERATIONS | $ | 54,102,226 |
6 | See notes to financial statements. |
| Years Ended December 31, | |||||||||||||||||||||||
|---|---|---|---|---|---|---|---|---|---|---|---|---|---|---|---|---|---|---|---|---|---|---|---|
| 2007 | 2006 | ||||||||||||||||||||||
Operations: | |||||||||||||||||||||||
| Net investment loss | $ | (257,382 | ) | $ | (742,963 | ) | |||||||||||||||||
| Net realized gain on investments | 44,471,759 | 21,464,140 | |||||||||||||||||||||
| Change in net unrealized appreciation/(depreciation) | 9,887,849 | (9,100,122 | ) | ||||||||||||||||||||
Net increase in net assets from operations | 54,102,226 | 11,621,055 | |||||||||||||||||||||
Distributions to Shareholders: | |||||||||||||||||||||||
| Net realized gains | (19,936,538 | ) | (25,263,799 | ) | |||||||||||||||||||
Capital Share Transactions: | |||||||||||||||||||||||
| Proceeds from sale of shares | 10,351,433 | 7,978,268 | |||||||||||||||||||||
| Proceeds from reinvestment of dividends and distributions to shareholders | 19,936,538 | 25,263,799 | |||||||||||||||||||||
| Cost of shares repurchased | (56,341,129 | ) | (61,580,675 | ) | |||||||||||||||||||
Net decrease from capital share transactions | (26,053,158 | ) | (28,338,608 | ) | |||||||||||||||||||
Total Increase/(Decrease) in Net Assets | 8,112,530 | (41,981,352 | ) | ||||||||||||||||||||
NET ASSETS: | |||||||||||||||||||||||
| Beginning of year | 283,836,045 | 325,817,397 | |||||||||||||||||||||
| End of year | $ | 291,948,575 | $ | 283,836,045 | |||||||||||||||||||
See notes to financial statements. | 7 |
| Years Ended December 31, | |||||||||||||||||||||||
|---|---|---|---|---|---|---|---|---|---|---|---|---|---|---|---|---|---|---|---|---|---|---|---|
| | 2007 | | 2006 | | 2005 | | 2004 | | 2003 | ||||||||||||||
Net asset value, beginning of year | $ | 18.96 | $ | 20.07 | $ | 20.24 | $ | 18.15 | $ | 15.19 | |||||||||||||
Income from investment operations: | |||||||||||||||||||||||
| Net investment loss | (0.02 | ) | (0.05 | ) | (0.08 | ) | (0.05 | ) | (0.03 | ) | |||||||||||||
| Net gain/(loss) on securities (both realized and unrealized) | 3.89 | 0.63 | 1.88 | 2.14 | 2.99 | ||||||||||||||||||
| Total from investment operations | 3.87 | 0.58 | 1.80 | 2.09 | 2.96 | ||||||||||||||||||
Less distributions: | |||||||||||||||||||||||
| Distributions from net realized gains | (1.47 | ) | (1.69 | ) | (1.97 | ) | — | — | |||||||||||||||
Net asset value, end of year | $ | 21.36 | $ | 18.96 | $ | 20.07 | $ | 20.24 | $ | 18.15 | |||||||||||||
Total return* | 20.72 | % | 3.85 | % | 9.13 | % | 11.51 | % | 19.49 | % | |||||||||||||
Ratios/supplemental data: | |||||||||||||||||||||||
| Net assets, end of year (in thousands) | $ | 291,949 | $ | 283,836 | $ | 325,817 | $ | 350,409 | $ | 355,435 | |||||||||||||
| Ratio of expenses to average net assets (1) | 0.96 | % | 0.98 | % | 0.96 | % | 0.95 | % | 0.99 | % | |||||||||||||
| Ratio of expenses to average net assets (2) | 0.79 | % | 0.89 | % | 0.96 | % | 0.95 | % | 0.99 | % | |||||||||||||
| Ratio of net investment loss to average net assets | (0.09 | )% | (0.24 | )% | (0.39 | )% | (0.27 | )% | (0.19 | )% | |||||||||||||
| Portfolio turnover rate | 200 | % | 220 | % | 219 | % | 187 | % | 129 | % | |||||||||||||
| * | Total returns do not reflect the effects of charges deducted under the terms of GIAC’s variable contracts. Including such charges would reduce the total returns for all years shown. |
| (1) | Ratio reflects expenses grossed up for custody credit arrangement and grossed up for the waiver of a portion of the service and distribution plan fees by the Distributor. The ratio of expenses to average net assets net of custody credits, but exclusive of the waiver of a portion of the service and distribution plan fees by the Distributor, would have been 0.95% for the year ended December 31, 2007 and would not have changed for the other years shown. |
| (2) | Ratio reflects expenses net of the waiver of a portion of the service and distribution plan fees by the Distributor and net of the custody credit arrangement. |
8 | See notes to financial statements. |
9
by the Fund, if any. Such distributions are determined in accordance with income tax regulations, which may differ from generally accepted accounting principles. All dividends or distributions will be payable in shares of the Fund at the net asset value on the ex-dividend date. This policy is, however, subject to change at any time by the Board of Directors.
2. | Capital Share Transactions, Dividends and Distributions |
| Year Ended December 31, 2007 | Year Ended December 31, 2006 | |||||||||
|---|---|---|---|---|---|---|---|---|---|---|
| Shares sold | 507,061 | 392,891 | ||||||||
| Shares issued in reinvestment of dividends and distributions | 971,566 | 1,482,617 | ||||||||
| Shares repurchased | (2,781,422 | ) | (3,135,375 | ) | ||||||
| Net decrease | (1,302,795 | ) | (1,259,867 | ) | ||||||
| Distributions per share from net realized gains | $ | 1.47 | $ | 1.69 | ||||||
| Year Ended December 31, 2007 | ||||||
|---|---|---|---|---|---|---|
PURCHASES: | ||||||
| Investment Securities | $ | 559,875,423 | ||||
SALES: | ||||||
| Investment Securities | $ | 607,414,412 | ||||
10
| Cost of investments for tax purposes | $ | 253,534,763 | ||||
| Gross tax unrealized appreciation | $ | 41,773,737 | ||||
| Gross tax unrealized depreciation | (3,532,718 | ) | ||||
| Net tax unrealized appreciation on investments | $ | 38,241,019 | ||||
| Undistributed ordinary income | $ | 33,768,915 | ||||
| Undistributed long-term gains | $ | 10,473,049 |
| 2007 | 2006 | |||||||||
|---|---|---|---|---|---|---|---|---|---|---|
| Ordinary income | $ | 1,921,030 | $ | 8,593,152 | ||||||
| Long-term capital gain | 18,015,508 | 16,670,647 | ||||||||
| $ | 19,936,538 | $ | 25,263,799 | |||||||
5. | Investment Advisory Fee, Service and Distribution Fees and Transactions with Affiliates |
11
Public Accounting Firm
Value Line Centurion Fund, Inc.
New York, New York
February 15, 2008
12
13
14
| Name, Address, and Age | | Position | | Length of Time Served | | Principal Occupation During the Past 5 Years | | Other Directorships Held by Director | ||||||||||
|---|---|---|---|---|---|---|---|---|---|---|---|---|---|---|---|---|---|---|
Interested Director* | ||||||||||||||||||
| Jean Bernhard Buttner Age 73 | Chairman of the Board of Directors and President | Since 1983 | Chairman, President and Chief Executive Officer of Value Line, Inc. (the “Adviser”) and Value Line Publishing, Inc.; Chairman and President of each of the 14 Value Line Funds and Value Line Securities Inc. (the “Distributor”). | Value Line, Inc. | ||||||||||||||
Non-Interested Directors | ||||||||||||||||||
| John W. Chandler 116 North Hemlock Lane Williamstown, MA 01267 Age 84 | Director (Lead Independent Director Since 2007) | Since 1991 | Consultant, Academic Search Consultation Service, Inc. (1994-2004); Trustee Emeritus and Chairman (1993-1994) of the Board of Trustees of Duke University; President Emeritus, Williams College. | None | ||||||||||||||
| Frances T. Newton 4921 Buckingham Drive Charlotte, NC 28209 Age 66 | Director | Since 2000 | Retired. Customer Support Analyst, Duke Power Company, until April 2007. | None | ||||||||||||||
| Francis Oakley 54 Scott Hill Road Williamstown, MA 01267 Age 76 | Director | Since 2000 | Professor of History, Williams College, (1961 to 2002) Professor Emeritus since 2002. Professor Emeritus since 1994 and President, (1985-1994); Chairman (1993-1997) and Interim President (2002-2003) of the American Council of Learned Societies. Trustee since 1997 and Chairman of the Board since 2005. National Humanities Center. | None | ||||||||||||||
| David H. Porter 5 Birch Run Drive Saratoga Springs, NY 12866 Age 72 | Director | Since 1997 | Visiting Professor of Classics, Williams College, since 1999; President Emeritus, Skidmore College since 1999 and President, (1987-1998). | None | �� | |||||||||||||
| Paul Craig Roberts 169 Pompano St. Panama City Beach, FL 32413 Age 68 | Director | Since 1983 | Chairman, Institute for Political Economy. | None | ||||||||||||||
| Nancy-Beth Sheerr 1409 Beaumont Drive Gladwyne, PA 19035 Age 58 | Director | Since 1996 | Senior Financial Advisor, Veritable, L.P. (Investment Advisor) Since 2004; Senior Financial Advisor, Hawthorn, (2001-2004). | None | ||||||||||||||
| * | Mrs. Buttner is an “interested person” as defined in the Investment Company Act of 1940 by virtue of her positions with the Adviser and her indirect ownership of a controlling interest in the Adviser. Unless otherwise indicated, the address for each of the above is 220 East 42nd Street, New York, NY 10017. |
15
| Name, Address, and Age | | Position | | Length of Time Served | | Principal Occupation During the Past 5 Years | | |||||||||||
|---|---|---|---|---|---|---|---|---|---|---|---|---|---|---|---|---|---|---|
Officers | ||||||||||||||||||
| David T. Henigson Age 50 | Vice President, Secretary and Chief Compliance Officer | Since 1994 | Director, Vice President and Chief Compliance Officer of the Adviser. Director and Vice President of the Distributor. Vice President, Secretary and Chief Compliance Officer of each of the 14 Value Line Funds. | |||||||||||||||
| Stephen R. Anastasio Age 48 | Treasurer | Since 2005 | Corporate Controller of the Adviser until 2003; Chief Financial Officer of the Adviser, (2003-2005); Treasurer of the Adviser since 2005, Treasurer of each of the 14 Value Line Funds. | |||||||||||||||
| Howard A. Brecher Age 53 | Assistant Secretary, Assistant Treasurer | Since 2005 | Director, Vice President and Secretary of the Adviser, Director and Vice President of the Distributor. | |||||||||||||||
16
Item 2. Code of Ethics
(a) The Registrant has adopted a Code of Ethics that applies to its principal executive officer, and principal financial officer and principal accounting officer.
(f) Pursuant to item 12(a), the Registrant is attaching as an exhibit a copy of its Code of Ethics that applies to its principal executive officer, and principal financial officer and principal accounting officer.
Item 3. Audit Committee Financial Expert.
(a)(1)The Registrant has an Audit Committee Financial Expert serving on its Audit Committee.
(2) The Registrant’s Board has designated John W. Chandler, a member of the Registrant’s Audit Committee, as the Registrant’s Audit Committee Financial Expert. Mr. Chandler is an independent director who is a senior consultant with Academic Search Consultation Service. He spent most of his professional career at Williams College, where he served as a faculty member, Dean of the Faculty, and President (1973-85). He
also served as President of Hamilton College (1968-73), and as President of the Association of American Colleges and Universities (1985-90). He has also previously served as Trustee Emeritus and Chairman of the Board of Trustees of Duke University.
A person who is designated as an “audit committee financial expert” shall not make such person an "expert" for any purpose, including without limitation under Section 11 of the Securities Act of 1933 or under applicable fiduciary laws, as a result of being designated or identified as an audit committee financial expert. The designation or identification of a person as an audit committee financial expert does not impose on such person any duties, obligations, or liabilities that are greater than the duties, obligations, and liabilities imposed on such person as a member of the audit committee and Board of Trustees in the absence of such designation or identification.
Item 4. Principal Accountant Fees and Services
| (a) Audit Fees 2007 - $53,877 |
| (b) Audit-Related fees – None. |
| (c) Tax Preparation Fees 2007 -$3,507 |
| (d) All Other Fees – None |
| (e) | (1) | Audit Committee Pre-Approval Policy. All services to be performed for the Registrant by PricewaterhouseCoopers LLP must be pre-approved by the audit committee. All services performed were pre-approved by the committee. |
| (e) (2) Not applicable. |
| (f) Not applicable. |
| (g) Aggregate Non-Audit Fees 2007 -$3,507 |
| (h) Not applicable. |
Item 11. Controls and Procedures.
| (a) | The registrant’s principal executive officer and principal financial officer have concluded that the registrant’s disclosure controls and procedures (as defined in rule 30a-2(c) under the Act (17 CFR 270.30a-2(c) ) based on their evaluation of these controls and procedures as of a date within 90 days of the filing date of this report, are appropriately designed to ensure that material information relating to the registrant is made known to such officers and are operating effectively. |
| (b) | The registrant’s principal executive officer and principal financial officer have determined that there have been no significant changes in the registrant’s internal controls or in other factors that could significantly affect these controls subsequent to the date of their evaluation, including corrective actions with regard to significant deficiencies and material weaknesses. |
Item 12. Exhibits.
| (a) | Code of Business Conduct and Ethics for Principal Executive and Senior Financial Officers attached hereto as Exhibit 100.COE |
| (b) | (1) Certification pursuant to Rule 30a-2(a) under the Investment Company Act of 1940 (17 CFR 270.30a-2) attached hereto as Exhibit 99.CERT. |
|
| (2) | Certification persuant to Section 906 of the Sarbanes-Oxley Act of 2002 attached hereto as Exhibit 99.906.CERT. |
SIGNATURES
Pursuant to the requirements of the Securities Exchange Act of 1934 and the Investment Company Act of 1940, the registrant has duly caused this report to be signed on its behalf by the undersigned, thereunto duly authorized.
By | Jean B. Buttner |
| Jean B. Buttner, President |
Date: February 29, 2008 |
Pursuant to the requirements of the Securities Exchange Act of 1934 and the Investment Company Act of 1940, this report has been signed below by the following persons on behalf of the registrant and in the capacities and on the dates indicated.
By: | Jean B. Buttner |
| Jean B. Buttner, President, Principal Executive Officer |
By: | Stephen R. Anastasio �� |
| Stephen R. Anastasio, Treasurer, Principal Financial Officer |
Date: February 29, 2008 |