UNITED STATES
SECURITIES AND EXCHANGE COMMISSION
Washington, D.C. 20549
FORM N-CSR
CERTIFIED SHAREHOLDER REPORT OF REGISTERED
MANAGEMENT INVESTMENT COMPANIES
Investment Company Act file Number 811-3835
Value Line Centurion Fund, Inc.
(Exact name of registrant as specified in charter)
220 East 42nd Street, New York, N.Y. 10017
(Address of principal executive offices) (Zip Code)
Registrant’s telephone number, including area code: 212-907-1500
Date of fiscal year end: December 31, 2004
Date of reporting period: December 31, 2004
Item I. Reports to Stockholders.
A copy of the Annual Report to Stockholders for the period ended 12/31/04 is included with this Form.
n Value Line Centurion Fund | Annual Report |

Sigourney B. Romaine, Jr. (left), C.F.A., Co-Portfolio Manager,
John Koller (right), Co-Portfolio Manager
Objective:
Long-term growth of capital
Inception Date:
November 15, 1983
Net Assets at
December 31, 2004:
$350,408,657
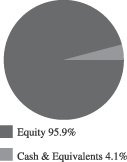
Portfolio Composition at December 31, 2004:
An Update from Fund Management
In 2004, the Fund returned 11.51%, compared with 10.88% for the S&P 500 Index. The Fund outperformed the S&P 500 in the first quarter and trailed the benchmark in the second and third quarters of 2004; a strong fourth-quarter gain lifted the Fund’s return for the year above the benchmark.
Following three declining years and the large gains of 2003, last year the S&P 500 Index performed more in line with its historical long-term averages. The Dow Jones Industrial Average, representing the largest companies, did the worst, returning 5.31%. For the sixth year in a row, the smaller stocks had the best record, as indicated by the showing of the Russell 2000 Index, which gained 18.33%. Stocks generally rose in the first quarter, but prices seesawed down during the second and third quarters, and the broad indices touched their year’s lows in August or October. The ensuing rally represented most of the gains in 2004, or, in the case of the Dow Jones Industrial Average, more than the year’s total return. Although the Federal Reserve raised short-term interest rates five times during 2004, rising rates had little effect on stock prices last year.
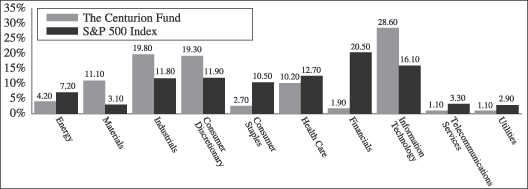
In 2004, the Fund’s performance was impacted by underweightings in the utilities and telecommunications services — the second and third-best performing sectors in 2004 — as these groups offered few timely names. On the other hand, the Fund’s underweight relative to its benchmark in consumer staples helped its performance, as that sector returned less than the S&P 500 last year. An overweighting in industrials helped the Fund beat the S&P 500 in the fourth quarter.
The Fund generally invests in stocks that are ranked in the highest category for price appreciation over the next six to twelve months by the Value Line Timeliness Ranking system. The system favors stocks that have above-average earnings and stock-price momentum compared with those of the other roughly 1700 stocks in the Value Line Investment Survey. We generally buy stocks when their Timeliness ranking rises to the top category and sell them when their ranking drops out of it.
The views expressed above are those of the Fund’s portfolio manager(s) as of December 31, 2004 and are subject to change without notice. They do not necessarily represent the views of Value Line. The views expressed herein are based on current market conditions and are not intended to predict or guarantee the future performance of any Fund, any individual security, any market or market segment. The composition of each Fund’s portfolio is subject to change. No recommendation is made with respect to any security discussed herein
About information in this report:
| • | It is important to consider the Fund’s investment objectives, risks, fees and expenses before investing. All funds involve some risk, including possible loss of the principal amount invested. |
| • | The S&P 500 Index is an index of 500 primarily large cap U.S. stocks that is generally considered to be representative of U.S. stock market activity. The Russell 2000 Index is generally considered to be representative of small capitalization growth issues in the U.S. stock market. The Dow Jones Industrial Average is an unmanaged index of 30 individual stocks listed on the New York Stock Exchange that is generally considered to be representative of U.S. stock market activity. Index returns are provided for comparative purposes. Please note that the indices are unmanaged and not available for direct investment and their returns do not reflect the fees and expenses that have been deducted from the Fund. |
1
n Value Line Centurion Fund | Annual Report |
Top Ten Holdings (As of 12/31/2004)
| Company | Percentage of Total Net Assets | ||
American Eagle Outfitters, Inc. | 1.20 | % | |
CKE Restaurants, Inc. | 1.14 | % | |
Tibco Software, Inc. | 1.12 | % | |
Kohls Corp. | 1.06 | % | |
Cognizant Technology Solutions Corp. Class “A” | 1.06 | % | |
Macromedia, Inc. | 1.06 | % | |
Itron, Inc. | 1.06 | % | |
Cendant Corp. | 1.06 | % | |
NVR, Inc. | 1.05 | % | |
SAPIENT Corp. | 1.05 | % |
Sector Weightings vs. Index (As of 12/31/04)
Average Annual Total Returns (For periods ended 12/31/2004)
| 1 Yr | 3 Yrs | 5 Yrs | 10 Yrs | Since Inception 11/18/1983 | ||||||
Value Line Centurion Fund | 11.51% | 0.89% | –5.54% | 9.38% | 10.31% | |||||
S&P 500 Index | 10.88% | 3.59% | –2.30% | 12.07% | 12.75% |
All performance data quoted is historical and the results represent past performance and neither guarantee nor predict future investment results. To obtain performance data current to the most recent month (availability within 7 business days of the most recent month end), please call us at (800) 221-3253 or visit our website at www.guardianinvestor.com. Current performance may be higher or lower than the performance quoted here. Investment return and principal value will fluctuate so that an investor’s shares, when redeemed, may be worth more or less than the original cost.
Total return figures are historical and assume the reinvestment of dividends and distributions and the deduction of all Fund expenses. The actual total returns for owners of variable annuity contracts or variable life insurance policies that provide for investment in the Fund will be lower to reflect separate account and contract/policy charges. The return figures shown do not reflect the deduction of taxes that a contractowner may pay on distributions or redemption of units.
2
n Value Line Centurion Fund | Annual Report |
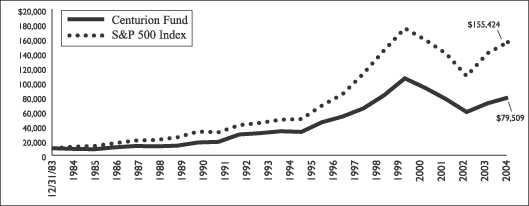
Growth of a Hypothetical $10,000 Investment
To give you a comparison, this chart shows you the performance of a hypothetical $10,000 investment made in the Fund and in the S&P 500 Index. Index returns do not include the fees and expenses of the Fund, but do include the reinvestment of dividends.
Fund Expenses
By investing in the Fund, you incur ongoing costs, including management fees; distribution and/or service (12b-1) fees; and other Fund expenses. These examples are intended to help you understand your ongoing costs (in dollars) of investing in the Fund and to compare these costs with the ongoing costs of investing in other underlying funds.
The examples are based on an investment of $1,000 invested on July 1, 2004 and held for six months ended December 31, 2004.
Shares of the Fund are not offered directly to the public. Instead, shares are currently issued and redeemed only in connection with investments in and payments under certain variable annuity and variable insurance contracts issued by Guardian Insurance and Annuity Company, Inc. The fees and expenses associated with the variable contracts are not included in these examples, and had such fees and expenses been included, your costs would have been higher. Please see your variable contract prospectus for more details on the fees associated with the variable contract.
Actual Expenses
The first table provides information about actual account values and actual expenses. You may use the information in this line, together with the amount you invested, to estimate the expenses that you paid over the period. Simply divide your account value by $1,000 (for example, an $8,600 account value divided by $1,000 = 8.6), then multiply the result by the number in the first line under the heading entitled “Expenses Paid During Period” to estimate the expenses you paid on your account during this period.
| Beginning Account Value July 1, 2004 | Ending Account Value Dec. 31, 2004 | Expenses Paid During the Period July 1, 2004 - Dec. 31, 20041 | |||||||
Value Line Centurion Fund | $ | 1,000.00 | $ | 1,075.40 | $ | 4.96 | |||
| 1 | Expenses are equal to the Fund’s annualized expense ratio of .95%, multiplied by the average account value over the period, multiplied by 184/366 (to reflect the Fund’s most recent fiscal half-year). |
3
n Value Line Centurion Fund | Annual Report |
Hypothetical Example for Comparison Purposes
This second table provides information about hypothetical account values and hypothetical expenses based on the Fund’s actual expense ratio and an assumed rate of return of 5% per year before expenses, which is not the Fund’s actual return. The hypothetical account values and expenses may not be used to estimate the actual ending account balance or expenses you paid for the period. You may use this information to compare the ongoing costs of investing in the Fund and other funds. To do so, compare this 5% hypothetical example with the 5% hypothetical examples that appear in the shareholder reports of the other funds.
Please note that the expenses shown in the table are meant to highlight your ongoing costs and will not help you determine the relative total costs of owning different funds.
| Beginning Account Value July 1, 2004 | Ending Account Value Dec. 31, 2004 | Expenses Paid During the Period July 1, 2004 - Dec. 31, 20041 | |||||||
Value Line Centurion Fund | $ | 1,000.00 | $ | 1,020.36 | $ | 4.82 | |||
| 1 | Expenses are equal to the Fund’s annualized expense ratio of .95%, multiplied by the average account value over the period, multiplied by 184/366 (to reflect the Fund’s most recent fiscal half-year). |
4
| n | Value Line Centurion Fund, Inc. |
Schedule of Investments
December 31, 2004
| Common Stocks — 95.9% | |||||
| Shares | Value | ||||
| Aerospace/Defense — 2.0% | |||||
| 73,200 | Armor Holdings, Inc.* | $ | 3,441,864 | ||
| 88,700 | United Industrial Corp. | 3,436,238 | |||
| 6,878,102 | |||||
| Biotechnology — 1.0% | |||||
| 55,200 | Amgen Inc.* | 3,541,080 | |||
| Chemical–Basic — 2.0% | |||||
| 121,700 | Lyondell Chemical Company | 3,519,564 | |||
| 161,100 | Olin Corporation | 3,547,422 | |||
| 7,066,986 | |||||
| Chemical–Diversified — 1.0% | |||||
| 61,600 | Eastman Chemical Company | 3,556,168 | |||
| Coal — 2.1% | |||||
| 84,500 | Joy Global Inc. | 3,669,835 | |||
| 44,100 | Peabody Energy Corp. | 3,568,131 | |||
| 7,237,966 | |||||
| Computer & Peripherals — 3.1% | |||||
| 55,300 | Apple Computer, Inc.* | 3,561,320 | |||
| 84,800 | Dell, Inc.* | 3,573,472 | |||
| 110,500 | Network Appliance, Inc.* | 3,670,810 | |||
| 10,805,602 | |||||
| Computer Software & Services — 13.1% | |||||
| 56,600 | Adobe Systems, Inc. | 3,551,084 | |||
| 59,500 | Affiliated Computer Services, Inc.* | 3,581,305 | |||
| 85,400 | Anteon International Corp.* | 3,574,844 | |||
| 94,400 | Autodesk, Inc.* | 3,582,480 | |||
| 51,900 | CACI International Inc.* | 3,535,947 | |||
| 141,700 | Citrix Systems, Inc.* | 3,475,901 | |||
| 87,700 | Cognizant Technology Solutions Corp. Class “A”* | 3,712,341 | |||
| 82,300 | Cognos Inc.* | 3,626,138 | |||
| 119,200 | Macromedia, Inc.* | 3,709,504 | |||
| 64,000 | Mercury Interactive Corp.* | 2,915,200 | |||
| 259,700 | Oracle Corp.* | 3,563,084 | |||
| 174,000 | RSA Security Inc.* | 3,490,440 | |||
| 83,100 | SEI Investments Company | 3,484,383 | |||
| 45,802,651 | |||||
| Diversified Companies — 1.4% | |||||
| 158,200 | Cendant Corp. | 3,698,716 | |||
| 40,000 | Park-Ohio Holdings Corp.* | 1,036,000 | |||
| 4,734,716 | |||||
| E-Commerce — 4.1% | |||||
| 153,600 | Internet Security Systems, Inc.* | 3,571,200 | |||
| 466,000 | Sapient Corporation* | 3,686,060 | |||
| 293,200 | TIBCO Software, Inc.* | 3,911,288 | |||
| 66,000 | Websense, Inc.* | 3,347,520 | |||
| 14,516,068 | |||||
| Educational Services — 1.2% | |||||
| 53,700 | Bright Horizons Family Solutions, Inc.* | 3,477,612 | |||
| 12,600 | ITT Educational Services, Inc.* | 599,130 | |||
| 4,076,742 | |||||
| Shares | Value | ||||
| Electrical Equipment — 3.0% | |||||
| 58,200 | Garmin Ltd. | $ | 3,540,888 | ||
| 72,200 | Rockwell Automation, Inc. | 3,577,510 | |||
| 111,000 | Thomas & Betts Corp.* | 3,413,250 | |||
| 10,531,648 | |||||
| Electrical Utility–Central — 1.0% | |||||
| 54,900 | TXU Corp. | 3,544,344 | |||
| Electronics — 2.0% | |||||
| 27,900 | Harman International Industries, Inc. | 3,543,300 | |||
| 137,100 | Intermagnetics General Corp.* | 3,483,711 | |||
| 7,027,011 | |||||
| Financial Services–Diversified — 0.9% | |||||
| 57,000 | SLM Corp. | 3,043,230 | |||
| Food Wholesalers — 0.5% | |||||
| 50,000 | Nash Finch Company | 1,888,000 | |||
| Home Appliance — 1.0% | |||||
| 41,300 | Black & Decker Corp. (The) | 3,648,029 | |||
| Homebuilding — 3.3% | |||||
| 16,000 | Beazer Homes USA, Inc. | 2,339,360 | |||
| 17,400 | KB Home | 1,816,560 | |||
| 4,800 | NVR, Inc.* | 3,693,120 | |||
| 53,700 | Toll Brothers, Inc.* | 3,684,357 | |||
| 11,533,397 | |||||
| Hotel/Gaming — 1.0% | |||||
| 63,800 | Station Casinos, Inc. | 3,488,584 | |||
| Human Resources — 1.0% | |||||
| 164,900 | Korn/Ferry International* | 3,421,675 | |||
| Industrial Services — 1.0% | |||||
| 63,700 | C.H. Robinson Worldwide, Inc. | 3,536,624 | |||
| Information Services — 2.0% | |||||
| 96,300 | Advisory Board Co. (The)* | 3,551,544 | |||
| 61,500 | FactSet Research Systems, Inc. | 3,594,060 | |||
| 7,145,604 | |||||
| Internet — 2.1% | |||||
| 31,200 | eBay, Inc.* | 3,627,936 | |||
| 95,100 | Yahoo! Inc.* | 3,583,368 | |||
| 7,211,304 | |||||
| Maritime — 1.0% | |||||
| 199,400 | OMI Corporation | 3,359,890 | |||
| Medical Services — 3.6% | |||||
| 28,400 | Aetna Inc. | 3,542,900 | |||
| 106,900 | American Healthways, Inc.* | 3,531,976 | |||
| 127,200 | Community Health Systems, Inc.* | 3,546,336 | |||
| 24,000 | UnitedHealth Group Inc. | 2,112,720 | |||
| 12,733,932 | |||||
| Medical Supplies — 3.1% | |||||
| 100,400 | Affymetrix, Inc.* | 3,669,620 | |||
| 58,800 | Biosite, Inc.* | 3,618,552 | |||
| 129,600 | Cytyc Corp.* | 3,573,072 | |||
| 10,861,244 | |||||
| Natural Gas–Diversified — 2.0% | |||||
| 70,100 | Southwestern Energy Co.* | 3,553,369 | |||
| 100,000 | XTO Energy, Inc. | 3,538,000 | |||
| 7,091,369 | |||||
See notes to financial statements.
5
| n | Value Line Centurion Fund, Inc. |
Schedule of Investments (Continued)
December 31, 2004
| Shares | Value | ||||
| Oilfield Services/Equipment — 1.0% | |||||
| 88,400 | Cal Dive International, Inc.* | $ | 3,602,300 | ||
| Paper & Forest Products — 1.0% | |||||
| 104,700 | MeadWestvaco Corp. | 3,548,283 | |||
| Petroleum–Producing — 1.0% | |||||
| 72,800 | Berry Petroleum Co. Class “A” | 3,472,560 | |||
| Pharmacy Services — 1.0% | |||||
| 91,400 | Walgreen Co. | 3,507,018 | |||
| Power Industry — 0.7% | |||||
| 83,700 | Headwaters, Inc.* | 2,385,450 | |||
| Precision Instrument — 1.3% | |||||
| 20,000 | Kronos Inc.* | 1,022,600 | |||
| 83,700 | II-VI, Inc.* | 3,556,413 | |||
| 4,579,013 | |||||
| Railroad — 2.1% | |||||
| 59,400 | Canadian National Railway Co. | 3,638,250 | |||
| 98,300 | Norfolk Southern Corp. | 3,557,477 | |||
| 7,195,727 | |||||
| Restaurant — 2.2% | |||||
| 275,600 | CKE Restaurants, Inc.* | 3,998,956 | |||
| 62,700 | P.F. Chang’s China Bistro, Inc.* | 3,533,145 | |||
| 7,532,101 | |||||
| Retail Building Supply — 2.0% | |||||
| 91,000 | Building Materials Holding Corp. | 3,484,390 | |||
| 83,300 | Home Depot, Inc. (The) | 3,560,242 | |||
| 7,044,632 | |||||
| Retail–Special Lines — 4.9% | |||||
| 80,200 | Aeropostale, Inc.* | 2,360,286 | |||
| 89,200 | American Eagle Outfitters, Inc. | 4,201,320 | |||
| 90,000 | Bed Bath & Beyond Inc.* | 3,584,700 | |||
| 118,800 | Quiksilver, Inc.* | 3,539,052 | |||
| 81,500 | Urban Outfitters, Inc.* | 3,618,600 | |||
| 17,303,958 | |||||
| Retail Store — 3.1% | |||||
| 74,600 | Costco Wholesale Corp. | 3,611,386 | |||
| 75,800 | Kohl’s Corp.* | 3,727,086 | |||
| 88,500 | Penney (J.C.) Co., Inc. | 3,663,900 | |||
| 11,002,372 | |||||
| Semiconductor — 1.0% | |||||
| 91,200 | Cree, Inc.* | 3,655,296 | |||
| Steel–General — 3.9% | |||||
| 60,000 | Carpenter Technology Corp. | 3,507,600 | |||
| 72,100 | Commercial Metals Co. | 3,645,376 | |||
| 65,800 | Nucor Corp. | 3,443,972 | |||
| 114,800 | Steel Technologies Inc. | 3,158,148 | |||
| 13,755,096 | |||||
| Steel–Integrated — 1.0% | |||||
| 236,300 | AK Steel Holding Corp.* | 3,419,261 | |||
| Telecommunications Equipment — 3.0% | |||||
| 131,800 | Juniper Networks, Inc.* | 3,583,642 | |||
| 99,700 | Marvell Technology Group Ltd.* | 3,536,359 | |||
| 79,500 | QUALCOMM Incorporated | 3,370,800 | |||
| 10,490,801 | |||||
| Shares | Value | |||||
| Telecommunication Services — 1.0% | ||||||
| 121,700 | Western Wireless Corp. Class “A”* | $ | 3,565,810 | |||
| Toiletries/Cosmetics — 0.0% | ||||||
| 4,100 | Chattem, Inc.* | 135,710 | ||||
| Trucking — 4.1% | ||||||
| 78,100 | Arkansas Best Corp. | 3,505,909 | ||||
| 161,800 | Heartland Express, Inc. | 3,635,646 | ||||
| 79,100 | Hunt (J.B.) Transport Services, Inc. | 3,547,635 | ||||
| 64,200 | Yellow Roadway Corp.* | 3,576,582 | ||||
| 14,265,772 | ||||||
| Wireless Networking — 2.1% | ||||||
| 155,000 | Itron, Inc.* | 3,706,050 | ||||
| 42,200 | Research In Motion Ltd.* | 3,478,124 | ||||
| 7,184,174 | ||||||
Total Common Stocks and Total Investment Securities — 95.9% | 335,927,300 | |||||
| Repurchase Agreements — 9.1% (including accrued interest) | ||||||
| Principal Amount | Value | |||||
| $ 14,000,000 | Collateralized by $11,693,000 U.S. Treasury Bonds, 6.375%, due 8/15/27, with a value of $14,292,865 (with UBS Warburg LLC, 1.50%, dated 12/31/04, due 1/3/05, delivery value $14,001,750) | $ | 14,000,583 | |||
| 10,000,000 | Collateralized by $9,215,000 U.S. Treasury Notes, 9.375%, due 2/15/06, with a value of $10,204,173 (with Morgan Stanley, 1.40%, dated 12/31/04, due 1/3/05, delivery value $10,001,166) | 10,000,389 | ||||
| 8,000,000 | Collateralized by $5,740,000 U.S. Treasury Notes, 12.50%, due 8/15/14, with a value of $8,174,119 (with State Street Bank & Co. Trust, 1.45%, dated 12/31/04, due 1/3/05, delivery value $8,000,967) | 8,000,322 | ||||
Total Repurchase Agreements | 32,001,294 | |||||
| Excess of Liabilities Over Cash and Other Assets — (5.0%) | (17,519,937 | ) | ||||
| Net Assets — 100.0% | $ | 350,408,657 | ||||
| Net Asset Value Per Outstanding Share ($350,408,657÷17,312,796 shares outstanding) | $ | 20.24 | ||||
| * | Non-income producing security. |
See notes to financial statements.
6
| n | Value Line Centurion Fund, Inc. |
Statement of Assets and Liabilities
December 31, 2004
ASSETS: | |||
Investment securities, at value (cost $301,840,403) | $ | 335,927,300 | |
Repurchase agreements (cost $32,001,294) | 32,001,294 | ||
Cash | 120,783 | ||
Receivable for securities sold | 22,040,821 | ||
Dividends receivable | 166,580 | ||
Prepaid insurance expense | 8,140 | ||
Receivable for capital shares sold | 41,384 | ||
Total Assets | 390,306,302 | ||
LIABILITIES: | |||
Payable for securities purchased | 39,416,101 | ||
Payable for capital shares repurchased | 157,256 | ||
Accrued expenses: | |||
Advisory fee | 147,549 | ||
Service and distribution plan fees | 118,039 | ||
Other | 58,700 | ||
Total Liabilities | 39,897,645 | ||
Net Assets | $ | 350,408,657 | |
NET ASSETS CONSIST OF: | |||
Capital stock, at $1.00 par value (authorized 50,000,000, outstanding 17,312,796 shares) | $ | 17,312,796 | |
Additional paid-in capital | 268,016,842 | ||
Undistributed net investment income | 5,565 | ||
Accumulated net realized gain on investments | 30,986,557 | ||
Net unrealized appreciation of investments | 34,086,897 | ||
Net Assets | $ | 350,408,657 | |
Net Asset Value Per Outstanding Share ($350,408,657 ÷ 17,312,796 shares outstanding) | $20.24 | ||
Statement of Operations
Year Ended
December 31, 2004
INVESTMENT INCOME: | ||||
Dividends (Net of foreign tax of $19, 294) | $ | 2,145,448 | ||
Interest | 198,324 | |||
Total Income | 2,343,772 | |||
Expenses: | ||||
Advisory fee | 1,707,260 | |||
Service and distribution plan fees | 1,365,808 | |||
Auditing and legal fees | 61,328 | |||
Custodian fees | 50,922 | |||
Insurance | 38,506 | |||
Directors’ fees and expenses | 20,920 | |||
Other | 15,815 | |||
Total Expenses Before Custody Credits | 3,260,559 | |||
Less: Custody Credits | (2,541 | ) | ||
Net Expenses | 3,258,018 | |||
Net Investment Loss | (914,246 | ) | ||
NET REALIZED AND UNREALIZED GAIN (LOSS) ON INVESTMENTS: | ||||
Net realized gain | 52,024,708 | |||
Change in net unrealized appreciation | (14,245,468 | ) | ||
Net Realized Gain and Change in Net Unrealized Appreciation on Investments | 37,779,240 | |||
NET INCREASE IN NET ASSETS | $ | 36,864,994 | ||
See notes to financial statements.
7
| n | Value Line Centurion Fund, Inc. |
Statements of Changes in Net Assets
| Years Ended December 31, | ||||||||
| 2004 | 2003 | |||||||
Operations: | ||||||||
Net investment loss | $ | (914,246 | ) | $ | (633,541 | ) | ||
Net realized gain on investments | 52,024,708 | 48,416,930 | ||||||
Change in net unrealized appreciation | (14,245,468 | ) | 12,000,159 | |||||
Net increase in net assets from operations | 36,864,994 | 59,783,548 | ||||||
Capital Share Transactions: | ||||||||
Proceeds from sale of shares | 10,476,991 | 13,366,869 | ||||||
Cost of shares repurchased | (52,368,057 | ) | (56,366,694 | ) | ||||
Net decrease from capital share transactions | (41,891,066 | ) | (42,999,825 | ) | ||||
Total (Decrease) Increase in Net Assets | (5,026,072 | ) | 16,783,723 | |||||
Net Assets: | ||||||||
Beginning of year | 355,434,729 | 338,651,006 | ||||||
End of year | $ | 350,408,657 | $ | 355,434,729 | ||||
Undistributed net investment income, at end of year | 5,565 | — | ||||||
See notes to financial statements.
8
| n | Value Line Centurion Fund, Inc. |
Notes to Financial Statements
December 31, 2004
1. Significant Accounting Policies
Value Line Centurion Fund, Inc. (the “Fund”) is an open-end diversified management investment company registered under the Investment Company Act of 1940, as amended, whose primary investment objective is long-term growth of capital. The Fund’s portfolio will usually consist of common stocks ranked 1 or 2 for year-ahead performance by The Value Line Investment Survey, one of the nation’s major investment advisory services.
The preparation of financial statements in conformity with generally accepted accounting principles requires management to make estimates and assumptions that affect the reported amounts of assets and liabilities and disclosure of contingent assets and liabilities at the date of the financial statements and the reported amounts of revenues and expenses during the reporting period. Actual results could differ from those estimates. The following is a summary of significant accounting policies consistently followed by the Fund in the preparation of its financial statements.
(A) Security Valuation
Securities listed on a securities exchange are valued at the closing sales price on the date as of which the net asset value is being determined. Securities traded on the NASDAQ Stock Market are valued at the NASDAQ Official Closing Price. In the absence of closing sales prices for such securities and for securities traded in the over-the-counter market, the security is valued at the midpoint between the latest available and representative asked and bid prices. Short-term instruments with maturities of 60 days or less are valued at amortized cost, which approximates market value. Short-term instruments with maturities greater than 60 days, at the date of purchase, are valued at the midpoint between the latest available and representative asked and bid prices, and commencing 60 days prior to maturity such securities are valued at amortized cost. Other assets and securities for which market valuations are not readily available are valued at fair value as the Board of Directors may determine in good faith. In addition, the Fund may use the fair value of a security when the closing market price on the primary exchange where the security is traded no longer accurately reflects the value of a security due to factors affecting one or more relevant securities markets or the specific issuer.
(B) Repurchase Agreements
In connection with transactions in repurchase agreements, the Fund’s custodian takes possession of the under
lying collateral securities, the value of which exceeds the principal amount of the repurchase transaction, including accrued interest. To the extent that any repurchase transaction exceeds one business day, the value of the collateral is marked-to-market on a daily basis to ensure the adequacy of the collateral. In the event of default of the obligation to repurchase, the Fund has the right to liquidate the collateral and apply the proceeds in satisfaction of the obligation. Under certain circumstances, in the event of default or bankruptcy by the other party to the agreement, realization and/or retention of the collateral or proceeds may be subject to legal proceedings.
(C) Federal Income Taxes
It is the Fund’s policy to comply with the requirements of the Internal Revenue Code applicable to regulated investment companies and to distribute all of its taxable income to its shareholders. Therefore, no federal income tax provision is required.
(D) Dividends and Distributions
It is the Fund’s policy to distribute to its shareholders, as dividends and as capital gains distributions, all the net investment income for the year and all net capital gains realized by the Fund, if any. Such distributions are determined in accordance with income tax regulations, which may differ from generally accepted accounting principles. All dividends or distributions will be payable in shares of the Fund at the net asset value on the ex-dividend date. This policy is, however, subject to change at any time by the Board of Directors.
(E) Investments
Securities transactions are recorded on a trade date basis. Realized gains and losses from securities transactions are recorded on the identified cost basis. Interest income on investments, adjusted for amortization of discount and premium, is earned from settlement date and recognized on the accrual basis. Dividend income is recorded on the ex-dividend date.
(F) Representations and Indemnifications
In the normal course of business the Fund enters into contracts that contain a variety of representations and warranties which provide general indemnifications. The Fund’s maximum exposure under these arrangements is unknown, as this would involve future claims that may be made against the Fund that have not yet occurred. However, based on experience, the Fund expects the risk of loss to be remote.
9
| n | Value Line Centurion Fund, Inc. |
Notes to Financial Statements (Continued)
December 31, 2004
| 2. Capital | Share Transactions, Dividends and Distributions |
Shares of the Fund are available to the public only through the purchase of certain contracts issued by The Guardian Insurance and Annuity Company, Inc. (GIAC). Transactions in capital stock were as follows:
| Year Ended December 31, 2004 | Year Ended December 31, 2003 | |||||
Shares sold | 562,185 | 806,744 | ||||
Shares repurchased | (2,832,967 | ) | (3,514,933 | ) | ||
Net decrease | (2,270,782 | ) | (2,708,189 | ) | ||
3. Purchases and Sales of Securities
Purchases and sales of investment securities, excluding short-term investments, were as follows:
| Year Ended December 31, 2004 | |||
PURCHASES: | |||
Investment Securities | $ | 612,183,432 | |
SALES: | |||
Investment Securities | $ | 650,974,712 | |
4. Income Taxes
At December 31, 2004, information on the tax components of capital is as follows:
Cost of investments for tax purposes | $ | 334,004,079 | ||
Gross tax unrealized appreciation | $ | 36,100,293 | ||
Gross tax unrealized depreciation | (2,175,778 | ) | ||
Net tax unrealized appreciation on Investments | $ | 33,924,515 | ||
Undistributed long-term gain | $ | 31,154,504 | ||
Net realized gains/losses differ for financial statement and tax purposes primarily due to differing treatments of wash sales. During the year ended December 31, 2004, the Fund utilized its carryforward loss of $20,383,341.
Permanent book-tax differences are reclassified within the composition of net asset accounts. During the year ended December 31, 2004, the Fund reclassified $939,046 from accumulated net investment loss to additional paid-in-capital and $19,235 from net investment income to realized gain. Net assets were not affected by this reclassification.
| 5. Investment | Advisory Contract, Management Fees and Transactions with Interested Parties |
An advisory fee of $1,707,260 was paid or payable to Value Line, Inc. (the “Adviser”), the Fund’s investment adviser, for the year ended December 31, 2004. This was computed at the rate of 1/2 of 1% of the average daily net assets of the Fund during the period and paid monthly. The Adviser provides research, investment programs, supervision of the investment portfolio and pays costs of administrative services, office space, equipment and compensation of administrative, bookkeeping, and clerical personnel necessary for managing the affairs of the Fund. The Adviser also provides persons, satisfactory to the Fund’s Board of Directors, to act as officers and employees of the Fund and pays their salaries and wages. The Fund bears all other costs and expenses.
The Fund has a Service and Distribution Plan (the “Plan”) adopted pursuant to Rule 12b-1 under the Investment Company Act of 1940, for the payment of certain expenses incurred by Value Line Securities, Inc. (the “Distributor”), a wholly-owned subsidiary of the Adviser, in advertising, marketing and distributing the Fund’s shares and for servicing the Fund’s shareholders at an annual rate of 0.40% of the Fund’s average daily net assets. For the year ended December 31, 2004, fees amounting to $1,365,808 were paid or payable to the Distributor under this plan.
For the year ended December 31, 2004, the Fund’s expenses were reduced by $2,541 under a custody credit arrangement with the Custodian.
Certain officers and directors of the Adviser and Value Line Securities, Inc. (the “Distributor” and a registered broker/dealer) are also officers and directors of the Fund. During the year ended December 31, 2004 the Fund paid brokerage commissions totaling $514,656 to the Distributor which clears its transactions through unaffiliated brokers.
10
| n | Value Line Centurion Fund, Inc. |
Financial Highlights
Selected data for a share of capital stock outstanding throughout each year:
| Years Ended December 31, | |||||||||||||||
| 2004 | 2003 | 2002 | 2001 | 2000 | |||||||||||
Net asset value, beginning of year | $18.15 | $15.19 | $19.71 | $27.25 | $36.09 | ||||||||||
Income from investment operations: | |||||||||||||||
Net investment (loss) income | (.05 | ) | (.03 | ) | (.01 | ) | .05 | .04 | |||||||
Net gains (loss) on securities (both realized and unrealized) | 2.14 | 2.99 | (4.51 | ) | (4.48 | ) | (3.69 | ) | |||||||
Total from investment operations | 2.09 | 2.96 | (4.52 | ) | (4.43 | ) | (3.65 | ) | |||||||
Less distributions: | |||||||||||||||
Dividends from net investment income | — | — | — | (.04 | ) | (.03 | ) | ||||||||
Distributions from net realized gains | — | — | — | (3.00 | ) | (5.16 | ) | ||||||||
Tax return of capital | — | — | — | (.07 | ) | — | |||||||||
Total distributions | — | — | — | (3.11 | ) | (5.19 | ) | ||||||||
Net asset value, end of year | $20.24 | $18.15 | $15.19 | $19.71 | $27.25 | ||||||||||
Total return** | 11.51 | % | 19.49 | % | (22.93 | )% | (16.35 | )% | (12.47 | )% | |||||
Ratios/supplemental data: | |||||||||||||||
Net assets, end of year (in thousands) | $350,409 | $355,435 | $338,651 | $523,803 | $733,303 | ||||||||||
Ratio of expenses to average net assets (1) | .95 | % | .99 | % | .76 | % | .59 | % | .59 | % | |||||
Ratio of net investment (loss) income | (.27 | )% | (0.19 | )% | (0.06 | )% | 0.20 | % | 0.12 | % | |||||
Portfolio turnover rate | 187 | % | 129 | % | 126 | % | 141 | % | 76 | % | |||||
| ** | Total returns do not reflect the effects of charges deducted under the terms of GIAC’s variable contracts. Including such charges would reduce the total returns for all periods shown. |
| (1) | Ratio reflects expenses grossed up for custody credit arrangement. The ratio of expenses to average net assets net of custody credits would not have changed. |
11
| n | Value Line Centurion Fund, Inc. |
Report of Independent Registered
Public Accounting Firm
To the Board of Directors and Shareholders of
Value Line Centurion Fund, Inc.
In our opinion, the accompanying statement of assets and liabilities, including the schedule of investments, and the related statements of operations and of changes in net assets and the financial highlights present fairly, in all material respects, the financial position of Value Line Centurion Fund, Inc. (the “Fund”) at December 31, 2004, the results of its operations for the year then ended, the changes in its net assets for each of the two years in the period then ended and the financial highlights for each of the five years in the period then ended, in conformity with accounting principles generally accepted in the United States of America. These financial statements and financial highlights (hereafter referred to as “financial statements”) are the responsibility of the Fund’s management; our responsibility is to express an opinion on these financial statements based on our audits. We conducted our audits of these financial statements in accordance with the standards of the Public Company Accounting Oversight Board (United States). Those standards require that we plan and perform the audit to obtain reasonable assurance about whether the financial statements are free of material misstatement. An audit includes examining, on a test basis, evidence supporting the amounts and disclosures in the financial statements, assessing the accounting principles used and significant estimates made by management, and evaluating the overall financial statement presentation. We believe that our audits, which included confirmation of securities at December 31, 2004 by correspondence with the custodian and brokers, provide a reasonable basis for our opinion.
PricewaterhouseCoopers LLP
New York, New York
February 15, 2005
12
| n | Value Line Centurion Fund |
Management Information
The following table sets forth information on each Director and Officer of the Fund. Each Director serves as a director or trustee of each of the 14 Value Line Funds and oversees a total of 15 portfolios. Each Director serves until his or her successor is elected and qualified.
| Name, Address, And Age | Position | Length of Time Served | Principal Occupation During the Past 5 Years | Other Directorships Held by Director | ||||
Interested Directors* | ||||||||
| Jean Bernhard Buttner Age 70 | Chairman of the Board of Directors and President | Since 1983 | Chairman, President and Chief Executive Officer of Value Line, Inc. (the “Adviser”) and Value Line Publishing, Inc.; Chairman and President of each of the 14 Value Line Funds and Value Line Securities Inc. (the “Distributor”) | Value Line, Inc. | ||||
| Marion N. Ruth 5 Outrider Road Rolling Hills, CA 90274 Age 70 | Director | Since 2000 | Real Estate Executive: President, Ruth Realty (real estate broker); Director of the Adviser since 2000. | None | ||||
Non-Interested Directors | ||||||||
| John W. Chandler 1611 Cold Spring Rd. Williamstown, MA 01267 Age 81 | Director | Since 1991 | Consultant, Academic Search Consultation Service, Inc.; Trustee Emeritus and Chairman (1993-1994) of the Board of Trustees of Duke University; President Emeritus, Williams College. | None | ||||
| Frances T. Newton 4921 Buckingham Drive Charlotte, NC 28209 Age 63 | Director | Since 2000 | Customer Support Analyst, Duke Power Company. | None | ||||
| Francis Oakley 54 Scott Hill Road Williamstown, MA 01267 Age 73 | Director | Since 2000 | Professor of History, Williams College, 1961 to present. President Emeritus since 1994 and President, 1985-1994; Chairman (1993-1997) and Interim President (2002) of the American Council of Learned Societies. | Berkshire Life Insurance Company of America | ||||
| David H. Porter 5 Birch Run Drive Saratoga Springs, NY 12866 Age 69 | Director | Since 1997 | Visiting Professor of Classics, Williams College, since 1999; President Emeritus, Skidmore College since 1999 and President, 1987-1998. | None | ||||
| Paul Craig Roberts 169 Pompano St. Panama City Beach, FL 32413 Age 66 | Director | Since 1983 | Chairman, Institute for Political Economy. | A. Schulman Inc. (plastics) | ||||
| Nancy-Beth Sheerr 1409 Beaumont Drive Gladwyne, PA 19035 Age 56 | Director | Since 1996 | Senior Financial Advisor, Hawthorne, Since 2001; Chairman, Radcliffe College Board of Trustees, 1990-1999. | None | ||||
| * | Mrs. Buttner is an “interested person" as defined in the Investment company Act of 1940 by virtue of her positions with the Adviser and her indirect ownership of a controlling interest in the Adviser; Mrs. Ruth is an interested person by virtue of having been a director of the Adviser. Unless otherwise indicated, the address for each of the above is 220 East 42nd Street, New York, NY 10017. |
13
| n | Value Line Centurion Fund |
Management Information (Continued)
| Name, Address, And Age | Position | Length of Time Served | Principal Occupation During the Past 5 Years | |||
Officers | ||||||
| Sigourney B. Romaine Age 61 | Vice President | Since 2003 | Portfolio Manager with the Adviser since 2002; Securities Analyst with the Adviser, 1996-2002. | |||
| John J. Koller Age 36 | Vice President | Since 2004 | Portfolio Manager with the Adviser since 2004; Security Analyst with the Adviser, 2000-2004. | |||
| David T. Henigson Age 46 | Vice President, Secretary and Treasurer | Since 1994 | Director, Vice President and Compliance Officer of the Adviser. Director and Vice President of the Distributor. Vice President, Secretary Treasurer and Chief Compliance Officer of each of the 14 Value Line Funds. | |||
14
| n | Value Line Centurion Fund |
Proxy Voting
A description of the policies and procedures that the Fund uses to determine how to vote proxies relating to portfolio securities is available without charge upon request by calling 1-800-243-2729 or on the SEC’s website (http://www.sec.gov). Information regarding how the Fund voted proxies relating to portfolio securities during the most recent 12-month period ended June 30 is also available on the SEC’s website at http://www.sec.gov or at the Fund’s website at http://vlfunds.com.
15
Item 2. Code of Ethics
(a) The Registrant has adopted a Code of Ethics that applies to its principal executive officer, and principal financial officer and principal accounting officer.
(f) Pursuant to item 12(a), the Registrant is attaching as an exhibit a copy of its Code of Ethics that applies to its principal executive officer, and principal financial officer and principal accounting officer.
Item 3. Audit Committee Financial Expert.
(a)(1) The Registrant has an Audit Committee Financial Expert serving on its Audit Committee.
(2) The Registrant’s Board has designated John W. Chandler, a member of the Registrant’s Audit Committee, as the Registrant’s Audit Committee Financial Expert. Mr. Chandler is an independent director who is a senior consultant with Academic Search Consultation Service. He spent most of his professional career at Williams College, where he served as a faculty member, Dean of the Faculty, and President (1973-85). He
also served as President of Hamilton College (1968-73), and as President of the Association of American Colleges and Universities (1985-90). He has also previously served as Trustee Emeritus and Chairman of the Board of Trustees of Duke University.
A person who is designated as an “audit committee financial expert” shall not make such person an “expert” for any purpose, including without limitation under Section 11 of the Securities Act of 1933 or under applicable fiduciary laws, as a result of being designated or identified as an audit committee financial expert. The designation or identification of a person as an audit committee financial expert does not impose on such person any duties, obligations, or liabilities that are greater than the duties, obligations, and liabilities imposed on such person as a member of the audit committee and Board of Trustees in the absence of such designation or identification.
Item 4. Principal Accountant Fees and Services
(a) Audit Fees 2004 - $8,891; Audit Fees 2003 - $29,140.
(b) Audit-Related fees – None.
(c) Tax Preparation Fees 2004 -$3,040; Tax Preparation Fees 2003 - $6,840.
(d) All Other Fees – None
| (e) (1) | Audit Committee Pre-Approval Policy. All services to be performed for the Registrant by PricewaterhouseCoopers LLP must be pre-approved by the audit committee. All services performed during 2004 and 2003 were pre-approved by the committee. |
| (e) (2) | Not applicable. |
(f) Not applicable.
(g) Aggregate Non-Audit Fees 2004 -$3,040; Aggregate Non-Audit Fees 2003- $6,840.
(h) Not applicable.
Item 11. Controls and Procedures.
| (a) | The registrant’s principal executive officer and principal financial officer have concluded that the registrant’s disclosure controls and procedures (as defined in rule 30a-2(c) under the Act (17 CFR 270.30a-2(c) ) based on their evaluation of these controls and procedures as of a date within 90 days of the filing date of this report, are appropriately designed to ensure that material information relating to the registrant is made known to such officers and are operating effectively. |
| (b) | The registrant’s principal executive officer and principal financial officer have determined that there have been no significant changes in the registrant’s internal controls or in other factors that could significantly affect these controls subsequent to the date of their evaluation, including corrective actions with regard to significant deficiencies and material weaknesses. |
Item 12. Exhibits.
| (a) | Code of Business Conduct and Ethics for Principal Executive and Senior Financial Officers attached hereto as Exhibit 100.COE |
| (b) | (1) Certification pursuant to Rule 30a-2(a) under the Investment Company Act of 1940 (17 CFR 270.30a-2) attached hereto as Exhibit 99.CERT. |
| (2) | Certification pursuant to Section 906 of the Sarbanes-Oxley Act of 2002 attached hereto as Exhibit 99.906.CERT. |
SIGNATURES
Pursuant to the requirements of the Securities Exchange Act of 1934 and the Investment Company Act of 1940, the registrant has duly caused this report to be signed on its behalf by the undersigned, thereunto duly authorized.
By | /s/ Jean B. Buttner | |
Jean B. Buttner, President | ||
Date: March 04, 2005 | ||
Pursuant to the requirements of the Securities Exchange Act of 1934 and the Investment Company Act of 1940, this report has been signed below by the following persons on behalf of the registrant and in the capacities and on the dates indicated.
By: | /s/ Jean B. Buttner | |
Jean B. Buttner, President, Principal Executive Officer |
By: | /s/ David T. Henigson | |
David T. Henigson, Vice President, Treasurer, Principal Financial Officer | ||
Date: March 4, 2005 | ||