UNITED STATES SECURITIES AND EXCHANGE COMMISSION Washington, D.C. 20549
FORM N-CSR
CERTIFIED SHAREHOLDER REPORT OF REGISTERED
MANAGEMENT INVESTMENT COMPANIES
Investment Company Act file number 811-3855
Fidelity Advisor Series VIII (Exact name of registrant as specified in charter)
82 Devonshire St., Boston, Massachusetts 02109 (Address of principal executive offices) (Zip code)
Eric D. Roiter, Secretary
82 Devonshire St.
Boston, Massachusetts 02109 (Name and address of agent for service)
Registrant's telephone number, including area code: 617-563-7000
Date of fiscal year end:
October 31
Date of reporting period:
April 30, 2006
Item 1. Reports to Stockholders
Fidelity®Advisor Emerging Markets Fund Class A, Class T, Class B and Class C
Semiannual Report April 30, 2006
Contents
Chairman’s Message
3
Ned Johnson’s message to shareholders.
Shareholder Expense
4
An example of shareholder expenses.
Example
Investment Changes
6
A summary of major shifts in the fund’s
investments over the past six months.
Investments
7
A complete list of the fund’s investments
with their market values.
Financial Statements
18
Statements of assets and liabilities,
operations, and changes in net assets,
as well as financial highlights.
Notes
27
Notes to the financial statements.
Board Approval of
35
Investment Advisory
Contracts and
Management Fees
To view a fund’s proxy voting guidelines and proxy voting record for the 12-month period ended June 30, visit www.fidelity.com/proxyvotingresults or visit the Securities and Exchange Commission’s (SEC) web site at www.sec.gov. You may also call 1-877-208-0098 to request a free copy of the proxy voting guidelines.
Standard & Poor’s, S&P and S&P 500 are registered service marks of The McGraw-Hill Companies, Inc. and have been licensed for use by Fidelity Distributors Corporation.
Other third party marks appearing herein are the property of their respective owners. All other marks appearing herein are registered or unregistered trademarks or service marks of FMR Corp. or an affiliated company.
This report and the financial statements contained herein are submitted for the general information of the shareholders of the fund. This report is not authorized for distribution to prospective investors in the fund unless preceded or accompanied by an effective prospectus.
A fund files its complete schedule of portfolio holdings with the SEC for the first and third quarters of each fiscal year on Form N-Q. Forms N-Q are available on the SEC’s web site at http://www.sec.gov. A fund’s Forms N-Q may be reviewed and copied at the SEC’s Public Reference Room in Washington, DC. Information regarding the operation of the SEC’s Public Reference Room may be obtained by calling 1-800-SEC-0330. For a complete list of a fund’s portfolio holdings, view the most recent quarterly holdings report, semiannual report, or annual report on Fidelity’s web site at http://www.advisor.fidelity.com.
NOT FDIC INSURED · MAY LOSE VALUE · NO BANK GUARANTEE
Neither the fund nor Fidelity Distributors Corporation is a bank.
Semiannual Report
2
Chairman’s Message
(photograph of Edward C. Johnson 3d) Dear Shareholder:
Although many securities markets made gains in early 2006, there is only one certainty when it comes to investing: There is no sure thing. There are, however, a number of time-tested, fundamental investment principles that can put the historical odds in your favor.
One of the basic tenets is to invest for the long term. Over time, riding out the markets’ inevitable ups and downs has proven much more effective than selling into panic or chasing the hottest trend. Even missing only a few of the markets’ best days can significantly diminish investor returns. Patience also affords the benefits of compounding — of earning interest on additional income or reinvested dividends and capital gains. There are tax advantages and cost benefits to consider as well. The more you sell, the more taxes you pay, and the more you trade, the higher the costs. While staying the course doesn’t eliminate risk, it can considerably lessen the effect of short-term declines.
You can further manage your investing risk through diversification. And today, more than ever, geographic diversification should be taken into account. Studies indicate that asset allocation is the single most important determinant of a portfolio’s long-term success. The right mix of stocks, bonds and cash —aligned to your particular risk tolerance and investment objective — is very important. Age-appropriate rebalancing is also an essential aspect of asset allocation. For younger investors, an emphasis on equities — which historically have been the best performing asset class over time — is encouraged. As investors near their specific goal, such as retirement or sending a child to college, consideration may be given to replacing volatile assets (e.g. common stocks) with more-stable fixed investments (bonds or savings plans).
A third investment principle — investing regularly — can help lower the average cost of your purchases. Investing a certain amount of money each month or quarter helps ensure you won’t pay for all your shares at market highs. This strategy — known as dollar cost averaging — also reduces unconstruc-tive “emotion” from investing, helping shareholders avoid selling weak performers just prior to an upswing, or chasing a hot performer just before a correction.
We invite you to contact us via the Internet, through our Investor Centers or over the phone. It is our privilege to provide you the information you need to make the investments that are right for you.
Sincerely,
/s/Edward C. Johnson 3d Edward C. Johnson 3d
3 Semiannual Report
Shareholder Expense Example
As a shareholder of the Fund, you incur two types of costs: (1) transaction costs, including sales charges (loads) on purchase payments or redemption proceeds, redemption fees, and (2) ongoing costs, including management fees, distribution and/or service (12b-1) fees and other Fund expenses. This Example is intended to help you understand your ongoing costs (in dollars) of investing in the Fund and to compare these costs with the ongoing costs of investing in other mutual funds.
The Example is based on an investment of $1,000 invested at the beginning of the period and held for the entire period (November 1, 2005 to April 30, 2006).
Actual Expenses
The first line of the table below for each class of the Fund provides information about actual account values and actual expenses. You may use the information in this line, together with the amount you invested, to estimate the expenses that you paid over the period. Simply divide your account value by $1,000.00 (for example, an $8,600 account value divided by $1,000.00 = 8.6), then multiply the result by the number in the first line for a class of the Fund under the heading entitled “Expenses Paid During Period” to estimate the expenses you paid on your account during this period.
Hypothetical Example for Comparison Purposes
The second line of the table below for each class of the Fund provides information about hypothetical account values and hypothetical expenses based on a Class’ actual expense ratio and an assumed rate of return of 5% per year before expenses, which is not the Class’ actual return. The hypothetical account values and expenses may not be used to estimate the actual ending account balance or expenses you paid for the period. You may use this information to compare the ongoing costs of investing in the Fund and other funds. To do so, compare this 5% hypothetical example with the 5% hypothetical examples that appear in the shareholder reports of the other funds.
Semiannual Report 4
Please note that the expenses shown in the table are meant to highlight your ongoing costs only and do not reflect any transaction costs. Therefore, the second line of the table is useful in comparing ongoing costs only, and will not help you determine the relative total costs of owning different funds. In addition, if these transactional costs were included, your costs would have been higher.
Expenses Paid
Beginning
Ending
During Period*
Account Value
Account Value
November 1, 2005
November 1, 2005
April 30, 2006
to April 30, 2006
Class A
Actual
$1,000.00
$1,449.20
$9.72
HypotheticalA
$1,000.00
$1,016.86
$8.00
Class T
Actual
$1,000.00
$1,447.30
$11.23
HypotheticalA
$1,000.00
$1,015.62
$9.25
Class B
Actual
$1,000.00
$1,443.90
$14.24
HypotheticalA
$1,000.00
$1,013.14
$11.73
Class C
Actual
$1,000.00
$1,443.10
$14.24
HypotheticalA
$1,000.00
$1,013.14
$11.73
Institutional Class
Actual
$1,000.00
$1,451.20
$8.20
HypotheticalA
$1,000.00
$1,018.10
$6.76
A 5% return per year before expenses
* Expenses are equal to each Class’ annualized expense ratio (shown in the table below); multiplied by the average account value over the period, multiplied by 181/365 (to reflect the one-half year period).
Annualized
Expense Ratio
Class A
1.60%
Class T
1.85%
Class B
2.35%
Class C
2.35%
Institutional Class
1.35%
5 Semiannual Report
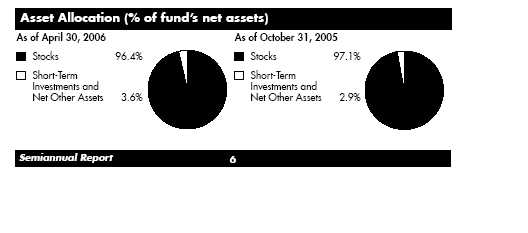
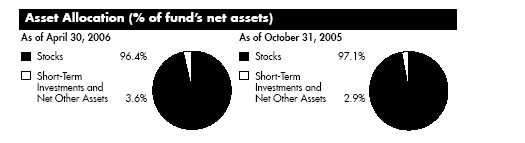
Investment Changes
Top Five Stocks as of April 30, 2006
% of fund’s
% of fund’s net assets
net assets
6 months ago
Samsung Electronics Co. Ltd. (Korea (South),
Semiconductors & Semiconductor Equipment)
4.7
5.6
Petroleo Brasileiro SA Petrobras (PN) (non-vtg.)
(Brazil, Oil, Gas & Consumable Fuels)
3.0
2.5
Lukoil Oil Co. sponsored ADR (Russia, Oil, Gas
& Consumable Fuels)
2.6
2.8
America Movil SA de CV Series L sponsored
ADR (Mexico, Wireless Telecommunication
Services)
2.2
3.1
Companhia Vale do Rio Doce (PN-A) sponsored
ADR (non-vtg.) (Brazil, Metals & Mining)
1.9
1.9
14.4
Top Five Market Sectors as of April 30, 2006
% of fund’s
% of fund’s net assets
net assets
6 months ago
Energy
18.4
14.3
Materials
15.5
10.5
Financials
14.9
20.2
Information Technology
14.7
17.1
Consumer Discretionary
10.3
10.3
Top Five Countries as of April 30, 2006
(excluding cash equivalents)
% of fund’s
% of fund’s net assets
net assets
6 months ago
Korea (South)
19.2
21.9
South Africa
12.7
9.8
Brazil
12.1
13.5
Russia
9.6
7.2
Taiwan
8.1
8.8
Percentages are adjusted for the effect of open futures contracts, if applicable.
Investments April 30, 2006 (Unaudited)
Showing Percentage of Net Assets
Common Stocks — 96.3%
Shares
Value (Note 1)
Argentina – 0.4%
Banco Macro Bansud SA sponsored ADR
5,100
$118,167
Inversiones y Representaciones SA sponsored GDR (a)
33,800
449,878
TOTAL ARGENTINA
568,045
Austria – 0.7%
Erste Bank der Oesterreichischen Sparkassen AG
3,400
206,330
Raiffeisen International Bank Holding AG
4,600
400,970
voestalpine AG
2,700
394,229
TOTAL AUSTRIA
1,001,529
Bermuda – 1.1%
Aquarius Platinum Ltd. (Australia)
31,300
450,337
Central European Media Enterprises Ltd. Class A (a)
8,000
515,280
Credicorp Ltd. (NY Shares)
7,900
214,090
Emperor International Holding Ltd.
292,000
71,180
Katanga Mining Ltd. (a)
40,700
253,010
Sinochem Hong Kong Holding Ltd.
195,200
83,082
TOTAL BERMUDA
1,586,979
Brazil – 12.1%
AES Tiete SA (PN) (non-vtg.)
3,193,600
89,901
Banco Bradesco SA:
(PN)
34,600
1,321,166
(PN) sponsored ADR (non-vtg.)
12,300
468,261
Banco do Brasil SA
6,800
195,496
Banco Itau Holding Financeira SA (PN) (non-vtg.)
18,070
579,591
Banco Nossa Caixa SA
7,700
173,776
Companhia Energetica de Minas Gerais (CEMIG) (PN)
sponsored ADR (non-vtg.)
11,500
544,985
Companhia Vale do Rio Doce:
(PN-A) sponsored ADR (non-vtg.)
62,000
2,757,760
sponsored ADR
4,900
252,448
CSU Cardsystem SA sponsored ADR (a)(c)
3,000
76,650
Cyrela Brazil Realty SA
28,900
491,591
Diagnosticos Da America SA (a)
11,100
283,483
Duratex SA (PN)
11,100
237,743
Itausa Investimentos Itau SA (PN)
63,700
292,403
Klabin Industria de Papel e Celulose (PN) (non-vtg.)
114,200
288,373
Localiza Rent a Car SA
26,700
562,913
Lojas Renner SA
11,700
669,933
Natura Cosmeticos SA
17,000
216,186
NET Servicos de Communicacao SA sponsored ADR
45,300
279,048
See accompanying notes which are an integral part of the financial statements.
7 Semiannual Report
Investments (Unaudited) continued
Common Stocks – continued
Shares
Value (Note 1)
Brazil – continued
Petroleo Brasileiro SA Petrobras:
(PN) (non-vtg.)
159,000
$3,529,693
(PN) sponsored ADR (non-vtg.)
8,200
728,898
sponsored ADR
5,900
583,097
Submarino SA
6,500
175,970
TAM SA:
(PN) (ltd.-vtg.)
8,600
222,108
(PN) sponsored ADR (ltd. vtg.)
8,800
221,320
Uniao de Bancos Brasileiros SA (Unibanco):
unit
28,100
445,668
GDR
9,200
730,020
Usinas Siderurgicas de Minas Gerais SA (Usiminas) (PN-A)
(non-vtg.)
22,900
869,037
Vivo Participacoes SA (PN) sponsored ADR
29,900
123,487
TOTAL BRAZIL
17,411,005
British Virgin Islands – 0.2%
Equator Exploration Ltd. (a)
36,100
223,353
Titanium Resources Group Ltd.
22,300
31,112
TOTAL BRITISH VIRGIN ISLANDS
254,465
Canada – 1.0%
Addax Petroleum Corp
4,400
117,753
Falcon Oil & Gas Ltd. (a)
189,000
579,848
First Quantum Minerals Ltd.
4,400
212,680
Pan American Silver Corp. (a)
4,900
121,404
SXR Uranium One, Inc. (a)
24,718
242,555
Valkyries Petroleum Corp. (a)
7,900
100,693
TOTAL CANADA
1,374,933
Cayman Islands – 1.2%
Foxconn International Holdings Ltd. (a)
309,900
667,500
FU JI Food & Catering Services Holdings Ltd.
100,800
210,615
Geely Automobile Holdings Ltd.
125,000
14,994
Lee & Man Paper Manufacturing Ltd.
136,000
199,966
Primeline Energy Holdings, Inc. (a)(d)
26,000
87,907
Primeline Energy Holdings, Inc. warrants 4/4/08 (a)(d)
13,000
29,189
Samson Holding Ltd.
207,900
115,302
SinoCom Software Group Ltd.
170,000
206,106
Xinao Gas Holdings Ltd.
239,000
220,403
TOTAL CAYMAN ISLANDS
1,751,982
See accompanying notes which are an integral part of the financial statements.
Semiannual Report 8
Common Stocks – continued
Shares
Value (Note 1)
China – 2.7%
Agile Property Holdings Ltd.
560,000
$433,364
Angang New Steel Co. Ltd. (H Shares)
109,200
95,069
Beijing Capital International Airport Co. Ltd. (H Shares)
323,100
187,527
China Gas Holdings Ltd. (a)
562,000
97,130
China National Building Materials Co. Ltd. (H Shares)
148,000
61,084
China Petroleum & Chemical Corp. (H Shares)
1,754,100
1,127,886
China Shenhua Energy Co. Ltd. (H Shares)
397,700
720,685
China Techfaith Wireless Communication Technology Ltd.
sponsored ADR
6,100
83,021
Dongfeng Motor Group Co. Ltd. (H Shares)
546,000
272,884
First Tractor Co. Ltd. Class H (a)
514,500
101,529
Golden Eagle Retail Group Ltd. (H Shares)
76,000
42,395
Li Ning Co. Ltd.
270,000
302,968
Shanghai Prime Machinery Co. Ltd. (H Shares)
30,000
11,221
Vision Grande Group Holdings Ltd.
36,000
37,145
Wumart Stores, Inc. (H Shares)
27,500
90,445
Xiamen International Port Co. Ltd. (H Shares)
556,600
139,270
Yantai Changyu Pioneer Wine Co. (B Shares)
42,300
139,612
TOTAL CHINA
3,943,235
Croatia – 0.2%
Pliva D.D. GDR
12,200
251,320
Cyprus – 0.1%
XXI Century Investments Public Ltd.
5,800
83,564
Czech Republic – 0.6%
Ceske Energeticke Zavody AS
24,200
829,224
Egypt – 1.0%
Commercial International Bank Ltd. sponsored GDR
15,400
200,354
Eastern Tobacco Co.
4,100
260,792
Misr International Bank SAE GDR
1,550
5,425
Orascom Construction Industries SAE:
GDR
4,420
358,020
GDR (c)
424
34,344
Orascom Hotels & Development (OHD)
20,054
136,969
Orascom Telecom SAE GDR
9,115
489,476
TOTAL EGYPT
1,485,380
Hong Kong – 2.5%
Chaoda Modern Agriculture (Holdings) Ltd.
772,000
537,681
China Mobile (Hong Kong) Ltd.
276,700
1,597,112
China Overseas Land & Investment Ltd.
288,300
184,062
CNOOC Ltd.
790,800
637,471
See accompanying notes which are an integral part of the financial statements.
9 Semiannual Report
Investments (Unaudited) continued
Common Stocks – continued
Shares
Value (Note 1)
Hong Kong – continued
CNOOC Ltd. sponsored ADR
4,700
$388,596
Kerry Properties Ltd.
65,500
231,898
TOTAL HONG KONG
3,576,820
Hungary – 0.8%
MOL Magyar Olay-es Gazipari RT Series A (For. Reg.)
10,124
1,204,459
India – 2.2%
Apollo Hospitals Enterprise Ltd.
6,000
62,820
Bharat Forge Ltd.
9,417
89,441
Bharti Televentures Ltd. (a)
59,560
555,208
Crompton Greaves Ltd.
8,330
197,146
Federal Bank Ltd.:
GDR (a)
11,701
54,438
GDR (a)(c)
9,000
41,872
Gujarat Ambuja Cement Ltd.
103,259
267,347
Jaiprakash Associates Ltd.
18,333
229,428
Larsen & Toubro Ltd.
8,424
505,590
Nagarjuna Construction Co. Ltd.
5,827
49,348
Reliance Energy Ventures Ltd. (a)
15,556
14,846
Reliance Industries Ltd.
15,556
349,542
Reliance Natural Resources Ltd. (a)
15,556
10,238
Rolta India Ltd.
45,181
256,596
Rolta India Ltd. sponsored GDR (c)
8,800
47,784
Sintex Industries Ltd.
4,182
19,536
State Bank of India
8,349
188,239
Suzlon Energy Ltd.
3,283
92,103
Uti Bank Ltd.
17,200
132,409
TOTAL INDIA
3,163,931
Indonesia – 1.4%
PT Aneka Tambang Tbk
853,000
558,308
PT Bakrie & Brothers Tbk (a)
10,842,500
209,814
PT Medco Energi International Tbk
932,500
509,503
PT Perusahaan Gas Negara Tbk Series B
510,700
720,849
TOTAL INDONESIA
1,998,474
Israel – 2.4%
Bank Hapoalim BM (Reg.)
116,528
587,191
Delek Group Ltd.
400
68,190
ECI Telecom Ltd. (a)
5,300
56,604
Israel Chemicals Ltd.
84,000
332,363
Ituran Location & Control Ltd.
5,900
98,176
See accompanying notes which are an integral part of the financial statements.
Semiannual Report 10
Common Stocks – continued
Shares
Value (Note 1)
Israel – continued
Orckit Communications Ltd. (a)
22,300
$359,476
Ormat Industries Ltd.
25,300
240,579
Orpak Systems Ltd.
19,400
60,501
RADWARE Ltd. (a)
7,300
115,705
Teva Pharmaceutical Industries Ltd. sponsored ADR
38,400
1,555,200
TOTAL ISRAEL
3,473,985
Korea (South) – 19.1%
CJ Corp.
2,490
340,572
CJ Home Shopping
3,169
362,882
Daegu Bank Co. Ltd.
16,870
316,598
Daelim Industrial Co.
6,840
522,165
Daewoo Shipbuilding & Marine Engineering Co. Ltd.
20,670
603,784
Fantom Co. Ltd. (a)
2,700
50,384
Fantom Co. Ltd. rights 5/19/06 (a)
718
1,180
Fursys, Inc.
2,700
89,890
Hanil Cement Co. Ltd.
2,280
164,627
Hanjin Heavy Industries & Construction Co. Ltd.
13,600
423,941
Hanwha Corp.
4,770
149,197
Hynix Semiconductor, Inc. (a)
8,120
283,681
Hyundai Department Store Co. Ltd.
5,710
547,903
Hyundai Engineering & Construction Co. Ltd. (a)
10,100
628,606
Hyundai Mipo Dockyard Co. Ltd.
4,870
456,458
Hyundai Motor Co.
15,700
1,379,982
Industrial Bank of Korea
23,920
481,875
Kookmin Bank
25,800
2,311,510
Korea Investment Holdings Co. Ltd.
8,100
346,965
Korea Zinc Co. Ltd.
4,770
429,384
Korean Air Co. Ltd.
12,510
455,621
Kyeryong Construction Industrial Co. Ltd.
12,230
575,743
LG Electronics, Inc.
10,920
904,259
LG Engineering & Construction Co. Ltd.
8,810
638,927
LG Investment & Securities Co. Ltd.
16,800
411,472
Lotte Shopping Co. Ltd. GDR (a)(c)
11,962
249,842
Macquarie Korea Infrastructure Fund:
GDR (c)
25,000
182,000
GDR
19,600
142,688
MegaStudy Co. Ltd.
2,379
235,844
NHN Corp. (a)
1,614
573,281
Phicom Corp.
3,820
52,451
POSCO
6,210
1,731,676
Samchully Co. Ltd.
1,000
121,402
See accompanying notes which are an integral part of the financial statements.
11 Semiannual Report
Investments (Unaudited) continued
Common Stocks – continued
Shares
Value (Note 1)
Korea (South) – continued
Samsung Electronics Co. Ltd.
9,852
$6,727,129
Samsung Heavy Industries Ltd.
31,090
735,097
Samsung SDI Co. Ltd.
3,500
289,456
Shinhan Financial Group Co. Ltd.
25,930
1,292,170
SK Corp.
14,700
1,081,673
Taewoong Co. Ltd.
11,600
252,749
Woongjin Coway Co. Ltd.
18,950
562,583
Wooree ETI Co. Ltd.
21,500
266,713
Woori Finance Holdings Co. Ltd.
8,610
194,447
TOTAL KOREA (SOUTH)
27,568,807
Lebanon – 0.1%
Solidere GDR (a)
8,200
183,516
Luxembourg – 1.5%
Evraz Group SA:
GDR (c)
2,800
70,000
GDR
16,600
415,000
Orco Property Group
3,900
500,408
Tenaris SA sponsored ADR
26,500
1,216,350
Ternium SA sponsored ADR
900
24,048
TOTAL LUXEMBOURG
2,225,806
Malaysia – 0.5%
Genting BHD
26,700
187,821
Lion Diversified Holdings BHD
77,600
100,612
Resorts World BHD
47,500
175,586
Steppe Cement Ltd. (a)
34,200
123,185
UMW Holdings BHD
73,000
148,014
TOTAL MALAYSIA
735,218
Mexico – 5.8%
America Movil SA de CV Series L sponsored ADR
87,400
3,225,934
Cemex SA de CV sponsored ADR
27,400
1,850,048
Corporacion Geo SA de CV Series B (a)
56,900
213,341
Gruma SA de CV Series B
69,100
216,559
Grupo Mexico SA de CV Series B
346,849
1,215,221
Sare Holding SA de CV Series B (a)
35,100
41,331
Urbi, Desarrollos Urbanos, SA de CV (a)
55,600
454,819
Wal-Mart de Mexico SA de CV Series V
383,604
1,093,709
TOTAL MEXICO
8,310,962
See accompanying notes which are an integral part of the financial statements.
Semiannual Report 12
Common Stocks – continued
Shares
Value (Note 1)
Oman – 0.0%
BankMuscat SAOG sponsored GDR (c)
6,875
$68,406
Philippines – 0.2%
Philippine Long Distance Telephone Co.
8,790
347,589
Poland – 0.2%
Echo Investment SA (a)
700
60,883
Globe Trade Centre SA (a)
600
51,990
TVN SA (a)
6,900
215,780
TOTAL POLAND
328,653
Romania – 0.0%
Banca Transilvania SA
134,500
70,751
Russia – 9.6%
Concern Kalina OJSC (a)
5,400
248,304
JSC MMC ’Norilsk Nickel’ sponsored ADR
14,800
1,961,000
Lukoil Oil Co. sponsored ADR
41,038
3,693,420
Novatek JSC:
GDR
8,900
378,250
GDR (c)
9,700
412,250
Novolipetsk Iron & Steel Corp. sponsored GDR
11,600
255,316
OAO Gazprom sponsored ADR
58,085
2,671,910
Polyus Gold Co. Zao ADR (a)
4,500
156,600
RBC Information Systems Jsc (a)
16,300
151,590
Sberbank RF GDR (a)
3,500
632,923
Seventh Continent (a)
4,100
103,320
Sistema JSFC sponsored:
GDR (c)
7,300
178,850
GDR
9,400
230,300
Surgutneftegaz JSC sponsored ADR
15,200
2,021,600
Vimpel Communications sponsored ADR (a)
12,200
567,910
VSMPO-Avisma Corp.
700
171,500
TOTAL RUSSIA
13,835,043
Singapore – 0.4%
Boustead Singapore Ltd.
192,700
146,276
Keppel Corp. Ltd.
26,600
257,444
Raffles Education Corp. Ltd.
115,800
183,129
TOTAL SINGAPORE
586,849
South Africa – 12.7%
Absa Group Ltd.
27,356
540,068
African Bank Investments Ltd.
165,447
924,577
Anglogold Ashanti Ltd. sponsored ADR
11,800
645,224
See accompanying notes which are an integral part of the financial statements.
13 Semiannual Report
Investments (Unaudited) continued
Common Stocks – continued
Shares
Value (Note 1)
South Africa – continued
Aspen Pharmacare Holdings Ltd.
106,222
$750,842
Aveng Ltd.
92,988
367,467
Edgars Consolidated Stores Ltd.
69,630
440,073
Ellerine Holdings Ltd.
54,132
832,080
FirstRand Ltd.
420,973
1,386,323
Foschini Ltd.
42,800
433,517
Gold Fields Ltd.
64,600
1,641,486
Impala Platinum Holdings Ltd.
5,908
1,120,186
JD Group Ltd.
25,900
400,486
Lewis Group Ltd.
49,822
502,570
MTN Group Ltd.
213,700
2,132,557
Mvelaphanda Group Ltd.
152,500
240,956
Naspers Ltd. Class N sponsored ADR
37,906
834,311
Sasol Ltd.
57,270
2,409,864
Standard Bank Group Ltd.
88,300
1,260,065
Steinhoff International Holdings Ltd.
92,600
367,012
Telkom SA Ltd.
26,200
624,007
Truworths International Ltd.
97,300
469,306
TOTAL SOUTH AFRICA
18,322,977
Spain – 0.2%
Banco Bilbao Vizcaya Argentaria SA sponsored ADR
9,900
218,394
Taiwan – 8.1%
Advanced Semiconductor Engineering, Inc.
720,000
855,262
Chipbond Technology Corp.
189,710
252,701
Delta Electronics, Inc.
260,000
810,004
Foxconn Technology Co. Ltd.
67,000
502,930
High Tech Computer Corp.
29,200
933,492
Hon Hai Precision Industry Co. Ltd. (Foxconn)
305,010
2,069,663
MediaTek, Inc.
72,900
851,102
Motech Industries, Inc.
9,185
254,771
Nan Ya Printed Circuit Board Corp.
10,000
107,503
Novatek Microelectronics Corp.
57,754
343,925
Phoenix Precision Technology Corp.
182,000
414,699
Powertech Technology, Inc.
55,000
188,758
Shin Kong Financial Holding Co. Ltd.
499,000
531,750
Siliconware Precision Industries Co. Ltd.
482,000
699,448
Taiwan Semiconductor Manufacturing Co. Ltd.
1,220,631
2,605,308
TSRC Corp.
305,000
217,953
TOTAL TAIWAN
11,639,269
See accompanying notes which are an integral part of the financial statements.
Semiannual Report 14
Common Stocks – continued
Shares
Value (Note 1)
Thailand – 1.6%
Bangchak Petroleum PCL:
warrants 4/12/11 (a)
17,000
$836
(For. Reg.)
161,400
59,348
Bumrungrad Hospital PCL (For. Reg.)
7,800
7,714
Charoen Pokphand Foods PCL (For. Reg.)
1,357,300
198,912
Minor International PCL (For. Reg.)
1,491,804
461,096
PTT PCL (For. Reg.)
80,500
553,397
Siam Cement PCL (For. Reg.)
52,000
351,932
Siam Commercial Bank PCL (For. Reg.)
391,200
677,538
TOTAL THAILAND
2,310,773
Turkey – 2.5%
Acibadem Saglik Hizmetleri AS
29,400
357,913
Akbank T. A. S.
72,500
603,025
Alarko Gayrimenkul Yatirim Ortakligi AS (a)
2,700
120,454
Aygaz AS
25,600
103,561
Denizbank AS (a)
22,600
199,940
Dogan Yayin Holding AS
87,712
444,363
Dogus Otomotiv Servis ve Ticaret AS
37,300
307,425
Enka Insaat ve Sanayi AS
25,200
390,624
Finansbank AS
144,076
751,701
Selcuk Ecza Deposu Tic AS
10,000
50,662
Turk Traktor ve Ziraat Makinalari AS
17,400
238,140
Vestel White Goods AS
13,000
28,113
TOTAL TURKEY
3,595,921
Ukraine – 0.1%
Stirol sponsored ADR (a)
3,100
72,356
Ukrnafta Open JSC sponsored ADR
285
101,816
TOTAL UKRAINE
174,172
United Arab Emirates – 0.4%
Investcom LLC GDR
35,700
540,855
United Kingdom – 1.5%
Aricom PLC (a)
110,500
119,907
Kazakhgold Group Ltd. GDR
14,700
409,395
Kazakhmys PLC
28,300
587,604
Oxus Gold PLC (a)
80,600
120,535
Sibir Energy PLC (a)
24,600
245,856
Trader Media East Ltd. GDR (a)(c)
6,054
53,881
See accompanying notes which are an integral part of the financial statements.
15 Semiannual Report
Investments (Unaudited)continued
Common Stocks – continued
Shares
Value (Note 1)
United Kingdom – continued
Vedanta Resources PLC
17,400
$500,751
Victoria Oil & Gas PLC (a)
40,100
183,562
TOTAL UNITED KINGDOM
2,221,491
United States of America – 1.2%
Central European Distribution Corp. (a)
3,336
136,943
CTC Media, Inc. (d)
799
23,970
DSP Group, Inc. (a)
3,100
83,824
Freeport-McMoRan Copper & Gold, Inc. Class B
11,100
716,838
NII Holdings, Inc. (a)
9,500
569,050
Zoran Corp. (a)
7,200
197,568
TOTAL UNITED STATES OF AMERICA
1,728,193
TOTAL COMMON STOCKS
(Cost $112,241,545)
138,972,975
Nonconvertible Preferred Stocks — 0.1%
Korea (South) – 0.1%
Samsung Electronics Co. Ltd.
(Cost $121,831)
320
173,376
Money Market Funds — 2.9%
Fidelity Cash Central Fund, 4.8% (b)
(Cost $4,161,276)
4,161,276
4,161,276
TOTAL INVESTMENT PORTFOLIO – 99.3%
(Cost $116,524,652)
143,307,627
NET OTHER ASSETS – 0.7%
1,002,763
NET ASSETS – 100%
$144,310,390
See accompanying notes which are an integral part of the financial statements.
Semiannual Report16
Legend
(a) Non-income producing
(b) Affiliated fund that is available only to investment companies and other accounts managed by Fidelity Investments. The rate quoted is the annualized seven-day yield of the fund at period end. A complete unaudited listing of the fund’s holdings as of its most recent quarter end is available upon request.
(c) Security exempt from registration under Rule 144A of the Securities Act of 1933.
These securities may be resold in transactions exempt from registration, normally to qualified institutional buyers. At the period end, the value of these securities amounted to $1,415,879 or 1.0% of net assets.
(d) Restricted securities – Investment in securities not registered under the Securities Act of 1933 (excluding 144A issues). At the end of the period, the value of restricted securities (excluding 144A issues) amounted to $141,066 or 0.1% of net assets.
Additional information on each holding is as follows:
Acquisition
Acquisition
Security
Date
Cost
CTC Media, Inc.
1/26/05
$11,998
Primeline Energy
Holdings, Inc.
3/23/06
$25,263
Primeline Energy
Holdings, Inc.
warrants 4/4/08
3/23/06
$8,210
Affiliated Central Funds
Information regarding fiscal year to date income earned by the fund from the affiliated Central funds is as follows:
Fund
Income earned
Fidelity Cash Central Fund
$91,530
Income Tax Information
At October 31, 2005, the fund had a capital loss carryforward of approximately $81,011 all of which will expire on October 31, 2012.
See accompanying notes which are an integral part of the financial statements.
17 Semiannual Report
Financial Statements
Statement of Assets and Liabilities
April 30, 2006 (Unaudited)
Assets
Investment in securities, at value — See accompanying
schedule:
Unaffiliated issuers (cost $112,363,376)
$139,146,351
Affiliated Central Funds (cost $4,161,276)
4,161,276
Total Investments (cost $116,524,652)
$143,307,627
Receivable for investments sold
1,475,713
Receivable for fund shares sold
2,829,313
Dividends receivable
260,757
Interest receivable
30,420
Receivable from investment adviser for expense
reductions
24,799
Other affiliated receivables
10,966
Other receivables
35,369
Total assets
147,974,964
Liabilities
Payable to custodian bank
$88,014
Payable for investments purchased
3,073,638
Payable for fund shares redeemed
192,766
Accrued management fee
86,758
Distribution fees payable
57,565
Other affiliated payables
36,791
Other payables and accrued expenses
129,042
Total liabilities
3,664,574
Net Assets
$144,310,390
Net Assets consist of:
Paid in capital
$117,022,775
Undistributed net investment income
80,386
Accumulated undistributed net realized gain (loss) on
investments and foreign currency transactions
482,207
Net unrealized appreciation (depreciation) on
investments and assets and liabilities in foreign
currencies
26,725,022
Net Assets
$144,310,390
See accompanying notes which are an integral part of the financial statements.
Semiannual Report 18
Statement of Assets and Liabilities continued
April 30, 2006 (Unaudited)
Calculation of Maximum Offering Price
Class A:
Net Asset Value and redemption price per share
($55,563,025 ÷ 2,806,982 shares)
$19.79
Maximum offering price per share (100/94.25 of $19.79)
$21.00
Class T:
Net Asset Value and redemption price per share
($30,957,596 ÷ 1,571,147 shares)
$19.70
Maximum offering price per share (100/96.50 of $19.70)
$20.41
Class B:
Net Asset Value and offering price per share
($17,099,683 ÷ 874,659 shares)A
$19.55
Class C:
Net Asset Value and offering price per share
($31,495,736 ÷ 1,610,705 shares)A
$19.55
Institutional Class:
Net Asset Value, offering price and redemption price per
share ($9,194,350 ÷ 462,150 shares)
$19.89
A Redemption price per share is equal to net asset value less any applicable contingent deferred sales charge.
See accompanying notes which are an integral part of the financial statements.
19 Semiannual Report
Financial Statements continued
Statement of Operations
Six months ended April 30, 2006 (Unaudited)
Investment Income
Dividends
$860,801
Interest
69
Income from affiliated Central Funds
91,530
952,400
Less foreign taxes withheld
(71,369)
Total income
881,031
Expenses
Management fee
$304,805
Transfer agent fees
136,161
Distribution fees
203,971
Accounting fees and expenses
20,522
Independent trustees’ compensation
113
Custodian fees and expenses
113,491
Registration fees
57,790
Audit
29,056
Legal
491
Miscellaneous
640
Total expenses before reductions
867,040
Expense reductions
(218,885)
648,155
Net investment income (loss)
232,876
Realized and Unrealized Gain (Loss)
Net realized gain (loss) on:
Investment securities:
Unaffiliated issuers (net of foreign taxes of $8,471)
709,934
Foreign currency transactions
(110,300)
Total net realized gain (loss)
599,634
Change in net unrealized appreciation (depreciation) on:
Investment securities (net of increase in deferred for-
eign taxes of $40,798)
23,031,980
Assets and liabilities in foreign currencies
(2,188)
Total change in net unrealized appreciation
(depreciation)
23,029,792
Net gain (loss)
23,629,426
Net increase (decrease) in net assets resulting from
operations
$23,862,302
See accompanying notes which are an integral part of the financial statements.
Semiannual Report 20
Statement of Changes in Net Assets
Six months ended
Year ended
April 30, 2006
October 31,
(Unaudited)
2005
Increase (Decrease) in Net Assets
Operations
Net investment income (loss)
$232,876
$84,570
Net realized gain (loss)
599,634
58,159
Change in net unrealized appreciation (depreciation) .
23,029,792
3,425,349
Net increase (decrease) in net assets resulting
from operations
23,862,302
3,568,078
Distributions to shareholders from net investment income .
(233,752)
—
Share transactions net increase (decrease)
91,743,137
20,919,617
Redemption fees
23,506
8,417
Total increase (decrease) in net assets
115,395,193
24,496,112
Net Assets
Beginning of period
28,915,197
4,419,085
End of period (including undistributed net investment
income of $80,386 and undistributed net investment
income of $81,262, respectively)
$144,310,390
$28,915,197
See accompanying notes which are an integral part of the financial statements.
21 Semiannual Report
Financial Highlights — Class A
Six months ended
Years ended
April 30, 2006
October 31,
(Unaudited)
2005
2004F
Selected Per-Share Data
Net asset value, beginning of period
$13.75
$9.87
$10.00
Income from Investment Operations
Net investment income (loss)E
.08
.12
.02
Net realized and unrealized gain (loss)
6.06
3.75
(.16)
Total from investment operations
6.14
3.87
(.14)
Distributions from net investment income
(.11)
—
—
Redemption fees added to paid in capitalE
.01
.01
.01
Net asset value, end of period
$19.79
$13.75
$9.87
Total ReturnB,C,D
44.92%
39.31%
(1.30)%
Ratios to Average Net AssetsG
Expenses before reductions
2.02%A
3.15%
10.75%A
Expenses net of fee waivers, if any
1.60%A
1.63%
2.00%A
Expenses net of all reductions
1.45%A
1.52%
1.91%A
Net investment income (loss)
.92%A
.95%
.28%A
Supplemental Data
Net assets, end of period (000 omitted)
$55,563
$9,617
$1,178
Portfolio turnover rate
29%A
54%
101%A
A Annualized
B Total returns for periods of less than one year are not annualized.
C Total returns would have been lower had certain expenses not been reduced during the periods shown. D Total returns do not include the effect of the sales charges.
E Calculated based on average shares outstanding during the period.
F For the period March 29, 2004 (commencement of operations) to October 31, 2004.
G Expense ratios reflect operating expenses of the class. Expenses before reductions do not reflect amounts reimbursed by the investment adviser or reductions from brokerage service arrangements or other expense offset arrangements and do not represent the amount paid by the class during periods when reimbursements or reductions occur. Expense ratios before reductions for start-up periods may not be representative of longer-term operating periods. Expenses net of fee waivers reflect expenses after reimbursement by the investment adviser but prior to reductions from brokerage service arrangements or other expense offset arrangements. Expenses net of all reductions represent the net expenses paid by the class.
See accompanying notes which are an integral part of the financial statements.
Semiannual Report22
Financial Highlights — Class T
Six months ended
Years ended
April 30, 2006
October 31,
(Unaudited)
2005
2004F
Selected Per-Share Data
Net asset value, beginning of period
$13.69
$9.86
$10.00
Income from Investment Operations
Net investment income (loss)E
.06
.09
—H
Net realized and unrealized gain (loss)
6.03
3.73
(.15)
Total from investment operations
6.09
3.82
(.15)
Distributions from net investment income
(.09)
—
—
Redemption fees added to paid in capitalE
.01
.01
.01
Net asset value, end of period
$19.70
$13.69
$9.86
Total ReturnB,C,D
44.73%
38.84%
(1.40)%
Ratios to Average Net AssetsG
Expenses before reductions
2.31%A
3.53%
11.13%A
Expenses net of fee waivers, if any
1.85%A
1.89%
2.25%A
Expenses net of all reductions
1.70%A
1.77%
2.16%A
Net investment income (loss)
.68%A
.70%
.03%A
Supplemental Data
Net assets, end of period (000 omitted)
$30,958
$6,801
$889
Portfolio turnover rate
29%A
54%
101%A
A Annualized
B Total returns for periods of less than one year are not annualized.
C Total returns would have been lower had certain expenses not been reduced during the periods shown. D Total returns do not include the effect of the sales charges.
E Calculated based on average shares outstanding during the period.
F For the period March 29, 2004 (commencement of operations) to October 31, 2004.
G Expense ratios reflect operating expenses of the class. Expenses before reductions do not reflect amounts reimbursed by the investment adviser or reductions from brokerage service arrangements or other expense offset arrangements and do not represent the amount paid by the class during periods when reimbursements or reductions occur. Expense ratios before reductions for start-up periods may not be representative of longer-term operating periods. Expenses net of fee waivers reflect expenses after reimbursement by the investment adviser but prior to reductions from brokerage service arrangements or other expense offset arrangements. Expenses net of all reductions represent the net expenses paid by the class.
H Amount represents less than $.01 per share.
See accompanying notes which are an integral part of the financial statements.
23Semiannual Report
Financial Highlights — Class B
Six months ended
Years ended
April 30, 2006
October 31,
(Unaudited)
2005
2004F
Selected Per-Share Data
Net asset value, beginning of period
$13.58
$9.83
$10.00
Income from Investment Operations
Net investment income (loss)E
02
.02
(.03)
Net realized and unrealized gain (loss)
5.99
3.72
(.15)
Total from investment operations
6.01
3.74
(.18)
Distributions from net investment income
(.05)
—
—
Redemption fees added to paid in capitalE
01
.01
.01
Net asset value, end of period
$19.55
$13.58
$9.83
Total ReturnB,C,D
44.39%
38.15%
(1.70)%
Ratios to Average Net AssetsG
Expenses before reductions
2.85%A
4.00%
11.49%A
Expenses net of fee waivers, if any
2.35%A
2.39%
2.75%A
Expenses net of all reductions
2.19%A
2.27%
2.67%A
Net investment income (loss)
18%A
.20%
(.47)%A
Supplemental Data
Net assets, end of period (000 omitted)
$17,100
$4,997
$719
Portfolio turnover rate
29%A
54%
101%A
A Annualized
B Total returns for periods of less than one year are not annualized.
C Total returns would have been lower had certain expenses not been reduced during the periods shown. D Total returns do not include the effect of the contingent deferred sales charge.
E Calculated based on average shares outstanding during the period.
F For the period March 29, 2004 (commencement of operations) to October 31, 2004.
G Expense ratios reflect operating expenses of the class. Expenses before reductions do not reflect amounts reimbursed by the investment adviser or reductions from brokerage service arrangements or other expense offset arrangements and do not represent the amount paid by the class during periods when reimbursements or reductions occur. Expense ratios before reductions for start-up periods may not be representative of longer-term operating periods. Expenses net of fee waivers reflect expenses after reimbursement by the investment adviser but prior to reductions from brokerage service arrangements or other expense offset arrangements. Expenses net of all reductions represent the net expenses paid by the class.
See accompanying notes which are an integral part of the financial statements.
Semiannual Report24
Financial Highlights — Class C
Six months ended
Years ended
April 30, 2006
October 31,
(Unaudited)
2005
2004F
Selected Per-Share Data
Net asset value, beginning of period
$13.59
$9.83
$10.00
Income from Investment Operations
Net investment income (loss)E
02
.02
(.03)
Net realized and unrealized gain (loss)
5.98
3.73
(.15)
Total from investment operations
6.00
3.75
(.18)
Distributions from net investment income
(.05)
—
—
Redemption fees added to paid in capitalE
01
.01
.01
Net asset value, end of period
$19.55
$13.59
$9.83
Total ReturnB,C,D
44.31%
38.25%
(1.70)%
Ratios to Average Net AssetsG
Expenses before reductions
2.80%A
4.09%
11.58%A
Expenses net of fee waivers, if any
2.35%A
2.39%
2.75%A
Expenses net of all reductions
2.20%A
2.28%
2.66%A
Net investment income (loss)
17%A
.19%
(.47)%A
Supplemental Data
Net assets, end of period (000 omitted)
$31,496
$5,890
$1,105
Portfolio turnover rate
29%A
54%
101%A
A Annualized
B Total returns for periods of less than one year are not annualized.
C Total returns would have been lower had certain expenses not been reduced during the periods shown. D Total returns do not include the effect of the contingent deferred sales charge.
E Calculated based on average shares outstanding during the period.
F For the period March 29, 2004 (commencement of operations) to October 31, 2004.
G Expense ratios reflect operating expenses of the class. Expenses before reductions do not reflect amounts reimbursed by the investment adviser or reductions from brokerage service arrangements or other expense offset arrangements and do not represent the amount paid by the class during periods when reimbursements or reductions occur. Expense ratios before reductions for start-up periods may not be representative of longer-term operating periods. Expenses net of fee waivers reflect expenses after reimbursement by the investment adviser but prior to reductions from brokerage service arrangements or other expense offset arrangements. Expenses net of all reductions represent the net expenses paid by the class.
See accompanying notes which are an integral part of the financial statements.
25Semiannual Report
Financial Highlights — Institutional Class
Six months ended
Years ended
April 30, 2006
October 31,
(Unaudited)
2005
2004E
Selected Per-Share Data
Net asset value, beginning of period
$13.80
$9.89
$10.00
Income from Investment Operations
Net investment income (loss)D
10
.14
.03
Net realized and unrealized gain (loss)
6.09
3.76
(.15)
Total from investment operations
6.19
3.90
(.12)
Distributions from net investment income
(.11)
—
—
Redemption fees added to paid in capitalD
01
.01
.01
Net asset value, end of period
$19.89
$13.80
$9.89
Total ReturnB,C
45.12%
39.53%
(1.10)%
Ratios to Average Net AssetsF
Expenses before reductions
1.63%A
3.05%
10.37%A
Expenses net of fee waivers, if any
1.35%A
1.41%
1.75%A
Expenses net of all reductions
1.20%A
1.30%
1.66%A
Net investment income (loss)
1.17%A
1.17%
.53%A
Supplemental Data
Net assets, end of period (000 omitted)
$9,194
$1,610
$529
Portfolio turnover rate
29%A
54%
101%A
A Annualized
B Total returns for periods of less than one year are not annualized.
C Total returns would have been lower had certain expenses not been reduced during the periods shown. D Calculated based on average shares outstanding during the period.
E For the period March 29, 2004 (commencement of operations) to October 31, 2004.
F Expense ratios reflect operating expenses of the class. Expenses before reductions do not reflect amounts reimbursed by the investment adviser or reductions from brokerage service arrangements or other expense offset arrangements and do not represent the amount paid by the class during periods when reimbursements or reductions occur. Expense ratios before reductions for start-up periods may not be representative of longer-term operating periods. Expenses net of fee waivers reflect expenses after reimbursement by the investment adviser but prior to reductions from brokerage service arrangements or other expense offset arrangements. Expenses net of all reductions represent the net expenses paid by the class.
See accompanying notes which are an integral part of the financial statements.
Semiannual Report26
Notes to Financial Statements
For the period ended April 30, 2006 (Unaudited)
1. Significant Accounting Policies.
Fidelity Advisor Emerging Markets Fund (the fund) is a fund of Fidelity Advisor Series VIII (the trust) and is authorized to issue an unlimited number of shares. The trust is registered under the Investment Company Act of 1940, as amended (the 1940 Act), as an open-end management investment company organized as a Massachusetts business trust.
The fund offers Class A, Class T, Class B, Class C, and Institutional Class shares, each of which has equal rights as to assets and voting privileges. Each class has exclusive voting rights with respect to matters that affect that class. Class B shares will automatically convert to Class A shares after a holding period of seven years from the initial date of purchase. Investment income, realized and unrealized capital gains and losses, the common expenses of the fund, and certain fund-level expense reductions, if any, are allocated on a pro rata basis to each class based on the relative net assets of each class to the total net assets of the fund. Each class differs with respect to transfer agent and distribution and service plan fees incurred. Certain expense reductions also differ by class.
The fund’s investments in emerging markets can be subject to social, economic, regulatory, and political uncertainties and can be extremely volatile. The fund may invest in affiliated money market central funds (Money Market Central Funds), which are open-end investment companies available to investment companies and other accounts managed by Fidelity Management & Research Company (FMR) and its affiliates. The financial statements have been prepared in conformity with accounting principles generally accepted in the United States of America, which require management to make certain estimates and assumptions at the date of the financial statements. The following summarizes the significant accounting policies of the fund:
Security Valuation. Investments are valued and net asset value (NAV) per share is calculated (NAV calculation) as of the close of business of the New York Stock Exchange (NYSE), normally 4:00 p.m. Eastern time. Wherever possible, the fund uses independent pricing services approved by the Board of Trustees to value its investments.
Equity securities, including restricted securities, for which market quotations are readily available, are valued at the last reported sale price or official closing price as reported by an independent pricing service on the primary market or exchange on which they are traded. In the event there were no sales during the day or closing prices are not available, securities are valued at the last quoted bid price. Investments in open-end mutual funds, are valued at their closing net asset value each business day. Short-term securities with remaining maturities of sixty days or less for which quotations are not readily available are valued at amortized cost, which approximates value.
27 Semiannual Report
Notes to Financial Statements (Unaudited) continued
1. Significant Accounting Policies continued
Security Valuation continued
When current market prices or quotations are not readily available or do not accurately reflect fair value, valuations may be determined in accordance with procedures adopted by the Board of Trustees. For example, when developments occur between the close of a market and the close of the NYSE that may materially affect the value of some or all of the securities, or when trading in a security is halted, those securities may be fair valued. Factors used in the determination of fair value may include monitoring news to identify significant market or security specific events such as changes in the value of U.S. securities markets, reviewing developments in foreign markets and evaluating the performance of ADRs, futures contracts and exchange-traded funds. Because the fund’s utilization of fair value pricing depends on market activity, the frequency with which fair value pricing is used can not be predicted and may be utilized to a significant extent. The value of securities used for NAV calculation under fair value pricing may differ from published prices for the same securities.
Foreign Currency. The fund uses foreign currency contracts to facilitate transactions in foreign-denominated securities. Losses from these transactions may arise from changes in the value of the foreign currency or if the counterparties do not perform under the contracts’ terms.
Foreign-denominated assets, including investment securities, and liabilities are translated into U.S. dollars at the exchange rate at period end. Purchases and sales of investment securities, income and dividends received and expenses denominated in foreign currencies are translated into U.S. dollars at the exchange rate in effect on the transaction date.
The effects of exchange rate fluctuations on investments are included with the net realized and unrealized gain (loss) on investment securities. Other foreign currency transactions resulting in realized and unrealized gain (loss) are disclosed separately.
Investment Transactions and Income. Security transactions are accounted for as of trade date. Gains and losses on securities sold are determined on the basis of identified cost. Dividend income is recorded on the ex-dividend date, except for certain dividends from foreign securities where the ex-dividend date may have passed, which are recorded as soon as the fund is informed of the ex-dividend date. Non-cash dividends included in dividend income, if any, are recorded at the fair market value of the securities received. Interest income is accrued as earned. Interest income includes coupon interest and amortization of premium and accretion of discount on debt securities. Investment income is recorded net of foreign taxes withheld where recovery of such taxes is uncertain.
Semiannual Report 28
1. Significant Accounting Policies continued
Expenses. Most expenses of the trust can be directly attributed to a fund. Expenses which cannot be directly attributed are apportioned among each fund in the trust.
Income Tax Information and Distributions to Shareholders. Each year, the fund intends to qualify as a regulated investment company by distributing all of its taxable income and realized gains under Subchapter M of the Internal Revenue Code. As a result, no provision for income taxes is required in the accompanying financial statements. Foreign taxes are provided for based on the fund’s understanding of the tax rules and rates that exist in the foreign markets in which it invests.
Distributions are recorded on the ex-dividend date. Income dividends and capital gain distributions are declared separately for each class. Income and capital gain distributions are determined in accordance with income tax regulations, which may differ from generally accepted accounting principles.
Capital accounts within the financial statements are adjusted for permanent book-tax differences. These adjustments have no impact on net assets or the results of operations. Temporary book-tax differences will reverse in a subsequent period.
Book-tax differences are primarily due to foreign currency transactions, certain foreign taxes, passive foreign investment companies (PFIC) and losses deferred due to wash sales.
The federal tax cost of investments and unrealized appreciation (depreciation) as of period end were as follows:
Unrealized appreciation
$27,983,339
Unrealized depreciation
(1,223,224)
Net unrealized appreciation (depreciation)
$26,760,115
Cost for federal income tax purposes
$116,547,512
Short-Term Trading (Redemption) Fees. Shares held in the fund less than 90 days are subject to a redemption fee equal to 1.50% of the proceeds of the redeemed shares. All redemption fees, including any estimated redemption fees paid by FMR, are retained by the fund and accounted for as an addition to paid in capital.
29 Semiannual Report
Notes to Financial Statements (Unaudited) continued
2. Operating Policies.
Repurchase Agreements. FMR has received an Exemptive Order from the Securities and Exchange Commission (the SEC) which permits the fund and other affiliated entities of FMR to transfer uninvested cash balances into joint trading accounts which are then invested in repurchase agreements. The fund may also invest directly with institutions in repurchase agreements. Repurchase agreements are collateralized by government or non-government securities. Upon settlement date, collateral is held in segregated accounts with custodian banks and may be obtained in the event of a default of the counterparty. The fund monitors, on a daily basis, the value of the collateral to ensure it is at least equal to the principal amount of the repurchase agreement (including accrued interest). In the event of a default by the counterparty, realization of the collateral proceeds could be delayed, during which time the value of the collateral may decline.
Restricted Securities. The fund may invest in securities that are subject to legal or contractual restrictions on resale. These securities generally may be resold in transactions exempt from registration or to the public if the securities are registered. Disposal of these securities may involve time-consuming negotiations and expense, and prompt sale at an acceptable price may be difficult. Information regarding restricted securities is included at the end of the fund’s Schedule of Investments.
3. Purchases and Sales of Investments.
Purchases and sales of securities, other than short-term securities and U.S. government securities, aggregated $97,846,602 and $10,554,938, respectively.
4. Fees and Other Transactions with Affiliates.
Management Fee. FMR and its affiliates provide the fund with investment management related services for which the fund pays a monthly management fee. The management fee is the sum of an individual fund fee rate that is based on an annual rate of .55% of the fund’s average net assets and a group fee rate that averaged .27% during the period. The group fee rate is based upon the average net assets of all the mutual funds advised by FMR. The group fee rate decreases as assets under management increase and increases as assets under management decrease. For the period, the total annualized management fee rate was .82% of the fund’s average net assets.
Semiannual Report 30
4. Fees and Other Transactions with Affiliates continued
Distribution and Service Plan. In accordance with Rule 12b-1 of the 1940 Act, the fund has adopted separate Distribution and Service Plans for each class of shares. Certain classes pay Fidelity Distributors Corporation (FDC), an affiliate of FMR, separate Distribution and Service Fees, each of which is based on an annual percentage of each class’ average net assets. In addition, FDC may pay financial intermediaries for selling shares of the fund and providing shareholder support services. For the period, the Distribution and Service Fee rates and the total amounts paid to and retained by FDC were as follows:
Distribution
Service
Paid to
Retained
Fee
Fee
FDC
by FDC
Class A
0%
.25%
$34,574
$1,754
Class T
25%
.25%
42,036
908
Class B
75%
.25%
51,459
39,095
Class C
75%
.25%
75,902
49,443
$203,971
$91,200
Sales Load. FDC receives a front-end sales charge of up to 5.75% for selling Class A shares, and 3.50% for selling Class T shares, some of which is paid to financial intermediaries for selling shares of the fund. FDC receives the proceeds of contingent deferred sales charges levied on Class A, Class T, Class B, and Class C redemptions. These charges depend on the holding period. The deferred sales charges range from 5% to 1% for Class B, 1% for Class C, 1.00% to .50% for certain purchases of Class A shares (.25% prior to February 24, 2006) and .25% for certain purchases of Class T shares.
For the period, sales charge amounts retained by FDC were as follows:
Retained
by FDC
Class A
$105,680
Class T
25,846
Class B*
4,244
Class C*
1,469
$137,239
* When Class B and Class C shares are initially sold, FDC pays commissions from its own resources to financial intermediaries through which the sales are made.
31 Semiannual Report
Notes to Financial Statements (Unaudited) continued
4. Fees and Other Transactions with Affiliates continued
Transfer Agent Fees. Fidelity Investments Institutional Operations Company, Inc. (FIIOC), an affiliate of FMR, is the transfer, dividend disbursing and shareholder servicing agent for each class of the fund. FIIOC receives account fees and asset-based fees that vary according to the account size and type of account of the shareholders of the respective classes of the fund. FIIOC pays for typesetting, printing and mailing of shareholder reports, except proxy statements. For the period the total transfer agent fees paid by each class to FIIOC, were as follows:
% of
Average
Amount
Net Assets
Class A
$48,780
.35*
Class T
32,393
.39*
Class B
21,726
.42*
Class C
28,314
.37*
Institutional Class
4,948
.21*
$136,161
* Annualized
Accounting Fees. Fidelity Service Company, Inc. (FSC), an affiliate of FMR, maintains the fund’s accounting records. The fee is based on the level of average net assets for the month.
Affiliated Central Funds. The fund may invest in Money Market Central Funds which seek preservation of capital and current income and are managed by Fidelity Investments Money Management, Inc. (FIMM), an affiliate of FMR.
The Money Market Central Funds do not pay a management fee.
Brokerage Commissions. The fund placed a portion of its portfolio transactions with brokerage firms which are affiliates of the investment adviser. The commissions paid to these affiliated firms were $48 for the period.
5. Committed Line of Credit.
The fund participates with other funds managed by FMR in a $4.2 billion credit facility (the “line of credit”) to be utilized for temporary or emergency purposes to fund shareholder redemptions or for other short-term liquidity purposes. The fund has agreed to pay commitment fees on its pro rata portion of the line of credit, which amounts to $58 and is reflected in Miscellaneous Expense on the Statement of Operations. During the period, there were no borrowings on this line of credit.
Semiannual Report 32
6. Expense Reductions.
FMR voluntarily agreed to reimburse each class to the extent annual operating expenses exceeded certain levels of average net assets as noted in the table below. Some expenses, for example interest expense, are excluded from this reimbursement.
The following classes were in reimbursement during the period:
Expense
Reimbursement
Limitations
from adviser
Class A
1.60%
$57,744
Class T
1.85%
38,353
Class B
2.35%
25,641
Class C
2.35%
33,676
Institutional Class
1.35%
6,513
$161,927
Many of the brokers with whom FMR places trades on behalf of the fund provided services to the fund in addition to trade execution. These services included payments of certain expenses on behalf of the fund totaling $56,595 for the period. In addition, through arrangements with the fund’s custodian, credits realized as a result of uninvested cash balances were used to reduce the fund’s expenses. During the period, these credits reduced the fund’s custody expenses by $363.
7. Other.
The fund’s organizational documents provide former and current trustees and officers with a limited indemnification against liabilities arising in connection with the performance of their duties to the fund. In the normal course of business, the fund may also enter into contracts that provide general indemnifications. The fund’s maximum exposure under these arrangements is unknown as this would be dependent on future claims that may be made against the fund. The risk of material loss from such claims is considered remote.
. Distributions to Shareholders.
Distributions to shareholders of each class were as follows:
Six months ended
Year ended
April 30,
October 31,
2006
2005
From net investment income
Class A
$108,159
$—
Class T
59,395
$—
Class B
22,205
$—
Class C
28,882
$—
Institutional Class
15,111
$—
Total
$233,752
$—
33Semiannual Report
Notes to Financial Statements (Unaudited) continued
9. Share Transactions.
Transactions for each class of shares were as follows:
Shares
Dollars
Six months ended
Year ended
Six months ended
Year ended
April 30,
October 31,
April 30,
October 31,
2006
2005
2006
2005
Class A
Shares sold
2,241,504
626,290
$39,547,469
$7,938,744
Reinvestment of
distributions
5,648
—
88,424
—
Shares redeemed
(139,515)
(46,288)
(2,417,745)
(542,567)
Net increase
(decrease)
2,107,637
580,002
$37,218,148
$7,396,177
Class T
Shares sold
1,200,398
460,358
$21,030,203
$5,753,778
Reinvestment of
distributions
3,457
—
54,063
—
Shares redeemed
(129,379)
(53,845)
(2,271,467)
(661,780)
Net increase
(decrease)
1,074,476
406,513
$18,812,799
$5,091,998
Class B
Shares sold
601,820
336,021
$10,430,506
$4,091,942
Reinvestment of
distributions
1,278
—
20,092
—
Shares redeemed
(96,402)
(41,193)
(1,677,913)
(504,698)
Net increase
(decrease)
506,696
294,828
$8,772,685
$3,587,244
Class C
Shares sold
1,272,368
386,910
$22,421,931
$4,844,275
Reinvestment of
distributions
1,539
—
24,174
—
Shares redeemed
(96,769)
(65,733)
(1,664,465)
(821,834)
Net increase
(decrease)
1,177,138
321,177
$20,781,640
$4,022,441
Institutional Class
Shares sold
387,798
77,612
$6,915,386
$997,482
Reinvestment of
distributions
676
—
10,642
—
Shares redeemed
(42,948)
(14,515)
(768,163)
(175,725)
Net increase
(decrease)
345,526
63,097
$6,157,865
$821,757
Semiannual Report 34
Board Approval of Investment Advisory Contracts and Management Fees
Advisor Emerging Markets Fund
On January 19, 2006, the Board of Trustees, including the Independent Trustees (together, the Board), voted to approve a general research services agreement (the Agreement) between FMR, FMR Co., Inc. (FMRC), Fidelity Investments Money Management, Inc. (FIMM), and Fidelity Research & Analysis Company (FRAC) (together, the Investment Advisers) for the fund, effective January 20, 2006, pursuant to which FRAC may provide general research and investment advisory support services to FMRC and FIMM. The Board considered that it has approved previously various sub-advisory agreements for the fund with affiliates of FMR that allow FMR to obtain research, non-discretionary advice, or discretionary portfolio management at no additional expense to the fund. The Board, assisted by the advice of fund counsel and independent Trustees’ counsel, considered a broad range of information and determined that it would be beneficial for the fund to access the research and investment advisory support services supplied by FRAC at no additional expense to the fund.
The Board reached this determination in part because the new arrangement will involve no changes in (i) the contractual terms of and fees payable under the fund’s management contract or sub-advisory agreements; (ii) the investment process or strategies employed in the management of the fund’s assets; (iii) the nature or level of services provided under the fund’s management contract or sub-advisory agreements; (iv) the day-to-day management of the fund or the persons primarily responsible for such management; or (v) the ultimate control or beneficial ownership of FMR, FMRC, or FIMM. The Board also considered that the establishment of the Agreement would not necessitate prior shareholder approval of the Agreement or result in an assignment and termination of the fund’s management contract or sub-advisory agreements under the Investment Company Act of 1940.
Because the Board was approving an arrangement with FRAC under which the fund will not bear any additional management fees or expenses and under which the fund’s portfolio manager would not change, it did not consider the fund’s investment performance, competitiveness of management fee and total expenses, costs of services and profitability, or economies of scale to be significant factors in its decision.
In connection with its future renewal of the fund’s management contract and sub-advisory agreements, the Board will consider: (i) the nature, extent, and quality of services provided to the fund, including shareholder and administrative services and investment performance; (ii) the competitiveness of the fund’s management fee and total expenses; (iii) the costs of the services and profitability, including the revenues earned and the expenses incurred by Fidelity in conducting the business of developing, marketing, distributing, managing, administering, and servicing the fund and its shareholders; and (iv) whether there have been economies of scale in respect of the management of the Fidelity funds, whether the Fidelity funds (including the fund) have
35 Semiannual Report
Board Approval of Investment Advisory Contracts and Management Fees continued
appropriately benefited from any such economies of scale, and whether there is potential for realization of any further economies.
Based on its evaluation of all of the conclusions noted above, and after considering all material factors, the Board ultimately concluded that the fund’s Agreement is fair and reasonable, and that the fund’s Agreement should be approved.
Semiannual Report 36
37 Semiannual Report
Investment Adviser Fidelity Management & Research Company Boston, MA Investment Sub-Advisers FMR Co., Inc. Fidelity Management & Research (U.K.) Inc. Fidelity Research & Analysis Company (formerly Fidelity Management & Research (Far East) Inc.) Fidelity International Investment Advisors Fidelity Investments Japan Limited Fidelity International Investment Advisors (U.K.) Limited General Distributor Fidelity Distributors Corporation Boston, MA Transfer and Service Agents Fidelity Investments Institutional Operations Company, Inc. Boston, MA Fidelity Service Company, Inc. Boston, MA Custodian JPMorgan Chase Bank New York, NY
FAEM-USAN-0606 1.800637.102
Fidelity® Advisor Emerging Markets Fund Institutional Class
Semiannual Report April 30, 2006
Contents
Chairman’s Message
3
Ned Johnson’s message to shareholders.
Shareholder Expense
4
An example of shareholder expenses.
Example
Investment Changes
6
A summary of major shifts in the fund’s
investments over the past six months.
Investments
7
A complete list of the fund’s investments
with their market values.
Financial Statements
18
Statements of assets and liabilities,
operations, and changes in net assets,
as well as financial highlights.
Notes
27
Notes to the financial statements.
Board Approval of
35
Investment Advisory
Contracts and
Management Fees
To view a fund’s proxy voting guidelines and proxy voting record for the 12-month period ended June 30, visit www.fidelity.com/proxyvotingresults or visit the Securities and Exchange Commission’s (SEC) web site at www.sec.gov. You may also call 1-877-208-0098 to request a free copy of the proxy voting guidelines.
Standard & Poor’s, S&P and S&P 500 are registered service marks of The McGraw-Hill Companies, Inc. and have been licensed for use by Fidelity Distributors Corporation.
Other third party marks appearing herein are the property of their respective owners. All other marks appearing herein are registered or unregistered trademarks or service marks of FMR Corp. or an affiliated company.
This report and the financial statements contained herein are submitted for the general information of the shareholders of the fund. This report is not authorized for distribution to prospective investors in the fund unless preceded or accompanied by an effective prospectus.
A fund files its complete schedule of portfolio holdings with the SEC for the first and third quarters of each fiscal year on Form N-Q. Forms N-Q are available on the SEC’s web site at http://www.sec.gov. A fund’s Forms N-Q may be reviewed and copied at the SEC’s Public Reference Room in Washington, DC. Information regarding the operation of the SEC’s Public Reference Room may be obtained by calling 1-800-SEC-0330. For a complete list of a fund’s portfolio holdings, view the most recent quarterly holdings report, semiannual report, or annual report on Fidelity’s web site at http://www.advisor.fidelity.com.
NOT FDIC INSURED · MAY LOSE VALUE · NO BANK GUARANTEE
Neither the fund nor Fidelity Distributors Corporation is a bank.
Semiannual Report 2
Chairman’s Message
(photograph of Edward C. Johnson 3d) Dear Shareholder:
Although many securities markets made gains in early 2006, there is only one certainty when it comes to investing: There is no sure thing. There are, however, a number of time-tested, fundamental investment principles that can put the historical odds in your favor.
One of the basic tenets is to invest for the long term. Over time, riding out the markets’ inevitable ups and downs has proven much more effective than selling into panic or chasing the hottest trend. Even missing only a few of the markets’ best days can significantly diminish investor returns. Patience also affords the benefits of compounding — of earning interest on additional income or reinvested dividends and capital gains. There are tax advantages and cost benefits to consider as well. The more you sell, the more taxes you pay, and the more you trade, the higher the costs. While staying the course doesn’t eliminate risk, it can considerably lessen the effect of short-term declines.
You can further manage your investing risk through diversification. And today, more than ever, geographic diversification should be taken into account. Studies indicate that asset allocation is the single most important determinant of a portfolio’s long-term success. The right mix of stocks, bonds and cash —aligned to your particular risk tolerance and investment objective — is very important. Age-appropriate rebalancing is also an essential aspect of asset allocation. For younger investors, an emphasis on equities — which historically have been the best performing asset class over time — is encouraged. As investors near their specific goal, such as retirement or sending a child to college, consideration may be given to replacing volatile assets (e.g. common stocks) with more-stable fixed investments (bonds or savings plans).
A third investment principle — investing regularly — can help lower the average cost of your purchases. Investing a certain amount of money each month or quarter helps ensure you won’t pay for all your shares at market highs. This strategy — known as dollar cost averaging — also reduces unconstruc-tive “emotion” from investing, helping shareholders avoid selling weak performers just prior to an upswing, or chasing a hot performer just before a correction.
We invite you to contact us via the Internet, through our Investor Centers or over the phone. It is our privilege to provide you the information you need to make the investments that are right for you.
Sincerely,
/s/Edward C. Johnson 3d Edward C. Johnson 3d
3 Semiannual Report
Shareholder Expense Example
As a shareholder of the Fund, you incur two types of costs: (1) transaction costs, including sales charges (loads) on purchase payments or redemption proceeds, redemption fees, and (2) ongoing costs, including management fees, distribution and/or service (12b-1) fees and other Fund expenses. This Example is intended to help you understand your ongoing costs (in dollars) of investing in the Fund and to compare these costs with the ongoing costs of investing in other mutual funds.
The Example is based on an investment of $1,000 invested at the beginning of the period and held for the entire period (November 1, 2005 to April 30, 2006).
Actual Expenses
The first line of the table below for each class of the Fund provides information about actual account values and actual expenses. You may use the information in this line, together with the amount you invested, to estimate the expenses that you paid over the period. Simply divide your account value by $1,000.00 (for example, an $8,600 account value divided by $1,000.00 = 8.6), then multiply the result by the number in the first line for a class of the Fund under the heading entitled “Expenses Paid During Period” to estimate the expenses you paid on your account during this period.
Hypothetical Example for Comparison Purposes
The second line of the table below for each class of the Fund provides information about hypothetical account values and hypothetical expenses based on a Class’ actual expense ratio and an assumed rate of return of 5% per year before expenses, which is not the Class’ actual return. The hypothetical account values and expenses may not be used to estimate the actual ending account balance or expenses you paid for the period. You may use this information to compare the ongoing costs of investing in the Fund and other funds. To do so, compare this 5% hypothetical example with the 5% hypothetical examples that appear in the shareholder reports of the other funds.
Semiannual Report 4
Please note that the expenses shown in the table are meant to highlight your ongoing costs only and do not reflect any transaction costs. Therefore, the second line of the table is useful in comparing ongoing costs only, and will not help you determine the relative total costs of owning different funds. In addition, if these transactional costs were included, your costs would have been higher.
Expenses Paid
Beginning
Ending
During Period*
Account Value
Account Value
November 1, 2005
November 1, 2005
April 30, 2006
to April 30, 2006
Class A
Actual
$1,000.00
$1,449.20
$9.72
HypotheticalA
$1,000.00
$1,016.86
$8.00
Class T
Actual
$1,000.00
$1,447.30
$11.23
HypotheticalA
$1,000.00
$1,015.62
$9.25
Class B
Actual
$1,000.00
$1,443.90
$14.24
HypotheticalA
$1,000.00
$1,013.14
$11.73
Class C
Actual
$1,000.00
$1,443.10
$14.24
HypotheticalA
$1,000.00
$1,013.14
$11.73
Institutional Class
Actual
$1,000.00
$1,451.20
$8.20
HypotheticalA
$1,000.00
$1,018.10
$6.76
A 5% return per year before expenses
* Expenses are equal to each Class’ annualized expense ratio (shown in the table below); multiplied by the average account value over the period, multiplied by 181/365 (to reflect the one-half year period).
Annualized
Expense Ratio
Class A
1.60%
Class T
1.85%
Class B
2.35%
Class C
2.35%
Institutional Class
1.35%
5 Semiannual Report
Investment Changes
Top Five Stocks as of April 30, 2006
% of fund’s
% of fund’s net assets
net assets
6 months ago
Samsung Electronics Co. Ltd. (Korea (South),
Semiconductors & Semiconductor Equipment)
4.7
5.6
Petroleo Brasileiro SA Petrobras (PN) (non-vtg.)
(Brazil, Oil, Gas & Consumable Fuels)
3.0
2.5
Lukoil Oil Co. sponsored ADR (Russia, Oil, Gas
& Consumable Fuels)
2.6
2.8
America Movil SA de CV Series L sponsored
ADR (Mexico, Wireless Telecommunication
Services)
2.2
3.1
Companhia Vale do Rio Doce (PN-A) sponsored
ADR (non-vtg.) (Brazil, Metals & Mining)
1.9
1.9
14.4
Top Five Market Sectors as of April 30, 2006
% of fund’s
% of fund’s net assets
net assets
6 months ago
Energy
18.4
14.3
Materials
15.5
10.5
Financials
14.9
20.2
Information Technology
14.7
17.1
Consumer Discretionary
10.3
10.3
Top Five Countries as of April 30, 2006
(excluding cash equivalents)
% of fund’s
% of fund’s net assets
net assets
6 months ago
Korea (South)
19.2
21.9
South Africa
12.7
9.8
Brazil
12.1
13.5
Russia
9.6
7.2
Taiwan
8.1
8.8
Percentages are adjusted for the effect of open futures contracts, if applicable.
Semiannual Report6
Investments April 30, 2006 (Unaudited)
Showing Percentage of Net Assets
Common Stocks — 96.3%
Shares
Value (Note 1)
Argentina – 0.4%
Banco Macro Bansud SA sponsored ADR
5,100
$118,167
Inversiones y Representaciones SA sponsored GDR (a)
33,800
449,878
TOTAL ARGENTINA
568,045
Austria – 0.7%
Erste Bank der Oesterreichischen Sparkassen AG
3,400
206,330
Raiffeisen International Bank Holding AG
4,600
400,970
voestalpine AG
2,700
394,229
TOTAL AUSTRIA
1,001,529
Bermuda – 1.1%
Aquarius Platinum Ltd. (Australia)
31,300
450,337
Central European Media Enterprises Ltd. Class A (a)
8,000
515,280
Credicorp Ltd. (NY Shares)
7,900
214,090
Emperor International Holding Ltd.
292,000
71,180
Katanga Mining Ltd. (a)
40,700
253,010
Sinochem Hong Kong Holding Ltd.
195,200
83,082
TOTAL BERMUDA
1,586,979
Brazil – 12.1%
AES Tiete SA (PN) (non-vtg.)
3,193,600
89,901
Banco Bradesco SA:
(PN)
34,600
1,321,166
(PN) sponsored ADR (non-vtg.)
12,300
468,261
Banco do Brasil SA
6,800
195,496
Banco Itau Holding Financeira SA (PN) (non-vtg.)
18,070
579,591
Banco Nossa Caixa SA
7,700
173,776
Companhia Energetica de Minas Gerais (CEMIG) (PN)
sponsored ADR (non-vtg.)
11,500
544,985
Companhia Vale do Rio Doce:
(PN-A) sponsored ADR (non-vtg.)
62,000
2,757,760
sponsored ADR
4,900
252,448
CSU Cardsystem SA sponsored ADR (a)(c)
3,000
76,650
Cyrela Brazil Realty SA
28,900
491,591
Diagnosticos Da America SA (a)
11,100
283,483
Duratex SA (PN)
11,100
237,743
Itausa Investimentos Itau SA (PN)
63,700
292,403
Klabin Industria de Papel e Celulose (PN) (non-vtg.)
114,200
288,373
Localiza Rent a Car SA
26,700
562,913
Lojas Renner SA
11,700
669,933
Natura Cosmeticos SA
17,000
216,186
NET Servicos de Communicacao SA sponsored ADR
45,300
279,048
See accompanying notes which are an integral part of the financial statements.
7 Semiannual Report
Investments (Unaudited) continued
Common Stocks – continued
Shares
Value (Note 1)
Brazil – continued
Petroleo Brasileiro SA Petrobras:
(PN) (non-vtg.)
159,000
$3,529,693
(PN) sponsored ADR (non-vtg.)
8,200
728,898
sponsored ADR
5,900
583,097
Submarino SA
6,500
175,970
TAM SA:
(PN) (ltd.-vtg.)
8,600
222,108
(PN) sponsored ADR (ltd. vtg.)
8,800
221,320
Uniao de Bancos Brasileiros SA (Unibanco):
unit
28,100
445,668
GDR
9,200
730,020
Usinas Siderurgicas de Minas Gerais SA (Usiminas) (PN-A)
(non-vtg.)
22,900
869,037
Vivo Participacoes SA (PN) sponsored ADR
29,900
123,487
TOTAL BRAZIL
17,411,005
British Virgin Islands – 0.2%
Equator Exploration Ltd. (a)
36,100
223,353
Titanium Resources Group Ltd.
22,300
31,112
TOTAL BRITISH VIRGIN ISLANDS
254,465
Canada – 1.0%
Addax Petroleum Corp
4,400
117,753
Falcon Oil & Gas Ltd. (a)
189,000
579,848
First Quantum Minerals Ltd.
4,400
212,680
Pan American Silver Corp. (a)
4,900
121,404
SXR Uranium One, Inc. (a)
24,718
242,555
Valkyries Petroleum Corp. (a)
7,900
100,693
TOTAL CANADA
1,374,933
Cayman Islands – 1.2%
Foxconn International Holdings Ltd. (a)
309,900
667,500
FU JI Food & Catering Services Holdings Ltd.
100,800
210,615
Geely Automobile Holdings Ltd.
125,000
14,994
Lee & Man Paper Manufacturing Ltd.
136,000
199,966
Primeline Energy Holdings, Inc. (a)(d)
26,000
87,907
Primeline Energy Holdings, Inc. warrants 4/4/08 (a)(d)
13,000
29,189
Samson Holding Ltd.
207,900
115,302
SinoCom Software Group Ltd.
170,000
206,106
Xinao Gas Holdings Ltd.
239,000
220,403
TOTAL CAYMAN ISLANDS
1,751,982
See accompanying notes which are an integral part of the financial statements.
Semiannual Report 8
Common Stocks – continued
Shares
Value (Note 1)
China – 2.7%
Agile Property Holdings Ltd.
560,000
$433,364
Angang New Steel Co. Ltd. (H Shares)
109,200
95,069
Beijing Capital International Airport Co. Ltd. (H Shares)
323,100
187,527
China Gas Holdings Ltd. (a)
562,000
97,130
China National Building Materials Co. Ltd. (H Shares)
148,000
61,084
China Petroleum & Chemical Corp. (H Shares)
1,754,100
1,127,886
China Shenhua Energy Co. Ltd. (H Shares)
397,700
720,685
China Techfaith Wireless Communication Technology Ltd.
sponsored ADR
6,100
83,021
Dongfeng Motor Group Co. Ltd. (H Shares)
546,000
272,884
First Tractor Co. Ltd. Class H (a)
514,500
101,529
Golden Eagle Retail Group Ltd. (H Shares)
76,000
42,395
Li Ning Co. Ltd.
270,000
302,968
Shanghai Prime Machinery Co. Ltd. (H Shares)
30,000
11,221
Vision Grande Group Holdings Ltd.
36,000
37,145
Wumart Stores, Inc. (H Shares)
27,500
90,445
Xiamen International Port Co. Ltd. (H Shares)
556,600
139,270
Yantai Changyu Pioneer Wine Co. (B Shares)
42,300
139,612
TOTAL CHINA
3,943,235
Croatia – 0.2%
Pliva D.D. GDR
12,200
251,320
Cyprus – 0.1%
XXI Century Investments Public Ltd.
5,800
83,564
Czech Republic – 0.6%
Ceske Energeticke Zavody AS
24,200
829,224
Egypt – 1.0%
Commercial International Bank Ltd. sponsored GDR
15,400
200,354
Eastern Tobacco Co.
4,100
260,792
Misr International Bank SAE GDR
1,550
5,425
Orascom Construction Industries SAE:
GDR
4,420
358,020
GDR (c)
424
34,344
Orascom Hotels & Development (OHD)
20,054
136,969
Orascom Telecom SAE GDR
9,115
489,476
TOTAL EGYPT
1,485,380
Hong Kong – 2.5%
Chaoda Modern Agriculture (Holdings) Ltd.
772,000
537,681
China Mobile (Hong Kong) Ltd.
276,700
1,597,112
China Overseas Land & Investment Ltd.
288,300
184,062
CNOOC Ltd.
790,800
637,471
See accompanying notes which are an integral part of the financial statements.
9 Semiannual Report
Investments (Unaudited) continued
Common Stocks – continued
Shares
Value (Note 1)
Hong Kong – continued
CNOOC Ltd. sponsored ADR
4,700
$388,596
Kerry Properties Ltd.
65,500
231,898
TOTAL HONG KONG
3,576,820
Hungary – 0.8%
MOL Magyar Olay-es Gazipari RT Series A (For. Reg.)
10,124
1,204,459
India – 2.2%
Apollo Hospitals Enterprise Ltd.
6,000
62,820
Bharat Forge Ltd.
9,417
89,441
Bharti Televentures Ltd. (a)
59,560
555,208
Crompton Greaves Ltd.
8,330
197,146
Federal Bank Ltd.:
GDR (a)
11,701
54,438
GDR (a)(c)
9,000
41,872
Gujarat Ambuja Cement Ltd.
103,259
267,347
Jaiprakash Associates Ltd.
18,333
229,428
Larsen & Toubro Ltd.
8,424
505,590
Nagarjuna Construction Co. Ltd.
5,827
49,348
Reliance Energy Ventures Ltd. (a)
15,556
14,846
Reliance Industries Ltd.
15,556
349,542
Reliance Natural Resources Ltd. (a)
15,556
10,238
Rolta India Ltd.
45,181
256,596
Rolta India Ltd. sponsored GDR (c)
8,800
47,784
Sintex Industries Ltd.
4,182
19,536
State Bank of India
8,349
188,239
Suzlon Energy Ltd.
3,283
92,103
Uti Bank Ltd.
17,200
132,409
TOTAL INDIA
3,163,931
Indonesia – 1.4%
PT Aneka Tambang Tbk
853,000
558,308
PT Bakrie & Brothers Tbk (a)
10,842,500
209,814
PT Medco Energi International Tbk
932,500
509,503
PT Perusahaan Gas Negara Tbk Series B
510,700
720,849
TOTAL INDONESIA
1,998,474
Israel – 2.4%
Bank Hapoalim BM (Reg.)
116,528
587,191
Delek Group Ltd.
400
68,190
ECI Telecom Ltd. (a)
5,300
56,604
Israel Chemicals Ltd.
84,000
332,363
Ituran Location & Control Ltd.
5,900
98,176
See accompanying notes which are an integral part of the financial statements.
Semiannual Report 10
Common Stocks – continued
Shares
Value (Note 1)
Israel – continued
Orckit Communications Ltd. (a)
22,300
$359,476
Ormat Industries Ltd.
25,300
240,579
Orpak Systems Ltd.
19,400
60,501
RADWARE Ltd. (a)
7,300
115,705
Teva Pharmaceutical Industries Ltd. sponsored ADR
38,400
1,555,200
TOTAL ISRAEL
3,473,985
Korea (South) – 19.1%
CJ Corp.
2,490
340,572
CJ Home Shopping
3,169
362,882
Daegu Bank Co. Ltd.
16,870
316,598
Daelim Industrial Co.
6,840
522,165
Daewoo Shipbuilding & Marine Engineering Co. Ltd.
20,670
603,784
Fantom Co. Ltd. (a)
2,700
50,384
Fantom Co. Ltd. rights 5/19/06 (a)
718
1,180
Fursys, Inc.
2,700
89,890
Hanil Cement Co. Ltd.
2,280
164,627
Hanjin Heavy Industries & Construction Co. Ltd.
13,600
423,941
Hanwha Corp.
4,770
149,197
Hynix Semiconductor, Inc. (a)
8,120
283,681
Hyundai Department Store Co. Ltd.
5,710
547,903
Hyundai Engineering & Construction Co. Ltd. (a)
10,100
628,606
Hyundai Mipo Dockyard Co. Ltd.
4,870
456,458
Hyundai Motor Co.
15,700
1,379,982
Industrial Bank of Korea
23,920
481,875
Kookmin Bank
25,800
2,311,510
Korea Investment Holdings Co. Ltd.
8,100
346,965
Korea Zinc Co. Ltd.
4,770
429,384
Korean Air Co. Ltd.
12,510
455,621
Kyeryong Construction Industrial Co. Ltd.
12,230
575,743
LG Electronics, Inc.
10,920
904,259
LG Engineering & Construction Co. Ltd.
8,810
638,927
LG Investment & Securities Co. Ltd.
16,800
411,472
Lotte Shopping Co. Ltd. GDR (a)(c)
11,962
249,842
Macquarie Korea Infrastructure Fund:
GDR (c)
25,000
182,000
GDR
19,600
142,688
MegaStudy Co. Ltd.
2,379
235,844
NHN Corp. (a)
1,614
573,281
Phicom Corp.
3,820
52,451
POSCO
6,210
1,731,676
Samchully Co. Ltd.
1,000
121,402
See accompanying notes which are an integral part of the financial statements.
11 Semiannual Report
Investments (Unaudited) continued
Common Stocks – continued
Shares
Value (Note 1)
Korea (South) – continued
Samsung Electronics Co. Ltd.
9,852
$6,727,129
Samsung Heavy Industries Ltd.
31,090
735,097
Samsung SDI Co. Ltd.
3,500
289,456
Shinhan Financial Group Co. Ltd.
25,930
1,292,170
SK Corp.
14,700
1,081,673
Taewoong Co. Ltd.
11,600
252,749
Woongjin Coway Co. Ltd.
18,950
562,583
Wooree ETI Co. Ltd.
21,500
266,713
Woori Finance Holdings Co. Ltd.
8,610
194,447
TOTAL KOREA (SOUTH)
27,568,807
Lebanon – 0.1%
Solidere GDR (a)
8,200
183,516
Luxembourg – 1.5%
Evraz Group SA:
GDR (c)
2,800
70,000
GDR
16,600
415,000
Orco Property Group
3,900
500,408
Tenaris SA sponsored ADR
26,500
1,216,350
Ternium SA sponsored ADR
900
24,048
TOTAL LUXEMBOURG
2,225,806
Malaysia – 0.5%
Genting BHD
26,700
187,821
Lion Diversified Holdings BHD
77,600
100,612
Resorts World BHD
47,500
175,586
Steppe Cement Ltd. (a)
34,200
123,185
UMW Holdings BHD
73,000
148,014
TOTAL MALAYSIA
735,218
Mexico – 5.8%
America Movil SA de CV Series L sponsored ADR
87,400
3,225,934
Cemex SA de CV sponsored ADR
27,400
1,850,048
Corporacion Geo SA de CV Series B (a)
56,900
213,341
Gruma SA de CV Series B
69,100
216,559
Grupo Mexico SA de CV Series B
346,849
1,215,221
Sare Holding SA de CV Series B (a)
35,100
41,331
Urbi, Desarrollos Urbanos, SA de CV (a)
55,600
454,819
Wal-Mart de Mexico SA de CV Series V
383,604
1,093,709
TOTAL MEXICO
8,310,962
See accompanying notes which are an integral part of the financial statements.
Semiannual Report 12
Common Stocks – continued
Shares
Value (Note 1)
Oman – 0.0%
BankMuscat SAOG sponsored GDR (c)
6,875
$68,406
Philippines – 0.2%
Philippine Long Distance Telephone Co.
8,790
347,589
Poland – 0.2%
Echo Investment SA (a)
700
60,883
Globe Trade Centre SA (a)
600
51,990
TVN SA (a)
6,900
215,780
TOTAL POLAND
328,653
Romania – 0.0%
Banca Transilvania SA
134,500
70,751
Russia – 9.6%
Concern Kalina OJSC (a)
5,400
248,304
JSC MMC ’Norilsk Nickel’ sponsored ADR
14,800
1,961,000
Lukoil Oil Co. sponsored ADR
41,038
3,693,420
Novatek JSC:
GDR
8,900
378,250
GDR (c)
9,700
412,250
Novolipetsk Iron & Steel Corp. sponsored GDR
11,600
255,316
OAO Gazprom sponsored ADR
58,085
2,671,910
Polyus Gold Co. Zao ADR (a)
4,500
156,600
RBC Information Systems Jsc (a)
16,300
151,590
Sberbank RF GDR (a)
3,500
632,923
Seventh Continent (a)
4,100
103,320
Sistema JSFC sponsored:
GDR (c)
7,300
178,850
GDR
9,400
230,300
Surgutneftegaz JSC sponsored ADR
15,200
2,021,600
Vimpel Communications sponsored ADR (a)
12,200
567,910
VSMPO-Avisma Corp.
700
171,500
TOTAL RUSSIA
13,835,043
Singapore – 0.4%
Boustead Singapore Ltd.
192,700
146,276
Keppel Corp. Ltd.
26,600
257,444
Raffles Education Corp. Ltd.
115,800
183,129
TOTAL SINGAPORE
586,849
South Africa – 12.7%
Absa Group Ltd.
27,356
540,068
African Bank Investments Ltd.
165,447
924,577
Anglogold Ashanti Ltd. sponsored ADR
11,800
645,224
See accompanying notes which are an integral part of the financial statements.
13 Semiannual Report
Investments (Unaudited) continued
Common Stocks – continued
Shares
Value (Note 1)
South Africa – continued
Aspen Pharmacare Holdings Ltd.
106,222
$750,842
Aveng Ltd.
92,988
367,467
Edgars Consolidated Stores Ltd.
69,630
440,073
Ellerine Holdings Ltd.
54,132
832,080
FirstRand Ltd.
420,973
1,386,323
Foschini Ltd.
42,800
433,517
Gold Fields Ltd.
64,600
1,641,486
Impala Platinum Holdings Ltd.
5,908
1,120,186
JD Group Ltd.
25,900
400,486
Lewis Group Ltd.
49,822
502,570
MTN Group Ltd.
213,700
2,132,557
Mvelaphanda Group Ltd.
152,500
240,956
Naspers Ltd. Class N sponsored ADR
37,906
834,311
Sasol Ltd.
57,270
2,409,864
Standard Bank Group Ltd.
88,300
1,260,065
Steinhoff International Holdings Ltd.
92,600
367,012
Telkom SA Ltd.
26,200
624,007
Truworths International Ltd.
97,300
469,306
TOTAL SOUTH AFRICA
18,322,977
Spain – 0.2%
Banco Bilbao Vizcaya Argentaria SA sponsored ADR
9,900
218,394
Taiwan – 8.1%
Advanced Semiconductor Engineering, Inc.
720,000
855,262
Chipbond Technology Corp.
189,710
252,701
Delta Electronics, Inc.
260,000
810,004
Foxconn Technology Co. Ltd.
67,000
502,930
High Tech Computer Corp.
29,200
933,492
Hon Hai Precision Industry Co. Ltd. (Foxconn)
305,010
2,069,663
MediaTek, Inc.
72,900
851,102
Motech Industries, Inc.
9,185
254,771
Nan Ya Printed Circuit Board Corp.
10,000
107,503
Novatek Microelectronics Corp.
57,754
343,925
Phoenix Precision Technology Corp.
182,000
414,699
Powertech Technology, Inc.
55,000
188,758
Shin Kong Financial Holding Co. Ltd.
499,000
531,750
Siliconware Precision Industries Co. Ltd.
482,000
699,448
Taiwan Semiconductor Manufacturing Co. Ltd.
1,220,631
2,605,308
TSRC Corp.
305,000
217,953
TOTAL TAIWAN
11,639,269
See accompanying notes which are an integral part of the financial statements.
Semiannual Report 14
Common Stocks – continued
Shares
Value (Note 1)
Thailand – 1.6%
Bangchak Petroleum PCL:
warrants 4/12/11 (a)
17,000
$836
(For. Reg.)
161,400
59,348
Bumrungrad Hospital PCL (For. Reg.)
7,800
7,714
Charoen Pokphand Foods PCL (For. Reg.)
1,357,300
198,912
Minor International PCL (For. Reg.)
1,491,804
461,096
PTT PCL (For. Reg.)
80,500
553,397
Siam Cement PCL (For. Reg.)
52,000
351,932
Siam Commercial Bank PCL (For. Reg.)
391,200
677,538
TOTAL THAILAND
2,310,773
Turkey – 2.5%
Acibadem Saglik Hizmetleri AS
29,400
357,913
Akbank T. A. S.
72,500
603,025
Alarko Gayrimenkul Yatirim Ortakligi AS (a)
2,700
120,454
Aygaz AS
25,600
103,561
Denizbank AS (a)
22,600
199,940
Dogan Yayin Holding AS
87,712
444,363
Dogus Otomotiv Servis ve Ticaret AS
37,300
307,425
Enka Insaat ve Sanayi AS
25,200
390,624
Finansbank AS
144,076
751,701
Selcuk Ecza Deposu Tic AS
10,000
50,662
Turk Traktor ve Ziraat Makinalari AS
17,400
238,140
Vestel White Goods AS
13,000
28,113
TOTAL TURKEY
3,595,921
Ukraine – 0.1%
Stirol sponsored ADR (a)
3,100
72,356
Ukrnafta Open JSC sponsored ADR
285
101,816
TOTAL UKRAINE
174,172
United Arab Emirates – 0.4%
Investcom LLC GDR
35,700
540,855
United Kingdom – 1.5%
Aricom PLC (a)
110,500
119,907
Kazakhgold Group Ltd. GDR
14,700
409,395
Kazakhmys PLC
28,300
587,604
Oxus Gold PLC (a)
80,600
120,535
Sibir Energy PLC (a)
24,600
245,856
Trader Media East Ltd. GDR (a)(c)
6,054
53,881
See accompanying notes which are an integral part of the financial statements.
15 Semiannual Report
Investments (Unaudited)continued
Common Stocks – continued
Shares
Value (Note 1)
United Kingdom – continued
Vedanta Resources PLC
17,400
$500,751
Victoria Oil & Gas PLC (a)
40,100
183,562
TOTAL UNITED KINGDOM
2,221,491
United States of America – 1.2%
Central European Distribution Corp. (a)
3,336
136,943
CTC Media, Inc. (d)
799
23,970
DSP Group, Inc. (a)
3,100
83,824
Freeport-McMoRan Copper & Gold, Inc. Class B
11,100
716,838
NII Holdings, Inc. (a)
9,500
569,050
Zoran Corp. (a)
7,200
197,568
TOTAL UNITED STATES OF AMERICA
1,728,193
TOTAL COMMON STOCKS
(Cost $112,241,545)
138,972,975
Nonconvertible Preferred Stocks — 0.1%
Korea (South) – 0.1%
Samsung Electronics Co. Ltd.
(Cost $121,831)
320
173,376
Money Market Funds — 2.9%
Fidelity Cash Central Fund, 4.8% (b)
(Cost $4,161,276)
4,161,276
4,161,276
TOTAL INVESTMENT PORTFOLIO – 99.3%
(Cost $116,524,652)
143,307,627
NET OTHER ASSETS – 0.7%
1,002,763
NET ASSETS – 100%
$144,310,390
See accompanying notes which are an integral part of the financial statements.
Semiannual Report16
Legend (a) Non-income producing (b) Affiliated fund that is available only to investment companies and other accounts managed by Fidelity Investments. The rate quoted is the annualized seven-day yield of the fund at period end. A complete unaudited listing of the fund’s holdings as of its most recent quarter end is available upon request. (c) Security exempt from registration under Rule 144A of the Securities Act of 1933. These securities may be resold in transactions exempt from registration, normally to qualified institutional buyers. At the period end, the value of these securities amounted to $1,415,879 or 1.0% of net assets. (d) Restricted securities – Investment in securities not registered under the Securities Act of 1933 (excluding 144A issues). At the end of the period, the value of restricted securities (excluding 144A issues) amounted to $141,066 or 0.1% of net assets.
Additional information on each holding is
as follows:
Acquisition
Acquisition
Security
Date
Cost
CTC Media, Inc.
1/26/05
$11,998
Primeline Energy
Holdings, Inc.
3/23/06
$25,263
Primeline Energy
Holdings, Inc.
warrants 4/4/08
3/23/06
$8,210
Affiliated Central Funds
Information regarding fiscal year to date income earned by the fund from the affiliated Central funds is as follows:
Fund
Income earned
Fidelity Cash Central Fund
$91,530
Income Tax Information
At October 31, 2005, the fund had a capital loss carryforward of approximately $81,011 all of which will expire on October 31, 2012.
See accompanying notes which are an integral part of the financial statements.
17 Semiannual Report
Financial Statements
Statement of Assets and Liabilities
April 30, 2006 (Unaudited)
Assets
Investment in securities, at value — See accompanying
schedule:
Unaffiliated issuers (cost $112,363,376)
$139,146,351
Affiliated Central Funds (cost $4,161,276)
4,161,276
Total Investments (cost $116,524,652)
$143,307,627
Receivable for investments sold
1,475,713
Receivable for fund shares sold
2,829,313
Dividends receivable
260,757
Interest receivable
30,420
Receivable from investment adviser for expense
reductions
24,799
Other affiliated receivables
10,966
Other receivables
35,369
Total assets
147,974,964
Liabilities
Payable to custodian bank
$88,014
Payable for investments purchased
3,073,638
Payable for fund shares redeemed
192,766
Accrued management fee
86,758
Distribution fees payable
57,565
Other affiliated payables
36,791
Other payables and accrued expenses
129,042
Total liabilities
3,664,574
Net Assets
$
$144,310,390
Net Assets consist of:
Paid in capital
$117,022,775
Undistributed net investment income
80,386
Accumulated undistributed net realized gain (loss) on
investments and foreign currency transactions
482,207
Net unrealized appreciation (depreciation) on
investments and assets and liabilities in foreign
currencies
26,725,022
Net Assets
$144,310,390
See accompanying notes which are an integral part of the financial statements.
Semiannual Report 18
Statement of Assets and Liabilities continued
April 30, 2006 (Unaudited)
Calculation of Maximum Offering Price
Class A:
Net Asset Value and redemption price per share
($55,563,025 ÷ 2,806,982 shares)
$19.79
Maximum offering price per share (100/94.25 of $19.79)
$21.00
Class T:
Net Asset Value and redemption price per share
($30,957,596 ÷ 1,571,147 shares)
$19.70
Maximum offering price per share (100/96.50 of $19.70)
$20.41
Class B:
Net Asset Value and offering price per share
($17,099,683 ÷ 874,659 shares)A
$19.55
Class C:
Net Asset Value and offering price per share
($31,495,736 ÷ 1,610,705 shares)A
$19.55
Institutional Class:
Net Asset Value, offering price and redemption price per
share ($9,194,350 ÷ 462,150 shares)
$19.89
A Redemption price per share is equal to net asset value less any applicable contingent deferred sales charge.
See accompanying notes which are an integral part of the financial statements.
19 Semiannual Report
Financial Statements continued
Statement of Operations
Six months ended April 30, 2006 (Unaudited)
Investment Income
Dividends
$860,801
Interest
69
Income from affiliated Central Funds
91,530
952,400
Less foreign taxes withheld
(71,369)
Total income
881,031
Expenses
Management fee
$304,805
Transfer agent fees
136,161
Distribution fees
203,971
Accounting fees and expenses
20,522
Independent trustees’ compensation
113
Custodian fees and expenses
113,491
Registration fees
57,790
Audit
29,056
Legal
491
Miscellaneous
640
Total expenses before reductions
867,040
Expense reductions
(218,885)
648,155
Net investment income (loss)
232,876
Realized and Unrealized Gain (Loss)
Net realized gain (loss) on:
Investment securities:
Unaffiliated issuers (net of foreign taxes of $8,471)
709,934
Foreign currency transactions
(110,300)
Total net realized gain (loss)
599,634
Change in net unrealized appreciation (depreciation) on:
Investment securities (net of increase in deferred for-
eign taxes of $40,798)
23,031,980
Assets and liabilities in foreign currencies
(2,188)
Total change in net unrealized appreciation
(depreciation)
23,029,792
Net gain (loss)
23,629,426
Net increase (decrease) in net assets resulting from
operations
$23,862,302
See accompanying notes which are an integral part of the financial statements.
Semiannual Report 20
Statement of Changes in Net Assets
Six months ended
Year ended
April 30, 2006
October 31,
(Unaudited)
2005
Increase (Decrease) in Net Assets
Operations
Net investment income (loss)
$232,876
$84,570
Net realized gain (loss)
599,634
58,159
Change in net unrealized appreciation (depreciation) .
23,029,792
3,425,349
Net increase (decrease) in net assets resulting
from operations
23,862,302
3,568,078
Distributions to shareholders from net investment income .
(233,752)
—
Share transactions net increase (decrease)
91,743,137
20,919,617
Redemption fees
23,506
8,417
Total increase (decrease) in net assets
115,395,193
24,496,112
Net Assets
Beginning of period
28,915,197
4,419,085
End of period (including undistributed net investment
income of $80,386 and undistributed net investment
income of $81,262, respectively)
$144,310,390
$28,915,197
See accompanying notes which are an integral part of the financial statements.
21 Semiannual Report
Financial Highlights — Class A
Six months ended
Years ended
April 30, 2006
October 31,
(Unaudited)
2005
2004F
Selected Per-Share Data
Net asset value, beginning of period
$13.75
$9.87
$10.00
Income from Investment Operations
Net investment income (loss)E
.08
.12
.02
Net realized and unrealized gain (loss)
6.06
3.75
(.16)
Total from investment operations
6.14
3.87
(.14)
Distributions from net investment income
(.11)
—
—
Redemption fees added to paid in capitalE
.01
.01
.01
Net asset value, end of period
$19.79
$13.75
$9.87
Total ReturnB,C,D
44.92%
39.31%
(1.30)%
Ratios to Average Net AssetsG
Expenses before reductions
2.02%A
3.15%
10.75%A
Expenses net of fee waivers, if any
1.60%A
1.63%
2.00%A
Expenses net of all reductions
1.45%A
1.52%
1.91%A
Net investment income (loss)
.92%A
.95%
.28%A
Supplemental Data
Net assets, end of period (000 omitted)
$55,563
$9,617
$1,178
Portfolio turnover rate
29%A
54%
101%A
A
Annualized
B
Total returns for periods of less than one year are not annualized.
C
Total returns would have been lower had certain expenses not been reduced during the periods shown.
D
Total returns do not include the effect of the sales charges.
E
Calculated based on average shares outstanding during the period.
F
For the period March 29, 2004 (commencement of operations) to October 31, 2004.
G
Expense ratios reflect operating expenses of the class. Expenses before reductions do not reflect amounts reimbursed by the investment adviser or
reductions from brokerage service arrangements or other expense offset arrangements and do not represent the amount paid by the class during
periods when reimbursements or reductions occur. Expense ratios before reductions for start-up periods may not be representative of longer-term
operating periods. Expenses net of fee waivers reflect expenses after reimbursement by the investment adviser but prior to reductions from
brokerage service arrangements or other expense offset arrangements. Expenses net of all reductions represent the net expenses paid by the
class.
See accompanying notes which are an integral part of the financial statements.
Semiannual Report22
Financial Highlights — Class T
Six months ended
Years ended
April 30, 2006
October 31,
(Unaudited)
2005
2004F
Selected Per-Share Data
Net asset value, beginning of period
$13.69
$9.86
$10.00
Income from Investment Operations
Net investment income (loss)E
06
.09
—H
Net realized and unrealized gain (loss)
6.03
3.73
(.15)
Total from investment operations
6.09
3.82
(.15)
Distributions from net investment income
(.09)
—
—
Redemption fees added to paid in capitalE
01
.01
.01
Net asset value, end of period
$19.70
$13.69
$9.86
Total ReturnB,C,D
44.73%
38.84%
(1.40)%
Ratios to Average Net AssetsG
Expenses before reductions
2.31%A
3.53%
11.13%A
Expenses net of fee waivers, if any
1.85%A
1.89%
2.25%A
Expenses net of all reductions
1.70%A
1.77%
2.16%A
Net investment income (loss)
68%A
.70%
.03%A
Supplemental Data
Net assets, end of period (000 omitted)
$30,958
$6,801
$889
Portfolio turnover rate
29%A
54%
101%A
A
Annualized
B
Total returns for periods of less than one year are not annualized.
C
Total returns would have been lower had certain expenses not been reduced during the periods shown.
D
Total returns do not include the effect of the sales charges.
E
Calculated based on average shares outstanding during the period.
F
For the period March 29, 2004 (commencement of operations) to October 31, 2004.
G
Expense ratios reflect operating expenses of the class. Expenses before reductions do not reflect amounts reimbursed by the investment adviser or
reductions from brokerage service arrangements or other expense offset arrangements and do not represent the amount paid by the class during
periods when reimbursements or reductions occur. Expense ratios before reductions for start-up periods may not be representative of longer-term
operating periods. Expenses net of fee waivers reflect expenses after reimbursement by the investment adviser but prior to reductions from
brokerage service arrangements or other expense offset arrangements. Expenses net of all reductions represent the net expenses paid by the
class.
H
Amount represents less than $.01 per share.
See accompanying notes which are an integral part of the financial statements.
23Semiannual Report
Financial Highlights — Class B
Six months ended
Years ended
April 30, 2006
October 31,
(Unaudited)
2005
2004F
Selected Per-Share Data
Net asset value, beginning of period
$13.58
$9.83
$10.00
Income from Investment Operations
Net investment income (loss)E
.02
.02
(.03)
Net realized and unrealized gain (loss)
5.99
3.72
(.15)
Total from investment operations
6.01
3.74
(.18)
Distributions from net investment income
(.05)
—
—
Redemption fees added to paid in capitalE
.01
.01
.01
Net asset value, end of period
$19.55
$13.58
$9.83
Total ReturnB,C,D
44.39%
38.15%
(1.70)%
Ratios to Average Net AssetsG
Expenses before reductions
2.85%A
4.00%
11.49%A
Expenses net of fee waivers, if any
2.35%A
2.39%
2.75%A
Expenses net of all reductions
2.19%A
2.27%
2.67%A
Net investment income (loss)
.18%A
.20%
(.47)%A
Supplemental Data
Net assets, end of period (000 omitted)
$17,100
$4,997
$719
Portfolio turnover rate
29%A
54%
101%A
A
Annualized
B
Total returns for periods of less than one year are not annualized.
C
Total returns would have been lower had certain expenses not been reduced during the periods shown.
D
Total returns do not include the effect of the contingent deferred sales charge.
E
Calculated based on average shares outstanding during the period.
F
For the period March 29, 2004 (commencement of operations) to October 31, 2004.
G
Expense ratios reflect operating expenses of the class. Expenses before reductions do not reflect amounts reimbursed by the investment adviser or
reductions from brokerage service arrangements or other expense offset arrangements and do not represent the amount paid by the class during
periods when reimbursements or reductions occur. Expense ratios before reductions for start-up periods may not be representative of longer-term
operating periods. Expenses net of fee waivers reflect expenses after reimbursement by the investment adviser but prior to reductions from
brokerage service arrangements or other expense offset arrangements. Expenses net of all reductions represent the net expenses paid by the
class.
See accompanying notes which are an integral part of the financial statements.
Semiannual Report24
Financial Highlights — Class C
Six months ended
Years ended
April 30, 2006
October 31,
(Unaudited)
2005
2004F
Selected Per-Share Data
Net asset value, beginning of period
$13.59
$9.83
$10.00
Income from Investment Operations
Net investment income (loss)E
02
.02
(.03)
Net realized and unrealized gain (loss)
5.98
3.73
(.15)
Total from investment operations
6.00
3.75
(.18)
Distributions from net investment income
(.05)
—
—
Redemption fees added to paid in capitalE
.01
.01
.01
Net asset value, end of period
$19.55
$13.59
$9.83
Total ReturnB,C,D
44.31%
38.25%
(1.70)%
Ratios to Average Net AssetsG
Expenses before reductions
2.80%A
4.09%
11.58%A
Expenses net of fee waivers, if any
2.35%A
2.39%
2.75%A
Expenses net of all reductions
2.20%A
2.28%
2.66%A
Net investment income (loss)
.17%A
.19%
(.47)%A
Supplemental Data
Net assets, end of period (000 omitted)
$31,496
$5,890
$1,105
Portfolio turnover rate
29%A
54%
101%A
A
Annualized
B
Total returns for periods of less than one year are not annualized.
C
Total returns would have been lower had certain expenses not been reduced during the periods shown.
D
Total returns do not include the effect of the contingent deferred sales charge.
E
Calculated based on average shares outstanding during the period.
F
For the period March 29, 2004 (commencement of operations) to October 31, 2004.
G
Expense ratios reflect operating expenses of the class. Expenses before reductions do not reflect amounts reimbursed by the investment adviser or
reductions from brokerage service arrangements or other expense offset arrangements and do not represent the amount paid by the class during
periods when reimbursements or reductions occur. Expense ratios before reductions for start-up periods may not be representative of longer-term
operating periods. Expenses net of fee waivers reflect expenses after reimbursement by the investment adviser but prior to reductions from
brokerage service arrangements or other expense offset arrangements. Expenses net of all reductions represent the net expenses paid by the
class.
See accompanying notes which are an integral part of the financial statements.
25Semiannual Report
Financial Highlights — Institutional Class
Six months ended
Years ended
April 30, 2006
October 31,
(Unaudited)
2005
2004E
Selected Per-Share Data
Net asset value, beginning of period
$13.80
$9.89
$10.00
Income from Investment Operations
Net investment income (loss)D
.10
.14
.03
Net realized and unrealized gain (loss)
6.09
3.76
(.15)
Total from investment operations
6.19
3.90
(.12)
Distributions from net investment income
(.11)
—
—
Redemption fees added to paid in capitalD
.01
.01
.01
Net asset value, end of period
$19.89
$13.80
$9.89
Total ReturnB,C
45.12%
39.53%
(1.10)%
Ratios to Average Net AssetsF
Expenses before reductions
1.63%A
3.05%
10.37%A
Expenses net of fee waivers, if any
1.35%A
1.41%
1.75%A
Expenses net of all reductions
1.20%A
1.30%
1.66%A
Net investment income (loss)
1.17%A
1.17%
.53%A
Supplemental Data
Net assets, end of period (000 omitted)
$9,194
$1,610
$529
Portfolio turnover rate
29%A
54%
101%A
A
Annualized
B
Total returns for periods of less than one year are not annualized.
C
Total returns would have been lower had certain expenses not been reduced during the periods shown.
D
Calculated based on average shares outstanding during the period.
E
For the period March 29, 2004 (commencement of operations) to October 31, 2004.
F
Expense ratios reflect operating expenses of the class. Expenses before reductions do not reflect amounts reimbursed by the investment adviser or
reductions from brokerage service arrangements or other expense offset arrangements and do not represent the amount paid by the class during
periods when reimbursements or reductions occur. Expense ratios before reductions for start-up periods may not be representative of longer-term
operating periods. Expenses net of fee waivers reflect expenses after reimbursement by the investment adviser but prior to reductions from
brokerage service arrangements or other expense offset arrangements. Expenses net of all reductions represent the net expenses paid by the
class.
See accompanying notes which are an integral part of the financial statements.
Semiannual Report26
Notes to Financial Statements
For the period ended April 30, 2006 (Unaudited)
1. Significant Accounting Policies.
Fidelity Advisor Emerging Markets Fund (the fund) is a fund of Fidelity Advisor Series VIII (the trust) and is authorized to issue an unlimited number of shares. The trust is registered under the Investment Company Act of 1940, as amended (the 1940 Act), as an open-end management investment company organized as a Massachusetts business trust.
The fund offers Class A, Class T, Class B, Class C, and Institutional Class shares, each of which has equal rights as to assets and voting privileges. Each class has exclusive voting rights with respect to matters that affect that class. Class B shares will automatically convert to Class A shares after a holding period of seven years from the initial date of purchase. Investment income, realized and unrealized capital gains and losses, the common expenses of the fund, and certain fund-level expense reductions, if any, are allocated on a pro rata basis to each class based on the relative net assets of each class to the total net assets of the fund. Each class differs with respect to transfer agent and distribution and service plan fees incurred. Certain expense reductions also differ by class.
The fund’s investments in emerging markets can be subject to social, economic, regulatory, and political uncertainties and can be extremely volatile. The fund may invest in affiliated money market central funds (Money Market Central Funds), which are open-end investment companies available to investment companies and other accounts managed by Fidelity Management & Research Company (FMR) and its affiliates. The financial statements have been prepared in conformity with accounting principles generally accepted in the United States of America, which require management to make certain estimates and assumptions at the date of the financial statements. The following summarizes the significant accounting policies of the fund:
Security Valuation. Investments are valued and net asset value (NAV) per share is calculated (NAV calculation) as of the close of business of the New York Stock Exchange (NYSE), normally 4:00 p.m. Eastern time. Wherever possible, the fund uses independent pricing services approved by the Board of Trustees to value its investments.
Equity securities, including restricted securities, for which market quotations are readily available, are valued at the last reported sale price or official closing price as reported by an independent pricing service on the primary market or exchange on which they are traded. In the event there were no sales during the day or closing prices are not available, securities are valued at the last quoted bid price. Investments in open-end mutual funds, are valued at their closing net asset value each business day. Short-term securities with remaining maturities of sixty days or less for which quotations are not readily available are valued at amortized cost, which approximates value.
27 Semiannual Report
Notes to Financial Statements (Unaudited) continued
1. Significant Accounting Policies continued
Security Valuation continued
When current market prices or quotations are not readily available or do not accurately reflect fair value, valuations may be determined in accordance with procedures adopted by the Board of Trustees. For example, when developments occur between the close of a market and the close of the NYSE that may materially affect the value of some or all of the securities, or when trading in a security is halted, those securities may be fair valued. Factors used in the determination of fair value may include monitoring news to identify significant market or security specific events such as changes in the value of U.S. securities markets, reviewing developments in foreign markets and evaluating the performance of ADRs, futures contracts and exchange-traded funds. Because the fund’s utilization of fair value pricing depends on market activity, the frequency with which fair value pricing is used can not be predicted and may be utilized to a significant extent. The value of securities used for NAV calculation under fair value pricing may differ from published prices for the same securities.
Foreign Currency. The fund uses foreign currency contracts to facilitate transactions in foreign-denominated securities. Losses from these transactions may arise from changes in the value of the foreign currency or if the counterparties do not perform under the contracts’ terms.
Foreign-denominated assets, including investment securities, and liabilities are translated into U.S. dollars at the exchange rate at period end. Purchases and sales of investment securities, income and dividends received and expenses denominated in foreign currencies are translated into U.S. dollars at the exchange rate in effect on the transaction date.
The effects of exchange rate fluctuations on investments are included with the net realized and unrealized gain (loss) on investment securities. Other foreign currency transactions resulting in realized and unrealized gain (loss) are disclosed separately.
Investment Transactions and Income. Security transactions are accounted for as of trade date. Gains and losses on securities sold are determined on the basis of identified cost. Dividend income is recorded on the ex-dividend date, except for certain dividends from foreign securities where the ex-dividend date may have passed, which are recorded as soon as the fund is informed of the ex-dividend date. Non-cash dividends included in dividend income, if any, are recorded at the fair market value of the securities received. Interest income is accrued as earned. Interest income includes coupon interest and amortization of premium and accretion of discount on debt securities. Investment income is recorded net of foreign taxes withheld where recovery of such taxes is uncertain.
Semiannual Report 28
1. Significant Accounting Policies continued
Expenses. Most expenses of the trust can be directly attributed to a fund. Expenses which cannot be directly attributed are apportioned among each fund in the trust.
Income Tax Information and Distributions to Shareholders. Each year, the fund intends to qualify as a regulated investment company by distributing all of its taxable income and realized gains under Subchapter M of the Internal Revenue Code. As a result, no provision for income taxes is required in the accompanying financial statements. Foreign taxes are provided for based on the fund’s understanding of the tax rules and rates that exist in the foreign markets in which it invests.
Distributions are recorded on the ex-dividend date. Income dividends and capital gain distributions are declared separately for each class. Income and capital gain distributions are determined in accordance with income tax regulations, which may differ from generally accepted accounting principles.
Capital accounts within the financial statements are adjusted for permanent book-tax differences. These adjustments have no impact on net assets or the results of operations. Temporary book-tax differences will reverse in a subsequent period.
Book-tax differences are primarily due to foreign currency transactions, certain foreign taxes, passive foreign investment companies (PFIC) and losses deferred due to wash sales.
The federal tax cost of investments and unrealized appreciation (depreciation) as of
period end were as follows:
Unrealized appreciation
$27,983,339
Unrealized depreciation
(1,223,224)
Net unrealized appreciation (depreciation)
$26,760,115
Cost for federal income tax purposes
$116,547,512
Short-Term Trading (Redemption) Fees. Shares held in the fund less than 90 days are subject to a redemption fee equal to 1.50% of the proceeds of the redeemed shares. All redemption fees, including any estimated redemption fees paid by FMR, are retained by the fund and accounted for as an addition to paid in capital.
29 Semiannual Report
Notes to Financial Statements (Unaudited) continued
2. Operating Policies.
Repurchase Agreements. FMR has received an Exemptive Order from the Securities and Exchange Commission (the SEC) which permits the fund and other affiliated entities of FMR to transfer uninvested cash balances into joint trading accounts which are then invested in repurchase agreements. The fund may also invest directly with institutions in repurchase agreements. Repurchase agreements are collateralized by government or non-government securities. Upon settlement date, collateral is held in segregated accounts with custodian banks and may be obtained in the event of a default of the counterparty. The fund monitors, on a daily basis, the value of the collateral to ensure it is at least equal to the principal amount of the repurchase agreement (including accrued interest). In the event of a default by the counterparty, realization of the collateral proceeds could be delayed, during which time the value of the collateral may decline.
Restricted Securities. The fund may invest in securities that are subject to legal or contractual restrictions on resale. These securities generally may be resold in transactions exempt from registration or to the public if the securities are registered. Disposal of these securities may involve time-consuming negotiations and expense, and prompt sale at an acceptable price may be difficult. Information regarding restricted securities is included at the end of the fund’s Schedule of Investments.
3. Purchases and Sales of Investments.
Purchases and sales of securities, other than short-term securities and U.S. government securities, aggregated $97,846,602 and $10,554,938, respectively.
4. Fees and Other Transactions with Affiliates.
Management Fee. FMR and its affiliates provide the fund with investment management related services for which the fund pays a monthly management fee. The management fee is the sum of an individual fund fee rate that is based on an annual rate of .55% of the fund’s average net assets and a group fee rate that averaged .27% during the period. The group fee rate is based upon the average net assets of all the mutual funds advised by FMR. The group fee rate decreases as assets under management increase and increases as assets under management decrease. For the period, the total annualized management fee rate was .82% of the fund’s average net assets.
Semiannual Report 30
4. Fees and Other Transactions with Affiliates continued
Distribution and Service Plan. In accordance with Rule 12b-1 of the 1940 Act, the fund has adopted separate Distribution and Service Plans for each class of shares. Certain classes pay Fidelity Distributors Corporation (FDC), an affiliate of FMR, separate Distribution and Service Fees, each of which is based on an annual percentage of each class’ average net assets. In addition, FDC may pay financial intermediaries for selling shares of the fund and providing shareholder support services. For the period, the Distribution and Service Fee rates and the total amounts paid to and retained by FDC were as follows:
Distribution
Service
Paid to
Retained
Fee
Fee
FDC
by FDC
Class A
0%
.25%
$34,574
$1,754
Class T
.25%
.25%
42,036
908
Class B
.75%
.25%
51,459
39,095
Class C
.75%
.25%
75,902
49,443
$203,971
$91,200
Sales Load. FDC receives a front-end sales charge of up to 5.75% for selling Class A shares, and 3.50% for selling Class T shares, some of which is paid to financial intermediaries for selling shares of the fund. FDC receives the proceeds of contingent deferred sales charges levied on Class A, Class T, Class B, and Class C redemptions. These charges depend on the holding period. The deferred sales charges range from 5% to 1% for Class B, 1% for Class C, 1.00% to .50% for certain purchases of Class A shares (.25% prior to February 24, 2006) and .25% for certain purchases of Class T shares.
For the period, sales charge amounts retained by FDC were as follows:
Retained
by FDC
Class A
$105,680
Class T
25,846
Class B*
4,244
Class C*
1,469
$137,239
* When Class B and Class C shares are initially sold, FDC pays commissions from its own resources to financial intermediaries through which the sales
are made.
31 Semiannual Report
Notes to Financial Statements (Unaudited) continued
4. Fees and Other Transactions with Affiliates continued
Transfer Agent Fees. Fidelity Investments Institutional Operations Company, Inc. (FIIOC), an affiliate of FMR, is the transfer, dividend disbursing and shareholder servicing agent for each class of the fund. FIIOC receives account fees and asset-based fees that vary according to the account size and type of account of the shareholders of the respective classes of the fund. FIIOC pays for typesetting, printing and mailing of shareholder reports, except proxy statements. For the period the total transfer agent fees paid by each class to FIIOC, were as follows:
% of
Average
Amount
Net Assets
Class A
$48,780
.35*
Class T
32,393
.39*
Class B
21,726
.42*
Class C
28,314
.37*
Institutional Class
4,948
.21*
$136,161
* Annualized
Accounting Fees. Fidelity Service Company, Inc. (FSC), an affiliate of FMR, maintains the fund’s accounting records. The fee is based on the level of average net assets for the month.
Affiliated Central Funds. The fund may invest in Money Market Central Funds which seek preservation of capital and current income and are managed by Fidelity Investments Money Management, Inc. (FIMM), an affiliate of FMR.
The Money Market Central Funds do not pay a management fee.
Brokerage Commissions. The fund placed a portion of its portfolio transactions with brokerage firms which are affiliates of the investment adviser. The commissions paid to these affiliated firms were $48 for the period.
5. Committed Line of Credit.
The fund participates with other funds managed by FMR in a $4.2 billion credit facility (the “line of credit”) to be utilized for temporary or emergency purposes to fund shareholder redemptions or for other short-term liquidity purposes. The fund has agreed to pay commitment fees on its pro rata portion of the line of credit, which amounts to $58 and is reflected in Miscellaneous Expense on the Statement of Operations. During the period, there were no borrowings on this line of credit.
Semiannual Report 32
6. Expense Reductions.
FMR voluntarily agreed to reimburse each class to the extent annual operating expenses exceeded certain levels of average net assets as noted in the table below. Some expenses, for example interest expense, are excluded from this reimbursement.
The following classes were in reimbursement during the period:
Expense
Reimbursement
Limitations
from adviser
Class A
1.60%
$57,744
Class T
1.85%
38,353
Class B
2.35%
25,641
Class C
2.35%
33,676
Institutional Class
1.35%
6,513
161,927
Many of the brokers with whom FMR places trades on behalf of the fund provided services to the fund in addition to trade execution. These services included payments of certain expenses on behalf of the fund totaling $56,595 for the period. In addition, through arrangements with the fund’s custodian, credits realized as a result of uninvested cash balances were used to reduce the fund’s expenses. During the period, these credits reduced the fund’s custody expenses by $363.
7. Other.
The fund’s organizational documents provide former and current trustees and officers with a limited indemnification against liabilities arising in connection with the performance of their duties to the fund. In the normal course of business, the fund may also enter into contracts that provide general indemnifications. The fund’s maximum exposure under these arrangements is unknown as this would be dependent on future claims that may be made against the fund. The risk of material loss from such claims is considered remote.
8. Distributions to Shareholders.
Distributions to shareholders of each class were as follows:
Six months ended
Year ended
April 30,
October 31,
2006
2005
From net investment income
Class A
$108,159
$—
Class T
59,395
—
Class B
22,205
—
Class C
28,882
—
Institutional Class
15,111
—
Total
$233,752
$—
33Semiannual Report
Notes to Financial Statements (Unaudited) continued
9. Share Transactions.
Transactions for each class of shares were as follows:
Shares
Dollars
Six months ended
Year ended
Six months ended
��
Year ended
April 30,
October 31,
April 30,
October 31,
2006
2005
2006
2005
Class A
Shares sold
2,241,504
626,290
$39,547,469
$7,938,744
Reinvestment of
distributions
5,648
—
88,424
—
Shares redeemed
(139,515)
(46,288)
(2,417,745)
(542,567)
Net increase
(decrease)
2,107,637
580,002
$37,218,148
$7,396,177
Class T
Shares sold
1,200,398
460,358
$21,030,203
$5,753,778
Reinvestment of
distributions
3,457
—
54,063
—
Shares redeemed
(129,379)
(53,845)
(2,271,467)
(661,780)
Net increase
(decrease)
1,074,476
406,513
$18,812,799
$5,091,998
Class B
Shares sold
601,820
336,021
$10,430,506
$4,091,942
Reinvestment of
distributions
1,278
—
20,092
—
Shares redeemed
(96,402)
(41,193)
(1,677,913)
(504,698)
Net increase
(decrease)
506,696
294,828
$8,772,685
$3,587,244
Class C
Shares sold
1,272,368
386,910
$22,421,931
$4,844,275
Reinvestment of
distributions
1,539
—
24,174
—
Shares redeemed
(96,769)
(65,733)
(1,664,465)
(821,834)
Net increase
(decrease)
1,177,138
321,177
$20,781,640
$4,022,441
Institutional Class
Shares sold
387,798
77,612
$6,915,386
$997,482
Reinvestment of
distributions
676
—
10,642
—
Shares redeemed
(42,948)
(14,515)
(768,163)
(175,725)
Net increase
(decrease)
345,526
63,097
$6,157,865
$821,757
Semiannual Report 34
Board Approval of Investment Advisory Contracts and Management Fees
Advisor Emerging Markets Fund
On January 19, 2006, the Board of Trustees, including the Independent Trustees (together, the Board), voted to approve a general research services agreement (the Agreement) between FMR, FMR Co., Inc. (FMRC), Fidelity Investments Money Management, Inc. (FIMM), and Fidelity Research & Analysis Company (FRAC) (together, the Investment Advisers) for the fund, effective January 20, 2006, pursuant to which FRAC may provide general research and investment advisory support services to FMRC and FIMM. The Board considered that it has approved previously various sub-advisory agreements for the fund with affiliates of FMR that allow FMR to obtain research, non-discretionary advice, or discretionary portfolio management at no additional expense to the fund. The Board, assisted by the advice of fund counsel and independent Trustees’ counsel, considered a broad range of information and determined that it would be beneficial for the fund to access the research and investment advisory support services supplied by FRAC at no additional expense to the fund.
The Board reached this determination in part because the new arrangement will involve no changes in (i) the contractual terms of and fees payable under the fund’s management contract or sub-advisory agreements; (ii) the investment process or strategies employed in the management of the fund’s assets; (iii) the nature or level of services provided under the fund’s management contract or sub-advisory agreements; (iv) the day-to-day management of the fund or the persons primarily responsible for such management; or (v) the ultimate control or beneficial ownership of FMR, FMRC, or FIMM. The Board also considered that the establishment of the Agreement would not necessitate prior shareholder approval of the Agreement or result in an assignment and termination of the fund’s management contract or sub-advisory agreements under the Investment Company Act of 1940.
Because the Board was approving an arrangement with FRAC under which the fund will not bear any additional management fees or expenses and under which the fund’s portfolio manager would not change, it did not consider the fund’s investment performance, competitiveness of management fee and total expenses, costs of services and profitability, or economies of scale to be significant factors in its decision.
In connection with its future renewal of the fund’s management contract and sub-advisory agreements, the Board will consider: (i) the nature, extent, and quality of services provided to the fund, including shareholder and administrative services and investment performance; (ii) the competitiveness of the fund’s management fee and total expenses; (iii) the costs of the services and profitability, including the revenues earned and the expenses incurred by Fidelity in conducting the business of developing, marketing, distributing, managing, administering, and servicing the fund and its shareholders; and (iv) whether there have been economies of scale in respect of the management of the Fidelity funds, whether the Fidelity funds (including the fund) have
35 Semiannual Report
Board Approval of Investment Advisory Contracts and Management Fees continued
appropriately benefited from any such economies of scale, and whether there is potential for realization of any further economies.
Based on its evaluation of all of the conclusions noted above, and after considering all material factors, the Board ultimately concluded that the fund’s Agreement is fair and reasonable, and that the fund’s Agreement should be approved.
Semiannual Report 36
37 Semiannual Report
Semiannual Report 38
39 Semiannual Report
Investment Adviser Fidelity Management & Research Company Boston, MA Investment Sub-Advisers FMR Co., Inc. Fidelity Management & Research (U.K.) Inc. Fidelity Research & Analysis Company (formerly Fidelity Management & Research (Far East) Inc.) Fidelity International Investment Advisors Fidelity Investments Japan Limited Fidelity International Investment Advisors (U.K.) Limited General Distributor Fidelity Distributors Corporation Boston, MA Transfer and Service Agents Fidelity Investments Institutional Operations Company, Inc. Boston, MA Fidelity Service Company, Inc. Boston, MA Custodian JPMorgan Chase Bank New York, NY
FAEMI-USAN-0606 1.800640.102
Item 2. Code of Ethics
Not applicable.
Item 3. Audit Committee Financial Expert
Not applicable.
Item 4. Principal Accountant Fees and Services
Not applicable.
Item 5. Audit Committee of Listed Registrants
Not applicable.
Item 6. Schedule of Investments
Not applicable.
Item 7. Disclosure of Proxy Voting Policies and Procedures for Closed-End Management Investment Companies
Not applicable.
Item 8. Portfolio Managers of Closed-End Management Investment Companies
Not applicable.
Item 9. Purchase of Equity Securities by Closed-End Management Investment Company and Affiliated Purchasers
Not applicable.
Item 10. Submission of Matters to a Vote of Security Holders
There were no material changes to the procedures by which shareholders may recommend nominees to the Fidelity Advisor Series VIII: Fidelity Advisor Emerging Markets Fund's Board of Trustees.
Item 11. Controls and Procedures
(a)(i) The President and Treasurer and the Chief Financial Officer have concluded that the Fidelity Advisor Series VIII: Fidelity Advisor Emerging Markets Fund's (the "Fund") disclosure controls and procedures (as defined in Rule 30a-3(c) under the Investment Company Act) provide reasonable assurances that material information relating to the Fund is made known to them by the appropriate persons, based on their evaluation of these controls and procedures as of a date within 90 days of the filing date of this report.
(a)(ii) There was no change in the Fund's internal control over financial reporting (as defined in Rule 30a-3(d) under the Investment Company Act) that occurred during the second fiscal quarter of the period covered by this report that has materially affected, or is reasonably likely to materially affect, the Fund's internal control over financial reporting.
Item 12. Exhibits
(a)
(1)
Not applicable.
(a)
(2)
Certification pursuant to Rule 30a-2(a) under the Investment Company Act of 1940 (17 CFR 270.30a-2(a)) is filed and attached hereto as Exhibit 99.CERT.
(a)
(3)
Not applicable.
(b)
Certification pursuant to Rule 30a-2(b) under the Investment Company Act of 1940 (17 CFR 270.30a-2(b)) is furnished and attached hereto as Exhibit 99.906CERT.
SIGNATURES
Pursuant to the requirements of the Securities Exchange Act of 1934 and the Investment Company Act of 1940, the registrant has duly caused this report to be signed on its behalf by the undersigned, thereunto duly authorized.
Fidelity Advisor Series VIII
By:
/s/Christine Reynolds
Christine Reynolds
President and Treasurer
Date:
June 15, 2006
Pursuant to the requirements of the Securities Exchange Act of 1934 and the Investment Company Act of 1940, this report has been signed below by the following persons on behalf of the registrant and in the capacities and on the dates indicated.
By:
/s/Christine Reynolds
Christine Reynolds
President and Treasurer
Date:
June 15, 2006
By:
/s/Paul M. Murphy
Paul M. Murphy
Chief Financial Officer
Date:
June 15, 2006
We use cookies on this site to provide a more responsive and personalized service. Continuing to browse, clicking I Agree, or closing this banner indicates agreement. See our Cookie Policy for more information.