UNITED STATES
SECURITIES AND EXCHANGE COMMISSION
Washington, D.C. 20549
FORM N-CSR
CERTIFIED SHAREHOLDER REPORT OF REGISTERED
MANAGEMENT INVESTMENT COMPANIES
Investment Company Act file number 811-3855
Fidelity Advisor Series VIII
(Exact name of registrant as specified in charter)
82 Devonshire St., Boston, Massachusetts 02109
(Address of principal executive offices) (Zip code)
Eric D. Roiter, Secretary
82 Devonshire St.
Boston, Massachusetts 02109
(Name and address of agent for service)
Registrant's telephone number, including area code: 617-563-7000
Date of fiscal year end: | October 31 |
| |
Date of reporting period: | October 31, 2007 |
Item 1. Reports to Stockholders
(Fidelity Investment logo)(registered trademark)
Fidelity® Advisor
Diversified International
Fund - Class A, Class T, Class B
and Class C
Annual Report
October 31, 2007
(2_fidelity_logos) (Registered_Trademark)
Contents
Chairman's Message | <Click Here> | Ned Johnson's message to shareholders. |
Note to Shareholders | <Click Here> | |
Performance | <Click Here> | How the fund has done over time. |
Management's Discussion | <Click Here> | The manager's review of fund performance, strategy and outlook. |
Shareholder Expense Example | <Click Here> | An example of shareholder expenses. |
Investment Changes | <Click Here> | A summary of major shifts in the fund's investments over the past six months. |
Investments | <Click Here> | A complete list of the fund's investments with their market values. |
Financial Statements | <Click Here> | Statements of assets and liabilities, operations, and changes in net assets,
as well as financial highlights. |
Notes | <Click Here> | Notes to the financial statements. |
Report of Independent Registered Public Accounting Firm | <Click Here> | |
Trustees and Officers | <Click Here> | |
Distributions | <Click Here> | |
Proxy Voting Results | <Click Here> | |
Board Approval of Investment Advisory Contracts and Management Fees | <Click Here> | |
To view a fund's proxy voting guidelines and proxy voting record for the 12-month period ended June 30, visit http://www.fidelity.com(search for proxy voting results) or visit the Securities and Exchange Commission's (SEC) web site at http://www.sec.gov. You may also call 1-877-208-0098 to request a free copy of the proxy voting guidelines.
Standard & Poor's, S&P and S&P 500 are registered service marks of The McGraw-Hill Companies, Inc. and have been licensed for use by Fidelity Distributors Corporation.
Other third party marks appearing herein are the property of their respective owners.
All other marks appearing herein are registered or unregistered trademarks or service marks of FMR LLC or an affiliated company.
Annual Report
This report and the financial statements contained herein are submitted for the general information of the shareholders of the fund. This report is not authorized for distribution to prospective investors in the fund unless preceded or accompanied by an effective prospectus.
A fund files its complete schedule of portfolio holdings with the SEC for the first and third quarters of each fiscal year on Form N-Q. Forms N-Q are available on the SEC's web site at http://www.sec.gov. A fund's Forms N-Q may be reviewed and copied at the SEC's Public Reference Room in Washington, DC. Information regarding the operation of the SEC's Public Reference Room may be obtained by calling 1-800-SEC-0330. For a complete list of a fund's portfolio holdings, view the most recent holdings listing, semiannual report, or annual report on Fidelity's web site at http://www.fidelity.com, or http://www.advisor.fidelity.com, as applicable.
NOT FDIC INSURED · MAY LOSE VALUE · NO BANK GUARANTEE
Neither the fund nor Fidelity Distributors Corporation is a bank.
Annual Report
Chairman's Message
(photo_of_Edward_C_Johnson_3d)
Dear Shareholder:
Many stock and bond markets around the world have been unsettled of late; however, volatility can often lead to opportunity for patient investors. Financial markets are always unpredictable, but there are a number of time-tested principles that can put the historical odds in your favor.
One of the basic tenets is to invest for the long term. Over time, riding out the markets' inevitable ups and downs has proven much more effective than selling into panic or chasing the hottest trend. Even missing only a few of the markets' best days can significantly diminish investor returns. Patience also affords the benefits of compounding - of earning interest on additional income or reinvested dividends and capital gains. There are tax advantages and cost benefits to consider as well. The more you sell, the more taxes you pay, and the more you trade, the higher the costs. While staying the course doesn't eliminate risk, it can considerably lessen the effect of short-term declines.
You can further manage your investing risk through diversification. And today, more than ever, geographic diversification should be taken into account. Studies indicate that asset allocation is the single most important determinant of a portfolio's long-term success. The right mix of stocks, bonds and cash - aligned to your particular risk tolerance and investment objective - is very important. Age-appropriate rebalancing is also an essential aspect of asset allocation. For younger investors, an emphasis on equities - which historically have been the best-performing asset class over time - is encouraged. As investors near their specific goal, such as retirement or sending a child to college, consideration may be given to replacing volatile assets (e.g. common stocks) with more-stable fixed investments (bonds or savings plans).
A third investment principle - investing regularly - can help lower the average cost of your purchases. Investing a certain amount of money each month or quarter helps ensure you won't pay for all your shares at market highs. This strategy - known as dollar cost averaging - also reduces unconstructive "emotion" from investing, helping shareholders avoid selling weak performers just prior to an upswing, or chasing a hot performer just before a correction.
We invite you to contact us via the Internet, through our Investor Centers or over the phone. It is our privilege to provide you the information you need to make the investments that are right for you.
Sincerely,
/s/Edward C. Johnson 3d
Edward C. Johnson 3d
Annual Report
Note to Shareholders:
At a shareholder meeting of Fidelity® Advisor Diversified International Fund held on October 17, 2007, the proposal to approve a new management contract for the fund did not receive the vote required for approval. As a result, the current management contract will remain in effect for the fund.
Annual Report
Performance: The Bottom Line
Average annual total return reflects the change in the value of an investment, assuming reinvestment of the class' dividend income and capital gains (the profits earned upon the sale of securities that have grown in value) and assuming a constant rate of performance each year. The $10,000 table and the fund's returns do not reflect the deduction of taxes that a shareholder would pay on fund distributions or the redemption of fund shares. During periods of reimbursement by Fidelity, a fund's total return will be greater than it would be had the reimbursement not occurred. How a fund did yesterday is no guarantee of how it will do tomorrow. Returns may reflect the conversion of Class B shares to Class A shares after a maximum of seven years.
Average Annual Total Returns
Periods ended October 31, 2007 | | Past 1
year | Past 5
years | Life of
fund A |
Class A (incl. 5.75% sales
charge) | | 15.70% | 21.24% | 13.25% |
Class T (incl. 3.50% sales
charge) | | 18.14% | 21.50% | 13.24% |
Class B (incl. contingent
deferred sales charge) B | | 16.73% | 21.44% | 13.25% |
Class C (incl. contingent
deferred sales charge) C | | 20.81% | 21.72% | 13.12% |
A From December 17, 1998.
B Class B shares' contingent deferred sales charges included in the past one year, past five years, and life of fund total return figures are 5%, 2%, and 0%, respectively.
C Class C shares' contingent deferred sales charges included in the past one year, past five years, and life of fund total return figures are 1%, 0%, and 0%, respectively.
Annual Report
$10,000 Over Life of Fund*
Let's say hypothetically that $10,000 was invested in Fidelity® Advisor Diversified International Fund - Class T on December 31, 1998, and the current 3.50% sales charge was paid. The chart shows how the value of your investment would have changed, and also shows how the Morgan Stanley Capital InternationalSM Europe, Australasia, Far East (MSCI® EAFE®) Index performed over the same period.
* From December 31, 1998 (first date following the fund's commencement for which the life of fund return for the MSCI EAFE Index is available).
Annual Report
Management's Discussion of Fund Performance
Comments from Penelope Dobkin, Portfolio Manager of Fidelity® Advisor Diversified International Fund
Foreign stocks, with a large assist from a weak U.S. dollar, generally had higher returns for U.S. investors than domestic equities during the 12-month period ending October 31, 2007. The backdrop for global stocks was solid, with robust economic growth and relatively high corporate profitability worldwide. Developed international equity markets, as measured by the Morgan Stanley Capital InternationalSM Europe, Australasia, and Far East (MSCI® EAFE®) Index - a performance monitor of established markets outside the United States and Canada - rose 25.09%. In comparison, the Standard & Poor's 500SM Index, a gauge of U.S. stocks, was up 14.56%. Among countries making up at least 1% of the EAFE benchmark, Finland had the best showing, soaring nearly 69%, while Hong Kong gained roughly 66%. The United Kingdom and Japan, the two largest components of the index, both underperformed. Fallout from the credit crunch and concerns about export growth tempered UK stocks, while Japan struggled with a slowdown in consumer spending and sluggish domestic growth. Emerging markets were the period's big winners, advancing 68.33% as measured by the MSCI Emerging Markets index.
For the 12 months ending October 31, 2007, the fund's Class A, Class T, Class B and Class C shares returned 22.76%, 22.43%, 21.73% and 21.81%, respectively (excluding sales charges), trailing the MSCI EAFE index. The largest drag on performance was the fund's overweighting in Japan, combined with weak stock selection there. On a sector basis, we had disappointing results within financials, and our positioning in the consumer sectors also detracted. A modest cash position hurt as well. Conversely, from a geographic standpoint, good stock selection and an underweighting in the UK market made healthy contributions to relative returns. Our focus on capital goods worldwide and an overweighting in Germany also paid off, as did stock selection in energy, technology, health care and materials. On an individual stock basis, detractors included Japanese financials ORIX, Daiwa Securities and out-of-benchmark OMC Card. Contributors included German holding SGL Carbon AG, the world's largest producer of carbon and graphite products. Backed by European and Asian demand for its steel products, SGL saw its stock price soar. Australian pharmaceutical company CSL was another strong performer. It owns the sole license for blockbuster cervical-cancer drug Gardasil, and its share price surged as demand rose worldwide.
The views expressed above reflect those of the portfolio manager(s) only through the end of the period as stated on the cover of this report and do not necessarily represent the views of Fidelity or any other person in the Fidelity organization. Any such views are subject to change at any time based upon market or other conditions and Fidelity disclaims any responsibility to update such views. These views may not be relied on as investment advice and, because investment decisions for a Fidelity fund are based on numerous factors, may not be relied on as an indication of trading intent on behalf of any Fidelity fund.
Annual Report
Shareholder Expense Example
As a shareholder of the Fund, you incur two types of costs: (1) transaction costs, including sales charges (loads) on purchase payments or redemption proceeds, redemption fees, and (2) ongoing costs, including management fees, distribution and/or service (12b-1) fees and other Fund expenses. This Example is intended to help you understand your ongoing costs (in dollars) of investing in the Fund and to compare these costs with the ongoing costs of investing in other mutual funds.
The Example is based on an investment of $1,000 invested at the beginning of the period and held for the entire period (May 1, 2007 to October 31, 2007).
Actual Expenses
The first line of the accompanying table for each class of the Fund provides information about actual account values and actual expenses. You may use the information in this line, together with the amount you invested, to estimate the expenses that you paid over the period. Simply divide your account value by $1,000.00 (for example, an $8,600 account value divided by $1,000.00 = 8.6), then multiply the result by the number in the first line for a class of the Fund under the heading entitled "Expenses Paid During Period" to estimate the expenses you paid on your account during this period. In addition, the Fund, as a shareholder in the underlying Fidelity Central Funds, will indirectly bear its pro rata share of the fees and expenses incurred by the underlying Fidelity Central Funds. These fees and expenses are not included in the Fund's annualized expense ratio used to calculate the expense estimate in the table below.
Hypothetical Example for Comparison Purposes
The second line of the accompanying table for each class of the Fund provides information about hypothetical account values and hypothetical expenses based on a Class' actual expense ratio and an assumed rate of return of 5% per year before expenses, which is not the Class' actual return. The hypothetical account values and expenses may not be used to estimate the actual ending account balance or expenses you paid for the period. You may use this information to compare the ongoing costs of investing in the Fund and other funds. To do so, compare this 5% hypothetical example with the 5% hypothetical examples that appear in the shareholder reports of the other funds. In addition, the Fund, as a shareholder in the underlying Fidelity Central Funds, will indirectly bear its pro rata share of the fees and expenses incurred by the underlying Fidelity Central Funds. These fees and expenses are not included in the Fund's annualized expense ratio used to calculate the expense estimate in the table below.
Please note that the expenses shown in the table are meant to highlight your ongoing costs only and do not reflect any transaction costs. Therefore, the second line of the table is useful in comparing ongoing costs only, and will not help you determine the relative total costs of owning different funds. In addition, if these transactional costs were included, your costs would have been higher.
Annual Report
Shareholder Expense Example - continued
| Beginning
Account Value
May 1, 2007 | Ending
Account Value
October 31, 2007 | Expenses Paid
During Period*
May 1, 2007
to October 31, 2007 |
Class A | | | |
Actual | $ 1,000.00 | $ 1,079.50 | $ 6.60 |
HypotheticalA | $ 1,000.00 | $ 1,018.85 | $ 6.41 |
Class T | | | |
Actual | $ 1,000.00 | $ 1,077.90 | $ 7.75 |
HypotheticalA | $ 1,000.00 | $ 1,017.74 | $ 7.53 |
Class B | | | |
Actual | $ 1,000.00 | $ 1,075.20 | $ 10.93 |
HypotheticalA | $ 1,000.00 | $ 1,014.67 | $ 10.61 |
Class C | | | |
Actual | $ 1,000.00 | $ 1,075.50 | $ 10.52 |
HypotheticalA | $ 1,000.00 | $ 1,015.07 | $ 10.21 |
Institutional Class | | | |
Actual | $ 1,000.00 | $ 1,081.10 | $ 5.19 |
HypotheticalA | $ 1,000.00 | $ 1,020.21 | $ 5.04 |
A 5% return per year before expenses
* Expenses are equal to each Class' annualized expense ratio (shown in the table below); multiplied by the average account value over the period, multiplied by 184/365 (to reflect the one-half year period).
| Annualized
Expense Ratio |
Class A | 1.26% |
Class T | 1.48% |
Class B | 2.09% |
Class C | 2.01% |
Institutional Class | .99% |
Annual Report
Investment Changes
Top Five Stocks as of October 31, 2007 |
| % of fund's
net assets | % of fund's net assets
6 months ago |
Vodafone Group PLC (United Kingdom, Wireless Telecommunication Services) | 3.5 | 2.3 |
Allianz AG sponsored ADR (Germany, Insurance) | 2.6 | 2.5 |
Roche Holding AG (participation certificate) (Switzerland, Pharmaceuticals) | 2.2 | 2.3 |
Nokia Corp. (Finland, Communications Equipment) | 2.0 | 0.9 |
Nestle SA (Switzerland, Food Products) | 1.9 | 2.4 |
| 12.2 | |
Top Five Market Sectors as of October 31, 2007 |
| % of fund's
net assets | % of fund's net assets
6 months ago |
Financials | 24.1 | 30.5 |
Industrials | 14.4 | 15.2 |
Information Technology | 12.3 | 11.5 |
Materials | 9.6 | 6.6 |
Consumer Discretionary | 7.7 | 9.5 |
Top Five Countries as of October 31, 2007 |
(excluding cash equivalents) | % of fund's
net assets | % of fund's net assets
6 months ago |
Japan | 26.0 | 25.4 |
Germany | 15.0 | 16.9 |
France | 10.9 | 8.5 |
United Kingdom | 9.0 | 9.7 |
Switzerland | 8.7 | 10.4 |
Percentages are adjusted for the effect of open futures contracts, if applicable. |
Asset Allocation (% of fund's net assets) |
As of October 31, 2007 | As of April 30, 2007 |
 | Stocks and
Equity Futures 99.7% | | | Stocks and
Equity Futures 96.6% | |
 | Short-Term
Investments and
Net Other Assets 0.3% | | | Short-Term
Investments and
Net Other Assets 3.4% | |

Annual Report
Investments October 31, 2007
Showing Percentage of Net Assets
Common Stocks - 98.0% |
| Shares | | Value (000s) |
Argentina - 0.0% |
Mercadolibre, Inc. | 78,700 | | $ 3,516 |
Australia - 4.1% |
Aristocrat Leisure Ltd. (d) | 3,680,300 | | 35,999 |
BHP Billiton Ltd. sponsored ADR (d) | 3,025,900 | | 264,040 |
Computershare Ltd. | 3,991,492 | | 32,184 |
CSL Ltd. | 6,147,900 | | 209,005 |
Downer EDI Ltd. | 4,046,122 | | 25,231 |
National Australia Bank Ltd. | 2,578,500 | | 104,321 |
Woolworths Ltd. | 740,300 | | 23,202 |
TOTAL AUSTRALIA | | 693,982 |
Austria - 0.4% |
voestalpine AG | 758,000 | | 68,165 |
Belgium - 0.2% |
Fortis | 1,066,800 | | 34,095 |
Bermuda - 0.3% |
Catlin Group Ltd. | 1,088,000 | | 11,344 |
Hiscox Ltd. | 3,778,100 | | 22,543 |
TPV Technology Ltd. | 15,168,000 | | 10,214 |
TOTAL BERMUDA | | 44,101 |
Brazil - 0.3% |
Bovespa Holding SA (a) | 1,328,000 | | 25,292 |
Medial Saude SA | 1,952,000 | | 25,724 |
TOTAL BRAZIL | | 51,016 |
Canada - 1.8% |
Canadian Natural Resources Ltd. | 1,438,000 | | 119,645 |
EnCana Corp. | 710,248 | | 49,722 |
Open Text Corp. (a)(d) | 1,234,400 | | 38,580 |
OPTI Canada, Inc. (a) | 1,484,800 | | 29,957 |
OZ Optics Ltd. unit (a)(g) | 5,400 | | 80 |
Suncor Energy, Inc. | 233,700 | | 25,605 |
Talisman Energy, Inc. | 1,931,100 | | 42,091 |
Westernzagros Resources Ltd. | 427,000 | | 1,628 |
Westernzagros Resources Ltd. warrants 1/18/08 (a) | 42,700 | | 50 |
TOTAL CANADA | | 307,358 |
Cayman Islands - 0.5% |
Alibaba.com Ltd. (a) | 698,000 | | 2,252 |
GlobalSantaFe Corp. | 147,200 | | 11,928 |
Common Stocks - continued |
| Shares | | Value (000s) |
Cayman Islands - continued |
Lee & Man Paper Manufacturing Ltd. | 5,423,700 | | $ 21,697 |
Subsea 7, Inc. (a)(d) | 1,414,500 | | 41,514 |
TOTAL CAYMAN ISLANDS | | 77,391 |
China - 0.1% |
Zhejiang Expressway Co. Ltd. (H Shares) | 13,346,000 | | 19,273 |
Denmark - 0.6% |
William Demant Holding AS (a) | 1,073,200 | | 98,357 |
Finland - 3.1% |
Cargotec Corp. (B Shares) | 542,240 | | 33,514 |
Metso Corp. | 1,447,500 | | 87,996 |
Neste Oil Oyj | 1,027,800 | | 36,944 |
Nokia Corp. | 1,111,500 | | 44,149 |
Nokia Corp. sponsored ADR | 7,450,500 | | 295,934 |
Wartsila Corp. (B Shares) | 271,700 | | 22,201 |
TOTAL FINLAND | | 520,738 |
France - 10.9% |
Alcatel-Lucent SA sponsored ADR | 13,185,500 | | 127,767 |
Alstom SA | 1,111,800 | | 262,395 |
Arkema sponsored ADR (a) | 2,572 | | 175 |
AXA SA sponsored ADR | 393,600 | | 17,606 |
BNP Paribas SA | 1,558,900 | | 171,852 |
Bureau Veritas SA (a) | 245,500 | | 14,220 |
Carbone Lorraine | 249,900 | | 22,364 |
CNP Assurances | 287,000 | | 36,587 |
Gaz de France | 1,856,400 | | 105,430 |
L'Air Liquide SA (a) | 454,740 | | 62,582 |
Lagardere S.C.A. (Reg.) | 580,982 | | 49,106 |
Neuf Cegetel | 1,217,511 | | 61,561 |
Orpea (a) | 512,400 | | 32,389 |
Pernod Ricard SA | 134,540 | | 31,090 |
Remy Cointreau SA | 1,234,000 | | 94,844 |
Renault SA | 604,700 | | 101,539 |
Sanofi-Aventis sponsored ADR | 1,775,300 | | 78,131 |
SCOR | 219,488 | | 5,978 |
Societe Generale Series A | 839,755 | | 141,499 |
Sodexho Alliance SA | 561,200 | | 40,466 |
Total SA: | | | |
Series B | 353,100 | | 28,463 |
sponsored ADR | 2,944,300 | | 237,340 |
Common Stocks - continued |
| Shares | | Value (000s) |
France - continued |
Unibail-Rodamco | 158,700 | | $ 39,460 |
Vivendi | 1,717,613 | | 77,342 |
TOTAL FRANCE | | 1,840,186 |
Germany - 14.7% |
Aareal Bank AG | 1,342,647 | | 69,581 |
Adidas-Salomon AG | 133,700 | | 8,920 |
Allianz AG sponsored ADR | 19,332,370 | | 436,912 |
Bayer AG | 3,047,700 | | 251,130 |
Bayerische Motoren Werke AG (BMW) | 888,000 | | 59,476 |
Bilfinger Berger AG | 758,900 | | 67,564 |
CompuGROUP Holding AG (a) | 826,400 | | 17,181 |
DaimlerChrysler AG (Reg.) | 796,000 | | 87,679 |
Deutz AG (a) | 875,800 | | 12,029 |
E.ON AG sponsored ADR | 4,279,300 | | 278,582 |
GFK AG | 178,956 | | 7,223 |
Henkel KGaA | 350,537 | | 16,251 |
Hochtief AG | 281,200 | | 38,830 |
K&S AG | 447,800 | | 93,624 |
KUKA AG (a)(d) | 496,413 | | 20,145 |
Lanxess AG | 437,000 | | 21,824 |
Linde AG | 556,256 | | 70,388 |
MAN AG | 281,000 | | 50,156 |
MTU Aero Engines Holding AG | 105,351 | | 6,432 |
Muenchener Rueckversicherungs-Gesellschaft AG (Reg.) | 1,415,500 | | 271,564 |
Patrizia Immobilien AG (d) | 1,171,800 | | 15,636 |
RWE AG | 971,900 | | 132,698 |
SAP AG sponsored ADR (d) | 713,600 | | 38,734 |
SGL Carbon AG (a) | 284,287 | | 16,586 |
Siemens AG: | | | |
(Reg.) | 798,400 | | 108,878 |
sponsored ADR | 1,515,200 | | 206,628 |
Wacker Chemie AG | 277,100 | | 68,048 |
TOTAL GERMANY | | 2,472,699 |
Greece - 0.2% |
Hellenic Exchanges Holding SA | 1,070,800 | | 37,233 |
Hong Kong - 1.9% |
Hysan Development Co. Ltd. | 58,250 | | 176 |
New World Development Co. Ltd. | 26,081,000 | | 94,001 |
Sino Land Co. | 12,044,000 | | 37,753 |
Common Stocks - continued |
| Shares | | Value (000s) |
Hong Kong - continued |
Sun Hung Kai Properties Ltd. | 3,765,000 | | $ 71,952 |
Wharf Holdings Ltd. | 18,388,000 | | 110,869 |
TOTAL HONG KONG | | 314,751 |
Indonesia - 0.2% |
PT Bank Mandiri Persero Tbk | 75,233,500 | | 31,874 |
Ireland - 0.2% |
Smurfit Kappa Group plc | 1,465,200 | | 29,485 |
Israel - 0.7% |
Bank Hapoalim BM (Reg.) | 7,390,800 | | 40,665 |
Mizrahi Tefahot Bank Ltd. | 9,841,265 | | 76,430 |
TOTAL ISRAEL | | 117,095 |
Italy - 1.6% |
ASM SpA | 3,645,538 | | 25,547 |
Fiat SpA | 1,655,500 | | 53,414 |
Milano Assicurazioni SpA | 1,337,400 | | 11,143 |
Pirelli & C. Real Estate SpA | 706,325 | | 34,875 |
Prysmian SpA | 1,873,700 | | 53,834 |
Unicredito Italiano SpA | 11,035,700 | | 94,332 |
TOTAL ITALY | | 273,145 |
Japan - 24.8% |
Aeon Co. Ltd. | 5,835,800 | | 91,884 |
Aeon Mall Co. Ltd. (d) | 1,695,800 | | 44,112 |
Aioi Insurance Co. Ltd. | 8,628,000 | | 50,158 |
Aoyama Trading Co. Ltd. | 1,633,400 | | 42,708 |
Arealink Co. Ltd. (d)(e) | 87,229 | | 43,272 |
Asics Corp. | 3,382,000 | | 53,942 |
Bank of Nagoya Ltd. | 6,814,000 | | 50,409 |
Bridgestone Corp. | 2,209,400 | | 48,917 |
Canon Fintech, Inc. | 595,800 | | 10,025 |
Canon, Inc. | 675,100 | | 34,140 |
Canon, Inc. sponsored ADR | 2,356,100 | | 119,148 |
Chiba Bank Ltd. | 5,205,000 | | 41,786 |
Credit Saison Co. Ltd. | 848,300 | | 27,055 |
Daiei, Inc. (a) | 2,113,050 | | 15,051 |
Daiwa House Industry Co. Ltd. | 4,107,000 | | 58,621 |
Daiwa Securities Group, Inc. | 18,548,000 | | 178,787 |
DCM Japan Holdings Co. Ltd. (d) | 3,112,820 | | 24,010 |
Fuji Machine Manufacturing Co. Ltd. | 1,833,600 | | 40,933 |
Fujitsu Ltd. | 9,681,000 | | 76,029 |
Common Stocks - continued |
| Shares | | Value (000s) |
Japan - continued |
Fukuoka Financial Group, Inc. (a) | 10,181,000 | | $ 65,631 |
Hokuhoku Financial Group, Inc. | 15,384,000 | | 47,532 |
Ibiden Co. Ltd. | 862,600 | | 73,134 |
Inpex Holdings, Inc. | 5,875 | | 63,348 |
Isetan Co. Ltd. | 1,706,400 | | 23,061 |
Juroku Bank Ltd. | 9,501,000 | | 57,504 |
Kansai Paint Co. Ltd. | 4,243,000 | | 31,860 |
Konica Minolta Holdings, Inc. | 3,961,000 | | 69,355 |
Kubota Corp. | 1,603,000 | | 13,461 |
Marubeni Corp. | 5,082,000 | | 43,646 |
Marui Group Co. Ltd. | 4,410,200 | | 45,759 |
Matsui Securities Co. Ltd. (d) | 8,961,400 | | 71,218 |
Millea Holdings, Inc. | 1,552,600 | | 60,955 |
Misumi Group, Inc. | 1,530,700 | | 25,909 |
Mitsubishi Corp. | 3,023,100 | | 94,146 |
Mitsubishi Estate Co. Ltd. | 2,829,000 | | 84,827 |
Mitsui & Co. Ltd. | 4,098,000 | | 106,317 |
Mitsui Fudosan Co. Ltd. | 2,189,000 | | 60,570 |
Mizuho Financial Group, Inc. | 3,159 | | 17,759 |
Monex Beans Holdings, Inc. (d) | 10,893 | | 7,531 |
Murata Manufacturing Co. Ltd. | 1,990,100 | | 121,138 |
Namco Bandai Holdings, Inc. | 1,242,400 | | 19,159 |
Nidec Corp. | 1,338,100 | | 100,563 |
Nintendo Co. Ltd. | 129,500 | | 81,326 |
Nippon Chemi-con Corp. | 3,839,900 | | 30,465 |
Nippon Electric Glass Co. Ltd. | 7,655,200 | | 130,141 |
Nomura Holdings, Inc. | 4,531,700 | | 80,800 |
Nomura Holdings, Inc. sponsored ADR | 4,015,900 | | 71,603 |
NSK Ltd. | 6,117,000 | | 54,246 |
Okamura Corp. | 4,931,000 | | 44,569 |
Okinawa Cellular Telephone Co. | 7,759 | | 22,730 |
OMC Card, Inc. (d)(e) | 11,455,100 | | 42,243 |
Omron Corp. | 1,838,100 | | 45,217 |
ORIX Corp. | 155,150 | | 31,832 |
Promise Co. Ltd. (d) | 896,950 | | 26,985 |
SBI E*TRADE Securities Co. Ltd. (d) | 52,205 | | 56,057 |
Sekisui House Ltd. | 4,321,000 | | 55,292 |
Seven & I Holdings Co. Ltd. | 943,500 | | 24,368 |
SFCG Co. Ltd. | 376,930 | | 62,533 |
SMC Corp. | 426,700 | | 57,170 |
Sompo Japan Insurance, Inc. | 9,988,000 | | 117,496 |
Sony Corp. sponsored ADR | 356,300 | | 17,623 |
Common Stocks - continued |
| Shares | | Value (000s) |
Japan - continued |
Sony Financial Holdings, Inc. | 1,336 | | $ 4,807 |
Sumitomo Corp. | 7,643,000 | | 133,200 |
Sumitomo Electric Industries Ltd. | 4,612,500 | | 74,694 |
Sumitomo Metal Industries Ltd. | 4,987,000 | | 24,689 |
Sumitomo Mitsui Financial Group, Inc. | 1,265 | | 10,364 |
Sumitomo Osaka Cement Co. Ltd. | 17,933,000 | | 44,953 |
T&D Holdings, Inc. | 608,500 | | 36,631 |
Takeda Pharmaceutical Co. Ltd. | 859,600 | | 53,706 |
Tokai Carbon Co. Ltd. (d) | 9,268,000 | | 116,252 |
Tokuyama Corp. (d) | 4,418,000 | | 61,723 |
Tokyo Tomin Bank Ltd. | 2,001,100 | | 66,619 |
Toyota Motor Corp. | 1,440,100 | | 82,403 |
Yamada Denki Co. Ltd. | 161,460 | | 16,651 |
Yamaguchi Financial Group, Inc. | 3,169,000 | | 37,190 |
TOTAL JAPAN | | 4,171,948 |
Korea (South) - 0.5% |
Daewoo Shipbuilding & Marine Engineering Co. Ltd. | 775,510 | | 49,265 |
Kookmin Bank | 292,010 | | 23,882 |
Samsung Electronics Co. Ltd. | 16,050 | | 9,897 |
TOTAL KOREA (SOUTH) | | 83,044 |
Luxembourg - 0.8% |
ArcelorMittal SA (NY Shares) Class A | 1,730,800 | | 138,377 |
Malaysia - 1.0% |
DiGi.com Bhd | 5,697,700 | | 42,915 |
Gamuda Bhd | 52,592,000 | | 72,513 |
Public Bank BHD (For. Reg.) | 8,688,500 | | 29,878 |
YTL Corp. BHD | 6,796,800 | | 15,396 |
TOTAL MALAYSIA | | 160,702 |
Netherlands - 4.7% |
Akzo Nobel NV (d) | 403,300 | | 32,446 |
Heineken NV (Bearer) | 2,658,700 | | 185,577 |
Koninklijke KPN NV | 5,301,900 | | 100,012 |
Koninklijke Philips Electronics NV (NY Shares) | 2,235,100 | | 92,399 |
Reed Elsevier NV sponsored ADR | 2,850,100 | | 110,983 |
SBM Offshore NV | 1,769,610 | | 68,095 |
Unilever NV: | | | |
(Certificaten Van Aandelen) | 1,917,700 | | 62,208 |
(NY Shares) | 4,369,400 | | 141,831 |
TOTAL NETHERLANDS | | 793,551 |
Common Stocks - continued |
| Shares | | Value (000s) |
Norway - 1.1% |
Aker Kvaerner ASA | 3,928,950 | | $ 136,907 |
Hafslund ASA (B Shares) | 1,249,863 | | 37,031 |
Odfjell Se (B Shares) | 237,650 | | 3,786 |
TOTAL NORWAY | | 177,724 |
Singapore - 0.1% |
City Developments Ltd. | 1,636,000 | | 18,064 |
Spain - 1.5% |
Banco Santander SA sponsored ADR | 1,021,400 | | 22,175 |
Inditex SA | 368,500 | | 27,415 |
Telefonica SA sponsored ADR | 2,076,900 | | 206,548 |
TOTAL SPAIN | | 256,138 |
Sweden - 1.3% |
Scania AB (B Shares) | 4,083,200 | | 111,499 |
SSAB Svenskt Stal AB (A Shares) | 216,200 | | 7,010 |
Telefonaktiebolaget LM Ericsson (B Shares) sponsored ADR | 3,526,200 | | 105,962 |
TOTAL SWEDEN | | 224,471 |
Switzerland - 8.7% |
ABB Ltd.: | | | |
(Reg.) | 4,987,147 | | 150,006 |
sponsored ADR | 1,898,700 | | 57,379 |
Basilea Pharmaceutica AG (a) | 132,140 | | 24,915 |
Credit Suisse Group sponsored ADR | 919,400 | | 62,243 |
Credit Suisse Group (Reg.) | 456,032 | | 30,873 |
Julius Baer Holding AG (Bearer) | 968,951 | | 83,820 |
Nestle SA: | | | |
(Reg.) | 424,214 | | 195,987 |
sponsored ADR | 1,103,600 | | 127,466 |
Novartis AG sponsored ADR | 1,125,900 | | 59,864 |
Roche Holding AG (participation certificate) | 2,172,980 | | 371,362 |
SGS Societe Generale de Surveillance Holding SA (Reg.) | 98,154 | | 128,635 |
Sonova Holding AG | 6,217 | | 698 |
Swiss Life Holding | 209,248 | | 57,808 |
Swisscom AG (Reg.) | 45,111 | | 16,679 |
Zurich Financial Services AG (Reg.) | 310,744 | | 93,561 |
TOTAL SWITZERLAND | | 1,461,296 |
Taiwan - 2.3% |
Advanced Semiconductor Engineering, Inc. | 79,815,374 | | 96,098 |
Compal Electronics, Inc. | 23,928,045 | | 30,321 |
Common Stocks - continued |
| Shares | | Value (000s) |
Taiwan - continued |
Siliconware Precision Industries Co. Ltd. sponsored ADR (d) | 6,680,541 | | $ 77,361 |
Taiwan Mobile Co. Ltd. | 42,544,000 | | 56,997 |
Taiwan Semiconductor Manufacturing Co. Ltd. | 14,013,708 | | 27,599 |
Taiwan Semiconductor Manufacturing Co. Ltd. sponsored ADR | 3,084,141 | | 32,846 |
Wistron Corp. | 32,869,618 | | 65,445 |
TOTAL TAIWAN | | 386,667 |
United Kingdom - 9.0% |
Anglo American PLC ADR | 1,771,042 | | 61,898 |
BP PLC | 6,596,300 | | 85,741 |
BP PLC sponsored ADR | 2,242,700 | | 174,908 |
Dawnay Day Treveria PLC (e) | 34,888,528 | | 44,102 |
GlaxoSmithKline PLC | 609,800 | | 15,626 |
Intertek Group PLC | 1,513,300 | | 32,375 |
Misys PLC | 1,770,444 | | 8,898 |
NETeller PLC (a) | 4,254,500 | | 6,324 |
Next PLC | 305,400 | | 14,020 |
Rentokil Initial PLC | 18,789,300 | | 67,190 |
Rio Tinto PLC: | | | |
(Reg.) | 464,400 | | 43,537 |
sponsored ADR | 190,800 | | 71,550 |
Royal Dutch Shell PLC Class A sponsored ADR | 1,275,400 | | 111,610 |
Serco Group PLC | 1,418,748 | | 13,296 |
Tesco PLC | 11,472,054 | | 117,589 |
Unilever PLC | 516,300 | | 17,482 |
Unilever PLC sponsored ADR | 1,509,260 | | 51,104 |
Vodafone Group PLC | 8,708,600 | | 34,199 |
Vodafone Group PLC sponsored ADR | 13,988,100 | | 549,311 |
TOTAL UNITED KINGDOM | | 1,520,760 |
United States of America - 0.4% |
Microsoft Corp. | 1,956,400 | | 72,015 |
TOTAL COMMON STOCKS (Cost $13,668,780) | 16,499,217 |
Preferred Stocks - 0.5% |
| | | |
Convertible Preferred Stocks - 0.0% |
Canada - 0.0% |
MetroPhotonics, Inc. Series 2 (a)(g) | 8,500 | | 0 |
Preferred Stocks - continued |
| Shares | | Value (000s) |
Nonconvertible Preferred Stocks - 0.5% |
Germany - 0.3% |
Henkel KGaA | 362,700 | | $ 18,513 |
Volkswagen AG | 163,000 | | 30,936 |
TOTAL GERMANY | | 49,449 |
Italy - 0.2% |
Buzzi Unicem SpA (Risp) | 1,569,595 | | 30,131 |
Fondiaria-Sai SpA (Risp) | 321,300 | | 10,953 |
TOTAL ITALY | | 41,084 |
TOTAL NONCONVERTIBLE PREFERRED STOCKS | | 90,533 |
TOTAL PREFERRED STOCKS (cost $87,709) | | 90,533 |
Government Obligations - 0.1% |
| Principal Amount (000s) | | |
United States of America - 0.1% |
U.S. Treasury Bills, yield at date of purchase 3.86% to 4.85% 11/1/07 to 1/31/08 (f)
(Cost $14,533) | $ 14,600 | | 14,536 |
Money Market Funds - 5.3% |
| Shares | | |
Fidelity Cash Central Fund, 4.97% (b) | 420,841,930 | | 420,842 |
Fidelity Securities Lending Cash Central Fund, 5.02% (b)(c) | 477,582,702 | | 477,583 |
TOTAL MONEY MARKET FUNDS (Cost $898,425) | 898,425 |
Cash Equivalents - 0.1% |
| Maturity Amount (000s) | | Value (000s) |
Investments in repurchase agreements in a joint trading account at 4.54%, dated 10/31/07 due 11/1/07 (Collateralized by U.S. Treasury Obligations) #
(Cost $6,750) | $ 6,751 | | $ 6,750 |
TOTAL INVESTMENT PORTFOLIO - 104.0% (Cost $14,676,197) | | 17,509,461 |
NET OTHER ASSETS - (4.0)% | | (668,159) |
NET ASSETS - 100% | $ 16,841,302 |
Futures Contracts |
| Expiration Date | | Underlying Face Amount at Value (000s) | | Unrealized Appreciation/
(Depreciation) (000s) |
Purchased |
Equity Index Contracts |
2,455 Nikkei 225 Index Contracts (Japan) | Dec. 2007 | | $ 206,895 | | $ 10,753 |
|
The face value of futures purchased as a percentage of net assets - 1.2% |
Legend |
(a) Non-income producing |
(b) Affiliated fund that is available only to investment companies and other accounts managed by Fidelity Investments. The rate quoted is the annualized seven-day yield of the fund at period end. A complete unaudited listing of the fund's holdings as of its most recent quarter end is available upon request. |
(c) Investment made with cash collateral received from securities on loan. |
(d) Security or a portion of the security is on loan at period end. |
(e) Affiliated company |
(f) Security or a portion of the security was pledged to cover margin requirements for futures contracts. At the period end, the value of securities pledged amounted to $10,377,000. |
(g) Restricted securities - Investment in securities not registered under the Securities Act of 1933 (excluding 144A issues). At the end of the period, the value of restricted securities (excluding 144A issues) amounted to $80,000 or 0.0% of net assets. |
Additional information on each holding is as follows: |
Security | Acquisition Date | Acquisition Cost (000s) |
MetroPhotonics, Inc. Series 2 | 9/29/00 | $ 85 |
OZ Optics Ltd. unit | 8/18/00 | $ 80 |
# Additional Information on each counterparty to the repurchase agreement is as follows: |
Repurchase Agreement / Counterparty | Value
(000s) |
$6,750,000 due 11/01/07 at 4.54% |
Banc of America Securities LLC | $ 3,833 |
Lehman Brothers, Inc. | 2,917 |
| $ 6,750 |
Affiliated Central Funds |
Information regarding fiscal year to date income earned by the Fund from investments in Fidelity Central Funds is as follows: |
Fund | Income earned
(Amounts in thousands) |
Fidelity Cash Central Fund | $ 42,393 |
Fidelity Securities Lending Cash Central Fund | 13,653 |
Total | $ 56,046 |
Other Affiliated Issuers |
An affiliated company is a company in which the fund has ownership of at least 5% of the voting securities. Fiscal year to date transactions with companies which are or were affiliates are as follows: |
Affiliates
(Amounts in thousands) | Value, beginning of period | Purchases | Sales Proceeds | Dividend Income | Value,
end of
period |
Arealink Co. Ltd. | $ 6,046 | $ 45,150 | $ - | $ 30 | $ 43,272 |
Dawnay Day Treveria PLC | 40,978 | 19,267 | 4,857 | 2,294 | 44,102 |
KUKA AG
(formerly IWKA AG) | 31,757 | - | 42,021 | - | - |
OMC Card, Inc. | 51,128 | 35,323 | - | 506 | 42,243 |
SGL Carbon AG | 79,939 | - | 175,743 | - | - |
Total | $ 209,848 | $ 99,740 | $ 222,621 | $ 2,830 | $ 129,617 |
See accompanying notes which are an integral part of the financial statements.
Annual Report
Financial Statements
Statement of Assets and Liabilities
Amounts in thousands (except per-share amounts) | October 31, 2007 |
| | |
Assets | | |
Investment in securities, at value (including securities loaned of $472,136 and repurchase agreements of $6,750) - See accompanying schedule: Unaffiliated issuers (cost $13,564,590) | $ 16,481,419 | |
Fidelity Central Funds (cost $898,425) | 898,425 | |
Other affiliated issuers (cost $213,182) | 129,617 | |
Total Investments (cost $14,676,197) | | $ 17,509,461 |
Receivable for investments sold | | 151,863 |
Receivable for fund shares sold | | 15,972 |
Dividends receivable | | 24,030 |
Distributions receivable from Fidelity Central Funds | | 2,490 |
Receivable for daily variation on futures contracts | | 2,578 |
Prepaid expenses | | 6 |
Other receivables | | 1,457 |
Total assets | | 17,707,857 |
| | |
Liabilities | | |
Payable to custodian bank | $ 6,903 | |
Payable for investments purchased | 323,145 | |
Payable for fund shares redeemed | 36,676 | |
Accrued management fee | 9,799 | |
Distribution fees payable | 4,466 | |
Other affiliated payables | 2,947 | |
Other payables and accrued expenses | 5,036 | |
Collateral on securities loaned, at value | 477,583 | |
Total liabilities | | 866,555 |
| | |
Net Assets | | $ 16,841,302 |
Net Assets consist of: | | |
Paid in capital | | $ 11,712,337 |
Undistributed net investment income | | 152,430 |
Accumulated undistributed net realized gain (loss) on investments and foreign currency transactions | | 2,132,259 |
Net unrealized appreciation (depreciation) on investments and assets and liabilities in foreign currencies | | 2,844,276 |
Net Assets | | $ 16,841,302 |
See accompanying notes which are an integral part of the financial statements.
Annual Report
Statement of Assets and Liabilities - continued
Amounts in thousands (except per-share amounts) | October 31, 2007 |
| | |
Calculation of Maximum Offering Price
Class A: Net Asset Value and redemption price per share ($5,774,215 ÷ 216,942 shares) | | $ 26.62 |
| | |
Maximum offering price per share (100/94.25 of $26.62) | | $ 28.24 |
Class T:
Net Asset Value and redemption price per share ($3,568,880 ÷ 135,677 shares) | | $ 26.30 |
| | |
Maximum offering price per share (100/96.50 of $26.30) | | $ 27.25 |
Class B:
Net Asset Value and offering price per share
($558,966 ÷ 21,976 shares)A | | $ 25.44 |
| | |
Class C:
Net Asset Value and offering price per share ($1,672,927 ÷ 65,599 shares)A | | $ 25.50 |
| | |
Institutional Class:
Net Asset Value, offering price and redemption price per share ($5,266,314 ÷ 194,651 shares) | | $ 27.06 |
A Redemption price per share is equal to net asset value less any applicable contingent deferred sales charge.
See accompanying notes which are an integral part of the financial statements.
Annual Report
Financial Statements - continued
Statement of Operations
Amounts in thousands | Year ended October 31, 2007 |
| | |
Investment Income | | |
Dividends (including $2,830 earned from other affiliated issuers) | | $ 370,521 |
Interest | | 1,336 |
Income from Fidelity Central Funds | | 56,046 |
| | 427,903 |
Less foreign taxes withheld | | (39,454) |
Total income | | 388,449 |
| | |
Expenses | | |
Management fee | $ 111,628 | |
Transfer agent fees | 32,939 | |
Distribution fees | 52,312 | |
Accounting and security lending fees | 2,250 | |
Custodian fees and expenses | 3,195 | |
Independent trustees' compensation | 53 | |
Registration fees | 555 | |
Audit | 156 | |
Legal | 187 | |
Miscellaneous | 4,641 | |
Total expenses before reductions | 207,916 | |
Expense reductions | (6,590) | 201,326 |
Net investment income (loss) | | 187,123 |
Realized and Unrealized Gain (Loss) Net realized gain (loss) on: | | |
Investment securities: | | |
Unaffiliated issuers | 2,063,333 | |
Other affiliated issuers | 136,144 | |
Foreign currency transactions | (5,589) | |
Futures contracts | 16,138 | |
Total net realized gain (loss) | | 2,210,026 |
Change in net unrealized appreciation (depreciation) on: Investment securities | 805,767 | |
Assets and liabilities in foreign currencies | 169 | |
Futures contracts | 148 | |
Total change in net unrealized appreciation (depreciation) | | 806,084 |
Net gain (loss) | | 3,016,110 |
Net increase (decrease) in net assets resulting from operations | | $ 3,203,233 |
See accompanying notes which are an integral part of the financial statements.
Annual Report
Statement of Changes in Net Assets
Amounts in thousands | Year ended
October 31,
2007 | Year ended
October 31,
2006 |
Increase (Decrease) in Net Assets | | |
Operations | | |
Net investment income (loss) | $ 187,123 | $ 153,748 |
Net realized gain (loss) | 2,210,026 | 1,020,572 |
Change in net unrealized appreciation (depreciation) | 806,084 | 889,367 |
Net increase (decrease) in net assets resulting
from operations | 3,203,233 | 2,063,687 |
Distributions to shareholders from net investment income | (133,151) | (64,018) |
Distributions to shareholders from net realized gain | (974,839) | (425,957) |
Total distributions | (1,107,990) | (489,975) |
Share transactions - net increase (decrease) | 320,019 | 4,317,582 |
Redemption fees | 467 | 520 |
Total increase (decrease) in net assets | 2,415,729 | 5,891,814 |
| | |
Net Assets | | |
Beginning of period | 14,425,573 | 8,533,759 |
End of period (including undistributed net investment income of $152,430 and undistributed net investment income of $144,715, respectively) | $ 16,841,302 | $ 14,425,573 |
See accompanying notes which are an integral part of the financial statements.
Annual Report
Financial Highlights - Class A
Years ended October 31, | 2007 | 2006 | 2005 | 2004 | 2003 |
Selected Per-Share Data | | | | | |
Net asset value, beginning of period | $ 23.42 | $ 20.30 | $ 16.97 | $ 14.60 | $ 11.12 |
Income from Investment Operations | | | | | |
Net investment income (loss) C | .31 | .30 | .19 | .08 | .09 |
Net realized and unrealized gain (loss) | 4.69 | 3.91 | 3.27 | 2.41 | 3.45 |
Total from investment operations | 5.00 | 4.21 | 3.46 | 2.49 | 3.54 |
Distributions from net investment income | (.23) | (.14) | (.05) | (.12) | (.06) |
Distributions from net realized gain | (1.57) | (.95) | (.08) | - | - |
Total distributions | (1.80) | (1.09) | (.13) | (.12) | (.06) |
Redemption fees added to paid in capital C | - G | - G | - G | - G | - |
Net asset value, end of period | $ 26.62 | $ 23.42 | $ 20.30 | $ 16.97 | $ 14.60 |
Total Return A, B | 22.76% | 21.54% | 20.50% | 17.15% | 31.99% |
Ratios to Average Net Assets D, F | | | | | |
Expenses before reductions | 1.25% | 1.26% | 1.27% | 1.31% | 1.42% |
Expenses net of fee waivers, if any | 1.25% | 1.26% | 1.27% | 1.31% | 1.42% |
Expenses net of all reductions | 1.21% | 1.20% | 1.20% | 1.27% | 1.39% |
Net investment income (loss) | 1.26% | 1.33% | 1.02% | .51% | .71% |
Supplemental Data | | | | | |
Net assets, end of period (in millions) | $ 5,774 | $ 4,694 | $ 2,792 | $ 1,294 | $ 241 |
Portfolio turnover rate E | 105% | 83% | 59% | 72% | 49% |
A Total returns would have been lower had certain expenses not been reduced during the periods shown.
B Total returns do not include the effect of the sales charges.
C Calculated based on average shares outstanding during the period.
D Fees and expenses of the underlying Fidelity Central Funds are not included in the Fund's expense ratio. The Fund indirectly bears its proportionate share of the expenses of any underlying Fidelity Central Funds.
E Amount does not include the portfolio activity of any underlying Fidelity Central Funds.
F Expense ratios reflect operating expenses of the class. Expenses before reductions do not reflect amounts reimbursed by the investment adviser or reductions from brokerage service arrangements or other expense offset arrangements and do not represent the amount paid by the class during periods when reimbursements or reductions occur. Expenses net of fee waivers reflect expenses after reimbursement by the investment adviser but prior to reductions from brokerage service arrangements or other expense offset arrangements. Expenses net of all reductions represent the net expenses paid by the class.
G Amount represents less than $.01 per share.
See accompanying notes which are an integral part of the financial statements.
Annual Report
Financial Highlights - Class T
Years ended October 31, | 2007 | 2006 | 2005 | 2004 | 2003 |
Selected Per-Share Data | | | | | |
Net asset value, beginning of period | $ 23.17 | $ 20.12 | $ 16.82 | $ 14.47 | $ 11.01 |
Income from Investment Operations | | | | | |
Net investment income (loss) C | .25 | .25 | .15 | .03 | .05 |
Net realized and unrealized gain (loss) | 4.63 | 3.89 | 3.23 | 2.39 | 3.43 |
Total from investment operations | 4.88 | 4.14 | 3.38 | 2.42 | 3.48 |
Distributions from net investment income | (.18) | (.14) | - | (.07) | (.02) |
Distributions from net realized gain | (1.57) | (.95) | (.08) | - | - |
Total distributions | (1.75) | (1.09) | (.08) | (.07) | (.02) |
Redemption fees added to paid in capital C | - G | - G | - G | - G | - |
Net asset value, end of period | $ 26.30 | $ 23.17 | $ 20.12 | $ 16.82 | $ 14.47 |
Total Return A, B | 22.43% | 21.33% | 20.16% | 16.78% | 31.66% |
Ratios to Average Net Assets D, F | | | | | |
Expenses before reductions | 1.47% | 1.48% | 1.51% | 1.61% | 1.75% |
Expenses net of fee waivers, if any | 1.47% | 1.48% | 1.51% | 1.61% | 1.75% |
Expenses net of all reductions | 1.43% | 1.42% | 1.45% | 1.57% | 1.72% |
Net investment income (loss) | 1.04% | 1.12% | .77% | .21% | .38% |
Supplemental Data | | | | | |
Net assets, end of period (in millions) | $ 3,569 | $ 3,609 | $ 2,420 | $ 1,510 | $ 552 |
Portfolio turnover rate E | 105% | 83% | 59% | 72% | 49% |
A Total returns would have been lower had certain expenses not been reduced during the periods shown.
B Total returns do not include the effect of the sales charges.
C Calculated based on average shares outstanding during the period.
D Fees and expenses of the underlying Fidelity Central Funds are not included in the Fund's expense ratio. The Fund indirectly bears its proportionate share of the expenses of any underlying Fidelity Central Funds.
E Amount does not include the portfolio activity of any underlying Fidelity Central Funds.
F Expense ratios reflect operating expenses of the class. Expenses before reductions do not reflect amounts reimbursed by the investment adviser or reductions from brokerage service arrangements or other expense offset arrangements and do not represent the amount paid by the class during periods when reimbursements or reductions occur. Expenses net of fee waivers reflect expenses after reimbursement by the investment adviser but prior to reductions from brokerage service arrangements or other expense offset arrangements. Expenses net of all reductions represent the net expenses paid by the class.
G Amount represents less than $.01 per share.
See accompanying notes which are an integral part of the financial statements.
Annual Report
Financial Highlights - Class B
Years ended October 31, | 2007 | 2006 | 2005 | 2004 | 2003 |
Selected Per-Share Data | | | | | |
Net asset value, beginning of period | $ 22.46 | $ 19.60 | $ 16.46 | $ 14.19 | $ 10.84 |
Income from Investment Operations | | | | | |
Net investment income (loss) C | .10 | .10 | .02 | (.07) | (.02) |
Net realized and unrealized gain (loss) | 4.50 | 3.79 | 3.16 | 2.35 | 3.37 |
Total from investment operations | 4.60 | 3.89 | 3.18 | 2.28 | 3.35 |
Distributions from net investment income | (.05) | (.08) | - | (.01) | - |
Distributions from net realized gain | (1.57) | (.95) | (.04) | - | - |
Total distributions | (1.62) | (1.03) | (.04) | (.01) | - |
Redemption fees added to paid in capital C | - G | - G | - G | - G | - |
Net asset value, end of period | $ 25.44 | $ 22.46 | $ 19.60 | $ 16.46 | $ 14.19 |
Total Return A, B | 21.73% | 20.55% | 19.35% | 16.08% | 30.90% |
Ratios to Average Net Assets D, F | | | | | |
Expenses before reductions | 2.08% | 2.12% | 2.16% | 2.24% | 2.32% |
Expenses net of fee waivers, if any | 2.08% | 2.12% | 2.16% | 2.24% | 2.32% |
Expenses net of all reductions | 2.04% | 2.06% | 2.10% | 2.20% | 2.29% |
Net investment income (loss) | .42% | .48% | .12% | (.42)% | (.19)% |
Supplemental Data | | | | | |
Net assets, end of period (in millions) | $ 559 | $ 508 | $ 351 | $ 196 | $ 89 |
Portfolio turnover rate E | 105% | 83% | 59% | 72% | 49% |
A Total returns would have been lower had certain expenses not been reduced during the periods shown.
B Total returns do not include the effect of the contingent deferred sales charge.
C Calculated based on average shares outstanding during the period.
D Fees and expenses of the underlying Fidelity Central Funds are not included in the Fund's expense ratio. The Fund indirectly bears its proportionate share of the expenses of any underlying Fidelity Central Funds.
E Amount does not include the portfolio activity of any underlying Fidelity Central Funds.
F Expense ratios reflect operating expenses of the class. Expenses before reductions do not reflect amounts reimbursed by the investment adviser or reductions from brokerage service arrangements or other expense offset arrangements and do not represent the amount paid by the class during periods when reimbursements or reductions occur. Expenses net of fee waivers reflect expenses after reimbursement by the investment adviser but prior to reductions from brokerage service arrangements or other expense offset arrangements. Expenses net of all reductions represent the net expenses paid by the class.
G Amount represents less than $.01 per share.
See accompanying notes which are an integral part of the financial statements.
Annual Report
Financial Highlights - Class C
Years ended October 31, | 2007 | 2006 | 2005 | 2004 | 2003 |
Selected Per-Share Data | | | | | |
Net asset value, beginning of period | $ 22.53 | $ 19.65 | $ 16.48 | $ 14.22 | $ 10.86 |
Income from Investment Operations | | | | | |
Net investment income (loss) C | .12 | .12 | .04 | (.05) | (.01) |
Net realized and unrealized gain (loss) | 4.50 | 3.79 | 3.17 | 2.35 | 3.37 |
Total from investment operations | 4.62 | 3.91 | 3.21 | 2.30 | 3.36 |
Distributions from net investment income | (.08) | (.08) | - | (.04) | - |
Distributions from net realized gain | (1.57) | (.95) | (.04) | - | - |
Total distributions | (1.65) | (1.03) | (.04) | (.04) | - |
Redemption fees added to paid in capital C | - G | - G | - G | - G | - |
Net asset value, end of period | $ 25.50 | $ 22.53 | $ 19.65 | $ 16.48 | $ 14.22 |
Total Return A, B | 21.81% | 20.62% | 19.51% | 16.21% | 30.94% |
Ratios to Average Net Assets D, F | | | | | |
Expenses before reductions | 2.00% | 2.02% | 2.05% | 2.13% | 2.23% |
Expenses net of fee waivers, if any | 2.00% | 2.02% | 2.05% | 2.13% | 2.23% |
Expenses net of all reductions | 1.96% | 1.96% | 1.99% | 2.09% | 2.20% |
Net investment income (loss) | .51% | .57% | .23% | (.31)% | (.10)% |
Supplemental Data | | | | | |
Net assets, end of period (in millions) | $ 1,673 | $ 1,395 | $ 758 | $ 381 | $ 124 |
Portfolio turnover rate E | 105% | 83% | 59% | 72% | 49% |
A Total returns would have been lower had certain expenses not been reduced during the periods shown.
B Total returns do not include the effect of the contingent deferred sales charge.
C Calculated based on average shares outstanding during the period.
D Fees and expenses of the underlying Fidelity Central Funds are not included in the Fund's expense ratio. The Fund indirectly bears its proportionate share of the expenses of any underlying Fidelity Central Funds.
E Amount does not include the portfolio activity of any underlying Fidelity Central Funds.
F Expense ratios reflect operating expenses of the class. Expenses before reductions do not reflect amounts reimbursed by the investment adviser or reductions from brokerage service arrangements or other expense offset arrangements and do not represent the amount paid by the class during periods when reimbursements or reductions occur. Expenses net of fee waivers reflect expenses after reimbursement by the investment adviser but prior to reductions from brokerage service arrangements or other expense offset arrangements. Expenses net of all reductions represent the net expenses paid by the class.
G Amount represents less than $.01 per share.
See accompanying notes which are an integral part of the financial statements.
Annual Report
Financial Highlights - Institutional Class
Years ended October 31, | 2007 | 2006 | 2005 | 2004 | 2003 |
Selected Per-Share Data | | | | | |
Net asset value, beginning of period | $ 23.78 | $ 20.56 | $ 17.18 | $ 14.74 | $ 11.22 |
Income from Investment Operations | | | | | |
Net investment income (loss) B | .38 | .37 | .25 | .13 | .13 |
Net realized and unrealized gain (loss) | 4.76 | 3.98 | 3.30 | 2.44 | 3.48 |
Total from investment operations | 5.14 | 4.35 | 3.55 | 2.57 | 3.61 |
Distributions from net investment income | (.29) | (.18) | (.09) | (.13) | (.09) |
Distributions from net realized gain | (1.57) | (.95) | (.08) | - | - |
Total distributions | (1.86) | (1.13) | (.17) | (.13) | (.09) |
Redemption fees added to paid in capital B | - F | - F | - F | - F | - |
Net asset value, end of period | $ 27.06 | $ 23.78 | $ 20.56 | $ 17.18 | $ 14.74 |
Total Return A | 23.07% | 21.96% | 20.81% | 17.54% | 32.41% |
Ratios to Average Net Assets C, E | | | | | |
Expenses before reductions | .98% | .97% | .97% | 1.03% | 1.09% |
Expenses net of fee waivers, if any | .98% | .97% | .97% | 1.03% | 1.09% |
Expenses net of all reductions | .94% | .92% | .91% | .98% | 1.06% |
Net investment income (loss) | 1.53% | 1.62% | 1.32% | .80% | 1.04% |
Supplemental Data | | | | | |
Net assets, end of period (in millions) | $ 5,266 | $ 4,220 | $ 2,213 | $ 1,185 | $ 391 |
Portfolio turnover rate D | 105% | 83% | 59% | 72% | 49% |
A Total returns would have been lower had certain expenses not been reduced during the periods shown.
B Calculated based on average shares outstanding during the period.
C Fees and expenses of the underlying Fidelity Central Funds are not included in the Fund's expense ratio. The Fund indirectly bears its proportionate share of the expenses of any underlying Fidelity Central Funds.
D Amount does not include the portfolio activity of any underlying Fidelity Central Funds.
E Expense ratios reflect operating expenses of the class. Expenses before reductions do not reflect amounts reimbursed by the investment adviser or reductions from brokerage service arrangements or other expense offset arrangements and do not represent the amount paid by the class during periods when reimbursements or reductions occur. Expenses net of fee waivers reflect expenses after reimbursement by the investment adviser but prior to reductions from brokerage service arrangements or other expense offset arrangements. Expenses net of all reductions represent the net expenses paid by the class.
F Amount represents less than $.01 per share.
See accompanying notes which are an integral part of the financial statements.
Annual Report
Notes to Financial Statements
For the period ended October 31, 2007
(Amounts in thousands except ratios)
1. Organization.
Fidelity Advisor Diversified International Fund (the Fund) is a fund of Fidelity Advisor Series VIII (the trust) and is authorized to issue an unlimited number of shares. The trust is registered under the Investment Company Act of 1940, as amended (the 1940 Act), as an open-end management investment company organized as a Massachusetts business trust. The Fund offers Class A, Class T, Class B, Class C, and Institutional Class shares, each of which has equal rights as to assets and voting privileges. Each class has exclusive voting rights with respect to matters that affect that class. Class B shares will automatically convert to Class A shares after a holding period of seven years from the initial date of purchase. Investment income, realized and unrealized capital gains and losses, the common expenses of the Fund, and certain fund-level expense reductions, if any, are allocated on a pro rata basis to each class based on the relative net assets of each class to the total net assets of the Fund. Each class differs with respect to transfer agent and distribution and service plan fees incurred. Certain expense reductions also differ by class. The Fund's investments in emerging markets can be subject to social, economic, regulatory, and political uncertainties and can be extremely volatile.
2. Investments in Fidelity Central Funds.
The Fund may invest in Fidelity Central Funds, which are open-end investment companies available only to other investment companies and accounts managed by Fidelity Management & Research Company (FMR) and its affiliates. The Fund's Schedule of Investments lists each of the Fidelity Central Funds as an investment of the Fund, but does not include the underlying holdings of each Fidelity Central Fund. As an Investing Fund, the Fund indirectly bears its proportionate share of the expenses of the underlying Fidelity Central Funds.
The Money Market Central Funds seek preservation of capital and current income and are managed by Fidelity Investments Money Management, Inc. (FIMM), an affiliate of FMR.
A complete list of holdings for each Fidelity Central Fund is available upon request or at the SEC's web site at www.sec.gov. In addition, the financial statements of the Fidelity Central Funds, which are not covered by the Fund's Report of Independent Registered Public Accounting Firm, are available on the SEC's web site or upon request.
3. Significant Accounting Policies.
The financial statements have been prepared in conformity with accounting principles generally accepted in the United States of America, which require management to make certain estimates and assumptions at the date of the financial statements. The following summarizes the significant accounting policies of the Fund:
Annual Report
Notes to Financial Statements - continued
(Amounts in thousands except ratios)
3. Significant Accounting Policies - continued
Security Valuation. Investments are valued and net asset value (NAV) per share is calculated (NAV calculation) as of the close of business of the New York Stock Exchange (NYSE), normally 4:00 p.m. Eastern time. Wherever possible, the Fund uses independent pricing services approved by the Board of Trustees to value its investments.
Equity securities, including restricted securities, for which market quotations are readily available, are valued at the last reported sale price or official closing price as reported by an independent pricing service on the primary market or exchange on which they are traded. In the event there were no sales during the day or closing prices are not available, securities are valued at the last quoted bid price. Investments in open-end mutual funds, including the Fidelity Central Funds, are valued at their closing net asset value each business day. Short-term securities with remaining maturities of sixty days or less for which quotations are not readily available are valued at amortized cost, which approximates value.
When current market prices or quotations are not readily available or do not accurately reflect fair value, valuations may be determined in accordance with procedures adopted by the Board of Trustees. For example, when developments occur between the close of a market and the close of the NYSE that may materially affect the value of some or all of the securities, or when trading in a security is halted, those securities may be fair valued. Factors used in the determination of fair value may include monitoring news to identify significant market or security specific events such as changes in the value of U.S. securities markets, reviewing developments in foreign markets and evaluating the performance of ADRs, futures contracts and exchange-traded funds. Because the Fund's utilization of fair value pricing depends on market activity, the frequency with which fair value pricing is used cannot be predicted and may be utilized to a significant extent. The value of securities used for NAV calculation under fair value pricing may differ from published prices for the same securities.
Foreign Currency. The Fund uses foreign currency contracts to facilitate transactions in foreign-denominated securities. Losses from these transactions may arise from changes in the value of the foreign currency or if the counterparties do not perform under the contracts' terms.
Foreign-denominated assets, including investment securities, and liabilities are translated into U.S. dollars at the exchange rate at period end. Purchases and sales of investment securities, income and dividends received and expenses denominated in foreign currencies are translated into U.S. dollars at the exchange rate in effect on the transaction date.
Annual Report
3. Significant Accounting Policies - continued
Foreign Currency - continued
The effects of exchange rate fluctuations on investments are included with the net realized and unrealized gain (loss) on investment securities. Other foreign currency transactions resulting in realized and unrealized gain (loss) are disclosed separately.
Investment Transactions and Income. For financial reporting purposes, the Fund's investment holdings and NAV include trades executed through the end of the last business day of the period. The NAV for processing shareholder transactions includes trades executed through the end of the prior business day. Gains and losses on securities sold are determined on the basis of identified cost and may include proceeds received from litigation. Dividend income is recorded on the ex-dividend date, except for certain dividends from foreign securities where the ex-dividend date may have passed, which are recorded as soon as the Fund is informed of the ex-dividend date. Non-cash dividends included in dividend income, if any, are recorded at the fair market value of the securities received.
Distributions received on securities that represent a return of capital or capital gain are recorded as a reduction of cost of investments and/or as a realized gain. The Fund estimates the components of distributions received that may be considered return of capital distributions or capital gain distributions. Interest income and distributions from the Fidelity Central Funds are accrued as earned. Interest income includes coupon interest and amortization of premium and accretion of discount on debt securities. Investment income is recorded net of foreign taxes withheld where recovery of such taxes is uncertain.
Expenses. Most expenses of the trust can be directly attributed to a fund. Expenses which cannot be directly attributed are apportioned among each Fund in the trust. Expense estimates are accrued in the period to which they relate and adjustments are made when actual amounts are known.
Income Tax Information and Distributions to Shareholders. Each year, the Fund intends to qualify as a regulated investment company by distributing all of its taxable income and realized gains under Subchapter M of the Internal Revenue Code. As a result, no provision for income taxes is required in the accompanying financial statements. Foreign taxes are provided for based on the Fund's understanding of the tax rules and rates that exist in the foreign markets in which it invests.
Distributions are recorded on the ex-dividend date. Income dividends and capital gain distributions are declared separately for each class. Income and capital gain distributions are determined in accordance with income tax regulations, which may differ from generally accepted accounting principles. In addition, the Fund will claim a portion of the payment made to redeeming shareholders as a distribution for income tax purposes.
Annual Report
Notes to Financial Statements - continued
(Amounts in thousands except ratios)
3. Significant Accounting Policies - continued
Income Tax Information and Distributions to Shareholders - continued
Capital accounts within the financial statements are adjusted for permanent book-tax differences. These adjustments have no impact on net assets or the results of operations. Temporary book-tax differences will reverse in a subsequent period.
Book-tax differences are primarily due to futures transactions, foreign currency transactions, certain foreign taxes, passive foreign investment companies (PFIC), market discount and losses deferred due to wash sales.
The tax-basis components of distributable earnings and the federal tax cost as of period end were as follows:
Unrealized appreciation | $ 3,355,737 | |
Unrealized depreciation | (560,220) | |
Net unrealized appreciation (depreciation) | 2,795,517 | |
Undistributed ordinary income | 302,420 | |
Undistributed long-term capital gain | 1,706,995 | |
| | |
Cost for federal income tax purposes | $ 14,713,944 | |
The tax character of distributions paid was as follows:
| October 31, 2007 | October 31, 2006 |
Ordinary Income | $ 313,217 | $ 171,628 |
Long-term Capital Gains | 794,773 | 318,347 |
Total | $ 1,107,990 | $ 489,975 |
Short-Term Trading (Redemption) Fees. Shares held in the Fund less than 30 days are subject to a redemption fee equal to 1.00% of the proceeds of the redeemed shares. All redemption fees, including any estimated redemption fees paid by FMR, are retained by the Fund and accounted for as an addition to paid in capital.
New Accounting Pronouncements. In July 2006, Financial Accounting Standards Board Interpretation No. 48, Accounting for Uncertainty in Income Taxes - an interpretation of FASB Statement 109 (FIN 48), was issued and is effective on the last business day of the semiannual reporting period for fiscal years beginning after December 15, 2006. FIN 48 sets forth a threshold for financial statement recognition, measurement and disclosure of a tax position taken or expected to be taken on a tax return. Management has concluded that the adoption of FIN 48 will not result in a material impact on the Fund's net assets, results of operations and financial statement disclosures.
Annual Report
3. Significant Accounting Policies - continued
New Accounting Pronouncements - continued
In addition, in September 2006, Statement of Financial Accounting Standards No. 157, Fair Value Measurements (SFAS 157), was issued and is effective for fiscal years beginning after November 15, 2007. SFAS 157 defines fair value, establishes a framework for measuring fair value and expands disclosures about fair value measurements. Management is currently evaluating the impact the adoption of SFAS 157 will have on the Fund's financial statement disclosures.
4. Operating Policies.
Repurchase Agreements. FMR has received an Exemptive Order from the Securities and Exchange Commission (the SEC) which permits the Fund and other affiliated entities of FMR to transfer uninvested cash balances into joint trading accounts which are then invested in repurchase agreements. The Fund may also invest directly with institutions in repurchase agreements. Repurchase agreements are collateralized by government or non-government securities. Upon settlement date, collateral is held in segregated accounts with custodian banks and may be obtained in the event of a default of the counterparty. The Fund monitors, on a daily basis, the value of the collateral to ensure it is at least equal to the principal amount of the repurchase agreement (including accrued interest). In the event of a default by the counterparty, realization of the collateral proceeds could be delayed, during which time the value of the collateral may decline.
Futures Contracts. The Fund may use futures contracts to manage its exposure to the stock market and to fluctuations in currency values. Buying futures tends to increase a fund's exposure to the underlying instrument, while selling futures tends to decrease a fund's exposure to the underlying instrument or hedge other fund investments. Upon entering into a futures contract, a fund is required to deposit with a clearing broker, no later than the following business day, an amount ("initial margin") equal to a certain percentage of the face value of the contract. The initial margin may be in the form of cash or securities and is transferred to a segregated account on settlement date. Subsequent payments ("variation margin") are made or received by a fund depending on the daily fluctuations in the value of the futures contract and are accounted for as unrealized gains or losses. Realized gains (losses) are recorded upon the expiration or closing of the futures contract. Securities deposited to meet margin requirements are identified in the Schedule of Investments. Futures contracts involve, to varying degrees, risk of loss in excess of any futures variation margin reflected in the Statement of Assets and Liabilities. The underlying face amount at value of any open futures contracts at period end is shown in the Schedule of Investments under the caption "Futures Contracts." This amount reflects each contract's exposure to the underlying instrument at period end.
Annual Report
Notes to Financial Statements - continued
(Amounts in thousands except ratios)
4. Operating Policies - continued
Futures Contracts - continued
Losses may arise from changes in the value of the underlying instruments or if the counterparties do not perform under the contract's terms. Futures contracts are valued at the settlement price established each day by the board of trade or exchange on which they are traded.
Restricted Securities. The Fund may invest in securities that are subject to legal or contractual restrictions on resale. These securities generally may be resold in transactions exempt from registration or to the public if the securities are registered. Disposal of these securities may involve time-consuming negotiations and expense, and prompt sale at an acceptable price may be difficult. Information regarding restricted securities is included at the end of the Fund's Schedule of Investments.
5. Purchases and Sales of Investments.
Purchases and sales of securities, other than short-term securities, aggregated $15,731,642 and $15,964,220, respectively.
6. Fees and Other Transactions with Affiliates.
Management Fee. FMR and its affiliates provide the Fund with investment management related services for which the Fund pays a monthly management fee. The management fee is the sum of an individual fund fee rate that is based on an annual rate of .45% of the Fund's average net assets and a group fee rate that averaged ..26% during the period. The group fee rate is based upon the average net assets of all the mutual funds advised by FMR. The group fee rate decreases as assets under management increase and increases as assets under management decrease. For the period, the total annual management fee rate was .71% of the Fund's average net assets.
In December 2006, the Board of Trustees approved a new management contract, subject to shareholder approval, to add a performance adjustment to the management fee. The proposal did not receive the number of votes required at the shareholder meeting on October 17, 2007 and as a result no changes were made to the Fund's management contract.
Distribution and Service Plan. In accordance with Rule 12b-1 of the 1940 Act, the Fund has adopted separate Distribution and Service Plans for each class of shares. Certain classes pay Fidelity Distributors Corporation (FDC), an affiliate of FMR, separate Distribution and Service Fees, each of which is based on an annual percentage
Annual Report
6. Fees and Other Transactions with Affiliates - continued
Distribution and Service Plan - continued
of each class' average net assets. In addition, FDC may pay financial intermediaries for selling shares of the Fund and providing shareholder support services. For the period, the Distribution and Service Fee rates and the total amounts paid to and retained by FDC were as follows:
| Distribution
Fee | Service
Fee | Paid to
FDC | Retained
by FDC |
Class A | 0% | .25% | $ 12,912 | $ 797 |
Class T | .25% | .25% | 18,557 | 577 |
Class B | .75% | .25% | 5,356 | 4,020 |
Class C | .75% | .25% | 15,487 | 3,642 |
| | | $ 52,312 | $ 9,036 |
Sales Load. FDC receives a front-end sales charge of up to 5.75% for selling Class A shares, and 3.50% for selling Class T shares, some of which is paid to financial intermediaries for selling shares of the Fund. FDC receives the proceeds of contingent deferred sales charges levied on Class A, Class T, Class B, and Class C redemptions. These charges depend on the holding period. The deferred sales charges range from 5% to 1% for Class B, 1% for Class C, 1.00% to .50% for certain purchases of Class A shares and .25% for certain purchases of Class T shares.
For the period, sales charge amounts retained by FDC were as follows:
| Retained
by FDC |
Class A | $ 1,065 |
Class T | 244 |
Class B* | 833 |
Class C* | 233 |
| $ 2,375 |
* When Class B and Class C shares are initially sold, FDC pays commissions from its own resources to financial intermediaries through which the sales are made.
Transfer Agent Fees. Fidelity Investments Institutional Operations Company, Inc. (FIIOC), an affiliate of FMR, is the transfer, dividend disbursing and shareholder servicing agent for each class of the Fund. FIIOC receives account fees and asset-based fees that vary according to the account size and type of account of the shareholders of the respective classes of the Fund. FIIOC pays for typesetting, printing and mailing of
Annual Report
Notes to Financial Statements - continued
(Amounts in thousands except ratios)
6. Fees and Other Transactions with Affiliates - continued
Transfer Agent Fees - continued
shareholder reports, except proxy statements. For the period, the total transfer agent fees paid by each class to FIIOC, were as follows:
| Amount | % of
Average
Net Assets |
Class A | $ 11,350 | .22 |
Class T | 7,114 | .19 |
Class B | 1,632 | .30 |
Class C | 3,418 | .22 |
Institutional Class | 9,425 | .20 |
| $ 32,939 | |
Accounting and Security Lending Fees. Fidelity Service Company, Inc. (FSC), an affiliate of FMR, maintains the Fund's accounting records. The accounting fee is based on the level of average net assets for the month. Under a separate contract, FSC administers the security lending program. The security lending fee is based on the number and duration of lending transactions.
Brokerage Commissions. The Fund placed a portion of its portfolio transactions with brokerage firms which are affiliates of the investment adviser. The commissions paid to these affiliated firms were $1 for the period.
7. Committed Line of Credit.
The Fund participates with other funds managed by FMR in a $4.2 billion credit facility (the "line of credit") to be utilized for temporary or emergency purposes to fund shareholder redemptions or for other short-term liquidity purposes. The Fund has agreed to pay commitment fees on its pro rata portion of the line of credit, which amounted to $33 and is reflected in Miscellaneous Expense on the Statement of Operations. During the period, there were no borrowings on this line of credit.
8. Security Lending.
The Fund lends portfolio securities from time to time in order to earn additional income. On the settlement date of the loan, the Fund receives collateral (in the form of U.S. Treasury obligations, letters of credit and/or cash) against the loaned securities and maintains collateral in an amount not less than 100% of the market value of the loaned securities during the period of the loan. The market value of the loaned securities is determined at the close of business of the Fund and any additional required collateral is delivered to the Fund on the next business day. If the borrower defaults on its obligation to return the securities loaned because of insolvency or other reasons, a fund could
Annual Report
8. Security Lending - continued
experience delays and costs in recovering the securities loaned or in gaining access to the collateral. Any cash collateral received is invested in the Fidelity Securities Lending Cash Central Fund. The value of loaned securities and cash collateral at period end are disclosed on the Fund's Statement of Assets and Liabilities. Security lending income represents the income earned on investing cash collateral, less fees and expenses associated with the loan, plus any premium payments that may be received on the loan of certain types of securities. Security lending income is presented in the Statement of Operations as a component of income from Fidelity Central Funds. Net income from lending portfolio securities during the period amounted to $13,653.
9. Expense Reductions.
Many of the brokers with whom FMR places trades on behalf of the Fund provided services in addition to trade execution. These services included payments of certain expenses on behalf of the Fund totaling $6,208 for the period. In addition, through arrangements with the Fund's custodian and each class' transfer agent, credits realized as a result of uninvested cash balances were used to reduce the Fund's expenses. During the period, these credits reduced the Fund's custody expenses by $1. During the period, credits reduced each class' transfer agent expense as noted in the table below.
| Transfer Agent
expense reduction | |
Class A | $ 71 | |
Class T | 61 | |
Institutional Class | 32 | |
| $ 164 | |
10. Other.
The Fund's organizational documents provide former and current trustees and officers with a limited indemnification against liabilities arising in connection with the performance of their duties to the Fund. In the normal course of business, the Fund may also enter into contracts that provide general indemnifications. The Fund's maximum exposure under these arrangements is unknown as this would be dependent on future claims that may be made against the Fund. The risk of material loss from such claims is considered remote.
In September 2006, FIIOC, a transfer agent of the Fund, notified the Fund that the Fund's books and records did not reflect a conversion of certain Class B to Class A shares upon their conversion date. In March 2007, FIIOC converted the relevant Class B shares to Class A shares and recorded the conversion in the books and records of the Fund
Annual Report
Notes to Financial Statements - continued
(Amounts in thousands except ratios)
10. Other - continued
which did not result in a material impact to the Fund's reported net assets or results of operations in the accompanying financial statements. FIIOC has remediated affected shareholders and reimbursed the Fund for all related audit and legal expenses.
The United States Securities and Exchange Commission ("SEC") is conducting an investigation of FMR (covering the years 2002 to 2004) arising from gifts, gratuities and business entertainment provided by certain brokers to certain individuals who were employed on FMR's domestic equity trading desk during that period. FMR is in discussions with the SEC staff regarding the possible resolution of the matter, but as of period-end no final resolution has been reached.
In December 2006, the Independent Trustees completed their own investigation of the matter with the assistance of independent counsel. The Independent Trustees and FMR agree that, despite the absence of proof that the Fidelity mutual funds experienced diminished execution quality as a result of the improper receipt of gifts and business entertainment, the conduct at issue was serious and is worthy of redress. Accordingly, the Independent Trustees have requested and FMR has agreed to pay $42 million to Fidelity mutual funds, plus interest to be determined at the time that payment is made. A method of allocating this payment among the funds has not yet been determined. The total payment to the Fund is not anticipated to have a material impact on the Fund's net assets. In addition, FMR reimbursed related legal expenses which are recorded in the accompanying Statement of Operations as an expense reduction.
11. Distributions to Shareholders.
Distributions to shareholders of each class were as follows:
Years ended October 31, | 2007 | 2006 |
From net investment income | | |
Class A | $ 46,511 | $ 20,889 |
Class T | 28,116 | 17,028 |
Class B | 1,108 | 1,465 |
Class C | 5,232 | 3,357 |
Institutional Class | 52,184 | 21,279 |
Total | $ 133,151 | $ 64,018 |
From net realized gain | | |
Class A | $ 316,111 | $ 137,810 |
Class T | 243,882 | 118,069 |
Class B | 35,514 | 17,614 |
Class C | 97,793 | 38,898 |
Institutional Class | 281,539 | 113,566 |
Total | $ 974,839 | $ 425,957 |
Annual Report
12. Share Transactions.
Transactions for each class of shares were as follows:
| Shares | Dollars |
Years ended October 31, | 2007 | 2006 | 2007 | 2006 |
Class A | | | | |
Shares sold | 64,291 | 92,555 | $ 1,554,629 | $ 2,062,928 |
Reinvestment of distributions | 13,015 | 5,911 | 292,975 | 120,998 |
Shares redeemed | (60,769) | (35,607) | (1,466,102) | (794,472) |
Net increase (decrease) | 16,537 | 62,859 | $ 381,502 | $ 1,389,454 |
Class T | | | | |
Shares sold | 27,062 | 62,102 | $ 641,406 | $ 1,371,264 |
Reinvestment of distributions | 11,891 | 6,462 | 265,043 | 131,108 |
Shares redeemed | (59,029) | (33,079) | (1,416,423) | (728,634) |
Net increase (decrease) | (20,076) | 35,485 | $ (509,974) | $ 773,738 |
Class B | | | | |
Shares sold | 3,350 | 7,773 | $ 77,002 | $ 166,883 |
Reinvestment of distributions | 1,452 | 822 | 31,456 | 16,265 |
Shares redeemed | (5,448) | (3,861) | (125,817) | (82,950) |
Net increase (decrease) | (646) | 4,734 | $ (17,359) | $ 100,198 |
Class C | | | | |
Shares sold | 12,688 | 28,685 | $ 291,365 | $ 617,751 |
Reinvestment of distributions | 3,357 | 1,513 | 72,889 | 30,000 |
Shares redeemed | (12,337) | (6,902) | (287,237) | (148,267) |
Net increase (decrease) | 3,708 | 23,296 | $ 77,017 | $ 499,484 |
Institutional Class | | | | |
Shares sold | 71,325 | 101,236 | $ 1,740,183 | $ 2,276,221 |
Reinvestment of distributions | 9,822 | 3,981 | 224,239 | 82,534 |
Shares redeemed | (63,957) | (35,373) | (1,575,589) | (804,047) |
Net increase (decrease) | 17,190 | 69,844 | $ 388,833 | $ 1,554,708 |
Annual Report
Report of Independent Registered Public Accounting Firm
To the Trustees of Fidelity Advisor Series VIII and the Shareholders of Fidelity Advisor Diversified International Fund:
In our opinion, the accompanying statement of assets and liabilities, including the schedule of investments, and the related statements of operations and of changes in net assets and the financial highlights present fairly, in all material respects, the financial position of Fidelity Advisor Diversified International Fund (a fund of Fidelity Advisor Series VIII) at October 31, 2007, the results of its operations for the year then ended, the changes in its net assets for each of the two years in the period then ended and the financial highlights for each of the five years in the period then ended, in conformity with accounting principles generally accepted in the United States of America. These financial statements and financial highlights (hereafter referred to as "financial statements") are the responsibility of the Fidelity Advisor Diversified International Fund's management. Our responsibility is to express an opinion on these financial statements based on our audits. We conducted our audits of these financial statements in accordance with the standards of the Public Company Accounting Oversight Board (United States). Those standards require that we plan and perform the audit to obtain reasonable assurance about whether the financial statements are free of material misstatement. An audit includes examining, on a test basis, evidence supporting the amounts and disclosures in the financial statements, assessing the accounting principles used and significant estimates made by management, and evaluating the overall financial statement presentation. We believe that our audits, which included confirmation of securities at October 31, 2007 by correspondence with the custodian and brokers, provide a reasonable basis for our opinion.
/s/ PricewaterhouseCoopers LLP
PricewaterhouseCoopers LLP
Boston, Massachusetts
December 21, 2007
Annual Report
Trustees and Officers
The Trustees, Members of the Advisory Board, and executive officers of the trust and fund, as applicable, are listed below. The Board of Trustees governs the fund and is responsible for protecting the interests of shareholders. The Trustees are experienced executives who meet periodically throughout the year to oversee the fund's activities, review contractual arrangements with companies that provide services to the fund, and review the fund's performance. Each of the Trustees oversees 370 funds advised by FMR or an affiliate. Mr. Curvey oversees 340 funds advised by FMR or an affiliate.
The Trustees hold office without limit in time except that (a) any Trustee may resign; (b) any Trustee may be removed by written instrument, signed by at least two-thirds of the number of Trustees prior to such removal; (c) any Trustee who requests to be retired or who has become incapacitated by illness or injury may be retired by written instrument signed by a majority of the other Trustees; and (d) any Trustee may be removed at any special meeting of shareholders by a two-thirds vote of the outstanding voting securities of the trust. Each Trustee who is not an interested person (as defined in the 1940 Act) (Independent Trustee), shall retire not later than the last day of the calendar year in which his or her 72nd birthday occurs. The Independent Trustees may waive this mandatory retirement age policy with respect to individual Trustees. The executive officers and Advisory Board Members hold office without limit in time, except that any officer and Advisory Board Member may resign or may be removed by a vote of a majority of the Trustees at any regular meeting or any special meeting of the Trustees. Except as indicated, each individual has held the office shown or other offices in the same company for the past five years.
The fund's Statement of Additional Information (SAI) includes more information about the Trustees. To request a free copy, call Fidelity at 1-877-208-0098.
Interested Trustees*:
Correspondence intended for each Trustee who is an interested person may be sent to Fidelity Investments, 82 Devonshire Street, Boston, Massachusetts 02109.
Name, Age; Principal Occupation |
Edward C. Johnson 3d (77) |
| Year of Election or Appointment: 1983 Mr. Johnson is Chairman of the Board of Trustees. Mr. Johnson serves as President (2006-present), Chief Executive Officer, Chairman, and a Director of FMR LLC; Chairman and a Director of FMR; Chairman and a Director of Fidelity Research & Analysis Company (FRAC); Chairman and a Director of Fidelity Investments Money Management, Inc.; and Chairman (2001-present) and a Director of FMR Co., Inc. In addition, Mr. Johnson serves as Chairman and Director of Fidelity International Limited (FIL). |
James C. Curvey (72) |
| Year of Election or Appointment: 2007 Mr. Curvey also serves as Trustee (2007-present) or Member of the Advisory Board (2007-present) of other investment companies advised by FMR. Mr. Curvey is a Director of FMR and FMR Co., Inc. (2007-present). Mr. Curvey is also Vice Chairman (2006-present) and Director of FMR LLC. Mr. Curvey joined Fidelity in 1982 and served in numerous senior management positions, including President and Chief Operating Officer of FMR LLC (1997-2000) and President of Fidelity Strategic Investments (2000-2002). In addition, he serves as a member of the Board of Directors of Geerlings & Wade, Inc. (wine distribution). |
* Trustees have been determined to be "Interested Trustees" by virtue of, among other things, their affiliation with the trust, or various entities under common control with FMR. FMR Corp. merged with FMR LLC on October 1, 2007. Any references to FMR LLC for prior periods are deemed to be references to the prior entity.
Independent Trustees:
Correspondence intended for each Independent Trustee (that is, the Trustees other than the Interested Trustees) may be sent to Fidelity Investments, P.O. Box 55235, Boston, Massachusetts 02205-5235.
Name, Age; Principal Occupation |
Dennis J. Dirks (59) |
| Year of Election or Appointment: 2005 Prior to his retirement in May 2003, Mr. Dirks was Chief Operating Officer and a member of the Board of The Depository Trust & Clearing Corporation (DTCC) (1999-2003). He also served as President, Chief Operating Officer, and Board member of The Depository Trust Company (DTC) (1999-2003) and President and Board member of the National Securities Clearing Corporation (NSCC) (1999-2003). In addition, Mr. Dirks served as Chief Executive Officer and Board member of the Government Securities Clearing Corporation (2001-2003) and Chief Executive Officer and Board member of the Mortgage-Backed Securities Clearing Corporation (2001-2003). Mr. Dirks also serves as a Trustee and a member of the Finance Committee of Manhattan College (2005-present) and a Trustee and a member of the Finance Committee of AHRC of Nassau County (2006-present). |
Albert R. Gamper, Jr. (65) |
| Year of Election or Appointment: 2006 Prior to his retirement in December 2004, Mr. Gamper served as Chairman of the Board of CIT Group Inc. (commercial finance). During his tenure with CIT Group Inc. Mr. Gamper served in numerous senior management positions, including Chairman (1987-1989; 1999-2001; 2002-2004), Chief Executive Officer (1987-2004), and President (1989-2002). He currently serves as a member of the Board of Directors of Public Service Enterprise Group (utilities, 2001-present), Chairman of the Board of Governors, Rutgers University (2004-present), and Chairman of the Board of Saint Barnabas Health Care System. |
George H. Heilmeier (71) |
| Year of Election or Appointment: 2004 Dr. Heilmeier is Chairman Emeritus of Telcordia Technologies (communication software and systems), where prior to his retirement, he served as company Chairman and Chief Executive Officer. He currently serves on the Boards of Directors of The Mitre Corporation (systems engineering and information technology support for the government), and HRL Laboratories (private research and development, 2004-present). He is Chairman of the General Motors Science & Technology Advisory Board and a Life Fellow of the Institute of Electrical and Electronics Engineers (IEEE). Dr. Heilmeier is a member of the Defense Science Board and the National Security Agency Advisory Board. He is also a member of the National Academy of Engineering, the American Academy of Arts and Sciences, and the Board of Overseers of the School of Engineering and Applied Science of the University of Pennsylvania. Previously, Dr. Heilmeier served as a Director of TRW Inc. (automotive, space, defense, and information technology, 1992-2002), Compaq (1994-2002), Automatic Data Processing, Inc. (ADP) (technology-based business outsourcing, 1995-2002), INET Technologies Inc. (telecommunications network surveillance, 2001-2004), and Teletech Holdings (customer management services). He is the recipient of the 2005 Kyoto Prize in Advanced Technology for his invention of the liquid crystal display, and a member of the Consumer Electronics Hall of Fame. |
James H. Keyes (67) |
| Year of Election or Appointment: 2007 Prior to his retirement in 2003, Mr. Keyes was Chairman, President, and Chief Executive Officer of Johnson Controls, Inc. (automotive supplier, 1993-2003). He currently serves as a member of the boards of LSI Logic Corporation (semiconductor technologies), Navistar International Corporation (manufacture and sale of trucks, buses, and diesel engines, 2002-present), and Pitney Bowes, Inc. (integrated mail, messaging, and document management solutions). |
Marie L. Knowles (61) |
| Year of Election or Appointment: 2001 Prior to Ms. Knowles' retirement in June 2000, she served as Executive Vice President and Chief Financial Officer of Atlantic Richfield Company (ARCO) (diversified energy, 1996-2000). From 1993 to 1996, she was a Senior Vice President of ARCO and President of ARCO Transportation Company. She served as a Director of ARCO from 1996 to 1998. She currently serves as a Director of Phelps Dodge Corporation (copper mining and manufacturing) and McKesson Corporation (healthcare service, 2002-present). Ms. Knowles is a Trustee of the Brookings Institution and the Catalina Island Conservancy and also serves as a member of the Advisory Board for the School of Engineering of the University of Southern California. |
Ned C. Lautenbach (63) |
| Year of Election or Appointment: 2000 Mr. Lautenbach is Chairman of the Independent Trustees (2006-present). Mr. Lautenbach has been a partner of Clayton, Dubilier & Rice, Inc. (private equity investment firm) since September 1998. Previously, Mr. Lautenbach was with the International Business Machines Corporation (IBM) from 1968 until his retirement in 1998. Mr. Lautenbach serves as a Director of Sony Corporation (2006-present) and Eaton Corporation (diversified industrial) as well as the Philharmonic Center for the Arts in Naples, Florida. He also is a member of the Board of Trustees of Fairfield University (2005-present), as well as a member of the Council on Foreign Relations. |
Cornelia M. Small (63) |
| Year of Election or Appointment: 2005 Ms. Small is a member (2000-present) and Chairperson (2002-present) of the Investment Committee, and a member (2002-present) of the Board of Trustees of Smith College. Previously, she served as Chief Investment Officer (1999-2000), Director of Global Equity Investments (1996-1999), and a member of the Board of Directors of Scudder, Stevens & Clark (1990-1997) and Scudder Kemper Investments (1997-1999). In addition, Ms. Small served as Co-Chair (2000-2003) of the Annual Fund for the Fletcher School of Law and Diplomacy. |
William S. Stavropoulos (68) |
| Year of Election or Appointment: 2001 Mr. Stavropoulos is Chairman Emeritus of the Board of Directors of The Dow Chemical Company. Since joining The Dow Chemical Company in 1967, Mr. Stavropoulos served in numerous senior management positions, including President (1993-2000; 2002-2003), CEO (1995-2000; 2002-2004), and Chairman of the Executive Committee (2000-2004). Currently, he is a Director of NCR Corporation (data warehousing and technology solutions), Chemical Financial Corporation, Maersk Inc. (industrial conglomerate, 2002-present), Tyco International, Inc. (multinational manufacturing and services, 2007-present), and a member of the Advisory Board for Metalmark Capital (private equity investment firm, 2005-present). He is a special advisor to Clayton, Dubilier & Rice, Inc., a private equity investment firm. He also serves as a member of the Board of Trustees of the American Enterprise Institute for Public Policy Research. In addition, Mr. Stavropoulos is a member of The Business Council, J.P. Morgan International Council and the University of Notre Dame Advisory Council for the College of Science. |
Kenneth L. Wolfe (68) |
| Year of Election or Appointment: 2005 Prior to his retirement in 2001, Mr. Wolfe was Chairman and Chief Executive Officer of Hershey Foods Corporation (1993-2001). He currently serves as a member of the boards of Adelphia Communications Corporation (2003-present), Bausch & Lomb, Inc., and Revlon Inc. (2004-present). |
Advisory Board Members and Executive Officers**:
Correspondence intended for Mr. Mauriello, Mr. Thomas, and Mr. Wiley may be sent to Fidelity Investments, P.O. Box 55235, Boston, Massachusetts 02205-5235. Correspondence intended for each executive officer and Mr. Lynch may be sent to Fidelity Investments, 82 Devonshire Street, Boston, Massachusetts 02109.
Name, Age; Principal Occupation |
Peter S. Lynch (63) |
| Year of Election or Appointment: 2003 Member of the Advisory Board of Fidelity Advisor Series VIII. Mr. Lynch is Vice Chairman and a Director of FMR, and Vice Chairman (2001-present) and a Director of FMR Co., Inc. Previously, Mr. Lynch served as a Trustee of the Fidelity funds (1990-2003). In addition, he serves as a Trustee of Boston College and as the Chairman of the Inner-City Scholarship Fund. |
Joseph Mauriello (63) |
| Year of Election or Appointment: 2007 Member of the Advisory Board of Fidelity Advisor Series VIII. Prior to his retirement in January 2006, Mr. Mauriello served in numerous senior management positions including Deputy Chairman and Chief Operating Officer (2004-2005), and Vice Chairman of Financial Services (2002-2004) of KPMG LLP US (professional services firm, 1965-2005). Mr. Mauriello currently serves as a member of the Board of Directors of XL Capital Ltd., (global insurance and re-insurance company, 2006-present) and of Arcadia Resources Inc., (health care services and products, 2007-present). He also served as a Director of the Hamilton Funds of the Bank of New York (2006-2007). |
David M. Thomas (58) |
| Year of Election or Appointment: 2007 Member of the Advisory Board of Fidelity Advisor Series VIII. Previously, Mr. Thomas served as Executive Chairman (2005-2006) and Chairman and Chief Executive Officer (2000-2005) of IMS Health, Inc. (pharmaceutical and healthcare information solutions). In addition, Mr. Thomas serves as a member of the Board of Directors of Fortune Brands, Inc. (consumer products holding company), and Interpublic Group of Companies, Inc. (marketing communication, 2004-present). |
Michael E. Wiley (57) |
| Year of Election or Appointment: 2007 Member of the Advisory Board of Fidelity Advisor Series VIII. Mr. Wiley also serves as Sr. Energy Advisor of Katzenbach Partners, LLC (consulting firm, 2006-present) and a member of the Board of Trustees of the University of Tulsa (2000-2006; 2007-present). He serves as a Director of Tesoro Corporation (independent oil refiner and marketer, 2005-present), and a Director of Bill Barrett Corporation (exploration and production company, 2005-present). In addition, he also serves as a Director of Post Oak Bank (privately-held bank, 2004-present), and an Advisory Director of Riverstone Holdings (private investment firm). Previously, Mr. Wiley served as Chairman, President, and CEO of Baker Hughes, Inc. (oilfield services company, 2000-2004), and as Director of Spinnaker Exploration Company (exploration and production company, 2001-2005). |
Kimberley H. Monasterio (43) |
| Year of Election or Appointment: 2007 President and Treasurer of Advisor Diversified International. Ms. Monasterio also serves as President and Treasurer of other Fidelity funds (2007-present) and is an employee of FMR (2004-present). Previously, Ms. Monasterio served as Deputy Treasurer of the Fidelity funds (2004-2006). Before joining Fidelity Investments, Ms. Monasterio served as Treasurer (2000-2004) and Chief Financial Officer (2002-2004) of the Franklin Templeton Funds and Senior Vice President of Franklin Templeton Services, LLC (2000-2004). |
Walter C. Donovan (45) |
| Year of Election or Appointment: 2007 Vice President of Advisor Diversified International. Mr. Donovan also serves as Vice President of Fidelity's Equity Funds (2007-present). Mr. Donovan also serves as Executive Vice President of FMR (2005-present) and FMR Co., Inc. (2005-present). Previously, Mr. Donovan served as Vice President of Fidelity's High Income Funds (2005-2007), Fixed-Income Funds (2005-2006), certain Asset Allocation Funds (2005-2006), certain Balanced Funds (2005-2006), and as Vice President and Director of Fidelity's International Equity Trading group (1998-2005). |
Eric M. Wetlaufer (45) |
| Year of Election or Appointment: 2006 Vice President of Advisor Diversified International. Mr. Wetlaufer also serves as Vice President of certain International Equity Funds (2006-present). Mr. Wetlaufer is Senior Vice President of FMR (2006-present) and FMR Co., Inc. (2006-present), and President and Director of Fidelity Management & Research (U.K.) Inc. (2006-present) and Fidelity Research & Analysis Company (2006-present). Before joining Fidelity Investments in 2005, Mr. Wetlaufer was a partner in Oxhead Capital Management (2004-2005). Previously, Mr. Wetlaufer served as a Chief Investment Officer of Putnam Investments (1997-2003). |
Eric D. Roiter (58) |
| Year of Election or Appointment: 1998 Secretary of Advisor Diversified International. He also serves as Secretary of other Fidelity funds; Vice President, General Counsel, and Secretary of FMR Co., Inc. (2001-present) and FMR; Assistant Secretary of Fidelity Management & Research (U.K.) Inc. (2001-present), Fidelity Research & Analysis Company (2001-present), and Fidelity Investments Money Management, Inc. (2001-present). Mr. Roiter is an Adjunct Member, Faculty of Law, at Boston College Law School (2003-present). Previously, Mr. Roiter served as Vice President and Secretary of Fidelity Distributors Corporation (FDC) (1998-2005). |
Scott C. Goebel (39) |
| Year of Election or Appointment: 2007 Assistant Secretary of Advisor Diversified International. Mr. Goebel also serves as Assistant Secretary of other Fidelity funds (2007-present), and is an employee of FMR. |
R. Stephen Ganis (41) |
| Year of Election or Appointment: 2006 Anti-Money Laundering (AML) officer of Advisor Diversified International. Mr. Ganis also serves as AML officer of other Fidelity funds (2006-present) and FMR LLC (2003-present). Before joining Fidelity Investments, Mr. Ganis practiced law at Goodwin Procter, LLP (2000-2002). |
Joseph B. Hollis (59) |
| Year of Election or Appointment: 2006 Chief Financial Officer of Advisor Diversified International. Mr. Hollis also serves as Chief Financial Officer of other Fidelity funds. Mr. Hollis is President of Fidelity Pricing and Cash Management Services (FPCMS) (2005-present). Mr. Hollis also serves as President and Director of Fidelity Service Company, Inc. (2006-present). Previously, Mr. Hollis served as Senior Vice President of Cash Management Services (1999-2002) and Investment Management Operations (2002-2005). |
Kenneth A. Rathgeber (60) |
| Year of Election or Appointment: 2004 Chief Compliance Officer of Advisor Diversified International. Mr. Rathgeber also serves as Chief Compliance Officer of other Fidelity funds (2004-present) and Executive Vice President of Risk Oversight for Fidelity Investments (2002-present). He is Chief Compliance Officer of FMR (2005-present), FMR Co., Inc. (2005-present), Fidelity Management & Research (U.K.) Inc. (2005-present), Fidelity Research & Analysis Company (2005-present), Fidelity Investments Money Management, Inc. (2005-present), and Strategic Advisers, Inc. (2005-present). Previously, Mr. Rathgeber served as Executive Vice President and Chief Operating Officer for Fidelity Investments Institutional Services Company, Inc. (1998-2002). |
Bryan A. Mehrmann (46) |
| Year of Election or Appointment: 2005 Deputy Treasurer of Advisor Diversified International. Mr. Mehrmann also serves as Deputy Treasurer of other Fidelity funds (2005-present) and is an employee of FMR. Previously, Mr. Mehrmann served as Vice President of Fidelity Investments Institutional Services Group (FIIS)/Fidelity Investments Institutional Operations Corporation, Inc. (FIIOC) Client Services (1998-2004). |
Kenneth B. Robins (38) |
| Year of Election or Appointment: 2005 Deputy Treasurer of Advisor Diversified International. Mr. Robins also serves as Deputy Treasurer of other Fidelity funds (2005-present) and is an employee of FMR (2004-present). Before joining Fidelity Investments, Mr. Robins worked at KPMG LLP, where he was a partner in KPMG's department of professional practice (2002-2004) and a Senior Manager (1999-2000). In addition, Mr. Robins served as Assistant Chief Accountant, United States Securities and Exchange Commission (2000-2002). |
Robert G. Byrnes (40) |
| Year of Election or Appointment: 2005 Assistant Treasurer of Advisor Diversified International. Mr. Byrnes also serves as Assistant Treasurer of other Fidelity funds (2005-present) and is an employee of FMR (2005-present). Previously, Mr. Byrnes served as Vice President of FPCMS (2003-2005). Before joining Fidelity Investments, Mr. Byrnes worked at Deutsche Asset Management where he served as Vice President of the Investment Operations Group (2000-2003). |
Peter L. Lydecker (53) |
| Year of Election or Appointment: 2004 Assistant Treasurer of Advisor Diversified International. Mr. Lydecker also serves as Assistant Treasurer of other Fidelity funds (2004) and is an employee of FMR. |
Paul M. Murphy (60) |
| Year of Election or Appointment: 2007 Assistant Treasurer of Advisor Diversified International. Mr. Murphy also serves as Assistant Treasurer of other Fidelity funds (2007-present) and is an employee of FMR (2007-present). Previously, Mr. Murphy served as Chief Financial Officer of the Fidelity Funds (2005-2006), Vice President and Associate General Counsel of FMR (2007), and Senior Vice President of Fidelity Pricing and Cash Management Services Group (FPCMS) (1994-2007). |
Gary W. Ryan (49) |
| Year of Election or Appointment: 2005 Assistant Treasurer of Advisor Diversified International. Mr. Ryan also serves as Assistant Treasurer of other Fidelity funds (2005-present) and is an employee of FMR (2005-present). Previously, Mr. Ryan served as Vice President of Fund Reporting in FPCMS (1999-2005). |
** FMR Corp. merged with FMR LLC on October 1, 2007. Any references to FMR LLC for prior periods are deemed to be references to the prior entity.
Annual Report
Distributions
The Board of Trustees of Advisor Diversified International Fund voted to pay to shareholders of record at the opening of business on record date, the following distributions per share derived from capital gains realized from sales of portfolio securities, and dividends derived from net investment income:
| Pay Date | Record Date | Dividends | Capital Gains |
Class A | 12/07/07 | 12/10/07 | $0.239 | $3.02 |
Class T | 12/07/07 | 12/10/07 | $0.16 | $3.02 |
Class B | 12/07/07 | 12/10/07 | $0.03 | $3.02 |
Class C | 12/07/07 | 12/10/07 | $0.059 | $3.02 |
The fund hereby designates as a capital gain dividend with respect to the taxable year ended October 31st 2007, $1,706,994,942, or, if subsequently determined to be different, the net capital gain of such year.
Class A designates 56%, Class T designates 61%, Class B designates 83%, and Class C designates 76%, of each dividend distributed in December 2006, respectively during the fiscal year as amounts which may be taken into account as a dividend for purposes of the maximum rate under section 1(h)(11) of the Internal Revenue Code.
The amounts per share which represent income derived from sources within, and taxes paid to, foreign countries or possessions of the United States are as follows:
| Pay Date | Income | Taxes |
Class A | 12/11/2006 | $0.284 | $0.0233 |
Class T | 12/11/2006 | $0.258 | $0.0233 |
Class B | 12/11/2006 | $0.189 | $0.0233 |
Class C | 12/11/2006 | $0.207 | $0.0233 |
The fund will notify shareholders in January 2008 of amounts for use in preparing 2007 income tax returns.
Annual Report
Proxy Voting Results
A special meeting of Advisor Diversified International shareholders was held on October 17, 2007. The results of votes taken among shareholders on the proposal before them are reported below. Each vote reported represents one dollar of net asset value held on the record date for the meeting.
PROPOSAL 1 |
To approve an amended management contract that includes adding a performance adjustment component to the management fee for Fidelity Advisor Diversified International Fund and giving the Trustees the authority to change the fund's performance adjustment index going forward, without shareholder vote, subject to applicable law. |
| # of
Votes | % of
Votes |
Affirmative | 4,780,444,603.41 | 60.433 |
Against | 2,831,418,822.29 | 35.794 |
Abstain | 298,449,571.17 | 3.773 |
TOTAL | 7,910,312,996.87 | 100.000 |
Annual Report
Board Approval of Investment Advisory Contracts and Management Fees
Advisor Diversified International Fund
Each year, typically in July, the Board of Trustees, including the Independent Trustees (together, the Board), votes on the renewal of the management contract and sub-advisory agreements (together, the Advisory Contracts) for the fund. The Board, assisted by the advice of fund counsel and Independent Trustees' counsel, requests and considers a broad range of information throughout the year.
The Board meets regularly each month except August and takes into account throughout the year matters bearing on Advisory Contracts. The Board, acting directly and through its separate committees, considers at each of its meetings factors that are relevant to the annual renewal of the fund's Advisory Contracts, including the services and support provided to the fund and its shareholders. At the time of the renewal, the Board had 12 standing committees, each composed of Independent Trustees with varying backgrounds, to which the Board has assigned specific subject matter responsibilities in order to enhance effective decision-making by the Board. Each committee has adopted a written charter outlining the structure and purposes of the committee. One such committee, the Equity Contract Committee, meets periodically as needed throughout the year to consider matters specifically related to the annual renewal of Advisory Contracts. The committee requests and receives information on, and makes recommendations to the Independent Trustees concerning, the approval and annual review of the Advisory Contracts.
At its July 2007 meeting, the Board of Trustees, including the Independent Trustees, unanimously determined to renew the Advisory Contracts for the fund. In reaching its determination, the Board considered all factors it believed relevant, including (i) the nature, extent, and quality of the services to be provided to the fund and its shareholders (including the investment performance of the fund); (ii) the competitiveness of the management fee and total expenses of the fund; (iii) the total costs of the services to be provided by and the profits to be realized by the investment adviser and its affiliates from the relationship with the fund; (iv) the extent to which economies of scale would be realized as the fund grows; and (v) whether fee levels reflect these economies of scale, if any, for the benefit of fund shareholders. The Board also approved amendments to the fund's agreements with foreign sub-advisers to clarify that each sub-adviser provides services as an independent contractor.
In determining whether to renew the Advisory Contracts for the fund, the Board ultimately reached a determination, with the assistance of fund counsel and Independent Trustees' counsel, that the renewal of the Advisory Contracts and the compensation to be received by Fidelity under the management contract is consistent with Fidelity's fiduciary duty under applicable law. In addition to evaluating the specific factors noted above, the Board, in reaching its determination, is aware that shareholders in the fund have a broad range of investment choices available to them, including a wide choice among mutual funds offered by competitors to Fidelity, and that the fund's shareholders, with the opportunity to review and weigh the disclosure provided by the fund in its prospectus and other public disclosures, have chosen to invest in this fund, managed by Fidelity.
Annual Report
Board Approval of Investment Advisory Contracts and
Management Fees - continued
Nature, Extent, and Quality of Services Provided. The Board considered staffing within the investment adviser, FMR, and the sub-advisers (together, the Investment Advisers), including the background of the fund's portfolio manager and the fund's investment objective and discipline. The Independent Trustees also had discussions with senior management of Fidelity's investment operations and investment groups. The Board considered the structure of the portfolio manager compensation program and whether this structure provides appropriate incentives.
Resources Dedicated to Investment Management and Support Services. The Board reviewed the size, education, and experience of the Investment Advisers' investment staff, their use of technology, and the Investment Advisers' approach to recruiting, training, and retaining portfolio managers and other research, advisory, and management personnel. The Board considered Fidelity's extensive global research capabilities that enable the Investment Advisers to aggregate data from various sources in an effort to produce positive investment results. The Board noted that Fidelity's analysts have access to a variety of technological tools that enable them to perform both fundamental and quantitative analysis and to specialize in various disciplines. The Board also considered that Fidelity's portfolio managers and analysts have access to daily portfolio attribution that allows for monitoring of a fund's portfolio, as well as an electronic communication system that provides immediate real-time access to research concerning issuers and credit enhancers.
Shareholder and Administrative Services. The Board considered (i) the nature, extent, quality, and cost of advisory, administrative, distribution, and shareholder services performed by the Investment Advisers and their affiliates under the Advisory Contracts and under separate agreements covering transfer agency, pricing and bookkeeping, and securities lending services for the fund; (ii) the nature and extent of the Investment Advisers' supervision of third party service providers, principally custodians and subcustodians; and (iii) the resources devoted to, and the record of compliance with, the fund's compliance policies and procedures. The Board reviewed the allocation of fund brokerage, including allocations to brokers affiliated with the Investment Advisers, the use of brokerage commissions to pay fund expenses, and the use of "soft" commission dollars to pay for research services. The Board also considered that Fidelity voluntarily pays for market data out of its own resources. The Board also considered the agreement reached between the Independent Trustees and Fidelity in December 2006 following an independent review of matters relating to receipt of travel, entertainment, gifts and gratuities in violation of Fidelity policies.
Annual Report
The Board noted that the growth of fund assets across the complex allows Fidelity to reinvest in the development of services designed to enhance the value or convenience of the Fidelity funds as investment vehicles. These services include 24-hour access to account information and market information through phone representatives and over the Internet, and investor education materials and asset allocation tools.
Investment in a Large Fund Family. The Board considered the benefits to shareholders of investing in a Fidelity fund, including the benefits of investing in a fund that is part of a large family of funds offering a variety of investment disciplines and providing for a large variety of mutual fund investor services. For example, fund shareholders are offered the privilege of exchanging shares of the fund for shares of other Fidelity funds, as set forth in the fund's prospectus, without paying a sales charge. The Board noted that, since the last Advisory Contract renewals in July 2006, Fidelity has taken a number of actions that benefited particular funds, including (i) dedicating additional resources to investment research and to restructure the investment research teams; (ii) contractually agreeing to reduce the management fee on Fidelity Advisor Floating Rate High Income Fund; (iii) contractually agreeing to reduce the management fees on Fidelity's California, Massachusetts, New Jersey, and New York AMT Tax-Free Money Market Funds, launching new Institutional Classes and Service Classes of these funds, and contractually agreeing to impose expense limitations on these funds; (iv) eliminating the exchange fee on the Fidelity Select Portfolios and reducing the pricing and bookkeeping fee rates for these funds; (v) reducing the maximum transfer agency fee rates on high income funds and certain equity funds; (vi) proposing amended management contracts that, if approved by shareholders, will add a performance adjustment component to the management fees paid by 18 Fidelity Advisor equity funds; (vii) contractually agreeing to reduce fees for Ultra-Short Central Fund and the money market Central Funds; (viii) waiving the Fidelity Advisor funds' contingent deferred sales charge on certain redemptions made through systematic withdrawal programs; and (ix) amending the management contracts for equity and fixed-income funds whose management contracts incorporate a "group fee" structure by adding four new fee "breakpoints" to the group fee rate schedules.
Investment Performance and Compliance. The Board considered whether the fund has operated within its investment objective, as well as its record of compliance with its investment restrictions. It also reviewed the fund's absolute investment performance for each class, as well as the fund's relative investment performance for each class measured against (i) a broad-based securities market index, and (ii) a peer group of mutual funds deemed appropriate by the Board over multiple periods. The following charts considered by the Board show, over the one-, three-, and five-year periods ended December 31, 2006, the cumulative total returns of Institutional Class (Class I) and Class B of the fund, the cumulative total returns of a broad-based securities market index ("benchmark"), and a range of cumulative total returns of a peer group of mutual funds identified by Morningstar, Inc. as having an investment style similar to that of the fund based on underlying portfolio holdings. The returns of Institutional Class (Class I) and Class B show the performance of the highest and lowest performing classes, respectively (based on three-year performance). The box within each chart shows the 25th percentile return (bottom of box) and the 75th percentile return (top of box) of the peer group. Returns shown above the box are in the first quartile and returns shown below the box are in the fourth quartile. The percentage beaten numbers noted below each chart correspond to the percentile box and represent the percentage of funds in the peer group whose performance was equal to or lower than that of the class indicated.
Annual Report
Board Approval of Investment Advisory Contracts and
Management Fees - continued
Advisor Diversified International Fund
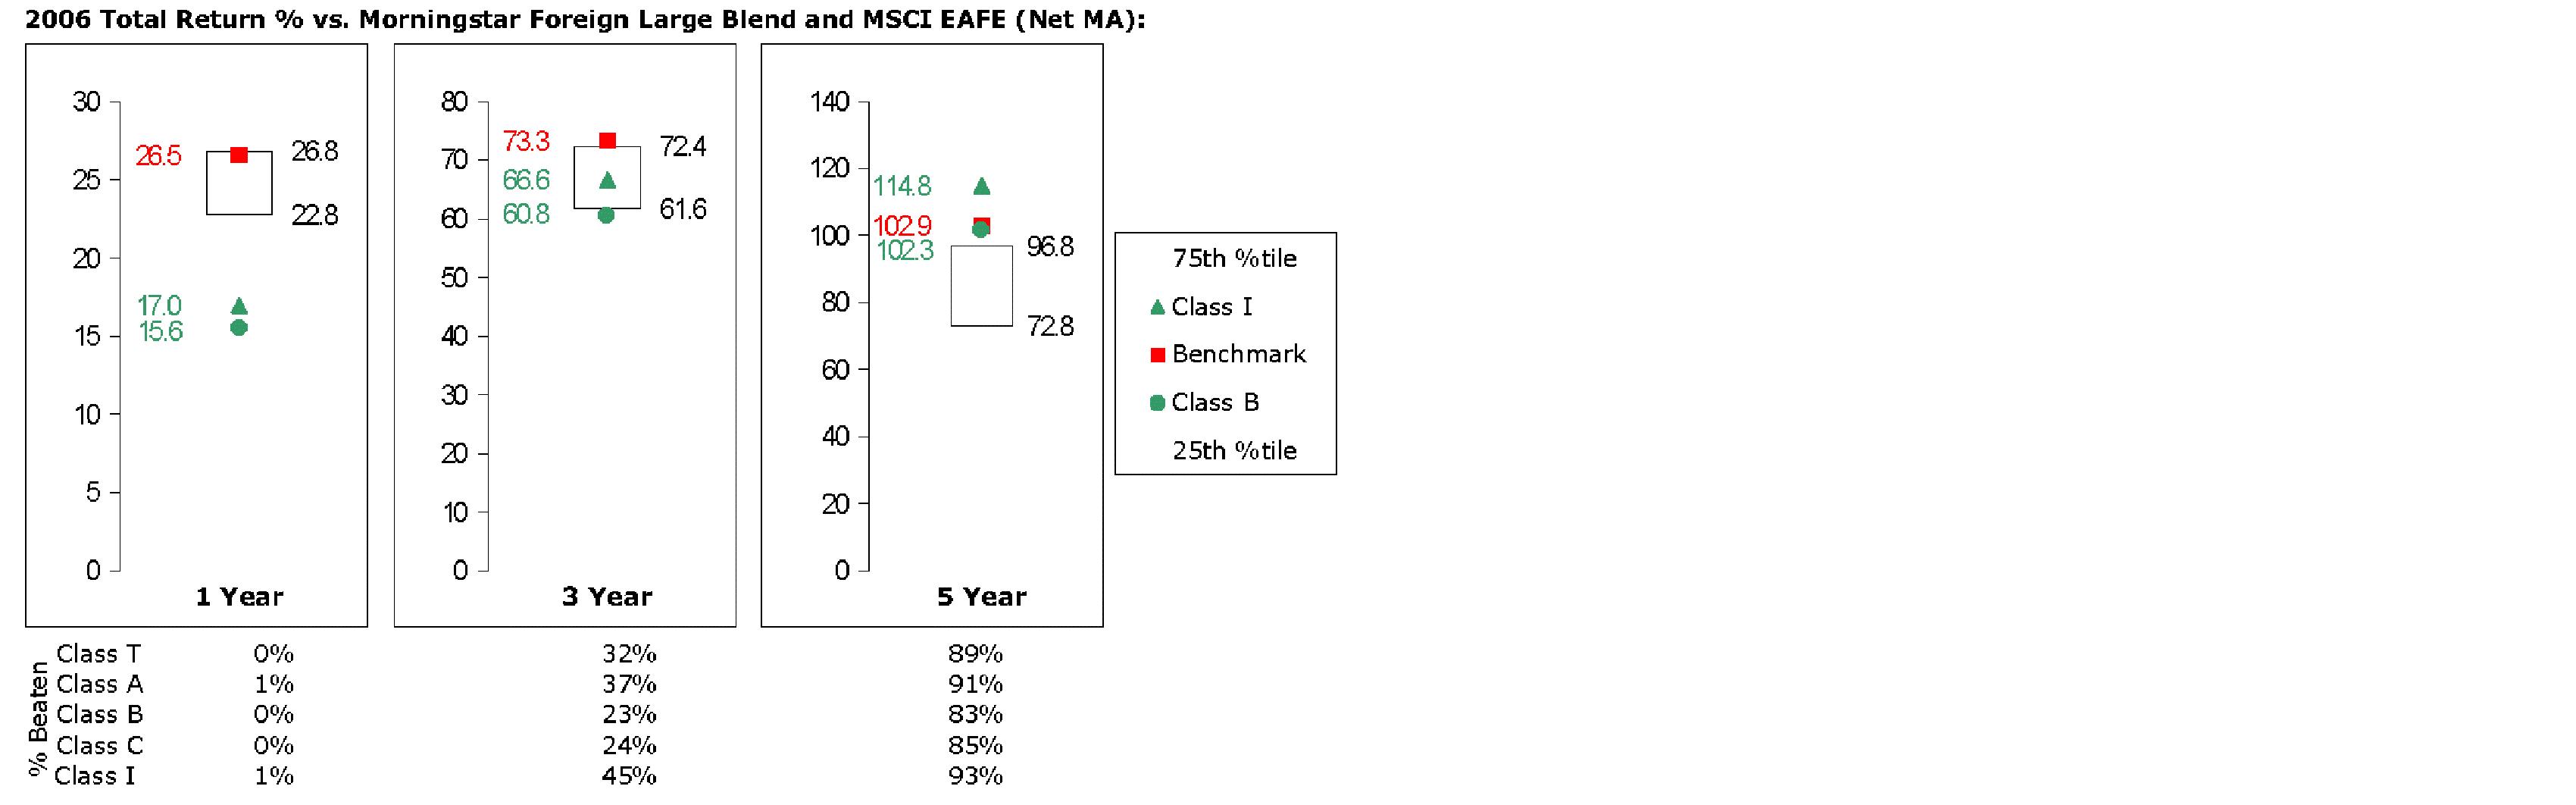
The Board reviewed the fund's relative investment performance against its peer group and stated that the performance of Institutional Class (Class I) of the fund was in the fourth quartile for the one-year period, the third quartile for the three-year period, and the first quartile for the five-year period. The Board also stated that the investment performance of the fund was lower than its benchmark for the one- and three-year periods, although the five-year cumulative total return of Institutional Class (Class I) compared favorably to its benchmark. The Board considered that the variations in performance among the fund's classes reflect the variations in class expenses, which result in lower performance for higher expense classes. The Board discussed with FMR actions to be taken by FMR to improve the fund's more recent disappointing performance relative to its peer group. The Board will continue to closely monitor the performance of the fund in the coming year.
The Board considered that FMR has taken steps to refocus and strengthen equity research, equity portfolio management, and compliance.
Annual Report
Based on its review, and giving particular weight to the nature and quality of the resources dedicated by the Investment Advisers to maintain and improve relative performance, the Board concluded that the nature, extent, and quality of the services provided to the fund will benefit the fund's shareholders, particularly in light of the Board's view that the fund's shareholders benefit from investing in a fund that is part of a large family of funds offering a variety of investment disciplines and services.
Competitiveness of Management Fee and Total Fund Expenses. The Board considered the fund's management fee and total expenses compared to "mapped groups" of competitive funds and classes. Fidelity creates "mapped groups" by combining similar Lipper investment objective categories that have comparable management fee characteristics. Combining Lipper investment objective categories aids the Board's management fee and total expense comparisons by broadening the competitive group used for comparison and by reducing the number of universes to which various Fidelity funds are compared. The Board also considered supplemental information about how the fund's management fee and total expenses ranked relative to groups based on Lipper classifications, which take into account a fund's market capitalization and style.
The Board considered two proprietary management fee comparisons for the 12-month periods shown in the chart below. The group of Lipper funds used by the Board for management fee comparisons is referred to below as the "Total Mapped Group." The Total Mapped Group comparison focuses on a fund's standing relative to the total universe of comparable funds available to investors, in terms of gross management fees before expense reimbursements or caps. "TMG %" represents the percentage of funds in the Total Mapped Group that had management fees that were lower than the fund's. For example, a TMG % of 13% means that 87% of the funds in the Total Mapped Group had higher management fees than the fund. The "Asset-Size Peer Group" (ASPG) comparison focuses on a fund's standing relative to non-Fidelity funds similar in size to the fund within the Total Mapped Group. The ASPG represents at least 15% of the funds in the Total Mapped Group with comparable asset size and management fee characteristics, subject to a minimum of 50 funds (or all funds in the Total Mapped Group if fewer than 50). Additional information, such as the ASPG quartile in which the fund's management fee ranked, is also included in the chart and considered by the Board.
Annual Report
Board Approval of Investment Advisory Contracts and
Management Fees - continued
Advisor Diversified International Fund
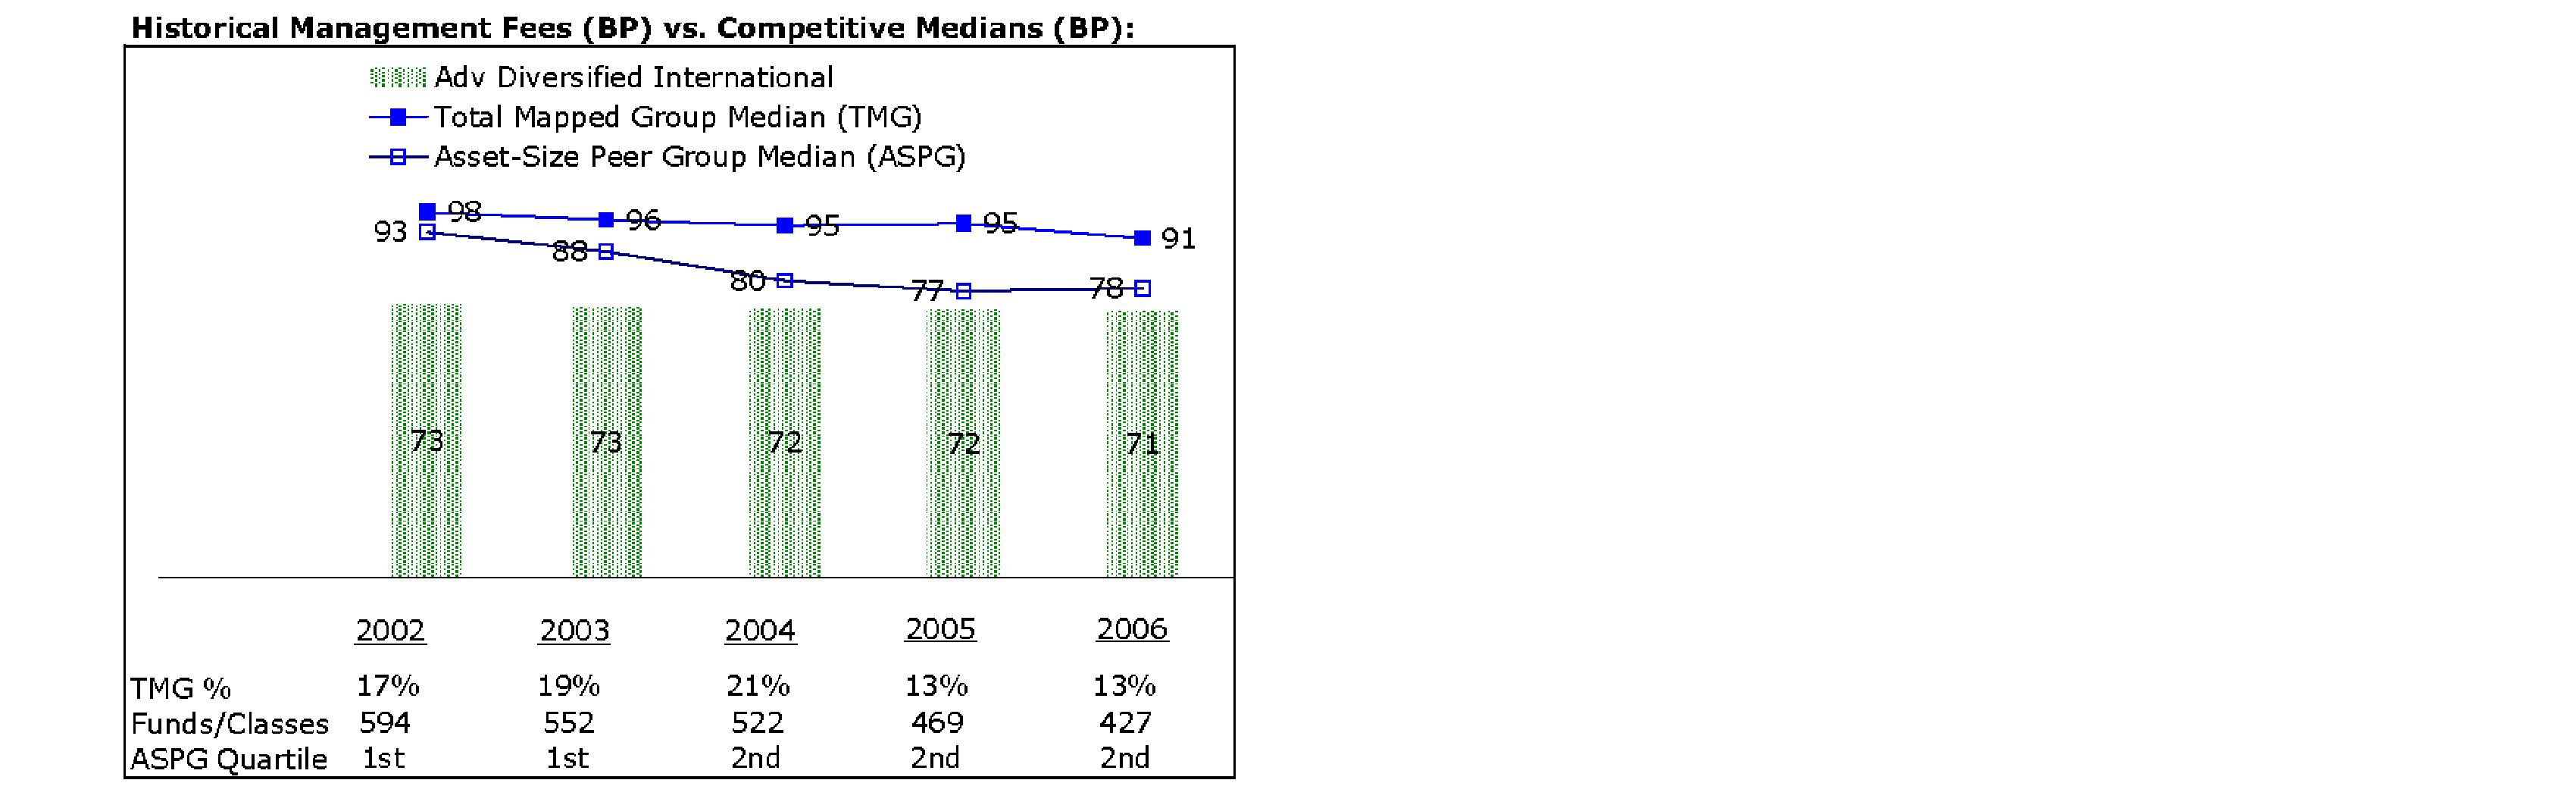
The Board noted that the fund's management fee ranked below the median of its Total Mapped Group and below the median of its ASPG for 2006.
Furthermore, the Board considered that, on December 14, 2006, it had approved an amended management contract for the fund that, if approved by shareholders, will add a performance adjustment component to the management fee paid by the fund (that is, the fund's management fee will be subject to upward or downward adjustment depending upon whether, and to what extent, the fund's investment performance for the performance period exceeds, or is exceeded by, the record (over the same period) of a Board-approved performance adjustment index).
Based on its review, the Board concluded that the fund's management fee was fair and reasonable in light of the services that the fund receives and the other factors considered.
In its review of each class's total expenses, the Board considered the fund's management fee as well as other fund or class expenses, as applicable, such as transfer agent fees, pricing and bookkeeping fees, fund-paid 12b-1 fees, and custodial, legal, and audit fees. The Board also noted the effects of any waivers and reimbursements on fees and expenses. As part of its review, the Board also considered current and historical total expenses of each class of the fund compared to competitive fund median expenses. Each class of the fund is compared to those funds and classes in the Total Mapped Group (used by the Board for management fee comparisons) that have a similar sales load structure.
The Board noted that the total expenses of each class ranked below its competitive median for 2006.
Annual Report
In its review of total expenses, the Board also considered Fidelity fee structures and other information on clients that FMR and its affiliates service in other competitive markets, such as other mutual funds advised or subadvised by FMR or its affiliates, pension plan clients, and other institutional clients.
Based on its review, the Board concluded that the total expenses of each class of the fund were reasonable in light of the services that the fund and its shareholders receive and the other factors considered.
Costs of the Services and Profitability. The Board considered the revenues earned and the expenses incurred by Fidelity in conducting the business of developing, marketing, distributing, managing, administering and servicing the fund and its shareholders. The Board also considered the level of Fidelity's profits in respect of all the Fidelity funds.
On an annual basis, FMR presents to the Board Fidelity's profitability for the fund. Fidelity calculates the profitability for each fund, as well as aggregate profitability for groups of Fidelity funds and all Fidelity funds, using a series of detailed revenue and cost allocation methodologies which originate with the audited books and records of Fidelity. The Audit Committee of the Board reviews any significant changes from the prior year's methodologies.
PricewaterhouseCoopers LLP (PwC), independent registered public accounting firm and auditor to Fidelity and certain Fidelity funds, has been engaged annually by the Board as part of the Board's assessment of the results of Fidelity's profitability analysis. PwC's engagement includes the review and assessment of Fidelity's methodologies used in determining the revenues and expenses attributable to Fidelity's mutual fund business, and completion of agreed-upon procedures surrounding the mathematical accuracy of fund profitability and its conformity to allocation methodologies. After considering PwC's reports issued under the engagement and information provided by Fidelity, the Board believes that while other allocation methods may also be reasonable, Fidelity's profitability methodologies are reasonable in all material respects.
The Board has also reviewed Fidelity's non-fund businesses and any fall-out benefits related to the mutual fund business as well as cases where Fidelity's affiliates may benefit from or be related to the fund's business.
The Board considered the costs of the services provided by and the profits realized by Fidelity in connection with the operation of the fund and determined that the amount of profit is a fair entrepreneurial profit for the management of the fund.
Economies of Scale. The Board considered whether there have been economies of scale in respect of the management of the Fidelity funds, whether the Fidelity funds (including the fund) have appropriately benefited from any such economies of scale, and whether there is potential for realization of any further economies of scale. The Board considered the extent to which the fund will benefit from economies of scale through increased services to the fund, through waivers or reimbursements, or through fee or expense reductions, including reductions that occur through operation of the transfer agent agreement. The transfer agent fee varies in part based on the number of accounts in the fund. If the number of accounts decreases or the average account size increases, the overall transfer agent fee rate decreases.
Annual Report
Board Approval of Investment Advisory Contracts and
Management Fees - continued
The Board recognized that the fund's management contract incorporates a "group fee" structure, which provides for lower group fee rates as total fund assets under FMR's management increase, and for higher group fee rates as total fund assets under FMR's management decrease. FMR determines the group fee rates based on a tiered asset "breakpoint" schedule. In connection with the renewal of the fund's management contract, the Board approved amendments to the fund's management contract that added four new fee breakpoints to the group fee rate schedule for assets under FMR's management above $1,386 billion. The Board considered that the group fee rate declines under both the present and amended schedules, but that under the amended schedule, the group fee rate declines faster as assets under FMR's management exceed $1,386 billion. The Board considered that the group fee is designed to deliver the benefits of economies of scale to fund shareholders when total fund assets increase, even if assets of any particular fund are unchanged or have declined, because some portion of Fidelity's costs are attributable to services provided to all Fidelity funds, and all funds benefit if those costs can be allocated among more assets. The Board concluded that, given the group fee structure, fund shareholders will achieve a certain level of economies of scale as assets under FMR's management increase at the fund complex level, regardless of whether Fidelity achieves any such economies of scale.
The Board further concluded that any potential economies of scale are being shared between fund shareholders and Fidelity in an appropriate manner.
Additional Information Requested by the Board. In order to develop fully the factual basis for consideration of the Fidelity funds' Advisory Contracts, the Board requested and received additional information on several topics, including (i) fund performance trends and actions to be taken by FMR to improve certain funds' overall performance; (ii) Fidelity's portfolio manager compensation structure, including its effects on fund profitability and the extent to which portfolio manager compensation is linked to fund performance; (iii) Fidelity's fee structures; (iv) the funds' sub-advisory arrangements; and (v) accounts managed by Fidelity other than the Fidelity funds.
Based on its evaluation of all of the conclusions noted above, and after considering all material factors, the Board ultimately concluded that the advisory fee structures are fair and reasonable, and that the fund's Advisory Contracts should be renewed.
Annual Report
Annual Report
Annual Report
Annual Report
Investment Adviser
Fidelity Management & Research Company
Boston, MA
Investment Sub-Advisers
FMR Co., Inc.
Fidelity Management & Research
(U.K.) Inc.
Fidelity Research & Analysis Company
Fidelity International
Investment Advisors
Fidelity Investments Japan Limited
Fidelity International Investment Advisors (U.K.) Limited
General Distributor
Fidelity Distributors Corporation
Boston, MA
Transfer and Service Agents
Fidelity Investments Institutional Operations Company, Inc.
Boston, MA
Fidelity Service Company, Inc.
Boston, MA
Custodian
State Street Bank and Trust Company
Quincy, MA
ADIF-UANN-1207
1.784735.104
(Fidelity Investment logo)(registered trademark)
(Fidelity Investment logo)(registered trademark)
Fidelity® Advisor
Diversified International
Fund - Institutional Class
Annual Report
October 31, 2007
(2_fidelity_logos) (Registered_Trademark)
Contents
Chairman's Message | <Click Here> | Ned Johnson's message to shareholders. |
Note to Shareholders | <Click Here> | |
Performance | <Click Here> | How the fund has done over time. |
Management's Discussion | <Click Here> | The manager's review of fund performance, strategy and outlook. |
Shareholder Expense Example | <Click Here> | An example of shareholder expenses. |
Investment Changes | <Click Here> | A summary of major shifts in the fund's investments over the past six months. |
Investments | <Click Here> | A complete list of the fund's investments with their market values. |
Financial Statements | <Click Here> | Statements of assets and liabilities, operations, and changes in net assets,
as well as financial highlights. |
Notes | <Click Here> | Notes to the financial statements. |
Report of Independent Registered Public Accounting Firm | <Click Here> | |
Trustees and Officers | <Click Here> | |
Distributions | <Click Here> | |
Proxy Voting Results | <Click Here> | |
Board Approval of Investment Advisory Contracts and Management Fees | <Click Here> | |
To view a fund's proxy voting guidelines and proxy voting record for the 12-month period ended June 30, visit http://www.fidelity.com (search for "proxy voting results") or visit the Securities and Exchange Commission's (SEC) web site at http://www.sec.gov. You may also call 1-877-208-0098 to request a free copy of the proxy voting guidelines.
Standard & Poor's, S&P and S&P 500 are registered service marks of The McGraw-Hill Companies, Inc. and have been licensed for use by Fidelity Distributors Corporation.
Other third party marks appearing herein are the property of their respective owners.
All other marks appearing herein are registered or unregistered trademarks or service marks of FMR LLC or an affiliated company.
Annual Report
This report and the financial statements contained herein are submitted for the general information of the shareholders of the fund. This report is not authorized for distribution to prospective investors in the fund unless preceded or accompanied by an effective prospectus.
A fund files its complete schedule of portfolio holdings with the SEC for the first and third quarters of each fiscal year on Form N-Q. Forms N-Q are available on the SEC's web site at http://www.sec.gov. A fund's Forms N-Q may be reviewed and copied at the SEC's Public Reference Room in Washington, DC. Information regarding the operation of the SEC's Public Reference Room may be obtained by calling 1-800-SEC-0330. For a complete list of a fund's portfolio holdings, view the most recent holdings listing, semiannual report, or annual report on Fidelity's web site at http://www.fidelity.com or http://www.advisor.fidelity.com, as applicable.
NOT FDIC INSURED · MAY LOSE VALUE · NO BANK GUARANTEE
Neither the fund nor Fidelity Distributors Corporation is a bank.
Annual Report
Chairman's Message
(photo_of_Edward_C_Johnson_3d)
Dear Shareholder:
Many stock and bond markets around the world have been unsettled of late; however, volatility can often lead to opportunity for patient investors. Financial markets are always unpredictable, but there are a number of time-tested principles that can put the historical odds in your favor.
One of the basic tenets is to invest for the long term. Over time, riding out the markets' inevitable ups and downs has proven much more effective than selling into panic or chasing the hottest trend. Even missing only a few of the markets' best days can significantly diminish investor returns. Patience also affords the benefits of compounding - of earning interest on additional income or reinvested dividends and capital gains. There are tax advantages and cost benefits to consider as well. The more you sell, the more taxes you pay, and the more you trade, the higher the costs. While staying the course doesn't eliminate risk, it can considerably lessen the effect of short-term declines.
You can further manage your investing risk through diversification. And today, more than ever, geographic diversification should be taken into account. Studies indicate that asset allocation is the single most important determinant of a portfolio's long-term success. The right mix of stocks, bonds and cash - aligned to your particular risk tolerance and investment objective - is very important. Age-appropriate rebalancing is also an essential aspect of asset allocation. For younger investors, an emphasis on equities - which historically have been the best-performing asset class over time - is encouraged. As investors near their specific goal, such as retirement or sending a child to college, consideration may be given to replacing volatile assets (e.g. common stocks) with more-stable fixed investments (bonds or savings plans).
A third investment principle - investing regularly - can help lower the average cost of your purchases. Investing a certain amount of money each month or quarter helps ensure you won't pay for all your shares at market highs. This strategy - known as dollar cost averaging - also reduces unconstructive "emotion" from investing, helping shareholders avoid selling weak performers just prior to an upswing, or chasing a hot performer just before a correction.
We invite you to contact us via the Internet, through our Investor Centers or over the phone. It is our privilege to provide you the information you need to make the investments that are right for you.
Sincerely,
/s/Edward C. Johnson 3d
Edward C. Johnson 3d
Annual Report
Note to Shareholders:
At a shareholder meeting of Fidelity® Advisor Diversified International Fund held on October 17, 2007, the proposal to approve a new management contract for the fund did not receive the vote required for approval. As a result, the current management contract will remain in effect for the fund.
Annual Report
Performance: The Bottom Line
Average annual total return reflects the change in the value of an investment, assuming reinvestment of the class' dividend income and capital gains (the profits earned upon the sale of securities that have grown in value) and assuming a constant rate of performance each year. The $10,000 table and the fund's returns do not reflect the deduction of taxes that a shareholder would pay on fund distributions or the redemption of fund shares. During periods of reimbursement by Fidelity, a fund's total return will be greater than it would be had the reimbursement not occurred. How a fund did yesterday is no guarantee of how it will do tomorrow.
Average Annual Total Returns
Periods ended October 31, 2007 | Past 1
year | Past 5
years | Life of
fund A |
Institutional Class | 23.07% | 23.06% | 14.36% |
A From December 17, 1998.
$10,000 Over Life of Fund*
Let's say hypothetically that $10,000 was invested in Fidelity® Advisor Diversified International Fund - Institutional Class on December 31, 1998. The chart shows how the value of your investment would have changed, and also shows how the Morgan Stanley Capital International SM Europe, Australia, Far East (MSCI® EAFE®) Index performed over the same period.
* From December 31, 1998 (first date following the fund's commencement for which the life of fund return for the MSCI EAFE Index is available).
Annual Report
Management's Discussion of Fund Performance
Comments from Penelope Dobkin, Portfolio Manager of Fidelity® Advisor Diversified International Fund
Foreign stocks, with a large assist from a weak U.S. dollar, generally had higher returns for U.S. investors than domestic equities during the 12-month period ending October 31, 2007. The backdrop for global stocks was solid, with robust economic growth and relatively high corporate profitability worldwide. Developed international equity markets, as measured by the Morgan Stanley Capital InternationalSM Europe, Australasia, and Far East (MSCI® EAFE®) Index - a performance monitor of established markets outside the United States and Canada - rose 25.09%. In comparison, the Standard & Poor's 500SM Index, a gauge of U.S. stocks, was up 14.56%. Among countries making up at least 1% of the EAFE benchmark, Finland had the best showing, soaring nearly 69%, while Hong Kong gained roughly 66%. The United Kingdom and Japan, the two largest components of the index, both underperformed. Fallout from the credit crunch and concerns about export growth tempered UK stocks, while Japan struggled with a slowdown in consumer spending and sluggish domestic growth. Emerging markets were the period's big winners, advancing 68.33% as measured by the MSCI Emerging Markets index.
For the 12 months ending October 31, 2007, the fund's Institutional Class shares returned 23.07%, trailing the MSCI EAFE index. The largest drag on performance was the fund's overweighting in Japan, combined with weak stock selection there. On a sector basis, we had disappointing results within financials, and our positioning in the consumer sectors also detracted. A modest cash position hurt as well. Conversely, from a geographic standpoint, good stock selection and an underweighting in the UK made healthy contributions to relative returns. Our focus on capital goods worldwide and an overweighting in Germany also paid off, as did stock selection in energy, technology, health care and materials. On an individual stock basis, detractors included Japanese financials ORIX, Daiwa Securities and out-of-benchmark OMC Card. Contributors included German holding SGL Carbon AG, the world's largest producer of carbon and graphite products. Backed by European and Asian demand for its steel products, SGL saw its stock price soar. Australian pharmaceutical company CSL was another strong performer. It owns the sole license for blockbuster cervical-cancer drug Gardasil, and its share price surged as demand rose worldwide.
The views expressed above reflect those of the portfolio manager(s) only through the end of the period as stated on the cover of this report and do not necessarily represent the views of Fidelity or any other person in the Fidelity organization. Any such views are subject to change at any time based upon market or other conditions and Fidelity disclaims any responsibility to update such views. These views may not be relied on as investment advice and, because investment decisions for a Fidelity fund are based on numerous factors, may not be relied on as an indication of trading intent on behalf of any Fidelity fund.
Annual Report
Shareholder Expense Example
As a shareholder of the Fund, you incur two types of costs: (1) transaction costs, including sales charges (loads) on purchase payments or redemption proceeds, redemption fees, and (2) ongoing costs, including management fees, distribution and/or service (12b-1) fees and other Fund expenses. This Example is intended to help you understand your ongoing costs (in dollars) of investing in the Fund and to compare these costs with the ongoing costs of investing in other mutual funds.
The Example is based on an investment of $1,000 invested at the beginning of the period and held for the entire period (May 1, 2007 to October 31, 2007).
Actual Expenses
The first line of the accompanying table for each class of the Fund provides information about actual account values and actual expenses. You may use the information in this line, together with the amount you invested, to estimate the expenses that you paid over the period. Simply divide your account value by $1,000.00 (for example, an $8,600 account value divided by $1,000.00 = 8.6), then multiply the result by the number in the first line for a class of the Fund under the heading entitled "Expenses Paid During Period" to estimate the expenses you paid on your account during this period. In addition, the Fund, as a shareholder in the underlying Fidelity Central Funds, will indirectly bear its pro rata share of the fees and expenses incurred by the underlying Fidelity Central Funds. These fees and expenses are not included in the Fund's annualized expense ratio used to calculate the expense estimate in the table below.
Hypothetical Example for Comparison Purposes
The second line of the accompanying table for each class of the Fund provides information about hypothetical account values and hypothetical expenses based on a Class' actual expense ratio and an assumed rate of return of 5% per year before expenses, which is not the Class' actual return. The hypothetical account values and expenses may not be used to estimate the actual ending account balance or expenses you paid for the period. You may use this information to compare the ongoing costs of investing in the Fund and other funds. To do so, compare this 5% hypothetical example with the 5% hypothetical examples that appear in the shareholder reports of the other funds. In addition, the Fund, as a shareholder in the underlying Fidelity Central Funds, will indirectly bear its pro rata share of the fees and expenses incurred by the underlying Fidelity Central Funds. These fees and expenses are not included in the Fund's annualized expense ratio used to calculate the expense estimate in the table below.
Please note that the expenses shown in the table are meant to highlight your ongoing costs only and do not reflect any transaction costs. Therefore, the second line of the table is useful in comparing ongoing costs only, and will not help you determine the relative total costs of owning different funds. In addition, if these transactional costs were included, your costs would have been higher.
Annual Report
| Beginning
Account Value
May 1, 2007 | Ending
Account Value
October 31, 2007 | Expenses Paid
During Period*
May 1, 2007
to October 31, 2007 |
Class A | | | |
Actual | $ 1,000.00 | $ 1,079.50 | $ 6.60 |
HypotheticalA | $ 1,000.00 | $ 1,018.85 | $ 6.41 |
Class T | | | |
Actual | $ 1,000.00 | $ 1,077.90 | $ 7.75 |
HypotheticalA | $ 1,000.00 | $ 1,017.74 | $ 7.53 |
Class B | | | |
Actual | $ 1,000.00 | $ 1,075.20 | $ 10.93 |
HypotheticalA | $ 1,000.00 | $ 1,014.67 | $ 10.61 |
Class C | | | |
Actual | $ 1,000.00 | $ 1,075.50 | $ 10.52 |
HypotheticalA | $ 1,000.00 | $ 1,015.07 | $ 10.21 |
Institutional Class | | | |
Actual | $ 1,000.00 | $ 1,081.10 | $ 5.19 |
HypotheticalA | $ 1,000.00 | $ 1,020.21 | $ 5.04 |
A 5% return per year before expenses
* Expenses are equal to each Class' annualized expense ratio (shown in the table below); multiplied by the average account value over the period, multiplied by 184/365 (to reflect the one-half year period).
| Annualized
Expense Ratio |
Class A | 1.26% |
Class T | 1.48% |
Class B | 2.09% |
Class C | 2.01% |
Institutional Class | .99% |
Annual Report
Investment Changes
Top Five Stocks as of October 31, 2007 |
| % of fund's
net assets | % of fund's net assets
6 months ago |
Vodafone Group PLC (United Kingdom, Wireless Telecommunication Services) | 3.5 | 2.3 |
Allianz AG sponsored ADR (Germany, Insurance) | 2.6 | 2.5 |
Roche Holding AG (participation certificate) (Switzerland, Pharmaceuticals) | 2.2 | 2.3 |
Nokia Corp. (Finland, Communications Equipment) | 2.0 | 0.9 |
Nestle SA (Switzerland, Food Products) | 1.9 | 2.4 |
| 12.2 | |
Top Five Market Sectors as of October 31, 2007 |
| % of fund's
net assets | % of fund's net assets
6 months ago |
Financials | 24.1 | 30.5 |
Industrials | 14.4 | 15.2 |
Information Technology | 12.3 | 11.5 |
Materials | 9.6 | 6.6 |
Consumer Discretionary | 7.7 | 9.5 |
Top Five Countries as of October 31, 2007 |
(excluding cash equivalents) | % of fund's
net assets | % of fund's net assets
6 months ago |
Japan | 26.0 | 25.4 |
Germany | 15.0 | 16.9 |
France | 10.9 | 8.5 |
United Kingdom | 9.0 | 9.7 |
Switzerland | 8.7 | 10.4 |
Percentages are adjusted for the effect of open futures contracts, if applicable. |
Asset Allocation (% of fund's net assets) |
As of October 31, 2007 | As of April 30, 2007 |
| Stocks and
Equity Futures 99.7% | | | Stocks and
Equity Futures 96.6% | |
| Short-Term
Investments and
Net Other Assets 0.3% | | | Short-Term
Investments and
Net Other Assets 3.4% | |

Annual Report
Investments October 31, 2007
Showing Percentage of Net Assets
Common Stocks - 98.0% |
| Shares | | Value (000s) |
Argentina - 0.0% |
Mercadolibre, Inc. | 78,700 | | $ 3,516 |
Australia - 4.1% |
Aristocrat Leisure Ltd. (d) | 3,680,300 | | 35,999 |
BHP Billiton Ltd. sponsored ADR (d) | 3,025,900 | | 264,040 |
Computershare Ltd. | 3,991,492 | | 32,184 |
CSL Ltd. | 6,147,900 | | 209,005 |
Downer EDI Ltd. | 4,046,122 | | 25,231 |
National Australia Bank Ltd. | 2,578,500 | | 104,321 |
Woolworths Ltd. | 740,300 | | 23,202 |
TOTAL AUSTRALIA | | 693,982 |
Austria - 0.4% |
voestalpine AG | 758,000 | | 68,165 |
Belgium - 0.2% |
Fortis | 1,066,800 | | 34,095 |
Bermuda - 0.3% |
Catlin Group Ltd. | 1,088,000 | | 11,344 |
Hiscox Ltd. | 3,778,100 | | 22,543 |
TPV Technology Ltd. | 15,168,000 | | 10,214 |
TOTAL BERMUDA | | 44,101 |
Brazil - 0.3% |
Bovespa Holding SA (a) | 1,328,000 | | 25,292 |
Medial Saude SA | 1,952,000 | | 25,724 |
TOTAL BRAZIL | | 51,016 |
Canada - 1.8% |
Canadian Natural Resources Ltd. | 1,438,000 | | 119,645 |
EnCana Corp. | 710,248 | | 49,722 |
Open Text Corp. (a)(d) | 1,234,400 | | 38,580 |
OPTI Canada, Inc. (a) | 1,484,800 | | 29,957 |
OZ Optics Ltd. unit (a)(g) | 5,400 | | 80 |
Suncor Energy, Inc. | 233,700 | | 25,605 |
Talisman Energy, Inc. | 1,931,100 | | 42,091 |
Westernzagros Resources Ltd. | 427,000 | | 1,628 |
Westernzagros Resources Ltd. warrants 1/18/08 (a) | 42,700 | | 50 |
TOTAL CANADA | | 307,358 |
Cayman Islands - 0.5% |
Alibaba.com Ltd. (a) | 698,000 | | 2,252 |
GlobalSantaFe Corp. | 147,200 | | 11,928 |
Common Stocks - continued |
| Shares | | Value (000s) |
Cayman Islands - continued |
Lee & Man Paper Manufacturing Ltd. | 5,423,700 | | $ 21,697 |
Subsea 7, Inc. (a)(d) | 1,414,500 | | 41,514 |
TOTAL CAYMAN ISLANDS | | 77,391 |
China - 0.1% |
Zhejiang Expressway Co. Ltd. (H Shares) | 13,346,000 | | 19,273 |
Denmark - 0.6% |
William Demant Holding AS (a) | 1,073,200 | | 98,357 |
Finland - 3.1% |
Cargotec Corp. (B Shares) | 542,240 | | 33,514 |
Metso Corp. | 1,447,500 | | 87,996 |
Neste Oil Oyj | 1,027,800 | | 36,944 |
Nokia Corp. | 1,111,500 | | 44,149 |
Nokia Corp. sponsored ADR | 7,450,500 | | 295,934 |
Wartsila Corp. (B Shares) | 271,700 | | 22,201 |
TOTAL FINLAND | | 520,738 |
France - 10.9% |
Alcatel-Lucent SA sponsored ADR | 13,185,500 | | 127,767 |
Alstom SA | 1,111,800 | | 262,395 |
Arkema sponsored ADR (a) | 2,572 | | 175 |
AXA SA sponsored ADR | 393,600 | | 17,606 |
BNP Paribas SA | 1,558,900 | | 171,852 |
Bureau Veritas SA (a) | 245,500 | | 14,220 |
Carbone Lorraine | 249,900 | | 22,364 |
CNP Assurances | 287,000 | | 36,587 |
Gaz de France | 1,856,400 | | 105,430 |
L'Air Liquide SA (a) | 454,740 | | 62,582 |
Lagardere S.C.A. (Reg.) | 580,982 | | 49,106 |
Neuf Cegetel | 1,217,511 | | 61,561 |
Orpea (a) | 512,400 | | 32,389 |
Pernod Ricard SA | 134,540 | | 31,090 |
Remy Cointreau SA | 1,234,000 | | 94,844 |
Renault SA | 604,700 | | 101,539 |
Sanofi-Aventis sponsored ADR | 1,775,300 | | 78,131 |
SCOR | 219,488 | | 5,978 |
Societe Generale Series A | 839,755 | | 141,499 |
Sodexho Alliance SA | 561,200 | | 40,466 |
Total SA: | | | |
Series B | 353,100 | | 28,463 |
sponsored ADR | 2,944,300 | | 237,340 |
Common Stocks - continued |
| Shares | | Value (000s) |
France - continued |
Unibail-Rodamco | 158,700 | | $ 39,460 |
Vivendi | 1,717,613 | | 77,342 |
TOTAL FRANCE | | 1,840,186 |
Germany - 14.7% |
Aareal Bank AG | 1,342,647 | | 69,581 |
Adidas-Salomon AG | 133,700 | | 8,920 |
Allianz AG sponsored ADR | 19,332,370 | | 436,912 |
Bayer AG | 3,047,700 | | 251,130 |
Bayerische Motoren Werke AG (BMW) | 888,000 | | 59,476 |
Bilfinger Berger AG | 758,900 | | 67,564 |
CompuGROUP Holding AG (a) | 826,400 | | 17,181 |
DaimlerChrysler AG (Reg.) | 796,000 | | 87,679 |
Deutz AG (a) | 875,800 | | 12,029 |
E.ON AG sponsored ADR | 4,279,300 | | 278,582 |
GFK AG | 178,956 | | 7,223 |
Henkel KGaA | 350,537 | | 16,251 |
Hochtief AG | 281,200 | | 38,830 |
K&S AG | 447,800 | | 93,624 |
KUKA AG (a)(d) | 496,413 | | 20,145 |
Lanxess AG | 437,000 | | 21,824 |
Linde AG | 556,256 | | 70,388 |
MAN AG | 281,000 | | 50,156 |
MTU Aero Engines Holding AG | 105,351 | | 6,432 |
Muenchener Rueckversicherungs-Gesellschaft AG (Reg.) | 1,415,500 | | 271,564 |
Patrizia Immobilien AG (d) | 1,171,800 | | 15,636 |
RWE AG | 971,900 | | 132,698 |
SAP AG sponsored ADR (d) | 713,600 | | 38,734 |
SGL Carbon AG (a) | 284,287 | | 16,586 |
Siemens AG: | | | |
(Reg.) | 798,400 | | 108,878 |
sponsored ADR | 1,515,200 | | 206,628 |
Wacker Chemie AG | 277,100 | | 68,048 |
TOTAL GERMANY | | 2,472,699 |
Greece - 0.2% |
Hellenic Exchanges Holding SA | 1,070,800 | | 37,233 |
Hong Kong - 1.9% |
Hysan Development Co. Ltd. | 58,250 | | 176 |
New World Development Co. Ltd. | 26,081,000 | | 94,001 |
Sino Land Co. | 12,044,000 | | 37,753 |
Common Stocks - continued |
| Shares | | Value (000s) |
Hong Kong - continued |
Sun Hung Kai Properties Ltd. | 3,765,000 | | $ 71,952 |
Wharf Holdings Ltd. | 18,388,000 | | 110,869 |
TOTAL HONG KONG | | 314,751 |
Indonesia - 0.2% |
PT Bank Mandiri Persero Tbk | 75,233,500 | | 31,874 |
Ireland - 0.2% |
Smurfit Kappa Group plc | 1,465,200 | | 29,485 |
Israel - 0.7% |
Bank Hapoalim BM (Reg.) | 7,390,800 | | 40,665 |
Mizrahi Tefahot Bank Ltd. | 9,841,265 | | 76,430 |
TOTAL ISRAEL | | 117,095 |
Italy - 1.6% |
ASM SpA | 3,645,538 | | 25,547 |
Fiat SpA | 1,655,500 | | 53,414 |
Milano Assicurazioni SpA | 1,337,400 | | 11,143 |
Pirelli & C. Real Estate SpA | 706,325 | | 34,875 |
Prysmian SpA | 1,873,700 | | 53,834 |
Unicredito Italiano SpA | 11,035,700 | | 94,332 |
TOTAL ITALY | | 273,145 |
Japan - 24.8% |
Aeon Co. Ltd. | 5,835,800 | | 91,884 |
Aeon Mall Co. Ltd. (d) | 1,695,800 | | 44,112 |
Aioi Insurance Co. Ltd. | 8,628,000 | | 50,158 |
Aoyama Trading Co. Ltd. | 1,633,400 | | 42,708 |
Arealink Co. Ltd. (d)(e) | 87,229 | | 43,272 |
Asics Corp. | 3,382,000 | | 53,942 |
Bank of Nagoya Ltd. | 6,814,000 | | 50,409 |
Bridgestone Corp. | 2,209,400 | | 48,917 |
Canon Fintech, Inc. | 595,800 | | 10,025 |
Canon, Inc. | 675,100 | | 34,140 |
Canon, Inc. sponsored ADR | 2,356,100 | | 119,148 |
Chiba Bank Ltd. | 5,205,000 | | 41,786 |
Credit Saison Co. Ltd. | 848,300 | | 27,055 |
Daiei, Inc. (a) | 2,113,050 | | 15,051 |
Daiwa House Industry Co. Ltd. | 4,107,000 | | 58,621 |
Daiwa Securities Group, Inc. | 18,548,000 | | 178,787 |
DCM Japan Holdings Co. Ltd. (d) | 3,112,820 | | 24,010 |
Fuji Machine Manufacturing Co. Ltd. | 1,833,600 | | 40,933 |
Fujitsu Ltd. | 9,681,000 | | 76,029 |
Common Stocks - continued |
| Shares | | Value (000s) |
Japan - continued |
Fukuoka Financial Group, Inc. (a) | 10,181,000 | | $ 65,631 |
Hokuhoku Financial Group, Inc. | 15,384,000 | | 47,532 |
Ibiden Co. Ltd. | 862,600 | | 73,134 |
Inpex Holdings, Inc. | 5,875 | | 63,348 |
Isetan Co. Ltd. | 1,706,400 | | 23,061 |
Juroku Bank Ltd. | 9,501,000 | | 57,504 |
Kansai Paint Co. Ltd. | 4,243,000 | | 31,860 |
Konica Minolta Holdings, Inc. | 3,961,000 | | 69,355 |
Kubota Corp. | 1,603,000 | | 13,461 |
Marubeni Corp. | 5,082,000 | | 43,646 |
Marui Group Co. Ltd. | 4,410,200 | | 45,759 |
Matsui Securities Co. Ltd. (d) | 8,961,400 | | 71,218 |
Millea Holdings, Inc. | 1,552,600 | | 60,955 |
Misumi Group, Inc. | 1,530,700 | | 25,909 |
Mitsubishi Corp. | 3,023,100 | | 94,146 |
Mitsubishi Estate Co. Ltd. | 2,829,000 | | 84,827 |
Mitsui & Co. Ltd. | 4,098,000 | | 106,317 |
Mitsui Fudosan Co. Ltd. | 2,189,000 | | 60,570 |
Mizuho Financial Group, Inc. | 3,159 | | 17,759 |
Monex Beans Holdings, Inc. (d) | 10,893 | | 7,531 |
Murata Manufacturing Co. Ltd. | 1,990,100 | | 121,138 |
Namco Bandai Holdings, Inc. | 1,242,400 | | 19,159 |
Nidec Corp. | 1,338,100 | | 100,563 |
Nintendo Co. Ltd. | 129,500 | | 81,326 |
Nippon Chemi-con Corp. | 3,839,900 | | 30,465 |
Nippon Electric Glass Co. Ltd. | 7,655,200 | | 130,141 |
Nomura Holdings, Inc. | 4,531,700 | | 80,800 |
Nomura Holdings, Inc. sponsored ADR | 4,015,900 | | 71,603 |
NSK Ltd. | 6,117,000 | | 54,246 |
Okamura Corp. | 4,931,000 | | 44,569 |
Okinawa Cellular Telephone Co. | 7,759 | | 22,730 |
OMC Card, Inc. (d)(e) | 11,455,100 | | 42,243 |
Omron Corp. | 1,838,100 | | 45,217 |
ORIX Corp. | 155,150 | | 31,832 |
Promise Co. Ltd. (d) | 896,950 | | 26,985 |
SBI E*TRADE Securities Co. Ltd. (d) | 52,205 | | 56,057 |
Sekisui House Ltd. | 4,321,000 | | 55,292 |
Seven & I Holdings Co. Ltd. | 943,500 | | 24,368 |
SFCG Co. Ltd. | 376,930 | | 62,533 |
SMC Corp. | 426,700 | | 57,170 |
Sompo Japan Insurance, Inc. | 9,988,000 | | 117,496 |
Sony Corp. sponsored ADR | 356,300 | | 17,623 |
Common Stocks - continued |
| Shares | | Value (000s) |
Japan - continued |
Sony Financial Holdings, Inc. | 1,336 | | $ 4,807 |
Sumitomo Corp. | 7,643,000 | | 133,200 |
Sumitomo Electric Industries Ltd. | 4,612,500 | | 74,694 |
Sumitomo Metal Industries Ltd. | 4,987,000 | | 24,689 |
Sumitomo Mitsui Financial Group, Inc. | 1,265 | | 10,364 |
Sumitomo Osaka Cement Co. Ltd. | 17,933,000 | | 44,953 |
T&D Holdings, Inc. | 608,500 | | 36,631 |
Takeda Pharmaceutical Co. Ltd. | 859,600 | | 53,706 |
Tokai Carbon Co. Ltd. (d) | 9,268,000 | | 116,252 |
Tokuyama Corp. (d) | 4,418,000 | | 61,723 |
Tokyo Tomin Bank Ltd. | 2,001,100 | | 66,619 |
Toyota Motor Corp. | 1,440,100 | | 82,403 |
Yamada Denki Co. Ltd. | 161,460 | | 16,651 |
Yamaguchi Financial Group, Inc. | 3,169,000 | | 37,190 |
TOTAL JAPAN | | 4,171,948 |
Korea (South) - 0.5% |
Daewoo Shipbuilding & Marine Engineering Co. Ltd. | 775,510 | | 49,265 |
Kookmin Bank | 292,010 | | 23,882 |
Samsung Electronics Co. Ltd. | 16,050 | | 9,897 |
TOTAL KOREA (SOUTH) | | 83,044 |
Luxembourg - 0.8% |
ArcelorMittal SA (NY Shares) Class A | 1,730,800 | | 138,377 |
Malaysia - 1.0% |
DiGi.com Bhd | 5,697,700 | | 42,915 |
Gamuda Bhd | 52,592,000 | | 72,513 |
Public Bank BHD (For. Reg.) | 8,688,500 | | 29,878 |
YTL Corp. BHD | 6,796,800 | | 15,396 |
TOTAL MALAYSIA | | 160,702 |
Netherlands - 4.7% |
Akzo Nobel NV (d) | 403,300 | | 32,446 |
Heineken NV (Bearer) | 2,658,700 | | 185,577 |
Koninklijke KPN NV | 5,301,900 | | 100,012 |
Koninklijke Philips Electronics NV (NY Shares) | 2,235,100 | | 92,399 |
Reed Elsevier NV sponsored ADR | 2,850,100 | | 110,983 |
SBM Offshore NV | 1,769,610 | | 68,095 |
Unilever NV: | | | |
(Certificaten Van Aandelen) | 1,917,700 | | 62,208 |
(NY Shares) | 4,369,400 | | 141,831 |
TOTAL NETHERLANDS | | 793,551 |
Common Stocks - continued |
| Shares | | Value (000s) |
Norway - 1.1% |
Aker Kvaerner ASA | 3,928,950 | | $ 136,907 |
Hafslund ASA (B Shares) | 1,249,863 | | 37,031 |
Odfjell Se (B Shares) | 237,650 | | 3,786 |
TOTAL NORWAY | | 177,724 |
Singapore - 0.1% |
City Developments Ltd. | 1,636,000 | | 18,064 |
Spain - 1.5% |
Banco Santander SA sponsored ADR | 1,021,400 | | 22,175 |
Inditex SA | 368,500 | | 27,415 |
Telefonica SA sponsored ADR | 2,076,900 | | 206,548 |
TOTAL SPAIN | | 256,138 |
Sweden - 1.3% |
Scania AB (B Shares) | 4,083,200 | | 111,499 |
SSAB Svenskt Stal AB (A Shares) | 216,200 | | 7,010 |
Telefonaktiebolaget LM Ericsson (B Shares) sponsored ADR | 3,526,200 | | 105,962 |
TOTAL SWEDEN | | 224,471 |
Switzerland - 8.7% |
ABB Ltd.: | | | |
(Reg.) | 4,987,147 | | 150,006 |
sponsored ADR | 1,898,700 | | 57,379 |
Basilea Pharmaceutica AG (a) | 132,140 | | 24,915 |
Credit Suisse Group sponsored ADR | 919,400 | | 62,243 |
Credit Suisse Group (Reg.) | 456,032 | | 30,873 |
Julius Baer Holding AG (Bearer) | 968,951 | | 83,820 |
Nestle SA: | | | |
(Reg.) | 424,214 | | 195,987 |
sponsored ADR | 1,103,600 | | 127,466 |
Novartis AG sponsored ADR | 1,125,900 | | 59,864 |
Roche Holding AG (participation certificate) | 2,172,980 | | 371,362 |
SGS Societe Generale de Surveillance Holding SA (Reg.) | 98,154 | | 128,635 |
Sonova Holding AG | 6,217 | | 698 |
Swiss Life Holding | 209,248 | | 57,808 |
Swisscom AG (Reg.) | 45,111 | | 16,679 |
Zurich Financial Services AG (Reg.) | 310,744 | | 93,561 |
TOTAL SWITZERLAND | | 1,461,296 |
Taiwan - 2.3% |
Advanced Semiconductor Engineering, Inc. | 79,815,374 | | 96,098 |
Compal Electronics, Inc. | 23,928,045 | | 30,321 |
Common Stocks - continued |
| Shares | | Value (000s) |
Taiwan - continued |
Siliconware Precision Industries Co. Ltd. sponsored ADR (d) | 6,680,541 | | $ 77,361 |
Taiwan Mobile Co. Ltd. | 42,544,000 | | 56,997 |
Taiwan Semiconductor Manufacturing Co. Ltd. | 14,013,708 | | 27,599 |
Taiwan Semiconductor Manufacturing Co. Ltd. sponsored ADR | 3,084,141 | | 32,846 |
Wistron Corp. | 32,869,618 | | 65,445 |
TOTAL TAIWAN | | 386,667 |
United Kingdom - 9.0% |
Anglo American PLC ADR | 1,771,042 | | 61,898 |
BP PLC | 6,596,300 | | 85,741 |
BP PLC sponsored ADR | 2,242,700 | | 174,908 |
Dawnay Day Treveria PLC (e) | 34,888,528 | | 44,102 |
GlaxoSmithKline PLC | 609,800 | | 15,626 |
Intertek Group PLC | 1,513,300 | | 32,375 |
Misys PLC | 1,770,444 | | 8,898 |
NETeller PLC (a) | 4,254,500 | | 6,324 |
Next PLC | 305,400 | | 14,020 |
Rentokil Initial PLC | 18,789,300 | | 67,190 |
Rio Tinto PLC: | | | |
(Reg.) | 464,400 | | 43,537 |
sponsored ADR | 190,800 | | 71,550 |
Royal Dutch Shell PLC Class A sponsored ADR | 1,275,400 | | 111,610 |
Serco Group PLC | 1,418,748 | | 13,296 |
Tesco PLC | 11,472,054 | | 117,589 |
Unilever PLC | 516,300 | | 17,482 |
Unilever PLC sponsored ADR | 1,509,260 | | 51,104 |
Vodafone Group PLC | 8,708,600 | | 34,199 |
Vodafone Group PLC sponsored ADR | 13,988,100 | | 549,311 |
TOTAL UNITED KINGDOM | | 1,520,760 |
United States of America - 0.4% |
Microsoft Corp. | 1,956,400 | | 72,015 |
TOTAL COMMON STOCKS (Cost $13,668,780) | 16,499,217 |
Preferred Stocks - 0.5% |
| | | |
Convertible Preferred Stocks - 0.0% |
Canada - 0.0% |
MetroPhotonics, Inc. Series 2 (a)(g) | 8,500 | | 0 |
Preferred Stocks - continued |
| Shares | | Value (000s) |
Nonconvertible Preferred Stocks - 0.5% |
Germany - 0.3% |
Henkel KGaA | 362,700 | | $ 18,513 |
Volkswagen AG | 163,000 | | 30,936 |
TOTAL GERMANY | | 49,449 |
Italy - 0.2% |
Buzzi Unicem SpA (Risp) | 1,569,595 | | 30,131 |
Fondiaria-Sai SpA (Risp) | 321,300 | | 10,953 |
TOTAL ITALY | | 41,084 |
TOTAL NONCONVERTIBLE PREFERRED STOCKS | | 90,533 |
TOTAL PREFERRED STOCKS (cost $87,709) | | 90,533 |
Government Obligations - 0.1% |
| Principal Amount (000s) | | |
United States of America - 0.1% |
U.S. Treasury Bills, yield at date of purchase 3.86% to 4.85% 11/1/07 to 1/31/08 (f)
(Cost $14,533) | $ 14,600 | | 14,536 |
Money Market Funds - 5.3% |
| Shares | | |
Fidelity Cash Central Fund, 4.97% (b) | 420,841,930 | | 420,842 |
Fidelity Securities Lending Cash Central Fund, 5.02% (b)(c) | 477,582,702 | | 477,583 |
TOTAL MONEY MARKET FUNDS (Cost $898,425) | 898,425 |
Cash Equivalents - 0.1% |
| Maturity Amount (000s) | | Value (000s) |
Investments in repurchase agreements in a joint trading account at 4.54%, dated 10/31/07 due 11/1/07 (Collateralized by U.S. Treasury Obligations) #
(Cost $6,750) | $ 6,751 | | $ 6,750 |
TOTAL INVESTMENT PORTFOLIO - 104.0% (Cost $14,676,197) | | 17,509,461 |
NET OTHER ASSETS - (4.0)% | | (668,159) |
NET ASSETS - 100% | $ 16,841,302 |
Futures Contracts |
| Expiration Date | | Underlying Face Amount at Value (000s) | | Unrealized Appreciation/
(Depreciation) (000s) |
Purchased |
Equity Index Contracts |
2,455 Nikkei 225 Index Contracts (Japan) | Dec. 2007 | | $ 206,895 | | $ 10,753 |
|
The face value of futures purchased as a percentage of net assets - 1.2% |
Legend |
(a) Non-income producing |
(b) Affiliated fund that is available only to investment companies and other accounts managed by Fidelity Investments. The rate quoted is the annualized seven-day yield of the fund at period end. A complete unaudited listing of the fund's holdings as of its most recent quarter end is available upon request. |
(c) Investment made with cash collateral received from securities on loan. |
(d) Security or a portion of the security is on loan at period end. |
(e) Affiliated company |
(f) Security or a portion of the security was pledged to cover margin requirements for futures contracts. At the period end, the value of securities pledged amounted to $10,377,000. |
(g) Restricted securities - Investment in securities not registered under the Securities Act of 1933 (excluding 144A issues). At the end of the period, the value of restricted securities (excluding 144A issues) amounted to $80,000 or 0.0% of net assets. |
Additional information on each holding is as follows: |
Security | Acquisition Date | Acquisition Cost (000s) |
MetroPhotonics, Inc. Series 2 | 9/29/00 | $ 85 |
OZ Optics Ltd. unit | 8/18/00 | $ 80 |
# Additional Information on each counterparty to the repurchase agreement is as follows: |
Repurchase Agreement / Counterparty | Value
(000s) |
$6,750,000 due 11/01/07 at 4.54% |
Banc of America Securities LLC | $ 3,833 |
Lehman Brothers, Inc. | 2,917 |
| $ 6,750 |
Affiliated Central Funds |
Information regarding fiscal year to date income earned by the Fund from investments in Fidelity Central Funds is as follows: |
Fund | Income earned
(Amounts in thousands) |
Fidelity Cash Central Fund | $ 42,393 |
Fidelity Securities Lending Cash Central Fund | 13,653 |
Total | $ 56,046 |
Other Affiliated Issuers |
An affiliated company is a company in which the fund has ownership of at least 5% of the voting securities. Fiscal year to date transactions with companies which are or were affiliates are as follows: |
Affiliates
(Amounts in thousands) | Value, beginning of period | Purchases | Sales Proceeds | Dividend Income | Value,
end of
period |
Arealink Co. Ltd. | $ 6,046 | $ 45,150 | $ - | $ 30 | $ 43,272 |
Dawnay Day Treveria PLC | 40,978 | 19,267 | 4,857 | 2,294 | 44,102 |
KUKA AG
(formerly IWKA AG) | 31,757 | - | 42,021 | - | - |
OMC Card, Inc. | 51,128 | 35,323 | - | 506 | 42,243 |
SGL Carbon AG | 79,939 | - | 175,743 | - | - |
Total | $ 209,848 | $ 99,740 | $ 222,621 | $ 2,830 | $ 129,617 |
See accompanying notes which are an integral part of the financial statements.
Annual Report
Financial Statements
Statement of Assets and Liabilities
Amounts in thousands (except per-share amounts) | October 31, 2007 |
| | |
Assets | | |
Investment in securities, at value (including securities loaned of $472,136 and repurchase agreements of $6,750) - See accompanying schedule: Unaffiliated issuers (cost $13,564,590) | $ 16,481,419 | |
Fidelity Central Funds (cost $898,425) | 898,425 | |
Other affiliated issuers (cost $213,182) | 129,617 | |
Total Investments (cost $14,676,197) | | $ 17,509,461 |
Receivable for investments sold | | 151,863 |
Receivable for fund shares sold | | 15,972 |
Dividends receivable | | 24,030 |
Distributions receivable from Fidelity Central Funds | | 2,490 |
Receivable for daily variation on futures contracts | | 2,578 |
Prepaid expenses | | 6 |
Other receivables | | 1,457 |
Total assets | | 17,707,857 |
| | |
Liabilities | | |
Payable to custodian bank | $ 6,903 | |
Payable for investments purchased | 323,145 | |
Payable for fund shares redeemed | 36,676 | |
Accrued management fee | 9,799 | |
Distribution fees payable | 4,466 | |
Other affiliated payables | 2,947 | |
Other payables and accrued expenses | 5,036 | |
Collateral on securities loaned, at value | 477,583 | |
Total liabilities | | 866,555 |
| | |
Net Assets | | $ 16,841,302 |
Net Assets consist of: | | |
Paid in capital | | $ 11,712,337 |
Undistributed net investment income | | 152,430 |
Accumulated undistributed net realized gain (loss) on investments and foreign currency transactions | | 2,132,259 |
Net unrealized appreciation (depreciation) on investments and assets and liabilities in foreign currencies | | 2,844,276 |
Net Assets | | $ 16,841,302 |
See accompanying notes which are an integral part of the financial statements.
Annual Report
Financial Statements - continued
Statement of Assets and Liabilities - continued
Amounts in thousands (except per-share amounts) | October 31, 2007 |
| | |
Calculation of Maximum Offering Price
Class A: Net Asset Value and redemption price per share ($5,774,215 ÷ 216,942 shares) | | $ 26.62 |
| | |
Maximum offering price per share (100/94.25 of $26.62) | | $ 28.24 |
Class T:
Net Asset Value and redemption price per share ($3,568,880 ÷ 135,677 shares) | | $ 26.30 |
| | |
Maximum offering price per share (100/96.50 of $26.30) | | $ 27.25 |
Class B:
Net Asset Value and offering price per share
($558,966 ÷ 21,976 shares)A | | $ 25.44 |
| | |
Class C:
Net Asset Value and offering price per share ($1,672,927 ÷ 65,599 shares)A | | $ 25.50 |
| | |
Institutional Class:
Net Asset Value, offering price and redemption price per share ($5,266,314 ÷ 194,651 shares) | | $ 27.06 |
A Redemption price per share is equal to net asset value less any applicable contingent deferred sales charge.
See accompanying notes which are an integral part of the financial statements.
Annual Report
Statement of Operations
Amounts in thousands | Year ended October 31, 2007 |
| | |
Investment Income | | |
Dividends (including $2,830 earned from other affiliated issuers) | | $ 370,521 |
Interest | | 1,336 |
Income from Fidelity Central Funds | | 56,046 |
| | 427,903 |
Less foreign taxes withheld | | (39,454) |
Total income | | 388,449 |
| | |
Expenses | | |
Management fee | $ 111,628 | |
Transfer agent fees | 32,939 | |
Distribution fees | 52,312 | |
Accounting and security lending fees | 2,250 | |
Custodian fees and expenses | 3,195 | |
Independent trustees' compensation | 53 | |
Registration fees | 555 | |
Audit | 156 | |
Legal | 187 | |
Miscellaneous | 4,641 | |
Total expenses before reductions | 207,916 | |
Expense reductions | (6,590) | 201,326 |
Net investment income (loss) | | 187,123 |
Realized and Unrealized Gain (Loss) Net realized gain (loss) on: | | |
Investment securities: | | |
Unaffiliated issuers | 2,063,333 | |
Other affiliated issuers | 136,144 | |
Foreign currency transactions | (5,589) | |
Futures contracts | 16,138 | |
Total net realized gain (loss) | | 2,210,026 |
Change in net unrealized appreciation (depreciation) on: Investment securities | 805,767 | |
Assets and liabilities in foreign currencies | 169 | |
Futures contracts | 148 | |
Total change in net unrealized appreciation (depreciation) | | 806,084 |
Net gain (loss) | | 3,016,110 |
Net increase (decrease) in net assets resulting from operations | | $ 3,203,233 |
See accompanying notes which are an integral part of the financial statements.
Annual Report
Financial Statements - continued
Statement of Changes in Net Assets
Amounts in thousands | Year ended
October 31,
2007 | Year ended
October 31,
2006 |
Increase (Decrease) in Net Assets | | |
Operations | | |
Net investment income (loss) | $ 187,123 | $ 153,748 |
Net realized gain (loss) | 2,210,026 | 1,020,572 |
Change in net unrealized appreciation (depreciation) | 806,084 | 889,367 |
Net increase (decrease) in net assets resulting
from operations | 3,203,233 | 2,063,687 |
Distributions to shareholders from net investment income | (133,151) | (64,018) |
Distributions to shareholders from net realized gain | (974,839) | (425,957) |
Total distributions | (1,107,990) | (489,975) |
Share transactions - net increase (decrease) | 320,019 | 4,317,582 |
Redemption fees | 467 | 520 |
Total increase (decrease) in net assets | 2,415,729 | 5,891,814 |
| | |
Net Assets | | |
Beginning of period | 14,425,573 | 8,533,759 |
End of period (including undistributed net investment income of $152,430 and undistributed net investment income of $144,715, respectively) | $ 16,841,302 | $ 14,425,573 |
See accompanying notes which are an integral part of the financial statements.
Annual Report
Financial Highlights - Class A
Years ended October 31, | 2007 | 2006 | 2005 | 2004 | 2003 |
Selected Per-Share Data | | | | | |
Net asset value, beginning of period | $ 23.42 | $ 20.30 | $ 16.97 | $ 14.60 | $ 11.12 |
Income from Investment Operations | | | | | |
Net investment income (loss) C | .31 | .30 | .19 | .08 | .09 |
Net realized and unrealized gain (loss) | 4.69 | 3.91 | 3.27 | 2.41 | 3.45 |
Total from investment operations | 5.00 | 4.21 | 3.46 | 2.49 | 3.54 |
Distributions from net investment income | (.23) | (.14) | (.05) | (.12) | (.06) |
Distributions from net realized gain | (1.57) | (.95) | (.08) | - | - |
Total distributions | (1.80) | (1.09) | (.13) | (.12) | (.06) |
Redemption fees added to paid in capital C | - G | - G | - G | - G | - |
Net asset value, end of period | $ 26.62 | $ 23.42 | $ 20.30 | $ 16.97 | $ 14.60 |
Total Return A, B | 22.76% | 21.54% | 20.50% | 17.15% | 31.99% |
Ratios to Average Net Assets D, F | | | | | |
Expenses before reductions | 1.25% | 1.26% | 1.27% | 1.31% | 1.42% |
Expenses net of fee waivers, if any | 1.25% | 1.26% | 1.27% | 1.31% | 1.42% |
Expenses net of all reductions | 1.21% | 1.20% | 1.20% | 1.27% | 1.39% |
Net investment income (loss) | 1.26% | 1.33% | 1.02% | .51% | .71% |
Supplemental Data | | | | | |
Net assets, end of period (in millions) | $ 5,774 | $ 4,694 | $ 2,792 | $ 1,294 | $ 241 |
Portfolio turnover rate E | 105% | 83% | 59% | 72% | 49% |
A Total returns would have been lower had certain expenses not been reduced during the periods shown.
B Total returns do not include the effect of the sales charges.
C Calculated based on average shares outstanding during the period.
D Fees and expenses of the underlying Fidelity Central Funds are not included in the Fund's expense ratio. The Fund indirectly bears its proportionate share of the expenses of any underlying Fidelity Central Funds.
E Amount does not include the portfolio activity of any underlying Fidelity Central Funds.
F Expense ratios reflect operating expenses of the class. Expenses before reductions do not reflect amounts reimbursed by the investment adviser or reductions from brokerage service arrangements or other expense offset arrangements and do not represent the amount paid by the class during periods when reimbursements or reductions occur. Expenses net of fee waivers reflect expenses after reimbursement by the investment adviser but prior to reductions from brokerage service arrangements or other expense offset arrangements. Expenses net of all reductions represent the net expenses paid by the class.
G Amount represents less than $.01 per share.
See accompanying notes which are an integral part of the financial statements.
Annual Report
Financial Highlights - Class T
Years ended October 31, | 2007 | 2006 | 2005 | 2004 | 2003 |
Selected Per-Share Data | | | | | |
Net asset value, beginning of period | $ 23.17 | $ 20.12 | $ 16.82 | $ 14.47 | $ 11.01 |
Income from Investment Operations | | | | | |
Net investment income (loss) C | .25 | .25 | .15 | .03 | .05 |
Net realized and unrealized gain (loss) | 4.63 | 3.89 | 3.23 | 2.39 | 3.43 |
Total from investment operations | 4.88 | 4.14 | 3.38 | 2.42 | 3.48 |
Distributions from net investment income | (.18) | (.14) | - | (.07) | (.02) |
Distributions from net realized gain | (1.57) | (.95) | (.08) | - | - |
Total distributions | (1.75) | (1.09) | (.08) | (.07) | (.02) |
Redemption fees added to paid in capital C | - G | - G | - G | - G | - |
Net asset value, end of period | $ 26.30 | $ 23.17 | $ 20.12 | $ 16.82 | $ 14.47 |
Total Return A, B | 22.43% | 21.33% | 20.16% | 16.78% | 31.66% |
Ratios to Average Net Assets D, F | | | | | |
Expenses before reductions | 1.47% | 1.48% | 1.51% | 1.61% | 1.75% |
Expenses net of fee waivers, if any | 1.47% | 1.48% | 1.51% | 1.61% | 1.75% |
Expenses net of all reductions | 1.43% | 1.42% | 1.45% | 1.57% | 1.72% |
Net investment income (loss) | 1.04% | 1.12% | .77% | .21% | .38% |
Supplemental Data | | | | | |
Net assets, end of period (in millions) | $ 3,569 | $ 3,609 | $ 2,420 | $ 1,510 | $ 552 |
Portfolio turnover rate E | 105% | 83% | 59% | 72% | 49% |
A Total returns would have been lower had certain expenses not been reduced during the periods shown.
B Total returns do not include the effect of the sales charges.
C Calculated based on average shares outstanding during the period.
D Fees and expenses of the underlying Fidelity Central Funds are not included in the Fund's expense ratio. The Fund indirectly bears its proportionate share of the expenses of any underlying Fidelity Central Funds.
E Amount does not include the portfolio activity of any underlying Fidelity Central Funds.
F Expense ratios reflect operating expenses of the class. Expenses before reductions do not reflect amounts reimbursed by the investment adviser or reductions from brokerage service arrangements or other expense offset arrangements and do not represent the amount paid by the class during periods when reimbursements or reductions occur. Expenses net of fee waivers reflect expenses after reimbursement by the investment adviser but prior to reductions from brokerage service arrangements or other expense offset arrangements. Expenses net of all reductions represent the net expenses paid by the class.
G Amount represents less than $.01 per share.
See accompanying notes which are an integral part of the financial statements.
Annual Report
Financial Highlights - Class B
Years ended October 31, | 2007 | 2006 | 2005 | 2004 | 2003 |
Selected Per-Share Data | | | | | |
Net asset value, beginning of period | $ 22.46 | $ 19.60 | $ 16.46 | $ 14.19 | $ 10.84 |
Income from Investment Operations | | | | | |
Net investment income (loss) C | .10 | .10 | .02 | (.07) | (.02) |
Net realized and unrealized gain (loss) | 4.50 | 3.79 | 3.16 | 2.35 | 3.37 |
Total from investment operations | 4.60 | 3.89 | 3.18 | 2.28 | 3.35 |
Distributions from net investment income | (.05) | (.08) | - | (.01) | - |
Distributions from net realized gain | (1.57) | (.95) | (.04) | - | - |
Total distributions | (1.62) | (1.03) | (.04) | (.01) | - |
Redemption fees added to paid in capital C | - G | - G | - G | - G | - |
Net asset value, end of period | $ 25.44 | $ 22.46 | $ 19.60 | $ 16.46 | $ 14.19 |
Total Return A, B | 21.73% | 20.55% | 19.35% | 16.08% | 30.90% |
Ratios to Average Net Assets D, F | | | | | |
Expenses before reductions | 2.08% | 2.12% | 2.16% | 2.24% | 2.32% |
Expenses net of fee waivers, if any | 2.08% | 2.12% | 2.16% | 2.24% | 2.32% |
Expenses net of all reductions | 2.04% | 2.06% | 2.10% | 2.20% | 2.29% |
Net investment income (loss) | .42% | .48% | .12% | (.42)% | (.19)% |
Supplemental Data | | | | | |
Net assets, end of period (in millions) | $ 559 | $ 508 | $ 351 | $ 196 | $ 89 |
Portfolio turnover rate E | 105% | 83% | 59% | 72% | 49% |
A Total returns would have been lower had certain expenses not been reduced during the periods shown.
B Total returns do not include the effect of the contingent deferred sales charge.
C Calculated based on average shares outstanding during the period.
D Fees and expenses of the underlying Fidelity Central Funds are not included in the Fund's expense ratio. The Fund indirectly bears its proportionate share of the expenses of any underlying Fidelity Central Funds.
E Amount does not include the portfolio activity of any underlying Fidelity Central Funds.
F Expense ratios reflect operating expenses of the class. Expenses before reductions do not reflect amounts reimbursed by the investment adviser or reductions from brokerage service arrangements or other expense offset arrangements and do not represent the amount paid by the class during periods when reimbursements or reductions occur. Expenses net of fee waivers reflect expenses after reimbursement by the investment adviser but prior to reductions from brokerage service arrangements or other expense offset arrangements. Expenses net of all reductions represent the net expenses paid by the class.
G Amount represents less than $.01 per share.
See accompanying notes which are an integral part of the financial statements.
Annual Report
Financial Highlights - Class C
Years ended October 31, | 2007 | 2006 | 2005 | 2004 | 2003 |
Selected Per-Share Data | | | | | |
Net asset value, beginning of period | $ 22.53 | $ 19.65 | $ 16.48 | $ 14.22 | $ 10.86 |
Income from Investment Operations | | | | | |
Net investment income (loss) C | .12 | .12 | .04 | (.05) | (.01) |
Net realized and unrealized gain (loss) | 4.50 | 3.79 | 3.17 | 2.35 | 3.37 |
Total from investment operations | 4.62 | 3.91 | 3.21 | 2.30 | 3.36 |
Distributions from net investment income | (.08) | (.08) | - | (.04) | - |
Distributions from net realized gain | (1.57) | (.95) | (.04) | - | - |
Total distributions | (1.65) | (1.03) | (.04) | (.04) | - |
Redemption fees added to paid in capital C | - G | - G | - G | - G | - |
Net asset value, end of period | $ 25.50 | $ 22.53 | $ 19.65 | $ 16.48 | $ 14.22 |
Total Return A, B | 21.81% | 20.62% | 19.51% | 16.21% | 30.94% |
Ratios to Average Net Assets D, F | | | | | |
Expenses before reductions | 2.00% | 2.02% | 2.05% | 2.13% | 2.23% |
Expenses net of fee waivers, if any | 2.00% | 2.02% | 2.05% | 2.13% | 2.23% |
Expenses net of all reductions | 1.96% | 1.96% | 1.99% | 2.09% | 2.20% |
Net investment income (loss) | .51% | .57% | .23% | (.31)% | (.10)% |
Supplemental Data | | | | | |
Net assets, end of period (in millions) | $ 1,673 | $ 1,395 | $ 758 | $ 381 | $ 124 |
Portfolio turnover rate E | 105% | 83% | 59% | 72% | 49% |
A Total returns would have been lower had certain expenses not been reduced during the periods shown.
B Total returns do not include the effect of the contingent deferred sales charge.
C Calculated based on average shares outstanding during the period.
D Fees and expenses of the underlying Fidelity Central Funds are not included in the Fund's expense ratio. The Fund indirectly bears its proportionate share of the expenses of any underlying Fidelity Central Funds.
E Amount does not include the portfolio activity of any underlying Fidelity Central Funds.
F Expense ratios reflect operating expenses of the class. Expenses before reductions do not reflect amounts reimbursed by the investment adviser or reductions from brokerage service arrangements or other expense offset arrangements and do not represent the amount paid by the class during periods when reimbursements or reductions occur. Expenses net of fee waivers reflect expenses after reimbursement by the investment adviser but prior to reductions from brokerage service arrangements or other expense offset arrangements. Expenses net of all reductions represent the net expenses paid by the class.
G Amount represents less than $.01 per share.
See accompanying notes which are an integral part of the financial statements.
Annual Report
Financial Highlights - Institutional Class
Years ended October 31, | 2007 | 2006 | 2005 | 2004 | 2003 |
Selected Per-Share Data | | | | | |
Net asset value, beginning of period | $ 23.78 | $ 20.56 | $ 17.18 | $ 14.74 | $ 11.22 |
Income from Investment Operations | | | | | |
Net investment income (loss) B | .38 | .37 | .25 | .13 | .13 |
Net realized and unrealized gain (loss) | 4.76 | 3.98 | 3.30 | 2.44 | 3.48 |
Total from investment operations | 5.14 | 4.35 | 3.55 | 2.57 | 3.61 |
Distributions from net investment income | (.29) | (.18) | (.09) | (.13) | (.09) |
Distributions from net realized gain | (1.57) | (.95) | (.08) | - | - |
Total distributions | (1.86) | (1.13) | (.17) | (.13) | (.09) |
Redemption fees added to paid in capital B | - F | - F | - F | - F | - |
Net asset value, end of period | $ 27.06 | $ 23.78 | $ 20.56 | $ 17.18 | $ 14.74 |
Total Return A | 23.07% | 21.96% | 20.81% | 17.54% | 32.41% |
Ratios to Average Net Assets C, E | | | | | |
Expenses before reductions | .98% | .97% | .97% | 1.03% | 1.09% |
Expenses net of fee waivers, if any | .98% | .97% | .97% | 1.03% | 1.09% |
Expenses net of all reductions | .94% | .92% | .91% | .98% | 1.06% |
Net investment income (loss) | 1.53% | 1.62% | 1.32% | .80% | 1.04% |
Supplemental Data | | | | | |
Net assets, end of period (in millions) | $ 5,266 | $ 4,220 | $ 2,213 | $ 1,185 | $ 391 |
Portfolio turnover rate D | 105% | 83% | 59% | 72% | 49% |
A Total returns would have been lower had certain expenses not been reduced during the periods shown.
B Calculated based on average shares outstanding during the period.
C Fees and expenses of the underlying Fidelity Central Funds are not included in the Fund's expense ratio. The Fund indirectly bears its proportionate share of the expenses of any underlying Fidelity Central Funds.
D Amount does not include the portfolio activity of any underlying Fidelity Central Funds.
E Expense ratios reflect operating expenses of the class. Expenses before reductions do not reflect amounts reimbursed by the investment adviser or reductions from brokerage service arrangements or other expense offset arrangements and do not represent the amount paid by the class during periods when reimbursements or reductions occur. Expenses net of fee waivers reflect expenses after reimbursement by the investment adviser but prior to reductions from brokerage service arrangements or other expense offset arrangements. Expenses net of all reductions represent the net expenses paid by the class.
F Amount represents less than $.01 per share.
See accompanying notes which are an integral part of the financial statements.
Annual Report
Notes to Financial Statements
For the period ended October 31, 2007
(Amounts in thousands except ratios)
1. Organization.
Fidelity Advisor Diversified International Fund (the Fund) is a fund of Fidelity Advisor Series VIII (the trust) and is authorized to issue an unlimited number of shares. The trust is registered under the Investment Company Act of 1940, as amended (the 1940 Act), as an open-end management investment company organized as a Massachusetts business trust. The Fund offers Class A, Class T, Class B, Class C, and Institutional Class shares, each of which has equal rights as to assets and voting privileges. Each class has exclusive voting rights with respect to matters that affect that class. Class B shares will automatically convert to Class A shares after a holding period of seven years from the initial date of purchase. Investment income, realized and unrealized capital gains and losses, the common expenses of the Fund, and certain fund-level expense reductions, if any, are allocated on a pro rata basis to each class based on the relative net assets of each class to the total net assets of the Fund. Each class differs with respect to transfer agent and distribution and service plan fees incurred. Certain expense reductions also differ by class. The Fund's investments in emerging markets can be subject to social, economic, regulatory, and political uncertainties and can be extremely volatile.
2. Investments in Fidelity Central Funds.
The Fund may invest in Fidelity Central Funds, which are open-end investment companies available only to other investment companies and accounts managed by Fidelity Management & Research Company (FMR) and its affiliates. The Fund's Schedule of Investments lists each of the Fidelity Central Funds as an investment of the Fund, but does not include the underlying holdings of each Fidelity Central Fund. As an Investing Fund, the Fund indirectly bears its proportionate share of the expenses of the underlying Fidelity Central Funds.
The Money Market Central Funds seek preservation of capital and current income and are managed by Fidelity Investments Money Management, Inc. (FIMM), an affiliate of FMR.
A complete list of holdings for each Fidelity Central Fund is available upon request or at the SEC's web site at www.sec.gov. In addition, the financial statements of the Fidelity Central Funds, which are not covered by the Fund's Report of Independent Registered Public Accounting Firm, are available on the SEC's web site or upon request.
3. Significant Accounting Policies.
The financial statements have been prepared in conformity with accounting principles generally accepted in the United States of America, which require management to make certain estimates and assumptions at the date of the financial statements. The following summarizes the significant accounting policies of the Fund:
Annual Report
3. Significant Accounting Policies - continued
Security Valuation. Investments are valued and net asset value (NAV) per share is calculated (NAV calculation) as of the close of business of the New York Stock Exchange (NYSE), normally 4:00 p.m. Eastern time. Wherever possible, the Fund uses independent pricing services approved by the Board of Trustees to value its investments.
Equity securities, including restricted securities, for which market quotations are readily available, are valued at the last reported sale price or official closing price as reported by an independent pricing service on the primary market or exchange on which they are traded. In the event there were no sales during the day or closing prices are not available, securities are valued at the last quoted bid price. Investments in open-end mutual funds, including the Fidelity Central Funds, are valued at their closing net asset value each business day. Short-term securities with remaining maturities of sixty days or less for which quotations are not readily available are valued at amortized cost, which approximates value.
When current market prices or quotations are not readily available or do not accurately reflect fair value, valuations may be determined in accordance with procedures adopted by the Board of Trustees. For example, when developments occur between the close of a market and the close of the NYSE that may materially affect the value of some or all of the securities, or when trading in a security is halted, those securities may be fair valued. Factors used in the determination of fair value may include monitoring news to identify significant market or security specific events such as changes in the value of U.S. securities markets, reviewing developments in foreign markets and evaluating the performance of ADRs, futures contracts and exchange-traded funds. Because the Fund's utilization of fair value pricing depends on market activity, the frequency with which fair value pricing is used cannot be predicted and may be utilized to a significant extent. The value of securities used for NAV calculation under fair value pricing may differ from published prices for the same securities.
Foreign Currency. The Fund uses foreign currency contracts to facilitate transactions in foreign-denominated securities. Losses from these transactions may arise from changes in the value of the foreign currency or if the counterparties do not perform under the contracts' terms.
Foreign-denominated assets, including investment securities, and liabilities are translated into U.S. dollars at the exchange rate at period end. Purchases and sales of investment securities, income and dividends received and expenses denominated in foreign currencies are translated into U.S. dollars at the exchange rate in effect on the transaction date.
Annual Report
Notes to Financial Statements - continued
(Amounts in thousands except ratios)
3. Significant Accounting Policies - continued
Foreign Currency - continued
The effects of exchange rate fluctuations on investments are included with the net realized and unrealized gain (loss) on investment securities. Other foreign currency transactions resulting in realized and unrealized gain (loss) are disclosed separately.
Investment Transactions and Income. For financial reporting purposes, the Fund's investment holdings and NAV include trades executed through the end of the last business day of the period. The NAV for processing shareholder transactions includes trades executed through the end of the prior business day. Gains and losses on securities sold are determined on the basis of identified cost and may include proceeds received from litigation. Dividend income is recorded on the ex-dividend date, except for certain dividends from foreign securities where the ex-dividend date may have passed, which are recorded as soon as the Fund is informed of the ex-dividend date. Non-cash dividends included in dividend income, if any, are recorded at the fair market value of the securities received.
Distributions received on securities that represent a return of capital or capital gain are recorded as a reduction of cost of investments and/or as a realized gain. The Fund estimates the components of distributions received that may be considered return of capital distributions or capital gain distributions. Interest income and distributions from the Fidelity Central Funds are accrued as earned. Interest income includes coupon interest and amortization of premium and accretion of discount on debt securities. Investment income is recorded net of foreign taxes withheld where recovery of such taxes is uncertain.
Expenses. Most expenses of the trust can be directly attributed to a fund. Expenses which cannot be directly attributed are apportioned among each Fund in the trust. Expense estimates are accrued in the period to which they relate and adjustments are made when actual amounts are known.
Income Tax Information and Distributions to Shareholders. Each year, the Fund intends to qualify as a regulated investment company by distributing all of its taxable income and realized gains under Subchapter M of the Internal Revenue Code. As a result, no provision for income taxes is required in the accompanying financial statements. Foreign taxes are provided for based on the Fund's understanding of the tax rules and rates that exist in the foreign markets in which it invests.
Distributions are recorded on the ex-dividend date. Income dividends and capital gain distributions are declared separately for each class. Income and capital gain distributions are determined in accordance with income tax regulations, which may differ from generally accepted accounting principles. In addition, the Fund will claim a portion of the payment made to redeeming shareholders as a distribution for income tax purposes.
Annual Report
3. Significant Accounting Policies - continued
Income Tax Information and Distributions to Shareholders - continued
Capital accounts within the financial statements are adjusted for permanent book-tax differences. These adjustments have no impact on net assets or the results of operations. Temporary book-tax differences will reverse in a subsequent period.
Book-tax differences are primarily due to futures transactions, foreign currency transactions, certain foreign taxes, passive foreign investment companies (PFIC), market discount and losses deferred due to wash sales.
The tax-basis components of distributable earnings and the federal tax cost as of period end were as follows:
Unrealized appreciation | $ 3,355,737 | |
Unrealized depreciation | (560,220) | |
Net unrealized appreciation (depreciation) | 2,795,517 | |
Undistributed ordinary income | 302,420 | |
Undistributed long-term capital gain | 1,706,995 | |
| | |
Cost for federal income tax purposes | $ 14,713,944 | |
The tax character of distributions paid was as follows:
| October 31, 2007 | October 31, 2006 |
Ordinary Income | $ 313,217 | $ 171,628 |
Long-term Capital Gains | 794,773 | 318,347 |
Total | $ 1,107,990 | $ 489,975 |
Short-Term Trading (Redemption) Fees. Shares held in the Fund less than 30 days are subject to a redemption fee equal to 1.00% of the proceeds of the redeemed shares. All redemption fees, including any estimated redemption fees paid by FMR, are retained by the Fund and accounted for as an addition to paid in capital.
New Accounting Pronouncements. In July 2006, Financial Accounting Standards Board Interpretation No. 48, Accounting for Uncertainty in Income Taxes - an interpretation of FASB Statement 109 (FIN 48), was issued and is effective on the last business day of the semiannual reporting period for fiscal years beginning after December 15, 2006. FIN 48 sets forth a threshold for financial statement recognition, measurement and disclosure of a tax position taken or expected to be taken on a tax return. Management has concluded that the adoption of FIN 48 will not result in a material impact on the Fund's net assets, results of operations and financial statement disclosures.
Annual Report
Notes to Financial Statements - continued
(Amounts in thousands except ratios)
3. Significant Accounting Policies - continued
New Accounting Pronouncements - continued
In addition, in September 2006, Statement of Financial Accounting Standards No. 157, Fair Value Measurements (SFAS 157), was issued and is effective for fiscal years beginning after November 15, 2007. SFAS 157 defines fair value, establishes a framework for measuring fair value and expands disclosures about fair value measurements. Management is currently evaluating the impact the adoption of SFAS 157 will have on the Fund's financial statement disclosures.
4. Operating Policies.
Repurchase Agreements. FMR has received an Exemptive Order from the Securities and Exchange Commission (the SEC) which permits the Fund and other affiliated entities of FMR to transfer uninvested cash balances into joint trading accounts which are then invested in repurchase agreements. The Fund may also invest directly with institutions in repurchase agreements. Repurchase agreements are collateralized by government or non-government securities. Upon settlement date, collateral is held in segregated accounts with custodian banks and may be obtained in the event of a default of the counterparty. The Fund monitors, on a daily basis, the value of the collateral to ensure it is at least equal to the principal amount of the repurchase agreement (including accrued interest). In the event of a default by the counterparty, realization of the collateral proceeds could be delayed, during which time the value of the collateral may decline.
Futures Contracts. The Fund may use futures contracts to manage its exposure to the stock market and to fluctuations in currency values. Buying futures tends to increase a fund's exposure to the underlying instrument, while selling futures tends to decrease a fund's exposure to the underlying instrument or hedge other fund investments. Upon entering into a futures contract, a fund is required to deposit with a clearing broker, no later than the following business day, an amount ("initial margin") equal to a certain percentage of the face value of the contract. The initial margin may be in the form of cash or securities and is transferred to a segregated account on settlement date. Subsequent payments ("variation margin") are made or received by a fund depending on the daily fluctuations in the value of the futures contract and are accounted for as unrealized gains or losses. Realized gains (losses) are recorded upon the expiration or closing of the futures contract. Securities deposited to meet margin requirements are identified in the Schedule of Investments. Futures contracts involve, to varying degrees, risk of loss in excess of any futures variation margin reflected in the Statement of Assets and Liabilities. The underlying face amount at value of any open futures contracts at period end is shown in the Schedule of Investments under the caption "Futures Contracts." This amount reflects each contract's exposure to the underlying instrument at period end.
Annual Report
4. Operating Policies - continued
Futures Contracts - continued
Losses may arise from changes in the value of the underlying instruments or if the counterparties do not perform under the contract's terms. Futures contracts are valued at the settlement price established each day by the board of trade or exchange on which they are traded.
Restricted Securities. The Fund may invest in securities that are subject to legal or contractual restrictions on resale. These securities generally may be resold in transactions exempt from registration or to the public if the securities are registered. Disposal of these securities may involve time-consuming negotiations and expense, and prompt sale at an acceptable price may be difficult. Information regarding restricted securities is included at the end of the Fund's Schedule of Investments.
5. Purchases and Sales of Investments.
Purchases and sales of securities, other than short-term securities, aggregated $15,731,642 and $15,964,220, respectively.
6. Fees and Other Transactions with Affiliates.
Management Fee. FMR and its affiliates provide the Fund with investment management related services for which the Fund pays a monthly management fee. The management fee is the sum of an individual fund fee rate that is based on an annual rate of .45% of the Fund's average net assets and a group fee rate that averaged ..26% during the period. The group fee rate is based upon the average net assets of all the mutual funds advised by FMR. The group fee rate decreases as assets under management increase and increases as assets under management decrease. For the period, the total annual management fee rate was .71% of the Fund's average net assets.
In December 2006, the Board of Trustees approved a new management contract, subject to shareholder approval, to add a performance adjustment to the management fee. The proposal did not receive the number of votes required at the shareholder meeting on October 17, 2007 and as a result no changes were made to the Fund's management contract.
Distribution and Service Plan. In accordance with Rule 12b-1 of the 1940 Act, the Fund has adopted separate Distribution and Service Plans for each class of shares. Certain classes pay Fidelity Distributors Corporation (FDC), an affiliate of FMR, separate Distribution and Service Fees, each of which is based on an annual percentage
Annual Report
Notes to Financial Statements - continued
(Amounts in thousands except ratios)
6. Fees and Other Transactions with Affiliates - continued
Distribution and Service Plan - continued
of each class' average net assets. In addition, FDC may pay financial intermediaries for selling shares of the Fund and providing shareholder support services. For the period, the Distribution and Service Fee rates and the total amounts paid to and retained by FDC were as follows:
| Distribution
Fee | Service
Fee | Paid to
FDC | Retained
by FDC |
Class A | 0% | .25% | $ 12,912 | $ 797 |
Class T | .25% | .25% | 18,557 | 577 |
Class B | .75% | .25% | 5,356 | 4,020 |
Class C | .75% | .25% | 15,487 | 3,642 |
| | | $ 52,312 | $ 9,036 |
Sales Load. FDC receives a front-end sales charge of up to 5.75% for selling Class A shares, and 3.50% for selling Class T shares, some of which is paid to financial intermediaries for selling shares of the Fund. FDC receives the proceeds of contingent deferred sales charges levied on Class A, Class T, Class B, and Class C redemptions. These charges depend on the holding period. The deferred sales charges range from 5% to 1% for Class B, 1% for Class C, 1.00% to .50% for certain purchases of Class A shares and .25% for certain purchases of Class T shares.
For the period, sales charge amounts retained by FDC were as follows:
| Retained
by FDC |
Class A | $ 1,065 |
Class T | 244 |
Class B* | 833 |
Class C* | 233 |
| $ 2,375 |
* When Class B and Class C shares are initially sold, FDC pays commissions from its own resources to financial intermediaries through which the sales are made.
Transfer Agent Fees. Fidelity Investments Institutional Operations Company, Inc. (FIIOC), an affiliate of FMR, is the transfer, dividend disbursing and shareholder servicing agent for each class of the Fund. FIIOC receives account fees and asset-based fees that vary according to the account size and type of account of the shareholders of the respective classes of the Fund. FIIOC pays for typesetting, printing and mailing of
Annual Report
6. Fees and Other Transactions with Affiliates - continued
Transfer Agent Fees - continued
shareholder reports, except proxy statements. For the period, the total transfer agent fees paid by each class to FIIOC, were as follows:
| Amount | % of
Average
Net Assets |
Class A | $ 11,350 | .22 |
Class T | 7,114 | .19 |
Class B | 1,632 | .30 |
Class C | 3,418 | .22 |
Institutional Class | 9,425 | .20 |
| $ 32,939 | |
Accounting and Security Lending Fees. Fidelity Service Company, Inc. (FSC), an affiliate of FMR, maintains the Fund's accounting records. The accounting fee is based on the level of average net assets for the month. Under a separate contract, FSC administers the security lending program. The security lending fee is based on the number and duration of lending transactions.
Brokerage Commissions. The Fund placed a portion of its portfolio transactions with brokerage firms which are affiliates of the investment adviser. The commissions paid to these affiliated firms were $1 for the period.
7. Committed Line of Credit.
The Fund participates with other funds managed by FMR in a $4.2 billion credit facility (the "line of credit") to be utilized for temporary or emergency purposes to fund shareholder redemptions or for other short-term liquidity purposes. The Fund has agreed to pay commitment fees on its pro rata portion of the line of credit, which amounted to $33 and is reflected in Miscellaneous Expense on the Statement of Operations. During the period, there were no borrowings on this line of credit.
8. Security Lending.
The Fund lends portfolio securities from time to time in order to earn additional income. On the settlement date of the loan, the Fund receives collateral (in the form of U.S. Treasury obligations, letters of credit and/or cash) against the loaned securities and maintains collateral in an amount not less than 100% of the market value of the loaned securities during the period of the loan. The market value of the loaned securities is determined at the close of business of the Fund and any additional required collateral is delivered to the Fund on the next business day. If the borrower defaults on its obligation to return the securities loaned because of insolvency or other reasons, a fund could
Annual Report
Notes to Financial Statements - continued
(Amounts in thousands except ratios)
8. Security Lending - continued
experience delays and costs in recovering the securities loaned or in gaining access to the collateral. Any cash collateral received is invested in the Fidelity Securities Lending Cash Central Fund. The value of loaned securities and cash collateral at period end are disclosed on the Fund's Statement of Assets and Liabilities. Security lending income represents the income earned on investing cash collateral, less fees and expenses associated with the loan, plus any premium payments that may be received on the loan of certain types of securities. Security lending income is presented in the Statement of Operations as a component of income from Fidelity Central Funds. Net income from lending portfolio securities during the period amounted to $13,653.
9. Expense Reductions.
Many of the brokers with whom FMR places trades on behalf of the Fund provided services in addition to trade execution. These services included payments of certain expenses on behalf of the Fund totaling $6,208 for the period. In addition, through arrangements with the Fund's custodian and each class' transfer agent, credits realized as a result of uninvested cash balances were used to reduce the Fund's expenses. During the period, these credits reduced the Fund's custody expenses by $1. During the period, credits reduced each class' transfer agent expense as noted in the table below.
| Transfer Agent
expense reduction | |
Class A | $ 71 | |
Class T | 61 | |
Institutional Class | 32 | |
| $ 164 | |
10. Other.
The Fund's organizational documents provide former and current trustees and officers with a limited indemnification against liabilities arising in connection with the performance of their duties to the Fund. In the normal course of business, the Fund may also enter into contracts that provide general indemnifications. The Fund's maximum exposure under these arrangements is unknown as this would be dependent on future claims that may be made against the Fund. The risk of material loss from such claims is considered remote.
In September 2006, FIIOC, a transfer agent of the Fund, notified the Fund that the Fund's books and records did not reflect a conversion of certain Class B to Class A shares upon their conversion date. In March 2007, FIIOC converted the relevant Class B shares to Class A shares and recorded the conversion in the books and records of the Fund
Annual Report
10. Other - continued
which did not result in a material impact to the Fund's reported net assets or results of operations in the accompanying financial statements. FIIOC has remediated affected shareholders and reimbursed the Fund for all related audit and legal expenses.
The United States Securities and Exchange Commission ("SEC") is conducting an investigation of FMR (covering the years 2002 to 2004) arising from gifts, gratuities and business entertainment provided by certain brokers to certain individuals who were employed on FMR's domestic equity trading desk during that period. FMR is in discussions with the SEC staff regarding the possible resolution of the matter, but as of period-end no final resolution has been reached.
In December 2006, the Independent Trustees completed their own investigation of the matter with the assistance of independent counsel. The Independent Trustees and FMR agree that, despite the absence of proof that the Fidelity mutual funds experienced diminished execution quality as a result of the improper receipt of gifts and business entertainment, the conduct at issue was serious and is worthy of redress. Accordingly, the Independent Trustees have requested and FMR has agreed to pay $42 million to Fidelity mutual funds, plus interest to be determined at the time that payment is made. A method of allocating this payment among the funds has not yet been determined. The total payment to the Fund is not anticipated to have a material impact on the Fund's net assets. In addition, FMR reimbursed related legal expenses which are recorded in the accompanying Statement of Operations as an expense reduction.
11. Distributions to Shareholders.
Distributions to shareholders of each class were as follows:
Years ended October 31, | 2007 | 2006 |
From net investment income | | |
Class A | $ 46,511 | $ 20,889 |
Class T | 28,116 | 17,028 |
Class B | 1,108 | 1,465 |
Class C | 5,232 | 3,357 |
Institutional Class | 52,184 | 21,279 |
Total | $ 133,151 | $ 64,018 |
From net realized gain | | |
Class A | $ 316,111 | $ 137,810 |
Class T | 243,882 | 118,069 |
Class B | 35,514 | 17,614 |
Class C | 97,793 | 38,898 |
Institutional Class | 281,539 | 113,566 |
Total | $ 974,839 | $ 425,957 |
Annual Report
Notes to Financial Statements - continued
(Amounts in thousands except ratios)
12. Share Transactions.
Transactions for each class of shares were as follows:
| Shares | Dollars |
Years ended October 31, | 2007 | 2006 | 2007 | 2006 |
Class A | | | | |
Shares sold | 64,291 | 92,555 | $ 1,554,629 | $ 2,062,928 |
Reinvestment of distributions | 13,015 | 5,911 | 292,975 | 120,998 |
Shares redeemed | (60,769) | (35,607) | (1,466,102) | (794,472) |
Net increase (decrease) | 16,537 | 62,859 | $ 381,502 | $ 1,389,454 |
Class T | | | | |
Shares sold | 27,062 | 62,102 | $ 641,406 | $ 1,371,264 |
Reinvestment of distributions | 11,891 | 6,462 | 265,043 | 131,108 |
Shares redeemed | (59,029) | (33,079) | (1,416,423) | (728,634) |
Net increase (decrease) | (20,076) | 35,485 | $ (509,974) | $ 773,738 |
Class B | | | | |
Shares sold | 3,350 | 7,773 | $ 77,002 | $ 166,883 |
Reinvestment of distributions | 1,452 | 822 | 31,456 | 16,265 |
Shares redeemed | (5,448) | (3,861) | (125,817) | (82,950) |
Net increase (decrease) | (646) | 4,734 | $ (17,359) | $ 100,198 |
Class C | | | | |
Shares sold | 12,688 | 28,685 | $ 291,365 | $ 617,751 |
Reinvestment of distributions | 3,357 | 1,513 | 72,889 | 30,000 |
Shares redeemed | (12,337) | (6,902) | (287,237) | (148,267) |
Net increase (decrease) | 3,708 | 23,296 | $ 77,017 | $ 499,484 |
Institutional Class | | | | |
Shares sold | 71,325 | 101,236 | $ 1,740,183 | $ 2,276,221 |
Reinvestment of distributions | 9,822 | 3,981 | 224,239 | 82,534 |
Shares redeemed | (63,957) | (35,373) | (1,575,589) | (804,047) |
Net increase (decrease) | 17,190 | 69,844 | $ 388,833 | $ 1,554,708 |
Annual Report
Report of Independent Registered Public Accounting Firm
To the Trustees of Fidelity Advisor Series VIII and the Shareholders of Fidelity Advisor Diversified International Fund:
In our opinion, the accompanying statement of assets and liabilities, including the schedule of investments, and the related statements of operations and of changes in net assets and the financial highlights present fairly, in all material respects, the financial position of Fidelity Advisor Diversified International Fund (a fund of Fidelity Advisor Series VIII) at October 31, 2007, the results of its operations for the year then ended, the changes in its net assets for each of the two years in the period then ended and the financial highlights for each of the five years in the period then ended, in conformity with accounting principles generally accepted in the United States of America. These financial statements and financial highlights (hereafter referred to as "financial statements") are the responsibility of the Fidelity Advisor Diversified International Fund's management. Our responsibility is to express an opinion on these financial statements based on our audits. We conducted our audits of these financial statements in accordance with the standards of the Public Company Accounting Oversight Board (United States). Those standards require that we plan and perform the audit to obtain reasonable assurance about whether the financial statements are free of material misstatement. An audit includes examining, on a test basis, evidence supporting the amounts and disclosures in the financial statements, assessing the accounting principles used and significant estimates made by management, and evaluating the overall financial statement presentation. We believe that our audits, which included confirmation of securities at October 31, 2007 by correspondence with the custodian and brokers, provide a reasonable basis for our opinion.
/s/ PricewaterhouseCoopers LLP
PricewaterhouseCoopers LLP
Boston, Massachusetts
December 21, 2007
Annual Report
Trustees and Officers
The Trustees, Members of the Advisory Board, and executive officers of the trust and fund, as applicable, are listed below. The Board of Trustees governs the fund and is responsible for protecting the interests of shareholders. The Trustees are experienced executives who meet periodically throughout the year to oversee the fund's activities, review contractual arrangements with companies that provide services to the fund, and review the fund's performance. Each of the Trustees oversees 370 funds advised by FMR or an affiliate. Mr. Curvey oversees 340 funds advised by FMR or an affiliate.
The Trustees hold office without limit in time except that (a) any Trustee may resign; (b) any Trustee may be removed by written instrument, signed by at least two-thirds of the number of Trustees prior to such removal; (c) any Trustee who requests to be retired or who has become incapacitated by illness or injury may be retired by written instrument signed by a majority of the other Trustees; and (d) any Trustee may be removed at any special meeting of shareholders by a two-thirds vote of the outstanding voting securities of the trust. Each Trustee who is not an interested person (as defined in the 1940 Act) (Independent Trustee), shall retire not later than the last day of the calendar year in which his or her 72nd birthday occurs. The Independent Trustees may waive this mandatory retirement age policy with respect to individual Trustees. The executive officers and Advisory Board Members hold office without limit in time, except that any officer and Advisory Board Member may resign or may be removed by a vote of a majority of the Trustees at any regular meeting or any special meeting of the Trustees. Except as indicated, each individual has held the office shown or other offices in the same company for the past five years.
The fund's Statement of Additional Information (SAI) includes more information about the Trustees. To request a free copy, call Fidelity at 1-877-208-0098.
Interested Trustees*:
Correspondence intended for each Trustee who is an interested person may be sent to Fidelity Investments, 82 Devonshire Street, Boston, Massachusetts 02109.
Name, Age; Principal Occupation |
Edward C. Johnson 3d (77) |
| Year of Election or Appointment: 1983 Mr. Johnson is Chairman of the Board of Trustees. Mr. Johnson serves as President (2006-present), Chief Executive Officer, Chairman, and a Director of FMR LLC; Chairman and a Director of FMR; Chairman and a Director of Fidelity Research & Analysis Company (FRAC); Chairman and a Director of Fidelity Investments Money Management, Inc.; and Chairman (2001-present) and a Director of FMR Co., Inc. In addition, Mr. Johnson serves as Chairman and Director of Fidelity International Limited (FIL). |
James C. Curvey (72) |
| Year of Election or Appointment: 2007 Mr. Curvey also serves as Trustee (2007-present) or Member of the Advisory Board (2007-present) of other investment companies advised by FMR. Mr. Curvey is a Director of FMR and FMR Co., Inc. (2007-present). Mr. Curvey is also Vice Chairman (2006-present) and Director of FMR LLC. Mr. Curvey joined Fidelity in 1982 and served in numerous senior management positions, including President and Chief Operating Officer of FMR LLC (1997-2000) and President of Fidelity Strategic Investments (2000-2002). In addition, he serves as a member of the Board of Directors of Geerlings & Wade, Inc. (wine distribution). |
* Trustees have been determined to be "Interested Trustees" by virtue of, among other things, their affiliation with the trust, or various entities under common control with FMR. FMR Corp. merged with FMR LLC on October 1, 2007. Any references to FMR LLC for prior periods are deemed to be references to the prior entity.
Independent Trustees:
Correspondence intended for each Independent Trustee (that is, the Trustees other than the Interested Trustees) may be sent to Fidelity Investments, P.O. Box 55235, Boston, Massachusetts 02205-5235.
Name, Age; Principal Occupation |
Dennis J. Dirks (59) |
| Year of Election or Appointment: 2005 Prior to his retirement in May 2003, Mr. Dirks was Chief Operating Officer and a member of the Board of The Depository Trust & Clearing Corporation (DTCC) (1999-2003). He also served as President, Chief Operating Officer, and Board member of The Depository Trust Company (DTC) (1999-2003) and President and Board member of the National Securities Clearing Corporation (NSCC) (1999-2003). In addition, Mr. Dirks served as Chief Executive Officer and Board member of the Government Securities Clearing Corporation (2001-2003) and Chief Executive Officer and Board member of the Mortgage-Backed Securities Clearing Corporation (2001-2003). Mr. Dirks also serves as a Trustee and a member of the Finance Committee of Manhattan College (2005-present) and a Trustee and a member of the Finance Committee of AHRC of Nassau County (2006-present). |
Albert R. Gamper, Jr. (65) |
| Year of Election or Appointment: 2006 Prior to his retirement in December 2004, Mr. Gamper served as Chairman of the Board of CIT Group Inc. (commercial finance). During his tenure with CIT Group Inc. Mr. Gamper served in numerous senior management positions, including Chairman (1987-1989; 1999-2001; 2002-2004), Chief Executive Officer (1987-2004), and President (1989-2002). He currently serves as a member of the Board of Directors of Public Service Enterprise Group (utilities, 2001-present), Chairman of the Board of Governors, Rutgers University (2004-present), and Chairman of the Board of Saint Barnabas Health Care System. |
George H. Heilmeier (71) |
| Year of Election or Appointment: 2004 Dr. Heilmeier is Chairman Emeritus of Telcordia Technologies (communication software and systems), where prior to his retirement, he served as company Chairman and Chief Executive Officer. He currently serves on the Boards of Directors of The Mitre Corporation (systems engineering and information technology support for the government), and HRL Laboratories (private research and development, 2004-present). He is Chairman of the General Motors Science & Technology Advisory Board and a Life Fellow of the Institute of Electrical and Electronics Engineers (IEEE). Dr. Heilmeier is a member of the Defense Science Board and the National Security Agency Advisory Board. He is also a member of the National Academy of Engineering, the American Academy of Arts and Sciences, and the Board of Overseers of the School of Engineering and Applied Science of the University of Pennsylvania. Previously, Dr. Heilmeier served as a Director of TRW Inc. (automotive, space, defense, and information technology, 1992-2002), Compaq (1994-2002), Automatic Data Processing, Inc. (ADP) (technology-based business outsourcing, 1995-2002), INET Technologies Inc. (telecommunications network surveillance, 2001-2004), and Teletech Holdings (customer management services). He is the recipient of the 2005 Kyoto Prize in Advanced Technology for his invention of the liquid crystal display, and a member of the Consumer Electronics Hall of Fame. |
James H. Keyes (67) |
| Year of Election or Appointment: 2007 Prior to his retirement in 2003, Mr. Keyes was Chairman, President, and Chief Executive Officer of Johnson Controls, Inc. (automotive supplier, 1993-2003). He currently serves as a member of the boards of LSI Logic Corporation (semiconductor technologies), Navistar International Corporation (manufacture and sale of trucks, buses, and diesel engines, 2002-present), and Pitney Bowes, Inc. (integrated mail, messaging, and document management solutions). |
Marie L. Knowles (61) |
| Year of Election or Appointment: 2001 Prior to Ms. Knowles' retirement in June 2000, she served as Executive Vice President and Chief Financial Officer of Atlantic Richfield Company (ARCO) (diversified energy, 1996-2000). From 1993 to 1996, she was a Senior Vice President of ARCO and President of ARCO Transportation Company. She served as a Director of ARCO from 1996 to 1998. She currently serves as a Director of Phelps Dodge Corporation (copper mining and manufacturing) and McKesson Corporation (healthcare service, 2002-present). Ms. Knowles is a Trustee of the Brookings Institution and the Catalina Island Conservancy and also serves as a member of the Advisory Board for the School of Engineering of the University of Southern California. |
Ned C. Lautenbach (63) |
| Year of Election or Appointment: 2000 Mr. Lautenbach is Chairman of the Independent Trustees (2006-present). Mr. Lautenbach has been a partner of Clayton, Dubilier & Rice, Inc. (private equity investment firm) since September 1998. Previously, Mr. Lautenbach was with the International Business Machines Corporation (IBM) from 1968 until his retirement in 1998. Mr. Lautenbach serves as a Director of Sony Corporation (2006-present) and Eaton Corporation (diversified industrial) as well as the Philharmonic Center for the Arts in Naples, Florida. He also is a member of the Board of Trustees of Fairfield University (2005-present), as well as a member of the Council on Foreign Relations. |
Cornelia M. Small (63) |
| Year of Election or Appointment: 2005 Ms. Small is a member (2000-present) and Chairperson (2002-present) of the Investment Committee, and a member (2002-present) of the Board of Trustees of Smith College. Previously, she served as Chief Investment Officer (1999-2000), Director of Global Equity Investments (1996-1999), and a member of the Board of Directors of Scudder, Stevens & Clark (1990-1997) and Scudder Kemper Investments (1997-1999). In addition, Ms. Small served as Co-Chair (2000-2003) of the Annual Fund for the Fletcher School of Law and Diplomacy. |
William S. Stavropoulos (68) |
| Year of Election or Appointment: 2001 Mr. Stavropoulos is Chairman Emeritus of the Board of Directors of The Dow Chemical Company. Since joining The Dow Chemical Company in 1967, Mr. Stavropoulos served in numerous senior management positions, including President (1993-2000; 2002-2003), CEO (1995-2000; 2002-2004), and Chairman of the Executive Committee (2000-2004). Currently, he is a Director of NCR Corporation (data warehousing and technology solutions), Chemical Financial Corporation, Maersk Inc. (industrial conglomerate, 2002-present), Tyco International, Inc. (multinational manufacturing and services, 2007-present), and a member of the Advisory Board for Metalmark Capital (private equity investment firm, 2005-present). He is a special advisor to Clayton, Dubilier & Rice, Inc., a private equity investment firm. He also serves as a member of the Board of Trustees of the American Enterprise Institute for Public Policy Research. In addition, Mr. Stavropoulos is a member of The Business Council, J.P. Morgan International Council and the University of Notre Dame Advisory Council for the College of Science. |
Kenneth L. Wolfe (68) |
| Year of Election or Appointment: 2005 Prior to his retirement in 2001, Mr. Wolfe was Chairman and Chief Executive Officer of Hershey Foods Corporation (1993-2001). He currently serves as a member of the boards of Adelphia Communications Corporation (2003-present), Bausch & Lomb, Inc., and Revlon Inc. (2004-present). |
Advisory Board Members and Executive Officers**:
Correspondence intended for Mr. Mauriello, Mr. Thomas, and Mr. Wiley may be sent to Fidelity Investments, P.O. Box 55235, Boston, Massachusetts 02205-5235. Correspondence intended for each executive officer and Mr. Lynch may be sent to Fidelity Investments, 82 Devonshire Street, Boston, Massachusetts 02109.
Name, Age; Principal Occupation |
Peter S. Lynch (63) |
| Year of Election or Appointment: 2003 Member of the Advisory Board of Fidelity Advisor Series VIII. Mr. Lynch is Vice Chairman and a Director of FMR, and Vice Chairman (2001-present) and a Director of FMR Co., Inc. Previously, Mr. Lynch served as a Trustee of the Fidelity funds (1990-2003). In addition, he serves as a Trustee of Boston College and as the Chairman of the Inner-City Scholarship Fund. |
Joseph Mauriello (63) |
| Year of Election or Appointment: 2007 Member of the Advisory Board of Fidelity Advisor Series VIII. Prior to his retirement in January 2006, Mr. Mauriello served in numerous senior management positions including Deputy Chairman and Chief Operating Officer (2004-2005), and Vice Chairman of Financial Services (2002-2004) of KPMG LLP US (professional services firm, 1965-2005). Mr. Mauriello currently serves as a member of the Board of Directors of XL Capital Ltd., (global insurance and re-insurance company, 2006-present) and of Arcadia Resources Inc., (health care services and products, 2007-present). He also served as a Director of the Hamilton Funds of the Bank of New York (2006-2007). |
David M. Thomas (58) |
| Year of Election or Appointment: 2007 Member of the Advisory Board of Fidelity Advisor Series VIII. Previously, Mr. Thomas served as Executive Chairman (2005-2006) and Chairman and Chief Executive Officer (2000-2005) of IMS Health, Inc. (pharmaceutical and healthcare information solutions). In addition, Mr. Thomas serves as a member of the Board of Directors of Fortune Brands, Inc. (consumer products holding company), and Interpublic Group of Companies, Inc. (marketing communication, 2004-present). |
Michael E. Wiley (57) |
| Year of Election or Appointment: 2007 Member of the Advisory Board of Fidelity Advisor Series VIII. Mr. Wiley also serves as Sr. Energy Advisor of Katzenbach Partners, LLC (consulting firm, 2006-present) and a member of the Board of Trustees of the University of Tulsa (2000-2006; 2007-present). He serves as a Director of Tesoro Corporation (independent oil refiner and marketer, 2005-present), and a Director of Bill Barrett Corporation (exploration and production company, 2005-present). In addition, he also serves as a Director of Post Oak Bank (privately-held bank, 2004-present), and an Advisory Director of Riverstone Holdings (private investment firm). Previously, Mr. Wiley served as Chairman, President, and CEO of Baker Hughes, Inc. (oilfield services company, 2000-2004), and as Director of Spinnaker Exploration Company (exploration and production company, 2001-2005). |
Kimberley H. Monasterio (43) |
| Year of Election or Appointment: 2007 President and Treasurer of Advisor Diversified International. Ms. Monasterio also serves as President and Treasurer of other Fidelity funds (2007-present) and is an employee of FMR (2004-present). Previously, Ms. Monasterio served as Deputy Treasurer of the Fidelity funds (2004-2006). Before joining Fidelity Investments, Ms. Monasterio served as Treasurer (2000-2004) and Chief Financial Officer (2002-2004) of the Franklin Templeton Funds and Senior Vice President of Franklin Templeton Services, LLC (2000-2004). |
Walter C. Donovan (45) |
| Year of Election or Appointment: 2007 Vice President of Advisor Diversified International. Mr. Donovan also serves as Vice President of Fidelity's Equity Funds (2007-present). Mr. Donovan also serves as Executive Vice President of FMR (2005-present) and FMR Co., Inc. (2005-present). Previously, Mr. Donovan served as Vice President of Fidelity's High Income Funds (2005-2007), Fixed-Income Funds (2005-2006), certain Asset Allocation Funds (2005-2006), certain Balanced Funds (2005-2006), and as Vice President and Director of Fidelity's International Equity Trading group (1998-2005). |
Eric M. Wetlaufer (45) |
| Year of Election or Appointment: 2006 Vice President of Advisor Diversified International. Mr. Wetlaufer also serves as Vice President of certain International Equity Funds (2006-present). Mr. Wetlaufer is Senior Vice President of FMR (2006-present) and FMR Co., Inc. (2006-present), and President and Director of Fidelity Management & Research (U.K.) Inc. (2006-present) and Fidelity Research & Analysis Company (2006-present). Before joining Fidelity Investments in 2005, Mr. Wetlaufer was a partner in Oxhead Capital Management (2004-2005). Previously, Mr. Wetlaufer served as a Chief Investment Officer of Putnam Investments (1997-2003). |
Eric D. Roiter (58) |
| Year of Election or Appointment: 1998 Secretary of Advisor Diversified International. He also serves as Secretary of other Fidelity funds; Vice President, General Counsel, and Secretary of FMR Co., Inc. (2001-present) and FMR; Assistant Secretary of Fidelity Management & Research (U.K.) Inc. (2001-present), Fidelity Research & Analysis Company (2001-present), and Fidelity Investments Money Management, Inc. (2001-present). Mr. Roiter is an Adjunct Member, Faculty of Law, at Boston College Law School (2003-present). Previously, Mr. Roiter served as Vice President and Secretary of Fidelity Distributors Corporation (FDC) (1998-2005). |
Scott C. Goebel (39) |
| Year of Election or Appointment: 2007 Assistant Secretary of Advisor Diversified International. Mr. Goebel also serves as Assistant Secretary of other Fidelity funds (2007-present), and is an employee of FMR. |
R. Stephen Ganis (41) |
| Year of Election or Appointment: 2006 Anti-Money Laundering (AML) officer of Advisor Diversified International. Mr. Ganis also serves as AML officer of other Fidelity funds (2006-present) and FMR LLC (2003-present). Before joining Fidelity Investments, Mr. Ganis practiced law at Goodwin Procter, LLP (2000-2002). |
Joseph B. Hollis (59) |
| Year of Election or Appointment: 2006 Chief Financial Officer of Advisor Diversified International. Mr. Hollis also serves as Chief Financial Officer of other Fidelity funds. Mr. Hollis is President of Fidelity Pricing and Cash Management Services (FPCMS) (2005-present). Mr. Hollis also serves as President and Director of Fidelity Service Company, Inc. (2006-present). Previously, Mr. Hollis served as Senior Vice President of Cash Management Services (1999-2002) and Investment Management Operations (2002-2005). |
Kenneth A. Rathgeber (60) |
| Year of Election or Appointment: 2004 Chief Compliance Officer of Advisor Diversified International. Mr. Rathgeber also serves as Chief Compliance Officer of other Fidelity funds (2004-present) and Executive Vice President of Risk Oversight for Fidelity Investments (2002-present). He is Chief Compliance Officer of FMR (2005-present), FMR Co., Inc. (2005-present), Fidelity Management & Research (U.K.) Inc. (2005-present), Fidelity Research & Analysis Company (2005-present), Fidelity Investments Money Management, Inc. (2005-present), and Strategic Advisers, Inc. (2005-present). Previously, Mr. Rathgeber served as Executive Vice President and Chief Operating Officer for Fidelity Investments Institutional Services Company, Inc. (1998-2002). |
Bryan A. Mehrmann (46) |
| Year of Election or Appointment: 2005 Deputy Treasurer of Advisor Diversified International. Mr. Mehrmann also serves as Deputy Treasurer of other Fidelity funds (2005-present) and is an employee of FMR. Previously, Mr. Mehrmann served as Vice President of Fidelity Investments Institutional Services Group (FIIS)/Fidelity Investments Institutional Operations Corporation, Inc. (FIIOC) Client Services (1998-2004). |
Kenneth B. Robins (38) |
| Year of Election or Appointment: 2005 Deputy Treasurer of Advisor Diversified International. Mr. Robins also serves as Deputy Treasurer of other Fidelity funds (2005-present) and is an employee of FMR (2004-present). Before joining Fidelity Investments, Mr. Robins worked at KPMG LLP, where he was a partner in KPMG's department of professional practice (2002-2004) and a Senior Manager (1999-2000). In addition, Mr. Robins served as Assistant Chief Accountant, United States Securities and Exchange Commission (2000-2002). |
Robert G. Byrnes (40) |
| Year of Election or Appointment: 2005 Assistant Treasurer of Advisor Diversified International. Mr. Byrnes also serves as Assistant Treasurer of other Fidelity funds (2005-present) and is an employee of FMR (2005-present). Previously, Mr. Byrnes served as Vice President of FPCMS (2003-2005). Before joining Fidelity Investments, Mr. Byrnes worked at Deutsche Asset Management where he served as Vice President of the Investment Operations Group (2000-2003). |
Peter L. Lydecker (53) |
| Year of Election or Appointment: 2004 Assistant Treasurer of Advisor Diversified International. Mr. Lydecker also serves as Assistant Treasurer of other Fidelity funds (2004) and is an employee of FMR. |
Paul M. Murphy (60) |
| Year of Election or Appointment: 2007 Assistant Treasurer of Advisor Diversified International. Mr. Murphy also serves as Assistant Treasurer of other Fidelity funds (2007-present) and is an employee of FMR (2007-present). Previously, Mr. Murphy served as Chief Financial Officer of the Fidelity Funds (2005-2006), Vice President and Associate General Counsel of FMR (2007), and Senior Vice President of Fidelity Pricing and Cash Management Services Group (FPCMS) (1994-2007). |
Gary W. Ryan (49) |
| Year of Election or Appointment: 2005 Assistant Treasurer of Advisor Diversified International. Mr. Ryan also serves as Assistant Treasurer of other Fidelity funds (2005-present) and is an employee of FMR (2005-present). Previously, Mr. Ryan served as Vice President of Fund Reporting in FPCMS (1999-2005). |
** FMR Corp. merged with FMR LLC on October 1, 2007. Any references to FMR LLC for prior periods are deemed to be references to the prior entity.
Annual Report
Distributions
The Board of Trustees of Advisor Diversified International Fund voted to pay to shareholders of record at the opening of business on record date, the following distributions per share derived from capital gains realized from sales of portfolio securities, and dividends derived from net investment income:
| Pay Date | Record Date | Dividends | Capital Gains |
Class I | 12/10/07 | 12/07/07 | $0.303 | $3.02 |
The fund hereby designates as a capital gain dividend with respect to the taxable year ended October 31st 2007, $1,706,994,942, or, if subsequently determined to be different, the net capital gain of such year.
Class I designates 50% of the dividends distributed during the fiscal year as amounts which may be taken into account as a dividend for purposes of the maximum rate under section 1(h)(11) of the Internal Revenue Code.
The amounts per share which represent income derived from sources within, and taxes paid to, foreign countries or possessions of the United States are as follows:
| Pay Date | Income | Taxes |
Class I | 12/11/2006 | $0.315 | $0.0233 |
The fund will notify shareholders in January 2008 of amounts for use in preparing 2007 income tax returns.
Annual Report
Proxy Voting Results
A special meeting of Advisor Diversified International shareholders was held on October 17, 2007. The results of votes taken among shareholders on the proposal before them are reported below. Each vote reported represents one dollar of net asset value held on the record date for the meeting.
PROPOSAL 1 |
To approve an amended management contract that includes adding a performance adjustment component to the management fee for Fidelity Advisor Diversified International Fund and giving the Trustees the authority to change the fund's performance adjustment index going forward, without shareholder vote, subject to applicable law. |
| # of
Votes | % of
Votes |
Affirmative | 4,780,444,603.41 | 60.433 |
Against | 2,831,418,822.29 | 35.794 |
Abstain | 298,449,571.17 | 3.773 |
TOTAL | 7,910,312,996.87 | 100.000 |
Annual Report
Board Approval of Investment Advisory Contracts and Management Fees
Advisor Diversified International Fund
Each year, typically in July, the Board of Trustees, including the Independent Trustees (together, the Board), votes on the renewal of the management contract and sub-advisory agreements (together, the Advisory Contracts) for the fund. The Board, assisted by the advice of fund counsel and Independent Trustees' counsel, requests and considers a broad range of information throughout the year.
The Board meets regularly each month except August and takes into account throughout the year matters bearing on Advisory Contracts. The Board, acting directly and through its separate committees, considers at each of its meetings factors that are relevant to the annual renewal of the fund's Advisory Contracts, including the services and support provided to the fund and its shareholders. At the time of the renewal, the Board had 12 standing committees, each composed of Independent Trustees with varying backgrounds, to which the Board has assigned specific subject matter responsibilities in order to enhance effective decision-making by the Board. Each committee has adopted a written charter outlining the structure and purposes of the committee. One such committee, the Equity Contract Committee, meets periodically as needed throughout the year to consider matters specifically related to the annual renewal of Advisory Contracts. The committee requests and receives information on, and makes recommendations to the Independent Trustees concerning, the approval and annual review of the Advisory Contracts.
At its July 2007 meeting, the Board of Trustees, including the Independent Trustees, unanimously determined to renew the Advisory Contracts for the fund. In reaching its determination, the Board considered all factors it believed relevant, including (i) the nature, extent, and quality of the services to be provided to the fund and its shareholders (including the investment performance of the fund); (ii) the competitiveness of the management fee and total expenses of the fund; (iii) the total costs of the services to be provided by and the profits to be realized by the investment adviser and its affiliates from the relationship with the fund; (iv) the extent to which economies of scale would be realized as the fund grows; and (v) whether fee levels reflect these economies of scale, if any, for the benefit of fund shareholders. The Board also approved amendments to the fund's agreements with foreign sub-advisers to clarify that each sub-adviser provides services as an independent contractor.
In determining whether to renew the Advisory Contracts for the fund, the Board ultimately reached a determination, with the assistance of fund counsel and Independent Trustees' counsel, that the renewal of the Advisory Contracts and the compensation to be received by Fidelity under the management contract is consistent with Fidelity's fiduciary duty under applicable law. In addition to evaluating the specific factors noted above, the Board, in reaching its determination, is aware that shareholders in the fund have a broad range of investment choices available to them, including a wide choice among mutual funds offered by competitors to Fidelity, and that the fund's shareholders, with the opportunity to review and weigh the disclosure provided by the fund in its prospectus and other public disclosures, have chosen to invest in this fund, managed by Fidelity.
Annual Report
Nature, Extent, and Quality of Services Provided. The Board considered staffing within the investment adviser, FMR, and the sub-advisers (together, the Investment Advisers), including the background of the fund's portfolio manager and the fund's investment objective and discipline. The Independent Trustees also had discussions with senior management of Fidelity's investment operations and investment groups. The Board considered the structure of the portfolio manager compensation program and whether this structure provides appropriate incentives.
Resources Dedicated to Investment Management and Support Services. The Board reviewed the size, education, and experience of the Investment Advisers' investment staff, their use of technology, and the Investment Advisers' approach to recruiting, training, and retaining portfolio managers and other research, advisory, and management personnel. The Board considered Fidelity's extensive global research capabilities that enable the Investment Advisers to aggregate data from various sources in an effort to produce positive investment results. The Board noted that Fidelity's analysts have access to a variety of technological tools that enable them to perform both fundamental and quantitative analysis and to specialize in various disciplines. The Board also considered that Fidelity's portfolio managers and analysts have access to daily portfolio attribution that allows for monitoring of a fund's portfolio, as well as an electronic communication system that provides immediate real-time access to research concerning issuers and credit enhancers.
Shareholder and Administrative Services. The Board considered (i) the nature, extent, quality, and cost of advisory, administrative, distribution, and shareholder services performed by the Investment Advisers and their affiliates under the Advisory Contracts and under separate agreements covering transfer agency, pricing and bookkeeping, and securities lending services for the fund; (ii) the nature and extent of the Investment Advisers' supervision of third party service providers, principally custodians and subcustodians; and (iii) the resources devoted to, and the record of compliance with, the fund's compliance policies and procedures. The Board reviewed the allocation of fund brokerage, including allocations to brokers affiliated with the Investment Advisers, the use of brokerage commissions to pay fund expenses, and the use of "soft" commission dollars to pay for research services. The Board also considered that Fidelity voluntarily pays for market data out of its own resources. The Board also considered the agreement reached between the Independent Trustees and Fidelity in December 2006 following an independent review of matters relating to receipt of travel, entertainment, gifts and gratuities in violation of Fidelity policies.
Annual Report
Board Approval of Investment Advisory Contracts and
Management Fees - continued
The Board noted that the growth of fund assets across the complex allows Fidelity to reinvest in the development of services designed to enhance the value or convenience of the Fidelity funds as investment vehicles. These services include 24-hour access to account information and market information through phone representatives and over the Internet, and investor education materials and asset allocation tools.
Investment in a Large Fund Family. The Board considered the benefits to shareholders of investing in a Fidelity fund, including the benefits of investing in a fund that is part of a large family of funds offering a variety of investment disciplines and providing for a large variety of mutual fund investor services. For example, fund shareholders are offered the privilege of exchanging shares of the fund for shares of other Fidelity funds, as set forth in the fund's prospectus, without paying a sales charge. The Board noted that, since the last Advisory Contract renewals in July 2006, Fidelity has taken a number of actions that benefited particular funds, including (i) dedicating additional resources to investment research and to restructure the investment research teams; (ii) contractually agreeing to reduce the management fee on Fidelity Advisor Floating Rate High Income Fund; (iii) contractually agreeing to reduce the management fees on Fidelity's California, Massachusetts, New Jersey, and New York AMT Tax-Free Money Market Funds, launching new Institutional Classes and Service Classes of these funds, and contractually agreeing to impose expense limitations on these funds; (iv) eliminating the exchange fee on the Fidelity Select Portfolios and reducing the pricing and bookkeeping fee rates for these funds; (v) reducing the maximum transfer agency fee rates on high income funds and certain equity funds; (vi) proposing amended management contracts that, if approved by shareholders, will add a performance adjustment component to the management fees paid by 18 Fidelity Advisor equity funds; (vii) contractually agreeing to reduce fees for Ultra-Short Central Fund and the money market Central Funds; (viii) waiving the Fidelity Advisor funds' contingent deferred sales charge on certain redemptions made through systematic withdrawal programs; and (ix) amending the management contracts for equity and fixed-income funds whose management contracts incorporate a "group fee" structure by adding four new fee "breakpoints" to the group fee rate schedules.
Investment Performance and Compliance. The Board considered whether the fund has operated within its investment objective, as well as its record of compliance with its investment restrictions. It also reviewed the fund's absolute investment performance for each class, as well as the fund's relative investment performance for each class measured against (i) a broad-based securities market index, and (ii) a peer group of mutual funds deemed appropriate by the Board over multiple periods. The following charts considered by the Board show, over the one-, three-, and five-year periods ended December 31, 2006, the cumulative total returns of Institutional Class (Class I) and Class B of the fund, the cumulative total returns of a broad-based securities market index ("benchmark"), and a range of cumulative total returns of a peer group of mutual funds identified by Morningstar, Inc. as having an investment style similar to that of the fund based on underlying portfolio holdings. The returns of Institutional Class (Class I) and Class B show the performance of the highest and lowest performing classes, respectively (based on three-year performance). The box within each chart shows the 25th percentile return (bottom of box) and the 75th percentile return (top of box) of the peer group. Returns shown above the box are in the first quartile and returns shown below the box are in the fourth quartile. The percentage beaten numbers noted below each chart correspond to the percentile box and represent the percentage of funds in the peer group whose performance was equal to or lower than that of the class indicated.
Annual Report
Advisor Diversified International Fund

The Board reviewed the fund's relative investment performance against its peer group and stated that the performance of Institutional Class (Class I) of the fund was in the fourth quartile for the one-year period, the third quartile for the three-year period, and the first quartile for the five-year period. The Board also stated that the investment performance of the fund was lower than its benchmark for the one- and three-year periods, although the five-year cumulative total return of Institutional Class (Class I) compared favorably to its benchmark. The Board considered that the variations in performance among the fund's classes reflect the variations in class expenses, which result in lower performance for higher expense classes. The Board discussed with FMR actions to be taken by FMR to improve the fund's more recent disappointing performance relative to its peer group. The Board will continue to closely monitor the performance of the fund in the coming year.
The Board considered that FMR has taken steps to refocus and strengthen equity research, equity portfolio management, and compliance.
Annual Report
Board Approval of Investment Advisory Contracts and
Management Fees - continued
Based on its review, and giving particular weight to the nature and quality of the resources dedicated by the Investment Advisers to maintain and improve relative performance, the Board concluded that the nature, extent, and quality of the services provided to the fund will benefit the fund's shareholders, particularly in light of the Board's view that the fund's shareholders benefit from investing in a fund that is part of a large family of funds offering a variety of investment disciplines and services.
Competitiveness of Management Fee and Total Fund Expenses. The Board considered the fund's management fee and total expenses compared to "mapped groups" of competitive funds and classes. Fidelity creates "mapped groups" by combining similar Lipper investment objective categories that have comparable management fee characteristics. Combining Lipper investment objective categories aids the Board's management fee and total expense comparisons by broadening the competitive group used for comparison and by reducing the number of universes to which various Fidelity funds are compared. The Board also considered supplemental information about how the fund's management fee and total expenses ranked relative to groups based on Lipper classifications, which take into account a fund's market capitalization and style.
The Board considered two proprietary management fee comparisons for the 12-month periods shown in the chart below. The group of Lipper funds used by the Board for management fee comparisons is referred to below as the "Total Mapped Group." The Total Mapped Group comparison focuses on a fund's standing relative to the total universe of comparable funds available to investors, in terms of gross management fees before expense reimbursements or caps. "TMG %" represents the percentage of funds in the Total Mapped Group that had management fees that were lower than the fund's. For example, a TMG % of 13% means that 87% of the funds in the Total Mapped Group had higher management fees than the fund. The "Asset-Size Peer Group" (ASPG) comparison focuses on a fund's standing relative to non-Fidelity funds similar in size to the fund within the Total Mapped Group. The ASPG represents at least 15% of the funds in the Total Mapped Group with comparable asset size and management fee characteristics, subject to a minimum of 50 funds (or all funds in the Total Mapped Group if fewer than 50). Additional information, such as the ASPG quartile in which the fund's management fee ranked, is also included in the chart and considered by the Board.
Annual Report
Advisor Diversified International Fund

The Board noted that the fund's management fee ranked below the median of its Total Mapped Group and below the median of its ASPG for 2006.
Furthermore, the Board considered that, on December 14, 2006, it had approved an amended management contract for the fund that, if approved by shareholders, will add a performance adjustment component to the management fee paid by the fund (that is, the fund's management fee will be subject to upward or downward adjustment depending upon whether, and to what extent, the fund's investment performance for the performance period exceeds, or is exceeded by, the record (over the same period) of a Board-approved performance adjustment index).
Based on its review, the Board concluded that the fund's management fee was fair and reasonable in light of the services that the fund receives and the other factors considered.
In its review of each class's total expenses, the Board considered the fund's management fee as well as other fund or class expenses, as applicable, such as transfer agent fees, pricing and bookkeeping fees, fund-paid 12b-1 fees, and custodial, legal, and audit fees. The Board also noted the effects of any waivers and reimbursements on fees and expenses. As part of its review, the Board also considered current and historical total expenses of each class of the fund compared to competitive fund median expenses. Each class of the fund is compared to those funds and classes in the Total Mapped Group (used by the Board for management fee comparisons) that have a similar sales load structure.
The Board noted that the total expenses of each class ranked below its competitive median for 2006.
Annual Report
Board Approval of Investment Advisory Contracts and
Management Fees - continued
In its review of total expenses, the Board also considered Fidelity fee structures and other information on clients that FMR and its affiliates service in other competitive markets, such as other mutual funds advised or subadvised by FMR or its affiliates, pension plan clients, and other institutional clients.
Based on its review, the Board concluded that the total expenses of each class of the fund were reasonable in light of the services that the fund and its shareholders receive and the other factors considered.
Costs of the Services and Profitability. The Board considered the revenues earned and the expenses incurred by Fidelity in conducting the business of developing, marketing, distributing, managing, administering and servicing the fund and its shareholders. The Board also considered the level of Fidelity's profits in respect of all the Fidelity funds.
On an annual basis, FMR presents to the Board Fidelity's profitability for the fund. Fidelity calculates the profitability for each fund, as well as aggregate profitability for groups of Fidelity funds and all Fidelity funds, using a series of detailed revenue and cost allocation methodologies which originate with the audited books and records of Fidelity. The Audit Committee of the Board reviews any significant changes from the prior year's methodologies.
PricewaterhouseCoopers LLP (PwC), independent registered public accounting firm and auditor to Fidelity and certain Fidelity funds, has been engaged annually by the Board as part of the Board's assessment of the results of Fidelity's profitability analysis. PwC's engagement includes the review and assessment of Fidelity's methodologies used in determining the revenues and expenses attributable to Fidelity's mutual fund business, and completion of agreed-upon procedures surrounding the mathematical accuracy of fund profitability and its conformity to allocation methodologies. After considering PwC's reports issued under the engagement and information provided by Fidelity, the Board believes that while other allocation methods may also be reasonable, Fidelity's profitability methodologies are reasonable in all material respects.
The Board has also reviewed Fidelity's non-fund businesses and any fall-out benefits related to the mutual fund business as well as cases where Fidelity's affiliates may benefit from or be related to the fund's business.
The Board considered the costs of the services provided by and the profits realized by Fidelity in connection with the operation of the fund and determined that the amount of profit is a fair entrepreneurial profit for the management of the fund.
Economies of Scale. The Board considered whether there have been economies of scale in respect of the management of the Fidelity funds, whether the Fidelity funds (including the fund) have appropriately benefited from any such economies of scale, and whether there is potential for realization of any further economies of scale. The Board considered the extent to which the fund will benefit from economies of scale through increased services to the fund, through waivers or reimbursements, or through fee or expense reductions, including reductions that occur through operation of the transfer agent agreement. The transfer agent fee varies in part based on the number of accounts in the fund. If the number of accounts decreases or the average account size increases, the overall transfer agent fee rate decreases.
Annual Report
The Board recognized that the fund's management contract incorporates a "group fee" structure, which provides for lower group fee rates as total fund assets under FMR's management increase, and for higher group fee rates as total fund assets under FMR's management decrease. FMR determines the group fee rates based on a tiered asset "breakpoint" schedule. In connection with the renewal of the fund's management contract, the Board approved amendments to the fund's management contract that added four new fee breakpoints to the group fee rate schedule for assets under FMR's management above $1,386 billion. The Board considered that the group fee rate declines under both the present and amended schedules, but that under the amended schedule, the group fee rate declines faster as assets under FMR's management exceed $1,386 billion. The Board considered that the group fee is designed to deliver the benefits of economies of scale to fund shareholders when total fund assets increase, even if assets of any particular fund are unchanged or have declined, because some portion of Fidelity's costs are attributable to services provided to all Fidelity funds, and all funds benefit if those costs can be allocated among more assets. The Board concluded that, given the group fee structure, fund shareholders will achieve a certain level of economies of scale as assets under FMR's management increase at the fund complex level, regardless of whether Fidelity achieves any such economies of scale.
The Board further concluded that any potential economies of scale are being shared between fund shareholders and Fidelity in an appropriate manner.
Additional Information Requested by the Board. In order to develop fully the factual basis for consideration of the Fidelity funds' Advisory Contracts, the Board requested and received additional information on several topics, including (i) fund performance trends and actions to be taken by FMR to improve certain funds' overall performance; (ii) Fidelity's portfolio manager compensation structure, including its effects on fund profitability and the extent to which portfolio manager compensation is linked to fund performance; (iii) Fidelity's fee structures; (iv) the funds' sub-advisory arrangements; and (v) accounts managed by Fidelity other than the Fidelity funds.
Based on its evaluation of all of the conclusions noted above, and after considering all material factors, the Board ultimately concluded that the advisory fee structures are fair and reasonable, and that the fund's Advisory Contracts should be renewed.
Annual Report
Annual Report
Annual Report
Annual Report
Annual Report
Annual Report
Annual Report
Investment Adviser
Fidelity Management & Research Company
Boston, MA
Investment Sub-Advisers
FMR Co., Inc.
Fidelity Management & Research
(U.K.) Inc.
Fidelity Research & Analysis Company
Fidelity International
Investment Advisors
Fidelity Investments Japan Limited
Fidelity International Investment Advisors (U.K.) Limited
General Distributor
Fidelity Distributors Corporation
Boston, MA
Transfer and Service Agents
Fidelity Investments Institutional Operations Company, Inc.
Boston, MA
Fidelity Service Company, Inc.
Boston, MA
Custodian
State Street Bank and Trust Company
Quincy, MA
ADIFI-UANN-1207
1.784736.104
(Fidelity Investment logo)(registered trademark)
(Fidelity Investment logo)(registered trademark)
Fidelity® Advisor
Emerging Asia
Fund - Class A, Class T, Class B
and Class C
Annual Report
October 31, 2007
(2_fidelity_logos) (Registered_Trademark)
Contents
Chairman's Message | <Click Here> | Ned Johnson's message to shareholders. |
Performance | <Click Here> | How the fund has done over time. |
Management's Discussion | <Click Here> | The manager's review of fund performance, strategy and outlook. |
Shareholder Expense Example | <Click Here> | An example of shareholder expenses. |
Investment Changes | <Click Here> | A summary of major shifts in the fund's investments over the past six months. |
Investments | <Click Here> | A complete list of the fund's investments with their market values. |
Financial Statements | <Click Here> | Statements of assets and liabilities, operations, and changes in net assets,
as well as financial highlights. |
Notes | <Click Here> | Notes to the financial statements. |
Report of Independent Registered Public Accounting Firm | <Click Here> | |
Trustees and Officers | <Click Here> | |
Distributions | <Click Here> | |
Board Approval of Investment Advisory Contracts and Management Fees | <Click Here> | |
To view a fund's proxy voting guidelines and proxy voting record for the 12-month period ended June 30, visit http://www.fidelity.com (search for "proxy voting guidelines") or visit the Securities and Exchange Commission's (SEC) web site at http://www.sec.gov. You may also call 1-877-208-0098 to request a free copy of the proxy voting guidelines.
Standard & Poor's, S&P and S&P 500 are registered service marks of The McGraw-Hill Companies, Inc. and have been licensed for use by Fidelity Distributors Corporation.
Other third party marks appearing herein are the property of their respective owners.
All other marks appearing herein are registered or unregistered trademarks or service marks of FMR LLC or an affiliated company.
Annual Report
This report and the financial statements contained herein are submitted for the general information of the shareholders of the fund. This report is not authorized for distribution to prospective investors in the fund unless preceded or accompanied by an effective prospectus.
A fund files its complete schedule of portfolio holdings with the SEC for the first and third quarters of each fiscal year on Form N-Q. Forms N-Q are available on the SEC's web site at http://www.sec.gov. A fund's Forms N-Q may be reviewed and copied at the SEC's Public Reference Room in Washington, DC. Information regarding the operation of the SEC's Public Reference Room may be obtained by calling 1-800-SEC-0330. For a complete list of a fund's portfolio holdings, view the most recent holdings listing, semiannual report, or annual report on Fidelity's web site at http://www.fidelity.com or http://www.advisor.fidelity.com, as applicable.
NOT FDIC INSURED · MAY LOSE VALUE · NO BANK GUARANTEE
Neither the fund nor Fidelity Distributors Corporation is a bank.
Annual Report
Chairman's Message
(photo_of_Edward_C_Johnson_3d)
Dear Shareholder:
Many stock and bond markets around the world have been unsettled of late; however, volatility can often lead to opportunity for patient investors. Financial markets are always unpredictable, but there are a number of time-tested principles that can put the historical odds in your favor.
One of the basic tenets is to invest for the long term. Over time, riding out the markets' inevitable ups and downs has proven much more effective than selling into panic or chasing the hottest trend. Even missing only a few of the markets' best days can significantly diminish investor returns. Patience also affords the benefits of compounding - of earning interest on additional income or reinvested dividends and capital gains. There are tax advantages and cost benefits to consider as well. The more you sell, the more taxes you pay, and the more you trade, the higher the costs. While staying the course doesn't eliminate risk, it can considerably lessen the effect of short-term declines.
You can further manage your investing risk through diversification. And today, more than ever, geographic diversification should be taken into account. Studies indicate that asset allocation is the single most important determinant of a portfolio's long-term success. The right mix of stocks, bonds and cash - aligned to your particular risk tolerance and investment objective - is very important. Age-appropriate rebalancing is also an essential aspect of asset allocation. For younger investors, an emphasis on equities - which historically have been the best-performing asset class over time - is encouraged. As investors near their specific goal, such as retirement or sending a child to college, consideration may be given to replacing volatile assets (e.g. common stocks) with more-stable fixed investments (bonds or savings plans).
A third investment principle - investing regularly - can help lower the average cost of your purchases. Investing a certain amount of money each month or quarter helps ensure you won't pay for all your shares at market highs. This strategy - known as dollar cost averaging - also reduces unconstructive "emotion" from investing, helping shareholders avoid selling weak performers just prior to an upswing, or chasing a hot performer just before a correction.
We invite you to contact us via the Internet, through our Investor Centers or over the phone. It is our privilege to provide you the information you need to make the investments that are right for you.
Sincerely,
/s/Edward C. Johnson 3d
Edward C. Johnson 3d
Annual Report
Performance: The Bottom Line
Average annual total return reflects the change in the value of an investment, assuming reinvestment of the class' dividend income and capital gains (the profits earned upon the sale of securities that have grown in value) and assuming a constant rate of performance each year. The $10,000 table and the fund's returns do not reflect the deduction of taxes that a shareholder would pay on fund distributions or the redemption of fund shares. During periods of reimbursement by Fidelity, a fund's total return will be greater than it would be had the reimbursement not occurred. How a fund did yesterday is no guarantee of how it will do tomorrow. Returns reflect the conversion of Class B shares to Class A shares after a maximum of seven years.
Average Annual Total Returns
Periods ended October 31, 2007 | | Past 1
year | Past 5
years | Past 10 years |
Class A (incl. 5.75% sales charge) A | | 70.06% | 33.64% | 14.14% |
Class T (incl. 3.50% sales charge) B | | 73.68% | 33.92% | 14.17% |
Class B (incl. contingent deferred sales charge) C | | 74.01% | 34.10% | 14.21% |
Class C (incl. contingent deferred sales charge) D | | 78.05% | 34.23% | 14.10% |
A Class A's 12b-1 fee may have ranged over time between 0.25% and 0.35%, as an equivalent amount of brokerage commissions of up to 0.10% of the class's average net assets may have been used to promote the sale of class shares. This practice has been discontinued and no commissions incurred after June 30, 2003 have been used to pay distribution expenses. Class A's 12b-1 plan currently authorizes a 0.25% 12b-1 fee. The initial offering of Class A shares took place on June 16, 1999. Returns prior to June 16, 1999 are those of Fidelity Advisor Emerging Asia Fund, Inc., (the Closed-End Fund). At the close of business on June 15, 1999, the Closed-End Fund reorganized as an open-end fund through a transfer of all its assets and liabilities to Fidelity Advisor Emerging Asia Fund (the fund). Shareholders of the Closed-End Fund received Class A shares of the fund in exchange for their shares of the Closed-End Fund. If Class A shares' total expenses, including its 12b-1 fee, had been reflected in the Closed-End Fund's performance, Class A's returns prior to June 16,1999 may have been lower.
B Class T's 12b-1 fee may have ranged over time between 0.50% and 0.60%, as an equivalent amount of brokerage commissions of up to 0.10% of the class's average net assets may have been used to promote the sale of class shares. This practice has been discontinued and no commissions incurred after June 30, 2003 have been used to pay distribution expenses. Class T's 12b-1 plan currently authorizes a 0.50% 12b-1 fee. The initial offering of Class T shares took place on June 16, 1999. Returns prior to June 16, 1999 are those of Fidelity Advisor Emerging Asia Fund, Inc., (the Closed-End Fund). At the close of business on June 15, 1999, the Closed-End Fund reorganized as an open-end fund through a transfer of all its assets and liabilities to Fidelity Advisor Emerging Asia Fund (the fund). Shareholders of the Closed-End Fund received Class A shares of the fund in exchange for their shares of the Closed-End Fund. If Class T shares total expenses, including its 12b-1 fee, had been reflected in the Closed-End Fund's performance, Class T's returns prior to June 16, 1999 may have been lower.
Annual Report
Performance - continued
C Class B shares bear a 1.00% 12b-1 fee that is reflected in returns after June 16, 1999. The initial offering of Class B shares took place on June 16, 1999. Returns prior to June 16, 1999 are those of Fidelity Advisor Emerging Asia Fund, Inc., (the Closed-End Fund). At the close of business on June 15, 1999, the Closed-End Fund reorganized as an open-end fund through a transfer of all its assets and liabilities to Fidelity Advisor Emerging Asia Fund (the fund). Shareholders of the Closed-End Fund received Class A shares of the fund in exchange for their shares of the Closed-End Fund. If Class B shares' total expenses, including its 1.00% 12b-1 fee, had been reflected in the Closed-End Fund's performance, Class B's returns, prior to June 16, 1999, may have been lower. Class B shares' contingent deferred sales charges included in the past one year, past five years, and past 10 years total return figures are 5%, 2%, and 0%, respectively.
D Class C shares bear a 1.00% 12b-1 fee that is reflected in returns after June 16, 1999. The initial offering of Class C shares took place on June 16, 1999. Returns prior to June 16, 1999 are those of Fidelity Advisor Emerging Asia Fund, Inc., (the Closed-End Fund). At the close of business on June 15, 1999, the Closed-End Fund reorganized as an open-end fund through a transfer of all its assets and liabilities to Fidelity Advisor Emerging Asia Fund (the fund). Shareholders of the Closed-End Fund received Class A shares of the fund in exchange for their shares of the Closed-End Fund. If Class C shares' total expenses, including its 1.00% 12b-1 fee, had been reflected in the Closed-End Fund's performance, Class C's returns, prior to June 16, 1999, may have been lower. Class C shares' contingent deferred sales charge included in the past one year, past five years, and past 10 years total return figures are 1%, 0%, and 0%, respectively.
$10,000 Over 10 Years
Let's say hypothetically that $10,000 was invested in Fidelity® Advisor Emerging Asia Fund - Class T on October 31, 1997, and the current 3.50% sales charge was paid. The chart shows how the value of your investment would have changed, and also shows how the Morgan Stanley Capital InternationalSM All Country (MSCI® AC) Asia ex Japan Index performed over the same period. The initial offering of Class T took place on June 16, 1999. See the previous page for additional information regarding the performance of Class T.
Annual Report
Management's Discussion of Fund Performance
Comments from Kevin Chang, Portfolio Manager of Fidelity® Advisor Emerging Asia Fund
Asian emerging-markets equities outperformed most U.S. and foreign developed stock markets during the year ending October 31, 2007. In that time, the Morgan Stanley Capital InternationalSM (MSCI®) All Country Asia ex Japan Index was up 73.18%. On the whole, developing Asian markets benefited from brisk economic growth and the ongoing build-out of commercial and industrial infrastructure. China led the way with a gain of roughly 168%, reflecting optimism about opportunities within the region's fast-growing economy. Hong Kong surged higher for similar reasons, jumping around 91%. However, two of the largest country weightings in the index trailed its overall return despite very strong absolute performance. South Korea - the benchmark's biggest constituent on average during the period - gained almost 57% but still was approximately 16 percentage points shy of the MSCI index. Taiwan - the third-largest country weighting on average - also came up short despite a solid return of nearly 40%.
During the past year, the fund's Class A, Class T, Class B and Class C shares returned 80.43%, 79.98%, 79.01% and 79.05%, respectively (excluding sales charges), beating the MSCI index. Information technology helped performance the most versus the index, followed by industrials, energy and consumer staples. Favorable stock selection was the primary driver. Geographically, stock picking in China, South Korea, Taiwan and India aided our results. Further, a weak U.S. dollar boosted absolute performance. The fund's top contributor was South Korea's Taewoong, a leading manufacturer of forged products for heavy industry. Other contributors included Taiwan-based semiconductor maker Global Unichip, China Oilfield Services, China Merchants Bank and Seoul Securities. Global Unichip and Seoul Securities were sold by period end. All five contributors were out-of-index positions. Conversely, the materials sector detracted from our results, while Indonesia and Thailand were the most negative country influences. An average cash position of more than 5% also hurt. Not owning strong-performing index components Hong Kong Exchanges & Clearing and Hyundai Heavy Industries, a Korean shipbuilder, dampened performance, as did underweighting index component China Life Insurance.
Note to shareholders: On November 14, 2007, shareholders of Fidelity Advisor Korea Fund approved the merger of Advisor Korea into Fidelity Advisor Emerging Asia Fund. The merger was completed on December 7, 2007.
The views expressed above reflect those of the portfolio manager(s) only through the end of the period as stated on the cover of this report and do not necessarily represent the views of Fidelity or any other person in the Fidelity organization. Any such views are subject to change at any time based upon market or other conditions and Fidelity disclaims any responsibility to update such views. These views may not be relied on as investment advice and, because investment decisions for a Fidelity fund are based on numerous factors, may not be relied on as an indication of trading intent on behalf of any Fidelity fund.
Annual Report
Shareholder Expense Example
As a shareholder of the Fund, you incur two types of costs: (1) transaction costs, including sales charges (loads) on purchase payments or redemption proceeds, redemption fees, and (2) ongoing costs, including management fees, distribution and/or service (12b-1) fees and other Fund expenses. This Example is intended to help you understand your ongoing costs (in dollars) of investing in the Fund and to compare these costs with the ongoing costs of investing in other mutual funds.
The Example is based on an investment of $1,000 invested at the beginning of the period and held for the entire period (May 1, 2007 to October 31, 2007).
Actual Expenses
The first line of the accompanying table for each class of the Fund provides information about actual account values and actual expenses. You may use the information in this line, together with the amount you invested, to estimate the expenses that you paid over the period. Simply divide your account value by $1,000.00 (for example, an $8,600 account value divided by $1,000.00 = 8.6), then multiply the result by the number in the first line for a class of the Fund under the heading entitled "Expenses Paid During Period" to estimate the expenses you paid on your account during this period. In addition, the Fund, as a shareholder in the underlying Fidelity Central Funds, will indirectly bear its pro rata share of the fees and expenses incurred by the underlying Fidelity Central Funds. These fees and expenses are not included in the Fund's annualized expense ratio used to calculate the expense estimate in the table below.
Hypothetical Example for Comparison Purposes
The second line of the accompanying table for each class of the Fund provides information about hypothetical account values and hypothetical expenses based on a Class' actual expense ratio and an assumed rate of return of 5% per year before expenses, which is not the Class' actual return. The hypothetical account values and expenses may not be used to estimate the actual ending account balance or expenses you paid for the period. You may use this information to compare the ongoing costs of investing in the Fund and other funds. To do so, compare this 5% hypothetical example with the 5% hypothetical examples that appear in the shareholder reports of the other funds. In addition, the Fund, as a shareholder in the underlying Fidelity Central Funds, will indirectly bear its pro rata share of the fees and expenses incurred by the underlying Fidelity Central Funds. These fees and expenses are not included in the Fund's annualized expense ratio used to calculate the expense estimate in the table below.
Annual Report
Please note that the expenses shown in the table are meant to highlight your ongoing costs only and do not reflect any transaction costs. Therefore, the second line of the table is useful in comparing ongoing costs only, and will not help you determine the relative total costs of owning different funds. In addition, if these transactional costs were included, your costs would have been higher.
| Beginning
Account Value
May 1, 2007 | Ending
Account Value
October 31, 2007 | Expenses Paid
During Period*
May 1, 2007 to
October 31, 2007 |
Class A | | | |
Actual | $ 1,000.00 | $ 1,465.70 | $ 9.14 |
Hypothetical A | $ 1,000.00 | $ 1,017.80 | $ 7.48 |
Class T | | | |
Actual | $ 1,000.00 | $ 1,464.10 | $ 10.87 |
Hypothetical A | $ 1,000.00 | $ 1,016.38 | $ 8.89 |
Class B | | | |
Actual | $ 1,000.00 | $ 1,460.00 | $ 13.95 |
Hypothetical A | $ 1,000.00 | $ 1,013.86 | $ 11.42 |
Class C | | | |
Actual | $ 1,000.00 | $ 1,460.70 | $ 13.65 |
Hypothetical A | $ 1,000.00 | $ 1,014.12 | $ 11.17 |
Institutional Class | | | |
Actual | $ 1,000.00 | $ 1,468.30 | $ 6.91 |
Hypothetical A | $ 1,000.00 | $ 1,019.61 | $ 5.65 |
A 5% return per year before expenses
* Expenses are equal to each Class' annualized expense ratio (shown in the table below); multiplied by the average account value over the period, multiplied by 184/365 (to reflect the one-half year period).
| Annualized
Expense Ratio |
Class A | 1.47% |
Class T | 1.75% |
Class B | 2.25% |
Class C | 2.20% |
Institutional Class | 1.11% |
Annual Report
Investment Changes
Top Ten Stocks as of October 31, 2007 |
| % of fund's
net assets | % of fund's net assets
6 months ago |
China Mobile (Hong Kong) Ltd. | 4.3 | 2.0 |
Samsung Electronics Co. Ltd. | 3.0 | 3.1 |
POSCO | 2.9 | 2.1 |
Reliance Industries Ltd. | 2.6 | 0.4 |
PetroChina Co. Ltd. (H Shares) | 2.5 | 1.9 |
Taewoong Co. Ltd. | 2.0 | 1.1 |
Shinhan Financial Group Co. Ltd. | 1.9 | 0.9 |
Sun Hung Kai Properties Ltd. | 1.9 | 2.0 |
Cheung Kong Holdings Ltd. | 1.6 | 1.9 |
Sina Corp. | 1.6 | 0.8 |
| 24.3 | |
Top Five Market Sectors as of October 31, 2007 |
| % of fund's
net assets | % of fund's net assets
6 months ago |
Financials | 26.3 | 34.8 |
Information Technology | 15.3 | 16.1 |
Industrials | 12.4 | 11.5 |
Materials | 12.2 | 7.4 |
Consumer Discretionary | 9.7 | 8.6 |
Asset Allocation (% of fund's net assets) |
As of October 31, 2007 | As of April 30, 2007 |
 | Stocks and
Investment
Companies 96.4% | | | Stocks and
Investment
Companies 95.9% | |
 | Short-Term
Investments and
Net Other Assets 3.6% | | | Short-Term
Investments and
Net Other Assets 4.1% | |

Annual Report
Investments October 31, 2007
Showing Percentage of Net Assets
Common Stocks - 96.4% |
| Shares | | Value |
Australia - 0.7% |
Boral Ltd. | 204,031 | | $ 1,296,610 |
Mount Gibson Iron Ltd. (a) | 400,000 | | 1,130,874 |
Thinksmart Ltd. | 51,200 | | 87,507 |
TOTAL AUSTRALIA | | 2,514,991 |
Bermuda - 1.4% |
Peace Mark Holdings Ltd. | 1,160,000 | | 1,911,195 |
Sinofert Holdings Ltd. | 3,340,000 | | 3,150,522 |
TOTAL BERMUDA | | 5,061,717 |
Cayman Islands - 2.9% |
Alibaba.com Ltd. (a) | 14,500 | | 46,772 |
Belle International Holdings Ltd. | 1,035,000 | | 1,679,037 |
CNinsure, Inc. ADR (a) | 1,500 | | 37,935 |
Computime Group Ltd. | 2,000,000 | | 358,869 |
Delta Networks, Inc. | 118,000 | | 56,942 |
Hutchison China Meditech Ltd. (a) | 3 | | 11 |
Lee & Man Paper Manufacturing Ltd. | 500,000 | | 2,000,172 |
Mindray Medical International Ltd. sponsored ADR (d) | 29,400 | | 1,168,944 |
New Oriental Education & Technology Group, Inc. sponsored ADR | 32,200 | | 2,882,544 |
Stella International Holdings Ltd. | 900,000 | | 1,974,104 |
TOTAL CAYMAN ISLANDS | | 10,205,330 |
China - 16.1% |
China Communications Construction Co. Ltd. (H Shares) | 500,000 | | 1,586,485 |
China Construction Bank Corp. (H Shares) | 4,000,000 | | 4,547,401 |
China Life Insurance Co. Ltd. (H Shares) | 500,000 | | 3,390,333 |
China Merchants Bank Co. Ltd. (H Shares) | 310,000 | | 1,598,426 |
China Oilfield Services Ltd. (H Shares) | 1,000,000 | | 2,448,853 |
China Petroleum & Chemical Corp. (H Shares) | 1,190,000 | | 1,974,329 |
China Shenhua Energy Co. Ltd. (H Shares) | 500,000 | | 3,222,141 |
Dalian Port (PDA) Co. Ltd. (H Shares) | 1,635,000 | | 1,513,981 |
Dongfang Electrical Machinery Co. Ltd. (H Shares) | 374,000 | | 3,343,390 |
Industrial & Commercial Bank of China | 4,000,000 | | 3,820,403 |
Nine Dragons Paper (Holdings) Ltd. | 850,000 | | 2,302,456 |
PetroChina Co. Ltd. (H Shares) | 3,328,000 | | 8,739,328 |
Ping An Insurance (Group) Co. of China, Ltd. (H Shares) | 350,000 | | 4,899,210 |
Sina Corp. (a) | 98,900 | | 5,669,937 |
SINOPEC Yizheng Chemical Fibre Co. Ltd. (H Shares) (a) | 3,000,000 | | 1,564,610 |
Common Stocks - continued |
| Shares | | Value |
China - continued |
Tencent Holdings Ltd. | 600,000 | | $ 5,143,431 |
Yantai Changyu Pioneer Wine Co. (B Shares) | 241,240 | | 1,797,707 |
TOTAL CHINA | | 57,562,421 |
Hong Kong - 17.6% |
Bank of East Asia Ltd. | 120,000 | | 816,471 |
Cheung Kong Holdings Ltd. | 290,000 | | 5,688,400 |
China Mobile (Hong Kong) Ltd. | 736,000 | | 15,261,695 |
China Netcom Group Corp. Hong Kong Ltd. | 700,000 | | 2,151,332 |
China Unicom Ltd. | 700,000 | | 1,716,400 |
CNOOC Ltd. | 1,238,500 | | 2,681,229 |
Esprit Holdings Ltd. | 132,500 | | 2,212,896 |
Fairwood Holdings Ltd. (e) | 600,000 | | 750,284 |
Hang Lung Properties Ltd. | 900,000 | | 4,329,922 |
Hang Seng Bank Ltd. | 80,000 | | 1,634,375 |
Hong Kong & Shanghai Hotels Ltd. | 174,000 | | 322,131 |
Hutchison Whampoa Ltd. | 77,000 | | 970,200 |
Kerry Properties Ltd. | 550,000 | | 4,783,961 |
Li & Fung Ltd. | 1,110,000 | | 5,267,274 |
Midland Holdings Ltd. | 1,564,000 | | 1,937,073 |
New World Development Co. Ltd. | 600,000 | | 2,162,518 |
Shougang Concord International Enterprises Co. Ltd. | 5,000,000 | | 2,698,055 |
Sun Hung Kai Properties Ltd. | 350,000 | | 6,688,747 |
Wing Hang Bank Ltd. | 70,000 | | 824,858 |
TOTAL HONG KONG | | 62,897,821 |
India - 9.4% |
Bajaj Auto Ltd. | 16,000 | | 1,017,969 |
Bharat Heavy Electricals Ltd. | 16,145 | | 1,080,662 |
Bharti Airtel Ltd. (a) | 152,768 | | 3,946,804 |
Container Corp. of India Ltd. | 10,000 | | 506,448 |
Educomp Solutions Ltd. | 38,160 | | 3,188,595 |
Idea Cellular Ltd. | 67,735 | | 234,837 |
IL&FS Investsmart Ltd. | 63,876 | | 285,532 |
INFO Edge India Ltd. | 53,892 | | 1,671,222 |
IVRCL Infrastructures & Projects Ltd. | 65,000 | | 846,509 |
Kotak Mahindra Bank Ltd. | 30,000 | | 770,493 |
Larsen & Toubro Ltd. | 11,558 | | 1,263,683 |
Max India Ltd. (a) | 111,250 | | 743,410 |
Punjab National Bank | 46,984 | | 745,499 |
Reliance Communication Ltd. | 150,854 | | 2,993,300 |
Reliance Industries Ltd. | 127,746 | | 9,118,526 |
Common Stocks - continued |
| Shares | | Value |
India - continued |
Royal Orchid Hotels Ltd. | 132,311 | | $ 437,669 |
Sesa Goa Ltd. | 7,646 | | 732,468 |
State Bank of India | 60,830 | | 3,816,763 |
TOTAL INDIA | | 33,400,389 |
Indonesia - 2.0% |
PT Bank Central Asia Tbk | 500,000 | | 408,072 |
PT Bank Niaga Tbk | 20,648,000 | | 1,989,387 |
PT Indosat Tbk | 1,500,000 | | 1,452,453 |
PT Mitra Adiperkasa Tbk | 2,913,500 | | 256,878 |
PT Perusahaan Gas Negara Tbk Series B | 1,800,000 | | 2,820,911 |
TOTAL INDONESIA | | 6,927,701 |
Korea (South) - 21.9% |
Daelim Industrial Co. | 16,000 | | 3,516,387 |
Dongbu Securities Co. Ltd. | 31,200 | | 654,954 |
Doosan Infracore Co. Ltd. | 40,000 | | 1,702,404 |
Hana Tour Service, Inc. | 29,000 | | 2,615,374 |
Hanwha Corp. | 20,000 | | 1,985,281 |
Hanwha Securities Co. Ltd. | 80,000 | | 2,421,877 |
Hyundai Mipo Dockyard Co. Ltd. | 7,680 | | 3,412,630 |
kiwoom.com Securities Co. Ltd. | 11,500 | | 1,109,803 |
Kookmin Bank | 49,140 | | 4,018,864 |
Korea Exchange Bank | 70,000 | | 1,157,895 |
Korean Reinsurance Co. | 36,000 | | 642,227 |
LG Chemical Ltd. | 12,000 | | 1,499,721 |
LG Household & Health Care Ltd. | 17,000 | | 3,790,242 |
LG.Philips LCD Co. Ltd. (a) | 17,170 | | 948,654 |
Meritz Securities Co. Ltd. | 93,659 | | 1,209,438 |
NHN Corp. (a) | 16,319 | | 5,247,834 |
POSCO | 14,372 | | 10,481,714 |
Samsung Corp. | 6,790 | | 628,477 |
Samsung Electronics Co. Ltd. | 17,317 | | 10,678,814 |
Samsung Fire & Marine Insurance Co. Ltd. | 10,000 | | 2,782,303 |
Shinhan Financial Group Co. Ltd. | 104,960 | | 6,873,306 |
Shinsegae Co. Ltd. | 2,000 | | 1,575,980 |
STX Pan Ocean Co. Ltd. | 700,000 | | 1,800,666 |
Taewoong Co. Ltd. | 50,000 | | 7,145,983 |
TSM Tech Co. Ltd. | 15,300 | | 299,881 |
TOTAL KOREA (SOUTH) | | 78,200,709 |
Malaysia - 2.7% |
Bumiputra-Commerce Holdings Bhd | 550,000 | | 1,912,783 |
Common Stocks - continued |
| Shares | | Value |
Malaysia - continued |
Hunza Properties Bhd | 342,100 | | $ 294,442 |
LCL Corp. Bhd | 468,900 | | 1,051,894 |
Malayan Banking BHD | 510,000 | | 1,723,728 |
Parkson Holdings Bhd | 300,000 | | 865,557 |
Resorts World Bhd | 1,264,700 | | 1,465,247 |
SP Setia Bhd | 600,000 | | 1,412,414 |
Zelan Bhd | 400,000 | | 726,235 |
TOTAL MALAYSIA | | 9,452,300 |
Papua New Guinea - 0.7% |
Lihir Gold Ltd. (a) | 650,000 | | 2,580,578 |
Philippines - 0.6% |
Jollibee Food Corp. | 700,000 | | 822,107 |
Philippine Long Distance Telephone Co. | 18,580 | | 1,285,732 |
TOTAL PHILIPPINES | | 2,107,839 |
Singapore - 4.4% |
Cosco Corp. Singapore Ltd. | 500,000 | | 2,715,397 |
F J Benjamin Holdings Ltd. | 1,800,000 | | 1,058,280 |
Keppel Corp. Ltd. | 190,000 | | 1,953,035 |
Parkway Holdings Ltd. | 685,650 | | 1,988,616 |
Raffles Medical Group Ltd. | 700,000 | | 744,751 |
SIA Engineering Co. Ltd. | 261,000 | | 858,493 |
Singapore Technologies Engineering Ltd. | 700,000 | | 1,851,848 |
United Overseas Bank Ltd. | 115,000 | | 1,725,144 |
Yangzijiang Shipbuilding Holdings Ltd. | 1,501,000 | | 2,673,028 |
TOTAL SINGAPORE | | 15,568,592 |
Taiwan - 14.1% |
Advanced Semiconductor Engineering, Inc. | 1,664,501 | | 2,004,059 |
Advantech Co. Ltd. | 105,297 | | 285,386 |
AU Optronics Corp. | 892,930 | | 1,901,904 |
China Steel Corp. | 2,165,000 | | 3,047,507 |
Chinatrust Financial Holding Co. Ltd. (a) | 1,420,319 | | 1,034,713 |
Chinatrust Financial Holding Co. Ltd. warrants (UBS Warrant Programme) 2/8/08 (a) | 254,240 | | 185,193 |
Delta Electronics, Inc. | 441,000 | | 1,769,718 |
E-Life Mall Corp. Ltd. | 258,030 | | 517,733 |
EVA Airways Corp. | 2,117,592 | | 853,051 |
Far East Department Stores Co. Ltd. | 1,248,000 | | 1,521,716 |
Far Eastern Textile Ltd. | 1,910,620 | | 2,524,295 |
Formosa International Hotel Corp. | 12,260 | | 121,105 |
Common Stocks - continued |
| Shares | | Value |
Taiwan - continued |
Formosa Plastics Corp. | 750,000 | | $ 2,310,542 |
Fuhwa Financial Holding Co. Ltd. (a) | 3,702,054 | | 2,719,830 |
Hung Poo Real Estate Development Co. Ltd. | 606,000 | | 602,352 |
Les Enphants Co. Ltd. | 1,200,000 | | 1,016,824 |
MediaTek, Inc. | 206,850 | | 4,041,860 |
Nan Ya Plastics Corp. | 1,143,000 | | 3,411,888 |
Nan Ya Printed Circuit Board Corp. | 399,283 | | 2,619,158 |
Phoenix Precision Technology Corp. | 1,956,938 | | 2,470,714 |
Shin Kong Financial Holding Co. Ltd. warrants (UBS Warrant Programme) 11/19/07 (a) | 1,050,703 | | 972,903 |
Siliconware Precision Industries Co. Ltd. | 611,837 | | 1,289,967 |
Sinyi Realty, Inc. | 460,243 | | 1,221,821 |
Taiwan Cement Corp. | 1,465,679 | | 2,497,468 |
Taiwan Semiconductor Manufacturing Co. Ltd. | 2,617,140 | | 5,154,299 |
Tsann Kuen Enterprise Co. Ltd. | 800,000 | | 1,215,002 |
Wistron Corp. | 472,338 | | 940,448 |
WPG Holding Co. Ltd. | 1,000,000 | | 1,651,489 |
Yageo Corp. | 908,000 | | 354,567 |
TOTAL TAIWAN | | 50,257,512 |
Thailand - 1.9% |
ACL Bank PCL (For. Reg.) (a) | 1,017,800 | | 175,199 |
Bumrungrad Hospital PCL (For. Reg.) | 1,068,700 | | 1,391,496 |
Central Pattana PCL (For. Reg.) | 2,000,000 | | 1,515,374 |
LPN Development PCL | 3,000,000 | | 754,745 |
Minor International PCL (For. Reg.) | 2,119,908 | | 1,110,324 |
Robinson Department Store PCL (For. Reg.) | 2,500,000 | | 750,331 |
Siam Commercial Bank PCL (For. Reg.) | 400,000 | | 1,118,140 |
True Corp. PCL (For. Reg.) rights 4/30/08 (a) | 190,863 | | 0 |
TOTAL THAILAND | | 6,815,609 |
TOTAL COMMON STOCKS (Cost $217,355,805) | 343,553,509 |
Money Market Funds - 3.4% |
| Shares | | Value |
Fidelity Cash Central Fund, 4.97% (b) | 11,913,545 | | $ 11,913,545 |
Fidelity Securities Lending Cash Central Fund, 5.02% (b)(c) | 357,750 | | 357,750 |
TOTAL MONEY MARKET FUNDS (Cost $12,271,295) | 12,271,295 |
TOTAL INVESTMENT PORTFOLIO - 99.8% (Cost $229,627,100) | | 355,824,804 |
NET OTHER ASSETS - 0.2% | | 762,792 |
NET ASSETS - 100% | $ 356,587,596 |
Legend |
(a) Non-income producing |
(b) Affiliated fund that is available only to investment companies and other accounts managed by Fidelity Investments. The rate quoted is the annualized seven-day yield of the fund at period end. A complete unaudited listing of the fund's holdings as of its most recent quarter end is available upon request. |
(c) Investment made with cash collateral received from securities on loan. |
(d) Security or a portion of the security is on loan at period end. |
(e) Security exempt from registration under Rule 144A of the Securities Act of 1933. These securities may be resold in transactions exempt from registration, normally to qualified institutional buyers. At the end of the period, the value of these securities amounted to $750,284 or 0.2% of net assets. |
Affiliated Central Funds |
Information regarding fiscal year to date income earned by the Fund from investments in Fidelity Central Funds is as follows: |
Fund | Income earned |
Fidelity Cash Central Fund | $ 577,405 |
Fidelity Securities Lending Cash Central Fund | 3,118 |
Total | $ 580,523 |
See accompanying notes which are an integral part of the financial statements.
Annual Report
Financial Statements
Statement of Assets and Liabilities
| October 31, 2007 |
Assets | | |
Investment in securities, at value (including securities loaned of $357,840) - See accompanying schedule: Unaffiliated issuers (cost $217,355,805) | $ 343,553,509 | |
Fidelity Central Funds (cost $12,271,295) | 12,271,295 | |
Total Investments (cost $229,627,100) | | $ 355,824,804 |
Foreign currency held at value (cost $298) | | 305 |
Receivable for investments sold | | 151,760 |
Receivable for fund shares sold | | 2,532,200 |
Dividends receivable | | 129,136 |
Distributions receivable from Fidelity Central Funds | | 84,252 |
Prepaid expenses | | 56 |
Other receivables | | 388,407 |
Total assets | | 359,110,920 |
| | |
Liabilities | | |
Payable for investments purchased | $ 83,393 | |
Payable for fund shares redeemed | 1,519,087 | |
Accrued management fee | 211,619 | |
Distribution fees payable | 146,308 | |
Other affiliated payables | 74,315 | |
Other payables and accrued expenses | 130,852 | |
Collateral on securities loaned, at value | 357,750 | |
Total liabilities | | 2,523,324 |
| | |
Net Assets | | $ 356,587,596 |
Net Assets consist of: | | |
Paid in capital | | $ 194,717,799 |
Undistributed net investment income | | 1,229,931 |
Accumulated undistributed net realized gain (loss) on investments and foreign currency transactions | | 34,394,993 |
Net unrealized appreciation (depreciation) on investments and assets and liabilities in foreign currencies | | 126,244,873 |
Net Assets | | $ 356,587,596 |
See accompanying notes which are an integral part of the financial statements.
Annual Report
Statement of Assets and Liabilities - continued
| October 31, 2007 |
Calculation of Maximum Offering Price
Class A:
Net Asset Value and redemption price per share ($152,629,813 ÷ 4,064,942 shares) | | $ 37.55 |
| | |
Maximum offering price per share (100/94.25 of $37.55) | | $ 39.84 |
Class T:
Net Asset Value and redemption price per share ($64,812,780 ÷ 1,757,472 shares) | | $ 36.88 |
| | |
Maximum offering price per share (100/96.50 of $36.88) | | $ 38.22 |
Class B:
Net Asset Value and offering price per share ($40,775,176 ÷ 1,146,861 shares)A | | $ 35.55 |
| | |
Class C:
Net Asset Value and offering price per share ($82,069,519 ÷ 2,313,403 shares)A | | $ 35.48 |
| | |
| | |
Institutional Class:
Net Asset Value, offering price and redemption price per share ($16,300,308 ÷ 426,175 shares) | | $ 38.25 |
A Redemption price per share is equal to net asset value less any applicable contingent deferred sales charge.
See accompanying notes which are an integral part of the financial statements.
Annual Report
Financial Statements - continued
Statement of Operations
| Year ended October 31, 2007 |
Investment Income | | |
Dividends | | $ 4,959,878 |
Interest | | 123 |
Income from Fidelity Central Funds | | 580,523 |
| | 5,540,524 |
Less foreign taxes withheld | | (556,806) |
Total income | | 4,983,718 |
| | |
Expenses | | |
Management fee | $ 1,542,886 | |
Transfer agent fees | 590,425 | |
Distribution fees | 1,202,317 | |
Accounting and security lending fees | 113,535 | |
Custodian fees and expenses | 268,641 | |
Independent trustees' compensation | 687 | |
Registration fees | 69,881 | |
Audit | 122,539 | |
Legal | 1,283 | |
Miscellaneous | (464) | |
Total expenses before reductions | 3,911,730 | |
Expense reductions | (188,614) | 3,723,116 |
Net investment income (loss) | | 1,260,602 |
Realized and Unrealized Gain (Loss) Net realized gain (loss) on: | | |
Investment securities: | | |
Unaffiliated issuers | 35,116,360 | |
Foreign currency transactions | 7,539 | |
Total net realized gain (loss) | | 35,123,899 |
Change in net unrealized appreciation (depreciation) on: Investment securities | 100,705,699 | |
Assets and liabilities in foreign currencies | 46,677 | |
Total change in net unrealized appreciation (depreciation) | | 100,752,376 |
Net gain (loss) | | 135,876,275 |
Net increase (decrease) in net assets resulting from operations | | $ 137,136,877 |
See accompanying notes which are an integral part of the financial statements.
Annual Report
Statement of Changes in Net Assets
| Year ended
October 31,
2007 | Year ended
October 31,
2006 |
Increase (Decrease) in Net Assets | | |
Operations | | |
Net investment income (loss) | $ 1,260,602 | $ 874,526 |
Net realized gain (loss) | 35,123,899 | 12,459,470 |
Change in net unrealized appreciation (depreciation) | 100,752,376 | 17,978,097 |
Net increase (decrease) in net assets resulting
from operations | 137,136,877 | 31,312,093 |
Distributions to shareholders from net investment income | (705,473) | (546,550) |
Distributions to shareholders from net realized gain | (11,219,115) | (6,267,718) |
Total distributions | (11,924,588) | (6,814,268) |
Share transactions - net increase (decrease) | 89,486,791 | 42,747,494 |
Redemption fees | 131,185 | 69,319 |
Total increase (decrease) in net assets | 214,830,265 | 67,314,638 |
| | |
Net Assets | | |
Beginning of period | 141,757,331 | 74,442,693 |
End of period (including undistributed net investment income of $1,229,931 and undistributed net investment income of $779,401, respectively) | $ 356,587,596 | $ 141,757,331 |
See accompanying notes which are an integral part of the financial statements.
Annual Report
Financial Highlights - Class A
Years ended October 31, | 2007 | 2006 | 2005 | 2004 | 2003 |
Selected Per-Share Data | | | | | |
Net asset value, beginning of period | $ 22.48 | $ 17.70 | $ 13.96 | $ 13.07 | $ 9.89 |
Income from Investment Operations | | | | | |
Net investment income (loss) C | .24 | .22 | .18 | .03 | .07 |
Net realized and unrealized gain (loss) | 16.64 | 6.10 | 3.61 | 1.00 H | 3.11 |
Total from investment operations | 16.88 | 6.32 | 3.79 | 1.03 | 3.18 |
Distributions from net investment income | (.15) | (.16) | - | (.15) | - |
Distributions from net realized gain | (1.68) | (1.39) | (.05) | - | - |
Total distributions | (1.83) | (1.55) | (.05) | (.15) | - |
Redemption fees added to paid in capital C | .02 | .01 | - G | .01 | - |
Net asset value, end of period | $ 37.55 | $ 22.48 | $ 17.70 | $ 13.96 | $ 13.07 |
Total Return A, B | 80.43% | 38.02% | 27.23% | 8.01%H | 32.15% |
Ratios to Average Net Assets D, F | | | | | |
Expenses before reductions | 1.47% | 1.73% | 1.90% | 2.24% | 2.81% |
Expenses net of fee waivers, if any | 1.47% | 1.50% | 1.61% | 2.00% | 2.02% |
Expenses net of all reductions | 1.40% | 1.39% | 1.55% | 1.99% | 2.02% |
Net investment income (loss) | .88% | 1.08% | 1.08% | .21% | .70% |
Supplemental Data | | | | | |
Net assets, end of period (000 omitted) | $ 152,630 | $55,790 | $30,782 | $21,099 | $24,161 |
Portfolio turnover rate E | 66% | 77% | 66% | 232% | 172% |
A Total returns would have been lower had certain expenses not been reduced during the periods shown.
B Total returns do not include the effect of the sales charges.
C Calculated based on average shares outstanding during the period.
D Fees and expenses of the underlying Fidelity Central Funds are not included in the Fund's expense ratio. The Fund indirectly bears its proportionate share of the expenses of any underlying Fidelity Central Funds.
E Amount does not include the portfolio activity of any underlying Fidelity Central Funds.
F Expense ratios reflect operating expenses of the class. Expenses before reductions do not reflect amounts reimbursed by the investment adviser or reductions from brokerage service arrangements or other expense offset arrangements and do not represent the amount paid by the class during periods when reimbursements or reductions occur. Expenses net of fee waivers reflect expenses after reimbursement by the investment adviser but prior to reductions from brokerage service arrangements or other expense offset arrangements. Expenses net of all reductions represent the net expenses paid by the class.
G Amount represents less than $.01 per share.
H In 2004 the Fund received a favorable ruling in India which entitles the Fund to a refund of capital gains taxes paid in the current and prior years. The impact to the Fund was an increase in realized and unrealized gain (loss) per share of $.51. Excluding this benefit, the total return would have been 4.18%. The realized and unrealized gains were allocated on a pro rata basis to each class based on the relative net assets of each class to the total net assets of the Fund.
See accompanying notes which are an integral part of the financial statements.
Annual Report
Financial Highlights - Class T
Years ended October 31, | 2007 | 2006 | 2005 | 2004 | 2003 |
Selected Per-Share Data | | | | | |
Net asset value, beginning of period | $ 22.13 | $ 17.45 | $ 13.80 | $ 12.92 | $ 9.81 |
Income from Investment Operations | | | | | |
Net investment income (loss) C | .16 | .17 | .14 | - | .05 |
Net realized and unrealized gain (loss) | 16.37 | 6.01 | 3.56 | .99 H | 3.06 |
Total from investment operations | 16.53 | 6.18 | 3.70 | .99 | 3.11 |
Distributions from net investment income | (.12) | (.12) | - | (.12) | - |
Distributions from net realized gain | (1.68) | (1.39) | (.05) | - | - |
Total distributions | (1.80) | (1.51) | (.05) | (.12) | - |
Redemption fees added to paid in capital C | .02 | .01 | - G | .01 | - |
Net asset value, end of period | $ 36.88 | $ 22.13 | $ 17.45 | $ 13.80 | $ 12.92 |
Total Return A, B | 79.98% | 37.69% | 26.89% | 7.78% H | 31.70% |
Ratios to Average Net Assets D, F | | | | | |
Expenses before reductions | 1.79% | 2.07% | 2.27% | 2.76% | 3.43% |
Expenses net of fee waivers, if any | 1.75% | 1.75% | 1.84% | 2.25% | 2.27% |
Expenses net of all reductions | 1.67% | 1.64% | 1.79% | 2.24% | 2.26% |
Net investment income (loss) | .61% | .83% | .85% | (.04)% | .45% |
Supplemental Data | | | | | |
Net assets, end of period (000 omitted) | $ 64,813 | $ 28,850 | $ 14,074 | $ 7,658 | $ 4,982 |
Portfolio turnover rate E | 66% | 77% | 66% | 232% | 172% |
A Total returns would have been lower had certain expenses not been reduced during the periods shown.
B Total returns do not include the effect of the sales charges.
C Calculated based on average shares outstanding during the period.
D Fees and expenses of the underlying Fidelity Central Funds are not included in the Fund's expense ratio. The Fund indirectly bears its proportionate share of the expenses of any underlying Fidelity Central Funds.
E Amount does not include the portfolio activity of any underlying Fidelity Central Funds.
F Expense ratios reflect operating expenses of the class. Expenses before reductions do not reflect amounts reimbursed by the investment adviser or reductions from brokerage service arrangements or other expense offset arrangements and do not represent the amount paid by the class during periods when reimbursements or reductions occur. Expenses net of fee waivers reflect expenses after reimbursement by the investment adviser but prior to reductions from brokerage service arrangements or other expense offset arrangements. Expenses net of all reductions represent the net expenses paid by the class.
G Amount represents less than $.01 per share.
H In 2004 the Fund received a favorable ruling in India which entitles the Fund to a refund of capital gains taxes paid in the current and prior years. The impact to the Fund was an increase in realized and unrealized gain (loss) per share of $.51. Excluding this benefit, the total return would have been 4.18%. The realized and unrealized gains were allocated on a pro rata basis to each class based on the relative net assets of each class to the total net assets of the Fund.
See accompanying notes which are an integral part of the financial statements.
Annual Report
Financial Highlights - Class B
Years ended October 31, | 2007 | 2006 | 2005 | 2004 | 2003 |
Selected Per-Share Data | | | | | |
Net asset value, beginning of period | $ 21.42 | $ 16.94 | $ 13.46 | $ 12.64 | $ 9.63 |
Income from Investment Operations | | | | | |
Net investment income (loss) C | .03 | .06 | .06 | (.07) | (.01) |
Net realized and unrealized gain (loss) | 15.79 | 5.84 | 3.47 | .96 H | 3.02 |
Total from investment operations | 15.82 | 5.90 | 3.53 | .89 | 3.01 |
Distributions from net investment income | (.03) | (.04) | - | (.08) | - |
Distributions from net realized gain | (1.68) | (1.39) | (.05) | - | - |
Total distributions | (1.71) | (1.43) | (.05) | (.08) | - |
Redemption fees added to paid in capital C | .02 | .01 | - G | .01 | - |
Net asset value, end of period | $ 35.55 | $ 21.42 | $ 16.94 | $ 13.46 | $ 12.64 |
Total Return A, B | 79.01% | 36.99% | 26.31% | 7.14% H | 31.26% |
Ratios to Average Net Assets D, F | | | | | |
Expenses before reductions | 2.28% | 2.59% | 2.75% | 3.19% | 3.87% |
Expenses net of fee waivers, if any | 2.25% | 2.25% | 2.35% | 2.75% | 2.77% |
Expenses net of all reductions | 2.17% | 2.14% | 2.29% | 2.74% | 2.77% |
Net investment income (loss) | .11% | .33% | .34% | (.54)% | (.05)% |
Supplemental Data | | | | | |
Net assets, end of period (000 omitted) | $ 40,775 | $ 18,985 | $ 11,504 | $ 7,065 | $ 5,157 |
Portfolio turnover rate E | 66% | 77% | 66% | 232% | 172% |
A Total returns would have been lower had certain expenses not been reduced during the periods shown.
B Total returns do not include the effect of the contingent deferred sales charge.
C Calculated based on average shares outstanding during the period.
D Fees and expenses of the underlying Fidelity Central Funds are not included in the Fund's expense ratio. The Fund indirectly bears its proportionate share of the expenses of any underlying Fidelity Central Funds.
E Amount does not include the portfolio activity of any underlying Fidelity Central Funds.
F Expense ratios reflect operating expenses of the class. Expenses before reductions do not reflect amounts reimbursed by the investment adviser or reductions from brokerage service arrangements or other expense offset arrangements and do not represent the amount paid by the class during periods when reimbursements or reductions occur. Expenses net of fee waivers reflect expenses after reimbursement by the investment adviser but prior to reductions from brokerage service arrangements or other expense offset arrangements. Expenses net of all reductions represent the net expenses paid by the class.
G Amount represents less than $.01 per share.
H In 2004 the Fund received a favorable ruling in India which entitles the Fund to a refund of capital gains taxes paid in the current and prior years. The impact to the Fund was an increase in realized and unrealized gain (loss) per share of $.51. Excluding this benefit, the total return would have been 4.18%. The realized and unrealized gains were allocated on a pro rata basis to each class based on the relative net assets of each class to the total net assets of the Fund.
See accompanying notes which are an integral part of the financial statements.
Annual Report
Financial Highlights - Class C
Years ended October 31, | 2007 | 2006 | 2005 | 2004 | 2003 |
Selected Per-Share Data | | | | | |
Net asset value, beginning of period | $ 21.39 | $ 16.94 | $ 13.46 | $ 12.65 | $ 9.64 |
Income from Investment Operations | | | | | |
Net investment income (loss) C | .04 | .06 | .06 | (.07) | (.01) |
Net realized and unrealized gain (loss) | 15.76 | 5.84 | 3.47 | .96 H | 3.02 |
Total from investment operations | 15.80 | 5.90 | 3.53 | .89 | 3.01 |
Distributions from net investment income | (.05) | (.07) | - | (.09) | - |
Distributions from net realized gain | (1.68) | (1.39) | (.05) | - | - |
Total distributions | (1.73) | (1.46) | (.05) | (.09) | - |
Redemption fees added to paid in capital C | .02 | .01 | - G | .01 | - |
Net asset value, end of period | $ 35.48 | $ 21.39 | $ 16.94 | $ 13.46 | $ 12.65 |
Total Return A, B | 79.05% | 37.02% | 26.31% | 7.14%H | 31.22% |
Ratios to Average Net Assets D, F | | | | | |
Expenses before reductions | 2.21% | 2.46% | 2.67% | 3.02% | 3.70% |
Expenses net of fee waivers, if any | 2.21% | 2.25% | 2.34% | 2.75% | 2.77% |
Expenses net of all reductions | 2.13% | 2.14% | 2.28% | 2.74% | 2.76% |
Net investment income (loss) | .14% | .33% | .35% | (.54)% | (.05)% |
Supplemental Data | | | | | |
Net assets, end of period (000 omitted) | $82,070 | $33,047 | $13,291 | $ 6,484 | $ 4,581 |
Portfolio turnover rate E | 66% | 77% | 66% | 232% | 172% |
A Total returns would have been lower had certain expenses not been reduced during the periods shown.
B Total returns do not include the effect of the contingent deferred sales charge.
C Calculated based on average shares outstanding during the period.
D Fees and expenses of the underlying Fidelity Central Funds are not included in the Fund's expense ratio. The Fund indirectly bears its proportionate share of the expenses of any underlying Fidelity Central Funds.
E Amount does not include the portfolio activity of any underlying Fidelity Central Funds.
F Expense ratios reflect operating expenses of the class. Expenses before reductions do not reflect amounts reimbursed by the investment adviser or reductions from brokerage service arrangements or other expense offset arrangements and do not represent the amount paid by the class during periods when reimbursements or reductions occur. Expenses net of fee waivers reflect expenses after reimbursement by the investment adviser but prior to reductions from brokerage service arrangements or other expense offset arrangements. Expenses net of all reductions represent the net expenses paid by the class.
G Amount represents less than $.01 per share.
H In 2004 the Fund received a favorable ruling in India which entitles the Fund to a refund of capital gains taxes paid in the current and prior years. The impact to the Fund was an increase in realized and unrealized gain (loss) per share of $.51. Excluding this benefit, the total return would have been 4.18%. The realized and unrealized gains were allocated on a pro rata basis to each class based on the relative net assets of each class to the total net assets of the Fund.
See accompanying notes which are an integral part of the financial statements.
Annual Report
Financial Highlights - Institutional Class
Years ended October 31, | 2007 | 2006 | 2005 | 2004 | 2003 |
Selected Per-Share Data | | | | | |
Net asset value, beginning of period | $ 22.84 | $ 17.97 | $ 14.13 | $ 13.20 | $ 9.97 |
Income from Investment Operations | | | | | |
Net investment income (loss) | .34 | .27 | .24 | .06 | .10 |
Net realized and unrealized gain (loss) B | 16.92 | 6.19 | 3.65 | 1.01 G | 3.13 |
Total from investment operations | 17.26 | 6.46 | 3.89 | 1.07 | 3.23 |
Distributions from net investment income | (.19) | (.21) | - | (.15) | - |
Distributions from net realized gain | (1.68) | (1.39) | (.05) | - | - |
Total distributions | (1.87) | (1.60) | (.05) | (.15) | - |
Redemption fees added to paid in capital B | .02 | .01 | - F | .01 | - |
Net asset value, end of period | $ 38.25 | $ 22.84 | $ 17.97 | $ 14.13 | $ 13.20 |
Total Return A | 80.97% | 38.28% | 27.61% | 8.24% G | 32.40% |
Ratios to Average Net AssetsC, E | | | | |
Expenses before reductions | 1.16% | 1.41% | 1.52% | 2.11% | 2.55% |
Expenses net of fee waivers, if any | 1.16% | 1.25% | 1.29% | 1.75% | 1.77% |
Expenses net of all reductions | 1.08% | 1.14% | 1.24% | 1.74% | 1.77% |
Net investment income (loss) | 1.20% | 1.33% | 1.40% | .46% | .94% |
Supplemental Data | | | | | |
Net assets, end of period (000 omitted) | $16,300 | $ 5,086 | $ 4,791 | $ 452 | $ 1,538 |
Portfolio turnover rate D | 66% | 77% | 66% | 232% | 172% |
A Total returns would have been lower had certain expenses not been reduced during the periods shown.
B Calculated based on average shares outstanding during the period.
C Fees and expenses of the underlying Fidelity Central Funds are not included in the Fund's expense ratio. The Fund indirectly bears its proportionate share of the expenses of any underlying Fidelity Central Funds.
D Amount does not include the portfolio activity of any underlying Fidelity Central Funds.
E Expense ratios reflect operating expenses of the class. Expenses before reductions do not reflect amounts reimbursed by the investment adviser or reductions from brokerage service arrangements or other expense offset arrangements and do not represent the amount paid by the class during periods when reimbursements or reductions occur. Expenses net of fee waivers reflect expenses after reimbursement by the investment adviser but prior to reductions from brokerage service arrangements or other expense offset arrangements. Expenses net of all reductions represent the net expenses paid by the class.
F Amount represents less than $.01 per share.
G In 2004 the Fund received a favorable ruling in India which entitles the Fund to a refund of capital gains taxes paid in the current and prior years. The impact to the Fund was an increase in realized and unrealized gain (loss) per share of $.51. Excluding this benefit, the total return would have been 4.18%. The realized and unrealized gains were allocated on a pro rata basis to each class based on the relative net assets of each class to the total net assets of the Fund.
See accompanying notes which are an integral part of the financial statements.
Annual Report
Notes to Financial Statements
For the period ended October 31, 2007
1. Organization.
Fidelity Advisor Emerging Asia Fund (the Fund) is a fund of Fidelity Advisor Series VIII (the trust) and is authorized to issue an unlimited number of shares. The trust is registered under the Investment Company Act of 1940, as amended (the 1940 Act), as an open-end management investment company organized as a Massachusetts business trust. The Fund offers Class A, Class T, Class B, Class C, and Institutional Class shares, each of which has equal rights as to assets and voting privileges. Each class has exclusive voting rights with respect to matters that affect that class. Class B shares will automatically convert to Class A shares after a holding period of seven years from the initial date of purchase. Investment income, realized and unrealized capital gains and losses, the common expenses of the Fund, and certain fund-level expense reductions, if any, are allocated on a pro rata basis to each class based on the relative net assets of each class to the total net assets of the Fund. Each class differs with respect to transfer agent and distribution and service plan fees incurred. Certain expense reductions also differ by class. The Fund's investments in emerging markets can be subject to social, economic, regulatory, and political uncertainties and can be extremely volatile.
2. Investments in Fidelity Central Funds.
The Fund may invest in Fidelity Central Funds, which are open-end investment companies available only to other investment companies and accounts managed by Fidelity Management & Research Company (FMR) and its affiliates. The Fund's Schedule of Investments lists each of the Fidelity Central Funds as an investment of the Fund, but does not include the underlying holdings of each Fidelity Central Fund. As an Investing Fund, the Fund indirectly bears its proportionate share of the expenses of the underlying Fidelity Central Funds.
The Money Market Central Funds seek preservation of capital and current income and are managed by Fidelity Investments Money Management, Inc. (FIMM), an affiliate of FMR.
A complete list of holdings for each Fidelity Central Fund is available upon request or at the SEC's web site at www.sec.gov. In addition, the financial statements of the Fidelity Central Funds, which are not covered by the Fund's Report of Independent Registered Public Accounting Firm, are available on the SEC's web site or upon request.
3. Significant Accounting Policies.
The financial statements have been prepared in conformity with accounting principles generally accepted in the United States of America, which require management to make certain estimates and assumptions at the date of the financial statements. The following summarizes the significant accounting policies of the Fund:
Annual Report
Notes to Financial Statements - continued
3. Significant Accounting Policies - continued
Security Valuation. Investments are valued and net asset value (NAV) per share is calculated (NAV calculation) as of the close of business of the New York Stock Exchange (NYSE), normally 4:00 p.m. Eastern time. Wherever possible, the Fund uses independent pricing services approved by the Board of Trustees to value its investments.
Equity securities, including restricted securities, for which market quotations are readily available, are valued at the last reported sale price or official closing price as reported by an independent pricing service on the primary market or exchange on which they are traded. In the event there were no sales during the day or closing prices are not available, securities are valued at the last quoted bid price. Investments in open-end mutual funds, including the Fidelity Central Funds, are valued at their closing net asset value each business day. Short-term securities with remaining maturities of sixty days or less for which quotations are not readily available are valued at amortized cost, which approximates value.
When current market prices or quotations are not readily available or do not accurately reflect fair value, valuations may be determined in accordance with procedures adopted by the Board of Trustees. For example, when developments occur between the close of a market and the close of the NYSE that may materially affect the value of some or all of the securities, or when trading in a security is halted, those securities may be fair valued. Factors used in the determination of fair value may include monitoring news to identify significant market or security specific events such as changes in the value of U.S. securities markets, reviewing developments in foreign markets and evaluating the performance of ADRs, futures contracts and exchange-traded funds. Because the Fund's utilization of fair value pricing depends on market activity, the frequency with which fair value pricing is used cannot be predicted and may be utilized to a significant extent. The value of securities used for NAV calculation under fair value pricing may differ from published prices for the same securities.
Foreign Currency. The Fund uses foreign currency contracts to facilitate transactions in foreign-denominated securities. Losses from these transactions may arise from changes in the value of the foreign currency or if the counterparties do not perform under the contracts' terms.
Foreign-denominated assets, including investment securities, and liabilities are translated into U.S. dollars at the exchange rate at period end. Purchases and sales of investment securities, income and dividends received and expenses denominated in foreign currencies are translated into U.S. dollars at the exchange rate in effect on the transaction date.
Annual Report
3. Significant Accounting Policies - continued
Foreign Currency - continued
The effects of exchange rate fluctuations on investments are included with the net realized and unrealized gain (loss) on investment securities. Other foreign currency transactions resulting in realized and unrealized gain (loss) are disclosed separately.
Investment Transactions and Income. For financial reporting purposes, the Fund's investment holdings and NAV include trades executed through the end of the last business day of the period. The NAV for processing shareholder transactions includes trades executed through the end of the prior business day. Gains and losses on securities sold are determined on the basis of identified cost and may include proceeds received from litigation. Dividend income is recorded on the ex-dividend date, except for certain dividends from foreign securities where the ex-dividend date may have passed, which are recorded as soon as the Fund is informed of the ex-dividend date. Non-cash dividends included in dividend income, if any, are recorded at the fair market value of the securities received. Interest income and distributions from the Fidelity Central Funds are accrued as earned. Interest income includes coupon interest and amortization of premium and accretion of discount on debt securities. Investment income is recorded net of foreign taxes withheld where recovery of such taxes is uncertain.
Expenses. Most expenses of the trust can be directly attributed to a fund. Expenses which cannot be directly attributed are apportioned among each Fund in the trust. Expense estimates are accrued in the period to which they relate and adjustments are made when actual amounts are known.
Income Tax Information and Distributions to Shareholders. Each year, the Fund intends to qualify as a regulated investment company by distributing all of its taxable income and realized gains under Subchapter M of the Internal Revenue Code. As a result, no provision for income taxes is required in the accompanying financial statements. Foreign taxes are provided for based on the Fund's understanding of the tax rules and rates that exist in the foreign markets in which it invests. The Fund received a final ruling from the Authority for Advance Ruling in India regarding the applicability of taxes imposed by the country on realized capital gains under the US/India tax treaty. The ruling entitled the Fund to a refund of capital gains taxes paid in prior years and exempts the Fund from taxes on future realized gains.
The per-share and total return impacts are disclosed on the Financial Highlights. The India Central Board of Direct Taxation may challenge the ruling at any time which could result in the reversal of some or all of the benefits recorded by the Fund.
Annual Report
Notes to Financial Statements - continued
3. Significant Accounting Policies - continued
Income Tax Information and Distributions to Shareholders - continued
Distributions are recorded on the ex-dividend date. Income dividends and capital gain distributions are declared separately for each class. Income and capital gain distributions are determined in accordance with income tax regulations, which may differ from generally accepted accounting principles. In addition, the Fund will claim a portion of the payment made to redeeming shareholders as a distribution for income tax purposes.
Capital accounts within the financial statements are adjusted for permanent book-tax differences. Certain adjustments have been made to the accounts relating to prior periods. Collectively, these adjustments have no impact on net assets or the results of operations. Temporary book-tax differences will reverse in a subsequent period.
Book-tax differences are primarily due to foreign currency transactions, passive foreign investment companies (PFIC) and losses deferred due to wash sales.
The tax-basis components of distributable earnings and the federal tax cost as of period end were as follows:
Unrealized appreciation | $ 128,910,629 |
Unrealized depreciation | (2,717,654) |
Net unrealized appreciation (depreciation) | 126,192,975 |
Undistributed ordinary income | 17,464,264 |
Undistributed long-term capital gain | 13,689,563 |
Cost for federal income tax purposes | $ 229,631,829 |
The tax character of distributions paid was as follows:
| October 31, 2007 | October 31, 2006 |
Ordinary Income | $ 6,114,690 | $ 5,416,432 |
Long-term Capital Gains | 5,809,898 | 1,397,836 |
Total | $ 11,924,588 | $ 6,814,268 |
Short-Term Trading (Redemption) Fees. Shares held in the Fund less than 90 days are subject to a redemption fee equal to 1.50% of the proceeds of the redeemed shares. All redemption fees, including any estimated redemption fees paid by FMR, are retained by the Fund and accounted for as an addition to paid in capital.
Annual Report
3. Significant Accounting Policies - continued
New Accounting Pronouncements. In July 2006, Financial Accounting Standards Board Interpretation No. 48, Accounting for Uncertainty in Income Taxes - an interpretation of FASB Statement 109 (FIN 48), was issued and is effective on the last business day of the semiannual reporting period for fiscal years beginning after December 15, 2006. FIN 48 sets forth a threshold for financial statement recognition, measurement and disclosure of a tax position taken or expected to be taken on a tax return. Management has concluded that the adoption of FIN 48 will not result in a material impact on the Fund's net assets, results of operations and financial statement disclosures.
In addition, in September 2006, Statement of Financial Accounting Standards No. 157, Fair Value Measurements (SFAS 157), was issued and is effective for fiscal years beginning after November 15, 2007. SFAS 157 defines fair value, establishes a framework for measuring fair value and expands disclosures about fair value measurements. Management is currently evaluating the impact the adoption of SFAS 157 will have on the Fund's financial statement disclosures.
4. Operating Policies.
Repurchase Agreements. FMR has received an Exemptive Order from the Securities and Exchange Commission (the SEC) which permits the Fund and other affiliated entities of FMR to transfer uninvested cash balances into joint trading accounts which are then invested in repurchase agreements. The Fund may also invest directly with institutions in repurchase agreements. Repurchase agreements are collateralized by government or non-government securities. Upon settlement date, collateral is held in segregated accounts with custodian banks and may be obtained in the event of a default of the counterparty. The Fund monitors, on a daily basis, the value of the collateral to ensure it is at least equal to the principal amount of the repurchase agreement (including accrued interest). In the event of a default by the counterparty, realization of the collateral proceeds could be delayed, during which time the value of the collateral may decline.
Restricted Securities. The Fund may invest in securities that are subject to legal or contractual restrictions on resale. These securities generally may be resold in transactions exempt from registration or to the public if the securities are registered. Disposal of these securities may involve time-consuming negotiations and expense, and prompt sale at an acceptable price may be difficult. Information regarding restricted securities is included at the end of the Fund's Schedule of Investments.
5. Purchases and Sales of Investments.
Purchases and sales of securities, other than short-term securities, aggregated $210,082,807 and $135,785,532, respectively.
Annual Report
Notes to Financial Statements - continued
6. Fees and Other Transactions with Affiliates.
Management Fee. FMR and its affiliates provide the Fund with investment management related services for which the Fund pays a monthly management fee. The management fee is the sum of an individual fund fee rate that is based on an annual rate of .45% of the Fund's average net assets and a group fee rate that averaged ..26% during the period. The group fee rate is based upon the average net assets of all the mutual funds advised by FMR. The group fee rate decreases as assets under management increase and increases as assets under management decrease. For the period, the total annual management fee rate was .71% of the Fund's average net assets.
Distribution and Service Plan. In accordance with Rule 12b-1 of the 1940 Act, the Fund has adopted separate Distribution and Service Plans for each class of shares. Certain classes pay Fidelity Distributors Corporation (FDC), an affiliate of FMR, separate Distribution and Service Fees, each of which is based on an annual percentage of each class' average net assets. In addition, FDC may pay financial intermediaries for selling shares of the Fund and providing shareholder support services. For the period, the Distribution and Service Fee rates and the total amounts paid to and retained by FDC were as follows:
| Distribution
Fee | Service
Fee | Paid to
FDC | Retained
by FDC |
Class A | -% | .25% | $ 222,594 | $ 15,762 |
Class T | .25% | .25% | 210,900 | 512 |
Class B | .75% | .25% | 271,630 | 204,139 |
Class C | .75% | .25% | 497,193 | 166,040 |
| | | $ 1,202,317 | $ 386,453 |
Sales Load. FDC receives a front-end sales charge of up to 5.75% for selling Class A shares, and 3.50% for selling Class T shares, some of which is paid to financial intermediaries for selling shares of the Fund. FDC receives the proceeds of contingent deferred sales charges levied on Class A, Class T, Class B, and Class C redemptions. These charges depend on the holding period. The deferred sales charges range from 5% to 1% for Class B, 1% for Class C, 1.00% to .50% for certain purchases of Class A shares and .25% for certain purchases of Class T shares.
Annual Report
6. Fees and Other Transactions with Affiliates -continued
Sales Load - continued
For the period, sales charge amounts retained by FDC were as follows:
| Retained
by FDC |
Class A | $ 159,971 |
Class T | 28,289 |
Class B* | 46,491 |
Class C* | 29,356 |
| $ 264,107 |
* When Class B and Class C shares are initially sold, FDC pays commissions from its own resources to financial intermediaries through which the sales are made.
Transfer Agent Fees. Fidelity Investments Institutional Operations Company, Inc. (FIIOC), an affiliate of FMR, is the transfer, dividend disbursing and shareholder servicing agent for each class of the Fund. FIIOC receives account fees and asset-based fees that vary according to the account size and type of account of the shareholders of the respective classes of the Fund. FIIOC pays for typesetting, printing and mailing of shareholder reports, except proxy statements. For the period, the total transfer agent fees paid by each class to FIIOC, were as follows:
| Amount | % of
Average
Net Assets |
Class A | $ 232,327 | .26 |
Class T | 133,732 | .32 |
Class B | 83,939 | .31 |
Class C | 122,374 | .24 |
Institutional Class | 18,053 | .19 |
| $ 590,425 | |
Accounting and Security Lending Fees. Fidelity Service Company, Inc. (FSC), an affiliate of FMR, maintains the Fund's accounting records. The accounting fee is based on the level of average net assets for the month. Under a separate contract, FSC administers the security lending program. The security lending fee is based on the number and duration of lending transactions.
Annual Report
Notes to Financial Statements - continued
7. Committed Line of Credit.
The Fund participates with other funds managed by FMR in a $4.2 billion credit facility (the "line of credit") to be utilized for temporary or emergency purposes to fund shareholder redemptions or for other short-term liquidity purposes. The Fund has agreed to pay commitment fees on its pro rata portion of the line of credit, which amounted to $412 and is reflected in Miscellaneous Expense on the Statement of Operations. During the period, there were no borrowings on this line of credit.
8. Security Lending.
The Fund lends portfolio securities from time to time in order to earn additional income. On the settlement date of the loan, the Fund receives collateral (in the form of U.S. Treasury obligations, letters of credit and/or cash) against the loaned securities and maintains collateral in an amount not less than 100% of the market value of the loaned securities during the period of the loan. The market value of the loaned securities is determined at the close of business of the Fund and any additional required collateral is delivered to the Fund on the next business day. If the borrower defaults on its obligation to return the securities loaned because of insolvency or other reasons, a fund could experience delays and costs in recovering the securities loaned or in gaining access to the collateral. Any cash collateral received is invested in the Fidelity Securities Lending Cash Central Fund. The value of loaned securities and cash collateral at period end are disclosed on the Fund's Statement of Assets and Liabilities. Security lending income represents the income earned on investing cash collateral, less fees and expenses associated with the loan, plus any premium payments that may be received on the loan of certain types of securities. Security lending income is presented in the Statement of Operations as a component of income from Fidelity Central Funds. Net income from lending portfolio securities during the period amounted to $3,118.
9. Expense Reductions.
FMR voluntarily agreed to reimburse each class to the extent annual operating expenses exceeded certain levels of average net assets as noted in the table below. Some expenses, for example interest expense, including commitment fees, are excluded from this reimbursement.
The following classes were in reimbursement during the period:
| Expense
Limitations | Reimbursement
from adviser |
Class T | 1.75% | $ 16,852 |
Class B | 2.25% | 8,867 |
| | $ 25,719 |
Annual Report
9. Expense Reductions - continued
Many of the brokers with whom FMR places trades on behalf of the Fund provided services to the Fund in addition to trade execution. These services included payments of certain expenses on behalf of the Fund totaling $159,250 for the period. In addition, through arrangements with the Fund's custodian and each class' transfer agent, credits realized as a result of uninvested cash balances were used to reduce the Fund's expenses. During the period, these credits reduced the Fund's custody expenses by $3,149. During the period, credits reduced each class' transfer agent expense as noted in the table below.
| Transfer Agent
expense reduction | |
Institutional Class | $ 198 | |
10. Other.
The Fund's organizational documents provide former and current trustees and officers with a limited indemnification against liabilities arising in connection with the performance of their duties to the Fund. In the normal course of business, the Fund may also enter into contracts that provide general indemnifications. The Fund's maximum exposure under these arrangements is unknown as this would be dependent on future claims that may be made against the Fund. The risk of material loss from such claims is considered remote.
In September 2006, FIIOC, the Fund's transfer agent notified the Fund that the Fund's books and records did not reflect a conversion of certain Class B to Class A shares upon their conversion date. In March 2007, FIIOC converted the relevant Class B shares to Class A shares and recorded the conversion in the books and records of the Fund which did not result in a material impact to the Fund's reported net assets or results of operations in the accompanying financial statements. FIIOC has remediated affected shareholders and reimbursed the Fund for all related audit and legal expenses.
Annual Report
Notes to Financial Statements - continued
11. Distributions to Shareholders.
Distributions to shareholders of each class were as follows:
| Years ended October 31, |
| 2007 | 2006 |
From net investment income | | |
Class A | $ 394,476 | $ 295,895 |
Class T | 160,784 | 104,293 |
Class B | 30,252 | 29,832 |
Class C | 75,200 | 61,147 |
Institutional Class | 44,761 | 55,383 |
Total | $ 705,473 | $ 546,550 |
From net realized gain | | |
Class A | $ 4,331,516 | $ 2,523,276 |
Class T | 2,269,882 | 1,169,089 |
Class B | 1,540,071 | 987,446 |
Class C | 2,688,016 | 1,214,208 |
Institutional Class | 389,630 | 373,699 |
Total | $ 11,219,115 | $ 6,267,718 |
12. Share Transactions.
Transactions for each class of shares were as follows:
| Shares
Years ended October 31, | Dollars
Years ended October 31, |
| 2007 | 2006 | 2007 | 2006 |
Class A | | | | |
Shares sold | 2,498,533 | 1,432,952 | $ 69,396,605 | $ 29,421,074 |
Reinvestment of distributions | 162,468 | 116,289 | 3,714,012 | 2,081,564 |
Shares redeemed | (1,077,457) | (806,635) | (29,208,159) | (16,443,108) |
Net increase (decrease) | 1,583,544 | 742,606 | $ 43,902,458 | $ 15,059,530 |
Class T | | | | |
Shares sold | 905,528 | 685,045 | $ 24,631,491 | $ 13,823,730 |
Reinvestment of distributions | 96,625 | 70,928 | 2,174,062 | 1,252,594 |
Shares redeemed | (548,117) | (258,935) | (14,491,120) | (5,230,235) |
Net increase (decrease) | 454,036 | 497,038 | $ 12,314,433 | $ 9,846,089 |
Class B | | | | |
Shares sold | 582,754 | 459,438 | $ 15,102,929 | $ 9,003,547 |
Reinvestment of distributions | 65,401 | 53,748 | 1,425,750 | 922,986 |
Shares redeemed | (387,524) | (306,089) | (9,787,762) | (6,064,575) |
Net increase (decrease) | 260,631 | 207,097 | $ 6,740,917 | $ 3,861,958 |
Annual Report
12. Share Transactions - continued
| Shares
Years ended October 31, | Dollars
Years ended October 31, |
| 2007 | 2006 | 2007 | 2006 |
Class C | | | | |
Shares sold | 1,281,274 | 1,058,526 | $ 34,698,003 | $ 20,658,561 |
Reinvestment of distributions | 105,026 | 61,905 | 2,283,267 | 1,061,055 |
Shares redeemed | (618,089) | (359,640) | (16,150,431) | (7,055,090) |
Net increase (decrease) | 768,211 | 760,791 | $ 20,830,839 | $ 14,664,526 |
Institutional Class | | | | |
Shares sold | 368,744 | 167,546 | $ 10,529,830 | $ 3,548,993 |
Reinvestment of distributions | 9,931 | 19,744 | 230,692 | 358,348 |
Shares redeemed | (175,119) | (231,297) | (5,062,378) | (4,591,950) |
Net increase (decrease) | 203,556 | (44,007) | $ 5,698,144 | $ (684,609) |
13. Subsequent Event.
On December 7, 2007, the Fund acquired all of the assets and assumed all of the liabilities of Fidelity Advisor Korea Fund ("Target Fund") pursuant to an agreement and plan of reorganization approved by Target Fund shareholders on November 14, 2007. As part of the reorganization, Class A, Class T, Class B, Class C and Institutional Class shareholders of the Target Fund received shares of the corresponding class of the Fund equal in value to the shareholder's shares in the Target Fund on the date of the reorganization. The reorganization qualified as a tax-free transaction for federal income tax purposes with no gain or loss recognized by the Fund or its shareholders.
Annual Report
Report of Independent Registered Public Accounting Firm
To the Trustees of Fidelity Advisor Series VIII and the Shareholders of Fidelity Advisor Emerging Asia Fund:
In our opinion, the accompanying statement of assets and liabilities, including the schedule of investments, and the related statements of operations and of changes in net assets and the financial highlights present fairly, in all material respects, the financial position of Fidelity Advisor Emerging Asia Fund (a fund of Fidelity Advisor Series VIII) at October 31, 2007, the results of its operations for the year then ended, the changes in its net assets for each of the two years in the period then ended and the financial highlights for each of the five years in the period then ended, in conformity with accounting principles generally accepted in the United States of America. These financial statements and financial highlights (hereafter referred to as "financial statements") are the responsibility of the Fidelity Advisor Emerging Asia Fund's management. Our responsibility is to express an opinion on these financial statements based on our audits. We conducted our audits of these financial statements in accordance with the standards of the Public Company Accounting Oversight Board (United States). Those standards require that we plan and perform the audit to obtain reasonable assurance about whether the financial statements are free of material misstatement. An audit includes examining, on a test basis, evidence supporting the amounts and disclosures in the financial statements, assessing the accounting principles used and significant estimates made by management, and evaluating the overall financial statement presentation. We believe that our audits, which included confirmation of securities at October 31, 2007 by correspondence with the custodian and brokers, provide a reasonable basis for our opinion.
/s/ PricewaterhouseCoopers LLP
PricewaterhouseCoopers LLP
Boston, Massachusetts
December 19, 2007
Annual Report
Trustees and Officers
The Trustees, Members of the Advisory Board, and executive officers of the trust and fund, as applicable, are listed below. The Board of Trustees governs the fund and is responsible for protecting the interests of shareholders. The Trustees are experienced executives who meet periodically throughout the year to oversee the fund's activities, review contractual arrangements with companies that provide services to the fund, and review the fund's performance. Except for James C. Curvey, each of the Trustees oversees 370 funds advised by FMR or an affiliate. Mr. Curvey oversees 340 funds advised by FMR or an affiliate.
The Trustees hold office without limit in time except that (a) any Trustee may resign; (b) any Trustee may be removed by written instrument, signed by at least two-thirds of the number of Trustees prior to such removal; (c) any Trustee who requests to be retired or who has become incapacitated by illness or injury may be retired by written instrument signed by a majority of the other Trustees; and (d) any Trustee may be removed at any special meeting of shareholders by a two-thirds vote of the outstanding voting securities of the trust. Each Trustee who is not an interested person (as defined in the 1940 Act) (Independent Trustee), shall retire not later than the last day of the calendar year in which his or her 72nd birthday occurs. The Independent Trustees may waive this mandatory retirement age policy with respect to individual Trustees. The executive officers and Advisory Board Members hold office without limit in time, except that any officer and Advisory Board Member may resign or may be removed by a vote of a majority of the Trustees at any regular meeting or any special meeting of the Trustees. Except as indicated, each individual has held the office shown or other offices in the same company for the past five years.
The fund's Statement of Additional Information (SAI) includes more information about the Trustees. To request a free copy, call Fidelity at 1-877-208-0098.
Interested Trustees*:
Correspondence intended for each Trustee who is an interested person may be sent to Fidelity Investments, 82 Devonshire Street, Boston, Massachusetts 02109.
Name, Age; Principal Occupation |
Edward C. Johnson 3d (77) |
| Year of Election or Appointment: 1983 Mr. Johnson is Chairman of the Board of Trustees. Mr. Johnson serves as President (2006-present), Chief Executive Officer, Chairman, and a Director of FMR LLC; Chairman and a Director of FMR; Chairman and a Director of Fidelity Research & Analysis Company (FRAC); Chairman and a Director of Fidelity Investments Money Management, Inc.; and Chairman (2001-present) and a Director of FMR Co., Inc. In addition, Mr. Johnson serves as Chairman and Director of Fidelity International Limited (FIL). |
James C. Curvey (72) |
| Year of Election or Appointment: 2007 Mr. Curvey also serves as Trustee (2007-present) or Member of the Advisory Board (2007-present) of other investment companies advised by FMR. Mr. Curvey is a Director of FMR and FMR Co., Inc. (2007-
present). Mr. Curvey is also Vice Chairman (2006-present) and Director of FMR LLC. Mr. Curvey joined Fidelity in 1982 and served in numerous senior management positions, including President and Chief Operating Officer of FMR LLC (1997-2000) and President of Fidelity Strategic Investments (2000-2002). In addition, he serves as a member of the Board of Directors of Geerlings & Wade, Inc. (wine distribution). |
* Trustees have been determined to be "Interested Trustees" by virtue of, among other things, their affiliation with the trust or various entities under common control with FMR. FMR Corp. merged with FMR LLC on October 1, 2007. Any references to FMR LLC for prior periods are deemed to be references to the prior entity.
Independent Trustees:
Correspondence intended for each Independent Trustee (that is, the Trustees other than the Interested Trustees) may be sent to Fidelity Investments, P.O. Box 55235, Boston, Massachusetts 02205-5235.
Name, Age; Principal Occupation |
Dennis J. Dirks (59) |
| Year of Election or Appointment: 2005 Prior to his retirement in May 2003, Mr. Dirks was Chief Operating Officer and a member of the Board of The Depository Trust & Clearing Corporation (DTCC) (1999-2003). He also served as President, Chief Operating Officer, and Board member of The Depository Trust Company (DTC) (1999-2003) and President and Board member of the National Securities Clearing Corporation (NSCC) (1999-2003). In addition, Mr. Dirks served as Chief Executive Officer and Board member of the Government Securities Clearing Corporation (2001-
2003) and Chief Executive Officer and Board member of the Mortgage-Backed Securities Clearing Corporation (2001-2003). Mr. Dirks also serves as a Trustee and a member of the Finance Committee of Manhattan College (2005-present) and a Trustee and a member of the Finance Committee of AHRC of Nassau County (2006-present). |
Albert R. Gamper, Jr. (65) |
| Year of Election or Appointment: 2006 Prior to his retirement in December 2004, Mr. Gamper served as Chairman of the Board of CIT Group Inc. (commercial finance). During his tenure with CIT Group Inc. Mr. Gamper served in numerous senior management positions, including Chairman (1987-1989; 1999-2001; 2002-2004), Chief Executive Officer (1987-2004), and President (1989-2002). He currently serves as a member of the Board of Directors of Public Service Enterprise Group (utilities, 2001-present), Chairman of the Board of Governors, Rutgers University (2004-present), and Chairman of the Board of Saint Barnabas Health Care System. |
George H. Heilmeier (71) |
| Year of Election or Appointment: 2004 Dr. Heilmeier is Chairman Emeritus of Telcordia Technologies (communication software and systems), where prior to his retirement, he served as company Chairman and Chief Executive Officer. He currently serves on the Boards of Directors of The Mitre Corporation (systems engineering and information technology support for the government), and HRL Laboratories (private research and development, 2004-
present). He is Chairman of the General Motors Science & Technology Advisory Board and a Life Fellow of the Institute of Electrical and Electronics Engineers (IEEE). Dr. Heilmeier is a member of the Defense Science Board and the National Security Agency Advisory Board. He is also a member of the National Academy of Engineering, the American Academy of Arts and Sciences, and the Board of Overseers of the School of Engineering and Applied Science of the University of Pennsylvania. Previously, Dr. Heilmeier served as a Director of TRW Inc. (automotive, space, defense, and information technology, 1992-2002), Compaq (1994-2002), Automatic Data Processing, Inc. (ADP) (technology-based business outsourcing, 1995-2002), INET Technologies Inc. (telecommunications network surveillance, 2001-
2004), and Teletech Holdings (customer management services). He is the recipient of the 2005 Kyoto Prize in Advanced Technology for his invention of the liquid crystal display, and a member of the Consumer Electronics Hall of Fame. |
James H. Keyes (67) |
| Year of Election or Appointment: 2007 Prior to his retirement in 2003, Mr. Keyes was Chairman, President, and Chief Executive Officer of Johnson Controls, Inc. (automotive supplier, 1993-2003). He currently serves as a member of the boards of LSI Logic Corporation (semiconductor technologies), Navistar International Corporation (manufacture and sale of trucks, buses, and diesel engines, 2002-present), and Pitney Bowes, Inc. (integrated mail, messaging, and document management solutions). |
Marie L. Knowles (61) |
| Year of Election or Appointment: 2001 Prior to Ms. Knowles' retirement in June 2000, she served as Executive Vice President and Chief Financial Officer of Atlantic Richfield Company (ARCO) (diversified energy, 1996-2000). From 1993 to 1996, she was a Senior Vice President of ARCO and President of ARCO Transportation Company. She served as a Director of ARCO from 1996 to 1998. She currently serves as a Director of Phelps Dodge Corporation (copper mining and manufacturing) and McKesson Corporation (healthcare service, 2002-present). Ms. Knowles is a Trustee of the Brookings Institution and the Catalina Island Conservancy and also serves as a member of the Advisory Board for the School of Engineering of the University of Southern California. |
Ned C. Lautenbach (63) |
| Year of Election or Appointment: 2000 Mr. Lautenbach is Chairman of the Independent Trustees (2006-present). Mr. Lautenbach has been a partner of Clayton, Dubilier & Rice, Inc. (private equity investment firm) since September 1998. Previously, Mr. Lautenbach was with the International Business Machines Corporation (IBM) from 1968 until his retirement in 1998. Mr. Lautenbach serves as a Director of Sony Corporation (2006-present) and Eaton Corporation (diversified industrial) as well as the Philharmonic Center for the Arts in Naples, Florida. He also is a member of the Board of Trustees of Fairfield University (2005-present), as well as a member of the Council on Foreign Relations. |
Cornelia M. Small (63) |
| Year of Election or Appointment: 2005 Ms. Small is a member (2000-present) and Chairperson (2002-present) of the Investment Committee, and a member (2002-present) of the Board of Trustees of Smith College. Previously, she served as Chief Investment Officer (1999-2000), Director of Global Equity Investments (1996-1999), and a member of the Board of Directors of Scudder, Stevens & Clark (1990-1997) and Scudder Kemper Investments (1997-1999). In addition, Ms. Small served as Co-Chair (2000-2003) of the Annual Fund for the Fletcher School of Law and Diplomacy. |
William S. Stavropoulos (68) |
| Year of Election or Appointment: 2001 Mr. Stavropoulos is Chairman Emeritus of the Board of Directors of The Dow Chemical Company. Since joining The Dow Chemical Company in 1967, Mr. Stavropoulos served in numerous senior management positions, including President (1993-2000; 2002-2003), CEO (1995-2000; 2002-2004), and Chairman of the Executive Committee (2000-2004). Currently, he is a Director of NCR Corporation (data warehousing and technology solutions), Chemical Financial Corporation, Maersk Inc. (industrial conglomerate, 2002-present), Tyco International, Inc. (multinational manufacturing and services, 2007-present), and a member of the Advisory Board for Metalmark Capital (private equity investment firm, 2005-present). He is a special advisor to Clayton, Dubilier & Rice, Inc., a private equity investment firm. He also serves as a member of the Board of Trustees of the American Enterprise Institute for Public Policy Research. In addition, Mr. Stavropoulos is a member of The Business Council, J.P. Morgan International Council and the University of Notre Dame Advisory Council for the College of Science. |
Kenneth L. Wolfe (68) |
| Year of Election or Appointment: 2005 Prior to his retirement in 2001, Mr. Wolfe was Chairman and Chief Executive Officer of Hershey Foods Corporation (1993-2001). He currently serves as a member of the boards of Adelphia Communications Corporation (2003-present), Bausch & Lomb, Inc., and Revlon Inc. (2004-present). |
Advisory Board Members and Executive Officers**:
Correspondence intended for Mr. Mauriello, Mr. Thomas, and Mr. Wiley may be sent to Fidelity Investments, P.O. Box 55235, Boston, Massachusetts 02205-5235. Correspondence intended for each executive officer and Mr. Lynch may be sent to Fidelity Investments, 82 Devonshire Street, Boston, Massachusetts 02109.
Name, Age; Principal Occupation |
Peter S. Lynch (63) |
| Year of Election or Appointment: 2003 Member of the Advisory Board of Fidelity Advisor Series VIII. Mr. Lynch is Vice Chairman and a Director of FMR, and Vice Chairman (2001-
present) and a Director of FMR Co., Inc. Previously, Mr. Lynch served as a Trustee of the Fidelity funds (1990-2003). In addition, he serves as a Trustee of Boston College and as the Chairman of the Inner-City Scholarship Fund. |
Joseph Mauriello (63) |
| Year of Election or Appointment: 2007 Member of the Advisory Board of Fidelity Advisor Series VIII. Prior to his retirement in January 2006, Mr. Mauriello served in numerous senior management positions including Deputy Chairman and Chief Operating Officer (2004-2005), and Vice Chairman of Financial Services (2002-
2004) of KPMG LLP US (professional services firm, 1965-2005). Mr. Mauriello currently serves as a member of the Board of Directors of XL Capital Ltd., (global insurance and re-insurance company, 2006-
present) and of Arcadia Resources Inc., (health care services and products, 2007-present). He also served as a Director of the Hamilton Funds of the Bank of New York (2006-2007). |
David M. Thomas (58) |
| Year of Election or Appointment: 2007 Member of the Advisory Board of Fidelity Advisor Series VIII. Previously, Mr. Thomas served as Executive Chairman (2005-2006) and Chairman and Chief Executive Officer (2000-2005) of IMS Health, Inc. (pharmaceutical and healthcare information solutions). In addition, Mr. Thomas serves as a member of the Board of Directors of Fortune Brands, Inc. (consumer products holding company), and Interpublic Group of Companies, Inc. (marketing communication, 2004-present). |
Michael E. Wiley (57) |
| Year of Election or Appointment: 2007 Member of the Advisory Board of Fidelity Advisor Series VIII. Mr. Wiley also serves as Sr. Energy Advisor of Katzenbach Partners, LLC (consulting firm, 2006-present) and a member of the Board of Trustees of the University of Tulsa (2000-2006; 2007-present). He serves as a Director of Tesoro Corporation (independent oil refiner and marketer, 2005-
present), and a Director of Bill Barrett Corporation (exploration and production company, 2005-present). In addition, he also serves as a Director of Post Oak Bank (privately-held bank, 2004-present), and an Advisory Director of Riverstone Holdings (private investment firm). Previously, Mr. Wiley served as Chairman, President, and CEO of Baker Hughes, Inc. (oilfield services company, 2000-2004), and as Director of Spinnaker Exploration Company (exploration and production company, 2001-2005). |
Kimberley H. Monasterio (43) |
| Year of Election or Appointment: 2007 President and Treasurer of Advisor Emerging Asia. Ms. Monasterio also serves as President and Treasurer of other Fidelity funds (2007-present) and is an employee of FMR (2004-present). Previously, Ms. Monasterio served as Deputy Treasurer of the Fidelity funds (2004-2006). Before joining Fidelity Investments, Ms. Monasterio served as Treasurer (2000-
2004) and Chief Financial Officer (2002-2004) of the Franklin Templeton Funds and Senior Vice President of Franklin Templeton Services, LLC (2000-2004). |
Walter C. Donovan (45) |
| Year of Election or Appointment: 2007 Vice President of Advisor Emerging Asia. Mr. Donovan also serves as Vice President of Fidelity's Equity Funds (2007-present). Mr. Donovan also serves as Executive Vice President of FMR (2005-present) and FMR Co., Inc. (2005-present). Previously, Mr. Donovan served as Vice President of Fidelity's High Income Funds (2005-2007), Fixed-Income Funds (2005-2006), certain Asset Allocation Funds (2005-2006), certain Balanced Funds (2005-2006), and as Vice President and Director of Fidelity's International Equity Trading group (1998-2005). |
Eric M. Wetlaufer (45) |
| Year of Election or Appointment: 2006 Vice President of Advisor Emerging Asia. Mr. Wetlaufer also serves as Vice President of certain International Equity Funds (2006-present). Mr. Wetlaufer is Senior Vice President of FMR (2006-present) and FMR Co., Inc. (2006-present), and President and Director of Fidelity Management & Research (U.K.) Inc. (2006-present) and Fidelity Research & Analysis Company (2006-present). Before joining Fidelity Investments in 2005, Mr. Wetlaufer was a partner in Oxhead Capital Management (2004-2005). Previously, Mr. Wetlaufer served as a Chief Investment Officer of Putnam Investments (1997-2003). |
Eric D. Roiter (58) |
| Year of Election or Appointment: 1999 Secretary of Advisor Emerging Asia. He also serves as Secretary of other Fidelity funds; Vice President, General Counsel, and Secretary of FMR Co., Inc. (2001-present) and FMR; Assistant Secretary of Fidelity Management & Research (U.K.) Inc. (2001-present), Fidelity Research & Analysis Company (2001-present), and Fidelity Investments Money Management, Inc. (2001-present). Mr. Roiter is an Adjunct Member, Faculty of Law, at Boston College Law School (2003-present). Previously, Mr. Roiter served as Vice President and Secretary of FDC (1998-2005). |
Scott C. Goebel (39) |
| Year of Election or Appointment: 2007 Assistant Secretary of Advisor Emerging Asia. Mr. Goebel also serves as Assistant Secretary of other Fidelity funds (2007-present), and is an employee of FMR. |
R. Stephen Ganis (41) |
| Year of Election or Appointment: 2006 Anti-Money Laundering (AML) officer of Advisor Emerging Asia. Mr. Ganis also serves as AML officer of other Fidelity funds (2006-
present) and FMR LLC (2003-present). Before joining Fidelity Investments, Mr. Ganis practiced law at Goodwin Procter, LLP (2000-2002). |
Joseph B. Hollis (59) |
| Year of Election or Appointment: 2006 Chief Financial Officer of Advisor Emerging Asia. Mr. Hollis also serves as Chief Financial Officer of other Fidelity funds. Mr. Hollis is President of Fidelity Pricing and Cash Management Services (FPCMS) (2005-
present). Mr. Hollis also serves as President and Director of Fidelity Service Company, Inc. (2006-present). Previously, Mr. Hollis served as Senior Vice President of Cash Management Services (1999-2002) and Investment Management Operations (2002-2005). |
Kenneth A. Rathgeber (60) |
| Year of Election or Appointment: 2004 Chief Compliance Officer of Advisor Emerging Asia. Mr. Rathgeber also serves as Chief Compliance Officer of other Fidelity funds (2004-
present) and Executive Vice President of Risk Oversight for Fidelity Investments (2002-present). He is Chief Compliance Officer of FMR (2005-present), FMR Co., Inc. (2005-present), Fidelity Management & Research (U.K.) Inc. (2005-present), Fidelity Research & Analysis Company (2005-present), Fidelity Investments Money Management, Inc. (2005-present), and Strategic Advisers, Inc. (2005-present). Previously, Mr. Rathgeber served as Executive Vice President and Chief Operating Officer for Fidelity Investments Institutional Services Company, Inc. (1998-2002). |
Bryan A. Mehrmann (46) |
| Year of Election or Appointment: 2005 Deputy Treasurer of Advisor Emerging Asia. Mr. Mehrmann also serves as Deputy Treasurer of other Fidelity funds (2005-present) and is an employee of FMR. Previously, Mr. Mehrmann served as Vice President of Fidelity Investments Institutional Services Group (FIIS)/Fidelity Investments Institutional Operations Corporation, Inc. (FIIOC) Client Services (1998-2004). |
Kenneth B. Robins (38) |
| Year of Election or Appointment: 2005 Deputy Treasurer of Advisor Emerging Asia. Mr. Robins also serves as Deputy Treasurer of other Fidelity funds (2005-present) and is an employee of FMR (2004-present). Before joining Fidelity Investments, Mr. Robins worked at KPMG LLP, where he was a partner in KPMG's department of professional practice (2002-2004) and a Senior Manager (1999-2000). In addition, Mr. Robins served as Assistant Chief Accountant, United States Securities and Exchange Commission (2000-2002). |
Robert G. Byrnes (40) |
| Year of Election or Appointment: 2005 Assistant Treasurer of Advisor Emerging Asia. Mr. Byrnes also serves as Assistant Treasurer of other Fidelity funds (2005-present) and is an employee of FMR (2005-present). Previously, Mr. Byrnes served as Vice President of FPCMS (2003-2005). Before joining Fidelity Investments, Mr. Byrnes worked at Deutsche Asset Management where he served as Vice President of the Investment Operations Group (2000-2003). |
Peter L. Lydecker (53) |
| Year of Election or Appointment: 2004 Assistant Treasurer of Advisor Emerging Asia. Mr. Lydecker also serves as Assistant Treasurer of other Fidelity funds (2004) and is an employee of FMR. |
Paul M. Murphy (60) |
| Year of Election or Appointment: 2007 Assistant Treasurer of Advisor Emerging Asia. Mr. Murphy also serves as Assistant Treasurer of other Fidelity funds (2007-present) and is an employee of FMR (2007-present). Previously, Mr. Murphy served as Chief Financial Officer of the Fidelity Funds (2005-2006), Vice President and Associate General Counsel of FMR (2007), and Senior Vice President of Fidelity Pricing and Cash Management Services Group (FPCMS) (1994-2007). |
Gary W. Ryan (49) |
| Year of Election or Appointment: 2005 Assistant Treasurer of Advisor Emerging Asia. Mr. Ryan also serves as Assistant Treasurer of other Fidelity funds (2005-present) and is an employee of FMR (2005-present). Previously, Mr. Ryan served as Vice President of Fund Reporting in FPCMS (1999-2005). |
** FMR Corp. merged with FMR LLC on October 1, 2007. Any references to FMR LLC for prior periods are deemed to be references to the prior entity.
Annual Report
Distributions
The Board of Trustees of Advisor Emerging Asia Fund voted to pay to shareholders of record at the opening of business on record date, the following distributions per share derived from capital gains realized from sales of portfolio securities, and dividends derived from net investment income:
| Pay Date | Record Date | Dividends | Capital Gains |
Class A | 12/05/07 | 12/04/07 | $.225 | $3.06 |
Class T | 12/05/07 | 12/04/07 | $.136 | $3.06 |
Class B | 12/05/07 | 12/04/07 | $.000 | $3.05 |
Class C | 12/05/07 | 12/04/07 | $.035 | $3.06 |
The fund hereby designates as a capital gain dividend with respect to the taxable year ended October 31 2007, $13,716,044, or, if subsequently determined to be different, the net capital gain of such year.
Class A designates 17%; Class T designates 17%; Class B designates 19%; and Class C designates 18% of the dividends distributed in December 2006, respectively during the fiscal year as amounts which may be taken into account as a dividend for purposes of the maximum rate under section 1(h)(11) of the Internal Revenue Code.
The amounts per share which represent income derived from sources within, and taxes paid to, foreign countries or possessions of the United States are as follows:
| Pay Date | Income | Taxes |
Class A | 12/11/2006 | $.301 | $.0418 |
Class T | 12/11/2006 | $.291 | $.0418 |
Class B | 12/11/2006 | $.265 | $.0418 |
Class C | 12/11/2006 | $.270 | $.0418 |
The fund will notify shareholders in January 2008 of amounts for use in preparing 2007 income tax returns.
Annual Report
Board Approval of Investment Advisory Contracts and Management Fees
Advisor Emerging Asia Fund
Each year, typically in July, the Board of Trustees, including the Independent Trustees (together, the Board), votes on the renewal of the management contract and sub-advisory agreements (together, the Advisory Contracts) for the fund. The Board, assisted by the advice of fund counsel and Independent Trustees' counsel, requests and considers a broad range of information throughout the year.
The Board meets regularly each month except August and takes into account throughout the year matters bearing on Advisory Contracts. The Board, acting directly and through its separate committees, considers at each of its meetings factors that are relevant to the annual renewal of the fund's Advisory Contracts, including the services and support provided to the fund and its shareholders. At the time of the renewal, the Board had 12 standing committees, each composed of Independent Trustees with varying backgrounds, to which the Board has assigned specific subject matter responsibilities in order to enhance effective decision-making by the Board. Each committee has adopted a written charter outlining the structure and purposes of the committee. One such committee, the Equity Contract Committee, meets periodically as needed throughout the year to consider matters specifically related to the annual renewal of Advisory Contracts. The committee requests and receives information on, and makes recommendations to the Independent Trustees concerning, the approval and annual review of the Advisory Contracts.
At its July 2007 meeting, the Board of Trustees, including the Independent Trustees, unanimously determined to renew the Advisory Contracts for the fund. In reaching its determination, the Board considered all factors it believed relevant, including (i) the nature, extent, and quality of the services to be provided to the fund and its shareholders (including the investment performance of the fund); (ii) the competitiveness of the management fee and total expenses of the fund; (iii) the total costs of the services to be provided by and the profits to be realized by the investment adviser and its affiliates from the relationship with the fund; (iv) the extent to which economies of scale would be realized as the fund grows; and (v) whether fee levels reflect these economies of scale, if any, for the benefit of fund shareholders. The Board also approved amendments to the fund's agreements with foreign sub-advisers to clarify that each sub-adviser provides services as an independent contractor.
In determining whether to renew the Advisory Contracts for the fund, the Board ultimately reached a determination, with the assistance of fund counsel and Independent Trustees' counsel, that the renewal of the Advisory Contracts and the compensation to be received by Fidelity under the management contract is consistent with Fidelity's fiduciary duty under applicable law. In addition to evaluating the specific factors noted above, the Board, in reaching its determination, is aware that shareholders in the fund have a broad range of investment choices available to them, including a wide choice among mutual funds offered by competitors to Fidelity, and that the fund's shareholders, with the opportunity to review and weigh the disclosure provided by the fund in its prospectus and other public disclosures, have chosen to invest in this fund, managed by Fidelity.
Annual Report
Board Approval of Investment Advisory Contracts and
Management Fees - continued
Nature, Extent, and Quality of Services Provided. The Board considered staffing within the investment adviser, FMR, and the sub-advisers (together, the Investment Advisers), including the background of the fund's portfolio manager and the fund's investment objective and discipline. The Independent Trustees also had discussions with senior management of Fidelity's investment operations and investment groups. The Board considered the structure of the portfolio manager compensation program and whether this structure provides appropriate incentives.
Resources Dedicated to Investment Management and Support Services. The Board reviewed the size, education, and experience of the Investment Advisers' investment staff, their use of technology, and the Investment Advisers' approach to recruiting, training, and retaining portfolio managers and other research, advisory, and management personnel. The Board considered Fidelity's extensive global research capabilities that enable the Investment Advisers to aggregate data from various sources in an effort to produce positive investment results. The Board noted that Fidelity's analysts have access to a variety of technological tools that enable them to perform both fundamental and quantitative analysis and to specialize in various disciplines. The Board also considered that Fidelity's portfolio managers and analysts have access to daily portfolio attribution that allows for monitoring of a fund's portfolio, as well as an electronic communication system that provides immediate real-time access to research concerning issuers and credit enhancers.
Shareholder and Administrative Services. The Board considered (i) the nature, extent, quality, and cost of advisory, administrative, distribution, and shareholder services performed by the Investment Advisers and their affiliates under the Advisory Contracts and under separate agreements covering transfer agency, pricing and bookkeeping, and securities lending services for the fund; (ii) the nature and extent of the Investment Advisers' supervision of third party service providers, principally custodians and subcustodians; and (iii) the resources devoted to, and the record of compliance with, the fund's compliance policies and procedures. The Board reviewed the allocation of fund brokerage, including allocations to brokers affiliated with the Investment Advisers, the use of brokerage commissions to pay fund expenses, and the use of "soft" commission dollars to pay for research services. The Board also considered that Fidelity voluntarily pays for market data out of its own resources. The Board also considered the agreement reached between the Independent Trustees and Fidelity in December 2006 following an independent review of matters relating to receipt of travel, entertainment, gifts and gratuities in violation of Fidelity policies.
Annual Report
The Board noted that the growth of fund assets across the complex allows Fidelity to reinvest in the development of services designed to enhance the value or convenience of the Fidelity funds as investment vehicles. These services include 24-hour access to account information and market information through phone representatives and over the Internet, and investor education materials and asset allocation tools.
Investment in a Large Fund Family. The Board considered the benefits to shareholders of investing in a Fidelity fund, including the benefits of investing in a fund that is part of a large family of funds offering a variety of investment disciplines and providing for a large variety of mutual fund investor services. For example, fund shareholders are offered the privilege of exchanging shares of the fund for shares of other Fidelity funds, as set forth in the fund's prospectus, without paying a sales charge. The Board noted that, since the last Advisory Contract renewals in July 2006, Fidelity has taken a number of actions that benefited particular funds, including (i) dedicating additional resources to investment research and to restructure the investment research teams; (ii) contractually agreeing to reduce the management fee on Fidelity Advisor Floating Rate High Income Fund; (iii) contractually agreeing to reduce the management fees on Fidelity's California, Massachusetts, New Jersey, and New York AMT Tax-Free Money Market Funds, launching new Institutional Classes and Service Classes of these funds, and contractually agreeing to impose expense limitations on these funds; (iv) eliminating the exchange fee on the Fidelity Select Portfolios and reducing the pricing and bookkeeping fee rates for these funds; (v) reducing the maximum transfer agency fee rates on high income funds and certain equity funds; (vi) proposing amended management contracts that, if approved by shareholders, will add a performance adjustment component to the management fees paid by 18 Fidelity Advisor equity funds; (vii) contractually agreeing to reduce fees for Ultra-Short Central Fund and the money market Central Funds; (viii) waiving the Fidelity Advisor funds' contingent deferred sales charge on certain redemptions made through systematic withdrawal programs; and (ix) amending the management contracts for equity and fixed-income funds whose management contracts incorporate a "group fee" structure by adding four new fee "breakpoints" to the group fee rate schedules.
Investment Performance and Compliance. The Board considered whether the fund has operated within its investment objective, as well as its record of compliance with its investment restrictions. It also reviewed the fund's absolute investment performance for each class, as well as the fund's relative investment performance for each class measured against a broad-based securities market index over multiple periods. The Board noted that FMR does not believe that a meaningful peer group exists against which to compare the fund's performance. The following charts considered by the Board show, over the one-, three-, and five-year periods ended December 31, 2006, the cumulative total returns of Institutional Class (Class I) and Class C of the fund and the cumulative total returns of a broad-based securities market index ("benchmark"). The returns of Institutional Class (Class I) and Class C show the performance of the highest and lowest performing classes, respectively (based on three-year performance).
Annual Report
Board Approval of Investment Advisory Contracts and
Management Fees - continued
Advisor Emerging Asia Fund
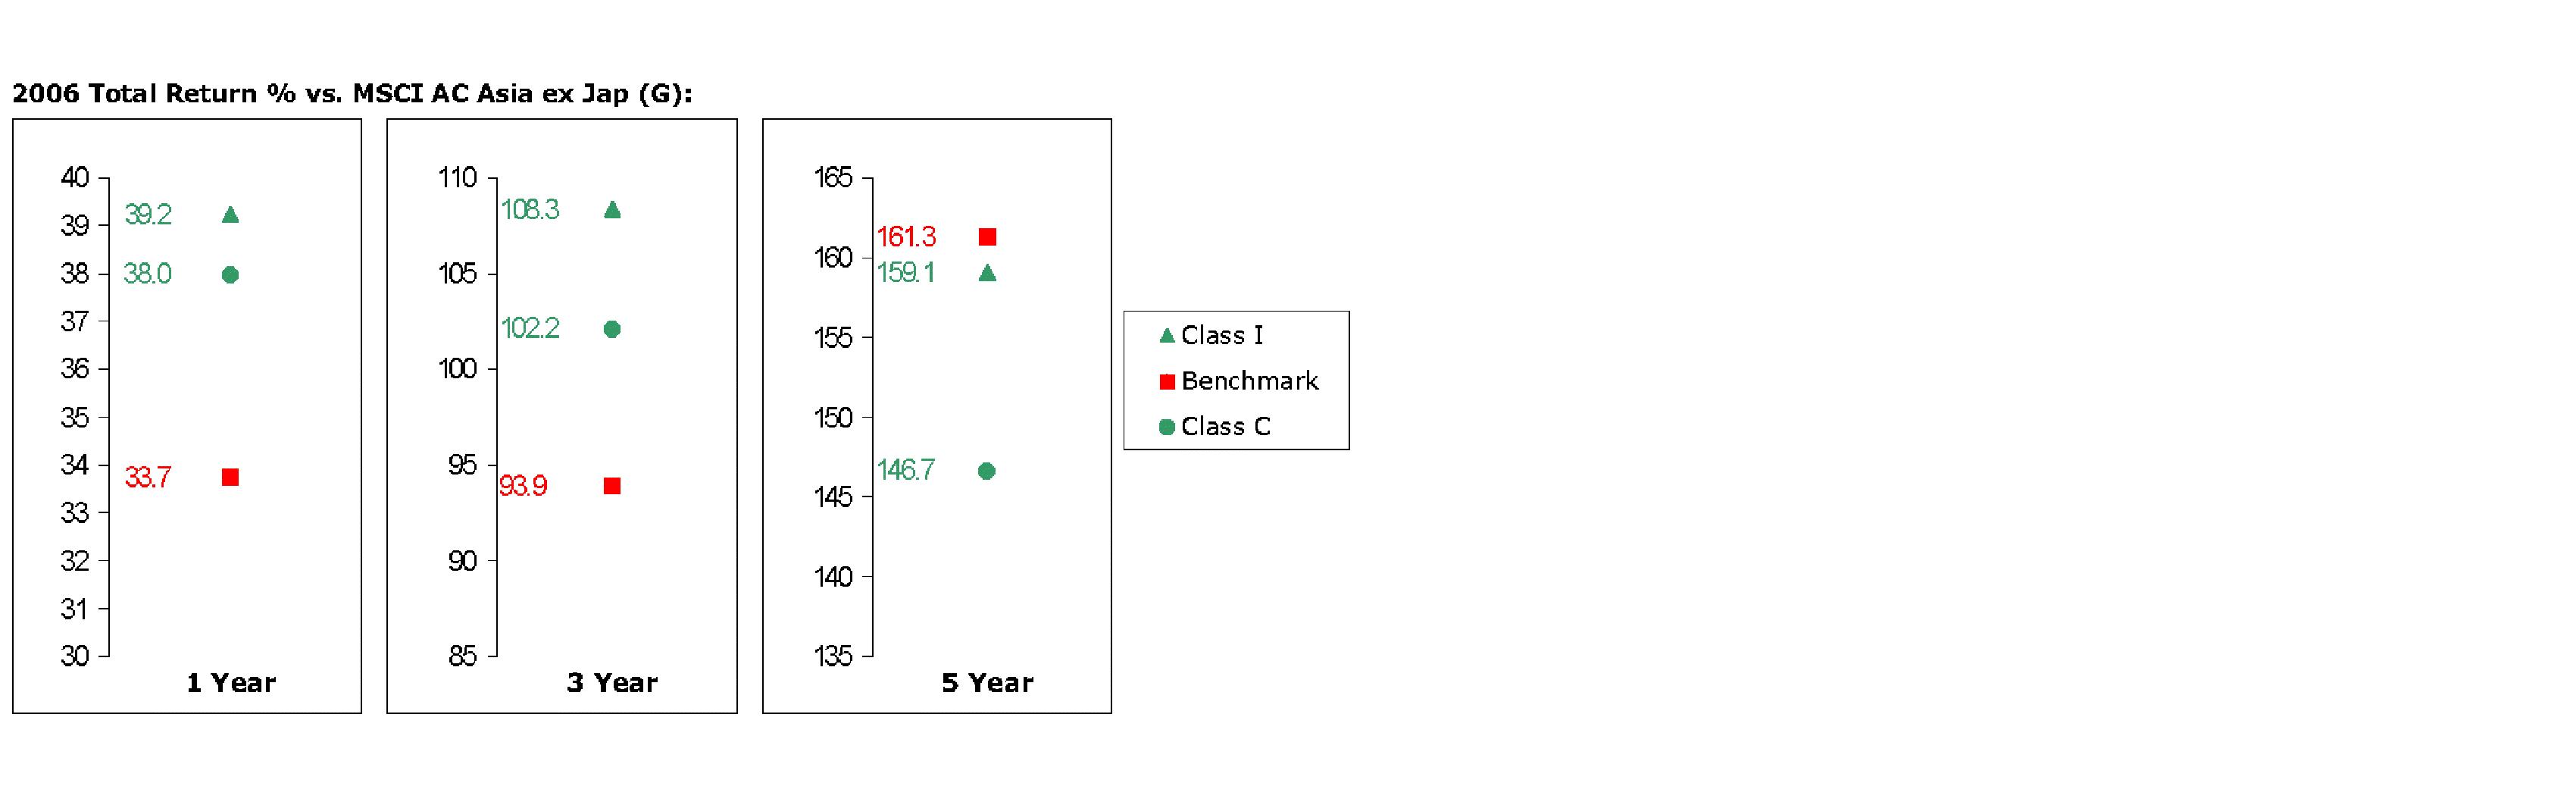
The Board stated that the relative investment performance of Institutional Class (Class I) of the fund compared favorably to its benchmark for the one- and three-year periods, although the fund's five-year cumulative total return was lower than its benchmark. The Board considered that the variations in performance among the fund's classes reflect the variations in class expenses, which result in lower performance for higher expense classes.
The Board considered that FMR has taken steps to refocus and strengthen equity research, equity portfolio management, and compliance.
Based on its review, and giving particular weight to the nature and quality of the resources dedicated by the Investment Advisers to maintain and improve relative performance, the Board concluded that the nature, extent, and quality of the services provided to the fund will benefit the fund's shareholders, particularly in light of the Board's view that the fund's shareholders benefit from investing in a fund that is part of a large family of funds offering a variety of investment disciplines and services.
Competitiveness of Management Fee and Total Fund Expenses. The Board considered the fund's management fee and total expenses compared to "mapped groups" of competitive funds and classes. Fidelity creates "mapped groups" by combining similar Lipper investment objective categories that have comparable management fee characteristics. Combining Lipper investment objective categories aids the Board's management fee and total expense comparisons by broadening the competitive group used for comparison and by reducing the number of universes to which various Fidelity funds are compared. The Board also considered supplemental information about how the fund's management fee and total expenses ranked relative to groups based on Lipper classifications, which take into account a fund's market capitalization and style.
Annual Report
The Board considered two proprietary management fee comparisons for the 12-month periods shown in the chart below. The group of Lipper funds used by the Board for management fee comparisons is referred to below as the "Total Mapped Group." The Total Mapped Group comparison focuses on a fund's standing relative to the total universe of comparable funds available to investors, in terms of gross management fees before expense reimbursements or caps. "TMG %" represents the percentage of funds in the Total Mapped Group that had management fees that were lower than the fund's. For example, a TMG % of 9% means that 91% of the funds in the Total Mapped Group had higher management fees than the fund. The "Asset-Size Peer Group" (ASPG) comparison focuses on a fund's standing relative to non-Fidelity funds similar in size to the fund within the Total Mapped Group. The ASPG represents at least 15% of the funds in the Total Mapped Group with comparable asset size and management fee characteristics, subject to a minimum of 50 funds (or all funds in the Total Mapped Group if fewer than 50). Additional information, such as the ASPG quartile in which the fund's management fee ranked, is also included in the chart and considered by the Board.
Advisor Emerging Asia Fund

The Board noted that the fund's management fee ranked below the median of its Total Mapped Group and below the median of its ASPG for 2006.
Annual Report
Board Approval of Investment Advisory Contracts and
Management Fees - continued
Based on its review, the Board concluded that the fund's management fee was fair and reasonable in light of the services that the fund receives and the other factors considered.
In its review of each class's total expenses, the Board considered the fund's management fee as well as other fund or class expenses, as applicable, such as transfer agent fees, pricing and bookkeeping fees, fund-paid 12b-1 fees, and custodial, legal, and audit fees. The Board also noted the effects of any waivers and reimbursements on fees and expenses. As part of its review, the Board also considered current and historical total expenses of each class of the fund compared to competitive fund median expenses. Each class of the fund is compared to those funds and classes in the Total Mapped Group (used by the Board for management fee comparisons) that have a similar sales load structure.
The Board noted that the total expenses of each class ranked below its competitive median for 2006.
In its review of total expenses, the Board also considered Fidelity fee structures and other information on clients that FMR and its affiliates service in other competitive markets, such as other mutual funds advised or subadvised by FMR or its affiliates, pension plan clients, and other institutional clients.
Based on its review, the Board concluded that the total expenses of each class of the fund were reasonable in light of the services that the fund and its shareholders receive and the other factors considered.
Costs of the Services and Profitability. The Board considered the revenues earned and the expenses incurred by Fidelity in conducting the business of developing, marketing, distributing, managing, administering and servicing the fund and its shareholders. The Board also considered the level of Fidelity's profits in respect of all the Fidelity funds.
On an annual basis, FMR presents to the Board Fidelity's profitability for the fund. Fidelity calculates the profitability for each fund, as well as aggregate profitability for groups of Fidelity funds and all Fidelity funds, using a series of detailed revenue and cost allocation methodologies which originate with the audited books and records of Fidelity. The Audit Committee of the Board reviews any significant changes from the prior year's methodologies.
PricewaterhouseCoopers LLP (PwC), independent registered public accounting firm and auditor to Fidelity and certain Fidelity funds, has been engaged annually by the Board as part of the Board's assessment of the results of Fidelity's profitability analysis. PwC's engagement includes the review and assessment of Fidelity's methodologies used in determining the revenues and expenses attributable to Fidelity's mutual fund business, and completion of agreed-upon procedures surrounding the mathematical accuracy of fund profitability and its conformity to allocation methodologies. After considering PwC's reports issued under the engagement and information provided by Fidelity, the Board believes that while other allocation methods may also be reasonable, Fidelity's profitability methodologies are reasonable in all material respects.
Annual Report
The Board has also reviewed Fidelity's non-fund businesses and any fall-out benefits related to the mutual fund business as well as cases where Fidelity's affiliates may benefit from or be related to the fund's business.
The Board considered the costs of the services provided by and the profits realized by Fidelity in connection with the operation of the fund and determined that the amount of profit is a fair entrepreneurial profit for the management of the fund.
Economies of Scale. The Board considered whether there have been economies of scale in respect of the management of the Fidelity funds, whether the Fidelity funds (including the fund) have appropriately benefited from any such economies of scale, and whether there is potential for realization of any further economies of scale. The Board considered the extent to which the fund will benefit from economies of scale through increased services to the fund, through waivers or reimbursements, or through fee or expense reductions, including reductions that occur through operation of the transfer agent agreement. The transfer agent fee varies in part based on the number of accounts in the fund. If the number of accounts decreases or the average account size increases, the overall transfer agent fee rate decreases.
The Board recognized that the fund's management contract incorporates a "group fee" structure, which provides for lower group fee rates as total fund assets under FMR's management increase, and for higher group fee rates as total fund assets under FMR's management decrease. FMR determines the group fee rates based on a tiered asset "breakpoint" schedule. In connection with the renewal of the fund's management contract, the Board approved amendments to the fund's management contract that added four new fee breakpoints to the group fee rate schedule for assets under FMR's management above $1,386 billion. The Board considered that the group fee rate declines under both the present and amended schedules, but that under the amended schedule, the group fee rate declines faster as assets under FMR's management exceed $1,386 billion. The Board considered that the group fee is designed to deliver the benefits of economies of scale to fund shareholders when total fund assets increase, even if assets of any particular fund are unchanged or have declined, because some portion of Fidelity's costs are attributable to services provided to all Fidelity funds, and all funds benefit if those costs can be allocated among more assets. The Board concluded that, given the group fee structure, fund shareholders will achieve a certain level of economies of scale as assets under FMR's management increase at the fund complex level, regardless of whether Fidelity achieves any such economies of scale.
The Board further concluded that any potential economies of scale are being shared between fund shareholders and Fidelity in an appropriate manner.
Annual Report
Board Approval of Investment Advisory Contracts and
Management Fees - continued
Additional Information Requested by the Board. In order to develop fully the factual basis for consideration of the Fidelity funds' Advisory Contracts, the Board requested and received additional information on several topics, including (i) fund performance trends and actions to be taken by FMR to improve certain funds' overall performance; (ii) Fidelity's portfolio manager compensation structure, including its effects on fund profitability and the extent to which portfolio manager compensation is linked to fund performance; (iii) Fidelity's fee structures; (iv) the funds' sub-advisory arrangements; and (v) accounts managed by Fidelity other than the Fidelity funds.
Based on its evaluation of all of the conclusions noted above, and after considering all material factors, the Board ultimately concluded that the advisory fee structures are fair and reasonable, and that the fund's Advisory Contracts should be renewed.
Annual Report
Annual Report
Annual Report
Annual Report
Annual Report
Annual Report
Investment Adviser
Fidelity Management & Research Company
Boston, MA
Investment Sub-Advisers
FMR Co., Inc.
Fidelity Management & Research
(U.K.) Inc.
Fidelity Research & Analysis Company
Fidelity International
Investment Advisors
Fidelity Investments Japan Limited
Fidelity International Investment Advisors (U.K.) Limited
General Distributor
Fidelity Distributors Corporation
Boston, MA
Transfer and Service Agents
Fidelity Investments Institutional Operations Company, Inc.
Boston, MA
Fidelity Service Company, Inc.
Boston, MA
Custodian
Brown Brothers Harriman & Co.
Boston, MA
AEA-UANN-1207
1.784737.104
(Fidelity Investment logo)(registered trademark)
(Fidelity Investment logo)(registered trademark)
Fidelity® Advisor
Emerging Asia
Fund - Institutional Class
Annual Report
October 31, 2007
(2_fidelity_logos) (Registered_Trademark)
Contents
Chairman's Message | <Click Here> | Ned Johnson's message to shareholders. |
Performance | <Click Here> | How the fund has done over time. |
Management's Discussion | <Click Here> | The manager's review of fund performance, strategy and outlook. |
Shareholder Expense Example | <Click Here> | An example of shareholder expenses. |
Investment Changes | <Click Here> | A summary of major shifts in the fund's investments over the past six months. |
Investments | <Click Here> | A complete list of the fund's investments with their market values. |
Financial Statements | <Click Here> | Statements of assets and liabilities, operations, and changes in net assets,
as well as financial highlights. |
Notes | <Click Here> | Notes to the financial statements. |
Report of Independent Registered Public Accounting Firm | <Click Here> | |
Trustees and Officers | <Click Here> | |
Distributions | <Click Here> | |
Board Approval of Investment Advisory Contracts and Management Fees | <Click Here> | |
To view a fund's proxy voting guidelines and proxy voting record for the 12-month period ended June 30, visit http://www.fidelity.com (search for "proxy voting guidelines") or visit the Securities and Exchange Commission's (SEC) web site at http://www.sec.gov. You may also call 1-877-208-0098 to request a free copy of the proxy voting guidelines.
Standard & Poor's, S&P and S&P 500 are registered service marks of The McGraw-Hill Companies, Inc. and have been licensed for use by Fidelity Distributors Corporation.
Other third party marks appearing herein are the property of their respective owners.
All other marks appearing herein are registered or unregistered trademarks or service marks of FMR LLC or an affiliated company.
Annual Report
This report and the financial statements contained herein are submitted for the general information of the shareholders of the fund. This report is not authorized for distribution to prospective investors in the fund unless preceded or accompanied by an effective prospectus.
A fund files its complete schedule of portfolio holdings with the SEC for the first and third quarters of each fiscal year on Form N-Q. Forms N-Q are available on the SEC's web site at http://www.sec.gov. A fund's Forms N-Q may be reviewed and copied at the SEC's Public Reference Room in Washington, DC. Information regarding the operation of the SEC's Public Reference Room may be obtained by calling 1-800-SEC-0330. For a complete list of a fund's portfolio holdings, view the most recent holdings listing, semiannual report, or annual report on Fidelity's web site at http://www.fidelity.com or http://www.advisor.fidelity.com, as applicable.
NOT FDIC INSURED · MAY LOSE VALUE · NO BANK GUARANTEE
Neither the fund nor Fidelity Distributors Corporation is a bank.
Annual Report
Chairman's Message
(photo_of_Edward_C_Johnson_3d)
Dear Shareholder:
Many stock and bond markets around the world have been unsettled of late; however, volatility can often lead to opportunity for patient investors. Financial markets are always unpredictable, but there are a number of time-tested principles that can put the historical odds in your favor.
One of the basic tenets is to invest for the long term. Over time, riding out the markets' inevitable ups and downs has proven much more effective than selling into panic or chasing the hottest trend. Even missing only a few of the markets' best days can significantly diminish investor returns. Patience also affords the benefits of compounding - of earning interest on additional income or reinvested dividends and capital gains. There are tax advantages and cost benefits to consider as well. The more you sell, the more taxes you pay, and the more you trade, the higher the costs. While staying the course doesn't eliminate risk, it can considerably lessen the effect of short-term declines.
You can further manage your investing risk through diversification. And today, more than ever, geographic diversification should be taken into account. Studies indicate that asset allocation is the single most important determinant of a portfolio's long-term success. The right mix of stocks, bonds and cash - aligned to your particular risk tolerance and investment objective - is very important. Age-appropriate rebalancing is also an essential aspect of asset allocation. For younger investors, an emphasis on equities - which historically have been the best-performing asset class over time - is encouraged. As investors near their specific goal, such as retirement or sending a child to college, consideration may be given to replacing volatile assets (e.g. common stocks) with more-stable fixed investments (bonds or savings plans).
A third investment principle - investing regularly - can help lower the average cost of your purchases. Investing a certain amount of money each month or quarter helps ensure you won't pay for all your shares at market highs. This strategy - known as dollar cost averaging - also reduces unconstructive "emotion" from investing, helping shareholders avoid selling weak performers just prior to an upswing, or chasing a hot performer just before a correction.
We invite you to contact us via the Internet, through our Investor Centers or over the phone. It is our privilege to provide you the information you need to make the investments that are right for you.
Sincerely,
/s/Edward C. Johnson 3d
Edward C. Johnson 3d
Annual Report
Performance: The Bottom Line
Average annual total return reflects the change in the value of an investment, assuming reinvestment of the class' dividend income and capital gains (the profits earned upon the sale of securities that have grown in value) and assuming a constant rate of performance each year. The $10,000 table and the fund's returns do not reflect the deduction of taxes that a shareholder would pay on fund distributions or the redemption of fund shares. During periods of reimbursement by Fidelity, a fund's total return will be greater than it would be had the reimbursement not occurred. How a fund did yesterday is no guarantee of how it will do tomorrow.
Average Annual Total Returns
Periods ended October 31, 2007 | | Past 1
year | Past 5
years | Past 10
years |
Institutional Class A | | 80.97% | 35.55% | 15.05% |
A Institutional Class shares are sold to eligible investors without a sales load or 12b-1 fee. The initial offering of Institutional Class shares took place on June 16, 1999. Returns prior to June 16, 1999 are those of Fidelity Advisor Emerging Asia Fund, Inc., (the Closed-End Fund). At the close of business on June 15, 1999, the Closed-End Fund reorganized as an open-end fund through a transfer of all its assets and liabilities to Fidelity Advisor Emerging Asia Fund (the fund). Shareholders of the Closed-End Fund received Class A shares of the fund in exchange for their shares of the Closed-End Fund. If the effect of Institutional Class expenses was reflected, returns may be lower than shown because Institutional Class shares of the fund may have higher total expenses than the Closed-End Fund.
$10,000 Over 10 Years
Let's say hypothetically that $10,000 was invested in Fidelity® Advisor Emerging Asia Fund - Institutional Class on October 31, 1997. The chart shows how the value of your investment would have changed, and also shows how the Morgan Stanley Capital InternationalSM All Country (MSCI® AC)Asia ex Japan Index performed over the same period. The initial offering of Institutional Class took place on June 16, 1999. See above for additional information regarding the performance of Institutional Class.
Annual Report
Management's Discussion of Fund Performance
Comments from Kevin Chang, Portfolio Manager of Fidelity® Advisor Emerging Asia Fund
Asian emerging-markets equities outperformed most U.S. and foreign developed stock markets during the year ending October 31, 2007. In that time, the Morgan Stanley Capital InternationalSM (MSCI®) All Country Asia ex Japan Index was up 73.18%. On the whole, developing Asian markets benefited from brisk economic growth and the ongoing build-out of commercial and industrial infrastructure. China led the way with a gain of roughly 168%, reflecting optimism about opportunities within the region's fast-growing economy. Hong Kong surged higher for similar reasons, jumping around 91%. However, two of the largest country weightings in the index trailed its overall return despite very strong absolute performance. South Korea - the benchmark's biggest constituent on average during the period - gained almost 57% but still was approximately 16 percentage points shy of the MSCI index. Taiwan - the third-largest country weighting on average - also came up short despite a solid return of nearly 40%.
During the past year, the fund's Institutional Class shares returned 80.97%, beating the MSCI index. Information technology helped performance the most versus the index, followed by industrials, energy and consumer staples. Favorable stock selection was the primary driver. Geographically, stock picking in China, South Korea, Taiwan and India aided our results. Further, a weak U.S. dollar boosted absolute performance. The fund's top contributor was South Korea's Taewoong, a leading manufacturer of forged products for heavy industry. Other contributors included Taiwan-based semiconductor maker Global Unichip, China Oilfield Services, China Merchants Bank and Seoul Securities. Global Unichip and Seoul Securities were sold by period end. All five contributors were out-of-index positions. Conversely, the materials sector detracted from our results, while Indonesia and Thailand were the most negative country influences. An average cash position of more than 5% also hurt. Not owning strong-performing index components Hong Kong Exchanges & Clearing and Hyundai Heavy Industries, a Korean shipbuilder, dampened performance, as did underweighting index component China Life Insurance.
Note to shareholders: On November 14, 2007, shareholders of Fidelity Advisor Korea Fund approved the merger of Advisor Korea into Fidelity Advisor Emerging Asia Fund. The merger was completed on December 7, 2007.
The views expressed above reflect those of the portfolio manager(s) only through the end of the period as stated on the cover of this report and do not necessarily represent the views of Fidelity or any other person in the Fidelity organization. Any such views are subject to change at any time based upon market or other conditions and Fidelity disclaims any responsibility to update such views. These views may not be relied on as investment advice and, because investment decisions for a Fidelity fund are based on numerous factors, may not be relied on as an indication of trading intent on behalf of any Fidelity fund.
Annual Report
Shareholder Expense Example
As a shareholder of the Fund, you incur two types of costs: (1) transaction costs, including sales charges (loads) on purchase payments or redemption proceeds, redemption fees, and (2) ongoing costs, including management fees, distribution and/or service (12b-1) fees and other Fund expenses. This Example is intended to help you understand your ongoing costs (in dollars) of investing in the Fund and to compare these costs with the ongoing costs of investing in other mutual funds.
The Example is based on an investment of $1,000 invested at the beginning of the period and held for the entire period (May 1, 2007 to October 31, 2007).
Actual Expenses
The first line of the accompanying table for each class of the Fund provides information about actual account values and actual expenses. You may use the information in this line, together with the amount you invested, to estimate the expenses that you paid over the period. Simply divide your account value by $1,000.00 (for example, an $8,600 account value divided by $1,000.00 = 8.6), then multiply the result by the number in the first line for a class of the Fund under the heading entitled "Expenses Paid During Period" to estimate the expenses you paid on your account during this period. In addition, the Fund, as a shareholder in the underlying Fidelity Central Funds, will indirectly bear its pro rata share of the fees and expenses incurred by the underlying Fidelity Central Funds. These fees and expenses are not included in the Fund's annualized expense ratio used to calculate the expense estimate in the table below.
Hypothetical Example for Comparison Purposes
The second line of the accompanying table for each class of the Fund provides information about hypothetical account values and hypothetical expenses based on a Class' actual expense ratio and an assumed rate of return of 5% per year before expenses, which is not the Class' actual return. The hypothetical account values and expenses may not be used to estimate the actual ending account balance or expenses you paid for the period. You may use this information to compare the ongoing costs of investing in the Fund and other funds. To do so, compare this 5% hypothetical example with the 5% hypothetical examples that appear in the shareholder reports of the other funds. In addition, the Fund, as a shareholder in the underlying Fidelity Central Funds, will indirectly bear its pro rata share of the fees and expenses incurred by the underlying Fidelity Central Funds. These fees and expenses are not included in the Fund's annualized expense ratio used to calculate the expense estimate in the table below.
Annual Report
Shareholder Expense Example - continued
Please note that the expenses shown in the table are meant to highlight your ongoing costs only and do not reflect any transaction costs. Therefore, the second line of the table is useful in comparing ongoing costs only, and will not help you determine the relative total costs of owning different funds. In addition, if these transactional costs were included, your costs would have been higher.
| Beginning
Account Value
May 1, 2007 | Ending
Account Value
October 31, 2007 | Expenses Paid
During Period*
May 1, 2007 to
October 31, 2007 |
Class A | | | |
Actual | $ 1,000.00 | $ 1,465.70 | $ 9.14 |
Hypothetical A | $ 1,000.00 | $ 1,017.80 | $ 7.48 |
Class T | | | |
Actual | $ 1,000.00 | $ 1,464.10 | $ 10.87 |
Hypothetical A | $ 1,000.00 | $ 1,016.38 | $ 8.89 |
Class B | | | |
Actual | $ 1,000.00 | $ 1,460.00 | $ 13.95 |
Hypothetical A | $ 1,000.00 | $ 1,013.86 | $ 11.42 |
Class C | | | |
Actual | $ 1,000.00 | $ 1,460.70 | $ 13.65 |
Hypothetical A | $ 1,000.00 | $ 1,014.12 | $ 11.17 |
Institutional Class | | | |
Actual | $ 1,000.00 | $ 1,468.30 | $ 6.91 |
Hypothetical A | $ 1,000.00 | $ 1,019.61 | $ 5.65 |
A 5% return per year before expenses
* Expenses are equal to each Class' annualized expense ratio (shown in the table below); multiplied by the average account value over the period, multiplied by 184/365 (to reflect the one-half year period).
| Annualized
Expense Ratio |
Class A | 1.47% |
Class T | 1.75% |
Class B | 2.25% |
Class C | 2.20% |
Institutional Class | 1.11% |
Annual Report
Investment Changes
Top Ten Stocks as of October 31, 2007 |
| % of fund's
net assets | % of fund's net assets
6 months ago |
China Mobile (Hong Kong) Ltd. | 4.3 | 2.0 |
Samsung Electronics Co. Ltd. | 3.0 | 3.1 |
POSCO | 2.9 | 2.1 |
Reliance Industries Ltd. | 2.6 | 0.4 |
PetroChina Co. Ltd. (H Shares) | 2.5 | 1.9 |
Taewoong Co. Ltd. | 2.0 | 1.1 |
Shinhan Financial Group Co. Ltd. | 1.9 | 0.9 |
Sun Hung Kai Properties Ltd. | 1.9 | 2.0 |
Cheung Kong Holdings Ltd. | 1.6 | 1.9 |
Sina Corp. | 1.6 | 0.8 |
| 24.3 | |
Top Five Market Sectors as of October 31, 2007 |
| % of fund's
net assets | % of fund's net assets
6 months ago |
Financials | 26.3 | 34.8 |
Information Technology | 15.3 | 16.1 |
Industrials | 12.4 | 11.5 |
Materials | 12.2 | 7.4 |
Consumer Discretionary | 9.7 | 8.6 |
Asset Allocation (% of fund's net assets) |
As of October 31, 2007 | As of April 30, 2007 |
| Stocks and
Investment
Companies 96.4% | | | Stocks and
Investment
Companies 95.9% | |
| Short-Term
Investments and
Net Other Assets 3.6% | | | Short-Term
Investments and
Net Other Assets 4.1% | |

Annual Report
Investments October 31, 2007
Showing Percentage of Net Assets
Common Stocks - 96.4% |
| Shares | | Value |
Australia - 0.7% |
Boral Ltd. | 204,031 | | $ 1,296,610 |
Mount Gibson Iron Ltd. (a) | 400,000 | | 1,130,874 |
Thinksmart Ltd. | 51,200 | | 87,507 |
TOTAL AUSTRALIA | | 2,514,991 |
Bermuda - 1.4% |
Peace Mark Holdings Ltd. | 1,160,000 | | 1,911,195 |
Sinofert Holdings Ltd. | 3,340,000 | | 3,150,522 |
TOTAL BERMUDA | | 5,061,717 |
Cayman Islands - 2.9% |
Alibaba.com Ltd. (a) | 14,500 | | 46,772 |
Belle International Holdings Ltd. | 1,035,000 | | 1,679,037 |
CNinsure, Inc. ADR (a) | 1,500 | | 37,935 |
Computime Group Ltd. | 2,000,000 | | 358,869 |
Delta Networks, Inc. | 118,000 | | 56,942 |
Hutchison China Meditech Ltd. (a) | 3 | | 11 |
Lee & Man Paper Manufacturing Ltd. | 500,000 | | 2,000,172 |
Mindray Medical International Ltd. sponsored ADR (d) | 29,400 | | 1,168,944 |
New Oriental Education & Technology Group, Inc. sponsored ADR | 32,200 | | 2,882,544 |
Stella International Holdings Ltd. | 900,000 | | 1,974,104 |
TOTAL CAYMAN ISLANDS | | 10,205,330 |
China - 16.1% |
China Communications Construction Co. Ltd. (H Shares) | 500,000 | | 1,586,485 |
China Construction Bank Corp. (H Shares) | 4,000,000 | | 4,547,401 |
China Life Insurance Co. Ltd. (H Shares) | 500,000 | | 3,390,333 |
China Merchants Bank Co. Ltd. (H Shares) | 310,000 | | 1,598,426 |
China Oilfield Services Ltd. (H Shares) | 1,000,000 | | 2,448,853 |
China Petroleum & Chemical Corp. (H Shares) | 1,190,000 | | 1,974,329 |
China Shenhua Energy Co. Ltd. (H Shares) | 500,000 | | 3,222,141 |
Dalian Port (PDA) Co. Ltd. (H Shares) | 1,635,000 | | 1,513,981 |
Dongfang Electrical Machinery Co. Ltd. (H Shares) | 374,000 | | 3,343,390 |
Industrial & Commercial Bank of China | 4,000,000 | | 3,820,403 |
Nine Dragons Paper (Holdings) Ltd. | 850,000 | | 2,302,456 |
PetroChina Co. Ltd. (H Shares) | 3,328,000 | | 8,739,328 |
Ping An Insurance (Group) Co. of China, Ltd. (H Shares) | 350,000 | | 4,899,210 |
Sina Corp. (a) | 98,900 | | 5,669,937 |
SINOPEC Yizheng Chemical Fibre Co. Ltd. (H Shares) (a) | 3,000,000 | | 1,564,610 |
Common Stocks - continued |
| Shares | | Value |
China - continued |
Tencent Holdings Ltd. | 600,000 | | $ 5,143,431 |
Yantai Changyu Pioneer Wine Co. (B Shares) | 241,240 | | 1,797,707 |
TOTAL CHINA | | 57,562,421 |
Hong Kong - 17.6% |
Bank of East Asia Ltd. | 120,000 | | 816,471 |
Cheung Kong Holdings Ltd. | 290,000 | | 5,688,400 |
China Mobile (Hong Kong) Ltd. | 736,000 | | 15,261,695 |
China Netcom Group Corp. Hong Kong Ltd. | 700,000 | | 2,151,332 |
China Unicom Ltd. | 700,000 | | 1,716,400 |
CNOOC Ltd. | 1,238,500 | | 2,681,229 |
Esprit Holdings Ltd. | 132,500 | | 2,212,896 |
Fairwood Holdings Ltd. (e) | 600,000 | | 750,284 |
Hang Lung Properties Ltd. | 900,000 | | 4,329,922 |
Hang Seng Bank Ltd. | 80,000 | | 1,634,375 |
Hong Kong & Shanghai Hotels Ltd. | 174,000 | | 322,131 |
Hutchison Whampoa Ltd. | 77,000 | | 970,200 |
Kerry Properties Ltd. | 550,000 | | 4,783,961 |
Li & Fung Ltd. | 1,110,000 | | 5,267,274 |
Midland Holdings Ltd. | 1,564,000 | | 1,937,073 |
New World Development Co. Ltd. | 600,000 | | 2,162,518 |
Shougang Concord International Enterprises Co. Ltd. | 5,000,000 | | 2,698,055 |
Sun Hung Kai Properties Ltd. | 350,000 | | 6,688,747 |
Wing Hang Bank Ltd. | 70,000 | | 824,858 |
TOTAL HONG KONG | | 62,897,821 |
India - 9.4% |
Bajaj Auto Ltd. | 16,000 | | 1,017,969 |
Bharat Heavy Electricals Ltd. | 16,145 | | 1,080,662 |
Bharti Airtel Ltd. (a) | 152,768 | | 3,946,804 |
Container Corp. of India Ltd. | 10,000 | | 506,448 |
Educomp Solutions Ltd. | 38,160 | | 3,188,595 |
Idea Cellular Ltd. | 67,735 | | 234,837 |
IL&FS Investsmart Ltd. | 63,876 | | 285,532 |
INFO Edge India Ltd. | 53,892 | | 1,671,222 |
IVRCL Infrastructures & Projects Ltd. | 65,000 | | 846,509 |
Kotak Mahindra Bank Ltd. | 30,000 | | 770,493 |
Larsen & Toubro Ltd. | 11,558 | | 1,263,683 |
Max India Ltd. (a) | 111,250 | | 743,410 |
Punjab National Bank | 46,984 | | 745,499 |
Reliance Communication Ltd. | 150,854 | | 2,993,300 |
Reliance Industries Ltd. | 127,746 | | 9,118,526 |
Common Stocks - continued |
| Shares | | Value |
India - continued |
Royal Orchid Hotels Ltd. | 132,311 | | $ 437,669 |
Sesa Goa Ltd. | 7,646 | | 732,468 |
State Bank of India | 60,830 | | 3,816,763 |
TOTAL INDIA | | 33,400,389 |
Indonesia - 2.0% |
PT Bank Central Asia Tbk | 500,000 | | 408,072 |
PT Bank Niaga Tbk | 20,648,000 | | 1,989,387 |
PT Indosat Tbk | 1,500,000 | | 1,452,453 |
PT Mitra Adiperkasa Tbk | 2,913,500 | | 256,878 |
PT Perusahaan Gas Negara Tbk Series B | 1,800,000 | | 2,820,911 |
TOTAL INDONESIA | | 6,927,701 |
Korea (South) - 21.9% |
Daelim Industrial Co. | 16,000 | | 3,516,387 |
Dongbu Securities Co. Ltd. | 31,200 | | 654,954 |
Doosan Infracore Co. Ltd. | 40,000 | | 1,702,404 |
Hana Tour Service, Inc. | 29,000 | | 2,615,374 |
Hanwha Corp. | 20,000 | | 1,985,281 |
Hanwha Securities Co. Ltd. | 80,000 | | 2,421,877 |
Hyundai Mipo Dockyard Co. Ltd. | 7,680 | | 3,412,630 |
kiwoom.com Securities Co. Ltd. | 11,500 | | 1,109,803 |
Kookmin Bank | 49,140 | | 4,018,864 |
Korea Exchange Bank | 70,000 | | 1,157,895 |
Korean Reinsurance Co. | 36,000 | | 642,227 |
LG Chemical Ltd. | 12,000 | | 1,499,721 |
LG Household & Health Care Ltd. | 17,000 | | 3,790,242 |
LG.Philips LCD Co. Ltd. (a) | 17,170 | | 948,654 |
Meritz Securities Co. Ltd. | 93,659 | | 1,209,438 |
NHN Corp. (a) | 16,319 | | 5,247,834 |
POSCO | 14,372 | | 10,481,714 |
Samsung Corp. | 6,790 | | 628,477 |
Samsung Electronics Co. Ltd. | 17,317 | | 10,678,814 |
Samsung Fire & Marine Insurance Co. Ltd. | 10,000 | | 2,782,303 |
Shinhan Financial Group Co. Ltd. | 104,960 | | 6,873,306 |
Shinsegae Co. Ltd. | 2,000 | | 1,575,980 |
STX Pan Ocean Co. Ltd. | 700,000 | | 1,800,666 |
Taewoong Co. Ltd. | 50,000 | | 7,145,983 |
TSM Tech Co. Ltd. | 15,300 | | 299,881 |
TOTAL KOREA (SOUTH) | | 78,200,709 |
Malaysia - 2.7% |
Bumiputra-Commerce Holdings Bhd | 550,000 | | 1,912,783 |
Common Stocks - continued |
| Shares | | Value |
Malaysia - continued |
Hunza Properties Bhd | 342,100 | | $ 294,442 |
LCL Corp. Bhd | 468,900 | | 1,051,894 |
Malayan Banking BHD | 510,000 | | 1,723,728 |
Parkson Holdings Bhd | 300,000 | | 865,557 |
Resorts World Bhd | 1,264,700 | | 1,465,247 |
SP Setia Bhd | 600,000 | | 1,412,414 |
Zelan Bhd | 400,000 | | 726,235 |
TOTAL MALAYSIA | | 9,452,300 |
Papua New Guinea - 0.7% |
Lihir Gold Ltd. (a) | 650,000 | | 2,580,578 |
Philippines - 0.6% |
Jollibee Food Corp. | 700,000 | | 822,107 |
Philippine Long Distance Telephone Co. | 18,580 | | 1,285,732 |
TOTAL PHILIPPINES | | 2,107,839 |
Singapore - 4.4% |
Cosco Corp. Singapore Ltd. | 500,000 | | 2,715,397 |
F J Benjamin Holdings Ltd. | 1,800,000 | | 1,058,280 |
Keppel Corp. Ltd. | 190,000 | | 1,953,035 |
Parkway Holdings Ltd. | 685,650 | | 1,988,616 |
Raffles Medical Group Ltd. | 700,000 | | 744,751 |
SIA Engineering Co. Ltd. | 261,000 | | 858,493 |
Singapore Technologies Engineering Ltd. | 700,000 | | 1,851,848 |
United Overseas Bank Ltd. | 115,000 | | 1,725,144 |
Yangzijiang Shipbuilding Holdings Ltd. | 1,501,000 | | 2,673,028 |
TOTAL SINGAPORE | | 15,568,592 |
Taiwan - 14.1% |
Advanced Semiconductor Engineering, Inc. | 1,664,501 | | 2,004,059 |
Advantech Co. Ltd. | 105,297 | | 285,386 |
AU Optronics Corp. | 892,930 | | 1,901,904 |
China Steel Corp. | 2,165,000 | | 3,047,507 |
Chinatrust Financial Holding Co. Ltd. (a) | 1,420,319 | | 1,034,713 |
Chinatrust Financial Holding Co. Ltd. warrants (UBS Warrant Programme) 2/8/08 (a) | 254,240 | | 185,193 |
Delta Electronics, Inc. | 441,000 | | 1,769,718 |
E-Life Mall Corp. Ltd. | 258,030 | | 517,733 |
EVA Airways Corp. | 2,117,592 | | 853,051 |
Far East Department Stores Co. Ltd. | 1,248,000 | | 1,521,716 |
Far Eastern Textile Ltd. | 1,910,620 | | 2,524,295 |
Formosa International Hotel Corp. | 12,260 | | 121,105 |
Common Stocks - continued |
| Shares | | Value |
Taiwan - continued |
Formosa Plastics Corp. | 750,000 | | $ 2,310,542 |
Fuhwa Financial Holding Co. Ltd. (a) | 3,702,054 | | 2,719,830 |
Hung Poo Real Estate Development Co. Ltd. | 606,000 | | 602,352 |
Les Enphants Co. Ltd. | 1,200,000 | | 1,016,824 |
MediaTek, Inc. | 206,850 | | 4,041,860 |
Nan Ya Plastics Corp. | 1,143,000 | | 3,411,888 |
Nan Ya Printed Circuit Board Corp. | 399,283 | | 2,619,158 |
Phoenix Precision Technology Corp. | 1,956,938 | | 2,470,714 |
Shin Kong Financial Holding Co. Ltd. warrants (UBS Warrant Programme) 11/19/07 (a) | 1,050,703 | | 972,903 |
Siliconware Precision Industries Co. Ltd. | 611,837 | | 1,289,967 |
Sinyi Realty, Inc. | 460,243 | | 1,221,821 |
Taiwan Cement Corp. | 1,465,679 | | 2,497,468 |
Taiwan Semiconductor Manufacturing Co. Ltd. | 2,617,140 | | 5,154,299 |
Tsann Kuen Enterprise Co. Ltd. | 800,000 | | 1,215,002 |
Wistron Corp. | 472,338 | | 940,448 |
WPG Holding Co. Ltd. | 1,000,000 | | 1,651,489 |
Yageo Corp. | 908,000 | | 354,567 |
TOTAL TAIWAN | | 50,257,512 |
Thailand - 1.9% |
ACL Bank PCL (For. Reg.) (a) | 1,017,800 | | 175,199 |
Bumrungrad Hospital PCL (For. Reg.) | 1,068,700 | | 1,391,496 |
Central Pattana PCL (For. Reg.) | 2,000,000 | | 1,515,374 |
LPN Development PCL | 3,000,000 | | 754,745 |
Minor International PCL (For. Reg.) | 2,119,908 | | 1,110,324 |
Robinson Department Store PCL (For. Reg.) | 2,500,000 | | 750,331 |
Siam Commercial Bank PCL (For. Reg.) | 400,000 | | 1,118,140 |
True Corp. PCL (For. Reg.) rights 4/30/08 (a) | 190,863 | | 0 |
TOTAL THAILAND | | 6,815,609 |
TOTAL COMMON STOCKS (Cost $217,355,805) | 343,553,509 |
Money Market Funds - 3.4% |
| Shares | | Value |
Fidelity Cash Central Fund, 4.97% (b) | 11,913,545 | | $ 11,913,545 |
Fidelity Securities Lending Cash Central Fund, 5.02% (b)(c) | 357,750 | | 357,750 |
TOTAL MONEY MARKET FUNDS (Cost $12,271,295) | 12,271,295 |
TOTAL INVESTMENT PORTFOLIO - 99.8% (Cost $229,627,100) | | 355,824,804 |
NET OTHER ASSETS - 0.2% | | 762,792 |
NET ASSETS - 100% | $ 356,587,596 |
Legend |
(a) Non-income producing |
(b) Affiliated fund that is available only to investment companies and other accounts managed by Fidelity Investments. The rate quoted is the annualized seven-day yield of the fund at period end. A complete unaudited listing of the fund's holdings as of its most recent quarter end is available upon request. |
(c) Investment made with cash collateral received from securities on loan. |
(d) Security or a portion of the security is on loan at period end. |
(e) Security exempt from registration under Rule 144A of the Securities Act of 1933. These securities may be resold in transactions exempt from registration, normally to qualified institutional buyers. At the end of the period, the value of these securities amounted to $750,284 or 0.2% of net assets. |
Affiliated Central Funds |
Information regarding fiscal year to date income earned by the Fund from investments in Fidelity Central Funds is as follows: |
Fund | Income earned |
Fidelity Cash Central Fund | $ 577,405 |
Fidelity Securities Lending Cash Central Fund | 3,118 |
Total | $ 580,523 |
See accompanying notes which are an integral part of the financial statements.
Annual Report
Financial Statements
Statement of Assets and Liabilities
| October 31, 2007 |
Assets | | |
Investment in securities, at value (including securities loaned of $357,840) - See accompanying schedule: Unaffiliated issuers (cost $217,355,805) | $ 343,553,509 | |
Fidelity Central Funds (cost $12,271,295) | 12,271,295 | |
Total Investments (cost $229,627,100) | | $ 355,824,804 |
Foreign currency held at value (cost $298) | | 305 |
Receivable for investments sold | | 151,760 |
Receivable for fund shares sold | | 2,532,200 |
Dividends receivable | | 129,136 |
Distributions receivable from Fidelity Central Funds | | 84,252 |
Prepaid expenses | | 56 |
Other receivables | | 388,407 |
Total assets | | 359,110,920 |
| | |
Liabilities | | |
Payable for investments purchased | $ 83,393 | |
Payable for fund shares redeemed | 1,519,087 | |
Accrued management fee | 211,619 | |
Distribution fees payable | 146,308 | |
Other affiliated payables | 74,315 | |
Other payables and accrued expenses | 130,852 | |
Collateral on securities loaned, at value | 357,750 | |
Total liabilities | | 2,523,324 |
| | |
Net Assets | | $ 356,587,596 |
Net Assets consist of: | | |
Paid in capital | | $ 194,717,799 |
Undistributed net investment income | | 1,229,931 |
Accumulated undistributed net realized gain (loss) on investments and foreign currency transactions | | 34,394,993 |
Net unrealized appreciation (depreciation) on investments and assets and liabilities in foreign currencies | | 126,244,873 |
Net Assets | | $ 356,587,596 |
See accompanying notes which are an integral part of the financial statements.
Annual Report
Financial Statements - continued
Statement of Assets and Liabilities - continued
| October 31, 2007 |
Calculation of Maximum Offering Price
Class A:
Net Asset Value and redemption price per share ($152,629,813 ÷ 4,064,942 shares) | | $ 37.55 |
| | |
Maximum offering price per share (100/94.25 of $37.55) | | $ 39.84 |
Class T:
Net Asset Value and redemption price per share ($64,812,780 ÷ 1,757,472 shares) | | $ 36.88 |
| | |
Maximum offering price per share (100/96.50 of $36.88) | | $ 38.22 |
Class B:
Net Asset Value and offering price per share ($40,775,176 ÷ 1,146,861 shares)A | | $ 35.55 |
| | |
Class C:
Net Asset Value and offering price per share ($82,069,519 ÷ 2,313,403 shares)A | | $ 35.48 |
| | |
| | |
Institutional Class:
Net Asset Value, offering price and redemption price per share ($16,300,308 ÷ 426,175 shares) | | $ 38.25 |
A Redemption price per share is equal to net asset value less any applicable contingent deferred sales charge.
See accompanying notes which are an integral part of the financial statements.
Annual Report
Statement of Operations
| Year ended October 31, 2007 |
Investment Income | | |
Dividends | | $ 4,959,878 |
Interest | | 123 |
Income from Fidelity Central Funds | | 580,523 |
| | 5,540,524 |
Less foreign taxes withheld | | (556,806) |
Total income | | 4,983,718 |
| | |
Expenses | | |
Management fee | $ 1,542,886 | |
Transfer agent fees | 590,425 | |
Distribution fees | 1,202,317 | |
Accounting and security lending fees | 113,535 | |
Custodian fees and expenses | 268,641 | |
Independent trustees' compensation | 687 | |
Registration fees | 69,881 | |
Audit | 122,539 | |
Legal | 1,283 | |
Miscellaneous | (464) | |
Total expenses before reductions | 3,911,730 | |
Expense reductions | (188,614) | 3,723,116 |
Net investment income (loss) | | 1,260,602 |
Realized and Unrealized Gain (Loss) Net realized gain (loss) on: | | |
Investment securities: | | |
Unaffiliated issuers | 35,116,360 | |
Foreign currency transactions | 7,539 | |
Total net realized gain (loss) | | 35,123,899 |
Change in net unrealized appreciation (depreciation) on: Investment securities | 100,705,699 | |
Assets and liabilities in foreign currencies | 46,677 | |
Total change in net unrealized appreciation (depreciation) | | 100,752,376 |
Net gain (loss) | | 135,876,275 |
Net increase (decrease) in net assets resulting from operations | | $ 137,136,877 |
See accompanying notes which are an integral part of the financial statements.
Annual Report
Financial Statements - continued
Statement of Changes in Net Assets
| Year ended
October 31,
2007 | Year ended
October 31,
2006 |
Increase (Decrease) in Net Assets | | |
Operations | | |
Net investment income (loss) | $ 1,260,602 | $ 874,526 |
Net realized gain (loss) | 35,123,899 | 12,459,470 |
Change in net unrealized appreciation (depreciation) | 100,752,376 | 17,978,097 |
Net increase (decrease) in net assets resulting
from operations | 137,136,877 | 31,312,093 |
Distributions to shareholders from net investment income | (705,473) | (546,550) |
Distributions to shareholders from net realized gain | (11,219,115) | (6,267,718) |
Total distributions | (11,924,588) | (6,814,268) |
Share transactions - net increase (decrease) | 89,486,791 | 42,747,494 |
Redemption fees | 131,185 | 69,319 |
Total increase (decrease) in net assets | 214,830,265 | 67,314,638 |
| | |
Net Assets | | |
Beginning of period | 141,757,331 | 74,442,693 |
End of period (including undistributed net investment income of $1,229,931 and undistributed net investment income of $779,401, respectively) | $ 356,587,596 | $ 141,757,331 |
See accompanying notes which are an integral part of the financial statements.
Annual Report
Financial Highlights - Class A
Years ended October 31, | 2007 | 2006 | 2005 | 2004 | 2003 |
Selected Per-Share Data | | | | | |
Net asset value, beginning of period | $ 22.48 | $ 17.70 | $ 13.96 | $ 13.07 | $ 9.89 |
Income from Investment Operations | | | | | |
Net investment income (loss) C | .24 | .22 | .18 | .03 | .07 |
Net realized and unrealized gain (loss) | 16.64 | 6.10 | 3.61 | 1.00 H | 3.11 |
Total from investment operations | 16.88 | 6.32 | 3.79 | 1.03 | 3.18 |
Distributions from net investment income | (.15) | (.16) | - | (.15) | - |
Distributions from net realized gain | (1.68) | (1.39) | (.05) | - | - |
Total distributions | (1.83) | (1.55) | (.05) | (.15) | - |
Redemption fees added to paid in capital C | .02 | .01 | - G | .01 | - |
Net asset value, end of period | $ 37.55 | $ 22.48 | $ 17.70 | $ 13.96 | $ 13.07 |
Total Return A, B | 80.43% | 38.02% | 27.23% | 8.01%H | 32.15% |
Ratios to Average Net Assets D, F | | | | | |
Expenses before reductions | 1.47% | 1.73% | 1.90% | 2.24% | 2.81% |
Expenses net of fee waivers, if any | 1.47% | 1.50% | 1.61% | 2.00% | 2.02% |
Expenses net of all reductions | 1.40% | 1.39% | 1.55% | 1.99% | 2.02% |
Net investment income (loss) | .88% | 1.08% | 1.08% | .21% | .70% |
Supplemental Data | | | | | |
Net assets, end of period (000 omitted) | $ 152,630 | $55,790 | $30,782 | $21,099 | $24,161 |
Portfolio turnover rate E | 66% | 77% | 66% | 232% | 172% |
A Total returns would have been lower had certain expenses not been reduced during the periods shown.
B Total returns do not include the effect of the sales charges.
C Calculated based on average shares outstanding during the period.
D Fees and expenses of the underlying Fidelity Central Funds are not included in the Fund's expense ratio. The Fund indirectly bears its proportionate share of the expenses of any underlying Fidelity Central Funds.
E Amount does not include the portfolio activity of any underlying Fidelity Central Funds.
F Expense ratios reflect operating expenses of the class. Expenses before reductions do not reflect amounts reimbursed by the investment adviser or reductions from brokerage service arrangements or other expense offset arrangements and do not represent the amount paid by the class during periods when reimbursements or reductions occur. Expenses net of fee waivers reflect expenses after reimbursement by the investment adviser but prior to reductions from brokerage service arrangements or other expense offset arrangements. Expenses net of all reductions represent the net expenses paid by the class.
G Amount represents less than $.01 per share.
H In 2004 the Fund received a favorable ruling in India which entitles the Fund to a refund of capital gains taxes paid in the current and prior years. The impact to the Fund was an increase in realized and unrealized gain (loss) per share of $.51. Excluding this benefit, the total return would have been 4.18%. The realized and unrealized gains were allocated on a pro rata basis to each class based on the relative net assets of each class to the total net assets of the Fund.
See accompanying notes which are an integral part of the financial statements.
Annual Report
Financial Highlights - Class T
Years ended October 31, | 2007 | 2006 | 2005 | 2004 | 2003 |
Selected Per-Share Data | | | | | |
Net asset value, beginning of period | $ 22.13 | $ 17.45 | $ 13.80 | $ 12.92 | $ 9.81 |
Income from Investment Operations | | | | | |
Net investment income (loss) C | .16 | .17 | .14 | - | .05 |
Net realized and unrealized gain (loss) | 16.37 | 6.01 | 3.56 | .99 H | 3.06 |
Total from investment operations | 16.53 | 6.18 | 3.70 | .99 | 3.11 |
Distributions from net investment income | (.12) | (.12) | - | (.12) | - |
Distributions from net realized gain | (1.68) | (1.39) | (.05) | - | - |
Total distributions | (1.80) | (1.51) | (.05) | (.12) | - |
Redemption fees added to paid in capital C | .02 | .01 | - G | .01 | - |
Net asset value, end of period | $ 36.88 | $ 22.13 | $ 17.45 | $ 13.80 | $ 12.92 |
Total Return A, B | 79.98% | 37.69% | 26.89% | 7.78% H | 31.70% |
Ratios to Average Net Assets D, F | | | | | |
Expenses before reductions | 1.79% | 2.07% | 2.27% | 2.76% | 3.43% |
Expenses net of fee waivers, if any | 1.75% | 1.75% | 1.84% | 2.25% | 2.27% |
Expenses net of all reductions | 1.67% | 1.64% | 1.79% | 2.24% | 2.26% |
Net investment income (loss) | .61% | .83% | .85% | (.04)% | .45% |
Supplemental Data | | | | | |
Net assets, end of period (000 omitted) | $ 64,813 | $ 28,850 | $ 14,074 | $ 7,658 | $ 4,982 |
Portfolio turnover rate E | 66% | 77% | 66% | 232% | 172% |
A Total returns would have been lower had certain expenses not been reduced during the periods shown.
B Total returns do not include the effect of the sales charges.
C Calculated based on average shares outstanding during the period.
D Fees and expenses of the underlying Fidelity Central Funds are not included in the Fund's expense ratio. The Fund indirectly bears its proportionate share of the expenses of any underlying Fidelity Central Funds.
E Amount does not include the portfolio activity of any underlying Fidelity Central Funds.
F Expense ratios reflect operating expenses of the class. Expenses before reductions do not reflect amounts reimbursed by the investment adviser or reductions from brokerage service arrangements or other expense offset arrangements and do not represent the amount paid by the class during periods when reimbursements or reductions occur. Expenses net of fee waivers reflect expenses after reimbursement by the investment adviser but prior to reductions from brokerage service arrangements or other expense offset arrangements. Expenses net of all reductions represent the net expenses paid by the class.
G Amount represents less than $.01 per share.
H In 2004 the Fund received a favorable ruling in India which entitles the Fund to a refund of capital gains taxes paid in the current and prior years. The impact to the Fund was an increase in realized and unrealized gain (loss) per share of $.51. Excluding this benefit, the total return would have been 4.18%. The realized and unrealized gains were allocated on a pro rata basis to each class based on the relative net assets of each class to the total net assets of the Fund.
See accompanying notes which are an integral part of the financial statements.
Annual Report
Financial Highlights - Class B
Years ended October 31, | 2007 | 2006 | 2005 | 2004 | 2003 |
Selected Per-Share Data | | | | | |
Net asset value, beginning of period | $ 21.42 | $ 16.94 | $ 13.46 | $ 12.64 | $ 9.63 |
Income from Investment Operations | | | | | |
Net investment income (loss) C | .03 | .06 | .06 | (.07) | (.01) |
Net realized and unrealized gain (loss) | 15.79 | 5.84 | 3.47 | .96 H | 3.02 |
Total from investment operations | 15.82 | 5.90 | 3.53 | .89 | 3.01 |
Distributions from net investment income | (.03) | (.04) | - | (.08) | - |
Distributions from net realized gain | (1.68) | (1.39) | (.05) | - | - |
Total distributions | (1.71) | (1.43) | (.05) | (.08) | - |
Redemption fees added to paid in capital C | .02 | .01 | - G | .01 | - |
Net asset value, end of period | $ 35.55 | $ 21.42 | $ 16.94 | $ 13.46 | $ 12.64 |
Total Return A, B | 79.01% | 36.99% | 26.31% | 7.14% H | 31.26% |
Ratios to Average Net Assets D, F | | | | | |
Expenses before reductions | 2.28% | 2.59% | 2.75% | 3.19% | 3.87% |
Expenses net of fee waivers, if any | 2.25% | 2.25% | 2.35% | 2.75% | 2.77% |
Expenses net of all reductions | 2.17% | 2.14% | 2.29% | 2.74% | 2.77% |
Net investment income (loss) | .11% | .33% | .34% | (.54)% | (.05)% |
Supplemental Data | | | | | |
Net assets, end of period (000 omitted) | $ 40,775 | $ 18,985 | $ 11,504 | $ 7,065 | $ 5,157 |
Portfolio turnover rate E | 66% | 77% | 66% | 232% | 172% |
A Total returns would have been lower had certain expenses not been reduced during the periods shown.
B Total returns do not include the effect of the contingent deferred sales charge.
C Calculated based on average shares outstanding during the period.
D Fees and expenses of the underlying Fidelity Central Funds are not included in the Fund's expense ratio. The Fund indirectly bears its proportionate share of the expenses of any underlying Fidelity Central Funds.
E Amount does not include the portfolio activity of any underlying Fidelity Central Funds.
F Expense ratios reflect operating expenses of the class. Expenses before reductions do not reflect amounts reimbursed by the investment adviser or reductions from brokerage service arrangements or other expense offset arrangements and do not represent the amount paid by the class during periods when reimbursements or reductions occur. Expenses net of fee waivers reflect expenses after reimbursement by the investment adviser but prior to reductions from brokerage service arrangements or other expense offset arrangements. Expenses net of all reductions represent the net expenses paid by the class.
G Amount represents less than $.01 per share.
H In 2004 the Fund received a favorable ruling in India which entitles the Fund to a refund of capital gains taxes paid in the current and prior years. The impact to the Fund was an increase in realized and unrealized gain (loss) per share of $.51. Excluding this benefit, the total return would have been 4.18%. The realized and unrealized gains were allocated on a pro rata basis to each class based on the relative net assets of each class to the total net assets of the Fund.
See accompanying notes which are an integral part of the financial statements.
Annual Report
Financial Highlights - Class C
Years ended October 31, | 2007 | 2006 | 2005 | 2004 | 2003 |
Selected Per-Share Data | | | | | |
Net asset value, beginning of period | $ 21.39 | $ 16.94 | $ 13.46 | $ 12.65 | $ 9.64 |
Income from Investment Operations | | | | | |
Net investment income (loss) C | .04 | .06 | .06 | (.07) | (.01) |
Net realized and unrealized gain (loss) | 15.76 | 5.84 | 3.47 | .96 H | 3.02 |
Total from investment operations | 15.80 | 5.90 | 3.53 | .89 | 3.01 |
Distributions from net investment income | (.05) | (.07) | - | (.09) | - |
Distributions from net realized gain | (1.68) | (1.39) | (.05) | - | - |
Total distributions | (1.73) | (1.46) | (.05) | (.09) | - |
Redemption fees added to paid in capital C | .02 | .01 | - G | .01 | - |
Net asset value, end of period | $ 35.48 | $ 21.39 | $ 16.94 | $ 13.46 | $ 12.65 |
Total Return A, B | 79.05% | 37.02% | 26.31% | 7.14%H | 31.22% |
Ratios to Average Net Assets D, F | | | | | |
Expenses before reductions | 2.21% | 2.46% | 2.67% | 3.02% | 3.70% |
Expenses net of fee waivers, if any | 2.21% | 2.25% | 2.34% | 2.75% | 2.77% |
Expenses net of all reductions | 2.13% | 2.14% | 2.28% | 2.74% | 2.76% |
Net investment income (loss) | .14% | .33% | .35% | (.54)% | (.05)% |
Supplemental Data | | | | | |
Net assets, end of period (000 omitted) | $82,070 | $33,047 | $13,291 | $ 6,484 | $ 4,581 |
Portfolio turnover rate E | 66% | 77% | 66% | 232% | 172% |
A Total returns would have been lower had certain expenses not been reduced during the periods shown.
B Total returns do not include the effect of the contingent deferred sales charge.
C Calculated based on average shares outstanding during the period.
D Fees and expenses of the underlying Fidelity Central Funds are not included in the Fund's expense ratio. The Fund indirectly bears its proportionate share of the expenses of any underlying Fidelity Central Funds.
E Amount does not include the portfolio activity of any underlying Fidelity Central Funds.
F Expense ratios reflect operating expenses of the class. Expenses before reductions do not reflect amounts reimbursed by the investment adviser or reductions from brokerage service arrangements or other expense offset arrangements and do not represent the amount paid by the class during periods when reimbursements or reductions occur. Expenses net of fee waivers reflect expenses after reimbursement by the investment adviser but prior to reductions from brokerage service arrangements or other expense offset arrangements. Expenses net of all reductions represent the net expenses paid by the class.
G Amount represents less than $.01 per share.
H In 2004 the Fund received a favorable ruling in India which entitles the Fund to a refund of capital gains taxes paid in the current and prior years. The impact to the Fund was an increase in realized and unrealized gain (loss) per share of $.51. Excluding this benefit, the total return would have been 4.18%. The realized and unrealized gains were allocated on a pro rata basis to each class based on the relative net assets of each class to the total net assets of the Fund.
See accompanying notes which are an integral part of the financial statements.
Annual Report
Financial Highlights - Institutional Class
Years ended October 31, | 2007 | 2006 | 2005 | 2004 | 2003 |
Selected Per-Share Data | | | | | |
Net asset value, beginning of period | $ 22.84 | $ 17.97 | $ 14.13 | $ 13.20 | $ 9.97 |
Income from Investment Operations | | | | | |
Net investment income (loss) | .34 | .27 | .24 | .06 | .10 |
Net realized and unrealized gain (loss) B | 16.92 | 6.19 | 3.65 | 1.01 G | 3.13 |
Total from investment operations | 17.26 | 6.46 | 3.89 | 1.07 | 3.23 |
Distributions from net investment income | (.19) | (.21) | - | (.15) | - |
Distributions from net realized gain | (1.68) | (1.39) | (.05) | - | - |
Total distributions | (1.87) | (1.60) | (.05) | (.15) | - |
Redemption fees added to paid in capital B | .02 | .01 | - F | .01 | - |
Net asset value, end of period | $ 38.25 | $ 22.84 | $ 17.97 | $ 14.13 | $ 13.20 |
Total Return A | 80.97% | 38.28% | 27.61% | 8.24% G | 32.40% |
Ratios to Average Net AssetsC, E | | | | |
Expenses before reductions | 1.16% | 1.41% | 1.52% | 2.11% | 2.55% |
Expenses net of fee waivers, if any | 1.16% | 1.25% | 1.29% | 1.75% | 1.77% |
Expenses net of all reductions | 1.08% | 1.14% | 1.24% | 1.74% | 1.77% |
Net investment income (loss) | 1.20% | 1.33% | 1.40% | .46% | .94% |
Supplemental Data | | | | | |
Net assets, end of period (000 omitted) | $16,300 | $ 5,086 | $ 4,791 | $ 452 | $ 1,538 |
Portfolio turnover rate D | 66% | 77% | 66% | 232% | 172% |
A Total returns would have been lower had certain expenses not been reduced during the periods shown.
B Calculated based on average shares outstanding during the period.
C Fees and expenses of the underlying Fidelity Central Funds are not included in the Fund's expense ratio. The Fund indirectly bears its proportionate share of the expenses of any underlying Fidelity Central Funds.
D Amount does not include the portfolio activity of any underlying Fidelity Central Funds.
E Expense ratios reflect operating expenses of the class. Expenses before reductions do not reflect amounts reimbursed by the investment adviser or reductions from brokerage service arrangements or other expense offset arrangements and do not represent the amount paid by the class during periods when reimbursements or reductions occur. Expenses net of fee waivers reflect expenses after reimbursement by the investment adviser but prior to reductions from brokerage service arrangements or other expense offset arrangements. Expenses net of all reductions represent the net expenses paid by the class.
F Amount represents less than $.01 per share.
G In 2004 the Fund received a favorable ruling in India which entitles the Fund to a refund of capital gains taxes paid in the current and prior years. The impact to the Fund was an increase in realized and unrealized gain (loss) per share of $.51. Excluding this benefit, the total return would have been 4.18%. The realized and unrealized gains were allocated on a pro rata basis to each class based on the relative net assets of each class to the total net assets of the Fund.
See accompanying notes which are an integral part of the financial statements.
Annual Report
Notes to Financial Statements
For the period ended October 31, 2007
1. Organization.
Fidelity Advisor Emerging Asia Fund (the Fund) is a fund of Fidelity Advisor Series VIII (the trust) and is authorized to issue an unlimited number of shares. The trust is registered under the Investment Company Act of 1940, as amended (the 1940 Act), as an open-end management investment company organized as a Massachusetts business trust. The Fund offers Class A, Class T, Class B, Class C, and Institutional Class shares, each of which has equal rights as to assets and voting privileges. Each class has exclusive voting rights with respect to matters that affect that class. Class B shares will automatically convert to Class A shares after a holding period of seven years from the initial date of purchase. Investment income, realized and unrealized capital gains and losses, the common expenses of the Fund, and certain fund-level expense reductions, if any, are allocated on a pro rata basis to each class based on the relative net assets of each class to the total net assets of the Fund. Each class differs with respect to transfer agent and distribution and service plan fees incurred. Certain expense reductions also differ by class. The Fund's investments in emerging markets can be subject to social, economic, regulatory, and political uncertainties and can be extremely volatile.
2. Investments in Fidelity Central Funds.
The Fund may invest in Fidelity Central Funds, which are open-end investment companies available only to other investment companies and accounts managed by Fidelity Management & Research Company (FMR) and its affiliates. The Fund's Schedule of Investments lists each of the Fidelity Central Funds as an investment of the Fund, but does not include the underlying holdings of each Fidelity Central Fund. As an Investing Fund, the Fund indirectly bears its proportionate share of the expenses of the underlying Fidelity Central Funds.
The Money Market Central Funds seek preservation of capital and current income and are managed by Fidelity Investments Money Management, Inc. (FIMM), an affiliate of FMR.
A complete list of holdings for each Fidelity Central Fund is available upon request or at the SEC's web site at www.sec.gov. In addition, the financial statements of the Fidelity Central Funds, which are not covered by the Fund's Report of Independent Registered Public Accounting Firm, are available on the SEC's web site or upon request.
3. Significant Accounting Policies.
The financial statements have been prepared in conformity with accounting principles generally accepted in the United States of America, which require management to make certain estimates and assumptions at the date of the financial statements. The following summarizes the significant accounting policies of the Fund:
Annual Report
3. Significant Accounting Policies - continued
Security Valuation. Investments are valued and net asset value (NAV) per share is calculated (NAV calculation) as of the close of business of the New York Stock Exchange (NYSE), normally 4:00 p.m. Eastern time. Wherever possible, the Fund uses independent pricing services approved by the Board of Trustees to value its investments.
Equity securities, including restricted securities, for which market quotations are readily available, are valued at the last reported sale price or official closing price as reported by an independent pricing service on the primary market or exchange on which they are traded. In the event there were no sales during the day or closing prices are not available, securities are valued at the last quoted bid price. Investments in open-end mutual funds, including the Fidelity Central Funds, are valued at their closing net asset value each business day. Short-term securities with remaining maturities of sixty days or less for which quotations are not readily available are valued at amortized cost, which approximates value.
When current market prices or quotations are not readily available or do not accurately reflect fair value, valuations may be determined in accordance with procedures adopted by the Board of Trustees. For example, when developments occur between the close of a market and the close of the NYSE that may materially affect the value of some or all of the securities, or when trading in a security is halted, those securities may be fair valued. Factors used in the determination of fair value may include monitoring news to identify significant market or security specific events such as changes in the value of U.S. securities markets, reviewing developments in foreign markets and evaluating the performance of ADRs, futures contracts and exchange-traded funds. Because the Fund's utilization of fair value pricing depends on market activity, the frequency with which fair value pricing is used cannot be predicted and may be utilized to a significant extent. The value of securities used for NAV calculation under fair value pricing may differ from published prices for the same securities.
Foreign Currency. The Fund uses foreign currency contracts to facilitate transactions in foreign-denominated securities. Losses from these transactions may arise from changes in the value of the foreign currency or if the counterparties do not perform under the contracts' terms.
Foreign-denominated assets, including investment securities, and liabilities are translated into U.S. dollars at the exchange rate at period end. Purchases and sales of investment securities, income and dividends received and expenses denominated in foreign currencies are translated into U.S. dollars at the exchange rate in effect on the transaction date.
Annual Report
Notes to Financial Statements - continued
3. Significant Accounting Policies - continued
Foreign Currency - continued
The effects of exchange rate fluctuations on investments are included with the net realized and unrealized gain (loss) on investment securities. Other foreign currency transactions resulting in realized and unrealized gain (loss) are disclosed separately.
Investment Transactions and Income. For financial reporting purposes, the Fund's investment holdings and NAV include trades executed through the end of the last business day of the period. The NAV for processing shareholder transactions includes trades executed through the end of the prior business day. Gains and losses on securities sold are determined on the basis of identified cost and may include proceeds received from litigation. Dividend income is recorded on the ex-dividend date, except for certain dividends from foreign securities where the ex-dividend date may have passed, which are recorded as soon as the Fund is informed of the ex-dividend date. Non-cash dividends included in dividend income, if any, are recorded at the fair market value of the securities received. Interest income and distributions from the Fidelity Central Funds are accrued as earned. Interest income includes coupon interest and amortization of premium and accretion of discount on debt securities. Investment income is recorded net of foreign taxes withheld where recovery of such taxes is uncertain.
Expenses. Most expenses of the trust can be directly attributed to a fund. Expenses which cannot be directly attributed are apportioned among each Fund in the trust. Expense estimates are accrued in the period to which they relate and adjustments are made when actual amounts are known.
Income Tax Information and Distributions to Shareholders. Each year, the Fund intends to qualify as a regulated investment company by distributing all of its taxable income and realized gains under Subchapter M of the Internal Revenue Code. As a result, no provision for income taxes is required in the accompanying financial statements. Foreign taxes are provided for based on the Fund's understanding of the tax rules and rates that exist in the foreign markets in which it invests. The Fund received a final ruling from the Authority for Advance Ruling in India regarding the applicability of taxes imposed by the country on realized capital gains under the US/India tax treaty. The ruling entitled the Fund to a refund of capital gains taxes paid in prior years and exempts the Fund from taxes on future realized gains.
The per-share and total return impacts are disclosed on the Financial Highlights. The India Central Board of Direct Taxation may challenge the ruling at any time which could result in the reversal of some or all of the benefits recorded by the Fund.
Annual Report
3. Significant Accounting Policies - continued
Income Tax Information and Distributions to Shareholders - continued
Distributions are recorded on the ex-dividend date. Income dividends and capital gain distributions are declared separately for each class. Income and capital gain distributions are determined in accordance with income tax regulations, which may differ from generally accepted accounting principles. In addition, the Fund will claim a portion of the payment made to redeeming shareholders as a distribution for income tax purposes.
Capital accounts within the financial statements are adjusted for permanent book-tax differences. Certain adjustments have been made to the accounts relating to prior periods. Collectively, these adjustments have no impact on net assets or the results of operations. Temporary book-tax differences will reverse in a subsequent period.
Book-tax differences are primarily due to foreign currency transactions, passive foreign investment companies (PFIC) and losses deferred due to wash sales.
The tax-basis components of distributable earnings and the federal tax cost as of period end were as follows:
Unrealized appreciation | $ 128,910,629 |
Unrealized depreciation | (2,717,654) |
Net unrealized appreciation (depreciation) | 126,192,975 |
Undistributed ordinary income | 17,464,264 |
Undistributed long-term capital gain | 13,689,563 |
Cost for federal income tax purposes | $ 229,631,829 |
The tax character of distributions paid was as follows:
| October 31, 2007 | October 31, 2006 |
Ordinary Income | $ 6,114,690 | $ 5,416,432 |
Long-term Capital Gains | 5,809,898 | 1,397,836 |
Total | $ 11,924,588 | $ 6,814,268 |
Short-Term Trading (Redemption) Fees. Shares held in the Fund less than 90 days are subject to a redemption fee equal to 1.50% of the proceeds of the redeemed shares. All redemption fees, including any estimated redemption fees paid by FMR, are retained by the Fund and accounted for as an addition to paid in capital.
Annual Report
Notes to Financial Statements - continued
3. Significant Accounting Policies - continued
New Accounting Pronouncements. In July 2006, Financial Accounting Standards Board Interpretation No. 48, Accounting for Uncertainty in Income Taxes - an interpretation of FASB Statement 109 (FIN 48), was issued and is effective on the last business day of the semiannual reporting period for fiscal years beginning after December 15, 2006. FIN 48 sets forth a threshold for financial statement recognition, measurement and disclosure of a tax position taken or expected to be taken on a tax return. Management has concluded that the adoption of FIN 48 will not result in a material impact on the Fund's net assets, results of operations and financial statement disclosures.
In addition, in September 2006, Statement of Financial Accounting Standards No. 157, Fair Value Measurements (SFAS 157), was issued and is effective for fiscal years beginning after November 15, 2007. SFAS 157 defines fair value, establishes a framework for measuring fair value and expands disclosures about fair value measurements. Management is currently evaluating the impact the adoption of SFAS 157 will have on the Fund's financial statement disclosures.
4. Operating Policies.
Repurchase Agreements. FMR has received an Exemptive Order from the Securities and Exchange Commission (the SEC) which permits the Fund and other affiliated entities of FMR to transfer uninvested cash balances into joint trading accounts which are then invested in repurchase agreements. The Fund may also invest directly with institutions in repurchase agreements. Repurchase agreements are collateralized by government or non-government securities. Upon settlement date, collateral is held in segregated accounts with custodian banks and may be obtained in the event of a default of the counterparty. The Fund monitors, on a daily basis, the value of the collateral to ensure it is at least equal to the principal amount of the repurchase agreement (including accrued interest). In the event of a default by the counterparty, realization of the collateral proceeds could be delayed, during which time the value of the collateral may decline.
Restricted Securities. The Fund may invest in securities that are subject to legal or contractual restrictions on resale. These securities generally may be resold in transactions exempt from registration or to the public if the securities are registered. Disposal of these securities may involve time-consuming negotiations and expense, and prompt sale at an acceptable price may be difficult. Information regarding restricted securities is included at the end of the Fund's Schedule of Investments.
5. Purchases and Sales of Investments.
Purchases and sales of securities, other than short-term securities, aggregated $210,082,807 and $135,785,532, respectively.
Annual Report
6. Fees and Other Transactions with Affiliates.
Management Fee. FMR and its affiliates provide the Fund with investment management related services for which the Fund pays a monthly management fee. The management fee is the sum of an individual fund fee rate that is based on an annual rate of .45% of the Fund's average net assets and a group fee rate that averaged ..26% during the period. The group fee rate is based upon the average net assets of all the mutual funds advised by FMR. The group fee rate decreases as assets under management increase and increases as assets under management decrease. For the period, the total annual management fee rate was .71% of the Fund's average net assets.
Distribution and Service Plan. In accordance with Rule 12b-1 of the 1940 Act, the Fund has adopted separate Distribution and Service Plans for each class of shares. Certain classes pay Fidelity Distributors Corporation (FDC), an affiliate of FMR, separate Distribution and Service Fees, each of which is based on an annual percentage of each class' average net assets. In addition, FDC may pay financial intermediaries for selling shares of the Fund and providing shareholder support services. For the period, the Distribution and Service Fee rates and the total amounts paid to and retained by FDC were as follows:
| Distribution
Fee | Service
Fee | Paid to
FDC | Retained
by FDC |
Class A | -% | .25% | $ 222,594 | $ 15,762 |
Class T | .25% | .25% | 210,900 | 512 |
Class B | .75% | .25% | 271,630 | 204,139 |
Class C | .75% | .25% | 497,193 | 166,040 |
| | | $ 1,202,317 | $ 386,453 |
Sales Load. FDC receives a front-end sales charge of up to 5.75% for selling Class A shares, and 3.50% for selling Class T shares, some of which is paid to financial intermediaries for selling shares of the Fund. FDC receives the proceeds of contingent deferred sales charges levied on Class A, Class T, Class B, and Class C redemptions. These charges depend on the holding period. The deferred sales charges range from 5% to 1% for Class B, 1% for Class C, 1.00% to .50% for certain purchases of Class A shares and .25% for certain purchases of Class T shares.
Annual Report
Notes to Financial Statements - continued
6. Fees and Other Transactions with Affiliates -continued
Sales Load - continued
For the period, sales charge amounts retained by FDC were as follows:
| Retained
by FDC |
Class A | $ 159,971 |
Class T | 28,289 |
Class B* | 46,491 |
Class C* | 29,356 |
| $ 264,107 |
* When Class B and Class C shares are initially sold, FDC pays commissions from its own resources to financial intermediaries through which the sales are made.
Transfer Agent Fees. Fidelity Investments Institutional Operations Company, Inc. (FIIOC), an affiliate of FMR, is the transfer, dividend disbursing and shareholder servicing agent for each class of the Fund. FIIOC receives account fees and asset-based fees that vary according to the account size and type of account of the shareholders of the respective classes of the Fund. FIIOC pays for typesetting, printing and mailing of shareholder reports, except proxy statements. For the period, the total transfer agent fees paid by each class to FIIOC, were as follows:
| Amount | % of
Average
Net Assets |
Class A | $ 232,327 | .26 |
Class T | 133,732 | .32 |
Class B | 83,939 | .31 |
Class C | 122,374 | .24 |
Institutional Class | 18,053 | .19 |
| $ 590,425 | |
Accounting and Security Lending Fees. Fidelity Service Company, Inc. (FSC), an affiliate of FMR, maintains the Fund's accounting records. The accounting fee is based on the level of average net assets for the month. Under a separate contract, FSC administers the security lending program. The security lending fee is based on the number and duration of lending transactions.
Annual Report
7. Committed Line of Credit.
The Fund participates with other funds managed by FMR in a $4.2 billion credit facility (the "line of credit") to be utilized for temporary or emergency purposes to fund shareholder redemptions or for other short-term liquidity purposes. The Fund has agreed to pay commitment fees on its pro rata portion of the line of credit, which amounted to $412 and is reflected in Miscellaneous Expense on the Statement of Operations. During the period, there were no borrowings on this line of credit.
8. Security Lending.
The Fund lends portfolio securities from time to time in order to earn additional income. On the settlement date of the loan, the Fund receives collateral (in the form of U.S. Treasury obligations, letters of credit and/or cash) against the loaned securities and maintains collateral in an amount not less than 100% of the market value of the loaned securities during the period of the loan. The market value of the loaned securities is determined at the close of business of the Fund and any additional required collateral is delivered to the Fund on the next business day. If the borrower defaults on its obligation to return the securities loaned because of insolvency or other reasons, a fund could experience delays and costs in recovering the securities loaned or in gaining access to the collateral. Any cash collateral received is invested in the Fidelity Securities Lending Cash Central Fund. The value of loaned securities and cash collateral at period end are disclosed on the Fund's Statement of Assets and Liabilities. Security lending income represents the income earned on investing cash collateral, less fees and expenses associated with the loan, plus any premium payments that may be received on the loan of certain types of securities. Security lending income is presented in the Statement of Operations as a component of income from Fidelity Central Funds. Net income from lending portfolio securities during the period amounted to $3,118.
9. Expense Reductions.
FMR voluntarily agreed to reimburse each class to the extent annual operating expenses exceeded certain levels of average net assets as noted in the table below. Some expenses, for example interest expense, including commitment fees, are excluded from this reimbursement.
The following classes were in reimbursement during the period:
| Expense
Limitations | Reimbursement
from adviser |
Class T | 1.75% | $ 16,852 |
Class B | 2.25% | 8,867 |
| | $ 25,719 |
Annual Report
Notes to Financial Statements - continued
9. Expense Reductions - continued
Many of the brokers with whom FMR places trades on behalf of the Fund provided services to the Fund in addition to trade execution. These services included payments of certain expenses on behalf of the Fund totaling $159,250 for the period. In addition, through arrangements with the Fund's custodian and each class' transfer agent, credits realized as a result of uninvested cash balances were used to reduce the Fund's expenses. During the period, these credits reduced the Fund's custody expenses by $3,149. During the period, credits reduced each class' transfer agent expense as noted in the table below.
| Transfer Agent
expense reduction | |
Institutional Class | $ 198 | |
10. Other.
The Fund's organizational documents provide former and current trustees and officers with a limited indemnification against liabilities arising in connection with the performance of their duties to the Fund. In the normal course of business, the Fund may also enter into contracts that provide general indemnifications. The Fund's maximum exposure under these arrangements is unknown as this would be dependent on future claims that may be made against the Fund. The risk of material loss from such claims is considered remote.
In September 2006, FIIOC, the Fund's transfer agent notified the Fund that the Fund's books and records did not reflect a conversion of certain Class B to Class A shares upon their conversion date. In March 2007, FIIOC converted the relevant Class B shares to Class A shares and recorded the conversion in the books and records of the Fund which did not result in a material impact to the Fund's reported net assets or results of operations in the accompanying financial statements. FIIOC has remediated affected shareholders and reimbursed the Fund for all related audit and legal expenses.
Annual Report
11. Distributions to Shareholders.
Distributions to shareholders of each class were as follows:
| Years ended October 31, |
| 2007 | 2006 |
From net investment income | | |
Class A | $ 394,476 | $ 295,895 |
Class T | 160,784 | 104,293 |
Class B | 30,252 | 29,832 |
Class C | 75,200 | 61,147 |
Institutional Class | 44,761 | 55,383 |
Total | $ 705,473 | $ 546,550 |
From net realized gain | | |
Class A | $ 4,331,516 | $ 2,523,276 |
Class T | 2,269,882 | 1,169,089 |
Class B | 1,540,071 | 987,446 |
Class C | 2,688,016 | 1,214,208 |
Institutional Class | 389,630 | 373,699 |
Total | $ 11,219,115 | $ 6,267,718 |
12. Share Transactions.
Transactions for each class of shares were as follows:
| Shares
Years ended October 31, | Dollars
Years ended October 31, |
| 2007 | 2006 | 2007 | 2006 |
Class A | | | | |
Shares sold | 2,498,533 | 1,432,952 | $ 69,396,605 | $ 29,421,074 |
Reinvestment of distributions | 162,468 | 116,289 | 3,714,012 | 2,081,564 |
Shares redeemed | (1,077,457) | (806,635) | (29,208,159) | (16,443,108) |
Net increase (decrease) | 1,583,544 | 742,606 | $ 43,902,458 | $ 15,059,530 |
Class T | | | | |
Shares sold | 905,528 | 685,045 | $ 24,631,491 | $ 13,823,730 |
Reinvestment of distributions | 96,625 | 70,928 | 2,174,062 | 1,252,594 |
Shares redeemed | (548,117) | (258,935) | (14,491,120) | (5,230,235) |
Net increase (decrease) | 454,036 | 497,038 | $ 12,314,433 | $ 9,846,089 |
Class B | | | | |
Shares sold | 582,754 | 459,438 | $ 15,102,929 | $ 9,003,547 |
Reinvestment of distributions | 65,401 | 53,748 | 1,425,750 | 922,986 |
Shares redeemed | (387,524) | (306,089) | (9,787,762) | (6,064,575) |
Net increase (decrease) | 260,631 | 207,097 | $ 6,740,917 | $ 3,861,958 |
Annual Report
Notes to Financial Statements - continued
12. Share Transactions - continued
| Shares
Years ended October 31, | Dollars
Years ended October 31, |
| 2007 | 2006 | 2007 | 2006 |
Class C | | | | |
Shares sold | 1,281,274 | 1,058,526 | $ 34,698,003 | $ 20,658,561 |
Reinvestment of distributions | 105,026 | 61,905 | 2,283,267 | 1,061,055 |
Shares redeemed | (618,089) | (359,640) | (16,150,431) | (7,055,090) |
Net increase (decrease) | 768,211 | 760,791 | $ 20,830,839 | $ 14,664,526 |
Institutional Class | | | | |
Shares sold | 368,744 | 167,546 | $ 10,529,830 | $ 3,548,993 |
Reinvestment of distributions | 9,931 | 19,744 | 230,692 | 358,348 |
Shares redeemed | (175,119) | (231,297) | (5,062,378) | (4,591,950) |
Net increase (decrease) | 203,556 | (44,007) | $ 5,698,144 | $ (684,609) |
13. Subsequent Event.
On December 7, 2007, the Fund acquired all of the assets and assumed all of the liabilities of Fidelity Advisor Korea Fund ("Target Fund") pursuant to an agreement and plan of reorganization approved by Target Fund shareholders on November 14, 2007. As part of the reorganization, Class A, Class T, Class B, Class C and Institutional Class shareholders of the Target Fund received shares of the corresponding class of the Fund equal in value to the shareholder's shares in the Target Fund on the date of the reorganization. The reorganization qualified as a tax-free transaction for federal income tax purposes with no gain or loss recognized by the Fund or its shareholders.
Annual Report
Report of Independent Registered Public Accounting Firm
To the Trustees of Fidelity Advisor Series VIII and the Shareholders of Fidelity Advisor Emerging Asia Fund:
In our opinion, the accompanying statement of assets and liabilities, including the schedule of investments, and the related statements of operations and of changes in net assets and the financial highlights present fairly, in all material respects, the financial position of Fidelity Advisor Emerging Asia Fund (a fund of Fidelity Advisor Series VIII) at October 31, 2007, the results of its operations for the year then ended, the changes in its net assets for each of the two years in the period then ended and the financial highlights for each of the five years in the period then ended, in conformity with accounting principles generally accepted in the United States of America. These financial statements and financial highlights (hereafter referred to as "financial statements") are the responsibility of the Fidelity Advisor Emerging Asia Fund's management. Our responsibility is to express an opinion on these financial statements based on our audits. We conducted our audits of these financial statements in accordance with the standards of the Public Company Accounting Oversight Board (United States). Those standards require that we plan and perform the audit to obtain reasonable assurance about whether the financial statements are free of material misstatement. An audit includes examining, on a test basis, evidence supporting the amounts and disclosures in the financial statements, assessing the accounting principles used and significant estimates made by management, and evaluating the overall financial statement presentation. We believe that our audits, which included confirmation of securities at October 31, 2007 by correspondence with the custodian and brokers, provide a reasonable basis for our opinion.
/s/ PricewaterhouseCoopers LLP
PricewaterhouseCoopers LLP
Boston, Massachusetts
December 19, 2007
Annual Report
Trustees and Officers
The Trustees, Members of the Advisory Board, and executive officers of the trust and fund, as applicable, are listed below. The Board of Trustees governs the fund and is responsible for protecting the interests of shareholders. The Trustees are experienced executives who meet periodically throughout the year to oversee the fund's activities, review contractual arrangements with companies that provide services to the fund, and review the fund's performance. Except for James C. Curvey, each of the Trustees oversees 370 funds advised by FMR or an affiliate. Mr. Curvey oversees 340 funds advised by FMR or an affiliate.
The Trustees hold office without limit in time except that (a) any Trustee may resign; (b) any Trustee may be removed by written instrument, signed by at least two-thirds of the number of Trustees prior to such removal; (c) any Trustee who requests to be retired or who has become incapacitated by illness or injury may be retired by written instrument signed by a majority of the other Trustees; and (d) any Trustee may be removed at any special meeting of shareholders by a two-thirds vote of the outstanding voting securities of the trust. Each Trustee who is not an interested person (as defined in the 1940 Act) (Independent Trustee), shall retire not later than the last day of the calendar year in which his or her 72nd birthday occurs. The Independent Trustees may waive this mandatory retirement age policy with respect to individual Trustees. The executive officers and Advisory Board Members hold office without limit in time, except that any officer and Advisory Board Member may resign or may be removed by a vote of a majority of the Trustees at any regular meeting or any special meeting of the Trustees. Except as indicated, each individual has held the office shown or other offices in the same company for the past five years.
The fund's Statement of Additional Information (SAI) includes more information about the Trustees. To request a free copy, call Fidelity at 1-877-208-0098.
Interested Trustees*:
Correspondence intended for each Trustee who is an interested person may be sent to Fidelity Investments, 82 Devonshire Street, Boston, Massachusetts 02109.
Name, Age; Principal Occupation |
Edward C. Johnson 3d (77) |
| Year of Election or Appointment: 1983 Mr. Johnson is Chairman of the Board of Trustees. Mr. Johnson serves as President (2006-present), Chief Executive Officer, Chairman, and a Director of FMR LLC; Chairman and a Director of FMR; Chairman and a Director of Fidelity Research & Analysis Company (FRAC); Chairman and a Director of Fidelity Investments Money Management, Inc.; and Chairman (2001-present) and a Director of FMR Co., Inc. In addition, Mr. Johnson serves as Chairman and Director of Fidelity International Limited (FIL). |
James C. Curvey (72) |
| Year of Election or Appointment: 2007 Mr. Curvey also serves as Trustee (2007-present) or Member of the Advisory Board (2007-present) of other investment companies advised by FMR. Mr. Curvey is a Director of FMR and FMR Co., Inc. (2007-
present). Mr. Curvey is also Vice Chairman (2006-present) and Director of FMR LLC. Mr. Curvey joined Fidelity in 1982 and served in numerous senior management positions, including President and Chief Operating Officer of FMR LLC (1997-2000) and President of Fidelity Strategic Investments (2000-2002). In addition, he serves as a member of the Board of Directors of Geerlings & Wade, Inc. (wine distribution). |
* Trustees have been determined to be "Interested Trustees" by virtue of, among other things, their affiliation with the trust or various entities under common control with FMR. FMR Corp. merged with FMR LLC on October 1, 2007. Any references to FMR LLC for prior periods are deemed to be references to the prior entity.
Independent Trustees:
Correspondence intended for each Independent Trustee (that is, the Trustees other than the Interested Trustees) may be sent to Fidelity Investments, P.O. Box 55235, Boston, Massachusetts 02205-5235.
Name, Age; Principal Occupation |
Dennis J. Dirks (59) |
| Year of Election or Appointment: 2005 Prior to his retirement in May 2003, Mr. Dirks was Chief Operating Officer and a member of the Board of The Depository Trust & Clearing Corporation (DTCC) (1999-2003). He also served as President, Chief Operating Officer, and Board member of The Depository Trust Company (DTC) (1999-2003) and President and Board member of the National Securities Clearing Corporation (NSCC) (1999-2003). In addition, Mr. Dirks served as Chief Executive Officer and Board member of the Government Securities Clearing Corporation (2001-
2003) and Chief Executive Officer and Board member of the Mortgage-Backed Securities Clearing Corporation (2001-2003). Mr. Dirks also serves as a Trustee and a member of the Finance Committee of Manhattan College (2005-present) and a Trustee and a member of the Finance Committee of AHRC of Nassau County (2006-present). |
Albert R. Gamper, Jr. (65) |
| Year of Election or Appointment: 2006 Prior to his retirement in December 2004, Mr. Gamper served as Chairman of the Board of CIT Group Inc. (commercial finance). During his tenure with CIT Group Inc. Mr. Gamper served in numerous senior management positions, including Chairman (1987-1989; 1999-2001; 2002-2004), Chief Executive Officer (1987-2004), and President (1989-2002). He currently serves as a member of the Board of Directors of Public Service Enterprise Group (utilities, 2001-present), Chairman of the Board of Governors, Rutgers University (2004-present), and Chairman of the Board of Saint Barnabas Health Care System. |
George H. Heilmeier (71) |
| Year of Election or Appointment: 2004 Dr. Heilmeier is Chairman Emeritus of Telcordia Technologies (communication software and systems), where prior to his retirement, he served as company Chairman and Chief Executive Officer. He currently serves on the Boards of Directors of The Mitre Corporation (systems engineering and information technology support for the government), and HRL Laboratories (private research and development, 2004-
present). He is Chairman of the General Motors Science & Technology Advisory Board and a Life Fellow of the Institute of Electrical and Electronics Engineers (IEEE). Dr. Heilmeier is a member of the Defense Science Board and the National Security Agency Advisory Board. He is also a member of the National Academy of Engineering, the American Academy of Arts and Sciences, and the Board of Overseers of the School of Engineering and Applied Science of the University of Pennsylvania. Previously, Dr. Heilmeier served as a Director of TRW Inc. (automotive, space, defense, and information technology, 1992-2002), Compaq (1994-2002), Automatic Data Processing, Inc. (ADP) (technology-based business outsourcing, 1995-2002), INET Technologies Inc. (telecommunications network surveillance, 2001-
2004), and Teletech Holdings (customer management services). He is the recipient of the 2005 Kyoto Prize in Advanced Technology for his invention of the liquid crystal display, and a member of the Consumer Electronics Hall of Fame. |
James H. Keyes (67) |
| Year of Election or Appointment: 2007 Prior to his retirement in 2003, Mr. Keyes was Chairman, President, and Chief Executive Officer of Johnson Controls, Inc. (automotive supplier, 1993-2003). He currently serves as a member of the boards of LSI Logic Corporation (semiconductor technologies), Navistar International Corporation (manufacture and sale of trucks, buses, and diesel engines, 2002-present), and Pitney Bowes, Inc. (integrated mail, messaging, and document management solutions). |
Marie L. Knowles (61) |
| Year of Election or Appointment: 2001 Prior to Ms. Knowles' retirement in June 2000, she served as Executive Vice President and Chief Financial Officer of Atlantic Richfield Company (ARCO) (diversified energy, 1996-2000). From 1993 to 1996, she was a Senior Vice President of ARCO and President of ARCO Transportation Company. She served as a Director of ARCO from 1996 to 1998. She currently serves as a Director of Phelps Dodge Corporation (copper mining and manufacturing) and McKesson Corporation (healthcare service, 2002-present). Ms. Knowles is a Trustee of the Brookings Institution and the Catalina Island Conservancy and also serves as a member of the Advisory Board for the School of Engineering of the University of Southern California. |
Ned C. Lautenbach (63) |
| Year of Election or Appointment: 2000 Mr. Lautenbach is Chairman of the Independent Trustees (2006-present). Mr. Lautenbach has been a partner of Clayton, Dubilier & Rice, Inc. (private equity investment firm) since September 1998. Previously, Mr. Lautenbach was with the International Business Machines Corporation (IBM) from 1968 until his retirement in 1998. Mr. Lautenbach serves as a Director of Sony Corporation (2006-present) and Eaton Corporation (diversified industrial) as well as the Philharmonic Center for the Arts in Naples, Florida. He also is a member of the Board of Trustees of Fairfield University (2005-present), as well as a member of the Council on Foreign Relations. |
Cornelia M. Small (63) |
| Year of Election or Appointment: 2005 Ms. Small is a member (2000-present) and Chairperson (2002-present) of the Investment Committee, and a member (2002-present) of the Board of Trustees of Smith College. Previously, she served as Chief Investment Officer (1999-2000), Director of Global Equity Investments (1996-1999), and a member of the Board of Directors of Scudder, Stevens & Clark (1990-1997) and Scudder Kemper Investments (1997-1999). In addition, Ms. Small served as Co-Chair (2000-2003) of the Annual Fund for the Fletcher School of Law and Diplomacy. |
William S. Stavropoulos (68) |
| Year of Election or Appointment: 2001 Mr. Stavropoulos is Chairman Emeritus of the Board of Directors of The Dow Chemical Company. Since joining The Dow Chemical Company in 1967, Mr. Stavropoulos served in numerous senior management positions, including President (1993-2000; 2002-2003), CEO (1995-2000; 2002-2004), and Chairman of the Executive Committee (2000-2004). Currently, he is a Director of NCR Corporation (data warehousing and technology solutions), Chemical Financial Corporation, Maersk Inc. (industrial conglomerate, 2002-present), Tyco International, Inc. (multinational manufacturing and services, 2007-present), and a member of the Advisory Board for Metalmark Capital (private equity investment firm, 2005-present). He is a special advisor to Clayton, Dubilier & Rice, Inc., a private equity investment firm. He also serves as a member of the Board of Trustees of the American Enterprise Institute for Public Policy Research. In addition, Mr. Stavropoulos is a member of The Business Council, J.P. Morgan International Council and the University of Notre Dame Advisory Council for the College of Science. |
Kenneth L. Wolfe (68) |
| Year of Election or Appointment: 2005 Prior to his retirement in 2001, Mr. Wolfe was Chairman and Chief Executive Officer of Hershey Foods Corporation (1993-2001). He currently serves as a member of the boards of Adelphia Communications Corporation (2003-present), Bausch & Lomb, Inc., and Revlon Inc. (2004-present). |
Advisory Board Members and Executive Officers**:
Correspondence intended for Mr. Mauriello, Mr. Thomas, and Mr. Wiley may be sent to Fidelity Investments, P.O. Box 55235, Boston, Massachusetts 02205-5235. Correspondence intended for each executive officer and Mr. Lynch may be sent to Fidelity Investments, 82 Devonshire Street, Boston, Massachusetts 02109.
Name, Age; Principal Occupation |
Peter S. Lynch (63) |
| Year of Election or Appointment: 2003 Member of the Advisory Board of Fidelity Advisor Series VIII. Mr. Lynch is Vice Chairman and a Director of FMR, and Vice Chairman (2001-
present) and a Director of FMR Co., Inc. Previously, Mr. Lynch served as a Trustee of the Fidelity funds (1990-2003). In addition, he serves as a Trustee of Boston College and as the Chairman of the Inner-City Scholarship Fund. |
Joseph Mauriello (63) |
| Year of Election or Appointment: 2007 Member of the Advisory Board of Fidelity Advisor Series VIII. Prior to his retirement in January 2006, Mr. Mauriello served in numerous senior management positions including Deputy Chairman and Chief Operating Officer (2004-2005), and Vice Chairman of Financial Services (2002-
2004) of KPMG LLP US (professional services firm, 1965-2005). Mr. Mauriello currently serves as a member of the Board of Directors of XL Capital Ltd., (global insurance and re-insurance company, 2006-
present) and of Arcadia Resources Inc., (health care services and products, 2007-present). He also served as a Director of the Hamilton Funds of the Bank of New York (2006-2007). |
David M. Thomas (58) |
| Year of Election or Appointment: 2007 Member of the Advisory Board of Fidelity Advisor Series VIII. Previously, Mr. Thomas served as Executive Chairman (2005-2006) and Chairman and Chief Executive Officer (2000-2005) of IMS Health, Inc. (pharmaceutical and healthcare information solutions). In addition, Mr. Thomas serves as a member of the Board of Directors of Fortune Brands, Inc. (consumer products holding company), and Interpublic Group of Companies, Inc. (marketing communication, 2004-present). |
Michael E. Wiley (57) |
| Year of Election or Appointment: 2007 Member of the Advisory Board of Fidelity Advisor Series VIII. Mr. Wiley also serves as Sr. Energy Advisor of Katzenbach Partners, LLC (consulting firm, 2006-present) and a member of the Board of Trustees of the University of Tulsa (2000-2006; 2007-present). He serves as a Director of Tesoro Corporation (independent oil refiner and marketer, 2005-
present), and a Director of Bill Barrett Corporation (exploration and production company, 2005-present). In addition, he also serves as a Director of Post Oak Bank (privately-held bank, 2004-present), and an Advisory Director of Riverstone Holdings (private investment firm). Previously, Mr. Wiley served as Chairman, President, and CEO of Baker Hughes, Inc. (oilfield services company, 2000-2004), and as Director of Spinnaker Exploration Company (exploration and production company, 2001-2005). |
Kimberley H. Monasterio (43) |
| Year of Election or Appointment: 2007 President and Treasurer of Advisor Emerging Asia. Ms. Monasterio also serves as President and Treasurer of other Fidelity funds (2007-present) and is an employee of FMR (2004-present). Previously, Ms. Monasterio served as Deputy Treasurer of the Fidelity funds (2004-2006). Before joining Fidelity Investments, Ms. Monasterio served as Treasurer (2000-
2004) and Chief Financial Officer (2002-2004) of the Franklin Templeton Funds and Senior Vice President of Franklin Templeton Services, LLC (2000-2004). |
Walter C. Donovan (45) |
| Year of Election or Appointment: 2007 Vice President of Advisor Emerging Asia. Mr. Donovan also serves as Vice President of Fidelity's Equity Funds (2007-present). Mr. Donovan also serves as Executive Vice President of FMR (2005-present) and FMR Co., Inc. (2005-present). Previously, Mr. Donovan served as Vice President of Fidelity's High Income Funds (2005-2007), Fixed-Income Funds (2005-2006), certain Asset Allocation Funds (2005-2006), certain Balanced Funds (2005-2006), and as Vice President and Director of Fidelity's International Equity Trading group (1998-2005). |
Eric M. Wetlaufer (45) |
| Year of Election or Appointment: 2006 Vice President of Advisor Emerging Asia. Mr. Wetlaufer also serves as Vice President of certain International Equity Funds (2006-present). Mr. Wetlaufer is Senior Vice President of FMR (2006-present) and FMR Co., Inc. (2006-present), and President and Director of Fidelity Management & Research (U.K.) Inc. (2006-present) and Fidelity Research & Analysis Company (2006-present). Before joining Fidelity Investments in 2005, Mr. Wetlaufer was a partner in Oxhead Capital Management (2004-2005). Previously, Mr. Wetlaufer served as a Chief Investment Officer of Putnam Investments (1997-2003). |
Eric D. Roiter (58) |
| Year of Election or Appointment: 1999 Secretary of Advisor Emerging Asia. He also serves as Secretary of other Fidelity funds; Vice President, General Counsel, and Secretary of FMR Co., Inc. (2001-present) and FMR; Assistant Secretary of Fidelity Management & Research (U.K.) Inc. (2001-present), Fidelity Research & Analysis Company (2001-present), and Fidelity Investments Money Management, Inc. (2001-present). Mr. Roiter is an Adjunct Member, Faculty of Law, at Boston College Law School (2003-present). Previously, Mr. Roiter served as Vice President and Secretary of FDC (1998-2005). |
Scott C. Goebel (39) |
| Year of Election or Appointment: 2007 Assistant Secretary of Advisor Emerging Asia. Mr. Goebel also serves as Assistant Secretary of other Fidelity funds (2007-present), and is an employee of FMR. |
R. Stephen Ganis (41) |
| Year of Election or Appointment: 2006 Anti-Money Laundering (AML) officer of Advisor Emerging Asia. Mr. Ganis also serves as AML officer of other Fidelity funds (2006-
present) and FMR LLC (2003-present). Before joining Fidelity Investments, Mr. Ganis practiced law at Goodwin Procter, LLP (2000-2002). |
Joseph B. Hollis (59) |
| Year of Election or Appointment: 2006 Chief Financial Officer of Advisor Emerging Asia. Mr. Hollis also serves as Chief Financial Officer of other Fidelity funds. Mr. Hollis is President of Fidelity Pricing and Cash Management Services (FPCMS) (2005-
present). Mr. Hollis also serves as President and Director of Fidelity Service Company, Inc. (2006-present). Previously, Mr. Hollis served as Senior Vice President of Cash Management Services (1999-2002) and Investment Management Operations (2002-2005). |
Kenneth A. Rathgeber (60) |
| Year of Election or Appointment: 2004 Chief Compliance Officer of Advisor Emerging Asia. Mr. Rathgeber also serves as Chief Compliance Officer of other Fidelity funds (2004-
present) and Executive Vice President of Risk Oversight for Fidelity Investments (2002-present). He is Chief Compliance Officer of FMR (2005-present), FMR Co., Inc. (2005-present), Fidelity Management & Research (U.K.) Inc. (2005-present), Fidelity Research & Analysis Company (2005-present), Fidelity Investments Money Management, Inc. (2005-present), and Strategic Advisers, Inc. (2005-present). Previously, Mr. Rathgeber served as Executive Vice President and Chief Operating Officer for Fidelity Investments Institutional Services Company, Inc. (1998-2002). |
Bryan A. Mehrmann (46) |
| Year of Election or Appointment: 2005 Deputy Treasurer of Advisor Emerging Asia. Mr. Mehrmann also serves as Deputy Treasurer of other Fidelity funds (2005-present) and is an employee of FMR. Previously, Mr. Mehrmann served as Vice President of Fidelity Investments Institutional Services Group (FIIS)/Fidelity Investments Institutional Operations Corporation, Inc. (FIIOC) Client Services (1998-2004). |
Kenneth B. Robins (38) |
| Year of Election or Appointment: 2005 Deputy Treasurer of Advisor Emerging Asia. Mr. Robins also serves as Deputy Treasurer of other Fidelity funds (2005-present) and is an employee of FMR (2004-present). Before joining Fidelity Investments, Mr. Robins worked at KPMG LLP, where he was a partner in KPMG's department of professional practice (2002-2004) and a Senior Manager (1999-2000). In addition, Mr. Robins served as Assistant Chief Accountant, United States Securities and Exchange Commission (2000-2002). |
Robert G. Byrnes (40) |
| Year of Election or Appointment: 2005 Assistant Treasurer of Advisor Emerging Asia. Mr. Byrnes also serves as Assistant Treasurer of other Fidelity funds (2005-present) and is an employee of FMR (2005-present). Previously, Mr. Byrnes served as Vice President of FPCMS (2003-2005). Before joining Fidelity Investments, Mr. Byrnes worked at Deutsche Asset Management where he served as Vice President of the Investment Operations Group (2000-2003). |
Peter L. Lydecker (53) |
| Year of Election or Appointment: 2004 Assistant Treasurer of Advisor Emerging Asia. Mr. Lydecker also serves as Assistant Treasurer of other Fidelity funds (2004) and is an employee of FMR. |
Paul M. Murphy (60) |
| Year of Election or Appointment: 2007 Assistant Treasurer of Advisor Emerging Asia. Mr. Murphy also serves as Assistant Treasurer of other Fidelity funds (2007-present) and is an employee of FMR (2007-present). Previously, Mr. Murphy served as Chief Financial Officer of the Fidelity Funds (2005-2006), Vice President and Associate General Counsel of FMR (2007), and Senior Vice President of Fidelity Pricing and Cash Management Services Group (FPCMS) (1994-2007). |
Gary W. Ryan (49) |
| Year of Election or Appointment: 2005 Assistant Treasurer of Advisor Emerging Asia. Mr. Ryan also serves as Assistant Treasurer of other Fidelity funds (2005-present) and is an employee of FMR (2005-present). Previously, Mr. Ryan served as Vice President of Fund Reporting in FPCMS (1999-2005). |
** FMR Corp. merged with FMR LLC on October 1, 2007. Any references to FMR LLC for prior periods are deemed to be references to the prior entity.
Annual Report
Distributions
The Board of Trustees of Advisor Emerging Asia Fund voted to pay to shareholders of record at the opening of business on record date, the following distributions per share derived from capital gains realized from sales of portfolio securities, and dividends derived from net investment income:
| Pay Date | Record Date | Dividends | Capital Gains |
Institutional Class | 12/05/07 | 12/04/07 | $.306 | $3.06 |
The fund hereby designates as a capital gain dividend with respect to the taxable year ended October 31, 2007 $13,716,044, or, if subsequently determined to be different, the net capital gain of such year.
Institutional Class designates 16% of the dividends distributed during the fiscal year as amounts which may be taken into account as a dividend for purposes of the maximum rate under section 1(h)(11) of the Internal Revenue Code.
The amounts per share which represent income derived from sources within, and taxes paid to, foreign countries or possessions of the United States are $.313 and $.0418 for the dividend paid December 11, 2006.
The fund will notify shareholders in January 2008 of amounts for use in preparing 2007 income tax returns.
Annual Report
Board Approval of Investment Advisory Contracts and Management Fees
Advisor Emerging Asia Fund
Each year, typically in July, the Board of Trustees, including the Independent Trustees (together, the Board), votes on the renewal of the management contract and sub-advisory agreements (together, the Advisory Contracts) for the fund. The Board, assisted by the advice of fund counsel and Independent Trustees' counsel, requests and considers a broad range of information throughout the year.
The Board meets regularly each month except August and takes into account throughout the year matters bearing on Advisory Contracts. The Board, acting directly and through its separate committees, considers at each of its meetings factors that are relevant to the annual renewal of the fund's Advisory Contracts, including the services and support provided to the fund and its shareholders. At the time of the renewal, the Board had 12 standing committees, each composed of Independent Trustees with varying backgrounds, to which the Board has assigned specific subject matter responsibilities in order to enhance effective decision-making by the Board. Each committee has adopted a written charter outlining the structure and purposes of the committee. One such committee, the Equity Contract Committee, meets periodically as needed throughout the year to consider matters specifically related to the annual renewal of Advisory Contracts. The committee requests and receives information on, and makes recommendations to the Independent Trustees concerning, the approval and annual review of the Advisory Contracts.
At its July 2007 meeting, the Board of Trustees, including the Independent Trustees, unanimously determined to renew the Advisory Contracts for the fund. In reaching its determination, the Board considered all factors it believed relevant, including (i) the nature, extent, and quality of the services to be provided to the fund and its shareholders (including the investment performance of the fund); (ii) the competitiveness of the management fee and total expenses of the fund; (iii) the total costs of the services to be provided by and the profits to be realized by the investment adviser and its affiliates from the relationship with the fund; (iv) the extent to which economies of scale would be realized as the fund grows; and (v) whether fee levels reflect these economies of scale, if any, for the benefit of fund shareholders. The Board also approved amendments to the fund's agreements with foreign sub-advisers to clarify that each sub-adviser provides services as an independent contractor.
In determining whether to renew the Advisory Contracts for the fund, the Board ultimately reached a determination, with the assistance of fund counsel and Independent Trustees' counsel, that the renewal of the Advisory Contracts and the compensation to be received by Fidelity under the management contract is consistent with Fidelity's fiduciary duty under applicable law. In addition to evaluating the specific factors noted above, the Board, in reaching its determination, is aware that shareholders in the fund have a broad range of investment choices available to them, including a wide choice among mutual funds offered by competitors to Fidelity, and that the fund's shareholders, with the opportunity to review and weigh the disclosure provided by the fund in its prospectus and other public disclosures, have chosen to invest in this fund, managed by Fidelity.
Annual Report
Nature, Extent, and Quality of Services Provided. The Board considered staffing within the investment adviser, FMR, and the sub-advisers (together, the Investment Advisers), including the background of the fund's portfolio manager and the fund's investment objective and discipline. The Independent Trustees also had discussions with senior management of Fidelity's investment operations and investment groups. The Board considered the structure of the portfolio manager compensation program and whether this structure provides appropriate incentives.
Resources Dedicated to Investment Management and Support Services. The Board reviewed the size, education, and experience of the Investment Advisers' investment staff, their use of technology, and the Investment Advisers' approach to recruiting, training, and retaining portfolio managers and other research, advisory, and management personnel. The Board considered Fidelity's extensive global research capabilities that enable the Investment Advisers to aggregate data from various sources in an effort to produce positive investment results. The Board noted that Fidelity's analysts have access to a variety of technological tools that enable them to perform both fundamental and quantitative analysis and to specialize in various disciplines. The Board also considered that Fidelity's portfolio managers and analysts have access to daily portfolio attribution that allows for monitoring of a fund's portfolio, as well as an electronic communication system that provides immediate real-time access to research concerning issuers and credit enhancers.
Shareholder and Administrative Services. The Board considered (i) the nature, extent, quality, and cost of advisory, administrative, distribution, and shareholder services performed by the Investment Advisers and their affiliates under the Advisory Contracts and under separate agreements covering transfer agency, pricing and bookkeeping, and securities lending services for the fund; (ii) the nature and extent of the Investment Advisers' supervision of third party service providers, principally custodians and subcustodians; and (iii) the resources devoted to, and the record of compliance with, the fund's compliance policies and procedures. The Board reviewed the allocation of fund brokerage, including allocations to brokers affiliated with the Investment Advisers, the use of brokerage commissions to pay fund expenses, and the use of "soft" commission dollars to pay for research services. The Board also considered that Fidelity voluntarily pays for market data out of its own resources. The Board also considered the agreement reached between the Independent Trustees and Fidelity in December 2006 following an independent review of matters relating to receipt of travel, entertainment, gifts and gratuities in violation of Fidelity policies.
Annual Report
Board Approval of Investment Advisory Contracts and
Management Fees - continued
The Board noted that the growth of fund assets across the complex allows Fidelity to reinvest in the development of services designed to enhance the value or convenience of the Fidelity funds as investment vehicles. These services include 24-hour access to account information and market information through phone representatives and over the Internet, and investor education materials and asset allocation tools.
Investment in a Large Fund Family. The Board considered the benefits to shareholders of investing in a Fidelity fund, including the benefits of investing in a fund that is part of a large family of funds offering a variety of investment disciplines and providing for a large variety of mutual fund investor services. For example, fund shareholders are offered the privilege of exchanging shares of the fund for shares of other Fidelity funds, as set forth in the fund's prospectus, without paying a sales charge. The Board noted that, since the last Advisory Contract renewals in July 2006, Fidelity has taken a number of actions that benefited particular funds, including (i) dedicating additional resources to investment research and to restructure the investment research teams; (ii) contractually agreeing to reduce the management fee on Fidelity Advisor Floating Rate High Income Fund; (iii) contractually agreeing to reduce the management fees on Fidelity's California, Massachusetts, New Jersey, and New York AMT Tax-Free Money Market Funds, launching new Institutional Classes and Service Classes of these funds, and contractually agreeing to impose expense limitations on these funds; (iv) eliminating the exchange fee on the Fidelity Select Portfolios and reducing the pricing and bookkeeping fee rates for these funds; (v) reducing the maximum transfer agency fee rates on high income funds and certain equity funds; (vi) proposing amended management contracts that, if approved by shareholders, will add a performance adjustment component to the management fees paid by 18 Fidelity Advisor equity funds; (vii) contractually agreeing to reduce fees for Ultra-Short Central Fund and the money market Central Funds; (viii) waiving the Fidelity Advisor funds' contingent deferred sales charge on certain redemptions made through systematic withdrawal programs; and (ix) amending the management contracts for equity and fixed-income funds whose management contracts incorporate a "group fee" structure by adding four new fee "breakpoints" to the group fee rate schedules.
Investment Performance and Compliance. The Board considered whether the fund has operated within its investment objective, as well as its record of compliance with its investment restrictions. It also reviewed the fund's absolute investment performance for each class, as well as the fund's relative investment performance for each class measured against a broad-based securities market index over multiple periods. The Board noted that FMR does not believe that a meaningful peer group exists against which to compare the fund's performance. The following charts considered by the Board show, over the one-, three-, and five-year periods ended December 31, 2006, the cumulative total returns of Institutional Class (Class I) and Class C of the fund and the cumulative total returns of a broad-based securities market index ("benchmark"). The returns of Institutional Class (Class I) and Class C show the performance of the highest and lowest performing classes, respectively (based on three-year performance).
Annual Report
Advisor Emerging Asia Fund

The Board stated that the relative investment performance of Institutional Class (Class I) of the fund compared favorably to its benchmark for the one- and three-year periods, although the fund's five-year cumulative total return was lower than its benchmark. The Board considered that the variations in performance among the fund's classes reflect the variations in class expenses, which result in lower performance for higher expense classes.
The Board considered that FMR has taken steps to refocus and strengthen equity research, equity portfolio management, and compliance.
Based on its review, and giving particular weight to the nature and quality of the resources dedicated by the Investment Advisers to maintain and improve relative performance, the Board concluded that the nature, extent, and quality of the services provided to the fund will benefit the fund's shareholders, particularly in light of the Board's view that the fund's shareholders benefit from investing in a fund that is part of a large family of funds offering a variety of investment disciplines and services.
Competitiveness of Management Fee and Total Fund Expenses. The Board considered the fund's management fee and total expenses compared to "mapped groups" of competitive funds and classes. Fidelity creates "mapped groups" by combining similar Lipper investment objective categories that have comparable management fee characteristics. Combining Lipper investment objective categories aids the Board's management fee and total expense comparisons by broadening the competitive group used for comparison and by reducing the number of universes to which various Fidelity funds are compared. The Board also considered supplemental information about how the fund's management fee and total expenses ranked relative to groups based on Lipper classifications, which take into account a fund's market capitalization and style.
Annual Report
Board Approval of Investment Advisory Contracts and
Management Fees - continued
The Board considered two proprietary management fee comparisons for the 12-month periods shown in the chart below. The group of Lipper funds used by the Board for management fee comparisons is referred to below as the "Total Mapped Group." The Total Mapped Group comparison focuses on a fund's standing relative to the total universe of comparable funds available to investors, in terms of gross management fees before expense reimbursements or caps. "TMG %" represents the percentage of funds in the Total Mapped Group that had management fees that were lower than the fund's. For example, a TMG % of 9% means that 91% of the funds in the Total Mapped Group had higher management fees than the fund. The "Asset-Size Peer Group" (ASPG) comparison focuses on a fund's standing relative to non-Fidelity funds similar in size to the fund within the Total Mapped Group. The ASPG represents at least 15% of the funds in the Total Mapped Group with comparable asset size and management fee characteristics, subject to a minimum of 50 funds (or all funds in the Total Mapped Group if fewer than 50). Additional information, such as the ASPG quartile in which the fund's management fee ranked, is also included in the chart and considered by the Board.
Advisor Emerging Asia Fund
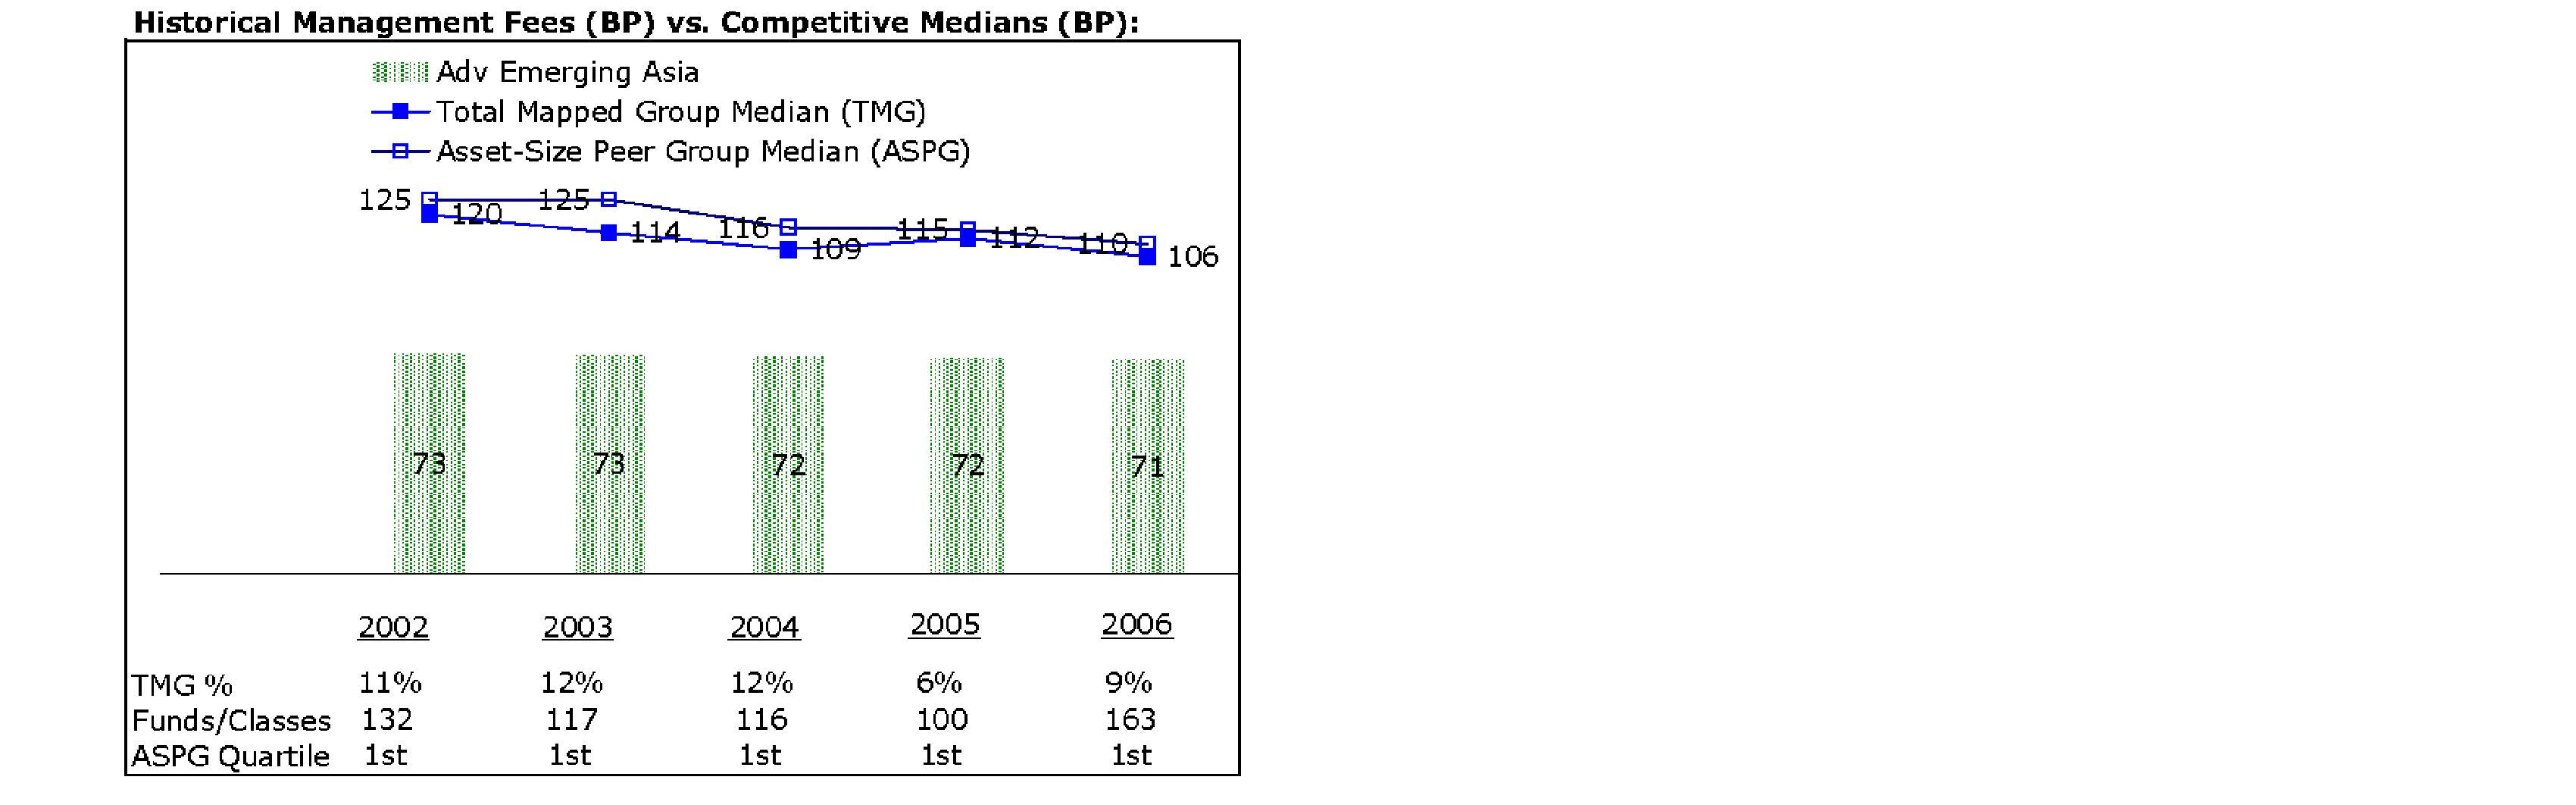
The Board noted that the fund's management fee ranked below the median of its Total Mapped Group and below the median of its ASPG for 2006.
Annual Report
Based on its review, the Board concluded that the fund's management fee was fair and reasonable in light of the services that the fund receives and the other factors considered.
In its review of each class's total expenses, the Board considered the fund's management fee as well as other fund or class expenses, as applicable, such as transfer agent fees, pricing and bookkeeping fees, fund-paid 12b-1 fees, and custodial, legal, and audit fees. The Board also noted the effects of any waivers and reimbursements on fees and expenses. As part of its review, the Board also considered current and historical total expenses of each class of the fund compared to competitive fund median expenses. Each class of the fund is compared to those funds and classes in the Total Mapped Group (used by the Board for management fee comparisons) that have a similar sales load structure.
The Board noted that the total expenses of each class ranked below its competitive median for 2006.
In its review of total expenses, the Board also considered Fidelity fee structures and other information on clients that FMR and its affiliates service in other competitive markets, such as other mutual funds advised or subadvised by FMR or its affiliates, pension plan clients, and other institutional clients.
Based on its review, the Board concluded that the total expenses of each class of the fund were reasonable in light of the services that the fund and its shareholders receive and the other factors considered.
Costs of the Services and Profitability. The Board considered the revenues earned and the expenses incurred by Fidelity in conducting the business of developing, marketing, distributing, managing, administering and servicing the fund and its shareholders. The Board also considered the level of Fidelity's profits in respect of all the Fidelity funds.
On an annual basis, FMR presents to the Board Fidelity's profitability for the fund. Fidelity calculates the profitability for each fund, as well as aggregate profitability for groups of Fidelity funds and all Fidelity funds, using a series of detailed revenue and cost allocation methodologies which originate with the audited books and records of Fidelity. The Audit Committee of the Board reviews any significant changes from the prior year's methodologies.
PricewaterhouseCoopers LLP (PwC), independent registered public accounting firm and auditor to Fidelity and certain Fidelity funds, has been engaged annually by the Board as part of the Board's assessment of the results of Fidelity's profitability analysis. PwC's engagement includes the review and assessment of Fidelity's methodologies used in determining the revenues and expenses attributable to Fidelity's mutual fund business, and completion of agreed-upon procedures surrounding the mathematical accuracy of fund profitability and its conformity to allocation methodologies. After considering PwC's reports issued under the engagement and information provided by Fidelity, the Board believes that while other allocation methods may also be reasonable, Fidelity's profitability methodologies are reasonable in all material respects.
Annual Report
Board Approval of Investment Advisory Contracts and
Management Fees - continued
The Board has also reviewed Fidelity's non-fund businesses and any fall-out benefits related to the mutual fund business as well as cases where Fidelity's affiliates may benefit from or be related to the fund's business.
The Board considered the costs of the services provided by and the profits realized by Fidelity in connection with the operation of the fund and determined that the amount of profit is a fair entrepreneurial profit for the management of the fund.
Economies of Scale. The Board considered whether there have been economies of scale in respect of the management of the Fidelity funds, whether the Fidelity funds (including the fund) have appropriately benefited from any such economies of scale, and whether there is potential for realization of any further economies of scale. The Board considered the extent to which the fund will benefit from economies of scale through increased services to the fund, through waivers or reimbursements, or through fee or expense reductions, including reductions that occur through operation of the transfer agent agreement. The transfer agent fee varies in part based on the number of accounts in the fund. If the number of accounts decreases or the average account size increases, the overall transfer agent fee rate decreases.
The Board recognized that the fund's management contract incorporates a "group fee" structure, which provides for lower group fee rates as total fund assets under FMR's management increase, and for higher group fee rates as total fund assets under FMR's management decrease. FMR determines the group fee rates based on a tiered asset "breakpoint" schedule. In connection with the renewal of the fund's management contract, the Board approved amendments to the fund's management contract that added four new fee breakpoints to the group fee rate schedule for assets under FMR's management above $1,386 billion. The Board considered that the group fee rate declines under both the present and amended schedules, but that under the amended schedule, the group fee rate declines faster as assets under FMR's management exceed $1,386 billion. The Board considered that the group fee is designed to deliver the benefits of economies of scale to fund shareholders when total fund assets increase, even if assets of any particular fund are unchanged or have declined, because some portion of Fidelity's costs are attributable to services provided to all Fidelity funds, and all funds benefit if those costs can be allocated among more assets. The Board concluded that, given the group fee structure, fund shareholders will achieve a certain level of economies of scale as assets under FMR's management increase at the fund complex level, regardless of whether Fidelity achieves any such economies of scale.
The Board further concluded that any potential economies of scale are being shared between fund shareholders and Fidelity in an appropriate manner.
Annual Report
Additional Information Requested by the Board. In order to develop fully the factual basis for consideration of the Fidelity funds' Advisory Contracts, the Board requested and received additional information on several topics, including (i) fund performance trends and actions to be taken by FMR to improve certain funds' overall performance; (ii) Fidelity's portfolio manager compensation structure, including its effects on fund profitability and the extent to which portfolio manager compensation is linked to fund performance; (iii) Fidelity's fee structures; (iv) the funds' sub-advisory arrangements; and (v) accounts managed by Fidelity other than the Fidelity funds.
Based on its evaluation of all of the conclusions noted above, and after considering all material factors, the Board ultimately concluded that the advisory fee structures are fair and reasonable, and that the fund's Advisory Contracts should be renewed.
Annual Report
Investment Adviser
Fidelity Management & Research Company
Boston, MA
Investment Sub-Advisers
FMR Co., Inc.
Fidelity Management & Research
(U.K.) Inc.
Fidelity Research & Analysis Company
Fidelity International
Investment Advisors
Fidelity Investments Japan Limited
Fidelity International Investment Advisors (U.K.) Limited
General Distributor
Fidelity Distributors Corporation
Boston, MA
Transfer and Service Agents
Fidelity Investments Institutional Operations Company, Inc.
Boston, MA
Fidelity Service Company, Inc.
Boston, MA
Custodian
Brown Brothers Harriman & Co.
Boston, MA
AEAI-UANN-1207
1.784738.104
(Fidelity Investment logo)(registered trademark)
(Fidelity Investment logo)(registered trademark)
Fidelity® Advisor
Emerging Markets
Fund - Class A, Class T, Class B
and Class C
Annual Report
October 31, 2007
(2_fidelity_logos) (Registered_Trademark)
Contents
Chairman's Message | <Click Here> | Ned Johnson's message to shareholders. |
Performance | <Click Here> | How the fund has done over time. |
Management's Discussion | <Click Here> | The manager's review of fund performance, strategy and outlook. |
Shareholder Expense Example | <Click Here> | An example of shareholder expenses. |
Investment Changes | <Click Here> | A summary of major shifts in the fund's investments over the past six months. |
Investments | <Click Here> | A complete list of the fund's investments with their market values. |
Financial Statements | <Click Here> | Statements of assets and liabilities, operations, and changes in net assets,
as well as financial highlights. |
Notes | <Click Here> | Notes to the financial statements. |
Report of Independent Registered Public Accounting Firm | <Click Here> | |
Trustees and Officers | <Click Here> | |
Distributions | <Click Here> | |
Board Approval of Investment Advisory Contracts and Management Fees | <Click Here> | |
To view a fund's proxy voting guidelines and proxy voting record for the 12-month period ended June 30, visit http://www.fidelity.com (search for "proxy voting guidelines") or visit the Securities and Exchange Commission's (SEC) web site at http://www.sec.gov. You may also call 1-877-208-0098 to request a free copy of the proxy voting guidelines.
Standard & Poor's, S&P and S&P 500 are registered service marks of The McGraw-Hill Companies, Inc. and have been licensed for use by Fidelity Distributors Corporation.
Other third party marks appearing herein are the property of their respective owners.
All other marks appearing herein are registered or unregistered trademarks or service marks of FMR LLC or an affiliated company.
Annual Report
This report and the financial statements contained herein are submitted for the general information of the shareholders of the fund. This report is not authorized for distribution to prospective investors in the fund unless preceded or accompanied by an effective prospectus.
A fund files its complete schedule of portfolio holdings with the SEC for the first and third quarters of each fiscal year on Form N-Q. Forms N-Q are available on the SEC's web site at http://www.sec.gov. A fund's Forms N-Q may be reviewed and copied at the SEC's Public Reference Room in Washington, DC. Information regarding the operation of the SEC's Public Reference Room may be obtained by calling 1-800-SEC-0330. For a complete list of a fund's portfolio holdings, view the most recent holdings listing, semiannual report, or annual report on Fidelity's web site at http://www.fidelity.com or http://advisor.fidelity.com, as applicable.
NOT FDIC INSURED · MAY LOSE VALUE · NO BANK GUARANTEE
Neither the fund nor Fidelity Distributors Corporation is a bank.
Annual Report
Chairman's Message
(photo_of_Edward_C_Johnson_3d)
Dear Shareholder:
Many stock and bond markets around the world have been unsettled of late; however, volatility can often lead to opportunity for patient investors. Financial markets are always unpredictable, but there are a number of time-tested principles that can put the historical odds in your favor.
One of the basic tenets is to invest for the long term. Over time, riding out the markets' inevitable ups and downs has proven much more effective than selling into panic or chasing the hottest trend. Even missing only a few of the markets' best days can significantly diminish investor returns. Patience also affords the benefits of compounding - of earning interest on additional income or reinvested dividends and capital gains. There are tax advantages and cost benefits to consider as well. The more you sell, the more taxes you pay, and the more you trade, the higher the costs. While staying the course doesn't eliminate risk, it can considerably lessen the effect of short-term declines.
You can further manage your investing risk through diversification. And today, more than ever, geographic diversification should be taken into account. Studies indicate that asset allocation is the single most important determinant of a portfolio's long-term success. The right mix of stocks, bonds and cash - aligned to your particular risk tolerance and investment objective - is very important. Age-appropriate rebalancing is also an essential aspect of asset allocation. For younger investors, an emphasis on equities - which historically have been the best-performing asset class over time - is encouraged. As investors near their specific goal, such as retirement or sending a child to college, consideration may be given to replacing volatile assets (e.g. common stocks) with more-stable fixed investments (bonds or savings plans).
A third investment principle - investing regularly - can help lower the average cost of your purchases. Investing a certain amount of money each month or quarter helps ensure you won't pay for all your shares at market highs. This strategy - known as dollar cost averaging - also reduces unconstructive "emotion" from investing, helping shareholders avoid selling weak performers just prior to an upswing, or chasing a hot performer just before a correction.
We invite you to contact us via the Internet, through our Investor Centers or over the phone. It is our privilege to provide you the information you need to make the investments that are right for you.
Sincerely,
/s/Edward C. Johnson 3d
Edward C. Johnson 3d
Annual Report
Performance: The Bottom Line
Average annual total return reflects the change in the value of an investment, assuming reinvestment of the class' dividend income and capital gains (the profits earned upon the sale of securities that have grown in value) and assuming a constant rate of performance each year. The $10,000 table and the fund's returns do not reflect the deduction of taxes that a shareholder would pay on fund distributions or the redemption of fund shares. During periods of reimbursement by Fidelity, a fund's total return will be greater than it would be had the reimbursement not occurred. How a fund did yesterday is no guarantee of how it will do tomorrow.
Average Annual Total Returns
Periods ended October 31, 2007 | Past 1
year | Life of
fundA |
Class A (incl. 5.75% sales charge) | 60.81% | 37.17% |
Class T (incl. 3.50% sales charge) | 64.30% | 37.71% |
Class B (incl. contingent deferred sales charge) B | 64.38% | 38.03% |
Class C (incl. contingent deferred sales charge) C | 68.43% | 38.41% |
A From March 29, 2004.
B Class B shares' contingent deferred sales charges included in the past one year and life of fund total return figures are 5% and 3%, respectively.
C Class C shares' contingent deferred sales charge included in the past one year and life of fund total return figures are 1% and 0%, respectively.
Annual Report
Performance - continued
$10,000 Over Life of Fund
Let's say hypothetically that $10,000 was invested in Fidelity® Advisor Emerging Markets Fund - Class T on March 29, 2004, when the fund started, and the current 3.50% sales charge was paid. The chart shows how the value of your investment would have changed, and also shows how the Morgan Stanley Capital InternationalSM Emerging Markets Index performed over the same period.
Annual Report
Management's Discussion of Fund Performance
Comments from Robert von Rekowsky, Portfolio Manager of Fidelity® Advisor Emerging Markets Fund
Emerging-markets equities continued their sparkling multiyear performance, returning 68.33% as measured by the Morgan Stanley Capital InternationalSM (MSCI®) Emerging Markets Index during the 12-month period ending October 31, 2007. On the whole, developing markets benefited from brisk economic growth, the ongoing build-out of commercial and industrial infrastructure, and rising commodity prices. China led the way with a superlative gain of roughly 168%, reflecting optimism about opportunities within the country's fast-growing economy. Hong Kong surged higher for similar reasons, jumping more than 147%. Brazil, the third-largest component of the MSCI benchmark, rose 111%, fueled largely by its exports of natural resources. However, three of the four largest country weightings in the index trailed its overall return despite very strong absolute performance. South Korea - the index's biggest constituent with a weighting of about 16% on average during the period - was a prime example. It gained almost 57% but still fell about 12 percentage points shy of the MSCI Emerging Markets index. Taiwan and Russia also trailed, despite solid returns of approximately 40% and 33%, respectively.
During the past year, the fund's Class A, Class T, Class B and Class C shares returned 70.63%, 70.26%, 69.38% and 69.43%, respectively (excluding sales charges), beating the MSCI index. Effective stock selection and a modest underweighting in technology added the most value versus the index. Stock picking in telecommunication services and materials also helped. A weak U.S. dollar further bolstered our absolute performance. Geographically, stock picking in South Korea, Russia and India helped, along with underweighting Taiwan. China Coal Energy was a significant contributor, spurred by an attractive valuation to start the period, healthy demand and tight coal supplies. Russian steel producer Evraz Group - a Luxembourg-incorporated company - further aided performance. China Coal Energy and Evraz were out-of-benchmark positions. Not owning Indian technology services provider and index component Infosys Technologies also added value, as did underweighting Korea-based Kookmin Bank - later sold completely - and Taiwan Semiconductor Manufacturing. Conversely, underweighting the strong-performing Chinese market hurt performance, as did a modest cash position. Not owning index components China Life Insurance, Korean shipbuilder Hyundai Heavy Industries and energy producer Petrochina detracted. Russia-based, U.S.-listed television network operator CTC Media - an out-of-benchmark holding - was hurt by revenue concerns.
The views expressed above reflect those of the portfolio manager(s) only through the end of the period as stated on the cover of this report and do not necessarily represent the views of Fidelity or any other person in the Fidelity organization. Any such views are subject to change at any time based upon market or other conditions and Fidelity disclaims any responsibility to update such views. These views may not be relied on as investment advice and, because investment decisions for a Fidelity fund are based on numerous factors, may not be relied on as an indication of trading intent on behalf of any Fidelity fund.
Annual Report
Shareholder Expense Example
As a shareholder of the Fund, you incur two types of costs: (1) transaction costs, including sales charges (loads) on purchase payments or redemption proceeds, redemption fees, and (2) ongoing costs, including management fees, distribution and/or service (12b-1) fees and other Fund expenses. This Example is intended to help you understand your ongoing costs (in dollars) of investing in the Fund and to compare these costs with the ongoing costs of investing in other mutual funds.
The Example is based on an investment of $1,000 invested at the beginning of the period and held for the entire period (May 1, 2007 to October 31, 2007).
Actual Expenses
The first line of the accompanying table for each class of the Fund provides information about actual account values and actual expenses. You may use the information in this line, together with the amount you invested, to estimate the expenses that you paid over the period. Simply divide your account value by $1,000.00 (for example, an $8,600 account value divided by $1,000.00 = 8.6), then multiply the result by the number in the first line for a class of the Fund under the heading entitled "Expenses Paid During Period" to estimate the expenses you paid on your account during this period. In addition, the Fund, as a shareholder in the underlying Fidelity Central Funds, will indirectly bear its pro rata share of the fees and expenses incurred by the underlying Fidelity Central Funds. These fees and expenses are not included in the Fund's annualized expense ratio used to calculate the expense estimate in the table below.
Hypothetical Example for Comparison Purposes
The second line of the accompanying table for each class of the Fund provides information about hypothetical account values and hypothetical expenses based on a Class' actual expense ratio and an assumed rate of return of 5% per year before expenses, which is not the Class' actual return. The hypothetical account values and expenses may not be used to estimate the actual ending account balance or expenses you paid for the period. You may use this information to compare the ongoing costs of investing in the Fund and other funds. To do so, compare this 5% hypothetical example with the 5% hypothetical examples that appear in the shareholder reports of the other funds. In addition, the Fund, as a shareholder in the underlying Fidelity Central Funds, will indirectly bear its pro rata share of the fees and expenses incurred by the underlying Fidelity Central Funds. These fees and expenses are not included in the Fund's annualized expense ratio used to calculate the expense estimate in the table below.
Please note that the expenses shown in the table are meant to highlight your ongoing costs only and do not reflect any transaction costs. Therefore, the second line of the table is useful in comparing ongoing costs only, and will not help you determine the relative total costs of owning different funds. In addition, if these transactional costs were included, your costs would have been higher.
Annual Report
| Beginning
Account Value
May 1, 2007 | Ending
Account Value
October 31, 2007 | Expenses Paid
During Period*
May 1, 2007 to
October 31, 2007 |
Class A | | | |
Actual | $ 1,000.00 | $ 1,411.00 | $ 9.72 |
Hypothetical A | $ 1,000.00 | $ 1,017.14 | $ 8.13 |
Class T | | | |
Actual | $ 1,000.00 | $ 1,409.60 | $ 11.24 |
Hypothetical A | $ 1,000.00 | $ 1,015.88 | $ 9.40 |
Class B | | | |
Actual | $ 1,000.00 | $ 1,405.40 | $ 14.25 |
Hypothetical A | $ 1,000.00 | $ 1,013.36 | $ 11.93 |
Class C | | | |
Actual | $ 1,000.00 | $ 1,405.90 | $ 14.25 |
Hypothetical A | $ 1,000.00 | $ 1,013.36 | $ 11.93 |
Institutional Class | | | |
Actual | $ 1,000.00 | $ 1,414.10 | $ 7.42 |
Hypothetical A | $ 1,000.00 | $ 1,019.06 | $ 6.21 |
A 5% return per year before expenses
* Expenses are equal to each Class' annualized expense ratio (shown in the table below); multiplied by the average account value over the period, multiplied by 184/365 (to reflect the one-half year period).
| Annualized
Expense Ratio |
Class A | 1.60% |
Class T | 1.85% |
Class B | 2.35% |
Class C | 2.35% |
Institutional Class | 1.22% |
Annual Report
Investment Changes
Top Five Stocks as of October 31, 2007 |
| % of fund's
net assets | % of fund's net assets
6 months ago |
China Mobile (Hong Kong) Ltd. (Hong Kong, Wireless Telecommunication Services) | 3.6 | 2.0 |
OAO Gazprom sponsored ADR (Russia, Oil, Gas & Consumable Fuels) | 3.5 | 3.1 |
Companhia Vale do Rio Doce (PN-A) sponsored ADR (Brazil, Metals & Mining) | 3.4 | 2.7 |
Petroleo Brasileiro SA - Petrobras (PN) (non-vtg.) (Brazil, Oil, Gas & Consumable Fuels) | 3.2 | 2.6 |
America Movil SAB de CV Series L sponsored ADR (Mexico, Wireless Telecommunication Services) | 1.9 | 3.0 |
| 15.6 | |
Top Five Market Sectors as of October 31, 2007 |
| % of fund's
net assets | % of fund's net assets
6 months ago |
Financials | 20.3 | 20.1 |
Materials | 17.9 | 14.0 |
Energy | 16.6 | 14.9 |
Industrials | 13.0 | 10.5 |
Telecommunication Services | 10.2 | 9.3 |
Top Five Countries as of October 31, 2007 |
(excluding cash equivalents) | % of fund's
net assets | % of fund's net assets
6 months ago |
Brazil | 13.7 | 13.1 |
Korea (South) | 13.5 | 15.9 |
Russia | 10.6 | 10.8 |
Hong Kong | 6.8 | 3.4 |
Taiwan | 6.5 | 4.9 |
Percentages are adjusted for the effect of open futures contracts, if applicable. |
Asset Allocation (% of fund's net assets) |
As of October 31, 2007 | As of April 30, 2007 |
 | Stocks and Investment Companies 97.1% | | | Stocks and Investment Companies 98.9% | |
 | Short-Term
Investments and Net Other Assets 2.9% | | | Short-Term
Investments and Net Other Assets 1.1% | |

Annual Report
Investments October 31, 2007
Showing Percentage of Net Assets
Common Stocks - 96.8% |
| Shares | | Value |
Argentina - 0.3% |
Banco Macro SA sponsored ADR | 26,900 | | $ 743,785 |
Banco Patagonia SA unit | 15,000 | | 364,141 |
Pampa Holding SA (a) | 161,800 | | 144,738 |
Telecom Argentina SA Class B sponsored ADR (a) | 17,000 | | 408,170 |
TOTAL ARGENTINA | | 1,660,834 |
Austria - 0.6% |
Raiffeisen International Bank Holding AG | 11,974 | | 1,979,399 |
voestalpine AG | 13,600 | | 1,223,007 |
TOTAL AUSTRIA | | 3,202,406 |
Bahrain - 0.1% |
Gulf Finance House BSC unit (a) | 29,100 | | 720,225 |
Bermuda - 2.0% |
Aquarius Platinum Ltd. (Australia) | 43,300 | | 1,707,355 |
CC Land Holdings Ltd. | 486,000 | | 963,566 |
Central European Media Enterprises Ltd. Class A (a) | 16,900 | | 1,939,275 |
China Grand Forestry Resources Group Ltd. (a) | 2,276,000 | | 808,858 |
Credicorp Ltd. (NY Shares) | 15,600 | | 1,159,548 |
Dufry South America Ltd. unit | 34,818 | | 1,016,506 |
Pacific Basin Shipping Ltd. | 208,000 | | 466,004 |
Samling Global Ltd. | 2,207,000 | | 758,435 |
Sinofert Holdings Ltd. | 2,112,100 | | 1,992,281 |
TOTAL BERMUDA | | 10,811,828 |
Brazil - 13.7% |
All America Latina Logistica SA unit | 114,600 | | 1,814,947 |
B2W Companhia Global Do Varejo | 23,600 | | 1,274,054 |
Banco Bradesco SA: | | | |
(PN) | 126,400 | | 4,295,890 |
(PN) sponsored ADR | 67,800 | | 2,315,370 |
Banco Daycoval SA (PN) | 53,600 | | 632,010 |
Banco do Brasil SA | 115,100 | | 2,084,986 |
Banco Indusval SA (e) | 18,432 | | 269,539 |
Bovespa Holding SA (a) | 11,000 | | 209,497 |
Companhia Brasileira (a)(e) | 622 | | 330,755 |
Companhia Brasileira de Distribuicao Grupo Pao de Acucar sponsored ADR | 12,200 | | 392,596 |
Companhia de Concessoes Rodoviarias | 53,100 | | 976,308 |
Companhia de Saneamento de Minas Gerais | 56,400 | | 1,059,476 |
Companhia Vale do Rio Doce (PN-A) sponsored ADR | 569,400 | | 17,975,958 |
CSU Cardsystem SA sponsored ADR (a)(e) | 3,000 | | 38,755 |
Common Stocks - continued |
| Shares | | Value |
Brazil - continued |
Duratex SA (PN) | 27,300 | | $ 913,471 |
Eternit SA | 104,160 | | 511,739 |
Gafisa SA: | | | |
ADR (a)(d) | 21,700 | | 773,822 |
warrants 12/28/07 (a) | 32,000 | | 570,560 |
GVT Holding SA | 37,400 | | 821,455 |
JBS SA | 132,229 | | 609,135 |
Localiza Rent a Car SA | 122,700 | | 1,453,166 |
Lojas Americanas SA (PN) | 102,112 | | 1,188,680 |
MRV Engenharia e Participacoes SA | 21,400 | | 445,168 |
Multiplan Empreendimentos Imobiliarios SA | 35,100 | | 512,674 |
Net Servicos de Comunicacao SA sponsored ADR (a) | 103,766 | | 1,668,557 |
Obrascon Huarte Lain Brasil SA | 37,900 | | 679,094 |
Petroleo Brasileiro SA - Petrobras: | | | |
(PN) (non-vtg.) | 370,100 | | 15,434,203 |
(PN) sponsored ADR (non-vtg.) | 19,600 | | 1,630,524 |
sponsored ADR | 11,800 | | 1,128,434 |
Satipel Industrial SA | 14,100 | | 105,785 |
Sul America SA unit | 24,200 | | 437,393 |
Tegma Gestao Logistica | 31,400 | | 539,032 |
Uniao de Bancos Brasileiros SA (Unibanco): | | | |
unit | 115,500 | | 1,827,865 |
GDR | 26,600 | | 4,203,864 |
Usinas Siderurgicas de Minas Gerais SA - Usiminas (PN-A) (non-vtg.) | 48,700 | | 3,819,492 |
Weg SA | 30,900 | | 469,724 |
TOTAL BRAZIL | | 73,413,978 |
British Virgin Islands - 0.0% |
Titanium Resources Group Ltd. (a) | 153,700 | | 241,260 |
Bulgaria - 0.0% |
Chimimport AD | 4,615 | | 57,668 |
Kaolin AD | 3,000 | | 43,465 |
MonBat AD (a) | 4,000 | | 96,411 |
TOTAL BULGARIA | | 197,544 |
Canada - 0.9% |
Addax Petroleum, Inc. | 7,900 | | 346,137 |
Addax Petroleum, Inc. (a)(e) | 4,700 | | 205,930 |
Eastern Platinum Ltd. (a) | 293,400 | | 910,466 |
First Quantum Minerals Ltd. | 12,800 | | 1,378,555 |
Frontera Copper Corp. (a) | 111,100 | | 903,673 |
Common Stocks - continued |
| Shares | | Value |
Canada - continued |
JumpTV, Inc. | 65,000 | | $ 130,799 |
Teck Cominco Ltd. Class B (sub. vtg.) | 3,303 | | 165,500 |
Uranium One, Inc. (a) | 19,300 | | 214,422 |
Uranium One, Inc. (South Africa) (a) | 49,418 | | 555,088 |
TOTAL CANADA | | 4,810,570 |
Cayman Islands - 1.6% |
Agile Property Holdings Ltd. | 1,250,000 | | 3,033,764 |
Alibaba.com Ltd. (a) | 21,000 | | 67,739 |
Bosideng International Holdings Ltd. | 202,000 | | 86,530 |
Chaoda Modern Agriculture (Holdings) Ltd. | 2,217,500 | | 2,023,760 |
China Aoyuan Property Group Ltd. | 45,000 | | 38,727 |
China Dongxiang Group Co. Ltd. | 70,000 | | 53,559 |
CNinsure, Inc. ADR (a) | 2,200 | | 55,638 |
E-House China Holdings Ltd. ADR sponsored ADR | 5,900 | | 209,450 |
Hidili Industry International Development Ltd. | 49,000 | | 73,086 |
Integra Group unit | 32,000 | | 512,000 |
KWG Property Holding Ltd. | 48,500 | | 91,364 |
Lee & Man Paper Manufacturing Ltd. | 512,200 | | 2,048,976 |
NagaCorp Ltd. | 582,000 | | 170,602 |
Neo-Neon Holdings Ltd. | 87,500 | | 103,083 |
NetDragon WebSoft, Inc. (a) | 77,000 | | 130,944 |
Niger Uranium Ltd. | 4,680 | | 3,503 |
TOTAL CAYMAN ISLANDS | | 8,702,725 |
Chile - 0.3% |
Lan Airlines SA sponsored ADR | 91,800 | | 1,527,552 |
China - 5.1% |
Angang Steel Co. Ltd. (H Shares) | 225,000 | | 828,408 |
Anhui Conch Cement Co. Ltd. (H Shares) | 166,000 | | 1,657,988 |
China Coal Energy Co. Ltd. (H Shares) | 1,168,300 | | 3,964,094 |
China Construction Bank Corp. (H Shares) | 5,484,000 | | 6,234,486 |
China Gas Holdings Ltd. | 1,314,000 | | 629,783 |
China Hongxing Sports Ltd. | 330,000 | | 295,922 |
China Molybdenum Co. Ltd. (H Shares) | 83,000 | | 217,662 |
Digital China Holdings Ltd. (H Shares) | 274,000 | | 180,960 |
First Tractor Co. Ltd. (H Shares) (a) | 736,500 | | 466,608 |
Golden Eagle Retail Group Ltd. (H Shares) | 355,000 | | 368,835 |
Guangzhou R&F Properties Co. Ltd. (H Shares) | 566,400 | | 2,981,905 |
Home Inns & Hotels Management, Inc. ADR (d) | 500 | | 22,015 |
Industrial & Commercial Bank of China | 2,146,000 | | 2,049,646 |
Parkson Retail Group Ltd. | 64,500 | | 736,141 |
Common Stocks - continued |
| Shares | | Value |
China - continued |
Ping An Insurance (Group) Co. of China, Ltd. (H Shares) | 372,000 | | $ 5,207,160 |
Shandong Weigao Group Medical Polymer Co. Ltd. (H Shares) | 222,000 | | 494,498 |
Shenzhen Expressway Co. Ltd. (H Shares) | 374,000 | | 388,830 |
Yantai Changyu Pioneer Wine Co. (B Shares) | 54,990 | | 409,782 |
TOTAL CHINA | | 27,134,723 |
Colombia - 0.3% |
Almacenes Exito SA unit (e) | 22,100 | | 170,694 |
BanColombia SA sponsored ADR | 42,900 | | 1,576,575 |
TOTAL COLOMBIA | | 1,747,269 |
Croatia - 0.1% |
T-Hrvatske Telekom ADR (a)(e) | 4,400 | | 316,800 |
Cyprus - 0.4% |
Mirland Development Corp. PLC | 68,900 | | 848,020 |
Urals Energy Public Co. Ltd. (a) | 69,500 | | 404,583 |
XXI Century Investments Public Ltd. (a)(d) | 30,500 | | 1,066,891 |
TOTAL CYPRUS | | 2,319,494 |
Czech Republic - 0.7% |
Ceske Energeticke Zavody AS | 52,700 | | 3,809,331 |
Egypt - 1.1% |
Commercial International Bank Ltd. sponsored GDR | 88,500 | | 1,225,725 |
Eastern Tobacco Co. | 8,000 | | 610,421 |
Egyptian Co. for Mobile Services (MobiNil) | 11,360 | | 401,486 |
Orascom Construction Industries SAE: | | | |
GDR | 11,444 | | 2,099,974 |
GDR (e) | 400 | | 73,400 |
Orascom Hotels & Development (OHD) (a) | 96,336 | | 1,248,221 |
TOTAL EGYPT | | 5,659,227 |
Estonia - 0.0% |
Olympic Entertainment Group AS | 18,200 | | 139,224 |
Finland - 0.0% |
Rakentajain Konevuokraamo Oyj (B Shares) | 5,500 | | 205,585 |
Georgia - 0.1% |
Bank of Georgia: | | | |
ADR (a)(e) | 5,000 | | 165,000 |
unit (a) | 17,800 | | 587,400 |
TOTAL GEORGIA | | 752,400 |
Common Stocks - continued |
| Shares | | Value |
Hong Kong - 6.8% |
China Mobile (Hong Kong) Ltd. | 931,700 | | $ 19,319,730 |
China Overseas Land & Investment Ltd. | 586,000 | | 1,402,633 |
China Overseas Land & Investment Ltd. warrants 8/27/08 (a) | 14,666 | | 12,205 |
China Resources Power Holdings Co. Ltd. | 529,700 | | 1,981,535 |
China Seven Star Shopping Ltd. (a) | 890,000 | | 47,361 |
CNOOC Ltd. | 2,677,000 | | 5,795,437 |
CNOOC Ltd. sponsored ADR (d) | 6,000 | | 1,298,940 |
CNPC (Hong Kong) Ltd. | 3,261,000 | | 2,659,060 |
Fosun International Ltd. | 116,500 | | 157,531 |
Kerry Properties Ltd. | 178,500 | | 1,552,613 |
REXCAPITAL Financial Holdings Ltd. (a) | 5,220,000 | | 1,086,032 |
Shanghai Industrial Holdings Ltd. (H Shares) | 214,000 | | 1,262,463 |
TOTAL HONG KONG | | 36,575,540 |
Hungary - 0.1% |
OTP Bank Ltd. unit | 3,900 | | 423,150 |
India - 6.5% |
Bank of India | 145,000 | | 1,333,231 |
Bharat Heavy Electricals Ltd. | 21,418 | | 1,433,609 |
Bharti Airtel Ltd. (a) | 90,875 | | 2,347,781 |
Blue Star Ltd. | 54,795 | | 545,212 |
Cairn India Ltd. | 199,506 | | 1,063,363 |
Federal Bank Ltd. | 14,399 | | 144,762 |
Federal Bank Ltd.: | | | |
GDR | 11,701 | | 116,029 |
GDR (e) | 9,000 | | 89,245 |
HCL Technologies Ltd. | 144,919 | | 1,176,584 |
Hindustan Zinc Ltd. | 8,048 | | 187,424 |
ICSA (India) Ltd. | 19,575 | | 182,982 |
Indiabulls Real Estate Ltd. sponsored GDR (a) | 51,448 | | 841,175 |
Indian Overseas Bank | 207,101 | | 752,439 |
IVRCL Infrastructures & Projects Ltd. | 73,174 | | 952,961 |
Jaiprakash Associates Ltd. | 43,720 | | 1,641,101 |
Jindal Saw Ltd. | 10,307 | | 208,580 |
JSW Steel Ltd. | 21,812 | | 536,844 |
Kalpataru Power Transmission Ltd. | 4,803 | | 218,488 |
LANCO Infratech Ltd. | 92,521 | | 1,073,078 |
Larsen & Toubro Ltd. | 24,681 | | 2,698,475 |
Pantaloon Retail India Ltd. | 35,450 | | 664,814 |
Punjab National Bank | 41,893 | | 664,719 |
Reliance Industries Ltd. | 107,800 | | 7,694,778 |
Rolta India Ltd. | 121,081 | | 2,161,822 |
Common Stocks - continued |
| Shares | | Value |
India - continued |
Rolta India Ltd. sponsored GDR (e) | 8,800 | | $ 132,000 |
Sintex Industries Ltd. | 55,441 | | 653,724 |
Sobha Developers Ltd. | 7,184 | | 175,468 |
State Bank of India | 27,749 | | 1,741,104 |
Steel Authority of India Ltd. | 279,585 | | 1,875,516 |
Tata Power Co. Ltd. | 36,835 | | 1,150,922 |
United Phosphorous Ltd. | 23,000 | | 212,324 |
TOTAL INDIA | | 34,670,554 |
Indonesia - 3.1% |
PT Astra Agro Lestari Tbk | 619,500 | | 1,557,731 |
PT Bakrie & Brothers Tbk (a) | 31,742,500 | | 1,124,602 |
PT Bank Mandiri Persero Tbk | 4,190,000 | | 1,775,145 |
PT Bank Niaga Tbk | 7,737,500 | | 745,490 |
PT Bank Rakyat Indonesia Tbk | 1,343,500 | | 1,165,447 |
PT Bumi Resources Tbk | 7,471,000 | | 4,023,412 |
PT Indocement Tunggal Prakarsa Tbk | 484,500 | | 443,004 |
PT International Nickel Indonesia Tbk | 179,000 | | 1,804,837 |
PT Medco Energi International Tbk | 1,756,000 | | 920,324 |
PT Perusahaan Gas Negara Tbk Series B | 1,599,000 | | 2,505,910 |
PT Perusahaan Perkebunan London Sumatra Indonesia Tbk (a) | 746,000 | | 800,798 |
TOTAL INDONESIA | | 16,866,700 |
Ireland - 0.1% |
Dragon Oil plc (a) | 75,515 | | 490,231 |
Israel - 1.1% |
Bank Hapoalim BM (Reg.) | 326,628 | | 1,797,156 |
First International Bank of Israel (a) | 76,693 | | 203,713 |
Israel Chemicals Ltd. | 268,500 | | 2,954,655 |
Ormat Industries Ltd. | 41,500 | | 679,349 |
Orpak Systems Ltd. | 19,400 | | 68,567 |
Queenco Leisure International Ltd. GDR (a) | 12,300 | | 215,625 |
Saifun Semiconductors Ltd. (a) | 14,150 | | 143,340 |
TOTAL ISRAEL | | 6,062,405 |
Kazakhstan - 0.5% |
JSC Halyk Bank of Kazakhstan: | | | |
GDR (e) | 25,900 | | 478,114 |
unit | 17,590 | | 324,711 |
KazMunaiGas Exploration & Production JSC (Reg. S) GDR | 67,500 | | 1,822,500 |
TOTAL KAZAKHSTAN | | 2,625,325 |
Common Stocks - continued |
| Shares | | Value |
Korea (South) - 13.5% |
Asia Cement Co. Ltd. | 6,175 | | $ 496,525 |
CJ CheilJedang Corp. (a) | 2,596 | | 860,433 |
CJ Corp. | 5,121 | | 573,310 |
Daegu Bank Co. Ltd. | 19,010 | | 336,962 |
Daewoo Shipbuilding & Marine Engineering Co. Ltd. | 47,000 | | 2,985,702 |
Doosan Co. Ltd. (a) | 11,031 | | 3,244,173 |
GS Engineering & Construction Corp. | 18,210 | | 3,858,418 |
Hanil Cement Co. Ltd. | 1,520 | | 164,397 |
Hanjin Heavy Industries & Consolidated Co. Ltd. (a) | 18,279 | | 2,003,262 |
Hanjin Heavy Industries & Construction Holdings | 6,760 | | 433,636 |
Hyundai Engineering & Construction Co. Ltd. (a) | 21,955 | | 2,248,261 |
Hyundai Mipo Dockyard Co. Ltd. | 6,351 | | 2,822,085 |
Hyundai Steel Co. | 14,610 | | 1,457,060 |
Industrial Bank of Korea | 56,390 | | 1,156,211 |
Korean Air Lines Co. Ltd. | 7,700 | | 677,261 |
Kyeryong Construction Industrial Co. Ltd. | 17,170 | | 807,006 |
LG Household & Health Care Ltd. | 10,040 | | 2,238,472 |
LG Petrochemical Co. Ltd. | 11,390 | | 679,478 |
Macquarie Korea Infrastructure Fund GDR | 83,400 | | 577,962 |
MegaStudy Co. Ltd. | 7,904 | | 2,916,942 |
NHN Corp. (a) | 13,980 | | 4,495,663 |
Osstem Implant Co. Ltd. | 8,700 | | 404,058 |
POSCO | 11,330 | | 8,263,138 |
Samsung Corp. | 23,000 | | 2,128,861 |
Samsung Electronics Co. Ltd. | 14,941 | | 9,213,615 |
Samsung Fire & Marine Insurance Co. Ltd. | 7,200 | | 2,003,258 |
Samsung Heavy Industries Ltd. | 48,360 | | 2,919,969 |
Samwhan Corp. | 18,370 | | 615,754 |
Shinhan Financial Group Co. Ltd. | 62,100 | | 4,066,619 |
SK Chemicals Co. Ltd. | 9,013 | | 898,656 |
SK Energy Co. Ltd. | 17,304 | | 3,977,269 |
Taewoong Co. Ltd. | 12,228 | | 1,747,622 |
Woori Investment & Securities Co. Ltd. | 35,050 | | 1,080,611 |
TOTAL KOREA (SOUTH) | | 72,352,649 |
Lebanon - 0.0% |
Solidere GDR | 14,600 | | 266,012 |
Luxembourg - 0.5% |
Evraz Group SA GDR | 32,600 | | 2,461,300 |
Malaysia - 1.6% |
Bandar Raya Developments BHD | 219,700 | | 207,397 |
DiGi.com Bhd | 102,200 | | 769,778 |
Common Stocks - continued |
| Shares | | Value |
Malaysia - continued |
Gamuda Bhd | 397,000 | | $ 547,378 |
Genting Bhd | 505,000 | | 1,256,950 |
IJM Corp. Bhd | 160,000 | | 420,304 |
KNM Group Bhd | 663,400 | | 1,174,256 |
Lion Diversified Holdings Bhd | 148,300 | | 106,181 |
Parkson Holdings Bhd | 192,790 | | 556,236 |
Public Bank BHD | 552,000 | | 1,846,610 |
Steppe Cement Ltd. (a) | 114,600 | | 607,561 |
UEM World BHD | 381,900 | | 499,329 |
Zelan Bhd | 204,000 | | 370,380 |
TOTAL MALAYSIA | | 8,362,360 |
Mauritius - 0.1% |
Golden Agri-Resources Ltd. | 464,000 | | 567,997 |
Mexico - 3.8% |
Alsea SAB de CV | 318,900 | | 475,068 |
America Movil SAB de CV Series L sponsored ADR | 155,200 | | 10,148,528 |
Banco Compartamos SA de CV | 131,800 | | 680,032 |
Empresas ICA Sociedad Controladora SA de CV sponsored ADR (a) | 5,200 | | 145,496 |
Fomento Economico Mexicano SA de CV sponsored ADR | 70,200 | | 2,499,822 |
Grupo Aeroportuario Norte Sab de CV ADR | 38,900 | | 1,187,617 |
Grupo Financiero Banorte SA de CV Series O | 112,900 | | 530,619 |
Grupo Mexico SA de CV Series B | 343,768 | | 3,128,154 |
Urbi, Desarrollos Urbanos, SA de CV (a) | 369,000 | | 1,425,834 |
TOTAL MEXICO | | 20,221,170 |
Netherlands - 0.3% |
A&D Pharma Holdings NV (Reg. S) unit | 4,200 | | 103,444 |
AmRest Holdings NV (a) | 6,500 | | 345,887 |
X5 Retail Group NV unit (a) | 30,300 | | 1,090,800 |
TOTAL NETHERLANDS | | 1,540,131 |
Nigeria - 0.1% |
Guaranty Trust Bank PLC sponsored GDR (a)(e) | 31,600 | | 356,448 |
Oman - 0.3% |
BankMuscat SAOG sponsored: | | | |
GDR (e) | 7,562 | | 120,992 |
GDR | 84,270 | | 1,348,320 |
TOTAL OMAN | | 1,469,312 |
Common Stocks - continued |
| Shares | | Value |
Pakistan - 0.1% |
MCB Bank Ltd. (a) | 22,195 | | $ 138,892 |
MCB Bank Ltd. | 5,000 | | 120,050 |
MCB Bank Ltd. unit (e) | 11,385 | | 273,354 |
TOTAL PAKISTAN | | 532,296 |
Panama - 0.0% |
Intergroup Financial Services Corp. (e) | 16,076 | | 281,330 |
Philippines - 0.8% |
Alliance Global Group, Inc. (a) | 1,523,000 | | 189,389 |
Ayala Corp. | 52,080 | | 743,572 |
GMA Networks, Inc. unit | 569,000 | | 112,686 |
International Container Terminal Services, Inc. | 383,000 | | 366,022 |
Megaworld Corp. | 5,711,000 | | 578,662 |
PNOC Energy Development Corp. | 3,911,000 | | 684,481 |
Robinsons Land Corp. | 1,238,000 | | 591,560 |
Security Bank Corp. | 192,000 | | 347,081 |
SM Investments Corp. | 101,094 | | 884,645 |
TOTAL PHILIPPINES | | 4,498,098 |
Poland - 0.5% |
Bank Handlowy w Warszawie SA | 21,015 | | 974,609 |
Globe Trade Centre SA (a) | 54,800 | | 1,128,316 |
PBG SA (a) | 2,574 | | 349,889 |
Polimex Mostostal SA | 50,000 | | 207,896 |
Vistula & Wolczanka SA (a) | 1,010 | | 6,057 |
TOTAL POLAND | | 2,666,767 |
Romania - 0.0% |
Banca Transilvania SA | 346,580 | | 136,455 |
Russia - 10.6% |
JSC Chelyabinsk Zinc Plant (a) | 7,300 | | 102,200 |
JSC MMC 'Norilsk Nickel' sponsored ADR | 19,800 | | 6,237,000 |
Lukoil Oil Co. sponsored ADR | 19,363 | | 1,778,492 |
Magnitogorsk Iron & Steel Works | 310,300 | | 403,390 |
Mechel Steel Group OAO sponsored ADR (d) | 32,500 | | 2,734,875 |
Mobile TeleSystems OJSC sponsored ADR | 72,800 | | 6,042,400 |
Novolipetsk Iron & Steel Corp. sponsored GDR (e) | 22,500 | | 927,900 |
OAO Gazprom sponsored ADR | 376,370 | | 18,912,593 |
OAO Raspadskaya | 50,000 | | 255,500 |
OAO TatNeft unit | 16,450 | | 2,052,138 |
OAO TMK (a) | 87,500 | | 984,375 |
OAO TMK unit | 19,000 | | 845,310 |
Common Stocks - continued |
| Shares | | Value |
Russia - continued |
Open Investments (a) | 1,588 | | $ 438,288 |
Rosinter Restaurants Holding | 5,000 | | 280,000 |
Sberbank (Savings Bank of the Russian Federation) (a) | 769,000 | | 3,306,700 |
Sberbank (Savings Bank of the Russian Federation) GDR | 7,300 | | 3,696,396 |
Sistema-Hals JSC | 1,500 | | 292,500 |
Sistema-Hals JSC unit (a) | 10,000 | | 97,500 |
Surgutneftegaz JSC sponsored ADR | 5,444 | | 376,725 |
Uralkali JSC (a) | 132,300 | | 661,500 |
Uralkali JSC unit (a) | 18,400 | | 461,840 |
Vimpel Communications sponsored ADR | 110,400 | | 3,650,928 |
VSMPO-Avisma Corp. (a) | 1,000 | | 317,000 |
Wimm-Bill-Dann Foods OJSC sponsored ADR | 14,900 | | 1,784,275 |
TOTAL RUSSIA | | 56,639,825 |
Singapore - 0.7% |
Keppel Corp. Ltd. | 101,200 | | 1,040,248 |
Olam International Ltd. | 266,000 | | 649,570 |
Sino-Environment Technology Group Ltd. (a) | 198,000 | | 458,410 |
Straits Asia Resources Ltd. | 494,000 | | 915,110 |
Yangzijiang Shipbuilding Holdings Ltd. | 314,000 | | 559,181 |
TOTAL SINGAPORE | | 3,622,519 |
South Africa - 6.2% |
African Bank Investments Ltd. | 291,247 | | 1,617,790 |
African Rainbow Minerals Ltd. | 32,686 | | 754,408 |
Anglo Platinum Ltd. | 8,512 | | 1,460,360 |
Aspen Pharmacare Holdings Ltd. | 182,800 | | 1,067,435 |
Bell Equipment Ltd. | 29,836 | | 238,725 |
Bidvest Group Ltd. | 108,700 | | 2,281,379 |
Exxaro Resources Ltd. | 46,900 | | 758,526 |
FirstRand Ltd. | 900,273 | | 3,560,089 |
Illovo Sugar Ltd. | 110,157 | | 389,846 |
Impala Platinum Holdings Ltd. | 134,464 | | 5,048,348 |
JSE Ltd. | 5,700 | | 75,866 |
Kumba Iron Ore Ltd. | 48,400 | | 1,891,614 |
Mr. Price Group Ltd. | 167,100 | | 678,788 |
MTN Group Ltd. | 283,532 | | 5,507,911 |
Murray & Roberts Holdings Ltd. | 227,661 | | 3,485,501 |
Nedbank Group Ltd. | 102,474 | | 2,246,891 |
Raubex Group Ltd. | 200,228 | | 1,102,964 |
Shoprite Holdings Ltd. | 164,382 | | 1,024,384 |
TOTAL SOUTH AFRICA | | 33,190,825 |
Common Stocks - continued |
| Shares | | Value |
Taiwan - 6.5% |
AU Optronics Corp. | 978,000 | | $ 2,083,099 |
AU Optronics Corp. sponsored ADR | 73,457 | | 1,596,221 |
China Steel Corp. | 2,307,920 | | 3,248,685 |
Chung Hwa Pulp Corp. | 1,611,000 | | 1,111,463 |
Delta Electronics, Inc. | 522,427 | | 2,096,481 |
Everlight Electronics Co. Ltd. | 44,286 | | 193,439 |
Feng Tay Enterprise Co. Ltd. | 291,840 | | 251,345 |
Formosa Chemicals & Fibre Corp. | 664,000 | | 1,783,238 |
Foxconn Technology Co. Ltd. | 109,455 | | 1,317,717 |
Gemtek Technology Corp. | 93,927 | | 211,368 |
Greatek Electronics, Inc. | 482,840 | | 755,672 |
Hon Hai Precision Industry Co. Ltd. (Foxconn) | 953,014 | | 7,236,964 |
Innolux Display Corp. | 487,553 | | 2,257,538 |
MediaTek, Inc. | 226,550 | | 4,426,799 |
Shin Kong Financial Holding Co. Ltd. | 1,681,545 | | 1,557,226 |
Siliconware Precision Industries Co. Ltd. | 1,391,267 | | 2,933,278 |
Taiwan Cement Corp. | 780,740 | | 1,330,355 |
Taiwan Semiconductor Manufacturing Co. Ltd. | 251,220 | | 494,763 |
TOTAL TAIWAN | | 34,885,651 |
Thailand - 1.0% |
Mermaid Maritime PLC | 43,000 | | 56,767 |
Minor International PCL (For. Reg.) | 1,811,504 | | 948,794 |
PTT Public Co. Ltd. (For. Reg.) | 298,000 | | 3,647,727 |
Total Access Communication PCL (a) | 123,000 | | 147,600 |
Total Access Communication PCL unit (a) | 262,200 | | 316,322 |
TOTAL THAILAND | | 5,117,210 |
Turkey - 2.9% |
Aksigorta AS | 105,015 | | 774,520 |
Anadolu Efes Biracilik ve Malt Sanyii AS | 130,646 | | 1,590,989 |
Asya Katilim Bankasi AS (a) | 246,000 | | 2,088,590 |
Atakule Gayrimenkul Yatirim Ortakligi AS | 109,000 | | 214,999 |
Bagfas Bandirma Gubre Fabrikalari AS | 14,609 | | 701,603 |
Enka Insaat ve Sanayi AS | 156,940 | | 2,449,559 |
Tofas Turk Otomobil Fabrikasi AS | 233,000 | | 1,228,892 |
Tupras-Turkiye Petrol Rafinerileri AS | 87,200 | | 2,467,819 |
Turk Hava Yollari AO (a) | 24,000 | | 170,833 |
Turkiye Garanti Bankasi AS | 403,375 | | 3,701,482 |
TOTAL TURKEY | | 15,389,286 |
United Kingdom - 0.6% |
Aricom Plc (a) | 521,300 | | 831,823 |
Common Stocks - continued |
| Shares | | Value |
United Kingdom - continued |
Aricom Plc warrants 6/5/10 (a)(f) | 12,700 | | $ 8,462 |
Gafisa SA warrants (Deutsche Bank Warrant Program) 12/17/07 (a) | 13,700 | | 244,271 |
Hirco PLC | 21,000 | | 164,598 |
Imperial Energy PLC (a) | 23,300 | | 666,560 |
Sibir Energy PLC | 97,355 | | 1,100,076 |
TOTAL UNITED KINGDOM | | 3,015,790 |
United States of America - 1.1% |
BMB Munai, Inc. (a) | 44,763 | | 261,864 |
Central European Distribution Corp. (a) | 14,600 | | 776,428 |
CTC Media, Inc. (a) | 42,696 | | 1,071,243 |
Golden Telecom, Inc. (d) | 24,000 | | 2,482,800 |
NII Holdings, Inc. (a) | 19,000 | | 1,102,000 |
Pricesmart, Inc. | 15,370 | | 437,123 |
TOTAL UNITED STATES OF AMERICA | | 6,131,458 |
Vietnam - 0.1% |
Luks Group (Vietnam Holdings) Co. Ltd. | 290,000 | | 384,540 |
TOTAL COMMON STOCKS (Cost $333,816,905) | 519,176,309 |
Nonconvertible Preferred Stocks - 0.1% |
| | | |
Korea (South) - 0.0% |
Samsung Electronics Co. Ltd. | 320 | | 152,422 |
South Africa - 0.1% |
Allied Electronics Corp. Ltd. | 45,500 | | 329,051 |
TOTAL NONCONVERTIBLE PREFERRED STOCKS (Cost $407,568) | 481,473 |
Investment Companies - 0.2% |
| | | |
Romania - 0.2% |
SIF 1 Banat-Crisana Arad Fund | 190,100 | | 295,248 |
SIF 3 Transilvania Brasov Fund | 583,700 | | 606,910 |
SIF 4 Muntenia Bucuresti Fund | 164,900 | | 179,348 |
SIF 5 Oltenia Craiova Fund | 72,400 | | 136,384 |
TOTAL INVESTMENT COMPANIES (Cost $949,813) | 1,217,890 |
Convertible Bonds - 0.0% |
| Principal Amount | | Value |
Brazil - 0.0% |
Companhia de Saneamento de Minas Gerais 2.3% 6/1/13 (f)
(Cost $34,686) | BRL | 555 | $ 41,703 |
Money Market Funds - 3.1% |
| Shares | | |
Fidelity Cash Central Fund, 4.97% (b) | 10,983,296 | | 10,983,296 |
Fidelity Securities Lending Cash Central Fund, 5.02% (b)(c) | 5,758,300 | | 5,758,300 |
TOTAL MONEY MARKET FUNDS (Cost $16,741,596) | 16,741,596 |
TOTAL INVESTMENT PORTFOLIO - 100.2% (Cost $351,950,568) | | 537,658,971 |
NET OTHER ASSETS - (0.2)% | | (933,573) |
NET ASSETS - 100% | $ 536,725,398 |
Currency Abbreviations |
BRL | - | Brazilian real |
Legend |
(a) Non-income producing |
(b) Affiliated fund that is available only to investment companies and other accounts managed by Fidelity Investments. The rate quoted is the annualized seven-day yield of the fund at period end. A complete unaudited listing of the fund's holdings as of its most recent quarter end is available upon request. |
(c) Investment made with cash collateral received from securities on loan. |
(d) Security or a portion of the security is on loan at period end. |
(e) Security exempt from registration under Rule 144A of the Securities Act of 1933. These securities may be resold in transactions exempt from registration, normally to qualified institutional buyers. At the end of the period, the value of these securities amounted to $4,230,256 or 0.8% of net assets. |
(f) Restricted securities - Investment in securities not registered under the Securities Act of 1933 (excluding 144A issues). At the end of the period, the value of restricted securities (excluding 144A issues) amounted to $50,165 or 0.0% of net assets. |
Additional information on each holding is as follows: |
Security | Acquisition Date | Acquisition Cost |
Aricom Plc warrants 6/5/10 | 5/11/07 | $ 0 |
Companhia de Saneamento
de Minas Gerais 2.3% 6/1/13 | 8/22/07 | $ 34,686 |
Affiliated Central Funds |
Information regarding fiscal year to date income earned by the Fund from investments in Fidelity Central Funds is as follows: |
Fund | Income earned |
Fidelity Cash Central Fund | $ 398,567 |
Fidelity Securities Lending Cash Central Fund | 22,006 |
Total | $ 420,573 |
See accompanying notes which are an integral part of the financial statements.
Annual Report
Financial Statements
Statement of Assets and Liabilities
| October 31, 2007 |
Assets | | |
Investment in securities, at value (including securities loaned of $5,779,220) - See accompanying schedule: Unaffiliated issuers (cost $335,208,972) | $ 520,917,375 | |
Fidelity Central Funds (cost $16,741,596) | 16,741,596 | |
Total Investments (cost $351,950,568) | | $ 537,658,971 |
Foreign currency held at value (cost $199) | | 199 |
Receivable for investments sold | | 2,522,436 |
Receivable for fund shares sold | | 11,055,980 |
Dividends receivable | | 592,467 |
Distributions receivable from Fidelity Central Funds | | 72,052 |
Other receivables | | 81,368 |
Total assets | | 551,983,473 |
| | |
Liabilities | | |
Payable for investments purchased | $ 6,897,916 | |
Payable for fund shares redeemed | 835,640 | |
Accrued management fee | 350,538 | |
Distribution fees payable | 192,323 | |
Other affiliated payables | 112,439 | |
Other payables and accrued expenses | 1,110,919 | |
Collateral on securities loaned, at value | 5,758,300 | |
Total liabilities | | 15,258,075 |
| | |
Net Assets | | $ 536,725,398 |
Net Assets consist of: | | |
Paid in capital | | $ 339,750,852 |
Undistributed net investment income | | 147,275 |
Accumulated undistributed net realized gain (loss) on investments and foreign currency transactions | | 12,095,382 |
Net unrealized appreciation (depreciation) on investments and assets and liabilities in foreign currencies | | 184,731,889 |
Net Assets | | $ 536,725,398 |
See accompanying notes which are an integral part of the financial statements.
Annual Report
Financial Statements - continued
Statement of Assets and Liabilities - continued
| October 31, 2007 |
| | |
Calculation of Maximum Offering Price Class A: Net Asset Value and redemption price per share ($218,835,538 ÷ 6,681,035 shares) | | $ 32.75 |
| | |
Maximum offering price per share (100/94.25 of $32.75) | | $ 34.75 |
Class T: Net Asset Value and redemption price per share ($119,951,833 ÷ 3,688,704 shares) | | $ 32.52 |
| | |
Maximum offering price per share (100/96.50 of $32.52) | | $ 33.70 |
Class B: Net Asset Value and offering price per share ($41,041,859 ÷ 1,281,158 shares)A | | $ 32.03 |
| | |
Class C: Net Asset Value and offering price per share ($104,885,033 ÷ 3,273,998 shares)A | | $ 32.04 |
| | |
| | |
Institutional Class: Net Asset Value, offering price and redemption price per share ($52,011,135 ÷ 1,575,101 shares) | | $ 33.02 |
A Redemption price per share is equal to net asset value less any applicable contingent deferred sales charge.
See accompanying notes which are an integral part of the financial statements.
Annual Report
Statement of Operations
| Year ended October 31, 2007 |
Investment Income | | |
Dividends | | $ 5,671,744 |
Income from Fidelity Central Funds | | 420,573 |
| | 6,092,317 |
Less foreign taxes withheld | | (552,834) |
Total income | | 5,539,483 |
| | |
Expenses | | |
Management fee | $ 2,344,500 | |
Transfer agent fees | 863,842 | |
Distribution fees | 1,508,122 | |
Accounting and security lending fees | 151,503 | |
Custodian fees and expenses | 384,982 | |
Independent trustees' compensation | 904 | |
Registration fees | 90,634 | |
Audit | 79,139 | |
Legal | 10,319 | |
Miscellaneous | (604) | |
Total expenses before reductions | 5,433,341 | |
Expense reductions | (177,082) | 5,256,259 |
Net investment income (loss) | | 283,224 |
Realized and Unrealized Gain (Loss) Net realized gain (loss) on: | | |
Investment securities: | | |
Unaffiliated issuers (net of foreign taxes of $94,875) | 14,316,867 | |
Foreign currency transactions | (13,978) | |
Total net realized gain (loss) | | 14,302,889 |
Change in net unrealized appreciation (depreciation) on: Investment securities (net of increase in deferred foreign taxes of $852,046) | 159,290,703 | |
Assets and liabilities in foreign currencies | 11,888 | |
Total change in net unrealized appreciation (depreciation) | | 159,302,591 |
Net gain (loss) | | 173,605,480 |
Net increase (decrease) in net assets resulting from operations | | $ 173,888,704 |
See accompanying notes which are an integral part of the financial statements.
Annual Report
Financial Statements - continued
Statement of Changes in Net Assets
| Year ended
October 31,
2007 | Year ended
October 31,
2006 |
Increase (Decrease) in Net Assets | | |
Operations | | |
Net investment income (loss) | $ 283,224 | $ 236,971 |
Net realized gain (loss) | 14,302,889 | (2,203,739) |
Change in net unrealized appreciation (depreciation) | 159,302,591 | 21,734,068 |
Net increase (decrease) in net assets resulting
from operations | 173,888,704 | 19,767,300 |
Distributions to shareholders from net investment income | (135,949) | (233,810) |
Share transactions - net increase (decrease) | 182,659,550 | 131,636,302 |
Redemption fees | 114,351 | 113,753 |
Total increase (decrease) in net assets | 356,526,656 | 151,283,545 |
| | |
Net Assets | | |
Beginning of period | 180,198,742 | 28,915,197 |
End of period (including undistributed net investment income of $147,275 and undistributed net investment income of $0, respectively) | $ 536,725,398 | $ 180,198,742 |
See accompanying notes which are an integral part of the financial statements.
Annual Report
Financial Highlights - Class A
Years ended October 31, | 2007 | 2006 | 2005 | 2004 H |
Selected Per-Share Data | | | | |
Net asset value, beginning of period | $ 19.22 | $ 13.75 | $ 9.87 | $ 10.00 |
Income from Investment Operations | | | | |
Net investment income (loss) E | .09 | .09 | .12 | .02 |
Net realized and unrealized gain (loss) | 13.46 | 5.47 | 3.75 | (.16) |
Total from investment operations | 13.55 | 5.56 | 3.87 | (.14) |
Distributions from net investment income | (.03) | (.11) | - | - |
Redemption fees added to paid in capital E | .01 | .02 | .01 | .01 |
Net asset value, end of period | $ 32.75 | $ 19.22 | $ 13.75 | $ 9.87 |
Total Return B,C,D | 70.63% | 40.75% | 39.31% | (1.30)% |
Ratios to Average Net Assets F,I | | | | |
Expenses before reductions | 1.59% | 1.84% | 3.15% | 10.75% A |
Expenses net of fee waivers, if any | 1.59% | 1.60% | 1.63% | 2.00% A |
Expenses net of all reductions | 1.54% | 1.49% | 1.52% | 1.91% A |
Net investment income (loss) | .36% | .51% | .95% | .28% A |
Supplemental Data | | | | |
Net assets, end of period
(000 omitted) | $ 218,836 | $ 68,232 | $ 9,617 | $ 1,178 |
Portfolio turnover rate G | 48% | 48% | 54% | 101% A |
A Annualized
B Total returns for periods of less than one year are not annualized.
C Total returns would have been lower had certain expenses not been reduced during the periods shown.
D Total returns do not include the effect of the sales charges.
E Calculated based on average shares outstanding during the period.
F Fees and expenses of the underlying Fidelity Central Funds are not included in the Fund's expense ratio. The Fund indirectly bears its proportionate share of the expenses of any underlying Fidelity Central Funds.
G Amount does not include the portfolio activity of any underlying Fidelity Central Funds.
H For the period March 29, 2004 (commencement of operations) to October 31, 2004.
I Expense ratios reflect operating expenses of the class. Expenses before reductions do not reflect amounts reimbursed by the investment adviser or reductions from brokerage service arrangements or other expense offset arrangements and do not represent the amount paid by the class during periods when reimbursements or reductions occur. Expense ratios before reductions for start-up periods may not be representative of longer-term operating periods. Expenses net of fee waivers reflect expenses after reimbursement by the investment adviser but prior to reductions from brokerage service arrangements or other expense offset arrangements. Expenses net of all reductions represent the net expenses paid by the class.
See accompanying notes which are an integral part of the financial statements.
Annual Report
Financial Highlights - Class T
Years ended October 31, | 2007 | 2006 | 2005 | 2004 H |
Selected Per-Share Data | | | | |
Net asset value, beginning of period | $ 19.10 | $ 13.69 | $ 9.86 | $ 10.00 |
Income from Investment Operations | | | | |
Net investment income (loss) E | .03 | .05 | .09 | -J |
Net realized and unrealized gain (loss) | 13.38 | 5.43 | 3.73 | (.15) |
Total from investment operations | 13.41 | 5.48 | 3.82 | (.15) |
Distributions from net investment income | - | (.09) | - | - |
Redemption fees added to paid in capital E | .01 | .02 | .01 | .01 |
Net asset value, end of period | $ 32.52 | $ 19.10 | $ 13.69 | $ 9.86 |
Total Return B,C,D | 70.26% | 40.32% | 38.84% | (1.40)% |
Ratios to Average Net Assets F,I | | | | |
Expenses before reductions | 1.86% | 2.12% | 3.53% | 11.13% A |
Expenses net of fee waivers, if any | 1.85% | 1.85% | 1.89% | 2.25% A |
Expenses net of all reductions | 1.79% | 1.74% | 1.77% | 2.16% A |
Net investment income (loss) | .11% | .26% | .70% | .03% A |
Supplemental Data | | | | |
Net assets, end of period
(000 omitted) | $ 119,952 | $ 41,369 | $ 6,801 | $ 889 |
Portfolio turnover rate G | 48% | 48% | 54% | 101% A |
A Annualized
B Total returns for periods of less than one year are not annualized.
C Total returns would have been lower had certain expenses not been reduced during the periods shown.
D Total returns do not include the effect of the sales charges.
E Calculated based on average shares outstanding during the period.
F Fees and expenses of the underlying Fidelity Central Funds are not included in the Fund's expense ratio. The Fund indirectly bears its proportionate share of the expenses of any underlying Fidelity Central Funds.
G Amount does not include the portfolio activity of any underlying Fidelity Central Funds.
H For the period March 29, 2004 (commencement of operations) to October 31, 2004.
I Expense ratios reflect operating expenses of the class. Expenses before reductions do not reflect amounts reimbursed by the investment adviser or reductions from brokerage service arrangements or other expense offset arrangements and do not represent the amount paid by the class during periods when reimbursements or reductions occur. Expense ratios before reductions for start-up periods may not be representative of longer-term operating periods. Expenses net of fee waivers reflect expenses after reimbursement by the investment adviser but prior to reductions from brokerage service arrangements or other expense offset arrangements. Expenses net of all reductions represent the net expenses paid by the class.
J Amount represents less than $.01 per share.
See accompanying notes which are an integral part of the financial statements.
Annual Report
Financial Highlights - Class B
Years ended October 31, | 2007 | 2006 | 2005 | 2004 H |
Selected Per-Share Data | | | | |
Net asset value, beginning of period | $ 18.91 | $ 13.58 | $ 9.83 | $ 10.00 |
Income from Investment Operations | | | | |
Net investment income (loss) E | (.09) | (.04) | .02 | (.03) |
Net realized and unrealized gain (loss) | 13.20 | 5.40 | 3.72 | (.15) |
Total from investment operations | 13.11 | 5.36 | 3.74 | (.18) |
Distributions from net investment income | - | (.05) | - | - |
Redemption fees added to paid in capital E | .01 | .02 | .01 | .01 |
Net asset value, end of period | $ 32.03 | $ 18.91 | $ 13.58 | $ 9.83 |
Total Return B,C,D | 69.38% | 39.67% | 38.15% | (1.70)% |
Ratios to Average Net Assets F,I | | | | |
Expenses before reductions | 2.37% | 2.66% | 4.00% | 11.49% A |
Expenses net of fee waivers, if any | 2.35% | 2.35% | 2.39% | 2.75% A |
Expenses net of all reductions | 2.29% | 2.24% | 2.27% | 2.67% A |
Net investment income (loss) | (.39)% | (.24)% | .20% | (.47)% A |
Supplemental Data | | | | |
Net assets, end of period
(000 omitted) | $ 41,042 | $ 18,622 | $ 4,997 | $ 719 |
Portfolio turnover rate G | 48% | 48% | 54% | 101% A |
A Annualized
B Total returns for periods of less than one year are not annualized.
C Total returns would have been lower had certain expenses not been reduced during the periods shown.
D Total returns do not include the effect of the contingent deferred sales charge.
E Calculated based on average shares outstanding during the period.
F Fees and expenses of the underlying Fidelity Central Funds are not included in the Fund's expense ratio. The Fund indirectly bears its proportionate share of the expenses of any underlying Fidelity Central Funds.
G Amount does not include the portfolio activity of any underlying Fidelity Central Funds.
H For the period March 29, 2004 (commencement of operations) to October 31, 2004.
I Expense ratios reflect operating expenses of the class. Expenses before reductions do not reflect amounts reimbursed by the investment adviser or reductions from brokerage service arrangements or other expense offset arrangements and do not represent the amount paid by the class during periods when reimbursements or reductions occur. Expense ratios before reductions for start-up periods may not be representative of longer-term operating periods. Expenses net of fee waivers reflect expenses after reimbursement by the investment adviser but prior to reductions from brokerage service arrangements or other expense offset arrangements. Expenses net of all reductions represent the net expenses paid by the class.
See accompanying notes which are an integral part of the financial statements.
Annual Report
Financial Highlights - Class C
Years ended October 31, | 2007 | 2006 | 2005 | 2004 H |
Selected Per-Share Data | | | | |
Net asset value, beginning of period | $ 18.91 | $ 13.59 | $ 9.83 | $ 10.00 |
Income from Investment Operations | | | | |
Net investment income (loss) E | (.09) | (.04) | .02 | (.03) |
Net realized and unrealized gain (loss) | 13.21 | 5.39 | 3.73 | (.15) |
Total from investment operations | 13.12 | 5.35 | 3.75 | (.18) |
Distributions from net investment income | - | (.05) | - | - |
Redemption fees added to paid in capital E | .01 | .02 | .01 | .01 |
Net asset value, end of period | $ 32.04 | $ 18.91 | $ 13.59 | $ 9.83 |
Total Return B,C,D | 69.43% | 39.59% | 38.25% | (1.70)% |
Ratios to Average Net Assets F,I | | | | |
Expenses before reductions | 2.34% | 2.58% | 4.09% | 11.58% A |
Expenses net of fee waivers, if any | 2.34% | 2.35% | 2.39% | 2.75% A |
Expenses net of all reductions | 2.29% | 2.24% | 2.28% | 2.66% A |
Net investment income (loss) | (.39)% | (.24)% | .19% | (.47)% A |
Supplemental Data | | | | |
Net assets, end of period
(000 omitted) | $ 104,885 | $ 42,805 | $ 5,890 | $ 1,105 |
Portfolio turnover rate G | 48% | 48% | 54% | 101% A |
A Annualized
B Total returns for periods of less than one year are not annualized.
C Total returns would have been lower had certain expenses not been reduced during the periods shown.
D Total returns do not include the effect of the contingent deferred sales charge.
E Calculated based on average shares outstanding during the period.
F Fees and expenses of the underlying Fidelity Central Funds are not included in the Fund's expense ratio. The Fund indirectly bears its proportionate share of the expenses of any underlying Fidelity Central Funds.
G Amount does not include the portfolio activity of any underlying Fidelity Central Funds.
H For the period March 29, 2004 (commencement of operations) to October 31, 2004.
I Expense ratios reflect operating expenses of the class. Expenses before reductions do not reflect amounts reimbursed by the investment adviser or reductions from brokerage service arrangements or other expense offset arrangements and do not represent the amount paid by the class during periods when reimbursements or reductions occur. Expense ratios before reductions for start-up periods may not be representative of longer-term operating periods. Expenses net of fee waivers reflect expenses after reimbursement by the investment adviser but prior to reductions from brokerage service arrangements or other expense offset arrangements. Expenses net of all reductions represent the net expenses paid by the class.
See accompanying notes which are an integral part of the financial statements.
Annual Report
Financial Highlights - Institutional Class
Years ended October 31, | 2007 | 2006 | 2005 | 2004 G |
Selected Per-Share Data | | | | |
Net asset value, beginning of period | $ 19.34 | $ 13.80 | $ 9.89 | $ 10.00 |
Income from Investment Operations | | | | |
Net investment income (loss) D | .18 | .14 | .14 | .03 |
Net realized and unrealized gain (loss) | 13.55 | 5.49 | 3.76 | (.15) |
Total from investment operations | 13.73 | 5.63 | 3.90 | (.12) |
Distributions from net investment income | (.06) | (.11) | - | - |
Redemption fees added to paid in capital D | .01 | .02 | .01 | .01 |
Net asset value, end of period | $ 33.02 | $ 19.34 | $ 13.80 | $ 9.89 |
Total Return B,C | 71.23% | 41.11% | 39.53% | (1.10)% |
Ratios to Average Net Assets E,H | | | | |
Expenses before reductions | 1.25% | 1.47% | 3.05% | 10.37% A |
Expenses net of fee waivers, if any | 1.25% | 1.35% | 1.41% | 1.75% A |
Expenses net of all reductions | 1.19% | 1.24% | 1.30% | 1.66% A |
Net investment income (loss) | .71% | .75% | 1.17% | .53% A |
Supplemental Data | | | | |
Net assets, end of period
(000 omitted) | $ 52,011 | $ 9,172 | $ 1,610 | $ 529 |
Portfolio turnover rate F | 48% | 48% | 54% | 101% A |
A Annualized
B Total returns for periods of less than one year are not annualized.
C Total returns would have been lower had certain expenses not been reduced during the periods shown.
D Calculated based on average shares outstanding during the period.
E Fees and expenses of the underlying Fidelity Central Funds are not included in the Fund's expense ratio. The Fund indirectly bears its proportionate share of the expenses of any underlying Fidelity Central Funds.
F Amount does not include the portfolio activity of any underlying Fidelity Central Funds.
G For the period March 29, 2004 (commencement of operations) to October 31, 2004.
H Expense ratios reflect operating expenses of the class. Expenses before reductions do not reflect amounts reimbursed by the investment adviser or reductions from brokerage service arrangements or other expense offset arrangements and do not represent the amount paid by the class during periods when reimbursements or reductions occur. Expense ratios before reductions for start-up periods may not be representative of longer-term operating periods. Expenses net of fee waivers reflect expenses after reimbursement by the investment adviser but prior to reductions from brokerage service arrangements or other expense offset arrangements. Expenses net of all reductions represent the net expenses paid by the class.
See accompanying notes which are an integral part of the financial statements.
Annual Report
Notes to Financial Statements
For the period ended October 31, 2007
1. Organization.
Fidelity Advisor Emerging Markets Fund (the Fund) is a non-diversified fund of Fidelity Advisor Series VIII (the trust) and is authorized to issue an unlimited number of shares. The trust is registered under the Investment Company Act of 1940, as amended (the 1940 Act), as an open-end management investment company organized as a Massachusetts business trust. The Fund offers Class A, Class T, Class B, Class C and Institutional Class shares, each of which has equal rights as to assets and voting privileges. Each class has exclusive voting rights with respect to matters that affect that class. Class B shares will automatically convert to Class A shares after a holding period of seven years from the initial date of purchase. Investment income, realized and unrealized capital gains and losses, the common expenses of the Fund, and certain fund-level expense reductions, if any, are allocated on a pro rata basis to each class based on the relative net assets of each class to the total net assets of the Fund. Each class differs with respect to transfer agent and distribution and service plan fees incurred. Certain expense reductions also differ by class. The Fund's investments in emerging markets can be subject to social, economic, regulatory, and political uncertainties and can be extremely volatile.
2. Investments in Fidelity Central Funds.
The Fund may invest in Fidelity Central Funds, which are open-end investment companies available only to other investment companies and accounts managed by Fidelity Management & Research Company (FMR) and its affiliates. The Fund's Schedule of Investments lists each of the Fidelity Central Funds as an investment of the Fund, but does not include the underlying holdings of each Fidelity Central Fund. As an Investing Fund, the Fund indirectly bears its proportionate share of the expenses of the underlying Fidelity Central Funds.
The Money Market Central Funds seek preservation of capital and current income and are managed by Fidelity Investments Money Management, Inc. (FIMM), an affiliate of FMR.
A complete list of holdings for each Fidelity Central Fund is available upon request or at the SEC's web site at www.sec.gov. In addition, the financial statements of the Fidelity Central Funds, which are not covered by the Fund's Report of Independent Registered Public Accounting Firm, are available on the SEC's web site or upon request.
3. Significant Accounting Policies.
The financial statements have been prepared in conformity with accounting principles generally accepted in the United States of America, which require management to make certain estimates and assumptions at the date of the financial statements. The following summarizes the significant accounting policies of the Fund:
Annual Report
3. Significant Accounting Policies - continued
Security Valuation. Investments are valued and net asset value (NAV) per share is calculated (NAV calculation) as of the close of business of the New York Stock Exchange (NYSE), normally 4:00 p.m. Eastern time. Wherever possible, the Fund uses independent pricing services approved by the Board of Trustees to value its investments.
Equity securities, including restricted securities, for which market quotations are readily available, are valued at the last reported sale price or official closing price as reported by an independent pricing service on the primary market or exchange on which they are traded. In the event there were no sales during the day or closing prices are not available, securities are valued at the last quoted bid price. Debt securities, including restricted securities, for which quotations are readily available, are valued by independent pricing services or by dealers who make markets in such securities. Pricing services consider yield or price of bonds of comparable quality, coupon, maturity and type as well as dealer supplied prices. Investments in open-end mutual funds, including the Fidelity Central Funds, are valued at their closing net asset value each business day. Short-term securities with remaining maturities of sixty days or less for which quotations are not readily available are valued at amortized cost, which approximates value.
When current market prices or quotations are not readily available or do not accurately reflect fair value, valuations may be determined in accordance with procedures adopted by the Board of Trustees. For example, when developments occur between the close of a market and the close of the NYSE that may materially affect the value of some or all of the securities, or when trading in a security is halted, those securities may be fair valued. Factors used in the determination of fair value may include monitoring news to identify significant market or security specific events such as changes in the value of U.S. securities markets, reviewing developments in foreign markets and evaluating the performance of ADRs, futures contracts and exchange-traded funds. Because the Fund's utilization of fair value pricing depends on market activity, the frequency with which fair value pricing is used cannot be predicted and may be utilized to a significant extent. The value of securities used for NAV calculation under fair value pricing may differ from published prices for the same securities.
Foreign Currency. The Fund uses foreign currency contracts to facilitate transactions in foreign-denominated securities. Losses from these transactions may arise from changes in the value of the foreign currency or if the counterparties do not perform under the contracts' terms.
Foreign-denominated assets, including investment securities, and liabilities are translated into U.S. dollars at the exchange rate at period end. Purchases and sales of investment securities, income and dividends received and expenses denominated in foreign currencies are translated into U.S. dollars at the exchange rate in effect on the transaction date.
Annual Report
Notes to Financial Statements - continued
3. Significant Accounting Policies - continued
Foreign Currency - continued
The effects of exchange rate fluctuations on investments are included with the net realized and unrealized gain (loss) on investment securities. Other foreign currency transactions resulting in realized and unrealized gain (loss) are disclosed separately.
Investment Transactions and Income. For financial reporting purposes, the Fund's investment holdings and NAV include trades executed through the end of the last business day of the period. The NAV for processing shareholder transactions includes trades executed through the end of the prior business day. Gains and losses on securities sold are determined on the basis of identified cost. Dividend income is recorded on the ex-dividend date, except for certain dividends from foreign securities where theex-dividend date may have passed, which are recorded as soon as the Fund is informed of the ex-dividend date. Non-cash dividends included in dividend income, if any, are recorded at the fair market value of the securities received. Distributions received on securities that represent a return of capital or capital gain are recorded as a reduction of cost of investments and/or as a realized gain. The Fund estimates the components of distributions received that may be considered return of capital distributions or capital gain distributions. Interest income and distributions from the Fidelity Central Funds are accrued as earned. Interest income includes coupon interest and amortization of premium and accretion of discount on debt securities. Investment income is recorded net of foreign taxes withheld where recovery of such taxes is uncertain.
Expenses. Most expenses of the trust can be directly attributed to a fund. Expenses which cannot be directly attributed are apportioned among each Fund in the trust. Expense estimates are accrued in the period to which they relate and adjustments are made when actual amounts are known.
Income Tax Information and Distributions to Shareholders. Each year, the Fund intends to qualify as a regulated investment company by distributing all of its taxable income and realized gains under Subchapter M of the Internal Revenue Code. As a result, no provision for income taxes is required in the accompanying financial statements. Foreign taxes are provided for based on the Fund's understanding of the tax rules and rates that exist in the foreign markets in which it invests.
Distributions are recorded on the ex-dividend date. Income dividends and capital gain distributions are declared separately for each class. Income and capital gain distributions are determined in accordance with income tax regulations, which may differ from generally accepted accounting principles. In addition, the Fund will claim a portion of the payment made to redeeming shareholders as a distribution for income tax purposes.
Annual Report
3. Significant Accounting Policies - continued
Income Tax Information and Distributions to Shareholders - continued
Capital accounts within the financial statements are adjusted for permanent book-tax differences. These adjustments have no impact on net assets or the results of operations. Temporary book-tax differences will reverse in a subsequent period.
Book-tax differences are primarily due to foreign currency transactions, certain foreign taxes, passive foreign investment companies (PFIC), capital loss carryforwards and losses deferred due to wash sales.
The tax-basis components of distributable earnings and the federal tax cost as of period end were as follows:
Unrealized appreciation | $ 186,040,842 | |
Unrealized depreciation | (3,284,458) | |
Net unrealized appreciation (depreciation) | 182,756,384 | |
Undistributed ordinary income | 1,018,070 | |
Undistributed long-term capital gain | 12,313,925 | |
| | |
Cost for federal income tax purposes | $ 354,902,587 | |
The tax character of distributions paid was as follows:
| October 31, 2007 | October 31, 2006 |
Ordinary Income | $ 135,949 | $ 233,810 |
Short-Term Trading (Redemption) Fees. Shares held in the Fund less than 90 days are subject to a redemption fee equal to 1.50% of the proceeds of the redeemed shares. All redemption fees, including any estimated redemption fees paid by FMR, are retained by the Fund and accounted for as an addition to paid in capital.
New Accounting Pronouncements. In July 2006, Financial Accounting Standards Board Interpretation No. 48, Accounting for Uncertainty in Income Taxes - an interpretation of FASB Statement 109 (FIN 48), was issued and is effective on the last business day of the semiannual reporting period for fiscal years beginning after December 15, 2006. FIN 48 sets forth a threshold for financial statement recognition, measurement and disclosure of a tax position taken or expected to be taken on a tax return. Management has concluded that the adoption of FIN 48 will not result in a material impact on the Fund's net assets, results of operations and financial statement disclosures.
In addition, in September 2006, Statement of Financial Accounting Standards No. 157, Fair Value Measurements (SFAS 157), was issued and is effective for fiscal years beginning after November 15, 2007. SFAS 157 defines fair value, establishes a framework for measuring fair value and expands disclosures about fair value measurements. Management is currently evaluating the impact the adoption of SFAS 157 will have on the Fund's financial statement disclosures.
Annual Report
Notes to Financial Statements - continued
4. Operating Policies.
Repurchase Agreements. FMR has received an Exemptive Order from the Securities and Exchange Commission (the SEC) which permits the Fund and other affiliated entities of FMR to transfer uninvested cash balances into joint trading accounts which are then invested in repurchase agreements. The Fund may also invest directly with institutions in repurchase agreements. Repurchase agreements are collateralized by government or non-government securities. Upon settlement date, collateral is held in segregated accounts with custodian banks and may be obtained in the event of a default of the counterparty. The Fund monitors, on a daily basis, the value of the collateral to ensure it is at least equal to the principal amount of the repurchase agreement (including accrued interest). In the event of a default by the counterparty, realization of the collateral proceeds could be delayed, during which time the value of the collateral may decline.
Restricted Securities. The Fund may invest in securities that are subject to legal or contractual restrictions on resale. These securities generally may be resold in transactions exempt from registration or to the public if the securities are registered. Disposal of these securities may involve time-consuming negotiations and expense, and prompt sale at an acceptable price may be difficult. Information regarding restricted securities is included at the end of the Fund's Schedule of Investments.
5. Purchases and Sales of Investments.
Purchases and sales of securities, other than short-term securities, aggregated $310,092,721 and $138,126,917, respectively.
6. Fees and Other Transactions with Affiliates.
Management Fee. FMR and its affiliates provide the Fund with investment management related services for which the Fund pays a monthly management fee. The management fee is the sum of an individual fund fee rate that is based on an annual rate of .55% of the Fund's average net assets and a group fee rate that averaged ..26% during the period. The group fee rate is based upon the average net assets of all the mutual funds advised by FMR. The group fee rate decreases as assets under management increase and increases as assets under management decrease. For the period, the total annual management fee rate was .80% of the Fund's average net assets.
Annual Report
6. Fees and Other Transactions with Affiliates - continued
Distribution and Service Plan. In accordance with Rule 12b-1 of the 1940 Act, the Fund has adopted separate Distribution and Service Plans for each class of shares. Certain classes pay Fidelity Distributors Corporation (FDC), an affiliate of FMR, separate Distribution and Service Fees, each of which is based on an annual percentage of each class' average net assets. In addition, FDC may pay financial intermediaries for selling shares of the Fund and providing shareholder support services. For the period, the Distribution and Service Fee rates and the total amounts paid to and retained by FDC were as follows:
| Distribution
Fee | Service
Fee | Paid to
FDC | Retained
by FDC |
Class A | -% | .25% | $ 285,484 | $ 45,204 |
Class T | .25% | .25% | 338,336 | 8,780 |
Class B | .75% | .25% | 258,308 | 193,731 |
Class C | .75% | .25% | 625,994 | 253,879 |
| | | $ 1,508,122 | $ 501,594 |
Sales Load. FDC receives a front-end sales charge of up to 5.75% for selling Class A shares, and 3.50% for selling Class T shares, some of which is paid to financial intermediaries for selling shares of the Fund. FDC receives the proceeds of contingent deferred sales charges levied on Class A, Class T, Class B, and Class C redemptions. These charges depend on the holding period. The deferred sales charges range from 5% to 1% forClass B, 1% for Class C, 1.00% to .50% for certain purchases of Class A shares and .25% for certain purchases of Class T shares.
For the period, sales charge amounts retained by FDC were as follows:
| Retained
by FDC |
Class A | $ 199,157 |
Class T | 37,466 |
Class B* | 46,149 |
Class C* | 25,790 |
| $ 308,562 |
* When Class B and Class C shares are initially sold, FDC pays commissions from its own resources to financial intermediaries through which the sales are made.
Annual Report
Notes to Financial Statements - continued
6. Fees and Other Transactions with Affiliates - continued
Transfer Agent Fees. Fidelity Investments Institutional Operations Company, Inc. (FIIOC), an affiliate of FMR, is the transfer, dividend disbursing and shareholder servicing agent for each class of the Fund. FIIOC receives account fees and asset-based fees that vary according to the account size and type of account of the shareholders of the respective classes of the Fund. FIIOC pays for typesetting, printing and mailing of shareholder reports, except proxy statements. For the period, the total transfer agent fees paid by each class to FIIOC, were as follows:
| Amount | % of
Average
Net Assets |
Class A | $ 342,142 | .30 |
Class T | 210,942 | .31 |
Class B | 82,727 | .32 |
Class C | 187,331 | .30 |
Institutional Class | 40,700 | .21 |
| $ 863,842 | |
Accounting and Security Lending Fees. Fidelity Service Company, Inc. (FSC), an affiliate of FMR, maintains the Fund's accounting records. The accounting fee is based on the level of average net assets for the month. Under a separate contract, FSC administers the security lending program. The security lending fee is based on the number and duration of lending transactions.
Brokerage Commissions. The Fund placed a portion of its portfolio transactions with brokerage firms which are affiliates of the investment adviser. The commissions paid to these affiliated firms were $41 for the period.
7. Committed Line of Credit.
The Fund participates with other funds managed by FMR in a $4.2 billion credit facility (the "line of credit") to be utilized for temporary or emergency purposes to fund shareholder redemptions or for other short-term liquidity purposes. The Fund has agreed to pay commitment fees on its pro rata portion of the line of credit, which amounted to $538 and is reflected in Miscellaneous Expense on the Statement of Operations. During the period, there were no borrowings on this line of credit.
8. Security Lending.
The Fund lends portfolio securities from time to time in order to earn additional income. On the settlement date of the loan, the Fund receives collateral (in the form of U.S. Treasury obligations, letters of credit and/or cash) against the loaned securities and maintains collateral in an amount not less than 100% of the market value of the loaned securities during the period of the loan. The market value of the loaned securities is determined at the close of business of the Fund and any additional required collateral is
Annual Report
8. Security Lending - continued
delivered to the Fund on the next business day. If the borrower defaults on its obligation to return the securities loaned because of insolvency or other reasons, a fund could experience delays and costs in recovering the securities loaned or in gaining access to the collateral. Any cash collateral received is invested in the Fidelity Securities Lending Cash Central Fund. The value of loaned securities and cash collateral at period end are disclosed on the Fund's Statement of Assets and Liabilities. Security lending income represents the income earned on investing cash collateral, less fees and expenses associated with the loan, plus any premium payments that may be received on the loan of certain types of securities. Security lending income is presented in the Statement of Operations as a component of income from Fidelity Central Funds. Net income from lending portfolio securities during the period amounted to $22,006.
9. Expense Reductions.
FMR voluntarily agreed to reimburse each class to the extent annual operating expenses exceeded certain levels of average net assets as noted in the table below. Some expenses, for example interest expense, including commitment fees, are excluded from this reimbursement.
The following classes were in reimbursement during the period:
| Expense
Limitations | Reimbursement
from Adviser |
Class T | 1.85% | $ 7,631 |
Class B | 2.35% | 5,884 |
| | $ 13,515 |
Many of the brokers with whom FMR places trades on behalf of the Fund provided services to the Fund in addition to trade execution. These services included payments of certain expenses on behalf of the Fund totaling $160,943 for the period. In addition, through arrangements with each class' transfer agent, credits realized as a result of uninvested cash balances were used to reduce the Fund's expenses. During the period, credits reduced each class' transfer agent expense as noted in the table below.
| Transfer Agent
expense reduction | |
Institutional Class | $ 257 | |
10. Other.
The Fund's organizational documents provide former and current trustees and officers with a limited indemnification against liabilities arising in connection with the performance of their duties to the Fund. In the normal course of business, the Fund may also
Annual Report
Notes to Financial Statements - continued
10. Other - continued
enter into contracts that provide general indemnifications. The Fund's maximum exposure under these arrangements is unknown as this would be dependent on future claims that may be made against the Fund. The risk of material loss from such claims is considered remote.
In September 2006, FIIOC, the Fund's transfer agent, notified the Fund that the Fund's books and records did not reflect a conversion of certain Class B to Class A shares upon their conversion date. In March 2007, FIIOC converted the relevant Class B shares to Class A shares and recorded the conversion in the books and records of the Fund which did not result in a material impact to the Fund's reported net assets or results of operations in the accompanying financial statements. FIIOC has remediated affected shareholders and reimbursed the Fund for all related audit and legal expenses.
The United States Securities and Exchange Commission ("SEC") is conducting an investigation of FMR (covering the years 2002 to 2004) arising from gifts, gratuities and business entertainment provided by certain brokers to certain individuals who were employed on FMR's domestic equity trading desk during that period. FMR is in discussions with the SEC staff regarding the possible resolution of the matter, but as ofperiod-end no final resolution has been reached.
In December 2006, the Independent Trustees completed their own investigation of the matter with the assistance of independent counsel. The Independent Trustees and FMR agree that, despite the absence of proof that the Fidelity mutual funds experienced diminished execution quality as a result of the improper receipt of gifts and business entertainment, the conduct at issue was serious and is worthy of redress. Accordingly, the Independent Trustees have requested and FMR has agreed to pay $42 million to Fidelity mutual funds, plus interest to be determined at the time that payment is made. A method of allocating this payment among the funds has not yet been determined. The total payment to the Fund is not anticipated to have a material impact on the Fund's net assets. In addition, FMR reimbursed related legal expenses which are recorded in the accompanying Statement of Operations as an expense reduction.
11. Distributions to Shareholders.
Distributions to shareholders of each class were as follows:
Years ended October 31, | 2007 | 2006 |
From net investment income | | |
Class A | $ 107,461 | $ 108,159 |
Class T | - | 59,424 |
Class B | - | 22,167 |
Class C | - | 28,948 |
Institutional Class | 28,488 | 15,112 |
Total | $ 135,949 | $ 233,810 |
Annual Report
12. Share Transactions.
Transactions for each class of shares were as follows:
| Shares | Dollars |
Years ended October 31, | 2007 | 2006 | 2007 | 2006 |
Class A | | | | |
Shares sold | 4,642,561 | 3,827,132 | $ 115,951,246 | $ 68,553,729 |
Reinvestment of distributions | 4,531 | 5,651 | 93,931 | 88,424 |
Shares redeemed | (1,516,681) | (981,504) | (35,427,581) | (17,267,219) |
Net increase (decrease) | 3,130,411 | 2,851,279 | $ 80,617,596 | $ 51,374,934 |
Class T | | | | |
Shares sold | 2,453,317 | 2,192,291 | $ 60,760,054 | $ 39,024,862 |
Reinvestment of distributions | - | 3,478 | - | 54,093 |
Shares redeemed | (930,237) | (526,816) | (21,865,345) | (9,118,376) |
Net increase (decrease) | 1,523,080 | 1,668,953 | $ 38,894,709 | $ 29,960,579 |
Class B | | | | |
Shares sold | 569,930 | 896,679 | $ 13,827,872 | $ 15,771,361 |
Reinvestment of distributions | - | 1,275 | - | 20,054 |
Shares redeemed | (273,651) | (281,038) | (6,330,619) | (4,902,600) |
Net increase (decrease) | 296,279 | 616,916 | $ 7,497,253 | $ 10,888,815 |
Class C | | | | |
Shares sold | 1,627,896 | 2,286,049 | $ 39,785,213 | $ 40,697,157 |
Reinvestment of distributions | - | 1,544 | - | 24,240 |
Shares redeemed | (617,626) | (457,432) | (14,265,294) | (7,909,606) |
Net increase (decrease) | 1,010,270 | 1,830,161 | $ 25,519,919 | $ 32,811,791 |
Institutional Class | | | | |
Shares sold | 1,365,554 | 615,656 | $ 36,368,938 | $ 11,096,263 |
Reinvestment of distributions | 877 | 676 | 18,267 | 10,642 |
Shares redeemed | (265,597) | (258,689) | (6,257,132) | (4,506,722) |
Net increase (decrease) | 1,100,834 | 357,643 | $ 30,130,073 | $ 6,600,183 |
Annual Report
Report of Independent Registered Public Accounting Firm
To the Trustees of Fidelity Advisor Series VIII and Shareholders of Fidelity Advisor Emerging Markets Fund:
We have audited the accompanying statement of assets and liabilities of Fidelity Advisor Emerging Markets Fund (the Fund), a fund of Fidelity Advisor Series VIII, including the schedule of investments, as of October 31, 2007, and the related statement of operations for the year then ended, the statement of changes in net assets for each of the two years in the period then ended, and the financial highlights for each of the three years in the period then ended and the period March 29, 2004 (commencement of operations) to October 31, 2004. These financial statements and financial highlights are the responsibility of the Fund's management. Our responsibility is to express an opinion on these financial statements and financial highlights based on our audits.
We conducted our audits in accordance with standards of the Public Company Accounting Oversight Board (United States). Those standards require that we plan and perform the audit to obtain reasonable assurance about whether the financial statements and financial highlights are free of material misstatement. The Fund is not required to have, nor were we engaged to perform, an audit of its internal control over financial reporting. Our audits included consideration of internal control over financial reporting as a basis for designing audit procedures that are appropriate in the circumstances, but not for the purpose of expressing an opinion on the effectiveness of the Fund's internal control over financial reporting. Accordingly, we express no such opinion. An audit also includes examining, on a test basis, evidence supporting the amounts and disclosures in the financial statements, assessing the accounting principles used and significant estimates made by management, as well as evaluating the overall financial statement presentation. Our procedures included confirmation of securities owned as of October 31, 2007, by correspondence with the custodians and brokers; where replies were not received from brokers, we performed other auditing procedures. We believe that our audits provide a reasonable basis for our opinion.
In our opinion, the financial statements and financial highlights referred to above present fairly, in all material respects, the financial position of Fidelity Advisor Emerging Markets Fund as of October 31, 2007, the results of its operations for the year then ended, the changes in its net assets for each of the two years in the period then ended and its financial highlights for each of the three years in the period then ended and the period March 29, 2004 (commencement of operations) to October 31, 2004, in conformity with accounting principles generally accepted in the United States of America.
/s/ Deloitte & Touche LLP
DELOITTE & TOUCHE LLP
Boston, Massachusetts
December 21, 2007
Annual Report
Trustees and Officers
The Trustees, Members of the Advisory Board, and executive officers of the trust and fund, as applicable, are listed below. The Board of Trustees governs the fund and is responsible for protecting the interests of shareholders. The Trustees are experienced executives who meet periodically throughout the year to oversee the fund's activities, review contractual arrangements with companies that provide services to the fund, and review the fund's performance. Except for James C. Curvey, each of the Trustees oversees 370 funds advised by FMR or an affiliate. Mr. Curvey oversees 340 funds advised by FMR or an affiliate.
The Trustees hold office without limit in time except that (a) any Trustee may resign; (b) any Trustee may be removed by written instrument, signed by at least two-thirds of the number of Trustees prior to such removal; (c) any Trustee who requests to be retired or who has become incapacitated by illness or injury may be retired by written instrument signed by a majority of the other Trustees; and (d) any Trustee may be removed at any special meeting of shareholders by a two-thirds vote of the outstanding voting securities of the trust. Each Trustee who is not an interested person (as defined in the 1940 Act) (Independent Trustee), shall retire not later than the last day of the calendar year in which his or her 72nd birthday occurs. The Independent Trustees may waive this mandatory retirement age policy with respect to individual Trustees. The executive officers and Advisory Board Members hold office without limit in time, except that any officer and Advisory Board Member may resign or may be removed by a vote of a majority of the Trustees at any regular meeting or any special meeting of the Trustees. Except as indicated, each individual has held the office shown or other offices in the same company for the past five years.
The fund's Statement of Additional Information (SAI) includes more information about the Trustees. To request a free copy, call Fidelity at 1-877-208-0098.
Interested Trustees*:
Correspondence intended for each Trustee who is an interested person may be sent to Fidelity Investments, 82 Devonshire Street, Boston, Massachusetts 02109.
Name, Age; Principal Occupation |
Edward C. Johnson 3d (77) |
| Year of Election or Appointment: 1983 Mr. Johnson is Chairman of the Board of Trustees. Mr. Johnson serves as President (2006-present), Chief Executive Officer, Chairman, and a Director of FMR LLC; Chairman and a Director of FMR; Chairman and a Director of Fidelity Research & Analysis Company (FRAC); Chairman and a Director of Fidelity Investments Money Management, Inc.; and Chairman (2001-present) and a Director of FMR Co., Inc. In addition, Mr. Johnson serves as Chairman and Director of Fidelity International Limited (FIL). |
James C. Curvey (72) |
| Year of Election or Appointment: 2007 Mr. Curvey also serves as Trustee (2007-present) or Member of the Advisory Board (2007-present) of other investment companies advised by FMR. Mr. Curvey is a Director of FMR and FMR Co., Inc. (2007-present). Mr. Curvey is also Vice Chairman (2006-present) and Director of FMR LLC. Mr. Curvey joined Fidelity in 1982 and served in numerous senior management positions, including President and Chief Operating Officer of FMR LLC (1997-2000) and President of Fidelity Strategic Investments (2000-2002). In addition, he serves as a member of the Board of Directors of Geerlings & Wade, Inc. (wine distribution). |
* Trustees have been determined to be "Interested Trustees" by virtue of, among other things, their affiliation with the trust or various entities under common control with FMR. FMR Corp. merged with FMR LLC on October 1, 2007. Any references to FMR LLC for prior periods are deemed to be references to the prior entity.
Independent Trustees:
Correspondence intended for each Independent Trustee (that is, the Trustees other than the Interested Trustees) may be sent to Fidelity Investments, P.O. Box 55235, Boston, Massachusetts 02205-5235.
Name, Age; Principal Occupation |
Dennis J. Dirks (59) |
| Year of Election or Appointment: 2005 Prior to his retirement in May 2003, Mr. Dirks was Chief Operating Officer and a member of the Board of The Depository Trust & Clearing Corporation (DTCC) (1999-2003). He also served as President, Chief Operating Officer, and Board member of The Depository Trust Company (DTC) (1999-2003) and President and Board member of the National Securities Clearing Corporation (NSCC) (1999-2003). In addition, Mr. Dirks served as Chief Executive Officer and Board member of the Government Securities Clearing Corporation (2001-2003) and Chief Executive Officer and Board member of the Mortgage-Backed Securities Clearing Corporation (2001-2003). Mr. Dirks also serves as a Trustee and a member of the Finance Committee of Manhattan College (2005-present) and a Trustee and a member of the Finance Committee of AHRC of Nassau County (2006-present). |
Albert R. Gamper, Jr. (65) |
| Year of Election or Appointment: 2006 Prior to his retirement in December 2004, Mr. Gamper served as Chairman of the Board of CIT Group Inc. (commercial finance). During his tenure with CIT Group Inc. Mr. Gamper served in numerous senior management positions, including Chairman (1987-1989; 1999-2001; 2002-2004), Chief Executive Officer (1987-2004), and President (1989-2002). He currently serves as a member of the Board of Directors of Public Service Enterprise Group (utilities, 2001-present), Chairman of the Board of Governors, Rutgers University (2004-present), and Chairman of the Board of Saint Barnabas Health Care System. |
George H. Heilmeier (71) |
| Year of Election or Appointment: 2004 Dr. Heilmeier is Chairman Emeritus of Telcordia Technologies (communication software and systems), where prior to his retirement, he served as company Chairman and Chief Executive Officer. He currently serves on the Boards of Directors of The Mitre Corporation (systems engineering and information technology support for the government), and HRL Laboratories (private research and development, 2004-present). He is Chairman of the General Motors Science & Technology Advisory Board and a Life Fellow of the Institute of Electrical and Electronics Engineers (IEEE). Dr. Heilmeier is a member of the Defense Science Board and the National Security Agency Advisory Board. He is also a member of the National Academy of Engineering, the American Academy of Arts and Sciences, and the Board of Overseers of the School of Engineering and Applied Science of the University of Pennsylvania. Previously, Dr. Heilmeier served as a Director of TRW Inc. (automotive, space, defense, and information technology, 1992-2002), Compaq (1994-2002), Automatic Data Processing, Inc. (ADP) (technology-based business outsourcing, 1995-2002), INET Technologies Inc. (telecommunications network surveillance, 2001-2004), and Teletech Holdings (customer management services). He is the recipient of the 2005 Kyoto Prize in Advanced Technology for his invention of the liquid crystal display, and a member of the Consumer Electronics Hall of Fame. |
James H. Keyes (67) |
| Year of Election or Appointment: 2007 Prior to his retirement in 2003, Mr. Keyes was Chairman, President, and Chief Executive Officer of Johnson Controls, Inc. (automotive supplier, 1993-2003). He currently serves as a member of the boards of LSI Logic Corporation (semiconductor technologies), Navistar International Corporation (manufacture and sale of trucks, buses, and diesel engines, 2002-present), and Pitney Bowes, Inc. (integrated mail, messaging, and document management solutions). |
Marie L. Knowles (61) |
| Year of Election or Appointment: 2001 Prior to Ms. Knowles' retirement in June 2000, she served as Executive Vice President and Chief Financial Officer of Atlantic Richfield Company (ARCO) (diversified energy, 1996-2000). From 1993 to 1996, she was a Senior Vice President of ARCO and President of ARCO Transportation Company. She served as a Director of ARCO from 1996 to 1998. She currently serves as a Director of Phelps Dodge Corporation (copper mining and manufacturing) and McKesson Corporation (healthcare service, 2002-present). Ms. Knowles is a Trustee of the Brookings Institution and the Catalina Island Conservancy and also serves as a member of the Advisory Board for the School of Engineering of the University of Southern California. |
Ned C. Lautenbach (63) |
| Year of Election or Appointment: 2000 Mr. Lautenbach is Chairman of the Independent Trustees (2006-present). Mr. Lautenbach has been a partner of Clayton, Dubilier & Rice, Inc. (private equity investment firm) since September 1998. Previously, Mr. Lautenbach was with the International Business Machines Corporation (IBM) from 1968 until his retirement in 1998. Mr. Lautenbach serves as a Director of Sony Corporation (2006-present) and Eaton Corporation (diversified industrial) as well as the Philharmonic Center for the Arts in Naples, Florida. He also is a member of the Board of Trustees of Fairfield University (2005-present), as well as a member of the Council on Foreign Relations. |
Cornelia M. Small (63) |
| Year of Election or Appointment: 2005 Ms. Small is a member (2000-present) and Chairperson (2002-present) of the Investment Committee, and a member (2002-present) of the Board of Trustees of Smith College. Previously, she served as Chief Investment Officer (1999-2000), Director of Global Equity Investments (1996-1999), and a member of the Board of Directors of Scudder, Stevens & Clark (1990-1997) and Scudder Kemper Investments (1997-1999). In addition, Ms. Small served as Co-Chair (2000-2003) of the Annual Fund for the Fletcher School of Law and Diplomacy. |
William S. Stavropoulos (68) |
| Year of Election or Appointment: 2001 Mr. Stavropoulos is Chairman Emeritus of the Board of Directors of The Dow Chemical Company. Since joining The Dow Chemical Company in 1967, Mr. Stavropoulos served in numerous senior management positions, including President (1993-2000; 2002-2003), CEO (1995-2000; 2002-2004), and Chairman of the Executive Committee (2000-2004). Currently, he is a Director of NCR Corporation (data warehousing and technology solutions), Chemical Financial Corporation, Maersk Inc. (industrial conglomerate, 2002-present), Tyco International, Inc. (multinational manufacturing and services, 2007-present), and a member of the Advisory Board for Metalmark Capital (private equity investment firm, 2005-present). He is a special advisor to Clayton, Dubilier & Rice, Inc., a private equity investment firm. He also serves as a member of the Board of Trustees of the American Enterprise Institute for Public Policy Research. In addition, Mr. Stavropoulos is a member of The Business Council, J.P. Morgan International Council and the University of Notre Dame Advisory Council for the College of Science. |
Kenneth L. Wolfe (68) |
| Year of Election or Appointment: 2005 Prior to his retirement in 2001, Mr. Wolfe was Chairman and Chief Executive Officer of Hershey Foods Corporation (1993-2001). He currently serves as a member of the boards of Adelphia Communications Corporation (2003-present), Bausch & Lomb, Inc., and Revlon Inc. (2004-present). |
Advisory Board Members and Executive Officers**:
Correspondence intended for Mr. Mauriello, Mr. Thomas, and Mr. Wiley may be sent to Fidelity Investments, P.O. Box 55235, Boston, Massachusetts 02205-5235. Correspondence intended for each executive officer and Mr. Lynch may be sent to Fidelity Investments, 82 Devonshire Street, Boston, Massachusetts 02109.
Name, Age; Principal Occupation |
Peter S. Lynch (63) |
| Year of Election or Appointment: 2003 Member of the Advisory Board of Fidelity Advisor Series VIII. Mr. Lynch is Vice Chairman and a Director of FMR, and Vice Chairman (2001-present) and a Director of FMR Co., Inc. Previously, Mr. Lynch served as a Trustee of the Fidelity funds (1990-2003). In addition, he serves as a Trustee of Boston College and as the Chairman of the Inner-City Scholarship Fund. |
Joseph Mauriello (63) |
| Year of Election or Appointment: 2007 Member of the Advisory Board of Fidelity Advisor Series VIII. Prior to his retirement in January 2006, Mr. Mauriello served in numerous senior management positions including Deputy Chairman and Chief Operating Officer (2004-2005), and Vice Chairman of Financial Services (2002-2004) of KPMG LLP US (professional services firm, 1965-2005). Mr. Mauriello currently serves as a member of the Board of Directors of XL Capital Ltd., (global insurance and re-insurance company, 2006-present) and of Arcadia Resources Inc., (health care services and products, 2007-present). He also served as a Director of the Hamilton Funds of the Bank of New York (2006-2007). |
David M. Thomas (58) |
| Year of Election or Appointment: 2007 Member of the Advisory Board of Fidelity Advisor Series VIII. Previously, Mr. Thomas served as Executive Chairman (2005-2006) and Chairman and Chief Executive Officer (2000-2005) of IMS Health, Inc. (pharmaceutical and healthcare information solutions). In addition, Mr. Thomas serves as a member of the Board of Directors of Fortune Brands, Inc. (consumer products holding company), and Interpublic Group of Companies, Inc. (marketing communication, 2004-present). |
Michael E. Wiley (57) |
| Year of Election or Appointment: 2007 Member of the Advisory Board of Fidelity Advisor Series VIII. Mr. Wiley also serves as Sr. Energy Advisor of Katzenbach Partners, LLC (consulting firm, 2006-present) and a member of the Board of Trustees of the University of Tulsa (2000-2006; 2007-present). He serves as a Director of Tesoro Corporation (independent oil refiner and marketer, 2005-present), and a Director of Bill Barrett Corporation (exploration and production company, 2005-present). In addition, he also serves as a Director of Post Oak Bank (privately-held bank, 2004-present), and an Advisory Director of Riverstone Holdings (private investment firm). Previously, Mr. Wiley served as Chairman, President, and CEO of Baker Hughes, Inc. (oilfield services company, 2000-2004), and as Director of Spinnaker Exploration Company (exploration and production company, 2001-2005). |
Kimberley H. Monasterio (43) |
| Year of Election or Appointment: 2007 President and Treasurer of Advisor Emerging Markets. Ms. Monasterio also serves as President and Treasurer of other Fidelity funds (2007-present) and is an employee of FMR (2004-present). Previously, Ms. Monasterio served as Deputy Treasurer of the Fidelity funds (2004-2006). Before joining Fidelity Investments, Ms. Monasterio served as Treasurer (2000-2004) and Chief Financial Officer (2002-2004) of the Franklin Templeton Funds and Senior Vice President of Franklin Templeton Services, LLC (2000-2004). |
Walter C. Donovan (45) |
| Year of Election or Appointment: 2007 Vice President of Advisor Emerging Markets. Mr. Donovan also serves as Vice President of Fidelity's Equity Funds (2007-present). Mr. Donovan also serves as Executive Vice President of FMR (2005-present) and FMR Co., Inc. (2005-present). Previously, Mr. Donovan served as Vice President of Fidelity's High Income Funds (2005-2007), Fixed-Income Funds (2005-2006), certain Asset Allocation Funds (2005-2006), certain Balanced Funds (2005-2006), and as Vice President and Director of Fidelity's International Equity Trading group (1998-2005). |
Eric M. Wetlaufer (45) |
| Year of Election or Appointment: 2006 Vice President of Advisor Emerging Markets. Mr. Wetlaufer also serves as Vice President of certain International Equity Funds (2006-present). Mr. Wetlaufer is Senior Vice President of FMR (2006-present) and FMR Co., Inc. (2006-present), and President and Director of Fidelity Management & Research (U.K.) Inc. (2006-present) and Fidelity Research & Analysis Company (2006-present). Before joining Fidelity Investments in 2005, Mr. Wetlaufer was a partner in Oxhead Capital Management (2004-2005). Previously, Mr. Wetlaufer served as a Chief Investment Officer of Putnam Investments (1997-2003). |
Eric D. Roiter (58) |
| Year of Election or Appointment: 1998 Secretary of Advisor Emerging Markets. He also serves as Secretary of other Fidelity funds; Vice President, General Counsel, and Secretary of FMR Co., Inc. (2001-present) and FMR; Assistant Secretary of Fidelity Management & Research (U.K.) Inc. (2001-present), Fidelity Research & Analysis Company (2001-present), and Fidelity Investments Money Management, Inc. (2001-present). Mr. Roiter is an Adjunct Member, Faculty of Law, at Boston College Law School (2003-present). Previously, Mr. Roiter served as Vice President and Secretary of Fidelity Distributors Corporation (FDC) (1998-2005). |
Scott C. Goebel (39) |
| Year of Election or Appointment: 2007 Assistant Secretary of Advisor Emerging Markets. Mr. Goebel also serves as Assistant Secretary of other Fidelity funds (2007-present), and is an employee of FMR. |
R. Stephen Ganis (41) |
| Year of Election or Appointment: 2006 Anti-Money Laundering (AML) officer of Advisor Emerging Markets. Mr. Ganis also serves as AML officer of other Fidelity funds (2006-present) and FMR LLC (2003-present). Before joining Fidelity Investments, Mr. Ganis practiced law at Goodwin Procter, LLP (2000-2002). |
Joseph B. Hollis (59) |
| Year of Election or Appointment: 2006 Chief Financial Officer of Advisor Emerging Markets. Mr. Hollis also serves as Chief Financial Officer of other Fidelity funds. Mr. Hollis is President of Fidelity Pricing and Cash Management Services (FPCMS) (2005-present). Mr. Hollis also serves as President and Director of Fidelity Service Company, Inc. (2006-present). Previously, Mr. Hollis served as Senior Vice President of Cash Management Services (1999-2002) and Investment Management Operations (2002-2005). |
Kenneth A. Rathgeber (60) |
| Year of Election or Appointment: 2004 Chief Compliance Officer of Advisor Emerging Markets. Mr. Rathgeber also serves as Chief Compliance Officer of other Fidelity funds (2004-present) and Executive Vice President of Risk Oversight for Fidelity Investments (2002-present). He is Chief Compliance Officer of FMR (2005-present), FMR Co., Inc. (2005-present), Fidelity Management & Research (U.K.) Inc. (2005-present), Fidelity Research & Analysis Company (2005-present), Fidelity Investments Money Management, Inc. (2005-present), and Strategic Advisers, Inc. (2005-present). Previously, Mr. Rathgeber served as Executive Vice President and Chief Operating Officer for Fidelity Investments Institutional Services Company, Inc. (1998-2002). |
Bryan A. Mehrmann (46) |
| Year of Election or Appointment: 2005 Deputy Treasurer of Advisor Emerging Markets. Mr. Mehrmann also serves as Deputy Treasurer of other Fidelity funds (2005-present) and is an employee of FMR. Previously, Mr. Mehrmann served as Vice President of Fidelity Investments Institutional Services Group (FIIS)/Fidelity Investments Institutional Operations Corporation, Inc. (FIIOC) Client Services (1998-2004). |
Kenneth B. Robins (38) |
| Year of Election or Appointment: 2005 Deputy Treasurer of Advisor Emerging Markets. Mr. Robins also serves as Deputy Treasurer of other Fidelity funds (2005-present) and is an employee of FMR (2004-present). Before joining Fidelity Investments, Mr. Robins worked at KPMG LLP, where he was a partner in KPMG's department of professional practice (2002-2004) and a Senior Manager (1999-2000). In addition, Mr. Robins served as Assistant Chief Accountant, United States Securities and Exchange Commission (2000-2002). |
Robert G. Byrnes (40) |
| Year of Election or Appointment: 2005 Assistant Treasurer of Advisor Emerging Markets. Mr. Byrnes also serves as Assistant Treasurer of other Fidelity funds (2005-present) and is an employee of FMR (2005-present). Previously, Mr. Byrnes served as Vice President of FPCMS (2003-2005). Before joining Fidelity Investments, Mr. Byrnes worked at Deutsche Asset Management where he served as Vice President of the Investment Operations Group (2000-2003). |
Peter L. Lydecker (53) |
| Year of Election or Appointment: 2004 Assistant Treasurer of Advisor Emerging Markets. Mr. Lydecker also serves as Assistant Treasurer of other Fidelity funds (2004) and is an employee of FMR. |
Paul M. Murphy (60) |
| Year of Election or Appointment: 2007 Assistant Treasurer of Advisor Emerging Markets. Mr. Murphy also serves as Assistant Treasurer of other Fidelity funds (2007-present) and is an employee of FMR (2007-present). Previously, Mr. Murphy served as Chief Financial Officer of the Fidelity Funds (2005-2006), Vice President and Associate General Counsel of FMR (2007), and Senior Vice President of Fidelity Pricing and Cash Management Services Group (FPCMS) (1994-2007). |
Gary W. Ryan (49) |
| Year of Election or Appointment: 2005 Assistant Treasurer of Advisor Emerging Markets. Mr. Ryan also serves as Assistant Treasurer of other Fidelity funds (2005-present) and is an employee of FMR (2005-present). Previously, Mr. Ryan served as Vice President of Fund Reporting in FPCMS (1999-2005). |
** FMR Corp. merged with FMR LLC on October 1, 2007. Any references to FMR LLC for prior periods are deemed to be references to the prior entity.
Annual Report
Distributions
The Board of Trustees of Advisors Emerging Markets voted to pay to shareholders of record at the opening of business on record date, the following distributions per share derived from capital gains realized from sales of portfolio securities, and dividends derived from net investment income:
| Pay Date | Record Date | Dividends | Capital Gains |
Class A | 12/10/07 | 12/07/07 | $.02 | $.785 |
Class T | 12/10/07 | 12/07/07 | $.00 | $.743 |
Class B | 12/10/07 | 12/07/07 | $.00 | $.700 |
Class C | 12/10/07 | 2/07/07 | $.00 | $.700 |
Class A designates 100% of the dividends distributed during the fiscal year as amounts which may be taken into account as a dividend for purposes of the maximum rate under section 1(h)(11) of the Internal Revenue Code.
The amounts per share which represent income derived from sources within, and taxes paid to, foreign countries or possessions of the United States are as follows:
| Pay Date | Income | Taxes |
Class A | 12/11/06 | $.084 | $.056 |
Shareholder Notification:
The fund will notify shareholders in January 2008 of amounts for use in preparing 2007 income tax returns.
Annual Report
Board Approval of Investment Advisory Contracts and Management Fees
Advisor Emerging Markets Fund
Each year, typically in July, the Board of Trustees, including the Independent Trustees (together, the Board), votes on the renewal of the management contract and sub-advisory agreements (together, the Advisory Contracts) for the fund. The Board, assisted by the advice of fund counsel and Independent Trustees' counsel, requests and considers a broad range of information throughout the year.
The Board meets regularly each month except August and takes into account throughout the year matters bearing on Advisory Contracts. The Board, acting directly and through its separate committees, considers at each of its meetings factors that are relevant to the annual renewal of the fund's Advisory Contracts, including the services and support provided to the fund and its shareholders. At the time of the renewal, the Board had 12 standing committees, each composed of Independent Trustees with varying backgrounds, to which the Board has assigned specific subject matter responsibilities in order to enhance effective decision-making by the Board. Each committee has adopted a written charter outlining the structure and purposes of the committee. One such committee, the Equity Contract Committee, meets periodically as needed throughout the year to consider matters specifically related to the annual renewal of Advisory Contracts. The committee requests and receives information on, and makes recommendations to the Independent Trustees concerning, the approval and annual review of the Advisory Contracts.
At its July 2007 meeting, the Board of Trustees, including the Independent Trustees, unanimously determined to renew the Advisory Contracts for the fund. In reaching its determination, the Board considered all factors it believed relevant, including (i) the nature, extent, and quality of the services to be provided to the fund and its shareholders (including the investment performance of the fund); (ii) the competitiveness of the management fee and total expenses of the fund; (iii) the total costs of the services to be provided by and the profits to be realized by the investment adviser and its affiliates from the relationship with the fund; (iv) the extent to which economies of scale would be realized as the fund grows; and (v) whether fee levels reflect these economies of scale, if any, for the benefit of fund shareholders. The Board also approved amendments to the fund's agreements with foreign sub-advisers to clarify that each sub-adviser provides services as an independent contractor.
In determining whether to renew the Advisory Contracts for the fund, the Board ultimately reached a determination, with the assistance of fund counsel and Independent Trustees' counsel, that the renewal of the Advisory Contracts and the compensation to be received by Fidelity under the management contract is consistent with Fidelity's fiduciary duty under applicable law. In addition to evaluating the specific factors noted above, the Board, in reaching its determination, is aware that shareholders in the fund have a broad range of investment choices available to them, including a wide choice among mutual funds offered by competitors to Fidelity, and that the fund's shareholders, with the opportunity to review and weigh the disclosure provided by the fund in its prospectus and other public disclosures, have chosen to invest in this fund, managed by Fidelity.
Annual Report
Nature, Extent, and Quality of Services Provided. The Board considered staffing within the investment adviser, FMR, and the sub-advisers (together, the Investment Advisers), including the background of the fund's portfolio manager and the fund's investment objective and discipline. The Independent Trustees also had discussions with senior management of Fidelity's investment operations and investment groups. The Board considered the structure of the portfolio manager compensation program and whether this structure provides appropriate incentives.
Resources Dedicated to Investment Management and Support Services. The Board reviewed the size, education, and experience of the Investment Advisers' investment staff, their use of technology, and the Investment Advisers' approach to recruiting, training, and retaining portfolio managers and other research, advisory, and management personnel. The Board considered Fidelity's extensive global research capabilities that enable the Investment Advisers to aggregate data from various sources in an effort to produce positive investment results. The Board noted that Fidelity's analysts have access to a variety of technological tools that enable them to perform both fundamental and quantitative analysis and to specialize in various disciplines. The Board also considered that Fidelity's portfolio managers and analysts have access to daily portfolio attribution that allows for monitoring of a fund's portfolio, as well as an electronic communication system that provides immediate real-time access to research concerning issuers and credit enhancers.
Shareholder and Administrative Services. The Board considered (i) the nature, extent, quality, and cost of advisory, administrative, distribution, and shareholder services performed by the Investment Advisers and their affiliates under the Advisory Contracts and under separate agreements covering transfer agency, pricing and bookkeeping, and securities lending services for the fund; (ii) the nature and extent of the Investment Advisers' supervision of third party service providers, principally custodians and subcustodians; and (iii) the resources devoted to, and the record of compliance with, the fund's compliance policies and procedures. The Board reviewed the allocation of fund brokerage, including allocations to brokers affiliated with the Investment Advisers, the use of brokerage commissions to pay fund expenses, and the use of "soft" commission dollars to pay for research services. The Board also considered that Fidelity voluntarily pays for market data out of its own resources. The Board also considered the agreement reached between the Independent Trustees and Fidelity in December 2006 following an independent review of matters relating to receipt of travel, entertainment, gifts and gratuities in violation of Fidelity policies.
Annual Report
Board Approval of Investment Advisory Contracts and
Management Fees - continued
The Board noted that the growth of fund assets across the complex allows Fidelity to reinvest in the development of services designed to enhance the value or convenience of the Fidelity funds as investment vehicles. These services include 24-hour access to account information and market information through phone representatives and over the Internet, and investor education materials and asset allocation tools.
Investment in a Large Fund Family. The Board considered the benefits to shareholders of investing in a Fidelity fund, including the benefits of investing in a fund that is part of a large family of funds offering a variety of investment disciplines and providing for a large variety of mutual fund investor services. For example, fund shareholders are offered the privilege of exchanging shares of the fund for shares of other Fidelity funds, as set forth in the fund's prospectus, without paying a sales charge. The Board noted that, since the last Advisory Contract renewals in July 2006, Fidelity has taken a number of actions that benefited particular funds, including (i) dedicating additional resources to investment research and to restructure the investment research teams; (ii) contractually agreeing to reduce the management fee on Fidelity Advisor Floating Rate High Income Fund; (iii) contractually agreeing to reduce the management fees on Fidelity's California, Massachusetts, New Jersey, and New York AMT Tax-Free Money Market Funds, launching new Institutional Classes and Service Classes of these funds, and contractually agreeing to impose expense limitations on these funds; (iv) eliminating the exchange fee on the Fidelity Select Portfolios and reducing the pricing and bookkeeping fee rates for these funds; (v) reducing the maximum transfer agency fee rates on high income funds and certain equity funds; (vi) proposing amended management contracts that, if approved by shareholders, will add a performance adjustment component to the management fees paid by 18 Fidelity Advisor equity funds; (vii) contractually agreeing to reduce fees for Ultra-Short Central Fund and the money market Central Funds; (viii) waiving the Fidelity Advisor funds' contingent deferred sales charge on certain redemptions made through systematic withdrawal programs; and (ix) amending the management contracts for equity and fixed-income funds whose management contracts incorporate a "group fee" structure by adding four new fee "breakpoints" to the group fee rate schedules.
Investment Performance and Compliance. The Board considered whether the fund has operated within its investment objective, as well as its record of compliance with its investment restrictions. It also reviewed the fund's absolute investment performance for each class, as well as the fund's relative investment performance for each class measured against (i) a broad-based securities market index, and (ii) a peer group of mutual funds deemed appropriate by the Board. Because the fund had been in existence less than three calendar years, the following chart considered by the Board shows, for the one-year period ended December 31, 2006, the total returns of Institutional Class (Class I) and Class C of the fund, the total return of a broad-based securities market index ("benchmark"), and a range of total returns of a peer group of mutual funds identified by Morningstar, Inc. as having an investment style similar to that of the fund based on underlying portfolio holdings. The returns of Institutional Class (Class I) and Class C show the performance of the highest and lowest performing classes, respectively. The box within the chart shows the 25th percentile return (bottom of box) and the 75th percentile return (top of box) of the peer group. Returns shown above the box are in the first quartile and returns shown below the box are in the fourth quartile. The percentage beaten numbers noted below the chart correspond to the percentile box and represent the percentage of funds in the peer group whose performance was equal to or lower than that of the class indicated.
Annual Report
Advisor Emerging Markets Fund
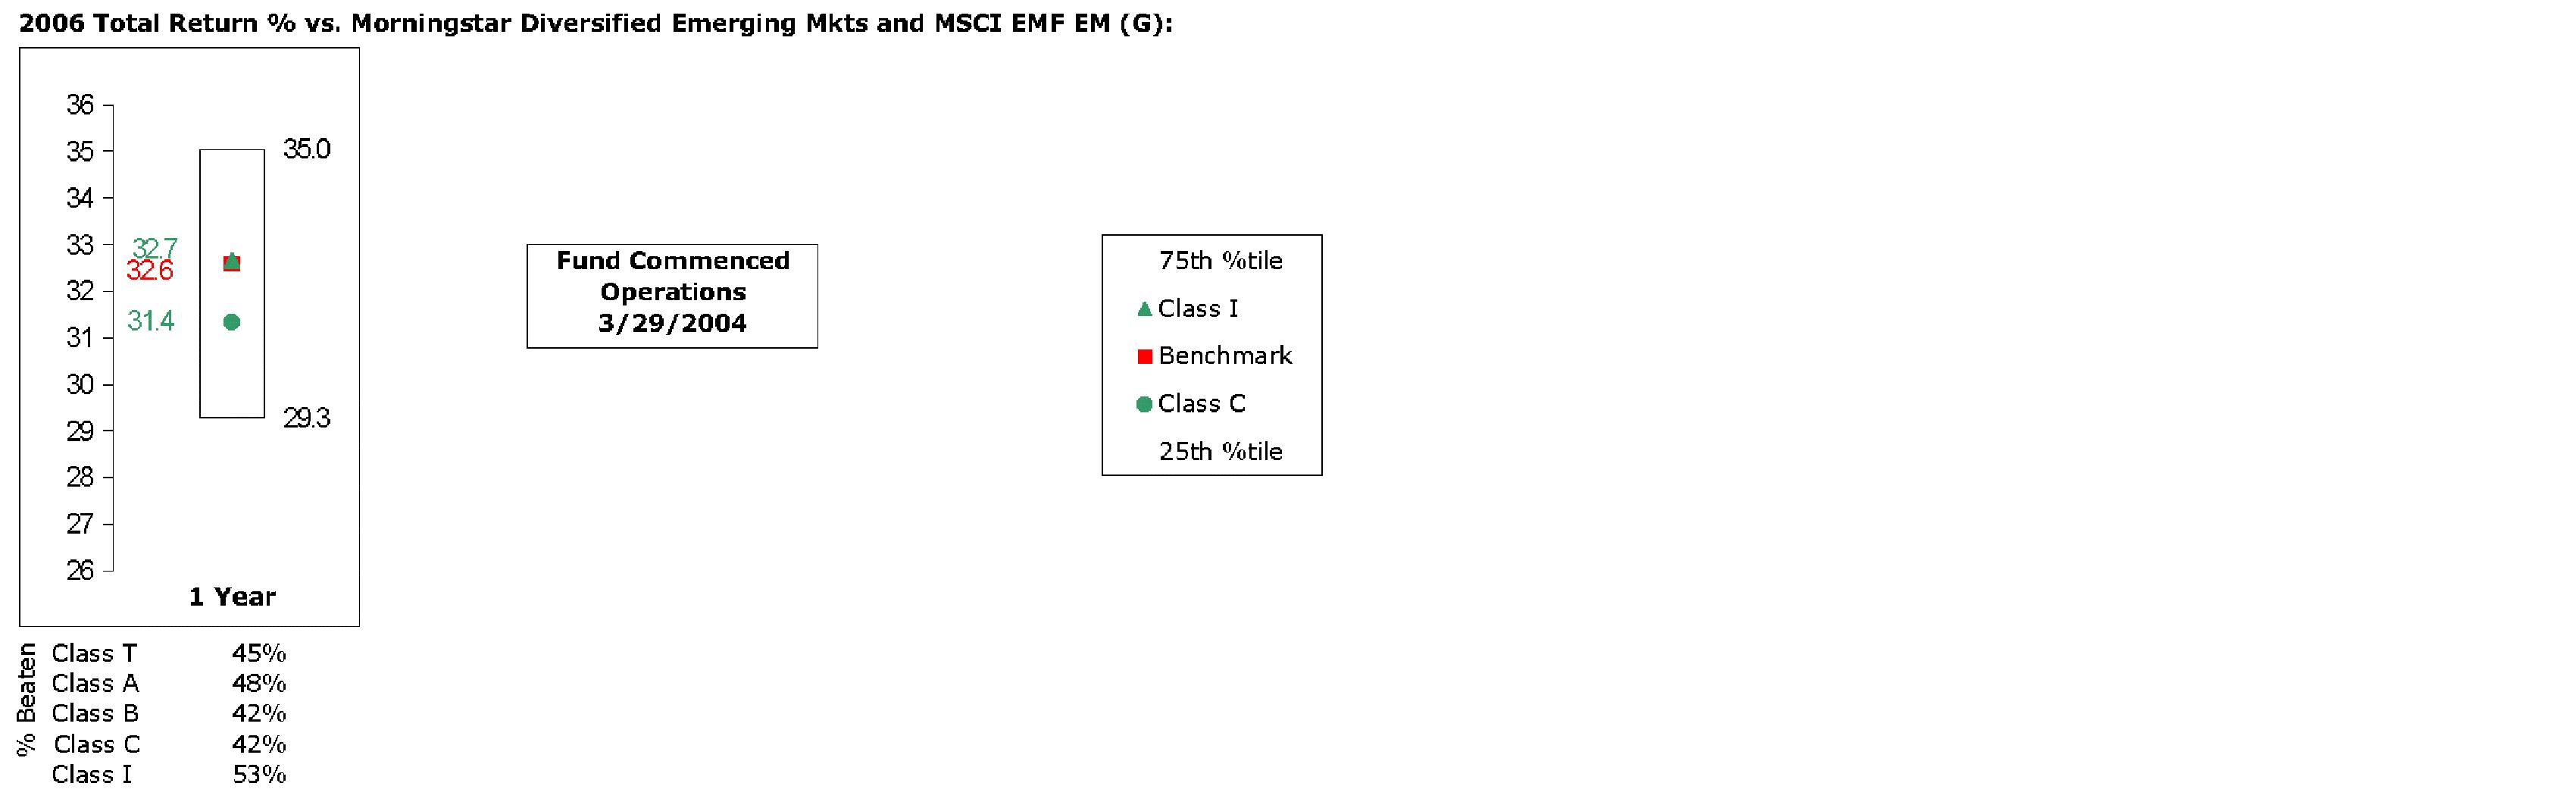
The Board reviewed the fund's relative investment performance against its peer group and stated that the performance of Institutional Class (Class I) of the fund was in the second quartile for the period shown. The Board also stated that the investment performance of Institutional Class (Class I) of the fund compared favorably to its benchmark for the period shown. The Board considered that the variations in performance among the fund's classes reflect the variations in class expenses, which result in lower performance for higher expense classes. The Board stated that it is difficult to evaluate in any comprehensive fashion the performance of the fund, in light of its relatively recent commencement of operations.
The Board considered that FMR has taken steps to refocus and strengthen equity research, equity portfolio management, and compliance.
Based on its review, and giving particular weight to the nature and quality of the resources dedicated by the Investment Advisers to maintain and improve relative performance, the Board concluded that the nature, extent, and quality of the services provided to the fund will benefit the fund's shareholders, particularly in light of the Board's view that the fund's shareholders benefit from investing in a fund that is part of a large family of funds offering a variety of investment disciplines and services.
Annual Report
Board Approval of Investment Advisory Contracts and
Management Fees - continued
Competitiveness of Management Fee and Total Fund Expenses. The Board considered the fund's management fee and total expenses compared to "mapped groups" of competitive funds and classes. Fidelity creates "mapped groups" by combining similar Lipper investment objective categories that have comparable management fee characteristics. Combining Lipper investment objective categories aids the Board's management fee and total expense comparisons by broadening the competitive group used for comparison and by reducing the number of universes to which various Fidelity funds are compared. The Board also considered supplemental information about how the fund's management fee and total expenses ranked relative to groups based on Lipper classifications, which take into account a fund's market capitalization and style.
The Board considered two proprietary management fee comparisons for the 12-month (or shorter) periods shown in the chart below. The group of Lipper funds used by the Board for management fee comparisons is referred to below as the "Total Mapped Group." The Total Mapped Group comparison focuses on a fund's standing relative to the total universe of comparable funds available to investors, in terms of gross management fees before expense reimbursements or caps. "TMG %" represents the percentage of funds in the Total Mapped Group that had management fees that were lower than the fund's. For example, a TMG % of 15% means that 85% of the funds in the Total Mapped Group had higher management fees than the fund. The "Asset-Size Peer Group" (ASPG) comparison focuses on a fund's standing relative to non-Fidelity funds similar in size to the fund within the Total Mapped Group. The ASPG represents at least 15% of the funds in the Total Mapped Group with comparable asset size and management fee characteristics, subject to a minimum of 50 funds (or all funds in the Total Mapped Group if fewer than 50). Additional information, such as the ASPG quartile in which the fund's management fee ranked, is also included in the chart and considered by the Board.
Annual Report
Advisor Emerging Markets Fund
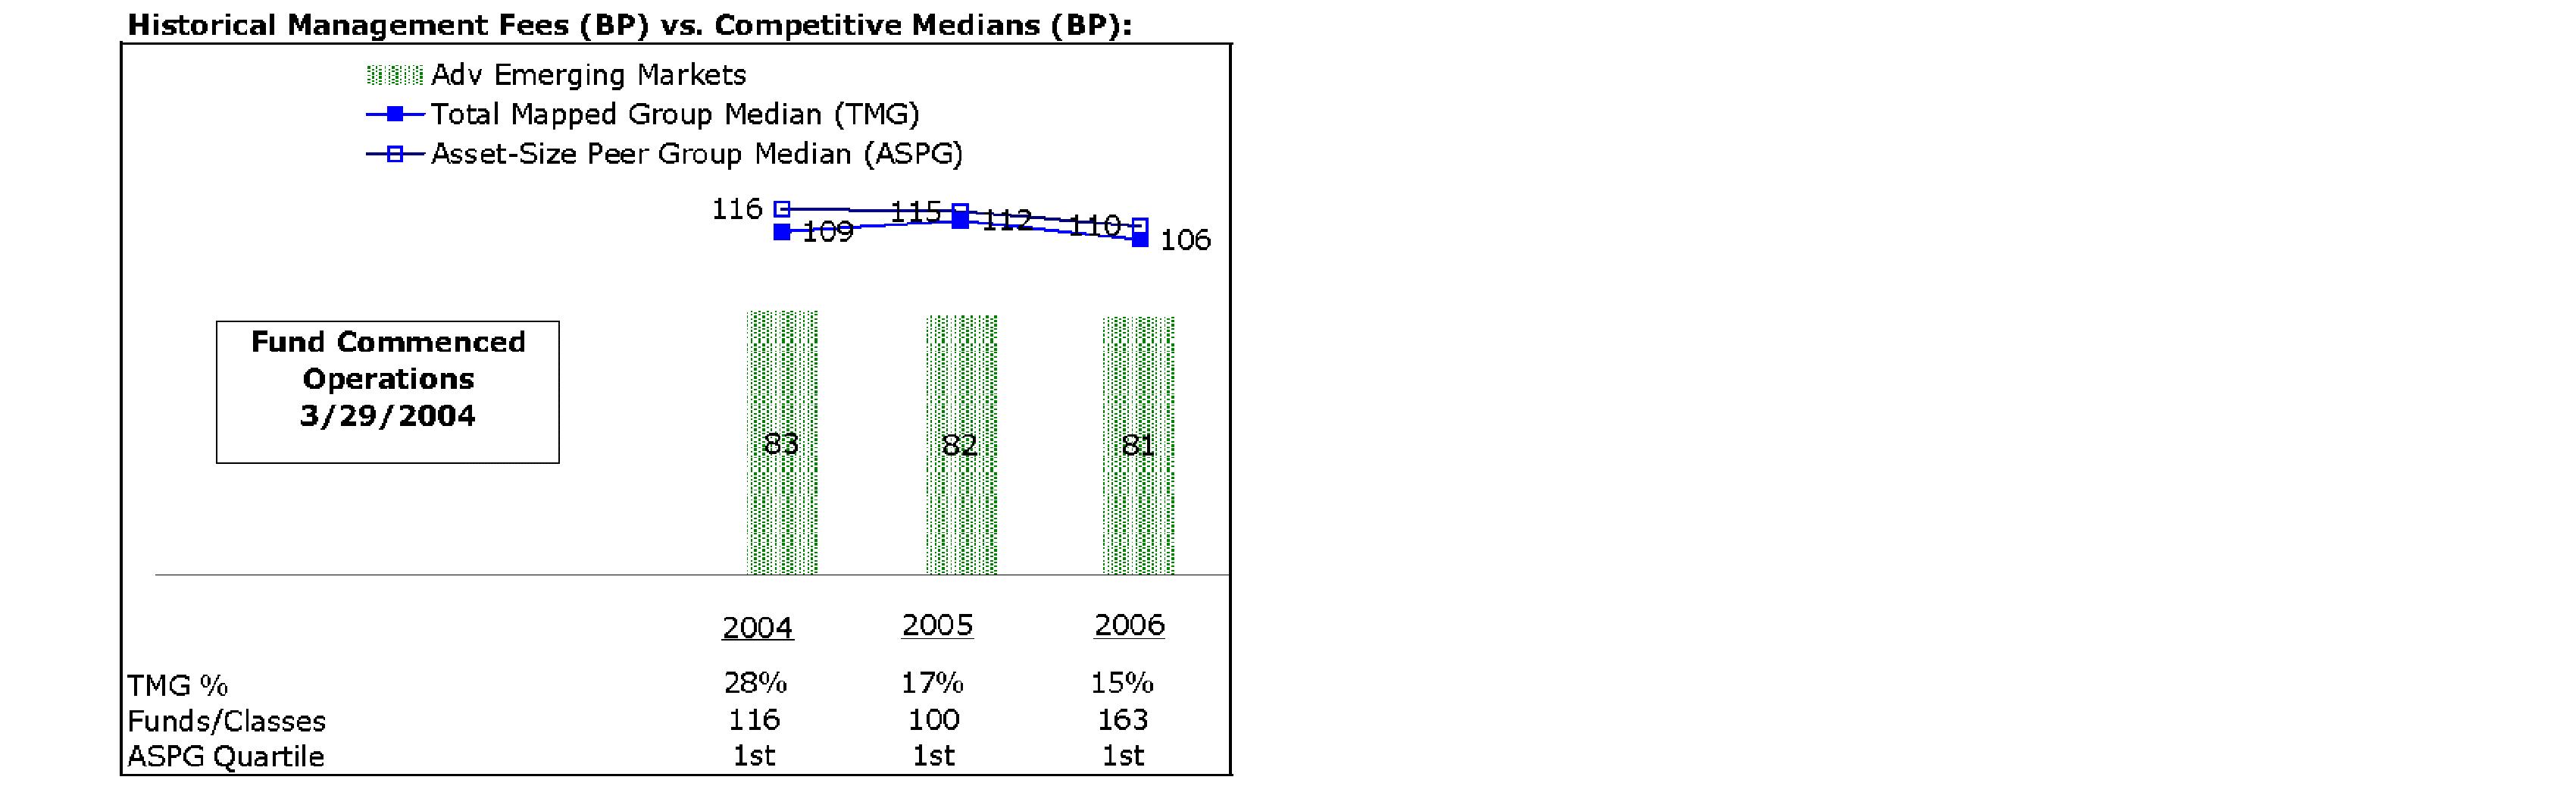
The Board noted that the fund's management fee ranked below the median of its Total Mapped Group and below the median of its ASPG for 2006.
Based on its review, the Board concluded that the fund's management fee was fair and reasonable in light of the services that the fund receives and the other factors considered.
In its review of each class's total expenses, the Board considered the fund's management fee as well as other fund or class expenses, as applicable, such as transfer agent fees, pricing and bookkeeping fees, fund-paid 12b-1 fees, and custodial, legal, and audit fees. The Board also noted the effects of any waivers and reimbursements on fees and expenses. As part of its review, the Board also considered current and historical total expenses of each class of the fund compared to competitive fund median expenses. Each class of the fund is compared to those funds and classes in the Total Mapped Group (used by the Board for management fee comparisons) that have a similar sales load structure.
The Board noted that the total expenses of each of Class A, Class B, Class C and Institutional Class ranked below its competitive median for 2006, and the total expenses of Class T ranked above its competitive median for 2006. The Board noted that the fund offers multiple classes, each of which has a different sales load and 12b-1 fee structure, and that the multiple structures are intended to offer a range of pricing options for the intermediary market. The Board also noted that the total expenses of the classes vary primarily by the level of their 12b-1 fees, although differences in transfer agent fees may also cause expenses to vary from class to class.
Annual Report
Board Approval of Investment Advisory Contracts and
Management Fees - continued
In its review of total expenses, the Board also considered Fidelity fee structures and other information on clients that FMR and its affiliates service in other competitive markets, such as other mutual funds advised or subadvised by FMR or its affiliates, pension plan clients, and other institutional clients.
Based on its review, the Board concluded that the total expenses of each class of the fund were reasonable, although in one case above the median of the universe presented for comparison, in light of the services that the fund and its shareholders receive and the other factors considered.
Costs of the Services and Profitability. The Board considered the revenues earned and the expenses incurred by Fidelity in conducting the business of developing, marketing, distributing, managing, administering and servicing the fund and its shareholders. The Board also considered the level of Fidelity's profits in respect of all the Fidelity funds.
On an annual basis, FMR presents to the Board Fidelity's profitability for the fund. Fidelity calculates the profitability for each fund, as well as aggregate profitability for groups of Fidelity funds and all Fidelity funds, using a series of detailed revenue and cost allocation methodologies which originate with the audited books and records of Fidelity. The Audit Committee of the Board reviews any significant changes from the prior year's methodologies.
PricewaterhouseCoopers LLP (PwC), independent registered public accounting firm and auditor to Fidelity and certain Fidelity funds, has been engaged annually by the Board as part of the Board's assessment of the results of Fidelity's profitability analysis. PwC's engagement includes the review and assessment of Fidelity's methodologies used in determining the revenues and expenses attributable to Fidelity's mutual fund business, and completion of agreed-upon procedures surrounding the mathematical accuracy of fund profitability and its conformity to allocation methodologies. After considering PwC's reports issued under the engagement and information provided by Fidelity, the Board believes that while other allocation methods may also be reasonable, Fidelity's profitability methodologies are reasonable in all material respects.
The Board has also reviewed Fidelity's non-fund businesses and any fall-out benefits related to the mutual fund business as well as cases where Fidelity's affiliates may benefit from or be related to the fund's business.
The Board considered the costs of the services provided by and the profits realized by Fidelity in connection with the operation of the fund and determined that the amount of profit is a fair entrepreneurial profit for the management of the fund.
Economies of Scale. The Board considered whether there have been economies of scale in respect of the management of the Fidelity funds, whether the Fidelity funds (including the fund) have appropriately benefited from any such economies of scale, and whether there is potential for realization of any further economies of scale. The Board considered the extent to which the fund will benefit from economies of scale through increased services to the fund, through waivers or reimbursements, or through fee or expense reductions, including reductions that occur through operation of the transfer agent agreement. The transfer agent fee varies in part based on the number of accounts in the fund. If the number of accounts decreases or the average account size increases, the overall transfer agent fee rate decreases.
Annual Report
The Board recognized that the fund's management contract incorporates a "group fee" structure, which provides for lower group fee rates as total fund assets under FMR's management increase, and for higher group fee rates as total fund assets under FMR's management decrease. FMR determines the group fee rates based on a tiered asset "breakpoint" schedule. In connection with the renewal of the fund's management contract, the Board approved amendments to the fund's management contract that added four new fee breakpoints to the group fee rate schedule for assets under FMR's management above $1,386 billion. The Board considered that the group fee rate declines under both the present and amended schedules, but that under the amended schedule, the group fee rate declines faster as assets under FMR's management exceed $1,386 billion. The Board considered that the group fee is designed to deliver the benefits of economies of scale to fund shareholders when total fund assets increase, even if assets of any particular fund are unchanged or have declined, because some portion of Fidelity's costs are attributable to services provided to all Fidelity funds, and all funds benefit if those costs can be allocated among more assets. The Board concluded that, given the group fee structure, fund shareholders will achieve a certain level of economies of scale as assets under FMR's management increase at the fund complex level, regardless of whether Fidelity achieves any such economies of scale.
The Board further concluded that any potential economies of scale are being shared between fund shareholders and Fidelity in an appropriate manner.
Additional Information Requested by the Board. In order to develop fully the factual basis for consideration of the Fidelity funds' Advisory Contracts, the Board requested and received additional information on several topics, including (i) fund performance trends and actions to be taken by FMR to improve certain funds' overall performance; (ii) Fidelity's portfolio manager compensation structure, including its effects on fund profitability and the extent to which portfolio manager compensation is linked to fund performance; (iii) Fidelity's fee structures; (iv) the funds' sub-advisory arrangements; and (v) accounts managed by Fidelity other than the Fidelity funds.
Based on its evaluation of all of the conclusions noted above, and after considering all material factors, the Board ultimately concluded that the advisory fee structures are fair and reasonable, and that the fund's Advisory Contracts should be renewed.
Annual Report
Annual Report
Annual Report
Annual Report
Annual Report
Annual Report
Annual Report
Annual Report
Investment Adviser
Fidelity Management & Research Company
Boston, MA
Investment Sub-Advisers
FMR Co., Inc.
Fidelity Management & Research
(U.K.) Inc.
Fidelity Research & Analysis Company
Fidelity International
Investment Advisors
Fidelity Investments Japan Limited
Fidelity International Investment Advisors (U.K.) Limited
General Distributor
Fidelity Distributors Corporation
Boston, MA
Transfer and Service Agents
Fidelity Investments Institutional Operations Company, Inc.
Boston, MA
Fidelity Service Company, Inc.
Boston, MA
Custodian
JPMorgan Chase Bank
New York, NY
FAEM-UANN-1207
1.809005.103
(Fidelity Investment logo)(registered trademark)
(Fidelity Investment logo)(registered trademark)
Fidelity® Advisor
Emerging Markets
Fund - Institutional Class
Annual Report
October 31, 2007
(2_fidelity_logos) (Registered_Trademark)
Contents
Chairman's Message | <Click Here> | Ned Johnson's message to shareholders. |
Performance | <Click Here> | How the fund has done over time. |
Management's Discussion | <Click Here> | The manager's review of fund performance, strategy and outlook. |
Shareholder Expense Example | <Click Here> | An example of shareholder expenses. |
Investment Changes | <Click Here> | A summary of major shifts in the fund's investments over the past six months. |
Investments | <Click Here> | A complete list of the fund's investments with their market values. |
Financial Statements | <Click Here> | Statements of assets and liabilities, operations, and changes in net assets,
as well as financial highlights. |
Notes | <Click Here> | Notes to the financial statements. |
Report of Independent Registered Public Accounting Firm | <Click Here> | |
Trustees and Officers | <Click Here> | |
Distributions | <Click Here> | |
Board Approval of Investment Advisory Contracts and Management Fees | <Click Here> | |
To view a fund's proxy voting guidelines and proxy voting record for the 12-month period ended June 30, visit http://www.fidelity.com (search for "proxy voting guidelines") or visit the Securities and Exchange Commission's (SEC) web site at http://www.sec.gov. You may also call 1-877-208-0098 to request a free copy of the proxy voting guidelines.
Standard & Poor's, S&P and S&P 500 are registered service marks of The McGraw-Hill Companies, Inc. and have been licensed for use by Fidelity Distributors Corporation.
Other third party marks appearing herein are the property of their respective owners.
All other marks appearing herein are registered or unregistered trademarks or service marks of FMR LLC or an affiliated company.
Annual Report
This report and the financial statements contained herein are submitted for the general information of the shareholders of the fund. This report is not authorized for distribution to prospective investors in the fund unless preceded or accompanied by an effective prospectus.
A fund files its complete schedule of portfolio holdings with the SEC for the first and third quarters of each fiscal year on Form N-Q. Forms N-Q are available on the SEC's web site at http://www.sec.gov. A fund's Forms N-Q may be reviewed and copied at the SEC's Public Reference Room in Washington, DC. Information regarding the operation of the SEC's Public Reference Room may be obtained by calling 1-800-SEC-0330. For a complete list of a fund's portfolio holdings, view the most recent holdings listing, semiannual report, or annual report on Fidelity's web site at http://www.fidelity.com or http://www.advisor.fidelity.com, as applicable.
NOT FDIC INSURED · MAY LOSE VALUE · NO BANK GUARANTEE
Neither the fund nor Fidelity Distributors Corporation is a bank.
Annual Report
Chairman's Message
(photo_of_Edward_C_Johnson_3d)
Dear Shareholder:
Many stock and bond markets around the world have been unsettled of late; however, volatility can often lead to opportunity for patient investors. Financial markets are always unpredictable, but there are a number of time-tested principles that can put the historical odds in your favor.
One of the basic tenets is to invest for the long term. Over time, riding out the markets' inevitable ups and downs has proven much more effective than selling into panic or chasing the hottest trend. Even missing only a few of the markets' best days can significantly diminish investor returns. Patience also affords the benefits of compounding - of earning interest on additional income or reinvested dividends and capital gains. There are tax advantages and cost benefits to consider as well. The more you sell, the more taxes you pay, and the more you trade, the higher the costs. While staying the course doesn't eliminate risk, it can considerably lessen the effect of short-term declines.
You can further manage your investing risk through diversification. And today, more than ever, geographic diversification should be taken into account. Studies indicate that asset allocation is the single most important determinant of a portfolio's long-term success. The right mix of stocks, bonds and cash - aligned to your particular risk tolerance and investment objective - is very important. Age-appropriate rebalancing is also an essential aspect of asset allocation. For younger investors, an emphasis on equities - which historically have been the best-performing asset class over time - is encouraged. As investors near their specific goal, such as retirement or sending a child to college, consideration may be given to replacing volatile assets (e.g. common stocks) with more-stable fixed investments (bonds or savings plans).
A third investment principle - investing regularly - can help lower the average cost of your purchases. Investing a certain amount of money each month or quarter helps ensure you won't pay for all your shares at market highs. This strategy - known as dollar cost averaging - also reduces unconstructive "emotion" from investing, helping shareholders avoid selling weak performers just prior to an upswing, or chasing a hot performer just before a correction.
We invite you to contact us via the Internet, through our Investor Centers or over the phone. It is our privilege to provide you the information you need to make the investments that are right for you.
Sincerely,
/s/Edward C. Johnson 3d
Edward C. Johnson 3d
Annual Report
Performance: The Bottom Line
Average annual total return reflects the change in the value of an investment, assuming reinvestment of the class' dividend income and capital gains (the profits earned upon the sale of securities that have grown in value) and assuming a constant rate of performance each year. The $10,000 table and the fund's returns do not reflect the deduction of taxes that a shareholder would pay on fund distributions or the redemption of fund shares. During periods of reimbursement by Fidelity, a fund's total return will be greater than it would be had the reimbursement not occurred. How a fund did yesterday is no guarantee of how it will do tomorrow.
Average Annual Total Returns
Periods ended October 31, 2007 | Past 1
year | Life of
FundA |
Institutional Class A | 71.23% | 39.83% |
A From March 29, 2004.
$10,000 Over Life of Fund
Let's say hypothetically that $10,000 was invested in Fidelity® Advisor Emerging Markets Fund - Institutional Class on March 29, 2004, when the fund started. The chart shows how the value of your investment would have changed, and also shows how the Morgan Stanley Capital InternationalSM Emerging Markets Index performed over the same period.
Annual Report
Management's Discussion of Fund Performance
Comments from Robert von Rekowsky, Portfolio Manager of Fidelity® Advisor Emerging Markets Fund
Emerging-markets equities continued their sparkling multiyear performance, returning 68.33% as measured by the Morgan Stanley Capital InternationalSM (MSCI®) Emerging Markets Index during the 12-month period ending October 31, 2007. On the whole, developing markets benefited from brisk economic growth, the ongoing build-out of commercial and industrial infrastructure, and rising commodity prices. China led the way with a superlative gain of roughly 168%, reflecting optimism about opportunities within the country's fast-growing economy. Hong Kong surged higher for similar reasons, jumping more than 147%. Brazil, the third-largest component of the MSCI benchmark, rose 111%, fueled largely by its exports of natural resources. However, three of the four largest country weightings in the index trailed its overall return despite very strong absolute performance. South Korea - the index's biggest constituent with a weighting of about 16% on average during the period - was a prime example. It gained almost 57% but still fell about 12 percentage points shy of the MSCI Emerging Markets index. Taiwan and Russia also trailed, despite solid returns of approximately 40% and 33%, respectively.
During the past year, the fund's Institutional Class shares returned 71.23%, beating the MSCI index. Effective stock selection and a modest underweighting in technology added the most value versus the index. Stock picking in telecommunication services and materials also helped. A weak U.S. dollar further bolstered our absolute performance. Geographically, stock picking in South Korea, Russia and India helped, along with underweighting Taiwan. China Coal Energy was a significant contributor, spurred by an attractive valuation to start the period, healthy demand and tight coal supplies. Russian steel producer Evraz Group - a Luxembourg-incorporated company - - further aided performance. China Coal Energy and Evraz were out-of-benchmark positions. Not owning Indian technology services provider and index component Infosys Technologies also added value, as did underweighting Korea-based Kookmin Bank - later sold completely - and Taiwan Semiconductor Manufacturing. Conversely, underweighting the strong-performing Chinese market hurt performance, as did a modest cash position. Not owning index components China Life Insurance, Korean shipbuilder Hyundai Heavy Industries and energy producer Petrochina detracted. Russia-based, U.S.-listed television network operator CTC Media - an out-of-benchmark holding - was hurt by revenue concerns.
The views expressed above reflect those of the portfolio manager(s) only through the end of the period as stated on the cover of this report and do not necessarily represent the views of Fidelity or any other person in the Fidelity organization. Any such views are subject to change at any time based upon market or other conditions and Fidelity disclaims any responsibility to update such views. These views may not be relied on as investment advice and, because investment decisions for a Fidelity fund are based on numerous factors, may not be relied on as an indication of trading intent on behalf of any Fidelity fund.
Annual Report
Shareholder Expense Example
As a shareholder of the Fund, you incur two types of costs: (1) transaction costs, including sales charges (loads) on purchase payments or redemption proceeds, redemption fees, and (2) ongoing costs, including management fees, distribution and/or service (12b-1) fees and other Fund expenses. This Example is intended to help you understand your ongoing costs (in dollars) of investing in the Fund and to compare these costs with the ongoing costs of investing in other mutual funds.
The Example is based on an investment of $1,000 invested at the beginning of the period and held for the entire period (May 1, 2007 to October 31, 2007).
Actual Expenses
The first line of the accompanying table for each class of the Fund provides information about actual account values and actual expenses. You may use the information in this line, together with the amount you invested, to estimate the expenses that you paid over the period. Simply divide your account value by $1,000.00 (for example, an $8,600 account value divided by $1,000.00 = 8.6), then multiply the result by the number in the first line for a class of the Fund under the heading entitled "Expenses Paid During Period" to estimate the expenses you paid on your account during this period. In addition, the Fund, as a shareholder in the underlying Fidelity Central Funds, will indirectly bear its pro rata share of the fees and expenses incurred by the underlying Fidelity Central Funds. These fees and expenses are not included in the Fund's annualized expense ratio used to calculate the expense estimate in the table below.
Hypothetical Example for Comparison Purposes
The second line of the accompanying table for each class of the Fund provides information about hypothetical account values and hypothetical expenses based on a Class' actual expense ratio and an assumed rate of return of 5% per year before expenses, which is not the Class' actual return. The hypothetical account values and expenses may not be used to estimate the actual ending account balance or expenses you paid for the period. You may use this information to compare the ongoing costs of investing in the Fund and other funds. To do so, compare this 5% hypothetical example with the 5% hypothetical examples that appear in the shareholder reports of the other funds. In addition, the Fund, as a shareholder in the underlying Fidelity Central Funds, will indirectly bear its pro rata share of the fees and expenses incurred by the underlying Fidelity Central Funds. These fees and expenses are not included in the Fund's annualized expense ratio used to calculate the expense estimate in the table below.
Please note that the expenses shown in the table are meant to highlight your ongoing costs only and do not reflect any transaction costs. Therefore, the second line of the table is useful in comparing ongoing costs only, and will not help you determine the relative total costs of owning different funds. In addition, if these transactional costs were included, your costs would have been higher.
Annual Report
Shareholder Expense Example - continued
| Beginning
Account Value
May 1, 2007 | Ending
Account Value
October 31, 2007 | Expenses Paid
During Period*
May 1, 2007 to
October 31, 2007 |
Class A | | | |
Actual | $ 1,000.00 | $ 1,411.00 | $ 9.72 |
Hypothetical A | $ 1,000.00 | $ 1,017.14 | $ 8.13 |
Class T | | | |
Actual | $ 1,000.00 | $ 1,409.60 | $ 11.24 |
Hypothetical A | $ 1,000.00 | $ 1,015.88 | $ 9.40 |
Class B | | | |
Actual | $ 1,000.00 | $ 1,405.40 | $ 14.25 |
Hypothetical A | $ 1,000.00 | $ 1,013.36 | $ 11.93 |
Class C | | | |
Actual | $ 1,000.00 | $ 1,405.90 | $ 14.25 |
Hypothetical A | $ 1,000.00 | $ 1,013.36 | $ 11.93 |
Institutional Class | | | |
Actual | $ 1,000.00 | $ 1,414.10 | $ 7.42 |
Hypothetical A | $ 1,000.00 | $ 1,019.06 | $ 6.21 |
A 5% return per year before expenses
* Expenses are equal to each Class' annualized expense ratio (shown in the table below); multiplied by the average account value over the period, multiplied by 184/365 (to reflect the one-half year period).
| Annualized
Expense Ratio |
Class A | 1.60% |
Class T | 1.85% |
Class B | 2.35% |
Class C | 2.35% |
Institutional Class | 1.22% |
Annual Report
Investment Changes
Top Five Stocks as of October 31, 2007 |
| % of fund's
net assets | % of fund's net assets
6 months ago |
China Mobile (Hong Kong) Ltd. (Hong Kong, Wireless Telecommunication Services) | 3.6 | 2.0 |
OAO Gazprom sponsored ADR (Russia, Oil, Gas & Consumable Fuels) | 3.5 | 3.1 |
Companhia Vale do Rio Doce (PN-A) sponsored ADR (Brazil, Metals & Mining) | 3.4 | 2.7 |
Petroleo Brasileiro SA - Petrobras (PN) (non-vtg.) (Brazil, Oil, Gas & Consumable Fuels) | 3.2 | 2.6 |
America Movil SAB de CV Series L sponsored ADR (Mexico, Wireless Telecommunication Services) | 1.9 | 3.0 |
| 15.6 | |
Top Five Market Sectors as of October 31, 2007 |
| % of fund's
net assets | % of fund's net assets
6 months ago |
Financials | 20.3 | 20.1 |
Materials | 17.9 | 14.0 |
Energy | 16.6 | 14.9 |
Industrials | 13.0 | 10.5 |
Telecommunication Services | 10.2 | 9.3 |
Top Five Countries as of October 31, 2007 |
(excluding cash equivalents) | % of fund's
net assets | % of fund's net assets
6 months ago |
Brazil | 13.7 | 13.1 |
Korea (South) | 13.5 | 15.9 |
Russia | 10.6 | 10.8 |
Hong Kong | 6.8 | 3.4 |
Taiwan | 6.5 | 4.9 |
Percentages are adjusted for the effect of open futures contracts, if applicable. |
Asset Allocation (% of fund's net assets) |
As of October 31, 2007 | As of April 30, 2007 |
| Stocks and Investment Companies 97.1% | | | Stocks and Investment Companies 98.9% | |
| Short-Term
Investments and Net Other Assets 2.9% | | | Short-Term
Investments and Net Other Assets 1.1% | |

Annual Report
Investments October 31, 2007
Showing Percentage of Net Assets
Common Stocks - 96.8% |
| Shares | | Value |
Argentina - 0.3% |
Banco Macro SA sponsored ADR | 26,900 | | $ 743,785 |
Banco Patagonia SA unit | 15,000 | | 364,141 |
Pampa Holding SA (a) | 161,800 | | 144,738 |
Telecom Argentina SA Class B sponsored ADR (a) | 17,000 | | 408,170 |
TOTAL ARGENTINA | | 1,660,834 |
Austria - 0.6% |
Raiffeisen International Bank Holding AG | 11,974 | | 1,979,399 |
voestalpine AG | 13,600 | | 1,223,007 |
TOTAL AUSTRIA | | 3,202,406 |
Bahrain - 0.1% |
Gulf Finance House BSC unit (a) | 29,100 | | 720,225 |
Bermuda - 2.0% |
Aquarius Platinum Ltd. (Australia) | 43,300 | | 1,707,355 |
CC Land Holdings Ltd. | 486,000 | | 963,566 |
Central European Media Enterprises Ltd. Class A (a) | 16,900 | | 1,939,275 |
China Grand Forestry Resources Group Ltd. (a) | 2,276,000 | | 808,858 |
Credicorp Ltd. (NY Shares) | 15,600 | | 1,159,548 |
Dufry South America Ltd. unit | 34,818 | | 1,016,506 |
Pacific Basin Shipping Ltd. | 208,000 | | 466,004 |
Samling Global Ltd. | 2,207,000 | | 758,435 |
Sinofert Holdings Ltd. | 2,112,100 | | 1,992,281 |
TOTAL BERMUDA | | 10,811,828 |
Brazil - 13.7% |
All America Latina Logistica SA unit | 114,600 | | 1,814,947 |
B2W Companhia Global Do Varejo | 23,600 | | 1,274,054 |
Banco Bradesco SA: | | | |
(PN) | 126,400 | | 4,295,890 |
(PN) sponsored ADR | 67,800 | | 2,315,370 |
Banco Daycoval SA (PN) | 53,600 | | 632,010 |
Banco do Brasil SA | 115,100 | | 2,084,986 |
Banco Indusval SA (e) | 18,432 | | 269,539 |
Bovespa Holding SA (a) | 11,000 | | 209,497 |
Companhia Brasileira (a)(e) | 622 | | 330,755 |
Companhia Brasileira de Distribuicao Grupo Pao de Acucar sponsored ADR | 12,200 | | 392,596 |
Companhia de Concessoes Rodoviarias | 53,100 | | 976,308 |
Companhia de Saneamento de Minas Gerais | 56,400 | | 1,059,476 |
Companhia Vale do Rio Doce (PN-A) sponsored ADR | 569,400 | | 17,975,958 |
CSU Cardsystem SA sponsored ADR (a)(e) | 3,000 | | 38,755 |
Common Stocks - continued |
| Shares | | Value |
Brazil - continued |
Duratex SA (PN) | 27,300 | | $ 913,471 |
Eternit SA | 104,160 | | 511,739 |
Gafisa SA: | | | |
ADR (a)(d) | 21,700 | | 773,822 |
warrants 12/28/07 (a) | 32,000 | | 570,560 |
GVT Holding SA | 37,400 | | 821,455 |
JBS SA | 132,229 | | 609,135 |
Localiza Rent a Car SA | 122,700 | | 1,453,166 |
Lojas Americanas SA (PN) | 102,112 | | 1,188,680 |
MRV Engenharia e Participacoes SA | 21,400 | | 445,168 |
Multiplan Empreendimentos Imobiliarios SA | 35,100 | | 512,674 |
Net Servicos de Comunicacao SA sponsored ADR (a) | 103,766 | | 1,668,557 |
Obrascon Huarte Lain Brasil SA | 37,900 | | 679,094 |
Petroleo Brasileiro SA - Petrobras: | | | |
(PN) (non-vtg.) | 370,100 | | 15,434,203 |
(PN) sponsored ADR (non-vtg.) | 19,600 | | 1,630,524 |
sponsored ADR | 11,800 | | 1,128,434 |
Satipel Industrial SA | 14,100 | | 105,785 |
Sul America SA unit | 24,200 | | 437,393 |
Tegma Gestao Logistica | 31,400 | | 539,032 |
Uniao de Bancos Brasileiros SA (Unibanco): | | | |
unit | 115,500 | | 1,827,865 |
GDR | 26,600 | | 4,203,864 |
Usinas Siderurgicas de Minas Gerais SA - Usiminas (PN-A) (non-vtg.) | 48,700 | | 3,819,492 |
Weg SA | 30,900 | | 469,724 |
TOTAL BRAZIL | | 73,413,978 |
British Virgin Islands - 0.0% |
Titanium Resources Group Ltd. (a) | 153,700 | | 241,260 |
Bulgaria - 0.0% |
Chimimport AD | 4,615 | | 57,668 |
Kaolin AD | 3,000 | | 43,465 |
MonBat AD (a) | 4,000 | | 96,411 |
TOTAL BULGARIA | | 197,544 |
Canada - 0.9% |
Addax Petroleum, Inc. | 7,900 | | 346,137 |
Addax Petroleum, Inc. (a)(e) | 4,700 | | 205,930 |
Eastern Platinum Ltd. (a) | 293,400 | | 910,466 |
First Quantum Minerals Ltd. | 12,800 | | 1,378,555 |
Frontera Copper Corp. (a) | 111,100 | | 903,673 |
Common Stocks - continued |
| Shares | | Value |
Canada - continued |
JumpTV, Inc. | 65,000 | | $ 130,799 |
Teck Cominco Ltd. Class B (sub. vtg.) | 3,303 | | 165,500 |
Uranium One, Inc. (a) | 19,300 | | 214,422 |
Uranium One, Inc. (South Africa) (a) | 49,418 | | 555,088 |
TOTAL CANADA | | 4,810,570 |
Cayman Islands - 1.6% |
Agile Property Holdings Ltd. | 1,250,000 | | 3,033,764 |
Alibaba.com Ltd. (a) | 21,000 | | 67,739 |
Bosideng International Holdings Ltd. | 202,000 | | 86,530 |
Chaoda Modern Agriculture (Holdings) Ltd. | 2,217,500 | | 2,023,760 |
China Aoyuan Property Group Ltd. | 45,000 | | 38,727 |
China Dongxiang Group Co. Ltd. | 70,000 | | 53,559 |
CNinsure, Inc. ADR (a) | 2,200 | | 55,638 |
E-House China Holdings Ltd. ADR sponsored ADR | 5,900 | | 209,450 |
Hidili Industry International Development Ltd. | 49,000 | | 73,086 |
Integra Group unit | 32,000 | | 512,000 |
KWG Property Holding Ltd. | 48,500 | | 91,364 |
Lee & Man Paper Manufacturing Ltd. | 512,200 | | 2,048,976 |
NagaCorp Ltd. | 582,000 | | 170,602 |
Neo-Neon Holdings Ltd. | 87,500 | | 103,083 |
NetDragon WebSoft, Inc. (a) | 77,000 | | 130,944 |
Niger Uranium Ltd. | 4,680 | | 3,503 |
TOTAL CAYMAN ISLANDS | | 8,702,725 |
Chile - 0.3% |
Lan Airlines SA sponsored ADR | 91,800 | | 1,527,552 |
China - 5.1% |
Angang Steel Co. Ltd. (H Shares) | 225,000 | | 828,408 |
Anhui Conch Cement Co. Ltd. (H Shares) | 166,000 | | 1,657,988 |
China Coal Energy Co. Ltd. (H Shares) | 1,168,300 | | 3,964,094 |
China Construction Bank Corp. (H Shares) | 5,484,000 | | 6,234,486 |
China Gas Holdings Ltd. | 1,314,000 | | 629,783 |
China Hongxing Sports Ltd. | 330,000 | | 295,922 |
China Molybdenum Co. Ltd. (H Shares) | 83,000 | | 217,662 |
Digital China Holdings Ltd. (H Shares) | 274,000 | | 180,960 |
First Tractor Co. Ltd. (H Shares) (a) | 736,500 | | 466,608 |
Golden Eagle Retail Group Ltd. (H Shares) | 355,000 | | 368,835 |
Guangzhou R&F Properties Co. Ltd. (H Shares) | 566,400 | | 2,981,905 |
Home Inns & Hotels Management, Inc. ADR (d) | 500 | | 22,015 |
Industrial & Commercial Bank of China | 2,146,000 | | 2,049,646 |
Parkson Retail Group Ltd. | 64,500 | | 736,141 |
Common Stocks - continued |
| Shares | | Value |
China - continued |
Ping An Insurance (Group) Co. of China, Ltd. (H Shares) | 372,000 | | $ 5,207,160 |
Shandong Weigao Group Medical Polymer Co. Ltd. (H Shares) | 222,000 | | 494,498 |
Shenzhen Expressway Co. Ltd. (H Shares) | 374,000 | | 388,830 |
Yantai Changyu Pioneer Wine Co. (B Shares) | 54,990 | | 409,782 |
TOTAL CHINA | | 27,134,723 |
Colombia - 0.3% |
Almacenes Exito SA unit (e) | 22,100 | | 170,694 |
BanColombia SA sponsored ADR | 42,900 | | 1,576,575 |
TOTAL COLOMBIA | | 1,747,269 |
Croatia - 0.1% |
T-Hrvatske Telekom ADR (a)(e) | 4,400 | | 316,800 |
Cyprus - 0.4% |
Mirland Development Corp. PLC | 68,900 | | 848,020 |
Urals Energy Public Co. Ltd. (a) | 69,500 | | 404,583 |
XXI Century Investments Public Ltd. (a)(d) | 30,500 | | 1,066,891 |
TOTAL CYPRUS | | 2,319,494 |
Czech Republic - 0.7% |
Ceske Energeticke Zavody AS | 52,700 | | 3,809,331 |
Egypt - 1.1% |
Commercial International Bank Ltd. sponsored GDR | 88,500 | | 1,225,725 |
Eastern Tobacco Co. | 8,000 | | 610,421 |
Egyptian Co. for Mobile Services (MobiNil) | 11,360 | | 401,486 |
Orascom Construction Industries SAE: | | | |
GDR | 11,444 | | 2,099,974 |
GDR (e) | 400 | | 73,400 |
Orascom Hotels & Development (OHD) (a) | 96,336 | | 1,248,221 |
TOTAL EGYPT | | 5,659,227 |
Estonia - 0.0% |
Olympic Entertainment Group AS | 18,200 | | 139,224 |
Finland - 0.0% |
Rakentajain Konevuokraamo Oyj (B Shares) | 5,500 | | 205,585 |
Georgia - 0.1% |
Bank of Georgia: | | | |
ADR (a)(e) | 5,000 | | 165,000 |
unit (a) | 17,800 | | 587,400 |
TOTAL GEORGIA | | 752,400 |
Common Stocks - continued |
| Shares | | Value |
Hong Kong - 6.8% |
China Mobile (Hong Kong) Ltd. | 931,700 | | $ 19,319,730 |
China Overseas Land & Investment Ltd. | 586,000 | | 1,402,633 |
China Overseas Land & Investment Ltd. warrants 8/27/08 (a) | 14,666 | | 12,205 |
China Resources Power Holdings Co. Ltd. | 529,700 | | 1,981,535 |
China Seven Star Shopping Ltd. (a) | 890,000 | | 47,361 |
CNOOC Ltd. | 2,677,000 | | 5,795,437 |
CNOOC Ltd. sponsored ADR (d) | 6,000 | | 1,298,940 |
CNPC (Hong Kong) Ltd. | 3,261,000 | | 2,659,060 |
Fosun International Ltd. | 116,500 | | 157,531 |
Kerry Properties Ltd. | 178,500 | | 1,552,613 |
REXCAPITAL Financial Holdings Ltd. (a) | 5,220,000 | | 1,086,032 |
Shanghai Industrial Holdings Ltd. (H Shares) | 214,000 | | 1,262,463 |
TOTAL HONG KONG | | 36,575,540 |
Hungary - 0.1% |
OTP Bank Ltd. unit | 3,900 | | 423,150 |
India - 6.5% |
Bank of India | 145,000 | | 1,333,231 |
Bharat Heavy Electricals Ltd. | 21,418 | | 1,433,609 |
Bharti Airtel Ltd. (a) | 90,875 | | 2,347,781 |
Blue Star Ltd. | 54,795 | | 545,212 |
Cairn India Ltd. | 199,506 | | 1,063,363 |
Federal Bank Ltd. | 14,399 | | 144,762 |
Federal Bank Ltd.: | | | |
GDR | 11,701 | | 116,029 |
GDR (e) | 9,000 | | 89,245 |
HCL Technologies Ltd. | 144,919 | | 1,176,584 |
Hindustan Zinc Ltd. | 8,048 | | 187,424 |
ICSA (India) Ltd. | 19,575 | | 182,982 |
Indiabulls Real Estate Ltd. sponsored GDR (a) | 51,448 | | 841,175 |
Indian Overseas Bank | 207,101 | | 752,439 |
IVRCL Infrastructures & Projects Ltd. | 73,174 | | 952,961 |
Jaiprakash Associates Ltd. | 43,720 | | 1,641,101 |
Jindal Saw Ltd. | 10,307 | | 208,580 |
JSW Steel Ltd. | 21,812 | | 536,844 |
Kalpataru Power Transmission Ltd. | 4,803 | | 218,488 |
LANCO Infratech Ltd. | 92,521 | | 1,073,078 |
Larsen & Toubro Ltd. | 24,681 | | 2,698,475 |
Pantaloon Retail India Ltd. | 35,450 | | 664,814 |
Punjab National Bank | 41,893 | | 664,719 |
Reliance Industries Ltd. | 107,800 | | 7,694,778 |
Rolta India Ltd. | 121,081 | | 2,161,822 |
Common Stocks - continued |
| Shares | | Value |
India - continued |
Rolta India Ltd. sponsored GDR (e) | 8,800 | | $ 132,000 |
Sintex Industries Ltd. | 55,441 | | 653,724 |
Sobha Developers Ltd. | 7,184 | | 175,468 |
State Bank of India | 27,749 | | 1,741,104 |
Steel Authority of India Ltd. | 279,585 | | 1,875,516 |
Tata Power Co. Ltd. | 36,835 | | 1,150,922 |
United Phosphorous Ltd. | 23,000 | | 212,324 |
TOTAL INDIA | | 34,670,554 |
Indonesia - 3.1% |
PT Astra Agro Lestari Tbk | 619,500 | | 1,557,731 |
PT Bakrie & Brothers Tbk (a) | 31,742,500 | | 1,124,602 |
PT Bank Mandiri Persero Tbk | 4,190,000 | | 1,775,145 |
PT Bank Niaga Tbk | 7,737,500 | | 745,490 |
PT Bank Rakyat Indonesia Tbk | 1,343,500 | | 1,165,447 |
PT Bumi Resources Tbk | 7,471,000 | | 4,023,412 |
PT Indocement Tunggal Prakarsa Tbk | 484,500 | | 443,004 |
PT International Nickel Indonesia Tbk | 179,000 | | 1,804,837 |
PT Medco Energi International Tbk | 1,756,000 | | 920,324 |
PT Perusahaan Gas Negara Tbk Series B | 1,599,000 | | 2,505,910 |
PT Perusahaan Perkebunan London Sumatra Indonesia Tbk (a) | 746,000 | | 800,798 |
TOTAL INDONESIA | | 16,866,700 |
Ireland - 0.1% |
Dragon Oil plc (a) | 75,515 | | 490,231 |
Israel - 1.1% |
Bank Hapoalim BM (Reg.) | 326,628 | | 1,797,156 |
First International Bank of Israel (a) | 76,693 | | 203,713 |
Israel Chemicals Ltd. | 268,500 | | 2,954,655 |
Ormat Industries Ltd. | 41,500 | | 679,349 |
Orpak Systems Ltd. | 19,400 | | 68,567 |
Queenco Leisure International Ltd. GDR (a) | 12,300 | | 215,625 |
Saifun Semiconductors Ltd. (a) | 14,150 | | 143,340 |
TOTAL ISRAEL | | 6,062,405 |
Kazakhstan - 0.5% |
JSC Halyk Bank of Kazakhstan: | | | |
GDR (e) | 25,900 | | 478,114 |
unit | 17,590 | | 324,711 |
KazMunaiGas Exploration & Production JSC (Reg. S) GDR | 67,500 | | 1,822,500 |
TOTAL KAZAKHSTAN | | 2,625,325 |
Common Stocks - continued |
| Shares | | Value |
Korea (South) - 13.5% |
Asia Cement Co. Ltd. | 6,175 | | $ 496,525 |
CJ CheilJedang Corp. (a) | 2,596 | | 860,433 |
CJ Corp. | 5,121 | | 573,310 |
Daegu Bank Co. Ltd. | 19,010 | | 336,962 |
Daewoo Shipbuilding & Marine Engineering Co. Ltd. | 47,000 | | 2,985,702 |
Doosan Co. Ltd. (a) | 11,031 | | 3,244,173 |
GS Engineering & Construction Corp. | 18,210 | | 3,858,418 |
Hanil Cement Co. Ltd. | 1,520 | | 164,397 |
Hanjin Heavy Industries & Consolidated Co. Ltd. (a) | 18,279 | | 2,003,262 |
Hanjin Heavy Industries & Construction Holdings | 6,760 | | 433,636 |
Hyundai Engineering & Construction Co. Ltd. (a) | 21,955 | | 2,248,261 |
Hyundai Mipo Dockyard Co. Ltd. | 6,351 | | 2,822,085 |
Hyundai Steel Co. | 14,610 | | 1,457,060 |
Industrial Bank of Korea | 56,390 | | 1,156,211 |
Korean Air Lines Co. Ltd. | 7,700 | | 677,261 |
Kyeryong Construction Industrial Co. Ltd. | 17,170 | | 807,006 |
LG Household & Health Care Ltd. | 10,040 | | 2,238,472 |
LG Petrochemical Co. Ltd. | 11,390 | | 679,478 |
Macquarie Korea Infrastructure Fund GDR | 83,400 | | 577,962 |
MegaStudy Co. Ltd. | 7,904 | | 2,916,942 |
NHN Corp. (a) | 13,980 | | 4,495,663 |
Osstem Implant Co. Ltd. | 8,700 | | 404,058 |
POSCO | 11,330 | | 8,263,138 |
Samsung Corp. | 23,000 | | 2,128,861 |
Samsung Electronics Co. Ltd. | 14,941 | | 9,213,615 |
Samsung Fire & Marine Insurance Co. Ltd. | 7,200 | | 2,003,258 |
Samsung Heavy Industries Ltd. | 48,360 | | 2,919,969 |
Samwhan Corp. | 18,370 | | 615,754 |
Shinhan Financial Group Co. Ltd. | 62,100 | | 4,066,619 |
SK Chemicals Co. Ltd. | 9,013 | | 898,656 |
SK Energy Co. Ltd. | 17,304 | | 3,977,269 |
Taewoong Co. Ltd. | 12,228 | | 1,747,622 |
Woori Investment & Securities Co. Ltd. | 35,050 | | 1,080,611 |
TOTAL KOREA (SOUTH) | | 72,352,649 |
Lebanon - 0.0% |
Solidere GDR | 14,600 | | 266,012 |
Luxembourg - 0.5% |
Evraz Group SA GDR | 32,600 | | 2,461,300 |
Malaysia - 1.6% |
Bandar Raya Developments BHD | 219,700 | | 207,397 |
DiGi.com Bhd | 102,200 | | 769,778 |
Common Stocks - continued |
| Shares | | Value |
Malaysia - continued |
Gamuda Bhd | 397,000 | | $ 547,378 |
Genting Bhd | 505,000 | | 1,256,950 |
IJM Corp. Bhd | 160,000 | | 420,304 |
KNM Group Bhd | 663,400 | | 1,174,256 |
Lion Diversified Holdings Bhd | 148,300 | | 106,181 |
Parkson Holdings Bhd | 192,790 | | 556,236 |
Public Bank BHD | 552,000 | | 1,846,610 |
Steppe Cement Ltd. (a) | 114,600 | | 607,561 |
UEM World BHD | 381,900 | | 499,329 |
Zelan Bhd | 204,000 | | 370,380 |
TOTAL MALAYSIA | | 8,362,360 |
Mauritius - 0.1% |
Golden Agri-Resources Ltd. | 464,000 | | 567,997 |
Mexico - 3.8% |
Alsea SAB de CV | 318,900 | | 475,068 |
America Movil SAB de CV Series L sponsored ADR | 155,200 | | 10,148,528 |
Banco Compartamos SA de CV | 131,800 | | 680,032 |
Empresas ICA Sociedad Controladora SA de CV sponsored ADR (a) | 5,200 | | 145,496 |
Fomento Economico Mexicano SA de CV sponsored ADR | 70,200 | | 2,499,822 |
Grupo Aeroportuario Norte Sab de CV ADR | 38,900 | | 1,187,617 |
Grupo Financiero Banorte SA de CV Series O | 112,900 | | 530,619 |
Grupo Mexico SA de CV Series B | 343,768 | | 3,128,154 |
Urbi, Desarrollos Urbanos, SA de CV (a) | 369,000 | | 1,425,834 |
TOTAL MEXICO | | 20,221,170 |
Netherlands - 0.3% |
A&D Pharma Holdings NV (Reg. S) unit | 4,200 | | 103,444 |
AmRest Holdings NV (a) | 6,500 | | 345,887 |
X5 Retail Group NV unit (a) | 30,300 | | 1,090,800 |
TOTAL NETHERLANDS | | 1,540,131 |
Nigeria - 0.1% |
Guaranty Trust Bank PLC sponsored GDR (a)(e) | 31,600 | | 356,448 |
Oman - 0.3% |
BankMuscat SAOG sponsored: | | | |
GDR (e) | 7,562 | | 120,992 |
GDR | 84,270 | | 1,348,320 |
TOTAL OMAN | | 1,469,312 |
Common Stocks - continued |
| Shares | | Value |
Pakistan - 0.1% |
MCB Bank Ltd. (a) | 22,195 | | $ 138,892 |
MCB Bank Ltd. | 5,000 | | 120,050 |
MCB Bank Ltd. unit (e) | 11,385 | | 273,354 |
TOTAL PAKISTAN | | 532,296 |
Panama - 0.0% |
Intergroup Financial Services Corp. (e) | 16,076 | | 281,330 |
Philippines - 0.8% |
Alliance Global Group, Inc. (a) | 1,523,000 | | 189,389 |
Ayala Corp. | 52,080 | | 743,572 |
GMA Networks, Inc. unit | 569,000 | | 112,686 |
International Container Terminal Services, Inc. | 383,000 | | 366,022 |
Megaworld Corp. | 5,711,000 | | 578,662 |
PNOC Energy Development Corp. | 3,911,000 | | 684,481 |
Robinsons Land Corp. | 1,238,000 | | 591,560 |
Security Bank Corp. | 192,000 | | 347,081 |
SM Investments Corp. | 101,094 | | 884,645 |
TOTAL PHILIPPINES | | 4,498,098 |
Poland - 0.5% |
Bank Handlowy w Warszawie SA | 21,015 | | 974,609 |
Globe Trade Centre SA (a) | 54,800 | | 1,128,316 |
PBG SA (a) | 2,574 | | 349,889 |
Polimex Mostostal SA | 50,000 | | 207,896 |
Vistula & Wolczanka SA (a) | 1,010 | | 6,057 |
TOTAL POLAND | | 2,666,767 |
Romania - 0.0% |
Banca Transilvania SA | 346,580 | | 136,455 |
Russia - 10.6% |
JSC Chelyabinsk Zinc Plant (a) | 7,300 | | 102,200 |
JSC MMC 'Norilsk Nickel' sponsored ADR | 19,800 | | 6,237,000 |
Lukoil Oil Co. sponsored ADR | 19,363 | | 1,778,492 |
Magnitogorsk Iron & Steel Works | 310,300 | | 403,390 |
Mechel Steel Group OAO sponsored ADR (d) | 32,500 | | 2,734,875 |
Mobile TeleSystems OJSC sponsored ADR | 72,800 | | 6,042,400 |
Novolipetsk Iron & Steel Corp. sponsored GDR (e) | 22,500 | | 927,900 |
OAO Gazprom sponsored ADR | 376,370 | | 18,912,593 |
OAO Raspadskaya | 50,000 | | 255,500 |
OAO TatNeft unit | 16,450 | | 2,052,138 |
OAO TMK (a) | 87,500 | | 984,375 |
OAO TMK unit | 19,000 | | 845,310 |
Common Stocks - continued |
| Shares | | Value |
Russia - continued |
Open Investments (a) | 1,588 | | $ 438,288 |
Rosinter Restaurants Holding | 5,000 | | 280,000 |
Sberbank (Savings Bank of the Russian Federation) (a) | 769,000 | | 3,306,700 |
Sberbank (Savings Bank of the Russian Federation) GDR | 7,300 | | 3,696,396 |
Sistema-Hals JSC | 1,500 | | 292,500 |
Sistema-Hals JSC unit (a) | 10,000 | | 97,500 |
Surgutneftegaz JSC sponsored ADR | 5,444 | | 376,725 |
Uralkali JSC (a) | 132,300 | | 661,500 |
Uralkali JSC unit (a) | 18,400 | | 461,840 |
Vimpel Communications sponsored ADR | 110,400 | | 3,650,928 |
VSMPO-Avisma Corp. (a) | 1,000 | | 317,000 |
Wimm-Bill-Dann Foods OJSC sponsored ADR | 14,900 | | 1,784,275 |
TOTAL RUSSIA | | 56,639,825 |
Singapore - 0.7% |
Keppel Corp. Ltd. | 101,200 | | 1,040,248 |
Olam International Ltd. | 266,000 | | 649,570 |
Sino-Environment Technology Group Ltd. (a) | 198,000 | | 458,410 |
Straits Asia Resources Ltd. | 494,000 | | 915,110 |
Yangzijiang Shipbuilding Holdings Ltd. | 314,000 | | 559,181 |
TOTAL SINGAPORE | | 3,622,519 |
South Africa - 6.2% |
African Bank Investments Ltd. | 291,247 | | 1,617,790 |
African Rainbow Minerals Ltd. | 32,686 | | 754,408 |
Anglo Platinum Ltd. | 8,512 | | 1,460,360 |
Aspen Pharmacare Holdings Ltd. | 182,800 | | 1,067,435 |
Bell Equipment Ltd. | 29,836 | | 238,725 |
Bidvest Group Ltd. | 108,700 | | 2,281,379 |
Exxaro Resources Ltd. | 46,900 | | 758,526 |
FirstRand Ltd. | 900,273 | | 3,560,089 |
Illovo Sugar Ltd. | 110,157 | | 389,846 |
Impala Platinum Holdings Ltd. | 134,464 | | 5,048,348 |
JSE Ltd. | 5,700 | | 75,866 |
Kumba Iron Ore Ltd. | 48,400 | | 1,891,614 |
Mr. Price Group Ltd. | 167,100 | | 678,788 |
MTN Group Ltd. | 283,532 | | 5,507,911 |
Murray & Roberts Holdings Ltd. | 227,661 | | 3,485,501 |
Nedbank Group Ltd. | 102,474 | | 2,246,891 |
Raubex Group Ltd. | 200,228 | | 1,102,964 |
Shoprite Holdings Ltd. | 164,382 | | 1,024,384 |
TOTAL SOUTH AFRICA | | 33,190,825 |
Common Stocks - continued |
| Shares | | Value |
Taiwan - 6.5% |
AU Optronics Corp. | 978,000 | | $ 2,083,099 |
AU Optronics Corp. sponsored ADR | 73,457 | | 1,596,221 |
China Steel Corp. | 2,307,920 | | 3,248,685 |
Chung Hwa Pulp Corp. | 1,611,000 | | 1,111,463 |
Delta Electronics, Inc. | 522,427 | | 2,096,481 |
Everlight Electronics Co. Ltd. | 44,286 | | 193,439 |
Feng Tay Enterprise Co. Ltd. | 291,840 | | 251,345 |
Formosa Chemicals & Fibre Corp. | 664,000 | | 1,783,238 |
Foxconn Technology Co. Ltd. | 109,455 | | 1,317,717 |
Gemtek Technology Corp. | 93,927 | | 211,368 |
Greatek Electronics, Inc. | 482,840 | | 755,672 |
Hon Hai Precision Industry Co. Ltd. (Foxconn) | 953,014 | | 7,236,964 |
Innolux Display Corp. | 487,553 | | 2,257,538 |
MediaTek, Inc. | 226,550 | | 4,426,799 |
Shin Kong Financial Holding Co. Ltd. | 1,681,545 | | 1,557,226 |
Siliconware Precision Industries Co. Ltd. | 1,391,267 | | 2,933,278 |
Taiwan Cement Corp. | 780,740 | | 1,330,355 |
Taiwan Semiconductor Manufacturing Co. Ltd. | 251,220 | | 494,763 |
TOTAL TAIWAN | | 34,885,651 |
Thailand - 1.0% |
Mermaid Maritime PLC | 43,000 | | 56,767 |
Minor International PCL (For. Reg.) | 1,811,504 | | 948,794 |
PTT Public Co. Ltd. (For. Reg.) | 298,000 | | 3,647,727 |
Total Access Communication PCL (a) | 123,000 | | 147,600 |
Total Access Communication PCL unit (a) | 262,200 | | 316,322 |
TOTAL THAILAND | | 5,117,210 |
Turkey - 2.9% |
Aksigorta AS | 105,015 | | 774,520 |
Anadolu Efes Biracilik ve Malt Sanyii AS | 130,646 | | 1,590,989 |
Asya Katilim Bankasi AS (a) | 246,000 | | 2,088,590 |
Atakule Gayrimenkul Yatirim Ortakligi AS | 109,000 | | 214,999 |
Bagfas Bandirma Gubre Fabrikalari AS | 14,609 | | 701,603 |
Enka Insaat ve Sanayi AS | 156,940 | | 2,449,559 |
Tofas Turk Otomobil Fabrikasi AS | 233,000 | | 1,228,892 |
Tupras-Turkiye Petrol Rafinerileri AS | 87,200 | | 2,467,819 |
Turk Hava Yollari AO (a) | 24,000 | | 170,833 |
Turkiye Garanti Bankasi AS | 403,375 | | 3,701,482 |
TOTAL TURKEY | | 15,389,286 |
United Kingdom - 0.6% |
Aricom Plc (a) | 521,300 | | 831,823 |
Common Stocks - continued |
| Shares | | Value |
United Kingdom - continued |
Aricom Plc warrants 6/5/10 (a)(f) | 12,700 | | $ 8,462 |
Gafisa SA warrants (Deutsche Bank Warrant Program) 12/17/07 (a) | 13,700 | | 244,271 |
Hirco PLC | 21,000 | | 164,598 |
Imperial Energy PLC (a) | 23,300 | | 666,560 |
Sibir Energy PLC | 97,355 | | 1,100,076 |
TOTAL UNITED KINGDOM | | 3,015,790 |
United States of America - 1.1% |
BMB Munai, Inc. (a) | 44,763 | | 261,864 |
Central European Distribution Corp. (a) | 14,600 | | 776,428 |
CTC Media, Inc. (a) | 42,696 | | 1,071,243 |
Golden Telecom, Inc. (d) | 24,000 | | 2,482,800 |
NII Holdings, Inc. (a) | 19,000 | | 1,102,000 |
Pricesmart, Inc. | 15,370 | | 437,123 |
TOTAL UNITED STATES OF AMERICA | | 6,131,458 |
Vietnam - 0.1% |
Luks Group (Vietnam Holdings) Co. Ltd. | 290,000 | | 384,540 |
TOTAL COMMON STOCKS (Cost $333,816,905) | 519,176,309 |
Nonconvertible Preferred Stocks - 0.1% |
| | | |
Korea (South) - 0.0% |
Samsung Electronics Co. Ltd. | 320 | | 152,422 |
South Africa - 0.1% |
Allied Electronics Corp. Ltd. | 45,500 | | 329,051 |
TOTAL NONCONVERTIBLE PREFERRED STOCKS (Cost $407,568) | 481,473 |
Investment Companies - 0.2% |
| | | |
Romania - 0.2% |
SIF 1 Banat-Crisana Arad Fund | 190,100 | | 295,248 |
SIF 3 Transilvania Brasov Fund | 583,700 | | 606,910 |
SIF 4 Muntenia Bucuresti Fund | 164,900 | | 179,348 |
SIF 5 Oltenia Craiova Fund | 72,400 | | 136,384 |
TOTAL INVESTMENT COMPANIES (Cost $949,813) | 1,217,890 |
Convertible Bonds - 0.0% |
| Principal Amount | | Value |
Brazil - 0.0% |
Companhia de Saneamento de Minas Gerais 2.3% 6/1/13 (f)
(Cost $34,686) | BRL | 555 | $ 41,703 |
Money Market Funds - 3.1% |
| Shares | | |
Fidelity Cash Central Fund, 4.97% (b) | 10,983,296 | | 10,983,296 |
Fidelity Securities Lending Cash Central Fund, 5.02% (b)(c) | 5,758,300 | | 5,758,300 |
TOTAL MONEY MARKET FUNDS (Cost $16,741,596) | 16,741,596 |
TOTAL INVESTMENT PORTFOLIO - 100.2% (Cost $351,950,568) | | 537,658,971 |
NET OTHER ASSETS - (0.2)% | | (933,573) |
NET ASSETS - 100% | $ 536,725,398 |
Currency Abbreviations |
BRL | - | Brazilian real |
Legend |
(a) Non-income producing |
(b) Affiliated fund that is available only to investment companies and other accounts managed by Fidelity Investments. The rate quoted is the annualized seven-day yield of the fund at period end. A complete unaudited listing of the fund's holdings as of its most recent quarter end is available upon request. |
(c) Investment made with cash collateral received from securities on loan. |
(d) Security or a portion of the security is on loan at period end. |
(e) Security exempt from registration under Rule 144A of the Securities Act of 1933. These securities may be resold in transactions exempt from registration, normally to qualified institutional buyers. At the end of the period, the value of these securities amounted to $4,230,256 or 0.8% of net assets. |
(f) Restricted securities - Investment in securities not registered under the Securities Act of 1933 (excluding 144A issues). At the end of the period, the value of restricted securities (excluding 144A issues) amounted to $50,165 or 0.0% of net assets. |
Additional information on each holding is as follows: |
Security | Acquisition Date | Acquisition Cost |
Aricom Plc warrants 6/5/10 | 5/11/07 | $ 0 |
Companhia de Saneamento
de Minas Gerais 2.3% 6/1/13 | 8/22/07 | $ 34,686 |
Affiliated Central Funds |
Information regarding fiscal year to date income earned by the Fund from investments in Fidelity Central Funds is as follows: |
Fund | Income earned |
Fidelity Cash Central Fund | $ 398,567 |
Fidelity Securities Lending Cash Central Fund | 22,006 |
Total | $ 420,573 |
See accompanying notes which are an integral part of the financial statements.
Annual Report
Financial Statements
Statement of Assets and Liabilities
| October 31, 2007 |
Assets | | |
Investment in securities, at value (including securities loaned of $5,779,220) - See accompanying schedule: Unaffiliated issuers (cost $335,208,972) | $ 520,917,375 | |
Fidelity Central Funds (cost $16,741,596) | 16,741,596 | |
Total Investments (cost $351,950,568) | | $ 537,658,971 |
Foreign currency held at value (cost $199) | | 199 |
Receivable for investments sold | | 2,522,436 |
Receivable for fund shares sold | | 11,055,980 |
Dividends receivable | | 592,467 |
Distributions receivable from Fidelity Central Funds | | 72,052 |
Other receivables | | 81,368 |
Total assets | | 551,983,473 |
| | |
Liabilities | | |
Payable for investments purchased | $ 6,897,916 | |
Payable for fund shares redeemed | 835,640 | |
Accrued management fee | 350,538 | |
Distribution fees payable | 192,323 | |
Other affiliated payables | 112,439 | |
Other payables and accrued expenses | 1,110,919 | |
Collateral on securities loaned, at value | 5,758,300 | |
Total liabilities | | 15,258,075 |
| | |
Net Assets | | $ 536,725,398 |
Net Assets consist of: | | |
Paid in capital | | $ 339,750,852 |
Undistributed net investment income | | 147,275 |
Accumulated undistributed net realized gain (loss) on investments and foreign currency transactions | | 12,095,382 |
Net unrealized appreciation (depreciation) on investments and assets and liabilities in foreign currencies | | 184,731,889 |
Net Assets | | $ 536,725,398 |
See accompanying notes which are an integral part of the financial statements.
Annual Report
Statement of Assets and Liabilities - continued
| October 31, 2007 |
| | |
Calculation of Maximum Offering Price Class A: Net Asset Value and redemption price per share ($218,835,538 ÷ 6,681,035 shares) | | $ 32.75 |
| | |
Maximum offering price per share (100/94.25 of $32.75) | | $ 34.75 |
Class T: Net Asset Value and redemption price per share ($119,951,833 ÷ 3,688,704 shares) | | $ 32.52 |
| | |
Maximum offering price per share (100/96.50 of $32.52) | | $ 33.70 |
Class B: Net Asset Value and offering price per share ($41,041,859 ÷ 1,281,158 shares)A | | $ 32.03 |
| | |
Class C: Net Asset Value and offering price per share ($104,885,033 ÷ 3,273,998 shares)A | | $ 32.04 |
| | |
| | |
Institutional Class: Net Asset Value, offering price and redemption price per share ($52,011,135 ÷ 1,575,101 shares) | | $ 33.02 |
A Redemption price per share is equal to net asset value less any applicable contingent deferred sales charge.
See accompanying notes which are an integral part of the financial statements.
Annual Report
Financial Statements - continued
Statement of Operations
| Year ended October 31, 2007 |
Investment Income | | |
Dividends | | $ 5,671,744 |
Income from Fidelity Central Funds | | 420,573 |
| | 6,092,317 |
Less foreign taxes withheld | | (552,834) |
Total income | | 5,539,483 |
| | |
Expenses | | |
Management fee | $ 2,344,500 | |
Transfer agent fees | 863,842 | |
Distribution fees | 1,508,122 | |
Accounting and security lending fees | 151,503 | |
Custodian fees and expenses | 384,982 | |
Independent trustees' compensation | 904 | |
Registration fees | 90,634 | |
Audit | 79,139 | |
Legal | 10,319 | |
Miscellaneous | (604) | |
Total expenses before reductions | 5,433,341 | |
Expense reductions | (177,082) | 5,256,259 |
Net investment income (loss) | | 283,224 |
Realized and Unrealized Gain (Loss) Net realized gain (loss) on: | | |
Investment securities: | | |
Unaffiliated issuers (net of foreign taxes of $94,875) | 14,316,867 | |
Foreign currency transactions | (13,978) | |
Total net realized gain (loss) | | 14,302,889 |
Change in net unrealized appreciation (depreciation) on: Investment securities (net of increase in deferred foreign taxes of $852,046) | 159,290,703 | |
Assets and liabilities in foreign currencies | 11,888 | |
Total change in net unrealized appreciation (depreciation) | | 159,302,591 |
Net gain (loss) | | 173,605,480 |
Net increase (decrease) in net assets resulting from operations | | $ 173,888,704 |
See accompanying notes which are an integral part of the financial statements.
Annual Report
Statement of Changes in Net Assets
| Year ended
October 31,
2007 | Year ended
October 31,
2006 |
Increase (Decrease) in Net Assets | | |
Operations | | |
Net investment income (loss) | $ 283,224 | $ 236,971 |
Net realized gain (loss) | 14,302,889 | (2,203,739) |
Change in net unrealized appreciation (depreciation) | 159,302,591 | 21,734,068 |
Net increase (decrease) in net assets resulting
from operations | 173,888,704 | 19,767,300 |
Distributions to shareholders from net investment income | (135,949) | (233,810) |
Share transactions - net increase (decrease) | 182,659,550 | 131,636,302 |
Redemption fees | 114,351 | 113,753 |
Total increase (decrease) in net assets | 356,526,656 | 151,283,545 |
| | |
Net Assets | | |
Beginning of period | 180,198,742 | 28,915,197 |
End of period (including undistributed net investment income of $147,275 and undistributed net investment income of $0, respectively) | $ 536,725,398 | $ 180,198,742 |
See accompanying notes which are an integral part of the financial statements.
Annual Report
Financial Highlights - Class A
Years ended October 31, | 2007 | 2006 | 2005 | 2004 H |
Selected Per-Share Data | | | | |
Net asset value, beginning of period | $ 19.22 | $ 13.75 | $ 9.87 | $ 10.00 |
Income from Investment Operations | | | | |
Net investment income (loss) E | .09 | .09 | .12 | .02 |
Net realized and unrealized gain (loss) | 13.46 | 5.47 | 3.75 | (.16) |
Total from investment operations | 13.55 | 5.56 | 3.87 | (.14) |
Distributions from net investment income | (.03) | (.11) | - | - |
Redemption fees added to paid in capital E | .01 | .02 | .01 | .01 |
Net asset value, end of period | $ 32.75 | $ 19.22 | $ 13.75 | $ 9.87 |
Total Return B,C,D | 70.63% | 40.75% | 39.31% | (1.30)% |
Ratios to Average Net Assets F,I | | | | |
Expenses before reductions | 1.59% | 1.84% | 3.15% | 10.75% A |
Expenses net of fee waivers, if any | 1.59% | 1.60% | 1.63% | 2.00% A |
Expenses net of all reductions | 1.54% | 1.49% | 1.52% | 1.91% A |
Net investment income (loss) | .36% | .51% | .95% | .28% A |
Supplemental Data | | | | |
Net assets, end of period
(000 omitted) | $ 218,836 | $ 68,232 | $ 9,617 | $ 1,178 |
Portfolio turnover rate G | 48% | 48% | 54% | 101% A |
A Annualized
B Total returns for periods of less than one year are not annualized.
C Total returns would have been lower had certain expenses not been reduced during the periods shown.
D Total returns do not include the effect of the sales charges.
E Calculated based on average shares outstanding during the period.
F Fees and expenses of the underlying Fidelity Central Funds are not included in the Fund's expense ratio. The Fund indirectly bears its proportionate share of the expenses of any underlying Fidelity Central Funds.
G Amount does not include the portfolio activity of any underlying Fidelity Central Funds.
H For the period March 29, 2004 (commencement of operations) to October 31, 2004.
I Expense ratios reflect operating expenses of the class. Expenses before reductions do not reflect amounts reimbursed by the investment adviser or reductions from brokerage service arrangements or other expense offset arrangements and do not represent the amount paid by the class during periods when reimbursements or reductions occur. Expense ratios before reductions for start-up periods may not be representative of longer-term operating periods. Expenses net of fee waivers reflect expenses after reimbursement by the investment adviser but prior to reductions from brokerage service arrangements or other expense offset arrangements. Expenses net of all reductions represent the net expenses paid by the class.
See accompanying notes which are an integral part of the financial statements.
Annual Report
Financial Highlights - Class T
Years ended October 31, | 2007 | 2006 | 2005 | 2004 H |
Selected Per-Share Data | | | | |
Net asset value, beginning of period | $ 19.10 | $ 13.69 | $ 9.86 | $ 10.00 |
Income from Investment Operations | | | | |
Net investment income (loss) E | .03 | .05 | .09 | -J |
Net realized and unrealized gain (loss) | 13.38 | 5.43 | 3.73 | (.15) |
Total from investment operations | 13.41 | 5.48 | 3.82 | (.15) |
Distributions from net investment income | - | (.09) | - | - |
Redemption fees added to paid in capital E | .01 | .02 | .01 | .01 |
Net asset value, end of period | $ 32.52 | $ 19.10 | $ 13.69 | $ 9.86 |
Total Return B,C,D | 70.26% | 40.32% | 38.84% | (1.40)% |
Ratios to Average Net Assets F,I | | | | |
Expenses before reductions | 1.86% | 2.12% | 3.53% | 11.13% A |
Expenses net of fee waivers, if any | 1.85% | 1.85% | 1.89% | 2.25% A |
Expenses net of all reductions | 1.79% | 1.74% | 1.77% | 2.16% A |
Net investment income (loss) | .11% | .26% | .70% | .03% A |
Supplemental Data | | | | |
Net assets, end of period
(000 omitted) | $ 119,952 | $ 41,369 | $ 6,801 | $ 889 |
Portfolio turnover rate G | 48% | 48% | 54% | 101% A |
A Annualized
B Total returns for periods of less than one year are not annualized.
C Total returns would have been lower had certain expenses not been reduced during the periods shown.
D Total returns do not include the effect of the sales charges.
E Calculated based on average shares outstanding during the period.
F Fees and expenses of the underlying Fidelity Central Funds are not included in the Fund's expense ratio. The Fund indirectly bears its proportionate share of the expenses of any underlying Fidelity Central Funds.
G Amount does not include the portfolio activity of any underlying Fidelity Central Funds.
H For the period March 29, 2004 (commencement of operations) to October 31, 2004.
I Expense ratios reflect operating expenses of the class. Expenses before reductions do not reflect amounts reimbursed by the investment adviser or reductions from brokerage service arrangements or other expense offset arrangements and do not represent the amount paid by the class during periods when reimbursements or reductions occur. Expense ratios before reductions for start-up periods may not be representative of longer-term operating periods. Expenses net of fee waivers reflect expenses after reimbursement by the investment adviser but prior to reductions from brokerage service arrangements or other expense offset arrangements. Expenses net of all reductions represent the net expenses paid by the class.
J Amount represents less than $.01 per share.
See accompanying notes which are an integral part of the financial statements.
Annual Report
Financial Highlights - Class B
Years ended October 31, | 2007 | 2006 | 2005 | 2004 H |
Selected Per-Share Data | | | | |
Net asset value, beginning of period | $ 18.91 | $ 13.58 | $ 9.83 | $ 10.00 |
Income from Investment Operations | | | | |
Net investment income (loss) E | (.09) | (.04) | .02 | (.03) |
Net realized and unrealized gain (loss) | 13.20 | 5.40 | 3.72 | (.15) |
Total from investment operations | 13.11 | 5.36 | 3.74 | (.18) |
Distributions from net investment income | - | (.05) | - | - |
Redemption fees added to paid in capital E | .01 | .02 | .01 | .01 |
Net asset value, end of period | $ 32.03 | $ 18.91 | $ 13.58 | $ 9.83 |
Total Return B,C,D | 69.38% | 39.67% | 38.15% | (1.70)% |
Ratios to Average Net Assets F,I | | | | |
Expenses before reductions | 2.37% | 2.66% | 4.00% | 11.49% A |
Expenses net of fee waivers, if any | 2.35% | 2.35% | 2.39% | 2.75% A |
Expenses net of all reductions | 2.29% | 2.24% | 2.27% | 2.67% A |
Net investment income (loss) | (.39)% | (.24)% | .20% | (.47)% A |
Supplemental Data | | | | |
Net assets, end of period
(000 omitted) | $ 41,042 | $ 18,622 | $ 4,997 | $ 719 |
Portfolio turnover rate G | 48% | 48% | 54% | 101% A |
A Annualized
B Total returns for periods of less than one year are not annualized.
C Total returns would have been lower had certain expenses not been reduced during the periods shown.
D Total returns do not include the effect of the contingent deferred sales charge.
E Calculated based on average shares outstanding during the period.
F Fees and expenses of the underlying Fidelity Central Funds are not included in the Fund's expense ratio. The Fund indirectly bears its proportionate share of the expenses of any underlying Fidelity Central Funds.
G Amount does not include the portfolio activity of any underlying Fidelity Central Funds.
H For the period March 29, 2004 (commencement of operations) to October 31, 2004.
I Expense ratios reflect operating expenses of the class. Expenses before reductions do not reflect amounts reimbursed by the investment adviser or reductions from brokerage service arrangements or other expense offset arrangements and do not represent the amount paid by the class during periods when reimbursements or reductions occur. Expense ratios before reductions for start-up periods may not be representative of longer-term operating periods. Expenses net of fee waivers reflect expenses after reimbursement by the investment adviser but prior to reductions from brokerage service arrangements or other expense offset arrangements. Expenses net of all reductions represent the net expenses paid by the class.
See accompanying notes which are an integral part of the financial statements.
Annual Report
Financial Highlights - Class C
Years ended October 31, | 2007 | 2006 | 2005 | 2004 H |
Selected Per-Share Data | | | | |
Net asset value, beginning of period | $ 18.91 | $ 13.59 | $ 9.83 | $ 10.00 |
Income from Investment Operations | | | | |
Net investment income (loss) E | (.09) | (.04) | .02 | (.03) |
Net realized and unrealized gain (loss) | 13.21 | 5.39 | 3.73 | (.15) |
Total from investment operations | 13.12 | 5.35 | 3.75 | (.18) |
Distributions from net investment income | - | (.05) | - | - |
Redemption fees added to paid in capital E | .01 | .02 | .01 | .01 |
Net asset value, end of period | $ 32.04 | $ 18.91 | $ 13.59 | $ 9.83 |
Total Return B,C,D | 69.43% | 39.59% | 38.25% | (1.70)% |
Ratios to Average Net Assets F,I | | | | |
Expenses before reductions | 2.34% | 2.58% | 4.09% | 11.58% A |
Expenses net of fee waivers, if any | 2.34% | 2.35% | 2.39% | 2.75% A |
Expenses net of all reductions | 2.29% | 2.24% | 2.28% | 2.66% A |
Net investment income (loss) | (.39)% | (.24)% | .19% | (.47)% A |
Supplemental Data | | | | |
Net assets, end of period
(000 omitted) | $ 104,885 | $ 42,805 | $ 5,890 | $ 1,105 |
Portfolio turnover rate G | 48% | 48% | 54% | 101% A |
A Annualized
B Total returns for periods of less than one year are not annualized.
C Total returns would have been lower had certain expenses not been reduced during the periods shown.
D Total returns do not include the effect of the contingent deferred sales charge.
E Calculated based on average shares outstanding during the period.
F Fees and expenses of the underlying Fidelity Central Funds are not included in the Fund's expense ratio. The Fund indirectly bears its proportionate share of the expenses of any underlying Fidelity Central Funds.
G Amount does not include the portfolio activity of any underlying Fidelity Central Funds.
H For the period March 29, 2004 (commencement of operations) to October 31, 2004.
I Expense ratios reflect operating expenses of the class. Expenses before reductions do not reflect amounts reimbursed by the investment adviser or reductions from brokerage service arrangements or other expense offset arrangements and do not represent the amount paid by the class during periods when reimbursements or reductions occur. Expense ratios before reductions for start-up periods may not be representative of longer-term operating periods. Expenses net of fee waivers reflect expenses after reimbursement by the investment adviser but prior to reductions from brokerage service arrangements or other expense offset arrangements. Expenses net of all reductions represent the net expenses paid by the class.
See accompanying notes which are an integral part of the financial statements.
Annual Report
Financial Highlights - Institutional Class
Years ended October 31, | 2007 | 2006 | 2005 | 2004 G |
Selected Per-Share Data | | | | |
Net asset value, beginning of period | $ 19.34 | $ 13.80 | $ 9.89 | $ 10.00 |
Income from Investment Operations | | | | |
Net investment income (loss) D | .18 | .14 | .14 | .03 |
Net realized and unrealized gain (loss) | 13.55 | 5.49 | 3.76 | (.15) |
Total from investment operations | 13.73 | 5.63 | 3.90 | (.12) |
Distributions from net investment income | (.06) | (.11) | - | - |
Redemption fees added to paid in capital D | .01 | .02 | .01 | .01 |
Net asset value, end of period | $ 33.02 | $ 19.34 | $ 13.80 | $ 9.89 |
Total Return B,C | 71.23% | 41.11% | 39.53% | (1.10)% |
Ratios to Average Net Assets E,H | | | | |
Expenses before reductions | 1.25% | 1.47% | 3.05% | 10.37% A |
Expenses net of fee waivers, if any | 1.25% | 1.35% | 1.41% | 1.75% A |
Expenses net of all reductions | 1.19% | 1.24% | 1.30% | 1.66% A |
Net investment income (loss) | .71% | .75% | 1.17% | .53% A |
Supplemental Data | | | | |
Net assets, end of period
(000 omitted) | $ 52,011 | $ 9,172 | $ 1,610 | $ 529 |
Portfolio turnover rate F | 48% | 48% | 54% | 101% A |
A Annualized
B Total returns for periods of less than one year are not annualized.
C Total returns would have been lower had certain expenses not been reduced during the periods shown.
D Calculated based on average shares outstanding during the period.
E Fees and expenses of the underlying Fidelity Central Funds are not included in the Fund's expense ratio. The Fund indirectly bears its proportionate share of the expenses of any underlying Fidelity Central Funds.
F Amount does not include the portfolio activity of any underlying Fidelity Central Funds.
G For the period March 29, 2004 (commencement of operations) to October 31, 2004.
H Expense ratios reflect operating expenses of the class. Expenses before reductions do not reflect amounts reimbursed by the investment adviser or reductions from brokerage service arrangements or other expense offset arrangements and do not represent the amount paid by the class during periods when reimbursements or reductions occur. Expense ratios before reductions for start-up periods may not be representative of longer-term operating periods. Expenses net of fee waivers reflect expenses after reimbursement by the investment adviser but prior to reductions from brokerage service arrangements or other expense offset arrangements. Expenses net of all reductions represent the net expenses paid by the class.
See accompanying notes which are an integral part of the financial statements.
Annual Report
Notes to Financial Statements
For the period ended October 31, 2007
1. Organization.
Fidelity Advisor Emerging Markets Fund (the Fund) is a non-diversified fund of Fidelity Advisor Series VIII (the trust) and is authorized to issue an unlimited number of shares. The trust is registered under the Investment Company Act of 1940, as amended (the 1940 Act), as an open-end management investment company organized as a Massachusetts business trust. The Fund offers Class A, Class T, Class B, Class C and Institutional Class shares, each of which has equal rights as to assets and voting privileges. Each class has exclusive voting rights with respect to matters that affect that class. Class B shares will automatically convert to Class A shares after a holding period of seven years from the initial date of purchase. Investment income, realized and unrealized capital gains and losses, the common expenses of the Fund, and certain fund-level expense reductions, if any, are allocated on a pro rata basis to each class based on the relative net assets of each class to the total net assets of the Fund. Each class differs with respect to transfer agent and distribution and service plan fees incurred. Certain expense reductions also differ by class. The Fund's investments in emerging markets can be subject to social, economic, regulatory, and political uncertainties and can be extremely volatile.
2. Investments in Fidelity Central Funds.
The Fund may invest in Fidelity Central Funds, which are open-end investment companies available only to other investment companies and accounts managed by Fidelity Management & Research Company (FMR) and its affiliates. The Fund's Schedule of Investments lists each of the Fidelity Central Funds as an investment of the Fund, but does not include the underlying holdings of each Fidelity Central Fund. As an Investing Fund, the Fund indirectly bears its proportionate share of the expenses of the underlying Fidelity Central Funds.
The Money Market Central Funds seek preservation of capital and current income and are managed by Fidelity Investments Money Management, Inc. (FIMM), an affiliate of FMR.
A complete list of holdings for each Fidelity Central Fund is available upon request or at the SEC's web site at www.sec.gov. In addition, the financial statements of the Fidelity Central Funds, which are not covered by the Fund's Report of Independent Registered Public Accounting Firm, are available on the SEC's web site or upon request.
3. Significant Accounting Policies.
The financial statements have been prepared in conformity with accounting principles generally accepted in the United States of America, which require management to make certain estimates and assumptions at the date of the financial statements. The following summarizes the significant accounting policies of the Fund:
Annual Report
Notes to Financial Statements - continued
3. Significant Accounting Policies - continued
Security Valuation. Investments are valued and net asset value (NAV) per share is calculated (NAV calculation) as of the close of business of the New York Stock Exchange (NYSE), normally 4:00 p.m. Eastern time. Wherever possible, the Fund uses independent pricing services approved by the Board of Trustees to value its investments.
Equity securities, including restricted securities, for which market quotations are readily available, are valued at the last reported sale price or official closing price as reported by an independent pricing service on the primary market or exchange on which they are traded. In the event there were no sales during the day or closing prices are not available, securities are valued at the last quoted bid price. Debt securities, including restricted securities, for which quotations are readily available, are valued by independent pricing services or by dealers who make markets in such securities. Pricing services consider yield or price of bonds of comparable quality, coupon, maturity and type as well as dealer supplied prices. Investments in open-end mutual funds, including the Fidelity Central Funds, are valued at their closing net asset value each business day. Short-term securities with remaining maturities of sixty days or less for which quotations are not readily available are valued at amortized cost, which approximates value.
When current market prices or quotations are not readily available or do not accurately reflect fair value, valuations may be determined in accordance with procedures adopted by the Board of Trustees. For example, when developments occur between the close of a market and the close of the NYSE that may materially affect the value of some or all of the securities, or when trading in a security is halted, those securities may be fair valued. Factors used in the determination of fair value may include monitoring news to identify significant market or security specific events such as changes in the value of U.S. securities markets, reviewing developments in foreign markets and evaluating the performance of ADRs, futures contracts and exchange-traded funds. Because the Fund's utilization of fair value pricing depends on market activity, the frequency with which fair value pricing is used cannot be predicted and may be utilized to a significant extent. The value of securities used for NAV calculation under fair value pricing may differ from published prices for the same securities.
Foreign Currency. The Fund uses foreign currency contracts to facilitate transactions in foreign-denominated securities. Losses from these transactions may arise from changes in the value of the foreign currency or if the counterparties do not perform under the contracts' terms.
Foreign-denominated assets, including investment securities, and liabilities are translated into U.S. dollars at the exchange rate at period end. Purchases and sales of investment securities, income and dividends received and expenses denominated in foreign currencies are translated into U.S. dollars at the exchange rate in effect on the transaction date.
Annual Report
3. Significant Accounting Policies - continued
Foreign Currency - continued
The effects of exchange rate fluctuations on investments are included with the net realized and unrealized gain (loss) on investment securities. Other foreign currency transactions resulting in realized and unrealized gain (loss) are disclosed separately.
Investment Transactions and Income. For financial reporting purposes, the Fund's investment holdings and NAV include trades executed through the end of the last business day of the period. The NAV for processing shareholder transactions includes trades executed through the end of the prior business day. Gains and losses on securities sold are determined on the basis of identified cost. Dividend income is recorded on the ex-dividend date, except for certain dividends from foreign securities where theex-dividend date may have passed, which are recorded as soon as the Fund is informed of the ex-dividend date. Non-cash dividends included in dividend income, if any, are recorded at the fair market value of the securities received. Distributions received on securities that represent a return of capital or capital gain are recorded as a reduction of cost of investments and/or as a realized gain. The Fund estimates the components of distributions received that may be considered return of capital distributions or capital gain distributions. Interest income and distributions from the Fidelity Central Funds are accrued as earned. Interest income includes coupon interest and amortization of premium and accretion of discount on debt securities. Investment income is recorded net of foreign taxes withheld where recovery of such taxes is uncertain.
Expenses. Most expenses of the trust can be directly attributed to a fund. Expenses which cannot be directly attributed are apportioned among each Fund in the trust. Expense estimates are accrued in the period to which they relate and adjustments are made when actual amounts are known.
Income Tax Information and Distributions to Shareholders. Each year, the Fund intends to qualify as a regulated investment company by distributing all of its taxable income and realized gains under Subchapter M of the Internal Revenue Code. As a result, no provision for income taxes is required in the accompanying financial statements. Foreign taxes are provided for based on the Fund's understanding of the tax rules and rates that exist in the foreign markets in which it invests.
Distributions are recorded on the ex-dividend date. Income dividends and capital gain distributions are declared separately for each class. Income and capital gain distributions are determined in accordance with income tax regulations, which may differ from generally accepted accounting principles. In addition, the Fund will claim a portion of the payment made to redeeming shareholders as a distribution for income tax purposes.
Annual Report
Notes to Financial Statements - continued
3. Significant Accounting Policies - continued
Income Tax Information and Distributions to Shareholders - continued
Capital accounts within the financial statements are adjusted for permanent book-tax differences. These adjustments have no impact on net assets or the results of operations. Temporary book-tax differences will reverse in a subsequent period.
Book-tax differences are primarily due to foreign currency transactions, certain foreign taxes, passive foreign investment companies (PFIC), capital loss carryforwards and losses deferred due to wash sales.
The tax-basis components of distributable earnings and the federal tax cost as of period end were as follows:
Unrealized appreciation | $ 186,040,842 | |
Unrealized depreciation | (3,284,458) | |
Net unrealized appreciation (depreciation) | 182,756,384 | |
Undistributed ordinary income | 1,018,070 | |
Undistributed long-term capital gain | 12,313,925 | |
| | |
Cost for federal income tax purposes | $ 354,902,587 | |
The tax character of distributions paid was as follows:
| October 31, 2007 | October 31, 2006 |
Ordinary Income | $ 135,949 | $ 233,810 |
Short-Term Trading (Redemption) Fees. Shares held in the Fund less than 90 days are subject to a redemption fee equal to 1.50% of the proceeds of the redeemed shares. All redemption fees, including any estimated redemption fees paid by FMR, are retained by the Fund and accounted for as an addition to paid in capital.
New Accounting Pronouncements. In July 2006, Financial Accounting Standards Board Interpretation No. 48, Accounting for Uncertainty in Income Taxes - an interpretation of FASB Statement 109 (FIN 48), was issued and is effective on the last business day of the semiannual reporting period for fiscal years beginning after December 15, 2006. FIN 48 sets forth a threshold for financial statement recognition, measurement and disclosure of a tax position taken or expected to be taken on a tax return. Management has concluded that the adoption of FIN 48 will not result in a material impact on the Fund's net assets, results of operations and financial statement disclosures.
In addition, in September 2006, Statement of Financial Accounting Standards No. 157, Fair Value Measurements (SFAS 157), was issued and is effective for fiscal years beginning after November 15, 2007. SFAS 157 defines fair value, establishes a framework for measuring fair value and expands disclosures about fair value measurements. Management is currently evaluating the impact the adoption of SFAS 157 will have on the Fund's financial statement disclosures.
Annual Report
4. Operating Policies.
Repurchase Agreements. FMR has received an Exemptive Order from the Securities and Exchange Commission (the SEC) which permits the Fund and other affiliated entities of FMR to transfer uninvested cash balances into joint trading accounts which are then invested in repurchase agreements. The Fund may also invest directly with institutions in repurchase agreements. Repurchase agreements are collateralized by government or non-government securities. Upon settlement date, collateral is held in segregated accounts with custodian banks and may be obtained in the event of a default of the counterparty. The Fund monitors, on a daily basis, the value of the collateral to ensure it is at least equal to the principal amount of the repurchase agreement (including accrued interest). In the event of a default by the counterparty, realization of the collateral proceeds could be delayed, during which time the value of the collateral may decline.
Restricted Securities. The Fund may invest in securities that are subject to legal or contractual restrictions on resale. These securities generally may be resold in transactions exempt from registration or to the public if the securities are registered. Disposal of these securities may involve time-consuming negotiations and expense, and prompt sale at an acceptable price may be difficult. Information regarding restricted securities is included at the end of the Fund's Schedule of Investments.
5. Purchases and Sales of Investments.
Purchases and sales of securities, other than short-term securities, aggregated $310,092,721 and $138,126,917, respectively.
6. Fees and Other Transactions with Affiliates.
Management Fee. FMR and its affiliates provide the Fund with investment management related services for which the Fund pays a monthly management fee. The management fee is the sum of an individual fund fee rate that is based on an annual rate of .55% of the Fund's average net assets and a group fee rate that averaged ..26% during the period. The group fee rate is based upon the average net assets of all the mutual funds advised by FMR. The group fee rate decreases as assets under management increase and increases as assets under management decrease. For the period, the total annual management fee rate was .80% of the Fund's average net assets.
Annual Report
Notes to Financial Statements - continued
6. Fees and Other Transactions with Affiliates - continued
Distribution and Service Plan. In accordance with Rule 12b-1 of the 1940 Act, the Fund has adopted separate Distribution and Service Plans for each class of shares. Certain classes pay Fidelity Distributors Corporation (FDC), an affiliate of FMR, separate Distribution and Service Fees, each of which is based on an annual percentage of each class' average net assets. In addition, FDC may pay financial intermediaries for selling shares of the Fund and providing shareholder support services. For the period, the Distribution and Service Fee rates and the total amounts paid to and retained by FDC were as follows:
| Distribution
Fee | Service
Fee | Paid to
FDC | Retained
by FDC |
Class A | -% | .25% | $ 285,484 | $ 45,204 |
Class T | .25% | .25% | 338,336 | 8,780 |
Class B | .75% | .25% | 258,308 | 193,731 |
Class C | .75% | .25% | 625,994 | 253,879 |
| | | $ 1,508,122 | $ 501,594 |
Sales Load. FDC receives a front-end sales charge of up to 5.75% for selling Class A shares, and 3.50% for selling Class T shares, some of which is paid to financial intermediaries for selling shares of the Fund. FDC receives the proceeds of contingent deferred sales charges levied on Class A, Class T, Class B, and Class C redemptions. These charges depend on the holding period. The deferred sales charges range from 5% to 1% forClass B, 1% for Class C, 1.00% to .50% for certain purchases of Class A shares and .25% for certain purchases of Class T shares.
For the period, sales charge amounts retained by FDC were as follows:
| Retained
by FDC |
Class A | $ 199,157 |
Class T | 37,466 |
Class B* | 46,149 |
Class C* | 25,790 |
| $ 308,562 |
* When Class B and Class C shares are initially sold, FDC pays commissions from its own resources to financial intermediaries through which the sales are made.
Annual Report
6. Fees and Other Transactions with Affiliates - continued
Transfer Agent Fees. Fidelity Investments Institutional Operations Company, Inc. (FIIOC), an affiliate of FMR, is the transfer, dividend disbursing and shareholder servicing agent for each class of the Fund. FIIOC receives account fees and asset-based fees that vary according to the account size and type of account of the shareholders of the respective classes of the Fund. FIIOC pays for typesetting, printing and mailing of shareholder reports, except proxy statements. For the period, the total transfer agent fees paid by each class to FIIOC, were as follows:
| Amount | % of
Average
Net Assets |
Class A | $ 342,142 | .30 |
Class T | 210,942 | .31 |
Class B | 82,727 | .32 |
Class C | 187,331 | .30 |
Institutional Class | 40,700 | .21 |
| $ 863,842 | |
Accounting and Security Lending Fees. Fidelity Service Company, Inc. (FSC), an affiliate of FMR, maintains the Fund's accounting records. The accounting fee is based on the level of average net assets for the month. Under a separate contract, FSC administers the security lending program. The security lending fee is based on the number and duration of lending transactions.
Brokerage Commissions. The Fund placed a portion of its portfolio transactions with brokerage firms which are affiliates of the investment adviser. The commissions paid to these affiliated firms were $41 for the period.
7. Committed Line of Credit.
The Fund participates with other funds managed by FMR in a $4.2 billion credit facility (the "line of credit") to be utilized for temporary or emergency purposes to fund shareholder redemptions or for other short-term liquidity purposes. The Fund has agreed to pay commitment fees on its pro rata portion of the line of credit, which amounted to $538 and is reflected in Miscellaneous Expense on the Statement of Operations. During the period, there were no borrowings on this line of credit.
8. Security Lending.
The Fund lends portfolio securities from time to time in order to earn additional income. On the settlement date of the loan, the Fund receives collateral (in the form of U.S. Treasury obligations, letters of credit and/or cash) against the loaned securities and maintains collateral in an amount not less than 100% of the market value of the loaned securities during the period of the loan. The market value of the loaned securities is determined at the close of business of the Fund and any additional required collateral is
Annual Report
Notes to Financial Statements - continued
8. Security Lending - continued
delivered to the Fund on the next business day. If the borrower defaults on its obligation to return the securities loaned because of insolvency or other reasons, a fund could experience delays and costs in recovering the securities loaned or in gaining access to the collateral. Any cash collateral received is invested in the Fidelity Securities Lending Cash Central Fund. The value of loaned securities and cash collateral at period end are disclosed on the Fund's Statement of Assets and Liabilities. Security lending income represents the income earned on investing cash collateral, less fees and expenses associated with the loan, plus any premium payments that may be received on the loan of certain types of securities. Security lending income is presented in the Statement of Operations as a component of income from Fidelity Central Funds. Net income from lending portfolio securities during the period amounted to $22,006.
9. Expense Reductions.
FMR voluntarily agreed to reimburse each class to the extent annual operating expenses exceeded certain levels of average net assets as noted in the table below. Some expenses, for example interest expense, including commitment fees, are excluded from this reimbursement.
The following classes were in reimbursement during the period:
| Expense
Limitations | Reimbursement
from Adviser |
Class T | 1.85% | $ 7,631 |
Class B | 2.35% | 5,884 |
| | $ 13,515 |
Many of the brokers with whom FMR places trades on behalf of the Fund provided services to the Fund in addition to trade execution. These services included payments of certain expenses on behalf of the Fund totaling $160,943 for the period. In addition, through arrangements with each class' transfer agent, credits realized as a result of uninvested cash balances were used to reduce the Fund's expenses. During the period, credits reduced each class' transfer agent expense as noted in the table below.
| Transfer Agent
expense reduction | |
Institutional Class | $ 257 | |
10. Other.
The Fund's organizational documents provide former and current trustees and officers with a limited indemnification against liabilities arising in connection with the performance of their duties to the Fund. In the normal course of business, the Fund may also
Annual Report
10. Other - continued
enter into contracts that provide general indemnifications. The Fund's maximum exposure under these arrangements is unknown as this would be dependent on future claims that may be made against the Fund. The risk of material loss from such claims is considered remote.
In September 2006, FIIOC, the Fund's transfer agent, notified the Fund that the Fund's books and records did not reflect a conversion of certain Class B to Class A shares upon their conversion date. In March 2007, FIIOC converted the relevant Class B shares to Class A shares and recorded the conversion in the books and records of the Fund which did not result in a material impact to the Fund's reported net assets or results of operations in the accompanying financial statements. FIIOC has remediated affected shareholders and reimbursed the Fund for all related audit and legal expenses.
The United States Securities and Exchange Commission ("SEC") is conducting an investigation of FMR (covering the years 2002 to 2004) arising from gifts, gratuities and business entertainment provided by certain brokers to certain individuals who were employed on FMR's domestic equity trading desk during that period. FMR is in discussions with the SEC staff regarding the possible resolution of the matter, but as ofperiod-end no final resolution has been reached.
In December 2006, the Independent Trustees completed their own investigation of the matter with the assistance of independent counsel. The Independent Trustees and FMR agree that, despite the absence of proof that the Fidelity mutual funds experienced diminished execution quality as a result of the improper receipt of gifts and business entertainment, the conduct at issue was serious and is worthy of redress. Accordingly, the Independent Trustees have requested and FMR has agreed to pay $42 million to Fidelity mutual funds, plus interest to be determined at the time that payment is made. A method of allocating this payment among the funds has not yet been determined. The total payment to the Fund is not anticipated to have a material impact on the Fund's net assets. In addition, FMR reimbursed related legal expenses which are recorded in the accompanying Statement of Operations as an expense reduction.
11. Distributions to Shareholders.
Distributions to shareholders of each class were as follows:
Years ended October 31, | 2007 | 2006 |
From net investment income | | |
Class A | $ 107,461 | $ 108,159 |
Class T | - | 59,424 |
Class B | - | 22,167 |
Class C | - | 28,948 |
Institutional Class | 28,488 | 15,112 |
Total | $ 135,949 | $ 233,810 |
Annual Report
Notes to Financial Statements - continued
12. Share Transactions.
Transactions for each class of shares were as follows:
| Shares | Dollars |
Years ended October 31, | 2007 | 2006 | 2007 | 2006 |
Class A | | | | |
Shares sold | 4,642,561 | 3,827,132 | $ 115,951,246 | $ 68,553,729 |
Reinvestment of distributions | 4,531 | 5,651 | 93,931 | 88,424 |
Shares redeemed | (1,516,681) | (981,504) | (35,427,581) | (17,267,219) |
Net increase (decrease) | 3,130,411 | 2,851,279 | $ 80,617,596 | $ 51,374,934 |
Class T | | | | |
Shares sold | 2,453,317 | 2,192,291 | $ 60,760,054 | $ 39,024,862 |
Reinvestment of distributions | - | 3,478 | - | 54,093 |
Shares redeemed | (930,237) | (526,816) | (21,865,345) | (9,118,376) |
Net increase (decrease) | 1,523,080 | 1,668,953 | $ 38,894,709 | $ 29,960,579 |
Class B | | | | |
Shares sold | 569,930 | 896,679 | $ 13,827,872 | $ 15,771,361 |
Reinvestment of distributions | - | 1,275 | - | 20,054 |
Shares redeemed | (273,651) | (281,038) | (6,330,619) | (4,902,600) |
Net increase (decrease) | 296,279 | 616,916 | $ 7,497,253 | $ 10,888,815 |
Class C | | | | |
Shares sold | 1,627,896 | 2,286,049 | $ 39,785,213 | $ 40,697,157 |
Reinvestment of distributions | - | 1,544 | - | 24,240 |
Shares redeemed | (617,626) | (457,432) | (14,265,294) | (7,909,606) |
Net increase (decrease) | 1,010,270 | 1,830,161 | $ 25,519,919 | $ 32,811,791 |
Institutional Class | | | | |
Shares sold | 1,365,554 | 615,656 | $ 36,368,938 | $ 11,096,263 |
Reinvestment of distributions | 877 | 676 | 18,267 | 10,642 |
Shares redeemed | (265,597) | (258,689) | (6,257,132) | (4,506,722) |
Net increase (decrease) | 1,100,834 | 357,643 | $ 30,130,073 | $ 6,600,183 |
Annual Report
Report of Independent Registered Public Accounting Firm
To the Trustees of Fidelity Advisor Series VIII and Shareholders of Fidelity Advisor Emerging Markets Fund:
We have audited the accompanying statement of assets and liabilities of Fidelity Advisor Emerging Markets Fund (the Fund), a fund of Fidelity Advisor Series VIII, including the schedule of investments, as of October 31, 2007, and the related statement of operations for the year then ended, the statement of changes in net assets for each of the two years in the period then ended, and the financial highlights for each of the three years in the period then ended and the period March 29, 2004 (commencement of operations) to October 31, 2004. These financial statements and financial highlights are the responsibility of the Fund's management. Our responsibility is to express an opinion on these financial statements and financial highlights based on our audits.
We conducted our audits in accordance with standards of the Public Company Accounting Oversight Board (United States). Those standards require that we plan and perform the audit to obtain reasonable assurance about whether the financial statements and financial highlights are free of material misstatement. The Fund is not required to have, nor were we engaged to perform, an audit of its internal control over financial reporting. Our audits included consideration of internal control over financial reporting as a basis for designing audit procedures that are appropriate in the circumstances, but not for the purpose of expressing an opinion on the effectiveness of the Fund's internal control over financial reporting. Accordingly, we express no such opinion. An audit also includes examining, on a test basis, evidence supporting the amounts and disclosures in the financial statements, assessing the accounting principles used and significant estimates made by management, as well as evaluating the overall financial statement presentation. Our procedures included confirmation of securities owned as of October 31, 2007, by correspondence with the custodians and brokers; where replies were not received from brokers, we performed other auditing procedures. We believe that our audits provide a reasonable basis for our opinion.
In our opinion, the financial statements and financial highlights referred to above present fairly, in all material respects, the financial position of Fidelity Advisor Emerging Markets Fund as of October 31, 2007, the results of its operations for the year then ended, the changes in its net assets for each of the two years in the period then ended and its financial highlights for each of the three years in the period then ended and the period March 29, 2004 (commencement of operations) to October 31, 2004, in conformity with accounting principles generally accepted in the United States of America.
/s/ Deloitte & Touche LLP
DELOITTE & TOUCHE LLP
Boston, Massachusetts
December 21, 2007
Annual Report
Trustees and Officers
The Trustees, Members of the Advisory Board, and executive officers of the trust and fund, as applicable, are listed below. The Board of Trustees governs the fund and is responsible for protecting the interests of shareholders. The Trustees are experienced executives who meet periodically throughout the year to oversee the fund's activities, review contractual arrangements with companies that provide services to the fund, and review the fund's performance. Except for James C. Curvey, each of the Trustees oversees 370 funds advised by FMR or an affiliate. Mr. Curvey oversees 340 funds advised by FMR or an affiliate.
The Trustees hold office without limit in time except that (a) any Trustee may resign; (b) any Trustee may be removed by written instrument, signed by at least two-thirds of the number of Trustees prior to such removal; (c) any Trustee who requests to be retired or who has become incapacitated by illness or injury may be retired by written instrument signed by a majority of the other Trustees; and (d) any Trustee may be removed at any special meeting of shareholders by a two-thirds vote of the outstanding voting securities of the trust. Each Trustee who is not an interested person (as defined in the 1940 Act) (Independent Trustee), shall retire not later than the last day of the calendar year in which his or her 72nd birthday occurs. The Independent Trustees may waive this mandatory retirement age policy with respect to individual Trustees. The executive officers and Advisory Board Members hold office without limit in time, except that any officer and Advisory Board Member may resign or may be removed by a vote of a majority of the Trustees at any regular meeting or any special meeting of the Trustees. Except as indicated, each individual has held the office shown or other offices in the same company for the past five years.
The fund's Statement of Additional Information (SAI) includes more information about the Trustees. To request a free copy, call Fidelity at 1-877-208-0098.
Interested Trustees*:
Correspondence intended for each Trustee who is an interested person may be sent to Fidelity Investments, 82 Devonshire Street, Boston, Massachusetts 02109.
Name, Age; Principal Occupation |
Edward C. Johnson 3d (77) |
| Year of Election or Appointment: 1983 Mr. Johnson is Chairman of the Board of Trustees. Mr. Johnson serves as President (2006-present), Chief Executive Officer, Chairman, and a Director of FMR LLC; Chairman and a Director of FMR; Chairman and a Director of Fidelity Research & Analysis Company (FRAC); Chairman and a Director of Fidelity Investments Money Management, Inc.; and Chairman (2001-present) and a Director of FMR Co., Inc. In addition, Mr. Johnson serves as Chairman and Director of Fidelity International Limited (FIL). |
James C. Curvey (72) |
| Year of Election or Appointment: 2007 Mr. Curvey also serves as Trustee (2007-present) or Member of the Advisory Board (2007-present) of other investment companies advised by FMR. Mr. Curvey is a Director of FMR and FMR Co., Inc. (2007-present). Mr. Curvey is also Vice Chairman (2006-present) and Director of FMR LLC. Mr. Curvey joined Fidelity in 1982 and served in numerous senior management positions, including President and Chief Operating Officer of FMR LLC (1997-2000) and President of Fidelity Strategic Investments (2000-2002). In addition, he serves as a member of the Board of Directors of Geerlings & Wade, Inc. (wine distribution). |
* Trustees have been determined to be "Interested Trustees" by virtue of, among other things, their affiliation with the trust or various entities under common control with FMR. FMR Corp. merged with FMR LLC on October 1, 2007. Any references to FMR LLC for prior periods are deemed to be references to the prior entity.
Independent Trustees:
Correspondence intended for each Independent Trustee (that is, the Trustees other than the Interested Trustees) may be sent to Fidelity Investments, P.O. Box 55235, Boston, Massachusetts 02205-5235.
Name, Age; Principal Occupation |
Dennis J. Dirks (59) |
| Year of Election or Appointment: 2005 Prior to his retirement in May 2003, Mr. Dirks was Chief Operating Officer and a member of the Board of The Depository Trust & Clearing Corporation (DTCC) (1999-2003). He also served as President, Chief Operating Officer, and Board member of The Depository Trust Company (DTC) (1999-2003) and President and Board member of the National Securities Clearing Corporation (NSCC) (1999-2003). In addition, Mr. Dirks served as Chief Executive Officer and Board member of the Government Securities Clearing Corporation (2001-2003) and Chief Executive Officer and Board member of the Mortgage-Backed Securities Clearing Corporation (2001-2003). Mr. Dirks also serves as a Trustee and a member of the Finance Committee of Manhattan College (2005-present) and a Trustee and a member of the Finance Committee of AHRC of Nassau County (2006-present). |
Albert R. Gamper, Jr. (65) |
| Year of Election or Appointment: 2006 Prior to his retirement in December 2004, Mr. Gamper served as Chairman of the Board of CIT Group Inc. (commercial finance). During his tenure with CIT Group Inc. Mr. Gamper served in numerous senior management positions, including Chairman (1987-1989; 1999-2001; 2002-2004), Chief Executive Officer (1987-2004), and President (1989-2002). He currently serves as a member of the Board of Directors of Public Service Enterprise Group (utilities, 2001-present), Chairman of the Board of Governors, Rutgers University (2004-present), and Chairman of the Board of Saint Barnabas Health Care System. |
George H. Heilmeier (71) |
| Year of Election or Appointment: 2004 Dr. Heilmeier is Chairman Emeritus of Telcordia Technologies (communication software and systems), where prior to his retirement, he served as company Chairman and Chief Executive Officer. He currently serves on the Boards of Directors of The Mitre Corporation (systems engineering and information technology support for the government), and HRL Laboratories (private research and development, 2004-present). He is Chairman of the General Motors Science & Technology Advisory Board and a Life Fellow of the Institute of Electrical and Electronics Engineers (IEEE). Dr. Heilmeier is a member of the Defense Science Board and the National Security Agency Advisory Board. He is also a member of the National Academy of Engineering, the American Academy of Arts and Sciences, and the Board of Overseers of the School of Engineering and Applied Science of the University of Pennsylvania. Previously, Dr. Heilmeier served as a Director of TRW Inc. (automotive, space, defense, and information technology, 1992-2002), Compaq (1994-2002), Automatic Data Processing, Inc. (ADP) (technology-based business outsourcing, 1995-2002), INET Technologies Inc. (telecommunications network surveillance, 2001-2004), and Teletech Holdings (customer management services). He is the recipient of the 2005 Kyoto Prize in Advanced Technology for his invention of the liquid crystal display, and a member of the Consumer Electronics Hall of Fame. |
James H. Keyes (67) |
| Year of Election or Appointment: 2007 Prior to his retirement in 2003, Mr. Keyes was Chairman, President, and Chief Executive Officer of Johnson Controls, Inc. (automotive supplier, 1993-2003). He currently serves as a member of the boards of LSI Logic Corporation (semiconductor technologies), Navistar International Corporation (manufacture and sale of trucks, buses, and diesel engines, 2002-present), and Pitney Bowes, Inc. (integrated mail, messaging, and document management solutions). |
Marie L. Knowles (61) |
| Year of Election or Appointment: 2001 Prior to Ms. Knowles' retirement in June 2000, she served as Executive Vice President and Chief Financial Officer of Atlantic Richfield Company (ARCO) (diversified energy, 1996-2000). From 1993 to 1996, she was a Senior Vice President of ARCO and President of ARCO Transportation Company. She served as a Director of ARCO from 1996 to 1998. She currently serves as a Director of Phelps Dodge Corporation (copper mining and manufacturing) and McKesson Corporation (healthcare service, 2002-present). Ms. Knowles is a Trustee of the Brookings Institution and the Catalina Island Conservancy and also serves as a member of the Advisory Board for the School of Engineering of the University of Southern California. |
Ned C. Lautenbach (63) |
| Year of Election or Appointment: 2000 Mr. Lautenbach is Chairman of the Independent Trustees (2006-present). Mr. Lautenbach has been a partner of Clayton, Dubilier & Rice, Inc. (private equity investment firm) since September 1998. Previously, Mr. Lautenbach was with the International Business Machines Corporation (IBM) from 1968 until his retirement in 1998. Mr. Lautenbach serves as a Director of Sony Corporation (2006-present) and Eaton Corporation (diversified industrial) as well as the Philharmonic Center for the Arts in Naples, Florida. He also is a member of the Board of Trustees of Fairfield University (2005-present), as well as a member of the Council on Foreign Relations. |
Cornelia M. Small (63) |
| Year of Election or Appointment: 2005 Ms. Small is a member (2000-present) and Chairperson (2002-present) of the Investment Committee, and a member (2002-present) of the Board of Trustees of Smith College. Previously, she served as Chief Investment Officer (1999-2000), Director of Global Equity Investments (1996-1999), and a member of the Board of Directors of Scudder, Stevens & Clark (1990-1997) and Scudder Kemper Investments (1997-1999). In addition, Ms. Small served as Co-Chair (2000-2003) of the Annual Fund for the Fletcher School of Law and Diplomacy. |
William S. Stavropoulos (68) |
| Year of Election or Appointment: 2001 Mr. Stavropoulos is Chairman Emeritus of the Board of Directors of The Dow Chemical Company. Since joining The Dow Chemical Company in 1967, Mr. Stavropoulos served in numerous senior management positions, including President (1993-2000; 2002-2003), CEO (1995-2000; 2002-2004), and Chairman of the Executive Committee (2000-2004). Currently, he is a Director of NCR Corporation (data warehousing and technology solutions), Chemical Financial Corporation, Maersk Inc. (industrial conglomerate, 2002-present), Tyco International, Inc. (multinational manufacturing and services, 2007-present), and a member of the Advisory Board for Metalmark Capital (private equity investment firm, 2005-present). He is a special advisor to Clayton, Dubilier & Rice, Inc., a private equity investment firm. He also serves as a member of the Board of Trustees of the American Enterprise Institute for Public Policy Research. In addition, Mr. Stavropoulos is a member of The Business Council, J.P. Morgan International Council and the University of Notre Dame Advisory Council for the College of Science. |
Kenneth L. Wolfe (68) |
| Year of Election or Appointment: 2005 Prior to his retirement in 2001, Mr. Wolfe was Chairman and Chief Executive Officer of Hershey Foods Corporation (1993-2001). He currently serves as a member of the boards of Adelphia Communications Corporation (2003-present), Bausch & Lomb, Inc., and Revlon Inc. (2004-present). |
Advisory Board Members and Executive Officers**:
Correspondence intended for Mr. Mauriello, Mr. Thomas, and Mr. Wiley may be sent to Fidelity Investments, P.O. Box 55235, Boston, Massachusetts 02205-5235. Correspondence intended for each executive officer and Mr. Lynch may be sent to Fidelity Investments, 82 Devonshire Street, Boston, Massachusetts 02109.
Name, Age; Principal Occupation |
Peter S. Lynch (63) |
| Year of Election or Appointment: 2003 Member of the Advisory Board of Fidelity Advisor Series VIII. Mr. Lynch is Vice Chairman and a Director of FMR, and Vice Chairman (2001-present) and a Director of FMR Co., Inc. Previously, Mr. Lynch served as a Trustee of the Fidelity funds (1990-2003). In addition, he serves as a Trustee of Boston College and as the Chairman of the Inner-City Scholarship Fund. |
Joseph Mauriello (63) |
| Year of Election or Appointment: 2007 Member of the Advisory Board of Fidelity Advisor Series VIII. Prior to his retirement in January 2006, Mr. Mauriello served in numerous senior management positions including Deputy Chairman and Chief Operating Officer (2004-2005), and Vice Chairman of Financial Services (2002-2004) of KPMG LLP US (professional services firm, 1965-2005). Mr. Mauriello currently serves as a member of the Board of Directors of XL Capital Ltd., (global insurance and re-insurance company, 2006-present) and of Arcadia Resources Inc., (health care services and products, 2007-present). He also served as a Director of the Hamilton Funds of the Bank of New York (2006-2007). |
David M. Thomas (58) |
| Year of Election or Appointment: 2007 Member of the Advisory Board of Fidelity Advisor Series VIII. Previously, Mr. Thomas served as Executive Chairman (2005-2006) and Chairman and Chief Executive Officer (2000-2005) of IMS Health, Inc. (pharmaceutical and healthcare information solutions). In addition, Mr. Thomas serves as a member of the Board of Directors of Fortune Brands, Inc. (consumer products holding company), and Interpublic Group of Companies, Inc. (marketing communication, 2004-present). |
Michael E. Wiley (57) |
| Year of Election or Appointment: 2007 Member of the Advisory Board of Fidelity Advisor Series VIII. Mr. Wiley also serves as Sr. Energy Advisor of Katzenbach Partners, LLC (consulting firm, 2006-present) and a member of the Board of Trustees of the University of Tulsa (2000-2006; 2007-present). He serves as a Director of Tesoro Corporation (independent oil refiner and marketer, 2005-present), and a Director of Bill Barrett Corporation (exploration and production company, 2005-present). In addition, he also serves as a Director of Post Oak Bank (privately-held bank, 2004-present), and an Advisory Director of Riverstone Holdings (private investment firm). Previously, Mr. Wiley served as Chairman, President, and CEO of Baker Hughes, Inc. (oilfield services company, 2000-2004), and as Director of Spinnaker Exploration Company (exploration and production company, 2001-2005). |
Kimberley H. Monasterio (43) |
| Year of Election or Appointment: 2007 President and Treasurer of Advisor Emerging Markets. Ms. Monasterio also serves as President and Treasurer of other Fidelity funds (2007-present) and is an employee of FMR (2004-present). Previously, Ms. Monasterio served as Deputy Treasurer of the Fidelity funds (2004-2006). Before joining Fidelity Investments, Ms. Monasterio served as Treasurer (2000-2004) and Chief Financial Officer (2002-2004) of the Franklin Templeton Funds and Senior Vice President of Franklin Templeton Services, LLC (2000-2004). |
Walter C. Donovan (45) |
| Year of Election or Appointment: 2007 Vice President of Advisor Emerging Markets. Mr. Donovan also serves as Vice President of Fidelity's Equity Funds (2007-present). Mr. Donovan also serves as Executive Vice President of FMR (2005-present) and FMR Co., Inc. (2005-present). Previously, Mr. Donovan served as Vice President of Fidelity's High Income Funds (2005-2007), Fixed-Income Funds (2005-2006), certain Asset Allocation Funds (2005-2006), certain Balanced Funds (2005-2006), and as Vice President and Director of Fidelity's International Equity Trading group (1998-2005). |
Eric M. Wetlaufer (45) |
| Year of Election or Appointment: 2006 Vice President of Advisor Emerging Markets. Mr. Wetlaufer also serves as Vice President of certain International Equity Funds (2006-present). Mr. Wetlaufer is Senior Vice President of FMR (2006-present) and FMR Co., Inc. (2006-present), and President and Director of Fidelity Management & Research (U.K.) Inc. (2006-present) and Fidelity Research & Analysis Company (2006-present). Before joining Fidelity Investments in 2005, Mr. Wetlaufer was a partner in Oxhead Capital Management (2004-2005). Previously, Mr. Wetlaufer served as a Chief Investment Officer of Putnam Investments (1997-2003). |
Eric D. Roiter (58) |
| Year of Election or Appointment: 1998 Secretary of Advisor Emerging Markets. He also serves as Secretary of other Fidelity funds; Vice President, General Counsel, and Secretary of FMR Co., Inc. (2001-present) and FMR; Assistant Secretary of Fidelity Management & Research (U.K.) Inc. (2001-present), Fidelity Research & Analysis Company (2001-present), and Fidelity Investments Money Management, Inc. (2001-present). Mr. Roiter is an Adjunct Member, Faculty of Law, at Boston College Law School (2003-present). Previously, Mr. Roiter served as Vice President and Secretary of Fidelity Distributors Corporation (FDC) (1998-2005). |
Scott C. Goebel (39) |
| Year of Election or Appointment: 2007 Assistant Secretary of Advisor Emerging Markets. Mr. Goebel also serves as Assistant Secretary of other Fidelity funds (2007-present), and is an employee of FMR. |
R. Stephen Ganis (41) |
| Year of Election or Appointment: 2006 Anti-Money Laundering (AML) officer of Advisor Emerging Markets. Mr. Ganis also serves as AML officer of other Fidelity funds (2006-present) and FMR LLC (2003-present). Before joining Fidelity Investments, Mr. Ganis practiced law at Goodwin Procter, LLP (2000-2002). |
Joseph B. Hollis (59) |
| Year of Election or Appointment: 2006 Chief Financial Officer of Advisor Emerging Markets. Mr. Hollis also serves as Chief Financial Officer of other Fidelity funds. Mr. Hollis is President of Fidelity Pricing and Cash Management Services (FPCMS) (2005-present). Mr. Hollis also serves as President and Director of Fidelity Service Company, Inc. (2006-present). Previously, Mr. Hollis served as Senior Vice President of Cash Management Services (1999-2002) and Investment Management Operations (2002-2005). |
Kenneth A. Rathgeber (60) |
| Year of Election or Appointment: 2004 Chief Compliance Officer of Advisor Emerging Markets. Mr. Rathgeber also serves as Chief Compliance Officer of other Fidelity funds (2004-present) and Executive Vice President of Risk Oversight for Fidelity Investments (2002-present). He is Chief Compliance Officer of FMR (2005-present), FMR Co., Inc. (2005-present), Fidelity Management & Research (U.K.) Inc. (2005-present), Fidelity Research & Analysis Company (2005-present), Fidelity Investments Money Management, Inc. (2005-present), and Strategic Advisers, Inc. (2005-present). Previously, Mr. Rathgeber served as Executive Vice President and Chief Operating Officer for Fidelity Investments Institutional Services Company, Inc. (1998-2002). |
Bryan A. Mehrmann (46) |
| Year of Election or Appointment: 2005 Deputy Treasurer of Advisor Emerging Markets. Mr. Mehrmann also serves as Deputy Treasurer of other Fidelity funds (2005-present) and is an employee of FMR. Previously, Mr. Mehrmann served as Vice President of Fidelity Investments Institutional Services Group (FIIS)/Fidelity Investments Institutional Operations Corporation, Inc. (FIIOC) Client Services (1998-2004). |
Kenneth B. Robins (38) |
| Year of Election or Appointment: 2005 Deputy Treasurer of Advisor Emerging Markets. Mr. Robins also serves as Deputy Treasurer of other Fidelity funds (2005-present) and is an employee of FMR (2004-present). Before joining Fidelity Investments, Mr. Robins worked at KPMG LLP, where he was a partner in KPMG's department of professional practice (2002-2004) and a Senior Manager (1999-2000). In addition, Mr. Robins served as Assistant Chief Accountant, United States Securities and Exchange Commission (2000-2002). |
Robert G. Byrnes (40) |
| Year of Election or Appointment: 2005 Assistant Treasurer of Advisor Emerging Markets. Mr. Byrnes also serves as Assistant Treasurer of other Fidelity funds (2005-present) and is an employee of FMR (2005-present). Previously, Mr. Byrnes served as Vice President of FPCMS (2003-2005). Before joining Fidelity Investments, Mr. Byrnes worked at Deutsche Asset Management where he served as Vice President of the Investment Operations Group (2000-2003). |
Peter L. Lydecker (53) |
| Year of Election or Appointment: 2004 Assistant Treasurer of Advisor Emerging Markets. Mr. Lydecker also serves as Assistant Treasurer of other Fidelity funds (2004) and is an employee of FMR. |
Paul M. Murphy (60) |
| Year of Election or Appointment: 2007 Assistant Treasurer of Advisor Emerging Markets. Mr. Murphy also serves as Assistant Treasurer of other Fidelity funds (2007-present) and is an employee of FMR (2007-present). Previously, Mr. Murphy served as Chief Financial Officer of the Fidelity Funds (2005-2006), Vice President and Associate General Counsel of FMR (2007), and Senior Vice President of Fidelity Pricing and Cash Management Services Group (FPCMS) (1994-2007). |
Gary W. Ryan (49) |
| Year of Election or Appointment: 2005 Assistant Treasurer of Advisor Emerging Markets. Mr. Ryan also serves as Assistant Treasurer of other Fidelity funds (2005-present) and is an employee of FMR (2005-present). Previously, Mr. Ryan served as Vice President of Fund Reporting in FPCMS (1999-2005). |
** FMR Corp. merged with FMR LLC on October 1, 2007. Any references to FMR LLC for prior periods are deemed to be references to the prior entity.
Annual Report
Distributions
The Board of Trustees of Advisor Emerging Markets Fund voted to pay to shareholders of record at the opening of business on record date, the following distributions per share derived from capital gains realized from sales of portfolio securities, and dividends derived from net investment income:
| Pay Date | Record Date | Dividends | Capital Gains |
Institutional Class | 12/10/07 | 12/07/07 | $0.090 | $0.785 |
The fund hereby designates as a capital gain dividend with respect to the taxable year ended October 31, 2007 $12,313,925, or, if subsequently determined to be different, the net capital gain of such year.
Institutional Class designates 100% of the dividends distributed during the fiscal year as amounts which may be taken into account as a dividend for purposes of the maximum rate under section 1(h)(11) of the Internal Revenue Code.
The amounts per share which represent income derived from sources within, and taxes paid to, foreign countries or possessions of the United States are as follows:
| Pay Date | Income | Taxes |
Institutional Class | 12/11/06 | $0.117 | $0.056 |
The fund will notify shareholders in January 2008 of amounts for use in preparing 2007 income tax returns.
Annual Report
Board Approval of Investment Advisory Contracts and Management Fees
Advisor Emerging Markets Fund
Each year, typically in July, the Board of Trustees, including the Independent Trustees (together, the Board), votes on the renewal of the management contract and sub-advisory agreements (together, the Advisory Contracts) for the fund. The Board, assisted by the advice of fund counsel and Independent Trustees' counsel, requests and considers a broad range of information throughout the year.
The Board meets regularly each month except August and takes into account throughout the year matters bearing on Advisory Contracts. The Board, acting directly and through its separate committees, considers at each of its meetings factors that are relevant to the annual renewal of the fund's Advisory Contracts, including the services and support provided to the fund and its shareholders. At the time of the renewal, the Board had 12 standing committees, each composed of Independent Trustees with varying backgrounds, to which the Board has assigned specific subject matter responsibilities in order to enhance effective decision-making by the Board. Each committee has adopted a written charter outlining the structure and purposes of the committee. One such committee, the Equity Contract Committee, meets periodically as needed throughout the year to consider matters specifically related to the annual renewal of Advisory Contracts. The committee requests and receives information on, and makes recommendations to the Independent Trustees concerning, the approval and annual review of the Advisory Contracts.
At its July 2007 meeting, the Board of Trustees, including the Independent Trustees, unanimously determined to renew the Advisory Contracts for the fund. In reaching its determination, the Board considered all factors it believed relevant, including (i) the nature, extent, and quality of the services to be provided to the fund and its shareholders (including the investment performance of the fund); (ii) the competitiveness of the management fee and total expenses of the fund; (iii) the total costs of the services to be provided by and the profits to be realized by the investment adviser and its affiliates from the relationship with the fund; (iv) the extent to which economies of scale would be realized as the fund grows; and (v) whether fee levels reflect these economies of scale, if any, for the benefit of fund shareholders. The Board also approved amendments to the fund's agreements with foreign sub-advisers to clarify that each sub-adviser provides services as an independent contractor.
In determining whether to renew the Advisory Contracts for the fund, the Board ultimately reached a determination, with the assistance of fund counsel and Independent Trustees' counsel, that the renewal of the Advisory Contracts and the compensation to be received by Fidelity under the management contract is consistent with Fidelity's fiduciary duty under applicable law. In addition to evaluating the specific factors noted above, the Board, in reaching its determination, is aware that shareholders in the fund have a broad range of investment choices available to them, including a wide choice among mutual funds offered by competitors to Fidelity, and that the fund's shareholders, with the opportunity to review and weigh the disclosure provided by the fund in its prospectus and other public disclosures, have chosen to invest in this fund, managed by Fidelity.
Annual Report
Board Approval of Investment Advisory Contracts and
Management Fees - continued
Nature, Extent, and Quality of Services Provided. The Board considered staffing within the investment adviser, FMR, and the sub-advisers (together, the Investment Advisers), including the background of the fund's portfolio manager and the fund's investment objective and discipline. The Independent Trustees also had discussions with senior management of Fidelity's investment operations and investment groups. The Board considered the structure of the portfolio manager compensation program and whether this structure provides appropriate incentives.
Resources Dedicated to Investment Management and Support Services. The Board reviewed the size, education, and experience of the Investment Advisers' investment staff, their use of technology, and the Investment Advisers' approach to recruiting, training, and retaining portfolio managers and other research, advisory, and management personnel. The Board considered Fidelity's extensive global research capabilities that enable the Investment Advisers to aggregate data from various sources in an effort to produce positive investment results. The Board noted that Fidelity's analysts have access to a variety of technological tools that enable them to perform both fundamental and quantitative analysis and to specialize in various disciplines. The Board also considered that Fidelity's portfolio managers and analysts have access to daily portfolio attribution that allows for monitoring of a fund's portfolio, as well as an electronic communication system that provides immediate real-time access to research concerning issuers and credit enhancers.
Shareholder and Administrative Services. The Board considered (i) the nature, extent, quality, and cost of advisory, administrative, distribution, and shareholder services performed by the Investment Advisers and their affiliates under the Advisory Contracts and under separate agreements covering transfer agency, pricing and bookkeeping, and securities lending services for the fund; (ii) the nature and extent of the Investment Advisers' supervision of third party service providers, principally custodians and subcustodians; and (iii) the resources devoted to, and the record of compliance with, the fund's compliance policies and procedures. The Board reviewed the allocation of fund brokerage, including allocations to brokers affiliated with the Investment Advisers, the use of brokerage commissions to pay fund expenses, and the use of "soft" commission dollars to pay for research services. The Board also considered that Fidelity voluntarily pays for market data out of its own resources. The Board also considered the agreement reached between the Independent Trustees and Fidelity in December 2006 following an independent review of matters relating to receipt of travel, entertainment, gifts and gratuities in violation of Fidelity policies.
Annual Report
The Board noted that the growth of fund assets across the complex allows Fidelity to reinvest in the development of services designed to enhance the value or convenience of the Fidelity funds as investment vehicles. These services include 24-hour access to account information and market information through phone representatives and over the Internet, and investor education materials and asset allocation tools.
Investment in a Large Fund Family. The Board considered the benefits to shareholders of investing in a Fidelity fund, including the benefits of investing in a fund that is part of a large family of funds offering a variety of investment disciplines and providing for a large variety of mutual fund investor services. For example, fund shareholders are offered the privilege of exchanging shares of the fund for shares of other Fidelity funds, as set forth in the fund's prospectus, without paying a sales charge. The Board noted that, since the last Advisory Contract renewals in July 2006, Fidelity has taken a number of actions that benefited particular funds, including (i) dedicating additional resources to investment research and to restructure the investment research teams; (ii) contractually agreeing to reduce the management fee on Fidelity Advisor Floating Rate High Income Fund; (iii) contractually agreeing to reduce the management fees on Fidelity's California, Massachusetts, New Jersey, and New York AMT Tax-Free Money Market Funds, launching new Institutional Classes and Service Classes of these funds, and contractually agreeing to impose expense limitations on these funds; (iv) eliminating the exchange fee on the Fidelity Select Portfolios and reducing the pricing and bookkeeping fee rates for these funds; (v) reducing the maximum transfer agency fee rates on high income funds and certain equity funds; (vi) proposing amended management contracts that, if approved by shareholders, will add a performance adjustment component to the management fees paid by 18 Fidelity Advisor equity funds; (vii) contractually agreeing to reduce fees for Ultra-Short Central Fund and the money market Central Funds; (viii) waiving the Fidelity Advisor funds' contingent deferred sales charge on certain redemptions made through systematic withdrawal programs; and (ix) amending the management contracts for equity and fixed-income funds whose management contracts incorporate a "group fee" structure by adding four new fee "breakpoints" to the group fee rate schedules.
Investment Performance and Compliance. The Board considered whether the fund has operated within its investment objective, as well as its record of compliance with its investment restrictions. It also reviewed the fund's absolute investment performance for each class, as well as the fund's relative investment performance for each class measured against (i) a broad-based securities market index, and (ii) a peer group of mutual funds deemed appropriate by the Board. Because the fund had been in existence less than three calendar years, the following chart considered by the Board shows, for the one-year period ended December 31, 2006, the total returns of Institutional Class (Class I) and Class C of the fund, the total return of a broad-based securities market index ("benchmark"), and a range of total returns of a peer group of mutual funds identified by Morningstar, Inc. as having an investment style similar to that of the fund based on underlying portfolio holdings. The returns of Institutional Class (Class I) and Class C show the performance of the highest and lowest performing classes, respectively. The box within the chart shows the 25th percentile return (bottom of box) and the 75th percentile return (top of box) of the peer group. Returns shown above the box are in the first quartile and returns shown below the box are in the fourth quartile. The percentage beaten numbers noted below the chart correspond to the percentile box and represent the percentage of funds in the peer group whose performance was equal to or lower than that of the class indicated.
Annual Report
Board Approval of Investment Advisory Contracts and
Management Fees - continued
Advisor Emerging Markets Fund

The Board reviewed the fund's relative investment performance against its peer group and stated that the performance of Institutional Class (Class I) of the fund was in the second quartile for the period shown. The Board also stated that the investment performance of Institutional Class (Class I) of the fund compared favorably to its benchmark for the period shown. The Board considered that the variations in performance among the fund's classes reflect the variations in class expenses, which result in lower performance for higher expense classes. The Board stated that it is difficult to evaluate in any comprehensive fashion the performance of the fund, in light of its relatively recent commencement of operations.
The Board considered that FMR has taken steps to refocus and strengthen equity research, equity portfolio management, and compliance.
Based on its review, and giving particular weight to the nature and quality of the resources dedicated by the Investment Advisers to maintain and improve relative performance, the Board concluded that the nature, extent, and quality of the services provided to the fund will benefit the fund's shareholders, particularly in light of the Board's view that the fund's shareholders benefit from investing in a fund that is part of a large family of funds offering a variety of investment disciplines and services.
Annual Report
Competitiveness of Management Fee and Total Fund Expenses. The Board considered the fund's management fee and total expenses compared to "mapped groups" of competitive funds and classes. Fidelity creates "mapped groups" by combining similar Lipper investment objective categories that have comparable management fee characteristics. Combining Lipper investment objective categories aids the Board's management fee and total expense comparisons by broadening the competitive group used for comparison and by reducing the number of universes to which various Fidelity funds are compared. The Board also considered supplemental information about how the fund's management fee and total expenses ranked relative to groups based on Lipper classifications, which take into account a fund's market capitalization and style.
The Board considered two proprietary management fee comparisons for the 12-month (or shorter) periods shown in the chart below. The group of Lipper funds used by the Board for management fee comparisons is referred to below as the "Total Mapped Group." The Total Mapped Group comparison focuses on a fund's standing relative to the total universe of comparable funds available to investors, in terms of gross management fees before expense reimbursements or caps. "TMG %" represents the percentage of funds in the Total Mapped Group that had management fees that were lower than the fund's. For example, a TMG % of 15% means that 85% of the funds in the Total Mapped Group had higher management fees than the fund. The "Asset-Size Peer Group" (ASPG) comparison focuses on a fund's standing relative to non-Fidelity funds similar in size to the fund within the Total Mapped Group. The ASPG represents at least 15% of the funds in the Total Mapped Group with comparable asset size and management fee characteristics, subject to a minimum of 50 funds (or all funds in the Total Mapped Group if fewer than 50). Additional information, such as the ASPG quartile in which the fund's management fee ranked, is also included in the chart and considered by the Board.
Annual Report
Board Approval of Investment Advisory Contracts and
Management Fees - continued
Advisor Emerging Markets Fund

The Board noted that the fund's management fee ranked below the median of its Total Mapped Group and below the median of its ASPG for 2006.
Based on its review, the Board concluded that the fund's management fee was fair and reasonable in light of the services that the fund receives and the other factors considered.
In its review of each class's total expenses, the Board considered the fund's management fee as well as other fund or class expenses, as applicable, such as transfer agent fees, pricing and bookkeeping fees, fund-paid 12b-1 fees, and custodial, legal, and audit fees. The Board also noted the effects of any waivers and reimbursements on fees and expenses. As part of its review, the Board also considered current and historical total expenses of each class of the fund compared to competitive fund median expenses. Each class of the fund is compared to those funds and classes in the Total Mapped Group (used by the Board for management fee comparisons) that have a similar sales load structure.
The Board noted that the total expenses of each of Class A, Class B, Class C and Institutional Class ranked below its competitive median for 2006, and the total expenses of Class T ranked above its competitive median for 2006. The Board noted that the fund offers multiple classes, each of which has a different sales load and 12b-1 fee structure, and that the multiple structures are intended to offer a range of pricing options for the intermediary market. The Board also noted that the total expenses of the classes vary primarily by the level of their 12b-1 fees, although differences in transfer agent fees may also cause expenses to vary from class to class.
Annual Report
In its review of total expenses, the Board also considered Fidelity fee structures and other information on clients that FMR and its affiliates service in other competitive markets, such as other mutual funds advised or subadvised by FMR or its affiliates, pension plan clients, and other institutional clients.
Based on its review, the Board concluded that the total expenses of each class of the fund were reasonable, although in one case above the median of the universe presented for comparison, in light of the services that the fund and its shareholders receive and the other factors considered.
Costs of the Services and Profitability. The Board considered the revenues earned and the expenses incurred by Fidelity in conducting the business of developing, marketing, distributing, managing, administering and servicing the fund and its shareholders. The Board also considered the level of Fidelity's profits in respect of all the Fidelity funds.
On an annual basis, FMR presents to the Board Fidelity's profitability for the fund. Fidelity calculates the profitability for each fund, as well as aggregate profitability for groups of Fidelity funds and all Fidelity funds, using a series of detailed revenue and cost allocation methodologies which originate with the audited books and records of Fidelity. The Audit Committee of the Board reviews any significant changes from the prior year's methodologies.
PricewaterhouseCoopers LLP (PwC), independent registered public accounting firm and auditor to Fidelity and certain Fidelity funds, has been engaged annually by the Board as part of the Board's assessment of the results of Fidelity's profitability analysis. PwC's engagement includes the review and assessment of Fidelity's methodologies used in determining the revenues and expenses attributable to Fidelity's mutual fund business, and completion of agreed-upon procedures surrounding the mathematical accuracy of fund profitability and its conformity to allocation methodologies. After considering PwC's reports issued under the engagement and information provided by Fidelity, the Board believes that while other allocation methods may also be reasonable, Fidelity's profitability methodologies are reasonable in all material respects.
The Board has also reviewed Fidelity's non-fund businesses and any fall-out benefits related to the mutual fund business as well as cases where Fidelity's affiliates may benefit from or be related to the fund's business.
The Board considered the costs of the services provided by and the profits realized by Fidelity in connection with the operation of the fund and determined that the amount of profit is a fair entrepreneurial profit for the management of the fund.
Economies of Scale. The Board considered whether there have been economies of scale in respect of the management of the Fidelity funds, whether the Fidelity funds (including the fund) have appropriately benefited from any such economies of scale, and whether there is potential for realization of any further economies of scale. The Board considered the extent to which the fund will benefit from economies of scale through increased services to the fund, through waivers or reimbursements, or through fee or expense reductions, including reductions that occur through operation of the transfer agent agreement. The transfer agent fee varies in part based on the number of accounts in the fund. If the number of accounts decreases or the average account size increases, the overall transfer agent fee rate decreases.
Annual Report
Board Approval of Investment Advisory Contracts and
Management Fees - continued
The Board recognized that the fund's management contract incorporates a "group fee" structure, which provides for lower group fee rates as total fund assets under FMR's management increase, and for higher group fee rates as total fund assets under FMR's management decrease. FMR determines the group fee rates based on a tiered asset "breakpoint" schedule. In connection with the renewal of the fund's management contract, the Board approved amendments to the fund's management contract that added four new fee breakpoints to the group fee rate schedule for assets under FMR's management above $1,386 billion. The Board considered that the group fee rate declines under both the present and amended schedules, but that under the amended schedule, the group fee rate declines faster as assets under FMR's management exceed $1,386 billion. The Board considered that the group fee is designed to deliver the benefits of economies of scale to fund shareholders when total fund assets increase, even if assets of any particular fund are unchanged or have declined, because some portion of Fidelity's costs are attributable to services provided to all Fidelity funds, and all funds benefit if those costs can be allocated among more assets. The Board concluded that, given the group fee structure, fund shareholders will achieve a certain level of economies of scale as assets under FMR's management increase at the fund complex level, regardless of whether Fidelity achieves any such economies of scale.
The Board further concluded that any potential economies of scale are being shared between fund shareholders and Fidelity in an appropriate manner.
Additional Information Requested by the Board. In order to develop fully the factual basis for consideration of the Fidelity funds' Advisory Contracts, the Board requested and received additional information on several topics, including (i) fund performance trends and actions to be taken by FMR to improve certain funds' overall performance; (ii) Fidelity's portfolio manager compensation structure, including its effects on fund profitability and the extent to which portfolio manager compensation is linked to fund performance; (iii) Fidelity's fee structures; (iv) the funds' sub-advisory arrangements; and (v) accounts managed by Fidelity other than the Fidelity funds.
Based on its evaluation of all of the conclusions noted above, and after considering all material factors, the Board ultimately concluded that the advisory fee structures are fair and reasonable, and that the fund's Advisory Contracts should be renewed.
Annual Report
Annual Report
Annual Report
Investment Adviser
Fidelity Management & Research Company
Boston, MA
Investment Sub-Advisers
FMR Co., Inc.
Fidelity Management & Research
(U.K.) Inc.
Fidelity Research & Analysis Company
Fidelity International
Investment Advisors
Fidelity Investments Japan Limited
Fidelity International Investment Advisors (U.K.) Limited
General Distributor
Fidelity Distributors Corporation
Boston, MA
Transfer and Service Agents
Fidelity Investments Institutional Operations Company, Inc.
Boston, MA
Fidelity Service Company, Inc.
Boston, MA
Custodian
JPMorgan Chase Bank
New York, NY
FAEMI-UANN-1207
1.809006.103
(Fidelity Investment logo)(registered trademark)
(Fidelity Investment logo)(registered trademark)
Fidelity® Advisor
Europe Capital Appreciation
Fund - Class A, Class T, Class B
and Class C
Annual Report
October 31, 2007
(2_fidelity_logos) (Registered_Trademark)
Contents
Chairman's Message | <Click Here> | Ned Johnson's message to shareholders. |
Performance | <Click Here> | How the fund has done over time. |
Management's Discussion | 7 | The manager's review of fund performance, strategy and outlook |
Shareholder Expense Example | <Click Here> | An example of shareholder expenses. |
Investment Changes | <Click Here> | A summary of major shifts in the fund's investments over the past six months. |
Investments | <Click Here> | A complete list of the fund's investments with their market values. |
Financial Statements | <Click Here> | Statements of assets and liabilities, operations, and changes in net assets,
as well as financial highlights. |
Notes | <Click Here> | Notes to the financial statements. |
Report of Independent Registered Public Accounting Firm | <Click Here> | |
Trustees and Officers | <Click Here> | |
Distributions | <Click Here> | |
Board Approval of Investment Advisory Contracts and Management Fees | <Click Here> | |
| | |
To view a fund's proxy voting guidelines and proxy voting record for the 12-month period ended June 30, visit http://www.fidelity.com (search for "proxy voting guidelines") or visit the Securities and Exchange Commission's (SEC) web site at http://www.sec.gov. You may also call 1-877-208-0098 to request a free copy of the proxy voting guidelines.
Standard & Poor's, S&P and S&P 500 are registered service marks of The McGraw-Hill Companies, Inc. and have been licensed for use by Fidelity Distributors Corporation.
Other third party marks appearing herein are the property of their respective owners.
All other marks appearing herein are registered or unregistered trademarks or service marks of FMR LLC or an affiliated company.
Annual Report
This report and the financial statements contained herein are submitted for the general information of the shareholders of the fund. This report is not authorized for distribution to prospective investors in the fund unless preceded or accompanied by an effective prospectus.
A fund files its complete schedule of portfolio holdings with the SEC for the first and third quarters of each fiscal year on Form N-Q. Forms N-Q are available on the SEC's web site at http://www.sec.gov. A fund's Forms N-Q may be reviewed and copied at the SEC's Public Reference Room in Washington, DC. Information regarding the operation of the SEC's Public Reference Room may be obtained by calling 1-800-SEC-0330. For a complete list of a fund's portfolio holdings, view the most recent holdings listing, semiannual report, or annual report on Fidelity's web site at http://www.fidelity.com or http://www.advisor.fidelity.com, as applicable.
NOT FDIC INSURED · MAY LOSE VALUE · NO BANK GUARANTEE
Neither the fund nor Fidelity Distributors Corporation is a bank.
Annual Report
Chairman's Message
(photo_of_Edward_C_Johnson_3d)
Dear Shareholder:
Many stock and bond markets around the world have been unsettled of late; however, volatility can often lead to opportunity for patient investors. Financial markets are always unpredictable, but there are a number of time-tested principles that can put the historical odds in your favor.
One of the basic tenets is to invest for the long term. Over time, riding out the markets' inevitable ups and downs has proven much more effective than selling into panic or chasing the hottest trend. Even missing only a few of the markets' best days can significantly diminish investor returns. Patience also affords the benefits of compounding - of earning interest on additional income or reinvested dividends and capital gains. There are tax advantages and cost benefits to consider as well. The more you sell, the more taxes you pay, and the more you trade, the higher the costs. While staying the course doesn't eliminate risk, it can considerably lessen the effect of short-term declines.
You can further manage your investing risk through diversification. And today, more than ever, geographic diversification should be taken into account. Studies indicate that asset allocation is the single most important determinant of a portfolio's long-term success. The right mix of stocks, bonds and cash - aligned to your particular risk tolerance and investment objective - is very important. Age-appropriate rebalancing is also an essential aspect of asset allocation. For younger investors, an emphasis on equities - which historically have been the best-performing asset class over time - is encouraged. As investors near their specific goal, such as retirement or sending a child to college, consideration may be given to replacing volatile assets (e.g. common stocks) with more-stable fixed investments (bonds or savings plans).
A third investment principle - investing regularly - can help lower the average cost of your purchases. Investing a certain amount of money each month or quarter helps ensure you won't pay for all your shares at market highs. This strategy - known as dollar cost averaging - also reduces unconstructive "emotion" from investing, helping shareholders avoid selling weak performers just prior to an upswing, or chasing a hot performer just before a correction.
We invite you to contact us via the Internet, through our Investor Centers or over the phone. It is our privilege to provide you the information you need to make the investments that are right for you.
Sincerely,
/s/Edward C. Johnson 3d
Edward C. Johnson 3d
Annual Report
Performance: The Bottom Line
Average annual total return reflects the change in the value of an investment, assuming reinvestment of the class' dividend income and capital gains (the profits earned upon the sale of securities that have grown in value) and assuming a constant rate of performance each year. The $10,000 table and the fund's returns do not reflect the deduction of taxes that a shareholder would pay on fund distributions or the redemption of fund shares. During periods of reimbursement by Fidelity, a fund's total return will be greater than it would be had the reimbursement not occurred. How a fund did yesterday is no guarantee of how it will do tomorrow. Returns reflect the conversion of Class B to Class A shares after a maximum of seven years.
Average Annual Total Returns
Periods ended October 31, 2007 | Past 1
year | Past 5
years | Life of
fund A |
Class A (incl. 5.75% sales charge) | 21.73% | 22.49% | 9.40% |
Class T (incl. 3.50% sales charge) | 24.35% | 22.78% | 9.46% |
Class B (incl. contingent deferred sales charge) B | 23.29% | 22.90% | 9.48% |
Class C (incl. contingent deferred sales charge) C | 27.21% | 23.02% | 9.33% |
A From December 17, 1998.
B Class B shares' contingent deferred sales charges included in the past one year, past five years, and life of fund total return figures are 5%, 2%, and 0%, respectively.
C Class C shares' contingent deferred sales charges included in the past one year, past five years, and life of fund total return figures are 1%, 0%, and 0%, respectively.
Annual Report
Performance - continued
$10,000 Over Life of Fund *
Let's say hypothetically that $10,000 was invested in Fidelity® Advisor Europe Capital Appreciation Fund - Class T on December 31, 1998, and the current 3.50% sales charge was paid. The chart shows how the value of your investment would have changed, and also shows how the MSCI® Europe Index performed over the same period.
* From December 31, 1998 (first date following the fund's commencement for which the life of fund return for the MSCI Europe Index is available).
Annual Report
Management's Discussion of Fund Performance
Comments from Melissa Reilly, Portfolio Manager of Fidelity® Advisor Europe Capital Appreciation Fund
Foreign stocks, with a large assist from a weak U.S. dollar, generally had higher returns for U.S. investors than domestic equities during the 12-month period ending October 31, 2007. The backdrop for global stocks was solid, with robust economic growth and relatively high corporate profitability worldwide. Developed international equity markets, as measured by the Morgan Stanley Capital InternationalSM Europe, Australasia, and Far East (MSCI® EAFE®) Index - a performance monitor of established markets outside the United States and Canada - rose 25.09%. In comparison, the Standard & Poor's 500SM Index, a gauge of U.S. stocks, was up 14.56%. Among countries making up at least 1% of the EAFE benchmark, Finland had the best showing, soaring nearly 69%, while Hong Kong gained roughly 66%. The United Kingdom and Japan, the two largest components of the index, both underperformed. Fallout from the credit crunch and concerns about export growth tempered UK stocks, while Japan struggled with a slowdown in consumer spending and sluggish domestic growth. Emerging markets were the period's big winners, advancing 68.33% as measured by the MSCI Emerging Markets index.
During the year, the fund's Class A, Class T, Class B and Class C shares returned 29.16%, 28.86%, 28.29% and 28.21%, respectively (excluding sales charges), outpacing the 28.20% advance of the MSCI Europe index. Favorable stock picking was the primary driver of performance, but the fund also benefited from its big underweighting in the generally weak financials group. The best stock picks were in energy, consumer discretionary, industrials and health care, with such top contributors as Arcandor, the large German retailer; Actelion, an out-of-index Swiss biopharmaceuticals firm; and Royal Dutch Shell, the UK-listed oil giant, which I added during the period. The major drag on relative performance came from the materials sector, where not owning some of the index's top-performing stocks, such as BHP Billiton, the UK-listed mining giant, detracted. In addition, weakening business fundamentals at UK cable and telecommunications firm Virgin Media drove down the price of this U.S.-listed stock, making it the period's biggest detractor. Big positions in cash and sovereign bonds also hurt. Virgin Media was not in the portfolio at period end.
The views expressed above reflect those of the portfolio manager(s) only through the end of the period as stated on the cover of this report and do not necessarily represent the views of Fidelity or any other person in the Fidelity organization. Any such views are subject to change at any time based upon market or other conditions and Fidelity disclaims any responsibility to update such views. These views may not be relied on as investment advice and, because investment decisions for a Fidelity fund are based on numerous factors, may not be relied on as an indication of trading intent on behalf of any Fidelity fund.
Annual Report
Shareholder Expense Example
As a shareholder of the Fund, you incur two types of costs: (1) transaction costs, including sales charges (loads) on purchase payments or redemption proceeds, redemption fees, and (2) ongoing costs, including management fees, distribution and/or service (12b-1) fees and other Fund expenses. This Example is intended to help you understand your ongoing costs (in dollars) of investing in the Fund and to compare these costs with the ongoing costs of investing in other mutual funds.
The Example is based on an investment of $1,000 invested at the beginning of the period and held for the entire period (May 1, 2007 to October 31, 2007).
Actual Expenses
The first line of the accompanying table for each class of the Fund provides information about actual account values and actual expenses. You may use the information in this line, together with the amount you invested, to estimate the expenses that you paid over the period. Simply divide your account value by $1,000.00 (for example, an $8,600 account value divided by $1,000.00 = 8.6), then multiply the result by the number in the first line for a class of the Fund under the heading entitled "Expenses Paid During Period" to estimate the expenses you paid on your account during this period. In addition, the Fund, as a shareholder in the underlying Fidelity Central Funds, will indirectly bear its pro rata share of the fees and expenses incurred by the underlying Fidelity Central Funds. These fees and expenses are not included in the Fund's annualized expense ratio used to calculate the expense estimate in the table below.
Hypothetical Example for Comparison Purposes
The second line of the accompanying table for each class of the Fund provides information about hypothetical account values and hypothetical expenses based on a Class' actual expense ratio and an assumed rate of return of 5% per year before expenses, which is not the Class' actual return. The hypothetical account values and expenses may not be used to estimate the actual ending account balance or expenses you paid for the period. You may use this information to compare the ongoing costs of investing in the Fund and other funds. To do so, compare this 5% hypothetical example with the 5% hypothetical examples that appear in the shareholder reports of the other funds. In addition, the Fund, as a share-holder in the underlying Fidelity Central Funds, will indirectly bear its pro rata share of the fees and expenses incurred by the underlying Fidelity Central Funds. These fees and expenses are not included in the Fund's annualized expense ratio used to calculate the expense estimate in the table below.
Annual Report
Please note that the expenses shown in the table are meant to highlight your ongoing costs only and do not reflect any transaction costs. Therefore, the second line of the table is useful in comparing ongoing costs only, and will not help you determine the relative total costs of owning different funds. In addition, if these transactional costs were included, your costs would have been higher.
| Beginning
Account Value
May 1, 2007 | Ending
Account Value
October 31, 2007 | Expenses Paid
During Period*
May 1, 2007 to
October 31, 2007 |
Class A | | | |
Actual | $ 1,000.00 | $ 1,086.70 | $ 7.89 |
HypotheticalA | $ 1,000.00 | $ 1,017.64 | $ 7.63 |
Class T | | | |
Actual | $ 1,000.00 | $ 1,085.80 | $ 9.20 |
HypotheticalA | $ 1,000.00 | $ 1,016.38 | $ 8.89 |
Class B | | | |
Actual | $ 1,000.00 | $ 1,082.70 | $ 11.81 |
HypotheticalA | $ 1,000.00 | $ 1,013.86 | $ 11.42 |
Class C | | | |
Actual | $ 1,000.00 | $ 1,083.00 | $ 11.81 |
HypotheticalA | $ 1,000.00 | $ 1,013.86 | $ 11.42 |
Institutional Class | | | |
Actual | $ 1,000.00 | $ 1,089.10 | $ 5.95 |
HypotheticalA | $ 1,000.00 | $ 1,019.51 | $ 5.75 |
A 5% return per year before expenses
* Expenses are equal to each Class' annualized expense ratio (shown in the table below); multiplied by the average account value over the period, multiplied by 184/365 (to reflect the one-half year period).
| Annualized
Expense Ratio |
Class A | 1.50% |
Class T | 1.75% |
Class B | 2.25% |
Class C | 2.25% |
Institutional Class | 1.13% |
Annual Report
Investment Changes
Top Five Stocks as of October 31, 2007 |
| % of fund's
net assets | % of fund's net assets
6 months ago |
Royal Dutch Shell PLC Class A (United Kingdom) (United Kingdom, Oil, Gas & Consumable Fuels) | 3.7 | 0.0 |
Vodafone Group PLC (United Kingdom, Telecommunications Services) | 2.8 | 0.0 |
Roche Holding AG (participation certificate) (Switzerland, Pharmaceuticals) | 2.6 | 0.0 |
E.ON AG (Germany, Electric Utilities) | 2.3 | 3.0 |
Nestle SA (Reg.) (Switzerland, Food Products) | 2.2 | 2.9 |
| 13.6 | |
Top Five Market Sectors as of October 31, 2007 |
| % of fund's
net assets | % of fund's net assets
6 months ago |
Financials | 24.8 | 14.4 |
Industrials | 10.6 | 7.2 |
Energy | 10.4 | 5.3 |
Consumer Discretionary | 9.9 | 17.4 |
Consumer Staples | 9.6 | 8.9 |
Top Five Countries as of October 31, 2007 |
(excluding cash equivalents) | % of fund's
net assets | % of fund's net assets
6 months ago |
United Kingdom | 20.8 | 13.6 |
Germany | 19.3 | 12.1 |
France | 15.4 | 17.1 |
Switzerland | 12.9 | 11.0 |
Spain | 4.8 | 0.0 |
Percentages are adjusted for the effect of open futures contracts, if applicable. |
Asset Allocation (% of fund's net assets) |
As of October 31, 2007 | As of April 30, 2007 |
| Stocks 97.5% | | | Stocks 85.5% | |
 | Bonds 0.0% | | | Bonds 5.2% | |
| Short-Term
Investments and
Net Other Assets 2.5% | | | Short-Term
Investments and
Net Other Assets 9.3% | |

Annual Report
Investments October 31, 2007
Showing Percentage of Net Assets
Common Stocks - 97.1% |
| Shares | | Value |
Argentina - 0.5% |
Cresud S.A.C.I.F. y A. sponsored ADR | 16,400 | | $ 404,752 |
Australia - 1.1% |
CSL Ltd. | 26,022 | | 884,647 |
Austria - 0.7% |
voestalpine AG | 6,600 | | 593,518 |
Belgium - 1.9% |
Fortis | 23,600 | | 754,268 |
InBev SA | 7,900 | | 745,790 |
TOTAL BELGIUM | | 1,500,058 |
Bermuda - 1.2% |
Aquarius Platinum Ltd. (United Kingdom) | 8,000 | | 306,535 |
SeaDrill Ltd. (a) | 26,800 | | 637,976 |
TOTAL BERMUDA | | 944,511 |
Cyprus - 1.2% |
Bank of Cyprus Public Co. Ltd. | 47,400 | | 920,220 |
Finland - 2.3% |
Metso Corp. | 10,900 | | 662,629 |
Nokia Corp. sponsored ADR | 30,500 | | 1,211,460 |
TOTAL FINLAND | | 1,874,089 |
France - 15.4% |
Alcatel-Lucent SA sponsored ADR | 45,200 | | 437,988 |
Alstom SA | 4,000 | | 944,038 |
AXA SA | 29,400 | | 1,315,062 |
Bouygues SA | 7,200 | | 691,182 |
Cap Gemini SA | 8,800 | | 560,975 |
Eutelsat Communications | 16,936 | | 457,613 |
Groupe Danone | 9,600 | | 828,000 |
LVMH Moet Hennessy - Louis Vuitton | 5,300 | | 682,478 |
Pinault Printemps-Redoute SA | 3,300 | | 654,142 |
Remy Cointreau SA | 6,100 | | 468,839 |
Renault SA | 3,600 | | 604,497 |
Societe Generale Series A | 6,700 | | 1,128,950 |
Suez SA (France) | 13,400 | | 871,000 |
Total SA sponsored ADR | 12,200 | | 983,442 |
Veolia Environnement | 9,450 | | 844,060 |
Vinci SA | 9,500 | | 779,295 |
TOTAL FRANCE | | 12,251,561 |
Common Stocks - continued |
| Shares | | Value |
Germany - 19.3% |
Adidas-Salomon AG | 10,100 | | $ 673,844 |
Allianz AG (Reg.) | 5,100 | | 1,152,600 |
Arcandor AG (a) | 7,200 | | 231,576 |
Bayer AG | 12,534 | | 1,032,802 |
Continental AG | 4,200 | | 635,209 |
DaimlerChrysler AG | 8,200 | | 903,230 |
Deutsche Boerse AG | 5,300 | | 836,204 |
E.ON AG | 9,200 | | 1,796,760 |
Hochtief AG | 5,500 | | 759,468 |
Lanxess AG | 11,800 | | 589,294 |
Linde AG | 5,000 | | 632,691 |
MAN AG | 6,400 | | 1,142,350 |
Muenchener Rueckversicherungs-Gesellschaft AG (Reg.) | 5,300 | | 1,016,806 |
RWE AG | 8,300 | | 1,133,240 |
Siemens AG (Reg.) | 10,700 | | 1,459,159 |
SolarWorld AG | 10,400 | | 705,461 |
Wacker Chemie AG | 2,700 | | 663,043 |
TOTAL GERMANY | | 15,363,737 |
Greece - 2.1% |
Bank of Piraeus | 25,575 | | 1,025,629 |
Cosmote Mobile Telecommunications SA | 19,600 | | 676,404 |
TOTAL GREECE | | 1,702,033 |
Ireland - 1.1% |
Anglo Irish Bank Corp. PLC | 24,900 | | 418,471 |
CRH PLC | 12,500 | | 477,017 |
TOTAL IRELAND | | 895,488 |
Italy - 2.8% |
IFIL Finanziaria di Partecipazioni SpA | 8,264 | | 94,215 |
Intesa Sanpaolo SpA | 138,600 | | 1,095,786 |
Prysmian SpA | 2,600 | | 74,701 |
Unicredito Italiano SpA | 113,600 | | 971,044 |
TOTAL ITALY | | 2,235,746 |
Luxembourg - 2.1% |
Acergy SA | 17,600 | | 509,344 |
ArcelorMittal SA | 15,000 | | 1,203,953 |
TOTAL LUXEMBOURG | | 1,713,297 |
Netherlands - 1.9% |
Koninklijke Ahold NV | 32,760 | | 493,038 |
Common Stocks - continued |
| Shares | | Value |
Netherlands - continued |
Nutreco Holding NV | 8,017 | | $ 547,649 |
SBM Offshore NV | 12,700 | | 488,698 |
TOTAL NETHERLANDS | | 1,529,385 |
Norway - 2.2% |
Marine Harvest ASA (a) | 586,000 | | 594,026 |
Petroleum Geo-Services ASA | 23,800 | | 700,717 |
Telenor ASA | 18,600 | | 436,480 |
TOTAL NORWAY | | 1,731,223 |
Spain - 4.8% |
Banco Santander Central Hispano SA | 42,600 | | 925,783 |
Compania de Distribucion Integral Logista SA | 5,100 | | 397,891 |
Inditex SA | 10,300 | | 766,278 |
Telefonica SA sponsored ADR | 17,400 | | 1,730,430 |
TOTAL SPAIN | | 3,820,382 |
Sweden - 2.8% |
Atlas Copco AB (A Shares) | 35,000 | | 585,284 |
H&M Hennes & Mauritz AB (B Shares) | 12,300 | | 818,871 |
Investor AB (B Shares) | 18,300 | | 452,190 |
SSAB Svenskt Stal AB (B Shares) | 12,150 | | 357,592 |
TOTAL SWEDEN | | 2,213,937 |
Switzerland - 12.9% |
ABB Ltd. (Reg.) | 44,492 | | 1,338,255 |
Actelion Ltd. (Reg.) (a) | 13,265 | | 659,070 |
Credit Suisse Group (Reg.) | 7,417 | | 502,131 |
Julius Baer Holding AG (Bearer) | 7,894 | | 682,879 |
Lindt & Spruengli AG | 20 | | 761,461 |
Nestle SA (Reg.) | 3,840 | | 1,774,080 |
Pargesa Holding SA | 4,021 | | 457,886 |
Roche Holding AG (participation certificate) | 12,204 | | 2,085,664 |
Sonova Holding AG | 6,291 | | 706,061 |
Swiss Life Holding | 2,975 | | 821,894 |
UBS AG (Reg.) | 9,090 | | 488,042 |
TOTAL SWITZERLAND | | 10,277,423 |
United Kingdom - 20.8% |
3i Group plc | 21,975 | | 495,705 |
Barclays PLC | 18,800 | | 238,995 |
BG Group PLC | 65,900 | | 1,215,856 |
BP PLC | 68,600 | | 891,686 |
Common Stocks - continued |
| Shares | | Value |
United Kingdom - continued |
Burberry Group PLC | 36,800 | | $ 470,531 |
GlaxoSmithKline PLC | 24,000 | | 615,000 |
Gyrus Group PLC (a) | 60,700 | | 539,498 |
HSBC Holdings PLC sponsored ADR | 14,500 | | 1,443,040 |
Man Group plc | 52,000 | | 635,690 |
Next PLC | 13,900 | | 638,085 |
Reckitt Benckiser Group PLC | 19,100 | | 1,107,508 |
Royal Bank of Scotland Group PLC | 41,200 | | 442,418 |
Royal Dutch Shell PLC Class A (United Kingdom) | 66,800 | | 2,923,434 |
Scottish & Southern Energy PLC | 25,300 | | 818,455 |
Standard Chartered PLC (United Kingdom) | 24,100 | | 934,961 |
Vodafone Group PLC | 202,200 | | 794,039 |
Vodafone Group PLC sponsored ADR | 36,850 | | 1,447,100 |
Xstrata PLC | 12,300 | | 881,478 |
TOTAL UNITED KINGDOM | | 16,533,479 |
TOTAL COMMON STOCKS (Cost $68,156,497) | 77,389,486 |
Nonconvertible Preferred Stocks - 0.4% |
| | | |
Italy - 0.4% |
Istituto Finanziario Industriale SpA (IFI) (a)
(Cost $141,694) | 7,400 | | 308,125 |
Money Market Funds - 3.1% |
| | | |
Fidelity Cash Central Fund, 4.97% (b)
(Cost $2,435,477) | 2,435,477 | | 2,435,477 |
TOTAL INVESTMENT PORTFOLIO - 100.6% (Cost $70,733,668) | | 80,133,088 |
NET OTHER ASSETS - (0.6)% | | (474,841) |
NET ASSETS - 100% | $ 79,658,247 |
Legend |
(a) Non-income producing |
(b) Affiliated fund that is available only to investment companies and other accounts managed by Fidelity Investments. The rate quoted is the annualized seven-day yield of the fund at period end. A complete unaudited listing of the fund's holdings as of its most recent quarter end is available upon request. |
Affiliated Central Funds |
Information regarding fiscal year to date income earned by the Fund from investments in Fidelity Central Funds is as follows: |
Fund | Income earned |
Fidelity Cash Central Fund | $ 196,084 |
Fidelity Securities Lending Cash Central Fund | 63,983 |
Total | $ 260,067 |
See accompanying notes which are an integral part of the financial statements.
Annual Report
Financial Statements
Statement of Assets and Liabilities
| October 31, 2007 |
Assets | | |
Investment in securities, at value - See accompanying schedule: Unaffiliated issuers (cost $68,298,191) | $ 77,697,611 | |
Fidelity Central Funds (cost $2,435,477) | 2,435,477 | |
Total Investments (cost $70,733,668) | | $ 80,133,088 |
Cash | | 7,352 |
Receivable for fund shares sold | | 88,285 |
Dividends receivable | | 78,686 |
Distributions receivable from Fidelity Central Funds | | 7,046 |
Prepaid expenses | | 24 |
Other receivables | | 4,010 |
Total assets | | 80,318,491 |
| | |
Liabilities | | |
Payable for fund shares redeemed | $ 504,700 | |
Accrued management fee | 47,328 | |
Distribution fees payable | 36,855 | |
Other affiliated payables | 23,057 | |
Other payables and accrued expenses | 48,304 | |
Total liabilities | | 660,244 |
| | |
Net Assets | | $ 79,658,247 |
Net Assets consist of: | | |
Paid in capital | | $ 54,640,015 |
Undistributed net investment income | | 1,144,523 |
Accumulated undistributed net realized gain (loss) on investments and foreign currency transactions | | 14,471,876 |
Net unrealized appreciation (depreciation) on investments and assets and liabilities in foreign currencies | | 9,401,833 |
Net Assets | | $ 79,658,247 |
See accompanying notes which are an integral part of the financial statements.
Annual Report
Statement of Assets and Liabilities - continued
| October 31, 2007 |
Calculation of Maximum Offering Price
Class A:
Net Asset Value and redemption price per share ($29,272,945 ÷ 1,397,884 shares) | | $ 20.94 |
| | |
Maximum offering price per share (100/94.25 of $20.94) | | $ 22.22 |
Class T:
Net Asset Value and redemption price per share ($21,357,184 ÷ 1,029,468 shares) | | $ 20.75 |
| | |
Maximum offering price per share (100/96.50 of $20.75) | | $ 21.50 |
Class B:
Net Asset Value and offering price per share ($11,205,997 ÷ 555,966 shares)A | | $ 20.16 |
| | |
Class C:
Net Asset Value and offering price per share ($16,084,288 ÷ 800,351 shares)A | | $ 20.10 |
| | |
| | |
Institutional Class:
Net Asset Value, offering price and redemption price per share ($1,737,833 ÷ 81,715 shares) | | $ 21.27 |
A Redemption price per share is equal to net asset value less any applicable contingent deferred sales charge.
See accompanying notes which are an integral part of the financial statements.
Annual Report
Financial Statements - continued
Statement of Operations
| Year ended October 31, 2007 |
Investment Income | | |
Dividends | | $ 2,428,878 |
Interest | | 138,414 |
Income from Fidelity Central Funds | | 260,067 |
| | 2,827,359 |
Less foreign taxes withheld | | (204,646) |
Total income | | 2,622,713 |
| | |
Expenses | | |
Management fee | $ 590,667 | |
Transfer agent fees | 248,531 | |
Distribution fees | 465,492 | |
Accounting and security lending fees | 46,722 | |
Custodian fees and expenses | 55,348 | |
Independent trustees' compensation | 277 | |
Registration fees | 74,480 | |
Audit | 50,157 | |
Legal | 2,224 | |
Miscellaneous | 681 | |
Total expenses before reductions | 1,534,579 | |
Expense reductions | (62,298) | 1,472,281 |
Net investment income (loss) | | 1,150,432 |
Realized and Unrealized Gain (Loss) Net realized gain (loss) on: | | |
Investment securities: | | |
Unaffiliated issuers | 14,739,061 | |
Foreign currency transactions | 24,791 | |
Total net realized gain (loss) | | 14,763,852 |
Change in net unrealized appreciation (depreciation) on: Investment securities | 3,567,047 | |
Assets and liabilities in foreign currencies | 544 | |
Total change in net unrealized appreciation (depreciation) | | 3,567,591 |
Net gain (loss) | | 18,331,443 |
Net increase (decrease) in net assets resulting from operations | | $ 19,481,875 |
See accompanying notes which are an integral part of the financial statements.
Annual Report
Statement of Changes in Net Assets
| Year ended
October 31,
2007 | Year ended
October 31,
2006 |
Increase (Decrease) in Net Assets | | |
Operations | | |
Net investment income (loss) | $ 1,150,432 | $ 367,772 |
Net realized gain (loss) | 14,763,852 | 5,374,448 |
Change in net unrealized appreciation (depreciation) | 3,567,591 | 4,133,071 |
Net increase (decrease) in net assets resulting
from operations | 19,481,875 | 9,875,291 |
Distributions to shareholders from net investment income | (305,480) | (119,954) |
Distributions to shareholders from net realized gain | (4,668,174) | (423,334) |
Total distributions | (4,973,654) | (543,288) |
Share transactions - net increase (decrease) | 2,498,409 | 28,326,294 |
Redemption fees | 3,169 | 6,074 |
Total increase (decrease) in net assets | 17,009,799 | 37,664,371 |
| | |
Net Assets | | |
Beginning of period | 62,648,448 | 24,984,077 |
End of period (including undistributed net investment income of $1,144,523 and undistributed net investment income of $358,723, respectively) | $ 79,658,247 | $ 62,648,448 |
See accompanying notes which are an integral part of the financial statements.
Annual Report
Financial Highlights - Class A
Years ended October 31, | 2007 | 2006 | 2005 | 2004 | 2003 |
Selected Per-Share Data | | | | | |
Net asset value, beginning of period | $ 17.49 | $ 13.47 | $ 11.30 | $ 10.00 | $ 8.03 |
Income from Investment Operations | | | | | |
Net investment income (loss) C | .32 | .19 F | .12 | .01 | .04 |
Net realized and unrealized gain (loss) | 4.48 | 4.18 | 2.05 | 1.37 | 1.98 |
Total from investment operations | 4.80 | 4.37 | 2.17 | 1.38 | 2.02 |
Distributions from net investment income | (.12) | (.13) | - | (.08) | (.05) |
Distributions from net realized gain | (1.23) | (.22) | - | - | - |
Total distributions | (1.35) | (.35) | - | (.08) | (.05) |
Redemption fees added to paid in capital C | - H | - H | - H | - H | - |
Net asset value, end of period | $ 20.94 | $ 17.49 | $ 13.47 | $ 11.30 | $ 10.00 |
Total Return A,B | 29.16% | 33.17% | 19.20% | 13.87% | 25.30% |
Ratios to Average Net Assets D,G | | | | | |
Expenses before reductions | 1.53% | 1.81% | 2.16% | 2.41% | 3.07% |
Expenses net of fee waivers, if any | 1.50% | 1.50% | 1.55% | 1.75% | 1.75% |
Expenses net of all reductions | 1.46% | 1.40% | 1.44% | 1.68% | 1.69% |
Net investment income (loss) | 1.69% | 1.16% F | .95% | .07% | .49% |
Supplemental Data | | | | | |
Net assets, end of period (000 omitted) | $ 29,273 | $ 18,972 | $ 4,544 | $ 2,905 | $ 3,346 |
Portfolio turnover rate E | 173% | 173% | 135% | 123% | 199% |
A Total returns would have been lower had certain expenses not been reduced during the periods shown.
B Total returns do not include the effect of the sales charges.
C Calculated based on average shares outstanding during the period.
D Fees and expenses of the underlying Fidelity Central Funds are not included in the Fund's expense ratio. The Fund indirectly bears its proportionate share of the expenses of any underlying Fidelity Central Funds.
E Amount does not include the portfolio activity of any underlying Fidelity Central Funds.
F Investment income per share reflects a special dividend which amounted to $.08 per share. Excluding the special dividend, the ratio of net investment income (loss) to average net assets would have been .68%.
G Expense ratios reflect operating expenses of the class. Expenses before reductions do not reflect amounts reimbursed by the investment adviser or reductions from brokerage service arrangements or other expense offset arrangements and do not represent the amount paid by the class during periods when reimbursements or reductions occur. Expenses net of fee waivers reflect expenses after reimbursement by the investment adviser but prior to reductions from brokerage service arrangements or other expense offset arrangements. Expenses net of all reductions represent the net expenses paid by the class.
H Amount represents less than $.01 per share.
See accompanying notes which are an integral part of the financial statements.
Annual Report
Financial Highlights - Class T
Years ended October 31, | 2007 | 2006 | 2005 | 2004 | 2003 |
Selected Per-Share Data | | | | | |
Net asset value, beginning of period | $ 17.35 | $ 13.34 | $ 11.21 | $ 9.93 | $ 7.98 |
Income from Investment Operations | | | | | |
Net investment income (loss) C | .27 | .14 F | .09 | (.02) | .02 |
Net realized and unrealized gain (loss) | 4.44 | 4.17 | 2.04 | 1.36 | 1.96 |
Total from investment operations | 4.71 | 4.31 | 2.13 | 1.34 | 1.98 |
Distributions from net investment income | (.08) | (.08) | - | (.06) | (.03) |
Distributions from net realized gain | (1.23) | (.22) | - | - | - |
Total distributions | (1.31) | (.30) | - | (.06) | (.03) |
Redemption fees added to paid in capital C | - H | - H | - H | - H | - |
Net asset value, end of period | $ 20.75 | $ 17.35 | $ 13.34 | $ 11.21 | $ 9.93 |
Total Return A,B | 28.86% | 32.95% | 19.00% | 13.54% | 24.90% |
Ratios to Average Net Assets D, G | | | | | |
Expenses before reductions | 1.80% | 2.07% | 2.45% | 2.70% | 3.34% |
Expenses net of fee waivers, if any | 1.75% | 1.75% | 1.81% | 2.00% | 2.00% |
Expenses net of all reductions | 1.71% | 1.65% | 1.70% | 1.93% | 1.94% |
Net investment income (loss) | 1.44% | .91% F | .70% | (.18)% | .24% |
Supplemental Data | | | | | |
Net assets, end of period (000 omitted) | $ 21,357 | $ 24,643 | $ 8,893 | $ 8,102 | $ 7,628 |
Portfolio turnover rate E | 173% | 173% | 135% | 123% | 199% |
A Total returns would have been lower had certain expenses not been reduced during the periods shown.
B Total returns do not include the effect of the sales charges.
C Calculated based on average shares outstanding during the period.
D Fees and expenses of the underlying Fidelity Central Funds are not included in the Fund's expense ratio. The Fund indirectly bears its proportionate share of the expenses of any underlying Fidelity Central Funds.
E Amount does not include the portfolio activity of any underlying Fidelity Central Funds.
F Investment income per share reflects a special dividend which amounted to $.08 per share. Excluding the special dividend, the ratio of net investment income (loss) to average net assets would have been .43%.
G Expense ratios reflect operating expenses of the class. Expenses before reductions do not reflect amounts reimbursed by the investment adviser or reductions from brokerage service arrangements or other expense offset arrangements and do not represent the amount paid by the class during periods when reimbursements or reductions occur. Expenses net of fee waivers reflect expenses after reimbursement by the investment adviser but prior to reductions from brokerage service arrangements or other expense offset arrangements. Expenses net of all reductions represent the net expenses paid by the class.
H Amount represents less than $.01 per share.
See accompanying notes which are an integral part of the financial statements.
Annual Report
Financial Highlights - Class B
Years ended October 31, | 2007 | 2006 | 2005 | 2004 | 2003 |
Selected Per-Share Data | | | | | |
Net asset value, beginning of period | $ 16.91 | $ 12.98 | $ 10.97 | $ 9.72 | $ 7.82 |
Income from Investment Operations | | | | | |
Net investment income (loss) C | .17 | .06 F | .02 | (.07) | (.02) |
Net realized and unrealized gain (loss) | 4.34 | 4.10 | 1.99 | 1.33 | 1.92 |
Total from investment operations | 4.51 | 4.16 | 2.01 | 1.26 | 1.90 |
Distributions from net investment income | (.03) | (.01) | - | (.01) | - |
Distributions from net realized gain | (1.23) | (.22) | - | - | - |
Total distributions | (1.26) | (.23) | - | (.01) | - |
Redemption fees added to paid in capital C | - H | - H | - H | - H | - |
Net asset value, end of period | $ 20.16 | $ 16.91 | $ 12.98 | $ 10.97 | $ 9.72 |
Total Return A,B | 28.29% | 32.49% | 18.32% | 12.97% | 24.30% |
Ratios to Average Net Assets D,G | | | | | |
Expenses before reductions | 2.31% | 2.69% | 2.94% | 3.20% | 3.87% |
Expenses net of fee waivers, if any | 2.25% | 2.25% | 2.32% | 2.50% | 2.50% |
Expenses net of all reductions | 2.21% | 2.15% | 2.20% | 2.43% | 2.44% |
Net investment income (loss) | .94% | .41% F | .19% | (.68)% | (.26)% |
Supplemental Data | | | | | |
Net assets, end of period (000 omitted) | $ 11,206 | $ 8,529 | $ 6,415 | $ 6,288 | $ 5,596 |
Portfolio turnover rate E | 173% | 173% | 135% | 123% | 199% |
A Total returns would have been lower had certain expenses not been reduced during the periods shown.
B Total returns do not include the effect of the contingent deferred sales charge.
C Calculated based on average shares outstanding during the period.
D Fees and expenses of the underlying Fidelity Central Funds are not included in the Fund's expense ratio. The Fund indirectly bears its proportionate share of the expenses of any underlying Fidelity Central Funds.
E Amount does not include the portfolio activity of any underlying Fidelity Central Funds.
F Investment income per share reflects a special dividend which amounted to $.07 per share. Excluding the special dividend, the ratio of net investment income (loss) to average net assets would have been (.07)%.
G Expense ratios reflect operating expenses of the class. Expenses before reductions do not reflect amounts reimbursed by the investment adviser or reductions from brokerage service arrangements or other expense offset arrangements and do not represent the amount paid by the class during periods when reimbursements or reductions occur. Expenses net of fee waivers reflect expenses after reimbursement by the investment adviser but prior to reductions from brokerage service arrangements or other expense offset arrangements. Expenses net of all reductions represent the net expenses paid by the class.
H Amount represents less than $.01 per share.
See accompanying notes which are an integral part of the financial statements.
Annual Report
Financial Highlights - Class C
Years ended October 31, | 2007 | 2006 | 2005 | 2004 | 2003 |
Selected Per-Share Data | | | | | |
Net asset value, beginning of period | $ 16.89 | $ 13.00 | $ 10.98 | $ 9.73 | $ 7.83 |
Income from Investment Operations | | | | | |
Net investment income (loss) C | .17 | .06 F | .03 | (.07) | (.02) |
Net realized and unrealized gain (loss) | 4.32 | 4.07 | 1.99 | 1.33 | 1.92 |
Total from investment operations | 4.49 | 4.13 | 2.02 | 1.26 | 1.90 |
Distributions from net investment income | (.05) | (.02) | - | (.01) | - |
Distributions from net realized gain | (1.23) | (.22) | - | - | - |
Total distributions | (1.28) | (.24) | - | (.01) | - |
Redemption fees added to paid in capital C | - H | - H | - H | - H | - |
Net asset value, end of period | $ 20.10 | $ 16.89 | $ 13.00 | $ 10.98 | $ 9.73 |
Total Return A,B | 28.21% | 32.25% | 18.40% | 12.96% | 24.27% |
Ratios to Average Net Assets D,G | | | | | |
Expenses before reductions | 2.26% | 2.57% | 2.86% | 3.08% | 3.74% |
Expenses net of fee waivers, if any | 2.25% | 2.25% | 2.30% | 2.50% | 2.50% |
Expenses net of all reductions | 2.21% | 2.15% | 2.19% | 2.43% | 2.44% |
Net investment income (loss) | .94% | .41% F | .20% | (.68)% | (.26)% |
Supplemental Data | | | | | |
Net assets, end of period (000 omitted) | $ 16,084 | $ 9,173 | $ 4,566 | $ 3,234 | $ 3,076 |
Portfolio turnover rate E | 173% | 173% | 135% | 123% | 199% |
A Total returns would have been lower had certain expenses not been reduced during the periods shown.
B Total returns do not include the effect of the contingent deferred sales charge.
C Calculated based on average shares outstanding during the period.
D Fees and expenses of the underlying Fidelity Central Funds are not included in the Fund's expense ratio. The Fund indirectly bears its proportionate share of the expenses of any underlying Fidelity Central Funds.
E Amount does not include the portfolio activity of any underlying Fidelity Central Funds.
F Investment income per share reflects a special dividend which amounted to $.07 per share. Excluding the special dividend, the ratio of net investment income (loss) to average net assets would have been (.07)%.
G Expense ratios reflect operating expenses of the class. Expenses before reductions do not reflect amounts reimbursed by the investment adviser or reductions from brokerage service arrangements or other expense offset arrangements and do not represent the amount paid by the class during periods when reimbursements or reductions occur. Expenses net of fee waivers reflect expenses after reimbursement by the investment adviser but prior to reductions from brokerage service arrangements or other expense offset arrangements. Expenses net of all reductions represent the net expenses paid by the class.
H Amount represents less than $.01 per share.
See accompanying notes which are an integral part of the financial statements.
Annual Report
Financial Highlights - Institutional Class
Years ended October 31, | 2007 | 2006 | 2005 | 2004 | 2003 |
Selected Per-Share Data | | | | | |
Net asset value, beginning of period | $ 17.72 | $ 13.63 | $ 11.40 | $ 10.07 | $ 8.10 |
Income from Investment Operations | | | | | |
Net investment income (loss) B | .38 | .23 E | .16 | .04 | .06 |
Net realized and unrealized gain (loss) | 4.54 | 4.25 | 2.07 | 1.37 | 1.98 |
Total from investment operations | 4.92 | 4.48 | 2.23 | 1.41 | 2.04 |
Distributions from net investment income | (.14) | (.17) | - | (.08) | (.07) |
Distributions from net realized gain | (1.23) | (.22) | - | - | - |
Total distributions | (1.37) | (.39) | - | (.08) | (.07) |
Redemption fees added to paid in capitalB | - G | - G | - G | - G | - |
Net asset value, end of period | $ 21.27 | $ 17.72 | $ 13.63 | $ 11.40 | $ 10.07 |
Total Return A | 29.57% | 33.68% | 19.56% | 14.07% | 25.39% |
Ratios to Average Net Assets C,F | | | | | |
Expenses before reductions | 1.19% | 1.46% | 1.73% | 1.95% | 2.56% |
Expenses net of fee waivers, if any | 1.19% | 1.25% | 1.31% | 1.50% | 1.50% |
Expenses net of all reductions | 1.15% | 1.15% | 1.20% | 1.43% | 1.44% |
Net investment income (loss) | 2.00% | 1.41% E | 1.20% | .32% | .73% |
Supplemental Data | | | | | |
Net assets, end of period (000 omitted) | $ 1,738 | $ 1,331 | $ 566 | $ 457 | $ 371 |
Portfolio turnover rate D | 173% | 173% | 135% | 123% | 199% |
A Total returns would have been lower had certain expenses not been reduced during the periods shown.
B Calculated based on average shares outstanding during the period.
C Fees and expenses of the underlying Fidelity Central Funds are not included in the Fund's expense ratio. The Fund indirectly bears its proportionate share of the expenses of any underlying Fidelity Central Funds.
D Amount does not include the portfolio activity of any underlying Fidelity Central Funds.
E Investment income per share reflects a special dividend which amounted to $.08 per share. Excluding the special dividend, the ratio of net investment income (loss) to average net assets would have been .93%.
F Expense ratios reflect operating expenses of the class. Expenses before reductions do not reflect amounts reimbursed by the investment adviser or reductions from brokerage service arrangements or other expense offset arrangements and do not represent the amount paid by the class during periods when reimbursements or reductions occur. Expenses net of fee waivers reflect expenses after reimbursement by the investment adviser but prior to reductions from brokerage service arrangements or other expense offset arrangements. Expenses net of all reductions represent the net expenses paid by the class.
G Amount represents less than $.01 per share.
See accompanying notes which are an integral part of the financial statements.
Annual Report
Notes to Financial Statements
For the period ended October 31, 2007
1. Organization.
Fidelity Advisor Europe Capital Appreciation Fund (the Fund) is a fund of Fidelity Advisor Series VIII (the trust) and is authorized to issue an unlimited number of shares. The trust is registered under the Investment Company Act of 1940, as amended (the 1940 Act), as an open-end management investment company organized as a Massachusetts business trust. The Fund offers Class A, Class T, Class B, Class C, and Institutional Class shares, each of which has equal rights as to assets and voting privileges. Each class has exclusive voting rights with respect to matters that affect that class. Class B shares will automatically convert to Class A shares after a holding period of seven years from the initial date of purchase. Investment income, realized and unrealized capital gains and losses, the common expenses of the Fund, and certain fund-level expense reductions, if any, are allocated on a pro rata basis to each class based on the relative net assets of each class to the total net assets of the Fund. Each class differs with respect to transfer agent and distribution and service plan fees incurred. Certain expense reductions also differ by class.
2. Investments in Fidelity Central Funds.
The Fund may invest in Fidelity Central Funds, which are open-end investment companies available only to other investment companies and accounts managed by Fidelity Management & Research Company (FMR) and its affiliates. The Fund's Schedule of Investments lists each of the Fidelity Central Funds as an investment of the Fund, but does not include the underlying holdings of each Fidelity Central Fund. As an Investing Fund, the Fund indirectly bears its proportionate share of the expenses of the underlying Fidelity Central Funds.
The Money Market Central Funds seek preservation of capital and current income and are managed by Fidelity Investments Money Management, Inc. (FIMM), an affiliate of FMR.
A complete list of holdings for each Fidelity Central Fund is available upon request or at the SEC's web site at www.sec.gov. In addition, the financial statements of the Fidelity Central Funds, which are not covered by the Fund's Report of Independent Registered Public Accounting Firm, are available on the SEC's web site or upon request.
3. Significant Accounting Policies.
The financial statements have been prepared in conformity with accounting principles generally accepted in the United States of America, which require management to make certain estimates and assumptions at the date of the financial statements. The following summarizes the significant accounting policies of the Fund:
Annual Report
Notes to Financial Statements - continued
3. Significant Accounting Policies - continued
Security Valuation. Investments are valued and net asset value (NAV) per share is calculated (NAV calculation) as of the close of business of the New York Stock Exchange (NYSE), normally 4:00 p.m. Eastern time. Wherever possible, the Fund uses independent pricing services approved by the Board of Trustees to value its investments.
Equity securities, including restricted securities, for which market quotations are readily available, are valued at the last reported sale price or official closing price as reported by an independent pricing service on the primary market or exchange on which they are traded. In the event there were no sales during the day or closing prices are not available, securities are valued at the last quoted bid price. Investments in open-end mutual funds, including the Fidelity Central Funds, are valued at their closing net asset value each business day. Short-term securities with remaining maturities of sixty days or less for which quotations are not readily available are valued at amortized cost, which approximates value.
When current market prices or quotations are not readily available or do not accurately reflect fair value, valuations may be determined in accordance with procedures adopted by the Board of Trustees. For example, when developments occur between the close of a market and the close of the NYSE that may materially affect the value of some or all of the securities, or when trading in a security is halted, those securities may be fair valued. Factors used in the determination of fair value may include monitoring news to identify significant market or security specific events such as changes in the value of U.S. securities markets, reviewing developments in foreign markets and evaluating the performance of ADRs, futures contracts and exchange-traded funds. Because the Fund's utilization of fair value pricing depends on market activity, the frequency with which fair value pricing is used cannot be predicted and may be utilized to a significant extent. The value of securities used for NAV calculation under fair value pricing may differ from published prices for the same securities.
Foreign Currency. The Fund uses foreign currency contracts to facilitate transactions in foreign-denominated securities. Losses from these transactions may arise from changes in the value of the foreign currency or if the counterparties do not perform under the contracts' terms.
Foreign-denominated assets, including investment securities, and liabilities are translated into U.S. dollars at the exchange rate at period end. Purchases and sales of investment securities, income and dividends received and expenses denominated in foreign currencies are translated into U.S. dollars at the exchange rate in effect on the transaction date.
Annual Report
3. Significant Accounting Policies - continued
Foreign Currency - continued
The effects of exchange rate fluctuations on investments are included with the net realized and unrealized gain (loss) on investment securities. Other foreign currency transactions resulting in realized and unrealized gain (loss) are disclosed separately.
Investment Transactions and Income. For financial reporting purposes, the Fund's investment holdings and NAV include trades executed through the end of the last business day of the period. The NAV for processing shareholder transactions includes trades executed through the end of the prior business day. Gains and losses on securities sold are determined on the basis of identified cost. Dividend income is recorded on the ex-dividend date, except for certain dividends from foreign securities where the ex-dividend date may have passed, which are recorded as soon as the Fund is informed of the ex-dividend date. Non-cash dividends included in dividend income, if any, are recorded at the fair market value of the securities received. Distributions received on securities that represent a return of capital or capital gain are recorded as a reduction of cost of investments and/or as a realized gain. The Fund estimates the components of distributions received that may be considered return of capital distributions or capital gain distributions. Interest income and distributions from the Fidelity Central Funds are accrued as earned. Interest income includes coupon interest and amortization of premium and accretion of discount on debt securities. Investment income is recorded net of foreign taxes withheld where recovery of such taxes is uncertain.
Expenses. Most expenses of the trust can be directly attributed to a fund. Expenses which cannot be directly attributed are apportioned among each Fund in the trust. Expense estimates are accrued in the period to which they relate and adjustments are made when actual amounts are known.
Income Tax Information and Distributions to Shareholders. Each year, the Fund intends to qualify as a regulated investment company by distributing all of its taxable income and realized gains under Subchapter M of the Internal Revenue Code. As a result, no provision for income taxes is required in the accompanying financial statements. Foreign taxes are provided for based on the Fund's understanding of the tax rules and rates that exist in the foreign markets in which it invests.
Distributions are recorded on the ex-dividend date. Income dividends and capital gain distributions are declared separately for each class. Income and capital gain distributions are determined in accordance with income tax regulations, which may differ from generally accepted accounting principles. In addition, the Fund will claim a portion of the payment made to redeeming shareholders as a distribution for income tax purposes.
Annual Report
Notes to Financial Statements - continued
3. Significant Accounting Policies - continued
Income Tax Information and Distributions to Shareholders - continued
Capital accounts within the financial statements are adjusted for permanent book-tax differences. These adjustments have no impact on net assets or the results of operations. Temporary book-tax differences will reverse in a subsequent period.
Book-tax differences are primarily due to foreign currency transactions, passive foreign investment companies (PFIC), market discount, and losses deferred due to wash sales.
The tax-basis components of distributable earnings and the federal tax cost as of period end were as follows:
Unrealized appreciation | $ 11,410,275 |
Unrealized depreciation | (2,119,561) |
Net unrealized appreciation (depreciation) | 9,290,714 |
Undistributed ordinary income | 3,562,176 |
Undistributed long-term capital gain | 7,509,078 |
| |
Cost for federal income tax purposes | $ 70,842,374 |
The tax character of distributions paid was as follows:
| October 31, 2007 | October 31, 2006 |
Ordinary Income | $ 912,722 | $ 119,954 |
Long-term Capital Gains | 4,060,932 | 423,334 |
Total | $ 4,973,654 | $ 543,288 |
Short-Term Trading (Redemption) Fees. Shares held in the Fund less than 30 days are subject to a redemption fee equal to 1.00% of the proceeds of the redeemed shares. All redemption fees, including any estimated redemption fees paid by FMR, are retained by the Fund and accounted for as an addition to paid in capital.
New Accounting Pronouncements. In July 2006, Financial Accounting Standards Board Interpretation No. 48, Accounting for Uncertainty in Income Taxes - an interpretation of FASB Statement 109 (FIN 48), was issued and is effective on the last business day of the semiannual reporting period for fiscal years beginning after December 15, 2006. FIN 48 sets forth a threshold for financial statement recognition, measurement and disclosure of a tax position taken or expected to be taken on a tax return. Management has concluded that the adoption of FIN 48 will not result in a material impact on the Fund's net assets, results of operations and financial statement disclosures.
In addition, in September 2006, Statement of Financial Accounting Standards No. 157, Fair Value Measurements (SFAS 157), was issued and is effective for fiscal years beginning after November 15, 2007. SFAS 157 defines fair value, establishes a framework for measuring fair value and expands disclosures about fair value measurements.
Annual Report
3. Significant Accounting Policies - continued
New Accounting Pronouncements - continued
Management is currently evaluating the impact the adoption of SFAS 157 will have on the Fund's financial statement disclosures.
4. Operating Policies.
Repurchase Agreements. FMR has received an Exemptive Order from the Securities and Exchange Commission (the SEC) which permits the Fund and other affiliated entities of FMR to transfer uninvested cash balances into joint trading accounts which are then invested in repurchase agreements. The Fund may also invest directly with institutions in repurchase agreements. Repurchase agreements are collateralized by government or non-government securities. Upon settlement date, collateral is held in segregated accounts with custodian banks and may be obtained in the event of a default of the counterparty. The Fund monitors, on a daily basis, the value of the collateral to ensure it is at least equal to the principal amount of the repurchase agreement (including accrued interest). In the event of a default by the counterparty, realization of the collateral proceeds could be delayed, during which time the value of the collateral may decline.
5. Purchases and Sales of Investments.
Purchases and sales of securities, other than short-term securities, aggregated $136,567,514 and $128,760,493, respectively.
6. Fees and Other Transactions with Affiliates.
Management Fee. FMR and its affiliates provide the Fund with investment management related services for which the Fund pays a monthly management fee. The management fee is the sum of an individual fund fee rate that is based on an annual rate of .45% of the Fund's average net assets and a group fee rate that averaged ..26% during the period. The group fee rate is based upon the average net assets of all the mutual funds advised by FMR. The group fee rate decreases as assets under management increase and increases as assets under management decrease. For the period, the total annual management fee rate was .71% of the Fund's average net assets.
Distribution and Service Plan. In accordance with Rule 12b-1 of the 1940 Act, the Fund has adopted separate Distribution and Service Plans for each class of shares, except for the Institutional Class. Certain classes pay Fidelity Distributors Corporation (FDC), an affiliate of FMR, separate Distribution and Service Fees, each of which is based on an annual percentage of each class' average net assets. In addition, FDC may
Annual Report
Notes to Financial Statements - continued
6. Fees and Other Transactions with Affiliates - continued
Distribution and Service Plan - continued
pay financial intermediaries for selling shares of the Fund and providing shareholder support services.
For the period, the Distribution and Service Fee rates and the total amounts paid to and retained by FDC were as follows:
| Distribution
Fee | Service
Fee | Paid to
FDC | Retained
by FDC |
Class A | -% | .25% | $ 68,126 | $ 3,141 |
Class T | .25% | .25% | 145,443 | 347 |
Class B | .75% | .25% | 105,361 | 79,081 |
Class C | .75% | .25% | 146,562 | 47,151 |
| | | $ 465,492 | $ 129,720 |
Sales Load. FDC receives a front-end sales charge of up to 5.75% for selling Class A shares, and 3.50% for selling Class T shares, some of which is paid to financial intermediaries for selling shares of the Fund. FDC receives the proceeds of contingent deferred sales charges levied on Class A, Class T, Class B, and Class C redemptions. These charges depend on the holding period. The deferred sales charges range from 5% to 1% for Class B, 1% for Class C, 1% to .50% for certain purchases of Class A shares and .25% for certain purchases of Class T shares.
For the period, sales charge amounts retained by FDC were as follows:
| Retained
by FDC |
Class A | $ 38,896 |
Class T | 10,484 |
Class B * | 15,214 |
Class C * | 5,510 |
| $ 70,104 |
* When Class B and Class C shares are initially sold, FDC pays commissions from its own resources to financial intermediaries through which the sales are made.
Transfer Agent Fees. Fidelity Investments Institutional Operations Company, Inc. (FIIOC), an affiliate of FMR, is the transfer, dividend disbursing and shareholder servicing agent for each class of the Fund. FIIOC receives account fees and asset-based fees that vary according to the account size and type of account of the shareholders of the respective classes of the Fund. FIIOC pays for typesetting, printing and mailing of shareholder reports, except proxy statements.
Annual Report
6. Fees and Other Transactions with Affiliates - continued
Transfer Agent Fees - continued
For the period, the total transfer agent fees paid by each class to FIIOC, were as follows:
| Amount | % of
Average
Net Assets |
Class A | $ 82,424 | .30 |
Class T | 87,636 | .30 |
Class B | 33,735 | .32 |
Class C | 41,419 | .28 |
Institutional Class | 3,317 | .19 |
| $ 248,531 | |
Accounting and Security Lending Fees. Fidelity Service Company, Inc. (FSC), an affiliate of FMR, maintains the Fund's accounting records. The accounting fee is based on the level of average net assets for the month. Under a separate contract, FSC administers the security lending program. The security lending fee is based on the number and duration of lending transactions.
Brokerage Commissions. The Fund placed a portion of its portfolio transactions with brokerage firms which are affiliates of the investment adviser. The commissions paid to these affiliated firms were $76 for the period.
7. Committed Line of Credit.
The Fund participates with other funds managed by FMR in a $4.2 billion credit facility (the "line of credit") to be utilized for temporary or emergency purposes to fund share-holder redemptions or for other short-term liquidity purposes. The Fund has agreed to pay commitment fees on its pro rata portion of the line of credit, which amounted to $168 and is reflected in Miscellaneous Expense on the Statement of Operations. During the period, there were no borrowings on this line of credit.
8. Security Lending.
The Fund lends portfolio securities from time to time in order to earn additional income. On the settlement date of the loan, the Fund receives collateral (in the form of U.S. Treasury obligations, letters of credit and/or cash) against the loaned securities and maintains collateral in an amount not less than 100% of the market value of the loaned securities during the period of the loan. The market value of the loaned securities is determined at the close of business of the Fund and any additional required collateral is delivered to the Fund on the next business day. If the borrower defaults on its obligation to return the securities loaned because of insolvency or other reasons, a fund could
Annual Report
Notes to Financial Statements - continued
8. Security Lending - continued
experience delays and costs in recovering the securities loaned or in gaining access to the collateral. Any cash collateral received is invested in the Fidelity Securities Lending Cash Central Fund. At period end, there were no security loans outstanding. Security lending income represents the income earned on investing cash collateral, less fees and expenses associated with the loan, plus any premium payments that may be received on the loan of certain types of securities. Security lending income is presented in the Statement of Operations as a component of income from Fidelity Central Funds. Net income from lending portfolio securities during the period amounted to $63,983.
9. Expense Reductions.
FMR voluntarily agreed to reimburse each class to the extent annual operating expenses exceeded certain levels of average net assets as noted in the table below. Some expenses, for example interest expense, including commitment fees, are excluded from this reimbursement.
The following classes were in reimbursement during the period:
| Expense
Limitations | Reimbursement
from adviser |
Class A | 1.50% | $ 8,048 |
Class T | 1.75% | 12,523 |
Class B | 2.25% | 6,415 |
Class C | 2.25% | 1,113 |
| | $ 28,099 |
Many of the brokers with whom FMR places trades on behalf of the Fund provided services to the Fund in addition to trade execution. These services included payments of certain expenses on behalf of the Fund totaling $33,306 for the period.
10. Other.
The Fund's organizational documents provide former and current trustees and officers with a limited indemnification against liabilities arising in connection with the performance of their duties to the Fund. In the normal course of business, the Fund may also enter into contracts that provide general indemnifications. The Fund's maximum exposure under these arrangements is unknown as this would be dependent on future claims that may be made against the Fund. The risk of material loss from such claims is considered remote.
Annual Report
10. Other - continued
In September 2006, FIIOC, the Fund's transfer agent, notified the Fund that the Fund's books and records did not reflect a conversion of certain Class B to Class A shares upon their conversion date. In March 2007, FIIOC converted the relevant Class B shares to Class A shares and recorded the conversion in the books and records of the Fund which did not result in a material impact to the Fund's reported net assets or results of operations in the accompanying financial statements. FIIOC has remediated affected shareholders and reimbursed the Fund for all related audit and legal expenses.
The United States Securities and Exchange Commission ("SEC") is conducting an investigation of FMR (covering the years 2002 to 2004) arising from gifts, gratuities and business entertainment provided by certain brokers to certain individuals who were employed on FMR's domestic equity trading desk during that period. FMR is in discussions with the SEC staff regarding the possible resolution of the matter, but as of period-end no final resolution has been reached.
In December 2006, the Independent Trustees completed their own investigation of the matter with the assistance of independent counsel. The Independent Trustees and FMR agree that, despite the absence of proof that the Fidelity mutual funds experienced diminished execution quality as a result of the improper receipt of gifts and business entertainment, the conduct at issue was serious and is worthy of redress. Accordingly, the Independent Trustees have requested and FMR has agreed to pay $42 million to Fidelity mutual funds, plus interest to be determined at the time that payment is made. A method of allocating this payment among the funds has not yet been determined. The total payment to the Fund is not anticipated to have a material impact on the Fund's net assets. In addition, FMR reimbursed related legal expenses which are recorded in the accompanying Statement of Operations as an expense reduction.
11. Distributions to Shareholders.
Distributions to shareholders of each class were as follows:
| Years ended October 31, |
| 2007 | 2006 |
From net investment income | | |
Class A | $ 131,953 | $ 47,168 |
Class T | 120,031 | 54,756 |
Class B | 14,114 | 2,978 |
Class C | 27,366 | 6,844 |
Institutional Class | 12,016 | 8,208 |
Total | $ 305,480 | $ 119,954 |
Annual Report
Notes to Financial Statements - continued
11. Distributions to Shareholders - continued
| Years ended October 31, |
| 2007 | 2006 |
From net realized gain | | |
Class A | $ 1,411,320 | $ 79,213 |
Class T | 1,778,779 | 145,138 |
Class B | 642,980 | 109,180 |
Class C | 731,741 | 79,243 |
Institutional Class | 103,354 | 10,560 |
Total | $ 4,668,174 | $ 423,334 |
12. Share Transactions.
Transactions for each class of shares were as follows:
| Shares | Dollars |
| Years ended October 31, | Years ended October 31, |
| 2007 | 2006 | 2007 | 2006 |
Class A | | | | |
Shares sold | 887,671 | 950,467 | $ 16,290,832 | $ 15,398,163 |
Reinvestment of distributions | 81,628 | 8,427 | 1,393,387 | 115,445 |
Shares redeemed | (655,962) | (211,724) | (12,453,019) | (3,398,595) |
Net increase (decrease) | 313,337 | 747,170 | $ 5,231,200 | $ 12,115,013 |
Class T | | | | |
Shares sold | 628,131 | 1,226,606 | $ 11,365,875 | $ 19,872,364 |
Reinvestment of distributions | 110,301 | 14,226 | 1,869,603 | 193,752 |
Shares redeemed | (1,129,336) | (487,091) | (21,225,724) | (7,833,255) |
Net increase (decrease) | (390,904) | 753,741 | $ (7,990,246) | $ 12,232,861 |
Class B | | | | |
Shares sold | 290,925 | 224,137 | $ 5,134,606 | $ 3,557,649 |
Reinvestment of distributions | 36,910 | 7,684 | 610,124 | 102,344 |
Shares redeemed | (276,174) | (221,615) | (4,941,749) | (3,404,462) |
Net increase (decrease) | 51,661 | 10,206 | $ 802,981 | $ 255,531 |
Class C | | | | |
Shares sold | 555,549 | 375,786 | $ 9,727,989 | $ 5,938,976 |
Reinvestment of distributions | 36,928 | 5,509 | 608,950 | 73,380 |
Shares redeemed | (335,147) | (189,571) | (6,006,565) | (2,918,486) |
Net increase (decrease) | 257,330 | 191,724 | $ 4,330,374 | $ 3,093,870 |
Institutional Class | | | | |
Shares sold | 50,928 | 96,924 | $ 962,437 | $ 1,629,400 |
Reinvestment of distributions | 3,929 | 1,054 | 67,898 | 14,581 |
Shares redeemed | (48,267) | (64,378) | (906,235) | (1,014,962) |
Net increase (decrease) | 6,590 | 33,600 | $ 124,100 | $ 629,019 |
Annual Report
Report of Independent Registered Public Accounting Firm
To the Trustees of Fidelity Advisor Series VIII and Shareholders of Fidelity Advisor Europe Capital Appreciation Fund:
We have audited the accompanying statement of assets and liabilities of Fidelity Advisor Europe Capital Appreciation Fund (the Fund), a fund of Fidelity Advisor Series VIII, including the schedule of investments, as of October 31, 2007, and the related statement of operations for the year then ended, the statement of changes in net assets for each of the two years in the period then ended, and the financial highlights for each of the five years in the period then ended. These financial statements and financial highlights are the responsibility of the Fund's management. Our responsibility is to express an opinion on these financial statements and financial highlights based on our audits.
We conducted our audits in accordance with standards of the Public Company Accounting Oversight Board (United States). Those standards require that we plan and perform the audit to obtain reasonable assurance about whether the financial statements and financial highlights are free of material misstatement. The Fund is not required to have, nor were we engaged to perform, an audit of its internal control over financial reporting. Our audits included consideration of internal control over financial reporting as a basis for designing audit procedures that are appropriate in the circumstances, but not for the purpose of expressing an opinion on the effectiveness of the Fund's internal control over financial reporting. Accordingly, we express no such opinion. An audit also includes examining, on a test basis, evidence supporting the amounts and disclosures in the financial statements, assessing the accounting principles used and significant estimates made by management, as well as evaluating the overall financial statement presentation. Our procedures included confirmation of securities owned as of October 31, 2007, by correspondence with the custodians. We believe that our audits provide a reasonable basis for our opinion.
In our opinion, the financial statements and financial highlights referred to above present fairly, in all material respects, the financial position of Fidelity Advisor Europe Capital Appreciation Fund as of October 31, 2007, the results of its operations for the year then ended, the changes in its net assets for each of the two years in the period then ended, and its financial highlights for each of the five years in the period then ended, in conformity with accounting principles generally accepted in the United States of America.
/s/ Deloitte & Touche LLP
DELOITTE & TOUCHE LLP
Boston, Massachusetts
December 18, 2007
Annual Report
Trustees and Officers
The Trustees, Members of the Advisory Board, and executive officers of the trust and fund, as applicable, are listed below. The Board of Trustees governs the fund and is responsible for protecting the interests of shareholders. The Trustees are experienced executives who meet periodically throughout the year to oversee the fund's activities, review contractual arrangements with companies that provide services to the fund, and review the fund's performance. Except for James C. Curvey, each of the Trustees oversees 370 funds advised by FMR or an affiliate. Mr. Curvey oversees 340 funds advised by FMR or an affiliate.
The Trustees hold office without limit in time except that (a) any Trustee may resign; (b) any Trustee may be removed by written instrument, signed by at least two-thirds of the number of Trustees prior to such removal; (c) any Trustee who requests to be retired or who has become incapacitated by illness or injury may be retired by written instrument signed by a majority of the other Trustees; and (d) any Trustee may be removed at any special meeting of shareholders by a two-thirds vote of the outstanding voting securities of the trust. Each Trustee who is not an interested person (as defined in the 1940 Act) (Independent Trustee), shall retire not later than the last day of the calendar year in which his or her 72nd birthday occurs. The Independent Trustees may waive this mandatory retirement age policy with respect to individual Trustees. The executive officers and Advisory Board Members hold office without limit in time, except that any officer and Advisory Board Member may resign or may be removed by a vote of a majority of the Trustees at any regular meeting or any special meeting of the Trustees. Except as indicated, each individual has held the office shown or other offices in the same company for the past five years.
The fund's Statement of Additional Information (SAI) includes more information about the Trustees. To request a free copy, call Fidelity at 1-877-208-0098.
Interested Trustees*:
Correspondence intended for each Trustee who is an interested person may be sent to Fidelity Investments, 82 Devonshire Street, Boston, Massachusetts 02109.
Name, Age; Principal Occupation |
Edward C. Johnson 3d (77) |
| Year of Election or Appointment: 1983 Mr. Johnson is Chairman of the Board of Trustees. Mr. Johnson serves as President (2006-present), Chief Executive Officer, Chairman, and a Director of FMR LLC; Chairman and a Director of FMR; Chairman and a Director of Fidelity Research & Analysis Company (FRAC); Chairman and a Director of Fidelity Investments Money Management, Inc.; and Chairman (2001-present) and a Director of FMR Co., Inc. In addition, Mr. Johnson serves as Chairman and Director of Fidelity International Limited (FIL). |
James C. Curvey (72) |
| Year of Election or Appointment: 2007 Mr. Curvey also serves as Trustee (2007-present) or Member of the Advisory Board (2007-present) of other investment companies advised by FMR. Mr. Curvey is a Director of FMR and FMR Co., Inc. (2007-
present). Mr. Curvey is also Vice Chairman (2006-present) and Director of FMR LLC. Mr. Curvey joined Fidelity in 1982 and served in numerous senior management positions, including President and Chief Operating Officer of FMR LLC (1997-2000) and President of Fidelity Strategic Investments (2000-2002). In addition, he serves as a member of the Board of Directors of Geerlings & Wade, Inc. (wine distribution). |
* Trustees have been determined to be "Interested Trustees" by virtue of, among other things, their affiliation with the trust or various entities under common control with FMR. FMR Corp. merged with FMR LLC on October 1, 2007. Any references to FMR LLC for prior periods are deemed to be references to the prior entity.
Independent Trustees:
Correspondence intended for each Independent Trustee (that is, the Trustees other than the Interested Trustees) may be sent to Fidelity Investments, P.O. Box 55235, Boston, Massachusetts 02205-5235.
Name, Age; Principal Occupation |
Dennis J. Dirks (59) |
| Year of Election or Appointment: 2005 Prior to his retirement in May 2003, Mr. Dirks was Chief Operating Officer and a member of the Board of The Depository Trust & Clearing Corporation (DTCC) (1999-2003). He also served as President, Chief Operating Officer, and Board member of The Depository Trust Company (DTC) (1999-2003) and President and Board member of the National Securities Clearing Corporation (NSCC) (1999-2003). In addition, Mr. Dirks served as Chief Executive Officer and Board member of the Government Securities Clearing Corporation (2001-2003) and Chief Executive Officer and Board member of the Mortgage-Backed Securities Clearing Corporation (2001-2003). Mr. Dirks also serves as a Trustee and a member of the Finance Committee of Manhattan College (2005-present) and a Trustee and a member of the Finance Committee of AHRC of Nassau County (2006-present). |
Albert R. Gamper, Jr. (65) |
| Year of Election or Appointment: 2006 Prior to his retirement in December 2004, Mr. Gamper served as Chairman of the Board of CIT Group Inc. (commercial finance). During his tenure with CIT Group Inc. Mr. Gamper served in numerous senior management positions, including Chairman (1987-1989; 1999-2001; 2002-2004), Chief Executive Officer (1987-2004), and President (1989-2002). He currently serves as a member of the Board of Directors of Public Service Enterprise Group (utilities, 2001-present), Chairman of the Board of Governors, Rutgers University (2004-present), and Chairman of the Board of Saint Barnabas Health Care System. |
George H. Heilmeier (71) |
| Year of Election or Appointment: 2004 Dr. Heilmeier is Chairman Emeritus of Telcordia Technologies (communication software and systems), where prior to his retirement, he served as company Chairman and Chief Executive Officer. He currently serves on the Boards of Directors of The Mitre Corporation (systems engineering and information technology support for the government), and HRL Laboratories (private research and development, 2004-present). He is Chairman of the General Motors Science & Technology Advisory Board and a Life Fellow of the Institute of Electrical and Electronics Engineers (IEEE). Dr. Heilmeier is a member of the Defense Science Board and the National Security Agency Advisory Board. He is also a member of the National Academy of Engineering, the American Academy of Arts and Sciences, and the Board of Overseers of the School of Engineering and Applied Science of the University of Pennsylvania. Previously, Dr. Heilmeier served as a Director of TRW Inc. (automotive, space, defense, and information technology, 1992-2002), Compaq (1994-2002), Automatic Data Processing, Inc. (ADP) (technology-based business outsourcing, 1995-2002), INET Technologies Inc. (telecommunications network surveillance, 2001-2004), and Teletech Holdings (customer management services). He is the recipient of the 2005 Kyoto Prize in Advanced Technology for his invention of the liquid crystal display, and a member of the Consumer Electronics Hall of Fame. |
James H. Keyes (67) |
| Year of Election or Appointment: 2007 Prior to his retirement in 2003, Mr. Keyes was Chairman, President, and Chief Executive Officer of Johnson Controls, Inc. (automotive supplier, 1993-2003). He currently serves as a member of the boards of LSI Logic Corporation (semiconductor technologies), Navistar International Corporation (manufacture and sale of trucks, buses, and diesel engines, 2002-present), and Pitney Bowes, Inc. (integrated mail, messaging, and document management solutions). |
Marie L. Knowles (61) |
| Year of Election or Appointment: 2001 Prior to Ms. Knowles' retirement in June 2000, she served as Executive Vice President and Chief Financial Officer of Atlantic Richfield Company (ARCO) (diversified energy, 1996-2000). From 1993 to 1996, she was a Senior Vice President of ARCO and President of ARCO Transportation Company. She served as a Director of ARCO from 1996 to 1998. She currently serves as a Director of Phelps Dodge Corporation (copper mining and manufacturing) and McKesson Corporation (healthcare service, 2002-present). Ms. Knowles is a Trustee of the Brookings Institution and the Catalina Island Conservancy and also serves as a member of the Advisory Board for the School of Engineering of the University of Southern California. |
Ned C. Lautenbach (63) |
| Year of Election or Appointment: 2000 Mr. Lautenbach is Chairman of the Independent Trustees (2006-present). Mr. Lautenbach has been a partner of Clayton, Dubilier & Rice, Inc. (private equity investment firm) since September 1998. Previously, Mr. Lautenbach was with the International Business Machines Corporation (IBM) from 1968 until his retirement in 1998. Mr. Lautenbach serves as a Director of Sony Corporation (2006-present) and Eaton Corporation (diversified industrial) as well as the Philharmonic Center for the Arts in Naples, Florida. He also is a member of the Board of Trustees of Fairfield University (2005-present), as well as a member of the Council on Foreign Relations. |
Cornelia M. Small (63) |
| Year of Election or Appointment: 2005 Ms. Small is a member (2000-present) and Chairperson (2002-present) of the Investment Committee, and a member (2002-present) of the Board of Trustees of Smith College. Previously, she served as Chief Investment Officer (1999-2000), Director of Global Equity Investments (1996-1999), and a member of the Board of Directors of Scudder, Stevens & Clark (1990-1997) and Scudder Kemper Investments (1997-1999). In addition, Ms. Small served as Co-Chair (2000-2003) of the Annual Fund for the Fletcher School of Law and Diplomacy. |
William S. Stavropoulos (68) |
| Year of Election or Appointment: 2001 Mr. Stavropoulos is Chairman Emeritus of the Board of Directors of The Dow Chemical Company. Since joining The Dow Chemical Company in 1967, Mr. Stavropoulos served in numerous senior management positions, including President (1993-2000; 2002-2003), CEO (1995-2000; 2002-2004), and Chairman of the Executive Committee (2000-2004). Currently, he is a Director of NCR Corporation (data warehousing and technology solutions), Chemical Financial Corporation, Maersk Inc. (industrial conglomerate, 2002-present), Tyco International, Inc. (multinational manufacturing and services, 2007-present), and a member of the Advisory Board for Metalmark Capital (private equity investment firm, 2005-present). He is a special advisor to Clayton, Dubilier & Rice, Inc., a private equity investment firm. He also serves as a member of the Board of Trustees of the American Enterprise Institute for Public Policy Research. In addition, Mr. Stavropoulos is a member of The Business Council, J.P. Morgan International Council and the University of Notre Dame Advisory Council for the College of Science. |
Kenneth L. Wolfe (68) |
| Year of Election or Appointment: 2005 Prior to his retirement in 2001, Mr. Wolfe was Chairman and Chief Executive Officer of Hershey Foods Corporation (1993-2001). He currently serves as a member of the boards of Adelphia Communications Corporation (2003-present), Bausch & Lomb, Inc., and Revlon Inc. (2004-present). |
Advisory Board Members and Executive Officers**:
Correspondence intended for Mr. Mauriello, Mr. Thomas, and Mr. Wiley may be sent to Fidelity Investments, P.O. Box 55235, Boston, Massachusetts 02205-5235. Correspondence intended for each executive officer and Mr. Lynch may be sent to Fidelity Investments, 82 Devonshire Street, Boston, Massachusetts 02109.
Name, Age; Principal Occupation |
Peter S. Lynch (63) |
| Year of Election or Appointment: 2003 Member of the Advisory Board of Fidelity Advisor Series VIII. Mr. Lynch is Vice Chairman and a Director of FMR, and Vice Chairman (2001-
present) and a Director of FMR Co., Inc. Previously, Mr. Lynch served as a Trustee of the Fidelity funds (1990-2003). In addition, he serves as a Trustee of Boston College and as the Chairman of the Inner-City Scholarship Fund. |
Joseph Mauriello (63) |
| Year of Election or Appointment: 2007 Member of the Advisory Board of Fidelity Advisor Series VIII. Prior to his retirement in January 2006, Mr. Mauriello served in numerous senior management positions including Deputy Chairman and Chief Operating Officer (2004-2005), and Vice Chairman of Financial Services (2002-2004) of KPMG LLP US (professional services firm, 1965-2005). Mr. Mauriello currently serves as a member of the Board of Directors of XL Capital Ltd., (global insurance and re-insurance company, 2006-
present) and of Arcadia Resources Inc., (health care services and products, 2007-present). He also served as a Director of the Hamilton Funds of the Bank of New York (2006-2007). |
David M. Thomas (58) |
| Year of Election or Appointment: 2007 Member of the Advisory Board of Fidelity Advisor Series VIII. Previously, Mr. Thomas served as Executive Chairman (2005-2006) and Chairman and Chief Executive Officer (2000-2005) of IMS Health, Inc. (pharmaceutical and healthcare information solutions). In addition, Mr. Thomas serves as a member of the Board of Directors of Fortune Brands, Inc. (consumer products holding company), and Interpublic Group of Companies, Inc. (marketing communication, 2004-present). |
Michael E. Wiley (57) |
| Year of Election or Appointment: 2007 Member of the Advisory Board of Fidelity Advisor Series VIII. Mr. Wiley also serves as Sr. Energy Advisor of Katzenbach Partners, LLC (consulting firm, 2006-present) and a member of the Board of Trustees of the University of Tulsa (2000-2006; 2007-present). He serves as a Director of Tesoro Corporation (independent oil refiner and marketer, 2005-
present), and a Director of Bill Barrett Corporation (exploration and production company, 2005-present). In addition, he also serves as a Director of Post Oak Bank (privately-held bank, 2004-present), and an Advisory Director of Riverstone Holdings (private investment firm). Previously, Mr. Wiley served as Chairman, President, and CEO of Baker Hughes, Inc. (oilfield services company, 2000-2004), and as Director of Spinnaker Exploration Company (exploration and production company, 2001-2005). |
Kimberley H. Monasterio (43) |
| Year of Election or Appointment: 2007 President and Treasurer of Advisor Europe Capital Appreciation. Ms. Monasterio also serves as President and Treasurer of other Fidelity funds (2007-present) and is an employee of FMR (2004-present). Previously, Ms. Monasterio served as Deputy Treasurer of the Fidelity funds (2004-2006). Before joining Fidelity Investments, Ms. Monasterio served as Treasurer (2000-2004) and Chief Financial Officer (2002-2004) of the Franklin Templeton Funds and Senior Vice President of Franklin Templeton Services, LLC (2000-2004). |
Walter C. Donovan (45) |
| Year of Election or Appointment: 2007 Vice President of Advisor Europe Capital Appreciation. Mr. Donovan also serves as Vice President of Fidelity's Equity Funds (2007-present). Mr. Donovan also serves as Executive Vice President of FMR (2005-
present) and FMR Co., Inc. (2005-present). Previously, Mr. Donovan served as Vice President of Fidelity's High Income Funds (2005-2007), Fixed-Income Funds (2005-2006), certain Asset Allocation Funds (2005-2006), certain Balanced Funds (2005-2006), and as Vice President and Director of Fidelity's International Equity Trading group (1998-2005). |
Eric M. Wetlaufer (45) |
| Year of Election or Appointment: 2006 Vice President of Advisor Europe Capital Appreciation. Mr. Wetlaufer also serves as Vice President of certain International Equity Funds (2006-present). Mr. Wetlaufer is Senior Vice President of FMR (2006-
present) and FMR Co., Inc. (2006-present), and President and Director of Fidelity Management & Research (U.K.) Inc. (2006-present) and Fidelity Research & Analysis Company (2006-present). Before joining Fidelity Investments in 2005, Mr. Wetlaufer was a partner in Oxhead Capital Management (2004-2005). Previously, Mr. Wetlaufer served as a Chief Investment Officer of Putnam Investments (1997-2003). |
Eric D. Roiter (59) |
| Year of Election or Appointment: 1998 Secretary of Advisor Europe Capital Appreciation. He also serves as Secretary of other Fidelity funds; Vice President, General Counsel, and Secretary of FMR Co., Inc. (2001-present) and FMR; Assistant Secretary of Fidelity Management & Research (U.K.) Inc. (2001-present), Fidelity Research & Analysis Company (2001-present), and Fidelity Investments Money Management, Inc. (2001-present). Mr. Roiter is an Adjunct Member, Faculty of Law, at Boston College Law School (2003-present). Previously, Mr. Roiter served as Vice President and Secretary of Fidelity Distributors Corporation (FDC). |
Scott C. Goebel (39) |
| Year of Election or Appointment: 2007 Assistant Secretary of Advisor Europe Capital Appreciation. Mr. Goebel also serves as Assistant Secretary of other Fidelity funds (2007-present), and is an employee of FMR. |
R. Stephen Ganis (41) |
| Year of Election or Appointment: 2006 Anti-Money Laundering (AML) officer of Advisor Europe Capital Appreciation. Mr. Ganis also serves as AML officer of other Fidelity funds (2006-present) and FMR LLC (2003-present). Before joining Fidelity Investments, Mr. Ganis practiced law at Goodwin Procter, LLP (2000-2002). |
Joseph B. Hollis (59) |
| Year of Election or Appointment: 2006 Chief Financial Officer of Advisor Europe Capital Appreciation. Mr. Hollis also serves as Chief Financial Officer of other Fidelity funds. Mr. Hollis is President of Fidelity Pricing and Cash Management Services (FPCMS) (2005-present). Mr. Hollis also serves as President and Director of Fidelity Service Company, Inc. (2006-present). Previously, Mr. Hollis served as Senior Vice President of Cash Management Services (1999-2002) and Investment Management Operations (2002-2005). |
Kenneth A. Rathgeber (60) |
| Year of Election or Appointment: 2004 Chief Compliance Officer of Advisor Europe Capital Appreciation. Mr. Rathgeber also serves as Chief Compliance Officer of other Fidelity funds (2004-present) and Executive Vice President of Risk Oversight for Fidelity Investments (2002-present). He is Chief Compliance Officer of FMR (2005-present), FMR Co., Inc. (2005-present), Fidelity Management & Research (U.K.) Inc. (2005-present), Fidelity Research & Analysis Company (2005-present), Fidelity Investments Money Management, Inc. (2005-present), and Strategic Advisers, Inc. (2005-present). Previously, Mr. Rathgeber served as Executive Vice President and Chief Operating Officer for Fidelity Investments Institutional Services Company, Inc. (1998-2002). |
Bryan A. Mehrmann (46) |
| Year of Election or Appointment: 2005 Deputy Treasurer of Advisor Europe Capital Appreciation. Mr. Mehrmann also serves as Deputy Treasurer of other Fidelity funds (2005-present) and is an employee of FMR. Previously, Mr. Mehrmann served as Vice President of Fidelity Investments Institutional Services Group (FIIS)/Fidelity Investments Institutional Operations Corporation, Inc. (FIIOC) Client Services (1998-2004). |
Kenneth B. Robins (38) |
| Year of Election or Appointment: 2005 Deputy Treasurer of Advisor Europe Capital Appreciation. Mr. Robins also serves as Deputy Treasurer of other Fidelity funds (2005-present) and is an employee of FMR (2004-present). Before joining Fidelity Investments, Mr. Robins worked at KPMG LLP, where he was a partner in KPMG's department of professional practice (2002-2004) and a Senior Manager (1999-2000). In addition, Mr. Robins served as Assistant Chief Accountant, United States Securities and Exchange Commission (2000-2002). |
Robert G. Byrnes (40) |
| Year of Election or Appointment: 2005 Assistant Treasurer of Advisor Europe Capital Appreciation. Mr. Byrnes also serves as Assistant Treasurer of other Fidelity funds (2005-present) and is an employee of FMR (2005-present). Previously, Mr. Byrnes served as Vice President of FPCMS (2003-2005). Before joining Fidelity Investments, Mr. Byrnes worked at Deutsche Asset Management where he served as Vice President of the Investment Operations Group (2000-2003). |
Peter L. Lydecker (53) |
| Year of Election or Appointment: 2004 Assistant Treasurer of Advisor Europe Capital Appreciation. Mr. Lydecker also serves as Assistant Treasurer of other Fidelity funds (2004) and is an employee of FMR. |
Paul M. Murphy (60) |
| Year of Election or Appointment: 2007 Assistant Treasurer of Advisor Europe Capital Appreciation. Mr. Murphy also serves as Assistant Treasurer of other Fidelity funds (2007-present) and is an employee of FMR (2007-present). Previously, Mr. Murphy served as Chief Financial Officer of the Fidelity Funds (2005-2006), Vice President and Associate General Counsel of FMR (2007), and Senior Vice President of Fidelity Pricing and Cash Management Services Group (FPCMS) (1994-2007). |
Gary W. Ryan (49) |
| Year of Election or Appointment: 2005 Assistant Treasurer of Advisor Europe Capital Appreciation. Mr. Ryan also serves as Assistant Treasurer of other Fidelity funds (2005-present) and is an employee of FMR (2005-present). Previously, Mr. Ryan served as Vice President of Fund Reporting in FPCMS (1999-2005). |
** FMR Corp. merged with FMR LLC on October 1, 2007. Any references to FMR LLC for prior periods are deemed to be references to the prior entity.
Annual Report
Distributions
The Board of Trustees of Advisor Europe Capital Appreciation fund voted to pay to shareholders of record at the opening of business on record date, the following distributions per share derived from capital gains realized from sales of portfolio securities, and dividends derived from net investment income:
| Pay Date | Record Date | Dividends | Capital Gains |
Class A | 12/10/07 | 12/07/07 | $0.305 | $2.68 |
Class T | 12/10/07 | 12/07/07 | $0.186 | $2.68 |
Class B | 12/10/07 | 12/07/07 | $0.138 | $2.68 |
Class C | 12/10/07 | 12/07/07 | $0.146 | $2.68 |
The fund hereby designates as a capital gain dividend with respect to the taxable year ended October 31, 2007 $7,509,078, or, if subsequently determined to be different, the net capital gain of such year.
Class A designates 73%; Class B designates 100%; Class C designates 94%; and Class T designates 81%; of the dividends distributed in December during the fiscal year as amounts which may be taken into account as a dividend for purposes of the maximum rate under section 1(h)(11) of the Internal Revenue Code.
The amounts per share which represent income derived from sources within, and taxes paid to, foreign countries or possessions of the United States are as follows:
| Pay Date | Income | Taxes |
Class A | 12/04/06 | $0.149 | $0.0269 |
Class T | 12/04/06 | $0.133 | $0.0269 |
Class B | 12/04/06 | $0.105 | $0.0269 |
Class C | 12/04/06 | $0.115 | $0.0269 |
The fund will notify shareholders in January 2008 of amounts for use in preparing 2007 income tax returns.
Annual Report
Board Approval of Investment Advisory Contracts and Management Fees
Advisor Europe Capital Appreciation Fund
Each year, typically in July, the Board of Trustees, including the Independent Trustees (together, the Board), votes on the renewal of the management contract and sub-advisory agreements (together, the Advisory Contracts) for the fund. The Board, assisted by the advice of fund counsel and Independent Trustees' counsel, requests and considers a broad range of information throughout the year.
The Board meets regularly each month except August and takes into account throughout the year matters bearing on Advisory Contracts. The Board, acting directly and through its separate committees, considers at each of its meetings factors that are relevant to the annual renewal of the fund's Advisory Contracts, including the services and support provided to the fund and its shareholders. At the time of the renewal, the Board had 12 standing committees, each composed of Independent Trustees with varying backgrounds, to which the Board has assigned specific subject matter responsibilities in order to enhance effective decision-making by the Board. Each committee has adopted a written charter outlining the structure and purposes of the committee. One such committee, the Equity Contract Committee, meets periodically as needed throughout the year to consider matters specifically related to the annual renewal of Advisory Contracts. The committee requests and receives information on, and makes recommendations to the Independent Trustees concerning, the approval and annual review of the Advisory Contracts.
At its July 2007 meeting, the Board of Trustees, including the Independent Trustees, unanimously determined to renew the Advisory Contracts for the fund. In reaching its determination, the Board considered all factors it believed relevant, including (i) the nature, extent, and quality of the services to be provided to the fund and its shareholders (including the investment performance of the fund); (ii) the competitiveness of the management fee and total expenses of the fund; (iii) the total costs of the services to be provided by and the profits to be realized by the investment adviser and its affiliates from the relationship with the fund; (iv) the extent to which economies of scale would be realized as the fund grows; and (v) whether fee levels reflect these economies of scale, if any, for the benefit of fund shareholders. The Board also approved amendments to the fund's agreements with foreign sub-advisers to clarify that each sub-adviser provides services as an independent contractor.
In determining whether to renew the Advisory Contracts for the fund, the Board ultimately reached a determination, with the assistance of fund counsel and Independent Trustees' counsel, that the renewal of the Advisory Contracts and the compensation to be received by Fidelity under the management contract is consistent with Fidelity's fiduciary duty under applicable law. In addition to evaluating the specific factors noted above, the Board, in reaching its determination, is aware that shareholders in the fund have a broad range of investment choices available to them, including a wide choice among mutual funds offered by competitors to Fidelity, and that the fund's shareholders, with the opportunity to review and weigh the disclosure provided by the fund in its prospectus and other public disclosures, have chosen to invest in this fund, managed by Fidelity.
Annual Report
Nature, Extent, and Quality of Services Provided. The Board considered staffing within the investment adviser, FMR, and the sub-advisers (together, the Investment Advisers), including the background of the fund's portfolio manager and the fund's investment objective and discipline. The Independent Trustees also had discussions with senior management of Fidelity's investment operations and investment groups. The Board considered the structure of the portfolio manager compensation program and whether this structure provides appropriate incentives.
Resources Dedicated to Investment Management and Support Services. The Board reviewed the size, education, and experience of the Investment Advisers' investment staff, their use of technology, and the Investment Advisers' approach to recruiting, training, and retaining portfolio managers and other research, advisory, and management personnel. The Board considered Fidelity's extensive global research capabilities that enable the Investment Advisers to aggregate data from various sources in an effort to produce positive investment results. The Board noted that Fidelity's analysts have access to a variety of technological tools that enable them to perform both fundamental and quantitative analysis and to specialize in various disciplines. The Board also considered that Fidelity's portfolio managers and analysts have access to daily portfolio attribution that allows for monitoring of a fund's portfolio, as well as an electronic communication system that provides immediate real-time access to research concerning issuers and credit enhancers.
Shareholder and Administrative Services. The Board considered (i) the nature, extent, quality, and cost of advisory, administrative, distribution, and shareholder services performed by the Investment Advisers and their affiliates under the Advisory Contracts and under separate agreements covering transfer agency, pricing and bookkeeping, and securities lending services for the fund; (ii) the nature and extent of the Investment Advisers' supervision of third party service providers, principally custodians and subcustodians; and (iii) the resources devoted to, and the record of compliance with, the fund's compliance policies and procedures. The Board reviewed the allocation of fund brokerage, including allocations to brokers affiliated with the Investment Advisers, the use of brokerage commissions to pay fund expenses, and the use of "soft" commission dollars to pay for research services. The Board also considered that Fidelity voluntarily pays for market data out of its own resources. The Board also considered the agreement reached between the Independent Trustees and Fidelity in December 2006 following an independent review of matters relating to receipt of travel, entertainment, gifts and gratuities in violation of Fidelity policies.
Annual Report
Board Approval of Investment Advisory Contracts and
Management Fees - continued
The Board noted that the growth of fund assets across the complex allows Fidelity to reinvest in the development of services designed to enhance the value or convenience of the Fidelity funds as investment vehicles. These services include 24-hour access to account information and market information through phone representatives and over the Internet, and investor education materials and asset allocation tools.
Investment in a Large Fund Family. The Board considered the benefits to shareholders of investing in a Fidelity fund, including the benefits of investing in a fund that is part of a large family of funds offering a variety of investment disciplines and providing for a large variety of mutual fund investor services. For example, fund shareholders are offered the privilege of exchanging shares of the fund for shares of other Fidelity funds, as set forth in the fund's prospectus, without paying a sales charge. The Board noted that, since the last Advisory Contract renewals in July 2006, Fidelity has taken a number of actions that benefited particular funds, including (i) dedicating additional resources to investment research and to restructure the investment research teams; (ii) contractually agreeing to reduce the management fee on Fidelity Advisor Floating Rate High Income Fund; (iii) contractually agreeing to reduce the management fees on Fidelity's California, Massachusetts, New Jersey, and New York AMT Tax-Free Money Market Funds, launching new Institutional Classes and Service Classes of these funds, and contractually agreeing to impose expense limitations on these funds; (iv) eliminating the exchange fee on the Fidelity Select Portfolios and reducing the pricing and bookkeeping fee rates for these funds; (v) reducing the maximum transfer agency fee rates on high income funds and certain equity funds; (vi) proposing amended management contracts that, if approved by shareholders, will add a performance adjustment component to the management fees paid by 18 Fidelity Advisor equity funds; (vii) contractually agreeing to reduce fees for Ultra-Short Central Fund and the money market Central Funds; (viii) waiving the Fidelity Advisor funds' contingent deferred sales charge on certain redemptions made through systematic withdrawal programs; and (ix) amending the management contracts for equity and fixed-income funds whose management contracts incorporate a "group fee" structure by adding four new fee "breakpoints" to the group fee rate schedules.
Investment Performance and Compliance. The Board considered whether the fund has operated within its investment objective, as well as its record of compliance with its investment restrictions. It also reviewed the fund's absolute investment performance for each class, as well as the fund's relative investment performance for each class measured against (i) a broad-based securities market index, and (ii) a peer group of mutual funds deemed appropriate by the Board over multiple periods. The following charts considered by the Board show, over the one-, three-, and five-year periods ended December 31, 2006, the cumulative total returns of Institutional Class (Class I) and Class C of the fund, the cumulative total returns of a broad-based securities market index ("benchmark"), and a range of cumulative total returns of a peer group of mutual funds identified by Morningstar, Inc. as having an investment style similar to that of the fund based on underlying portfolio holdings. The returns of Institutional Class (Class I) and Class C show the performance of the highest and lowest performing classes, respectively (based on three-year performance). The box within each chart shows the 25th percentile return (bottom of box) and the 75th percentile return (top of box) of the peer group. Returns shown above the box are in the first quartile and returns shown below the box are in the fourth quartile. The percentage beaten numbers noted below each chart correspond to the percentile box and represent the percentage of funds in the peer group whose performance was equal to or lower than that of the class indicated.
Annual Report
Advisor Europe Capital Appreciation Fund
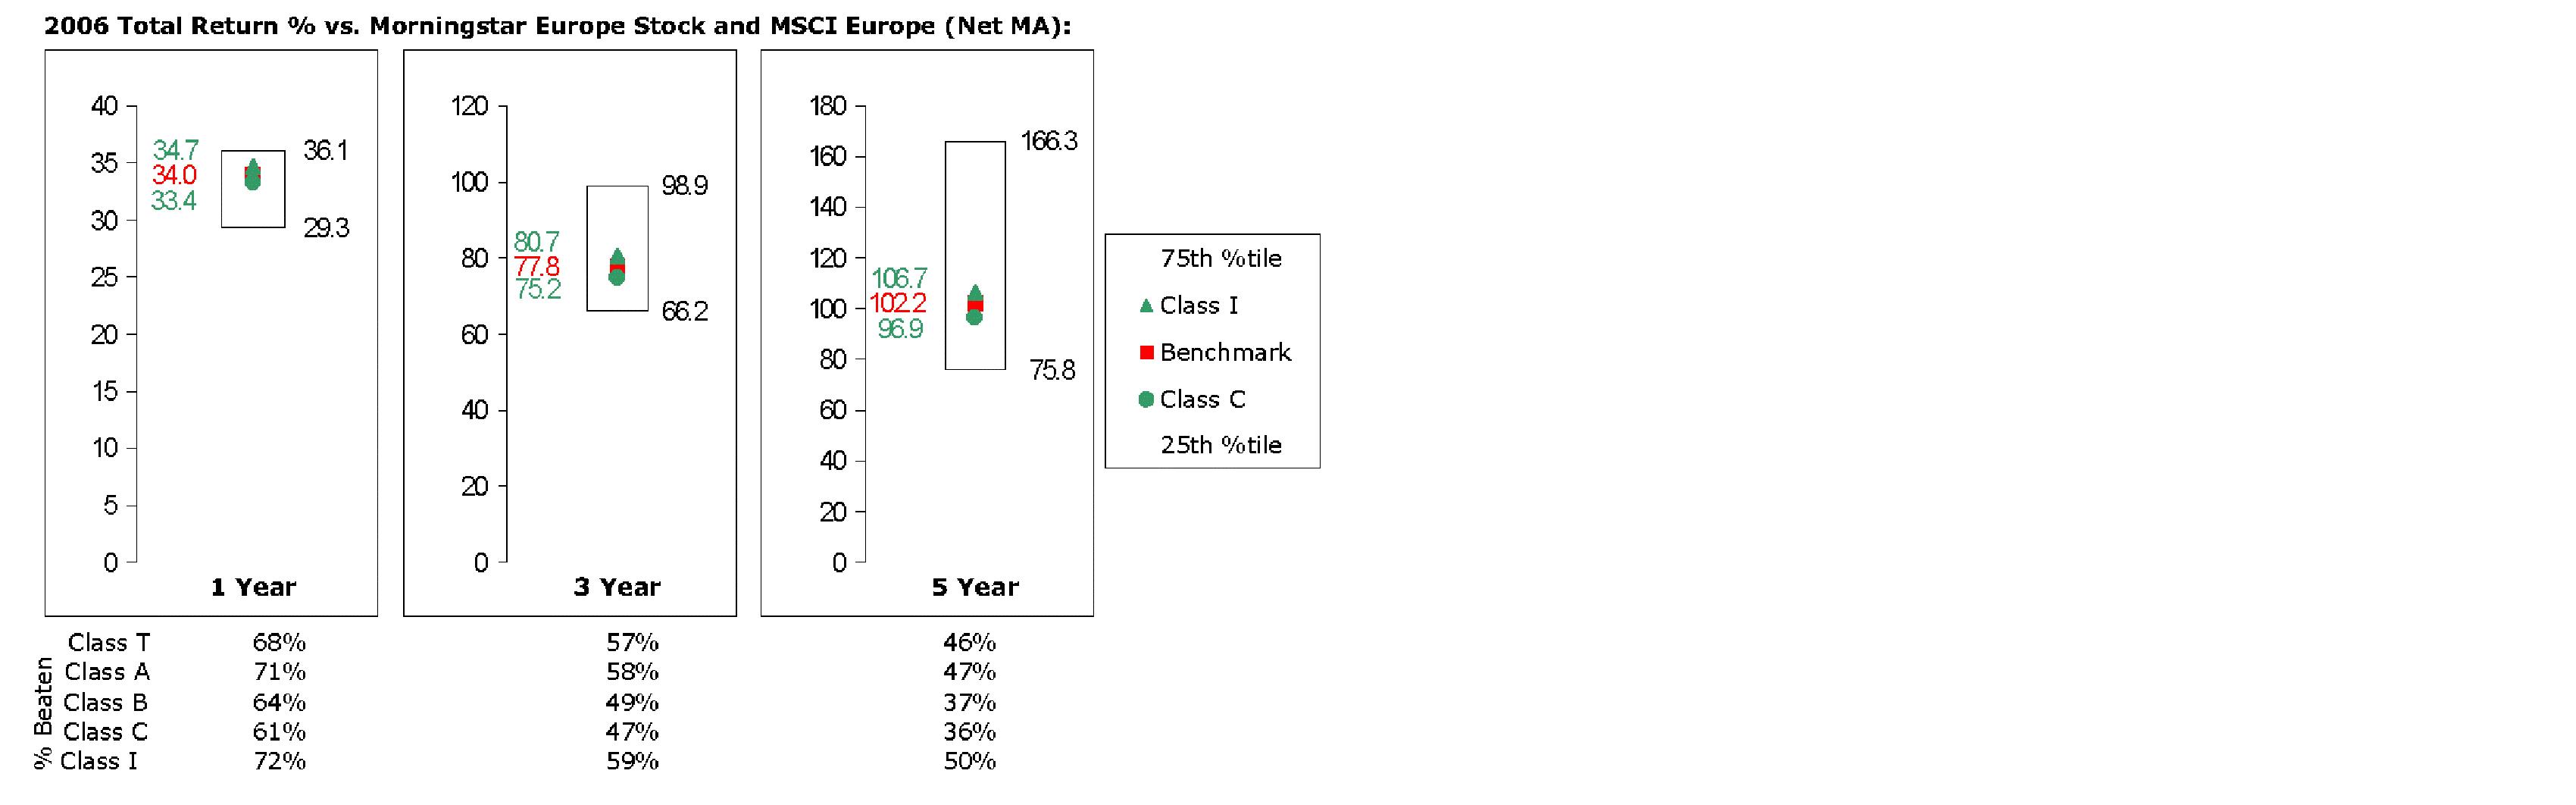
The Board reviewed the fund's relative investment performance against its peer group and stated that the performance of Institutional Class (Class I) of the fund was in the second quartile for all the periods shown. The Board also stated that the investment performance of Institutional Class (Class I) of the fund compared favorably to its benchmark for all the periods shown. The Board considered that the variations in performance among the fund's classes reflect the variations in class expenses, which result in lower performance for higher expense classes.
The Board considered that FMR has taken steps to refocus and strengthen equity research, equity portfolio management, and compliance.
Based on its review, and giving particular weight to the nature and quality of the resources dedicated by the Investment Advisers to maintain and improve relative performance, the Board concluded that the nature, extent, and quality of the services provided to the fund will benefit the fund's shareholders, particularly in light of the Board's view that the fund's shareholders benefit from investing in a fund that is part of a large family of funds offering a variety of investment disciplines and services.
Annual Report
Board Approval of Investment Advisory Contracts and
Management Fees - continued
Competitiveness of Management Fee and Total Fund Expenses. The Board considered the fund's management fee and total expenses compared to "mapped groups" of competitive funds and classes. Fidelity creates "mapped groups" by combining similar Lipper investment objective categories that have comparable management fee characteristics. Combining Lipper investment objective categories aids the Board's management fee and total expense comparisons by broadening the competitive group used for comparison and by reducing the number of universes to which various Fidelity funds are compared. The Board also considered supplemental information about how the fund's management fee and total expenses ranked relative to groups based on Lipper classifications, which take into account a fund's market capitalization and style.
The Board considered two proprietary management fee comparisons for the 12-month periods shown in the chart below. The group of Lipper funds used by the Board for management fee comparisons is referred to below as the "Total Mapped Group." The Total Mapped Group comparison focuses on a fund's standing relative to the total universe of comparable funds available to investors, in terms of gross management fees before expense reimbursements or caps. "TMG %" represents the percentage of funds in the Total Mapped Group that had management fees that were lower than the fund's. For example, a TMG % of 13% means that 87% of the funds in the Total Mapped Group had higher management fees than the fund. The "Asset-Size Peer Group" (ASPG) comparison focuses on a fund's standing relative to non-Fidelity funds similar in size to the fund within the Total Mapped Group. The ASPG represents at least 15% of the funds in the Total Mapped Group with comparable asset size and management fee characteristics, subject to a minimum of 50 funds (or all funds in the Total Mapped Group if fewer than 50). Additional information, such as the ASPG quartile in which the fund's management fee ranked, is also included in the chart and considered by the Board.
Annual Report
Advisor Europe Capital Appreciation Fund
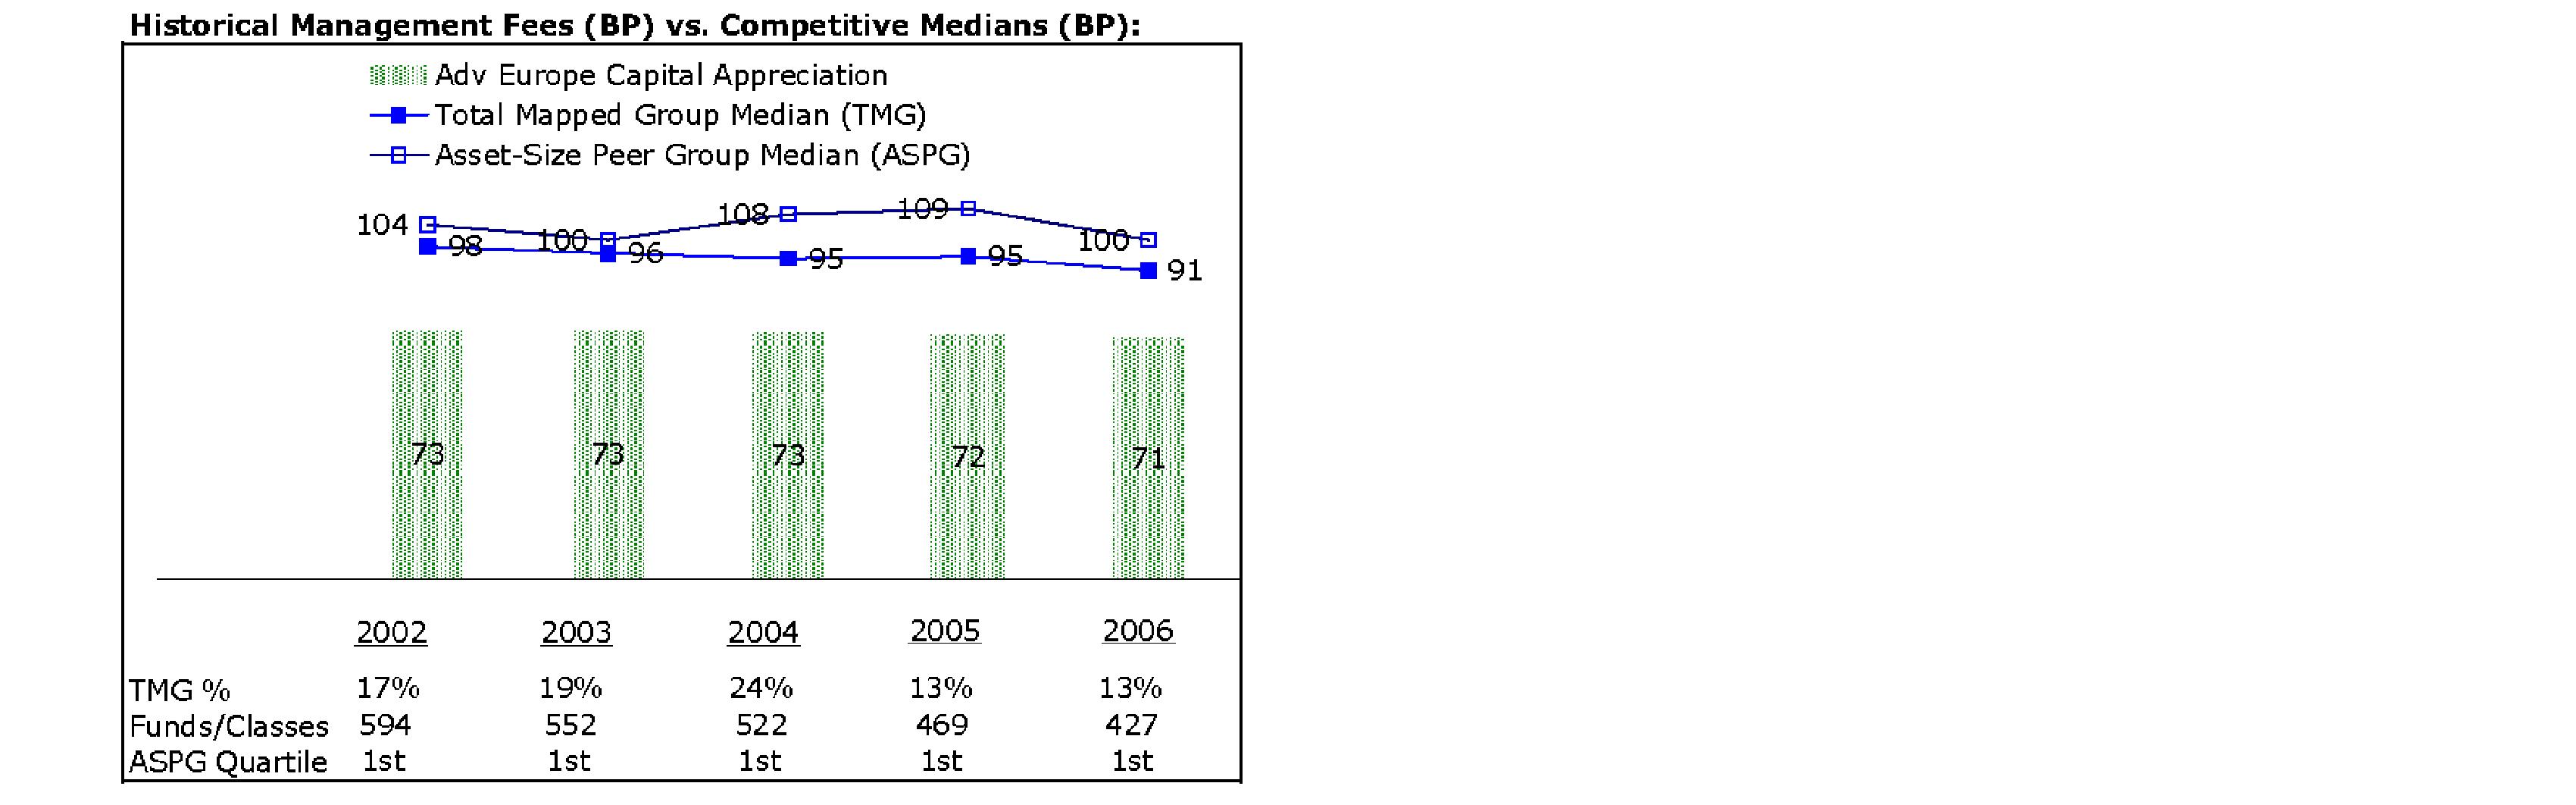
The Board noted that the fund's management fee ranked below the median of its Total Mapped Group and below the median of its ASPG for 2006.
Based on its review, the Board concluded that the fund's management fee was fair and reasonable in light of the services that the fund receives and the other factors considered.
In its review of each class's total expenses, the Board considered the fund's management fee as well as other fund or class expenses, as applicable, such as transfer agent fees, pricing and bookkeeping fees, fund-paid 12b-1 fees, and custodial, legal, and audit fees. The Board also noted the effects of any waivers and reimbursements on fees and expenses. As part of its review, the Board also considered current and historical total expenses of each class of the fund compared to competitive fund median expenses. Each class of the fund is compared to those funds and classes in the Total Mapped Group (used by the Board for management fee comparisons) that have a similar sales load structure.
The Board noted that the total expenses of Class A ranked below its competitive median for 2006, the total expenses of each of Class B and Class C ranked equal to its competitive median for 2006, and the total expenses of each of Class T and Institutional Class ranked above its competitive median for 2006. The Board noted that the fund offers multiple classes, each of which has a different sales load and 12b-1 fee structure, and that the multiple structures are intended to offer a range of pricing options for the intermediary market. The Board also noted that the total expenses of the classes vary primarily by the level of their 12b-1 fees, although differences in transfer agent fees may also cause expenses to vary from class to class.
Annual Report
Board Approval of Investment Advisory Contracts and
Management Fees - continued
In its review of total expenses, the Board also considered Fidelity fee structures and other information on clients that FMR and its affiliates service in other competitive markets, such as other mutual funds advised or subadvised by FMR or its affiliates, pension plan clients, and other institutional clients.
Based on its review, the Board concluded that the total expenses of each class of the fund were reasonable, although in some cases above the median of the universe presented for comparison, in light of the services that the fund and its shareholders receive and the other factors considered.
Costs of the Services and Profitability. The Board considered the revenues earned and the expenses incurred by Fidelity in conducting the business of developing, marketing, distributing, managing, administering and servicing the fund and its shareholders. The Board also considered the level of Fidelity's profits in respect of all the Fidelity funds.
On an annual basis, FMR presents to the Board Fidelity's profitability for the fund. Fidelity calculates the profitability for each fund, as well as aggregate profitability for groups of Fidelity funds and all Fidelity funds, using a series of detailed revenue and cost allocation methodologies which originate with the audited books and records of Fidelity. The Audit Committee of the Board reviews any significant changes from the prior year's methodologies.
PricewaterhouseCoopers LLP (PwC), independent registered public accounting firm and auditor to Fidelity and certain Fidelity funds, has been engaged annually by the Board as part of the Board's assessment of the results of Fidelity's profitability analysis. PwC's engagement includes the review and assessment of Fidelity's methodologies used in determining the revenues and expenses attributable to Fidelity's mutual fund business, and completion of agreed-upon procedures surrounding the mathematical accuracy of fund profitability and its conformity to allocation methodologies. After considering PwC's reports issued under the engagement and information provided by Fidelity, the Board believes that while other allocation methods may also be reasonable, Fidelity's profitability methodologies are reasonable in all material respects.
The Board has also reviewed Fidelity's non-fund businesses and any fall-out benefits related to the mutual fund business as well as cases where Fidelity's affiliates may benefit from or be related to the fund's business.
The Board considered the costs of the services provided by and the profits realized by Fidelity in connection with the operation of the fund and determined that the amount of profit is a fair entrepreneurial profit for the management of the fund.
Economies of Scale. The Board considered whether there have been economies of scale in respect of the management of the Fidelity funds, whether the Fidelity funds (including the fund) have appropriately benefited from any such economies of scale, and whether there is potential for realization of any further economies of scale. The Board considered the extent to which the fund will benefit from economies of scale through increased services to the fund, through waivers or reimbursements, or through fee or expense reductions, including reductions that occur through operation of the transfer agent agreement. The transfer agent fee varies in part based on the number of accounts in the fund. If the number of accounts decreases or the average account size increases, the overall transfer agent fee rate decreases.
Annual Report
The Board recognized that the fund's management contract incorporates a "group fee" structure, which provides for lower group fee rates as total fund assets under FMR's management increase, and for higher group fee rates as total fund assets under FMR's management decrease. FMR determines the group fee rates based on a tiered asset "breakpoint" schedule. In connection with the renewal of the fund's management contract, the Board approved amendments to the fund's management contract that added four new fee breakpoints to the group fee rate schedule for assets under FMR's management above $1,386 billion. The Board considered that the group fee rate declines under both the present and amended schedules, but that under the amended schedule, the group fee rate declines faster as assets under FMR's management exceed $1,386 billion. The Board considered that the group fee is designed to deliver the benefits of economies of scale to fund shareholders when total fund assets increase, even if assets of any particular fund are unchanged or have declined, because some portion of Fidelity's costs are attributable to services provided to all Fidelity funds, and all funds benefit if those costs can be allocated among more assets. The Board concluded that, given the group fee structure, fund shareholders will achieve a certain level of economies of scale as assets under FMR's management increase at the fund complex level, regardless of whether Fidelity achieves any such economies of scale.
The Board further concluded that any potential economies of scale are being shared between fund shareholders and Fidelity in an appropriate manner.
Additional Information Requested by the Board. In order to develop fully the factual basis for consideration of the Fidelity funds' Advisory Contracts, the Board requested and received additional information on several topics, including (i) fund performance trends and actions to be taken by FMR to improve certain funds' overall performance; (ii) Fidelity's portfolio manager compensation structure, including its effects on fund profitability and the extent to which portfolio manager compensation is linked to fund performance; (iii) Fidelity's fee structures; (iv) the funds' sub-advisory arrangements; and (v) accounts managed by Fidelity other than the Fidelity funds.
Based on its evaluation of all of the conclusions noted above, and after considering all material factors, the Board ultimately concluded that the advisory fee structures are fair and reasonable, and that the fund's Advisory Contracts should be renewed.
Annual Report
Annual Report
Annual Report
Annual Report
Annual Report
Annual Report
Annual Report
Annual Report
Annual Report
Investment Adviser
Fidelity Management & Research Company
Boston, MA
Investment Sub-Advisers
FMR Co., Inc.
Fidelity Management & Research
(U.K.) Inc.
Fidelity Research & Analysis Company
Fidelity International Investment Advisors
Fidelity International Investment Advisors (U.K.) Limited
Fidelity Investments Japan Limited
General Distributor
Fidelity Distributors Corporation
Boston, MA
Transfer and Service Agents
Fidelity Investments Institutional Operations Company, Inc.
Boston, MA
Fidelity Service Company, Inc.
Boston, MA
Custodian
State Street Bank and Trust Company
Quincy, MA
AEUR-UANN-1207
1.784739.104
(Fidelity Investment logo)(registered trademark)
(Fidelity Investment logo)(registered trademark)
Fidelity® Advisor
Europe Capital Appreciation
Fund - Institutional Class
Annual Report
October 31, 2007
(2_fidelity_logos) (Registered_Trademark)
Contents
Chairman's Message | <Click Here> | Ned Johnson's message to shareholders. |
Performance | <Click Here> | How the fund has done over time. |
Management's Discussion | <Click Here> | The manager's review of fund performance, strategy and outlook |
Shareholder Expense Example | <Click Here> | An example of shareholder expenses. |
Investment Changes | <Click Here> | A summary of major shifts in the fund's investments over the past six months. |
Investments | <Click Here> | A complete list of the fund's investments with their market values. |
Financial Statements | <Click Here> | Statements of assets and liabilities, operations, and changes in net assets,
as well as financial highlights. |
Notes | <Click Here> | Notes to the financial statements. |
Report of Independent Registered Public Accounting Firm | <Click Here> | |
Trustees and Officers | <Click Here> | |
Distributions | <Click Here> | |
Board Approval of Investment Advisory Contracts and Management Fees | <Click Here> | |
| | |
To view a fund's proxy voting guidelines and proxy voting record for the 12-month period ended June 30, visit http://www.fidelity.com (search for "proxy voting guidelines") or visit the Securities and Exchange Commission's (SEC) web site at http://www.sec.gov. You may also call 1-877-208-0098 to request a free copy of the proxy voting guidelines.
Standard & Poor's, S&P and S&P 500 are registered service marks of The McGraw-Hill Companies, Inc. and have been licensed for use by Fidelity Distributors Corporation.
Other third party marks appearing herein are the property of their respective owners.
All other marks appearing herein are registered or unregistered trademarks or service marks of FMR LLC or an affiliated company.
Annual Report
This report and the financial statements contained herein are submitted for the general information of the shareholders of the fund. This report is not authorized for distribution to prospective investors in the fund unless preceded or accompanied by an effective prospectus.
A fund files its complete schedule of portfolio holdings with the SEC for the first and third quarters of each fiscal year on Form N-Q. Forms N-Q are available on the SEC's web site at http://www.sec.gov. A fund's Forms N-Q may be reviewed and copied at the SEC's Public Reference Room in Washington, DC. Information regarding the operation of the SEC's Public Reference Room may be obtained by calling 1-800-SEC-0330. For a complete list of a fund's portfolio holdings, view the most recent holdings listing, semiannual report, or annual report on Fidelity's web site at http://www.fidelity.com or http://www.advisor.fidelity.com, as applicable.
NOT FDIC INSURED · MAY LOSE VALUE · NO BANK GUARANTEE
Neither the fund nor Fidelity Distributors Corporation is a bank.
Annual Report
Chairman's Message
(photo_of_Edward_C_Johnson_3d)
Dear Shareholder:
Many stock and bond markets around the world have been unsettled of late; however, volatility can often lead to opportunity for patient investors. Financial markets are always unpredictable, but there are a number of time-tested principles that can put the historical odds in your favor.
One of the basic tenets is to invest for the long term. Over time, riding out the markets' inevitable ups and downs has proven much more effective than selling into panic or chasing the hottest trend. Even missing only a few of the markets' best days can significantly diminish investor returns. Patience also affords the benefits of compounding - of earning interest on additional income or reinvested dividends and capital gains. There are tax advantages and cost benefits to consider as well. The more you sell, the more taxes you pay, and the more you trade, the higher the costs. While staying the course doesn't eliminate risk, it can considerably lessen the effect of short-term declines.
You can further manage your investing risk through diversification. And today, more than ever, geographic diversification should be taken into account. Studies indicate that asset allocation is the single most important determinant of a portfolio's long-term success. The right mix of stocks, bonds and cash - aligned to your particular risk tolerance and investment objective - is very important. Age-appropriate rebalancing is also an essential aspect of asset allocation. For younger investors, an emphasis on equities - which historically have been the best-performing asset class over time - is encouraged. As investors near their specific goal, such as retirement or sending a child to college, consideration may be given to replacing volatile assets (e.g. common stocks) with more-stable fixed investments (bonds or savings plans).
A third investment principle - investing regularly - can help lower the average cost of your purchases. Investing a certain amount of money each month or quarter helps ensure you won't pay for all your shares at market highs. This strategy - known as dollar cost averaging - also reduces unconstructive "emotion" from investing, helping shareholders avoid selling weak performers just prior to an upswing, or chasing a hot performer just before a correction.
We invite you to contact us via the Internet, through our Investor Centers or over the phone. It is our privilege to provide you the information you need to make the investments that are right for you.
Sincerely,
/s/Edward C. Johnson 3d
Edward C. Johnson 3d
Annual Report
Performance: The Bottom Line
Average annual total return reflects the change in the value of an investment, assuming reinvestment of the class' dividend income and capital gains (the profits earned upon the sale of securities that have grown in value) and assuming a constant rate of performance each year. The $10,000 table and the fund's returns do not reflect the deduction of taxes that a shareholder would pay on fund distributions or the redemption of fund shares. During periods of reimbursement by Fidelity, a fund's total return will be greater than it would be had the reimbursement not occurred. How a fund did yesterday is no guarantee of how it will do tomorrow.
Average Annual Total Returns
Periods ended October 31, 2007 | Past 1
year | Past 5
years | Life of
fundA |
Institutional Class | 29.57% | 24.26% | 10.42% |
A From December 17, 1998.
$10,000 Over Life of Fund *
Let's say hypothetically that $10,000 was invested in Fidelity® Advisor Europe Capital Appreciation Fund - Institutional Class on December 31, 1998. The chart shows how the value of your investment would have changed, and also shows how the MSCI® Europe Index performed over the same period.
* From December 31, 1998 (first date following the fund's commencement for which the life of fund return for the MSCI Europe Index is available).
Annual Report
Management's Discussion of Fund Performance
Comments from Melissa Reilly, Portfolio Manager of Fidelity® Advisor Europe Capital Appreciation Fund
Foreign stocks, with a large assist from a weak U.S. dollar, generally had higher returns for U.S. investors than domestic equities during the 12-month period ending October 31, 2007. The backdrop for global stocks was solid, with robust economic growth and relatively high corporate profitability worldwide. Developed international equity markets, as measured by the Morgan Stanley Capital InternationalSM Europe, Australasia, and Far East (MSCI® EAFE®) Index - a performance monitor of established markets outside the United States and Canada - rose 25.09%. In comparison, the Standard & Poor's 500SM Index, a gauge of U.S. stocks, was up 14.56%. Among countries making up at least 1% of the EAFE benchmark, Finland had the best showing, soaring nearly 69%, while Hong Kong gained roughly 66%. The United Kingdom and Japan, the two largest components of the index, both underperformed. Fallout from the credit crunch and concerns about export growth tempered UK stocks, while Japan struggled with a slowdown in consumer spending and sluggish domestic growth. Emerging markets were the period's big winners, advancing 68.33% as measured by the MSCI Emerging Markets index.
During the year, the fund's Institutional Class shares returned 29.57%, outpacing the 28.20% advance of its benchmark, the MSCI Europe index. Favorable stock picking was the primary driver of performance, but the fund also benefited from its big underweighting in the generally weak financials group. The best stock picks were in energy, consumer discretionary, industrials and health care, with such top contributors as Arcandor, the large German retailer; Actelion, an out-of-index Swiss biopharmaceuticals firm; and Royal Dutch Shell, the UK-listed oil giant, which I added during the period. The major drag on relative performance came from the materials sector, where not owning some of the index's top-performing stocks, such as BHP Billiton, the UK-listed mining giant, detracted. In addition, weakening business fundamentals at UK cable and telecommunications firm Virgin Media drove down the price of this U.S.-listed stock, making it the period's biggest detractor. Big positions in cash and sovereign bonds also hurt. Virgin Media was not in the portfolio at period end.
The views expressed above reflect those of the portfolio manager(s) only through the end of the period as stated on the cover of this report and do not necessarily represent the views of Fidelity or any other person in the Fidelity organization. Any such views are subject to change at any time based upon market or other conditions and Fidelity disclaims any responsibility to update such views. These views may not be relied on as investment advice and, because investment decisions for a Fidelity fund are based on numerous factors, may not be relied on as an indication of trading intent on behalf of any Fidelity fund.
Annual Report
Shareholder Expense Example
As a shareholder of the Fund, you incur two types of costs: (1) transaction costs, including sales charges (loads) on purchase payments or redemption proceeds, redemption fees, and (2) ongoing costs, including management fees, distribution and/or service (12b-1) fees and other Fund expenses. This Example is intended to help you understand your ongoing costs (in dollars) of investing in the Fund and to compare these costs with the ongoing costs of investing in other mutual funds.
The Example is based on an investment of $1,000 invested at the beginning of the period and held for the entire period (May 1, 2007 to October 31, 2007).
Actual Expenses
The first line of the accompanying table for each class of the Fund provides information about actual account values and actual expenses. You may use the information in this line, together with the amount you invested, to estimate the expenses that you paid over the period. Simply divide your account value by $1,000.00 (for example, an $8,600 account value divided by $1,000.00 = 8.6), then multiply the result by the number in the first line for a class of the Fund under the heading entitled "Expenses Paid During Period" to estimate the expenses you paid on your account during this period. In addition, the Fund, as a shareholder in the underlying Fidelity Central Funds, will indirectly bear its pro rata share of the fees and expenses incurred by the underlying Fidelity Central Funds. These fees and expenses are not included in the Fund's annualized expense ratio used to calculate the expense estimate in the table below.
Hypothetical Example for Comparison Purposes
The second line of the accompanying table for each class of the Fund provides information about hypothetical account values and hypothetical expenses based on a Class' actual expense ratio and an assumed rate of return of 5% per year before expenses, which is not the Class' actual return. The hypothetical account values and expenses may not be used to estimate the actual ending account balance or expenses you paid for the period. You may use this information to compare the ongoing costs of investing in the Fund and other funds. To do so, compare this 5% hypothetical example with the 5% hypothetical examples that appear in the shareholder reports of the other funds. In addition, the Fund, as a share-holder in the underlying Fidelity Central Funds, will indirectly bear its pro rata share of the fees and expenses incurred by the underlying Fidelity Central Funds. These fees and expenses are not included in the Fund's annualized expense ratio used to calculate the expense estimate in the table below.
Annual Report
Shareholder Expense Example - continued
Please note that the expenses shown in the table are meant to highlight your ongoing costs only and do not reflect any transaction costs. Therefore, the second line of the table is useful in comparing ongoing costs only, and will not help you determine the relative total costs of owning different funds. In addition, if these transactional costs were included, your costs would have been higher.
| Beginning
Account Value
May 1, 2007 | Ending
Account Value
October 31, 2007 | Expenses Paid
During Period*
May 1, 2007 to
October 31, 2007 |
Class A | | | |
Actual | $ 1,000.00 | $ 1,086.70 | $ 7.89 |
HypotheticalA | $ 1,000.00 | $ 1,017.64 | $ 7.63 |
Class T | | | |
Actual | $ 1,000.00 | $ 1,085.80 | $ 9.20 |
HypotheticalA | $ 1,000.00 | $ 1,016.38 | $ 8.89 |
Class B | | | |
Actual | $ 1,000.00 | $ 1,082.70 | $ 11.81 |
HypotheticalA | $ 1,000.00 | $ 1,013.86 | $ 11.42 |
Class C | | | |
Actual | $ 1,000.00 | $ 1,083.00 | $ 11.81 |
HypotheticalA | $ 1,000.00 | $ 1,013.86 | $ 11.42 |
Institutional Class | | | |
Actual | $ 1,000.00 | $ 1,089.10 | $ 5.95 |
HypotheticalA | $ 1,000.00 | $ 1,019.51 | $ 5.75 |
A 5% return per year before expenses
* Expenses are equal to each Class' annualized expense ratio (shown in the table below); multiplied by the average account value over the period, multiplied by 184/365 (to reflect the one-half year period).
| Annualized
Expense Ratio |
Class A | 1.50% |
Class T | 1.75% |
Class B | 2.25% |
Class C | 2.25% |
Institutional Class | 1.13% |
Annual Report
Investment Changes
Top Five Stocks as of October 31, 2007 |
| % of fund's
net assets | % of fund's net assets
6 months ago |
Royal Dutch Shell PLC Class A (United Kingdom) (United Kingdom, Oil, Gas & Consumable Fuels) | 3.7 | 0.0 |
Vodafone Group PLC (United Kingdom, Telecommunications Services) | 2.8 | 0.0 |
Roche Holding AG (participation certificate) (Switzerland, Pharmaceuticals) | 2.6 | 0.0 |
E.ON AG (Germany, Electric Utilities) | 2.3 | 3.0 |
Nestle SA (Reg.) (Switzerland, Food Products) | 2.2 | 2.9 |
| 13.6 | |
Top Five Market Sectors as of October 31, 2007 |
| % of fund's
net assets | % of fund's net assets
6 months ago |
Financials | 24.8 | 14.4 |
Industrials | 10.6 | 7.2 |
Energy | 10.4 | 5.3 |
Consumer Discretionary | 9.9 | 17.4 |
Consumer Staples | 9.6 | 8.9 |
Top Five Countries as of October 31, 2007 |
(excluding cash equivalents) | % of fund's
net assets | % of fund's net assets
6 months ago |
United Kingdom | 20.8 | 13.6 |
Germany | 19.3 | 12.1 |
France | 15.4 | 17.1 |
Switzerland | 12.9 | 11.0 |
Spain | 4.8 | 0.0 |
Percentages are adjusted for the effect of open futures contracts, if applicable. |
Asset Allocation (% of fund's net assets) |
As of October 31, 2007 | As of April 30, 2007 |
| Stocks 97.5% | | | Stocks 85.5% | |
| Bonds 0.0% | | | Bonds 5.2% | |
| Short-Term
Investments and
Net Other Assets 2.5% | | | Short-Term
Investments and
Net Other Assets 9.3% | |

Annual Report
Investments October 31, 2007
Showing Percentage of Net Assets
Common Stocks - 97.1% |
| Shares | | Value |
Argentina - 0.5% |
Cresud S.A.C.I.F. y A. sponsored ADR | 16,400 | | $ 404,752 |
Australia - 1.1% |
CSL Ltd. | 26,022 | | 884,647 |
Austria - 0.7% |
voestalpine AG | 6,600 | | 593,518 |
Belgium - 1.9% |
Fortis | 23,600 | | 754,268 |
InBev SA | 7,900 | | 745,790 |
TOTAL BELGIUM | | 1,500,058 |
Bermuda - 1.2% |
Aquarius Platinum Ltd. (United Kingdom) | 8,000 | | 306,535 |
SeaDrill Ltd. (a) | 26,800 | | 637,976 |
TOTAL BERMUDA | | 944,511 |
Cyprus - 1.2% |
Bank of Cyprus Public Co. Ltd. | 47,400 | | 920,220 |
Finland - 2.3% |
Metso Corp. | 10,900 | | 662,629 |
Nokia Corp. sponsored ADR | 30,500 | | 1,211,460 |
TOTAL FINLAND | | 1,874,089 |
France - 15.4% |
Alcatel-Lucent SA sponsored ADR | 45,200 | | 437,988 |
Alstom SA | 4,000 | | 944,038 |
AXA SA | 29,400 | | 1,315,062 |
Bouygues SA | 7,200 | | 691,182 |
Cap Gemini SA | 8,800 | | 560,975 |
Eutelsat Communications | 16,936 | | 457,613 |
Groupe Danone | 9,600 | | 828,000 |
LVMH Moet Hennessy - Louis Vuitton | 5,300 | | 682,478 |
Pinault Printemps-Redoute SA | 3,300 | | 654,142 |
Remy Cointreau SA | 6,100 | | 468,839 |
Renault SA | 3,600 | | 604,497 |
Societe Generale Series A | 6,700 | | 1,128,950 |
Suez SA (France) | 13,400 | | 871,000 |
Total SA sponsored ADR | 12,200 | | 983,442 |
Veolia Environnement | 9,450 | | 844,060 |
Vinci SA | 9,500 | | 779,295 |
TOTAL FRANCE | | 12,251,561 |
Common Stocks - continued |
| Shares | | Value |
Germany - 19.3% |
Adidas-Salomon AG | 10,100 | | $ 673,844 |
Allianz AG (Reg.) | 5,100 | | 1,152,600 |
Arcandor AG (a) | 7,200 | | 231,576 |
Bayer AG | 12,534 | | 1,032,802 |
Continental AG | 4,200 | | 635,209 |
DaimlerChrysler AG | 8,200 | | 903,230 |
Deutsche Boerse AG | 5,300 | | 836,204 |
E.ON AG | 9,200 | | 1,796,760 |
Hochtief AG | 5,500 | | 759,468 |
Lanxess AG | 11,800 | | 589,294 |
Linde AG | 5,000 | | 632,691 |
MAN AG | 6,400 | | 1,142,350 |
Muenchener Rueckversicherungs-Gesellschaft AG (Reg.) | 5,300 | | 1,016,806 |
RWE AG | 8,300 | | 1,133,240 |
Siemens AG (Reg.) | 10,700 | | 1,459,159 |
SolarWorld AG | 10,400 | | 705,461 |
Wacker Chemie AG | 2,700 | | 663,043 |
TOTAL GERMANY | | 15,363,737 |
Greece - 2.1% |
Bank of Piraeus | 25,575 | | 1,025,629 |
Cosmote Mobile Telecommunications SA | 19,600 | | 676,404 |
TOTAL GREECE | | 1,702,033 |
Ireland - 1.1% |
Anglo Irish Bank Corp. PLC | 24,900 | | 418,471 |
CRH PLC | 12,500 | | 477,017 |
TOTAL IRELAND | | 895,488 |
Italy - 2.8% |
IFIL Finanziaria di Partecipazioni SpA | 8,264 | | 94,215 |
Intesa Sanpaolo SpA | 138,600 | | 1,095,786 |
Prysmian SpA | 2,600 | | 74,701 |
Unicredito Italiano SpA | 113,600 | | 971,044 |
TOTAL ITALY | | 2,235,746 |
Luxembourg - 2.1% |
Acergy SA | 17,600 | | 509,344 |
ArcelorMittal SA | 15,000 | | 1,203,953 |
TOTAL LUXEMBOURG | | 1,713,297 |
Netherlands - 1.9% |
Koninklijke Ahold NV | 32,760 | | 493,038 |
Common Stocks - continued |
| Shares | | Value |
Netherlands - continued |
Nutreco Holding NV | 8,017 | | $ 547,649 |
SBM Offshore NV | 12,700 | | 488,698 |
TOTAL NETHERLANDS | | 1,529,385 |
Norway - 2.2% |
Marine Harvest ASA (a) | 586,000 | | 594,026 |
Petroleum Geo-Services ASA | 23,800 | | 700,717 |
Telenor ASA | 18,600 | | 436,480 |
TOTAL NORWAY | | 1,731,223 |
Spain - 4.8% |
Banco Santander Central Hispano SA | 42,600 | | 925,783 |
Compania de Distribucion Integral Logista SA | 5,100 | | 397,891 |
Inditex SA | 10,300 | | 766,278 |
Telefonica SA sponsored ADR | 17,400 | | 1,730,430 |
TOTAL SPAIN | | 3,820,382 |
Sweden - 2.8% |
Atlas Copco AB (A Shares) | 35,000 | | 585,284 |
H&M Hennes & Mauritz AB (B Shares) | 12,300 | | 818,871 |
Investor AB (B Shares) | 18,300 | | 452,190 |
SSAB Svenskt Stal AB (B Shares) | 12,150 | | 357,592 |
TOTAL SWEDEN | | 2,213,937 |
Switzerland - 12.9% |
ABB Ltd. (Reg.) | 44,492 | | 1,338,255 |
Actelion Ltd. (Reg.) (a) | 13,265 | | 659,070 |
Credit Suisse Group (Reg.) | 7,417 | | 502,131 |
Julius Baer Holding AG (Bearer) | 7,894 | | 682,879 |
Lindt & Spruengli AG | 20 | | 761,461 |
Nestle SA (Reg.) | 3,840 | | 1,774,080 |
Pargesa Holding SA | 4,021 | | 457,886 |
Roche Holding AG (participation certificate) | 12,204 | | 2,085,664 |
Sonova Holding AG | 6,291 | | 706,061 |
Swiss Life Holding | 2,975 | | 821,894 |
UBS AG (Reg.) | 9,090 | | 488,042 |
TOTAL SWITZERLAND | | 10,277,423 |
United Kingdom - 20.8% |
3i Group plc | 21,975 | | 495,705 |
Barclays PLC | 18,800 | | 238,995 |
BG Group PLC | 65,900 | | 1,215,856 |
BP PLC | 68,600 | | 891,686 |
Common Stocks - continued |
| Shares | | Value |
United Kingdom - continued |
Burberry Group PLC | 36,800 | | $ 470,531 |
GlaxoSmithKline PLC | 24,000 | | 615,000 |
Gyrus Group PLC (a) | 60,700 | | 539,498 |
HSBC Holdings PLC sponsored ADR | 14,500 | | 1,443,040 |
Man Group plc | 52,000 | | 635,690 |
Next PLC | 13,900 | | 638,085 |
Reckitt Benckiser Group PLC | 19,100 | | 1,107,508 |
Royal Bank of Scotland Group PLC | 41,200 | | 442,418 |
Royal Dutch Shell PLC Class A (United Kingdom) | 66,800 | | 2,923,434 |
Scottish & Southern Energy PLC | 25,300 | | 818,455 |
Standard Chartered PLC (United Kingdom) | 24,100 | | 934,961 |
Vodafone Group PLC | 202,200 | | 794,039 |
Vodafone Group PLC sponsored ADR | 36,850 | | 1,447,100 |
Xstrata PLC | 12,300 | | 881,478 |
TOTAL UNITED KINGDOM | | 16,533,479 |
TOTAL COMMON STOCKS (Cost $68,156,497) | 77,389,486 |
Nonconvertible Preferred Stocks - 0.4% |
| | | |
Italy - 0.4% |
Istituto Finanziario Industriale SpA (IFI) (a)
(Cost $141,694) | 7,400 | | 308,125 |
Money Market Funds - 3.1% |
| | | |
Fidelity Cash Central Fund, 4.97% (b)
(Cost $2,435,477) | 2,435,477 | | 2,435,477 |
TOTAL INVESTMENT PORTFOLIO - 100.6% (Cost $70,733,668) | | 80,133,088 |
NET OTHER ASSETS - (0.6)% | | (474,841) |
NET ASSETS - 100% | $ 79,658,247 |
Legend |
(a) Non-income producing |
(b) Affiliated fund that is available only to investment companies and other accounts managed by Fidelity Investments. The rate quoted is the annualized seven-day yield of the fund at period end. A complete unaudited listing of the fund's holdings as of its most recent quarter end is available upon request. |
Affiliated Central Funds |
Information regarding fiscal year to date income earned by the Fund from investments in Fidelity Central Funds is as follows: |
Fund | Income earned |
Fidelity Cash Central Fund | $ 196,084 |
Fidelity Securities Lending Cash Central Fund | 63,983 |
Total | $ 260,067 |
See accompanying notes which are an integral part of the financial statements.
Annual Report
Financial Statements
Statement of Assets and Liabilities
| October 31, 2007 |
Assets | | |
Investment in securities, at value - See accompanying schedule: Unaffiliated issuers (cost $68,298,191) | $ 77,697,611 | |
Fidelity Central Funds (cost $2,435,477) | 2,435,477 | |
Total Investments (cost $70,733,668) | | $ 80,133,088 |
Cash | | 7,352 |
Receivable for fund shares sold | | 88,285 |
Dividends receivable | | 78,686 |
Distributions receivable from Fidelity Central Funds | | 7,046 |
Prepaid expenses | | 24 |
Other receivables | | 4,010 |
Total assets | | 80,318,491 |
| | |
Liabilities | | |
Payable for fund shares redeemed | $ 504,700 | |
Accrued management fee | 47,328 | |
Distribution fees payable | 36,855 | |
Other affiliated payables | 23,057 | |
Other payables and accrued expenses | 48,304 | |
Total liabilities | | 660,244 |
| | |
Net Assets | | $ 79,658,247 |
Net Assets consist of: | | |
Paid in capital | | $ 54,640,015 |
Undistributed net investment income | | 1,144,523 |
Accumulated undistributed net realized gain (loss) on investments and foreign currency transactions | | 14,471,876 |
Net unrealized appreciation (depreciation) on investments and assets and liabilities in foreign currencies | | 9,401,833 |
Net Assets | | $ 79,658,247 |
See accompanying notes which are an integral part of the financial statements.
Annual Report
Financial Statements - continued
Statement of Assets and Liabilities - continued
| October 31, 2007 |
Calculation of Maximum Offering Price
Class A:
Net Asset Value and redemption price per share ($29,272,945 ÷ 1,397,884 shares) | | $ 20.94 |
| | |
Maximum offering price per share (100/94.25 of $20.94) | | $ 22.22 |
Class T:
Net Asset Value and redemption price per share ($21,357,184 ÷ 1,029,468 shares) | | $ 20.75 |
| | |
Maximum offering price per share (100/96.50 of $20.75) | | $ 21.50 |
Class B:
Net Asset Value and offering price per share ($11,205,997 ÷ 555,966 shares)A | | $ 20.16 |
| | |
Class C:
Net Asset Value and offering price per share ($16,084,288 ÷ 800,351 shares)A | | $ 20.10 |
| | |
| | |
Institutional Class:
Net Asset Value, offering price and redemption price per share ($1,737,833 ÷ 81,715 shares) | | $ 21.27 |
A Redemption price per share is equal to net asset value less any applicable contingent deferred sales charge.
See accompanying notes which are an integral part of the financial statements.
Annual Report
Statement of Operations
| Year ended October 31, 2007 |
Investment Income | | |
Dividends | | $ 2,428,878 |
Interest | | 138,414 |
Income from Fidelity Central Funds | | 260,067 |
| | 2,827,359 |
Less foreign taxes withheld | | (204,646) |
Total income | | 2,622,713 |
| | |
Expenses | | |
Management fee | $ 590,667 | |
Transfer agent fees | 248,531 | |
Distribution fees | 465,492 | |
Accounting and security lending fees | 46,722 | |
Custodian fees and expenses | 55,348 | |
Independent trustees' compensation | 277 | |
Registration fees | 74,480 | |
Audit | 50,157 | |
Legal | 2,224 | |
Miscellaneous | 681 | |
Total expenses before reductions | 1,534,579 | |
Expense reductions | (62,298) | 1,472,281 |
Net investment income (loss) | | 1,150,432 |
Realized and Unrealized Gain (Loss) Net realized gain (loss) on: | | |
Investment securities: | | |
Unaffiliated issuers | 14,739,061 | |
Foreign currency transactions | 24,791 | |
Total net realized gain (loss) | | 14,763,852 |
Change in net unrealized appreciation (depreciation) on: Investment securities | 3,567,047 | |
Assets and liabilities in foreign currencies | 544 | |
Total change in net unrealized appreciation (depreciation) | | 3,567,591 |
Net gain (loss) | | 18,331,443 |
Net increase (decrease) in net assets resulting from operations | | $ 19,481,875 |
See accompanying notes which are an integral part of the financial statements.
Annual Report
Financial Statements - continued
Statement of Changes in Net Assets
| Year ended
October 31,
2007 | Year ended
October 31,
2006 |
Increase (Decrease) in Net Assets | | |
Operations | | |
Net investment income (loss) | $ 1,150,432 | $ 367,772 |
Net realized gain (loss) | 14,763,852 | 5,374,448 |
Change in net unrealized appreciation (depreciation) | 3,567,591 | 4,133,071 |
Net increase (decrease) in net assets resulting
from operations | 19,481,875 | 9,875,291 |
Distributions to shareholders from net investment income | (305,480) | (119,954) |
Distributions to shareholders from net realized gain | (4,668,174) | (423,334) |
Total distributions | (4,973,654) | (543,288) |
Share transactions - net increase (decrease) | 2,498,409 | 28,326,294 |
Redemption fees | 3,169 | 6,074 |
Total increase (decrease) in net assets | 17,009,799 | 37,664,371 |
| | |
Net Assets | | |
Beginning of period | 62,648,448 | 24,984,077 |
End of period (including undistributed net investment income of $1,144,523 and undistributed net investment income of $358,723, respectively) | $ 79,658,247 | $ 62,648,448 |
See accompanying notes which are an integral part of the financial statements.
Annual Report
Financial Highlights - Class A
Years ended October 31, | 2007 | 2006 | 2005 | 2004 | 2003 |
Selected Per-Share Data | | | | | |
Net asset value, beginning of period | $ 17.49 | $ 13.47 | $ 11.30 | $ 10.00 | $ 8.03 |
Income from Investment Operations | | | | | |
Net investment income (loss) C | .32 | .19 F | .12 | .01 | .04 |
Net realized and unrealized gain (loss) | 4.48 | 4.18 | 2.05 | 1.37 | 1.98 |
Total from investment operations | 4.80 | 4.37 | 2.17 | 1.38 | 2.02 |
Distributions from net investment income | (.12) | (.13) | - | (.08) | (.05) |
Distributions from net realized gain | (1.23) | (.22) | - | - | - |
Total distributions | (1.35) | (.35) | - | (.08) | (.05) |
Redemption fees added to paid in capital C | - H | - H | - H | - H | - |
Net asset value, end of period | $ 20.94 | $ 17.49 | $ 13.47 | $ 11.30 | $ 10.00 |
Total Return A,B | 29.16% | 33.17% | 19.20% | 13.87% | 25.30% |
Ratios to Average Net Assets D,G | | | | | |
Expenses before reductions | 1.53% | 1.81% | 2.16% | 2.41% | 3.07% |
Expenses net of fee waivers, if any | 1.50% | 1.50% | 1.55% | 1.75% | 1.75% |
Expenses net of all reductions | 1.46% | 1.40% | 1.44% | 1.68% | 1.69% |
Net investment income (loss) | 1.69% | 1.16% F | .95% | .07% | .49% |
Supplemental Data | | | | | |
Net assets, end of period (000 omitted) | $ 29,273 | $ 18,972 | $ 4,544 | $ 2,905 | $ 3,346 |
Portfolio turnover rate E | 173% | 173% | 135% | 123% | 199% |
A Total returns would have been lower had certain expenses not been reduced during the periods shown.
B Total returns do not include the effect of the sales charges.
C Calculated based on average shares outstanding during the period.
D Fees and expenses of the underlying Fidelity Central Funds are not included in the Fund's expense ratio. The Fund indirectly bears its proportionate share of the expenses of any underlying Fidelity Central Funds.
E Amount does not include the portfolio activity of any underlying Fidelity Central Funds.
F Investment income per share reflects a special dividend which amounted to $.08 per share. Excluding the special dividend, the ratio of net investment income (loss) to average net assets would have been .68%.
G Expense ratios reflect operating expenses of the class. Expenses before reductions do not reflect amounts reimbursed by the investment adviser or reductions from brokerage service arrangements or other expense offset arrangements and do not represent the amount paid by the class during periods when reimbursements or reductions occur. Expenses net of fee waivers reflect expenses after reimbursement by the investment adviser but prior to reductions from brokerage service arrangements or other expense offset arrangements. Expenses net of all reductions represent the net expenses paid by the class.
H Amount represents less than $.01 per share.
See accompanying notes which are an integral part of the financial statements.
Annual Report
Financial Highlights - Class T
Years ended October 31, | 2007 | 2006 | 2005 | 2004 | 2003 |
Selected Per-Share Data | | | | | |
Net asset value, beginning of period | $ 17.35 | $ 13.34 | $ 11.21 | $ 9.93 | $ 7.98 |
Income from Investment Operations | | | | | |
Net investment income (loss) C | .27 | .14 F | .09 | (.02) | .02 |
Net realized and unrealized gain (loss) | 4.44 | 4.17 | 2.04 | 1.36 | 1.96 |
Total from investment operations | 4.71 | 4.31 | 2.13 | 1.34 | 1.98 |
Distributions from net investment income | (.08) | (.08) | - | (.06) | (.03) |
Distributions from net realized gain | (1.23) | (.22) | - | - | - |
Total distributions | (1.31) | (.30) | - | (.06) | (.03) |
Redemption fees added to paid in capital C | - H | - H | - H | - H | - |
Net asset value, end of period | $ 20.75 | $ 17.35 | $ 13.34 | $ 11.21 | $ 9.93 |
Total Return A,B | 28.86% | 32.95% | 19.00% | 13.54% | 24.90% |
Ratios to Average Net Assets D, G | | | | | |
Expenses before reductions | 1.80% | 2.07% | 2.45% | 2.70% | 3.34% |
Expenses net of fee waivers, if any | 1.75% | 1.75% | 1.81% | 2.00% | 2.00% |
Expenses net of all reductions | 1.71% | 1.65% | 1.70% | 1.93% | 1.94% |
Net investment income (loss) | 1.44% | .91% F | .70% | (.18)% | .24% |
Supplemental Data | | | | | |
Net assets, end of period (000 omitted) | $ 21,357 | $ 24,643 | $ 8,893 | $ 8,102 | $ 7,628 |
Portfolio turnover rate E | 173% | 173% | 135% | 123% | 199% |
A Total returns would have been lower had certain expenses not been reduced during the periods shown.
B Total returns do not include the effect of the sales charges.
C Calculated based on average shares outstanding during the period.
D Fees and expenses of the underlying Fidelity Central Funds are not included in the Fund's expense ratio. The Fund indirectly bears its proportionate share of the expenses of any underlying Fidelity Central Funds.
E Amount does not include the portfolio activity of any underlying Fidelity Central Funds.
F Investment income per share reflects a special dividend which amounted to $.08 per share. Excluding the special dividend, the ratio of net investment income (loss) to average net assets would have been .43%.
G Expense ratios reflect operating expenses of the class. Expenses before reductions do not reflect amounts reimbursed by the investment adviser or reductions from brokerage service arrangements or other expense offset arrangements and do not represent the amount paid by the class during periods when reimbursements or reductions occur. Expenses net of fee waivers reflect expenses after reimbursement by the investment adviser but prior to reductions from brokerage service arrangements or other expense offset arrangements. Expenses net of all reductions represent the net expenses paid by the class.
H Amount represents less than $.01 per share.
See accompanying notes which are an integral part of the financial statements.
Annual Report
Financial Highlights - Class B
Years ended October 31, | 2007 | 2006 | 2005 | 2004 | 2003 |
Selected Per-Share Data | | | | | |
Net asset value, beginning of period | $ 16.91 | $ 12.98 | $ 10.97 | $ 9.72 | $ 7.82 |
Income from Investment Operations | | | | | |
Net investment income (loss) C | .17 | .06 F | .02 | (.07) | (.02) |
Net realized and unrealized gain (loss) | 4.34 | 4.10 | 1.99 | 1.33 | 1.92 |
Total from investment operations | 4.51 | 4.16 | 2.01 | 1.26 | 1.90 |
Distributions from net investment income | (.03) | (.01) | - | (.01) | - |
Distributions from net realized gain | (1.23) | (.22) | - | - | - |
Total distributions | (1.26) | (.23) | - | (.01) | - |
Redemption fees added to paid in capital C | - H | - H | - H | - H | - |
Net asset value, end of period | $ 20.16 | $ 16.91 | $ 12.98 | $ 10.97 | $ 9.72 |
Total Return A,B | 28.29% | 32.49% | 18.32% | 12.97% | 24.30% |
Ratios to Average Net Assets D,G | | | | | |
Expenses before reductions | 2.31% | 2.69% | 2.94% | 3.20% | 3.87% |
Expenses net of fee waivers, if any | 2.25% | 2.25% | 2.32% | 2.50% | 2.50% |
Expenses net of all reductions | 2.21% | 2.15% | 2.20% | 2.43% | 2.44% |
Net investment income (loss) | .94% | .41% F | .19% | (.68)% | (.26)% |
Supplemental Data | | | | | |
Net assets, end of period (000 omitted) | $ 11,206 | $ 8,529 | $ 6,415 | $ 6,288 | $ 5,596 |
Portfolio turnover rate E | 173% | 173% | 135% | 123% | 199% |
A Total returns would have been lower had certain expenses not been reduced during the periods shown.
B Total returns do not include the effect of the contingent deferred sales charge.
C Calculated based on average shares outstanding during the period.
D Fees and expenses of the underlying Fidelity Central Funds are not included in the Fund's expense ratio. The Fund indirectly bears its proportionate share of the expenses of any underlying Fidelity Central Funds.
E Amount does not include the portfolio activity of any underlying Fidelity Central Funds.
F Investment income per share reflects a special dividend which amounted to $.07 per share. Excluding the special dividend, the ratio of net investment income (loss) to average net assets would have been (.07)%.
G Expense ratios reflect operating expenses of the class. Expenses before reductions do not reflect amounts reimbursed by the investment adviser or reductions from brokerage service arrangements or other expense offset arrangements and do not represent the amount paid by the class during periods when reimbursements or reductions occur. Expenses net of fee waivers reflect expenses after reimbursement by the investment adviser but prior to reductions from brokerage service arrangements or other expense offset arrangements. Expenses net of all reductions represent the net expenses paid by the class.
H Amount represents less than $.01 per share.
See accompanying notes which are an integral part of the financial statements.
Annual Report
Financial Highlights - Class C
Years ended October 31, | 2007 | 2006 | 2005 | 2004 | 2003 |
Selected Per-Share Data | | | | | |
Net asset value, beginning of period | $ 16.89 | $ 13.00 | $ 10.98 | $ 9.73 | $ 7.83 |
Income from Investment Operations | | | | | |
Net investment income (loss) C | .17 | .06 F | .03 | (.07) | (.02) |
Net realized and unrealized gain (loss) | 4.32 | 4.07 | 1.99 | 1.33 | 1.92 |
Total from investment operations | 4.49 | 4.13 | 2.02 | 1.26 | 1.90 |
Distributions from net investment income | (.05) | (.02) | - | (.01) | - |
Distributions from net realized gain | (1.23) | (.22) | - | - | - |
Total distributions | (1.28) | (.24) | - | (.01) | - |
Redemption fees added to paid in capital C | - H | - H | - H | - H | - |
Net asset value, end of period | $ 20.10 | $ 16.89 | $ 13.00 | $ 10.98 | $ 9.73 |
Total Return A,B | 28.21% | 32.25% | 18.40% | 12.96% | 24.27% |
Ratios to Average Net Assets D,G | | | | | |
Expenses before reductions | 2.26% | 2.57% | 2.86% | 3.08% | 3.74% |
Expenses net of fee waivers, if any | 2.25% | 2.25% | 2.30% | 2.50% | 2.50% |
Expenses net of all reductions | 2.21% | 2.15% | 2.19% | 2.43% | 2.44% |
Net investment income (loss) | .94% | .41% F | .20% | (.68)% | (.26)% |
Supplemental Data | | | | | |
Net assets, end of period (000 omitted) | $ 16,084 | $ 9,173 | $ 4,566 | $ 3,234 | $ 3,076 |
Portfolio turnover rate E | 173% | 173% | 135% | 123% | 199% |
A Total returns would have been lower had certain expenses not been reduced during the periods shown.
B Total returns do not include the effect of the contingent deferred sales charge.
C Calculated based on average shares outstanding during the period.
D Fees and expenses of the underlying Fidelity Central Funds are not included in the Fund's expense ratio. The Fund indirectly bears its proportionate share of the expenses of any underlying Fidelity Central Funds.
E Amount does not include the portfolio activity of any underlying Fidelity Central Funds.
F Investment income per share reflects a special dividend which amounted to $.07 per share. Excluding the special dividend, the ratio of net investment income (loss) to average net assets would have been (.07)%.
G Expense ratios reflect operating expenses of the class. Expenses before reductions do not reflect amounts reimbursed by the investment adviser or reductions from brokerage service arrangements or other expense offset arrangements and do not represent the amount paid by the class during periods when reimbursements or reductions occur. Expenses net of fee waivers reflect expenses after reimbursement by the investment adviser but prior to reductions from brokerage service arrangements or other expense offset arrangements. Expenses net of all reductions represent the net expenses paid by the class.
H Amount represents less than $.01 per share.
See accompanying notes which are an integral part of the financial statements.
Annual Report
Financial Highlights - Institutional Class
Years ended October 31, | 2007 | 2006 | 2005 | 2004 | 2003 |
Selected Per-Share Data | | | | | |
Net asset value, beginning of period | $ 17.72 | $ 13.63 | $ 11.40 | $ 10.07 | $ 8.10 |
Income from Investment Operations | | | | | |
Net investment income (loss) B | .38 | .23 E | .16 | .04 | .06 |
Net realized and unrealized gain (loss) | 4.54 | 4.25 | 2.07 | 1.37 | 1.98 |
Total from investment operations | 4.92 | 4.48 | 2.23 | 1.41 | 2.04 |
Distributions from net investment income | (.14) | (.17) | - | (.08) | (.07) |
Distributions from net realized gain | (1.23) | (.22) | - | - | - |
Total distributions | (1.37) | (.39) | - | (.08) | (.07) |
Redemption fees added to paid in capitalB | - G | - G | - G | - G | - |
Net asset value, end of period | $ 21.27 | $ 17.72 | $ 13.63 | $ 11.40 | $ 10.07 |
Total Return A | 29.57% | 33.68% | 19.56% | 14.07% | 25.39% |
Ratios to Average Net Assets C,F | | | | | |
Expenses before reductions | 1.19% | 1.46% | 1.73% | 1.95% | 2.56% |
Expenses net of fee waivers, if any | 1.19% | 1.25% | 1.31% | 1.50% | 1.50% |
Expenses net of all reductions | 1.15% | 1.15% | 1.20% | 1.43% | 1.44% |
Net investment income (loss) | 2.00% | 1.41% E | 1.20% | .32% | .73% |
Supplemental Data | | | | | |
Net assets, end of period (000 omitted) | $ 1,738 | $ 1,331 | $ 566 | $ 457 | $ 371 |
Portfolio turnover rate D | 173% | 173% | 135% | 123% | 199% |
A Total returns would have been lower had certain expenses not been reduced during the periods shown.
B Calculated based on average shares outstanding during the period.
C Fees and expenses of the underlying Fidelity Central Funds are not included in the Fund's expense ratio. The Fund indirectly bears its proportionate share of the expenses of any underlying Fidelity Central Funds.
D Amount does not include the portfolio activity of any underlying Fidelity Central Funds.
E Investment income per share reflects a special dividend which amounted to $.08 per share. Excluding the special dividend, the ratio of net investment income (loss) to average net assets would have been .93%.
F Expense ratios reflect operating expenses of the class. Expenses before reductions do not reflect amounts reimbursed by the investment adviser or reductions from brokerage service arrangements or other expense offset arrangements and do not represent the amount paid by the class during periods when reimbursements or reductions occur. Expenses net of fee waivers reflect expenses after reimbursement by the investment adviser but prior to reductions from brokerage service arrangements or other expense offset arrangements. Expenses net of all reductions represent the net expenses paid by the class.
G Amount represents less than $.01 per share.
See accompanying notes which are an integral part of the financial statements.
Annual Report
Notes to Financial Statements
For the period ended October 31, 2007
1. Organization.
Fidelity Advisor Europe Capital Appreciation Fund (the Fund) is a fund of Fidelity Advisor Series VIII (the trust) and is authorized to issue an unlimited number of shares. The trust is registered under the Investment Company Act of 1940, as amended (the 1940 Act), as an open-end management investment company organized as a Massachusetts business trust. The Fund offers Class A, Class T, Class B, Class C, and Institutional Class shares, each of which has equal rights as to assets and voting privileges. Each class has exclusive voting rights with respect to matters that affect that class. Class B shares will automatically convert to Class A shares after a holding period of seven years from the initial date of purchase. Investment income, realized and unrealized capital gains and losses, the common expenses of the Fund, and certain fund-level expense reductions, if any, are allocated on a pro rata basis to each class based on the relative net assets of each class to the total net assets of the Fund. Each class differs with respect to transfer agent and distribution and service plan fees incurred. Certain expense reductions also differ by class.
2. Investments in Fidelity Central Funds.
The Fund may invest in Fidelity Central Funds, which are open-end investment companies available only to other investment companies and accounts managed by Fidelity Management & Research Company (FMR) and its affiliates. The Fund's Schedule of Investments lists each of the Fidelity Central Funds as an investment of the Fund, but does not include the underlying holdings of each Fidelity Central Fund. As an Investing Fund, the Fund indirectly bears its proportionate share of the expenses of the underlying Fidelity Central Funds.
The Money Market Central Funds seek preservation of capital and current income and are managed by Fidelity Investments Money Management, Inc. (FIMM), an affiliate of FMR.
A complete list of holdings for each Fidelity Central Fund is available upon request or at the SEC's web site at www.sec.gov. In addition, the financial statements of the Fidelity Central Funds, which are not covered by the Fund's Report of Independent Registered Public Accounting Firm, are available on the SEC's web site or upon request.
3. Significant Accounting Policies.
The financial statements have been prepared in conformity with accounting principles generally accepted in the United States of America, which require management to make certain estimates and assumptions at the date of the financial statements. The following summarizes the significant accounting policies of the Fund:
Annual Report
3. Significant Accounting Policies - continued
Security Valuation. Investments are valued and net asset value (NAV) per share is calculated (NAV calculation) as of the close of business of the New York Stock Exchange (NYSE), normally 4:00 p.m. Eastern time. Wherever possible, the Fund uses independent pricing services approved by the Board of Trustees to value its investments.
Equity securities, including restricted securities, for which market quotations are readily available, are valued at the last reported sale price or official closing price as reported by an independent pricing service on the primary market or exchange on which they are traded. In the event there were no sales during the day or closing prices are not available, securities are valued at the last quoted bid price. Investments in open-end mutual funds, including the Fidelity Central Funds, are valued at their closing net asset value each business day. Short-term securities with remaining maturities of sixty days or less for which quotations are not readily available are valued at amortized cost, which approximates value.
When current market prices or quotations are not readily available or do not accurately reflect fair value, valuations may be determined in accordance with procedures adopted by the Board of Trustees. For example, when developments occur between the close of a market and the close of the NYSE that may materially affect the value of some or all of the securities, or when trading in a security is halted, those securities may be fair valued. Factors used in the determination of fair value may include monitoring news to identify significant market or security specific events such as changes in the value of U.S. securities markets, reviewing developments in foreign markets and evaluating the performance of ADRs, futures contracts and exchange-traded funds. Because the Fund's utilization of fair value pricing depends on market activity, the frequency with which fair value pricing is used cannot be predicted and may be utilized to a significant extent. The value of securities used for NAV calculation under fair value pricing may differ from published prices for the same securities.
Foreign Currency. The Fund uses foreign currency contracts to facilitate transactions in foreign-denominated securities. Losses from these transactions may arise from changes in the value of the foreign currency or if the counterparties do not perform under the contracts' terms.
Foreign-denominated assets, including investment securities, and liabilities are translated into U.S. dollars at the exchange rate at period end. Purchases and sales of investment securities, income and dividends received and expenses denominated in foreign currencies are translated into U.S. dollars at the exchange rate in effect on the transaction date.
Annual Report
Notes to Financial Statements - continued
3. Significant Accounting Policies - continued
Foreign Currency - continued
The effects of exchange rate fluctuations on investments are included with the net realized and unrealized gain (loss) on investment securities. Other foreign currency transactions resulting in realized and unrealized gain (loss) are disclosed separately.
Investment Transactions and Income. For financial reporting purposes, the Fund's investment holdings and NAV include trades executed through the end of the last business day of the period. The NAV for processing shareholder transactions includes trades executed through the end of the prior business day. Gains and losses on securities sold are determined on the basis of identified cost. Dividend income is recorded on the ex-dividend date, except for certain dividends from foreign securities where the ex-dividend date may have passed, which are recorded as soon as the Fund is informed of the ex-dividend date. Non-cash dividends included in dividend income, if any, are recorded at the fair market value of the securities received. Distributions received on securities that represent a return of capital or capital gain are recorded as a reduction of cost of investments and/or as a realized gain. The Fund estimates the components of distributions received that may be considered return of capital distributions or capital gain distributions. Interest income and distributions from the Fidelity Central Funds are accrued as earned. Interest income includes coupon interest and amortization of premium and accretion of discount on debt securities. Investment income is recorded net of foreign taxes withheld where recovery of such taxes is uncertain.
Expenses. Most expenses of the trust can be directly attributed to a fund. Expenses which cannot be directly attributed are apportioned among each Fund in the trust. Expense estimates are accrued in the period to which they relate and adjustments are made when actual amounts are known.
Income Tax Information and Distributions to Shareholders. Each year, the Fund intends to qualify as a regulated investment company by distributing all of its taxable income and realized gains under Subchapter M of the Internal Revenue Code. As a result, no provision for income taxes is required in the accompanying financial statements. Foreign taxes are provided for based on the Fund's understanding of the tax rules and rates that exist in the foreign markets in which it invests.
Distributions are recorded on the ex-dividend date. Income dividends and capital gain distributions are declared separately for each class. Income and capital gain distributions are determined in accordance with income tax regulations, which may differ from generally accepted accounting principles. In addition, the Fund will claim a portion of the payment made to redeeming shareholders as a distribution for income tax purposes.
Annual Report
3. Significant Accounting Policies - continued
Income Tax Information and Distributions to Shareholders - continued
Capital accounts within the financial statements are adjusted for permanent book-tax differences. These adjustments have no impact on net assets or the results of operations. Temporary book-tax differences will reverse in a subsequent period.
Book-tax differences are primarily due to foreign currency transactions, passive foreign investment companies (PFIC), market discount, and losses deferred due to wash sales.
The tax-basis components of distributable earnings and the federal tax cost as of period end were as follows:
Unrealized appreciation | $ 11,410,275 |
Unrealized depreciation | (2,119,561) |
Net unrealized appreciation (depreciation) | 9,290,714 |
Undistributed ordinary income | 3,562,176 |
Undistributed long-term capital gain | 7,509,078 |
| |
Cost for federal income tax purposes | $ 70,842,374 |
The tax character of distributions paid was as follows:
| October 31, 2007 | October 31, 2006 |
Ordinary Income | $ 912,722 | $ 119,954 |
Long-term Capital Gains | 4,060,932 | 423,334 |
Total | $ 4,973,654 | $ 543,288 |
Short-Term Trading (Redemption) Fees. Shares held in the Fund less than 30 days are subject to a redemption fee equal to 1.00% of the proceeds of the redeemed shares. All redemption fees, including any estimated redemption fees paid by FMR, are retained by the Fund and accounted for as an addition to paid in capital.
New Accounting Pronouncements. In July 2006, Financial Accounting Standards Board Interpretation No. 48, Accounting for Uncertainty in Income Taxes - an interpretation of FASB Statement 109 (FIN 48), was issued and is effective on the last business day of the semiannual reporting period for fiscal years beginning after December 15, 2006. FIN 48 sets forth a threshold for financial statement recognition, measurement and disclosure of a tax position taken or expected to be taken on a tax return. Management has concluded that the adoption of FIN 48 will not result in a material impact on the Fund's net assets, results of operations and financial statement disclosures.
In addition, in September 2006, Statement of Financial Accounting Standards No. 157, Fair Value Measurements (SFAS 157), was issued and is effective for fiscal years beginning after November 15, 2007. SFAS 157 defines fair value, establishes a framework for measuring fair value and expands disclosures about fair value measurements.
Annual Report
Notes to Financial Statements - continued
3. Significant Accounting Policies - continued
New Accounting Pronouncements - continued
Management is currently evaluating the impact the adoption of SFAS 157 will have on the Fund's financial statement disclosures.
4. Operating Policies.
Repurchase Agreements. FMR has received an Exemptive Order from the Securities and Exchange Commission (the SEC) which permits the Fund and other affiliated entities of FMR to transfer uninvested cash balances into joint trading accounts which are then invested in repurchase agreements. The Fund may also invest directly with institutions in repurchase agreements. Repurchase agreements are collateralized by government or non-government securities. Upon settlement date, collateral is held in segregated accounts with custodian banks and may be obtained in the event of a default of the counterparty. The Fund monitors, on a daily basis, the value of the collateral to ensure it is at least equal to the principal amount of the repurchase agreement (including accrued interest). In the event of a default by the counterparty, realization of the collateral proceeds could be delayed, during which time the value of the collateral may decline.
5. Purchases and Sales of Investments.
Purchases and sales of securities, other than short-term securities, aggregated $136,567,514 and $128,760,493, respectively.
6. Fees and Other Transactions with Affiliates.
Management Fee. FMR and its affiliates provide the Fund with investment management related services for which the Fund pays a monthly management fee. The management fee is the sum of an individual fund fee rate that is based on an annual rate of .45% of the Fund's average net assets and a group fee rate that averaged ..26% during the period. The group fee rate is based upon the average net assets of all the mutual funds advised by FMR. The group fee rate decreases as assets under management increase and increases as assets under management decrease. For the period, the total annual management fee rate was .71% of the Fund's average net assets.
Distribution and Service Plan. In accordance with Rule 12b-1 of the 1940 Act, the Fund has adopted separate Distribution and Service Plans for each class of shares, except for the Institutional Class. Certain classes pay Fidelity Distributors Corporation (FDC), an affiliate of FMR, separate Distribution and Service Fees, each of which is based on an annual percentage of each class' average net assets. In addition, FDC may
Annual Report
6. Fees and Other Transactions with Affiliates - continued
Distribution and Service Plan - continued
pay financial intermediaries for selling shares of the Fund and providing shareholder support services.
For the period, the Distribution and Service Fee rates and the total amounts paid to and retained by FDC were as follows:
| Distribution
Fee | Service
Fee | Paid to
FDC | Retained
by FDC |
Class A | -% | .25% | $ 68,126 | $ 3,141 |
Class T | .25% | .25% | 145,443 | 347 |
Class B | .75% | .25% | 105,361 | 79,081 |
Class C | .75% | .25% | 146,562 | 47,151 |
| | | $ 465,492 | $ 129,720 |
Sales Load. FDC receives a front-end sales charge of up to 5.75% for selling Class A shares, and 3.50% for selling Class T shares, some of which is paid to financial intermediaries for selling shares of the Fund. FDC receives the proceeds of contingent deferred sales charges levied on Class A, Class T, Class B, and Class C redemptions. These charges depend on the holding period. The deferred sales charges range from 5% to 1% for Class B, 1% for Class C, 1% to .50% for certain purchases of Class A shares and .25% for certain purchases of Class T shares.
For the period, sales charge amounts retained by FDC were as follows:
| Retained
by FDC |
Class A | $ 38,896 |
Class T | 10,484 |
Class B * | 15,214 |
Class C * | 5,510 |
| $ 70,104 |
* When Class B and Class C shares are initially sold, FDC pays commissions from its own resources to financial intermediaries through which the sales are made.
Transfer Agent Fees. Fidelity Investments Institutional Operations Company, Inc. (FIIOC), an affiliate of FMR, is the transfer, dividend disbursing and shareholder servicing agent for each class of the Fund. FIIOC receives account fees and asset-based fees that vary according to the account size and type of account of the shareholders of the respective classes of the Fund. FIIOC pays for typesetting, printing and mailing of shareholder reports, except proxy statements.
Annual Report
Notes to Financial Statements - continued
6. Fees and Other Transactions with Affiliates - continued
Transfer Agent Fees - continued
For the period, the total transfer agent fees paid by each class to FIIOC, were as follows:
| Amount | % of
Average
Net Assets |
Class A | $ 82,424 | .30 |
Class T | 87,636 | .30 |
Class B | 33,735 | .32 |
Class C | 41,419 | .28 |
Institutional Class | 3,317 | .19 |
| $ 248,531 | |
Accounting and Security Lending Fees. Fidelity Service Company, Inc. (FSC), an affiliate of FMR, maintains the Fund's accounting records. The accounting fee is based on the level of average net assets for the month. Under a separate contract, FSC administers the security lending program. The security lending fee is based on the number and duration of lending transactions.
Brokerage Commissions. The Fund placed a portion of its portfolio transactions with brokerage firms which are affiliates of the investment adviser. The commissions paid to these affiliated firms were $76 for the period.
7. Committed Line of Credit.
The Fund participates with other funds managed by FMR in a $4.2 billion credit facility (the "line of credit") to be utilized for temporary or emergency purposes to fund share-holder redemptions or for other short-term liquidity purposes. The Fund has agreed to pay commitment fees on its pro rata portion of the line of credit, which amounted to $168 and is reflected in Miscellaneous Expense on the Statement of Operations. During the period, there were no borrowings on this line of credit.
8. Security Lending.
The Fund lends portfolio securities from time to time in order to earn additional income. On the settlement date of the loan, the Fund receives collateral (in the form of U.S. Treasury obligations, letters of credit and/or cash) against the loaned securities and maintains collateral in an amount not less than 100% of the market value of the loaned securities during the period of the loan. The market value of the loaned securities is determined at the close of business of the Fund and any additional required collateral is delivered to the Fund on the next business day. If the borrower defaults on its obligation to return the securities loaned because of insolvency or other reasons, a fund could
Annual Report
8. Security Lending - continued
experience delays and costs in recovering the securities loaned or in gaining access to the collateral. Any cash collateral received is invested in the Fidelity Securities Lending Cash Central Fund. At period end, there were no security loans outstanding. Security lending income represents the income earned on investing cash collateral, less fees and expenses associated with the loan, plus any premium payments that may be received on the loan of certain types of securities. Security lending income is presented in the Statement of Operations as a component of income from Fidelity Central Funds. Net income from lending portfolio securities during the period amounted to $63,983.
9. Expense Reductions.
FMR voluntarily agreed to reimburse each class to the extent annual operating expenses exceeded certain levels of average net assets as noted in the table below. Some expenses, for example interest expense, including commitment fees, are excluded from this reimbursement.
The following classes were in reimbursement during the period:
| Expense
Limitations | Reimbursement
from adviser |
Class A | 1.50% | $ 8,048 |
Class T | 1.75% | 12,523 |
Class B | 2.25% | 6,415 |
Class C | 2.25% | 1,113 |
| | $ 28,099 |
Many of the brokers with whom FMR places trades on behalf of the Fund provided services to the Fund in addition to trade execution. These services included payments of certain expenses on behalf of the Fund totaling $33,306 for the period.
10. Other.
The Fund's organizational documents provide former and current trustees and officers with a limited indemnification against liabilities arising in connection with the performance of their duties to the Fund. In the normal course of business, the Fund may also enter into contracts that provide general indemnifications. The Fund's maximum exposure under these arrangements is unknown as this would be dependent on future claims that may be made against the Fund. The risk of material loss from such claims is considered remote.
Annual Report
Notes to Financial Statements - continued
10. Other - continued
In September 2006, FIIOC, the Fund's transfer agent, notified the Fund that the Fund's books and records did not reflect a conversion of certain Class B to Class A shares upon their conversion date. In March 2007, FIIOC converted the relevant Class B shares to Class A shares and recorded the conversion in the books and records of the Fund which did not result in a material impact to the Fund's reported net assets or results of operations in the accompanying financial statements. FIIOC has remediated affected shareholders and reimbursed the Fund for all related audit and legal expenses.
The United States Securities and Exchange Commission ("SEC") is conducting an investigation of FMR (covering the years 2002 to 2004) arising from gifts, gratuities and business entertainment provided by certain brokers to certain individuals who were employed on FMR's domestic equity trading desk during that period. FMR is in discussions with the SEC staff regarding the possible resolution of the matter, but as of period-end no final resolution has been reached.
In December 2006, the Independent Trustees completed their own investigation of the matter with the assistance of independent counsel. The Independent Trustees and FMR agree that, despite the absence of proof that the Fidelity mutual funds experienced diminished execution quality as a result of the improper receipt of gifts and business entertainment, the conduct at issue was serious and is worthy of redress. Accordingly, the Independent Trustees have requested and FMR has agreed to pay $42 million to Fidelity mutual funds, plus interest to be determined at the time that payment is made. A method of allocating this payment among the funds has not yet been determined. The total payment to the Fund is not anticipated to have a material impact on the Fund's net assets. In addition, FMR reimbursed related legal expenses which are recorded in the accompanying Statement of Operations as an expense reduction.
11. Distributions to Shareholders.
Distributions to shareholders of each class were as follows:
| Years ended October 31, |
| 2007 | 2006 |
From net investment income | | |
Class A | $ 131,953 | $ 47,168 |
Class T | 120,031 | 54,756 |
Class B | 14,114 | 2,978 |
Class C | 27,366 | 6,844 |
Institutional Class | 12,016 | 8,208 |
Total | $ 305,480 | $ 119,954 |
Annual Report
11. Distributions to Shareholders - continued
| Years ended October 31, |
| 2007 | 2006 |
From net realized gain | | |
Class A | $ 1,411,320 | $ 79,213 |
Class T | 1,778,779 | 145,138 |
Class B | 642,980 | 109,180 |
Class C | 731,741 | 79,243 |
Institutional Class | 103,354 | 10,560 |
Total | $ 4,668,174 | $ 423,334 |
12. Share Transactions.
Transactions for each class of shares were as follows:
| Shares | Dollars |
| Years ended October 31, | Years ended October 31, |
| 2007 | 2006 | 2007 | 2006 |
Class A | | | | |
Shares sold | 887,671 | 950,467 | $ 16,290,832 | $ 15,398,163 |
Reinvestment of distributions | 81,628 | 8,427 | 1,393,387 | 115,445 |
Shares redeemed | (655,962) | (211,724) | (12,453,019) | (3,398,595) |
Net increase (decrease) | 313,337 | 747,170 | $ 5,231,200 | $ 12,115,013 |
Class T | | | | |
Shares sold | 628,131 | 1,226,606 | $ 11,365,875 | $ 19,872,364 |
Reinvestment of distributions | 110,301 | 14,226 | 1,869,603 | 193,752 |
Shares redeemed | (1,129,336) | (487,091) | (21,225,724) | (7,833,255) |
Net increase (decrease) | (390,904) | 753,741 | $ (7,990,246) | $ 12,232,861 |
Class B | | | | |
Shares sold | 290,925 | 224,137 | $ 5,134,606 | $ 3,557,649 |
Reinvestment of distributions | 36,910 | 7,684 | 610,124 | 102,344 |
Shares redeemed | (276,174) | (221,615) | (4,941,749) | (3,404,462) |
Net increase (decrease) | 51,661 | 10,206 | $ 802,981 | $ 255,531 |
Class C | | | | |
Shares sold | 555,549 | 375,786 | $ 9,727,989 | $ 5,938,976 |
Reinvestment of distributions | 36,928 | 5,509 | 608,950 | 73,380 |
Shares redeemed | (335,147) | (189,571) | (6,006,565) | (2,918,486) |
Net increase (decrease) | 257,330 | 191,724 | $ 4,330,374 | $ 3,093,870 |
Institutional Class | | | | |
Shares sold | 50,928 | 96,924 | $ 962,437 | $ 1,629,400 |
Reinvestment of distributions | 3,929 | 1,054 | 67,898 | 14,581 |
Shares redeemed | (48,267) | (64,378) | (906,235) | (1,014,962) |
Net increase (decrease) | 6,590 | 33,600 | $ 124,100 | $ 629,019 |
Annual Report
Report of Independent Registered Public Accounting Firm
To the Trustees of Fidelity Advisor Series VIII and Shareholders of Fidelity Advisor Europe Capital Appreciation Fund:
We have audited the accompanying statement of assets and liabilities of Fidelity Advisor Europe Capital Appreciation Fund (the Fund), a fund of Fidelity Advisor Series VIII, including the schedule of investments, as of October 31, 2007, and the related statement of operations for the year then ended, the statement of changes in net assets for each of the two years in the period then ended, and the financial highlights for each of the five years in the period then ended. These financial statements and financial highlights are the responsibility of the Fund's management. Our responsibility is to express an opinion on these financial statements and financial highlights based on our audits.
We conducted our audits in accordance with standards of the Public Company Accounting Oversight Board (United States). Those standards require that we plan and perform the audit to obtain reasonable assurance about whether the financial statements and financial highlights are free of material misstatement. The Fund is not required to have, nor were we engaged to perform, an audit of its internal control over financial reporting. Our audits included consideration of internal control over financial reporting as a basis for designing audit procedures that are appropriate in the circumstances, but not for the purpose of expressing an opinion on the effectiveness of the Fund's internal control over financial reporting. Accordingly, we express no such opinion. An audit also includes examining, on a test basis, evidence supporting the amounts and disclosures in the financial statements, assessing the accounting principles used and significant estimates made by management, as well as evaluating the overall financial statement presentation. Our procedures included confirmation of securities owned as of October 31, 2007, by correspondence with the custodians. We believe that our audits provide a reasonable basis for our opinion.
In our opinion, the financial statements and financial highlights referred to above present fairly, in all material respects, the financial position of Fidelity Advisor Europe Capital Appreciation Fund as of October 31, 2007, the results of its operations for the year then ended, the changes in its net assets for each of the two years in the period then ended, and its financial highlights for each of the five years in the period then ended, in conformity with accounting principles generally accepted in the United States of America.
/s/ Deloitte & Touche LLP
DELOITTE & TOUCHE LLP
Boston, Massachusetts
December 18, 2007
Annual Report
Trustees and Officers
The Trustees, Members of the Advisory Board, and executive officers of the trust and fund, as applicable, are listed below. The Board of Trustees governs the fund and is responsible for protecting the interests of shareholders. The Trustees are experienced executives who meet periodically throughout the year to oversee the fund's activities, review contractual arrangements with companies that provide services to the fund, and review the fund's performance. Except for James C. Curvey, each of the Trustees oversees 370 funds advised by FMR or an affiliate. Mr. Curvey oversees 340 funds advised by FMR or an affiliate.
The Trustees hold office without limit in time except that (a) any Trustee may resign; (b) any Trustee may be removed by written instrument, signed by at least two-thirds of the number of Trustees prior to such removal; (c) any Trustee who requests to be retired or who has become incapacitated by illness or injury may be retired by written instrument signed by a majority of the other Trustees; and (d) any Trustee may be removed at any special meeting of shareholders by a two-thirds vote of the outstanding voting securities of the trust. Each Trustee who is not an interested person (as defined in the 1940 Act) (Independent Trustee), shall retire not later than the last day of the calendar year in which his or her 72nd birthday occurs. The Independent Trustees may waive this mandatory retirement age policy with respect to individual Trustees. The executive officers and Advisory Board Members hold office without limit in time, except that any officer and Advisory Board Member may resign or may be removed by a vote of a majority of the Trustees at any regular meeting or any special meeting of the Trustees. Except as indicated, each individual has held the office shown or other offices in the same company for the past five years.
The fund's Statement of Additional Information (SAI) includes more information about the Trustees. To request a free copy, call Fidelity at 1-877-208-0098.
Interested Trustees*:
Correspondence intended for each Trustee who is an interested person may be sent to Fidelity Investments, 82 Devonshire Street, Boston, Massachusetts 02109.
Name, Age; Principal Occupation |
Edward C. Johnson 3d (77) |
| Year of Election or Appointment: 1983 Mr. Johnson is Chairman of the Board of Trustees. Mr. Johnson serves as President (2006-present), Chief Executive Officer, Chairman, and a Director of FMR LLC; Chairman and a Director of FMR; Chairman and a Director of Fidelity Research & Analysis Company (FRAC); Chairman and a Director of Fidelity Investments Money Management, Inc.; and Chairman (2001-present) and a Director of FMR Co., Inc. In addition, Mr. Johnson serves as Chairman and Director of Fidelity International Limited (FIL). |
James C. Curvey (72) |
| Year of Election or Appointment: 2007 Mr. Curvey also serves as Trustee (2007-present) or Member of the Advisory Board (2007-present) of other investment companies advised by FMR. Mr. Curvey is a Director of FMR and FMR Co., Inc. (2007-
present). Mr. Curvey is also Vice Chairman (2006-present) and Director of FMR LLC. Mr. Curvey joined Fidelity in 1982 and served in numerous senior management positions, including President and Chief Operating Officer of FMR LLC (1997-2000) and President of Fidelity Strategic Investments (2000-2002). In addition, he serves as a member of the Board of Directors of Geerlings & Wade, Inc. (wine distribution). |
* Trustees have been determined to be "Interested Trustees" by virtue of, among other things, their affiliation with the trust or various entities under common control with FMR. FMR Corp. merged with FMR LLC on October 1, 2007. Any references to FMR LLC for prior periods are deemed to be references to the prior entity.
Independent Trustees:
Correspondence intended for each Independent Trustee (that is, the Trustees other than the Interested Trustees) may be sent to Fidelity Investments, P.O. Box 55235, Boston, Massachusetts 02205-5235.
Name, Age; Principal Occupation |
Dennis J. Dirks (59) |
| Year of Election or Appointment: 2005 Prior to his retirement in May 2003, Mr. Dirks was Chief Operating Officer and a member of the Board of The Depository Trust & Clearing Corporation (DTCC) (1999-2003). He also served as President, Chief Operating Officer, and Board member of The Depository Trust Company (DTC) (1999-2003) and President and Board member of the National Securities Clearing Corporation (NSCC) (1999-2003). In addition, Mr. Dirks served as Chief Executive Officer and Board member of the Government Securities Clearing Corporation (2001-2003) and Chief Executive Officer and Board member of the Mortgage-Backed Securities Clearing Corporation (2001-2003). Mr. Dirks also serves as a Trustee and a member of the Finance Committee of Manhattan College (2005-present) and a Trustee and a member of the Finance Committee of AHRC of Nassau County (2006-present). |
Albert R. Gamper, Jr. (65) |
| Year of Election or Appointment: 2006 Prior to his retirement in December 2004, Mr. Gamper served as Chairman of the Board of CIT Group Inc. (commercial finance). During his tenure with CIT Group Inc. Mr. Gamper served in numerous senior management positions, including Chairman (1987-1989; 1999-2001; 2002-2004), Chief Executive Officer (1987-2004), and President (1989-2002). He currently serves as a member of the Board of Directors of Public Service Enterprise Group (utilities, 2001-present), Chairman of the Board of Governors, Rutgers University (2004-present), and Chairman of the Board of Saint Barnabas Health Care System. |
George H. Heilmeier (71) |
| Year of Election or Appointment: 2004 Dr. Heilmeier is Chairman Emeritus of Telcordia Technologies (communication software and systems), where prior to his retirement, he served as company Chairman and Chief Executive Officer. He currently serves on the Boards of Directors of The Mitre Corporation (systems engineering and information technology support for the government), and HRL Laboratories (private research and development, 2004-present). He is Chairman of the General Motors Science & Technology Advisory Board and a Life Fellow of the Institute of Electrical and Electronics Engineers (IEEE). Dr. Heilmeier is a member of the Defense Science Board and the National Security Agency Advisory Board. He is also a member of the National Academy of Engineering, the American Academy of Arts and Sciences, and the Board of Overseers of the School of Engineering and Applied Science of the University of Pennsylvania. Previously, Dr. Heilmeier served as a Director of TRW Inc. (automotive, space, defense, and information technology, 1992-2002), Compaq (1994-2002), Automatic Data Processing, Inc. (ADP) (technology-based business outsourcing, 1995-2002), INET Technologies Inc. (telecommunications network surveillance, 2001-2004), and Teletech Holdings (customer management services). He is the recipient of the 2005 Kyoto Prize in Advanced Technology for his invention of the liquid crystal display, and a member of the Consumer Electronics Hall of Fame. |
James H. Keyes (67) |
| Year of Election or Appointment: 2007 Prior to his retirement in 2003, Mr. Keyes was Chairman, President, and Chief Executive Officer of Johnson Controls, Inc. (automotive supplier, 1993-2003). He currently serves as a member of the boards of LSI Logic Corporation (semiconductor technologies), Navistar International Corporation (manufacture and sale of trucks, buses, and diesel engines, 2002-present), and Pitney Bowes, Inc. (integrated mail, messaging, and document management solutions). |
Marie L. Knowles (61) |
| Year of Election or Appointment: 2001 Prior to Ms. Knowles' retirement in June 2000, she served as Executive Vice President and Chief Financial Officer of Atlantic Richfield Company (ARCO) (diversified energy, 1996-2000). From 1993 to 1996, she was a Senior Vice President of ARCO and President of ARCO Transportation Company. She served as a Director of ARCO from 1996 to 1998. She currently serves as a Director of Phelps Dodge Corporation (copper mining and manufacturing) and McKesson Corporation (healthcare service, 2002-present). Ms. Knowles is a Trustee of the Brookings Institution and the Catalina Island Conservancy and also serves as a member of the Advisory Board for the School of Engineering of the University of Southern California. |
Ned C. Lautenbach (63) |
| Year of Election or Appointment: 2000 Mr. Lautenbach is Chairman of the Independent Trustees (2006-present). Mr. Lautenbach has been a partner of Clayton, Dubilier & Rice, Inc. (private equity investment firm) since September 1998. Previously, Mr. Lautenbach was with the International Business Machines Corporation (IBM) from 1968 until his retirement in 1998. Mr. Lautenbach serves as a Director of Sony Corporation (2006-present) and Eaton Corporation (diversified industrial) as well as the Philharmonic Center for the Arts in Naples, Florida. He also is a member of the Board of Trustees of Fairfield University (2005-present), as well as a member of the Council on Foreign Relations. |
Cornelia M. Small (63) |
| Year of Election or Appointment: 2005 Ms. Small is a member (2000-present) and Chairperson (2002-present) of the Investment Committee, and a member (2002-present) of the Board of Trustees of Smith College. Previously, she served as Chief Investment Officer (1999-2000), Director of Global Equity Investments (1996-1999), and a member of the Board of Directors of Scudder, Stevens & Clark (1990-1997) and Scudder Kemper Investments (1997-1999). In addition, Ms. Small served as Co-Chair (2000-2003) of the Annual Fund for the Fletcher School of Law and Diplomacy. |
William S. Stavropoulos (68) |
| Year of Election or Appointment: 2001 Mr. Stavropoulos is Chairman Emeritus of the Board of Directors of The Dow Chemical Company. Since joining The Dow Chemical Company in 1967, Mr. Stavropoulos served in numerous senior management positions, including President (1993-2000; 2002-2003), CEO (1995-2000; 2002-2004), and Chairman of the Executive Committee (2000-2004). Currently, he is a Director of NCR Corporation (data warehousing and technology solutions), Chemical Financial Corporation, Maersk Inc. (industrial conglomerate, 2002-present), Tyco International, Inc. (multinational manufacturing and services, 2007-present), and a member of the Advisory Board for Metalmark Capital (private equity investment firm, 2005-present). He is a special advisor to Clayton, Dubilier & Rice, Inc., a private equity investment firm. He also serves as a member of the Board of Trustees of the American Enterprise Institute for Public Policy Research. In addition, Mr. Stavropoulos is a member of The Business Council, J.P. Morgan International Council and the University of Notre Dame Advisory Council for the College of Science. |
Kenneth L. Wolfe (68) |
| Year of Election or Appointment: 2005 Prior to his retirement in 2001, Mr. Wolfe was Chairman and Chief Executive Officer of Hershey Foods Corporation (1993-2001). He currently serves as a member of the boards of Adelphia Communications Corporation (2003-present), Bausch & Lomb, Inc., and Revlon Inc. (2004-present). |
Advisory Board Members and Executive Officers**:
Correspondence intended for Mr. Mauriello, Mr. Thomas, and Mr. Wiley may be sent to Fidelity Investments, P.O. Box 55235, Boston, Massachusetts 02205-5235. Correspondence intended for each executive officer and Mr. Lynch may be sent to Fidelity Investments, 82 Devonshire Street, Boston, Massachusetts 02109.
Name, Age; Principal Occupation |
Peter S. Lynch (63) |
| Year of Election or Appointment: 2003 Member of the Advisory Board of Fidelity Advisor Series VIII. Mr. Lynch is Vice Chairman and a Director of FMR, and Vice Chairman (2001-
present) and a Director of FMR Co., Inc. Previously, Mr. Lynch served as a Trustee of the Fidelity funds (1990-2003). In addition, he serves as a Trustee of Boston College and as the Chairman of the Inner-City Scholarship Fund. |
Joseph Mauriello (63) |
| Year of Election or Appointment: 2007 Member of the Advisory Board of Fidelity Advisor Series VIII. Prior to his retirement in January 2006, Mr. Mauriello served in numerous senior management positions including Deputy Chairman and Chief Operating Officer (2004-2005), and Vice Chairman of Financial Services (2002-2004) of KPMG LLP US (professional services firm, 1965-2005). Mr. Mauriello currently serves as a member of the Board of Directors of XL Capital Ltd., (global insurance and re-insurance company, 2006-
present) and of Arcadia Resources Inc., (health care services and products, 2007-present). He also served as a Director of the Hamilton Funds of the Bank of New York (2006-2007). |
David M. Thomas (58) |
| Year of Election or Appointment: 2007 Member of the Advisory Board of Fidelity Advisor Series VIII. Previously, Mr. Thomas served as Executive Chairman (2005-2006) and Chairman and Chief Executive Officer (2000-2005) of IMS Health, Inc. (pharmaceutical and healthcare information solutions). In addition, Mr. Thomas serves as a member of the Board of Directors of Fortune Brands, Inc. (consumer products holding company), and Interpublic Group of Companies, Inc. (marketing communication, 2004-present). |
Michael E. Wiley (57) |
| Year of Election or Appointment: 2007 Member of the Advisory Board of Fidelity Advisor Series VIII. Mr. Wiley also serves as Sr. Energy Advisor of Katzenbach Partners, LLC (consulting firm, 2006-present) and a member of the Board of Trustees of the University of Tulsa (2000-2006; 2007-present). He serves as a Director of Tesoro Corporation (independent oil refiner and marketer, 2005-
present), and a Director of Bill Barrett Corporation (exploration and production company, 2005-present). In addition, he also serves as a Director of Post Oak Bank (privately-held bank, 2004-present), and an Advisory Director of Riverstone Holdings (private investment firm). Previously, Mr. Wiley served as Chairman, President, and CEO of Baker Hughes, Inc. (oilfield services company, 2000-2004), and as Director of Spinnaker Exploration Company (exploration and production company, 2001-2005). |
Kimberley H. Monasterio (43) |
| Year of Election or Appointment: 2007 President and Treasurer of Advisor Europe Capital Appreciation. Ms. Monasterio also serves as President and Treasurer of other Fidelity funds (2007-present) and is an employee of FMR (2004-present). Previously, Ms. Monasterio served as Deputy Treasurer of the Fidelity funds (2004-2006). Before joining Fidelity Investments, Ms. Monasterio served as Treasurer (2000-2004) and Chief Financial Officer (2002-2004) of the Franklin Templeton Funds and Senior Vice President of Franklin Templeton Services, LLC (2000-2004). |
Walter C. Donovan (45) |
| Year of Election or Appointment: 2007 Vice President of Advisor Europe Capital Appreciation. Mr. Donovan also serves as Vice President of Fidelity's Equity Funds (2007-present). Mr. Donovan also serves as Executive Vice President of FMR (2005-
present) and FMR Co., Inc. (2005-present). Previously, Mr. Donovan served as Vice President of Fidelity's High Income Funds (2005-2007), Fixed-Income Funds (2005-2006), certain Asset Allocation Funds (2005-2006), certain Balanced Funds (2005-2006), and as Vice President and Director of Fidelity's International Equity Trading group (1998-2005). |
Eric M. Wetlaufer (45) |
| Year of Election or Appointment: 2006 Vice President of Advisor Europe Capital Appreciation. Mr. Wetlaufer also serves as Vice President of certain International Equity Funds (2006-present). Mr. Wetlaufer is Senior Vice President of FMR (2006-
present) and FMR Co., Inc. (2006-present), and President and Director of Fidelity Management & Research (U.K.) Inc. (2006-present) and Fidelity Research & Analysis Company (2006-present). Before joining Fidelity Investments in 2005, Mr. Wetlaufer was a partner in Oxhead Capital Management (2004-2005). Previously, Mr. Wetlaufer served as a Chief Investment Officer of Putnam Investments (1997-2003). |
Eric D. Roiter (59) |
| Year of Election or Appointment: 1998 Secretary of Advisor Europe Capital Appreciation. He also serves as Secretary of other Fidelity funds; Vice President, General Counsel, and Secretary of FMR Co., Inc. (2001-present) and FMR; Assistant Secretary of Fidelity Management & Research (U.K.) Inc. (2001-present), Fidelity Research & Analysis Company (2001-present), and Fidelity Investments Money Management, Inc. (2001-present). Mr. Roiter is an Adjunct Member, Faculty of Law, at Boston College Law School (2003-present). Previously, Mr. Roiter served as Vice President and Secretary of Fidelity Distributors Corporation (FDC). |
Scott C. Goebel (39) |
| Year of Election or Appointment: 2007 Assistant Secretary of Advisor Europe Capital Appreciation. Mr. Goebel also serves as Assistant Secretary of other Fidelity funds (2007-present), and is an employee of FMR. |
R. Stephen Ganis (41) |
| Year of Election or Appointment: 2006 Anti-Money Laundering (AML) officer of Advisor Europe Capital Appreciation. Mr. Ganis also serves as AML officer of other Fidelity funds (2006-present) and FMR LLC (2003-present). Before joining Fidelity Investments, Mr. Ganis practiced law at Goodwin Procter, LLP (2000-2002). |
Joseph B. Hollis (59) |
| Year of Election or Appointment: 2006 Chief Financial Officer of Advisor Europe Capital Appreciation. Mr. Hollis also serves as Chief Financial Officer of other Fidelity funds. Mr. Hollis is President of Fidelity Pricing and Cash Management Services (FPCMS) (2005-present). Mr. Hollis also serves as President and Director of Fidelity Service Company, Inc. (2006-present). Previously, Mr. Hollis served as Senior Vice President of Cash Management Services (1999-2002) and Investment Management Operations (2002-2005). |
Kenneth A. Rathgeber (60) |
| Year of Election or Appointment: 2004 Chief Compliance Officer of Advisor Europe Capital Appreciation. Mr. Rathgeber also serves as Chief Compliance Officer of other Fidelity funds (2004-present) and Executive Vice President of Risk Oversight for Fidelity Investments (2002-present). He is Chief Compliance Officer of FMR (2005-present), FMR Co., Inc. (2005-present), Fidelity Management & Research (U.K.) Inc. (2005-present), Fidelity Research & Analysis Company (2005-present), Fidelity Investments Money Management, Inc. (2005-present), and Strategic Advisers, Inc. (2005-present). Previously, Mr. Rathgeber served as Executive Vice President and Chief Operating Officer for Fidelity Investments Institutional Services Company, Inc. (1998-2002). |
Bryan A. Mehrmann (46) |
| Year of Election or Appointment: 2005 Deputy Treasurer of Advisor Europe Capital Appreciation. Mr. Mehrmann also serves as Deputy Treasurer of other Fidelity funds (2005-present) and is an employee of FMR. Previously, Mr. Mehrmann served as Vice President of Fidelity Investments Institutional Services Group (FIIS)/Fidelity Investments Institutional Operations Corporation, Inc. (FIIOC) Client Services (1998-2004). |
Kenneth B. Robins (38) |
| Year of Election or Appointment: 2005 Deputy Treasurer of Advisor Europe Capital Appreciation. Mr. Robins also serves as Deputy Treasurer of other Fidelity funds (2005-present) and is an employee of FMR (2004-present). Before joining Fidelity Investments, Mr. Robins worked at KPMG LLP, where he was a partner in KPMG's department of professional practice (2002-2004) and a Senior Manager (1999-2000). In addition, Mr. Robins served as Assistant Chief Accountant, United States Securities and Exchange Commission (2000-2002). |
Robert G. Byrnes (40) |
| Year of Election or Appointment: 2005 Assistant Treasurer of Advisor Europe Capital Appreciation. Mr. Byrnes also serves as Assistant Treasurer of other Fidelity funds (2005-present) and is an employee of FMR (2005-present). Previously, Mr. Byrnes served as Vice President of FPCMS (2003-2005). Before joining Fidelity Investments, Mr. Byrnes worked at Deutsche Asset Management where he served as Vice President of the Investment Operations Group (2000-2003). |
Peter L. Lydecker (53) |
| Year of Election or Appointment: 2004 Assistant Treasurer of Advisor Europe Capital Appreciation. Mr. Lydecker also serves as Assistant Treasurer of other Fidelity funds (2004) and is an employee of FMR. |
Paul M. Murphy (60) |
| Year of Election or Appointment: 2007 Assistant Treasurer of Advisor Europe Capital Appreciation. Mr. Murphy also serves as Assistant Treasurer of other Fidelity funds (2007-present) and is an employee of FMR (2007-present). Previously, Mr. Murphy served as Chief Financial Officer of the Fidelity Funds (2005-2006), Vice President and Associate General Counsel of FMR (2007), and Senior Vice President of Fidelity Pricing and Cash Management Services Group (FPCMS) (1994-2007). |
Gary W. Ryan (49) |
| Year of Election or Appointment: 2005 Assistant Treasurer of Advisor Europe Capital Appreciation. Mr. Ryan also serves as Assistant Treasurer of other Fidelity funds (2005-present) and is an employee of FMR (2005-present). Previously, Mr. Ryan served as Vice President of Fund Reporting in FPCMS (1999-2005). |
** FMR Corp. merged with FMR LLC on October 1, 2007. Any references to FMR LLC for prior periods are deemed to be references to the prior entity.
Annual Report
Distributions
The Board of Trustees of Advisor Europe Capital Appreciation fund voted to pay to shareholders of record at the opening of business on record date, the following distributions per share derived from capital gains realized from sales of portfolio securities, and dividends derived from net investment income:
| Pay Date | Record Date | Dividends | Capital Gains |
Institutional Class | 12/10/07 | 12/07/07 | $0.384 | $2.68 |
The fund hereby designates as a capital gain dividend with respect to the taxable year ended October 31, 2007 $7,509,078, or, if subsequently determined to be different, the net capital gain of such year.
Institutional Class designates 67% of the dividends distributed in December during the fiscal year as amounts which may be taken into account as a dividend for purposes of the maximum rate under section 1(h)(11) of the Internal Revenue Code.
The amounts per share which represent income derived from sources within, and taxes paid to, foreign countries or possessions of the United States are as follows:
| Pay Date | Income | Taxes |
Institutional Class | 12/04/06 | $0.163 | $0.0269 |
The fund will notify shareholders in January 2008 of amounts for use in preparing 2007 income tax returns.
Annual Report
Board Approval of Investment Advisory Contracts and Management Fees
Advisor Europe Capital Appreciation Fund
Each year, typically in July, the Board of Trustees, including the Independent Trustees (together, the Board), votes on the renewal of the management contract and sub-advisory agreements (together, the Advisory Contracts) for the fund. The Board, assisted by the advice of fund counsel and Independent Trustees' counsel, requests and considers a broad range of information throughout the year.
The Board meets regularly each month except August and takes into account throughout the year matters bearing on Advisory Contracts. The Board, acting directly and through its separate committees, considers at each of its meetings factors that are relevant to the annual renewal of the fund's Advisory Contracts, including the services and support provided to the fund and its shareholders. At the time of the renewal, the Board had 12 standing committees, each composed of Independent Trustees with varying backgrounds, to which the Board has assigned specific subject matter responsibilities in order to enhance effective decision-making by the Board. Each committee has adopted a written charter outlining the structure and purposes of the committee. One such committee, the Equity Contract Committee, meets periodically as needed throughout the year to consider matters specifically related to the annual renewal of Advisory Contracts. The committee requests and receives information on, and makes recommendations to the Independent Trustees concerning, the approval and annual review of the Advisory Contracts.
At its July 2007 meeting, the Board of Trustees, including the Independent Trustees, unanimously determined to renew the Advisory Contracts for the fund. In reaching its determination, the Board considered all factors it believed relevant, including (i) the nature, extent, and quality of the services to be provided to the fund and its shareholders (including the investment performance of the fund); (ii) the competitiveness of the management fee and total expenses of the fund; (iii) the total costs of the services to be provided by and the profits to be realized by the investment adviser and its affiliates from the relationship with the fund; (iv) the extent to which economies of scale would be realized as the fund grows; and (v) whether fee levels reflect these economies of scale, if any, for the benefit of fund shareholders. The Board also approved amendments to the fund's agreements with foreign sub-advisers to clarify that each sub-adviser provides services as an independent contractor.
In determining whether to renew the Advisory Contracts for the fund, the Board ultimately reached a determination, with the assistance of fund counsel and Independent Trustees' counsel, that the renewal of the Advisory Contracts and the compensation to be received by Fidelity under the management contract is consistent with Fidelity's fiduciary duty under applicable law. In addition to evaluating the specific factors noted above, the Board, in reaching its determination, is aware that shareholders in the fund have a broad range of investment choices available to them, including a wide choice among mutual funds offered by competitors to Fidelity, and that the fund's shareholders, with the opportunity to review and weigh the disclosure provided by the fund in its prospectus and other public disclosures, have chosen to invest in this fund, managed by Fidelity.
Annual Report
Board Approval of Investment Advisory Contracts and
Management Fees - continued
Nature, Extent, and Quality of Services Provided. The Board considered staffing within the investment adviser, FMR, and the sub-advisers (together, the Investment Advisers), including the background of the fund's portfolio manager and the fund's investment objective and discipline. The Independent Trustees also had discussions with senior management of Fidelity's investment operations and investment groups. The Board considered the structure of the portfolio manager compensation program and whether this structure provides appropriate incentives.
Resources Dedicated to Investment Management and Support Services. The Board reviewed the size, education, and experience of the Investment Advisers' investment staff, their use of technology, and the Investment Advisers' approach to recruiting, training, and retaining portfolio managers and other research, advisory, and management personnel. The Board considered Fidelity's extensive global research capabilities that enable the Investment Advisers to aggregate data from various sources in an effort to produce positive investment results. The Board noted that Fidelity's analysts have access to a variety of technological tools that enable them to perform both fundamental and quantitative analysis and to specialize in various disciplines. The Board also considered that Fidelity's portfolio managers and analysts have access to daily portfolio attribution that allows for monitoring of a fund's portfolio, as well as an electronic communication system that provides immediate real-time access to research concerning issuers and credit enhancers.
Shareholder and Administrative Services. The Board considered (i) the nature, extent, quality, and cost of advisory, administrative, distribution, and shareholder services performed by the Investment Advisers and their affiliates under the Advisory Contracts and under separate agreements covering transfer agency, pricing and bookkeeping, and securities lending services for the fund; (ii) the nature and extent of the Investment Advisers' supervision of third party service providers, principally custodians and subcustodians; and (iii) the resources devoted to, and the record of compliance with, the fund's compliance policies and procedures. The Board reviewed the allocation of fund brokerage, including allocations to brokers affiliated with the Investment Advisers, the use of brokerage commissions to pay fund expenses, and the use of "soft" commission dollars to pay for research services. The Board also considered that Fidelity voluntarily pays for market data out of its own resources. The Board also considered the agreement reached between the Independent Trustees and Fidelity in December 2006 following an independent review of matters relating to receipt of travel, entertainment, gifts and gratuities in violation of Fidelity policies.
Annual Report
The Board noted that the growth of fund assets across the complex allows Fidelity to reinvest in the development of services designed to enhance the value or convenience of the Fidelity funds as investment vehicles. These services include 24-hour access to account information and market information through phone representatives and over the Internet, and investor education materials and asset allocation tools.
Investment in a Large Fund Family. The Board considered the benefits to shareholders of investing in a Fidelity fund, including the benefits of investing in a fund that is part of a large family of funds offering a variety of investment disciplines and providing for a large variety of mutual fund investor services. For example, fund shareholders are offered the privilege of exchanging shares of the fund for shares of other Fidelity funds, as set forth in the fund's prospectus, without paying a sales charge. The Board noted that, since the last Advisory Contract renewals in July 2006, Fidelity has taken a number of actions that benefited particular funds, including (i) dedicating additional resources to investment research and to restructure the investment research teams; (ii) contractually agreeing to reduce the management fee on Fidelity Advisor Floating Rate High Income Fund; (iii) contractually agreeing to reduce the management fees on Fidelity's California, Massachusetts, New Jersey, and New York AMT Tax-Free Money Market Funds, launching new Institutional Classes and Service Classes of these funds, and contractually agreeing to impose expense limitations on these funds; (iv) eliminating the exchange fee on the Fidelity Select Portfolios and reducing the pricing and bookkeeping fee rates for these funds; (v) reducing the maximum transfer agency fee rates on high income funds and certain equity funds; (vi) proposing amended management contracts that, if approved by shareholders, will add a performance adjustment component to the management fees paid by 18 Fidelity Advisor equity funds; (vii) contractually agreeing to reduce fees for Ultra-Short Central Fund and the money market Central Funds; (viii) waiving the Fidelity Advisor funds' contingent deferred sales charge on certain redemptions made through systematic withdrawal programs; and (ix) amending the management contracts for equity and fixed-income funds whose management contracts incorporate a "group fee" structure by adding four new fee "breakpoints" to the group fee rate schedules.
Investment Performance and Compliance. The Board considered whether the fund has operated within its investment objective, as well as its record of compliance with its investment restrictions. It also reviewed the fund's absolute investment performance for each class, as well as the fund's relative investment performance for each class measured against (i) a broad-based securities market index, and (ii) a peer group of mutual funds deemed appropriate by the Board over multiple periods. The following charts considered by the Board show, over the one-, three-, and five-year periods ended December 31, 2006, the cumulative total returns of Institutional Class (Class I) and Class C of the fund, the cumulative total returns of a broad-based securities market index ("benchmark"), and a range of cumulative total returns of a peer group of mutual funds identified by Morningstar, Inc. as having an investment style similar to that of the fund based on underlying portfolio holdings. The returns of Institutional Class (Class I) and Class C show the performance of the highest and lowest performing classes, respectively (based on three-year performance). The box within each chart shows the 25th percentile return (bottom of box) and the 75th percentile return (top of box) of the peer group. Returns shown above the box are in the first quartile and returns shown below the box are in the fourth quartile. The percentage beaten numbers noted below each chart correspond to the percentile box and represent the percentage of funds in the peer group whose performance was equal to or lower than that of the class indicated.
Annual Report
Board Approval of Investment Advisory Contracts and
Management Fees - continued
Advisor Europe Capital Appreciation Fund

The Board reviewed the fund's relative investment performance against its peer group and stated that the performance of Institutional Class (Class I) of the fund was in the second quartile for all the periods shown. The Board also stated that the investment performance of Institutional Class (Class I) of the fund compared favorably to its benchmark for all the periods shown. The Board considered that the variations in performance among the fund's classes reflect the variations in class expenses, which result in lower performance for higher expense classes.
The Board considered that FMR has taken steps to refocus and strengthen equity research, equity portfolio management, and compliance.
Based on its review, and giving particular weight to the nature and quality of the resources dedicated by the Investment Advisers to maintain and improve relative performance, the Board concluded that the nature, extent, and quality of the services provided to the fund will benefit the fund's shareholders, particularly in light of the Board's view that the fund's shareholders benefit from investing in a fund that is part of a large family of funds offering a variety of investment disciplines and services.
Annual Report
Competitiveness of Management Fee and Total Fund Expenses. The Board considered the fund's management fee and total expenses compared to "mapped groups" of competitive funds and classes. Fidelity creates "mapped groups" by combining similar Lipper investment objective categories that have comparable management fee characteristics. Combining Lipper investment objective categories aids the Board's management fee and total expense comparisons by broadening the competitive group used for comparison and by reducing the number of universes to which various Fidelity funds are compared. The Board also considered supplemental information about how the fund's management fee and total expenses ranked relative to groups based on Lipper classifications, which take into account a fund's market capitalization and style.
The Board considered two proprietary management fee comparisons for the 12-month periods shown in the chart below. The group of Lipper funds used by the Board for management fee comparisons is referred to below as the "Total Mapped Group." The Total Mapped Group comparison focuses on a fund's standing relative to the total universe of comparable funds available to investors, in terms of gross management fees before expense reimbursements or caps. "TMG %" represents the percentage of funds in the Total Mapped Group that had management fees that were lower than the fund's. For example, a TMG % of 13% means that 87% of the funds in the Total Mapped Group had higher management fees than the fund. The "Asset-Size Peer Group" (ASPG) comparison focuses on a fund's standing relative to non-Fidelity funds similar in size to the fund within the Total Mapped Group. The ASPG represents at least 15% of the funds in the Total Mapped Group with comparable asset size and management fee characteristics, subject to a minimum of 50 funds (or all funds in the Total Mapped Group if fewer than 50). Additional information, such as the ASPG quartile in which the fund's management fee ranked, is also included in the chart and considered by the Board.
Annual Report
Board Approval of Investment Advisory Contracts and
Management Fees - continued
Advisor Europe Capital Appreciation Fund

The Board noted that the fund's management fee ranked below the median of its Total Mapped Group and below the median of its ASPG for 2006.
Based on its review, the Board concluded that the fund's management fee was fair and reasonable in light of the services that the fund receives and the other factors considered.
In its review of each class's total expenses, the Board considered the fund's management fee as well as other fund or class expenses, as applicable, such as transfer agent fees, pricing and bookkeeping fees, fund-paid 12b-1 fees, and custodial, legal, and audit fees. The Board also noted the effects of any waivers and reimbursements on fees and expenses. As part of its review, the Board also considered current and historical total expenses of each class of the fund compared to competitive fund median expenses. Each class of the fund is compared to those funds and classes in the Total Mapped Group (used by the Board for management fee comparisons) that have a similar sales load structure.
The Board noted that the total expenses of Class A ranked below its competitive median for 2006, the total expenses of each of Class B and Class C ranked equal to its competitive median for 2006, and the total expenses of each of Class T and Institutional Class ranked above its competitive median for 2006. The Board noted that the fund offers multiple classes, each of which has a different sales load and 12b-1 fee structure, and that the multiple structures are intended to offer a range of pricing options for the intermediary market. The Board also noted that the total expenses of the classes vary primarily by the level of their 12b-1 fees, although differences in transfer agent fees may also cause expenses to vary from class to class.
Annual Report
In its review of total expenses, the Board also considered Fidelity fee structures and other information on clients that FMR and its affiliates service in other competitive markets, such as other mutual funds advised or subadvised by FMR or its affiliates, pension plan clients, and other institutional clients.
Based on its review, the Board concluded that the total expenses of each class of the fund were reasonable, although in some cases above the median of the universe presented for comparison, in light of the services that the fund and its shareholders receive and the other factors considered.
Costs of the Services and Profitability. The Board considered the revenues earned and the expenses incurred by Fidelity in conducting the business of developing, marketing, distributing, managing, administering and servicing the fund and its shareholders. The Board also considered the level of Fidelity's profits in respect of all the Fidelity funds.
On an annual basis, FMR presents to the Board Fidelity's profitability for the fund. Fidelity calculates the profitability for each fund, as well as aggregate profitability for groups of Fidelity funds and all Fidelity funds, using a series of detailed revenue and cost allocation methodologies which originate with the audited books and records of Fidelity. The Audit Committee of the Board reviews any significant changes from the prior year's methodologies.
PricewaterhouseCoopers LLP (PwC), independent registered public accounting firm and auditor to Fidelity and certain Fidelity funds, has been engaged annually by the Board as part of the Board's assessment of the results of Fidelity's profitability analysis. PwC's engagement includes the review and assessment of Fidelity's methodologies used in determining the revenues and expenses attributable to Fidelity's mutual fund business, and completion of agreed-upon procedures surrounding the mathematical accuracy of fund profitability and its conformity to allocation methodologies. After considering PwC's reports issued under the engagement and information provided by Fidelity, the Board believes that while other allocation methods may also be reasonable, Fidelity's profitability methodologies are reasonable in all material respects.
The Board has also reviewed Fidelity's non-fund businesses and any fall-out benefits related to the mutual fund business as well as cases where Fidelity's affiliates may benefit from or be related to the fund's business.
The Board considered the costs of the services provided by and the profits realized by Fidelity in connection with the operation of the fund and determined that the amount of profit is a fair entrepreneurial profit for the management of the fund.
Economies of Scale. The Board considered whether there have been economies of scale in respect of the management of the Fidelity funds, whether the Fidelity funds (including the fund) have appropriately benefited from any such economies of scale, and whether there is potential for realization of any further economies of scale. The Board considered the extent to which the fund will benefit from economies of scale through increased services to the fund, through waivers or reimbursements, or through fee or expense reductions, including reductions that occur through operation of the transfer agent agreement. The transfer agent fee varies in part based on the number of accounts in the fund. If the number of accounts decreases or the average account size increases, the overall transfer agent fee rate decreases.
Annual Report
Board Approval of Investment Advisory Contracts and
Management Fees - continued
The Board recognized that the fund's management contract incorporates a "group fee" structure, which provides for lower group fee rates as total fund assets under FMR's management increase, and for higher group fee rates as total fund assets under FMR's management decrease. FMR determines the group fee rates based on a tiered asset "breakpoint" schedule. In connection with the renewal of the fund's management contract, the Board approved amendments to the fund's management contract that added four new fee breakpoints to the group fee rate schedule for assets under FMR's management above $1,386 billion. The Board considered that the group fee rate declines under both the present and amended schedules, but that under the amended schedule, the group fee rate declines faster as assets under FMR's management exceed $1,386 billion. The Board considered that the group fee is designed to deliver the benefits of economies of scale to fund shareholders when total fund assets increase, even if assets of any particular fund are unchanged or have declined, because some portion of Fidelity's costs are attributable to services provided to all Fidelity funds, and all funds benefit if those costs can be allocated among more assets. The Board concluded that, given the group fee structure, fund shareholders will achieve a certain level of economies of scale as assets under FMR's management increase at the fund complex level, regardless of whether Fidelity achieves any such economies of scale.
The Board further concluded that any potential economies of scale are being shared between fund shareholders and Fidelity in an appropriate manner.
Additional Information Requested by the Board. In order to develop fully the factual basis for consideration of the Fidelity funds' Advisory Contracts, the Board requested and received additional information on several topics, including (i) fund performance trends and actions to be taken by FMR to improve certain funds' overall performance; (ii) Fidelity's portfolio manager compensation structure, including its effects on fund profitability and the extent to which portfolio manager compensation is linked to fund performance; (iii) Fidelity's fee structures; (iv) the funds' sub-advisory arrangements; and (v) accounts managed by Fidelity other than the Fidelity funds.
Based on its evaluation of all of the conclusions noted above, and after considering all material factors, the Board ultimately concluded that the advisory fee structures are fair and reasonable, and that the fund's Advisory Contracts should be renewed.
Annual Report
Annual Report
Annual Report
Annual Report
Investment Adviser
Fidelity Management & Research Company
Boston, MA
Investment Sub-Advisers
FMR Co., Inc.
Fidelity Management & Research
(U.K.) Inc.
Fidelity Research & Analysis Company
Fidelity International Investment Advisors
Fidelity International Investment Advisors (U.K.) Limited
Fidelity Investments Japan Limited
General Distributor
Fidelity Distributors Corporation
Boston, MA
Transfer and Service Agents
Fidelity Investments Institutional Operations Company, Inc.
Boston, MA
Fidelity Service Company, Inc.
Boston, MA
Custodian
State Street Bank and Trust Company
Quincy, MA
AEURI-UANN-1207
1.784740.104
(Fidelity Investment logo)(registered trademark)
(Fidelity Investment logo)(registered trademark)
Fidelity® Advisor
Global Capital Appreciation
Fund - Class A, Class T, Class B
and Class C
Annual Report
October 31, 2007
(2_fidelity_logos) (Registered_Trademark)
Contents
Chairman's Message | <Click Here> | Ned Johnson's message to shareholders. |
Note to Shareholders | <Click Here> | An explanation of the changes to the fund. |
Performance | <Click Here> | How the fund has done over time. |
Management's Discussion | <Click Here> | The manager's review of fund performance, strategy and outlook. |
Shareholder Expense Example | <Click Here> | An example of shareholder expenses. |
Investment Changes | <Click Here> | A summary of major shifts in the fund's investments over the past six months. |
Investments | <Click Here> | A complete list of the fund's investments with their market values. |
Financial Statements | <Click Here> | Statements of assets and liabilities, operations, and changes in net assets,
as well as financial highlights. |
Notes | <Click Here> | Notes to the financial statements. |
Report of Independent Registered Public Accounting Firm | <Click Here> | |
Trustees and Officers | <Click Here> | |
Distributions | <Click Here> | |
Proxy Voting Results | <Click Here> | |
Board Approval of Investment Advisory Contracts and Management Fees | <Click Here> | |
To view a fund's proxy voting guidelines and proxy voting record for the 12-month period ended June 30, visit http://www.fidelity.com (search for "proxy voting guidelines") or visit the Securities and Exchange Commission's (SEC) web site at http://www.sec.gov. You may also call 1-877-208-0098 to request a free copy of the proxy voting guidelines.
Standard & Poor's, S&P and S&P 500 are registered service marks of The McGraw-Hill Companies, Inc. and have been licensed for use by Fidelity Distributors Corporation.
Other third party marks appearing herein are the property of their respective owners.
All other marks appearing herein are registered or unregistered trademarks or service marks of FMR LLC or an affiliated company.
Annual Report
This report and the financial statements contained herein are submitted for the general information of the shareholders of the fund. This report is not authorized for distribution to prospective investors in the fund unless preceded or accompanied by an effective prospectus.
A fund files its complete schedule of portfolio holdings with the SEC for the first and third quarters of each fiscal year on Form N-Q. Forms N-Q are available on the SEC's web site at http://www.sec.gov. A fund's Forms N-Q may be reviewed and copied at the SEC's Public Reference Room in Washington, DC. Information regarding the operation of the SEC's Public Reference Room may be obtained by calling 1-800-SEC-0330. For a complete list of a fund's portfolio holdings, view the most recent holdings listing, semiannual report, or annual report on Fidelity's web site at http://www.fidelity.com or http://www.advisor.fidelity.com, as applicable.
NOT FDIC INSURED · MAY LOSE VALUE · NO BANK GUARANTEE
Neither the fund nor Fidelity Distributors Corporation is a bank.
Annual Report
Chairman's Message
(photo_of_Edward_C_Johnson_3d)
Dear Shareholder:
Many stock and bond markets around the world have been unsettled of late; however, volatility can often lead to opportunity for patient investors. Financial markets are always unpredictable, but there are a number of time-tested principles that can put the historical odds in your favor.
One of the basic tenets is to invest for the long term. Over time, riding out the markets' inevitable ups and downs has proven much more effective than selling into panic or chasing the hottest trend. Even missing only a few of the markets' best days can significantly diminish investor returns. Patience also affords the benefits of compounding - of earning interest on additional income or reinvested dividends and capital gains. There are tax advantages and cost benefits to consider as well. The more you sell, the more taxes you pay, and the more you trade, the higher the costs. While staying the course doesn't eliminate risk, it can considerably lessen the effect of short-term declines.
You can further manage your investing risk through diversification. And today, more than ever, geographic diversification should be taken into account. Studies indicate that asset allocation is the single most important determinant of a portfolio's long-term success. The right mix of stocks, bonds and cash - aligned to your particular risk tolerance and investment objective - is very important. Age-appropriate rebalancing is also an essential aspect of asset allocation. For younger investors, an emphasis on equities - which historically have been the best-performing asset class over time - is encouraged. As investors near their specific goal, such as retirement or sending a child to college, consideration may be given to replacing volatile assets (e.g. common stocks) with more-stable fixed investments (bonds or savings plans).
A third investment principle - investing regularly - can help lower the average cost of your purchases. Investing a certain amount of money each month or quarter helps ensure you won't pay for all your shares at market highs. This strategy - known as dollar cost averaging - also reduces unconstructive "emotion" from investing, helping shareholders avoid selling weak performers just prior to an upswing, or chasing a hot performer just before a correction.
We invite you to contact us via the Internet, through our Investor Centers or over the phone. It is our privilege to provide you the information you need to make the investments that are right for you.
Sincerely,
/s/Edward C. Johnson 3d
Edward C. Johnson 3d
Annual Report
Note to Shareholders:
On June 20, 2007, shareholders of Fidelity® Advisor Global Capital Appreciation Fund approved a new management contract for the fund, effective July 1, 2007, which adds a performance adjustment component to the management fee based on the fund's performance versus the Morgan Stanley Capital InternationalSM All Country World Index (MSCI® ACWI). The new contract also allows the Board of Trustees to designate an alternate performance adjustment index in the future, without a shareholder vote, when permitted by applicable law.
Annual Report
Performance: The Bottom Line
Average annual total return reflects the change in the value of an investment, assuming reinvestment of the class' dividend income and capital gains (the profits earned upon the sale of securities that have grown in value) and assuming a constant rate of performance each year. The $10,000 table and the fund's returns do not reflect the deduction of taxes that a shareholder would pay on fund distributions or the redemption of fund shares. During periods of reimbursement by Fidelity, a fund's total return will be greater than it would be had the reimbursement not occurred. How a fund did yesterday is no guarantee of how it will do tomorrow. Returns reflect the conversion of Class B shares to Class A shares after a maximum of seven years.
Average Annual Total Returns
Periods ended October 31, 2007 | Past 1
year | Past 5
years | Life of
fund A |
Class A (incl. 5.75% sales charge) | 13.62% | 14.44% | 6.35% |
Class T (incl. 3.50% sales charge) | 16.03% | 14.71% | 6.36% |
Class B (incl. contingent deferred sales charge)B | 14.65% | 14.73% | 6.43% |
Class C (incl. contingent deferred sales charge)C | 18.62% | 14.95% | 6.27% |
A From December 17, 1998.
B Class B shares' contingent deferred sales charges included in the past one year, past five years, and life of fund total return figures are 5%, 2%, and 0%, respectively.
C Class C shares' contingent deferred sales charges included in the past one year, past five years, and life of fund total return figures are 1%, 0%, and 0%, respectively.
Annual Report
$10,000 Over Life of Fund
Let's say hypothetically that $10,000 was invested in Fidelity® Advisor Global Capital Appreciation Fund - Class T on December 17, 1998, when the fund started, and the current 3.50% sales charge was paid. The chart shows how the value of your investment would have changed, and also shows how the MSCI® All Country (AC) World Index performed over the same period.
Annual Report
Management's Discussion of Fund Performance
Comments from Darren Maupin, Lead Portfolio Manager of Fidelity® Advisor Global Capital Appreciation Fund
Foreign stocks, with a large assist from a weak U.S. dollar, generally had higher returns for U.S. investors than domestic equities during the 12-month period ending October 31, 2007. The backdrop for global stocks was solid, with robust economic growth and relatively high corporate profitability worldwide. Developed international equity markets, as measured by the Morgan Stanley Capital InternationalSM Europe, Australasia, and Far East (MSCI® EAFE®) Index - a performance monitor of established markets outside the United States and Canada - rose 25.09%. In comparison, the Standard & Poor's 500SM Index, a gauge of U.S. stocks, was up 14.56%, while Canada did appreciably better, as measured by the 43.24% advance of the S&P/TSX Composite Index. Among countries making up at least 1% of the EAFE benchmark, Finland had the best showing, soaring nearly 69%, while Hong Kong gained roughly 66%. The United Kingdom and Japan, the two largest components of the index, both underperformed. Fallout from the credit crunch and concerns about export growth tempered UK stocks, while Japan struggled with a slowdown in consumer spending and sluggish domestic growth. Emerging markets were the period's big winners, advancing 68.33% as measured by the MSCI Emerging Markets index.
The fund's Class A, Class T, Class B and Class C shares were up 20.55%, 20.24%, 19.65% and 19.62%, respectively (excluding sales charges), compared with a gain of 24.58% for the MSCI All Country World index. The fund underperformed the index mainly due to unrewarding stock selection in materials and financials, with detractors in these sectors coming from both the international and U.S. equity sleeves. Overweighting the strong materials sector and underweighting the weak financials group, however, helped offset some of that damage. Regionally, our positioning in the Japanese market detracted, as did our overweighting versus the index in U.S. stocks, which did not perform as well as their international counterparts. However, good stock picking in the U.S. sleeve - especially within information technology - more than offset that drag. Overall, the fund's biggest relative detractors were Catalyst Paper, a Canadian materials company; Countrywide Financial, a large U.S. mortgage originator; and Sears Holdings, the large U.S. retail store chain. Contributions to the fund's relative results included U.S.-based Fluor, a global engineering and construction company; and Saskatchewan Wheat Pool, a Canadian grain processor.
Note to shareholders: Sammy Simnegar will become Co-Manager of the fund on January 1, 2008, replacing Darren Maupin.
The views expressed above reflect those of the portfolio manager(s) only through the end of the period as stated on the cover of this report and do not necessarily represent the views of Fidelity or any other person in the Fidelity organization. Any such views are subject to change at any time based upon market or other conditions and Fidelity disclaims any responsibility to update such views. These views may not be relied on as investment advice and, because investment decisions for a Fidelity fund are based on numerous factors, may not be relied on as an indication of trading intent on behalf of any Fidelity fund.
Annual Report
Shareholder Expense Example
As a shareholder of the Fund, you incur two types of costs: (1) transaction costs, including sales charges (loads) on purchase payments or redemption proceeds, redemption fees, and (2) ongoing costs, including management fees, distribution and/or service (12b-1) fees and other Fund expenses. This Example is intended to help you understand your ongoing costs (in dollars) of investing in the Fund and to compare these costs with the ongoing costs of investing in other mutual funds.
The Example is based on an investment of $1,000 invested at the beginning of the period and held for the entire period (May 1, 2007 to October 31, 2007).
Actual Expenses
The first line of the accompanying table for each class of the Fund provides information about actual account values and actual expenses. You may use the information in this line, together with the amount you invested, to estimate the expenses that you paid over the period. Simply divide your account value by $1,000.00 (for example, an $8,600 account value divided by $1,000.00 = 8.6), then multiply the result by the number in the first line for a class of the Fund under the heading entitled "Expenses Paid During Period" to estimate the expenses you paid on your account during this period. In addition, the Fund, as a shareholder in the underlying Fidelity Central Funds, will indirectly bear its pro rata share of the fees and expenses incurred by the underlying Fidelity Central Funds. These fees and expenses are not included in the Fund's annualized expense ratio used to calculate the expense estimate in the table below.
Hypothetical Example for Comparison Purposes
The second line of the accompanying table for each class of the Fund provides information about hypothetical account values and hypothetical expenses based on a Class' actual expense ratio and an assumed rate of return of 5% per year before expenses, which is not the Class' actual return. The hypothetical account values and expenses may not be used to estimate the actual ending account balance or expenses you paid for the period. You may use this information to compare the ongoing costs of investing in the Fund and other funds. To do so, compare this 5% hypothetical example with the 5% hypothetical examples that appear in the shareholder reports of the other funds. In addition, the Fund, as a shareholder in the underlying Fidelity Central Funds, will indirectly bear its pro rata share of the fees and expenses incurred by the underlying Fidelity Central Funds. These fees and expenses are not included in the Fund's annualized expense ratio used to calculate the expense estimate in the table below.
Annual Report
Shareholder Expense Example - continued
Please note that the expenses shown in the table are meant to highlight your ongoing costs only and do not reflect any transaction costs. Therefore, the second line of the table is useful in comparing ongoing costs only, and will not help you determine the relative total costs of owning different funds. In addition, if these transactional costs were included, your costs would have been higher.
| Beginning
Account Value
May 1, 2007 | Ending
Account Value
October 31, 2007 | Expenses Paid
During Period*
May 1, 2007 to
October 31, 2007 |
Class A | | | |
Actual | $ 1,000.00 | $ 1,074.00 | $ 7.84 |
Hypothetical A | $ 1,000.00 | $ 1,017.64 | $ 7.63 |
Class T | | | |
Actual | $ 1,000.00 | $ 1,072.70 | $ 9.14 |
Hypothetical A | $ 1,000.00 | $ 1,016.38 | $ 8.89 |
Class B | | | |
Actual | $ 1,000.00 | $ 1,070.10 | $ 11.74 |
Hypothetical A | $ 1,000.00 | $ 1,013.86 | $ 11.42 |
Class C | | | |
Actual | $ 1,000.00 | $ 1,070.00 | $ 11.74 |
Hypothetical A | $ 1,000.00 | $ 1,013.86 | $ 11.42 |
Institutional Class | | | |
Actual | $ 1,000.00 | $ 1,075.80 | $ 6.54 |
Hypothetical A | $ 1,000.00 | $ 1,018.90 | $ 6.36 |
A 5% return per year before expenses
* Expenses are equal to each Class' annualized expense ratio (shown in the table below); multiplied by the average account value over the period, multiplied by 184/365 (to reflect the one-half year period).
| Annualized
Expense Ratio |
Class A | 1.50% |
Class T | 1.75% |
Class B | 2.25% |
Class C | 2.25% |
Institutional Class | 1.25% |
Annual Report
Investment Changes
Top Five Stocks as of October 31, 2007 |
| % of fund's
net assets | % of fund's net assets
6 months ago |
Hutchison Whampoa Ltd. (Hong Kong, Industrial Conglomerates) | 3.4 | 0.0 |
Google, Inc. Class A (sub. vtg.) (United States of America, Internet Software & Services) | 3.2 | 2.6 |
Kubota Corp. (Japan, Machinery) | 2.7 | 1.0 |
Fluor Corp. (United States of America, Construction & Engineering) | 2.3 | 1.3 |
Takeda Pharamaceutical Co. Ltd. (Japan, Pharmaceuticals) | 2.3 | 0.2 |
| 13.9 | |
Top Five Market Sectors as of October 31, 2007 |
| % of fund's
net assets | % of fund's net assets
6 months ago |
Financials | 14.0 | 15.9 |
Materials | 12.6 | 10.6 |
Energy | 12.5 | 10.1 |
Industrials | 11.1 | 9.2 |
Health Care | 10.5 | 9.4 |
Top Five Countries as of October 31, 2007 |
(excluding cash equivalents) | % of fund's
net assets | % of fund's net assets
6 months ago |
United States of America | 42.1 | 50.7 |
Japan | 16.2 | 9.2 |
Canada | 11.4 | 9.6 |
Hong Kong | 3.4 | 0.0 |
Germany | 2.8 | 2.4 |
Percentages are adjusted for the effect of open futures contracts, if applicable. |
Asset Allocation (% of fund's net assets) |
As of October 31, 2007 | As of April 30, 2007 |
| Stocks 90.7% | | | Stocks 92.3% | |
| Bonds 0.6% | | | Bonds 1.5% | |
| Short-Term
Investments and
Net Other Assets 8.7% | | | Short-Term
Investments and
Net Other Assets 6.2% | |

Annual Report
Investments October 31, 2007
Showing Percentage of Net Assets
Common Stocks - 89.3% |
| Shares | | Value |
Argentina - 1.3% |
Cresud S.A.C.I.F. y A. sponsored ADR | 11,500 | | $ 283,820 |
Inversiones y Representaciones SA sponsored GDR (a) | 6,100 | | 108,946 |
Pampa Holding SA (a) | 272,138 | | 243,441 |
TOTAL ARGENTINA | | 636,207 |
Australia - 0.3% |
ABB Grain Ltd. | 15,812 | | 111,309 |
Newcrest Mining Ltd. | 805 | | 24,539 |
TOTAL AUSTRALIA | | 135,848 |
Brazil - 0.0% |
Bovespa Holding SA (a) | 1,000 | | 19,045 |
Canada - 11.4% |
Absolut Resources Corp. (a) | 58,000 | | 60,813 |
Aquiline Resources, Inc. (a) | 52,800 | | 593,315 |
Aquiline Resources, Inc. (a)(f) | 22,100 | | 248,338 |
Canadian Natural Resources Ltd. | 6,100 | | 507,537 |
Canfor Corp. (a) | 48,000 | | 444,821 |
Catalyst Paper Corp. (a) | 300,700 | | 452,228 |
European Goldfields Ltd. (a) | 83,500 | | 567,751 |
Guyana Goldfields, Inc. (a) | 15,400 | | 159,024 |
IAMGOLD Corp. | 70,100 | | 614,730 |
NuVista Energy Ltd. (a) | 10,000 | | 155,899 |
ProEx Energy Ltd. (a) | 19,100 | | 295,138 |
Saskatchewan Wheat Pool, Inc. (a)(f) | 38,600 | | 522,053 |
Suncor Energy, Inc. | 3,100 | | 339,647 |
Trican Well Service Ltd. | 28,700 | | 607,922 |
TOTAL CANADA | | 5,569,216 |
Cayman Islands - 2.1% |
ACE Ltd. | 7,100 | | 430,331 |
Apex Silver Mines Ltd. (a) | 12,500 | | 256,250 |
Hutchison Telecommunications International Ltd. (a) | 242,000 | | 345,408 |
TOTAL CAYMAN ISLANDS | | 1,031,989 |
Czech Republic - 1.3% |
Philip Morris CR AS | 1,270 | | 662,543 |
France - 1.7% |
Sanofi-Aventis sponsored ADR | 18,900 | | 831,789 |
Common Stocks - continued |
| Shares | | Value |
Germany - 2.8% |
E.ON AG | 4,300 | | $ 839,790 |
Lanxess AG | 10,300 | | 514,383 |
TOTAL GERMANY | | 1,354,173 |
Hong Kong - 3.4% |
Hutchison Whampoa Ltd. | 131,000 | | 1,650,601 |
Japan - 14.1% |
Aioi Insurance Co. Ltd. | 70,000 | | 406,935 |
Canon, Inc. | 5,300 | | 268,021 |
Kose Corp. | 24,400 | | 626,353 |
Kubota Corp. | 135,600 | | 1,138,659 |
Kubota Corp. sponsored ADR | 3,800 | | 159,980 |
Millea Holdings, Inc. | 10,412 | | 408,775 |
Mitsui Marine & Fire Insurance Co. Ltd. | 33,000 | | 378,555 |
Nec Electronics Corp. (a) | 2,000 | | 54,807 |
Nissin Healthcare Food Service Co. | 1,700 | | 20,811 |
Parco Co. Ltd. | 21,900 | | 306,667 |
Seino Holdings Co. Ltd. | 14,000 | | 120,239 |
SFCG Co. Ltd. | 2,970 | | 492,725 |
Shinsei Bank Ltd. | 284,000 | | 920,721 |
Takeda Pharmaceutical Co. Ltd. | 17,700 | | 1,105,861 |
Tokyo Steel Manufacturing Co. Ltd. | 8,000 | | 110,956 |
Torii Pharmaceutical Co. Ltd. | 5,000 | | 88,133 |
Tsutsumi Jewelry Co. Ltd. | 6,000 | | 131,271 |
USS Co. Ltd. | 2,060 | | 134,960 |
TOTAL JAPAN | | 6,874,429 |
Netherlands - 1.6% |
Koninklijke Philips Electronics NV | 19,000 | | 785,460 |
Netherlands Antilles - 1.8% |
Schlumberger Ltd. (NY Shares) | 9,400 | | 907,758 |
Philippines - 1.1% |
DMCI Holdings, Inc. | 793,000 | | 219,136 |
Semirara Mining Corp. | 301,600 | | 312,539 |
TOTAL PHILIPPINES | | 531,675 |
South Africa - 1.9% |
Gold Fields Ltd. sponsored ADR | 52,800 | | 954,096 |
Switzerland - 1.4% |
Actelion Ltd. (Reg.) (a) | 13,630 | | 677,205 |
Common Stocks - continued |
| Shares | | Value |
Taiwan - 1.4% |
Taiwan Mobile Co. Ltd. | 506,000 | | $ 677,895 |
United States of America - 41.7% |
AbitibiBowater, Inc. | 29,168 | | 999,296 |
AllianceBernstein Holding LP | 4,400 | | 375,892 |
American Express Co. | 6,800 | | 414,460 |
Apple, Inc. (a) | 5,000 | | 949,750 |
Bank of America Corp. | 11,600 | | 560,048 |
Becton, Dickinson & Co. | 4,100 | | 342,186 |
Chesapeake Energy Corp. | 12,300 | | 485,604 |
Cogent Communications Group, Inc. (a) | 16,219 | | 448,942 |
Corporate Executive Board Co. | 6,700 | | 477,375 |
Countrywide Financial Corp. | 18,700 | | 290,224 |
Crown Castle International Corp. (a) | 8,000 | | 328,560 |
Discovery Holding Co. Class A (a) | 19,300 | | 550,243 |
Dolan Media Co. | 8,100 | | 218,700 |
Equinix, Inc. (a) | 6,400 | | 746,624 |
Fluor Corp. | 7,000 | | 1,106,000 |
Genentech, Inc. (a) | 6,240 | | 462,571 |
Google, Inc. Class A (sub. vtg.) (a) | 2,200 | | 1,555,400 |
Hewlett-Packard Co. | 18,400 | | 950,912 |
Landstar System, Inc. | 10,300 | | 433,527 |
Microchip Technology, Inc. | 9,200 | | 305,164 |
Noble Energy, Inc. | 12,400 | | 949,096 |
Norfolk Southern Corp. | 5,500 | | 284,075 |
NRG Energy, Inc. (a) | 18,000 | | 821,880 |
Sears Holdings Corp. (a)(e) | 6,000 | | 808,740 |
Synthes, Inc. | 7,232 | | 902,829 |
The Chubb Corp. | 14,200 | | 757,570 |
The Walt Disney Co. | 18,300 | | 633,729 |
UnitedHealth Group, Inc. | 3,720 | | 182,838 |
Valero Energy Corp. | 14,700 | | 1,035,321 |
VCA Antech, Inc. (a) | 11,400 | | 524,970 |
Virgin Media, Inc. | 27,551 | | 609,153 |
Wells Fargo & Co. | 15,600 | | 530,556 |
Williams Partners LP | 7,200 | | 329,400 |
TOTAL UNITED STATES OF AMERICA | | 20,371,635 |
TOTAL COMMON STOCKS (Cost $37,954,495) | 43,671,564 |
Preferred Stocks - 1.4% |
| Shares | | Value |
Convertible Preferred Stocks - 0.4% |
United States of America - 0.4% |
Freeport-McMoRan Copper & Gold, Inc. 6.75% | 1,200 | | $ 204,791 |
Nonconvertible Preferred Stocks - 1.0% |
Italy - 1.0% |
Istituto Finanziario Industriale SpA (IFI) (a) | 11,400 | | 474,679 |
TOTAL PREFERRED STOCKS (Cost $637,636) | 679,470 |
Government Obligations - 2.7% |
| Principal
Amount (d) | | |
Japan - 2.1% |
Japan Government 0.5953% to 0.6503% 11/5/07 to 1/21/08 | JPY | $ 120,000,000 | | 1,039,684 |
Switzerland - 0.6% |
Switzerland Confederation 4.25% 1/8/08 | CHF | 312,000 | | 270,195 |
TOTAL GOVERNMENT OBLIGATIONS (Cost $1,271,383) | 1,309,879 |
Money Market Funds - 7.8% |
| Shares | | |
Fidelity Cash Central Fund, 4.97% (b) | 2,987,851 | | 2,987,851 |
Fidelity Securities Lending Cash Central Fund, 5.02% (b)(c) | 817,150 | | 817,150 |
TOTAL MONEY MARKET FUNDS (Cost $3,805,001) | | 3,805,001 |
TOTAL INVESTMENT PORTFOLIO - 101.2% (Cost $43,668,515) | | 49,465,914 |
NET OTHER ASSETS - 1.2% | | (571,198) |
NET ASSETS - 100% | $ 48,894,716 |
Forward Foreign Currency Contracts |
| Settlement Dates | | Value | | Unrealized Appreciation/
(Depreciation) |
Contracts to Buy |
64,013 AUD | Nov. 2007 | | $ 59,574 | | $ 1,751 |
67,840 CHF | Nov. 2007 | | 58,631 | | 984 |
242,870 EUR | Nov. 2007 | | 351,958 | | 6,161 |
113,249 GBP | Nov. 2007 | | 235,339 | | 4,602 |
27,104,661 JPY | Nov. 2007 | | 235,412 | | 4,063 |
| | $ 940,914 | | $ 17,561 |
|
(Payable Amount $923,353) |
|
The value of contracts to buy as a percentage of net assets - 1.9% |
Currency Abbreviations |
AUD | - | Australian dollar |
CHF | - | Swiss franc |
EUR | - | European Monetary Unit |
GBP | - | British pound |
JPY | - | Japanese yen |
Legend |
(a) Non-income producing |
(b) Affiliated fund that is available only to investment companies and other accounts managed by Fidelity Investments. The rate quoted is the annualized seven-day yield of the fund at period end. A complete unaudited listing of the fund's holdings as of its most recent quarter end is available upon request. |
(c) Investment made with cash collateral received from securities on loan. |
(d) Principal amount is stated in United States dollars unless otherwise noted. |
(e) Security or a portion of the security is on loan at period end. |
(f) Security exempt from registration under Rule 144A of the Securities Act of 1933. These securities may be resold in transactions exempt from registration, normally to qualified institutional buyers. At the end of the period, the value of these securities amounted to $770,391 or 1.6% of net assets. |
Affiliated Central Funds |
Information regarding fiscal year to date income earned by the Fund from investments in Fidelity Central Funds is as follows: |
Fund | Income earned |
Fidelity Cash Central Fund | $ 136,672 |
Fidelity Securities Lending Cash Central Fund | 14,515 |
Total | $ 151,187 |
See accompanying notes which are an integral part of the financial statements.
Annual Report
Financial Statements
Statement of Assets and Liabilities
Assets | | October 31, 2007 |
Investment in securities, at value (including securities loaned of $795,261) - See accompanying schedule: Unaffiliated issuers (cost $39,863,514) | $ 45,660,913 | |
Fidelity Central Funds (cost $3,805,001) | 3,805,001 | |
Total Investments (cost $43,668,515) | | $ 49,465,914 |
Receivable for investments sold | | 558,379 |
Unrealized appreciation on foreign currency contracts | | 17,561 |
Receivable for closed foreign currency contracts | | 5,520 |
Receivable for fund shares sold | | 90,070 |
Dividends receivable | | 45,870 |
Interest receivable | | 9,285 |
Distributions receivable from Fidelity Central Funds | | 13,617 |
Prepaid expenses | | 25 |
Receivable from investment adviser for expense reductions | | 50,771 |
Other receivables | | 2,848 |
Total assets | | 50,259,860 |
| | |
Liabilities | | |
Payable to custodian bank | $ 41,899 | |
Payable for investments purchased | 237,532 | |
Payable for fund shares redeemed | 91,749 | |
Accrued management fee | 28,080 | |
Distribution fees payable | 20,362 | |
Other affiliated payables | 13,310 | |
Other payables and accrued expenses | 115,062 | |
Collateral on securities loaned, at value | 817,150 | |
Total liabilities | | 1,365,144 |
| | |
Net Assets | | $ 48,894,716 |
Net Assets consist of: | | |
Paid in capital | | $ 37,588,494 |
Undistributed net investment income | | 12,210 |
Accumulated undistributed net realized gain (loss) on investments and foreign currency transactions | | 5,483,707 |
Net unrealized appreciation (depreciation) on investments and assets and liabilities in foreign currencies | | 5,810,305 |
Net Assets | | $ 48,894,716 |
See accompanying notes which are an integral part of the financial statements.
Annual Report
Statement of Assets and Liabilities - continued
| October 31, 2007 |
Calculation of Maximum Offering Price
Class A:
Net Asset Value and redemption price per share ($13,999,515 ÷ 910,041 shares) | | $ 15.38 |
| | |
Maximum offering price per share (100/94.25 of $15.38) | | $ 16.32 |
Class T:
Net Asset Value and redemption price per share ($22,038,594 ÷ 1,464,065 shares) | | $ 15.05 |
| | |
Maximum offering price per share (100/96.50 of $15.05) | | $ 15.60 |
Class B:
Net Asset Value and offering price per share ($5,028,792 ÷ 350,625 shares)A | | $ 14.34 |
| | |
Class C:
Net Asset Value and offering price per share ($5,351,666 ÷ 372,668 shares)A | | $ 14.36 |
| | |
Institutional Class:
Net Asset Value, offering price and redemption price per share ($2,476,149 ÷ 157,134 shares) | | $ 15.76 |
A Redemption price per share is equal to net asset value less any applicable contingent deferred sales charge.
See accompanying notes which are an integral part of the financial statements.
Annual Report
Financial Statements - continued
Statement of Operations
| Year ended October 31, 2007 |
Investment Income | | |
Dividends | | $ 624,693 |
Interest | | 7,374 |
Income from Fidelity Central Funds | | 151,187 |
| | 783,254 |
Less foreign taxes withheld | | (36,322) |
Total income | | 746,932 |
| | |
Expenses | | |
Management fee | $ 350,569 | |
Transfer agent fees | 156,724 | |
Distribution fees | 257,629 | |
Accounting and security lending fees | 27,239 | |
Custodian fees and expenses | 48,715 | |
Independent trustees' compensation | 170 | |
Registration fees | 58,713 | |
Audit | 60,227 | |
Legal | 4,507 | |
Proxy Fees | 66,160 | |
Miscellaneous | 449 | |
Total expenses before reductions | 1,031,102 | |
Expense reductions | (179,298) | 851,804 |
Net investment income (loss) | | (104,872) |
Realized and Unrealized Gain (Loss) Net realized gain (loss) on: | | |
Investment securities: | | |
Unaffiliated issuers (net of foreign taxes of $9,231) | 5,779,710 | |
Foreign currency transactions | 56,677 | |
Total net realized gain (loss) | | 5,836,387 |
Change in net unrealized appreciation (depreciation) on: Investment securities (net of increase in deferred foreign taxes of $6,193) | 3,360,081 | |
Assets and liabilities in foreign currencies | 18,201 | |
Total change in net unrealized appreciation (depreciation) | | 3,378,282 |
Net gain (loss) | | 9,214,669 |
Net increase (decrease) in net assets resulting from operations | | $ 9,109,797 |
See accompanying notes which are an integral part of the financial statements.
Annual Report
Financial Statements - continued
Statement of Changes in Net Assets
| Year ended
October 31,
2007 | Year ended
October 31,
2006 |
Increase (Decrease) in Net Assets | | |
Operations | | |
Net investment income (loss) | $ (104,872) | $ (129,151) |
Net realized gain (loss) | 5,836,387 | 10,213,621 |
Change in net unrealized appreciation (depreciation) | 3,378,282 | (5,808,262) |
Net increase (decrease) in net assets resulting
from operations | 9,109,797 | 4,276,208 |
Distributions to shareholders from net investment income | - | (48,426) |
Distributions to shareholders from net realized gain | (7,528,976) | (68,744) |
Total distributions | (7,528,976) | (117,170) |
Share transactions - net increase (decrease) | (4,022,385) | (5,374,003) |
Redemption fees | 1,520 | 2,963 |
Total increase (decrease) in net assets | (2,440,044) | (1,212,002) |
| | |
Net Assets | | |
Beginning of period | 51,334,760 | 52,546,762 |
End of period (including undistributed net investment income of $12,210 and undistributed net investment income of $0, respectively) | $ 48,894,716 | $ 51,334,760 |
See accompanying notes which are an integral part of the financial statements.
Annual Report
Financial Highlights - Class A
Years ended October 31, | 2007 | 2006 | 2005 | 2004 | 2003 |
Selected Per-Share Data | | | | | |
Net asset value, beginning of period | $ 14.83 | $ 13.68 | $ 11.88 | $ 10.73 | $ 8.62 |
Income from Investment Operations | | | | | |
Net investment income (loss) C | .01 | .01 | .05 | (.04) | (.02) |
Net realized and unrealized gain (loss) | 2.69 | 1.20 | 1.75 | 1.19 | 2.13 |
Total from investment operations | 2.70 | 1.21 | 1.80 | 1.15 | 2.11 |
Distributions from net investment income | - | (.04) | - | - | - |
Distributions from net realized gain | (2.15) | (.02) | - | - | - |
Total distributions | (2.15) | (.06) | - | - | - |
Redemption fees added to paid in capital C | - G | - G | - G | - G | - |
Net asset value, end of period | $ 15.38 | $ 14.83 | $ 13.68 | $ 11.88 | $ 10.73 |
Total Return A, B | 20.55% | 8.86% | 15.15% | 10.72% | 24.48% |
Ratios to Average Net Assets D, F | | | | | |
Expenses before reductions | 1.81% | 1.69% | 1.76% | 1.97% | 2.25% |
Expenses net of fee waivers, if any | 1.50% | 1.50% | 1.56% | 1.75% | 1.76% |
Expenses net of all reductions | 1.45% | 1.46% | 1.54% | 1.72% | 1.73% |
Net investment income (loss) | .06% | .06% | .39% | (.33)% | (.27)% |
Supplemental Data | | | | | |
Net assets, end of period (000 omitted) | $ 14,000 | $ 10,956 | $ 10,101 | $ 8,450 | $ 4,436 |
Portfolio turnover rate E | 102% | 251% | 52% | 59% | 53% |
A Total returns would have been lower had certain expenses not been reduced during the periods shown.
B Total returns do not include the effect of the sales charges.
C Calculated based on average shares outstanding during the period.
D Fees and expenses of the underlying Fidelity Central Funds are not included in the Fund's expense ratio. The Fund indirectly bears its proportionate share of the expenses of any underlying Fidelity Central Funds.
E Amount does not include the portfolio activity of any underlying Fidelity Central Funds.
F Expense ratios reflect operating expenses of the class. Expenses before reductions do not reflect amounts reimbursed by the investment adviser or reductions from brokerage service arrangements or other expense offset arrangements and do not represent the amount paid by the class during periods when reimbursements or reductions occur. Expenses net of fee waivers reflect expenses after reimbursement by the investment adviser but prior to reductions from brokerage service arrangements or other expense offset arrangements. Expenses net of all reductions represent the net expenses paid by the class.
G Amount represents less than $.01 per share.
See accompanying notes which are an integral part of the financial statements.
Annual Report
Financial Highlights - Class T
Years ended October 31, | 2007 | 2006 | 2005 | 2004 | 2003 |
Selected Per-Share Data | | | | | |
Net asset value, beginning of period | $ 14.59 | $ 13.46 | $ 11.71 | $ 10.61 | $ 8.54 |
Income from Investment Operations | | | | | |
Net investment income (loss) C | (.03) | (.03) | .02 | (.07) | (.05) |
Net realized and unrealized gain (loss) | 2.64 | 1.19 | 1.73 | 1.17 | 2.12 |
Total from investment operations | 2.61 | 1.16 | 1.75 | 1.10 | 2.07 |
Distributions from net investment income | - | (.01) | - | - | - |
Distributions from net realized gain | (2.15) | (.02) | - | - | - |
Total distributions | (2.15) | (.03) | - | - | - |
Redemption fees added to paid in capital C | - G | -G | -G | -G | - |
Net asset value, end of period | $ 15.05 | $ 14.59 | $ 13.46 | $ 11.71 | $ 10.61 |
Total Return A, B | 20.24% | 8.62% | 14.94% | 10.37% | 24.24% |
Ratios to Average Net Assets D, F | | | | | |
Expenses before reductions | 2.08% | 1.99% | 2.09% | 2.39% | 2.65% |
Expenses net of fee waivers, if any | 1.75% | 1.75% | 1.81% | 2.00% | 2.01% |
Expenses net of all reductions | 1.71% | 1.71% | 1.79% | 1.97% | 1.98% |
Net investment income (loss) | (.19)% | (.19)% | .14% | (.58)% | (.52)% |
Supplemental Data | | | | | |
Net assets, end of period (000 omitted) | $ 22,039 | $ 26,780 | $ 28,786 | $ 20,966 | $ 17,334 |
Portfolio turnover rate E | 102% | 251% | 52% | 59% | 53% |
A Total returns would have been lower had certain expenses not been reduced during the periods shown.
B Total returns do not include the effect of the sales charges.
C Calculated based on average shares outstanding during the period.
D Fees and expenses of the underlying Fidelity Central Funds are not included in the Fund's expense ratio. The Fund indirectly bears its proportionate share of the expenses of any underlying Fidelity Central Funds.
E Amount does not include the portfolio activity of any underlying Fidelity Central Funds.
F Expense ratios reflect operating expenses of the class. Expenses before reductions do not reflect amounts reimbursed by the investment adviser or reductions from brokerage service arrangements or other expense offset arrangements and do not represent the amount paid by the class during periods when reimbursements or reductions occur. Expenses net of fee waivers reflect expenses after reimbursement by the investment adviser but prior to reductions from brokerage service arrangements or other expense offset arrangements. Expenses net of all reductions represent the net expenses paid by the class.
G Amount represents less than $.01 per share.
See accompanying notes which are an integral part of the financial statements.
Annual Report
Financial Highlights - Class B
Years ended October 31, | 2007 | 2006 | 2005 | 2004 | 2003 |
Selected Per-Share Data | | | | | |
Net asset value, beginning of period | $ 14.06 | $ 13.01 | $ 11.38 | $ 10.36 | $ 8.38 |
Income from Investment Operations | | | | | |
Net investment income (loss) C | (.09) | (.10) | (.04) | (.12) | (.09) |
Net realized and unrealized gain (loss) | 2.52 | 1.15 | 1.67 | 1.14 | 2.07 |
Total from investment operations | 2.43 | 1.05 | 1.63 | 1.02 | 1.98 |
Distributions from net realized gain | (2.15) | - | - | - | - |
Total distributions | (2.15) | - | - | - | - |
Redemption fees added to paid in capital C | - G | - G | - G | - G | - |
Net asset value, end of period | $ 14.34 | $ 14.06 | $ 13.01 | $ 11.38 | $ 10.36 |
Total Return A, B | 19.65% | 8.07% | 14.32% | 9.85% | 23.63% |
Ratios to Average Net Assets D, F | | | | | |
Expenses before reductions | 2.57% | 2.52% | 2.61% | 3.00% | 3.25% |
Expenses net of fee waivers, if any | 2.25% | 2.25% | 2.31% | 2.50% | 2.50% |
Expenses net of all reductions | 2.20% | 2.22% | 2.29% | 2.47% | 2.47% |
Net investment income (loss) | (.69)% | (.69)% | (.36)% | (1.08)% | (1.01)% |
Supplemental Data | | | | | |
Net assets, end of period (000 omitted) | $ 5,029 | $ 5,788 | $ 6,464 | $ 5,575 | $ 4,918 |
Portfolio turnover rate E | 102% | 251% | 52% | 59% | 53% |
A Total returns would have been lower had certain expenses not been reduced during the periods shown.
B Total returns do not include the effect of the contingent deferred sales charge.
C Calculated based on average shares outstanding during the period.
D Fees and expenses of the underlying Fidelity Central Funds are not included in the Fund's expense ratio. The Fund indirectly bears its proportionate share of the expenses of any underlying Fidelity Central Funds.
E Amount does not include the portfolio activity of any underlying Fidelity Central Funds.
F Expense ratios reflect operating expenses of the class. Expenses before reductions do not reflect amounts reimbursed by the investment adviser or reductions from brokerage service arrangements or other expense offset arrangements and do not represent the amount paid by the class during periods when reimbursements or reductions occur. Expenses net of fee waivers reflect expenses after reimbursement by the investment adviser but prior to reductions from brokerage service arrangements or other expense offset arrangements. Expenses net of all reductions represent the net expenses paid by the class.
G Amount represents less than $.01 per share.
See accompanying notes which are an integral part of the financial statements.
Annual Report
Financial Highlights - Class C
Years ended October 31, | 2007 | 2006 | 2005 | 2004 | 2003 |
Selected Per-Share Data | | | | | |
Net asset value, beginning of period | $ 14.08 | $ 13.02 | $ 11.39 | $ 10.38 | $ 8.39 |
Income from Investment Operations | | | | | |
Net investment income (loss) C | (.09) | (.10) | (.05) | (.12) | (.09) |
Net realized and unrealized gain (loss) | 2.52 | 1.16 | 1.68 | 1.13 | 2.08 |
Total from investment operations | 2.43 | 1.06 | 1.63 | 1.01 | 1.99 |
Distributions from net realized gain | (2.15) | - | - | - | - |
Total distributions | (2.15) | - | - | - | - |
Redemption fees added to paid in capital C | - G | - G | - G | -G | - |
Net asset value, end of period | $ 14.36 | $ 14.08 | $ 13.02 | $ 11.39 | $ 10.38 |
Total Return A, B | 19.62% | 8.14% | 14.31% | 9.73% | 23.72% |
Ratios to Average Net Assets D, F | | | | | |
Expenses before reductions | 2.57% | 2.50% | 2.59% | 2.87% | 3.10% |
Expenses net of fee waivers, if any | 2.25% | 2.25% | 2.31% | 2.50% | 2.50% |
Expenses net of all reductions | 2.20% | 2.21% | 2.29% | 2.47% | 2.47% |
Net investment income (loss) | (.69)% | (.69)% | (.36)% | (1.08)% | (1.01)% |
Supplemental Data | | | | | |
Net assets, end of period (000 omitted) | $ 5,352 | $ 5,348 | $ 5,396 | $ 3,959 | $ 3,190 |
Portfolio turnover rate E | 102% | 251% | 52% | 59% | 53% |
A Total returns would have been lower had certain expenses not been reduced during the periods shown.
B Total returns do not include the effect of the contingent deferred sales charge.
C Calculated based on average shares outstanding during the period.
D Fees and expenses of the underlying Fidelity Central Funds are not included in the Fund's expense ratio. The Fund indirectly bears its proportionate share of the expenses of any underlying Fidelity Central Funds.
E Amount does not include the portfolio activity of any underlying Fidelity Central Funds.
F Expense ratios reflect operating expenses of the class. Expenses before reductions do not reflect amounts reimbursed by the investment adviser or reductions from brokerage service arrangements or other expense offset arrangements and do not represent the amount paid by the class during periods when reimbursements or reductions occur. Expenses net of fee waivers reflect expenses after reimbursement by the investment adviser but prior to reductions from brokerage service arrangements or other expense offset arrangements. Expenses net of all reductions represent the net expenses paid by the class.
G Amount represents less than $.01 per share.
See accompanying notes which are an integral part of the financial statements.
Annual Report
Financial Highlights - Institutional Class
Years ended October 31, | 2007 | 2006 | 2005 | 2004 | 2003 |
Selected Per-Share Data | | | | | |
Net asset value, beginning of period | $ 15.11 | $ 13.93 | $ 12.06 | $ 10.88 | $ 8.68 |
Income from Investment Operations | | | | | |
Net investment income (loss) B | .05 | .05 | .09 | (.01) | - |
Net realized and unrealized gain (loss) | 2.75 | 1.22 | 1.78 | 1.19 | 2.20 |
Total from investment operations | 2.80 | 1.27 | 1.87 | 1.18 | 2.20 |
Distributions from net investment income | - | (.07) | - | - | - |
Distributions from net realized gain | (2.15) | (.02) | - | - | - |
Total distributions | (2.15) | (.09) | - | - | - |
Redemption fees added to paid in capital B | - F | - F | - F | - F | - |
Net asset value, end of period | $ 15.76 | $ 15.11 | $ 13.93 | $ 12.06 | $ 10.88 |
Total Return A | 20.88% | 9.15% | 15.51% | 10.85% | 25.35% |
Ratios to Average Net Assets C, E | | | | | |
Expenses before reductions | 1.43% | 1.29% | 1.42% | 1.55% | 1.87% |
Expenses net of fee waivers, if any | 1.25% | 1.25% | 1.31% | 1.50% | 1.50% |
Expenses net of all reductions | 1.20% | 1.21% | 1.29% | 1.47% | 1.48% |
Net investment income (loss) | .31% | .31% | .64% | (.08)% | (.01)% |
Supplemental Data | | | | | |
Net assets, end of period (000 omitted) | $ 2,476 | $ 2,464 | $ 1,800 | $ 1,187 | $ 175 |
Portfolio turnover rate D | 102% | 251% | 52% | 59% | 53% |
A Total returns would have been lower had certain expenses not been reduced during the periods shown.
B Calculated based on average shares outstanding during the period.
C Fees and expenses of the underlying Fidelity Central Funds are not included in the Fund's expense ratio. The Fund indirectly bears its proportionate share of the expenses of any underlying Fidelity Central Funds.
D Amount does not include the portfolio activity of any underlying Fidelity Central Funds.
E Expense ratios reflect operating expenses of the class. Expenses before reductions do not reflect amounts reimbursed by the investment adviser or reductions from brokerage service arrangements or other expense offset arrangements and do not represent the amount paid by the class during periods when reimbursements or reductions occur. Expenses net of fee waivers reflect expenses after reimbursement by the investment adviser but prior to reductions from brokerage service arrangements or other expense offset arrangements. Expenses net of all reductions represent the net expenses paid by the class.
F Amount represents less than $.01 per share.
See accompanying notes which are an integral part of the financial statements.
Annual Report
Notes to Financial Statements
For the period ended October 31, 2007
1. Organization.
Fidelity Advisor Global Capital Appreciation Fund (the Fund) is a fund of Fidelity Advisor Series VIII (the trust) and is authorized to issue an unlimited number of shares. The trust is registered under the Investment Company Act of 1940, as amended (the 1940 Act), as an open-end management investment company organized as a Massachusetts business trust. The Fund offers Class A, Class T, Class B, Class C, and Institutional Class shares, each of which has equal rights as to assets and voting privileges. Each class has exclusive voting rights with respect to matters that affect that class. Class B shares will automatically convert to Class A shares after a holding period of seven years from the initial date of purchase. Investment income, realized and unrealized capital gains and losses, the common expenses of the Fund, and certain fund-level expense reductions, if any, are allocated on a pro rata basis to each class based on the relative net assets of each class to the total net assets of the Fund. Each class differs with respect to transfer agent and distribution and service plan fees incurred. Certain expense reductions also differ by class.
2. Investments in Fidelity Central Funds.
The Fund may invest in Fidelity Central Funds, which are open-end investment companies available only to other investment companies and accounts managed by Fidelity Management & Research Company (FMR) and its affiliates. The Fund's Schedule of Investments lists each of the Fidelity Central Funds as an investment of the Fund, but does not include the underlying holdings of each Fidelity Central Fund. As an Investing Fund, the Fund indirectly bears its proportionate share of the expenses of the underlying Fidelity Central Funds.
The Money Market Central Funds seek preservation of capital and current income and are managed by Fidelity Investments Money Management, Inc. (FIMM), an affiliate of FMR.
A complete list of holdings for each Fidelity Central Fund is available upon request or at the SEC's web site at www.sec.gov. In addition, the financial statements of the Fidelity Central Funds are available on the SEC's web site or upon request.
3. Significant Accounting Policies.
The financial statements have been prepared in conformity with accounting principles generally accepted in the United States of America, which require management to make certain estimates and assumptions at the date of the financial statements. The following summarizes the significant accounting policies of the Fund:
Security Valuation. Investments are valued and net asset value (NAV) per share is calculated (NAV calculation) as of the close of business of the New York Stock Exchange
Annual Report
Notes to Financial Statements - continued
3. Significant Accounting Policies - continued
Security Valuation - continued
(NYSE), normally 4:00 p.m. Eastern time. Wherever possible, the Fund uses independent pricing services approved by the Board of Trustees to value its investments.
Equity securities, including restricted securities, for which market quotations are readily available, are valued at the last reported sale price or official closing price as reported by an independent pricing service on the primary market or exchange on which they are traded. In the event there were no sales during the day or closing prices are not available, securities are valued at the last quoted bid price. Debt securities, including restricted securities, for which quotations are readily available, are valued by independent pricing services or by dealers who make markets in such securities. Pricing services consider yield or price of bonds of comparable quality, coupon, maturity and type as well as dealer supplied prices. Investments in open-end mutual funds, including the Fidelity Central Funds, are valued at their closing net asset value each business day. Short-term securities with remaining maturities of sixty days or less for which quotations are not readily available are valued at amortized cost, which approximates value.
When current market prices or quotations are not readily available or do not accurately reflect fair value, valuations may be determined in accordance with procedures adopted by the Board of Trustees. For example, when developments occur between the close of a market and the close of the NYSE that may materially affect the value of some or all of the securities, or when trading in a security is halted, those securities may be fair valued. Factors used in the determination of fair value may include monitoring news to identify significant market or security specific events such as changes in the value of U.S. securities markets, reviewing developments in foreign markets and evaluating the performance of ADRs, futures contracts and exchange-traded funds. Because the Fund's utilization of fair value pricing depends on market activity, the frequency with which fair value pricing is used cannot be predicted and may be utilized to a significant extent. The value of securities used for NAV calculation under fair value pricing may differ from published prices for the same securities.
Foreign Currency. The Fund uses foreign currency contracts to facilitate transactions in foreign-denominated securities. Losses from these transactions may arise from changes in the value of the foreign currency or if the counterparties do not perform under the contracts' terms.
Foreign-denominated assets, including investment securities, and liabilities are translated into U.S. dollars at the exchange rate at period end. Purchases and sales of investment securities, income and dividends received and expenses denominated in foreign currencies are translated into U.S. dollars at the exchange rate in effect on the transaction date.
Annual Report
3. Significant Accounting Policies - continued
Foreign Currency - continued
The effects of exchange rate fluctuations on investments are included with the net realized and unrealized gain (loss) on investment securities. Other foreign currency transactions resulting in realized and unrealized gain (loss) are disclosed separately.
Investment Transactions and Income. For financial reporting purposes, the Fund's investment holdings and NAV include trades executed through the end of the last business day of the period. The NAV for processing shareholder transactions includes trades executed through the end of the prior business day. Gains and losses on securities sold are determined on the basis of identified cost and may include proceeds received from litigation. Dividend income is recorded on the ex-dividend date, except for certain dividends from foreign securities where the ex-dividend date may have passed, which are recorded as soon as the Fund is informed of the ex-dividend date. Non-cash dividends included in dividend income, if any, are recorded at the fair market value of the securities received. Distributions received on securities that represent a return of capital or capital gain are recorded as a reduction of cost of investments and/or as a realized gain. The Fund estimates the components of distributions received that may be considered return of capital distributions or capital gain distributions. Interest income and income distributions from the Fidelity Central Funds are accrued as earned. Interest income includes coupon interest and amortization of premium and accretion of discount on debt securities. Investment income is recorded net of foreign taxes withheld where recovery of such taxes is uncertain.
Expenses. Most expenses of the trust can be directly attributed to a fund. Expenses which cannot be directly attributed are apportioned among each Fund in the trust. Expense estimates are accrued in the period to which they relate and adjustments are made when actual amounts are known.
Income Tax Information and Distributions to Shareholders. Each year, the Fund intends to qualify as a regulated investment company by distributing all of its taxable income and realized gains under Subchapter M of the Internal Revenue Code. As a result, no provision for income taxes is required in the accompanying financial statements. Foreign taxes are provided for based on the Fund's understanding of the tax rules and rates that exist in the foreign markets in which it invests.
Distributions are recorded on the ex-dividend date. Income dividends and capital gain distributions are declared separately for each class. Income and capital gain distributions are determined in accordance with income tax regulations, which may differ from generally accepted accounting principles. In addition, the Fund will claim a portion of the payment made to redeeming shareholders as a distribution for income tax purposes.
Annual Report
Notes to Financial Statements - continued
3. Significant Accounting Policies - continued
Income Tax Information and Distributions to Shareholders - continued
Capital accounts within the financial statements are adjusted for permanent book-tax differences. Certain adjustments have been made to the accounts of prior periods. Collectively, these adjustments have no impact on net assets or the results of operations. Temporary book-tax differences will reverse in a subsequent period.
Book-tax differences are primarily due to foreign currency transactions, passive foreign investment companies (PFIC), market discount, partnerships, certain foreign taxes and losses deferred due to wash sales.
The tax-basis components of distributable earnings and the federal tax cost as of period end were as follows:
Unrealized appreciation | $ 7,175,946 |
Unrealized depreciation | (2,336,575) |
Net unrealized appreciation (depreciation) | 4,839,371 |
Undistributed ordinary income | 4,438,957 |
Undistributed long-term capital gain | 1,180,989 |
| |
| |
Cost for federal income tax purposes | $ 44,626,543 |
The tax character of distributions paid was as follows:
| October 31, 2007 | October 31, 2006 |
Ordinary Income | $ - | $ 117,170 |
Long-term Capital Gains | 7,528,976 | - |
Total | $ 7,528,976 | $ 117,170 |
Short-Term Trading (Redemption) Fees. Shares held in the Fund less than 30 days are subject to a redemption fee equal to 1.00% of the proceeds of the redeemed shares. All redemption fees, including any estimated redemption fees paid by FMR, are retained by the Fund and accounted for as an addition to paid in capital.
New Accounting Pronouncements. In July 2006, Financial Accounting Standards Board Interpretation No. 48, Accounting for Uncertainty in Income Taxes - an interpretation of FASB Statement 109 (FIN 48), was issued and is effective on the last business day of the semiannual reporting period for fiscal years beginning after December 15, 2006. FIN 48 sets forth a threshold for financial statement recognition, measurement and disclosure of a tax position taken or expected to be taken on a tax return. Management has concluded that the adoption of FIN 48 will not result in a material impact on the Fund's net assets, results of operations and financial statement disclosures.
Annual Report
3. Significant Accounting Policies - continued
New Accounting Pronouncements - continued
In addition, in September 2006, Statement of Financial Accounting Standards No. 157, Fair Value Measurements (SFAS 157), was issued and is effective for fiscal years beginning after November 15, 2007. SFAS 157 defines fair value, establishes a framework for measuring fair value and expands disclosures about fair value measurements. Management is currently evaluating the impact the adoption of SFAS 157 will have on the Fund's financial statement disclosures.
4. Operating Policies.
Forward Foreign Currency Contracts. The Fund generally uses foreign currency contracts to facilitate transactions in foreign-denominated securities and to manage the Fund's currency exposure. Contracts to sell generally are used to hedge the Fund's investments against currency fluctuations, while contracts to buy generally are used to offset a previous contract to sell. Also, a contract to buy can be used to acquire exposure to foreign currencies and a contract to sell can be used to offset a previous contract to buy. These contracts involve market risk in excess of the unrealized gain or loss reflected in the Fund's Statement of Assets and Liabilities. The U.S. dollar value of the currencies the Fund has committed to buy or sell is shown in the Schedule of Investments under the caption "Forward Foreign Currency Contracts." This amount represents the aggregate exposure to each currency the Fund has acquired or hedged through currency contracts at period end. Losses may arise from changes in the value of foreign currency or if the counterparties do not perform under the contracts' terms.
The U.S. dollar value of forward foreign currency contracts is determined using forward currency exchange rates supplied by a quotation service. Purchases and sales of forward foreign currency contracts having the same settlement date and broker are offset and any realized gain (loss) recognized on the date of offset: otherwise, gain (loss) is recognized on settlement date. Contracts that have been offset with different counterparties are reflected as both a contract to buy and a contract to sell in the Schedule of Investments under the caption "Forward Foreign Currency Contracts."
Repurchase Agreements. FMR has received an Exemptive Order from the Securities and Exchange Commission (the SEC) which permits the Fund and other affiliated entities of FMR to transfer uninvested cash balances into joint trading accounts which are then invested in repurchase agreements. The Fund may also invest directly with institutions in repurchase agreements. Repurchase agreements are collateralized by government or non-government securities. Upon settlement date, collateral is held in segregated accounts with custodian banks and may be obtained in the event of a default of the counterparty. The Fund monitors, on a daily basis, the value of the collateral to ensure it is at least equal to the principal amount of the repurchase agreement
Annual Report
Notes to Financial Statements - continued
4. Operating Policies - continued
Repurchase Agreements - continued
(including accrued interest). In the event of a default by the counterparty, realization of the collateral proceeds could be delayed, during which time the value of the collateral may decline.
Restricted Securities. The Fund may invest in securities that are subject to legal or contractual restrictions on resale. These securities generally may be resold in transactions exempt from registration or to the public if the securities are registered. Disposal of these securities may involve time-consuming negotiations and expense, and prompt sale at an acceptable price may be difficult. Information regarding restricted securities is included at the end of the Fund's Schedule of Investments.
5. Purchases and Sales of Investments.
Purchases and sales of securities, other than short-term securities, aggregated $47,258,803 and $60,696,048, respectively.
6. Fees and Other Transactions with Affiliates.
Management Fee. FMR and its affiliates provide the Fund with investment management related services for which the Fund pays a monthly management fee. The management fee is the sum of an individual fund fee rate that is based on an annual rate of .45% of the Fund's average net assets and a group fee rate that averaged ..26% during the period. The group fee rate is based upon the average net assets of all the mutual funds advised by FMR. The group fee rate decreases as assets under management increase and increases as assets under management decrease.
In addition, on June 20, 2007, shareholders approved a new management contract which adds a performance adjustment to the management fee (up to a maximum of ..20% of the Fund's average net assets over a 36 month performance period). The upward or downward adjustment to the management fee is based on the relative investment performance of the Fund's Institutional Class as compared to an appropriate benchmark index. The Fund's performance period began on July 1, 2007. The performance adjustment will take effect starting with the twelfth month of the performance period (June, 2008). Subsequent months will be added until the performance period includes 36 months.
For the period, the total annual management fee rate was .71% of the Fund's average net assets.
Annual Report
6. Fees and Other Transactions with Affiliates - continued
Distribution and Service Plan. In accordance with Rule 12b-1 of the 1940 Act, the Fund has adopted separate Distribution and Service Plans for each class of shares. Certain classes pay Fidelity Distributors Corporation (FDC), an affiliate of FMR, separate Distribution and Service Fees, each of which is based on an annual percentage ofeach class' average net assets. In addition, FDC may pay financial intermediaries for selling shares of the Fund and providing shareholder support services. For the period, the Distribution and Service Fee rates and the total amounts paid to and retained by FDC were as follows:
| Distribution
Fee | Service
Fee | Paid to
FDC | Retained
by FDC |
Class A | 0% | .25% | $ 30,470 | $ 2,536 |
Class T | .25% | .25% | 120,948 | 122 |
Class B | .75% | .25% | 53,122 | 39,851 |
Class C | .75% | .25% | 53,089 | 6,517 |
| | | $ 257,629 | $ 49,026 |
Sales Load. FDC receives a front-end sales charge of up to 5.75% for selling Class A shares, and 3.50% for selling Class T shares, some of which is paid to financial intermediaries for selling shares of the Fund. FDC receives the proceeds of contingent deferred sales charges levied on Class A, Class T, Class B, and Class C redemptions. These charges depend on the holding period. The deferred sales charges range from 5% to 1% for Class B, 1% for Class C, 1.00% to .50% for certain purchases of Class A shares and .25% for certain purchases of Class T shares.
For the period, sales charge amounts retained by FDC were as follows:
| Retained
by FDC |
Class A | $ 6,500 |
Class T | 4,305 |
Class B* | 9,526 |
Class C* | 3,506 |
| $ 23,837 |
* When Class B and Class C shares are initially sold, FDC pays commissions from its own resources to financial intermediaries through which the sales are made.
Transfer Agent Fees. Fidelity Investments Institutional Operations Company, Inc. (FIIOC), an affiliate of FMR, is the transfer, dividend disbursing and shareholder servicing agent for each class of the Fund. FIIOC receives account fees and asset-based fees that vary according to the account size and type of account of the shareholders of the respective classes of the Fund. FIIOC pays for typesetting, printing and mailing of shareholder reports, except proxy statements.
Annual Report
Notes to Financial Statements - continued
6. Fees and Other Transactions with Affiliates - continued
Transfer Agent Fees - continued
For the period, the total transfer agent fees paid by each class to FIIOC, were as follows:
| Amount | % of
Average
Net Assets |
Class A | $ 38,118 | .31 |
Class T | 80,250 | .33 |
Class B | 17,008 | .32 |
Class C | 17,047 | .32 |
Institutional Class | 4,301 | .18 |
| $ 156,724 | |
Accounting and Security Lending Fees. Fidelity Service Company, Inc. (FSC), an affiliate of FMR, maintains the Fund's accounting records. The accounting fee is based on the level of average net assets for the month. Under a separate contract, FSC administers the security lending program. The security lending fee is based on the number and duration of lending transactions.
Brokerage Commissions. The Fund placed a portion of its portfolio transactions with brokerage firms which are affiliates of the investment adviser. The commissions paid to these affiliated firms were $261 for the period.
7. Committed Line of Credit.
The Fund participates with other funds managed by FMR in a $4.2 billion credit facility (the "line of credit") to be utilized for temporary or emergency purposes to fund shareholder redemptions or for other short-term liquidity purposes. The Fund has agreed to pay commitment fees on its pro rata portion of the line of credit, which amounted to $105 and is reflected in Miscellaneous Expense on the Statement of Operations. During the period, there were no borrowings on this line of credit.
8. Security Lending.
The Fund lends portfolio securities from time to time in order to earn additional income. On the settlement date of the loan, the Fund receives collateral (in the form of U.S. Treasury obligations, letters of credit and/or cash) against the loaned securities and maintains collateral in an amount not less than 100% of the market value of the loaned securities during the period of the loan. The market value of the loaned securities is determined at the close of business of the Fund and any additional required collateral is delivered to the Fund on the next business day. If the borrower defaults on its obligation to return the securities loaned because of insolvency or other reasons, a fund could experience delays and costs in recovering the securities loaned or in gaining access to
Annual Report
8. Security Lending - continued
the collateral. Any cash collateral received is invested in the Fidelity Securities Lending Cash Central Fund. Security lending income represents the income earned on investing cash collateral, less fees and expenses associated with the loan, plus any premium payments that may be received on the loan of certain types of securities. Security lending income is presented in the Statement of Operations as a component of income from Fidelity Central Funds. Net income from lending portfolio securities during the period amounted to $14,515.
9. Expense Reductions.
FMR voluntarily agreed to reimburse each class to the extent annual operating expenses exceeded certain levels of average net assets as noted in the table below. Some expenses, for example interest expense, including commitment fees, are excluded from this reimbursement.
The following classes were in reimbursement during the period:
| Expense
Limitations | Reimbursement
from adviser |
| | |
Class A | 1.50% | $ 38,226 |
Class T | 1.75% | 79,562 |
Class B | 2.25% | 17,172 |
Class C | 2.25% | 17,017 |
Institutional Class | 1.25% | 4,317 |
| | $ 156,294 |
Many of the brokers with whom FMR places trades on behalf of the Fund provided services to the Fund in addition to trade execution. These services included payments of certain expenses on behalf of the Fund totaling $22,043 for the period.
10. Other.
The Fund's organizational documents provide former and current trustees and officers with a limited indemnification against liabilities arising in connection with the performance of their duties to the Fund. In the normal course of business, the Fund may also enter into contracts that provide general indemnifications. The Fund's maximum exposure under these arrangements is unknown as this would be dependent on future claims that may be made against the Fund. The risk of material loss from such claims is considered remote.
In September 2006, FIIOC, the Fund's transfer agent, notified the Fund that the Fund's books and records did not reflect a conversion of certain Class B to Class A shares upon
Annual Report
Notes to Financial Statements - continued
10. Other - continued
their conversion date. In March 2007, FIIOC converted the relevant Class B shares to Class A shares and recorded the conversion in the books and records of the Fund which did not result in a material impact to the Fund's reported net assets or results of operations in the accompanying financial statements. FIIOC has remediated affected shareholders and reimbursed the Fund for all related audit and legal expenses.
The United States Securities and Exchange Commission ("SEC") is conducting an investigation of FMR (covering the years 2002 to 2004) arising from gifts, gratuities and business entertainment provided by certain brokers to certain individuals who were employed on FMR's domestic equity trading desk during that period. FMR is in discussions with the SEC staff regarding the possible resolution of the matter, but as of period-end no final resolution has been reached.
In December 2006, the Independent Trustees completed their own investigation of the matter with the assistance of independent counsel. The Independent Trustees and FMR agree that, despite the absence of proof that the Fidelity mutual funds experienced diminished execution quality as a result of the improper receipt of gifts and business entertainment, the conduct at issue was serious and is worthy of redress. Accordingly, the Independent Trustees have requested and FMR has agreed to pay $42 million to Fidelity mutual funds, plus interest to be determined at the time that payment is made. A method of allocating this payment among the funds has not yet been determined. The total payment to the Fund is not anticipated to have a material impact on the Fund's net assets. In addition, FMR reimbursed related legal expenses which are recorded in the accompanying Statement of Operations as an expense reduction.
11. Distributions to Shareholders.
Distributions to shareholders of each class were as follows:
| Years ended October 31, |
| 2007 | 2006 |
From net investment income | | |
Class A | $ - | $ 27,948 |
Class T | - | 12,729 |
Institutional Class | - | 7,749 |
Total | $ - | $ 48,426 |
From net realized gain | | |
Class A | $ 1,605,953 | $ 17,372 |
Class T | 3,892,392 | 48,789 |
Class B | 859,727 | - |
Class C | 818,416 | - |
Institutional Class | 352,488 | 2,583 |
Total | $ 7,528,976 | $ 68,744 |
Annual Report
12. Share Transactions.
Transactions for each class of shares were as follows:
| Shares | Dollars |
| Years ended October 31, | Years ended October 31, |
| 2007 | 2006 | 2007 | 2006 |
Class A | | | | |
Shares sold | 317,426 | 338,926 | $ 4,551,831 | $ 4,991,381 |
Reinvestment of distributions | 117,030 | 3,052 | 1,549,483 | 44,044 |
Shares redeemed | (262,944) | (342,002) | (3,684,586) | (4,955,841) |
Net increase (decrease) | 171,512 | (24) | $ 2,416,728 | $ 79,584 |
Class T | | | | |
Shares sold | 275,123 | 466,972 | $ 3,836,949 | $ 6,780,148 |
Reinvestment of distributions | 296,053 | 4,267 | 3,842,771 | 60,712 |
Shares redeemed | (942,615) | (775,038) | (13,037,243) | (11,207,562) |
Net increase (decrease) | (371,439) | (303,799) | $ (5,357,523) | $ (4,366,702) |
Class B | | | | |
Shares sold | 54,071 | 98,474 | $ 718,841 | $ 1,390,516 |
Reinvestment of distributions | 62,934 | - | 781,643 | - |
Shares redeemed | (178,017) | (183,857) | (2,365,148) | (2,543,722) |
Net increase (decrease) | (61,012) | (85,383) | $ (864,664) | $ (1,153,206) |
Class C | | | | |
Shares sold | 79,702 | 101,868 | $ 1,057,436 | $ 1,419,609 |
Reinvestment of distributions | 60,320 | - | 750,384 | - |
Shares redeemed | (147,310) | (136,265) | (1,939,803) | (1,876,045) |
Net increase (decrease) | (7,288) | (34,397) | $ (131,983) | $ (456,436) |
Institutional Class | | | | |
Shares sold | 10,485 | 74,429 | $ 151,256 | $ 1,122,565 |
Reinvestment of distributions | 13,152 | 587 | 177,952 | 8,618 |
Shares redeemed | (29,545) | (41,218) | (414,151) | (608,426) |
Net increase (decrease) | (5,908) | 33,798 | $ (84,943) | $ 522,757 |
Annual Report
Report of Independent Registered Public Accounting Firm
To the Trustees of Fidelity Advisor Series VIII and the Shareholders of Fidelity Advisor Global Capital Appreciation Fund:
In our opinion, the accompanying statement of assets and liabilities, including the schedule of investments, and the related statements of operations and of changes in net assets and the financial highlights present fairly, in all material respects, the financial position of Fidelity Advisor Global Capital Appreciation Fund (a fund of Fidelity Advisor Series VIII) at October 31, 2007, the results of its operations for the year then ended, the changes in its net assets for each of the two years in the period then ended and the financial highlights for each of the five years in the period then ended, in conformity with accounting principles generally accepted in the United States of America. These financial statements and financial highlights (hereafter referred to as "financial statements") are the responsibility of the Fidelity Advisor Global Capital Appreciation Fund's management. Our responsibility is to express an opinion on these financial statements based on our audits. We conducted our audits of these financial statements in accordance with the standards of the Public Company Accounting Oversight Board (United States). Those standards require that we plan and perform the audit to obtain reasonable assurance about whether the financial statements are free of material misstatement. An audit includes examining, on a test basis, evidence supporting the amounts and disclosures in the financial statements, assessing the accounting principles used and significant estimates made by management, and evaluating the overall financial statement presentation. We believe that our audits, which included confirmation of securities at October 31, 2007 by correspondence with the custodian and brokers, provide a reasonable basis for our opinion.
/s/ PricewaterhouseCoopers LLP
PricewaterhouseCoopers LLP
Boston, Massachusetts
December 20, 2007
Annual Report
Trustees and Officers
The Trustees, Members of the Advisory Board, and executive officers of the trust and fund, as applicable, are listed below. The Board of Trustees governs the fund and is responsible for protecting the interests of shareholders. The Trustees are experienced executives who meet periodically throughout the year to oversee the fund's activities, review contractual arrangements with companies that provide services to the fund, and review the fund's performance. Except for James C. Curvey, each of the Trustees oversees 370 funds advised by FMR or an affiliate. Mr. Curvey oversees 340 funds advised by FMR or an affiliate.
The Trustees hold office without limit in time except that (a) any Trustee may resign; (b) any Trustee may be removed by written instrument, signed by at least two-thirds of the number of Trustees prior to such removal; (c) any Trustee who requests to be retired or who has become incapacitated by illness or injury may be retired by written instrument signed by a majority of the other Trustees; and (d) any Trustee may be removed at any special meeting of shareholders by a two-thirds vote of the outstanding voting securities of the trust. Each Trustee who is not an interested person (as defined in the 1940 Act) (Independent Trustee), shall retire not later than the last day of the calendar year in which his or her 72nd birthday occurs. The Independent Trustees may waive this mandatory retirement age policy with respect to individual Trustees. The executive officers and Advisory Board Members hold office without limit in time, except that any officer and Advisory Board Member may resign or may be removed by a vote of a majority of the Trustees at any regular meeting or any special meeting of the Trustees. Except as indicated, each individual has held the office shown or other offices in the same company for the past five years.
The fund's Statement of Additional Information includes more information about the Trustees. To request a free copy, call Fidelity at 1-877-208-0098.
Interested Trustees*:
Correspondence intended for each Trustee who is an interested person may be sent to Fidelity Investments, 82 Devonshire Street, Boston, Massachusetts 02109.
Name, Age; Principal Occupation |
Edward C. Johnson 3d (77) |
| Year of Election or Appointment: 1983 Mr. Johnson is Chairman of the Board of Trustees. Mr. Johnson serves as President (2006-present), Chief Executive Officer, Chairman, and a Director of FMR LLC; Chairman and a Director of FMR; Chairman and a Director of Fidelity Research & Analysis Company (FRAC); Chairman and a Director of Fidelity Investments Money Management, Inc.; and Chairman (2001-present) and a Director of FMR Co., Inc. In addition, Mr. Johnson serves as Chairman and Director of Fidelity International Limited (FIL). |
James C. Curvey (72) |
| Year of Election or Appointment: 2007 Mr. Curvey also serves as Trustee (2007-present) or Member of the Advisory Board (2007-present) of other investment companies advised by FMR. Mr. Curvey is a Director of FMR and FMR Co., Inc. (2007- present). Mr. Curvey is also Vice Chairman (2006-present) and Director of FMR LLC. Mr. Curvey joined Fidelity in 1982 and served in numerous senior management positions, including President and Chief Operating Officer of FMR LLC (1997-2000) and President of Fidelity Strategic Investments (2000-2002). In addition, he serves as a member of the Board of Directors of Geerlings & Wade, Inc. (wine distribution). |
* Trustees have been determined to be "Interested Trustees" by virtue of, among other things, their affiliation with the trust or various entities under common control with FMR. FMR Corp. merged with FMR LLC on October 1, 2007. Any references to FMR LLC for prior periods are deemed to be references to the prior entity.
Independent Trustees:
Correspondence intended for each Independent Trustee (that is, the Trustees other than the Interested Trustees) may be sent to Fidelity Investments, P.O. Box 55235, Boston, Massachusetts 02205-5235.
Name, Age; Principal Occupation |
Dennis J. Dirks (59) |
| Year of Election or Appointment: 2005 Prior to his retirement in May 2003, Mr. Dirks was Chief Operating Officer and a member of the Board of The Depository Trust & Clearing Corporation (DTCC) (1999-2003). He also served as President, Chief Operating Officer, and Board member of The Depository Trust Company (DTC) (1999-2003) and President and Board member of the National Securities Clearing Corporation (NSCC) (1999-2003). In addition, Mr. Dirks served as Chief Executive Officer and Board member of the Government Securities Clearing Corporation (2001-2003) and Chief Executive Officer and Board member of the Mortgage-Backed Securities Clearing Corporation (2001-2003). Mr. Dirks also serves as a Trustee and a member of the Finance Committee of Manhattan College (2005-present) and a Trustee and a member of the Finance Committee of AHRC of Nassau County (2006-present). |
Albert R. Gamper, Jr. (65) |
| Year of Election or Appointment: 2006 Prior to his retirement in December 2004, Mr. Gamper served as Chairman of the Board of CIT Group Inc. (commercial finance). During his tenure with CIT Group Inc. Mr. Gamper served in numerous senior management positions, including Chairman (1987-1989; 1999-2001; 2002-2004), Chief Executive Officer (1987-2004), and President (1989-2002). He currently serves as a member of the Board of Directors of Public Service Enterprise Group (utilities, 2001-present), Chairman of the Board of Governors, Rutgers University (2004-present), and Chairman of the Board of Saint Barnabas Health Care System. |
George H. Heilmeier (71) |
| Year of Election or Appointment: 2004 Dr. Heilmeier is Chairman Emeritus of Telcordia Technologies (communication software and systems), where prior to his retirement, he served as company Chairman and Chief Executive Officer. He currently serves on the Boards of Directors of The Mitre Corporation (systems engineering and information technology support for the government), and HRL Laboratories (private research and development, 2004-present). He is Chairman of the General Motors Science & Technology Advisory Board and a Life Fellow of the Institute of Electrical and Electronics Engineers (IEEE). Dr. Heilmeier is a member of the Defense Science Board and the National Security Agency Advisory Board. He is also a member of the National Academy of Engineering, the American Academy of Arts and Sciences, and the Board of Overseers of the School of Engineering and Applied Science of the University of Pennsylvania. Previously, Dr. Heilmeier served as a Director of TRW Inc. (automotive, space, defense, and information technology, 1992-2002), Compaq (1994-2002), Automatic Data Processing, Inc. (ADP) (technology-based business outsourcing, 1995-2002), INET Technologies Inc. (telecommunications network surveillance, 2001-2004), and Teletech Holdings (customer management services). He is the recipient of the 2005 Kyoto Prize in Advanced Technology for his invention of the liquid crystal display, and a member of the Consumer Electronics Hall of Fame. |
James H. Keyes (67) |
| Year of Election or Appointment: 2007 Prior to his retirement in 2003, Mr. Keyes was Chairman, President, and Chief Executive Officer of Johnson Controls, Inc. (automotive supplier, 1993-2003). He currently serves as a member of the boards of LSI Logic Corporation (semiconductor technologies), Navistar International Corporation (manufacture and sale of trucks, buses, and diesel engines, 2002-present), and Pitney Bowes, Inc. (integrated mail, messaging, and document management solutions). |
Marie L. Knowles (61) |
| Year of Election or Appointment: 2001 Prior to Ms. Knowles' retirement in June 2000, she served as Executive Vice President and Chief Financial Officer of Atlantic Richfield Company (ARCO) (diversified energy, 1996-2000). From 1993 to 1996, she was a Senior Vice President of ARCO and President of ARCO Transportation Company. She served as a Director of ARCO from 1996 to 1998. She currently serves as a Director of Phelps Dodge Corporation (copper mining and manufacturing) and McKesson Corporation (healthcare service, 2002-present). Ms. Knowles is a Trustee of the Brookings Institution and the Catalina Island Conservancy and also serves as a member of the Advisory Board for the School of Engineering of the University of Southern California. |
Ned C. Lautenbach (63) |
| Year of Election or Appointment: 2000 Mr. Lautenbach is Chairman of the Independent Trustees (2006-present). Mr. Lautenbach has been a partner of Clayton, Dubilier & Rice, Inc. (private equity investment firm) since September 1998. Previously, Mr. Lautenbach was with the International Business Machines Corporation (IBM) from 1968 until his retirement in 1998. Mr. Lautenbach serves as a Director of Sony Corporation (2006-present) and Eaton Corporation (diversified industrial) as well as the Philharmonic Center for the Arts in Naples, Florida. He also is a member of the Board of Trustees of Fairfield University (2005-present), as well as a member of the Council on Foreign Relations. |
Cornelia M. Small (63) |
| Year of Election or Appointment: 2005 Ms. Small is a member (2000-present) and Chairperson (2002-present) of the Investment Committee, and a member (2002-present) of the Board of Trustees of Smith College. Previously, she served as Chief Investment Officer (1999-2000), Director of Global Equity Investments (1996-1999), and a member of the Board of Directors of Scudder, Stevens & Clark (1990-1997) and Scudder Kemper Investments (1997-1999). In addition, Ms. Small served as Co-Chair (2000-2003) of the Annual Fund for the Fletcher School of Law and Diplomacy. |
William S. Stavropoulos (68) |
| Year of Election or Appointment: 2001 Mr. Stavropoulos is Chairman Emeritus of the Board of Directors of The Dow Chemical Company. Since joining The Dow Chemical Company in 1967, Mr. Stavropoulos served in numerous senior management positions, including President (1993-2000; 2002-2003), CEO (1995-2000; 2002-2004), and Chairman of the Executive Committee (2000-2004). Currently, he is a Director of NCR Corporation (data warehousing and technology solutions), Chemical Financial Corporation, Maersk Inc. (industrial conglomerate, 2002-present), Tyco International, Inc. (multinational manufacturing and services, 2007-present), and a member of the Advisory Board for Metalmark Capital (private equity investment firm, 2005-present). He is a special advisor to Clayton, Dubilier & Rice, Inc., a private equity investment firm. He also serves as a member of the Board of Trustees of the American Enterprise Institute for Public Policy Research. In addition, Mr. Stavropoulos is a member of The Business Council, J.P. Morgan International Council and the University of Notre Dame Advisory Council for the College of Science. |
Kenneth L. Wolfe (68) |
| Year of Election or Appointment: 2005 Prior to his retirement in 2001, Mr. Wolfe was Chairman and Chief Executive Officer of Hershey Foods Corporation (1993-2001). He currently serves as a member of the boards of Adelphia Communications Corporation (2003-present), Bausch & Lomb, Inc., and Revlon Inc. (2004-present). |
Advisory Board Members and Executive Officers**:
Correspondence intended for Mr. Mauriello, Mr. Thomas, and Mr. Wiley may be sent to Fidelity Investments, P.O. Box 55235, Boston, Massachusetts 02205-5235. Correspondence intended for each executive officer and Mr. Lynch may be sent to Fidelity Investments, 82 Devonshire Street, Boston, Massachusetts 02109.
Name, Age; Principal Occupation |
Peter S. Lynch (63) |
| Year of Election or Appointment: 2003 Member of the Advisory Board of Fidelity Advisor Series VIII. Mr. Lynch is Vice Chairman and a Director of FMR, and Vice Chairman (2001-present) and a Director of FMR Co., Inc. Previously, Mr. Lynch served as a Trustee of the Fidelity funds (1990-2003). In addition, he serves as a Trustee of Boston College and as the Chairman of the Inner-City Scholarship Fund. |
Joseph Mauriello (63) |
| Year of Election or Appointment: 2007 Member of the Advisory Board of Fidelity Advisor Series VIII. Prior to his retirement in January 2006, Mr. Mauriello served in numerous senior management positions including Deputy Chairman and Chief Operating Officer (2004-2005), and Vice Chairman of Financial Services (2002-2004) of KPMG LLP US (professional services firm, 1965-2005). Mr. Mauriello currently serves as a member of the Board of Directors of XL Capital Ltd., (global insurance and re-insurance company, 2006-present) and of Arcadia Resources Inc., (health care services and products, 2007-present). He also served as a Director of the Hamilton Funds of the Bank of New York (2006-2007). |
David M. Thomas (58) |
| Year of Election or Appointment: 2007 Member of the Advisory Board of Fidelity Investment Trust. Previously, Mr. Thomas served as Executive Chairman (2005-2006) and Chairman and Chief Executive Officer (2000-2005) of IMS Health, Inc. (pharmaceutical and healthcare information solutions). In addition, Mr. Thomas serves as a member of the Board of Directors of Fortune Brands, Inc. (consumer products holding company), and Interpublic Group of Companies, Inc. (marketing communication, 2004-present). |
Michael E. Wiley (57) |
| Year of Election or Appointment: 2007 Member of the Advisory Board of Fidelity Advisor Series VIII. Mr. Wiley also serves as Sr. Energy Advisor of Katzenbach Partners, LLC (consulting firm, 2006-present) and a member of the Board of Trustees of the University of Tulsa (2000-2006; 2007-present). He serves as a Director of Tesoro Corporation (independent oil refiner and marketer, 2005- present), and a Director of Bill Barrett Corporation (exploration and production company, 2005-present). In addition, he also serves as a Director of Post Oak Bank (privately-held bank, 2004-present), and an Advisory Director of Riverstone Holdings (private investment firm). Previously, Mr. Wiley served as Chairman, President, and CEO of Baker Hughes, Inc. (oilfield services company, 2000-2004), and as Director of Spinnaker Exploration Company (exploration and production company, 2001-2005). |
Kimberley H. Monasterio (43) |
| Year of Election or Appointment: 2007 President and Treasurer of Advisor Global Capital Appreciation. Ms. Monasterio also serves as President and Treasurer of other Fidelity funds (2007-present) and is an employee of FMR (2004-present). Previously, Ms. Monasterio served as Deputy Treasurer of the Fidelity funds (2004-2006). Before joining Fidelity Investments, Ms. Monasterio served as Treasurer (2000-2004) and Chief Financial Officer (2002-2004) of the Franklin Templeton Funds and Senior Vice President of Franklin Templeton Services, LLC (2000-2004). |
Walter C. Donovan (45) |
| Year of Election or Appointment: 2007 Vice President of Advisor Global Capital Appreciation. Mr. Donovan also serves as Vice President of Fidelity's Equity Funds (2007-present). Mr. Donovan also serves as Executive Vice President of FMR (2005-present) and FMR Co., Inc. (2005-present). Previously, Mr. Donovan served as Vice President of Fidelity's High Income Funds (2005-2007), Fixed-Income Funds (2005-2006), certain Asset Allocation Funds (2005-2006), certain Balanced Funds (2005-2006), and as Vice President and Director of Fidelity's International Equity Trading group (1998-2005). |
Eric M. Wetlaufer (45) |
| Year of Election or Appointment: 2006 Vice President of Advisor Global Capital Appreciation. Mr. Wetlaufer also serves as Vice President of certain International Equity Funds (2006-present). Mr. Wetlaufer is Senior Vice President of FMR (2006-present) and FMR Co., Inc. (2006-present), and President and Director of Fidelity Management & Research (U.K.) Inc. (2006-present) and Fidelity Research & Analysis Company (2006-present). Before joining Fidelity Investments in 2005, Mr. Wetlaufer was a partner in Oxhead Capital Management (2004-2005). Previously, Mr. Wetlaufer served as a Chief Investment Officer of Putnam Investments (1997-2003). |
Eric D. Roiter (58) |
| Year of Election or Appointment: 1998 Secretary of Advisor Global Capital Appreciation. He also serves as Secretary of other Fidelity funds; Vice President, General Counsel, and Secretary of FMR Co., Inc. (2001-present) and FMR; Assistant Secretary of Fidelity Management & Research (U.K.) Inc. (2001-present), Fidelity Research & Analysis Company (2001-present), and Fidelity Investments Money Management, Inc. (2001-present). Mr. Roiter is an Adjunct Member, Faculty of Law, at Boston College Law School (2003-present). Previously, Mr. Roiter served as Vice President and Secretary of Fidelity Distributors Corporation (FDC) (1998-2005). |
Scott C. Goebel (39) |
| Year of Election or Appointment: 2007 Assistant Secretary of Advisor Global Capital Appreciation. Mr. Goebel also serves as Assistant Secretary of other Fidelity funds (2007-present), and is an employee of FMR. |
R. Stephen Ganis (41) |
| Year of Election or Appointment: 2006 Anti-Money Laundering (AML) officer of Advisor Global Capital Appreciation. Mr. Ganis also serves as AML officer of other Fidelity funds (2006-present) and FMR LLC (2003-present). Before joining Fidelity Investments, Mr. Ganis practiced law at Goodwin Procter, LLP (2000-2002). |
Joseph B. Hollis (59) |
| Year of Election or Appointment: 2006 Chief Financial Officer of Advisor Global Capital Appreciation. Mr. Hollis also serves as Chief Financial Officer of other Fidelity funds. Mr. Hollis is President of Fidelity Pricing and Cash Management Services (FPCMS) (2005-present). Mr. Hollis also serves as President and Director of Fidelity Service Company, Inc. (2006-present). Previously, Mr. Hollis served as Senior Vice President of Cash Management Services (1999-2002) and Investment Management Operations (2002-2005). |
Kenneth A. Rathgeber (60) |
| Year of Election or Appointment: 2004 Chief Compliance Officer of Advisor Global Capital Appreciation. Mr. Rathgeber also serves as Chief Compliance Officer of other Fidelity funds (2004-present) and Executive Vice President of Risk Oversight for Fidelity Investments (2002-present). He is Chief Compliance Officer of FMR (2005-present), FMR Co., Inc. (2005-present), Fidelity Management & Research (U.K.) Inc. (2005-present), Fidelity Research & Analysis Company (2005-present), Fidelity Investments Money Management, Inc. (2005-present), and Strategic Advisers, Inc. (2005-present). Previously, Mr. Rathgeber served as Executive Vice President and Chief Operating Officer for Fidelity Investments Institutional Services Company, Inc. (1998-2002). |
Bryan A. Mehrmann (46) |
| Year of Election or Appointment: 2005 Deputy Treasurer of Advisor Global Capital Appreciation. Mr. Mehrmann also serves as Deputy Treasurer of other Fidelity funds (2005-present) and is an employee of FMR. Previously, Mr. Mehrmann served as Vice President of Fidelity Investments Institutional Services Group (FIIS)/Fidelity Investments Institutional Operations Corporation, Inc. (FIIOC) Client Services (1998-2004). |
Kenneth B. Robins (38) |
| Year of Election or Appointment: 2005 Deputy Treasurer of Advisor Global Capital Appreciation. Mr. Robins also serves as Deputy Treasurer of other Fidelity funds (2005-present) and is an employee of FMR (2004-present). Before joining Fidelity Investments, Mr. Robins worked at KPMG LLP, where he was a partner in KPMG's department of professional practice (2002-2004) and a Senior Manager (1999-2000). In addition, Mr. Robins served as Assistant Chief Accountant, United States Securities and Exchange Commission (2000-2002). |
Robert G. Byrnes (40) |
| Year of Election or Appointment: 2005 Assistant Treasurer of Advisor Global Capital Appreciation. Mr. Byrnes also serves as Assistant Treasurer of other Fidelity funds (2005-present) and is an employee of FMR (2005-present). Previously, Mr. Byrnes served as Vice President of FPCMS (2003-2005). Before joining Fidelity Investments, Mr. Byrnes worked at Deutsche Asset Management where he served as Vice President of the Investment Operations Group (2000-2003). |
Peter L. Lydecker (53) |
| Year of Election or Appointment: 2004 Assistant Treasurer of Advisor Global Capital Appreciation. Mr. Lydecker also serves as Assistant Treasurer of other Fidelity funds (2004) and is an employee of FMR. |
Paul M. Murphy (60) |
| Year of Election or Appointment: 2007 Assistant Treasurer of the fund. Mr. Murphy also serves as Assistant Treasurer of other Fidelity funds (2007-present) and is an employee of FMR (2007-present). Previously, Mr. Murphy served as Chief Financial Officer of the Fidelity Funds (2005-2006), Vice President and Associate General Counsel of FMR (2007), and Senior Vice President of Fidelity Pricing and Cash Management Services Group (FPCMS) (1994-2007). |
Gary W. Ryan (49) |
| Year of Election or Appointment: 2005 Assistant Treasurer of Advisor Global Capital Appreciation. Mr. Ryan also serves as Assistant Treasurer of other Fidelity funds (2005-present) and is an employee of FMR (2005-present). Previously, Mr. Ryan served as Vice President of Fund Reporting in FPCMS (1999-2005). |
** FMR Corp. merged with FMR LLC on October 1, 2007. Any references to FMR LLC for prior periods are deemed to be references to the prior entity.
Annual Report
Distributions
The Board of Trustees of Fidelity Advisor Global Capital Appreciation Fund voted to pay to shareholders of record at the opening of business on record date, the following distributions per share derived from capital gains realized from sales of portfolio securities, and dividends derived from net investment income:
| Pay Date | Record Date | Dividends | Capital Gains |
Class A | 12/10/07 | 12/07/07 | $0 | $1.796 |
Class T | 12/10/07 | 12/07/07 | $0 | $1.748 |
Class B | 12/10/07 | 12/07/07 | $0 | $1.678 |
Class C | 12/10/07 | 12/07/07 | $0 | $1.692 |
The fund hereby designates as a capital gain dividend with respect to the taxable year ended October 31, 2007, $1,203,299, or, if subsequently determined to be different, the net capital gain of such year.
The fund will notify shareholders in January 2008 of amounts for use in preparing 2007 income tax returns.
Annual Report
Proxy Voting Results
A special meeting of the fund's shareholders was held on June 20, 2007. The results of votes taken among shareholders on the proposal before them are reported below. Each vote reported represents one dollar of net asset value held on the record date for the meeting.
PROPOSAL 2 |
To approve an amended management contract that includes adding a performance adjustment component to the management fee for Fidelity Advisor Global Capital Appreciation Fund and giving the Trustees the authority to change the fund's performance adjustment index going forward, without shareholder vote, subject to applicable law. |
| # of
Votes | % of
Votes |
Affirmative | 18,745,624.96 | 73.981 |
Against | 3,491,395.81 | 13.779 |
Abstain | 3,101,380.21 | 12.240 |
TOTAL | 25,338,400.98 | 100.000 |
Annual Report
Board Approval of Investment Advisory Contracts and Management Fees
Advisor Global Capital Appreciation Fund
Each year, typically in July, the Board of Trustees, including the Independent Trustees (together, the Board), votes on the renewal of the management contract and sub-advisory agreements (together, the Advisory Contracts) for the fund. The Board, assisted by the advice of fund counsel and Independent Trustees' counsel, requests and considers a broad range of information throughout the year.
The Board meets regularly each month except August and takes into account throughout the year matters bearing on Advisory Contracts. The Board, acting directly and through its separate committees, considers at each of its meetings factors that are relevant to the annual renewal of the fund's Advisory Contracts, including the services and support provided to the fund and its shareholders. At the time of the renewal, the Board had 12 standing committees, each composed of Independent Trustees with varying backgrounds, to which the Board has assigned specific subject matter responsibilities in order to enhance effective decision-making by the Board. Each committee has adopted a written charter outlining the structure and purposes of the committee. One such committee, the Equity Contract Committee, meets periodically as needed throughout the year to consider matters specifically related to the annual renewal of Advisory Contracts. The committee requests and receives information on, and makes recommendations to the Independent Trustees concerning, the approval and annual review of the Advisory Contracts.
At its July 2007 meeting, the Board of Trustees, including the Independent Trustees, unanimously determined to renew the Advisory Contracts for the fund. In reaching its determination, the Board considered all factors it believed relevant, including (i) the nature, extent, and quality of the services to be provided to the fund and its shareholders (including the investment performance of the fund); (ii) the competitiveness of the management fee and total expenses of the fund; (iii) the total costs of the services to be provided by and the profits to be realized by the investment adviser and its affiliates from the relationship with the fund; (iv) the extent to which economies of scale would be realized as the fund grows; and (v) whether fee levels reflect these economies of scale, if any, for the benefit of fund shareholders. The Board also approved amendments to the fund's agreements with foreign sub-advisers to clarify that each sub-adviser provides services as an independent contractor.
In determining whether to renew the Advisory Contracts for the fund, the Board ultimately reached a determination, with the assistance of fund counsel and Independent Trustees' counsel, that the renewal of the Advisory Contracts and the compensation to be received by Fidelity under the management contract is consistent with Fidelity's fiduciary duty under applicable law. In addition to evaluating the specific factors noted above, the Board, in reaching its determination, is aware that shareholders in the fund have a broad range of investment choices available to them, including a wide choice among mutual funds offered by competitors to Fidelity, and that the fund's shareholders, with the opportunity to review and weigh the disclosure provided by the fund in its prospectus and other public disclosures, have chosen to invest in this fund, managed by Fidelity.
Annual Report
Board Approval of Investment Advisory Contracts and
Management Fees - continued
Nature, Extent, and Quality of Services Provided. The Board considered staffing within the investment adviser, FMR, and the sub-advisers (together, the Investment Advisers), including the backgrounds of the fund's portfolio managers and the fund's investment objective and discipline. The Independent Trustees also had discussions with senior management of Fidelity's investment operations and investment groups. The Board considered the structure of the portfolio manager compensation program and whether this structure provides appropriate incentives.
Resources Dedicated to Investment Management and Support Services. The Board reviewed the size, education, and experience of the Investment Advisers' investment staff, their use of technology, and the Investment Advisers' approach to recruiting, training, and retaining portfolio managers and other research, advisory, and management personnel. The Board considered Fidelity's extensive global research capabilities that enable the Investment Advisers to aggregate data from various sources in an effort to produce positive investment results. The Board noted that Fidelity's analysts have access to a variety of technological tools that enable them to perform both fundamental and quantitative analysis and to specialize in various disciplines. The Board also considered that Fidelity's portfolio managers and analysts have access to daily portfolio attribution that allows for monitoring of a fund's portfolio, as well as an electronic communication system that provides immediate real-time access to research concerning issuers and credit enhancers.
Shareholder and Administrative Services. The Board considered (i) the nature, extent, quality, and cost of advisory, administrative, distribution, and shareholder services performed by the Investment Advisers and their affiliates under the Advisory Contracts and under separate agreements covering transfer agency, pricing and bookkeeping, and securities lending services for the fund; (ii) the nature and extent of the Investment Advisers' supervision of third party service providers, principally custodians and subcustodians; and (iii) the resources devoted to, and the record of compliance with, the fund's compliance policies and procedures. The Board reviewed the allocation of fund brokerage, including allocations to brokers affiliated with the Investment Advisers, the use of brokerage commissions to pay fund expenses, and the use of "soft" commission dollars to pay for research services. The Board also considered that Fidelity voluntarily pays for market data out of its own resources. The Board also considered the agreement reached between the Independent Trustees and Fidelity in December 2006 following an independent review of matters relating to receipt of travel, entertainment, gifts and gratuities in violation of Fidelity policies.
Annual Report
The Board noted that the growth of fund assets across the complex allows Fidelity to reinvest in the development of services designed to enhance the value or convenience of the Fidelity funds as investment vehicles. These services include 24-hour access to account information and market information through phone representatives and over the Internet, and investor education materials and asset allocation tools.
Investment in a Large Fund Family. The Board considered the benefits to shareholders of investing in a Fidelity fund, including the benefits of investing in a fund that is part of a large family of funds offering a variety of investment disciplines and providing for a large variety of mutual fund investor services. For example, fund shareholders are offered the privilege of exchanging shares of the fund for shares of other Fidelity funds, as set forth in the fund's prospectus, without paying a sales charge. The Board noted that, since the last Advisory Contract renewals in July 2006, Fidelity has taken a number of actions that benefited particular funds, including (i) dedicating additional resources to investment research and to restructure the investment research teams; (ii) contractually agreeing to reduce the management fee on Fidelity Advisor Floating Rate High Income Fund; (iii) contractually agreeing to reduce the management fees on Fidelity's California, Massachusetts, New Jersey, and New York AMT Tax-Free Money Market Funds, launching new Institutional Classes and Service Classes of these funds, and contractually agreeing to impose expense limitations on these funds; (iv) eliminating the exchange fee on the Fidelity Select Portfolios and reducing the pricing and bookkeeping fee rates for these funds; (v) reducing the maximum transfer agency fee rates on high income funds and certain equity funds; (vi) proposing amended management contracts that, if approved by shareholders, will add a performance adjustment component to the management fees paid by 18 Fidelity Advisor equity funds; (vii) contractually agreeing to reduce fees for Ultra-Short Central Fund and the money market Central Funds; (viii) waiving the Fidelity Advisor funds' contingent deferred sales charge on certain redemptions made through systematic withdrawal programs; and (ix) amending the management contracts for equity and fixed-income funds whose management contracts incorporate a "group fee" structure by adding four new fee "breakpoints" to the group fee rate schedules.
Investment Performance and Compliance. The Board considered whether the fund has operated within its investment objective, as well as its record of compliance with its investment restrictions. It also reviewed the fund's absolute investment performance for each class, as well as the fund's relative investment performance for each class measured against (i) a broad-based securities market index, and (ii) a peer group of mutual funds deemed appropriate by the Board over multiple periods. The following charts considered by the Board show, over the one-, three-, and five-year periods ended December 31, 2006, the cumulative total returns of Institutional Class (Class I) and Class B of the fund, the cumulative total returns of a broad-based securities market index ("benchmark"), and a range of cumulative total returns of a peer group of mutual funds identified by Morningstar, Inc. as having an investment style similar to that of the fund based on underlying portfolio holdings. The returns of Institutional Class (Class I) and Class B show the performance of the highest and lowest performing classes, respectively (based on three-year performance). The box within each chart shows the 25th percentile return (bottom of box) and the 75th percentile return (top of box) of the peer group. Returns shown above the box are in the first quartile and returns shown below the box are in the fourth quartile. The percentage beaten numbers noted below each chart correspond to the percentile box and represent the percentage of funds in the peer group whose performance was equal to or lower than that of the class indicated.
Annual Report
Board Approval of Investment Advisory Contracts and
Management Fees - continued
Advisor Global Capital Appreciation Fund
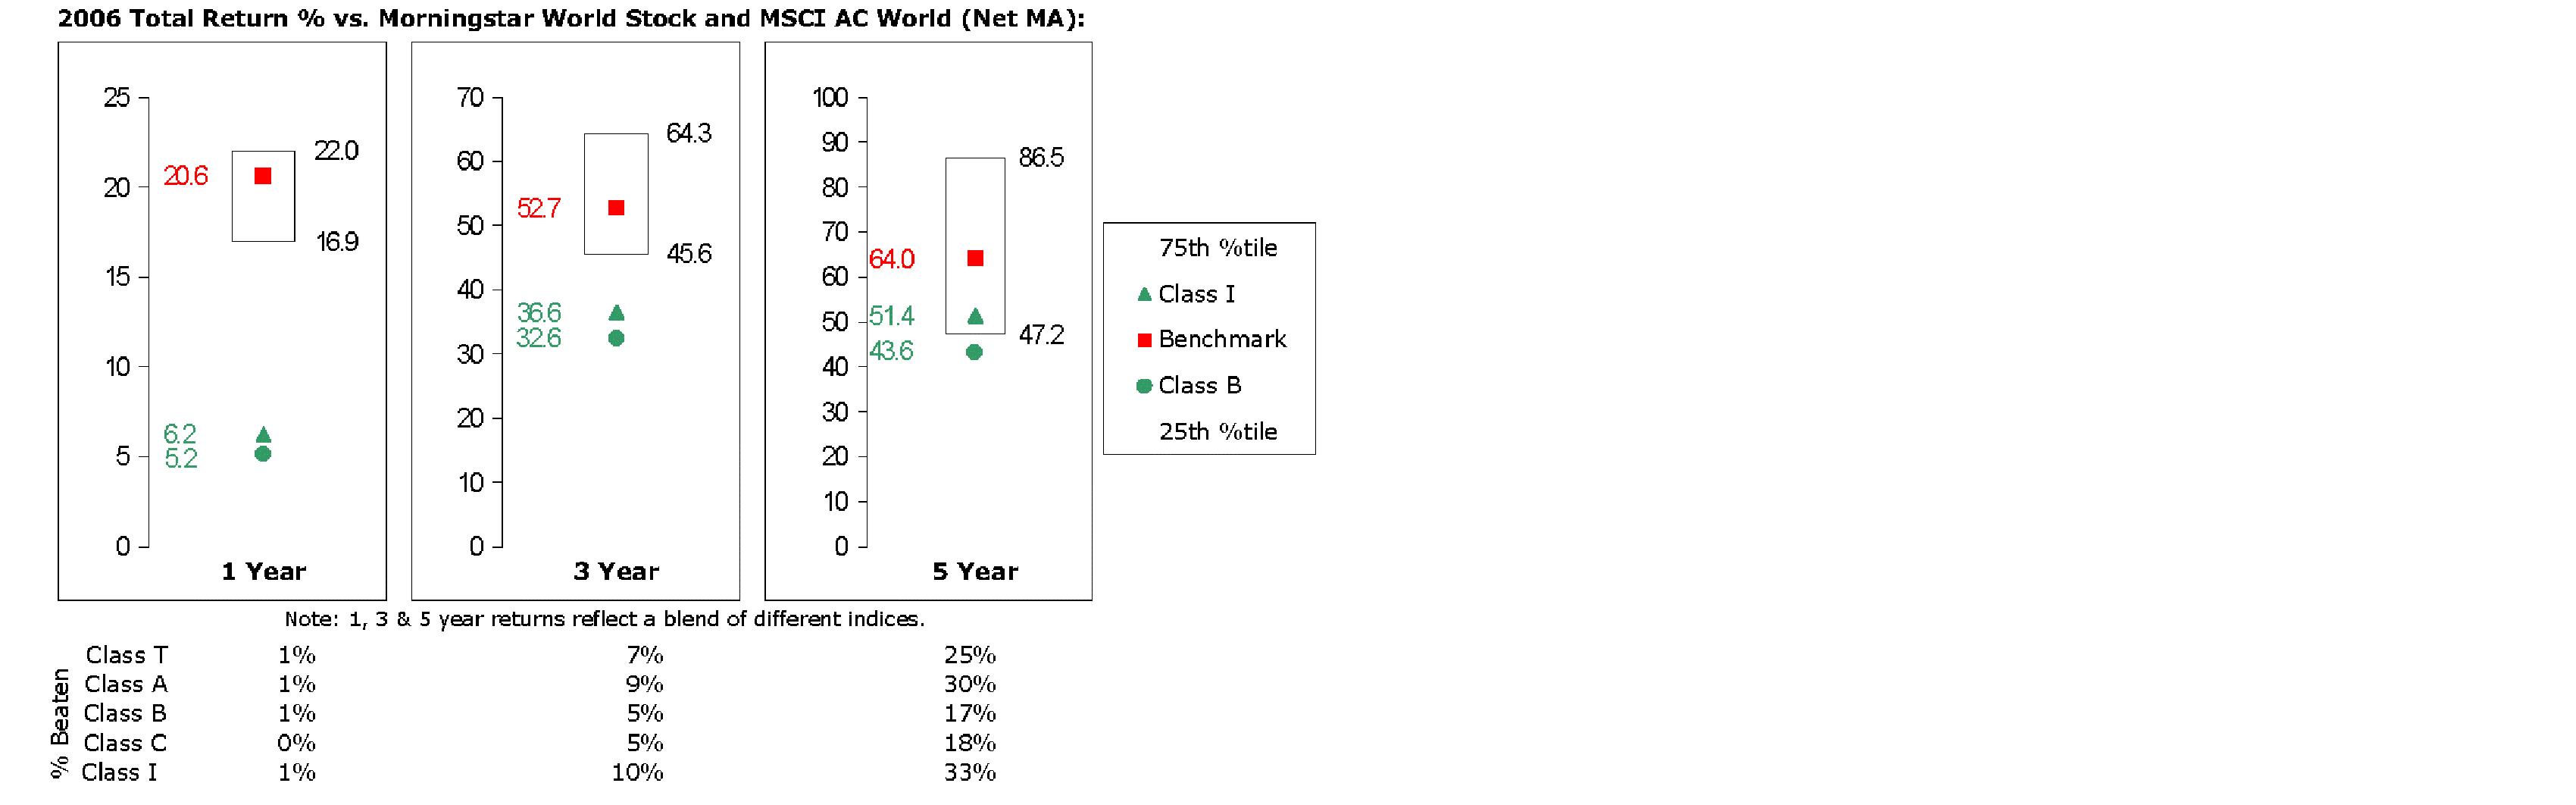
The Board reviewed the fund's relative investment performance against its peer group and stated that the performance of Institutional Class (Class I) of the fund was in the fourth quartile for the one- and three-year periods and the third quartile for the five-year period. The Board also stated that the investment performance of Institutional Class (Class I) of the fund was lower than its benchmark for all the periods shown. The Board considered that the variations in performance among the fund's classes reflect the variations in class expenses, which result in lower performance for higher expense classes. The Board discussed with FMR actions to be taken by FMR to improve the fund's disappointing performance relative to its peer group. The Board will continue to closely monitor the performance of the fund in the coming year and discuss with FMR other appropriate actions to address the performance of the fund.
The Board considered that FMR has taken steps to refocus and strengthen equity research, equity portfolio management, and compliance.
Annual Report
Based on its review, and giving particular weight to the nature and quality of the resources dedicated by the Investment Advisers to maintain and improve relative performance, the Board concluded that the nature, extent, and quality of the services provided to the fund will benefit the fund's shareholders, particularly in light of the Board's view that the fund's shareholders benefit from investing in a fund that is part of a large family of funds offering a variety of investment disciplines and services.
Competitiveness of Management Fee and Total Fund Expenses. The Board considered the fund's management fee and total expenses compared to "mapped groups" of competitive funds and classes. Fidelity creates "mapped groups" by combining similar Lipper investment objective categories that have comparable management fee characteristics. Combining Lipper investment objective categories aids the Board's management fee and total expense comparisons by broadening the competitive group used for comparison and by reducing the number of universes to which various Fidelity funds are compared. The Board also considered supplemental information about how the fund's management fee and total expenses ranked relative to groups based on Lipper classifications, which take into account a fund's market capitalization and style.
The Board considered two proprietary management fee comparisons for the 12-month periods shown in the chart below. The group of Lipper funds used by the Board for management fee comparisons is referred to below as the "Total Mapped Group." The Total Mapped Group comparison focuses on a fund's standing relative to the total universe of comparable funds available to investors, in terms of gross management fees before expense reimbursements or caps. "TMG %" represents the percentage of funds in the Total Mapped Group that had management fees that were lower than the fund's. For example, a TMG % of 15% means that 85% of the funds in the Total Mapped Group had higher management fees than the fund. The "Asset-Size Peer Group" (ASPG) comparison focuses on a fund's standing relative to non-Fidelity funds similar in size to the fund within the Total Mapped Group. The ASPG represents at least 15% of the funds in the Total Mapped Group with comparable asset size and management fee characteristics, subject to a minimum of 50 funds (or all funds in the Total Mapped Group if fewer than 50). Additional information, such as the ASPG quartile in which the fund's management fee ranked, is also included in the chart and considered by the Board.
Annual Report
Board Approval of Investment Advisory Contracts and
Management Fees - continued
Advisor Global Capital Appreciation Fund
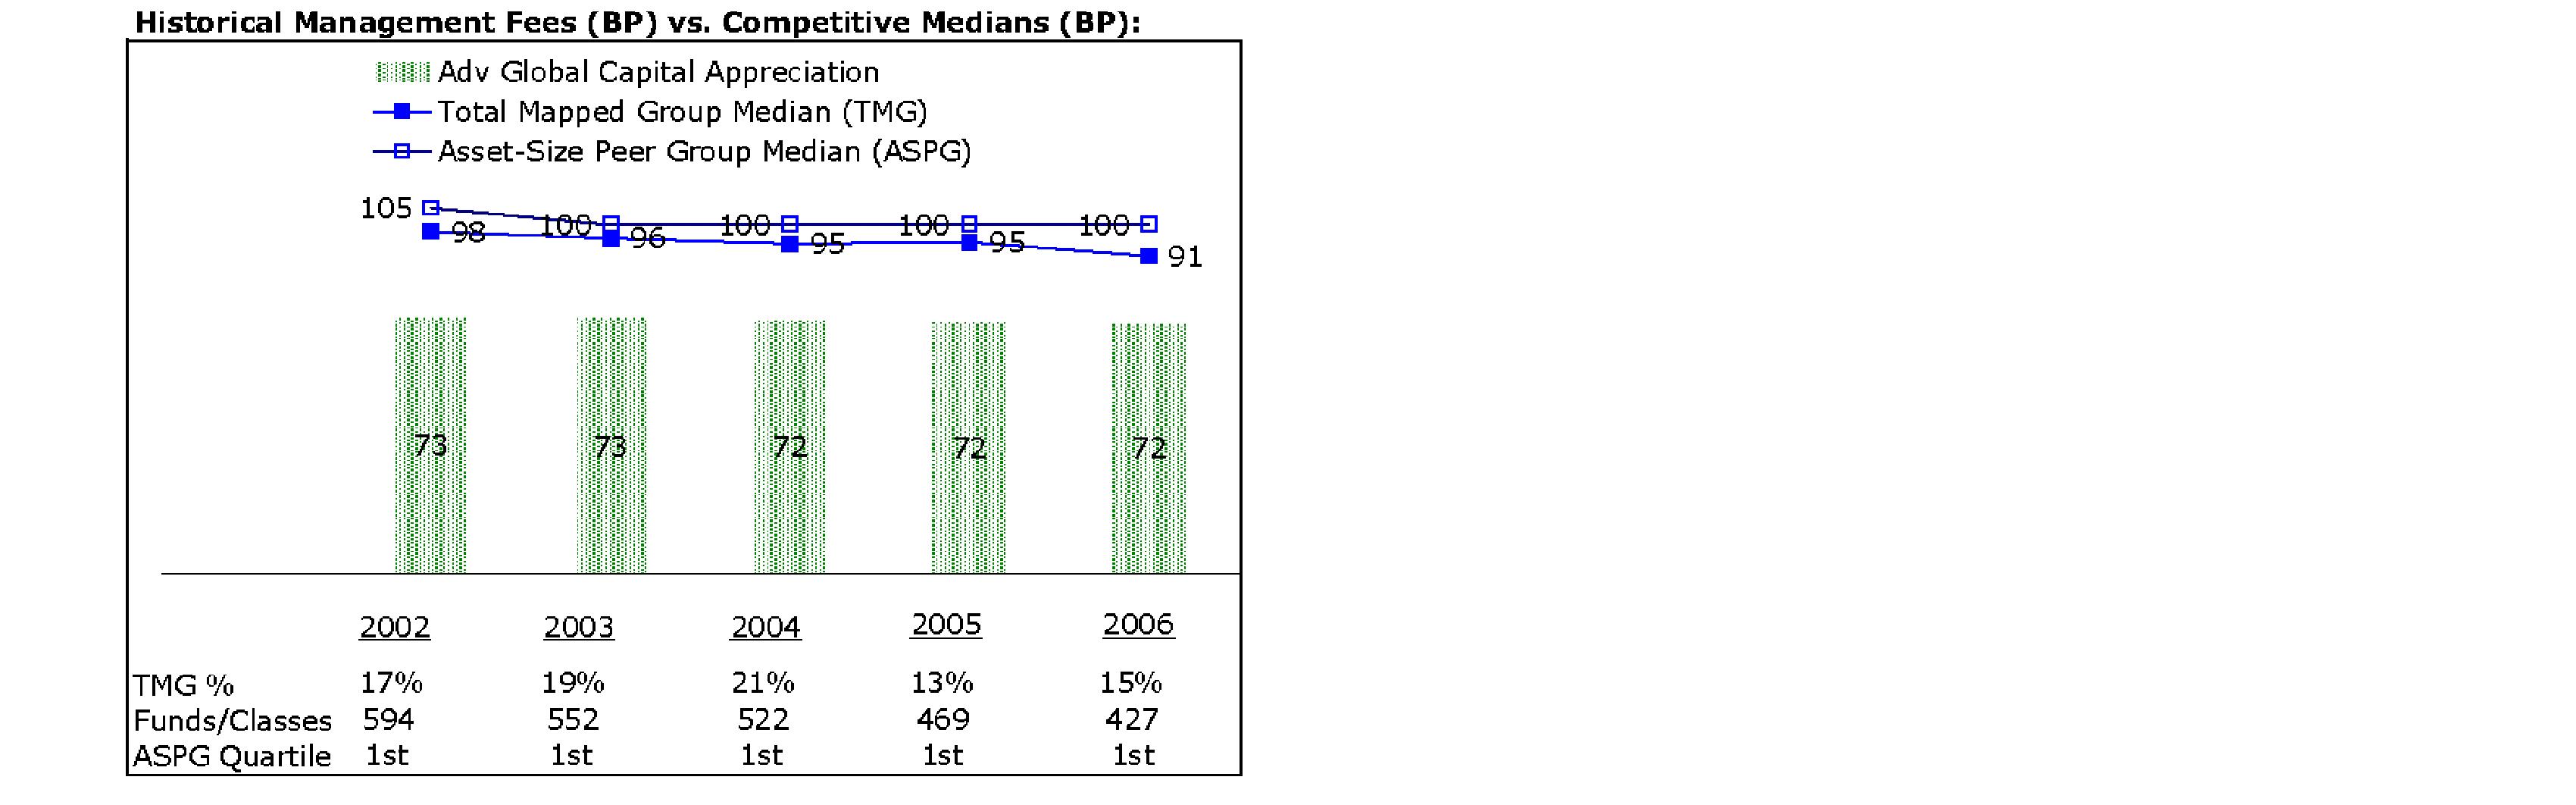
The Board noted that the fund's management fee ranked below the median of its Total Mapped Group and below the median of its ASPG for 2006.
Furthermore, the Board considered that, on June 20, 2007, after the periods shown in the chart above, shareholders approved an amended management contract for the fund that will add a performance adjustment component to the management fee paid by the fund (that is, the fund's management fee will be subject to upward or downward adjustment depending upon whether, and to what extent, the fund's investment performance for the performance period exceeds, or is exceeded by, the record (over the same period) of a Board-approved performance adjustment index). The performance period for the fund commenced on July 1, 2007. Starting with the twelfth month, the performance adjustment takes effect.
Based on its review, the Board concluded that the fund's management fee was fair and reasonable in light of the services that the fund receives and the other factors considered.
In its review of each class's total expenses, the Board considered the fund's management fee as well as other fund or class expenses, as applicable, such as transfer agent fees, pricing and bookkeeping fees, fund-paid 12b-1 fees, and custodial, legal, and audit fees. The Board also noted the effects of any waivers and reimbursements on fees and expenses. As part of its review, the Board also considered current and historical total expenses of each class of the fund compared to competitive fund median expenses. Each class of the fund is compared to those funds and classes in the Total Mapped Group (used by the Board for management fee comparisons) that have a similar sales load structure.
Annual Report
The Board noted that the total expenses of Class A ranked below its competitive median for 2006, the total expenses of each of Class B and Class C ranked equal to its competitive median for 2006, and the total expenses of each of Class T and Institutional Class ranked above its competitive median for 2006. The Board noted that the fund offers multiple classes, each of which has a different sales load and 12b-1 fee structure, and that the multiple structures are intended to offer a range of pricing options for the intermediary market. The Board also noted that the total expenses of the classes vary primarily by the level of their 12b-1 fees, although differences in transfer agent fees may also cause expenses to vary from class to class.
In its review of total expenses, the Board also considered Fidelity fee structures and other information on clients that FMR and its affiliates service in other competitive markets, such as other mutual funds advised or subadvised by FMR or its affiliates, pension plan clients, and other institutional clients.
Based on its review, the Board concluded that the total expenses of each class of the fund were reasonable, although in some cases above the median of the universe presented for comparison, in light of the services that the fund and its shareholders receive and the other factors considered.
Costs of the Services and Profitability. The Board considered the revenues earned and the expenses incurred by Fidelity in conducting the business of developing, marketing, distributing, managing, administering and servicing the fund and its shareholders. The Board also considered the level of Fidelity's profits in respect of all the Fidelity funds.
On an annual basis, FMR presents to the Board Fidelity's profitability for the fund. Fidelity calculates the profitability for each fund, as well as aggregate profitability for groups of Fidelity funds and all Fidelity funds, using a series of detailed revenue and cost allocation methodologies which originate with the audited books and records of Fidelity. The Audit Committee of the Board reviews any significant changes from the prior year's methodologies.
PricewaterhouseCoopers LLP (PwC), independent registered public accounting firm and auditor to Fidelity and certain Fidelity funds, has been engaged annually by the Board as part of the Board's assessment of the results of Fidelity's profitability analysis. PwC's engagement includes the review and assessment of Fidelity's methodologies used in determining the revenues and expenses attributable to Fidelity's mutual fund business, and completion of agreed-upon procedures surrounding the mathematical accuracy of fund profitability and its conformity to allocation methodologies. After considering PwC's reports issued under the engagement and information provided by Fidelity, the Board believes that while other allocation methods may also be reasonable, Fidelity's profitability methodologies are reasonable in all material respects.
Annual Report
Board Approval of Investment Advisory Contracts and
Management Fees - continued
The Board has also reviewed Fidelity's non-fund businesses and any fall-out benefits related to the mutual fund business as well as cases where Fidelity's affiliates may benefit from or be related to the fund's business.
The Board considered the costs of the services provided by and the profits realized by Fidelity in connection with the operation of the fund and determined that the amount of profit is a fair entrepreneurial profit for the management of the fund.
Economies of Scale. The Board considered whether there have been economies of scale in respect of the management of the Fidelity funds, whether the Fidelity funds (including the fund) have appropriately benefited from any such economies of scale, and whether there is potential for realization of any further economies of scale. The Board considered the extent to which the fund will benefit from economies of scale through increased services to the fund, through waivers or reimbursements, or through fee or expense reductions, including reductions that occur through operation of the transfer agent agreement. The transfer agent fee varies in part based on the number of accounts in the fund. If the number of accounts decreases or the average account size increases, the overall transfer agent fee rate decreases.
The Board recognized that the fund's management contract incorporates a "group fee" structure, which provides for lower group fee rates as total fund assets under FMR's management increase, and for higher group fee rates as total fund assets under FMR's management decrease. FMR determines the group fee rates based on a tiered asset "breakpoint" schedule. In connection with the renewal of the fund's management contract, the Board approved amendments to the fund's management contract that added four new fee breakpoints to the group fee rate schedule for assets under FMR's management above $1,386 billion. The Board considered that the group fee rate declines under both the present and amended schedules, but that under the amended schedule, the group fee rate declines faster as assets under FMR's management exceed $1,386 billion. The Board considered that the group fee is designed to deliver the benefits of economies of scale to fund shareholders when total fund assets increase, even if assets of any particular fund are unchanged or have declined, because some portion of Fidelity's costs are attributable to services provided to all Fidelity funds, and all funds benefit if those costs can be allocated among more assets. The Board concluded that, given the group fee structure, fund shareholders will achieve a certain level of economies of scale as assets under FMR's management increase at the fund complex level, regardless of whether Fidelity achieves any such economies of scale.
The Board further concluded that any potential economies of scale are being shared between fund shareholders and Fidelity in an appropriate manner.
Additional Information Requested by the Board. In order to develop fully the factual basis for consideration of the Fidelity funds' Advisory Contracts, the Board requested and received additional information on several topics, including (i) fund performance trends and actions to be taken by FMR to improve certain funds' overall performance; (ii) Fidelity's portfolio manager compensation structure, including its effects on fund profitability and the extent to which portfolio manager compensation is linked to fund performance; (iii) Fidelity's fee structures; (iv) the funds' sub-advisory arrangements; and (v) accounts managed by Fidelity other than the Fidelity funds.
Annual Report
Based on its evaluation of all of the conclusions noted above, and after considering all material factors, the Board ultimately concluded that the advisory fee structures are fair and reasonable, and that the fund's Advisory Contracts should be renewed.
Annual Report
Investment Adviser
Fidelity Management & Research Company
Boston, MA
Investment Sub-Advisers
FMR Co., Inc.
Fidelity Management & Research
(U.K.) Inc.
Fidelity Research & Analysis Company
Fidelity International
Investment Advisors
Fidelity Investments Japan Limited
Fidelity International Investment Advisors (U.K.) Limited
General Distributor
Fidelity Distributors Corporation
Boston, MA
Transfer and Service Agents
Fidelity Investments Institutional Operations Company, Inc.
Boston, MA
Fidelity Service Company, Inc.
Boston, MA
Custodian
State Street Bank and Trust Company
Quincy, MA
AGLO-UANN-1207
1.784744.104
(Fidelity Investment logo)(registered trademark)
(Fidelity Investment logo)(registered trademark)
Fidelity® Advisor
Global Capital Appreciation
Fund - Institutional Class
Annual Report
October 31, 2007
(2_fidelity_logos) (Registered_Trademark)
Contents
Chairman's Message | <Click Here> | Ned Johnson's message to shareholders. |
Note to Shareholders | <Click Here> | An explanation of the changes to the fund. |
Performance | <Click Here> | How the fund has done over time. |
Management's Discussion | <Click Here> | The manager's review of fund performance, strategy and outlook. |
Shareholder Expense Example | <Click Here> | An example of shareholder expenses. |
Investment Changes | <Click Here> | A summary of major shifts in the fund's investments over the past six months. |
Investments | <Click Here> | A complete list of the fund's investments with their market values. |
Financial Statements | <Click Here> | Statements of assets and liabilities, operations, and changes in net assets,
as well as financial highlights. |
Notes | <Click Here> | Notes to the financial statements. |
Report of Independent Registered Public Accounting Firm | <Click Here> | |
Trustees and Officers | <Click Here> | |
Distributions | <Click Here> | |
Proxy Voting Results | <Click Here> | |
Board Approval of Investment Advisory Contracts and Management Fees | <Click Here> | |
To view a fund's proxy voting guidelines and proxy voting record for the 12-month period ended June 30, visit http://www.fidelity.com (search for "proxy voting guidelines") or visit the Securities and Exchange Commission's (SEC) web site at http://www.sec.gov. You may also call 1-877-208-0098 to request a free copy of the proxy voting guidelines.
Standard & Poor's, S&P and S&P 500 are registered service marks of The McGraw-Hill Companies, Inc. and have been licensed for use by Fidelity Distributors Corporation.
Other third party marks appearing herein are the property of their respective owners.
All other marks appearing herein are registered or unregistered trademarks or service marks of FMR LLC or an affiliated company.
Annual Report
This report and the financial statements contained herein are submitted for the general information of the shareholders of the fund. This report is not authorized for distribution to prospective investors in the fund unless preceded or accompanied by an effective prospectus.
A fund files its complete schedule of portfolio holdings with the SEC for the first and third quarters of each fiscal year on Form N-Q. Forms N-Q are available on the SEC's web site at http://www.sec.gov. A fund's Forms N-Q may be reviewed and copied at the SEC's Public Reference Room in Washington, DC. Information regarding the operation of the SEC's Public Reference Room may be obtained by calling 1-800-SEC-0330. For a complete list of a fund's portfolio holdings, view the most recent holdings listing, semiannual report, or annual report on Fidelity's web site at http://www.fidelity.com or http://www.advisor.fidelity.com, as applicable.
NOT FDIC INSURED · MAY LOSE VALUE · NO BANK GUARANTEE
Neither the fund nor Fidelity Distributors Corporation is a bank.
Annual Report
Chairman's Message
(photo_of_Edward_C_Johnson_3d)
Dear Shareholder:
Many stock and bond markets around the world have been unsettled of late; however, volatility can often lead to opportunity for patient investors. Financial markets are always unpredictable, but there are a number of time-tested principles that can put the historical odds in your favor.
One of the basic tenets is to invest for the long term. Over time, riding out the markets' inevitable ups and downs has proven much more effective than selling into panic or chasing the hottest trend. Even missing only a few of the markets' best days can significantly diminish investor returns. Patience also affords the benefits of compounding - of earning interest on additional income or reinvested dividends and capital gains. There are tax advantages and cost benefits to consider as well. The more you sell, the more taxes you pay, and the more you trade, the higher the costs. While staying the course doesn't eliminate risk, it can considerably lessen the effect of short-term declines.
You can further manage your investing risk through diversification. And today, more than ever, geographic diversification should be taken into account. Studies indicate that asset allocation is the single most important determinant of a portfolio's long-term success. The right mix of stocks, bonds and cash - aligned to your particular risk tolerance and investment objective - is very important. Age-appropriate rebalancing is also an essential aspect of asset allocation. For younger investors, an emphasis on equities - which historically have been the best-performing asset class over time - is encouraged. As investors near their specific goal, such as retirement or sending a child to college, consideration may be given to replacing volatile assets (e.g. common stocks) with more-stable fixed investments (bonds or savings plans).
A third investment principle - investing regularly - can help lower the average cost of your purchases. Investing a certain amount of money each month or quarter helps ensure you won't pay for all your shares at market highs. This strategy - known as dollar cost averaging - also reduces unconstructive "emotion" from investing, helping shareholders avoid selling weak performers just prior to an upswing, or chasing a hot performer just before a correction.
We invite you to contact us via the Internet, through our Investor Centers or over the phone. It is our privilege to provide you the information you need to make the investments that are right for you.
Sincerely,
/s/Edward C. Johnson 3d
Edward C. Johnson 3d
Annual Report
Note to Shareholders:
On June 20, 2007, shareholders of Fidelity® Advisor Global Capital Appreciation Fund approved a new management contract for the fund, effective July 1, 2007, which adds a performance adjustment component to the management fee based on the fund's performance versus the Morgan Stanley Capital InternationalSM All Country World Index (MSCI® ACWI). The new contract also allows the Board of Trustees to designate an alternate performance adjustment index in the future, without a shareholder vote, when permitted by applicable law.
Annual Report
Performance: The Bottom Line
Average annual total return reflects the change in the value of an investment, assuming reinvestment of the class' dividend income and capital gains (the profits earned upon the sale of securities that have grown in value) and assuming a constant rate of performance each year. The $10,000 table and the fund's returns do not reflect the deduction of taxes that a shareholder would pay on fund distributions or the redemption of fund shares. During periods of reimbursement by Fidelity, a fund's total return will be greater than it would be had the reimbursement not occurred. How a fund did yesterday is no guarantee of how it will do tomorrow.
Average Annual Total Returns
Periods ended October 31, 2007 | Past 1
year | Past 5
years | Life of
fund A |
Institutional Class | 20.88% | 16.19% | 7.37% |
A From December 17, 1998.
$10,000 Over Life of Fund
Let's say hypothetically that $10,000 was invested in Fidelity® Advisor Global Capital Appreciation Fund - Institutional Class on December 17, 1998, when the fund started. The chart shows how the value of your investment would have changed, and also shows how the MSCI® All Country (AC) World Index performed over the same period.
Annual Report
Management's Discussion of Fund Performance
Comments from Darren Maupin, Lead Portfolio Manager of Fidelity® Advisor Global Capital Appreciation Fund
Foreign stocks, with a large assist from a weak U.S. dollar, generally had higher returns for U.S. investors than domestic equities during the 12-month period ending October 31, 2007. The backdrop for global stocks was solid, with robust economic growth and relatively high corporate profitability worldwide. Developed international equity markets, as measured by the Morgan Stanley Capital InternationalSM Europe, Australasia, and Far East (MSCI® EAFE®) Index - a performance monitor of established markets outside the United States and Canada - rose 25.09%. In comparison, the Standard & Poor's 500SM Index, a gauge of U.S. stocks, was up 14.56%, while Canada did appreciably better, as measured by the 43.24% advance of the S&P/TSX Composite Index. Among countries making up at least 1% of the EAFE benchmark, Finland had the best showing, soaring nearly 69%, while Hong Kong gained roughly 66%. The United Kingdom and Japan, the two largest components of the index, both underperformed. Fallout from the credit crunch and concerns about export growth tempered UK stocks, while Japan struggled with a slowdown in consumer spending and sluggish domestic growth. Emerging markets were the period's big winners, advancing 68.33% as measured by the MSCI Emerging Markets index.
The fund's Institutional Class shares were up 20.88%, compared with a gain of 24.58% for the MSCI All Country World index. The fund underperformed the index mainly due to unrewarding stock selection in materials and financials, with detractors in these sectors coming from both the international and U.S. equity sleeves. Overweighting the strong materials sector and underweighting the weak financials group, however, helped offset some of that damage. Regionally, our positioning in the Japanese market detracted, as did our overweighting versus the index in U.S. stocks, which did not perform as well as their international counterparts. However, good stock picking in the U.S. sleeve - especially within information technology - more than offset that drag. Overall, the fund's biggest relative detractors were Catalyst Paper, a Canadian materials company; Countrywide Financial, a large U.S. mortgage originator; and Sears Holdings, the large U.S. retail store chain. Contributions to the fund's relative results included U.S.-based Fluor, a global engineering and construction company; and Saskatchewan Wheat Pool, a Canadian grain processor.
Note to shareholders: Sammy Simnegar will become Co-Manager of the fund on January 1, 2008, replacing Darren Maupin.
The views expressed above reflect those of the portfolio manager(s) only through the end of the period as stated on the cover of this report and do not necessarily represent the views of Fidelity or any other person in the Fidelity organization. Any such views are subject to change at any time based upon market or other conditions and Fidelity disclaims any responsibility to update such views. These views may not be relied on as investment advice and, because investment decisions for a Fidelity fund are based on numerous factors, may not be relied on as an indication of trading intent on behalf of any Fidelity fund.
Annual Report
Shareholder Expense Example
As a shareholder of the Fund, you incur two types of costs: (1) transaction costs, including sales charges (loads) on purchase payments or redemption proceeds, redemption fees, and (2) ongoing costs, including management fees, distribution and/or service (12b-1) fees and other Fund expenses. This Example is intended to help you understand your ongoing costs (in dollars) of investing in the Fund and to compare these costs with the ongoing costs of investing in other mutual funds.
The Example is based on an investment of $1,000 invested at the beginning of the period and held for the entire period (May 1, 2007 to October 31, 2007).
Actual Expenses
The first line of the accompanying table for each class of the Fund provides information about actual account values and actual expenses. You may use the information in this line, together with the amount you invested, to estimate the expenses that you paid over the period. Simply divide your account value by $1,000.00 (for example, an $8,600 account value divided by $1,000.00 = 8.6), then multiply the result by the number in the first line for a class of the Fund under the heading entitled "Expenses Paid During Period" to estimate the expenses you paid on your account during this period. In addition, the Fund, as a shareholder in the underlying Fidelity Central Funds, will indirectly bear its pro rata share of the fees and expenses incurred by the underlying Fidelity Central Funds. These fees and expenses are not included in the Fund's annualized expense ratio used to calculate the expense estimate in the table below.
Hypothetical Example for Comparison Purposes
The second line of the accompanying table for each class of the Fund provides information about hypothetical account values and hypothetical expenses based on a Class' actual expense ratio and an assumed rate of return of 5% per year before expenses, which is not the Class' actual return. The hypothetical account values and expenses may not be used to estimate the actual ending account balance or expenses you paid for the period. You may use this information to compare the ongoing costs of investing in the Fund and other funds. To do so, compare this 5% hypothetical example with the 5% hypothetical examples that appear in the shareholder reports of the other funds. In addition, the Fund, as a shareholder in the underlying Fidelity Central Funds, will indirectly bear its pro rata share of the fees and expenses incurred by the underlying Fidelity Central Funds. These fees and expenses are not included in the Fund's annualized expense ratio used to calculate the expense estimate in the table below.
Annual Report
Please note that the expenses shown in the table are meant to highlight your ongoing costs only and do not reflect any transaction costs. Therefore, the second line of the table is useful in comparing ongoing costs only, and will not help you determine the relative total costs of owning different funds. In addition, if these transactional costs were included, your costs would have been higher.
| Beginning
Account Value
May 1, 2007 | Ending
Account Value
October 31, 2007 | Expenses Paid
During Period*
May 1, 2007 to
October 31, 2007 |
Class A | | | |
Actual | $ 1,000.00 | $ 1,074.00 | $ 7.84 |
Hypothetical A | $ 1,000.00 | $ 1,017.64 | $ 7.63 |
Class T | | | |
Actual | $ 1,000.00 | $ 1,072.70 | $ 9.14 |
Hypothetical A | $ 1,000.00 | $ 1,016.38 | $ 8.89 |
Class B | | | |
Actual | $ 1,000.00 | $ 1,070.10 | $ 11.74 |
Hypothetical A | $ 1,000.00 | $ 1,013.86 | $ 11.42 |
Class C | | | |
Actual | $ 1,000.00 | $ 1,070.00 | $ 11.74 |
Hypothetical A | $ 1,000.00 | $ 1,013.86 | $ 11.42 |
Institutional Class | | | |
Actual | $ 1,000.00 | $ 1,075.80 | $ 6.54 |
Hypothetical A | $ 1,000.00 | $ 1,018.90 | $ 6.36 |
A 5% return per year before expenses
* Expenses are equal to each Class' annualized expense ratio (shown in the table below); multiplied by the average account value over the period, multiplied by 184/365 (to reflect the one-half year period).
| Annualized
Expense Ratio |
Class A | 1.50% |
Class T | 1.75% |
Class B | 2.25% |
Class C | 2.25% |
Institutional Class | 1.25% |
Annual Report
Investment Changes
Top Five Stocks as of October 31, 2007 |
| % of fund's
net assets | % of fund's net assets
6 months ago |
Hutchison Whampoa Ltd. (Hong Kong, Industrial Conglomerates) | 3.4 | 0.0 |
Google, Inc. Class A (sub. vtg.) (United States of America, Internet Software & Services) | 3.2 | 2.6 |
Kubota Corp. (Japan, Machinery) | 2.7 | 1.0 |
Fluor Corp. (United States of America, Construction & Engineering) | 2.3 | 1.3 |
Takeda Pharamaceutical Co. Ltd. (Japan, Pharmaceuticals) | 2.3 | 0.2 |
| 13.9 | |
Top Five Market Sectors as of October 31, 2007 |
| % of fund's
net assets | % of fund's net assets
6 months ago |
Financials | 14.0 | 15.9 |
Materials | 12.6 | 10.6 |
Energy | 12.5 | 10.1 |
Industrials | 11.1 | 9.2 |
Health Care | 10.5 | 9.4 |
Top Five Countries as of October 31, 2007 |
(excluding cash equivalents) | % of fund's
net assets | % of fund's net assets
6 months ago |
United States of America | 42.1 | 50.7 |
Japan | 16.2 | 9.2 |
Canada | 11.4 | 9.6 |
Hong Kong | 3.4 | 0.0 |
Germany | 2.8 | 2.4 |
Percentages are adjusted for the effect of open futures contracts, if applicable. |
Asset Allocation (% of fund's net assets) |
As of October 31, 2007 | As of April 30, 2007 |
| Stocks 90.7% | | | Stocks 92.3% | |
| Bonds 0.6% | | | Bonds 1.5% | |
| Short-Term
Investments and
Net Other Assets 8.7% | | | Short-Term
Investments and
Net Other Assets 6.2% | |

Annual Report
Investments October 31, 2007
Showing Percentage of Net Assets
Common Stocks - 89.3% |
| Shares | | Value |
Argentina - 1.3% |
Cresud S.A.C.I.F. y A. sponsored ADR | 11,500 | | $ 283,820 |
Inversiones y Representaciones SA sponsored GDR (a) | 6,100 | | 108,946 |
Pampa Holding SA (a) | 272,138 | | 243,441 |
TOTAL ARGENTINA | | 636,207 |
Australia - 0.3% |
ABB Grain Ltd. | 15,812 | | 111,309 |
Newcrest Mining Ltd. | 805 | | 24,539 |
TOTAL AUSTRALIA | | 135,848 |
Brazil - 0.0% |
Bovespa Holding SA (a) | 1,000 | | 19,045 |
Canada - 11.4% |
Absolut Resources Corp. (a) | 58,000 | | 60,813 |
Aquiline Resources, Inc. (a) | 52,800 | | 593,315 |
Aquiline Resources, Inc. (a)(f) | 22,100 | | 248,338 |
Canadian Natural Resources Ltd. | 6,100 | | 507,537 |
Canfor Corp. (a) | 48,000 | | 444,821 |
Catalyst Paper Corp. (a) | 300,700 | | 452,228 |
European Goldfields Ltd. (a) | 83,500 | | 567,751 |
Guyana Goldfields, Inc. (a) | 15,400 | | 159,024 |
IAMGOLD Corp. | 70,100 | | 614,730 |
NuVista Energy Ltd. (a) | 10,000 | | 155,899 |
ProEx Energy Ltd. (a) | 19,100 | | 295,138 |
Saskatchewan Wheat Pool, Inc. (a)(f) | 38,600 | | 522,053 |
Suncor Energy, Inc. | 3,100 | | 339,647 |
Trican Well Service Ltd. | 28,700 | | 607,922 |
TOTAL CANADA | | 5,569,216 |
Cayman Islands - 2.1% |
ACE Ltd. | 7,100 | | 430,331 |
Apex Silver Mines Ltd. (a) | 12,500 | | 256,250 |
Hutchison Telecommunications International Ltd. (a) | 242,000 | | 345,408 |
TOTAL CAYMAN ISLANDS | | 1,031,989 |
Czech Republic - 1.3% |
Philip Morris CR AS | 1,270 | | 662,543 |
France - 1.7% |
Sanofi-Aventis sponsored ADR | 18,900 | | 831,789 |
Common Stocks - continued |
| Shares | | Value |
Germany - 2.8% |
E.ON AG | 4,300 | | $ 839,790 |
Lanxess AG | 10,300 | | 514,383 |
TOTAL GERMANY | | 1,354,173 |
Hong Kong - 3.4% |
Hutchison Whampoa Ltd. | 131,000 | | 1,650,601 |
Japan - 14.1% |
Aioi Insurance Co. Ltd. | 70,000 | | 406,935 |
Canon, Inc. | 5,300 | | 268,021 |
Kose Corp. | 24,400 | | 626,353 |
Kubota Corp. | 135,600 | | 1,138,659 |
Kubota Corp. sponsored ADR | 3,800 | | 159,980 |
Millea Holdings, Inc. | 10,412 | | 408,775 |
Mitsui Marine & Fire Insurance Co. Ltd. | 33,000 | | 378,555 |
Nec Electronics Corp. (a) | 2,000 | | 54,807 |
Nissin Healthcare Food Service Co. | 1,700 | | 20,811 |
Parco Co. Ltd. | 21,900 | | 306,667 |
Seino Holdings Co. Ltd. | 14,000 | | 120,239 |
SFCG Co. Ltd. | 2,970 | | 492,725 |
Shinsei Bank Ltd. | 284,000 | | 920,721 |
Takeda Pharmaceutical Co. Ltd. | 17,700 | | 1,105,861 |
Tokyo Steel Manufacturing Co. Ltd. | 8,000 | | 110,956 |
Torii Pharmaceutical Co. Ltd. | 5,000 | | 88,133 |
Tsutsumi Jewelry Co. Ltd. | 6,000 | | 131,271 |
USS Co. Ltd. | 2,060 | | 134,960 |
TOTAL JAPAN | | 6,874,429 |
Netherlands - 1.6% |
Koninklijke Philips Electronics NV | 19,000 | | 785,460 |
Netherlands Antilles - 1.8% |
Schlumberger Ltd. (NY Shares) | 9,400 | | 907,758 |
Philippines - 1.1% |
DMCI Holdings, Inc. | 793,000 | | 219,136 |
Semirara Mining Corp. | 301,600 | | 312,539 |
TOTAL PHILIPPINES | | 531,675 |
South Africa - 1.9% |
Gold Fields Ltd. sponsored ADR | 52,800 | | 954,096 |
Switzerland - 1.4% |
Actelion Ltd. (Reg.) (a) | 13,630 | | 677,205 |
Common Stocks - continued |
| Shares | | Value |
Taiwan - 1.4% |
Taiwan Mobile Co. Ltd. | 506,000 | | $ 677,895 |
United States of America - 41.7% |
AbitibiBowater, Inc. | 29,168 | | 999,296 |
AllianceBernstein Holding LP | 4,400 | | 375,892 |
American Express Co. | 6,800 | | 414,460 |
Apple, Inc. (a) | 5,000 | | 949,750 |
Bank of America Corp. | 11,600 | | 560,048 |
Becton, Dickinson & Co. | 4,100 | | 342,186 |
Chesapeake Energy Corp. | 12,300 | | 485,604 |
Cogent Communications Group, Inc. (a) | 16,219 | | 448,942 |
Corporate Executive Board Co. | 6,700 | | 477,375 |
Countrywide Financial Corp. | 18,700 | | 290,224 |
Crown Castle International Corp. (a) | 8,000 | | 328,560 |
Discovery Holding Co. Class A (a) | 19,300 | | 550,243 |
Dolan Media Co. | 8,100 | | 218,700 |
Equinix, Inc. (a) | 6,400 | | 746,624 |
Fluor Corp. | 7,000 | | 1,106,000 |
Genentech, Inc. (a) | 6,240 | | 462,571 |
Google, Inc. Class A (sub. vtg.) (a) | 2,200 | | 1,555,400 |
Hewlett-Packard Co. | 18,400 | | 950,912 |
Landstar System, Inc. | 10,300 | | 433,527 |
Microchip Technology, Inc. | 9,200 | | 305,164 |
Noble Energy, Inc. | 12,400 | | 949,096 |
Norfolk Southern Corp. | 5,500 | | 284,075 |
NRG Energy, Inc. (a) | 18,000 | | 821,880 |
Sears Holdings Corp. (a)(e) | 6,000 | | 808,740 |
Synthes, Inc. | 7,232 | | 902,829 |
The Chubb Corp. | 14,200 | | 757,570 |
The Walt Disney Co. | 18,300 | | 633,729 |
UnitedHealth Group, Inc. | 3,720 | | 182,838 |
Valero Energy Corp. | 14,700 | | 1,035,321 |
VCA Antech, Inc. (a) | 11,400 | | 524,970 |
Virgin Media, Inc. | 27,551 | | 609,153 |
Wells Fargo & Co. | 15,600 | | 530,556 |
Williams Partners LP | 7,200 | | 329,400 |
TOTAL UNITED STATES OF AMERICA | | 20,371,635 |
TOTAL COMMON STOCKS (Cost $37,954,495) | 43,671,564 |
Preferred Stocks - 1.4% |
| Shares | | Value |
Convertible Preferred Stocks - 0.4% |
United States of America - 0.4% |
Freeport-McMoRan Copper & Gold, Inc. 6.75% | 1,200 | | $ 204,791 |
Nonconvertible Preferred Stocks - 1.0% |
Italy - 1.0% |
Istituto Finanziario Industriale SpA (IFI) (a) | 11,400 | | 474,679 |
TOTAL PREFERRED STOCKS (Cost $637,636) | 679,470 |
Government Obligations - 2.7% |
| Principal
Amount (d) | | |
Japan - 2.1% |
Japan Government 0.5953% to 0.6503% 11/5/07 to 1/21/08 | JPY | $ 120,000,000 | | 1,039,684 |
Switzerland - 0.6% |
Switzerland Confederation 4.25% 1/8/08 | CHF | 312,000 | | 270,195 |
TOTAL GOVERNMENT OBLIGATIONS (Cost $1,271,383) | 1,309,879 |
Money Market Funds - 7.8% |
| Shares | | |
Fidelity Cash Central Fund, 4.97% (b) | 2,987,851 | | 2,987,851 |
Fidelity Securities Lending Cash Central Fund, 5.02% (b)(c) | 817,150 | | 817,150 |
TOTAL MONEY MARKET FUNDS (Cost $3,805,001) | | 3,805,001 |
TOTAL INVESTMENT PORTFOLIO - 101.2% (Cost $43,668,515) | | 49,465,914 |
NET OTHER ASSETS - 1.2% | | (571,198) |
NET ASSETS - 100% | $ 48,894,716 |
Forward Foreign Currency Contracts |
| Settlement Dates | | Value | | Unrealized Appreciation/
(Depreciation) |
Contracts to Buy |
64,013 AUD | Nov. 2007 | | $ 59,574 | | $ 1,751 |
67,840 CHF | Nov. 2007 | | 58,631 | | 984 |
242,870 EUR | Nov. 2007 | | 351,958 | | 6,161 |
113,249 GBP | Nov. 2007 | | 235,339 | | 4,602 |
27,104,661 JPY | Nov. 2007 | | 235,412 | | 4,063 |
| | $ 940,914 | | $ 17,561 |
|
(Payable Amount $923,353) |
|
The value of contracts to buy as a percentage of net assets - 1.9% |
Currency Abbreviations |
AUD | - | Australian dollar |
CHF | - | Swiss franc |
EUR | - | European Monetary Unit |
GBP | - | British pound |
JPY | - | Japanese yen |
Legend |
(a) Non-income producing |
(b) Affiliated fund that is available only to investment companies and other accounts managed by Fidelity Investments. The rate quoted is the annualized seven-day yield of the fund at period end. A complete unaudited listing of the fund's holdings as of its most recent quarter end is available upon request. |
(c) Investment made with cash collateral received from securities on loan. |
(d) Principal amount is stated in United States dollars unless otherwise noted. |
(e) Security or a portion of the security is on loan at period end. |
(f) Security exempt from registration under Rule 144A of the Securities Act of 1933. These securities may be resold in transactions exempt from registration, normally to qualified institutional buyers. At the end of the period, the value of these securities amounted to $770,391 or 1.6% of net assets. |
Affiliated Central Funds |
Information regarding fiscal year to date income earned by the Fund from investments in Fidelity Central Funds is as follows: |
Fund | Income earned |
Fidelity Cash Central Fund | $ 136,672 |
Fidelity Securities Lending Cash Central Fund | 14,515 |
Total | $ 151,187 |
See accompanying notes which are an integral part of the financial statements.
Annual Report
Financial Statements
Statement of Assets and Liabilities
Assets | | October 31, 2007 |
Investment in securities, at value (including securities loaned of $795,261) - See accompanying schedule: Unaffiliated issuers (cost $39,863,514) | $ 45,660,913 | |
Fidelity Central Funds (cost $3,805,001) | 3,805,001 | |
Total Investments (cost $43,668,515) | | $ 49,465,914 |
Receivable for investments sold | | 558,379 |
Unrealized appreciation on foreign currency contracts | | 17,561 |
Receivable for closed foreign currency contracts | | 5,520 |
Receivable for fund shares sold | | 90,070 |
Dividends receivable | | 45,870 |
Interest receivable | | 9,285 |
Distributions receivable from Fidelity Central Funds | | 13,617 |
Prepaid expenses | | 25 |
Receivable from investment adviser for expense reductions | | 50,771 |
Other receivables | | 2,848 |
Total assets | | 50,259,860 |
| | |
Liabilities | | |
Payable to custodian bank | $ 41,899 | |
Payable for investments purchased | 237,532 | |
Payable for fund shares redeemed | 91,749 | |
Accrued management fee | 28,080 | |
Distribution fees payable | 20,362 | |
Other affiliated payables | 13,310 | |
Other payables and accrued expenses | 115,062 | |
Collateral on securities loaned, at value | 817,150 | |
Total liabilities | | 1,365,144 |
| | |
Net Assets | | $ 48,894,716 |
Net Assets consist of: | | |
Paid in capital | | $ 37,588,494 |
Undistributed net investment income | | 12,210 |
Accumulated undistributed net realized gain (loss) on investments and foreign currency transactions | | 5,483,707 |
Net unrealized appreciation (depreciation) on investments and assets and liabilities in foreign currencies | | 5,810,305 |
Net Assets | | $ 48,894,716 |
See accompanying notes which are an integral part of the financial statements.
Annual Report
Financial Statements - continued
Statement of Assets and Liabilities - continued
| October 31, 2007 |
Calculation of Maximum Offering Price
Class A:
Net Asset Value and redemption price per share ($13,999,515 ÷ 910,041 shares) | | $ 15.38 |
| | |
Maximum offering price per share (100/94.25 of $15.38) | | $ 16.32 |
Class T:
Net Asset Value and redemption price per share ($22,038,594 ÷ 1,464,065 shares) | | $ 15.05 |
| | |
Maximum offering price per share (100/96.50 of $15.05) | | $ 15.60 |
Class B:
Net Asset Value and offering price per share ($5,028,792 ÷ 350,625 shares)A | | $ 14.34 |
| | |
Class C:
Net Asset Value and offering price per share ($5,351,666 ÷ 372,668 shares)A | | $ 14.36 |
| | |
Institutional Class:
Net Asset Value, offering price and redemption price per share ($2,476,149 ÷ 157,134 shares) | | $ 15.76 |
A Redemption price per share is equal to net asset value less any applicable contingent deferred sales charge.
See accompanying notes which are an integral part of the financial statements.
Annual Report
Statement of Operations
| Year ended October 31, 2007 |
Investment Income | | |
Dividends | | $ 624,693 |
Interest | | 7,374 |
Income from Fidelity Central Funds | | 151,187 |
| | 783,254 |
Less foreign taxes withheld | | (36,322) |
Total income | | 746,932 |
| | |
Expenses | | |
Management fee | $ 350,569 | |
Transfer agent fees | 156,724 | |
Distribution fees | 257,629 | |
Accounting and security lending fees | 27,239 | |
Custodian fees and expenses | 48,715 | |
Independent trustees' compensation | 170 | |
Registration fees | 58,713 | |
Audit | 60,227 | |
Legal | 4,507 | |
Proxy Fees | 66,160 | |
Miscellaneous | 449 | |
Total expenses before reductions | 1,031,102 | |
Expense reductions | (179,298) | 851,804 |
Net investment income (loss) | | (104,872) |
Realized and Unrealized Gain (Loss) Net realized gain (loss) on: | | |
Investment securities: | | |
Unaffiliated issuers (net of foreign taxes of $9,231) | 5,779,710 | |
Foreign currency transactions | 56,677 | |
Total net realized gain (loss) | | 5,836,387 |
Change in net unrealized appreciation (depreciation) on: Investment securities (net of increase in deferred foreign taxes of $6,193) | 3,360,081 | |
Assets and liabilities in foreign currencies | 18,201 | |
Total change in net unrealized appreciation (depreciation) | | 3,378,282 |
Net gain (loss) | | 9,214,669 |
Net increase (decrease) in net assets resulting from operations | | $ 9,109,797 |
See accompanying notes which are an integral part of the financial statements.
Annual Report
Financial Statements - continued
Statement of Changes in Net Assets
| Year ended
October 31,
2007 | Year ended
October 31,
2006 |
Increase (Decrease) in Net Assets | | |
Operations | | |
Net investment income (loss) | $ (104,872) | $ (129,151) |
Net realized gain (loss) | 5,836,387 | 10,213,621 |
Change in net unrealized appreciation (depreciation) | 3,378,282 | (5,808,262) |
Net increase (decrease) in net assets resulting
from operations | 9,109,797 | 4,276,208 |
Distributions to shareholders from net investment income | - | (48,426) |
Distributions to shareholders from net realized gain | (7,528,976) | (68,744) |
Total distributions | (7,528,976) | (117,170) |
Share transactions - net increase (decrease) | (4,022,385) | (5,374,003) |
Redemption fees | 1,520 | 2,963 |
Total increase (decrease) in net assets | (2,440,044) | (1,212,002) |
| | |
Net Assets | | |
Beginning of period | 51,334,760 | 52,546,762 |
End of period (including undistributed net investment income of $12,210 and undistributed net investment income of $0, respectively) | $ 48,894,716 | $ 51,334,760 |
See accompanying notes which are an integral part of the financial statements.
Annual Report
Financial Highlights - Class A
Years ended October 31, | 2007 | 2006 | 2005 | 2004 | 2003 |
Selected Per-Share Data | | | | | |
Net asset value, beginning of period | $ 14.83 | $ 13.68 | $ 11.88 | $ 10.73 | $ 8.62 |
Income from Investment Operations | | | | | |
Net investment income (loss) C | .01 | .01 | .05 | (.04) | (.02) |
Net realized and unrealized gain (loss) | 2.69 | 1.20 | 1.75 | 1.19 | 2.13 |
Total from investment operations | 2.70 | 1.21 | 1.80 | 1.15 | 2.11 |
Distributions from net investment income | - | (.04) | - | - | - |
Distributions from net realized gain | (2.15) | (.02) | - | - | - |
Total distributions | (2.15) | (.06) | - | - | - |
Redemption fees added to paid in capital C | - G | - G | - G | - G | - |
Net asset value, end of period | $ 15.38 | $ 14.83 | $ 13.68 | $ 11.88 | $ 10.73 |
Total Return A, B | 20.55% | 8.86% | 15.15% | 10.72% | 24.48% |
Ratios to Average Net Assets D, F | | | | | |
Expenses before reductions | 1.81% | 1.69% | 1.76% | 1.97% | 2.25% |
Expenses net of fee waivers, if any | 1.50% | 1.50% | 1.56% | 1.75% | 1.76% |
Expenses net of all reductions | 1.45% | 1.46% | 1.54% | 1.72% | 1.73% |
Net investment income (loss) | .06% | .06% | .39% | (.33)% | (.27)% |
Supplemental Data | | | | | |
Net assets, end of period (000 omitted) | $ 14,000 | $ 10,956 | $ 10,101 | $ 8,450 | $ 4,436 |
Portfolio turnover rate E | 102% | 251% | 52% | 59% | 53% |
A Total returns would have been lower had certain expenses not been reduced during the periods shown.
B Total returns do not include the effect of the sales charges.
C Calculated based on average shares outstanding during the period.
D Fees and expenses of the underlying Fidelity Central Funds are not included in the Fund's expense ratio. The Fund indirectly bears its proportionate share of the expenses of any underlying Fidelity Central Funds.
E Amount does not include the portfolio activity of any underlying Fidelity Central Funds.
F Expense ratios reflect operating expenses of the class. Expenses before reductions do not reflect amounts reimbursed by the investment adviser or reductions from brokerage service arrangements or other expense offset arrangements and do not represent the amount paid by the class during periods when reimbursements or reductions occur. Expenses net of fee waivers reflect expenses after reimbursement by the investment adviser but prior to reductions from brokerage service arrangements or other expense offset arrangements. Expenses net of all reductions represent the net expenses paid by the class.
G Amount represents less than $.01 per share.
See accompanying notes which are an integral part of the financial statements.
Annual Report
Financial Highlights - Class T
Years ended October 31, | 2007 | 2006 | 2005 | 2004 | 2003 |
Selected Per-Share Data | | | | | |
Net asset value, beginning of period | $ 14.59 | $ 13.46 | $ 11.71 | $ 10.61 | $ 8.54 |
Income from Investment Operations | | | | | |
Net investment income (loss) C | (.03) | (.03) | .02 | (.07) | (.05) |
Net realized and unrealized gain (loss) | 2.64 | 1.19 | 1.73 | 1.17 | 2.12 |
Total from investment operations | 2.61 | 1.16 | 1.75 | 1.10 | 2.07 |
Distributions from net investment income | - | (.01) | - | - | - |
Distributions from net realized gain | (2.15) | (.02) | - | - | - |
Total distributions | (2.15) | (.03) | - | - | - |
Redemption fees added to paid in capital C | - G | -G | -G | -G | - |
Net asset value, end of period | $ 15.05 | $ 14.59 | $ 13.46 | $ 11.71 | $ 10.61 |
Total Return A, B | 20.24% | 8.62% | 14.94% | 10.37% | 24.24% |
Ratios to Average Net Assets D, F | | | | | |
Expenses before reductions | 2.08% | 1.99% | 2.09% | 2.39% | 2.65% |
Expenses net of fee waivers, if any | 1.75% | 1.75% | 1.81% | 2.00% | 2.01% |
Expenses net of all reductions | 1.71% | 1.71% | 1.79% | 1.97% | 1.98% |
Net investment income (loss) | (.19)% | (.19)% | .14% | (.58)% | (.52)% |
Supplemental Data | | | | | |
Net assets, end of period (000 omitted) | $ 22,039 | $ 26,780 | $ 28,786 | $ 20,966 | $ 17,334 |
Portfolio turnover rate E | 102% | 251% | 52% | 59% | 53% |
A Total returns would have been lower had certain expenses not been reduced during the periods shown.
B Total returns do not include the effect of the sales charges.
C Calculated based on average shares outstanding during the period.
D Fees and expenses of the underlying Fidelity Central Funds are not included in the Fund's expense ratio. The Fund indirectly bears its proportionate share of the expenses of any underlying Fidelity Central Funds.
E Amount does not include the portfolio activity of any underlying Fidelity Central Funds.
F Expense ratios reflect operating expenses of the class. Expenses before reductions do not reflect amounts reimbursed by the investment adviser or reductions from brokerage service arrangements or other expense offset arrangements and do not represent the amount paid by the class during periods when reimbursements or reductions occur. Expenses net of fee waivers reflect expenses after reimbursement by the investment adviser but prior to reductions from brokerage service arrangements or other expense offset arrangements. Expenses net of all reductions represent the net expenses paid by the class.
G Amount represents less than $.01 per share.
See accompanying notes which are an integral part of the financial statements.
Annual Report
Financial Highlights - Class B
Years ended October 31, | 2007 | 2006 | 2005 | 2004 | 2003 |
Selected Per-Share Data | | | | | |
Net asset value, beginning of period | $ 14.06 | $ 13.01 | $ 11.38 | $ 10.36 | $ 8.38 |
Income from Investment Operations | | | | | |
Net investment income (loss) C | (.09) | (.10) | (.04) | (.12) | (.09) |
Net realized and unrealized gain (loss) | 2.52 | 1.15 | 1.67 | 1.14 | 2.07 |
Total from investment operations | 2.43 | 1.05 | 1.63 | 1.02 | 1.98 |
Distributions from net realized gain | (2.15) | - | - | - | - |
Total distributions | (2.15) | - | - | - | - |
Redemption fees added to paid in capital C | - G | - G | - G | - G | - |
Net asset value, end of period | $ 14.34 | $ 14.06 | $ 13.01 | $ 11.38 | $ 10.36 |
Total Return A, B | 19.65% | 8.07% | 14.32% | 9.85% | 23.63% |
Ratios to Average Net Assets D, F | | | | | |
Expenses before reductions | 2.57% | 2.52% | 2.61% | 3.00% | 3.25% |
Expenses net of fee waivers, if any | 2.25% | 2.25% | 2.31% | 2.50% | 2.50% |
Expenses net of all reductions | 2.20% | 2.22% | 2.29% | 2.47% | 2.47% |
Net investment income (loss) | (.69)% | (.69)% | (.36)% | (1.08)% | (1.01)% |
Supplemental Data | | | | | |
Net assets, end of period (000 omitted) | $ 5,029 | $ 5,788 | $ 6,464 | $ 5,575 | $ 4,918 |
Portfolio turnover rate E | 102% | 251% | 52% | 59% | 53% |
A Total returns would have been lower had certain expenses not been reduced during the periods shown.
B Total returns do not include the effect of the contingent deferred sales charge.
C Calculated based on average shares outstanding during the period.
D Fees and expenses of the underlying Fidelity Central Funds are not included in the Fund's expense ratio. The Fund indirectly bears its proportionate share of the expenses of any underlying Fidelity Central Funds.
E Amount does not include the portfolio activity of any underlying Fidelity Central Funds.
F Expense ratios reflect operating expenses of the class. Expenses before reductions do not reflect amounts reimbursed by the investment adviser or reductions from brokerage service arrangements or other expense offset arrangements and do not represent the amount paid by the class during periods when reimbursements or reductions occur. Expenses net of fee waivers reflect expenses after reimbursement by the investment adviser but prior to reductions from brokerage service arrangements or other expense offset arrangements. Expenses net of all reductions represent the net expenses paid by the class.
G Amount represents less than $.01 per share.
See accompanying notes which are an integral part of the financial statements.
Annual Report
Financial Highlights - Class C
Years ended October 31, | 2007 | 2006 | 2005 | 2004 | 2003 |
Selected Per-Share Data | | | | | |
Net asset value, beginning of period | $ 14.08 | $ 13.02 | $ 11.39 | $ 10.38 | $ 8.39 |
Income from Investment Operations | | | | | |
Net investment income (loss) C | (.09) | (.10) | (.05) | (.12) | (.09) |
Net realized and unrealized gain (loss) | 2.52 | 1.16 | 1.68 | 1.13 | 2.08 |
Total from investment operations | 2.43 | 1.06 | 1.63 | 1.01 | 1.99 |
Distributions from net realized gain | (2.15) | - | - | - | - |
Total distributions | (2.15) | - | - | - | - |
Redemption fees added to paid in capital C | - G | - G | - G | -G | - |
Net asset value, end of period | $ 14.36 | $ 14.08 | $ 13.02 | $ 11.39 | $ 10.38 |
Total Return A, B | 19.62% | 8.14% | 14.31% | 9.73% | 23.72% |
Ratios to Average Net Assets D, F | | | | | |
Expenses before reductions | 2.57% | 2.50% | 2.59% | 2.87% | 3.10% |
Expenses net of fee waivers, if any | 2.25% | 2.25% | 2.31% | 2.50% | 2.50% |
Expenses net of all reductions | 2.20% | 2.21% | 2.29% | 2.47% | 2.47% |
Net investment income (loss) | (.69)% | (.69)% | (.36)% | (1.08)% | (1.01)% |
Supplemental Data | | | | | |
Net assets, end of period (000 omitted) | $ 5,352 | $ 5,348 | $ 5,396 | $ 3,959 | $ 3,190 |
Portfolio turnover rate E | 102% | 251% | 52% | 59% | 53% |
A Total returns would have been lower had certain expenses not been reduced during the periods shown.
B Total returns do not include the effect of the contingent deferred sales charge.
C Calculated based on average shares outstanding during the period.
D Fees and expenses of the underlying Fidelity Central Funds are not included in the Fund's expense ratio. The Fund indirectly bears its proportionate share of the expenses of any underlying Fidelity Central Funds.
E Amount does not include the portfolio activity of any underlying Fidelity Central Funds.
F Expense ratios reflect operating expenses of the class. Expenses before reductions do not reflect amounts reimbursed by the investment adviser or reductions from brokerage service arrangements or other expense offset arrangements and do not represent the amount paid by the class during periods when reimbursements or reductions occur. Expenses net of fee waivers reflect expenses after reimbursement by the investment adviser but prior to reductions from brokerage service arrangements or other expense offset arrangements. Expenses net of all reductions represent the net expenses paid by the class.
G Amount represents less than $.01 per share.
See accompanying notes which are an integral part of the financial statements.
Annual Report
Financial Highlights - Institutional Class
Years ended October 31, | 2007 | 2006 | 2005 | 2004 | 2003 |
Selected Per-Share Data | | | | | |
Net asset value, beginning of period | $ 15.11 | $ 13.93 | $ 12.06 | $ 10.88 | $ 8.68 |
Income from Investment Operations | | | | | |
Net investment income (loss) B | .05 | .05 | .09 | (.01) | - |
Net realized and unrealized gain (loss) | 2.75 | 1.22 | 1.78 | 1.19 | 2.20 |
Total from investment operations | 2.80 | 1.27 | 1.87 | 1.18 | 2.20 |
Distributions from net investment income | - | (.07) | - | - | - |
Distributions from net realized gain | (2.15) | (.02) | - | - | - |
Total distributions | (2.15) | (.09) | - | - | - |
Redemption fees added to paid in capital B | - F | - F | - F | - F | - |
Net asset value, end of period | $ 15.76 | $ 15.11 | $ 13.93 | $ 12.06 | $ 10.88 |
Total Return A | 20.88% | 9.15% | 15.51% | 10.85% | 25.35% |
Ratios to Average Net Assets C, E | | | | | |
Expenses before reductions | 1.43% | 1.29% | 1.42% | 1.55% | 1.87% |
Expenses net of fee waivers, if any | 1.25% | 1.25% | 1.31% | 1.50% | 1.50% |
Expenses net of all reductions | 1.20% | 1.21% | 1.29% | 1.47% | 1.48% |
Net investment income (loss) | .31% | .31% | .64% | (.08)% | (.01)% |
Supplemental Data | | | | | |
Net assets, end of period (000 omitted) | $ 2,476 | $ 2,464 | $ 1,800 | $ 1,187 | $ 175 |
Portfolio turnover rate D | 102% | 251% | 52% | 59% | 53% |
A Total returns would have been lower had certain expenses not been reduced during the periods shown.
B Calculated based on average shares outstanding during the period.
C Fees and expenses of the underlying Fidelity Central Funds are not included in the Fund's expense ratio. The Fund indirectly bears its proportionate share of the expenses of any underlying Fidelity Central Funds.
D Amount does not include the portfolio activity of any underlying Fidelity Central Funds.
E Expense ratios reflect operating expenses of the class. Expenses before reductions do not reflect amounts reimbursed by the investment adviser or reductions from brokerage service arrangements or other expense offset arrangements and do not represent the amount paid by the class during periods when reimbursements or reductions occur. Expenses net of fee waivers reflect expenses after reimbursement by the investment adviser but prior to reductions from brokerage service arrangements or other expense offset arrangements. Expenses net of all reductions represent the net expenses paid by the class.
F Amount represents less than $.01 per share.
See accompanying notes which are an integral part of the financial statements.
Annual Report
Notes to Financial Statements
For the period ended October 31, 2007
1. Organization.
Fidelity Advisor Global Capital Appreciation Fund (the Fund) is a fund of Fidelity Advisor Series VIII (the trust) and is authorized to issue an unlimited number of shares. The trust is registered under the Investment Company Act of 1940, as amended (the 1940 Act), as an open-end management investment company organized as a Massachusetts business trust. The Fund offers Class A, Class T, Class B, Class C, and Institutional Class shares, each of which has equal rights as to assets and voting privileges. Each class has exclusive voting rights with respect to matters that affect that class. Class B shares will automatically convert to Class A shares after a holding period of seven years from the initial date of purchase. Investment income, realized and unrealized capital gains and losses, the common expenses of the Fund, and certain fund-level expense reductions, if any, are allocated on a pro rata basis to each class based on the relative net assets of each class to the total net assets of the Fund. Each class differs with respect to transfer agent and distribution and service plan fees incurred. Certain expense reductions also differ by class.
2. Investments in Fidelity Central Funds.
The Fund may invest in Fidelity Central Funds, which are open-end investment companies available only to other investment companies and accounts managed by Fidelity Management & Research Company (FMR) and its affiliates. The Fund's Schedule of Investments lists each of the Fidelity Central Funds as an investment of the Fund, but does not include the underlying holdings of each Fidelity Central Fund. As an Investing Fund, the Fund indirectly bears its proportionate share of the expenses of the underlying Fidelity Central Funds.
The Money Market Central Funds seek preservation of capital and current income and are managed by Fidelity Investments Money Management, Inc. (FIMM), an affiliate of FMR.
A complete list of holdings for each Fidelity Central Fund is available upon request or at the SEC's web site at www.sec.gov. In addition, the financial statements of the Fidelity Central Funds are available on the SEC's web site or upon request.
3. Significant Accounting Policies.
The financial statements have been prepared in conformity with accounting principles generally accepted in the United States of America, which require management to make certain estimates and assumptions at the date of the financial statements. The following summarizes the significant accounting policies of the Fund:
Security Valuation. Investments are valued and net asset value (NAV) per share is calculated (NAV calculation) as of the close of business of the New York Stock Exchange
Annual Report
3. Significant Accounting Policies - continued
Security Valuation - continued
(NYSE), normally 4:00 p.m. Eastern time. Wherever possible, the Fund uses independent pricing services approved by the Board of Trustees to value its investments.
Equity securities, including restricted securities, for which market quotations are readily available, are valued at the last reported sale price or official closing price as reported by an independent pricing service on the primary market or exchange on which they are traded. In the event there were no sales during the day or closing prices are not available, securities are valued at the last quoted bid price. Debt securities, including restricted securities, for which quotations are readily available, are valued by independent pricing services or by dealers who make markets in such securities. Pricing services consider yield or price of bonds of comparable quality, coupon, maturity and type as well as dealer supplied prices. Investments in open-end mutual funds, including the Fidelity Central Funds, are valued at their closing net asset value each business day. Short-term securities with remaining maturities of sixty days or less for which quotations are not readily available are valued at amortized cost, which approximates value.
When current market prices or quotations are not readily available or do not accurately reflect fair value, valuations may be determined in accordance with procedures adopted by the Board of Trustees. For example, when developments occur between the close of a market and the close of the NYSE that may materially affect the value of some or all of the securities, or when trading in a security is halted, those securities may be fair valued. Factors used in the determination of fair value may include monitoring news to identify significant market or security specific events such as changes in the value of U.S. securities markets, reviewing developments in foreign markets and evaluating the performance of ADRs, futures contracts and exchange-traded funds. Because the Fund's utilization of fair value pricing depends on market activity, the frequency with which fair value pricing is used cannot be predicted and may be utilized to a significant extent. The value of securities used for NAV calculation under fair value pricing may differ from published prices for the same securities.
Foreign Currency. The Fund uses foreign currency contracts to facilitate transactions in foreign-denominated securities. Losses from these transactions may arise from changes in the value of the foreign currency or if the counterparties do not perform under the contracts' terms.
Foreign-denominated assets, including investment securities, and liabilities are translated into U.S. dollars at the exchange rate at period end. Purchases and sales of investment securities, income and dividends received and expenses denominated in foreign currencies are translated into U.S. dollars at the exchange rate in effect on the transaction date.
Annual Report
Notes to Financial Statements - continued
3. Significant Accounting Policies - continued
Foreign Currency - continued
The effects of exchange rate fluctuations on investments are included with the net realized and unrealized gain (loss) on investment securities. Other foreign currency transactions resulting in realized and unrealized gain (loss) are disclosed separately.
Investment Transactions and Income. For financial reporting purposes, the Fund's investment holdings and NAV include trades executed through the end of the last business day of the period. The NAV for processing shareholder transactions includes trades executed through the end of the prior business day. Gains and losses on securities sold are determined on the basis of identified cost and may include proceeds received from litigation. Dividend income is recorded on the ex-dividend date, except for certain dividends from foreign securities where the ex-dividend date may have passed, which are recorded as soon as the Fund is informed of the ex-dividend date. Non-cash dividends included in dividend income, if any, are recorded at the fair market value of the securities received. Distributions received on securities that represent a return of capital or capital gain are recorded as a reduction of cost of investments and/or as a realized gain. The Fund estimates the components of distributions received that may be considered return of capital distributions or capital gain distributions. Interest income and income distributions from the Fidelity Central Funds are accrued as earned. Interest income includes coupon interest and amortization of premium and accretion of discount on debt securities. Investment income is recorded net of foreign taxes withheld where recovery of such taxes is uncertain.
Expenses. Most expenses of the trust can be directly attributed to a fund. Expenses which cannot be directly attributed are apportioned among each Fund in the trust. Expense estimates are accrued in the period to which they relate and adjustments are made when actual amounts are known.
Income Tax Information and Distributions to Shareholders. Each year, the Fund intends to qualify as a regulated investment company by distributing all of its taxable income and realized gains under Subchapter M of the Internal Revenue Code. As a result, no provision for income taxes is required in the accompanying financial statements. Foreign taxes are provided for based on the Fund's understanding of the tax rules and rates that exist in the foreign markets in which it invests.
Distributions are recorded on the ex-dividend date. Income dividends and capital gain distributions are declared separately for each class. Income and capital gain distributions are determined in accordance with income tax regulations, which may differ from generally accepted accounting principles. In addition, the Fund will claim a portion of the payment made to redeeming shareholders as a distribution for income tax purposes.
Annual Report
3. Significant Accounting Policies - continued
Income Tax Information and Distributions to Shareholders - continued
Capital accounts within the financial statements are adjusted for permanent book-tax differences. Certain adjustments have been made to the accounts of prior periods. Collectively, these adjustments have no impact on net assets or the results of operations. Temporary book-tax differences will reverse in a subsequent period.
Book-tax differences are primarily due to foreign currency transactions, passive foreign investment companies (PFIC), market discount, partnerships, certain foreign taxes and losses deferred due to wash sales.
The tax-basis components of distributable earnings and the federal tax cost as of period end were as follows:
Unrealized appreciation | $ 7,175,946 |
Unrealized depreciation | (2,336,575) |
Net unrealized appreciation (depreciation) | 4,839,371 |
Undistributed ordinary income | 4,438,957 |
Undistributed long-term capital gain | 1,180,989 |
| |
| |
Cost for federal income tax purposes | $ 44,626,543 |
The tax character of distributions paid was as follows:
| October 31, 2007 | October 31, 2006 |
Ordinary Income | $ - | $ 117,170 |
Long-term Capital Gains | 7,528,976 | - |
Total | $ 7,528,976 | $ 117,170 |
Short-Term Trading (Redemption) Fees. Shares held in the Fund less than 30 days are subject to a redemption fee equal to 1.00% of the proceeds of the redeemed shares. All redemption fees, including any estimated redemption fees paid by FMR, are retained by the Fund and accounted for as an addition to paid in capital.
New Accounting Pronouncements. In July 2006, Financial Accounting Standards Board Interpretation No. 48, Accounting for Uncertainty in Income Taxes - an interpretation of FASB Statement 109 (FIN 48), was issued and is effective on the last business day of the semiannual reporting period for fiscal years beginning after December 15, 2006. FIN 48 sets forth a threshold for financial statement recognition, measurement and disclosure of a tax position taken or expected to be taken on a tax return. Management has concluded that the adoption of FIN 48 will not result in a material impact on the Fund's net assets, results of operations and financial statement disclosures.
Annual Report
Notes to Financial Statements - continued
3. Significant Accounting Policies - continued
New Accounting Pronouncements - continued
In addition, in September 2006, Statement of Financial Accounting Standards No. 157, Fair Value Measurements (SFAS 157), was issued and is effective for fiscal years beginning after November 15, 2007. SFAS 157 defines fair value, establishes a framework for measuring fair value and expands disclosures about fair value measurements. Management is currently evaluating the impact the adoption of SFAS 157 will have on the Fund's financial statement disclosures.
4. Operating Policies.
Forward Foreign Currency Contracts. The Fund generally uses foreign currency contracts to facilitate transactions in foreign-denominated securities and to manage the Fund's currency exposure. Contracts to sell generally are used to hedge the Fund's investments against currency fluctuations, while contracts to buy generally are used to offset a previous contract to sell. Also, a contract to buy can be used to acquire exposure to foreign currencies and a contract to sell can be used to offset a previous contract to buy. These contracts involve market risk in excess of the unrealized gain or loss reflected in the Fund's Statement of Assets and Liabilities. The U.S. dollar value of the currencies the Fund has committed to buy or sell is shown in the Schedule of Investments under the caption "Forward Foreign Currency Contracts." This amount represents the aggregate exposure to each currency the Fund has acquired or hedged through currency contracts at period end. Losses may arise from changes in the value of foreign currency or if the counterparties do not perform under the contracts' terms.
The U.S. dollar value of forward foreign currency contracts is determined using forward currency exchange rates supplied by a quotation service. Purchases and sales of forward foreign currency contracts having the same settlement date and broker are offset and any realized gain (loss) recognized on the date of offset: otherwise, gain (loss) is recognized on settlement date. Contracts that have been offset with different counterparties are reflected as both a contract to buy and a contract to sell in the Schedule of Investments under the caption "Forward Foreign Currency Contracts."
Repurchase Agreements. FMR has received an Exemptive Order from the Securities and Exchange Commission (the SEC) which permits the Fund and other affiliated entities of FMR to transfer uninvested cash balances into joint trading accounts which are then invested in repurchase agreements. The Fund may also invest directly with institutions in repurchase agreements. Repurchase agreements are collateralized by government or non-government securities. Upon settlement date, collateral is held in segregated accounts with custodian banks and may be obtained in the event of a default of the counterparty. The Fund monitors, on a daily basis, the value of the collateral to ensure it is at least equal to the principal amount of the repurchase agreement
Annual Report
4. Operating Policies - continued
Repurchase Agreements - continued
(including accrued interest). In the event of a default by the counterparty, realization of the collateral proceeds could be delayed, during which time the value of the collateral may decline.
Restricted Securities. The Fund may invest in securities that are subject to legal or contractual restrictions on resale. These securities generally may be resold in transactions exempt from registration or to the public if the securities are registered. Disposal of these securities may involve time-consuming negotiations and expense, and prompt sale at an acceptable price may be difficult. Information regarding restricted securities is included at the end of the Fund's Schedule of Investments.
5. Purchases and Sales of Investments.
Purchases and sales of securities, other than short-term securities, aggregated $47,258,803 and $60,696,048, respectively.
6. Fees and Other Transactions with Affiliates.
Management Fee. FMR and its affiliates provide the Fund with investment management related services for which the Fund pays a monthly management fee. The management fee is the sum of an individual fund fee rate that is based on an annual rate of .45% of the Fund's average net assets and a group fee rate that averaged ..26% during the period. The group fee rate is based upon the average net assets of all the mutual funds advised by FMR. The group fee rate decreases as assets under management increase and increases as assets under management decrease.
In addition, on June 20, 2007, shareholders approved a new management contract which adds a performance adjustment to the management fee (up to a maximum of ..20% of the Fund's average net assets over a 36 month performance period). The upward or downward adjustment to the management fee is based on the relative investment performance of the Fund's Institutional Class as compared to an appropriate benchmark index. The Fund's performance period began on July 1, 2007. The performance adjustment will take effect starting with the twelfth month of the performance period (June, 2008). Subsequent months will be added until the performance period includes 36 months.
For the period, the total annual management fee rate was .71% of the Fund's average net assets.
Annual Report
Notes to Financial Statements - continued
6. Fees and Other Transactions with Affiliates - continued
Distribution and Service Plan. In accordance with Rule 12b-1 of the 1940 Act, the Fund has adopted separate Distribution and Service Plans for each class of shares. Certain classes pay Fidelity Distributors Corporation (FDC), an affiliate of FMR, separate Distribution and Service Fees, each of which is based on an annual percentage ofeach class' average net assets. In addition, FDC may pay financial intermediaries for selling shares of the Fund and providing shareholder support services. For the period, the Distribution and Service Fee rates and the total amounts paid to and retained by FDC were as follows:
| Distribution
Fee | Service
Fee | Paid to
FDC | Retained
by FDC |
Class A | 0% | .25% | $ 30,470 | $ 2,536 |
Class T | .25% | .25% | 120,948 | 122 |
Class B | .75% | .25% | 53,122 | 39,851 |
Class C | .75% | .25% | 53,089 | 6,517 |
| | | $ 257,629 | $ 49,026 |
Sales Load. FDC receives a front-end sales charge of up to 5.75% for selling Class A shares, and 3.50% for selling Class T shares, some of which is paid to financial intermediaries for selling shares of the Fund. FDC receives the proceeds of contingent deferred sales charges levied on Class A, Class T, Class B, and Class C redemptions. These charges depend on the holding period. The deferred sales charges range from 5% to 1% for Class B, 1% for Class C, 1.00% to .50% for certain purchases of Class A shares and .25% for certain purchases of Class T shares.
For the period, sales charge amounts retained by FDC were as follows:
| Retained
by FDC |
Class A | $ 6,500 |
Class T | 4,305 |
Class B* | 9,526 |
Class C* | 3,506 |
| $ 23,837 |
* When Class B and Class C shares are initially sold, FDC pays commissions from its own resources to financial intermediaries through which the sales are made.
Transfer Agent Fees. Fidelity Investments Institutional Operations Company, Inc. (FIIOC), an affiliate of FMR, is the transfer, dividend disbursing and shareholder servicing agent for each class of the Fund. FIIOC receives account fees and asset-based fees that vary according to the account size and type of account of the shareholders of the respective classes of the Fund. FIIOC pays for typesetting, printing and mailing of shareholder reports, except proxy statements.
Annual Report
6. Fees and Other Transactions with Affiliates - continued
Transfer Agent Fees - continued
For the period, the total transfer agent fees paid by each class to FIIOC, were as follows:
| Amount | % of
Average
Net Assets |
Class A | $ 38,118 | .31 |
Class T | 80,250 | .33 |
Class B | 17,008 | .32 |
Class C | 17,047 | .32 |
Institutional Class | 4,301 | .18 |
| $ 156,724 | |
Accounting and Security Lending Fees. Fidelity Service Company, Inc. (FSC), an affiliate of FMR, maintains the Fund's accounting records. The accounting fee is based on the level of average net assets for the month. Under a separate contract, FSC administers the security lending program. The security lending fee is based on the number and duration of lending transactions.
Brokerage Commissions. The Fund placed a portion of its portfolio transactions with brokerage firms which are affiliates of the investment adviser. The commissions paid to these affiliated firms were $261 for the period.
7. Committed Line of Credit.
The Fund participates with other funds managed by FMR in a $4.2 billion credit facility (the "line of credit") to be utilized for temporary or emergency purposes to fund shareholder redemptions or for other short-term liquidity purposes. The Fund has agreed to pay commitment fees on its pro rata portion of the line of credit, which amounted to $105 and is reflected in Miscellaneous Expense on the Statement of Operations. During the period, there were no borrowings on this line of credit.
8. Security Lending.
The Fund lends portfolio securities from time to time in order to earn additional income. On the settlement date of the loan, the Fund receives collateral (in the form of U.S. Treasury obligations, letters of credit and/or cash) against the loaned securities and maintains collateral in an amount not less than 100% of the market value of the loaned securities during the period of the loan. The market value of the loaned securities is determined at the close of business of the Fund and any additional required collateral is delivered to the Fund on the next business day. If the borrower defaults on its obligation to return the securities loaned because of insolvency or other reasons, a fund could experience delays and costs in recovering the securities loaned or in gaining access to
Annual Report
Notes to Financial Statements - continued
8. Security Lending - continued
the collateral. Any cash collateral received is invested in the Fidelity Securities Lending Cash Central Fund. Security lending income represents the income earned on investing cash collateral, less fees and expenses associated with the loan, plus any premium payments that may be received on the loan of certain types of securities. Security lending income is presented in the Statement of Operations as a component of income from Fidelity Central Funds. Net income from lending portfolio securities during the period amounted to $14,515.
9. Expense Reductions.
FMR voluntarily agreed to reimburse each class to the extent annual operating expenses exceeded certain levels of average net assets as noted in the table below. Some expenses, for example interest expense, including commitment fees, are excluded from this reimbursement.
The following classes were in reimbursement during the period:
| Expense
Limitations | Reimbursement
from adviser |
| | |
Class A | 1.50% | $ 38,226 |
Class T | 1.75% | 79,562 |
Class B | 2.25% | 17,172 |
Class C | 2.25% | 17,017 |
Institutional Class | 1.25% | 4,317 |
| | $ 156,294 |
Many of the brokers with whom FMR places trades on behalf of the Fund provided services to the Fund in addition to trade execution. These services included payments of certain expenses on behalf of the Fund totaling $22,043 for the period.
10. Other.
The Fund's organizational documents provide former and current trustees and officers with a limited indemnification against liabilities arising in connection with the performance of their duties to the Fund. In the normal course of business, the Fund may also enter into contracts that provide general indemnifications. The Fund's maximum exposure under these arrangements is unknown as this would be dependent on future claims that may be made against the Fund. The risk of material loss from such claims is considered remote.
In September 2006, FIIOC, the Fund's transfer agent, notified the Fund that the Fund's books and records did not reflect a conversion of certain Class B to Class A shares upon
Annual Report
10. Other - continued
their conversion date. In March 2007, FIIOC converted the relevant Class B shares to Class A shares and recorded the conversion in the books and records of the Fund which did not result in a material impact to the Fund's reported net assets or results of operations in the accompanying financial statements. FIIOC has remediated affected shareholders and reimbursed the Fund for all related audit and legal expenses.
The United States Securities and Exchange Commission ("SEC") is conducting an investigation of FMR (covering the years 2002 to 2004) arising from gifts, gratuities and business entertainment provided by certain brokers to certain individuals who were employed on FMR's domestic equity trading desk during that period. FMR is in discussions with the SEC staff regarding the possible resolution of the matter, but as of period-end no final resolution has been reached.
In December 2006, the Independent Trustees completed their own investigation of the matter with the assistance of independent counsel. The Independent Trustees and FMR agree that, despite the absence of proof that the Fidelity mutual funds experienced diminished execution quality as a result of the improper receipt of gifts and business entertainment, the conduct at issue was serious and is worthy of redress. Accordingly, the Independent Trustees have requested and FMR has agreed to pay $42 million to Fidelity mutual funds, plus interest to be determined at the time that payment is made. A method of allocating this payment among the funds has not yet been determined. The total payment to the Fund is not anticipated to have a material impact on the Fund's net assets. In addition, FMR reimbursed related legal expenses which are recorded in the accompanying Statement of Operations as an expense reduction.
11. Distributions to Shareholders.
Distributions to shareholders of each class were as follows:
| Years ended October 31, |
| 2007 | 2006 |
From net investment income | | |
Class A | $ - | $ 27,948 |
Class T | - | 12,729 |
Institutional Class | - | 7,749 |
Total | $ - | $ 48,426 |
From net realized gain | | |
Class A | $ 1,605,953 | $ 17,372 |
Class T | 3,892,392 | 48,789 |
Class B | 859,727 | - |
Class C | 818,416 | - |
Institutional Class | 352,488 | 2,583 |
Total | $ 7,528,976 | $ 68,744 |
Annual Report
Notes to Financial Statements - continued
12. Share Transactions.
Transactions for each class of shares were as follows:
| Shares | Dollars |
| Years ended October 31, | Years ended October 31, |
| 2007 | 2006 | 2007 | 2006 |
Class A | | | | |
Shares sold | 317,426 | 338,926 | $ 4,551,831 | $ 4,991,381 |
Reinvestment of distributions | 117,030 | 3,052 | 1,549,483 | 44,044 |
Shares redeemed | (262,944) | (342,002) | (3,684,586) | (4,955,841) |
Net increase (decrease) | 171,512 | (24) | $ 2,416,728 | $ 79,584 |
Class T | | | | |
Shares sold | 275,123 | 466,972 | $ 3,836,949 | $ 6,780,148 |
Reinvestment of distributions | 296,053 | 4,267 | 3,842,771 | 60,712 |
Shares redeemed | (942,615) | (775,038) | (13,037,243) | (11,207,562) |
Net increase (decrease) | (371,439) | (303,799) | $ (5,357,523) | $ (4,366,702) |
Class B | | | | |
Shares sold | 54,071 | 98,474 | $ 718,841 | $ 1,390,516 |
Reinvestment of distributions | 62,934 | - | 781,643 | - |
Shares redeemed | (178,017) | (183,857) | (2,365,148) | (2,543,722) |
Net increase (decrease) | (61,012) | (85,383) | $ (864,664) | $ (1,153,206) |
Class C | | | | |
Shares sold | 79,702 | 101,868 | $ 1,057,436 | $ 1,419,609 |
Reinvestment of distributions | 60,320 | - | 750,384 | - |
Shares redeemed | (147,310) | (136,265) | (1,939,803) | (1,876,045) |
Net increase (decrease) | (7,288) | (34,397) | $ (131,983) | $ (456,436) |
Institutional Class | | | | |
Shares sold | 10,485 | 74,429 | $ 151,256 | $ 1,122,565 |
Reinvestment of distributions | 13,152 | 587 | 177,952 | 8,618 |
Shares redeemed | (29,545) | (41,218) | (414,151) | (608,426) |
Net increase (decrease) | (5,908) | 33,798 | $ (84,943) | $ 522,757 |
Annual Report
Report of Independent Registered Public Accounting Firm
To the Trustees of Fidelity Advisor Series VIII and the Shareholders of Fidelity Advisor Global Capital Appreciation Fund:
In our opinion, the accompanying statement of assets and liabilities, including the schedule of investments, and the related statements of operations and of changes in net assets and the financial highlights present fairly, in all material respects, the financial position of Fidelity Advisor Global Capital Appreciation Fund (a fund of Fidelity Advisor Series VIII) at October 31, 2007, the results of its operations for the year then ended, the changes in its net assets for each of the two years in the period then ended and the financial highlights for each of the five years in the period then ended, in conformity with accounting principles generally accepted in the United States of America. These financial statements and financial highlights (hereafter referred to as "financial statements") are the responsibility of the Fidelity Advisor Global Capital Appreciation Fund's management. Our responsibility is to express an opinion on these financial statements based on our audits. We conducted our audits of these financial statements in accordance with the standards of the Public Company Accounting Oversight Board (United States). Those standards require that we plan and perform the audit to obtain reasonable assurance about whether the financial statements are free of material misstatement. An audit includes examining, on a test basis, evidence supporting the amounts and disclosures in the financial statements, assessing the accounting principles used and significant estimates made by management, and evaluating the overall financial statement presentation. We believe that our audits, which included confirmation of securities at October 31, 2007 by correspondence with the custodian and brokers, provide a reasonable basis for our opinion.
/s/ PricewaterhouseCoopers LLP
PricewaterhouseCoopers LLP
Boston, Massachusetts
December 20, 2007
Annual Report
Trustees and Officers
The Trustees, Members of the Advisory Board, and executive officers of the trust and fund, as applicable, are listed below. The Board of Trustees governs the fund and is responsible for protecting the interests of shareholders. The Trustees are experienced executives who meet periodically throughout the year to oversee the fund's activities, review contractual arrangements with companies that provide services to the fund, and review the fund's performance. Except for James C. Curvey, each of the Trustees oversees 370 funds advised by FMR or an affiliate. Mr. Curvey oversees 340 funds advised by FMR or an affiliate.
The Trustees hold office without limit in time except that (a) any Trustee may resign; (b) any Trustee may be removed by written instrument, signed by at least two-thirds of the number of Trustees prior to such removal; (c) any Trustee who requests to be retired or who has become incapacitated by illness or injury may be retired by written instrument signed by a majority of the other Trustees; and (d) any Trustee may be removed at any special meeting of shareholders by a two-thirds vote of the outstanding voting securities of the trust. Each Trustee who is not an interested person (as defined in the 1940 Act) (Independent Trustee), shall retire not later than the last day of the calendar year in which his or her 72nd birthday occurs. The Independent Trustees may waive this mandatory retirement age policy with respect to individual Trustees. The executive officers and Advisory Board Members hold office without limit in time, except that any officer and Advisory Board Member may resign or may be removed by a vote of a majority of the Trustees at any regular meeting or any special meeting of the Trustees. Except as indicated, each individual has held the office shown or other offices in the same company for the past five years.
The fund's Statement of Additional Information includes more information about the Trustees. To request a free copy, call Fidelity at 1-877-208-0098.
Interested Trustees*:
Correspondence intended for each Trustee who is an interested person may be sent to Fidelity Investments, 82 Devonshire Street, Boston, Massachusetts 02109.
Name, Age; Principal Occupation |
Edward C. Johnson 3d (77) |
| Year of Election or Appointment: 1983 Mr. Johnson is Chairman of the Board of Trustees. Mr. Johnson serves as President (2006-present), Chief Executive Officer, Chairman, and a Director of FMR LLC; Chairman and a Director of FMR; Chairman and a Director of Fidelity Research & Analysis Company (FRAC); Chairman and a Director of Fidelity Investments Money Management, Inc.; and Chairman (2001-present) and a Director of FMR Co., Inc. In addition, Mr. Johnson serves as Chairman and Director of Fidelity International Limited (FIL). |
James C. Curvey (72) |
| Year of Election or Appointment: 2007 Mr. Curvey also serves as Trustee (2007-present) or Member of the Advisory Board (2007-present) of other investment companies advised by FMR. Mr. Curvey is a Director of FMR and FMR Co., Inc. (2007- present). Mr. Curvey is also Vice Chairman (2006-present) and Director of FMR LLC. Mr. Curvey joined Fidelity in 1982 and served in numerous senior management positions, including President and Chief Operating Officer of FMR LLC (1997-2000) and President of Fidelity Strategic Investments (2000-2002). In addition, he serves as a member of the Board of Directors of Geerlings & Wade, Inc. (wine distribution). |
* Trustees have been determined to be "Interested Trustees" by virtue of, among other things, their affiliation with the trust or various entities under common control with FMR. FMR Corp. merged with FMR LLC on October 1, 2007. Any references to FMR LLC for prior periods are deemed to be references to the prior entity.
Independent Trustees:
Correspondence intended for each Independent Trustee (that is, the Trustees other than the Interested Trustees) may be sent to Fidelity Investments, P.O. Box 55235, Boston, Massachusetts 02205-5235.
Name, Age; Principal Occupation |
Dennis J. Dirks (59) |
| Year of Election or Appointment: 2005 Prior to his retirement in May 2003, Mr. Dirks was Chief Operating Officer and a member of the Board of The Depository Trust & Clearing Corporation (DTCC) (1999-2003). He also served as President, Chief Operating Officer, and Board member of The Depository Trust Company (DTC) (1999-2003) and President and Board member of the National Securities Clearing Corporation (NSCC) (1999-2003). In addition, Mr. Dirks served as Chief Executive Officer and Board member of the Government Securities Clearing Corporation (2001-2003) and Chief Executive Officer and Board member of the Mortgage-Backed Securities Clearing Corporation (2001-2003). Mr. Dirks also serves as a Trustee and a member of the Finance Committee of Manhattan College (2005-present) and a Trustee and a member of the Finance Committee of AHRC of Nassau County (2006-present). |
Albert R. Gamper, Jr. (65) |
| Year of Election or Appointment: 2006 Prior to his retirement in December 2004, Mr. Gamper served as Chairman of the Board of CIT Group Inc. (commercial finance). During his tenure with CIT Group Inc. Mr. Gamper served in numerous senior management positions, including Chairman (1987-1989; 1999-2001; 2002-2004), Chief Executive Officer (1987-2004), and President (1989-2002). He currently serves as a member of the Board of Directors of Public Service Enterprise Group (utilities, 2001-present), Chairman of the Board of Governors, Rutgers University (2004-present), and Chairman of the Board of Saint Barnabas Health Care System. |
George H. Heilmeier (71) |
| Year of Election or Appointment: 2004 Dr. Heilmeier is Chairman Emeritus of Telcordia Technologies (communication software and systems), where prior to his retirement, he served as company Chairman and Chief Executive Officer. He currently serves on the Boards of Directors of The Mitre Corporation (systems engineering and information technology support for the government), and HRL Laboratories (private research and development, 2004-present). He is Chairman of the General Motors Science & Technology Advisory Board and a Life Fellow of the Institute of Electrical and Electronics Engineers (IEEE). Dr. Heilmeier is a member of the Defense Science Board and the National Security Agency Advisory Board. He is also a member of the National Academy of Engineering, the American Academy of Arts and Sciences, and the Board of Overseers of the School of Engineering and Applied Science of the University of Pennsylvania. Previously, Dr. Heilmeier served as a Director of TRW Inc. (automotive, space, defense, and information technology, 1992-2002), Compaq (1994-2002), Automatic Data Processing, Inc. (ADP) (technology-based business outsourcing, 1995-2002), INET Technologies Inc. (telecommunications network surveillance, 2001-2004), and Teletech Holdings (customer management services). He is the recipient of the 2005 Kyoto Prize in Advanced Technology for his invention of the liquid crystal display, and a member of the Consumer Electronics Hall of Fame. |
James H. Keyes (67) |
| Year of Election or Appointment: 2007 Prior to his retirement in 2003, Mr. Keyes was Chairman, President, and Chief Executive Officer of Johnson Controls, Inc. (automotive supplier, 1993-2003). He currently serves as a member of the boards of LSI Logic Corporation (semiconductor technologies), Navistar International Corporation (manufacture and sale of trucks, buses, and diesel engines, 2002-present), and Pitney Bowes, Inc. (integrated mail, messaging, and document management solutions). |
Marie L. Knowles (61) |
| Year of Election or Appointment: 2001 Prior to Ms. Knowles' retirement in June 2000, she served as Executive Vice President and Chief Financial Officer of Atlantic Richfield Company (ARCO) (diversified energy, 1996-2000). From 1993 to 1996, she was a Senior Vice President of ARCO and President of ARCO Transportation Company. She served as a Director of ARCO from 1996 to 1998. She currently serves as a Director of Phelps Dodge Corporation (copper mining and manufacturing) and McKesson Corporation (healthcare service, 2002-present). Ms. Knowles is a Trustee of the Brookings Institution and the Catalina Island Conservancy and also serves as a member of the Advisory Board for the School of Engineering of the University of Southern California. |
Ned C. Lautenbach (63) |
| Year of Election or Appointment: 2000 Mr. Lautenbach is Chairman of the Independent Trustees (2006-present). Mr. Lautenbach has been a partner of Clayton, Dubilier & Rice, Inc. (private equity investment firm) since September 1998. Previously, Mr. Lautenbach was with the International Business Machines Corporation (IBM) from 1968 until his retirement in 1998. Mr. Lautenbach serves as a Director of Sony Corporation (2006-present) and Eaton Corporation (diversified industrial) as well as the Philharmonic Center for the Arts in Naples, Florida. He also is a member of the Board of Trustees of Fairfield University (2005-present), as well as a member of the Council on Foreign Relations. |
Cornelia M. Small (63) |
| Year of Election or Appointment: 2005 Ms. Small is a member (2000-present) and Chairperson (2002-present) of the Investment Committee, and a member (2002-present) of the Board of Trustees of Smith College. Previously, she served as Chief Investment Officer (1999-2000), Director of Global Equity Investments (1996-1999), and a member of the Board of Directors of Scudder, Stevens & Clark (1990-1997) and Scudder Kemper Investments (1997-1999). In addition, Ms. Small served as Co-Chair (2000-2003) of the Annual Fund for the Fletcher School of Law and Diplomacy. |
William S. Stavropoulos (68) |
| Year of Election or Appointment: 2001 Mr. Stavropoulos is Chairman Emeritus of the Board of Directors of The Dow Chemical Company. Since joining The Dow Chemical Company in 1967, Mr. Stavropoulos served in numerous senior management positions, including President (1993-2000; 2002-2003), CEO (1995-2000; 2002-2004), and Chairman of the Executive Committee (2000-2004). Currently, he is a Director of NCR Corporation (data warehousing and technology solutions), Chemical Financial Corporation, Maersk Inc. (industrial conglomerate, 2002-present), Tyco International, Inc. (multinational manufacturing and services, 2007-present), and a member of the Advisory Board for Metalmark Capital (private equity investment firm, 2005-present). He is a special advisor to Clayton, Dubilier & Rice, Inc., a private equity investment firm. He also serves as a member of the Board of Trustees of the American Enterprise Institute for Public Policy Research. In addition, Mr. Stavropoulos is a member of The Business Council, J.P. Morgan International Council and the University of Notre Dame Advisory Council for the College of Science. |
Kenneth L. Wolfe (68) |
| Year of Election or Appointment: 2005 Prior to his retirement in 2001, Mr. Wolfe was Chairman and Chief Executive Officer of Hershey Foods Corporation (1993-2001). He currently serves as a member of the boards of Adelphia Communications Corporation (2003-present), Bausch & Lomb, Inc., and Revlon Inc. (2004-present). |
Advisory Board Members and Executive Officers**:
Correspondence intended for Mr. Mauriello, Mr. Thomas, and Mr. Wiley may be sent to Fidelity Investments, P.O. Box 55235, Boston, Massachusetts 02205-5235. Correspondence intended for each executive officer and Mr. Lynch may be sent to Fidelity Investments, 82 Devonshire Street, Boston, Massachusetts 02109.
Name, Age; Principal Occupation |
Peter S. Lynch (63) |
| Year of Election or Appointment: 2003 Member of the Advisory Board of Fidelity Advisor Series VIII. Mr. Lynch is Vice Chairman and a Director of FMR, and Vice Chairman (2001-present) and a Director of FMR Co., Inc. Previously, Mr. Lynch served as a Trustee of the Fidelity funds (1990-2003). In addition, he serves as a Trustee of Boston College and as the Chairman of the Inner-City Scholarship Fund. |
Joseph Mauriello (63) |
| Year of Election or Appointment: 2007 Member of the Advisory Board of Fidelity Advisor Series VIII. Prior to his retirement in January 2006, Mr. Mauriello served in numerous senior management positions including Deputy Chairman and Chief Operating Officer (2004-2005), and Vice Chairman of Financial Services (2002-2004) of KPMG LLP US (professional services firm, 1965-2005). Mr. Mauriello currently serves as a member of the Board of Directors of XL Capital Ltd., (global insurance and re-insurance company, 2006-present) and of Arcadia Resources Inc., (health care services and products, 2007-present). He also served as a Director of the Hamilton Funds of the Bank of New York (2006-2007). |
David M. Thomas (58) |
| Year of Election or Appointment: 2007 Member of the Advisory Board of Fidelity Investment Trust. Previously, Mr. Thomas served as Executive Chairman (2005-2006) and Chairman and Chief Executive Officer (2000-2005) of IMS Health, Inc. (pharmaceutical and healthcare information solutions). In addition, Mr. Thomas serves as a member of the Board of Directors of Fortune Brands, Inc. (consumer products holding company), and Interpublic Group of Companies, Inc. (marketing communication, 2004-present). |
Michael E. Wiley (57) |
| Year of Election or Appointment: 2007 Member of the Advisory Board of Fidelity Advisor Series VIII. Mr. Wiley also serves as Sr. Energy Advisor of Katzenbach Partners, LLC (consulting firm, 2006-present) and a member of the Board of Trustees of the University of Tulsa (2000-2006; 2007-present). He serves as a Director of Tesoro Corporation (independent oil refiner and marketer, 2005- present), and a Director of Bill Barrett Corporation (exploration and production company, 2005-present). In addition, he also serves as a Director of Post Oak Bank (privately-held bank, 2004-present), and an Advisory Director of Riverstone Holdings (private investment firm). Previously, Mr. Wiley served as Chairman, President, and CEO of Baker Hughes, Inc. (oilfield services company, 2000-2004), and as Director of Spinnaker Exploration Company (exploration and production company, 2001-2005). |
Kimberley H. Monasterio (43) |
| Year of Election or Appointment: 2007 President and Treasurer of Advisor Global Capital Appreciation. Ms. Monasterio also serves as President and Treasurer of other Fidelity funds (2007-present) and is an employee of FMR (2004-present). Previously, Ms. Monasterio served as Deputy Treasurer of the Fidelity funds (2004-2006). Before joining Fidelity Investments, Ms. Monasterio served as Treasurer (2000-2004) and Chief Financial Officer (2002-2004) of the Franklin Templeton Funds and Senior Vice President of Franklin Templeton Services, LLC (2000-2004). |
Walter C. Donovan (45) |
| Year of Election or Appointment: 2007 Vice President of Advisor Global Capital Appreciation. Mr. Donovan also serves as Vice President of Fidelity's Equity Funds (2007-present). Mr. Donovan also serves as Executive Vice President of FMR (2005-present) and FMR Co., Inc. (2005-present). Previously, Mr. Donovan served as Vice President of Fidelity's High Income Funds (2005-2007), Fixed-Income Funds (2005-2006), certain Asset Allocation Funds (2005-2006), certain Balanced Funds (2005-2006), and as Vice President and Director of Fidelity's International Equity Trading group (1998-2005). |
Eric M. Wetlaufer (45) |
| Year of Election or Appointment: 2006 Vice President of Advisor Global Capital Appreciation. Mr. Wetlaufer also serves as Vice President of certain International Equity Funds (2006-present). Mr. Wetlaufer is Senior Vice President of FMR (2006-present) and FMR Co., Inc. (2006-present), and President and Director of Fidelity Management & Research (U.K.) Inc. (2006-present) and Fidelity Research & Analysis Company (2006-present). Before joining Fidelity Investments in 2005, Mr. Wetlaufer was a partner in Oxhead Capital Management (2004-2005). Previously, Mr. Wetlaufer served as a Chief Investment Officer of Putnam Investments (1997-2003). |
Eric D. Roiter (58) |
| Year of Election or Appointment: 1998 Secretary of Advisor Global Capital Appreciation. He also serves as Secretary of other Fidelity funds; Vice President, General Counsel, and Secretary of FMR Co., Inc. (2001-present) and FMR; Assistant Secretary of Fidelity Management & Research (U.K.) Inc. (2001-present), Fidelity Research & Analysis Company (2001-present), and Fidelity Investments Money Management, Inc. (2001-present). Mr. Roiter is an Adjunct Member, Faculty of Law, at Boston College Law School (2003-present). Previously, Mr. Roiter served as Vice President and Secretary of Fidelity Distributors Corporation (FDC) (1998-2005). |
Scott C. Goebel (39) |
| Year of Election or Appointment: 2007 Assistant Secretary of Advisor Global Capital Appreciation. Mr. Goebel also serves as Assistant Secretary of other Fidelity funds (2007-present), and is an employee of FMR. |
R. Stephen Ganis (41) |
| Year of Election or Appointment: 2006 Anti-Money Laundering (AML) officer of Advisor Global Capital Appreciation. Mr. Ganis also serves as AML officer of other Fidelity funds (2006-present) and FMR LLC (2003-present). Before joining Fidelity Investments, Mr. Ganis practiced law at Goodwin Procter, LLP (2000-2002). |
Joseph B. Hollis (59) |
| Year of Election or Appointment: 2006 Chief Financial Officer of Advisor Global Capital Appreciation. Mr. Hollis also serves as Chief Financial Officer of other Fidelity funds. Mr. Hollis is President of Fidelity Pricing and Cash Management Services (FPCMS) (2005-present). Mr. Hollis also serves as President and Director of Fidelity Service Company, Inc. (2006-present). Previously, Mr. Hollis served as Senior Vice President of Cash Management Services (1999-2002) and Investment Management Operations (2002-2005). |
Kenneth A. Rathgeber (60) |
| Year of Election or Appointment: 2004 Chief Compliance Officer of Advisor Global Capital Appreciation. Mr. Rathgeber also serves as Chief Compliance Officer of other Fidelity funds (2004-present) and Executive Vice President of Risk Oversight for Fidelity Investments (2002-present). He is Chief Compliance Officer of FMR (2005-present), FMR Co., Inc. (2005-present), Fidelity Management & Research (U.K.) Inc. (2005-present), Fidelity Research & Analysis Company (2005-present), Fidelity Investments Money Management, Inc. (2005-present), and Strategic Advisers, Inc. (2005-present). Previously, Mr. Rathgeber served as Executive Vice President and Chief Operating Officer for Fidelity Investments Institutional Services Company, Inc. (1998-2002). |
Bryan A. Mehrmann (46) |
| Year of Election or Appointment: 2005 Deputy Treasurer of Advisor Global Capital Appreciation. Mr. Mehrmann also serves as Deputy Treasurer of other Fidelity funds (2005-present) and is an employee of FMR. Previously, Mr. Mehrmann served as Vice President of Fidelity Investments Institutional Services Group (FIIS)/Fidelity Investments Institutional Operations Corporation, Inc. (FIIOC) Client Services (1998-2004). |
Kenneth B. Robins (38) |
| Year of Election or Appointment: 2005 Deputy Treasurer of Advisor Global Capital Appreciation. Mr. Robins also serves as Deputy Treasurer of other Fidelity funds (2005-present) and is an employee of FMR (2004-present). Before joining Fidelity Investments, Mr. Robins worked at KPMG LLP, where he was a partner in KPMG's department of professional practice (2002-2004) and a Senior Manager (1999-2000). In addition, Mr. Robins served as Assistant Chief Accountant, United States Securities and Exchange Commission (2000-2002). |
Robert G. Byrnes (40) |
| Year of Election or Appointment: 2005 Assistant Treasurer of Advisor Global Capital Appreciation. Mr. Byrnes also serves as Assistant Treasurer of other Fidelity funds (2005-present) and is an employee of FMR (2005-present). Previously, Mr. Byrnes served as Vice President of FPCMS (2003-2005). Before joining Fidelity Investments, Mr. Byrnes worked at Deutsche Asset Management where he served as Vice President of the Investment Operations Group (2000-2003). |
Peter L. Lydecker (53) |
| Year of Election or Appointment: 2004 Assistant Treasurer of Advisor Global Capital Appreciation. Mr. Lydecker also serves as Assistant Treasurer of other Fidelity funds (2004) and is an employee of FMR. |
Paul M. Murphy (60) |
| Year of Election or Appointment: 2007 Assistant Treasurer of the fund. Mr. Murphy also serves as Assistant Treasurer of other Fidelity funds (2007-present) and is an employee of FMR (2007-present). Previously, Mr. Murphy served as Chief Financial Officer of the Fidelity Funds (2005-2006), Vice President and Associate General Counsel of FMR (2007), and Senior Vice President of Fidelity Pricing and Cash Management Services Group (FPCMS) (1994-2007). |
Gary W. Ryan (49) |
| Year of Election or Appointment: 2005 Assistant Treasurer of Advisor Global Capital Appreciation. Mr. Ryan also serves as Assistant Treasurer of other Fidelity funds (2005-present) and is an employee of FMR (2005-present). Previously, Mr. Ryan served as Vice President of Fund Reporting in FPCMS (1999-2005). |
** FMR Corp. merged with FMR LLC on October 1, 2007. Any references to FMR LLC for prior periods are deemed to be references to the prior entity.
Annual Report
Distributions
The Board of Trustees of Fidelity Advisor Global Capital Appreciation Fund voted to pay to shareholders of record at the opening of business on record date, the following distributions per share derived from capital gains realized from sales of portfolio securities, and dividends derived from net investment income:
| Pay Date | Record Date | Dividends | Capital Gains |
Institutional Class | 12/10/07 | 12/07/07 | $0.00 | $1.831 |
The fund hereby designates as a capital gain dividend with respect to the taxable year ended October 31, 2007, $1,203,299, or, if subsequently determined to be different, the net capital gain of such year.
The fund will notify shareholders in January 2008 of amounts for use in preparing 2007 income tax returns.
Annual Report
Proxy Voting Results
A special meeting of the fund's shareholders was held on June 20, 2007. The results of votes taken among shareholders on the proposal before them are reported below. Each vote reported represents one dollar of net asset value held on the record date for the meeting.
PROPOSAL 2 |
To approve an amended management contract that includes adding a performance adjustment component to the management fee for Fidelity Advisor Global Capital Appreciation Fund and giving the Trustees the authority to change the fund's performance adjustment index going forward, without shareholder vote, subject to applicable law. |
| # of
Votes | % of
Votes |
Affirmative | 18,745,624.96 | 73.981 |
Against | 3,491,395.81 | 13.779 |
Abstain | 3,101,380.21 | 12.240 |
TOTAL | 25,338,400.98 | 100.000 |
Annual Report
Board Approval of Investment Advisory Contracts and Management Fees
Advisor Global Capital Appreciation Fund
Each year, typically in July, the Board of Trustees, including the Independent Trustees (together, the Board), votes on the renewal of the management contract and sub-advisory agreements (together, the Advisory Contracts) for the fund. The Board, assisted by the advice of fund counsel and Independent Trustees' counsel, requests and considers a broad range of information throughout the year.
The Board meets regularly each month except August and takes into account throughout the year matters bearing on Advisory Contracts. The Board, acting directly and through its separate committees, considers at each of its meetings factors that are relevant to the annual renewal of the fund's Advisory Contracts, including the services and support provided to the fund and its shareholders. At the time of the renewal, the Board had 12 standing committees, each composed of Independent Trustees with varying backgrounds, to which the Board has assigned specific subject matter responsibilities in order to enhance effective decision-making by the Board. Each committee has adopted a written charter outlining the structure and purposes of the committee. One such committee, the Equity Contract Committee, meets periodically as needed throughout the year to consider matters specifically related to the annual renewal of Advisory Contracts. The committee requests and receives information on, and makes recommendations to the Independent Trustees concerning, the approval and annual review of the Advisory Contracts.
At its July 2007 meeting, the Board of Trustees, including the Independent Trustees, unanimously determined to renew the Advisory Contracts for the fund. In reaching its determination, the Board considered all factors it believed relevant, including (i) the nature, extent, and quality of the services to be provided to the fund and its shareholders (including the investment performance of the fund); (ii) the competitiveness of the management fee and total expenses of the fund; (iii) the total costs of the services to be provided by and the profits to be realized by the investment adviser and its affiliates from the relationship with the fund; (iv) the extent to which economies of scale would be realized as the fund grows; and (v) whether fee levels reflect these economies of scale, if any, for the benefit of fund shareholders. The Board also approved amendments to the fund's agreements with foreign sub-advisers to clarify that each sub-adviser provides services as an independent contractor.
In determining whether to renew the Advisory Contracts for the fund, the Board ultimately reached a determination, with the assistance of fund counsel and Independent Trustees' counsel, that the renewal of the Advisory Contracts and the compensation to be received by Fidelity under the management contract is consistent with Fidelity's fiduciary duty under applicable law. In addition to evaluating the specific factors noted above, the Board, in reaching its determination, is aware that shareholders in the fund have a broad range of investment choices available to them, including a wide choice among mutual funds offered by competitors to Fidelity, and that the fund's shareholders, with the opportunity to review and weigh the disclosure provided by the fund in its prospectus and other public disclosures, have chosen to invest in this fund, managed by Fidelity.
Annual Report
Nature, Extent, and Quality of Services Provided. The Board considered staffing within the investment adviser, FMR, and the sub-advisers (together, the Investment Advisers), including the backgrounds of the fund's portfolio managers and the fund's investment objective and discipline. The Independent Trustees also had discussions with senior management of Fidelity's investment operations and investment groups. The Board considered the structure of the portfolio manager compensation program and whether this structure provides appropriate incentives.
Resources Dedicated to Investment Management and Support Services. The Board reviewed the size, education, and experience of the Investment Advisers' investment staff, their use of technology, and the Investment Advisers' approach to recruiting, training, and retaining portfolio managers and other research, advisory, and management personnel. The Board considered Fidelity's extensive global research capabilities that enable the Investment Advisers to aggregate data from various sources in an effort to produce positive investment results. The Board noted that Fidelity's analysts have access to a variety of technological tools that enable them to perform both fundamental and quantitative analysis and to specialize in various disciplines. The Board also considered that Fidelity's portfolio managers and analysts have access to daily portfolio attribution that allows for monitoring of a fund's portfolio, as well as an electronic communication system that provides immediate real-time access to research concerning issuers and credit enhancers.
Shareholder and Administrative Services. The Board considered (i) the nature, extent, quality, and cost of advisory, administrative, distribution, and shareholder services performed by the Investment Advisers and their affiliates under the Advisory Contracts and under separate agreements covering transfer agency, pricing and bookkeeping, and securities lending services for the fund; (ii) the nature and extent of the Investment Advisers' supervision of third party service providers, principally custodians and subcustodians; and (iii) the resources devoted to, and the record of compliance with, the fund's compliance policies and procedures. The Board reviewed the allocation of fund brokerage, including allocations to brokers affiliated with the Investment Advisers, the use of brokerage commissions to pay fund expenses, and the use of "soft" commission dollars to pay for research services. The Board also considered that Fidelity voluntarily pays for market data out of its own resources. The Board also considered the agreement reached between the Independent Trustees and Fidelity in December 2006 following an independent review of matters relating to receipt of travel, entertainment, gifts and gratuities in violation of Fidelity policies.
Annual Report
Board Approval of Investment Advisory Contracts and
Management Fees - continued
The Board noted that the growth of fund assets across the complex allows Fidelity to reinvest in the development of services designed to enhance the value or convenience of the Fidelity funds as investment vehicles. These services include 24-hour access to account information and market information through phone representatives and over the Internet, and investor education materials and asset allocation tools.
Investment in a Large Fund Family. The Board considered the benefits to shareholders of investing in a Fidelity fund, including the benefits of investing in a fund that is part of a large family of funds offering a variety of investment disciplines and providing for a large variety of mutual fund investor services. For example, fund shareholders are offered the privilege of exchanging shares of the fund for shares of other Fidelity funds, as set forth in the fund's prospectus, without paying a sales charge. The Board noted that, since the last Advisory Contract renewals in July 2006, Fidelity has taken a number of actions that benefited particular funds, including (i) dedicating additional resources to investment research and to restructure the investment research teams; (ii) contractually agreeing to reduce the management fee on Fidelity Advisor Floating Rate High Income Fund; (iii) contractually agreeing to reduce the management fees on Fidelity's California, Massachusetts, New Jersey, and New York AMT Tax-Free Money Market Funds, launching new Institutional Classes and Service Classes of these funds, and contractually agreeing to impose expense limitations on these funds; (iv) eliminating the exchange fee on the Fidelity Select Portfolios and reducing the pricing and bookkeeping fee rates for these funds; (v) reducing the maximum transfer agency fee rates on high income funds and certain equity funds; (vi) proposing amended management contracts that, if approved by shareholders, will add a performance adjustment component to the management fees paid by 18 Fidelity Advisor equity funds; (vii) contractually agreeing to reduce fees for Ultra-Short Central Fund and the money market Central Funds; (viii) waiving the Fidelity Advisor funds' contingent deferred sales charge on certain redemptions made through systematic withdrawal programs; and (ix) amending the management contracts for equity and fixed-income funds whose management contracts incorporate a "group fee" structure by adding four new fee "breakpoints" to the group fee rate schedules.
Investment Performance and Compliance. The Board considered whether the fund has operated within its investment objective, as well as its record of compliance with its investment restrictions. It also reviewed the fund's absolute investment performance for each class, as well as the fund's relative investment performance for each class measured against (i) a broad-based securities market index, and (ii) a peer group of mutual funds deemed appropriate by the Board over multiple periods. The following charts considered by the Board show, over the one-, three-, and five-year periods ended December 31, 2006, the cumulative total returns of Institutional Class (Class I) and Class B of the fund, the cumulative total returns of a broad-based securities market index ("benchmark"), and a range of cumulative total returns of a peer group of mutual funds identified by Morningstar, Inc. as having an investment style similar to that of the fund based on underlying portfolio holdings. The returns of Institutional Class (Class I) and Class B show the performance of the highest and lowest performing classes, respectively (based on three-year performance). The box within each chart shows the 25th percentile return (bottom of box) and the 75th percentile return (top of box) of the peer group. Returns shown above the box are in the first quartile and returns shown below the box are in the fourth quartile. The percentage beaten numbers noted below each chart correspond to the percentile box and represent the percentage of funds in the peer group whose performance was equal to or lower than that of the class indicated.
Annual Report
Advisor Global Capital Appreciation Fund

The Board reviewed the fund's relative investment performance against its peer group and stated that the performance of Institutional Class (Class I) of the fund was in the fourth quartile for the one- and three-year periods and the third quartile for the five-year period. The Board also stated that the investment performance of Institutional Class (Class I) of the fund was lower than its benchmark for all the periods shown. The Board considered that the variations in performance among the fund's classes reflect the variations in class expenses, which result in lower performance for higher expense classes. The Board discussed with FMR actions to be taken by FMR to improve the fund's disappointing performance relative to its peer group. The Board will continue to closely monitor the performance of the fund in the coming year and discuss with FMR other appropriate actions to address the performance of the fund.
The Board considered that FMR has taken steps to refocus and strengthen equity research, equity portfolio management, and compliance.
Annual Report
Board Approval of Investment Advisory Contracts and
Management Fees - continued
Based on its review, and giving particular weight to the nature and quality of the resources dedicated by the Investment Advisers to maintain and improve relative performance, the Board concluded that the nature, extent, and quality of the services provided to the fund will benefit the fund's shareholders, particularly in light of the Board's view that the fund's shareholders benefit from investing in a fund that is part of a large family of funds offering a variety of investment disciplines and services.
Competitiveness of Management Fee and Total Fund Expenses. The Board considered the fund's management fee and total expenses compared to "mapped groups" of competitive funds and classes. Fidelity creates "mapped groups" by combining similar Lipper investment objective categories that have comparable management fee characteristics. Combining Lipper investment objective categories aids the Board's management fee and total expense comparisons by broadening the competitive group used for comparison and by reducing the number of universes to which various Fidelity funds are compared. The Board also considered supplemental information about how the fund's management fee and total expenses ranked relative to groups based on Lipper classifications, which take into account a fund's market capitalization and style.
The Board considered two proprietary management fee comparisons for the 12-month periods shown in the chart below. The group of Lipper funds used by the Board for management fee comparisons is referred to below as the "Total Mapped Group." The Total Mapped Group comparison focuses on a fund's standing relative to the total universe of comparable funds available to investors, in terms of gross management fees before expense reimbursements or caps. "TMG %" represents the percentage of funds in the Total Mapped Group that had management fees that were lower than the fund's. For example, a TMG % of 15% means that 85% of the funds in the Total Mapped Group had higher management fees than the fund. The "Asset-Size Peer Group" (ASPG) comparison focuses on a fund's standing relative to non-Fidelity funds similar in size to the fund within the Total Mapped Group. The ASPG represents at least 15% of the funds in the Total Mapped Group with comparable asset size and management fee characteristics, subject to a minimum of 50 funds (or all funds in the Total Mapped Group if fewer than 50). Additional information, such as the ASPG quartile in which the fund's management fee ranked, is also included in the chart and considered by the Board.
Annual Report
Advisor Global Capital Appreciation Fund

The Board noted that the fund's management fee ranked below the median of its Total Mapped Group and below the median of its ASPG for 2006.
Furthermore, the Board considered that, on June 20, 2007, after the periods shown in the chart above, shareholders approved an amended management contract for the fund that will add a performance adjustment component to the management fee paid by the fund (that is, the fund's management fee will be subject to upward or downward adjustment depending upon whether, and to what extent, the fund's investment performance for the performance period exceeds, or is exceeded by, the record (over the same period) of a Board-approved performance adjustment index). The performance period for the fund commenced on July 1, 2007. Starting with the twelfth month, the performance adjustment takes effect.
Based on its review, the Board concluded that the fund's management fee was fair and reasonable in light of the services that the fund receives and the other factors considered.
In its review of each class's total expenses, the Board considered the fund's management fee as well as other fund or class expenses, as applicable, such as transfer agent fees, pricing and bookkeeping fees, fund-paid 12b-1 fees, and custodial, legal, and audit fees. The Board also noted the effects of any waivers and reimbursements on fees and expenses. As part of its review, the Board also considered current and historical total expenses of each class of the fund compared to competitive fund median expenses. Each class of the fund is compared to those funds and classes in the Total Mapped Group (used by the Board for management fee comparisons) that have a similar sales load structure.
Annual Report
Board Approval of Investment Advisory Contracts and
Management Fees - continued
The Board noted that the total expenses of Class A ranked below its competitive median for 2006, the total expenses of each of Class B and Class C ranked equal to its competitive median for 2006, and the total expenses of each of Class T and Institutional Class ranked above its competitive median for 2006. The Board noted that the fund offers multiple classes, each of which has a different sales load and 12b-1 fee structure, and that the multiple structures are intended to offer a range of pricing options for the intermediary market. The Board also noted that the total expenses of the classes vary primarily by the level of their 12b-1 fees, although differences in transfer agent fees may also cause expenses to vary from class to class.
In its review of total expenses, the Board also considered Fidelity fee structures and other information on clients that FMR and its affiliates service in other competitive markets, such as other mutual funds advised or subadvised by FMR or its affiliates, pension plan clients, and other institutional clients.
Based on its review, the Board concluded that the total expenses of each class of the fund were reasonable, although in some cases above the median of the universe presented for comparison, in light of the services that the fund and its shareholders receive and the other factors considered.
Costs of the Services and Profitability. The Board considered the revenues earned and the expenses incurred by Fidelity in conducting the business of developing, marketing, distributing, managing, administering and servicing the fund and its shareholders. The Board also considered the level of Fidelity's profits in respect of all the Fidelity funds.
On an annual basis, FMR presents to the Board Fidelity's profitability for the fund. Fidelity calculates the profitability for each fund, as well as aggregate profitability for groups of Fidelity funds and all Fidelity funds, using a series of detailed revenue and cost allocation methodologies which originate with the audited books and records of Fidelity. The Audit Committee of the Board reviews any significant changes from the prior year's methodologies.
PricewaterhouseCoopers LLP (PwC), independent registered public accounting firm and auditor to Fidelity and certain Fidelity funds, has been engaged annually by the Board as part of the Board's assessment of the results of Fidelity's profitability analysis. PwC's engagement includes the review and assessment of Fidelity's methodologies used in determining the revenues and expenses attributable to Fidelity's mutual fund business, and completion of agreed-upon procedures surrounding the mathematical accuracy of fund profitability and its conformity to allocation methodologies. After considering PwC's reports issued under the engagement and information provided by Fidelity, the Board believes that while other allocation methods may also be reasonable, Fidelity's profitability methodologies are reasonable in all material respects.
Annual Report
The Board has also reviewed Fidelity's non-fund businesses and any fall-out benefits related to the mutual fund business as well as cases where Fidelity's affiliates may benefit from or be related to the fund's business.
The Board considered the costs of the services provided by and the profits realized by Fidelity in connection with the operation of the fund and determined that the amount of profit is a fair entrepreneurial profit for the management of the fund.
Economies of Scale. The Board considered whether there have been economies of scale in respect of the management of the Fidelity funds, whether the Fidelity funds (including the fund) have appropriately benefited from any such economies of scale, and whether there is potential for realization of any further economies of scale. The Board considered the extent to which the fund will benefit from economies of scale through increased services to the fund, through waivers or reimbursements, or through fee or expense reductions, including reductions that occur through operation of the transfer agent agreement. The transfer agent fee varies in part based on the number of accounts in the fund. If the number of accounts decreases or the average account size increases, the overall transfer agent fee rate decreases.
The Board recognized that the fund's management contract incorporates a "group fee" structure, which provides for lower group fee rates as total fund assets under FMR's management increase, and for higher group fee rates as total fund assets under FMR's management decrease. FMR determines the group fee rates based on a tiered asset "breakpoint" schedule. In connection with the renewal of the fund's management contract, the Board approved amendments to the fund's management contract that added four new fee breakpoints to the group fee rate schedule for assets under FMR's management above $1,386 billion. The Board considered that the group fee rate declines under both the present and amended schedules, but that under the amended schedule, the group fee rate declines faster as assets under FMR's management exceed $1,386 billion. The Board considered that the group fee is designed to deliver the benefits of economies of scale to fund shareholders when total fund assets increase, even if assets of any particular fund are unchanged or have declined, because some portion of Fidelity's costs are attributable to services provided to all Fidelity funds, and all funds benefit if those costs can be allocated among more assets. The Board concluded that, given the group fee structure, fund shareholders will achieve a certain level of economies of scale as assets under FMR's management increase at the fund complex level, regardless of whether Fidelity achieves any such economies of scale.
The Board further concluded that any potential economies of scale are being shared between fund shareholders and Fidelity in an appropriate manner.
Additional Information Requested by the Board. In order to develop fully the factual basis for consideration of the Fidelity funds' Advisory Contracts, the Board requested and received additional information on several topics, including (i) fund performance trends and actions to be taken by FMR to improve certain funds' overall performance; (ii) Fidelity's portfolio manager compensation structure, including its effects on fund profitability and the extent to which portfolio manager compensation is linked to fund performance; (iii) Fidelity's fee structures; (iv) the funds' sub-advisory arrangements; and (v) accounts managed by Fidelity other than the Fidelity funds.
Annual Report
Board Approval of Investment Advisory Contracts and
Management Fees - continued
Based on its evaluation of all of the conclusions noted above, and after considering all material factors, the Board ultimately concluded that the advisory fee structures are fair and reasonable, and that the fund's Advisory Contracts should be renewed.
Annual Report
Annual Report
Annual Report
Annual Report
Investment Adviser
Fidelity Management & Research Company
Boston, MA
Investment Sub-Advisers
FMR Co., Inc.
Fidelity Management & Research
(U.K.) Inc.
Fidelity Research & Analysis Company
Fidelity International
Investment Advisors
Fidelity Investments Japan Limited
Fidelity International Investment Advisors (U.K.) Limited
General Distributor
Fidelity Distributors Corporation
Boston, MA
Transfer and Service Agents
Fidelity Investments Institutional Operations Company, Inc.
Boston, MA
Fidelity Service Company, Inc.
Boston, MA
Custodian
State Street Bank and Trust Company
Quincy, MA
AGLOI-UANN-1207
1.784745.104
(Fidelity Investment logo)(registered trademark)
(Fidelity Investment logo)(registered trademark)
Fidelity® Advisor
International
Capital Appreciation
Fund - Class A, Class T, Class B
and Class C
Annual Report
October 31, 2007
(2_fidelity_logos) (Registered_Trademark)
Contents
Chairman's Message | <Click Here> | Ned Johnson's message to shareholders. |
Note to Shareholders | <Click Here> | An explanation of the changes to the fund. |
Performance | <Click Here> | How the fund has done over time. |
Management's Discussion | <Click Here> | The manager's review of fund performance, strategy and outlook. |
Shareholder Expense Example | <Click Here> | An example of shareholder expenses. |
Investment Changes | <Click Here> | A summary of major shifts in the fund's investments over the past six months. |
Investments | <Click Here> | A complete list of the fund's investments with their market values. |
Financial Statements | <Click Here> | Statements of assets and liabilities, operations, and changes in net assets,
as well as financial highlights. |
Notes | <Click Here> | Notes to the financial statements. |
Report of Independent Registered Public Accounting Firm | <Click Here> | |
Trustees and Officers | <Click Here> | |
Distributions | <Click Here> | |
Proxy Voting Results | <Click Here> | |
Board Approval of Investment Advisory Contracts and Management Fees | <Click Here> | |
To view a fund's proxy voting guidelines and proxy voting record for the 12-month period ended June 30, visit http://www.fidelity.com (search for "proxy voting guidelines") or visit the Securities and Exchange Commission's (SEC) web site at http://www.sec.gov. You may also call 1-877-208-0098 to request a free copy of the proxy voting guidelines.
Standard & Poor's, S&P and S&P 500 are registered service marks of The McGraw-Hill Companies, Inc. and have been licensed for use by Fidelity Distributors Corporation.
Other third party marks appearing herein are the property of their respective owners.
All other marks appearing herein are registered or unregistered trademarks or service marks of FMR LLC or an affiliated company.
Annual Report
This report and the financial statements contained herein are submitted for the general information of the shareholders of the fund. This report is not authorized for distribution to prospective investors in the fund unless preceded or accompanied by an effective prospectus.
A fund files its complete schedule of portfolio holdings with the SEC for the first and third quarters of each fiscal year on Form N-Q. Forms N-Q are available on the SEC's web site at http://www.sec.gov. A fund's Forms N-Q may be reviewed and copied at the SEC's Public Reference Room in Washington, DC. Information regarding the operation of the SEC's Public Reference Room may be obtained by calling 1-800-SEC-0330. For a complete list of a fund's portfolio holdings, view the most recent holdings listing, semiannual report, or annual report on Fidelity's web site at http://www.fidelity.com or http://www.advisor.fidelity.com, as applicable.
NOT FDIC INSURED · MAY LOSE VALUE · NO BANK GUARANTEE
Neither the fund nor Fidelity Distributors Corporation is a bank.
Annual Report
Chairman's Message
(photo_of_Edward_C_Johnson_3d)
Dear Shareholder:
Many stock and bond markets around the world have been unsettled of late; however, volatility can often lead to opportunity for patient investors. Financial markets are always unpredictable, but there are a number of time-tested principles that can put the historical odds in your favor.
One of the basic tenets is to invest for the long term. Over time, riding out the markets' inevitable ups and downs has proven much more effective than selling into panic or chasing the hottest trend. Even missing only a few of the markets' best days can significantly diminish investor returns. Patience also affords the benefits of compounding - of earning interest on additional income or reinvested dividends and capital gains. There are tax advantages and cost benefits to consider as well. The more you sell, the more taxes you pay, and the more you trade, the higher the costs. While staying the course doesn't eliminate risk, it can considerably lessen the effect of short-term declines.
You can further manage your investing risk through diversification. And today, more than ever, geographic diversification should be taken into account. Studies indicate that asset allocation is the single most important determinant of a portfolio's long-term success. The right mix of stocks, bonds and cash - aligned to your particular risk tolerance and investment objective - is very important. Age-appropriate rebalancing is also an essential aspect of asset allocation. For younger investors, an emphasis on equities - which historically have been the best-performing asset class over time - is encouraged. As investors near their specific goal, such as retirement or sending a child to college, consideration may be given to replacing volatile assets (e.g. common stocks) with more-stable fixed investments (bonds or savings plans).
A third investment principle - investing regularly - can help lower the average cost of your purchases. Investing a certain amount of money each month or quarter helps ensure you won't pay for all your shares at market highs. This strategy - known as dollar cost averaging - also reduces unconstructive "emotion" from investing, helping shareholders avoid selling weak performers just prior to an upswing, or chasing a hot performer just before a correction.
We invite you to contact us via the Internet, through our Investor Centers or over the phone. It is our privilege to provide you the information you need to make the investments that are right for you.
Sincerely,
/s/Edward C. Johnson 3d
Edward C. Johnson 3d
Annual Report
Note to Shareholders:
On July 18, 2007, shareholders of Fidelity® Advisor International Capital Appreciation Fund approved a new management contract for the fund, effective August 1, 2007, which adds a performance adjustment component to the management fee based on the fund's performance versus the Morgan Stanley Capital InternationalSM All Country World (MSCI® ACWI) ex USA Index. The new contract also allows the Board of Trustees to designate an alternate performance adjustment index in the future, without a shareholder vote, when permitted by applicable law.
Annual Report
Performance: The Bottom Line
Average annual total return reflects the change in the value of an investment, assuming reinvestment of the class' dividend income and capital gains (the profits earned upon the sale of securities that have grown in value) and assuming a constant rate of performance each year. The $10,000 table and the fund's returns do not reflect the deduction of taxes that a shareholder would pay on fund distributions or the redemption of fund shares. During periods of reimbursement by Fidelity, a fund's total return will be greater than it would be had the reimbursement not occurred. How a fund did yesterday is no guarantee of how it will do tomorrow. Returns reflect the conversion of Class B shares to Class A shares after a maximum of seven years.
Average Annual Total Returns
Periods ended October 31, 2007 | | Past 1
year | Past 5
years | Life of
fundA |
Class A (incl. 5.75% sales charge) | | 17.58% | 17.07% | 9.92% |
Class T (incl. 3.50% sales charge) | | 20.11% | 17.36% | 9.97% |
Class B (incl. contingent deferred sales charge) B | | 18.85% | 17.29% | 9.96% |
Class C (incl. contingent deferred sales charge) C | | 22.85% | 17.60% | 9.78% |
A From November 3, 1997.
B Class B shares' contingent deferred sales charges included in the past one year, past five years, and life of fund total return figures are 5%, 2%, and 0%, respectively.
C Class C shares' contingent deferred sales charge included in the past one year, past five years, and life of fund total return figures are 1%, 0%, and 0%, respectively.
Annual Report
$10,000 Over Life of Fund
Let's say hypothetically that $10,000 was invested in Fidelity® Advisor International Capital Appreciation Fund - Class T on November 3, 1997, when the fund started, and the current 3.50% sales charge was paid. The chart shows how the value of your investment would have changed, and also shows how the MSCI ACWI ex USA Index performed over the same period.
Annual Report
Management's Discussion of Fund Performance
Comments from Darren Maupin, Portfolio Manager of Fidelity® Advisor International Capital Appreciation Fund
Foreign stocks, with a large assist from a weak U.S. dollar, generally had higher returns for U.S. investors than domestic equities during the 12-month period ending October 31, 2007. The backdrop for global stocks was solid, with robust economic growth and relatively high corporate profitability worldwide. Developed international equity markets, as measured by the Morgan Stanley Capital InternationalSM Europe, Australasia, and Far East (MSCI® EAFE®) Index - a performance monitor of established markets outside the United States and Canada - rose 25.09%. In comparison, the Standard & Poor's 500SM Index, a gauge of U.S. stocks, was up 14.56%. Among countries making up at least 1% of the EAFE benchmark, Finland had the best showing, soaring nearly 69%, while Hong Kong gained roughly 66%. The United Kingdom and Japan, the two largest components of the index, both underperformed. Fallout from the credit crunch and concerns about export growth tempered U.K. stocks, while Japan struggled with a slowdown in consumer spending and sluggish domestic growth. Emerging markets were the period's big winners, advancing 68.33% as measured by the MSCI Emerging Markets index.
The fund's Class A, Class T, Class B and Class C shares produced solid absolute returns of 24.76%, 24.47%, 23.85% and 23.85%, respectively (excluding sales charges), for the year. These results trailed the 32.60% advance of the MSCI All Country World ex USA index, mainly due to unrewarding stock selection. I held big stakes in two North American pulp and paper companies - Catalyst Paper and AbitibiBowater - believing they would benefit from consolidation in this over-capacity industry. Both stocks disappointed and were a significant drag on relative performance. Unproductive stock selection in financials - especially Japan's Shinsei Bank and U.K. reinsurance broker Benfield Group - also hurt, as did Japanese farm equipment manufacturer Kubota and positions in cash and sovereign bonds. Upside performance came from several stocks with leverage to global agriculture, which benefited from favorable supply/demand dynamics. Among the top contributors were Saskatchewan Wheat Pool, a dominant player in Canada's grain business; two large makers of farm equipment - U.S.-based Deere & Co. and Netherlands-based CNH Global; and Fiat, the Italian automaker. Some of the stocks I've mentioned were sold by period end.
Note to shareholders: Sammy Simnegar will become Portfolio Manager of the fund on January 1, 2008, replacing Darren Maupin.
The views expressed above reflect those of the portfolio manager(s) only through the end of the period as stated on the cover of this report and do not necessarily represent the views of Fidelity or any other person in the Fidelity organization. Any such views are subject to change at any time based upon market or other conditions and Fidelity disclaims any responsibility to update such views. These views may not be relied on as investment advice and, because investment decisions for a Fidelity fund are based on numerous factors, may not be relied on as an indication of trading intent on behalf of any Fidelity fund.
Annual Report
Shareholder Expense Example
As a shareholder of the Fund, you incur two types of costs: (1) transaction costs, including sales charges (loads) on purchase payments or redemption proceeds, redemption fees, and (2) ongoing costs, including management fees, distribution and/or service (12b-1) fees and other Fund expenses. This Example is intended to help you understand your ongoing costs (in dollars) of investing in the Fund and to compare these costs with the ongoing costs of investing in other mutual funds.
The Example is based on an investment of $1,000 invested at the beginning of the period and held for the entire period (May 1, 2007 to October 31, 2007).
Actual Expenses
The first line of the accompanying table for each class of the Fund provides information about actual account values and actual expenses. You may use the information in this line, together with the amount you invested, to estimate the expenses that you paid over the period. Simply divide your account value by $1,000.00 (for example, an $8,600 account value divided by $1,000.00 = 8.6), then multiply the result by the number in the first line for a class of the Fund under the heading entitled "Expenses Paid During Period" to estimate the expenses you paid on your account during this period. In addition, the Fund, as a shareholder in the underlying Fidelity Central Funds, will indirectly bear its pro rata share of the fees and expenses incurred by the underlying Fidelity Central Funds. These fees and expenses are not included in the Fund's annualized expense ratio used to calculate the expense estimate in the table below.
Hypothetical Example for Comparison Purposes
The second line of the accompanying table for each class of the Fund provides information about hypothetical account values and hypothetical expenses based on a Class' actual expense ratio and an assumed rate of return of 5% per year before expenses, which is not the Class' actual return. The hypothetical account values and expenses may not be used to estimate the actual ending account balance or expenses you paid for the period. You may use this information to compare the ongoing costs of investing in the Fund and other funds. To do so, compare this 5% hypothetical example with the 5% hypothetical examples that appear in the shareholder reports of the other funds. In addition, the Fund, as a shareholder in the underlying Fidelity Central Funds, will indirectly bear its pro rata share of the fees and expenses incurred by the underlying Fidelity Central Funds. These fees and expenses are not included in the Fund's annualized expense ratio used to calculate the expense estimate in the table below.
Annual Report
Shareholder Expense Example - continued
Please note that the expenses shown in the table are meant to highlight your ongoing costs only and do not reflect any transaction costs. Therefore, the second line of the table is useful in comparing ongoing costs only, and will not help you determine the relative total costs of owning different funds. In addition, if these transactional costs were included, your costs would have been higher.
| Beginning
Account Value
May 1, 2007 | Ending
Account Value
October 31, 2007 | Expenses Paid
During Period*
May 1, 2007
to October 31, 2007 |
Class A | | | |
Actual | $ 1,000.00 | $ 1,065.10 | $ 7.76 |
HypotheticalA | $ 1,000.00 | $ 1,017.69 | $ 7.58 |
Class T | | | |
Actual | $ 1,000.00 | $ 1,063.70 | $ 8.84 |
HypotheticalA | $ 1,000.00 | $ 1,016.64 | $ 8.64 |
Class B | | | |
Actual | $ 1,000.00 | $ 1,061.10 | $ 11.64 |
HypotheticalA | $ 1,000.00 | $ 1,013.91 | $ 11.37 |
Class C | | | |
Actual | $ 1,000.00 | $ 1,060.90 | $ 11.48 |
HypotheticalA | $ 1,000.00 | $ 1,014.06 | $ 11.22 |
Institutional Class | | | |
Actual | $ 1,000.00 | $ 1,066.80 | $ 6.04 |
HypotheticalA | $ 1,000.00 | $ 1,019.36 | $ 5.90 |
A 5% return per year before expenses
* Expenses are equal to each Class' annualized expense ratio (shown in the table below); multiplied by the average account value over the period, multiplied by 184/365 (to reflect the one-half year period).
| Annualized
Expense Ratio |
Class A | 1.49% |
Class T | 1.70% |
Class B | 2.24% |
Class C | 2.21% |
Institutional Class | 1.16% |
Annual Report
Investment Changes
Top Five Stocks as of October 31, 2007 |
| % of fund's
net assets | % of fund's net assets
6 months ago |
Hutchison Whampoa Ltd. (Hong Kong, Industrial Conglomerates) | 5.8 | 0.0 |
Kubota Corp. (Japan, Machinery) | 4.7 | 1.9 |
Takeda Pharamaceutical Co. Ltd. (Japan, Pharmaceuticals) | 4.0 | 0.3 |
Gold Fields Ltd. (South Africa, Metals & Mining) | 4.0 | 4.9 |
AbitibiBowater, Inc. (United States of America, Paper & Forest Products) | 3.7 | 0.0 |
| 22.2 | |
Top Five Market Sectors as of October 31, 2007 |
| % of fund's
net assets | % of fund's net assets
6 months ago |
Materials | 22.6 | 20.9 |
Health Care | 13.0 | 7.5 |
Financials | 12.5 | 9.3 |
Industrials | 10.9 | 9.4 |
Energy | 8.7 | 9.2 |
Top Five Countries as of October 31, 2007 |
(excluding cash equivalents) | % of fund's
net assets | % of fund's net assets
6 months ago |
Japan | 29.4 | 17.8 |
Canada | 20.2 | 18.5 |
United States of America | 9.4 | 10.7 |
Hong Kong | 5.8 | 0.0 |
Germany | 4.9 | 4.7 |
Percentages are adjusted for the effect of open futures contracts, if applicable. |
Asset Allocation (% of fund's net assets) |
As of October 31, 2007 | As of April 30, 2007 |
| Stocks 91.2% | | | Stocks 88.4% | |
| Bonds 1.1% | | | Bonds 1.0% | |
| Short-Term
Investments and
Net Other Assets 7.7% | | | Short-Term
Investments and
Net Other Assets 10.6% | |

Annual Report
Investments October 31, 2007
Showing Percentage of Net Assets
Common Stocks - 89.4% |
| Shares | | Value |
Argentina - 2.3% |
Cresud S.A.C.I.F. y A. sponsored ADR (e) | 175,138 | | $ 4,322,406 |
Inversiones y Representaciones SA sponsored GDR (a) | 92,500 | | 1,652,050 |
Pampa Holding SA (a) | 3,998,420 | | 3,576,780 |
TOTAL ARGENTINA | | 9,551,236 |
Australia - 0.5% |
ABB Grain Ltd. | 237,122 | | 1,669,220 |
Newcrest Mining Ltd. | 9,965 | | 303,767 |
TOTAL AUSTRALIA | | 1,972,987 |
Canada - 20.2% |
Absolut Resources Corp. (a) | 995,000 | | 1,043,264 |
Aquiline Resources, Inc. (a) | 814,800 | | 9,155,929 |
Aquiline Resources, Inc. (a)(f) | 354,100 | | 3,979,031 |
Canadian Natural Resources Ltd. | 90,100 | | 7,496,564 |
Canfor Corp. (a) | 730,700 | | 6,771,473 |
Catalyst Paper Corp. (a) | 4,595,600 | | 6,911,409 |
European Goldfields Ltd. (a) | 1,278,100 | | 8,690,322 |
Guyana Goldfields, Inc. (a) | 227,800 | | 2,352,309 |
IAMGOLD Corp. | 1,037,200 | | 9,095,548 |
NuVista Energy Ltd. (a) | 147,900 | | 2,305,749 |
ProEx Energy Ltd. (a) | 286,500 | | 4,427,065 |
Saskatchewan Wheat Pool, Inc. (a) | 8,400 | | 113,607 |
Saskatchewan Wheat Pool, Inc. (a)(f) | 596,400 | | 8,066,117 |
Suncor Energy, Inc. | 45,500 | | 4,985,146 |
Trican Well Service Ltd. | 424,200 | | 8,985,384 |
TOTAL CANADA | | 84,378,917 |
Cayman Islands - 2.2% |
Apex Silver Mines Ltd. (a) | 189,900 | | 3,892,950 |
Hutchison Telecommunications International Ltd. (a) | 3,676,000 | | 5,246,772 |
TOTAL CAYMAN ISLANDS | | 9,139,722 |
Czech Republic - 2.5% |
Philip Morris CR AS | 20,075 | | 10,472,880 |
France - 3.0% |
Sanofi-Aventis sponsored ADR (e) | 279,600 | | 12,305,196 |
Germany - 4.9% |
E.ON AG | 64,700 | | 12,635,910 |
Lanxess AG | 157,100 | | 7,845,595 |
TOTAL GERMANY | | 20,481,505 |
Common Stocks - continued |
| Shares | | Value |
Hong Kong - 5.8% |
Hutchison Whampoa Ltd. | 1,934,000 | | $ 24,368,401 |
Japan - 24.9% |
Aioi Insurance Co. Ltd. | 1,037,000 | | 6,028,453 |
Canon, Inc. | 79,700 | | 4,030,429 |
Kose Corp. (e) | 376,100 | | 9,654,570 |
Kubota Corp. | 2,026,000 | | 17,012,710 |
Kubota Corp. sponsored ADR | 58,300 | | 2,454,430 |
Millea Holdings, Inc. | 152,768 | | 5,997,672 |
Mitsui Marine & Fire Insurance Co. Ltd. | 491,000 | | 5,632,434 |
Nec Electronics Corp. (a) | 30,200 | | 827,580 |
Nissin Healthcare Food Service Co. | 37,700 | | 461,505 |
Parco Co. Ltd. | 340,500 | | 4,768,046 |
Seino Holdings Co. Ltd. | 211,000 | | 1,812,174 |
SFCG Co. Ltd. | 44,330 | | 7,354,380 |
Shinsei Bank Ltd. | 4,253,000 | | 13,788,125 |
Takeda Pharmaceutical Co. Ltd. | 269,200 | | 16,819,083 |
Tokyo Steel Manufacturing Co. Ltd. | 120,200 | | 1,667,119 |
Torii Pharmaceutical Co. Ltd. | 76,800 | | 1,353,724 |
Tsutsumi Jewelry Co. Ltd. | 90,600 | | 1,982,186 |
USS Co. Ltd. | 31,550 | | 2,066,992 |
TOTAL JAPAN | | 103,711,612 |
Korea (South) - 0.0% |
Samwhan Corp. | 10 | | 335 |
Netherlands - 2.8% |
Koninklijke Philips Electronics NV (e) | 284,200 | | 11,748,828 |
Philippines - 2.0% |
DMCI Holdings, Inc. | 12,042,000 | | 3,327,668 |
Semirara Mining Corp. | 4,601,500 | | 4,768,394 |
TOTAL PHILIPPINES | | 8,096,062 |
South Africa - 4.0% |
Gold Fields Ltd. | 140,700 | | 2,542,449 |
Gold Fields Ltd. sponsored ADR | 789,700 | | 14,269,879 |
TOTAL SOUTH AFRICA | | 16,812,328 |
Switzerland - 2.4% |
Actelion Ltd. (Reg.) (a) | 204,100 | | 10,140,685 |
Taiwan - 2.5% |
Taiwan Mobile Co. Ltd. | 7,812,000 | | 10,465,837 |
Common Stocks - continued |
| Shares | | Value |
United States of America - 9.4% |
AbitibiBowater, Inc. (e) | 443,951 | | $ 15,209,761 |
Deere & Co. | 800 | | 123,920 |
Synthes, Inc. | 110,016 | | 13,734,191 |
Virgin Media, Inc. | 458,490 | | 10,137,214 |
TOTAL UNITED STATES OF AMERICA | | 39,205,086 |
TOTAL COMMON STOCKS (Cost $341,373,385) | 372,851,617 |
Nonconvertible Preferred Stocks - 1.8% |
| | | |
Italy - 1.8% |
Istituto Finanziario Industriale SpA (IFI) (a)
(Cost $7,010,136) | 179,700 | | 7,482,441 |
Government Obligations - 5.6% |
| Principal
Amount (d) | | |
Japan - 4.5% |
Japan Government 0.5953% to 0.6503% 11/5/07
to 1/21/08 | JPY | 2,150,000,000 | | 18,627,309 |
Switzerland - 1.1% |
Switzerland Confederation 4.25% 1/8/08 | CHF | 5,573,000 | | 4,826,277 |
TOTAL GOVERNMENT OBLIGATIONS (Cost $22,770,599) | 23,453,586 |
Money Market Funds - 6.2% |
| Shares | | Value |
Fidelity Cash Central Fund, 4.97% (b) | 9,932,507 | | $ 9,932,507 |
Fidelity Securities Lending Cash Central Fund, 5.02% (b)(c) | 16,078,670 | | 16,078,670 |
TOTAL MONEY MARKET FUNDS (Cost $26,011,177) | 26,011,177 |
TOTAL INVESTMENT PORTFOLIO - 103.0% (Cost $397,165,297) | | 429,798,821 |
NET OTHER ASSETS - (3.0)% | | (12,456,471) |
NET ASSETS - 100% | $ 417,342,350 |
Forward Foreign Currency Contracts |
| Settlement Dates | | Value | | Unrealized Appreciation/
(Depreciation) |
Contracts to Buy |
885,642 AUD | Nov. 2007 | | $ 824,229 | | $ 24,229 |
941,448 CHF | Nov. 2007 | | 813,651 | | 13,651 |
3,020,108 EUR | Nov. 2007 | | 4,376,622 | | 76,622 |
1,374,274 GBP | Nov. 2007 | | 2,855,839 | | 55,839 |
292,897,500 JPY | Nov. 2007 | | 2,543,906 | | 43,906 |
| | $ 11,414,247 | | $ 214,247 |
|
(Payable Amount $11,200,000) |
The value of contracts to buy as a percentage of net assets - 2.7% |
|
Currency Abbreviations |
AUD | - | Australian dollar |
CHF | - | Swiss franc |
EUR | - | European Monetary Unit |
GBP | - | British pound |
JPY | - | Japanese yen |
Legend |
(a) Non-income producing |
(b) Affiliated fund that is available only to investment companies and other accounts managed by Fidelity Investments. The rate quoted is the annualized seven-day yield of the fund at period end. A complete unaudited listing of the fund's holdings as of its most recent quarter end is available upon request. |
(c) Investment made with cash collateral received from securities on loan. |
(d) Principal amount is stated in United States dollars unless otherwise noted. |
(e) Security or a portion of the security is on loan at period end. |
(f) Security exempt from registration under Rule 144A of the Securities Act of 1933. These securities may be resold in transactions exempt from registration, normally to qualified institutional buyers. At the end of the period, the value of these securities amounted to $12,045,148 or 2.9% of net assets. |
Affiliated Central Funds |
Information regarding fiscal year to date income earned by the Fund from investments in Fidelity Central Funds is as follows: |
Fund | Income earned |
Fidelity Cash Central Fund | $ 1,545,973 |
Fidelity Securities Lending Cash Central Fund | 432,880 |
Total | $ 1,978,853 |
See accompanying notes which are an integral part of the financial statements.
Annual Report
Financial Statements
Statement of Assets and Liabilities
| October 31, 2007 |
| | |
Assets | | |
Investment in securities, at value (including securities loaned of $15,288,536) - See accompanying schedule: Unaffiliated issuers (cost $371,154,120) | $ 403,787,644 | |
Fidelity Central Funds (cost $26,011,177) | 26,011,177 | |
Total Investments (cost $397,165,297) | | $ 429,798,821 |
Receivable for investments sold | | 8,742,692 |
Unrealized appreciation on foreign currency contracts | | 214,247 |
Receivable for fund shares sold | | 177,950 |
Dividends receivable | | 520,161 |
Interest receivable | | 165,858 |
Distributions receivable from Fidelity Central Funds | | 74,076 |
Prepaid expenses | | 212 |
Other receivables | | 38,645 |
Total assets | | 439,732,662 |
| | |
Liabilities | | |
Payable for investments purchased | $ 4,368,614 | |
Payable for fund shares redeemed | 930,997 | |
Accrued management fee | 242,733 | |
Distribution fees payable | 184,798 | |
Other affiliated payables | 111,586 | |
Other payables and accrued expenses | 472,914 | |
Collateral on securities loaned, at value | 16,078,670 | |
Total liabilities | | 22,390,312 |
| | |
Net Assets | | $ 417,342,350 |
Net Assets consist of: | | |
Paid in capital | | $ 295,855,525 |
Undistributed net investment income | | 315,878 |
Accumulated undistributed net realized gain (loss) on investments and foreign currency transactions | | 88,421,478 |
Net unrealized appreciation (depreciation) on investments and assets and liabilities in foreign currencies | | 32,749,469 |
Net Assets | | $ 417,342,350 |
See accompanying notes which are an integral part of the financial statements.
Annual Report
Financial Statements - continued
Statement of Assets and Liabilities - continued
| October 31, 2007 |
| | |
Calculation of Maximum Offering Price
Class A:
Net Asset Value and redemption price per share ($113,579,162 ÷ 6,093,662 shares) | | $ 18.64 |
| | |
Maximum offering price per share (100/94.25 of $18.64) | | $ 19.78 |
Class T:
Net Asset Value and redemption price per share ($179,989,719 ÷ 9,792,850 shares) | | $ 18.38 |
| | |
Maximum offering price per share (100/96.50 of $18.38) | | $ 19.05 |
Class B:
Net Asset Value and offering price per share ($40,013,139 ÷ 2,305,253 shares)A | | $ 17.36 |
| | |
Class C:
Net Asset Value and offering price per share ($66,297,673 ÷ 3,805,577 shares)A | | $ 17.42 |
| | |
| | |
Institutional Class:
Net Asset Value, offering price and redemption price per share ($17,462,657 ÷ 895,821 shares) | | $ 19.49 |
A Redemption price per share is equal to net asset value less any applicable contingent deferred sales charge.
See accompanying notes which are an integral part of the financial statements.
Annual Report
Statement of Operations
| Year ended October 31, 2007 |
| | |
Investment Income | | |
Dividends | | $ 6,429,744 |
Interest | | 94,421 |
Income from Fidelity Central Funds (including $432,880 from security lending) | | 1,978,853 |
| | 8,503,018 |
Less foreign taxes withheld | | (623,465) |
Total income | | 7,879,553 |
| | |
Expenses | | |
Management fee | $ 3,134,900 | |
Transfer agent fees | 1,227,776 | |
Distribution fees | 2,378,420 | |
Accounting and security lending fees | 236,815 | |
Custodian fees and expenses | 196,541 | |
Independent trustees' compensation | 1,515 | |
Registration fees | 85,210 | |
Audit | 85,542 | |
Legal | 13,931 | |
Miscellaneous | 316,276 | |
Total expenses before reductions | 7,676,926 | |
Expense reductions | (340,867) | 7,336,059 |
Net investment income (loss) | | 543,494 |
Realized and Unrealized Gain (Loss) Net realized gain (loss) on: | | |
Investment securities: | | |
Unaffiliated issuers (net of foreign taxes of $143,675) | 88,903,766 | |
Foreign currency transactions | 732,166 | |
Total net realized gain (loss) | | 89,635,932 |
Change in net unrealized appreciation (depreciation) on: Investment securities (net of increase in deferred foreign taxes of $95,467) | 5,888,253 | |
Assets and liabilities in foreign currencies | 391,523 | |
Total change in net unrealized appreciation (depreciation) | | 6,279,776 |
Net gain (loss) | | 95,915,708 |
Net increase (decrease) in net assets resulting from operations | | $ 96,459,202 |
See accompanying notes which are an integral part of the financial statements.
Annual Report
Financial Statements - continued
Statement of Changes in Net Assets
| Year ended
October 31,
2007 | Year ended
October 31,
2006 |
Increase (Decrease) in Net Assets | | |
Operations | | |
Net investment income (loss) | $ 543,494 | $ 2,266,586 |
Net realized gain (loss) | 89,635,932 | 89,037,741 |
Change in net unrealized appreciation (depreciation) | 6,279,776 | (5,423,613) |
Net increase (decrease) in net assets resulting
from operations | 96,459,202 | 85,880,714 |
Distributions to shareholders from net investment income | (1,726,224) | (3,614,527) |
Distributions to shareholders from net realized gain | (71,372,564) | (64,341,523) |
Total distributions | (73,098,788) | (67,956,050) |
Share transactions - net increase (decrease) | (47,012,739) | (241,477,433) |
Redemption fees | 75,033 | 71,076 |
Total increase (decrease) in net assets | (23,577,292) | (223,481,693) |
| | |
Net Assets | | |
Beginning of period | 440,919,642 | 664,401,335 |
End of period (including undistributed net investment income of $315,878 and undistributed net investment income of $2,185,614, respectively) | $ 417,342,350 | $ 440,919,642 |
See accompanying notes which are an integral part of the financial statements.
Annual Report
Financial Highlights - Class A
Years ended October 31, | 2007 | 2006 | 2005 | 2004 | 2003 |
Selected Per-Share Data | | | | | |
Net asset value, beginning of period | $ 17.79 | $ 17.38 | $ 15.40 | $ 14.47 | $ 10.93 |
Income from Investment Operations | | | | | |
Net investment income (loss) C | .07 | .12 | .12 | .01 | - G |
Net realized and unrealized gain (loss) | 3.81 | 2.73 | 1.86 | .92 | 3.54 |
Total from investment operations | 3.88 | 2.85 | 1.98 | .93 | 3.54 |
Distributions from net investment income | (.12) | (.20) | - | - | - |
Distributions from net realized gain | (2.90) | (2.24) | - | - | - |
Total distributions | (3.03) H | (2.44) | - | - | - |
Redemption fees added to paid in capital C | - G | - G | - G | - G | - |
Net asset value, end of period | $ 18.64 | $ 17.79 | $ 17.38 | $ 15.40 | $ 14.47 |
Total Return A,B | 24.76% | 17.62% | 12.86% | 6.43% | 32.39% |
Ratios to Average Net Assets D,F | | | | | |
Expenses before reductions | 1.47% | 1.43% | 1.44% | 1.48% | 1.59% |
Expenses net of fee waivers, if any | 1.47% | 1.43% | 1.44% | 1.48% | 1.59% |
Expenses net of all reductions | 1.39% | 1.32% | 1.30% | 1.40% | 1.54% |
Net investment income (loss) | .39% | .70% | .71% | .06% | .01% |
Supplemental Data | | | | | |
Net assets, end of period (000 omitted) | $ 113,579 | $ 110,240 | $ 113,809 | $ 103,606 | $ 41,867 |
Portfolio turnover rate E | 146% | 170% | 176% | 170% | 205% |
A Total returns would have been lower had certain expenses not been reduced during the periods shown.
B Total returns do not include the effect of the sales charges.
C Calculated based on average shares outstanding during the period.
D Fees and expenses of the underlying Fidelity Central Funds are not included in the Fund's expense ratio. The Fund indirectly bears its proportionate share of the expenses of any underlying Fidelity Central Funds.
E Amount does not include the portfolio activity of any underlying Fidelity Central Funds.
F Expense ratios reflect operating expenses of the class. Expenses before reductions do not reflect amounts reimbursed by the investment adviser or reductions from brokerage service arrangements or other expense offset arrangements and do not represent the amount paid by the class during periods when reimbursements or reductions occur. Expenses net of fee waivers reflect expenses after reimbursement by the investment adviser but prior to reductions from brokerage service arrangements or other expense offset arrangements. Expenses net of all reductions represent the net expenses paid by the class.
G Amount represents less than $.01 per share.
H Total distributions of $3.026 per share is comprised of distributions from net investment income of $.123 and distributions from net realized gain of $2.903 per share.
See accompanying notes which are an integral part of the financial statements.
Annual Report
Financial Highlights - Class T
Years ended October 31, | 2007 | 2006 | 2005 | 2004 | 2003 |
Selected Per-Share Data | | | | | |
Net asset value, beginning of period | $ 17.57 | $ 17.18 | $ 15.26 | $ 14.38 | $ 10.88 |
Income from Investment Operations | | | | | |
Net investment income (loss) C | .03 | .08 | .08 | (.03) | (.03) |
Net realized and unrealized gain (loss) | 3.76 | 2.70 | 1.84 | .91 | 3.53 |
Total from investment operations | 3.79 | 2.78 | 1.92 | .88 | 3.50 |
Distributions from net investment income | (.07) | (.15) | - | - | - |
Distributions from net realized gain | (2.90) | (2.24) | - | - | - |
Total distributions | (2.98) H | (2.39) | - | - | - |
Redemption fees added to paid in capital C | - G | - G | - G | - G | - |
Net asset value, end of period | $ 18.38 | $ 17.57 | $ 17.18 | $ 15.26 | $ 14.38 |
Total Return A,B | 24.47% | 17.38% | 12.58% | 6.12% | 32.17% |
Ratios to Average Net Assets D,F | | | | | |
Expenses before reductions | 1.69% | 1.65% | 1.67% | 1.74% | 1.85% |
Expenses net of fee waivers, if any | 1.69% | 1.65% | 1.67% | 1.74% | 1.85% |
Expenses net of all reductions | 1.61% | 1.54% | 1.53% | 1.66% | 1.79% |
Net investment income (loss) | .18% | .48% | .47% | (.20)% | (.24)% |
Supplemental Data | | | | | |
Net assets, end of period (000 omitted) | $ 179,990 | $ 188,320 | $ 216,717 | $ 216,588 | $ 149,514 |
Portfolio turnover rate E | 146% | 170% | 176% | 170% | 205% |
A Total returns would have been lower had certain expenses not been reduced during the periods shown.
B Total returns do not include the effect of the sales charges.
C Calculated based on average shares outstanding during the period.
D Fees and expenses of the underlying Fidelity Central Funds are not included in the Fund's expense ratio. The Fund indirectly bears its proportionate share of the expenses of any underlying Fidelity Central Funds.
E Amount does not include the portfolio activity of any underlying Fidelity Central Funds.
F Expense ratios reflect operating expenses of the class. Expenses before reductions do not reflect amounts reimbursed by the investment adviser or reductions from brokerage service arrangements or other expense offset arrangements and do not represent the amount paid by the class during periods when reimbursements or reductions occur. Expenses net of fee waivers reflect expenses after reimbursement by the investment adviser but prior to reductions from brokerage service arrangements or other expense offset arrangements. Expenses net of all reductions represent the net expenses paid by the class.
G Amount represents less than $.01 per share.
H Total distributions of $2.977 per share is comprised of distributions from net investment income of $.074 and distributions from net realized gain of $2.903 per share.
See accompanying notes which are an integral part of the financial statements.
Annual Report
Financial Highlights - Class B
Years ended October 31, | 2007 | 2006 | 2005 | 2004 | 2003 |
Selected Per-Share Data | | | | | |
Net asset value, beginning of period | $ 16.72 | $ 16.46 | $ 14.70 | $ 13.94 | $ 10.61 |
Income from Investment Operations | | | | | |
Net investment income (loss) C | (.06) | (.02) | (.02) | (.12) | (.09) |
Net realized and unrealized gain (loss) | 3.57 | 2.57 | 1.78 | .88 | 3.42 |
Total from investment operations | 3.51 | 2.55 | 1.76 | .76 | 3.33 |
Distributions from net investment income | - | (.05) | - | - | - |
Distributions from net realized gain | (2.87) | (2.24) | - | - | - |
Total distributions | (2.87) H | (2.29) | - | - | - |
Redemption fees added to paid in capital C | - G | - G | - G | - G | - |
Net asset value, end of period | $ 17.36 | $ 16.72 | $ 16.46 | $ 14.70 | $ 13.94 |
Total Return A,B | 23.85% | 16.58% | 11.97% | 5.45% | 31.39% |
Ratios to Average Net Assets D,F | | | | | |
Expenses before reductions | 2.24% | 2.26% | 2.27% | 2.35% | 2.42% |
Expenses net of fee waivers, if any | 2.24% | 2.25% | 2.27% | 2.35% | 2.42% |
Expenses net of all reductions | 2.17% | 2.14% | 2.13% | 2.27% | 2.37% |
Net investment income (loss) | (.38)% | (.13)% | (.13)% | (.80)% | (.82)% |
Supplemental Data | | | | | |
Net assets, end of period (000 omitted) | $ 40,013 | $ 51,661 | $ 57,168 | $ 59,985 | $ 50,358 |
Portfolio turnover rate E | 146% | 170% | 176% | 170% | 205% |
A Total returns would have been lower had certain expenses not been reduced during the periods shown.
B Total returns do not include the effect of the contingent deferred sales charge.
C Calculated based on average shares outstanding during the period.
D Fees and expenses of the underlying Fidelity Central Funds are not included in the Fund's expense ratio. The Fund indirectly bears its proportionate share of the expenses of any underlying Fidelity Central Funds.
E Amount does not include the portfolio activity of any underlying Fidelity Central Funds.
F Expense ratios reflect operating expenses of the class. Expenses before reductions do not reflect amounts reimbursed by the investment adviser or reductions from brokerage service arrangements or other expense offset arrangements and do not represent the amount paid by the class during periods when reimbursements or reductions occur. Expenses net of fee waivers reflect expenses after reimbursement by the investment adviser but prior to reductions from brokerage service arrangements or other expense offset arrangements. Expenses net of all reductions represent the net expenses paid by the class.
G Amount represents less than $.01 per share.
H Total distributions of $2.869 per share is comprised of distributions from net realized gain of $2.869 per share.
See accompanying notes which are an integral part of the financial statements.
Annual Report
Financial Highlights - Class C
Years ended October 31, | 2007 | 2006 | 2005 | 2004 | 2003 |
Selected Per-Share Data | | | | | |
Net asset value, beginning of period | $ 16.80 | $ 16.52 | $ 14.74 | $ 13.96 | $ 10.62 |
Income from Investment Operations | | | | | |
Net investment income (loss) C | (.05) | (.01) | - G | (.10) | (.08) |
Net realized and unrealized gain (loss) | 3.57 | 2.60 | 1.78 | .88 | 3.42 |
Total from investment operations | 3.52 | 2.59 | 1.78 | .78 | 3.34 |
Distributions from net investment income | - | (.07) | - | - | - |
Distributions from net realized gain | (2.90) | (2.24) | - | - | - |
Total distributions | (2.90) H | (2.31) | - | - | - |
Redemption fees added to paid in capital C | - G | - G | - G | - G | - |
Net asset value, end of period | $ 17.42 | $ 16.80 | $ 16.52 | $ 14.74 | $ 13.96 |
Total Return A,B | 23.85% | 16.75% | 12.08% | 5.59% | 31.45% |
Ratios to Average Net Assets D,F | | | | | |
Expenses before reductions | 2.19% | 2.16% | 2.17% | 2.21% | 2.33% |
Expenses net of fee waivers, if any | 2.19% | 2.16% | 2.17% | 2.21% | 2.33% |
Expenses net of all reductions | 2.12% | 2.05% | 2.04% | 2.12% | 2.28% |
Net investment income (loss) | (.33)% | (.03)% | (.03)% | (.66)% | (.73)% |
Supplemental Data | | | | | |
Net assets, end of period (000 omitted) | $ 66,298 | $ 66,162 | $ 67,429 | $ 76,412 | $ 58,560 |
Portfolio turnover rate E | 146% | 170% | 176% | 170% | 205% |
A Total returns would have been lower had certain expenses not been reduced during the periods shown.
B Total returns do not include the effect of the contingent deferred sales charge.
C Calculated based on average shares outstanding during the period.
D Fees and expenses of the underlying Fidelity Central Funds are not included in the Fund's expense ratio. The Fund indirectly bears its proportionate share of the expenses of any underlying Fidelity Central Funds.
E Amount does not include the portfolio activity of any underlying Fidelity Central Funds.
F Expense ratios reflect operating expenses of the class. Expenses before reductions do not reflect amounts reimbursed by the investment adviser or reductions from brokerage service arrangements or other expense offset arrangements and do not represent the amount paid by the class during periods when reimbursements or reductions occur. Expenses net of fee waivers reflect expenses after reimbursement by the investment adviser but prior to reductions from brokerage service arrangements or other expense offset arrangements. Expenses net of all reductions represent the net expenses paid by the class.
G Amount represents less than $.01 per share.
H Total distributions of $2.903 per share is comprised of distributions from net realized gain of $2.903 per share.
See accompanying notes which are an integral part of the financial statements.
Annual Report
Financial Highlights - Institutional Class
Years ended October 31, | 2007 | 2006 | 2005 | 2004 | 2003 |
Selected Per-Share Data | | | | | |
Net asset value, beginning of period | $ 18.46 | $ 17.70 | $ 15.65 | $ 14.70 | $ 11.08 |
Income from Investment Operations | | | | | |
Net investment income (loss) B | .13 | .20 | .16 | .05 | .04 |
Net realized and unrealized gain (loss) | 3.97 | 2.80 | 1.89 | .94 | 3.58 |
Total from investment operations | 4.10 | 3.00 | 2.05 | .99 | 3.62 |
Distributions from net investment income | (.17) | - | - | (.04) | - |
Distributions from net realized gain | (2.90) | (2.24) | - | - | - |
Total distributions | (3.07) G | (2.24) | - | (.04) | - |
Redemption fees added to paid in capital B | - F | - F | - F | - F | - |
Net asset value, end of period | $ 19.49 | $ 18.46 | $ 17.70 | $ 15.65 | $ 14.70 |
Total Return A | 25.16% | 18.09% | 13.10% | 6.75% | 32.67% |
Ratios to Average Net Assets C,E | | | | | |
Expenses before reductions | 1.14% | 1.04% | 1.23% | 1.21% | 1.28% |
Expenses net of fee waivers, if any | 1.14% | 1.04% | 1.23% | 1.21% | 1.28% |
Expenses net of all reductions | 1.07% | .93% | 1.09% | 1.13% | 1.22% |
Net investment income (loss) | .72% | 1.08% | .92% | .34% | .33% |
Supplemental Data | | | | | |
Net assets, end of period (000 omitted) | $ 17,463 | $ 24,536 | $ 209,278 | $ 210,160 | $ 246,623 |
Portfolio turnover rate D | 146% | 170% | 176% | 170% | 205% |
A Total returns would have been lower had certain expenses not been reduced during the periods shown.
B Calculated based on average shares outstanding during the period.
C Fees and expenses of the underlying Fidelity Central Funds are not included in the Fund's expense ratio. The Fund indirectly bears its proportionate share of the expenses of any underlying Fidelity Central Funds.
D Amount does not include the portfolio activity of any underlying Fidelity Central Funds.
E Expense ratios reflect operating expenses of the class. Expenses before reductions do not reflect amounts reimbursed by the investment adviser or reductions from brokerage service arrangements or other expense offset arrangements and do not represent the amount paid by the class during periods when reimbursements or reductions occur. Expenses net of fee waivers reflect expenses after reimbursement by the investment adviser but prior to reductions from brokerage service arrangements or other expense offset arrangements. Expenses net of all reductions represent the net expenses paid by the class.
F Amount represents less than $.01 per share.
G Total distributions of $3.069 per share is comprised of distributions from net investment income of $.166 and distributions from net realized gain of $2.903 per share.
See accompanying notes which are an integral part of the financial statements.
Annual Report
Notes to Financial Statements
For the period ended October 31, 2007
1. Organization.
Fidelity Advisor International Capital Appreciation Fund (the Fund) is a fund of Fidelity Advisor Series VIII (the trust) and is authorized to issue an unlimited number of shares. The trust is registered under the Investment Company Act of 1940, as amended (the 1940 Act), as an open-end management investment company organized as a Massachusetts business trust. The Fund offers Class A, Class T, Class B, Class C, and Institutional Class shares, each of which has equal rights as to assets and voting privileges. Each class has exclusive voting rights with respect to matters that affect that class. Class B shares will automatically convert to Class A shares after a holding period of seven years from the initial date of purchase. Investment income, realized and unrealized capital gains and losses, the common expenses of the Fund, and certain fund-level expense reductions, if any, are allocated on a pro rata basis to each class based on the relative net assets of each class to the total net assets of the Fund. Each class differs with respect to transfer agent and distribution and service plan fees incurred. Certain expense reductions also differ by class. The Fund's investments in emerging markets can be subject to social, economic, regulatory, and political uncertainties and can be extremely volatile.
2. Investments in Fidelity Central Funds.
The Fund may invest in Fidelity Central Funds, which are open-end investment companies available only to other investment companies and accounts managed by Fidelity Management & Research Company (FMR) and its affiliates. The Fund's Schedule of Investments lists each of the Fidelity Central Funds as an investment of the Fund, but does not include the underlying holdings of each Fidelity Central Fund. As an Investing Fund, the Fund indirectly bears its proportionate share of the expenses of the underlying Fidelity Central Funds.
The Money Market Central Funds seek preservation of capital and current income and are managed by Fidelity Investments Money Management, Inc. (FIMM), an affiliate of FMR.
A complete list of holdings for each Fidelity Central Fund is available upon request or at the SEC's web site at www.sec.gov. In addition, the financial statements of the Fidelity Central Funds, which are not covered by the Fund's Report of Independent Registered Public Accounting Firm, are available on the SEC's web site or upon request.
3. Significant Accounting Policies.
The financial statements have been prepared in conformity with accounting principles generally accepted in the United States of America, which require management to make certain estimates and assumptions at the date of the financial statements. The following summarizes the significant accounting policies of the Fund:
Security Valuation. Investments are valued and net asset value (NAV) per share is calculated (NAV calculation) as of the close of business of the New York Stock Exchange
Annual Report
3. Significant Accounting Policies - continued
Security Valuation - continued
(NYSE), normally 4:00 p.m. Eastern time. Wherever possible, the Fund uses independent pricing services approved by the Board of Trustees to value its investments.
Equity securities, including restricted securities, for which market quotations are readily available, are valued at the last reported sale price or official closing price as reported by an independent pricing service on the primary market or exchange on which they are traded. In the event there were no sales during the day or closing prices are not available, securities are valued at the last quoted bid price.
Debt securities, including restricted securities, for which quotations are readily available, are valued by independent pricing services or by dealers who make markets in such securities. Pricing services consider yield or price of bonds of comparable quality, coupon, maturity and type as well as dealer supplied prices.
Investments in open-end mutual funds, including the Fidelity Central Funds, are valued at their closing net asset value each business day. Short-term securities with remaining maturities of sixty days or less for which quotations are not readily available are valued at amortized cost, which approximates value.
When current market prices or quotations are not readily available or do not accurately reflect fair value, valuations may be determined in accordance with procedures adopted by the Board of Trustees. For example, when developments occur between the close of a market and the close of the NYSE that may materially affect the value of some or all of the securities, or when trading in a security is halted, those securities may be fair valued. Factors used in the determination of fair value may include monitoring news to identify significant market or security specific events such as changes in the value of U.S. securities markets, reviewing developments in foreign markets and evaluating the performance of ADRs, futures contracts and exchange-traded funds. Because the Fund's utilization of fair value pricing depends on market activity, the frequency with which fair value pricing is used cannot be predicted and may be utilized to a significant extent. The value of securities used for NAV calculation under fair value pricing may differ from published prices for the same securities.
Foreign Currency. The Fund uses foreign currency contracts to facilitate transactions in foreign-denominated securities. Losses from these transactions may arise from changes in the value of the foreign currency or if the counterparties do not perform under the contracts' terms.
Foreign-denominated assets, including investment securities, and liabilities are translated into U.S. dollars at the exchange rate at period end. Purchases and sales of investment securities, income and dividends received and expenses denominated in foreign currencies are translated into U.S. dollars at the exchange rate in effect on the transaction date.
Annual Report
Notes to Financial Statements - continued
3. Significant Accounting Policies - continued
Foreign Currency - continued
The effects of exchange rate fluctuations on investments are included with the net realized and unrealized gain (loss) on investment securities. Other foreign currency transactions resulting in realized and unrealized gain (loss) are disclosed separately.
Investment Transactions and Income. For financial reporting purposes, the Fund's investment holdings and NAV include trades executed through the end of the last business day of the period. The NAV for processing shareholder transactions includes trades executed through the end of the prior business day. Gains and losses on securities sold are determined on the basis of identified cost and may include proceeds received from litigation. Dividend income is recorded on the ex-dividend date, except for certain dividends from foreign securities where the ex-dividend date may have passed, which are recorded as soon as the Fund is informed of the ex-dividend date. Non-cash dividends included in dividend income, if any, are recorded at the fair market value of the securities received. Interest income and distributions from the Fidelity Central Funds are accrued as earned. Interest income includes coupon interest and amortization of premium and accretion of discount on debt securities. Investment income is recorded net of foreign taxes withheld where recovery of such taxes is uncertain.
Expenses. Most expenses of the trust can be directly attributed to a fund. Expenses which cannot be directly attributed are apportioned among each Fund in the trust. Expense estimates are accrued in the period to which they relate and adjustments are made when actual amounts are known.
Income Tax Information and Distributions to Shareholders. Each year, the Fund intends to qualify as a regulated investment company by distributing all of its taxable income and realized gains under Subchapter M of the Internal Revenue Code. As a result, no provision for income taxes is required in the accompanying financial statements. Foreign taxes are provided for based on the Fund's understanding of the tax rules and rates that exist in the foreign markets in which it invests.
Distributions are recorded on the ex-dividend date. Income dividends and capital gain distributions are declared separately for each class. Income and capital gain distributions are determined in accordance with income tax regulations, which may differ from generally accepted accounting principles. In addition, the Fund will claim a portion of the payment made to redeeming shareholders as a distribution for income tax purposes.
Capital accounts within the financial statements are adjusted for permanent book-tax differences. These adjustments have no impact on net assets or the results of operations. Temporary book-tax differences will reverse in a subsequent period.
Book-tax differences are primarily due to foreign currency transactions, certain foreign taxes, passive foreign investment companies (PFIC), market discount and losses deferred due to wash sales.
Annual Report
3. Significant Accounting Policies - continued
Income Tax Information and Distributions to Shareholders - continued
The tax-basis components of distributable earnings and the federal tax cost as of period end were as follows:
Unrealized appreciation | $ 43,860,036 | |
Unrealized depreciation | (26,088,379) | |
Net unrealized appreciation (depreciation) | 17,771,657 | |
Undistributed ordinary income | 61,700,087 | |
Undistributed long-term capital gain | 25,200,880 | |
| | |
Cost for federal income tax purposes | $ 412,027,164 | |
The tax character of distributions paid was as follows:
| October 31, 2007 | October 31, 2006 |
Ordinary Income | $ 8,592,674 | $ 3,614,527 |
Long-term Capital Gains | 64,506,114 | 64,341,523 |
Total | $ 73,098,788 | $ 67,956,050 |
Short-Term Trading (Redemption) Fees. Shares held in the Fund less than 30 days are subject to a redemption fee equal to 1.00% of the proceeds of the redeemed shares. All redemption fees, including any estimated redemption fees paid by FMR, are retained by the Fund and accounted for as an addition to paid in capital.
New Accounting Pronouncements. In July 2006, Financial Accounting Standards Board Interpretation No. 48, Accounting for Uncertainty in Income Taxes - an interpretation of FASB Statement 109 (FIN 48), was issued and is effective on the last business day of the semiannual reporting period for fiscal years beginning after December 15, 2006. FIN 48 sets forth a threshold for financial statement recognition, measurement and disclosure of a tax position taken or expected to be taken on a tax return. Management has concluded that the adoption of FIN 48 will not result in a material impact on the Fund's net assets, results of operations and financial statement disclosures.
In addition, in September 2006, Statement of Financial Accounting Standards No. 157, Fair Value Measurements (SFAS 157), was issued and is effective for fiscal years beginning after November 15, 2007. SFAS 157 defines fair value, establishes a framework for measuring fair value and expands disclosures about fair value measurements. Management is currently evaluating the impact the adoption of SFAS 157 will have on the Fund's financial statement disclosures.
4. Operating Policies.
Forward Foreign Currency Contracts. The Fund generally uses foreign currency contracts to facilitate transactions in foreign-denominated securities and to manage the Fund's currency exposure. Contracts to sell generally are used to hedge the Fund's investments against currency fluctuations, while contracts to buy generally are used to offset a
Annual Report
Notes to Financial Statements - continued
4. Operating Policies - continued
Forward Foreign Currency Contracts - continued
previous contract to sell. Also, a contract to buy can be used to acquire exposure to foreign currencies and a contract to sell can be used to offset a previous contract to buy. These contracts involve market risk in excess of the unrealized gain or loss reflected in the Fund's Statement of Assets and Liabilities. The U.S. dollar value of the currencies the Fund has committed to buy or sell is shown in the Schedule of Investments under the caption "Forward Foreign Currency Contracts." This amount represents the aggregate exposure to each currency the Fund has acquired or hedged through currency contracts at period end. Losses may arise from changes in the value of foreign currency or if the counterparties do not perform under the contracts' terms.
The U.S. dollar value of forward foreign currency contracts is determined using forward currency exchange rates supplied by a quotation service. Purchases and sales of forward foreign currency contracts having the same settlement date and broker are offset and any realized gain (loss) recognized on the date of offset: otherwise, gain (loss) is recognized on settlement date. Contracts that have been offset with different counterparties are reflected as both a contract to buy and a contract to sell in the Schedule of Investments under the caption "Forward Foreign Currency Contracts."
Repurchase Agreements. FMR has received an Exemptive Order from the Securities and Exchange Commission (the SEC) which permits the Fund and other affiliated entities of FMR to transfer uninvested cash balances into joint trading accounts which are then invested in repurchase agreements. The Fund may also invest directly with institutions in repurchase agreements. Repurchase agreements are collateralized by government or non-government securities. Upon settlement date, collateral is held in segregated accounts with custodian banks and may be obtained in the event of a default of the counterparty. The Fund monitors, on a daily basis, the value of the collateral to ensure it is at least equal to the principal amount of the repurchase agreement (including accrued interest). In the event of a default by the counterparty, realization of the collateral proceeds could be delayed, during which time the value of the collateral may decline.
Restricted Securities. The Fund may invest in securities that are subject to legal or contractual restrictions on resale. These securities generally may be resold in transactions exempt from registration or to the public if the securities are registered. Disposal of these securities may involve time-consuming negotiations and expense, and prompt sale at an acceptable price may be difficult. Information regarding restricted securities is included at the end of the Fund's Schedule of Investments.
5. Purchases and Sales of Investments.
Purchases and sales of securities, other than short-term securities, aggregated $586,680,503 and $733,027,024, respectively.
Annual Report
6. Fees and Other Transactions with Affiliates.
Management Fee. FMR and its affiliates provide the Fund with investment management related services for which the Fund pays a monthly management fee. The management fee is the sum of an individual fund fee rate that is based on an annual rate of .45% of the Fund's average net assets and a group fee rate that averaged .26% during the period. The group fee rate is based upon the average net assets of all the mutual funds advised by FMR. The group fee rate decreases as assets under management increase and increases as assets under management decrease.
In addition, on July 18, 2007, shareholders approved a new management contract which adds a performance adjustment to the management fee (up to a maximum of .20% of the Fund's average net assets over a 36 month performance period). The upward or downward adjustment to the management fee is based on the relative investment performance of the Fund's Institutional Class as compared to an appropriate benchmark index. The Fund's performance period began on August 1, 2007. The performance adjustment will take effect starting with the twelfth month of the performance period (July 2008). Subsequent months will be added until the performance period includes 36 months.
For the period, the total annual management fee rate was .71% of the Fund's average net assets.
Distribution and Service Plan. In accordance with Rule 12b-1 of the 1940 Act, the Fund has adopted separate Distribution and Service Plans for each class of shares. Certain classes pay Fidelity Distributors Corporation (FDC), an affiliate of FMR, separate Distribution and Service Fees, each of which is based on an annual percentage of each class' average net assets. In addition, FDC may pay financial intermediaries for selling shares of the Fund and providing shareholder support services.
For the period, the Distribution and Service Fee rates and the total amounts paid to and retained by FDC were as follows:
| Distribution
Fee | Service
Fee | Paid to
FDC | Retained
by FDC |
Class A | 0% | .25% | $ 298,686 | $ 13,003 |
Class T | .25% | .25% | 947,352 | 6,336 |
Class B | .75% | .25% | 464,321 | 348,633 |
Class C | .75% | .25% | 668,061 | 32,030 |
| | | $ 2,378,420 | $ 400,002 |
Sales Load. FDC receives a front-end sales charge of up to 5.75% for selling Class A shares, and 3.50% for selling Class T shares, some of which is paid to financial intermediaries for selling shares of the Fund. FDC receives the proceeds of contingent deferred sales charges levied on Class A, Class T, Class B, and Class C redemptions. These charges depend on the holding period. The deferred sales charges range from 5% to 1% for Class B, 1% for Class C, 1.00% to .50% for certain purchases of Class A shares and .25% for certain purchases of Class T shares.
Annual Report
Notes to Financial Statements - continued
6. Fees and Other Transactions with Affiliates - continued
Sales Load - continued
For the period, sales charge amounts retained by FDC were as follows:
| Retained
by FDC |
Class A | $ 23,764 |
Class T | 10,314 |
Class B* | 67,173 |
Class C* | 2,330 |
| $ 103,581 |
* When Class B and Class C shares are initially sold, FDC pays commissions from its own resources to financial intermediaries through which the sales are made.
Transfer Agent Fees. Fidelity Investments Institutional Operations Company, Inc. (FIIOC), an affiliate of FMR, is the transfer, dividend disbursing and shareholder servicing agent for each class of the Fund. FIIOC receives account fees and asset-based fees that vary according to the account size and type of account of the shareholders of the respective classes of the Fund. FIIOC pays for typesetting, printing and mailing of shareholder reports, except proxy statements. For the period, the total transfer agent fees paid by each class to FIIOC, were as follows:
| Amount | % of
Average
Net Assets |
Class A | $ 360,637 | .30 |
Class T | 498,512 | .26 |
Class B | 146,400 | .32 |
Class C | 179,681 | .27 |
Institutional Class | 42,546 | .22 |
| $ 1,227,776 | |
Accounting and Security Lending Fees. Fidelity Service Company, Inc. (FSC), an affiliate of FMR, maintains the Fund's accounting records. The accounting fee is based on the level of average net assets for the month. Under a separate contract, FSC administers the security lending program. The security lending fee is based on the number and duration of lending transactions.
Brokerage Commissions. The Fund placed a portion of its portfolio transactions with brokerage firms which are affiliates of the investment adviser. The commissions paid to these affiliated firms were $396 for the period.
7. Committed Line of Credit.
The Fund participates with other funds managed by FMR in a $4.2 billion credit facility (the "line of credit") to be utilized for temporary or emergency purposes to fund shareholder redemptions or for other short-term liquidity purposes. The Fund has agreed to pay commitment fees on its pro rata portion of the line of credit, which amounted to $940 and
Annual Report
7. Committed Line of Credit - continued
is reflected in Miscellaneous Expense on the Statement of Operations. During the period, there were no borrowings on this line of credit.
8. Security Lending.
The Fund lends portfolio securities from time to time in order to earn additional income. On the settlement date of the loan, the Fund receives collateral (in the form of U.S. Treasury obligations, letters of credit and/or cash) against the loaned securities and maintains collateral in an amount not less than 100% of the market value of the loaned securities during the period of the loan. The market value of the loaned securities is determined at the close of business of the Fund and any additional required collateral is delivered to the Fund on the next business day. If the borrower defaults on its obligation to return the securities loaned because of insolvency or other reasons, a fund could experience delays and costs in recovering the securities loaned or in gaining access to the collateral. Any cash collateral received is invested in the Fidelity Securities Lending Cash Central Fund. The value of loaned securities and cash collateral at period end are disclosed on the Fund's Statement of Assets and Liabilities. Security lending income represents the income earned on investing cash collateral, less fees and expenses associated with the loan, plus any premium payments that may be received on the loan of certain types of securities. Security lending income is presented in the Statement of Operations as a component of income from Fidelity Central Funds.
9. Expense Reductions.
Many of the brokers with whom FMR places trades on behalf of the Fund provided services to the Fund in addition to trade execution. These services included payments of certain expenses on behalf of the Fund totaling $312,177 for the period. In addition, through arrangements with the Fund's custodian and each class' transfer agent, credits realized as a result of uninvested cash balances were used to reduce the Fund's expenses. During the period, these credits reduced the Fund's custody expenses by $8,243. During the period, credits reduced each class' transfer agent expense as noted in the table below.
| Transfer Agent
expense reduction | |
Class A | $ 6,615 | |
Class T | 4,034 | |
Class B | 114 | |
Class C | 289 | |
| $ 11,052 | |
10. Other.
The Fund's organizational documents provide former and current trustees and officers with a limited indemnification against liabilities arising in connection with the
Annual Report
Notes to Financial Statements - continued
10. Other - continued
performance of their duties to the Fund. In the normal course of business, the Fund may also enter into contracts that provide general indemnifications. The Fund's maximum exposure under these arrangements is unknown as this would be dependent on future claims that may be made against the Fund. The risk of material loss from such claims is considered remote.
In September 2006, FIIOC, the Fund's transfer agent, notified the Fund that the Fund's books and records did not reflect a conversion of certain Class B to Class A shares upon their conversion date. In March 2007, FIIOC converted the relevant Class B shares to Class A shares and recorded the conversion in the books and records of the Fund which did not result in a material impact to the Fund's reported net assets or results of operations in the accompanying financial statements. FIIOC has remediated affected shareholders and reimbursed the Fund for all related audit and legal expenses.
The United States Securities and Exchange Commission ("SEC") is conducting an investigation of FMR (covering the years 2002 to 2004) arising from gifts, gratuities and business entertainment provided by certain brokers to certain individuals who were employed on FMR's domestic equity trading desk during that period. FMR is in discussions with the SEC staff regarding the possible resolution of the matter, but as of period-end no final resolution has been reached.
In December 2006, the Independent Trustees completed their own investigation of the matter with the assistance of independent counsel. The Independent Trustees and FMR agree that, despite the absence of proof that the Fidelity mutual funds experienced diminished execution quality as a result of the improper receipt of gifts and business entertainment, the conduct at issue was serious and is worthy of redress. Accordingly, the Independent Trustees have requested and FMR has agreed to pay $42 million to Fidelity mutual funds, plus interest to be determined at the time that payment is made. A method of allocating this payment among the funds has not yet been determined. The total payment to the Fund is not anticipated to have a material impact on the Fund's net assets. In addition, FMR reimbursed related legal expenses which are recorded in the accompanying Statement of Operations as an expense reduction.
11. Distributions to Shareholders.
Distributions to shareholders of each class were as follows:
Years ended October 31, | 2007 | 2006 |
From net investment income | | |
Class A | $ 741,807 | $ 1,314,737 |
Class T | 779,904 | 1,864,533 |
Class B | - | 174,253 |
Class C | - | 261,004 |
Institutional Class | 204,513 | - |
Total | $ 1,726,224 | $ 3,614,527 |
Annual Report
11. Distributions to Shareholders - continued
Distributions to shareholders of each class were as follows: - continued
Years ended October 31, | 2007 | 2006 |
From net realized gain | | |
Class A | $ 17,507,820 | $ 14,579,264 |
Class T | 30,595,453 | 27,296,712 |
Class B | 8,539,459 | 7,653,477 |
Class C | 11,153,317 | 8,994,200 |
Institutional Class | 3,576,515 | 5,817,870 |
Total | $ 71,372,564 | $ 64,341,523 |
12. Share Transactions.
Transactions for each class of shares were as follows:
| Shares | Dollars |
Years ended October 31, | 2007 | 2006 | 2007 | 2006 |
Class A | | | | |
Shares sold | 2,473,487 | 1,988,269 | $ 42,784,764 | $ 34,527,258 |
Reinvestment of distributions | 1,076,085 | 891,958 | 17,077,468 | 14,610,279 |
Shares redeemed | (3,652,624) | (3,230,754) | (63,819,065) | (55,819,320) |
Net increase (decrease) | (103,052) | (350,527) | $ (3,956,833) | $ (6,681,783) |
Class T | | | | |
Shares sold | 1,816,120 | 2,402,743 | $ 30,886,267 | $ 41,319,563 |
Reinvestment of distributions | 1,951,860 | 1,751,812 | 30,605,163 | 28,379,356 |
Shares redeemed | (4,694,918) | (6,046,800) | (80,369,952) | (103,769,435) |
Net increase (decrease) | (926,938) | (1,892,245) | $ (18,878,522) | $ (34,070,516) |
Class B | | | | |
Shares sold | 202,050 | 302,431 | $ 3,191,835 | $ 4,930,361 |
Reinvestment of distributions | 474,419 | 418,785 | 7,059,355 | 6,495,355 |
Shares redeemed | (1,460,360) | (1,105,832) | (23,561,432) | (18,120,098) |
Net increase (decrease) | (783,891) | (384,616) | $ (13,310,242) | $ (6,694,382) |
Class C | | | | |
Shares sold | 408,629 | 563,695 | $ 6,500,495 | $ 9,212,921 |
Reinvestment of distributions | 649,627 | 507,393 | 9,698,929 | 7,900,111 |
Shares redeemed | (1,190,743) | (1,214,249) | (19,242,229) | (19,964,214) |
Net increase (decrease) | (132,487) | (143,161) | $ (3,042,805) | $ (2,851,182) |
Institutional Class | | | | |
Shares sold | 112,415 | 476,544 | $ 1,997,164 | $ 8,549,810 |
Reinvestment of distributions | 179,235 | 255,142 | 2,966,333 | 4,319,555 |
Shares redeemed | (724,750) | (11,226,497) | (12,787,834) | (204,048,935) |
Net increase (decrease) | (433,100) | (10,494,811) | $ (7,824,337) | $ (191,179,570) |
Annual Report
Report of Independent Registered Public Accounting Firm
To the Trustees of Fidelity Advisor Series VIII and Shareholders of Fidelity Advisor International Capital Appreciation Fund:
We have audited the accompanying statement of assets and liabilities of Fidelity Advisor International Capital Appreciation Fund (the Fund), a fund of Fidelity Advisor Series VIII, including the schedule of investments, as of October 31, 2007, and the related statement of operations for the year then ended, the statement of changes in net assets for each of the two years in the period then ended, and the financial highlights for each of the five years in the period then ended. These financial statements and financial highlights are the responsibility of the Fund's management. Our responsibility is to express an opinion on these financial statements and financial highlights based on our audits.
We conducted our audits in accordance with standards of the Public Company Accounting Oversight Board (United States). Those standards require that we plan and perform the audit to obtain reasonable assurance about whether the financial statements and financial highlights are free of material misstatement. The Fund is not required to have, nor were we engaged to perform, an audit of its internal control over financial reporting. Our audits included consideration of internal control over financial reporting as a basis for designing audit procedures that are appropriate in the circumstances, but not for the purpose of expressing an opinion on the effectiveness of the Fund's internal control over financial reporting. Accordingly, we express no such opinion. An audit also includes examining, on a test basis, evidence supporting the amounts and disclosures in the financial statements, assessing the accounting principles used and significant estimates made by management, as well as evaluating the overall financial statement presentation. Our procedures included confirmation of securities owned as of October 31, 2007, by correspondence with the custodians and brokers; where replies were not received from brokers, we performed other auditing procedures. We believe that our audits provide a reasonable basis for our opinion.
In our opinion, the financial statements and financial highlights referred to above present fairly, in all material respects, the financial position of Fidelity Advisor International Capital Appreciation Fund as of October 31, 2007, the results of its operations for the year then ended, the changes in its net assets for each of the two years in the period then ended, and its financial highlights for each of the five years in the period then ended, in conformity with accounting principles generally accepted in the United States of America.
/s/ Deloitte & Touche LLP
DELOITTE & TOUCHE LLP
Boston, Massachusetts
December 14, 2007
Annual Report
Trustees and Officers
The Trustees, Members of the Advisory Board, and executive officers of the trust and fund, as applicable, are listed below. The Board of Trustees governs the fund and is responsible for protecting the interests of shareholders. The Trustees are experienced executives who meet periodically throughout the year to oversee the fund's activities, review contractual arrangements with companies that provide services to the fund, and review the fund's performance. Except for James C. Curvey, each of the Trustees oversees 370 funds advised by FMR or an affiliate. Mr. Curvey oversees 340 funds advised by FMR or an affiliate.
The Trustees hold office without limit in time except that (a) any Trustee may resign; (b) any Trustee may be removed by written instrument, signed by at least two-thirds of the number of Trustees prior to such removal; (c) any Trustee who requests to be retired or who has become incapacitated by illness or injury may be retired by written instrument signed by a majority of the other Trustees; and (d) any Trustee may be removed at any special meeting of shareholders by a two-thirds vote of the outstanding voting securities of the trust. Each Trustee who is not an interested person (as defined in the 1940 Act) (Independent Trustee), shall retire not later than the last day of the calendar year in which his or her 72nd birthday occurs. The Independent Trustees may waive this mandatory retirement age policy with respect to individual Trustees. The executive officers and Advisory Board Members hold office without limit in time, except that any officer and Advisory Board Member may resign or may be removed by a vote of a majority of the Trustees at any regular meeting or any special meeting of the Trustees. Except as indicated, each individual has held the office shown or other offices in the same company for the past five years.
The fund's Statement of Additional Information (SAI) includes more information about the Trustees. To request a free copy, call Fidelity at 1-877-208-0098.
Interested Trustees*:
Correspondence intended for each Trustee who is an interested person may be sent to Fidelity Investments, 82 Devonshire Street, Boston, Massachusetts 02109.
Name, Age; Principal Occupation |
Edward C. Johnson 3d (77) |
| Year of Election or Appointment: 1983 Mr. Johnson is Chairman of the Board of Trustees. Mr. Johnson serves as President (2006-present), Chief Executive Officer, Chairman, and a Director of FMR LLC; Chairman and a Director of FMR; Chairman and a Director of Fidelity Research & Analysis Company (FRAC); Chairman and a Director of Fidelity Investments Money Management, Inc.; and Chairman (2001-present) and a Director of FMR Co., Inc. In addition, Mr. Johnson serves as Chairman and Director of Fidelity International Limited (FIL). |
James C. Curvey (72) |
| Year of Election or Appointment: 2007 Mr. Curvey also serves as Trustee (2007-present) or Member of the Advisory Board (2007-present) of other investment companies advised by FMR. Mr. Curvey is a Director of FMR and FMR Co., Inc. (2007-present). Mr. Curvey is also Vice Chairman (2006-present) and Director of FMR LLC. Mr. Curvey joined Fidelity in 1982 and served in numerous senior management positions, including President and Chief Operating Officer of FMR LLC (1997-2000) and President of Fidelity Strategic Investments (2000-2002). In addition, he serves as a member of the Board of Directors of Geerlings & Wade, Inc. (wine distribution). |
* Trustees have been determined to be "Interested Trustees" by virtue of, among other things, their affiliation with the trust or various entities under common control with FMR. FMR Corp. merged with FMR LLC on October 1, 2007. Any references to FMR LLC for prior periods are deemed to be references to the prior entity.
Independent Trustees:
Correspondence intended for each Independent Trustee (that is, the Trustees other than the Interested Trustees) may be sent to Fidelity Investments, P.O. Box 55235, Boston, Massachusetts 02205-5235.
Name, Age; Principal Occupation |
Dennis J. Dirks (59) |
| Year of Election or Appointment: 2005 Prior to his retirement in May 2003, Mr. Dirks was Chief Operating Officer and a member of the Board of The Depository Trust & Clearing Corporation (DTCC) (1999-2003). He also served as President, Chief Operating Officer, and Board member of The Depository Trust Company (DTC) (1999-2003) and President and Board member of the National Securities Clearing Corporation (NSCC) (1999-2003). In addition, Mr. Dirks served as Chief Executive Officer and Board member of the Government Securities Clearing Corporation (2001-2003) and Chief Executive Officer and Board member of the Mortgage-Backed Securities Clearing Corporation (2001-2003). Mr. Dirks also serves as a Trustee and a member of the Finance Committee of Manhattan College (2005-present) and a Trustee and a member of the Finance Committee of AHRC of Nassau County (2006-present). |
Albert R. Gamper, Jr. (65) |
| Year of Election or Appointment: 2006 Prior to his retirement in December 2004, Mr. Gamper served as Chairman of the Board of CIT Group Inc. (commercial finance). During his tenure with CIT Group Inc. Mr. Gamper served in numerous senior management positions, including Chairman (1987-1989; 1999-2001; 2002-2004), Chief Executive Officer (1987-2004), and President (1989-2002). He currently serves as a member of the Board of Directors of Public Service Enterprise Group (utilities, 2001-present), Chairman of the Board of Governors, Rutgers University (2004-present), and Chairman of the Board of Saint Barnabas Health Care System. |
George H. Heilmeier (71) |
| Year of Election or Appointment: 2004 Dr. Heilmeier is Chairman Emeritus of Telcordia Technologies (communication software and systems), where prior to his retirement, he served as company Chairman and Chief Executive Officer. He currently serves on the Boards of Directors of The Mitre Corporation (systems engineering and information technology support for the government), and HRL Laboratories (private research and development, 2004-present). He is Chairman of the General Motors Science & Technology Advisory Board and a Life Fellow of the Institute of Electrical and Electronics Engineers (IEEE). Dr. Heilmeier is a member of the Defense Science Board and the National Security Agency Advisory Board. He is also a member of the National Academy of Engineering, the American Academy of Arts and Sciences, and the Board of Overseers of the School of Engineering and Applied Science of the University of Pennsylvania. Previously, Dr. Heilmeier served as a Director of TRW Inc. (automotive, space, defense, and information technology, 1992-2002), Compaq (1994-2002), Automatic Data Processing, Inc. (ADP) (technology-based business outsourcing, 1995-2002), INET Technologies Inc. (telecommunications network surveillance, 2001-2004), and Teletech Holdings (customer management services). He is the recipient of the 2005 Kyoto Prize in Advanced Technology for his invention of the liquid crystal display, and a member of the Consumer Electronics Hall of Fame. |
James H. Keyes (67) |
| Year of Election or Appointment: 2007 Prior to his retirement in 2003, Mr. Keyes was Chairman, President, and Chief Executive Officer of Johnson Controls, Inc. (automotive supplier, 1993-2003). He currently serves as a member of the boards of LSI Logic Corporation (semiconductor technologies), Navistar International Corporation (manufacture and sale of trucks, buses, and diesel engines, 2002-present), and Pitney Bowes, Inc. (integrated mail, messaging, and document management solutions). |
Marie L. Knowles (61) |
| Year of Election or Appointment: 2001 Prior to Ms. Knowles' retirement in June 2000, she served as Executive Vice President and Chief Financial Officer of Atlantic Richfield Company (ARCO) (diversified energy, 1996-2000). From 1993 to 1996, she was a Senior Vice President of ARCO and President of ARCO Transportation Company. She served as a Director of ARCO from 1996 to 1998. She currently serves as a Director of Phelps Dodge Corporation (copper mining and manufacturing) and McKesson Corporation (healthcare service, 2002-present). Ms. Knowles is a Trustee of the Brookings Institution and the Catalina Island Conservancy and also serves as a member of the Advisory Board for the School of Engineering of the University of Southern California. |
Ned C. Lautenbach (63) |
| Year of Election or Appointment: 2000 Mr. Lautenbach is Chairman of the Independent Trustees (2006-present). Mr. Lautenbach has been a partner of Clayton, Dubilier & Rice, Inc. (private equity investment firm) since September 1998. Previously, Mr. Lautenbach was with the International Business Machines Corporation (IBM) from 1968 until his retirement in 1998. Mr. Lautenbach serves as a Director of Sony Corporation (2006-present) and Eaton Corporation (diversified industrial) as well as the Philharmonic Center for the Arts in Naples, Florida. He also is a member of the Board of Trustees of Fairfield University (2005-present), as well as a member of the Council on Foreign Relations. |
Cornelia M. Small (63) |
| Year of Election or Appointment: 2005 Ms. Small is a member (2000-present) and Chairperson (2002-present) of the Investment Committee, and a member (2002-present) of the Board of Trustees of Smith College. Previously, she served as Chief Investment Officer (1999-2000), Director of Global Equity Investments (1996-1999), and a member of the Board of Directors of Scudder, Stevens & Clark (1990-1997) and Scudder Kemper Investments (1997-1999). In addition, Ms. Small served as Co-Chair (2000-2003) of the Annual Fund for the Fletcher School of Law and Diplomacy. |
William S. Stavropoulos (68) |
| Year of Election or Appointment: 2001 Mr. Stavropoulos is Chairman Emeritus of the Board of Directors of The Dow Chemical Company. Since joining The Dow Chemical Company in 1967, Mr. Stavropoulos served in numerous senior management positions, including President (1993-2000; 2002-2003), CEO (1995-2000; 2002-2004), and Chairman of the Executive Committee (2000-2004). Currently, he is a Director of NCR Corporation (data warehousing and technology solutions), Chemical Financial Corporation, Maersk Inc. (industrial conglomerate, 2002-present), Tyco International, Inc. (multinational manufacturing and services, 2007-present), and a member of the Advisory Board for Metalmark Capital (private equity investment firm, 2005-present). He is a special advisor to Clayton, Dubilier & Rice, Inc., a private equity investment firm. He also serves as a member of the Board of Trustees of the American Enterprise Institute for Public Policy Research. In addition, Mr. Stavropoulos is a member of The Business Council, J.P. Morgan International Council and the University of Notre Dame Advisory Council for the College of Science. |
Kenneth L. Wolfe (68) |
| Year of Election or Appointment: 2005 Prior to his retirement in 2001, Mr. Wolfe was Chairman and Chief Executive Officer of Hershey Foods Corporation (1993-2001). He currently serves as a member of the boards of Adelphia Communications Corporation (2003-present), Bausch & Lomb, Inc., and Revlon Inc. (2004-present). |
Advisory Board Members and Executive Officers**:
Correspondence intended for Mr. Mauriello, Mr. Thomas, and Mr. Wiley may be sent to Fidelity Investments, P.O. Box 55235, Boston, Massachusetts 02205-5235. Correspondence intended for each executive officer and Mr. Lynch may be sent to Fidelity Investments, 82 Devonshire Street, Boston, Massachusetts 02109.
Name, Age; Principal Occupation |
Peter S. Lynch (63) |
| Year of Election or Appointment: 2003 Member of the Advisory Board of Fidelity Advisor Series VIII. Mr. Lynch is Vice Chairman and a Director of FMR, and Vice Chairman (2001-present) and a Director of FMR Co., Inc. Previously, Mr. Lynch served as a Trustee of the Fidelity funds (1990-2003). In addition, he serves as a Trustee of Boston College and as the Chairman of the Inner-City Scholarship Fund. |
Joseph Mauriello (63) |
| Year of Election or Appointment: 2007 Member of the Advisory Board of Fidelity Advisor Series VIII. Prior to his retirement in January 2006, Mr. Mauriello served in numerous senior management positions including Deputy Chairman and Chief Operating Officer (2004-2005), and Vice Chairman of Financial Services (2002-2004) of KPMG LLP US (professional services firm, 1965-2005). Mr. Mauriello currently serves as a member of the Board of Directors of XL Capital Ltd., (global insurance and re-insurance company, 2006-present) and of Arcadia Resources Inc., (health care services and products, 2007-present). He also served as a Director of the Hamilton Funds of the Bank of New York (2006-2007). |
David M. Thomas (58) |
| Year of Election or Appointment: 2007 Member of the Advisory Board of Fidelity Advisor Series VIII. Previously, Mr. Thomas served as Executive Chairman (2005-2006) and Chairman and Chief Executive Officer (2000-2005) of IMS Heath, Inc. (pharmaceutical and healthcare information solutions). In addition, Mr. Thomas serves as a member of the Board of Directors of Fortune Brands, Inc. (consumer products holding company), and Interpublic Group of Companies, Inc. (marketing communication, 2004-present). |
Michael E. Wiley (57) |
| Year of Election or Appointment: 2007 Member of the Advisory Board of Fidelity Advisor Series VIII. Mr. Wiley also serves as Sr. Energy Advisor of Katzenbach Partners, LLC (consulting firm, 2006-present) and a member of the Board of Trustees of the University of Tulsa (2000-2006; 2007-present). He serves as a Director of Tesoro Corporation (independent oil refiner and marketer, 2005-present), and a Director of Bill Barrett Corporation (exploration and production company, 2005-present). In addition, he also serves as a Director of Post Oak Bank (privately-held bank, 2004-present), and an Advisory Director of Riverstone Holdings (private investment firm). Previously, Mr. Wiley served as Chairman, President, and CEO of Baker Hughes, Inc. (oilfield services company, 2000-2004), and as Director of Spinnaker Exploration Company (exploration and production company, 2001-2005). |
Kimberley H. Monasterio (43) |
| Year of Election or Appointment: 2007 President and Treasurer of Advisor International Capital Appreciation. Ms. Monasterio also serves as President and Treasurer of other Fidelity funds (2007-present) and is an employee of FMR (2004-present). Previously, Ms. Monasterio served as Deputy Treasurer of the Fidelity funds (2004-2006). Before joining Fidelity Investments, Ms. Monasterio served as Treasurer (2000-2004) and Chief Financial Officer (2002-2004) of the Franklin Templeton Funds and Senior Vice President of Franklin Templeton Services, LLC (2000-2004). |
Walter C. Donovan (45) |
| Year of Election or Appointment: 2007 Vice President of Advisor International Capital Appreciation. Mr. Donovan also serves as Vice President of Fidelity's Equity Funds (2007-present). Mr. Donovan also serves as Executive Vice President of FMR (2005-present) and FMR Co., Inc. (2005-present). Previously, Mr. Donovan served as Vice President of Fidelity's High Income Funds (2005-2007), Fixed-Income Funds (2005-2006), certain Asset Allocation Funds (2005-2006), certain Balanced Funds (2005-2006), and as Vice President and Director of Fidelity's International Equity Trading group (1998-2005). |
Eric M. Wetlaufer (45) |
| Year of Election or Appointment: 2006 Vice President of Advisor International Capital Appreciation. Mr. Wetlaufer also serves as Vice President of certain International Equity Funds (2006-present). Mr. Wetlaufer is Senior Vice President of FMR (2006-present) and FMR Co., Inc. (2006-present), and President and Director of Fidelity Management & Research (U.K.) Inc. (2006-present) and Fidelity Research & Analysis Company (2006-present). Before joining Fidelity Investments in 2005, Mr. Wetlaufer was a partner in Oxhead Capital Management (2004-2005). Previously, Mr. Wetlaufer served as a Chief Investment Officer of Putnam Investments (1997-2003). |
Eric D. Roiter (58) |
| Year of Election or Appointment: 1998 Secretary of Advisor International Capital Appreciation. He also serves as Secretary of Fidelity funds; Vice President, General Counsel, and Secretary of FMR Co., Inc. (2001-present) and FMR; Assistant Secretary of Fidelity Management & Research (U.K.) Inc. (2001-present), Fidelity Research & Analysis Company (2001-present), and Fidelity Investments Money Management, Inc. (2001-present). Mr. Roiter is an Adjunct Member, Faculty of Law, at Boston College Law School (2003-present). Previously, Mr. Roiter served as Vice President and Secretary of Fidelity Distributors Corporation (FDC) (1998-2005). |
Scott C. Goebel (39) |
| Year of Election or Appointment: 2007 Assistant Secretary of Advisor International Capital Appreciation. Mr. Goebel also serves as Assistant Secretary of other Fidelity funds (2007-present), and is an employee of FMR. |
R. Stephen Ganis (41) |
| Year of Election or Appointment: 2006 Anti-Money Laundering (AML) officer of Advisor International Capital Appreciation. Mr. Ganis also serves as AML officer of Fidelity funds (2006-present) and FMR LLC (2003-present). Before joining Fidelity Investments, Mr. Ganis practiced law at Goodwin Procter, LLP (2000-2002). |
Joseph B. Hollis (59) |
| Year of Election or Appointment: 2006 Chief Financial Officer of Advisor International Capital Appreciation. Mr. Hollis also serves as Chief Financial Officer of other Fidelity funds. Mr. Hollis is President of Fidelity Pricing and Cash Management Services (FPCMS) (2005-present). Mr. Hollis also serves as President and Director of Fidelity Service Company, Inc. (2006-present). Previously, Mr. Hollis served as Senior Vice President of Cash Management Services (1999-2002) and Investment Management Operations (2002-2005). |
Kenneth A. Rathgeber (60) |
| Year of Election or Appointment: 2004 Chief Compliance Officer of Advisor International Capital Appreciation. Mr. Rathgeber also serves as Chief Compliance Officer of other Fidelity funds (2004-present) and Executive Vice President of Risk Oversight for Fidelity Investments (2002-present). He is Chief Compliance Officer of FMR (2005-present), FMR Co., Inc. (2005-present), Fidelity Management & Research (U.K.) Inc. (2005-present), Fidelity Research & Analysis Company (2005-present), Fidelity Investments Money Management, Inc. (2005-present), and Strategic Advisers, Inc. (2005-present). Previously, Mr. Rathgeber served as Executive Vice President and Chief Operating Officer for Fidelity Investments Institutional Services Company, Inc. (1998-2002). |
Bryan A. Mehrmann (46) |
| Year of Election or Appointment: 2005 Deputy Treasurer of Advisor International Capital Appreciation. Mr. Mehrmann also serves as Deputy Treasurer of other Fidelity funds (2005-present) and is an employee of FMR. Previously, Mr. Mehrmann served as Vice President of Fidelity Investments Institutional Services Group (FIIS)/Fidelity Investments Institutional Operations Corporation, Inc. (FIIOC) Client Services (1998-2004). |
Kenneth B. Robins (38) |
| Year of Election or Appointment: 2005 Deputy Treasurer of Advisor International Capital Appreciation. Mr. Robins also serves as Deputy Treasurer of other Fidelity funds (2005-present) and is an employee of FMR (2004-present). Before joining Fidelity Investments, Mr. Robins worked at KPMG LLP, where he was a partner in KPMG's department of professional practice (2002-2004) and a Senior Manager (1999-2000). In addition, Mr. Robins served as Assistant Chief Accountant, United States Securities and Exchange Commission (2000-2002). |
Robert G. Byrnes (40) |
| Year of Election or Appointment: 2005 Assistant Treasurer of Advisor International Capital Appreciation. Mr. Byrnes also serves as Assistant Treasurer of Fidelity funds (2005-present) and is an employee of FMR (2005-present). Previously, Mr. Byrnes served as Vice President of FPCMS (2003-2005). Before joining Fidelity Investments, Mr. Byrnes worked at Deutsche Asset Management where he served as Vice President of the Investment Operations Group (2000-2003). |
Peter L. Lydecker (53) |
| Year of Election or Appointment: 2004 Assistant Treasurer of Advisor International Capital Appreciation. Mr. Lydecker also serves as Assistant Treasurer of other Fidelity funds (2004) and is an employee of FMR. |
Paul M. Murphy (60) |
| Year of Election or Appointment: 2007 Assistant Treasurer of Advisor International Capital Appreciation. Mr. Murphy also serves as Assistant Treasurer of other Fidelity funds (2007-present) and is an employee of FMR (2007-present). Previously, Mr. Murphy served as Chief Financial Officer of the Fidelity Funds (2005-2006), Vice President and Associate General Counsel of FMR (2007), and Senior Vice President of Fidelity Pricing and Cash Management Services Group (FPCMS) (1994-2007). |
Gary W. Ryan (49) |
| Year of Election or Appointment: 2005 Assistant Treasurer of Advisor International Capital Appreciation. Mr. Ryan also serves as Assistant Treasurer of other Fidelity funds (2005-present) and is an employee of FMR (2005-present). Previously, Mr. Ryan served as Vice President of Fund Reporting in FPCMS (1999-2005). |
** FMR Corp. merged with FMR LLC on October 1, 2007. Any references to FMR LLC for prior periods are deemed to be references to the prior entity.
Annual Report
Distributions
The Board of Trustees of Advisor International Capital Appreciation Fund voted to pay to shareholders of record at the opening of business on record date, the following distributions per share derived from capital gains realized from sales of portfolio securities, and dividends derived from net investment income:
| Pay Date | Record Date | Dividends | Capital Gains |
Class A | 12/10/2007 | 12/7/2007 | $.048 | $3.871 |
Class T | 12/10/2007 | 12/7/2007 | $.008 | $3.871 |
Class B | 12/10/2007 | 12/7/2007 | $.000 | $3.749 |
Class C | 12/10/2007 | 12/7/2007 | $.000 | $3.803 |
The fund hereby designates as a capital gain dividend with respect to the taxable year ended October 31, 2007, $25,229,649, or, if subsequently determined to be different, the net capital gain of such year.
Class A designates 48%; Class T designated 54%; Class B 75%; and Class C designates 67% of dividends distributed during the fiscal year as amounts which may be taken into account as a dividend for purposes of the maximum rate under section 1(h)(11) of the Internal Revenue Code.
The amounts per share which represent income derived from sources within, and taxes paid to, foreign countries or possessions of the United States are as follows:
| Pay Date | Income | Taxes |
Class A | 12/11/2006 | $.303 | $.0219 |
Class T | 12/11/2006 | $.268 | $.0219 |
Class B | 12/11/2006 | $.192 | $.0219 |
Class C | 12/11/2006 | $.216 | $.0219 |
The fund will notify shareholders in January 2008 of amounts for use in preparing 2007 income tax returns.
Annual Report
Proxy Voting Results
A special meeting of the fund's shareholders was held on July 18, 2007. The results of votes taken among shareholders on the proposal before them are reported below. Each vote reported represents one dollar of net asset value held on the record date for the meeting.
PROPOSAL 3 |
To approve an amended management contract that includes adding a performance adjustment component to the management fee for Fidelity Advisor International Capital Appreciation Fund and giving the Trustees the authority to change the fund's performance adjustment index going forward, without shareholder vote, subject to applicable law. |
| # of
Votes | % of
Votes |
Affirmative | 166,226,982.26 | 73.015 |
Against | 41,915,985.95 | 18.412 |
Abstain | 19,517,457.32 | 8.573 |
TOTAL | 227,660,425.53 | 100.000 |
Annual Report
Board Approval of Investment Advisory Contracts and Management Fees
Advisor International Capital Appreciation Fund
Each year, typically in July, the Board of Trustees, including the Independent Trustees (together, the Board), votes on the renewal of the management contract and sub-advisory agreements (together, the Advisory Contracts) for the fund. The Board, assisted by the advice of fund counsel and Independent Trustees' counsel, requests and considers a broad range of information throughout the year.
The Board meets regularly each month except August and takes into account throughout the year matters bearing on Advisory Contracts. The Board, acting directly and through its separate committees, considers at each of its meetings factors that are relevant to the annual renewal of the fund's Advisory Contracts, including the services and support provided to the fund and its shareholders. At the time of the renewal, the Board had 12 standing committees, each composed of Independent Trustees with varying backgrounds, to which the Board has assigned specific subject matter responsibilities in order to enhance effective decision-making by the Board. Each committee has adopted a written charter outlining the structure and purposes of the committee. One such committee, the Equity Contract Committee, meets periodically as needed throughout the year to consider matters specifically related to the annual renewal of Advisory Contracts. The committee requests and receives information on, and makes recommendations to the Independent Trustees concerning, the approval and annual review of the Advisory Contracts.
At its July 2007 meeting, the Board of Trustees, including the Independent Trustees, unanimously determined to renew the Advisory Contracts for the fund. In reaching its determination, the Board considered all factors it believed relevant, including (i) the nature, extent, and quality of the services to be provided to the fund and its shareholders (including the investment performance of the fund); (ii) the competitiveness of the management fee and total expenses of the fund; (iii) the total costs of the services to be provided by and the profits to be realized by the investment adviser and its affiliates from the relationship with the fund; (iv) the extent to which economies of scale would be realized as the fund grows; and (v) whether fee levels reflect these economies of scale, if any, for the benefit of fund shareholders. The Board also approved amendments to the fund's agreements with foreign sub-advisers to clarify that each sub-adviser provides services as an independent contractor.
In determining whether to renew the Advisory Contracts for the fund, the Board ultimately reached a determination, with the assistance of fund counsel and Independent Trustees' counsel, that the renewal of the Advisory Contracts and the compensation to be received by Fidelity under the management contract is consistent with Fidelity's fiduciary duty under applicable law. In addition to evaluating the specific factors noted above, the Board, in reaching its determination, is aware that shareholders in the fund have a broad range of investment choices available to them, including a wide choice among mutual funds offered by competitors to Fidelity, and that the fund's shareholders, with the opportunity to review and weigh the disclosure provided by the fund in its prospectus and other public disclosures, have chosen to invest in this fund, managed by Fidelity.
Annual Report
Board Approval of Investment Advisory Contracts and
Management Fees - continued
Nature, Extent, and Quality of Services Provided. The Board considered staffing within the investment adviser, FMR, and the sub-advisers (together, the Investment Advisers), including the background of the fund's portfolio manager and the fund's investment objective and discipline. The Independent Trustees also had discussions with senior management of Fidelity's investment operations and investment groups. The Board considered the structure of the portfolio manager compensation program and whether this structure provides appropriate incentives.
Resources Dedicated to Investment Management and Support Services. The Board reviewed the size, education, and experience of the Investment Advisers' investment staff, their use of technology, and the Investment Advisers' approach to recruiting, training, and retaining portfolio managers and other research, advisory, and management personnel. The Board considered Fidelity's extensive global research capabilities that enable the Investment Advisers to aggregate data from various sources in an effort to produce positive investment results. The Board noted that Fidelity's analysts have access to a variety of technological tools that enable them to perform both fundamental and quantitative analysis and to specialize in various disciplines. The Board also considered that Fidelity's portfolio managers and analysts have access to daily portfolio attribution that allows for monitoring of a fund's portfolio, as well as an electronic communication system that provides immediate real-time access to research concerning issuers and credit enhancers.
Shareholder and Administrative Services. The Board considered (i) the nature, extent, quality, and cost of advisory, administrative, distribution, and shareholder services performed by the Investment Advisers and their affiliates under the Advisory Contracts and under separate agreements covering transfer agency, pricing and bookkeeping, and securities lending services for the fund; (ii) the nature and extent of the Investment Advisers' supervision of third party service providers, principally custodians and subcustodians; and (iii) the resources devoted to, and the record of compliance with, the fund's compliance policies and procedures. The Board reviewed the allocation of fund brokerage, including allocations to brokers affiliated with the Investment Advisers, the use of brokerage commissions to pay fund expenses, and the use of "soft" commission dollars to pay for research services. The Board also considered that Fidelity voluntarily pays for market data out of its own resources. The Board also considered the agreement reached between the Independent Trustees and Fidelity in December 2006 following an independent review of matters relating to receipt of travel, entertainment, gifts and gratuities in violation of Fidelity policies.
The Board noted that the growth of fund assets across the complex allows Fidelity to reinvest in the development of services designed to enhance the value or convenience of the Fidelity funds as investment vehicles. These services include 24-hour access to account information and market information through phone representatives and over the Internet, and investor education materials and asset allocation tools.
Annual Report
Investment in a Large Fund Family. The Board considered the benefits to shareholders of investing in a Fidelity fund, including the benefits of investing in a fund that is part of a large family of funds offering a variety of investment disciplines and providing for a large variety of mutual fund investor services. For example, fund shareholders are offered the privilege of exchanging shares of the fund for shares of other Fidelity funds, as set forth in the fund's prospectus, without paying a sales charge. The Board noted that, since the last Advisory Contract renewals in July 2006, Fidelity has taken a number of actions that benefited particular funds, including (i) dedicating additional resources to investment research and to restructure the investment research teams; (ii) contractually agreeing to reduce the management fee on Fidelity Advisor Floating Rate High Income Fund; (iii) contractually agreeing to reduce the management fees on Fidelity's California, Massachusetts, New Jersey, and New York AMT Tax-Free Money Market Funds, launching new Institutional Classes and Service Classes of these funds, and contractually agreeing to impose expense limitations on these funds; (iv) eliminating the exchange fee on the Fidelity Select Portfolios and reducing the pricing and bookkeeping fee rates for these funds; (v) reducing the maximum transfer agency fee rates on high income funds and certain equity funds; (vi) proposing amended management contracts that, if approved by shareholders, will add a performance adjustment component to the management fees paid by 18 Fidelity Advisor equity funds; (vii) contractually agreeing to reduce fees for Ultra-Short Central Fund and the money market Central Funds; (viii) waiving the Fidelity Advisor funds' contingent deferred sales charge on certain redemptions made through systematic withdrawal programs; and (ix) amending the management contracts for equity and fixed-income funds whose management contracts incorporate a "group fee" structure by adding four new fee "breakpoints" to the group fee rate schedules.
Investment Performance and Compliance. The Board considered whether the fund has operated within its investment objective, as well as its record of compliance with its investment restrictions. It also reviewed the fund's absolute investment performance for each class, as well as the fund's relative investment performance for each class measured against (i) a broad-based securities market index, and (ii) a custom peer group of mutual funds deemed appropriate by the Board over multiple periods. The following charts considered by the Board show, over the one-, three-, and five-year periods ended December 31, 2006, the cumulative total returns of Institutional Class (Class I) and Class B of the fund, the cumulative total returns of a broad-based securities market index ("benchmark"), and a range of cumulative total returns of a custom peer group of mutual funds defined by FMR based on categories assigned by Morningstar, Inc. The returns of Institutional Class (Class I) and Class B show the performance of the highest and lowest performing classes, respectively (based on three-year performance). The box within each chart shows the 25th percentile return (bottom of box) and the 75th percentile return (top of box) of the peer group. Returns shown above the box are in the first quartile and returns shown below the box are in the fourth quartile. The percentage beaten numbers noted below each chart correspond to the percentile box and represent the percentage of funds in the peer group whose performance was equal to or lower than that of the class indicated. The fund's custom peer group, defined by FMR, is a peer group that FMR believes provides a more meaningful performance comparison than the peer group assigned by Morningstar, Inc. Morningstar, Inc. assigns mutual funds to categories based on their investment styles as measured by their underlying portfolio holdings.
Annual Report
Board Approval of Investment Advisory Contracts and
Management Fees - continued
Advisor International Capital Appreciation Fund
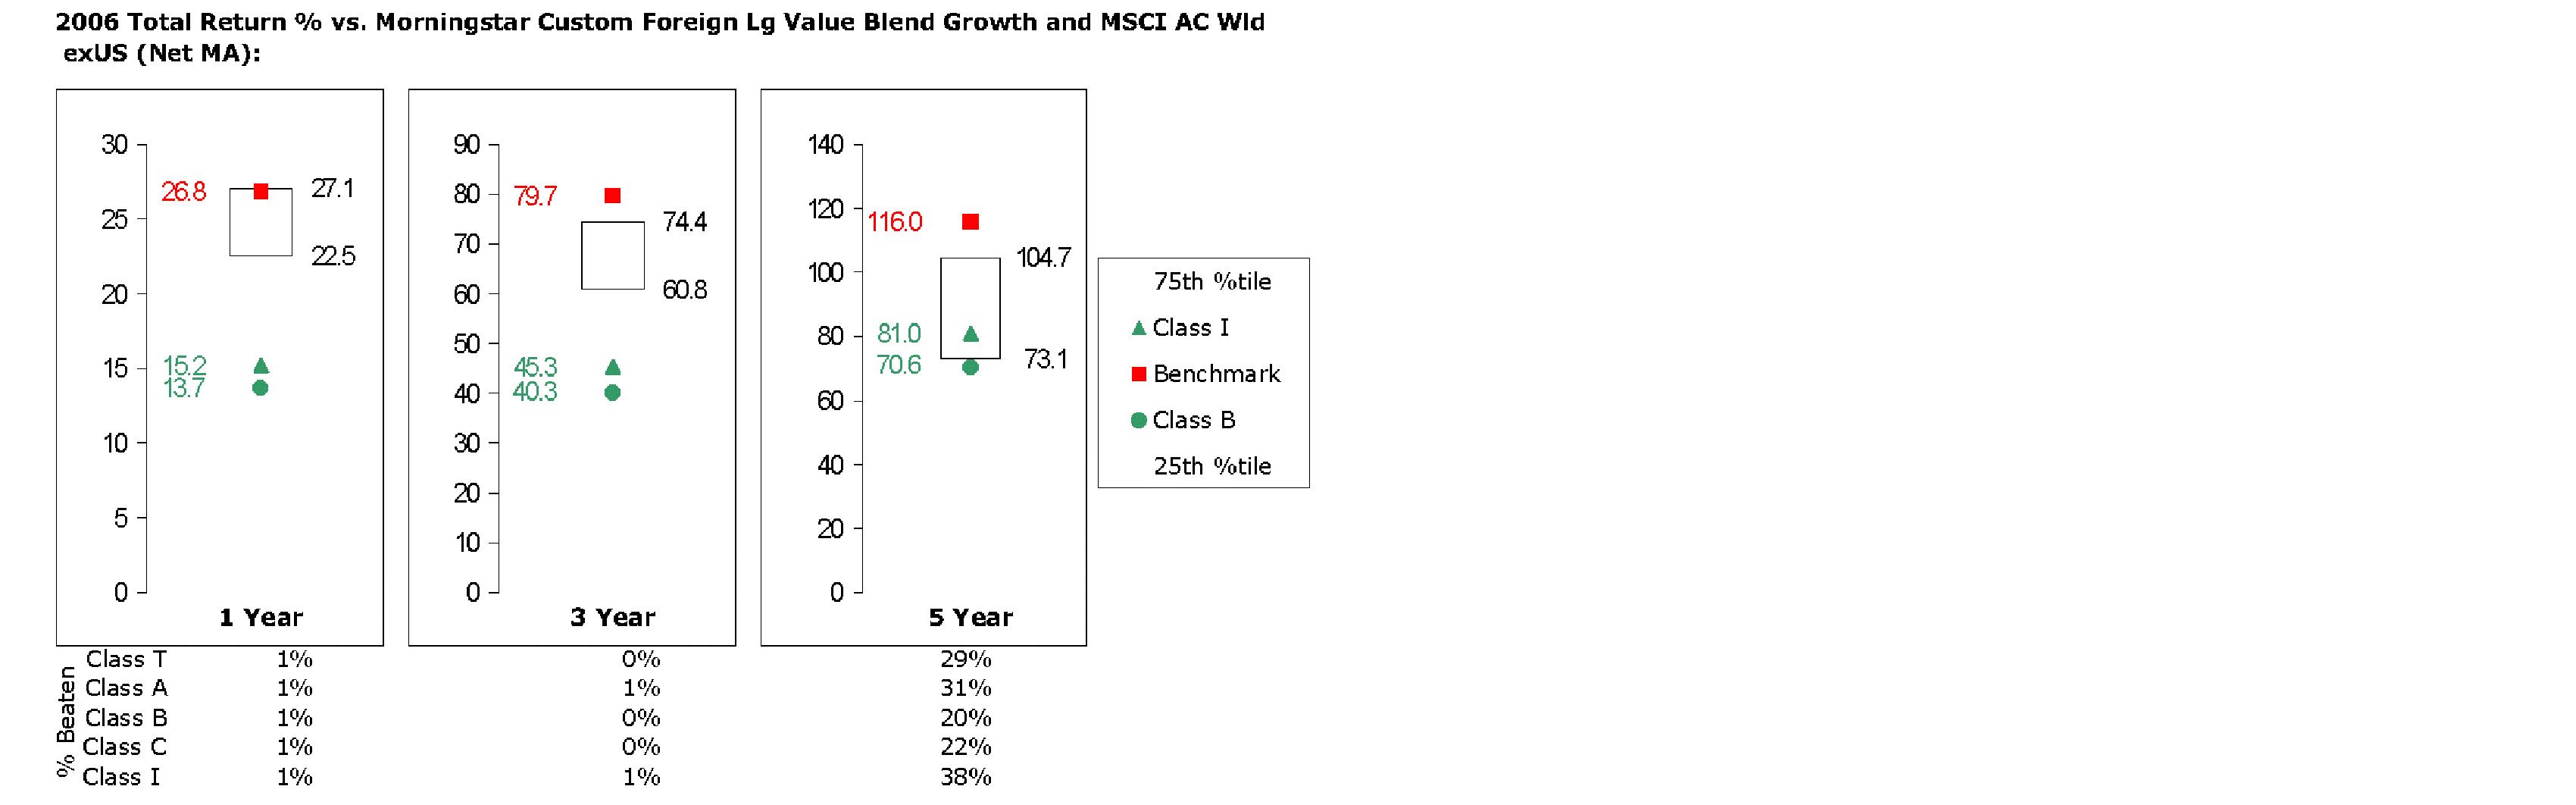
The Board reviewed the fund's relative investment performance against its peer group and stated that the performance of Institutional Class (Class I) of the fund was in the fourth quartile for the one- and three-year periods and the third quartile for the five-year period. The Board also stated that the investment performance of the fund was lower than its benchmark for all the periods shown. The Board considered that the variations in performance among the fund's classes reflect the variations in class expenses, which result in lower performance for higher expense classes. The Board discussed with FMR actions to be taken by FMR to improve the fund's disappointing performance relative to its peer group. The Board will continue to closely monitor the performance of the fund in the coming year and discuss with FMR other appropriate actions to address the performance of the fund.
The Board considered that FMR has taken steps to refocus and strengthen equity research, equity portfolio management, and compliance.
Annual Report
Based on its review, and giving particular weight to the nature and quality of the resources dedicated by the Investment Advisers to maintain and improve relative performance, the Board concluded that the nature, extent, and quality of the services provided to the fund will benefit the fund's shareholders, particularly in light of the Board's view that the fund's shareholders benefit from investing in a fund that is part of a large family of funds offering a variety of investment disciplines and services.
Competitiveness of Management Fee and Total Fund Expenses. The Board considered the fund's management fee and total expenses compared to "mapped groups" of competitive funds and classes. Fidelity creates "mapped groups" by combining similar Lipper investment objective categories that have comparable management fee characteristics. Combining Lipper investment objective categories aids the Board's management fee and total expense comparisons by broadening the competitive group used for comparison and by reducing the number of universes to which various Fidelity funds are compared. The Board also considered supplemental information about how the fund's management fee and total expenses ranked relative to groups based on Lipper classifications, which take into account a fund's market capitalization and style.
The Board considered two proprietary management fee comparisons for the 12-month periods shown in the chart below. The group of Lipper funds used by the Board for management fee comparisons is referred to below as the "Total Mapped Group." The Total Mapped Group comparison focuses on a fund's standing relative to the total universe of comparable funds available to investors, in terms of gross management fees before expense reimbursements or caps. "TMG %" represents the percentage of funds in the Total Mapped Group that had management fees that were lower than the fund's. For example, a TMG % of 15% means that 85% of the funds in the Total Mapped Group had higher management fees than the fund. The "Asset-Size Peer Group" (ASPG) comparison focuses on a fund's standing relative to non-Fidelity funds similar in size to the fund within the Total Mapped Group. The ASPG represents at least 15% of the funds in the Total Mapped Group with comparable asset size and management fee characteristics, subject to a minimum of 50 funds (or all funds in the Total Mapped Group if fewer than 50). Additional information, such as the ASPG quartile in which the fund's management fee ranked, is also included in the chart and considered by the Board.
Annual Report
Board Approval of Investment Advisory Contracts and
Management Fees - continued
Advisor International Capital Appreciation Fund

The Board noted that the fund's management fee ranked below the median of its Total Mapped Group and below the median of its ASPG for 2006.
Furthermore, the Board considered that, on July 18, 2007, after the periods shown in the chart above, shareholders approved an amended management contract for the fund that will add a performance adjustment component to the management fee paid by the fund (that is, the fund's management fee will be subject to upward or downward adjustment depending upon whether, and to what extent, the fund's investment performance for the performance period exceeds, or is exceeded by, the record (over the same period) of a Board-approved performance adjustment index). The performance period for the fund commenced on August 1, 2007. Starting with the twelfth month, the performance adjustment takes effect.
Based on its review, the Board concluded that the fund's management fee was fair and reasonable in light of the services that the fund receives and the other factors considered.
In its review of each class's total expenses, the Board considered the fund's management fee as well as other fund or class expenses, as applicable, such as transfer agent fees, pricing and bookkeeping fees, fund-paid 12b-1 fees, and custodial, legal, and audit fees. The Board also noted the effects of any waivers and reimbursements on fees and expenses. As part of its review, the Board also considered current and historical total expenses of each class of the fund compared to competitive fund median expenses. Each class of the fund is compared to those funds and classes in the Total Mapped Group (used by the Board for management fee comparisons) that have a similar sales load structure.
Annual Report
The Board noted that the total expenses of each of Class A, Class C, and Institutional Class ranked below its competitive median for 2006, the total expenses of Class B ranked equal to its competitive median for 2006, and the total expenses of Class T ranked above its competitive median for 2006. The Board noted that the fund offers multiple classes, each of which has a different sales load and 12b-1 fee structure, and that the multiple structures are intended to offer a range of pricing options for the intermediary market. The Board also noted that the total expenses of the classes vary primarily by the level of their 12b-1 fees, although differences in transfer agent fees may also cause expenses to vary from class to class.
In its review of total expenses, the Board also considered Fidelity fee structures and other information on clients that FMR and its affiliates service in other competitive markets, such as other mutual funds advised or subadvised by FMR or its affiliates, pension plan clients, and other institutional clients.
Based on its review, the Board concluded that the total expenses of each class of the fund were reasonable, although in one case above the median of the universe presented for comparison, in light of the services that the fund and its shareholders receive and the other factors considered.
Costs of the Services and Profitability. The Board considered the revenues earned and the expenses incurred by Fidelity in conducting the business of developing, marketing, distributing, managing, administering and servicing the fund and its shareholders. The Board also considered the level of Fidelity's profits in respect of all the Fidelity funds.
On an annual basis, FMR presents to the Board Fidelity's profitability for the fund. Fidelity calculates the profitability for each fund, as well as aggregate profitability for groups of Fidelity funds and all Fidelity funds, using a series of detailed revenue and cost allocation methodologies which originate with the audited books and records of Fidelity. The Audit Committee of the Board reviews any significant changes from the prior year's methodologies.
PricewaterhouseCoopers LLP (PwC), independent registered public accounting firm and auditor to Fidelity and certain Fidelity funds, has been engaged annually by the Board as part of the Board's assessment of the results of Fidelity's profitability analysis. PwC's engagement includes the review and assessment of Fidelity's methodologies used in determining the revenues and expenses attributable to Fidelity's mutual fund business, and completion of agreed-upon procedures surrounding the mathematical accuracy of fund profitability and its conformity to allocation methodologies. After considering PwC's reports issued under the engagement and information provided by Fidelity, the Board believes that while other allocation methods may also be reasonable, Fidelity's profitability methodologies are reasonable in all material respects.
Annual Report
Board Approval of Investment Advisory Contracts and
Management Fees - continued
The Board has also reviewed Fidelity's non-fund businesses and any fall-out benefits related to the mutual fund business as well as cases where Fidelity's affiliates may benefit from or be related to the fund's business.
The Board considered the costs of the services provided by and the profits realized by Fidelity in connection with the operation of the fund and determined that the amount of profit is a fair entrepreneurial profit for the management of the fund.
Economies of Scale. The Board considered whether there have been economies of scale in respect of the management of the Fidelity funds, whether the Fidelity funds (including the fund) have appropriately benefited from any such economies of scale, and whether there is potential for realization of any further economies of scale. The Board considered the extent to which the fund will benefit from economies of scale through increased services to the fund, through waivers or reimbursements, or through fee or expense reductions, including reductions that occur through operation of the transfer agent agreement. The transfer agent fee varies in part based on the number of accounts in the fund. If the number of accounts decreases or the average account size increases, the overall transfer agent fee rate decreases.
The Board recognized that the fund's management contract incorporates a "group fee" structure, which provides for lower group fee rates as total fund assets under FMR's management increase, and for higher group fee rates as total fund assets under FMR's management decrease. FMR determines the group fee rates based on a tiered asset "breakpoint" schedule. In connection with the renewal of the fund's management contract, the Board approved amendments to the fund's management contract that added four new fee breakpoints to the group fee rate schedule for assets under FMR's management above $1,386 billion. The Board considered that the group fee rate declines under both the present and amended schedules, but that under the amended schedule, the group fee rate declines faster as assets under FMR's management exceed $1,386 billion. The Board considered that the group fee is designed to deliver the benefits of economies of scale to fund shareholders when total fund assets increase, even if assets of any particular fund are unchanged or have declined, because some portion of Fidelity's costs are attributable to services provided to all Fidelity funds, and all funds benefit if those costs can be allocated among more assets. The Board concluded that, given the group fee structure, fund shareholders will achieve a certain level of economies of scale as assets under FMR's management increase at the fund complex level, regardless of whether Fidelity achieves any such economies of scale.
The Board further concluded that any potential economies of scale are being shared between fund shareholders and Fidelity in an appropriate manner.
Additional Information Requested by the Board. In order to develop fully the factual basis for consideration of the Fidelity funds' Advisory Contracts, the Board requested and received additional information on several topics, including (i) fund performance trends and actions to be taken by FMR to improve certain funds' overall performance; (ii) Fidelity's portfolio manager compensation structure, including its effects on fund profitability and the extent to which portfolio manager compensation is linked to fund performance; (iii) Fidelity's fee structures; (iv) the funds' sub-advisory arrangements; and (v) accounts managed by Fidelity other than the Fidelity funds.
Annual Report
Based on its evaluation of all of the conclusions noted above, and after considering all material factors, the Board ultimately concluded that the advisory fee structures are fair and reasonable, and that the fund's Advisory Contracts should be renewed.
Annual Report
Annual Report
Annual Report
Investment Adviser
Fidelity Management & Research Company
Boston, MA
Investment Sub-Advisers
FMR Co., Inc.
Fidelity Management & Research
(U.K.) Inc.
Fidelity Research & Analysis Company
Fidelity International
Investment Advisors
Fidelity Investments Japan Limited
Fidelity International Investment Advisors (U.K.) Limited
General Distributor
Fidelity Distributors Corporation
Boston, MA
Transfer and Service Agents
Fidelity Investments Institutional Operations Company, Inc.
Boston, MA
Fidelity Service Company, Inc.
Boston, MA
Custodian
Brown Brothers Harriman & Co.
Boston, MA
AICAP-UANN-1207
1.784754.104
(Fidelity Investment logo)(registered trademark)
(Fidelity Investment logo)(registered trademark)
Fidelity® Advisor
International
Capital Appreciation
Fund - Institutional Class
Annual Report
October 31, 2007
(2_fidelity_logos) (Registered_Trademark)
Contents
Chairman's Message | <Click Here> | Ned Johnson's message to shareholders. |
Note to Shareholders | <Click Here> | An explanation of the changes to the fund. |
Performance | <Click Here> | How the fund has done over time. |
Management's Discussion | <Click Here> | The manager's review of fund performance, strategy and outlook. |
Shareholder Expense Example | <Click Here> | An example of shareholder expenses. |
Investment Changes | <Click Here> | A summary of major shifts in the fund's investments over the past six months. |
Investments | <Click Here> | A complete list of the fund's investments with their market values. |
Financial Statements | <Click Here> | Statements of assets and liabilities, operations, and changes in net assets,
as well as financial highlights. |
Notes | <Click Here> | Notes to the financial statements. |
Report of Independent Registered Public Accounting Firm | <Click Here> | |
Trustees and Officers | <Click Here> | |
Distributions | <Click Here> | |
Proxy Voting Results | <Click Here> | |
Board Approval of Investment Advisory Contracts and Management Fees | <Click Here> | |
To view a fund's proxy voting guidelines and proxy voting record for the 12-month period ended June 30, visit http://www.fidelity.com (search for "proxy voting guidelines") or visit the Securities and Exchange Commission's (SEC) web site at http://www.sec.gov. You may also call 1-877-208-0098 to request a free copy of the proxy voting guidelines.
Standard & Poor's, S&P and S&P 500 are registered service marks of The McGraw-Hill Companies, Inc. and have been licensed for use by Fidelity Distributors Corporation.
Other third party marks appearing herein are the property of their respective owners.
All other marks appearing herein are registered or unregistered trademarks or service marks of FMR LLC or an affiliated company.
Annual Report
This report and the financial statements contained herein are submitted for the general information of the shareholders of the fund. This report is not authorized for distribution to prospective investors in the fund unless preceded or accompanied by an effective prospectus.
A fund files its complete schedule of portfolio holdings with the SEC for the first and third quarters of each fiscal year on Form N-Q. Forms N-Q are available on the SEC's web site at http://www.sec.gov. A fund's Forms N-Q may be reviewed and copied at the SEC's Public Reference Room in Washington, DC. Information regarding the operation of the SEC's Public Reference Room may be obtained by calling 1-800-SEC-0330. For a complete list of a fund's portfolio holdings, view the most recent holdings listing, semiannual report, or annual report on Fidelity's web site at http://www.fidelity.com or http://www.advisor.fidelity.com, as applicable.
NOT FDIC INSURED · MAY LOSE VALUE · NO BANK GUARANTEE
Neither the fund nor Fidelity Distributors Corporation is a bank.
Annual Report
Chairman's Message
(photo_of_Edward_C_Johnson_3d)
Dear Shareholder:
Many stock and bond markets around the world have been unsettled of late; however, volatility can often lead to opportunity for patient investors. Financial markets are always unpredictable, but there are a number of time-tested principles that can put the historical odds in your favor.
One of the basic tenets is to invest for the long term. Over time, riding out the markets' inevitable ups and downs has proven much more effective than selling into panic or chasing the hottest trend. Even missing only a few of the markets' best days can significantly diminish investor returns. Patience also affords the benefits of compounding - of earning interest on additional income or reinvested dividends and capital gains. There are tax advantages and cost benefits to consider as well. The more you sell, the more taxes you pay, and the more you trade, the higher the costs. While staying the course doesn't eliminate risk, it can considerably lessen the effect of short-term declines.
You can further manage your investing risk through diversification. And today, more than ever, geographic diversification should be taken into account. Studies indicate that asset allocation is the single most important determinant of a portfolio's long-term success. The right mix of stocks, bonds and cash - aligned to your particular risk tolerance and investment objective - is very important. Age-appropriate rebalancing is also an essential aspect of asset allocation. For younger investors, an emphasis on equities - which historically have been the best-performing asset class over time - is encouraged. As investors near their specific goal, such as retirement or sending a child to college, consideration may be given to replacing volatile assets (e.g. common stocks) with more-stable fixed investments (bonds or savings plans).
A third investment principle - investing regularly - can help lower the average cost of your purchases. Investing a certain amount of money each month or quarter helps ensure you won't pay for all your shares at market highs. This strategy - known as dollar cost averaging - also reduces unconstructive "emotion" from investing, helping shareholders avoid selling weak performers just prior to an upswing, or chasing a hot performer just before a correction.
We invite you to contact us via the Internet, through our Investor Centers or over the phone. It is our privilege to provide you the information you need to make the investments that are right for you.
Sincerely,
/s/Edward C. Johnson 3d
Edward C. Johnson 3d
Annual Report
Note to Shareholders:
On July 18, 2007, shareholders of Fidelity® Advisor International Capital Appreciation Fund approved a new management contract for the fund, effective August 1, 2007, which adds a performance adjustment component to the management fee based on the fund's performance versus the Morgan Stanley Capital InternationalSM All Country World (MSCI® ACWI) ex USA Index. The new contract also allows the Board of Trustees to designate an alternate performance adjustment index in the future, without a shareholder vote, when permitted by applicable law.
Annual Report
Performance: The Bottom Line
Average annual total return reflects the change in the value of an investment, assuming reinvestment of the class' dividend income and capital gains (the profits earned upon the sale of securities that have grown in value) and assuming a constant rate of performance each year. The $10,000 table and the fund's returns do not reflect the deduction of taxes that a shareholder would pay on fund distributions or the redemption of fund shares. During periods of reimbursement by Fidelity, a fund's total return will be greater than it would be had the reimbursement not occurred. How a fund did yesterday is no guarantee of how it will do tomorrow.
Average Annual Total Returns
Periods ended October 31, 2007 | | Past 1
year | Past 5
years | Life of
fundA |
Institutional Class | | 25.16% | 18.81% | 10.93% |
A From November 3, 1997.
$10,000 Over Life of Fund
Let's say hypothetically that $10,000 was invested in Fidelity® Advisor International Capital Appreciation Fund - Institutional Class on November 3, 1997, when the fund started. The chart shows how the value of your investment would have changed, and also shows how the MSCI ACWI ex USA Index performed over the same period.
Annual Report
Management's Discussion of Fund Performance
Comments from Darren Maupin, Portfolio Manager of Fidelity Advisor International Capital Appreciation Fund
Foreign stocks, with a large assist from a weak U.S. dollar, generally had higher returns for U.S. investors than domestic equities during the 12-month period ending October 31, 2007. The backdrop for global stocks was solid, with robust economic growth and relatively high corporate profitability worldwide. Developed international equity markets, as measured by the Morgan Stanley Capital InternationalSM Europe, Australasia, and Far East (MSCI® EAFE®) Index - a performance monitor of established markets outside the United States and Canada - rose 25.09%. In comparison, the Standard & Poor's 500SM Index, a gauge of U.S. stocks, was up 14.56%. Among countries making up at least 1% of the EAFE benchmark, Finland had the best showing, soaring nearly 69%, while Hong Kong gained roughly 66%. The United Kingdom and Japan, the two largest components of the index, both underperformed. Fallout from the credit crunch and concerns about export growth tempered U.K. stocks, while Japan struggled with a slowdown in consumer spending and sluggish domestic growth. Emerging markets were the period's big winners, advancing 68.33% as measured by the MSCI Emerging Markets index.
The fund's Institutional Class shares were up 25.16% for the year, but trailed the 32.60% advance of the MSCI All Country World ex USA index, mainly due to unrewarding stock selection. I held big stakes in two North American pulp and paper companies - Catalyst Paper and AbitibiBowater - believing they would benefit from consolidation in this over-capacity industry. Both stocks disappointed and were a significant drag on relative performance. Unproductive stock selection in financials - especially Japan's Shinsei Bank and U.K. reinsurance broker Benfield Group - also hurt, as did Japanese farm equipment manufacturer Kubota and positions in cash and sovereign bonds. Upside performance came from several stocks with leverage to global agriculture, which benefited from favorable supply/demand dynamics. Among the top contributors were Saskatchewan Wheat Pool, a dominant player in Canada's grain business; two large makers of farm equipment - U.S.-based Deere & Co. and Netherlands-based CNH Global; and Fiat, the Italian automaker. Some of the stocks I've mentioned were sold by period end.
Note to shareholders: Sammy Simnegar will become Portfolio Manager of the fund on January 1, 2008, replacing Darren Maupin.
The views expressed above reflect those of the portfolio manager(s) only through the end of the period as stated on the cover of this report and do not necessarily represent the views of Fidelity or any other person in the Fidelity organization. Any such views are subject to change at any time based upon market or other conditions and Fidelity disclaims any responsibility to update such views. These views may not be relied on as investment advice and, because investment decisions for a Fidelity fund are based on numerous factors, may not be relied on as an indication of trading intent on behalf of any Fidelity fund.
Annual Report
Shareholder Expense Example
As a shareholder of the Fund, you incur two types of costs: (1) transaction costs, including sales charges (loads) on purchase payments or redemption proceeds, redemption fees, and (2) ongoing costs, including management fees, distribution and/or service (12b-1) fees and other Fund expenses. This Example is intended to help you understand your ongoing costs (in dollars) of investing in the Fund and to compare these costs with the ongoing costs of investing in other mutual funds.
The Example is based on an investment of $1,000 invested at the beginning of the period and held for the entire period (May 1, 2007 to October 31, 2007).
Actual Expenses
The first line of the accompanying table for each class of the Fund provides information about actual account values and actual expenses. You may use the information in this line, together with the amount you invested, to estimate the expenses that you paid over the period. Simply divide your account value by $1,000.00 (for example, an $8,600 account value divided by $1,000.00 = 8.6), then multiply the result by the number in the first line for a class of the Fund under the heading entitled "Expenses Paid During Period" to estimate the expenses you paid on your account during this period. In addition, the Fund, as a shareholder in the underlying Fidelity Central Funds, will indirectly bear its pro rata share of the fees and expenses incurred by the underlying Fidelity Central Funds. These fees and expenses are not included in the Fund's annualized expense ratio used to calculate the expense estimate in the table below.
Hypothetical Example for Comparison Purposes
The second line of the accompanying table for each class of the Fund provides information about hypothetical account values and hypothetical expenses based on a Class' actual expense ratio and an assumed rate of return of 5% per year before expenses, which is not the Class' actual return. The hypothetical account values and expenses may not be used to estimate the actual ending account balance or expenses you paid for the period. You may use this information to compare the ongoing costs of investing in the Fund and other funds. To do so, compare this 5% hypothetical example with the 5% hypothetical examples that appear in the shareholder reports of the other funds. In addition, the Fund, as a shareholder in the underlying Fidelity Central Funds, will indirectly bear its pro rata share of the fees and expenses incurred by the underlying Fidelity Central Funds. These fees and expenses are not included in the Fund's annualized expense ratio used to calculate the expense estimate in the table below.
Annual Report
Please note that the expenses shown in the table are meant to highlight your ongoing costs only and do not reflect any transaction costs. Therefore, the second line of the table is useful in comparing ongoing costs only, and will not help you determine the relative total costs of owning different funds. In addition, if these transactional costs were included, your costs would have been higher.
| Beginning
Account Value
May 1, 2007 | Ending
Account Value
October 31, 2007 | Expenses Paid
During Period*
May 1, 2007
to October 31, 2007 |
Class A | | | |
Actual | $ 1,000.00 | $ 1,065.10 | $ 7.76 |
HypotheticalA | $ 1,000.00 | $ 1,017.69 | $ 7.58 |
Class T | | | |
Actual | $ 1,000.00 | $ 1,063.70 | $ 8.84 |
HypotheticalA | $ 1,000.00 | $ 1,016.64 | $ 8.64 |
Class B | | | |
Actual | $ 1,000.00 | $ 1,061.10 | $ 11.64 |
HypotheticalA | $ 1,000.00 | $ 1,013.91 | $ 11.37 |
Class C | | | |
Actual | $ 1,000.00 | $ 1,060.90 | $ 11.48 |
HypotheticalA | $ 1,000.00 | $ 1,014.06 | $ 11.22 |
Institutional Class | | | |
Actual | $ 1,000.00 | $ 1,066.80 | $ 6.04 |
HypotheticalA | $ 1,000.00 | $ 1,019.36 | $ 5.90 |
A 5% return per year before expenses
* Expenses are equal to each Class' annualized expense ratio (shown in the table below); multiplied by the average account value over the period, multiplied by 184/365 (to reflect the one-half year period).
| Annualized
Expense Ratio |
Class A | 1.49% |
Class T | 1.70% |
Class B | 2.24% |
Class C | 2.21% |
Institutional Class | 1.16% |
Annual Report
Investment Changes
Top Five Stocks as of October 31, 2007 |
| % of fund's
net assets | % of fund's net assets
6 months ago |
Hutchison Whampoa Ltd. (Hong Kong, Industrial Conglomerates) | 5.8 | 0.0 |
Kubota Corp. (Japan, Machinery) | 4.7 | 1.9 |
Takeda Pharamaceutical Co. Ltd. (Japan, Pharmaceuticals) | 4.0 | 0.3 |
Gold Fields Ltd. (South Africa, Metals & Mining) | 4.0 | 4.9 |
AbitibiBowater, Inc. (United States of America, Paper & Forest Products) | 3.7 | 0.0 |
| 22.2 | |
Top Five Market Sectors as of October 31, 2007 |
| % of fund's
net assets | % of fund's net assets
6 months ago |
Materials | 22.6 | 20.9 |
Health Care | 13.0 | 7.5 |
Financials | 12.5 | 9.3 |
Industrials | 10.9 | 9.4 |
Energy | 8.7 | 9.2 |
Top Five Countries as of October 31, 2007 |
(excluding cash equivalents) | % of fund's
net assets | % of fund's net assets
6 months ago |
Japan | 29.4 | 17.8 |
Canada | 20.2 | 18.5 |
United States of America | 9.4 | 10.7 |
Hong Kong | 5.8 | 0.0 |
Germany | 4.9 | 4.7 |
Percentages are adjusted for the effect of open futures contracts, if applicable. |
Asset Allocation (% of fund's net assets) |
As of October 31, 2007 | As of April 30, 2007 |
| Stocks 91.2% | | | Stocks 88.4% | |
| Bonds 1.1% | | | Bonds 1.0% | |
| Short-Term
Investments and
Net Other Assets 7.7% | | | Short-Term
Investments and
Net Other Assets 10.6% | |

Annual Report
Investments October 31, 2007
Showing Percentage of Net Assets
Common Stocks - 89.4% |
| Shares | | Value |
Argentina - 2.3% |
Cresud S.A.C.I.F. y A. sponsored ADR (e) | 175,138 | | $ 4,322,406 |
Inversiones y Representaciones SA sponsored GDR (a) | 92,500 | | 1,652,050 |
Pampa Holding SA (a) | 3,998,420 | | 3,576,780 |
TOTAL ARGENTINA | | 9,551,236 |
Australia - 0.5% |
ABB Grain Ltd. | 237,122 | | 1,669,220 |
Newcrest Mining Ltd. | 9,965 | | 303,767 |
TOTAL AUSTRALIA | | 1,972,987 |
Canada - 20.2% |
Absolut Resources Corp. (a) | 995,000 | | 1,043,264 |
Aquiline Resources, Inc. (a) | 814,800 | | 9,155,929 |
Aquiline Resources, Inc. (a)(f) | 354,100 | | 3,979,031 |
Canadian Natural Resources Ltd. | 90,100 | | 7,496,564 |
Canfor Corp. (a) | 730,700 | | 6,771,473 |
Catalyst Paper Corp. (a) | 4,595,600 | | 6,911,409 |
European Goldfields Ltd. (a) | 1,278,100 | | 8,690,322 |
Guyana Goldfields, Inc. (a) | 227,800 | | 2,352,309 |
IAMGOLD Corp. | 1,037,200 | | 9,095,548 |
NuVista Energy Ltd. (a) | 147,900 | | 2,305,749 |
ProEx Energy Ltd. (a) | 286,500 | | 4,427,065 |
Saskatchewan Wheat Pool, Inc. (a) | 8,400 | | 113,607 |
Saskatchewan Wheat Pool, Inc. (a)(f) | 596,400 | | 8,066,117 |
Suncor Energy, Inc. | 45,500 | | 4,985,146 |
Trican Well Service Ltd. | 424,200 | | 8,985,384 |
TOTAL CANADA | | 84,378,917 |
Cayman Islands - 2.2% |
Apex Silver Mines Ltd. (a) | 189,900 | | 3,892,950 |
Hutchison Telecommunications International Ltd. (a) | 3,676,000 | | 5,246,772 |
TOTAL CAYMAN ISLANDS | | 9,139,722 |
Czech Republic - 2.5% |
Philip Morris CR AS | 20,075 | | 10,472,880 |
France - 3.0% |
Sanofi-Aventis sponsored ADR (e) | 279,600 | | 12,305,196 |
Germany - 4.9% |
E.ON AG | 64,700 | | 12,635,910 |
Lanxess AG | 157,100 | | 7,845,595 |
TOTAL GERMANY | | 20,481,505 |
Common Stocks - continued |
| Shares | | Value |
Hong Kong - 5.8% |
Hutchison Whampoa Ltd. | 1,934,000 | | $ 24,368,401 |
Japan - 24.9% |
Aioi Insurance Co. Ltd. | 1,037,000 | | 6,028,453 |
Canon, Inc. | 79,700 | | 4,030,429 |
Kose Corp. (e) | 376,100 | | 9,654,570 |
Kubota Corp. | 2,026,000 | | 17,012,710 |
Kubota Corp. sponsored ADR | 58,300 | | 2,454,430 |
Millea Holdings, Inc. | 152,768 | | 5,997,672 |
Mitsui Marine & Fire Insurance Co. Ltd. | 491,000 | | 5,632,434 |
Nec Electronics Corp. (a) | 30,200 | | 827,580 |
Nissin Healthcare Food Service Co. | 37,700 | | 461,505 |
Parco Co. Ltd. | 340,500 | | 4,768,046 |
Seino Holdings Co. Ltd. | 211,000 | | 1,812,174 |
SFCG Co. Ltd. | 44,330 | | 7,354,380 |
Shinsei Bank Ltd. | 4,253,000 | | 13,788,125 |
Takeda Pharmaceutical Co. Ltd. | 269,200 | | 16,819,083 |
Tokyo Steel Manufacturing Co. Ltd. | 120,200 | | 1,667,119 |
Torii Pharmaceutical Co. Ltd. | 76,800 | | 1,353,724 |
Tsutsumi Jewelry Co. Ltd. | 90,600 | | 1,982,186 |
USS Co. Ltd. | 31,550 | | 2,066,992 |
TOTAL JAPAN | | 103,711,612 |
Korea (South) - 0.0% |
Samwhan Corp. | 10 | | 335 |
Netherlands - 2.8% |
Koninklijke Philips Electronics NV (e) | 284,200 | | 11,748,828 |
Philippines - 2.0% |
DMCI Holdings, Inc. | 12,042,000 | | 3,327,668 |
Semirara Mining Corp. | 4,601,500 | | 4,768,394 |
TOTAL PHILIPPINES | | 8,096,062 |
South Africa - 4.0% |
Gold Fields Ltd. | 140,700 | | 2,542,449 |
Gold Fields Ltd. sponsored ADR | 789,700 | | 14,269,879 |
TOTAL SOUTH AFRICA | | 16,812,328 |
Switzerland - 2.4% |
Actelion Ltd. (Reg.) (a) | 204,100 | | 10,140,685 |
Taiwan - 2.5% |
Taiwan Mobile Co. Ltd. | 7,812,000 | | 10,465,837 |
Common Stocks - continued |
| Shares | | Value |
United States of America - 9.4% |
AbitibiBowater, Inc. (e) | 443,951 | | $ 15,209,761 |
Deere & Co. | 800 | | 123,920 |
Synthes, Inc. | 110,016 | | 13,734,191 |
Virgin Media, Inc. | 458,490 | | 10,137,214 |
TOTAL UNITED STATES OF AMERICA | | 39,205,086 |
TOTAL COMMON STOCKS (Cost $341,373,385) | 372,851,617 |
Nonconvertible Preferred Stocks - 1.8% |
| | | |
Italy - 1.8% |
Istituto Finanziario Industriale SpA (IFI) (a)
(Cost $7,010,136) | 179,700 | | 7,482,441 |
Government Obligations - 5.6% |
| Principal
Amount (d) | | |
Japan - 4.5% |
Japan Government 0.5953% to 0.6503% 11/5/07
to 1/21/08 | JPY | 2,150,000,000 | | 18,627,309 |
Switzerland - 1.1% |
Switzerland Confederation 4.25% 1/8/08 | CHF | 5,573,000 | | 4,826,277 |
TOTAL GOVERNMENT OBLIGATIONS (Cost $22,770,599) | 23,453,586 |
Money Market Funds - 6.2% |
| Shares | | Value |
Fidelity Cash Central Fund, 4.97% (b) | 9,932,507 | | $ 9,932,507 |
Fidelity Securities Lending Cash Central Fund, 5.02% (b)(c) | 16,078,670 | | 16,078,670 |
TOTAL MONEY MARKET FUNDS (Cost $26,011,177) | 26,011,177 |
TOTAL INVESTMENT PORTFOLIO - 103.0% (Cost $397,165,297) | | 429,798,821 |
NET OTHER ASSETS - (3.0)% | | (12,456,471) |
NET ASSETS - 100% | $ 417,342,350 |
Forward Foreign Currency Contracts |
| Settlement Dates | | Value | | Unrealized Appreciation/
(Depreciation) |
Contracts to Buy |
885,642 AUD | Nov. 2007 | | $ 824,229 | | $ 24,229 |
941,448 CHF | Nov. 2007 | | 813,651 | | 13,651 |
3,020,108 EUR | Nov. 2007 | | 4,376,622 | | 76,622 |
1,374,274 GBP | Nov. 2007 | | 2,855,839 | | 55,839 |
292,897,500 JPY | Nov. 2007 | | 2,543,906 | | 43,906 |
| | $ 11,414,247 | | $ 214,247 |
|
(Payable Amount $11,200,000) |
The value of contracts to buy as a percentage of net assets - 2.7% |
|
Currency Abbreviations |
AUD | - | Australian dollar |
CHF | - | Swiss franc |
EUR | - | European Monetary Unit |
GBP | - | British pound |
JPY | - | Japanese yen |
Legend |
(a) Non-income producing |
(b) Affiliated fund that is available only to investment companies and other accounts managed by Fidelity Investments. The rate quoted is the annualized seven-day yield of the fund at period end. A complete unaudited listing of the fund's holdings as of its most recent quarter end is available upon request. |
(c) Investment made with cash collateral received from securities on loan. |
(d) Principal amount is stated in United States dollars unless otherwise noted. |
(e) Security or a portion of the security is on loan at period end. |
(f) Security exempt from registration under Rule 144A of the Securities Act of 1933. These securities may be resold in transactions exempt from registration, normally to qualified institutional buyers. At the end of the period, the value of these securities amounted to $12,045,148 or 2.9% of net assets. |
Affiliated Central Funds |
Information regarding fiscal year to date income earned by the Fund from investments in Fidelity Central Funds is as follows: |
Fund | Income earned |
Fidelity Cash Central Fund | $ 1,545,973 |
Fidelity Securities Lending Cash Central Fund | 432,880 |
Total | $ 1,978,853 |
See accompanying notes which are an integral part of the financial statements.
Annual Report
Financial Statements
Statement of Assets and Liabilities
| October 31, 2007 |
| | |
Assets | | |
Investment in securities, at value (including securities loaned of $15,288,536) - See accompanying schedule: Unaffiliated issuers (cost $371,154,120) | $ 403,787,644 | |
Fidelity Central Funds (cost $26,011,177) | 26,011,177 | |
Total Investments (cost $397,165,297) | | $ 429,798,821 |
Receivable for investments sold | | 8,742,692 |
Unrealized appreciation on foreign currency contracts | | 214,247 |
Receivable for fund shares sold | | 177,950 |
Dividends receivable | | 520,161 |
Interest receivable | | 165,858 |
Distributions receivable from Fidelity Central Funds | | 74,076 |
Prepaid expenses | | 212 |
Other receivables | | 38,645 |
Total assets | | 439,732,662 |
| | |
Liabilities | | |
Payable for investments purchased | $ 4,368,614 | |
Payable for fund shares redeemed | 930,997 | |
Accrued management fee | 242,733 | |
Distribution fees payable | 184,798 | |
Other affiliated payables | 111,586 | |
Other payables and accrued expenses | 472,914 | |
Collateral on securities loaned, at value | 16,078,670 | |
Total liabilities | | 22,390,312 |
| | |
Net Assets | | $ 417,342,350 |
Net Assets consist of: | | |
Paid in capital | | $ 295,855,525 |
Undistributed net investment income | | 315,878 |
Accumulated undistributed net realized gain (loss) on investments and foreign currency transactions | | 88,421,478 |
Net unrealized appreciation (depreciation) on investments and assets and liabilities in foreign currencies | | 32,749,469 |
Net Assets | | $ 417,342,350 |
See accompanying notes which are an integral part of the financial statements.
Annual Report
Statement of Assets and Liabilities - continued
| October 31, 2007 |
| | |
Calculation of Maximum Offering Price
Class A:
Net Asset Value and redemption price per share ($113,579,162 ÷ 6,093,662 shares) | | $ 18.64 |
| | |
Maximum offering price per share (100/94.25 of $18.64) | | $ 19.78 |
Class T:
Net Asset Value and redemption price per share ($179,989,719 ÷ 9,792,850 shares) | | $ 18.38 |
| | |
Maximum offering price per share (100/96.50 of $18.38) | | $ 19.05 |
Class B:
Net Asset Value and offering price per share ($40,013,139 ÷ 2,305,253 shares)A | | $ 17.36 |
| | |
Class C:
Net Asset Value and offering price per share ($66,297,673 ÷ 3,805,577 shares)A | | $ 17.42 |
| | |
| | |
Institutional Class:
Net Asset Value, offering price and redemption price per share ($17,462,657 ÷ 895,821 shares) | | $ 19.49 |
A Redemption price per share is equal to net asset value less any applicable contingent deferred sales charge.
See accompanying notes which are an integral part of the financial statements.
Annual Report
Financial Statements - continued
Statement of Operations
| Year ended October 31, 2007 |
| | |
Investment Income | | |
Dividends | | $ 6,429,744 |
Interest | | 94,421 |
Income from Fidelity Central Funds (including $432,880 from security lending) | | 1,978,853 |
| | 8,503,018 |
Less foreign taxes withheld | | (623,465) |
Total income | | 7,879,553 |
| | |
Expenses | | |
Management fee | $ 3,134,900 | |
Transfer agent fees | 1,227,776 | |
Distribution fees | 2,378,420 | |
Accounting and security lending fees | 236,815 | |
Custodian fees and expenses | 196,541 | |
Independent trustees' compensation | 1,515 | |
Registration fees | 85,210 | |
Audit | 85,542 | |
Legal | 13,931 | |
Miscellaneous | 316,276 | |
Total expenses before reductions | 7,676,926 | |
Expense reductions | (340,867) | 7,336,059 |
Net investment income (loss) | | 543,494 |
Realized and Unrealized Gain (Loss) Net realized gain (loss) on: | | |
Investment securities: | | |
Unaffiliated issuers (net of foreign taxes of $143,675) | 88,903,766 | |
Foreign currency transactions | 732,166 | |
Total net realized gain (loss) | | 89,635,932 |
Change in net unrealized appreciation (depreciation) on: Investment securities (net of increase in deferred foreign taxes of $95,467) | 5,888,253 | |
Assets and liabilities in foreign currencies | 391,523 | |
Total change in net unrealized appreciation (depreciation) | | 6,279,776 |
Net gain (loss) | | 95,915,708 |
Net increase (decrease) in net assets resulting from operations | | $ 96,459,202 |
See accompanying notes which are an integral part of the financial statements.
Annual Report
Statement of Changes in Net Assets
| Year ended
October 31,
2007 | Year ended
October 31,
2006 |
Increase (Decrease) in Net Assets | | |
Operations | | |
Net investment income (loss) | $ 543,494 | $ 2,266,586 |
Net realized gain (loss) | 89,635,932 | 89,037,741 |
Change in net unrealized appreciation (depreciation) | 6,279,776 | (5,423,613) |
Net increase (decrease) in net assets resulting
from operations | 96,459,202 | 85,880,714 |
Distributions to shareholders from net investment income | (1,726,224) | (3,614,527) |
Distributions to shareholders from net realized gain | (71,372,564) | (64,341,523) |
Total distributions | (73,098,788) | (67,956,050) |
Share transactions - net increase (decrease) | (47,012,739) | (241,477,433) |
Redemption fees | 75,033 | 71,076 |
Total increase (decrease) in net assets | (23,577,292) | (223,481,693) |
| | |
Net Assets | | |
Beginning of period | 440,919,642 | 664,401,335 |
End of period (including undistributed net investment income of $315,878 and undistributed net investment income of $2,185,614, respectively) | $ 417,342,350 | $ 440,919,642 |
See accompanying notes which are an integral part of the financial statements.
Annual Report
Financial Highlights - Class A
Years ended October 31, | 2007 | 2006 | 2005 | 2004 | 2003 |
Selected Per-Share Data | | | | | |
Net asset value, beginning of period | $ 17.79 | $ 17.38 | $ 15.40 | $ 14.47 | $ 10.93 |
Income from Investment Operations | | | | | |
Net investment income (loss) C | .07 | .12 | .12 | .01 | - G |
Net realized and unrealized gain (loss) | 3.81 | 2.73 | 1.86 | .92 | 3.54 |
Total from investment operations | 3.88 | 2.85 | 1.98 | .93 | 3.54 |
Distributions from net investment income | (.12) | (.20) | - | - | - |
Distributions from net realized gain | (2.90) | (2.24) | - | - | - |
Total distributions | (3.03) H | (2.44) | - | - | - |
Redemption fees added to paid in capital C | - G | - G | - G | - G | - |
Net asset value, end of period | $ 18.64 | $ 17.79 | $ 17.38 | $ 15.40 | $ 14.47 |
Total Return A,B | 24.76% | 17.62% | 12.86% | 6.43% | 32.39% |
Ratios to Average Net Assets D,F | | | | | |
Expenses before reductions | 1.47% | 1.43% | 1.44% | 1.48% | 1.59% |
Expenses net of fee waivers, if any | 1.47% | 1.43% | 1.44% | 1.48% | 1.59% |
Expenses net of all reductions | 1.39% | 1.32% | 1.30% | 1.40% | 1.54% |
Net investment income (loss) | .39% | .70% | .71% | .06% | .01% |
Supplemental Data | | | | | |
Net assets, end of period (000 omitted) | $ 113,579 | $ 110,240 | $ 113,809 | $ 103,606 | $ 41,867 |
Portfolio turnover rate E | 146% | 170% | 176% | 170% | 205% |
A Total returns would have been lower had certain expenses not been reduced during the periods shown.
B Total returns do not include the effect of the sales charges.
C Calculated based on average shares outstanding during the period.
D Fees and expenses of the underlying Fidelity Central Funds are not included in the Fund's expense ratio. The Fund indirectly bears its proportionate share of the expenses of any underlying Fidelity Central Funds.
E Amount does not include the portfolio activity of any underlying Fidelity Central Funds.
F Expense ratios reflect operating expenses of the class. Expenses before reductions do not reflect amounts reimbursed by the investment adviser or reductions from brokerage service arrangements or other expense offset arrangements and do not represent the amount paid by the class during periods when reimbursements or reductions occur. Expenses net of fee waivers reflect expenses after reimbursement by the investment adviser but prior to reductions from brokerage service arrangements or other expense offset arrangements. Expenses net of all reductions represent the net expenses paid by the class.
G Amount represents less than $.01 per share.
H Total distributions of $3.026 per share is comprised of distributions from net investment income of $.123 and distributions from net realized gain of $2.903 per share.
See accompanying notes which are an integral part of the financial statements.
Annual Report
Financial Highlights - Class T
Years ended October 31, | 2007 | 2006 | 2005 | 2004 | 2003 |
Selected Per-Share Data | | | | | |
Net asset value, beginning of period | $ 17.57 | $ 17.18 | $ 15.26 | $ 14.38 | $ 10.88 |
Income from Investment Operations | | | | | |
Net investment income (loss) C | .03 | .08 | .08 | (.03) | (.03) |
Net realized and unrealized gain (loss) | 3.76 | 2.70 | 1.84 | .91 | 3.53 |
Total from investment operations | 3.79 | 2.78 | 1.92 | .88 | 3.50 |
Distributions from net investment income | (.07) | (.15) | - | - | - |
Distributions from net realized gain | (2.90) | (2.24) | - | - | - |
Total distributions | (2.98) H | (2.39) | - | - | - |
Redemption fees added to paid in capital C | - G | - G | - G | - G | - |
Net asset value, end of period | $ 18.38 | $ 17.57 | $ 17.18 | $ 15.26 | $ 14.38 |
Total Return A,B | 24.47% | 17.38% | 12.58% | 6.12% | 32.17% |
Ratios to Average Net Assets D,F | | | | | |
Expenses before reductions | 1.69% | 1.65% | 1.67% | 1.74% | 1.85% |
Expenses net of fee waivers, if any | 1.69% | 1.65% | 1.67% | 1.74% | 1.85% |
Expenses net of all reductions | 1.61% | 1.54% | 1.53% | 1.66% | 1.79% |
Net investment income (loss) | .18% | .48% | .47% | (.20)% | (.24)% |
Supplemental Data | | | | | |
Net assets, end of period (000 omitted) | $ 179,990 | $ 188,320 | $ 216,717 | $ 216,588 | $ 149,514 |
Portfolio turnover rate E | 146% | 170% | 176% | 170% | 205% |
A Total returns would have been lower had certain expenses not been reduced during the periods shown.
B Total returns do not include the effect of the sales charges.
C Calculated based on average shares outstanding during the period.
D Fees and expenses of the underlying Fidelity Central Funds are not included in the Fund's expense ratio. The Fund indirectly bears its proportionate share of the expenses of any underlying Fidelity Central Funds.
E Amount does not include the portfolio activity of any underlying Fidelity Central Funds.
F Expense ratios reflect operating expenses of the class. Expenses before reductions do not reflect amounts reimbursed by the investment adviser or reductions from brokerage service arrangements or other expense offset arrangements and do not represent the amount paid by the class during periods when reimbursements or reductions occur. Expenses net of fee waivers reflect expenses after reimbursement by the investment adviser but prior to reductions from brokerage service arrangements or other expense offset arrangements. Expenses net of all reductions represent the net expenses paid by the class.
G Amount represents less than $.01 per share.
H Total distributions of $2.977 per share is comprised of distributions from net investment income of $.074 and distributions from net realized gain of $2.903 per share.
See accompanying notes which are an integral part of the financial statements.
Annual Report
Financial Highlights - Class B
Years ended October 31, | 2007 | 2006 | 2005 | 2004 | 2003 |
Selected Per-Share Data | | | | | |
Net asset value, beginning of period | $ 16.72 | $ 16.46 | $ 14.70 | $ 13.94 | $ 10.61 |
Income from Investment Operations | | | | | |
Net investment income (loss) C | (.06) | (.02) | (.02) | (.12) | (.09) |
Net realized and unrealized gain (loss) | 3.57 | 2.57 | 1.78 | .88 | 3.42 |
Total from investment operations | 3.51 | 2.55 | 1.76 | .76 | 3.33 |
Distributions from net investment income | - | (.05) | - | - | - |
Distributions from net realized gain | (2.87) | (2.24) | - | - | - |
Total distributions | (2.87) H | (2.29) | - | - | - |
Redemption fees added to paid in capital C | - G | - G | - G | - G | - |
Net asset value, end of period | $ 17.36 | $ 16.72 | $ 16.46 | $ 14.70 | $ 13.94 |
Total Return A,B | 23.85% | 16.58% | 11.97% | 5.45% | 31.39% |
Ratios to Average Net Assets D,F | | | | | |
Expenses before reductions | 2.24% | 2.26% | 2.27% | 2.35% | 2.42% |
Expenses net of fee waivers, if any | 2.24% | 2.25% | 2.27% | 2.35% | 2.42% |
Expenses net of all reductions | 2.17% | 2.14% | 2.13% | 2.27% | 2.37% |
Net investment income (loss) | (.38)% | (.13)% | (.13)% | (.80)% | (.82)% |
Supplemental Data | | | | | |
Net assets, end of period (000 omitted) | $ 40,013 | $ 51,661 | $ 57,168 | $ 59,985 | $ 50,358 |
Portfolio turnover rate E | 146% | 170% | 176% | 170% | 205% |
A Total returns would have been lower had certain expenses not been reduced during the periods shown.
B Total returns do not include the effect of the contingent deferred sales charge.
C Calculated based on average shares outstanding during the period.
D Fees and expenses of the underlying Fidelity Central Funds are not included in the Fund's expense ratio. The Fund indirectly bears its proportionate share of the expenses of any underlying Fidelity Central Funds.
E Amount does not include the portfolio activity of any underlying Fidelity Central Funds.
F Expense ratios reflect operating expenses of the class. Expenses before reductions do not reflect amounts reimbursed by the investment adviser or reductions from brokerage service arrangements or other expense offset arrangements and do not represent the amount paid by the class during periods when reimbursements or reductions occur. Expenses net of fee waivers reflect expenses after reimbursement by the investment adviser but prior to reductions from brokerage service arrangements or other expense offset arrangements. Expenses net of all reductions represent the net expenses paid by the class.
G Amount represents less than $.01 per share.
H Total distributions of $2.869 per share is comprised of distributions from net realized gain of $2.869 per share.
See accompanying notes which are an integral part of the financial statements.
Annual Report
Financial Highlights - Class C
Years ended October 31, | 2007 | 2006 | 2005 | 2004 | 2003 |
Selected Per-Share Data | | | | | |
Net asset value, beginning of period | $ 16.80 | $ 16.52 | $ 14.74 | $ 13.96 | $ 10.62 |
Income from Investment Operations | | | | | |
Net investment income (loss) C | (.05) | (.01) | - G | (.10) | (.08) |
Net realized and unrealized gain (loss) | 3.57 | 2.60 | 1.78 | .88 | 3.42 |
Total from investment operations | 3.52 | 2.59 | 1.78 | .78 | 3.34 |
Distributions from net investment income | - | (.07) | - | - | - |
Distributions from net realized gain | (2.90) | (2.24) | - | - | - |
Total distributions | (2.90) H | (2.31) | - | - | - |
Redemption fees added to paid in capital C | - G | - G | - G | - G | - |
Net asset value, end of period | $ 17.42 | $ 16.80 | $ 16.52 | $ 14.74 | $ 13.96 |
Total Return A,B | 23.85% | 16.75% | 12.08% | 5.59% | 31.45% |
Ratios to Average Net Assets D,F | | | | | |
Expenses before reductions | 2.19% | 2.16% | 2.17% | 2.21% | 2.33% |
Expenses net of fee waivers, if any | 2.19% | 2.16% | 2.17% | 2.21% | 2.33% |
Expenses net of all reductions | 2.12% | 2.05% | 2.04% | 2.12% | 2.28% |
Net investment income (loss) | (.33)% | (.03)% | (.03)% | (.66)% | (.73)% |
Supplemental Data | | | | | |
Net assets, end of period (000 omitted) | $ 66,298 | $ 66,162 | $ 67,429 | $ 76,412 | $ 58,560 |
Portfolio turnover rate E | 146% | 170% | 176% | 170% | 205% |
A Total returns would have been lower had certain expenses not been reduced during the periods shown.
B Total returns do not include the effect of the contingent deferred sales charge.
C Calculated based on average shares outstanding during the period.
D Fees and expenses of the underlying Fidelity Central Funds are not included in the Fund's expense ratio. The Fund indirectly bears its proportionate share of the expenses of any underlying Fidelity Central Funds.
E Amount does not include the portfolio activity of any underlying Fidelity Central Funds.
F Expense ratios reflect operating expenses of the class. Expenses before reductions do not reflect amounts reimbursed by the investment adviser or reductions from brokerage service arrangements or other expense offset arrangements and do not represent the amount paid by the class during periods when reimbursements or reductions occur. Expenses net of fee waivers reflect expenses after reimbursement by the investment adviser but prior to reductions from brokerage service arrangements or other expense offset arrangements. Expenses net of all reductions represent the net expenses paid by the class.
G Amount represents less than $.01 per share.
H Total distributions of $2.903 per share is comprised of distributions from net realized gain of $2.903 per share.
See accompanying notes which are an integral part of the financial statements.
Annual Report
Financial Highlights - Institutional Class
Years ended October 31, | 2007 | 2006 | 2005 | 2004 | 2003 |
Selected Per-Share Data | | | | | |
Net asset value, beginning of period | $ 18.46 | $ 17.70 | $ 15.65 | $ 14.70 | $ 11.08 |
Income from Investment Operations | | | | | |
Net investment income (loss) B | .13 | .20 | .16 | .05 | .04 |
Net realized and unrealized gain (loss) | 3.97 | 2.80 | 1.89 | .94 | 3.58 |
Total from investment operations | 4.10 | 3.00 | 2.05 | .99 | 3.62 |
Distributions from net investment income | (.17) | - | - | (.04) | - |
Distributions from net realized gain | (2.90) | (2.24) | - | - | - |
Total distributions | (3.07) G | (2.24) | - | (.04) | - |
Redemption fees added to paid in capital B | - F | - F | - F | - F | - |
Net asset value, end of period | $ 19.49 | $ 18.46 | $ 17.70 | $ 15.65 | $ 14.70 |
Total Return A | 25.16% | 18.09% | 13.10% | 6.75% | 32.67% |
Ratios to Average Net Assets C,E | | | | | |
Expenses before reductions | 1.14% | 1.04% | 1.23% | 1.21% | 1.28% |
Expenses net of fee waivers, if any | 1.14% | 1.04% | 1.23% | 1.21% | 1.28% |
Expenses net of all reductions | 1.07% | .93% | 1.09% | 1.13% | 1.22% |
Net investment income (loss) | .72% | 1.08% | .92% | .34% | .33% |
Supplemental Data | | | | | |
Net assets, end of period (000 omitted) | $ 17,463 | $ 24,536 | $ 209,278 | $ 210,160 | $ 246,623 |
Portfolio turnover rate D | 146% | 170% | 176% | 170% | 205% |
A Total returns would have been lower had certain expenses not been reduced during the periods shown.
B Calculated based on average shares outstanding during the period.
C Fees and expenses of the underlying Fidelity Central Funds are not included in the Fund's expense ratio. The Fund indirectly bears its proportionate share of the expenses of any underlying Fidelity Central Funds.
D Amount does not include the portfolio activity of any underlying Fidelity Central Funds.
E Expense ratios reflect operating expenses of the class. Expenses before reductions do not reflect amounts reimbursed by the investment adviser or reductions from brokerage service arrangements or other expense offset arrangements and do not represent the amount paid by the class during periods when reimbursements or reductions occur. Expenses net of fee waivers reflect expenses after reimbursement by the investment adviser but prior to reductions from brokerage service arrangements or other expense offset arrangements. Expenses net of all reductions represent the net expenses paid by the class.
F Amount represents less than $.01 per share.
G Total distributions of $3.069 per share is comprised of distributions from net investment income of $.166 and distributions from net realized gain of $2.903 per share.
See accompanying notes which are an integral part of the financial statements.
Annual Report
Notes to Financial Statements
For the period ended October 31, 2007
1. Organization.
Fidelity Advisor International Capital Appreciation Fund (the Fund) is a fund of Fidelity Advisor Series VIII (the trust) and is authorized to issue an unlimited number of shares. The trust is registered under the Investment Company Act of 1940, as amended (the 1940 Act), as an open-end management investment company organized as a Massachusetts business trust. The Fund offers Class A, Class T, Class B, Class C, and Institutional Class shares, each of which has equal rights as to assets and voting privileges. Each class has exclusive voting rights with respect to matters that affect that class. Class B shares will automatically convert to Class A shares after a holding period of seven years from the initial date of purchase. Investment income, realized and unrealized capital gains and losses, the common expenses of the Fund, and certain fund-level expense reductions, if any, are allocated on a pro rata basis to each class based on the relative net assets of each class to the total net assets of the Fund. Each class differs with respect to transfer agent and distribution and service plan fees incurred. Certain expense reductions also differ by class. The Fund's investments in emerging markets can be subject to social, economic, regulatory, and political uncertainties and can be extremely volatile.
2. Investments in Fidelity Central Funds.
The Fund may invest in Fidelity Central Funds, which are open-end investment companies available only to other investment companies and accounts managed by Fidelity Management & Research Company (FMR) and its affiliates. The Fund's Schedule of Investments lists each of the Fidelity Central Funds as an investment of the Fund, but does not include the underlying holdings of each Fidelity Central Fund. As an Investing Fund, the Fund indirectly bears its proportionate share of the expenses of the underlying Fidelity Central Funds.
The Money Market Central Funds seek preservation of capital and current income and are managed by Fidelity Investments Money Management, Inc. (FIMM), an affiliate of FMR.
A complete list of holdings for each Fidelity Central Fund is available upon request or at the SEC's web site at www.sec.gov. In addition, the financial statements of the Fidelity Central Funds, which are not covered by the Fund's Report of Independent Registered Public Accounting Firm, are available on the SEC's web site or upon request.
3. Significant Accounting Policies.
The financial statements have been prepared in conformity with accounting principles generally accepted in the United States of America, which require management to make certain estimates and assumptions at the date of the financial statements. The following summarizes the significant accounting policies of the Fund:
Security Valuation. Investments are valued and net asset value (NAV) per share is calculated (NAV calculation) as of the close of business of the New York Stock Exchange
Annual Report
Notes to Financial Statements - continued
3. Significant Accounting Policies - continued
Security Valuation - continued
(NYSE), normally 4:00 p.m. Eastern time. Wherever possible, the Fund uses independent pricing services approved by the Board of Trustees to value its investments.
Equity securities, including restricted securities, for which market quotations are readily available, are valued at the last reported sale price or official closing price as reported by an independent pricing service on the primary market or exchange on which they are traded. In the event there were no sales during the day or closing prices are not available, securities are valued at the last quoted bid price.
Debt securities, including restricted securities, for which quotations are readily available, are valued by independent pricing services or by dealers who make markets in such securities. Pricing services consider yield or price of bonds of comparable quality, coupon, maturity and type as well as dealer supplied prices.
Investments in open-end mutual funds, including the Fidelity Central Funds, are valued at their closing net asset value each business day. Short-term securities with remaining maturities of sixty days or less for which quotations are not readily available are valued at amortized cost, which approximates value.
When current market prices or quotations are not readily available or do not accurately reflect fair value, valuations may be determined in accordance with procedures adopted by the Board of Trustees. For example, when developments occur between the close of a market and the close of the NYSE that may materially affect the value of some or all of the securities, or when trading in a security is halted, those securities may be fair valued. Factors used in the determination of fair value may include monitoring news to identify significant market or security specific events such as changes in the value of U.S. securities markets, reviewing developments in foreign markets and evaluating the performance of ADRs, futures contracts and exchange-traded funds. Because the Fund's utilization of fair value pricing depends on market activity, the frequency with which fair value pricing is used cannot be predicted and may be utilized to a significant extent. The value of securities used for NAV calculation under fair value pricing may differ from published prices for the same securities.
Foreign Currency. The Fund uses foreign currency contracts to facilitate transactions in foreign-denominated securities. Losses from these transactions may arise from changes in the value of the foreign currency or if the counterparties do not perform under the contracts' terms.
Foreign-denominated assets, including investment securities, and liabilities are translated into U.S. dollars at the exchange rate at period end. Purchases and sales of investment securities, income and dividends received and expenses denominated in foreign currencies are translated into U.S. dollars at the exchange rate in effect on the transaction date.
Annual Report
3. Significant Accounting Policies - continued
Foreign Currency - continued
The effects of exchange rate fluctuations on investments are included with the net realized and unrealized gain (loss) on investment securities. Other foreign currency transactions resulting in realized and unrealized gain (loss) are disclosed separately.
Investment Transactions and Income. For financial reporting purposes, the Fund's investment holdings and NAV include trades executed through the end of the last business day of the period. The NAV for processing shareholder transactions includes trades executed through the end of the prior business day. Gains and losses on securities sold are determined on the basis of identified cost and may include proceeds received from litigation. Dividend income is recorded on the ex-dividend date, except for certain dividends from foreign securities where the ex-dividend date may have passed, which are recorded as soon as the Fund is informed of the ex-dividend date. Non-cash dividends included in dividend income, if any, are recorded at the fair market value of the securities received. Interest income and distributions from the Fidelity Central Funds are accrued as earned. Interest income includes coupon interest and amortization of premium and accretion of discount on debt securities. Investment income is recorded net of foreign taxes withheld where recovery of such taxes is uncertain.
Expenses. Most expenses of the trust can be directly attributed to a fund. Expenses which cannot be directly attributed are apportioned among each Fund in the trust. Expense estimates are accrued in the period to which they relate and adjustments are made when actual amounts are known.
Income Tax Information and Distributions to Shareholders. Each year, the Fund intends to qualify as a regulated investment company by distributing all of its taxable income and realized gains under Subchapter M of the Internal Revenue Code. As a result, no provision for income taxes is required in the accompanying financial statements. Foreign taxes are provided for based on the Fund's understanding of the tax rules and rates that exist in the foreign markets in which it invests.
Distributions are recorded on the ex-dividend date. Income dividends and capital gain distributions are declared separately for each class. Income and capital gain distributions are determined in accordance with income tax regulations, which may differ from generally accepted accounting principles. In addition, the Fund will claim a portion of the payment made to redeeming shareholders as a distribution for income tax purposes.
Capital accounts within the financial statements are adjusted for permanent book-tax differences. These adjustments have no impact on net assets or the results of operations. Temporary book-tax differences will reverse in a subsequent period.
Book-tax differences are primarily due to foreign currency transactions, certain foreign taxes, passive foreign investment companies (PFIC), market discount and losses deferred due to wash sales.
Annual Report
Notes to Financial Statements - continued
3. Significant Accounting Policies - continued
Income Tax Information and Distributions to Shareholders - continued
The tax-basis components of distributable earnings and the federal tax cost as of period end were as follows:
Unrealized appreciation | $ 43,860,036 | |
Unrealized depreciation | (26,088,379) | |
Net unrealized appreciation (depreciation) | 17,771,657 | |
Undistributed ordinary income | 61,700,087 | |
Undistributed long-term capital gain | 25,200,880 | |
| | |
Cost for federal income tax purposes | $ 412,027,164 | |
The tax character of distributions paid was as follows:
| October 31, 2007 | October 31, 2006 |
Ordinary Income | $ 8,592,674 | $ 3,614,527 |
Long-term Capital Gains | 64,506,114 | 64,341,523 |
Total | $ 73,098,788 | $ 67,956,050 |
Short-Term Trading (Redemption) Fees. Shares held in the Fund less than 30 days are subject to a redemption fee equal to 1.00% of the proceeds of the redeemed shares. All redemption fees, including any estimated redemption fees paid by FMR, are retained by the Fund and accounted for as an addition to paid in capital.
New Accounting Pronouncements. In July 2006, Financial Accounting Standards Board Interpretation No. 48, Accounting for Uncertainty in Income Taxes - an interpretation of FASB Statement 109 (FIN 48), was issued and is effective on the last business day of the semiannual reporting period for fiscal years beginning after December 15, 2006. FIN 48 sets forth a threshold for financial statement recognition, measurement and disclosure of a tax position taken or expected to be taken on a tax return. Management has concluded that the adoption of FIN 48 will not result in a material impact on the Fund's net assets, results of operations and financial statement disclosures.
In addition, in September 2006, Statement of Financial Accounting Standards No. 157, Fair Value Measurements (SFAS 157), was issued and is effective for fiscal years beginning after November 15, 2007. SFAS 157 defines fair value, establishes a framework for measuring fair value and expands disclosures about fair value measurements. Management is currently evaluating the impact the adoption of SFAS 157 will have on the Fund's financial statement disclosures.
4. Operating Policies.
Forward Foreign Currency Contracts. The Fund generally uses foreign currency contracts to facilitate transactions in foreign-denominated securities and to manage the Fund's currency exposure. Contracts to sell generally are used to hedge the Fund's investments against currency fluctuations, while contracts to buy generally are used to offset a
Annual Report
4. Operating Policies - continued
Forward Foreign Currency Contracts - continued
previous contract to sell. Also, a contract to buy can be used to acquire exposure to foreign currencies and a contract to sell can be used to offset a previous contract to buy. These contracts involve market risk in excess of the unrealized gain or loss reflected in the Fund's Statement of Assets and Liabilities. The U.S. dollar value of the currencies the Fund has committed to buy or sell is shown in the Schedule of Investments under the caption "Forward Foreign Currency Contracts." This amount represents the aggregate exposure to each currency the Fund has acquired or hedged through currency contracts at period end. Losses may arise from changes in the value of foreign currency or if the counterparties do not perform under the contracts' terms.
The U.S. dollar value of forward foreign currency contracts is determined using forward currency exchange rates supplied by a quotation service. Purchases and sales of forward foreign currency contracts having the same settlement date and broker are offset and any realized gain (loss) recognized on the date of offset: otherwise, gain (loss) is recognized on settlement date. Contracts that have been offset with different counterparties are reflected as both a contract to buy and a contract to sell in the Schedule of Investments under the caption "Forward Foreign Currency Contracts."
Repurchase Agreements. FMR has received an Exemptive Order from the Securities and Exchange Commission (the SEC) which permits the Fund and other affiliated entities of FMR to transfer uninvested cash balances into joint trading accounts which are then invested in repurchase agreements. The Fund may also invest directly with institutions in repurchase agreements. Repurchase agreements are collateralized by government or non-government securities. Upon settlement date, collateral is held in segregated accounts with custodian banks and may be obtained in the event of a default of the counterparty. The Fund monitors, on a daily basis, the value of the collateral to ensure it is at least equal to the principal amount of the repurchase agreement (including accrued interest). In the event of a default by the counterparty, realization of the collateral proceeds could be delayed, during which time the value of the collateral may decline.
Restricted Securities. The Fund may invest in securities that are subject to legal or contractual restrictions on resale. These securities generally may be resold in transactions exempt from registration or to the public if the securities are registered. Disposal of these securities may involve time-consuming negotiations and expense, and prompt sale at an acceptable price may be difficult. Information regarding restricted securities is included at the end of the Fund's Schedule of Investments.
5. Purchases and Sales of Investments.
Purchases and sales of securities, other than short-term securities, aggregated $586,680,503 and $733,027,024, respectively.
Annual Report
Notes to Financial Statements - continued
6. Fees and Other Transactions with Affiliates.
Management Fee. FMR and its affiliates provide the Fund with investment management related services for which the Fund pays a monthly management fee. The management fee is the sum of an individual fund fee rate that is based on an annual rate of .45% of the Fund's average net assets and a group fee rate that averaged .26% during the period. The group fee rate is based upon the average net assets of all the mutual funds advised by FMR. The group fee rate decreases as assets under management increase and increases as assets under management decrease.
In addition, on July 18, 2007, shareholders approved a new management contract which adds a performance adjustment to the management fee (up to a maximum of .20% of the Fund's average net assets over a 36 month performance period). The upward or downward adjustment to the management fee is based on the relative investment performance of the Fund's Institutional Class as compared to an appropriate benchmark index. The Fund's performance period began on August 1, 2007. The performance adjustment will take effect starting with the twelfth month of the performance period (July 2008). Subsequent months will be added until the performance period includes 36 months.
For the period, the total annual management fee rate was .71% of the Fund's average net assets.
Distribution and Service Plan. In accordance with Rule 12b-1 of the 1940 Act, the Fund has adopted separate Distribution and Service Plans for each class of shares. Certain classes pay Fidelity Distributors Corporation (FDC), an affiliate of FMR, separate Distribution and Service Fees, each of which is based on an annual percentage of each class' average net assets. In addition, FDC may pay financial intermediaries for selling shares of the Fund and providing shareholder support services.
For the period, the Distribution and Service Fee rates and the total amounts paid to and retained by FDC were as follows:
| Distribution
Fee | Service
Fee | Paid to
FDC | Retained
by FDC |
Class A | 0% | .25% | $ 298,686 | $ 13,003 |
Class T | .25% | .25% | 947,352 | 6,336 |
Class B | .75% | .25% | 464,321 | 348,633 |
Class C | .75% | .25% | 668,061 | 32,030 |
| | | $ 2,378,420 | $ 400,002 |
Sales Load. FDC receives a front-end sales charge of up to 5.75% for selling Class A shares, and 3.50% for selling Class T shares, some of which is paid to financial intermediaries for selling shares of the Fund. FDC receives the proceeds of contingent deferred sales charges levied on Class A, Class T, Class B, and Class C redemptions. These charges depend on the holding period. The deferred sales charges range from 5% to 1% for Class B, 1% for Class C, 1.00% to .50% for certain purchases of Class A shares and .25% for certain purchases of Class T shares.
Annual Report
6. Fees and Other Transactions with Affiliates - continued
Sales Load - continued
For the period, sales charge amounts retained by FDC were as follows:
| Retained
by FDC |
Class A | $ 23,764 |
Class T | 10,314 |
Class B* | 67,173 |
Class C* | 2,330 |
| $ 103,581 |
* When Class B and Class C shares are initially sold, FDC pays commissions from its own resources to financial intermediaries through which the sales are made.
Transfer Agent Fees. Fidelity Investments Institutional Operations Company, Inc. (FIIOC), an affiliate of FMR, is the transfer, dividend disbursing and shareholder servicing agent for each class of the Fund. FIIOC receives account fees and asset-based fees that vary according to the account size and type of account of the shareholders of the respective classes of the Fund. FIIOC pays for typesetting, printing and mailing of shareholder reports, except proxy statements. For the period, the total transfer agent fees paid by each class to FIIOC, were as follows:
| Amount | % of
Average
Net Assets |
Class A | $ 360,637 | .30 |
Class T | 498,512 | .26 |
Class B | 146,400 | .32 |
Class C | 179,681 | .27 |
Institutional Class | 42,546 | .22 |
| $ 1,227,776 | |
Accounting and Security Lending Fees. Fidelity Service Company, Inc. (FSC), an affiliate of FMR, maintains the Fund's accounting records. The accounting fee is based on the level of average net assets for the month. Under a separate contract, FSC administers the security lending program. The security lending fee is based on the number and duration of lending transactions.
Brokerage Commissions. The Fund placed a portion of its portfolio transactions with brokerage firms which are affiliates of the investment adviser. The commissions paid to these affiliated firms were $396 for the period.
7. Committed Line of Credit.
The Fund participates with other funds managed by FMR in a $4.2 billion credit facility (the "line of credit") to be utilized for temporary or emergency purposes to fund shareholder redemptions or for other short-term liquidity purposes. The Fund has agreed to pay commitment fees on its pro rata portion of the line of credit, which amounted to $940 and
Annual Report
Notes to Financial Statements - continued
7. Committed Line of Credit - continued
is reflected in Miscellaneous Expense on the Statement of Operations. During the period, there were no borrowings on this line of credit.
8. Security Lending.
The Fund lends portfolio securities from time to time in order to earn additional income. On the settlement date of the loan, the Fund receives collateral (in the form of U.S. Treasury obligations, letters of credit and/or cash) against the loaned securities and maintains collateral in an amount not less than 100% of the market value of the loaned securities during the period of the loan. The market value of the loaned securities is determined at the close of business of the Fund and any additional required collateral is delivered to the Fund on the next business day. If the borrower defaults on its obligation to return the securities loaned because of insolvency or other reasons, a fund could experience delays and costs in recovering the securities loaned or in gaining access to the collateral. Any cash collateral received is invested in the Fidelity Securities Lending Cash Central Fund. The value of loaned securities and cash collateral at period end are disclosed on the Fund's Statement of Assets and Liabilities. Security lending income represents the income earned on investing cash collateral, less fees and expenses associated with the loan, plus any premium payments that may be received on the loan of certain types of securities. Security lending income is presented in the Statement of Operations as a component of income from Fidelity Central Funds.
9. Expense Reductions.
Many of the brokers with whom FMR places trades on behalf of the Fund provided services to the Fund in addition to trade execution. These services included payments of certain expenses on behalf of the Fund totaling $312,177 for the period. In addition, through arrangements with the Fund's custodian and each class' transfer agent, credits realized as a result of uninvested cash balances were used to reduce the Fund's expenses. During the period, these credits reduced the Fund's custody expenses by $8,243. During the period, credits reduced each class' transfer agent expense as noted in the table below.
| Transfer Agent
expense reduction | |
Class A | $ 6,615 | |
Class T | 4,034 | |
Class B | 114 | |
Class C | 289 | |
| $ 11,052 | |
10. Other.
The Fund's organizational documents provide former and current trustees and officers with a limited indemnification against liabilities arising in connection with the
Annual Report
10. Other - continued
performance of their duties to the Fund. In the normal course of business, the Fund may also enter into contracts that provide general indemnifications. The Fund's maximum exposure under these arrangements is unknown as this would be dependent on future claims that may be made against the Fund. The risk of material loss from such claims is considered remote.
In September 2006, FIIOC, the Fund's transfer agent, notified the Fund that the Fund's books and records did not reflect a conversion of certain Class B to Class A shares upon their conversion date. In March 2007, FIIOC converted the relevant Class B shares to Class A shares and recorded the conversion in the books and records of the Fund which did not result in a material impact to the Fund's reported net assets or results of operations in the accompanying financial statements. FIIOC has remediated affected shareholders and reimbursed the Fund for all related audit and legal expenses.
The United States Securities and Exchange Commission ("SEC") is conducting an investigation of FMR (covering the years 2002 to 2004) arising from gifts, gratuities and business entertainment provided by certain brokers to certain individuals who were employed on FMR's domestic equity trading desk during that period. FMR is in discussions with the SEC staff regarding the possible resolution of the matter, but as of period-end no final resolution has been reached.
In December 2006, the Independent Trustees completed their own investigation of the matter with the assistance of independent counsel. The Independent Trustees and FMR agree that, despite the absence of proof that the Fidelity mutual funds experienced diminished execution quality as a result of the improper receipt of gifts and business entertainment, the conduct at issue was serious and is worthy of redress. Accordingly, the Independent Trustees have requested and FMR has agreed to pay $42 million to Fidelity mutual funds, plus interest to be determined at the time that payment is made. A method of allocating this payment among the funds has not yet been determined. The total payment to the Fund is not anticipated to have a material impact on the Fund's net assets. In addition, FMR reimbursed related legal expenses which are recorded in the accompanying Statement of Operations as an expense reduction.
11. Distributions to Shareholders.
Distributions to shareholders of each class were as follows:
Years ended October 31, | 2007 | 2006 |
From net investment income | | |
Class A | $ 741,807 | $ 1,314,737 |
Class T | 779,904 | 1,864,533 |
Class B | - | 174,253 |
Class C | - | 261,004 |
Institutional Class | 204,513 | - |
Total | $ 1,726,224 | $ 3,614,527 |
Annual Report
Notes to Financial Statements - continued
11. Distributions to Shareholders - continued
Distributions to shareholders of each class were as follows: - continued
Years ended October 31, | 2007 | 2006 |
From net realized gain | | |
Class A | $ 17,507,820 | $ 14,579,264 |
Class T | 30,595,453 | 27,296,712 |
Class B | 8,539,459 | 7,653,477 |
Class C | 11,153,317 | 8,994,200 |
Institutional Class | 3,576,515 | 5,817,870 |
Total | $ 71,372,564 | $ 64,341,523 |
12. Share Transactions.
Transactions for each class of shares were as follows:
| Shares | Dollars |
Years ended October 31, | 2007 | 2006 | 2007 | 2006 |
Class A | | | | |
Shares sold | 2,473,487 | 1,988,269 | $ 42,784,764 | $ 34,527,258 |
Reinvestment of distributions | 1,076,085 | 891,958 | 17,077,468 | 14,610,279 |
Shares redeemed | (3,652,624) | (3,230,754) | (63,819,065) | (55,819,320) |
Net increase (decrease) | (103,052) | (350,527) | $ (3,956,833) | $ (6,681,783) |
Class T | | | | |
Shares sold | 1,816,120 | 2,402,743 | $ 30,886,267 | $ 41,319,563 |
Reinvestment of distributions | 1,951,860 | 1,751,812 | 30,605,163 | 28,379,356 |
Shares redeemed | (4,694,918) | (6,046,800) | (80,369,952) | (103,769,435) |
Net increase (decrease) | (926,938) | (1,892,245) | $ (18,878,522) | $ (34,070,516) |
Class B | | | | |
Shares sold | 202,050 | 302,431 | $ 3,191,835 | $ 4,930,361 |
Reinvestment of distributions | 474,419 | 418,785 | 7,059,355 | 6,495,355 |
Shares redeemed | (1,460,360) | (1,105,832) | (23,561,432) | (18,120,098) |
Net increase (decrease) | (783,891) | (384,616) | $ (13,310,242) | $ (6,694,382) |
Class C | | | | |
Shares sold | 408,629 | 563,695 | $ 6,500,495 | $ 9,212,921 |
Reinvestment of distributions | 649,627 | 507,393 | 9,698,929 | 7,900,111 |
Shares redeemed | (1,190,743) | (1,214,249) | (19,242,229) | (19,964,214) |
Net increase (decrease) | (132,487) | (143,161) | $ (3,042,805) | $ (2,851,182) |
Institutional Class | | | | |
Shares sold | 112,415 | 476,544 | $ 1,997,164 | $ 8,549,810 |
Reinvestment of distributions | 179,235 | 255,142 | 2,966,333 | 4,319,555 |
Shares redeemed | (724,750) | (11,226,497) | (12,787,834) | (204,048,935) |
Net increase (decrease) | (433,100) | (10,494,811) | $ (7,824,337) | $ (191,179,570) |
Annual Report
Report of Independent Registered Public Accounting Firm
To the Trustees of Fidelity Advisor Series VIII and Shareholders of Fidelity Advisor International Capital Appreciation Fund:
We have audited the accompanying statement of assets and liabilities of Fidelity Advisor International Capital Appreciation Fund (the Fund), a fund of Fidelity Advisor Series VIII, including the schedule of investments, as of October 31, 2007, and the related statement of operations for the year then ended, the statement of changes in net assets for each of the two years in the period then ended, and the financial highlights for each of the five years in the period then ended. These financial statements and financial highlights are the responsibility of the Fund's management. Our responsibility is to express an opinion on these financial statements and financial highlights based on our audits.
We conducted our audits in accordance with standards of the Public Company Accounting Oversight Board (United States). Those standards require that we plan and perform the audit to obtain reasonable assurance about whether the financial statements and financial highlights are free of material misstatement. The Fund is not required to have, nor were we engaged to perform, an audit of its internal control over financial reporting. Our audits included consideration of internal control over financial reporting as a basis for designing audit procedures that are appropriate in the circumstances, but not for the purpose of expressing an opinion on the effectiveness of the Fund's internal control over financial reporting. Accordingly, we express no such opinion. An audit also includes examining, on a test basis, evidence supporting the amounts and disclosures in the financial statements, assessing the accounting principles used and significant estimates made by management, as well as evaluating the overall financial statement presentation. Our procedures included confirmation of securities owned as of October 31, 2007, by correspondence with the custodians and brokers; where replies were not received from brokers, we performed other auditing procedures. We believe that our audits provide a reasonable basis for our opinion.
In our opinion, the financial statements and financial highlights referred to above present fairly, in all material respects, the financial position of Fidelity Advisor International Capital Appreciation Fund as of October 31, 2007, the results of its operations for the year then ended, the changes in its net assets for each of the two years in the period then ended, and its financial highlights for each of the five years in the period then ended, in conformity with accounting principles generally accepted in the United States of America.
/s/ Deloitte & Touche LLP
DELOITTE & TOUCHE LLP
Boston, Massachusetts
December 14, 2007
Annual Report
Trustees and Officers
The Trustees, Members of the Advisory Board, and executive officers of the trust and fund, as applicable, are listed below. The Board of Trustees governs the fund and is responsible for protecting the interests of shareholders. The Trustees are experienced executives who meet periodically throughout the year to oversee the fund's activities, review contractual arrangements with companies that provide services to the fund, and review the fund's performance. Except for James C. Curvey, each of the Trustees oversees 370 funds advised by FMR or an affiliate. Mr. Curvey oversees 340 funds advised by FMR or an affiliate.
The Trustees hold office without limit in time except that (a) any Trustee may resign; (b) any Trustee may be removed by written instrument, signed by at least two-thirds of the number of Trustees prior to such removal; (c) any Trustee who requests to be retired or who has become incapacitated by illness or injury may be retired by written instrument signed by a majority of the other Trustees; and (d) any Trustee may be removed at any special meeting of shareholders by a two-thirds vote of the outstanding voting securities of the trust. Each Trustee who is not an interested person (as defined in the 1940 Act) (Independent Trustee), shall retire not later than the last day of the calendar year in which his or her 72nd birthday occurs. The Independent Trustees may waive this mandatory retirement age policy with respect to individual Trustees. The executive officers and Advisory Board Members hold office without limit in time, except that any officer and Advisory Board Member may resign or may be removed by a vote of a majority of the Trustees at any regular meeting or any special meeting of the Trustees. Except as indicated, each individual has held the office shown or other offices in the same company for the past five years.
The fund's Statement of Additional Information (SAI) includes more information about the Trustees. To request a free copy, call Fidelity at 1-877-208-0098.
Interested Trustees*:
Correspondence intended for each Trustee who is an interested person may be sent to Fidelity Investments, 82 Devonshire Street, Boston, Massachusetts 02109.
Name, Age; Principal Occupation |
Edward C. Johnson 3d (77) |
| Year of Election or Appointment: 1983 Mr. Johnson is Chairman of the Board of Trustees. Mr. Johnson serves as President (2006-present), Chief Executive Officer, Chairman, and a Director of FMR LLC; Chairman and a Director of FMR; Chairman and a Director of Fidelity Research & Analysis Company (FRAC); Chairman and a Director of Fidelity Investments Money Management, Inc.; and Chairman (2001-present) and a Director of FMR Co., Inc. In addition, Mr. Johnson serves as Chairman and Director of Fidelity International Limited (FIL). |
James C. Curvey (72) |
| Year of Election or Appointment: 2007 Mr. Curvey also serves as Trustee (2007-present) or Member of the Advisory Board (2007-present) of other investment companies advised by FMR. Mr. Curvey is a Director of FMR and FMR Co., Inc. (2007-present). Mr. Curvey is also Vice Chairman (2006-present) and Director of FMR LLC. Mr. Curvey joined Fidelity in 1982 and served in numerous senior management positions, including President and Chief Operating Officer of FMR LLC (1997-2000) and President of Fidelity Strategic Investments (2000-2002). In addition, he serves as a member of the Board of Directors of Geerlings & Wade, Inc. (wine distribution). |
* Trustees have been determined to be "Interested Trustees" by virtue of, among other things, their affiliation with the trust or various entities under common control with FMR. FMR Corp. merged with FMR LLC on October 1, 2007. Any references to FMR LLC for prior periods are deemed to be references to the prior entity.
Independent Trustees:
Correspondence intended for each Independent Trustee (that is, the Trustees other than the Interested Trustees) may be sent to Fidelity Investments, P.O. Box 55235, Boston, Massachusetts 02205-5235.
Name, Age; Principal Occupation |
Dennis J. Dirks (59) |
| Year of Election or Appointment: 2005 Prior to his retirement in May 2003, Mr. Dirks was Chief Operating Officer and a member of the Board of The Depository Trust & Clearing Corporation (DTCC) (1999-2003). He also served as President, Chief Operating Officer, and Board member of The Depository Trust Company (DTC) (1999-2003) and President and Board member of the National Securities Clearing Corporation (NSCC) (1999-2003). In addition, Mr. Dirks served as Chief Executive Officer and Board member of the Government Securities Clearing Corporation (2001-2003) and Chief Executive Officer and Board member of the Mortgage-Backed Securities Clearing Corporation (2001-2003). Mr. Dirks also serves as a Trustee and a member of the Finance Committee of Manhattan College (2005-present) and a Trustee and a member of the Finance Committee of AHRC of Nassau County (2006-present). |
Albert R. Gamper, Jr. (65) |
| Year of Election or Appointment: 2006 Prior to his retirement in December 2004, Mr. Gamper served as Chairman of the Board of CIT Group Inc. (commercial finance). During his tenure with CIT Group Inc. Mr. Gamper served in numerous senior management positions, including Chairman (1987-1989; 1999-2001; 2002-2004), Chief Executive Officer (1987-2004), and President (1989-2002). He currently serves as a member of the Board of Directors of Public Service Enterprise Group (utilities, 2001-present), Chairman of the Board of Governors, Rutgers University (2004-present), and Chairman of the Board of Saint Barnabas Health Care System. |
George H. Heilmeier (71) |
| Year of Election or Appointment: 2004 Dr. Heilmeier is Chairman Emeritus of Telcordia Technologies (communication software and systems), where prior to his retirement, he served as company Chairman and Chief Executive Officer. He currently serves on the Boards of Directors of The Mitre Corporation (systems engineering and information technology support for the government), and HRL Laboratories (private research and development, 2004-present). He is Chairman of the General Motors Science & Technology Advisory Board and a Life Fellow of the Institute of Electrical and Electronics Engineers (IEEE). Dr. Heilmeier is a member of the Defense Science Board and the National Security Agency Advisory Board. He is also a member of the National Academy of Engineering, the American Academy of Arts and Sciences, and the Board of Overseers of the School of Engineering and Applied Science of the University of Pennsylvania. Previously, Dr. Heilmeier served as a Director of TRW Inc. (automotive, space, defense, and information technology, 1992-2002), Compaq (1994-2002), Automatic Data Processing, Inc. (ADP) (technology-based business outsourcing, 1995-2002), INET Technologies Inc. (telecommunications network surveillance, 2001-2004), and Teletech Holdings (customer management services). He is the recipient of the 2005 Kyoto Prize in Advanced Technology for his invention of the liquid crystal display, and a member of the Consumer Electronics Hall of Fame. |
James H. Keyes (67) |
| Year of Election or Appointment: 2007 Prior to his retirement in 2003, Mr. Keyes was Chairman, President, and Chief Executive Officer of Johnson Controls, Inc. (automotive supplier, 1993-2003). He currently serves as a member of the boards of LSI Logic Corporation (semiconductor technologies), Navistar International Corporation (manufacture and sale of trucks, buses, and diesel engines, 2002-present), and Pitney Bowes, Inc. (integrated mail, messaging, and document management solutions). |
Marie L. Knowles (61) |
| Year of Election or Appointment: 2001 Prior to Ms. Knowles' retirement in June 2000, she served as Executive Vice President and Chief Financial Officer of Atlantic Richfield Company (ARCO) (diversified energy, 1996-2000). From 1993 to 1996, she was a Senior Vice President of ARCO and President of ARCO Transportation Company. She served as a Director of ARCO from 1996 to 1998. She currently serves as a Director of Phelps Dodge Corporation (copper mining and manufacturing) and McKesson Corporation (healthcare service, 2002-present). Ms. Knowles is a Trustee of the Brookings Institution and the Catalina Island Conservancy and also serves as a member of the Advisory Board for the School of Engineering of the University of Southern California. |
Ned C. Lautenbach (63) |
| Year of Election or Appointment: 2000 Mr. Lautenbach is Chairman of the Independent Trustees (2006-present). Mr. Lautenbach has been a partner of Clayton, Dubilier & Rice, Inc. (private equity investment firm) since September 1998. Previously, Mr. Lautenbach was with the International Business Machines Corporation (IBM) from 1968 until his retirement in 1998. Mr. Lautenbach serves as a Director of Sony Corporation (2006-present) and Eaton Corporation (diversified industrial) as well as the Philharmonic Center for the Arts in Naples, Florida. He also is a member of the Board of Trustees of Fairfield University (2005-present), as well as a member of the Council on Foreign Relations. |
Cornelia M. Small (63) |
| Year of Election or Appointment: 2005 Ms. Small is a member (2000-present) and Chairperson (2002-present) of the Investment Committee, and a member (2002-present) of the Board of Trustees of Smith College. Previously, she served as Chief Investment Officer (1999-2000), Director of Global Equity Investments (1996-1999), and a member of the Board of Directors of Scudder, Stevens & Clark (1990-1997) and Scudder Kemper Investments (1997-1999). In addition, Ms. Small served as Co-Chair (2000-2003) of the Annual Fund for the Fletcher School of Law and Diplomacy. |
William S. Stavropoulos (68) |
| Year of Election or Appointment: 2001 Mr. Stavropoulos is Chairman Emeritus of the Board of Directors of The Dow Chemical Company. Since joining The Dow Chemical Company in 1967, Mr. Stavropoulos served in numerous senior management positions, including President (1993-2000; 2002-2003), CEO (1995-2000; 2002-2004), and Chairman of the Executive Committee (2000-2004). Currently, he is a Director of NCR Corporation (data warehousing and technology solutions), Chemical Financial Corporation, Maersk Inc. (industrial conglomerate, 2002-present), Tyco International, Inc. (multinational manufacturing and services, 2007-present), and a member of the Advisory Board for Metalmark Capital (private equity investment firm, 2005-present). He is a special advisor to Clayton, Dubilier & Rice, Inc., a private equity investment firm. He also serves as a member of the Board of Trustees of the American Enterprise Institute for Public Policy Research. In addition, Mr. Stavropoulos is a member of The Business Council, J.P. Morgan International Council and the University of Notre Dame Advisory Council for the College of Science. |
Kenneth L. Wolfe (68) |
| Year of Election or Appointment: 2005 Prior to his retirement in 2001, Mr. Wolfe was Chairman and Chief Executive Officer of Hershey Foods Corporation (1993-2001). He currently serves as a member of the boards of Adelphia Communications Corporation (2003-present), Bausch & Lomb, Inc., and Revlon Inc. (2004-present). |
Advisory Board Members and Executive Officers**:
Correspondence intended for Mr. Mauriello, Mr. Thomas, and Mr. Wiley may be sent to Fidelity Investments, P.O. Box 55235, Boston, Massachusetts 02205-5235. Correspondence intended for each executive officer and Mr. Lynch may be sent to Fidelity Investments, 82 Devonshire Street, Boston, Massachusetts 02109.
Name, Age; Principal Occupation |
Peter S. Lynch (63) |
| Year of Election or Appointment: 2003 Member of the Advisory Board of Fidelity Advisor Series VIII. Mr. Lynch is Vice Chairman and a Director of FMR, and Vice Chairman (2001-present) and a Director of FMR Co., Inc. Previously, Mr. Lynch served as a Trustee of the Fidelity funds (1990-2003). In addition, he serves as a Trustee of Boston College and as the Chairman of the Inner-City Scholarship Fund. |
Joseph Mauriello (63) |
| Year of Election or Appointment: 2007 Member of the Advisory Board of Fidelity Advisor Series VIII. Prior to his retirement in January 2006, Mr. Mauriello served in numerous senior management positions including Deputy Chairman and Chief Operating Officer (2004-2005), and Vice Chairman of Financial Services (2002-2004) of KPMG LLP US (professional services firm, 1965-2005). Mr. Mauriello currently serves as a member of the Board of Directors of XL Capital Ltd., (global insurance and re-insurance company, 2006-present) and of Arcadia Resources Inc., (health care services and products, 2007-present). He also served as a Director of the Hamilton Funds of the Bank of New York (2006-2007). |
David M. Thomas (58) |
| Year of Election or Appointment: 2007 Member of the Advisory Board of Fidelity Advisor Series VIII. Previously, Mr. Thomas served as Executive Chairman (2005-2006) and Chairman and Chief Executive Officer (2000-2005) of IMS Heath, Inc. (pharmaceutical and healthcare information solutions). In addition, Mr. Thomas serves as a member of the Board of Directors of Fortune Brands, Inc. (consumer products holding company), and Interpublic Group of Companies, Inc. (marketing communication, 2004-present). |
Michael E. Wiley (57) |
| Year of Election or Appointment: 2007 Member of the Advisory Board of Fidelity Advisor Series VIII. Mr. Wiley also serves as Sr. Energy Advisor of Katzenbach Partners, LLC (consulting firm, 2006-present) and a member of the Board of Trustees of the University of Tulsa (2000-2006; 2007-present). He serves as a Director of Tesoro Corporation (independent oil refiner and marketer, 2005-present), and a Director of Bill Barrett Corporation (exploration and production company, 2005-present). In addition, he also serves as a Director of Post Oak Bank (privately-held bank, 2004-present), and an Advisory Director of Riverstone Holdings (private investment firm). Previously, Mr. Wiley served as Chairman, President, and CEO of Baker Hughes, Inc. (oilfield services company, 2000-2004), and as Director of Spinnaker Exploration Company (exploration and production company, 2001-2005). |
Kimberley H. Monasterio (43) |
| Year of Election or Appointment: 2007 President and Treasurer of Advisor International Capital Appreciation. Ms. Monasterio also serves as President and Treasurer of other Fidelity funds (2007-present) and is an employee of FMR (2004-present). Previously, Ms. Monasterio served as Deputy Treasurer of the Fidelity funds (2004-2006). Before joining Fidelity Investments, Ms. Monasterio served as Treasurer (2000-2004) and Chief Financial Officer (2002-2004) of the Franklin Templeton Funds and Senior Vice President of Franklin Templeton Services, LLC (2000-2004). |
Walter C. Donovan (45) |
| Year of Election or Appointment: 2007 Vice President of Advisor International Capital Appreciation. Mr. Donovan also serves as Vice President of Fidelity's Equity Funds (2007-present). Mr. Donovan also serves as Executive Vice President of FMR (2005-present) and FMR Co., Inc. (2005-present). Previously, Mr. Donovan served as Vice President of Fidelity's High Income Funds (2005-2007), Fixed-Income Funds (2005-2006), certain Asset Allocation Funds (2005-2006), certain Balanced Funds (2005-2006), and as Vice President and Director of Fidelity's International Equity Trading group (1998-2005). |
Eric M. Wetlaufer (45) |
| Year of Election or Appointment: 2006 Vice President of Advisor International Capital Appreciation. Mr. Wetlaufer also serves as Vice President of certain International Equity Funds (2006-present). Mr. Wetlaufer is Senior Vice President of FMR (2006-present) and FMR Co., Inc. (2006-present), and President and Director of Fidelity Management & Research (U.K.) Inc. (2006-present) and Fidelity Research & Analysis Company (2006-present). Before joining Fidelity Investments in 2005, Mr. Wetlaufer was a partner in Oxhead Capital Management (2004-2005). Previously, Mr. Wetlaufer served as a Chief Investment Officer of Putnam Investments (1997-2003). |
Eric D. Roiter (58) |
| Year of Election or Appointment: 1998 Secretary of Advisor International Capital Appreciation. He also serves as Secretary of Fidelity funds; Vice President, General Counsel, and Secretary of FMR Co., Inc. (2001-present) and FMR; Assistant Secretary of Fidelity Management & Research (U.K.) Inc. (2001-present), Fidelity Research & Analysis Company (2001-present), and Fidelity Investments Money Management, Inc. (2001-present). Mr. Roiter is an Adjunct Member, Faculty of Law, at Boston College Law School (2003-present). Previously, Mr. Roiter served as Vice President and Secretary of Fidelity Distributors Corporation (FDC) (1998-2005). |
Scott C. Goebel (39) |
| Year of Election or Appointment: 2007 Assistant Secretary of Advisor International Capital Appreciation. Mr. Goebel also serves as Assistant Secretary of other Fidelity funds (2007-present), and is an employee of FMR. |
R. Stephen Ganis (41) |
| Year of Election or Appointment: 2006 Anti-Money Laundering (AML) officer of Advisor International Capital Appreciation. Mr. Ganis also serves as AML officer of Fidelity funds (2006-present) and FMR LLC (2003-present). Before joining Fidelity Investments, Mr. Ganis practiced law at Goodwin Procter, LLP (2000-2002). |
Joseph B. Hollis (59) |
| Year of Election or Appointment: 2006 Chief Financial Officer of Advisor International Capital Appreciation. Mr. Hollis also serves as Chief Financial Officer of other Fidelity funds. Mr. Hollis is President of Fidelity Pricing and Cash Management Services (FPCMS) (2005-present). Mr. Hollis also serves as President and Director of Fidelity Service Company, Inc. (2006-present). Previously, Mr. Hollis served as Senior Vice President of Cash Management Services (1999-2002) and Investment Management Operations (2002-2005). |
Kenneth A. Rathgeber (60) |
| Year of Election or Appointment: 2004 Chief Compliance Officer of Advisor International Capital Appreciation. Mr. Rathgeber also serves as Chief Compliance Officer of other Fidelity funds (2004-present) and Executive Vice President of Risk Oversight for Fidelity Investments (2002-present). He is Chief Compliance Officer of FMR (2005-present), FMR Co., Inc. (2005-present), Fidelity Management & Research (U.K.) Inc. (2005-present), Fidelity Research & Analysis Company (2005-present), Fidelity Investments Money Management, Inc. (2005-present), and Strategic Advisers, Inc. (2005-present). Previously, Mr. Rathgeber served as Executive Vice President and Chief Operating Officer for Fidelity Investments Institutional Services Company, Inc. (1998-2002). |
Bryan A. Mehrmann (46) |
| Year of Election or Appointment: 2005 Deputy Treasurer of Advisor International Capital Appreciation. Mr. Mehrmann also serves as Deputy Treasurer of other Fidelity funds (2005-present) and is an employee of FMR. Previously, Mr. Mehrmann served as Vice President of Fidelity Investments Institutional Services Group (FIIS)/Fidelity Investments Institutional Operations Corporation, Inc. (FIIOC) Client Services (1998-2004). |
Kenneth B. Robins (38) |
| Year of Election or Appointment: 2005 Deputy Treasurer of Advisor International Capital Appreciation. Mr. Robins also serves as Deputy Treasurer of other Fidelity funds (2005-present) and is an employee of FMR (2004-present). Before joining Fidelity Investments, Mr. Robins worked at KPMG LLP, where he was a partner in KPMG's department of professional practice (2002-2004) and a Senior Manager (1999-2000). In addition, Mr. Robins served as Assistant Chief Accountant, United States Securities and Exchange Commission (2000-2002). |
Robert G. Byrnes (40) |
| Year of Election or Appointment: 2005 Assistant Treasurer of Advisor International Capital Appreciation. Mr. Byrnes also serves as Assistant Treasurer of Fidelity funds (2005-present) and is an employee of FMR (2005-present). Previously, Mr. Byrnes served as Vice President of FPCMS (2003-2005). Before joining Fidelity Investments, Mr. Byrnes worked at Deutsche Asset Management where he served as Vice President of the Investment Operations Group (2000-2003). |
Peter L. Lydecker (53) |
| Year of Election or Appointment: 2004 Assistant Treasurer of Advisor International Capital Appreciation. Mr. Lydecker also serves as Assistant Treasurer of other Fidelity funds (2004) and is an employee of FMR. |
Paul M. Murphy (60) |
| Year of Election or Appointment: 2007 Assistant Treasurer of Advisor International Capital Appreciation. Mr. Murphy also serves as Assistant Treasurer of other Fidelity funds (2007-present) and is an employee of FMR (2007-present). Previously, Mr. Murphy served as Chief Financial Officer of the Fidelity Funds (2005-2006), Vice President and Associate General Counsel of FMR (2007), and Senior Vice President of Fidelity Pricing and Cash Management Services Group (FPCMS) (1994-2007). |
Gary W. Ryan (49) |
| Year of Election or Appointment: 2005 Assistant Treasurer of Advisor International Capital Appreciation. Mr. Ryan also serves as Assistant Treasurer of other Fidelity funds (2005-present) and is an employee of FMR (2005-present). Previously, Mr. Ryan served as Vice President of Fund Reporting in FPCMS (1999-2005). |
** FMR Corp. merged with FMR LLC on October 1, 2007. Any references to FMR LLC for prior periods are deemed to be references to the prior entity.
Annual Report
Distributions
The Board of Trustees of Advisor International Capital Appreciation Fund voted to pay to shareholders of record at the opening of business on record date, the following distributions per share derived from capital gains realized from sales of portfolio securities, and dividends derived from net investment income:
| Pay Date | Record Date | Dividends | Capital Gains |
Institutional Class | 12/10/2007 | 12/7/2007 | $.105 | $3.871 |
The fund hereby designates as a capital gain dividend with respect to the taxable year ended October 31, 2007, $25,229,649, or, if subsequently determined to be different, the net capital gain of such year.
Institutional Class designates 43% of the dividend distributed during the fiscal year as amounts which may be taken into account as a dividend for purposes of the maximum rate under section 1(h)(11) of the Internal Revenue Code.
The amounts per share which represent income derived from sources within, and taxes paid to, foreign countries or possessions of the United States are as follows:
| Pay Date | Income | Taxes |
Institutional Class | 12/11/2006 | $.334 | $.0219 |
The fund will notify shareholders in January 2008 of amounts for use in preparing 2007 income tax returns.
Annual Report
Proxy Voting Results
A special meeting of the fund's shareholders was held on July 18, 2007. The results of votes taken among shareholders on the proposal before them are reported below. Each vote reported represents one dollar of net asset value held on the record date for the meeting.
PROPOSAL 3 |
To approve an amended management contract that includes adding a performance adjustment component to the management fee for Fidelity Advisor International Capital Appreciation Fund and giving the Trustees the authority to change the fund's performance adjustment index going forward, without shareholder vote, subject to applicable law. |
| # of
Votes | % of
Votes |
Affirmative | 166,226,982.26 | 73.015 |
Against | 41,915,985.95 | 18.412 |
Abstain | 19,517,457.32 | 8.573 |
TOTAL | 227,660,425.53 | 100.000 |
Annual Report
Board Approval of Investment Advisory Contracts and Management Fees
Advisor International Capital Appreciation Fund
Each year, typically in July, the Board of Trustees, including the Independent Trustees (together, the Board), votes on the renewal of the management contract and sub-advisory agreements (together, the Advisory Contracts) for the fund. The Board, assisted by the advice of fund counsel and Independent Trustees' counsel, requests and considers a broad range of information throughout the year.
The Board meets regularly each month except August and takes into account throughout the year matters bearing on Advisory Contracts. The Board, acting directly and through its separate committees, considers at each of its meetings factors that are relevant to the annual renewal of the fund's Advisory Contracts, including the services and support provided to the fund and its shareholders. At the time of the renewal, the Board had 12 standing committees, each composed of Independent Trustees with varying backgrounds, to which the Board has assigned specific subject matter responsibilities in order to enhance effective decision-making by the Board. Each committee has adopted a written charter outlining the structure and purposes of the committee. One such committee, the Equity Contract Committee, meets periodically as needed throughout the year to consider matters specifically related to the annual renewal of Advisory Contracts. The committee requests and receives information on, and makes recommendations to the Independent Trustees concerning, the approval and annual review of the Advisory Contracts.
At its July 2007 meeting, the Board of Trustees, including the Independent Trustees, unanimously determined to renew the Advisory Contracts for the fund. In reaching its determination, the Board considered all factors it believed relevant, including (i) the nature, extent, and quality of the services to be provided to the fund and its shareholders (including the investment performance of the fund); (ii) the competitiveness of the management fee and total expenses of the fund; (iii) the total costs of the services to be provided by and the profits to be realized by the investment adviser and its affiliates from the relationship with the fund; (iv) the extent to which economies of scale would be realized as the fund grows; and (v) whether fee levels reflect these economies of scale, if any, for the benefit of fund shareholders. The Board also approved amendments to the fund's agreements with foreign sub-advisers to clarify that each sub-adviser provides services as an independent contractor.
In determining whether to renew the Advisory Contracts for the fund, the Board ultimately reached a determination, with the assistance of fund counsel and Independent Trustees' counsel, that the renewal of the Advisory Contracts and the compensation to be received by Fidelity under the management contract is consistent with Fidelity's fiduciary duty under applicable law. In addition to evaluating the specific factors noted above, the Board, in reaching its determination, is aware that shareholders in the fund have a broad range of investment choices available to them, including a wide choice among mutual funds offered by competitors to Fidelity, and that the fund's shareholders, with the opportunity to review and weigh the disclosure provided by the fund in its prospectus and other public disclosures, have chosen to invest in this fund, managed by Fidelity.
Annual Report
Nature, Extent, and Quality of Services Provided. The Board considered staffing within the investment adviser, FMR, and the sub-advisers (together, the Investment Advisers), including the background of the fund's portfolio manager and the fund's investment objective and discipline. The Independent Trustees also had discussions with senior management of Fidelity's investment operations and investment groups. The Board considered the structure of the portfolio manager compensation program and whether this structure provides appropriate incentives.
Resources Dedicated to Investment Management and Support Services. The Board reviewed the size, education, and experience of the Investment Advisers' investment staff, their use of technology, and the Investment Advisers' approach to recruiting, training, and retaining portfolio managers and other research, advisory, and management personnel. The Board considered Fidelity's extensive global research capabilities that enable the Investment Advisers to aggregate data from various sources in an effort to produce positive investment results. The Board noted that Fidelity's analysts have access to a variety of technological tools that enable them to perform both fundamental and quantitative analysis and to specialize in various disciplines. The Board also considered that Fidelity's portfolio managers and analysts have access to daily portfolio attribution that allows for monitoring of a fund's portfolio, as well as an electronic communication system that provides immediate real-time access to research concerning issuers and credit enhancers.
Shareholder and Administrative Services. The Board considered (i) the nature, extent, quality, and cost of advisory, administrative, distribution, and shareholder services performed by the Investment Advisers and their affiliates under the Advisory Contracts and under separate agreements covering transfer agency, pricing and bookkeeping, and securities lending services for the fund; (ii) the nature and extent of the Investment Advisers' supervision of third party service providers, principally custodians and subcustodians; and (iii) the resources devoted to, and the record of compliance with, the fund's compliance policies and procedures. The Board reviewed the allocation of fund brokerage, including allocations to brokers affiliated with the Investment Advisers, the use of brokerage commissions to pay fund expenses, and the use of "soft" commission dollars to pay for research services. The Board also considered that Fidelity voluntarily pays for market data out of its own resources. The Board also considered the agreement reached between the Independent Trustees and Fidelity in December 2006 following an independent review of matters relating to receipt of travel, entertainment, gifts and gratuities in violation of Fidelity policies.
The Board noted that the growth of fund assets across the complex allows Fidelity to reinvest in the development of services designed to enhance the value or convenience of the Fidelity funds as investment vehicles. These services include 24-hour access to account information and market information through phone representatives and over the Internet, and investor education materials and asset allocation tools.
Annual Report
Board Approval of Investment Advisory Contracts and
Management Fees - continued
Investment in a Large Fund Family. The Board considered the benefits to shareholders of investing in a Fidelity fund, including the benefits of investing in a fund that is part of a large family of funds offering a variety of investment disciplines and providing for a large variety of mutual fund investor services. For example, fund shareholders are offered the privilege of exchanging shares of the fund for shares of other Fidelity funds, as set forth in the fund's prospectus, without paying a sales charge. The Board noted that, since the last Advisory Contract renewals in July 2006, Fidelity has taken a number of actions that benefited particular funds, including (i) dedicating additional resources to investment research and to restructure the investment research teams; (ii) contractually agreeing to reduce the management fee on Fidelity Advisor Floating Rate High Income Fund; (iii) contractually agreeing to reduce the management fees on Fidelity's California, Massachusetts, New Jersey, and New York AMT Tax-Free Money Market Funds, launching new Institutional Classes and Service Classes of these funds, and contractually agreeing to impose expense limitations on these funds; (iv) eliminating the exchange fee on the Fidelity Select Portfolios and reducing the pricing and bookkeeping fee rates for these funds; (v) reducing the maximum transfer agency fee rates on high income funds and certain equity funds; (vi) proposing amended management contracts that, if approved by shareholders, will add a performance adjustment component to the management fees paid by 18 Fidelity Advisor equity funds; (vii) contractually agreeing to reduce fees for Ultra-Short Central Fund and the money market Central Funds; (viii) waiving the Fidelity Advisor funds' contingent deferred sales charge on certain redemptions made through systematic withdrawal programs; and (ix) amending the management contracts for equity and fixed-income funds whose management contracts incorporate a "group fee" structure by adding four new fee "breakpoints" to the group fee rate schedules.
Investment Performance and Compliance. The Board considered whether the fund has operated within its investment objective, as well as its record of compliance with its investment restrictions. It also reviewed the fund's absolute investment performance for each class, as well as the fund's relative investment performance for each class measured against (i) a broad-based securities market index, and (ii) a custom peer group of mutual funds deemed appropriate by the Board over multiple periods. The following charts considered by the Board show, over the one-, three-, and five-year periods ended December 31, 2006, the cumulative total returns of Institutional Class (Class I) and Class B of the fund, the cumulative total returns of a broad-based securities market index ("benchmark"), and a range of cumulative total returns of a custom peer group of mutual funds defined by FMR based on categories assigned by Morningstar, Inc. The returns of Institutional Class (Class I) and Class B show the performance of the highest and lowest performing classes, respectively (based on three-year performance). The box within each chart shows the 25th percentile return (bottom of box) and the 75th percentile return (top of box) of the peer group. Returns shown above the box are in the first quartile and returns shown below the box are in the fourth quartile. The percentage beaten numbers noted below each chart correspond to the percentile box and represent the percentage of funds in the peer group whose performance was equal to or lower than that of the class indicated. The fund's custom peer group, defined by FMR, is a peer group that FMR believes provides a more meaningful performance comparison than the peer group assigned by Morningstar, Inc. Morningstar, Inc. assigns mutual funds to categories based on their investment styles as measured by their underlying portfolio holdings.
Annual Report
Advisor International Capital Appreciation Fund

The Board reviewed the fund's relative investment performance against its peer group and stated that the performance of Institutional Class (Class I) of the fund was in the fourth quartile for the one- and three-year periods and the third quartile for the five-year period. The Board also stated that the investment performance of the fund was lower than its benchmark for all the periods shown. The Board considered that the variations in performance among the fund's classes reflect the variations in class expenses, which result in lower performance for higher expense classes. The Board discussed with FMR actions to be taken by FMR to improve the fund's disappointing performance relative to its peer group. The Board will continue to closely monitor the performance of the fund in the coming year and discuss with FMR other appropriate actions to address the performance of the fund.
The Board considered that FMR has taken steps to refocus and strengthen equity research, equity portfolio management, and compliance.
Annual Report
Board Approval of Investment Advisory Contracts and
Management Fees - continued
Based on its review, and giving particular weight to the nature and quality of the resources dedicated by the Investment Advisers to maintain and improve relative performance, the Board concluded that the nature, extent, and quality of the services provided to the fund will benefit the fund's shareholders, particularly in light of the Board's view that the fund's shareholders benefit from investing in a fund that is part of a large family of funds offering a variety of investment disciplines and services.
Competitiveness of Management Fee and Total Fund Expenses. The Board considered the fund's management fee and total expenses compared to "mapped groups" of competitive funds and classes. Fidelity creates "mapped groups" by combining similar Lipper investment objective categories that have comparable management fee characteristics. Combining Lipper investment objective categories aids the Board's management fee and total expense comparisons by broadening the competitive group used for comparison and by reducing the number of universes to which various Fidelity funds are compared. The Board also considered supplemental information about how the fund's management fee and total expenses ranked relative to groups based on Lipper classifications, which take into account a fund's market capitalization and style.
The Board considered two proprietary management fee comparisons for the 12-month periods shown in the chart below. The group of Lipper funds used by the Board for management fee comparisons is referred to below as the "Total Mapped Group." The Total Mapped Group comparison focuses on a fund's standing relative to the total universe of comparable funds available to investors, in terms of gross management fees before expense reimbursements or caps. "TMG %" represents the percentage of funds in the Total Mapped Group that had management fees that were lower than the fund's. For example, a TMG % of 15% means that 85% of the funds in the Total Mapped Group had higher management fees than the fund. The "Asset-Size Peer Group" (ASPG) comparison focuses on a fund's standing relative to non-Fidelity funds similar in size to the fund within the Total Mapped Group. The ASPG represents at least 15% of the funds in the Total Mapped Group with comparable asset size and management fee characteristics, subject to a minimum of 50 funds (or all funds in the Total Mapped Group if fewer than 50). Additional information, such as the ASPG quartile in which the fund's management fee ranked, is also included in the chart and considered by the Board.
Annual Report
Advisor International Capital Appreciation Fund
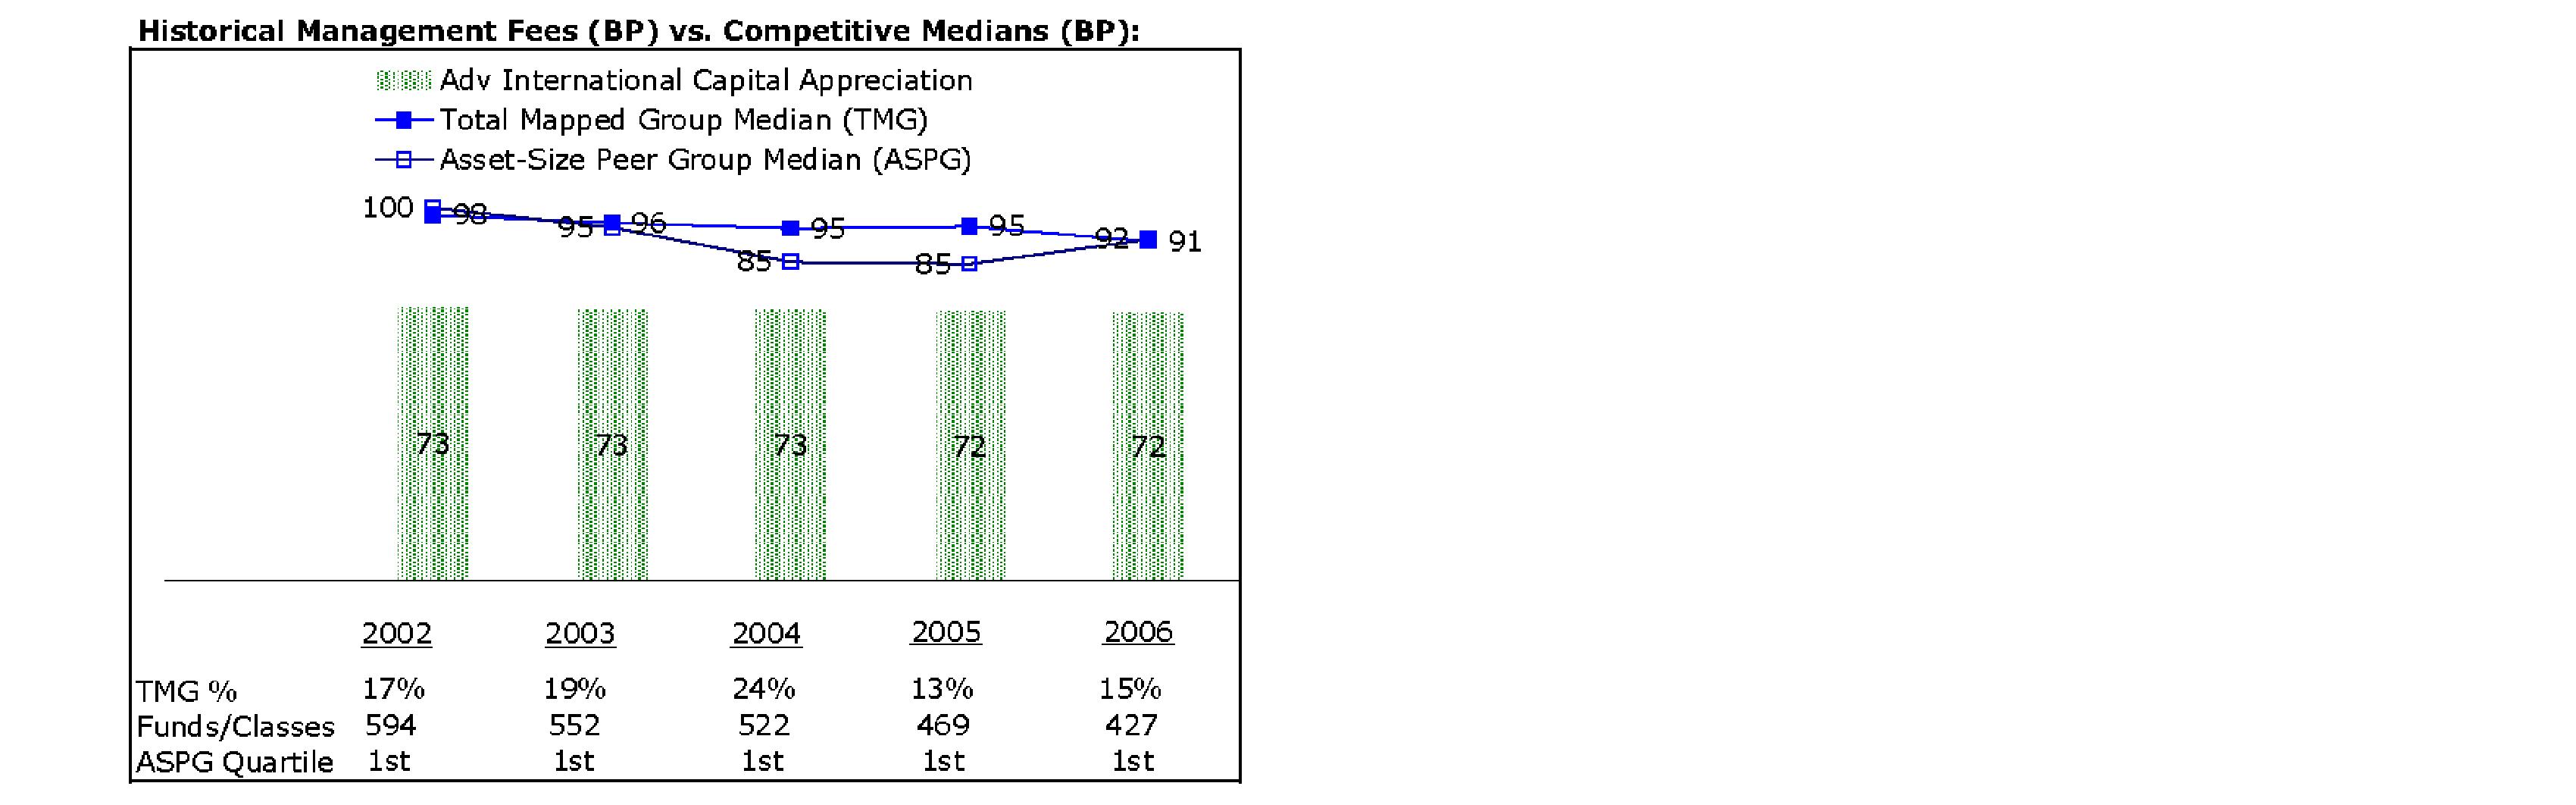
The Board noted that the fund's management fee ranked below the median of its Total Mapped Group and below the median of its ASPG for 2006.
Furthermore, the Board considered that, on July 18, 2007, after the periods shown in the chart above, shareholders approved an amended management contract for the fund that will add a performance adjustment component to the management fee paid by the fund (that is, the fund's management fee will be subject to upward or downward adjustment depending upon whether, and to what extent, the fund's investment performance for the performance period exceeds, or is exceeded by, the record (over the same period) of a Board-approved performance adjustment index). The performance period for the fund commenced on August 1, 2007. Starting with the twelfth month, the performance adjustment takes effect.
Based on its review, the Board concluded that the fund's management fee was fair and reasonable in light of the services that the fund receives and the other factors considered.
In its review of each class's total expenses, the Board considered the fund's management fee as well as other fund or class expenses, as applicable, such as transfer agent fees, pricing and bookkeeping fees, fund-paid 12b-1 fees, and custodial, legal, and audit fees. The Board also noted the effects of any waivers and reimbursements on fees and expenses. As part of its review, the Board also considered current and historical total expenses of each class of the fund compared to competitive fund median expenses. Each class of the fund is compared to those funds and classes in the Total Mapped Group (used by the Board for management fee comparisons) that have a similar sales load structure.
Annual Report
Board Approval of Investment Advisory Contracts and
Management Fees - continued
The Board noted that the total expenses of each of Class A, Class C, and Institutional Class ranked below its competitive median for 2006, the total expenses of Class B ranked equal to its competitive median for 2006, and the total expenses of Class T ranked above its competitive median for 2006. The Board noted that the fund offers multiple classes, each of which has a different sales load and 12b-1 fee structure, and that the multiple structures are intended to offer a range of pricing options for the intermediary market. The Board also noted that the total expenses of the classes vary primarily by the level of their 12b-1 fees, although differences in transfer agent fees may also cause expenses to vary from class to class.
In its review of total expenses, the Board also considered Fidelity fee structures and other information on clients that FMR and its affiliates service in other competitive markets, such as other mutual funds advised or subadvised by FMR or its affiliates, pension plan clients, and other institutional clients.
Based on its review, the Board concluded that the total expenses of each class of the fund were reasonable, although in one case above the median of the universe presented for comparison, in light of the services that the fund and its shareholders receive and the other factors considered.
Costs of the Services and Profitability. The Board considered the revenues earned and the expenses incurred by Fidelity in conducting the business of developing, marketing, distributing, managing, administering and servicing the fund and its shareholders. The Board also considered the level of Fidelity's profits in respect of all the Fidelity funds.
On an annual basis, FMR presents to the Board Fidelity's profitability for the fund. Fidelity calculates the profitability for each fund, as well as aggregate profitability for groups of Fidelity funds and all Fidelity funds, using a series of detailed revenue and cost allocation methodologies which originate with the audited books and records of Fidelity. The Audit Committee of the Board reviews any significant changes from the prior year's methodologies.
PricewaterhouseCoopers LLP (PwC), independent registered public accounting firm and auditor to Fidelity and certain Fidelity funds, has been engaged annually by the Board as part of the Board's assessment of the results of Fidelity's profitability analysis. PwC's engagement includes the review and assessment of Fidelity's methodologies used in determining the revenues and expenses attributable to Fidelity's mutual fund business, and completion of agreed-upon procedures surrounding the mathematical accuracy of fund profitability and its conformity to allocation methodologies. After considering PwC's reports issued under the engagement and information provided by Fidelity, the Board believes that while other allocation methods may also be reasonable, Fidelity's profitability methodologies are reasonable in all material respects.
Annual Report
The Board has also reviewed Fidelity's non-fund businesses and any fall-out benefits related to the mutual fund business as well as cases where Fidelity's affiliates may benefit from or be related to the fund's business.
The Board considered the costs of the services provided by and the profits realized by Fidelity in connection with the operation of the fund and determined that the amount of profit is a fair entrepreneurial profit for the management of the fund.
Economies of Scale. The Board considered whether there have been economies of scale in respect of the management of the Fidelity funds, whether the Fidelity funds (including the fund) have appropriately benefited from any such economies of scale, and whether there is potential for realization of any further economies of scale. The Board considered the extent to which the fund will benefit from economies of scale through increased services to the fund, through waivers or reimbursements, or through fee or expense reductions, including reductions that occur through operation of the transfer agent agreement. The transfer agent fee varies in part based on the number of accounts in the fund. If the number of accounts decreases or the average account size increases, the overall transfer agent fee rate decreases.
The Board recognized that the fund's management contract incorporates a "group fee" structure, which provides for lower group fee rates as total fund assets under FMR's management increase, and for higher group fee rates as total fund assets under FMR's management decrease. FMR determines the group fee rates based on a tiered asset "breakpoint" schedule. In connection with the renewal of the fund's management contract, the Board approved amendments to the fund's management contract that added four new fee breakpoints to the group fee rate schedule for assets under FMR's management above $1,386 billion. The Board considered that the group fee rate declines under both the present and amended schedules, but that under the amended schedule, the group fee rate declines faster as assets under FMR's management exceed $1,386 billion. The Board considered that the group fee is designed to deliver the benefits of economies of scale to fund shareholders when total fund assets increase, even if assets of any particular fund are unchanged or have declined, because some portion of Fidelity's costs are attributable to services provided to all Fidelity funds, and all funds benefit if those costs can be allocated among more assets. The Board concluded that, given the group fee structure, fund shareholders will achieve a certain level of economies of scale as assets under FMR's management increase at the fund complex level, regardless of whether Fidelity achieves any such economies of scale.
The Board further concluded that any potential economies of scale are being shared between fund shareholders and Fidelity in an appropriate manner.
Additional Information Requested by the Board. In order to develop fully the factual basis for consideration of the Fidelity funds' Advisory Contracts, the Board requested and received additional information on several topics, including (i) fund performance trends and actions to be taken by FMR to improve certain funds' overall performance; (ii) Fidelity's portfolio manager compensation structure, including its effects on fund profitability and the extent to which portfolio manager compensation is linked to fund performance; (iii) Fidelity's fee structures; (iv) the funds' sub-advisory arrangements; and (v) accounts managed by Fidelity other than the Fidelity funds.
Annual Report
Board Approval of Investment Advisory Contracts and
Management Fees - continued
Based on its evaluation of all of the conclusions noted above, and after considering all material factors, the Board ultimately concluded that the advisory fee structures are fair and reasonable, and that the fund's Advisory Contracts should be renewed.
Annual Report
Annual Report
Annual Report
Annual Report
Annual Report
Annual Report
Investment Adviser
Fidelity Management & Research Company
Boston, MA
Investment Sub-Advisers
FMR Co., Inc.
Fidelity Management & Research
(U.K.) Inc.
Fidelity Research & Analysis Company
Fidelity International
Investment Advisors
Fidelity Investments Japan Limited
Fidelity International Investment Advisors (U.K.) Limited
General Distributor
Fidelity Distributors Corporation
Boston, MA
Transfer and Service Agents
Fidelity Investments Institutional Operations Company, Inc.
Boston, MA
Fidelity Service Company, Inc.
Boston, MA
Custodian
Brown Brothers Harriman & Co.
Boston, MA
AICAPI-UANN-1207
1.784755.104
(Fidelity Investment logo)(registered trademark)
(Fidelity Investment logo)(registered trademark)
Fidelity® Advisor
Japan
Fund - Class A, Class T, Class B
and Class C
Annual Report
October 31, 2007
(2_fidelity_logos) (Registered_Trademark)
Contents
Chairman's Message | <Click Here> | Ned Johnson's message to shareholders. |
Note to Shareholders | <Click Here> | An explanation of the changes to the fund. |
Performance | <Click Here> | How the fund has done over time. |
Management's Discussion | <Click Here> | The manager's review of fund performance, strategy and outlook. |
Shareholder Expense Example | <Click Here> | An example of shareholder expenses. |
Investment Changes | <Click Here> | A summary of major shifts in the fund's investments over the past six months. |
Investments | <Click Here> | A complete list of the fund's investments with their market values. |
Financial Statements | <Click Here> | Statements of assets and liabilities, operations, and changes in net assets,
as well as financial highlights. |
Notes | <Click Here> | Notes to the financial statements. |
Report of Independent Registered Public Accounting Firm | <Click Here> | |
Trustees and Officers | <Click Here> | |
Distributions | <Click Here> | |
Proxy Voting Results | <Click Here> | |
Board Approval of Investment Advisory Contracts and Management Fees | <Click Here> | |
To view a fund's proxy voting guidelines and proxy voting record for the 12-month period ended June 30, visit http://www.fidelity.com (search for "proxy voting guidelines") or visit the Securities and Exchange Commission's (SEC) web site at http://www.sec.gov. You may also call 1-877-208-0098 to request a free copy of the proxy voting guidelines.
Standard & Poor's, S&P and S&P 500 are registered service marks of The McGraw-Hill Companies, Inc. and have been licensed for use by Fidelity Distributors Corporation.
Other third party marks appearing herein are the property of their respective owners.
All other marks appearing herein are registered or unregistered trademarks or service marks of FMR LLC or an affiliated company.
Annual Report
This report and the financial statements contained herein are submitted for the general information of the shareholders of the fund. This report is not authorized for distribution to prospective investors in the fund unless preceded or accompanied by an effective prospectus.
A fund files its complete schedule of portfolio holdings with the SEC for the first and third quarters of each fiscal year on Form N-Q. Forms N-Q are available on the SEC's web site at http://www.sec.gov. A fund's Forms N-Q may be reviewed and copied at the SEC's Public Reference Room in Washington, DC. Information regarding the operation of the SEC's Public Reference Room may be obtained by calling 1-800-SEC-0330. For a complete list of a fund's portfolio holdings, view the most recent holdings listing, semiannual report, or annual report on Fidelity's web site at http://www.fidelity.com or http://www.advisor.fidelity.com, as applicable.
NOT FDIC INSURED · MAY LOSE VALUE · NO BANK GUARANTEE
Neither the fund nor Fidelity Distributors Corporation is a bank.
Annual Report
Chairman's Message
(photo_of_Edward_C_Johnson_3d)
Dear Shareholder:
Many stock and bond markets around the world have been unsettled of late; however, volatility can often lead to opportunity for patient investors. Financial markets are always unpredictable, but there are a number of time-tested principles that can put the historical odds in your favor.
One of the basic tenets is to invest for the long term. Over time, riding out the markets' inevitable ups and downs has proven much more effective than selling into panic or chasing the hottest trend. Even missing only a few of the markets' best days can significantly diminish investor returns. Patience also affords the benefits of compounding - of earning interest on additional income or reinvested dividends and capital gains. There are tax advantages and cost benefits to consider as well. The more you sell, the more taxes you pay, and the more you trade, the higher the costs. While staying the course doesn't eliminate risk, it can considerably lessen the effect of short-term declines.
You can further manage your investing risk through diversification. And today, more than ever, geographic diversification should be taken into account. Studies indicate that asset allocation is the single most important determinant of a portfolio's long-term success. The right mix of stocks, bonds and cash - aligned to your particular risk tolerance and investment objective - is very important. Age-appropriate rebalancing is also an essential aspect of asset allocation. For younger investors, an emphasis on equities - which historically have been the best-performing asset class over time - is encouraged. As investors near their specific goal, such as retirement or sending a child to college, consideration may be given to replacing volatile assets (e.g. common stocks) with more-stable fixed investments (bonds or savings plans).
A third investment principle - investing regularly - can help lower the average cost of your purchases. Investing a certain amount of money each month or quarter helps ensure you won't pay for all your shares at market highs. This strategy - known as dollar cost averaging - also reduces unconstructive "emotion" from investing, helping shareholders avoid selling weak performers just prior to an upswing, or chasing a hot performer just before a correction.
We invite you to contact us via the Internet, through our Investor Centers or over the phone. It is our privilege to provide you the information you need to make the investments that are right for you.
Sincerely,
/s/Edward C. Johnson 3d
Edward C. Johnson 3d
Annual Report
Note to Shareholders:
On September 19, 2007, shareholders of Fidelity® Advisor Japan Fund approved a new management contract for the fund, effective October 1, 2007, which adds a performance adjustment component to the management fee based on the fund's performance versus the Tokyo Stock Exchange Stock Price Index (TOPIX). The new contract also allows the Board of Trustees to designate an alternate performance adjustment index in the future, without a shareholder vote, when permitted by applicable law.
Annual Report
Performance: The Bottom Line
Average annual total return reflects the change in the value of an investment, assuming reinvestment of the class' dividend income and capital gains (the profits earned upon the sale of securities that have grown in value) and assuming a constant rate of performance each year. The $10,000 table and the fund's returns do not reflect the deduction of taxes that a shareholder would pay on fund distributions or the redemption of fund shares. During periods of reimbursement by Fidelity, a fund's total return will be greater than it would be had the reimbursement not occurred. How a fund did yesterday is no guarantee of how it will do tomorrow. Returns reflect the conversion of Class B shares to Class A shares after a maximum of seven years.
Average Annual Total Returns
Periods ended October 31, 2007 | Past 1
year | Past 5
years | Life of
fund A |
Class A (incl. 5.75% sales charge) | -7.50% | 12.09% | 6.20% |
Class T (incl. 3.50% sales charge) | -5.55% | 12.34% | 6.18% |
Class B (incl. contingent deferred sales charge) B | -7.45% | 12.33% | 6.24% |
Class C (incl. contingent deferred sales charge) C | -3.54% | 12.62% | 6.14% |
A From December 17, 1998.
B Class B shares' contingent deferred sales charges included in the past one year, past five years, and life of fund total return figures are 5%, 2%, and 0%, respectively.
C Class C shares' contingent deferred sales charge included in the past one year, past five years, and life of fund total return figures are 1%, 0%, and 0%, respectively.
Annual Report
$10,000 Over Life of Fund
Let's say hypothetically that $10,000 was invested in Fidelity Advisor Japan Fund - Class T on December 17, 1998, when the fund started, and the current 3.50% sales charge was paid. The chart shows how the value of your investment would have changed, and also shows how the Tokyo Stock Exchange Stock Price Index (TOPIX) performed over the same period.
Annual Report
Management's Discussion of Fund Performance
Comments from Robert Rowland, who became Portfolio Manager of Fidelity® Advisor Japan Fund on September 3, 2007.
Despite opening with a four-month winning streak, the Japanese stock market - as measured by the Tokyo Stock Exchange Stock Price Index (TOPIX) - gained only 3.07% for the 12-month period ending October 31, 2007, a relatively meager result compared with much of the rest of the world. Japanese equities faced a number of head winds during the past year. Although an appreciation of the yen later in the period provided a small boost in returns for U.S. investors, it also increased prices of Japanese exports, raising fears that reduced demand for Japanese products would dampen economic growth. Meanwhile, concerns that Japanese financial institutions would become embroiled in the U.S. subprime mortgage crisis contributed to a nearly 15% decline in the financials sector of the TOPIX, the benchmark's largest component. The political backdrop was a distraction as well, particularly after Prime Minister Abe abruptly resigned from office in September. On the positive side, the business environment in Japan continued to improve in the form of corporate governance reforms, but economic growth remained anemic amid weaker-than-expected corporate spending.
During the past year, the fund's Class A, Class T, Class B and Class C shares returned -1.85%, -2.13%, -2.58% and -2.56%, respectively (excluding sales charges), trailing the TOPIX. Stock selection in consumer discretionary, information technology and consumer staples hurt performance the most versus the index. More broadly, the fund was hampered by its focus on small- and mid-cap stocks, which lagged large-caps. Casio Computer, a maker of digital cameras and other electronic devices, was our biggest detractor. The company's results fell short of its projections due to higher-than-expected research and development expenses. Other detractors included trucking and warehousing services provider Hamakyorex, discount supermarket operator Daikokutenbussan and Telewave, which provides information technology equipment and maintenance services for small companies. Conversely, the fund was aided by a significant underweighting in banks, particularly Mitsubishi UFJ Financial Group, Japan's largest banking group and a major index component. Video-game developer Nintendo was the fund's single largest contributor, its stock boosted by consensus-beating financial results. Shinko Plantech, a small-cap provider of engineering services to the petroleum, chemicals and pharmaceuticals industries, helped as well. Some stocks I mentioned were sold by period end.
The views expressed above reflect those of the portfolio manager(s) only through the end of the period as stated on the cover of this report and do not necessarily represent the views of Fidelity or any other person in the Fidelity organization. Any such views are subject to change at any time based upon market or other conditions and Fidelity disclaims any responsibility to update such views. These views may not be relied on as investment advice and, because investment decisions for a Fidelity fund are based on numerous factors, may not be relied on as an indication of trading intent on behalf of any Fidelity fund.
Annual Report
Shareholder Expense Example
As a shareholder of the Fund, you incur two types of costs: (1) transaction costs, including sales charges (loads) on purchase payments or redemption proceeds, redemption fees, and (2) ongoing costs, including management fees, distribution and/or service (12b-1) fees and other Fund expenses. This Example is intended to help you understand your ongoing costs (in dollars) of investing in the Fund and to compare these costs with the ongoing costs of investing in other mutual funds.
The Example is based on an investment of $1,000 invested at the beginning of the period and held for the entire period (May 1, 2007 to October 31, 2007).
Actual Expenses
The first line of the accompanying table for each class of the Fund provides information about actual account values and actual expenses. You may use the information in this line, together with the amount you invested, to estimate the expenses that you paid over the period. Simply divide your account value by $1,000.00 (for example, an $8,600 account value divided by $1,000.00 = 8.6), then multiply the result by the number in the first line for a class of the Fund under the heading entitled "Expenses Paid During Period" to estimate the expenses you paid on your account during this period. In addition, the Fund, as a shareholder in the underlying Fidelity Central Funds, will indirectly bear its pro rata share of the fees and expenses incurred by the underlying Fidelity Central Funds. These fees and expenses are not included in the Fund's annualized expense ratio used to calculate the expense estimate in the table below.
Hypothetical Example for Comparison Purposes
The second line of the accompanying table for each class of the Fund provides information about hypothetical account values and hypothetical expenses based on a Class' actual expense ratio and an assumed rate of return of 5% per year before expenses, which is not the Class' actual return. The hypothetical account values and expenses may not be used to estimate the actual ending account balance or expenses you paid for the period. You may use this information to compare the ongoing costs of investing in the Fund and other funds. To do so, compare this 5% hypothetical example with the 5% hypothetical examples that appear in the shareholder reports of the other funds. In addition, the Fund, as a shareholder in the underlying Fidelity Central Funds, will indirectly bear its pro rata share of the fees and expenses incurred by the underlying Fidelity Central Funds. These fees and expenses are not included in the Fund's annualized expense ratio used to calculate the expense estimate in the table below.
Please note that the expenses shown in the table are meant to highlight your ongoing costs only and do not reflect any transaction costs. Therefore, the second line of the table is useful in comparing ongoing costs only, and will not help you determine the relative total costs of owning different funds. In addition, if these transactional costs were included, your costs would have been higher.
Annual Report
Shareholder Expense Example - continued
| Beginning
Account Value
May 1, 2007 | Ending
Account Value
October 31, 2007 | Expenses Paid
During Period*
May 1, 2007
to October 31, 2007 |
Class A | | | |
Actual | $ 1,000.00 | $ 985.60 | $ 7.51 |
HypotheticalA | $ 1,000.00 | $ 1,017.64 | $ 7.63 |
Class T | | | |
Actual | $ 1,000.00 | $ 984.10 | $ 8.75 |
HypotheticalA | $ 1,000.00 | $ 1,016.38 | $ 8.89 |
Class B | | | |
Actual | $ 1,000.00 | $ 982.30 | $ 11.24 |
HypotheticalA | $ 1,000.00 | $ 1,013.86 | $ 11.42 |
Class C | | | |
Actual | $ 1,000.00 | $ 982.40 | $ 11.24 |
HypotheticalA | $ 1,000.00 | $ 1,013.86 | $ 11.42 |
Institutional Class | | | |
Actual | $ 1,000.00 | $ 986.50 | $ 6.26 |
HypotheticalA | $ 1,000.00 | $ 1,018.90 | $ 6.36 |
A 5% return per year before expenses
* Expenses are equal to each Class' annualized expense ratio (shown in the table below); multiplied by the average account value over the period, multiplied by 184/365 (to reflect the one-half year period).
| Annualized
Expense Ratio |
Class A | 1.50% |
Class T | 1.75% |
Class B | 2.25% |
Class C | 2.25% |
Institutional Class | 1.25% |
Annual Report
Investment Changes
Top Ten Stocks as of October 31, 2007 |
| % of fund's
net assets | % of fund's net assets
6 months ago |
Toyota Motor Corp. | 7.5 | 3.9 |
Canon, Inc. | 3.9 | 1.9 |
Honda Motor Co. Ltd. | 3.6 | 0.0 |
Mitsui & Co. Ltd. | 3.2 | 1.0 |
Mizuho Financial Group, Inc. | 3.2 | 2.0 |
Sumitomo Corp. | 2.6 | 1.0 |
Nintendo Co. Ltd. | 2.5 | 2.2 |
Sumitomo Mitsui Financial Group, Inc. | 2.3 | 0.0 |
Nippon Electric Glass Co. Ltd. | 2.3 | 1.1 |
Mitsubishi Corp. | 2.2 | 0.0 |
| 33.3 | |
Top Five Market Sectors as of October 31, 2007 |
| % of fund's
net assets | % of fund's net assets
6 months ago |
Industrials | 26.5 | 17.9 |
Consumer Discretionary | 21.6 | 26.0 |
Financials | 19.2 | 19.4 |
Information Technology | 17.6 | 11.7 |
Materials | 8.0 | 13.6 |
Asset Allocation (% of fund's net assets) |
As of October 31, 2007 | As of April 30, 2007 |
| Stocks 98.1% | | | Stocks 99.9% | |
| Short-Term
Investments and
Net Other Assets 1.9% | | | Short-Term
Investments and
Net Other Assets 0.1% | |

Annual Report
Investments October 31, 2007
Showing Percentage of Net Assets
Common Stocks - 98.1% |
| Shares | | Value |
CONSUMER DISCRETIONARY - 21.6% |
Auto Components - 4.7% |
Bridgestone Corp. | 27,600 | | $ 611,080 |
Denso Corp. | 36,000 | | 1,462,820 |
NGK Spark Plug Co. Ltd. | 22,000 | | 370,221 |
NHK Spring Co. Ltd. | 43,000 | | 369,364 |
Stanley Electric Co. Ltd. | 66,700 | | 1,483,671 |
Toyoda Gosei Co. Ltd. | 7,800 | | 280,233 |
| | 4,577,389 |
Automobiles - 12.3% |
Honda Motor Co. Ltd. | 95,100 | | 3,559,593 |
Isuzu Motors Ltd. | 78,000 | | 388,938 |
Toyota Motor Corp. | 127,200 | | 7,278,386 |
Yamaha Motor Co. Ltd. | 25,900 | | 739,749 |
| | 11,966,666 |
Household Durables - 1.9% |
Casio Computer Co. Ltd. | 74,200 | | 699,783 |
Haseko Corp. (a) | 472,000 | | 1,137,130 |
| | 1,836,913 |
Media - 0.6% |
Fuji Television Network, Inc. | 284 | | 573,663 |
Multiline Retail - 0.8% |
Marui Group Co. Ltd. | 38,600 | | 400,501 |
Mitsukoshi Ltd. | 94,000 | | 435,723 |
| | 836,224 |
Specialty Retail - 1.3% |
Yamada Denki Co. Ltd. | 12,150 | | 1,252,965 |
TOTAL CONSUMER DISCRETIONARY | | 21,043,820 |
CONSUMER STAPLES - 0.9% |
Food & Staples Retailing - 0.9% |
Aeon Co. Ltd. | 48,800 | | 768,347 |
Itochushokuhin Co. Ltd. | 2,800 | | 77,789 |
| | 846,136 |
FINANCIALS - 19.2% |
Capital Markets - 3.0% |
Daiwa Securities Group, Inc. | 45,000 | | 433,761 |
Common Stocks - continued |
| Shares | | Value |
FINANCIALS - continued |
Capital Markets - continued |
Matsui Securities Co. Ltd. (d) | 120,000 | | $ 953,658 |
Nomura Holdings, Inc. | 85,900 | | 1,531,597 |
| | 2,919,016 |
Commercial Banks - 8.4% |
Chiba Bank Ltd. | 27,000 | | 216,756 |
Mitsubishi UFJ Financial Group, Inc. | 133,900 | | 1,333,644 |
Mizuho Financial Group, Inc. | 558 | | 3,136,888 |
Sumitomo Mitsui Financial Group, Inc. | 273 | | 2,236,716 |
Sumitomo Trust & Banking Co. Ltd. | 167,000 | | 1,245,422 |
| | 8,169,426 |
Consumer Finance - 1.0% |
Credit Saison Co. Ltd. | 30,800 | | 982,317 |
Insurance - 2.3% |
Millea Holdings, Inc. | 16,400 | | 643,864 |
T&D Holdings, Inc. | 25,950 | | 1,562,170 |
| | 2,206,034 |
Real Estate Management & Development - 4.5% |
Leopalace21 Corp. | 51,900 | | 1,657,158 |
Mitsubishi Estate Co. Ltd. | 49,000 | | 1,469,254 |
Mitsui Fudosan Co. Ltd. | 18,000 | | 498,060 |
Tokyo Tatemono Co. Ltd. | 35,000 | | 450,378 |
Tokyu Land Corp. | 36,000 | | 373,046 |
| | 4,447,896 |
TOTAL FINANCIALS | | 18,724,689 |
HEALTH CARE - 2.2% |
Pharmaceuticals - 2.2% |
Daiichi Sankyo Co. Ltd. | 14,200 | | 403,907 |
Takeda Pharmaceutical Co. Ltd. | 27,600 | | 1,724,393 |
| | 2,128,300 |
INDUSTRIALS - 26.5% |
Building Products - 1.6% |
Asahi Glass Co. Ltd. | 114,000 | | 1,570,319 |
Commercial Services & Supplies - 0.5% |
Dai Nippon Printing Co. Ltd. | 33,000 | | 479,151 |
Common Stocks - continued |
| Shares | | Value |
INDUSTRIALS - continued |
Construction & Engineering - 1.0% |
Asunaro Aoki Construction Co. Ltd. | 6,000 | | $ 35,388 |
JGC Corp. | 49,000 | | 981,479 |
| | 1,016,867 |
Electrical Equipment - 3.9% |
Mitsubishi Electric Corp. | 140,000 | | 1,707,234 |
Sumitomo Electric Industries Ltd. | 127,900 | | 2,071,186 |
| | 3,778,420 |
Machinery - 9.8% |
Fanuc Ltd. | 6,100 | | 668,824 |
Kubota Corp. | 196,000 | | 1,645,850 |
Mitsubishi Heavy Industries Ltd. | 162,000 | | 943,661 |
NGK Insulators Ltd. | 25,000 | | 886,469 |
Nittoku Engineering Co. Ltd. | 52,100 | | 336,014 |
NSK Ltd. | 153,000 | | 1,356,827 |
OSG Corp. | 29,900 | | 378,336 |
SMC Corp. | 5,900 | | 790,491 |
Sumitomo Heavy Industries Ltd. | 64,000 | | 845,677 |
THK Co. Ltd. | 38,900 | | 857,994 |
Toshiba Machine Co. Ltd. | 108,000 | | 825,086 |
| | 9,535,229 |
Road & Rail - 0.8% |
East Japan Railway Co. | 96 | | 790,959 |
Trading Companies & Distributors - 8.0% |
Mitsubishi Corp. | 67,700 | | 2,108,322 |
Mitsui & Co. Ltd. | 122,000 | | 3,165,130 |
Sumitomo Corp. | 147,100 | | 2,563,613 |
| | 7,837,065 |
Transportation Infrastructure - 0.9% |
Mitsui-Soko Co. Ltd. | 44,000 | | 212,039 |
The Sumitomo Warehouse Co. Ltd. | 109,000 | | 628,194 |
| | 840,233 |
TOTAL INDUSTRIALS | | 25,848,243 |
INFORMATION TECHNOLOGY - 17.6% |
Electronic Equipment & Instruments - 7.8% |
Citizen Holdings Co. Ltd. | 17,800 | | 191,794 |
Dainippon Screen Manufacturing Co. Ltd. | 201,000 | | 1,195,278 |
Kyocera Corp. | 5,000 | | 427,400 |
Common Stocks - continued |
| Shares | | Value |
INFORMATION TECHNOLOGY - continued |
Electronic Equipment & Instruments - continued |
Murata Manufacturing Co. Ltd. | 9,500 | | $ 578,267 |
Nidec Sankyo Corp. | 67,000 | | 524,128 |
Nippon Electric Glass Co. Ltd. | 130,500 | | 2,218,539 |
Omron Corp. | 16,400 | | 403,442 |
Seikoh Giken Co. Ltd. | 3,000 | | 47,085 |
Shizuki Electric Co., Inc. | 54,000 | | 202,102 |
Yaskawa Electric Corp. | 104,000 | | 1,399,382 |
Yokogawa Electric Corp. | 32,900 | | 414,614 |
| | 7,602,031 |
IT Services - 0.1% |
Nomura Research Institute Ltd. | 3,600 | | 127,278 |
Office Electronics - 5.9% |
Canon, Inc. | 76,100 | | 3,848,377 |
Konica Minolta Holdings, Inc. | 110,000 | | 1,926,031 |
| | 5,774,408 |
Semiconductors & Semiconductor Equipment - 0.8% |
Advantest Corp. | 10,900 | | 316,300 |
Rohm Co. Ltd. | 5,800 | | 508,251 |
| | 824,551 |
Software - 3.0% |
Atlus Co. Ltd. | 95,300 | | 492,730 |
Nintendo Co. Ltd. | 3,800 | | 2,386,400 |
| | 2,879,130 |
TOTAL INFORMATION TECHNOLOGY | | 17,207,398 |
MATERIALS - 8.0% |
Chemicals - 3.1% |
JSR Corp. | 39,900 | | 1,036,261 |
Nitto Denko Corp. | 22,300 | | 1,088,914 |
Shin-Etsu Chemical Co. Ltd. | 5,700 | | 365,712 |
Sumitomo Bakelite Co. Ltd. | 86,000 | | 527,472 |
| | 3,018,359 |
Metals & Mining - 4.9% |
Hitachi Metals Ltd. | 90,000 | | 1,167,777 |
JFE Holdings, Inc. | 17,100 | | 1,001,224 |
Common Stocks - continued |
| Shares | | Value |
MATERIALS - continued |
Metals & Mining - continued |
Nippon Steel Corp. | 140,000 | | $ 930,715 |
Sumitomo Metal Industries Ltd. | 338,000 | | 1,673,331 |
| | 4,773,047 |
TOTAL MATERIALS | | 7,791,406 |
TELECOMMUNICATION SERVICES - 2.1% |
Wireless Telecommunication Services - 2.1% |
KDDI Corp. | 100 | | 755,431 |
NTT DoCoMo, Inc. | 889 | | 1,297,940 |
| | 2,053,371 |
TOTAL COMMON STOCKS (Cost $90,132,514) | 95,643,363 |
Money Market Funds - 2.5% |
| | | |
Fidelity Cash Central Fund, 4.97% (b) | 1,494,043 | | 1,494,043 |
Fidelity Securities Lending Cash Central Fund, 5.02% (b)(c) | 984,000 | | 984,000 |
TOTAL MONEY MARKET FUNDS (Cost $2,478,043) | 2,478,043 |
TOTAL INVESTMENT PORTFOLIO - 100.6% (Cost $92,610,557) | 98,121,406 |
NET OTHER ASSETS - (0.6)% | (602,941) |
NET ASSETS - 100% | $ 97,518,465 |
Legend |
(a) Non-income producing |
(b) Affiliated fund that is available only to investment companies and other accounts managed by Fidelity Investments. The rate quoted is the annualized seven-day yield of the fund at period end. A complete unaudited listing of the fund's holdings as of its most recent quarter end is available upon request. |
(c) Investment made with cash collateral received from securities on loan. |
(d) Security or a portion of the security is on loan at period end. |
Affiliated Central Funds |
Information regarding fiscal year to date income earned by the Fund from investments in Fidelity Central Funds is as follows: |
Fund | Income earned |
Fidelity Cash Central Fund | $ 25,804 |
Fidelity Securities Lending Cash Central Fund | 75,534 |
Total | $ 101,338 |
Income Tax Information |
At October 31, 2007, the fund had a capital loss carryforward of approximately $12,845,430 of which $6,193,464 and $6,651,966 will expire on October 31, 2010 and 2015, respectively. |
See accompanying notes which are an integral part of the financial statements.
Annual Report
Financial Statements
Statement of Assets and Liabilities
| October 31, 2007 |
| | |
Assets | | |
Investment in securities, at value (including securities loaned of $940,800) - See accompanying schedule: Unaffiliated issuers (cost $90,132,514) | $ 95,643,363 | |
Fidelity Central Funds (cost $2,478,043) | 2,478,043 | |
Total Investments (cost $92,610,557) | | $ 98,121,406 |
Receivable for investments sold | | 1,679,897 |
Receivable for fund shares sold | | 457,425 |
Dividends receivable | | 467,382 |
Distributions receivable from Fidelity Central Funds | | 5,408 |
Prepaid expenses | | 72 |
Receivable from investment adviser for expense reductions | | 83,092 |
Other receivables | | 6,747 |
Total assets | | 100,821,429 |
| | |
Liabilities | | |
Payable for investments purchased | $ 1,405,766 | |
Payable for fund shares redeemed | 506,837 | |
Accrued management fee | 57,943 | |
Distribution fees payable | 48,315 | |
Other affiliated payables | 26,286 | |
Other payables and accrued expenses | 273,817 | |
Collateral on securities loaned, at value | 984,000 | |
Total liabilities | | 3,302,964 |
| | |
Net Assets | | $ 97,518,465 |
Net Assets consist of: | | |
Paid in capital | | $ 105,281,477 |
Accumulated undistributed net realized gain (loss) on investments and foreign currency transactions | | (13,271,558) |
Net unrealized appreciation (depreciation) on investments and assets and liabilities in foreign currencies | | 5,508,546 |
Net Assets | | $ 97,518,465 |
See accompanying notes which are an integral part of the financial statements.
Annual Report
Statement of Assets and Liabilities - continued
| October 31, 2007 |
| | |
Calculation of Maximum Offering Price Class A:
Net Asset Value and redemption price per share
($32,945,326 ÷ 2,007,846 shares) | | $ 16.41 |
| | |
Maximum offering price per share (100/94.25 of $16.41) | | $ 17.41 |
Class T:
Net Asset Value and redemption price per share ($14,303,251 ÷ 887,724 shares) | | $ 16.11 |
| | |
Maximum offering price per share (100/96.50 of $16.11) | | $ 16.69 |
Class B:
Net Asset Value and offering price per share ($7,873,572 ÷ 508,006 shares)A | | $ 15.50 |
| | |
Class C:
Net Asset Value and offering price per share ($33,956,666 ÷ 2,176,952 shares)A | | $ 15.60 |
| | |
| | |
Institutional Class:
Net Asset Value, offering price and redemption price per share ($8,439,650 ÷ 501,632 shares) | | $ 16.82 |
A Redemption price per share is equal to net asset value less any applicable contingent deferred sales charge.
See accompanying notes which are an integral part of the financial statements.
Annual Report
Financial Statements - continued
Statement of Operations
| Year ended October 31, 2007 |
| | |
Investment Income | | |
Dividends | | $ 1,538,911 |
Interest | | 31 |
Income from Fidelity Central Funds | | 101,338 |
| | 1,640,280 |
Less foreign taxes withheld | | (109,603) |
Total income | | 1,530,677 |
| | |
Expenses | | |
Management fee | $ 861,457 | |
Transfer agent fees | 329,828 | |
Distribution fees | 733,568 | |
Accounting and security lending fees | 77,564 | |
Custodian fees and expenses | 94,801 | |
Independent trustees' compensation | 430 | |
Registration fees | 62,162 | |
Audit | 50,473 | |
Legal | 801 | |
Proxy fee | 224,904 | |
Miscellaneous | 1,163 | |
Total expenses before reductions | 2,437,151 | |
Expense reductions | (214,489) | 2,222,662 |
Net investment income (loss) | | (691,985) |
Realized and Unrealized Gain (Loss) Net realized gain (loss) on: | | |
Investment securities: | | |
Unaffiliated issuers | (5,161,947) | |
Foreign currency transactions | 1,051 | |
Total net realized gain (loss) | | (5,160,896) |
Change in net unrealized appreciation (depreciation) on: Investment securities | 3,044,244 | |
Assets and liabilities in foreign currencies | 4,697 | |
Total change in net unrealized appreciation (depreciation) | | 3,048,941 |
Net gain (loss) | | (2,111,955) |
Net increase (decrease) in net assets resulting from operations | | $ (2,803,940) |
See accompanying notes which are an integral part of the financial statements.
Annual Report
Statement of Changes in Net Assets
| Year ended
October 31,
2007 | Year ended
October 31,
2006 |
Increase (Decrease) in Net Assets | | |
Operations | | |
Net investment income (loss) | $ (691,985) | $ (1,237,948) |
Net realized gain (loss) | (5,160,896) | 14,734,526 |
Change in net unrealized appreciation (depreciation) | 3,048,941 | (11,088,654) |
Net increase (decrease) in net assets resulting
from operations | (2,803,940) | 2,407,924 |
Share transactions - net increase (decrease) | (46,358,208) | 40,871,973 |
Redemption fees | 26,649 | 135,732 |
Total increase (decrease) in net assets | (49,135,499) | 43,415,629 |
| | |
Net Assets | | |
Beginning of period | 146,653,964 | 103,238,335 |
End of period | $ 97,518,465 | $ 146,653,964 |
See accompanying notes which are an integral part of the financial statements.
Annual Report
Financial Highlights - Class A
| | | | | |
Years ended October 31, | 2007 | 2006 | 2005 | 2004 | 2003 |
Selected Per-Share Data | | | | | |
Net asset value, beginning of period | $ 16.72 | $ 15.61 | $ 12.64 | $ 11.78 | $ 8.74 |
Income from Investment Operations | | | | | |
Net investment income (loss) C | (.04) | (.07) | (.08) | (.11) | (.07) |
Net realized and unrealized gain (loss) | (.27) | 1.17 | 3.04 | .95 | 3.11 |
Total from investment operations | (.31) | 1.10 | 2.96 | .84 | 3.04 |
Redemption fees added to paid in capital C | - G | .01 | .01 | .02 | - |
Net asset value, end of period | $ 16.41 | $ 16.72 | $ 15.61 | $ 12.64 | $ 11.78 |
Total Return A, B | (1.85)% | 7.11% | 23.50% | 7.30% | 34.78% |
Ratios to Average Net Assets D, F | | | | | |
Expenses before reductions | 1.70% | 1.52% | 1.62% | 1.80% | 2.20% |
Expenses net of fee waivers, if any | 1.50% | 1.50% | 1.56% | 1.75% | 1.75% |
Expenses net of all reductions | 1.48% | 1.48% | 1.55% | 1.75% | 1.75% |
Net investment income (loss) | (.22)% | (.42)% | (.54)% | (.89)% | (.76)% |
Supplemental Data | | | | | |
Net assets, end of period (000 omitted) | $ 32,945 | $ 41,876 | $ 26,169 | $ 17,884 | $ 8,695 |
Portfolio turnover rate E | 138% | 83% | 89% | 83% | 99% |
A Total returns would have been lower had certain expenses not been reduced during the periods shown.
B Total returns do not include the effect of the sales charges.
C Calculated based on average shares outstanding during the period.
D Fees and expenses of the underlying Fidelity Central Funds are not included in the Fund's expense ratio. The Fund indirectly bears its proportionate share of the expenses of any underlying Fidelity Central Funds.
E Amount does not include the portfolio activity of any underlying Fidelity Central Funds.
F Expense ratios reflect operating expenses of the class. Expenses before reductions do not reflect amounts reimbursed by the investment adviser or reductions from brokerage service arrangements or other expense offset arrangements and do not represent the amount paid by the class during periods when reimbursements or reductions occur. Expenses net of fee waivers reflect expenses after reimbursement by the investment adviser but prior to reductions from brokerage service arrangements or other expense offset arrangements. Expenses net of all reductions represent the net expenses paid by the class.
G Amount represents less than $.01 per share.
See accompanying notes which are an integral part of the financial statements.
Annual Report
Financial Highlights - Class T
|
| | | | |
Years ended October 31, | 2007 | 2006 | 2005 | 2004 | 2003 |
Selected Per-Share Data | | | | | |
Net asset value, beginning of period | $ 16.46 | $ 15.41 | $ 12.51 | $ 11.68 | $ 8.69 |
Income from Investment Operations | | | | | |
Net investment income (loss) C | (.08) | (.12) | (.11) | (.14) | (.09) |
Net realized and unrealized gain (loss) | (.27) | 1.16 | 3.00 | .95 | 3.08 |
Total from investment operations | (.35) | 1.04 | 2.89 | .81 | 2.99 |
Redemption fees added to paid in capital C | - G | .01 | .01 | .02 | - |
Net asset value, end of period | $ 16.11 | $ 16.46 | $ 15.41 | $ 12.51 | $ 11.68 |
Total Return A, B | (2.13)% | 6.81% | 23.18% | 7.11% | 34.41% |
Ratios to Average Net Assets D, F | | | | | |
Expenses before reductions | 1.96% | 1.82% | 1.97% | 2.19% | 2.57% |
Expenses net of fee waivers, if any | 1.75% | 1.75% | 1.81% | 2.00% | 2.00% |
Expenses net of all reductions | 1.73% | 1.73% | 1.80% | 2.00% | 2.00% |
Net investment income (loss) | (.47)% | (.67)% | (.79)% | (1.14)% | (1.01)% |
Supplemental Data | | | | | |
Net assets, end of period (000 omitted) | $ 14,303 | $ 21,039 | $ 15,610 | $ 11,493 | $ 11,823 |
Portfolio turnover rate E | 138% | 83% | 89% | 83% | 99% |
A Total returns would have been lower had certain expenses not been reduced during the periods shown.
B Total returns do not include the effect of the sales charges.
C Calculated based on average shares outstanding during the period.
D Fees and expenses of the underlying Fidelity Central Funds are not included in the Fund's expense ratio. The Fund indirectly bears its proportionate share of the expenses of any underlying Fidelity Central Funds.
E Amount does not include the portfolio activity of any underlying Fidelity Central Funds.
F Expense ratios reflect operating expenses of the class. Expenses before reductions do not reflect amounts reimbursed by the investment adviser or reductions from brokerage service arrangements or other expense offset arrangements and do not represent the amount paid by the class during periods when reimbursements or reductions occur. Expenses net of fee waivers reflect expenses after reimbursement by the investment adviser but prior to reductions from brokerage service arrangements or other expense offset arrangements. Expenses net of all reductions represent the net expenses paid by the class.
G Amount represents less than $.01 per share.
See accompanying notes which are an integral part of the financial statements.
Annual Report
Financial Highlights - Class B
|
| | | | |
Years ended October 31, | 2007 | 2006 | 2005 | 2004 | 2003 |
Selected Per-Share Data | | | | | |
Net asset value, beginning of period | $ 15.91 | $ 14.96 | $ 12.21 | $ 11.46 | $ 8.57 |
Income from Investment Operations | | | | | |
Net investment income (loss) C | (.15) | (.20) | (.17) | (.20) | (.14) |
Net realized and unrealized gain (loss) | (.26) | 1.14 | 2.91 | .93 | 3.03 |
Total from investment operations | (.41) | .94 | 2.74 | .73 | 2.89 |
Redemption fees added to paid in capital C | - G | .01 | .01 | .02 | - |
Net asset value, end of period | $ 15.50 | $ 15.91 | $ 14.96 | $ 12.21 | $ 11.46 |
Total Return A, B | (2.58)% | 6.35% | 22.52% | 6.54% | 33.72% |
Ratios to Average Net Assets D, F | | | | | |
Expenses before reductions | 2.45% | 2.33% | 2.43% | 2.62% | 3.03% |
Expenses net of fee waivers, if any | 2.25% | 2.25% | 2.31% | 2.50% | 2.50% |
Expenses net of all reductions | 2.23% | 2.23% | 2.30% | 2.50% | 2.50% |
Net investment income (loss) | (.97)% | (1.17)% | (1.30)% | (1.64)% | (1.51)% |
Supplemental Data | | | | | |
Net assets, end of period (000 omitted) | $ 7,874 | $ 16,120 | $ 18,916 | $ 18,218 | $ 14,761 |
Portfolio turnover rate E | 138% | 83% | 89% | 83% | 99% |
A Total returns would have been lower had certain expenses not been reduced during the periods shown.
B Total returns do not include the effect of the contingent deferred sales charge.
C Calculated based on average shares outstanding during the period.
D Fees and expenses of the underlying Fidelity Central Funds are not included in the Fund's expense ratio. The Fund indirectly bears its proportionate share of the expenses of any underlying Fidelity Central Funds.
E Amount does not include the portfolio activity of any underlying Fidelity Central Funds.
F Expense ratios reflect operating expenses of the class. Expenses before reductions do not reflect amounts reimbursed by the investment adviser or reductions from brokerage service arrangements or other expense offset arrangements and do not represent the amount paid by the class during periods when reimbursements or reductions occur. Expenses net of fee waivers reflect expenses after reimbursement by the investment adviser but prior to reductions from brokerage service arrangements or other expense offset arrangements. Expenses net of all reductions represent the net expenses paid by the class.
G Amount represents less than $.01 per share.
See accompanying notes which are an integral part of the financial statements.
Annual Report
Financial Highlights - Class C
| | | | | |
Years ended October 31, | 2007 | 2006 | 2005 | 2004 | 2003 |
Selected Per-Share Data | | | | | |
Net asset value, beginning of period | $ 16.01 | $ 15.05 | $ 12.28 | $ 11.52 | $ 8.61 |
Income from Investment Operations | | | | | |
Net investment income (loss) C | (.15) | (.18) | (.17) | (.19) | (.14) |
Net realized and unrealized gain (loss) | (.26) | 1.13 | 2.93 | .93 | 3.05 |
Total from investment operations | (.41) | .95 | 2.76 | .74 | 2.91 |
Redemption fees added to paid in capital C | - G | .01 | .01 | .02 | - |
Net asset value, end of period | $ 15.60 | $ 16.01 | $ 15.05 | $ 12.28 | $ 11.52 |
Total Return A, B | (2.56)% | 6.38% | 22.56% | 6.60% | 33.80% |
Ratios to Average Net Assets D, F | | | | | |
Expenses before reductions | 2.37% | 2.18% | 2.27% | 2.44% | 2.82% |
Expenses net of fee waivers, if any | 2.25% | 2.18% | 2.27% | 2.44% | 2.50% |
Expenses net of all reductions | 2.23% | 2.16% | 2.26% | 2.44% | 2.49% |
Net investment income (loss) | (.97)% | (1.10)% | (1.25)% | (1.58)% | (1.51)% |
Supplemental Data | | | | | |
Net assets, end of period (000 omitted) | $ 33,957 | $ 53,846 | $ 34,144 | $ 21,564 | $ 10,374 |
Portfolio turnover rate E | 138% | 83% | 89% | 83% | 99% |
A Total returns would have been lower had certain expenses not been reduced during the periods shown.
B Total returns do not include the effect of the contingent deferred sales charge.
C Calculated based on average shares outstanding during the period.
D Fees and expenses of the underlying Fidelity Central Funds are not included in the Fund's expense ratio. The Fund indirectly bears its proportionate share of the expenses of any underlying Fidelity Central Funds.
E Amount does not include the portfolio activity of any underlying Fidelity Central Funds.
F Expense ratios reflect operating expenses of the class. Expenses before reductions do not reflect amounts reimbursed by the investment adviser or reductions from brokerage service arrangements or other expense offset arrangements and do not represent the amount paid by the class during periods when reimbursements or reductions occur. Expenses net of fee waivers reflect expenses after reimbursement by the investment adviser but prior to reductions from brokerage service arrangements or other expense offset arrangements. Expenses net of all reductions represent the net expenses paid by the class.
G Amount represents less than $.01 per share.
See accompanying notes which are an integral part of the financial statements.
Annual Report
Financial Highlights - Institutional Class
| | | | | |
Years ended October 31, | 2007 | 2006 | 2005 | 2004 | 2003 |
Selected Per-Share Data | | | | | |
Net asset value, beginning of period | $ 17.10 | $ 15.90 | $ 12.83 | $ 11.91 | $ 8.82 |
Income from Investment Operations | | | | | |
Net investment income (loss) B | .01 | (.01) | (.02) | (.06) | (.05) |
Net realized and unrealized gain (loss) | (.29) | 1.19 | 3.08 | .96 | 3.14 |
Total from investment operations | (.28) | 1.18 | 3.06 | .90 | 3.09 |
Redemption fees added to paid in capital B | - F | .02 | .01 | .02 | - |
Net asset value, end of period | $ 16.82 | $ 17.10 | $ 15.90 | $ 12.83 | $ 11.91 |
Total Return A | (1.64)% | 7.55% | 23.93% | 7.72% | 35.03% |
Ratios to Average Net Assets C, E | | | | | |
Expenses before reductions | 1.31% | 1.12% | 1.19% | 1.36% | 1.67% |
Expenses net of fee waivers, if any | 1.25% | 1.12% | 1.19% | 1.36% | 1.50% |
Expenses net of all reductions | 1.23% | 1.10% | 1.17% | 1.36% | 1.49% |
Net investment income (loss) | .03% | (.04)% | (.17)% | (.50)% | (.51)% |
Supplemental Data | | | | | |
Net assets, end of period (000 omitted) | $ 8,440 | $ 13,773 | $ 8,399 | $ 3,919 | $ 3,905 |
Portfolio turnover rate D | 138% | 83% | 89% | 83% | 99% |
A Total returns would have been lower had certain expenses not been reduced during the periods shown.
B Calculated based on average shares outstanding during the period.
C Fees and expenses of the underlying Fidelity Central Funds are not included in the Fund's expense ratio. The Fund indirectly bears its proportionate share of the expenses of any underlying Fidelity Central Funds.
D Amount does not include the portfolio activity of any underlying Fidelity Central Funds.
E Expense ratios reflect operating expenses of the class. Expenses before reductions do not reflect amounts reimbursed by the investment adviser or reductions from brokerage service arrangements or other expense offset arrangements and do not represent the amount paid by the class during periods when reimbursements or reductions occur. Expenses net of fee waivers reflect expenses after reimbursement by the investment adviser but prior to reductions from brokerage service arrangements or other expense offset arrangements. Expenses net of all reductions represent the net expenses paid by the class.
F Amount represents less than $.01 per share.
See accompanying notes which are an integral part of the financial statements.
Annual Report
Notes to Financial Statements
For the period ended October 31, 2007
1. Organization.
Fidelity Advisor Japan Fund (the Fund) is a fund of Fidelity Advisor Series VIII (the trust) and is authorized to issue an unlimited number of shares. The trust is registered under the Investment Company Act of 1940, as amended (the 1940 Act), as an open-end management investment company organized as a Massachusetts business trust. The Fund offers Class A, Class T, Class B, Class C, and Institutional Class shares, each of which has equal rights as to assets and voting privileges. Each class has exclusive voting rights with respect to matters that affect that class. Class B shares will automatically convert to Class A shares after a holding period of seven years from the initial date of purchase. Investment income, realized and unrealized capital gains and losses, the common expenses of the Fund, and certain fund-level expense reductions, if any, are allocated on a pro rata basis to each class based on the relative net assets of each class to the total net assets of the Fund. Each class differs with respect to transfer agent and distribution and service plan fees incurred. Certain expense reductions also differ by class.
2. Investments in Fidelity Central Funds.
The Fund may invest in Fidelity Central Funds, which are open-end investment companies available only to other investment companies and accounts managed by Fidelity Management & Research Company (FMR) and its affiliates. The Fund's Schedule of Investments lists each of the Fidelity Central Funds as an investment of the Fund, but does not include the underlying holdings of each Fidelity Central Fund. As an Investing Fund, the Fund indirectly bears its proportionate share of the expenses of the underlying Fidelity Central Funds.
The Money Market Central Funds seek preservation of capital and current income and are managed by Fidelity Investments Money Management, Inc. (FIMM), an affiliate of FMR.
A complete list of holdings for each Fidelity Central Fund is available upon request or at the SEC's web site at www.sec.gov. In addition, the financial statements of the Fidelity Central Funds, which are not covered by the Fund's Report of Independent Registered Public Accounting Firm, are available on the SEC's web site or upon request.
3. Significant Accounting Policies.
The financial statements have been prepared in conformity with accounting principles generally accepted in the United States of America, which require management to make certain estimates and assumptions at the date of the financial statements. The following summarizes the significant accounting policies of the Fund:
Annual Report
Notes to Financial Statements - continued
3. Significant Accounting Policies - continued
Security Valuation. Investments are valued and net asset value (NAV) per share is calculated (NAV calculation) as of the close of business of the New York Stock Exchange (NYSE), normally 4:00 p.m. Eastern time. Wherever possible, the Fund uses independent pricing services approved by the Board of Trustees to value its investments.
Equity securities, including restricted securities, for which market quotations are readily available, are valued at the last reported sale price or official closing price as reported by an independent pricing service on the primary market or exchange on which they are traded. In the event there were no sales during the day or closing prices are not available, securities are valued at the last quoted bid price.
Investments in open-end mutual funds, including the Fidelity Central Funds, are valued at their closing net asset value each business day. Short-term securities with remaining maturities of sixty days or less for which quotations are not readily available are valued at amortized cost, which approximates value.
When current market prices or quotations are not readily available or do not accurately reflect fair value, valuations may be determined in accordance with procedures adopted by the Board of Trustees. For example, when developments occur between the close of a market and the close of the NYSE that may materially affect the value of some or all of the securities, or when trading in a security is halted, those securities may be fair valued. Factors used in the determination of fair value may include monitoring news to identify significant market or security specific events such as changes in the value of U.S. securities markets, reviewing developments in foreign markets and evaluating the performance of ADRs, futures contracts and exchange-traded funds. Because the Fund's utilization of fair value pricing depends on market activity, the frequency with which fair value pricing is used cannot be predicted and may be utilized to a significant extent. The value of securities used for NAV calculation under fair value pricing may differ from published prices for the same securities.
Foreign Currency. The Fund uses foreign currency contracts to facilitate transactions in foreign-denominated securities. Losses from these transactions may arise from changes in the value of the foreign currency or if the counterparties do not perform under the contracts' terms.
Foreign-denominated assets, including investment securities, and liabilities are translated into U.S. dollars at the exchange rate at period end. Purchases and sales of investment securities, income and dividends received and expenses denominated in foreign currencies are translated into U.S. dollars at the exchange rate in effect on the transaction date.
Annual Report
3. Significant Accounting Policies - continued
Foreign Currency - continued
The effects of exchange rate fluctuations on investments are included with the net realized and unrealized gain (loss) on investment securities. Other foreign currency transactions resulting in realized and unrealized gain (loss) are disclosed separately.
Investment Transactions and Income. For financial reporting purposes, the Fund's investment holdings and NAV include trades executed through the end of the last business day of the period. The NAV for processing shareholder transactions includes trades executed through the end of the prior business day. Gains and losses on securities sold are determined on the basis of identified cost. Dividend income is recorded on the ex-dividend date, except for certain dividends from foreign securities where the ex-dividend date may have passed, which are recorded as soon as the Fund is informed of the ex-dividend date. Non-cash dividends included in dividend income, if any, are recorded at the fair market value of the securities received. Interest income and distributions from the Fidelity Central Funds are accrued as earned. Interest income includes coupon interest and amortization of premium and accretion of discount on debt securities. Investment income is recorded net of foreign taxes withheld where recovery of such taxes is uncertain.
Expenses. Most expenses of the trust can be directly attributed to a fund. Expenses which cannot be directly attributed are apportioned among each Fund in the trust. Expense estimates are accrued in the period to which they relate and adjustments are made when actual amounts are known.
Income Tax Information and Distributions to Shareholders. Each year, the Fund intends to qualify as a regulated investment company by distributing all of its taxable income and realized gains under Subchapter M of the Internal Revenue Code. As a result, no provision for income taxes is required in the accompanying financial statements. Foreign taxes are provided for based on the Fund's understanding of the tax rules and rates that exist in the foreign markets in which it invests.
Distributions are recorded on the ex-dividend date. Income dividends and capital gain distributions are declared separately for each class. Income and capital gain distributions are determined in accordance with income tax regulations, which may differ from generally accepted accounting principles.
Capital accounts within the financial statements are adjusted for permanent book-tax differences. These adjustments have no impact on net assets or the results of operations. Temporary book-tax differences will reverse in a subsequent period.
Annual Report
Notes to Financial Statements - continued
3. Significant Accounting Policies - continued
Income Tax Information and Distributions to Shareholders - continued
Book-tax differences are primarily due to foreign currency transactions, passive foreign investment companies (PFIC), capital loss carryforwards and losses deferred due to wash sales.
The tax-basis components of distributable earnings and the federal tax cost as of period end were as follows:
Unrealized appreciation | $ 8,750,540 | |
Unrealized depreciation | (3,845,732) | |
Net unrealized appreciation (depreciation) | 4,904,808 | |
Undistributed ordinary income | 177,634 | |
Capital loss carryforward | (12,845,430) | |
| | |
Cost for federal income tax purposes | $ 93,216,598 | |
Short-Term Trading (Redemption) Fees. Shares held in the Fund less than 90 days are subject to a redemption fee equal to 1.50% of the proceeds of the redeemed shares. All redemption fees, including any estimated redemption fees paid by FMR, are retained by the Fund and accounted for as an addition to paid in capital.
New Accounting Pronouncements. In July 2006, Financial Accounting Standards Board Interpretation No. 48, Accounting for Uncertainty in Income Taxes - an interpretation of FASB Statement 109 (FIN 48), was issued and is effective on the last business day of the semiannual reporting period for fiscal years beginning after December 15, 2006. FIN 48 sets forth a threshold for financial statement recognition, measurement and disclosure of a tax position taken or expected to be taken on a tax return. Management has concluded that the adoption of FIN 48 will not result in a material impact on the Fund's net assets, results of operations and financial statement disclosures.
In addition, in September 2006, Statement of Financial Accounting Standards No. 157, Fair Value Measurements (SFAS 157), was issued and is effective for fiscal years beginning after November 15, 2007. SFAS 157 defines fair value, establishes a framework for measuring fair value and expands disclosures about fair value measurements. Management is currently evaluating the impact the adoption of SFAS 157 will have on the Fund's financial statement disclosures.
Annual Report
4. Operating Policies.
Repurchase Agreements. FMR has received an Exemptive Order from the Securities and Exchange Commission (the SEC) which permits the Fund and other affiliated entities of FMR to transfer uninvested cash balances into joint trading accounts which are then invested in repurchase agreements. The Fund may also invest directly with institutions in repurchase agreements. Repurchase agreements are collateralized by government or non-government securities. Upon settlement date, collateral is held in segregated accounts with custodian banks and may be obtained in the event of a default of the counterparty. The Fund monitors, on a daily basis, the value of the collateral to ensure it is at least equal to the principal amount of the repurchase agreement (including accrued interest). In the event of a default by the counterparty, realization of the collateral proceeds could be delayed, during which time the value of the collateral may decline.
5. Purchases and Sales of Investments.
Purchases and sales of securities, other than short-term securities, aggregated $168,000,204 and $217,057,072, respectively.
6. Fees and Other Transactions with Affiliates.
Management Fee. FMR and its affiliates provide the Fund with investment management related services for which the Fund pays a monthly management fee. The management fee is the sum of an individual fund fee rate that is based on an annual rate of .45% of the Fund's average net assets and a group fee rate that averaged ..26% during the period. The group fee rate is based upon the average net assets of all the mutual funds advised by FMR. The group fee rate decreases as assets under management increase and increases as assets under management decrease.
In addition, on September 19, 2007, shareholders approved a new management contract which adds a performance adjustment to the management fee (up to a maximum of .20% of the Fund's average net assets over a 36 month performance period). The upward or downward adjustment to the management fee is based on the relative investment performance of the Fund's Institutional Class as compared to an appropriate benchmark index. The Fund's performance period began on October 1, 2007. The performance adjustment will take effect starting with the twelfth month of the performance period (September, 2008). Subsequent months will be added until the performance period includes 36 months. For the period, the total annual management fee rate was .71% of the Fund's average net assets.
Annual Report
Notes to Financial Statements - continued
6. Fees and Other Transactions with Affiliates - continued
Distribution and Service Plan. In accordance with Rule 12b-1 of the 1940 Act, the Fund has adopted separate Distribution and Service Plans for each class of shares. Certain classes pay Fidelity Distributors Corporation (FDC), an affiliate of FMR, separate Distribution and Service Fees, each of which is based on an annual percentage of each class' average net assets. In addition, FDC may pay financial intermediaries for selling shares of the Fund and providing shareholder support services. For the period, the Distribution and Service Fee rates and the total amounts paid to and retained by FDC were as follows:
| Distribution
Fee | Service
Fee | Paid to
FDC | Retained
by FDC |
Class A | 0% | .25% | $ 93,623 | $ 3,126 |
Class T | .25% | .25% | 89,096 | 210 |
Class B | .75% | .25% | 114,710 | 86,121 |
Class C | .75% | .25% | 436,139 | 98,142 |
| | | $ 733,568 | $ 187,599 |
Sales Load. FDC receives a front-end sales charge of up to 5.75% for selling Class A shares, and 3.50% for selling Class T shares, some of which is paid to financial intermediaries for selling shares of the Fund. FDC receives the proceeds of contingent deferred sales charges levied on Class A, Class T, Class B, and Class C redemptions. These charges depend on the holding period. The deferred sales charges range from 5% to 1% for
Class B, 1% for Class C, 1.00% to .50% for certain purchases of Class A shares and .25% for certain purchases of Class T shares.
For the period, sales charge amounts retained by FDC were as follows:
| Retained
by FDC |
Class A | $ 20,749 |
Class T | 4,721 |
Class B* | 33,265 |
Class C* | 40,977 |
| $ 99,712 |
* When Class B and Class C shares are initially sold, FDC pays commissions from its own resources to financial intermediaries through which the sales are made.
Annual Report
6. Fees and Other Transactions with Affiliates - continued
Transfer Agent Fees. Fidelity Investments Institutional Operations Company, Inc. (FIIOC), an affiliate of FMR, is the transfer, dividend disbursing and shareholder servicing agent for each class of the Fund. FIIOC receives account fees and asset-based fees that vary according to the account size and type of account of the shareholders of the respective classes of the Fund. FIIOC pays for typesetting, printing and mailing of shareholder reports, except proxy statements. For the period, the total transfer agent fees paid by each class to FIIOC, were as follows:
| Amount | % of
Average
Net Assets |
Class A | $ 114,107 | .31 |
Class T | 58,264 | .33 |
Class B | 36,531 | .32 |
Class C | 101,580 | .23 |
Institutional Class | 19,346 | .18 |
| $ 329,828 | |
Accounting and Security Lending Fees. Fidelity Service Company, Inc. (FSC), an affiliate of FMR, maintains the Fund's accounting records. The accounting fee is based on the level of average net assets for the month. Under a separate contract, FSC administers the security lending program. The security lending fee is based on the number and duration of lending transactions.
7. Committed Line of Credit.
The Fund participates with other funds managed by FMR in a $4.2 billion credit facility (the "line of credit") to be utilized for temporary or emergency purposes to fund shareholder redemptions or for other short-term liquidity purposes. The Fund has agreed to pay commitment fees on its pro rata portion of the line of credit, which amounted to $271 and is reflected in Miscellaneous Expense on the Statement of Operations. During the period, there were no borrowings on this line of credit.
8. Security Lending.
The Fund lends portfolio securities from time to time in order to earn additional income. On the settlement date of the loan, the Fund receives collateral (in the form of U.S. Treasury obligations, letters of credit and/or cash) against the loaned securities and maintains collateral in an amount not less than 100% of the market value of the loaned securities during the period of the loan. The market value of the loaned securities is determined at the close of business of the Fund and any additional required collateral is delivered to the Fund on the next business day. If the borrower defaults on its obligation to return the securities loaned because of insolvency or other reasons, a fund could experience delays and costs in recovering the securities loaned or in gaining access to
Annual Report
Notes to Financial Statements - continued
8. Security Lending - continued
the collateral. Any cash collateral received is invested in the Fidelity Securities Lending Cash Central Fund. The value of loaned securities and cash collateral at period end are disclosed on the Fund's Statement of Assets and Liabilities. Security lending income represents the income earned on investing cash collateral, less fees and expenses associated with the loan, plus any premium payments that may be received on the loan of certain types of securities. Security lending income is presented in the Statement of Operations as a component of income from Fidelity Central Funds. Net income from lending portfolio securities during the period amounted to $75,534.
9. Expense Reductions.
FMR voluntarily agreed to reimburse each class to the extent annual operating expenses exceeded certain levels of average net assets as noted in the table below. Some expenses, for example interest expense, including commitment fees, are excluded from this reimbursement.
The following classes were in reimbursement during the period:
| Expense
Limitations | Reimbursement
from adviser |
| | |
Class A | 1.50% | $ 74,193 |
Class T | 1.75% | 37,678 |
Class B | 2.25% | 22,458 |
Class C | 2.25% | 51,884 |
Institutional Class | 1.25% | 6,697 |
| | $ 192,910 |
Many of the brokers with whom FMR places trades on behalf of the Fund provided services to the Fund in addition to trade execution. These services included payments of certain expenses on behalf of the Fund totaling $21,323 for the period.
10. Other.
The Fund's organizational documents provide former and current trustees and officers with a limited indemnification against liabilities arising in connection with the performance of their duties to the Fund. In the normal course of business, the Fund may also enter into contracts that provide general indemnifications. The Fund's maximum exposure under these arrangements is unknown as this would be dependent on future claims that may be made against the Fund. The risk of material loss from such claims is considered remote.
In September 2006, FIIOC, the Fund's transfer agent, notified the Fund that the Fund's books and records did not reflect a conversion of certain Class B to Class A shares upon
Annual Report
10. Other - continued
their conversion date. In March 2007, FIIOC converted the relevant Class B shares to Class A shares and recorded the conversion in the books and records of the Fund which did not result in a material impact to the Fund's reported net assets or results of operations in the accompanying financial statements. FIIOC has remediated affected shareholders and reimbursed the Fund for all related audit and legal expenses.
11. Share Transactions.
Transactions for each class of shares were as follows:
| Shares | Dollars |
Years ended October 31, | 2007 | 2006 | 2007 | 2006 |
Class A | | | | |
Shares sold | 880,882 | 2,415,607 | $ 14,621,774 | $ 42,848,178 |
Shares redeemed | (1,378,099) | (1,587,280) | (22,819,285) | (27,666,623) |
Net increase (decrease) | (497,217) | 828,327 | $ (8,197,511) | $ 15,181,555 |
Class T | | | | |
Shares sold | 210,578 | 791,936 | $ 3,439,343 | $ 13,799,281 |
Shares redeemed | (601,386) | (526,692) | (9,800,348) | (8,958,468) |
Net increase (decrease) | (390,808) | 265,244 | $ (6,361,005) | $ 4,840,813 |
Class B | | | | |
Shares sold | 60,581 | 403,589 | $ 947,979 | $ 6,894,896 |
Shares redeemed | (565,912) | (654,386) | (8,855,704) | (10,858,321) |
Net increase (decrease) | (505,331) | (250,797) | $ (7,907,725) | $ (3,963,425) |
Class C | | | | |
Shares sold | 404,623 | 2,456,323 | $ 6,455,208 | $ 42,041,448 |
Shares redeemed | (1,590,835) | (1,361,698) | (25,190,493) | (22,520,719) |
Net increase (decrease) | (1,186,212) | 1,094,625 | $ (18,735,285) | $ 19,520,729 |
Institutional Class | | | | |
Shares sold | 174,093 | 594,833 | $ 2,974,426 | $ 10,866,389 |
Shares redeemed | (477,947) | (317,427) | (8,131,108) | (5,574,088) |
Net increase (decrease) | (303,854) | 277,406 | $ (5,156,682) | $ 5,292,301 |
Annual Report
Report of Independent Registered Public Accounting Firm
To the Trustees of Fidelity Advisor Series VIII and the Shareholders of Fidelity Advisor Japan Fund:
In our opinion, the accompanying statement of assets and liabilities, including the schedule of investments, and the related statements of operations and of changes in net assets and the financial highlights present fairly, in all material respects, the financial position of Fidelity Advisor Japan Fund (a fund of Fidelity Advisor Series VIII) at October 31, 2007, the results of its operations for the year then ended, the changes in its net assets for each of the two years in the period then ended and the financial highlights for each of the five years in the period then ended, in conformity with accounting principles generally accepted in the United States of America. These financial statements and financial highlights (hereafter referred to as "financial statements") are the responsibility of the Fidelity Advisor Japan Fund's management. Our responsibility is to express an opinion on these financial statements based on our audits. We conducted our audits of these financial statements in accordance with the standards of the Public Company Accounting Oversight Board (United States). Those standards require that we plan and perform the audit to obtain reasonable assurance about whether the financial statements are free of material misstatement. An audit includes examining, on a test basis, evidence supporting the amounts and disclosures in the financial statements, assessing the accounting principles used and significant estimates made by management, and evaluating the overall financial statement presentation. We believe that our audits, which included confirmation of securities at October 31, 2007 by correspondence with the custodian and brokers, provide a reasonable basis for our opinion.
/s/ PricewaterhouseCoopers LLP
PricewaterhouseCoopers LLP
Boston, Massachusetts
December 17, 2007
Annual Report
Trustees and Officers
The Trustees, Members of the Advisory Board, and executive officers of the trust and fund, as applicable, are listed below. The Board of Trustees governs the fund and is responsible for protecting the interests of shareholders. The Trustees are experienced executives who meet periodically throughout the year to oversee the fund's activities, review contractual arrangements with companies that provide services to the fund, and review the fund's performance. Each of the Trustees oversees 370 funds advised by FMR or an affiliate. Mr. Curvey oversees 340 funds advised by FMR or an affiliate.
The Trustees hold office without limit in time except that (a) any Trustee may resign; (b) any Trustee may be removed by written instrument, signed by at least two-thirds of the number of Trustees prior to such removal; (c) any Trustee who requests to be retired or who has become incapacitated by illness or injury may be retired by written instrument signed by a majority of the other Trustees; and (d) any Trustee may be removed at any special meeting of shareholders by a two-thirds vote of the outstanding voting securities of the trust. Each Trustee who is not an interested person (as defined in the 1940 Act) (Independent Trustee), shall retire not later than the last day of the calendar year in which his or her 72nd birthday occurs. The Independent Trustees may waive this mandatory retirement age policy with respect to individual Trustees. The executive officers and Advisory Board Members hold office without limit in time, except that any officer and Advisory Board Member may resign or may be removed by a vote of a majority of the Trustees at any regular meeting or any special meeting of the Trustees. Except as indicated, each individual has held the office shown or other offices in the same company for the past five years.
The fund's Statement of Additional Information (SAI) includes more information about the Trustees. To request a free copy, call Fidelity at 1-877-208-0098.
Interested Trustees*:
Correspondence intended for each Trustee who is an interested person may be sent to Fidelity Investments, 82 Devonshire Street, Boston, Massachusetts 02109.
Name, Age; Principal Occupation |
Edward C. Johnson 3d (77) |
| Year of Election or Appointment: 1983 Mr. Johnson is Chairman of the Board of Trustees. Mr. Johnson serves as President (2006-present), Chief Executive Officer, Chairman, and a Director of FMR LLC; Chairman and a Director of FMR; Chairman and a Director of Fidelity Research & Analysis Company (FRAC); Chairman and a Director of Fidelity Investments Money Management, Inc.; and Chairman (2001-present) and a Director of FMR Co., Inc. In addition, Mr. Johnson serves as Chairman and Director of Fidelity International Limited (FIL). |
James C. Curvey (72) |
| Year of Election or Appointment: 2007 Mr. Curvey also serves as Trustee (2007-present) or Member of the Advisory Board (2007-present) of other investment companies advised by FMR. Mr. Curvey is a Director of FMR and FMR Co., Inc. (2007-present). Mr. Curvey is also Vice Chairman (2006-present) and Director of FMR LLC. Mr. Curvey joined Fidelity in 1982 and served in numerous senior management positions, including President and Chief Operating Officer of FMR LLC (1997-2000) and President of Fidelity Strategic Investments (2000-2002). In addition, he serves as a member of the Board of Directors of Geerlings & Wade, Inc. (wine distribution). |
* Trustees have been determined to be "Interested Trustees" by virtue of, among other things, their affiliation with the trust, or various entities under common control with FMR. FMR Corp. merged with FMR LLC on October 1, 2007. Any references to FMR LLC for prior periods are deemed to be references to the prior entity.
Independent Trustees:
Correspondence intended for each Independent Trustee (that is, the Trustees other than the Interested Trustees) may be sent to Fidelity Investments, P.O. Box 55235, Boston, Massachusetts 02205-5235.
Name, Age; Principal Occupation |
Dennis J. Dirks (59) |
| Year of Election or Appointment: 2005 Prior to his retirement in May 2003, Mr. Dirks was Chief Operating Officer and a member of the Board of The Depository Trust & Clearing Corporation (DTCC) (1999-2003). He also served as President, Chief Operating Officer, and Board member of The Depository Trust Company (DTC) (1999-2003) and President and Board member of the National Securities Clearing Corporation (NSCC) (1999-2003). In addition, Mr. Dirks served as Chief Executive Officer and Board member of the Government Securities Clearing Corporation (2001-2003) and Chief Executive Officer and Board member of the Mortgage-Backed Securities Clearing Corporation (2001-2003). Mr. Dirks also serves as a Trustee and a member of the Finance Committee of Manhattan College (2005-present) and a Trustee and a member of the Finance Committee of AHRC of Nassau County (2006-present). |
Albert R. Gamper, Jr. (65) |
| Year of Election or Appointment: 2006 Prior to his retirement in December 2004, Mr. Gamper served as Chairman of the Board of CIT Group Inc. (commercial finance). During his tenure with CIT Group Inc. Mr. Gamper served in numerous senior management positions, including Chairman (1987-1989; 1999-2001; 2002-2004), Chief Executive Officer (1987-2004), and President (1989-2002). He currently serves as a member of the Board of Directors of Public Service Enterprise Group (utilities, 2001-present), Chairman of the Board of Governors, Rutgers University (2004-present), and Chairman of the Board of Saint Barnabas Health Care System. |
George H. Heilmeier (71) |
| Year of Election or Appointment: 2004 Dr. Heilmeier is Chairman Emeritus of Telcordia Technologies (communication software and systems), where prior to his retirement, he served as company Chairman and Chief Executive Officer. He currently serves on the Boards of Directors of The Mitre Corporation (systems engineering and information technology support for the government), and HRL Laboratories (private research and development, 2004-present). He is Chairman of the General Motors Science & Technology Advisory Board and a Life Fellow of the Institute of Electrical and Electronics Engineers (IEEE). Dr. Heilmeier is a member of the Defense Science Board and the National Security Agency Advisory Board. He is also a member of the National Academy of Engineering, the American Academy of Arts and Sciences, and the Board of Overseers of the School of Engineering and Applied Science of the University of Pennsylvania. Previously, Dr. Heilmeier served as a Director of TRW Inc. (automotive, space, defense, and information technology, 1992-2002), Compaq (1994-2002), Automatic Data Processing, Inc. (ADP) (technology-based business outsourcing, 1995-2002), INET Technologies Inc. (telecommunications network surveillance, 2001-2004), and Teletech Holdings (customer management services). He is the recipient of the 2005 Kyoto Prize in Advanced Technology for his invention of the liquid crystal display, and a member of the Consumer Electronics Hall of Fame. |
James H. Keyes (67) |
| Year of Election or Appointment: 2007 Prior to his retirement in 2003, Mr. Keyes was Chairman, President, and Chief Executive Officer of Johnson Controls, Inc. (automotive supplier, 1993-2003). He currently serves as a member of the boards of LSI Logic Corporation (semiconductor technologies), Navistar International Corporation (manufacture and sale of trucks, buses, and diesel engines, 2002-present), and Pitney Bowes, Inc. (integrated mail, messaging, and document management solutions). |
Marie L. Knowles (61) |
| Year of Election or Appointment: 2001 Prior to Ms. Knowles' retirement in June 2000, she served as Executive Vice President and Chief Financial Officer of Atlantic Richfield Company (ARCO) (diversified energy, 1996-2000). From 1993 to 1996, she was a Senior Vice President of ARCO and President of ARCO Transportation Company. She served as a Director of ARCO from 1996 to 1998. She currently serves as a Director of Phelps Dodge Corporation (copper mining and manufacturing) and McKesson Corporation (healthcare service, 2002-present). Ms. Knowles is a Trustee of the Brookings Institution and the Catalina Island Conservancy and also serves as a member of the Advisory Board for the School of Engineering of the University of Southern California. |
Ned C. Lautenbach (63) |
| Year of Election or Appointment: 2000 Mr. Lautenbach is Chairman of the Independent Trustees (2006-present). Mr. Lautenbach has been a partner of Clayton, Dubilier & Rice, Inc. (private equity investment firm) since September 1998. Previously, Mr. Lautenbach was with the International Business Machines Corporation (IBM) from 1968 until his retirement in 1998. Mr. Lautenbach serves as a Director of Sony Corporation (2006-present) and Eaton Corporation (diversified industrial) as well as the Philharmonic Center for the Arts in Naples, Florida. He also is a member of the Board of Trustees of Fairfield University (2005-present), as well as a member of the Council on Foreign Relations. |
Cornelia M. Small (63) |
| Year of Election or Appointment: 2005 Ms. Small is a member (2000-present) and Chairperson (2002-present) of the Investment Committee, and a member (2002-present) of the Board of Trustees of Smith College. Previously, she served as Chief Investment Officer (1999-2000), Director of Global Equity Investments (1996-1999), and a member of the Board of Directors of Scudder, Stevens & Clark (1990-1997) and Scudder Kemper Investments (1997-1999). In addition, Ms. Small served as Co-Chair (2000-2003) of the Annual Fund for the Fletcher School of Law and Diplomacy. |
William S. Stavropoulos (68) |
| Year of Election or Appointment: 2001 Mr. Stavropoulos is Chairman Emeritus of the Board of Directors of The Dow Chemical Company. Since joining The Dow Chemical Company in 1967, Mr. Stavropoulos served in numerous senior management positions, including President (1993-2000; 2002-2003), CEO (1995-2000; 2002-2004), and Chairman of the Executive Committee (2000-2004). Currently, he is a Director of NCR Corporation (data warehousing and technology solutions), Chemical Financial Corporation, Maersk Inc. (industrial conglomerate, 2002-present), Tyco International, Inc. (multinational manufacturing and services, 2007-present), and a member of the Advisory Board for Metalmark Capital (private equity investment firm, 2005-present). He is a special advisor to Clayton, Dubilier & Rice, Inc., a private equity investment firm. He also serves as a member of the Board of Trustees of the American Enterprise Institute for Public Policy Research. In addition, Mr. Stavropoulos is a member of The Business Council, J.P. Morgan International Council and the University of Notre Dame Advisory Council for the College of Science. |
Kenneth L. Wolfe (68) |
| Year of Election or Appointment: 2005 Prior to his retirement in 2001, Mr. Wolfe was Chairman and Chief Executive Officer of Hershey Foods Corporation (1993-2001). He currently serves as a member of the boards of Adelphia Communications Corporation (2003-present), Bausch & Lomb, Inc., and Revlon Inc. (2004-present). |
Advisory Board Members and Executive Officers**:
Correspondence intended for Mr. Mauriello, Mr. Thomas, and Mr. Wiley may be sent to Fidelity Investments, P.O. Box 55235, Boston, Massachusetts 02205-5235. Correspondence intended for each executive officer and Mr. Lynch may be sent to Fidelity Investments, 82 Devonshire Street, Boston, Massachusetts 02109.
Name, Age; Principal Occupation |
Peter S. Lynch (63) |
| Year of Election or Appointment: 2003 Member of the Advisory Board of Fidelity Advisor Series VIII. Mr. Lynch is Vice Chairman and a Director of FMR, and Vice Chairman (2001-present) and a Director of FMR Co., Inc. Previously, Mr. Lynch served as a Trustee of the Fidelity funds (1990-2003). In addition, he serves as a Trustee of Boston College and as the Chairman of the
Inner-City Scholarship Fund. |
Joseph Mauriello (63) |
| Year of Election or Appointment: 2007 Member of the Advisory Board of Fidelity Advisor Series VIII. Prior to his retirement in January 2006, Mr. Mauriello served in numerous senior management positions including Deputy Chairman and Chief Operating Officer (2004-2005), and Vice Chairman of Financial Services (2002-2004) of KPMG LLP US (professional services firm, 1965-2005). Mr. Mauriello currently serves as a member of the Board of Directors of XL Capital Ltd., (global insurance and re-insurance company, 2006-present) and of Arcadia Resources Inc., (health care services and products, 2007-present). He also served as a Director of the Hamilton Funds of the Bank of New York (2006-2007). |
David M. Thomas (58) |
| Year of Election or Appointment: 2007
Member of the Advisory Board of Fidelity Advisor Series VIII. Previously, Mr. Thomas served as Executive Chairman (2005-2006) and Chairman and Chief Executive Officer (2000-2005) of IMS Health, Inc. (pharmaceutical and healthcare information solutions). In addition, Mr. Thomas serves as a member of the Board of Directors of Fortune Brands, Inc. (consumer products holding company), and Interpublic Group of Companies, Inc. (marketing communication, 2004-present). |
Michael E. Wiley (57) |
| Year of Election or Appointment: 2007 Member of the Advisory Board of Fidelity Advisor Series VIII. Mr. Wiley also serves as Sr. Energy Advisor of Katzenbach Partners, LLC (consulting firm, 2006-present) and a member of the Board of Trustees of the University of Tulsa (2000-2006; 2007-present). He serves as a Director of Tesoro Corporation (independent oil refiner and marketer, 2005-present), and a Director of Bill Barrett Corporation (exploration and production company, 2005-present). In addition, he also serves as a Director of Post Oak Bank (privately-held bank, 2004-present), and an Advisory Director of Riverstone Holdings (private investment firm). Previously, Mr. Wiley served as Chairman, President, and CEO of Baker Hughes, Inc. (oilfield services company, 2000-2004), and as Director of Spinnaker Exploration Company (exploration and production company, 2001-2005). |
Kimberley H. Monasterio (43) |
| Year of Election or Appointment: 2007 President and Treasurer of Advisor Japan. Ms. Monasterio also serves as President and Treasurer of other Fidelity funds (2007-present) and is an employee of FMR (2004-present). Previously, Ms. Monasterio served as Deputy Treasurer of the Fidelity funds (2004-2006). Before joining Fidelity Investments, Ms. Monasterio served as Treasurer (2000-2004) and Chief Financial Officer (2002-2004) of the Franklin Templeton Funds and Senior Vice President of Franklin Templeton Services, LLC (2000-2004). |
Walter C. Donovan (45) |
| Year of Election or Appointment: 2007 Vice President of Advisor Japan. Mr. Donovan also serves as Vice President of Fidelity's Equity Funds (2007-present). Mr. Donovan also serves as Executive Vice President of FMR (2005-present) and FMR Co., Inc. (2005-present). Previously, Mr. Donovan served as Vice President of Fidelity's High Income Funds (2005-2007), Fixed-Income Funds (2005-2006), certain Asset Allocation Funds (2005-2006), certain Balanced Funds (2005-2006), and as Vice President and Director of Fidelity's International Equity Trading group (1998-2005). |
Eric M. Wetlaufer (45) |
| Year of Election or Appointment: 2006 Vice President of Advisor Japan. Mr. Wetlaufer also serves as Vice President of certain International Equity Funds (2006-present). Mr. Wetlaufer is Senior Vice President of FMR (2006-present) and FMR Co., Inc. (2006-present), and President and Director of Fidelity Management & Research (U.K.) Inc. (2006-present) and Fidelity Research & Analysis Company (2006-present). Before joining Fidelity Investments in 2005, Mr. Wetlaufer was a partner in Oxhead Capital Management (2004-2005). Previously, Mr. Wetlaufer served as a Chief Investment Officer of Putnam Investments (1997-2003). |
Eric D. Roiter (58) |
| Year of Election or Appointment: 1998 Secretary of Advisor Japan. He also serves as Secretary of other Fidelity funds; Vice President, General Counsel, and Secretary of FMR Co., Inc. (2001-present) and FMR; Assistant Secretary of Fidelity Management & Research (U.K.) Inc. (2001-present), Fidelity Research & Analysis Company (2001-present), and Fidelity Investments Money Management, Inc. (2001-present). Mr. Roiter is an Adjunct Member, Faculty of Law, at Boston College Law School (2003-present). Previously, Mr. Roiter served as Vice President and Secretary of Fidelity Distributors Corporation (FDC) (1998-2005). |
Scott C. Goebel (39) |
| Year of Election or Appointment: 2007 Assistant Secretary of Advisor Japan. Mr. Goebel also serves as Assistant Secretary of other Fidelity funds (2007-present), and is an employee of FMR. |
R. Stephen Ganis (41) |
| Year of Election or Appointment: 2006 Anti-Money Laundering (AML) officer of Advisor Japan. Mr. Ganis also serves as AML officer of other Fidelity funds (2006-present) and FMR LLC (2003-present). Before joining Fidelity Investments, Mr. Ganis practiced law at Goodwin Procter, LLP (2000-2002). |
Joseph B. Hollis (59) |
| Year of Election or Appointment: 2006 Chief Financial Officer of Advisor Japan. Mr. Hollis also serves as Chief Financial Officer of other Fidelity funds. Mr. Hollis is President of Fidelity Pricing and Cash Management Services (FPCMS) (2005-present). Mr. Hollis also serves as President and Director of Fidelity Service Company, Inc. (2006-present). Previously, Mr. Hollis served as Senior Vice President of Cash Management Services (1999-2002) and Investment Management Operations (2002-2005). |
Kenneth A. Rathgeber (60) |
| Year of Election or Appointment: 2004 Chief Compliance Officer of Advisor Japan. Mr. Rathgeber also serves as Chief Compliance Officer of other Fidelity funds (2004-present) and Executive Vice President of Risk Oversight for Fidelity Investments (2002-present). He is Chief Compliance Officer of FMR (2005-present), FMR Co., Inc. (2005-present), Fidelity Management & Research (U.K.) Inc. (2005-present), Fidelity Research & Analysis Company (2005-present), Fidelity Investments Money Management, Inc. (2005-present), and Strategic Advisers, Inc. (2005-present). Previously, Mr. Rathgeber served as Executive Vice President and Chief Operating Officer for Fidelity Investments Institutional Services Company, Inc. (1998-2002). |
Bryan A. Mehrmann (46) |
| Year of Election or Appointment: 2005 Deputy Treasurer of Advisor Japan. Mr. Mehrmann also serves as Deputy Treasurer of other Fidelity funds (2005-present) and is an employee of FMR. Previously, Mr. Mehrmann served as Vice President of Fidelity Investments Institutional Services Group (FIIS)/Fidelity Investments Institutional Operations Corporation, Inc. (FIIOC) Client Services (1998-2004). |
Kenneth B. Robins (38) |
| Year of Election or Appointment: 2005 Deputy Treasurer of Advisor Japan. Mr. Robins also serves as Deputy Treasurer of other Fidelity funds (2005-present) and is an employee of FMR (2004-present). Before joining Fidelity Investments, Mr. Robins worked at KPMG LLP, where he was a partner in KPMG's department of professional practice (2002-2004) and a Senior Manager (1999-2000). In addition, Mr. Robins served as Assistant Chief Accountant, United States Securities and Exchange Commission (2000-2002). |
Robert G. Byrnes (40) |
| Year of Election or Appointment: 2005 Assistant Treasurer of Advisor Japan. Mr. Byrnes also serves as Assistant Treasurer of other Fidelity funds (2005-present) and is an employee of FMR (2005-present). Previously, Mr. Byrnes served as Vice President of FPCMS (2003-2005). Before joining Fidelity Investments, Mr. Byrnes worked at Deutsche Asset Management where he served as Vice President of the Investment Operations Group (2000-2003). |
Peter L. Lydecker (53) |
| Year of Election or Appointment: 2004 Assistant Treasurer of Advisor Japan. Mr. Lydecker also serves as Assistant Treasurer of other Fidelity funds (2004) and is an employee of FMR. |
Paul M. Murphy (60) |
| Year of Election or Appointment: 2007 Assistant Treasurer of Advisor Japan. Mr. Murphy also serves as Assistant Treasurer of other Fidelity funds (2007-present) and is an employee of FMR (2007-present). Previously, Mr. Murphy served as Chief Financial Officer of the Fidelity Funds (2005-2006), Vice President and Associate General Counsel of FMR (2007), and Senior Vice President of Fidelity Pricing and Cash Management Services Group (FPCMS) (1994-2007). |
Gary W. Ryan (49) |
| Year of Election or Appointment: 2005 Assistant Treasurer of Advisor Japan. Mr. Ryan also serves as Assistant Treasurer of other Fidelity funds (2005-present) and is an employee of FMR (2005-present). Previously, Mr. Ryan served as Vice President of Fund Reporting in FPCMS (1999-2005). |
** FMR Corp. merged with FMR LLC on October 1, 2007. Any references to FMR LLC for prior periods are deemed to be references to the prior entity.
Annual Report
Distributions
The Board of Trustees of Advisor Japan Fund voted to pay to shareholders of record at the opening of business on record date, the following distributions per share derived from capital gains realized from sales of portfolio securities, and dividends derived from net investment income:
| Pay Date | Record Date | Dividends | Capital Gains |
Class A | 12/07/07 | 12/10/07 | $.00 | $.063 |
| | | | |
Class T | 12/07/07 | 12/10/07 | $.00 | $.004 |
| | | | |
Class B | 12/07/07 | 12/10/07 | $.00 | $.00 |
| | | | |
Class C | 12/07/07 | 12/10/07 | $.00 | $.00 |
The fund will notify shareholders in January 2008 of amounts for use in preparing 2007 income tax returns.
Annual Report
Proxy Voting Results
A special meeting of the fund's shareholders was held on September 19, 2007. The results of votes taken among shareholders on the proposal before them are reported below. Each vote reported represents one dollar of net asset value held on the record date for the meeting.
PROPOSAL 4 |
To approve an amended management contract that includes adding a performance adjustment component to the management fee for Fidelity Advisor Japan Fund and giving the Trustees the authority to change the fund's performance adjustment index going forward, without shareholder vote, subject to applicable law. |
| # of
Votes | % of
Votes |
Affirmative | 50,946,430.85 | 77.692 |
Against | 11,660,625.85 | 17.782 |
Abstain | 2,967,717.59 | 4.526 |
TOTAL | 65,574,774.29 | 100.000 |
Annual Report
Board Approval of Investment Advisory Contracts and Management Fees
Advisor Japan Fund
Each year, typically in July, the Board of Trustees, including the Independent Trustees (together, the Board), votes on the renewal of the management contract and sub-advisory agreements (together, the Advisory Contracts) for the fund. The Board, assisted by the advice of fund counsel and Independent Trustees' counsel, requests and considers a broad range of information throughout the year.
The Board meets regularly each month except August and takes into account throughout the year matters bearing on Advisory Contracts. The Board, acting directly and through its separate committees, considers at each of its meetings factors that are relevant to the annual renewal of the fund's Advisory Contracts, including the services and support provided to the fund and its shareholders. At the time of the renewal, the Board had 12 standing committees, each composed of Independent Trustees with varying backgrounds, to which the Board has assigned specific subject matter responsibilities in order to enhance effective decision-making by the Board. Each committee has adopted a written charter outlining the structure and purposes of the committee. One such committee, the Equity Contract Committee, meets periodically as needed throughout the year to consider matters specifically related to the annual renewal of Advisory Contracts. The committee requests and receives information on, and makes recommendations to the Independent Trustees concerning, the approval and annual review of the Advisory Contracts.
At its July 2007 meeting, the Board of Trustees, including the Independent Trustees, unanimously determined to renew the Advisory Contracts for the fund. In reaching its determination, the Board considered all factors it believed relevant, including (i) the nature, extent, and quality of the services to be provided to the fund and its shareholders (including the investment performance of the fund); (ii) the competitiveness of the management fee and total expenses of the fund; (iii) the total costs of the services to be provided by and the profits to be realized by the investment adviser and its affiliates from the relationship with the fund; (iv) the extent to which economies of scale would be realized as the fund grows; and (v) whether fee levels reflect these economies of scale, if any, for the benefit of fund shareholders. The Board also approved amendments to the fund's agreements with foreign sub-advisers to clarify that each sub-adviser provides services as an independent contractor.
In determining whether to renew the Advisory Contracts for the fund, the Board ultimately reached a determination, with the assistance of fund counsel and Independent Trustees' counsel, that the renewal of the Advisory Contracts and the compensation to be received by Fidelity under the management contract is consistent with Fidelity's fiduciary duty under applicable law. In addition to evaluating the specific factors noted above, the Board, in reaching its determination, is aware that shareholders in the fund have a broad range of investment choices available to them, including a wide choice among mutual funds offered by competitors to Fidelity, and that the fund's shareholders, with the opportunity to review and weigh the disclosure provided by the fund in its prospectus and other public disclosures, have chosen to invest in this fund, managed by Fidelity.
Annual Report
Nature, Extent, and Quality of Services Provided. The Board considered staffing within the investment adviser, FMR, and the sub-advisers (together, the Investment Advisers), including the background of the fund's portfolio manager and the fund's investment objective and discipline. The Independent Trustees also had discussions with senior management of Fidelity's investment operations and investment groups. The Board considered the structure of the portfolio manager compensation program and whether this structure provides appropriate incentives.
Resources Dedicated to Investment Management and Support Services. The Board reviewed the size, education, and experience of the Investment Advisers' investment staff, their use of technology, and the Investment Advisers' approach to recruiting, training, and retaining portfolio managers and other research, advisory, and management personnel. The Board considered Fidelity's extensive global research capabilities that enable the Investment Advisers to aggregate data from various sources in an effort to produce positive investment results. The Board noted that Fidelity's analysts have access to a variety of technological tools that enable them to perform both fundamental and quantitative analysis and to specialize in various disciplines. The Board also considered that Fidelity's portfolio managers and analysts have access to daily portfolio attribution that allows for monitoring of a fund's portfolio, as well as an electronic communication system that provides immediate real-time access to research concerning issuers and credit enhancers.
Shareholder and Administrative Services. The Board considered (i) the nature, extent, quality, and cost of advisory, administrative, distribution, and shareholder services performed by the Investment Advisers and their affiliates under the Advisory Contracts and under separate agreements covering transfer agency, pricing and bookkeeping, and securities lending services for the fund; (ii) the nature and extent of the Investment Advisers' supervision of third party service providers, principally custodians and subcustodians; and (iii) the resources devoted to, and the record of compliance with, the fund's compliance policies and procedures. The Board reviewed the allocation of fund brokerage, including allocations to brokers affiliated with the Investment Advisers, the use of brokerage commissions to pay fund expenses, and the use of "soft" commission dollars to pay for research services. The Board also considered that Fidelity voluntarily pays for market data out of its own resources. The Board also considered the agreement reached between the Independent Trustees and Fidelity in December 2006 following an independent review of matters relating to receipt of travel, entertainment, gifts and gratuities in violation of Fidelity policies.
Annual Report
Board Approval of Investment Advisory Contracts and
Management Fees - continued
The Board noted that the growth of fund assets across the complex allows Fidelity to reinvest in the development of services designed to enhance the value or convenience of the Fidelity funds as investment vehicles. These services include 24-hour access to account information and market information through phone representatives and over the Internet, and investor education materials and asset allocation tools.
Investment in a Large Fund Family. The Board considered the benefits to shareholders of investing in a Fidelity fund, including the benefits of investing in a fund that is part of a large family of funds offering a variety of investment disciplines and providing for a large variety of mutual fund investor services. For example, fund shareholders are offered the privilege of exchanging shares of the fund for shares of other Fidelity funds, as set forth in the fund's prospectus, without paying a sales charge. The Board noted that, since the last Advisory Contract renewals in July 2006, Fidelity has taken a number of actions that benefited particular funds, including (i) dedicating additional resources to investment research and to restructure the investment research teams; (ii) contractually agreeing to reduce the management fee on Fidelity Advisor Floating Rate High Income Fund; (iii) contractually agreeing to reduce the management fees on Fidelity's California, Massachusetts, New Jersey, and New York AMT Tax-Free Money Market Funds, launching new Institutional Classes and Service Classes of these funds, and contractually agreeing to impose expense limitations on these funds; (iv) eliminating the exchange fee on the Fidelity Select Portfolios and reducing the pricing and bookkeeping fee rates for these funds; (v) reducing the maximum transfer agency fee rates on high income funds and certain equity funds; (vi) proposing amended management contracts that, if approved by shareholders, will add a performance adjustment component to the management fees paid by 18 Fidelity Advisor equity funds; (vii) contractually agreeing to reduce fees for Ultra-Short Central Fund and the money market Central Funds; (viii) waiving the Fidelity Advisor funds' contingent deferred sales charge on certain redemptions made through systematic withdrawal programs; and (ix) amending the management contracts for equity and fixed-income funds whose management contracts incorporate a "group fee" structure by adding four new fee "breakpoints" to the group fee rate schedules.
Investment Performance and Compliance. The Board considered whether the fund has operated within its investment objective, as well as its record of compliance with its investment restrictions. It also reviewed the fund's absolute investment performance for each class, as well as the fund's relative investment performance for each class measured against (i) a broad-based securities market index, and (ii) a peer group of mutual funds deemed appropriate by the Board over multiple periods. The following charts considered by the Board show, over the one-, three-, and five-year periods ended December 31, 2006, the cumulative total returns of Institutional Class (Class I) and Class B of the fund, the cumulative total returns of a broad-based securities market index ("benchmark"), and a range of cumulative total returns of a peer group of mutual funds identified by Lipper Inc. as having an investment objective similar to that of the fund. The returns of Institutional Class (Class I) and Class B show the performance of the highest and lowest performing classes, respectively (based on three-year performance). The box within each chart shows the 25th percentile return (bottom of box) and the 75th percentile return (top of box) of the peer group. Returns shown above the box are in the first quartile and returns shown below the box are in the fourth quartile. The percentage beaten numbers noted below each chart correspond to the percentile box and represent the percentage of funds in the peer group whose performance was equal to or lower than that of the class indicated.
Annual Report
Advisor Japan Fund
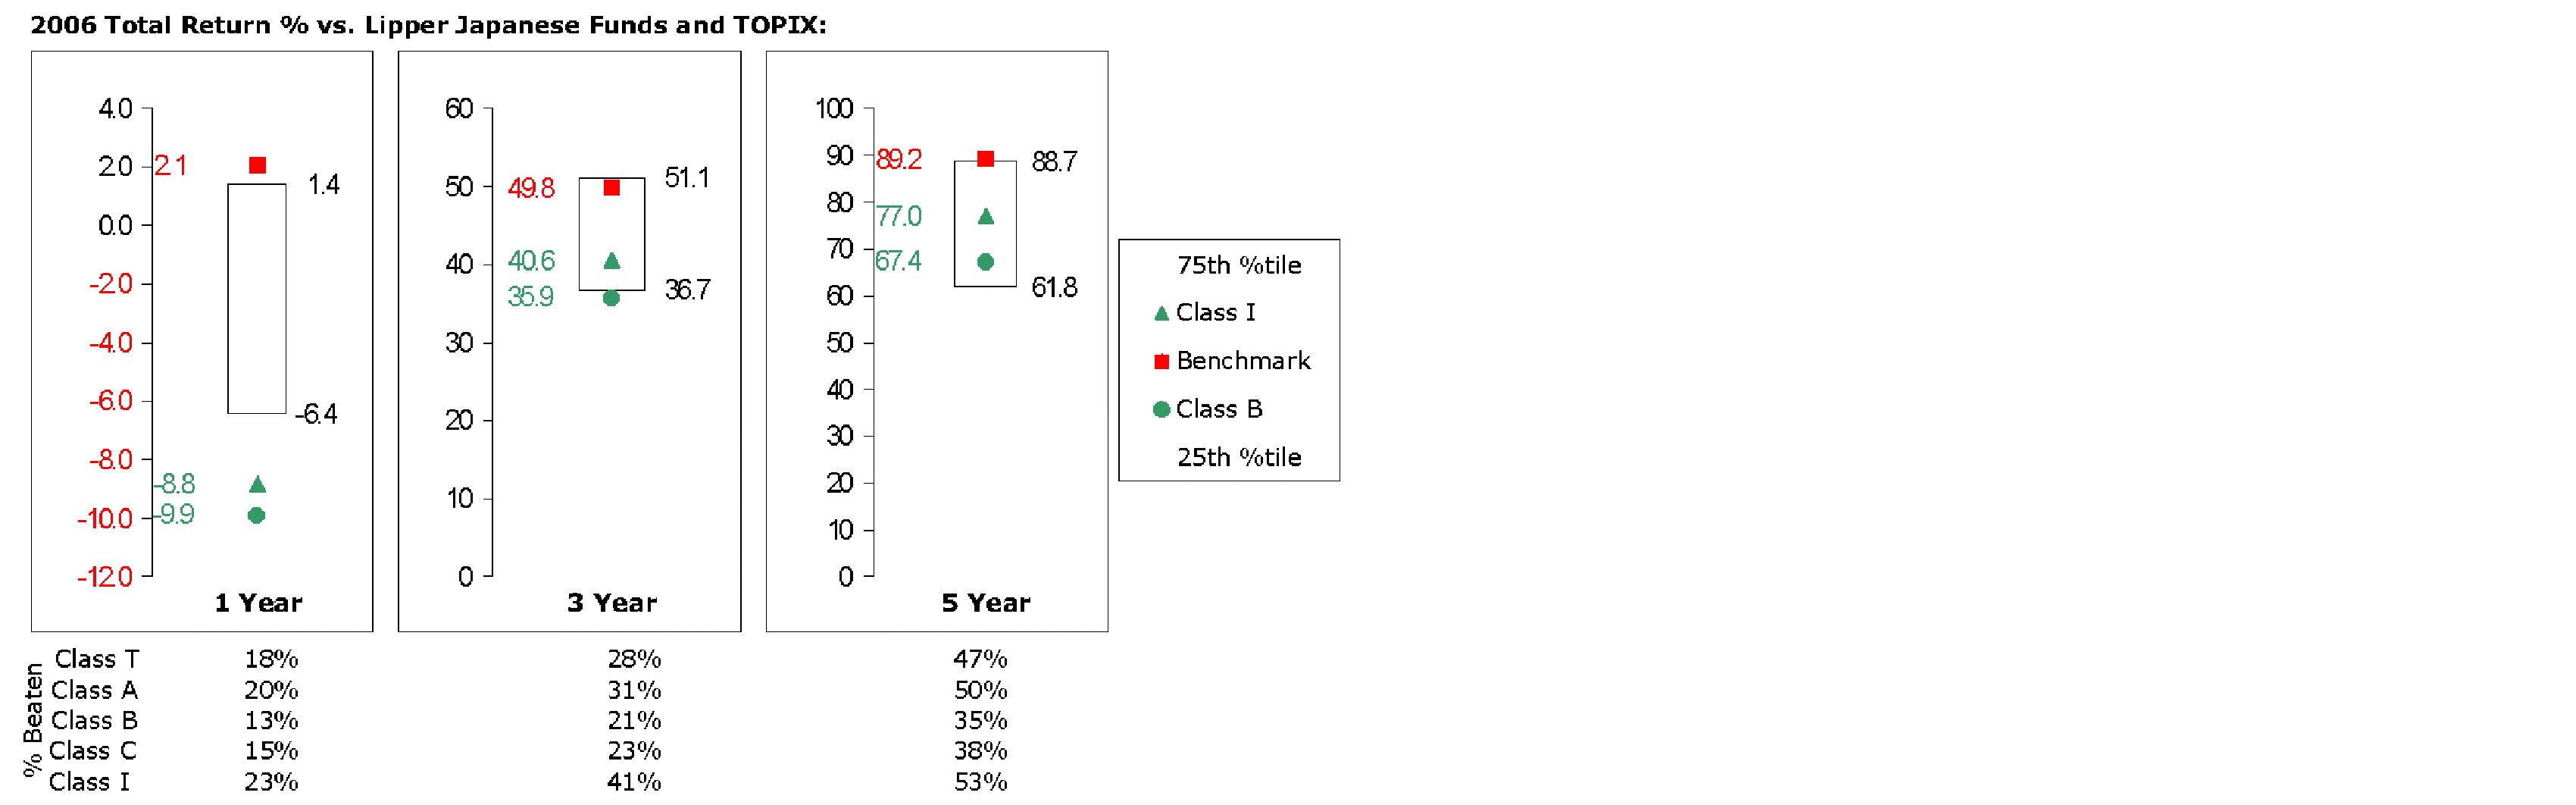
The Board reviewed the fund's relative investment performance against its peer group and stated that the performance of Institutional Class (Class I) of the fund was in the fourth quartile for the one-year period, the third quartile for the three-year period, and the second quartile for the five-year period. The Board also stated that the investment performance of the fund was lower than its benchmark for all the periods shown. The Board considered that the variations in performance among the fund's classes reflect the variations in class expenses, which result in lower performance for higher expense classes. The Board discussed with FMR actions to be taken by FMR to improve the fund's more recent disappointing performance relative to its peer group. The Board will continue to closely monitor the performance of the fund in the coming year.
The Board considered that FMR has taken steps to refocus and strengthen equity research, equity portfolio management, and compliance.
Based on its review, and giving particular weight to the nature and quality of the resources dedicated by the Investment Advisers to maintain and improve relative performance, the Board concluded that the nature, extent, and quality of the services provided to the fund will benefit the fund's shareholders, particularly in light of the Board's view that the fund's shareholders benefit from investing in a fund that is part of a large family of funds offering a variety of investment disciplines and services.
Annual Report
Board Approval of Investment Advisory Contracts and
Management Fees - continued
Competitiveness of Management Fee and Total Fund Expenses. The Board considered the fund's management fee and total expenses compared to "mapped groups" of competitive funds and classes. Fidelity creates "mapped groups" by combining similar Lipper investment objective categories that have comparable management fee characteristics. Combining Lipper investment objective categories aids the Board's management fee and total expense comparisons by broadening the competitive group used for comparison and by reducing the number of universes to which various Fidelity funds are compared. The Board also considered supplemental information about how the fund's management fee and total expenses ranked relative to groups based on Lipper classifications, which take into account a fund's market capitalization and style.
The Board considered two proprietary management fee comparisons for the 12-month periods shown in the chart below. The group of Lipper funds used by the Board for management fee comparisons is referred to below as the "Total Mapped Group" and, for the reasons explained above, is broader than the Lipper peer group used by the Board for performance comparisons. The Total Mapped Group comparison focuses on a fund's standing relative to the total universe of comparable funds available to investors, in terms of gross management fees before expense reimbursements or caps. "TMG %" represents the percentage of funds in the Total Mapped Group that had management fees that were lower than the fund's. For example, a TMG % of 15% means that 85% of the funds in the Total Mapped Group had higher management fees than the fund. The "Asset-Size Peer Group" (ASPG) comparison focuses on a fund's standing relative to non-Fidelity funds similar in size to the fund within the Total Mapped Group. The ASPG represents at least 15% of the funds in the Total Mapped Group with comparable asset size and management fee characteristics, subject to a minimum of 50 funds (or all funds in the Total Mapped Group if fewer than 50). Additional information, such as the ASPG quartile in which the fund's management fee ranked, is also included in the chart and considered by the Board.
Annual Report
Advisor Japan Fund
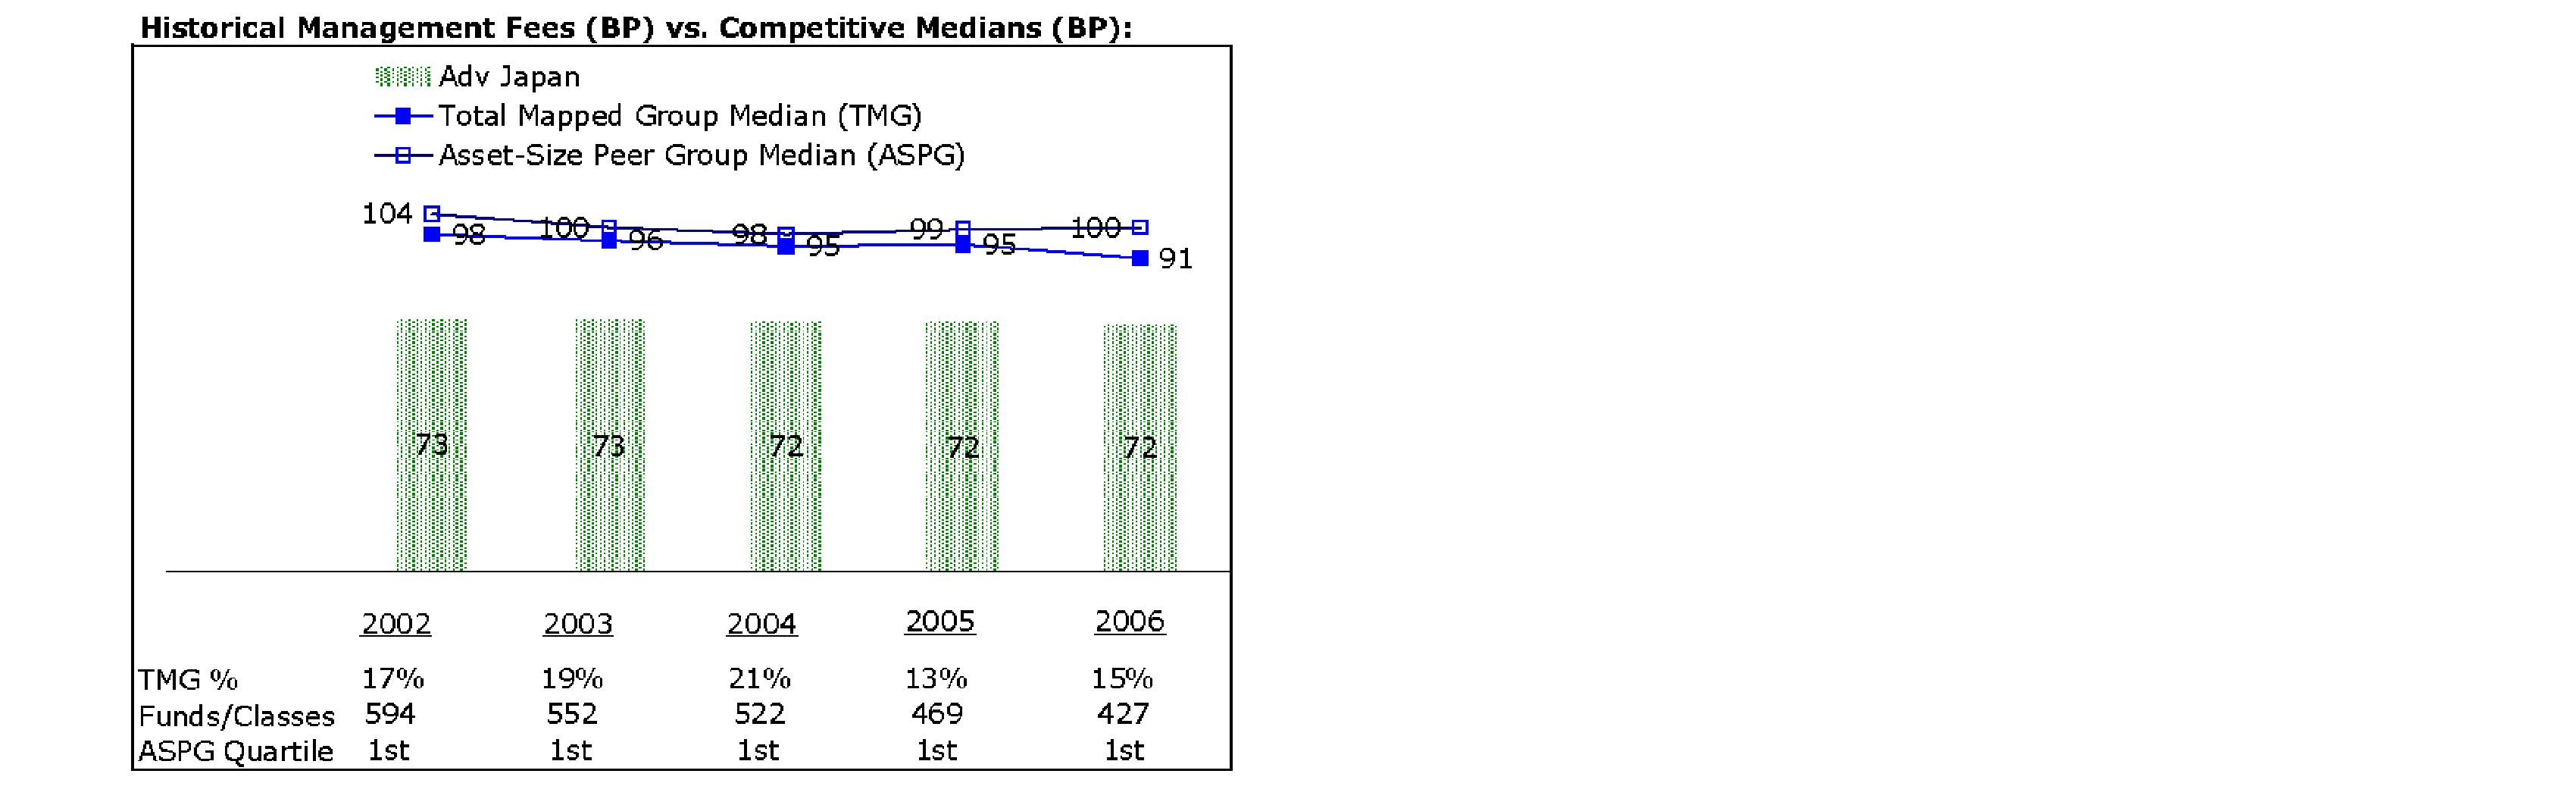
The Board noted that the fund's management fee ranked below the median of its Total Mapped Group and below the median of its ASPG for 2006.
Furthermore, the Board considered that, on December 14, 2006, it had approved an amended management contract for the fund that, if approved by shareholders, will add a performance adjustment component to the management fee paid by the fund (that is, the fund's management fee will be subject to upward or downward adjustment depending upon whether, and to what extent, the fund's investment performance for the performance period exceeds, or is exceeded by, the record (over the same period) of a Board-approved performance adjustment index).
Based on its review, the Board concluded that the fund's management fee was fair and reasonable in light of the services that the fund receives and the other factors considered.
In its review of each class's total expenses, the Board considered the fund's management fee as well as other fund or class expenses, as applicable, such as transfer agent fees, pricing and bookkeeping fees, fund-paid 12b-1 fees, and custodial, legal, and audit fees. The Board also noted the effects of any waivers and reimbursements on fees and expenses. As part of its review, the Board also considered current and historical total expenses of each class of the fund compared to competitive fund median expenses. Each class of the fund is compared to those funds and classes in the Total Mapped Group (used by the Board for management fee comparisons) that have a similar sales load structure.
The Board noted that the total expenses of each of Class A, Class C, and Institutional Class ranked below its competitive median for 2006, the total expenses of Class B ranked equal to its competitive median for 2006, and the total expenses of Class T ranked above its competitive median for 2006. The Board noted that the fund offers multiple classes, each of which has a different sales load and 12b-1 fee structure, and that the multiple structures are intended to offer a range of pricing options for the intermediary market. The Board also noted that the total expenses of the classes vary primarily by the level of their 12b-1 fees, although differences in transfer agent fees may also cause expenses to vary from class to class.
Annual Report
Board Approval of Investment Advisory Contracts and
Management Fees - continued
In its review of total expenses, the Board also considered Fidelity fee structures and other information on clients that FMR and its affiliates service in other competitive markets, such as other mutual funds advised or subadvised by FMR or its affiliates, pension plan clients, and other institutional clients.
Based on its review, the Board concluded that the total expenses of each class of the fund were reasonable, although in one case above the median of the universe presented for comparison, in light of the services that the fund and its shareholders receive and the other factors considered.
Costs of the Services and Profitability. The Board considered the revenues earned and the expenses incurred by Fidelity in conducting the business of developing, marketing, distributing, managing, administering and servicing the fund and its shareholders. The Board also considered the level of Fidelity's profits in respect of all the Fidelity funds.
On an annual basis, FMR presents to the Board Fidelity's profitability for the fund. Fidelity calculates the profitability for each fund, as well as aggregate profitability for groups of Fidelity funds and all Fidelity funds, using a series of detailed revenue and cost allocation methodologies which originate with the audited books and records of Fidelity. The Audit Committee of the Board reviews any significant changes from the prior year's methodologies.
PricewaterhouseCoopers LLP (PwC), independent registered public accounting firm and auditor to Fidelity and certain Fidelity funds, has been engaged annually by the Board as part of the Board's assessment of the results of Fidelity's profitability analysis. PwC's engagement includes the review and assessment of Fidelity's methodologies used in determining the revenues and expenses attributable to Fidelity's mutual fund business, and completion of agreed-upon procedures surrounding the mathematical accuracy of fund profitability and its conformity to allocation methodologies. After considering PwC's reports issued under the engagement and information provided by Fidelity, the Board believes that while other allocation methods may also be reasonable, Fidelity's profitability methodologies are reasonable in all material respects.
The Board has also reviewed Fidelity's non-fund businesses and any fall-out benefits related to the mutual fund business as well as cases where Fidelity's affiliates may benefit from or be related to the fund's business.
Annual Report
The Board considered the costs of the services provided by and the profits realized by Fidelity in connection with the operation of the fund and determined that the amount of profit is a fair entrepreneurial profit for the management of the fund.
Economies of Scale. The Board considered whether there have been economies of scale in respect of the management of the Fidelity funds, whether the Fidelity funds (including the fund) have appropriately benefited from any such economies of scale, and whether there is potential for realization of any further economies of scale. The Board considered the extent to which the fund will benefit from economies of scale through increased services to the fund, through waivers or reimbursements, or through fee or expense reductions, including reductions that occur through operation of the transfer agent agreement. The transfer agent fee varies in part based on the number of accounts in the fund. If the number of accounts decreases or the average account size increases, the overall transfer agent fee rate decreases.
The Board recognized that the fund's management contract incorporates a "group fee" structure, which provides for lower group fee rates as total fund assets under FMR's management increase, and for higher group fee rates as total fund assets under FMR's management decrease. FMR determines the group fee rates based on a tiered asset "breakpoint" schedule. In connection with the renewal of the fund's management contract, the Board approved amendments to the fund's management contract that added four new fee breakpoints to the group fee rate schedule for assets under FMR's management above $1,386 billion. The Board considered that the group fee rate declines under both the present and amended schedules, but that under the amended schedule, the group fee rate declines faster as assets under FMR's management exceed $1,386 billion. The Board considered that the group fee is designed to deliver the benefits of economies of scale to fund shareholders when total fund assets increase, even if assets of any particular fund are unchanged or have declined, because some portion of Fidelity's costs are attributable to services provided to all Fidelity funds, and all funds benefit if those costs can be allocated among more assets. The Board concluded that, given the group fee structure, fund shareholders will achieve a certain level of economies of scale as assets under FMR's management increase at the fund complex level, regardless of whether Fidelity achieves any such economies of scale.
The Board further concluded that any potential economies of scale are being shared between fund shareholders and Fidelity in an appropriate manner.
Additional Information Requested by the Board. In order to develop fully the factual basis for consideration of the Fidelity funds' Advisory Contracts, the Board requested and received additional information on several topics, including (i) fund performance trends and actions to be taken by FMR to improve certain funds' overall performance; (ii) Fidelity's portfolio manager compensation structure, including its effects on fund profitability and the extent to which portfolio manager compensation is linked to fund performance; (iii) Fidelity's fee structures; (iv) the funds' sub-advisory arrangements; and (v) accounts managed by Fidelity other than the Fidelity funds.
Annual Report
Board Approval of Investment Advisory Contracts and
Management Fees - continued
Based on its evaluation of all of the conclusions noted above, and after considering all material factors, the Board ultimately concluded that the advisory fee structures are fair and reasonable, and that the fund's Advisory Contracts should be renewed.
Annual Report
Annual Report
Annual Report
Annual Report
Investment Adviser
Fidelity Management & Research Company
Boston, MA
Investment Sub-Advisers
FMR Co., Inc.
Fidelity Management & Research
(U.K.) Inc.
Fidelity Research & Analysis Company
Fidelity International
Investment Advisors
Fidelity Investments Japan Limited
Fidelity International Investment Advisors (U.K.) Limited
General Distributor
Fidelity Distributors Corporation
Boston, MA
Transfer and Service Agents
Fidelity Investments Institutional Operations Company, Inc.
Boston, MA
Fidelity Service Company, Inc.
Boston, MA
Custodian
State Street Bank and Trust Company
Quincy, MA
AJAF-UANN-1207
1.784756.104
(Fidelity Investment logo)(registered trademark)
(Fidelity Investment logo)(registered trademark)
Fidelity® Advisor
Japan
Fund - Institutional Class
Annual Report
October 31, 2007
(2_fidelity_logos) (Registered_Trademark)
Contents
Chairman's Message | <Click Here> | Ned Johnson's message to shareholders. |
Note to Shareholders | <Click Here> | An explanation of the changes to the fund. |
Performance | <Click Here> | How the fund has done over time. |
Management's Discussion | <Click Here> | The manager's review of fund performance, strategy and outlook. |
Shareholder Expense Example | <Click Here> | An example of shareholder expenses. |
Investment Changes | <Click Here> | A summary of major shifts in the fund's investments over the past six months. |
Investments | <Click Here> | A complete list of the fund's investments with their market values. |
Financial Statements | <Click Here> | Statements of assets and liabilities, operations, and changes in net assets,
as well as financial highlights. |
Notes | <Click Here> | Notes to the financial statements. |
Report of Independent Registered Public Accounting Firm | <Click Here> | |
Trustees and Officers | <Click Here> | |
Distributions | <Click Here> | |
Proxy Voting Results | <Click Here> | |
Board Approval of Investment Advisory Contracts and Management Fees | <Click Here> | |
To view a fund's proxy voting guidelines and proxy voting record for the 12-month period ended June 30, visit http://www.fidelity.com (search for "proxy voting guidelines") or visit the Securities and Exchange Commission's (SEC) web site at http://www.sec.gov. You may also call 1-877-208-0098 to request a free copy of the proxy voting guidelines.
Standard & Poor's, S&P and S&P 500 are registered service marks of The McGraw-Hill Companies, Inc. and have been licensed for use by Fidelity Distributors Corporation.
Other third party marks appearing herein are the property of their respective owners.
All other marks appearing herein are registered or unregistered trademarks or service marks of FMR LLC or an affiliated company.
Annual Report
This report and the financial statements contained herein are submitted for the general information of the shareholders of the fund. This report is not authorized for distribution to prospective investors in the fund unless preceded or accompanied by an effective prospectus.
A fund files its complete schedule of portfolio holdings with the SEC for the first and third quarters of each fiscal year on Form N-Q. Forms N-Q are available on the SEC's web site at http://www.sec.gov. A fund's Forms N-Q may be reviewed and copied at the SEC's Public Reference Room in Washington, DC. Information regarding the operation of the SEC's Public Reference Room may be obtained by calling 1-800-SEC-0330. For a complete list of a fund's portfolio holdings, view the most recent holdings listing, semiannual report, or annual report on Fidelity's web site at http://www.fidelity.com or http://www.advisor.fidelity.com, as applicable.
NOT FDIC INSURED · MAY LOSE VALUE · NO BANK GUARANTEE
Neither the fund nor Fidelity Distributors Corporation is a bank.
Annual Report
Chairman's Message
(photo_of_Edward_C_Johnson_3d)
Dear Shareholder:
Many stock and bond markets around the world have been unsettled of late; however, volatility can often lead to opportunity for patient investors. Financial markets are always unpredictable, but there are a number of time-tested principles that can put the historical odds in your favor.
One of the basic tenets is to invest for the long term. Over time, riding out the markets' inevitable ups and downs has proven much more effective than selling into panic or chasing the hottest trend. Even missing only a few of the markets' best days can significantly diminish investor returns. Patience also affords the benefits of compounding - of earning interest on additional income or reinvested dividends and capital gains. There are tax advantages and cost benefits to consider as well. The more you sell, the more taxes you pay, and the more you trade, the higher the costs. While staying the course doesn't eliminate risk, it can considerably lessen the effect of short-term declines.
You can further manage your investing risk through diversification. And today, more than ever, geographic diversification should be taken into account. Studies indicate that asset allocation is the single most important determinant of a portfolio's long-term success. The right mix of stocks, bonds and cash - aligned to your particular risk tolerance and investment objective - is very important. Age-appropriate rebalancing is also an essential aspect of asset allocation. For younger investors, an emphasis on equities - which historically have been the best-performing asset class over time - is encouraged. As investors near their specific goal, such as retirement or sending a child to college, consideration may be given to replacing volatile assets (e.g. common stocks) with more-stable fixed investments (bonds or savings plans).
A third investment principle - investing regularly - can help lower the average cost of your purchases. Investing a certain amount of money each month or quarter helps ensure you won't pay for all your shares at market highs. This strategy - known as dollar cost averaging - also reduces unconstructive "emotion" from investing, helping shareholders avoid selling weak performers just prior to an upswing, or chasing a hot performer just before a correction.
We invite you to contact us via the Internet, through our Investor Centers or over the phone. It is our privilege to provide you the information you need to make the investments that are right for you.
Sincerely,
/s/Edward C. Johnson 3d
Edward C. Johnson 3d
Annual Report
Note to Shareholders:
On September 19, 2007, shareholders of Fidelity® Advisor Japan Fund approved a new management contract for the fund, effective October 1, 2007, which adds a performance adjustment component to the management fee based on the fund's performance versus the Tokyo Stock Exchange Stock Price Index (TOPIX). The new contract also allows the Board of Trustees to designate an alternate performance adjustment index in the future, without a shareholder vote, when permitted by applicable law.
Annual Report
Performance: The Bottom Line
Average annual total return reflects the change in the value of an investment, assuming reinvestment of the class' dividend income and capital gains (the profits earned upon the sale of securities that have grown in value) and assuming a constant rate of performance each year. The $10,000 table and the fund's returns do not reflect the deduction of taxes that a shareholder would pay on fund distributions or the redemption of fund shares. During periods of reimbursement by Fidelity, a fund's total return will be greater than it would be had the reimbursement not occurred. How a fund did yesterday is no guarantee of how it will do tomorrow.
Average Annual Total Returns
Periods ended October 31, 2007 | Past 1
year | Past 5
years | Life of
fund A |
Institutional Class | -1.64% | 13.78% | 7.25% |
A From December 17, 1998.
$10,000 Over Life of Fund
Let's say hypothetically that $10,000 was invested in Fidelity Advisor Japan Fund - Institutional Class on December 17, 1998, when the fund started. The chart shows how the value of your investment would have changed, and also shows how the Tokyo Stock Exchange Stock Price Index (TOPIX) performed over the same period.
Annual Report
Management's Discussion of Fund Performance
Comments from Robert Rowland, who became Portfolio Manager of Fidelity® Advisor Japan Fund on September 3, 2007.
Despite opening with a four-month winning streak, the Japanese stock market - as measured by the Tokyo Stock Exchange Stock Price Index (TOPIX) - gained only 3.07% for the 12-month period ending October 31, 2007, a relatively meager result compared with much of the rest of the world. Japanese equities faced a number of head winds during the past year. Although an appreciation of the yen later in the period provided a small boost in returns for U.S. investors, it also increased prices of Japanese exports, raising fears that reduced demand for Japanese products would dampen economic growth. Meanwhile, concerns that Japanese financial institutions would become embroiled in the U.S. subprime mortgage crisis contributed to a nearly 15% decline in the financials sector of the TOPIX, the benchmark's largest component. The political backdrop was a distraction as well, particularly after Prime Minister Abe abruptly resigned from office in September. On the positive side, the business environment in Japan continued to improve in the form of corporate governance reforms, but economic growth remained anemic amid weaker-than-expected corporate spending.
During the past year, the fund's Institutional Class shares returned -1.64%, trailing the TOPIX. Stock selection in consumer discretionary, information technology and consumer staples hurt performance the most versus the index. More broadly, the fund was hampered by its focus on small- and mid-cap stocks, which lagged large-caps. Casio Computer, a maker of digital cameras and other electronic devices, was our biggest detractor. The company's results fell short of its projections due to higher-than-expected research and development expenses. Other detractors included trucking and warehousing services provider Hamakyorex, discount supermarket operator Daikokutenbussan and Telewave, which provides information technology equipment and maintenance services for small companies. Conversely, the fund was aided by a significant underweighting in banks, particularly Mitsubishi UFJ Financial Group, Japan's largest banking group and a major index component. Video-game developer Nintendo was the fund's single largest contributor, its stock boosted by consensus-beating financial results. Shinko Plantech, a small-cap provider of engineering services to the petroleum, chemicals and pharmaceuticals industries, helped as well. Some stocks I mentioned were sold by period end.
The views expressed above reflect those of the portfolio manager(s) only through the end of the period as stated on the cover of this report and do not necessarily represent the views of Fidelity or any other person in the Fidelity organization. Any such views are subject to change at any time based upon market or other conditions and Fidelity disclaims any responsibility to update such views. These views may not be relied on as investment advice and, because investment decisions for a Fidelity fund are based on numerous factors, may not be relied on as an indication of trading intent on behalf of any Fidelity fund.
Annual Report
Shareholder Expense Example
As a shareholder of the Fund, you incur two types of costs: (1) transaction costs, including sales charges (loads) on purchase payments or redemption proceeds, redemption fees, and (2) ongoing costs, including management fees, distribution and/or service (12b-1) fees and other Fund expenses. This Example is intended to help you understand your ongoing costs (in dollars) of investing in the Fund and to compare these costs with the ongoing costs of investing in other mutual funds.
The Example is based on an investment of $1,000 invested at the beginning of the period and held for the entire period (May 1, 2007 to October 31, 2007).
Actual Expenses
The first line of the accompanying table for each class of the Fund provides information about actual account values and actual expenses. You may use the information in this line, together with the amount you invested, to estimate the expenses that you paid over the period. Simply divide your account value by $1,000.00 (for example, an $8,600 account value divided by $1,000.00 = 8.6), then multiply the result by the number in the first line for a class of the Fund under the heading entitled "Expenses Paid During Period" to estimate the expenses you paid on your account during this period. In addition, the Fund, as a shareholder in the underlying Fidelity Central Funds, will indirectly bear its pro rata share of the fees and expenses incurred by the underlying Fidelity Central Funds. These fees and expenses are not included in the Fund's annualized expense ratio used to calculate the expense estimate in the table below.
Hypothetical Example for Comparison Purposes
The second line of the accompanying table for each class of the Fund provides information about hypothetical account values and hypothetical expenses based on a Class' actual expense ratio and an assumed rate of return of 5% per year before expenses, which is not the Class' actual return. The hypothetical account values and expenses may not be used to estimate the actual ending account balance or expenses you paid for the period. You may use this information to compare the ongoing costs of investing in the Fund and other funds. To do so, compare this 5% hypothetical example with the 5% hypothetical examples that appear in the shareholder reports of the other funds. In addition, the Fund, as a shareholder in the underlying Fidelity Central Funds, will indirectly bear its pro rata share of the fees and expenses incurred by the underlying Fidelity Central Funds. These fees and expenses are not included in the Fund's annualized expense ratio used to calculate the expense estimate in the table below.
Please note that the expenses shown in the table are meant to highlight your ongoing costs only and do not reflect any transaction costs. Therefore, the second line of the table is useful in comparing ongoing costs only, and will not help you determine the relative total costs of owning different funds. In addition, if these transactional costs were included, your costs would have been higher.
Annual Report
| Beginning
Account Value
May 1, 2007 | Ending
Account Value
October 31, 2007 | Expenses Paid
During Period*
May 1, 2007
to October 31, 2007 |
Class A | | | |
Actual | $ 1,000.00 | $ 985.60 | $ 7.51 |
HypotheticalA | $ 1,000.00 | $ 1,017.64 | $ 7.63 |
Class T | | | |
Actual | $ 1,000.00 | $ 984.10 | $ 8.75 |
HypotheticalA | $ 1,000.00 | $ 1,016.38 | $ 8.89 |
Class B | | | |
Actual | $ 1,000.00 | $ 982.30 | $ 11.24 |
HypotheticalA | $ 1,000.00 | $ 1,013.86 | $ 11.42 |
Class C | | | |
Actual | $ 1,000.00 | $ 982.40 | $ 11.24 |
HypotheticalA | $ 1,000.00 | $ 1,013.86 | $ 11.42 |
Institutional Class | | | |
Actual | $ 1,000.00 | $ 986.50 | $ 6.26 |
HypotheticalA | $ 1,000.00 | $ 1,018.90 | $ 6.36 |
A 5% return per year before expenses
* Expenses are equal to each Class' annualized expense ratio (shown in the table below); multiplied by the average account value over the period, multiplied by 184/365 (to reflect the one-half year period).
| Annualized
Expense Ratio |
Class A | 1.50% |
Class T | 1.75% |
Class B | 2.25% |
Class C | 2.25% |
Institutional Class | 1.25% |
Annual Report
Investment Changes
Top Ten Stocks as of October 31, 2007 |
| % of fund's
net assets | % of fund's net assets
6 months ago |
Toyota Motor Corp. | 7.5 | 3.9 |
Canon, Inc. | 3.9 | 1.9 |
Honda Motor Co. Ltd. | 3.6 | 0.0 |
Mitsui & Co. Ltd. | 3.2 | 1.0 |
Mizuho Financial Group, Inc. | 3.2 | 2.0 |
Sumitomo Corp. | 2.6 | 1.0 |
Nintendo Co. Ltd. | 2.5 | 2.2 |
Sumitomo Mitsui Financial Group, Inc. | 2.3 | 0.0 |
Nippon Electric Glass Co. Ltd. | 2.3 | 1.1 |
Mitsubishi Corp. | 2.2 | 0.0 |
| 33.3 | |
Top Five Market Sectors as of October 31, 2007 |
| % of fund's
net assets | % of fund's net assets
6 months ago |
Industrials | 26.5 | 17.9 |
Consumer Discretionary | 21.6 | 26.0 |
Financials | 19.2 | 19.4 |
Information Technology | 17.6 | 11.7 |
Materials | 8.0 | 13.6 |
Asset Allocation (% of fund's net assets) |
As of October 31, 2007 | As of April 30, 2007 |
| Stocks 98.1% | | | Stocks 99.9% | |
| Short-Term
Investments and
Net Other Assets 1.9% | | | Short-Term
Investments and
Net Other Assets 0.1% | |

Annual Report
Investments October 31, 2007
Showing Percentage of Net Assets
Common Stocks - 98.1% |
| Shares | | Value |
CONSUMER DISCRETIONARY - 21.6% |
Auto Components - 4.7% |
Bridgestone Corp. | 27,600 | | $ 611,080 |
Denso Corp. | 36,000 | | 1,462,820 |
NGK Spark Plug Co. Ltd. | 22,000 | | 370,221 |
NHK Spring Co. Ltd. | 43,000 | | 369,364 |
Stanley Electric Co. Ltd. | 66,700 | | 1,483,671 |
Toyoda Gosei Co. Ltd. | 7,800 | | 280,233 |
| | 4,577,389 |
Automobiles - 12.3% |
Honda Motor Co. Ltd. | 95,100 | | 3,559,593 |
Isuzu Motors Ltd. | 78,000 | | 388,938 |
Toyota Motor Corp. | 127,200 | | 7,278,386 |
Yamaha Motor Co. Ltd. | 25,900 | | 739,749 |
| | 11,966,666 |
Household Durables - 1.9% |
Casio Computer Co. Ltd. | 74,200 | | 699,783 |
Haseko Corp. (a) | 472,000 | | 1,137,130 |
| | 1,836,913 |
Media - 0.6% |
Fuji Television Network, Inc. | 284 | | 573,663 |
Multiline Retail - 0.8% |
Marui Group Co. Ltd. | 38,600 | | 400,501 |
Mitsukoshi Ltd. | 94,000 | | 435,723 |
| | 836,224 |
Specialty Retail - 1.3% |
Yamada Denki Co. Ltd. | 12,150 | | 1,252,965 |
TOTAL CONSUMER DISCRETIONARY | | 21,043,820 |
CONSUMER STAPLES - 0.9% |
Food & Staples Retailing - 0.9% |
Aeon Co. Ltd. | 48,800 | | 768,347 |
Itochushokuhin Co. Ltd. | 2,800 | | 77,789 |
| | 846,136 |
FINANCIALS - 19.2% |
Capital Markets - 3.0% |
Daiwa Securities Group, Inc. | 45,000 | | 433,761 |
Common Stocks - continued |
| Shares | | Value |
FINANCIALS - continued |
Capital Markets - continued |
Matsui Securities Co. Ltd. (d) | 120,000 | | $ 953,658 |
Nomura Holdings, Inc. | 85,900 | | 1,531,597 |
| | 2,919,016 |
Commercial Banks - 8.4% |
Chiba Bank Ltd. | 27,000 | | 216,756 |
Mitsubishi UFJ Financial Group, Inc. | 133,900 | | 1,333,644 |
Mizuho Financial Group, Inc. | 558 | | 3,136,888 |
Sumitomo Mitsui Financial Group, Inc. | 273 | | 2,236,716 |
Sumitomo Trust & Banking Co. Ltd. | 167,000 | | 1,245,422 |
| | 8,169,426 |
Consumer Finance - 1.0% |
Credit Saison Co. Ltd. | 30,800 | | 982,317 |
Insurance - 2.3% |
Millea Holdings, Inc. | 16,400 | | 643,864 |
T&D Holdings, Inc. | 25,950 | | 1,562,170 |
| | 2,206,034 |
Real Estate Management & Development - 4.5% |
Leopalace21 Corp. | 51,900 | | 1,657,158 |
Mitsubishi Estate Co. Ltd. | 49,000 | | 1,469,254 |
Mitsui Fudosan Co. Ltd. | 18,000 | | 498,060 |
Tokyo Tatemono Co. Ltd. | 35,000 | | 450,378 |
Tokyu Land Corp. | 36,000 | | 373,046 |
| | 4,447,896 |
TOTAL FINANCIALS | | 18,724,689 |
HEALTH CARE - 2.2% |
Pharmaceuticals - 2.2% |
Daiichi Sankyo Co. Ltd. | 14,200 | | 403,907 |
Takeda Pharmaceutical Co. Ltd. | 27,600 | | 1,724,393 |
| | 2,128,300 |
INDUSTRIALS - 26.5% |
Building Products - 1.6% |
Asahi Glass Co. Ltd. | 114,000 | | 1,570,319 |
Commercial Services & Supplies - 0.5% |
Dai Nippon Printing Co. Ltd. | 33,000 | | 479,151 |
Common Stocks - continued |
| Shares | | Value |
INDUSTRIALS - continued |
Construction & Engineering - 1.0% |
Asunaro Aoki Construction Co. Ltd. | 6,000 | | $ 35,388 |
JGC Corp. | 49,000 | | 981,479 |
| | 1,016,867 |
Electrical Equipment - 3.9% |
Mitsubishi Electric Corp. | 140,000 | | 1,707,234 |
Sumitomo Electric Industries Ltd. | 127,900 | | 2,071,186 |
| | 3,778,420 |
Machinery - 9.8% |
Fanuc Ltd. | 6,100 | | 668,824 |
Kubota Corp. | 196,000 | | 1,645,850 |
Mitsubishi Heavy Industries Ltd. | 162,000 | | 943,661 |
NGK Insulators Ltd. | 25,000 | | 886,469 |
Nittoku Engineering Co. Ltd. | 52,100 | | 336,014 |
NSK Ltd. | 153,000 | | 1,356,827 |
OSG Corp. | 29,900 | | 378,336 |
SMC Corp. | 5,900 | | 790,491 |
Sumitomo Heavy Industries Ltd. | 64,000 | | 845,677 |
THK Co. Ltd. | 38,900 | | 857,994 |
Toshiba Machine Co. Ltd. | 108,000 | | 825,086 |
| | 9,535,229 |
Road & Rail - 0.8% |
East Japan Railway Co. | 96 | | 790,959 |
Trading Companies & Distributors - 8.0% |
Mitsubishi Corp. | 67,700 | | 2,108,322 |
Mitsui & Co. Ltd. | 122,000 | | 3,165,130 |
Sumitomo Corp. | 147,100 | | 2,563,613 |
| | 7,837,065 |
Transportation Infrastructure - 0.9% |
Mitsui-Soko Co. Ltd. | 44,000 | | 212,039 |
The Sumitomo Warehouse Co. Ltd. | 109,000 | | 628,194 |
| | 840,233 |
TOTAL INDUSTRIALS | | 25,848,243 |
INFORMATION TECHNOLOGY - 17.6% |
Electronic Equipment & Instruments - 7.8% |
Citizen Holdings Co. Ltd. | 17,800 | | 191,794 |
Dainippon Screen Manufacturing Co. Ltd. | 201,000 | | 1,195,278 |
Kyocera Corp. | 5,000 | | 427,400 |
Common Stocks - continued |
| Shares | | Value |
INFORMATION TECHNOLOGY - continued |
Electronic Equipment & Instruments - continued |
Murata Manufacturing Co. Ltd. | 9,500 | | $ 578,267 |
Nidec Sankyo Corp. | 67,000 | | 524,128 |
Nippon Electric Glass Co. Ltd. | 130,500 | | 2,218,539 |
Omron Corp. | 16,400 | | 403,442 |
Seikoh Giken Co. Ltd. | 3,000 | | 47,085 |
Shizuki Electric Co., Inc. | 54,000 | | 202,102 |
Yaskawa Electric Corp. | 104,000 | | 1,399,382 |
Yokogawa Electric Corp. | 32,900 | | 414,614 |
| | 7,602,031 |
IT Services - 0.1% |
Nomura Research Institute Ltd. | 3,600 | | 127,278 |
Office Electronics - 5.9% |
Canon, Inc. | 76,100 | | 3,848,377 |
Konica Minolta Holdings, Inc. | 110,000 | | 1,926,031 |
| | 5,774,408 |
Semiconductors & Semiconductor Equipment - 0.8% |
Advantest Corp. | 10,900 | | 316,300 |
Rohm Co. Ltd. | 5,800 | | 508,251 |
| | 824,551 |
Software - 3.0% |
Atlus Co. Ltd. | 95,300 | | 492,730 |
Nintendo Co. Ltd. | 3,800 | | 2,386,400 |
| | 2,879,130 |
TOTAL INFORMATION TECHNOLOGY | | 17,207,398 |
MATERIALS - 8.0% |
Chemicals - 3.1% |
JSR Corp. | 39,900 | | 1,036,261 |
Nitto Denko Corp. | 22,300 | | 1,088,914 |
Shin-Etsu Chemical Co. Ltd. | 5,700 | | 365,712 |
Sumitomo Bakelite Co. Ltd. | 86,000 | | 527,472 |
| | 3,018,359 |
Metals & Mining - 4.9% |
Hitachi Metals Ltd. | 90,000 | | 1,167,777 |
JFE Holdings, Inc. | 17,100 | | 1,001,224 |
Common Stocks - continued |
| Shares | | Value |
MATERIALS - continued |
Metals & Mining - continued |
Nippon Steel Corp. | 140,000 | | $ 930,715 |
Sumitomo Metal Industries Ltd. | 338,000 | | 1,673,331 |
| | 4,773,047 |
TOTAL MATERIALS | | 7,791,406 |
TELECOMMUNICATION SERVICES - 2.1% |
Wireless Telecommunication Services - 2.1% |
KDDI Corp. | 100 | | 755,431 |
NTT DoCoMo, Inc. | 889 | | 1,297,940 |
| | 2,053,371 |
TOTAL COMMON STOCKS (Cost $90,132,514) | 95,643,363 |
Money Market Funds - 2.5% |
| | | |
Fidelity Cash Central Fund, 4.97% (b) | 1,494,043 | | 1,494,043 |
Fidelity Securities Lending Cash Central Fund, 5.02% (b)(c) | 984,000 | | 984,000 |
TOTAL MONEY MARKET FUNDS (Cost $2,478,043) | 2,478,043 |
TOTAL INVESTMENT PORTFOLIO - 100.6% (Cost $92,610,557) | 98,121,406 |
NET OTHER ASSETS - (0.6)% | (602,941) |
NET ASSETS - 100% | $ 97,518,465 |
Legend |
(a) Non-income producing |
(b) Affiliated fund that is available only to investment companies and other accounts managed by Fidelity Investments. The rate quoted is the annualized seven-day yield of the fund at period end. A complete unaudited listing of the fund's holdings as of its most recent quarter end is available upon request. |
(c) Investment made with cash collateral received from securities on loan. |
(d) Security or a portion of the security is on loan at period end. |
Affiliated Central Funds |
Information regarding fiscal year to date income earned by the Fund from investments in Fidelity Central Funds is as follows: |
Fund | Income earned |
Fidelity Cash Central Fund | $ 25,804 |
Fidelity Securities Lending Cash Central Fund | 75,534 |
Total | $ 101,338 |
Income Tax Information |
At October 31, 2007, the fund had a capital loss carryforward of approximately $12,845,430 of which $6,193,464 and $6,651,966 will expire on October 31, 2010 and 2015, respectively. |
See accompanying notes which are an integral part of the financial statements.
Annual Report
Financial Statements
Statement of Assets and Liabilities
| October 31, 2007 |
| | |
Assets | | |
Investment in securities, at value (including securities loaned of $940,800) - See accompanying schedule: Unaffiliated issuers (cost $90,132,514) | $ 95,643,363 | |
Fidelity Central Funds (cost $2,478,043) | 2,478,043 | |
Total Investments (cost $92,610,557) | | $ 98,121,406 |
Receivable for investments sold | | 1,679,897 |
Receivable for fund shares sold | | 457,425 |
Dividends receivable | | 467,382 |
Distributions receivable from Fidelity Central Funds | | 5,408 |
Prepaid expenses | | 72 |
Receivable from investment adviser for expense reductions | | 83,092 |
Other receivables | | 6,747 |
Total assets | | 100,821,429 |
| | |
Liabilities | | |
Payable for investments purchased | $ 1,405,766 | |
Payable for fund shares redeemed | 506,837 | |
Accrued management fee | 57,943 | |
Distribution fees payable | 48,315 | |
Other affiliated payables | 26,286 | |
Other payables and accrued expenses | 273,817 | |
Collateral on securities loaned, at value | 984,000 | |
Total liabilities | | 3,302,964 |
| | |
Net Assets | | $ 97,518,465 |
Net Assets consist of: | | |
Paid in capital | | $ 105,281,477 |
Accumulated undistributed net realized gain (loss) on investments and foreign currency transactions | | (13,271,558) |
Net unrealized appreciation (depreciation) on investments and assets and liabilities in foreign currencies | | 5,508,546 |
Net Assets | | $ 97,518,465 |
See accompanying notes which are an integral part of the financial statements.
Annual Report
Financial Statements - continued
Statement of Assets and Liabilities - continued
| October 31, 2007 |
| | |
Calculation of Maximum Offering Price Class A:
Net Asset Value and redemption price per share
($32,945,326 ÷ 2,007,846 shares) | | $ 16.41 |
| | |
Maximum offering price per share (100/94.25 of $16.41) | | $ 17.41 |
Class T:
Net Asset Value and redemption price per share ($14,303,251 ÷ 887,724 shares) | | $ 16.11 |
| | |
Maximum offering price per share (100/96.50 of $16.11) | | $ 16.69 |
Class B:
Net Asset Value and offering price per share ($7,873,572 ÷ 508,006 shares)A | | $ 15.50 |
| | |
Class C:
Net Asset Value and offering price per share ($33,956,666 ÷ 2,176,952 shares)A | | $ 15.60 |
| | |
| | |
Institutional Class:
Net Asset Value, offering price and redemption price per share ($8,439,650 ÷ 501,632 shares) | | $ 16.82 |
A Redemption price per share is equal to net asset value less any applicable contingent deferred sales charge.
See accompanying notes which are an integral part of the financial statements.
Annual Report
Statement of Operations
| Year ended October 31, 2007 |
| | |
Investment Income | | |
Dividends | | $ 1,538,911 |
Interest | | 31 |
Income from Fidelity Central Funds | | 101,338 |
| | 1,640,280 |
Less foreign taxes withheld | | (109,603) |
Total income | | 1,530,677 |
| | |
Expenses | | |
Management fee | $ 861,457 | |
Transfer agent fees | 329,828 | |
Distribution fees | 733,568 | |
Accounting and security lending fees | 77,564 | |
Custodian fees and expenses | 94,801 | |
Independent trustees' compensation | 430 | |
Registration fees | 62,162 | |
Audit | 50,473 | |
Legal | 801 | |
Proxy fee | 224,904 | |
Miscellaneous | 1,163 | |
Total expenses before reductions | 2,437,151 | |
Expense reductions | (214,489) | 2,222,662 |
Net investment income (loss) | | (691,985) |
Realized and Unrealized Gain (Loss) Net realized gain (loss) on: | | |
Investment securities: | | |
Unaffiliated issuers | (5,161,947) | |
Foreign currency transactions | 1,051 | |
Total net realized gain (loss) | | (5,160,896) |
Change in net unrealized appreciation (depreciation) on: Investment securities | 3,044,244 | |
Assets and liabilities in foreign currencies | 4,697 | |
Total change in net unrealized appreciation (depreciation) | | 3,048,941 |
Net gain (loss) | | (2,111,955) |
Net increase (decrease) in net assets resulting from operations | | $ (2,803,940) |
See accompanying notes which are an integral part of the financial statements.
Annual Report
Financial Statements - continued
Statement of Changes in Net Assets
| Year ended
October 31,
2007 | Year ended
October 31,
2006 |
Increase (Decrease) in Net Assets | | |
Operations | | |
Net investment income (loss) | $ (691,985) | $ (1,237,948) |
Net realized gain (loss) | (5,160,896) | 14,734,526 |
Change in net unrealized appreciation (depreciation) | 3,048,941 | (11,088,654) |
Net increase (decrease) in net assets resulting
from operations | (2,803,940) | 2,407,924 |
Share transactions - net increase (decrease) | (46,358,208) | 40,871,973 |
Redemption fees | 26,649 | 135,732 |
Total increase (decrease) in net assets | (49,135,499) | 43,415,629 |
| | |
Net Assets | | |
Beginning of period | 146,653,964 | 103,238,335 |
End of period | $ 97,518,465 | $ 146,653,964 |
See accompanying notes which are an integral part of the financial statements.
Annual Report
Financial Highlights - Class A
| | | | | |
Years ended October 31, | 2007 | 2006 | 2005 | 2004 | 2003 |
Selected Per-Share Data | | | | | |
Net asset value, beginning of period | $ 16.72 | $ 15.61 | $ 12.64 | $ 11.78 | $ 8.74 |
Income from Investment Operations | | | | | |
Net investment income (loss) C | (.04) | (.07) | (.08) | (.11) | (.07) |
Net realized and unrealized gain (loss) | (.27) | 1.17 | 3.04 | .95 | 3.11 |
Total from investment operations | (.31) | 1.10 | 2.96 | .84 | 3.04 |
Redemption fees added to paid in capital C | - G | .01 | .01 | .02 | - |
Net asset value, end of period | $ 16.41 | $ 16.72 | $ 15.61 | $ 12.64 | $ 11.78 |
Total Return A, B | (1.85)% | 7.11% | 23.50% | 7.30% | 34.78% |
Ratios to Average Net Assets D, F | | | | | |
Expenses before reductions | 1.70% | 1.52% | 1.62% | 1.80% | 2.20% |
Expenses net of fee waivers, if any | 1.50% | 1.50% | 1.56% | 1.75% | 1.75% |
Expenses net of all reductions | 1.48% | 1.48% | 1.55% | 1.75% | 1.75% |
Net investment income (loss) | (.22)% | (.42)% | (.54)% | (.89)% | (.76)% |
Supplemental Data | | | | | |
Net assets, end of period (000 omitted) | $ 32,945 | $ 41,876 | $ 26,169 | $ 17,884 | $ 8,695 |
Portfolio turnover rate E | 138% | 83% | 89% | 83% | 99% |
A Total returns would have been lower had certain expenses not been reduced during the periods shown.
B Total returns do not include the effect of the sales charges.
C Calculated based on average shares outstanding during the period.
D Fees and expenses of the underlying Fidelity Central Funds are not included in the Fund's expense ratio. The Fund indirectly bears its proportionate share of the expenses of any underlying Fidelity Central Funds.
E Amount does not include the portfolio activity of any underlying Fidelity Central Funds.
F Expense ratios reflect operating expenses of the class. Expenses before reductions do not reflect amounts reimbursed by the investment adviser or reductions from brokerage service arrangements or other expense offset arrangements and do not represent the amount paid by the class during periods when reimbursements or reductions occur. Expenses net of fee waivers reflect expenses after reimbursement by the investment adviser but prior to reductions from brokerage service arrangements or other expense offset arrangements. Expenses net of all reductions represent the net expenses paid by the class.
G Amount represents less than $.01 per share.
See accompanying notes which are an integral part of the financial statements.
Annual Report
Financial Highlights - Class T
|
| | | | |
Years ended October 31, | 2007 | 2006 | 2005 | 2004 | 2003 |
Selected Per-Share Data | | | | | |
Net asset value, beginning of period | $ 16.46 | $ 15.41 | $ 12.51 | $ 11.68 | $ 8.69 |
Income from Investment Operations | | | | | |
Net investment income (loss) C | (.08) | (.12) | (.11) | (.14) | (.09) |
Net realized and unrealized gain (loss) | (.27) | 1.16 | 3.00 | .95 | 3.08 |
Total from investment operations | (.35) | 1.04 | 2.89 | .81 | 2.99 |
Redemption fees added to paid in capital C | - G | .01 | .01 | .02 | - |
Net asset value, end of period | $ 16.11 | $ 16.46 | $ 15.41 | $ 12.51 | $ 11.68 |
Total Return A, B | (2.13)% | 6.81% | 23.18% | 7.11% | 34.41% |
Ratios to Average Net Assets D, F | | | | | |
Expenses before reductions | 1.96% | 1.82% | 1.97% | 2.19% | 2.57% |
Expenses net of fee waivers, if any | 1.75% | 1.75% | 1.81% | 2.00% | 2.00% |
Expenses net of all reductions | 1.73% | 1.73% | 1.80% | 2.00% | 2.00% |
Net investment income (loss) | (.47)% | (.67)% | (.79)% | (1.14)% | (1.01)% |
Supplemental Data | | | | | |
Net assets, end of period (000 omitted) | $ 14,303 | $ 21,039 | $ 15,610 | $ 11,493 | $ 11,823 |
Portfolio turnover rate E | 138% | 83% | 89% | 83% | 99% |
A Total returns would have been lower had certain expenses not been reduced during the periods shown.
B Total returns do not include the effect of the sales charges.
C Calculated based on average shares outstanding during the period.
D Fees and expenses of the underlying Fidelity Central Funds are not included in the Fund's expense ratio. The Fund indirectly bears its proportionate share of the expenses of any underlying Fidelity Central Funds.
E Amount does not include the portfolio activity of any underlying Fidelity Central Funds.
F Expense ratios reflect operating expenses of the class. Expenses before reductions do not reflect amounts reimbursed by the investment adviser or reductions from brokerage service arrangements or other expense offset arrangements and do not represent the amount paid by the class during periods when reimbursements or reductions occur. Expenses net of fee waivers reflect expenses after reimbursement by the investment adviser but prior to reductions from brokerage service arrangements or other expense offset arrangements. Expenses net of all reductions represent the net expenses paid by the class.
G Amount represents less than $.01 per share.
See accompanying notes which are an integral part of the financial statements.
Annual Report
Financial Highlights - Class B
|
| | | | |
Years ended October 31, | 2007 | 2006 | 2005 | 2004 | 2003 |
Selected Per-Share Data | | | | | |
Net asset value, beginning of period | $ 15.91 | $ 14.96 | $ 12.21 | $ 11.46 | $ 8.57 |
Income from Investment Operations | | | | | |
Net investment income (loss) C | (.15) | (.20) | (.17) | (.20) | (.14) |
Net realized and unrealized gain (loss) | (.26) | 1.14 | 2.91 | .93 | 3.03 |
Total from investment operations | (.41) | .94 | 2.74 | .73 | 2.89 |
Redemption fees added to paid in capital C | - G | .01 | .01 | .02 | - |
Net asset value, end of period | $ 15.50 | $ 15.91 | $ 14.96 | $ 12.21 | $ 11.46 |
Total Return A, B | (2.58)% | 6.35% | 22.52% | 6.54% | 33.72% |
Ratios to Average Net Assets D, F | | | | | |
Expenses before reductions | 2.45% | 2.33% | 2.43% | 2.62% | 3.03% |
Expenses net of fee waivers, if any | 2.25% | 2.25% | 2.31% | 2.50% | 2.50% |
Expenses net of all reductions | 2.23% | 2.23% | 2.30% | 2.50% | 2.50% |
Net investment income (loss) | (.97)% | (1.17)% | (1.30)% | (1.64)% | (1.51)% |
Supplemental Data | | | | | |
Net assets, end of period (000 omitted) | $ 7,874 | $ 16,120 | $ 18,916 | $ 18,218 | $ 14,761 |
Portfolio turnover rate E | 138% | 83% | 89% | 83% | 99% |
A Total returns would have been lower had certain expenses not been reduced during the periods shown.
B Total returns do not include the effect of the contingent deferred sales charge.
C Calculated based on average shares outstanding during the period.
D Fees and expenses of the underlying Fidelity Central Funds are not included in the Fund's expense ratio. The Fund indirectly bears its proportionate share of the expenses of any underlying Fidelity Central Funds.
E Amount does not include the portfolio activity of any underlying Fidelity Central Funds.
F Expense ratios reflect operating expenses of the class. Expenses before reductions do not reflect amounts reimbursed by the investment adviser or reductions from brokerage service arrangements or other expense offset arrangements and do not represent the amount paid by the class during periods when reimbursements or reductions occur. Expenses net of fee waivers reflect expenses after reimbursement by the investment adviser but prior to reductions from brokerage service arrangements or other expense offset arrangements. Expenses net of all reductions represent the net expenses paid by the class.
G Amount represents less than $.01 per share.
See accompanying notes which are an integral part of the financial statements.
Annual Report
Financial Highlights - Class C
| | | | | |
Years ended October 31, | 2007 | 2006 | 2005 | 2004 | 2003 |
Selected Per-Share Data | | | | | |
Net asset value, beginning of period | $ 16.01 | $ 15.05 | $ 12.28 | $ 11.52 | $ 8.61 |
Income from Investment Operations | | | | | |
Net investment income (loss) C | (.15) | (.18) | (.17) | (.19) | (.14) |
Net realized and unrealized gain (loss) | (.26) | 1.13 | 2.93 | .93 | 3.05 |
Total from investment operations | (.41) | .95 | 2.76 | .74 | 2.91 |
Redemption fees added to paid in capital C | - G | .01 | .01 | .02 | - |
Net asset value, end of period | $ 15.60 | $ 16.01 | $ 15.05 | $ 12.28 | $ 11.52 |
Total Return A, B | (2.56)% | 6.38% | 22.56% | 6.60% | 33.80% |
Ratios to Average Net Assets D, F | | | | | |
Expenses before reductions | 2.37% | 2.18% | 2.27% | 2.44% | 2.82% |
Expenses net of fee waivers, if any | 2.25% | 2.18% | 2.27% | 2.44% | 2.50% |
Expenses net of all reductions | 2.23% | 2.16% | 2.26% | 2.44% | 2.49% |
Net investment income (loss) | (.97)% | (1.10)% | (1.25)% | (1.58)% | (1.51)% |
Supplemental Data | | | | | |
Net assets, end of period (000 omitted) | $ 33,957 | $ 53,846 | $ 34,144 | $ 21,564 | $ 10,374 |
Portfolio turnover rate E | 138% | 83% | 89% | 83% | 99% |
A Total returns would have been lower had certain expenses not been reduced during the periods shown.
B Total returns do not include the effect of the contingent deferred sales charge.
C Calculated based on average shares outstanding during the period.
D Fees and expenses of the underlying Fidelity Central Funds are not included in the Fund's expense ratio. The Fund indirectly bears its proportionate share of the expenses of any underlying Fidelity Central Funds.
E Amount does not include the portfolio activity of any underlying Fidelity Central Funds.
F Expense ratios reflect operating expenses of the class. Expenses before reductions do not reflect amounts reimbursed by the investment adviser or reductions from brokerage service arrangements or other expense offset arrangements and do not represent the amount paid by the class during periods when reimbursements or reductions occur. Expenses net of fee waivers reflect expenses after reimbursement by the investment adviser but prior to reductions from brokerage service arrangements or other expense offset arrangements. Expenses net of all reductions represent the net expenses paid by the class.
G Amount represents less than $.01 per share.
See accompanying notes which are an integral part of the financial statements.
Annual Report
Financial Highlights - Institutional Class
| | | | | |
Years ended October 31, | 2007 | 2006 | 2005 | 2004 | 2003 |
Selected Per-Share Data | | | | | |
Net asset value, beginning of period | $ 17.10 | $ 15.90 | $ 12.83 | $ 11.91 | $ 8.82 |
Income from Investment Operations | | | | | |
Net investment income (loss) B | .01 | (.01) | (.02) | (.06) | (.05) |
Net realized and unrealized gain (loss) | (.29) | 1.19 | 3.08 | .96 | 3.14 |
Total from investment operations | (.28) | 1.18 | 3.06 | .90 | 3.09 |
Redemption fees added to paid in capital B | - F | .02 | .01 | .02 | - |
Net asset value, end of period | $ 16.82 | $ 17.10 | $ 15.90 | $ 12.83 | $ 11.91 |
Total Return A | (1.64)% | 7.55% | 23.93% | 7.72% | 35.03% |
Ratios to Average Net Assets C, E | | | | | |
Expenses before reductions | 1.31% | 1.12% | 1.19% | 1.36% | 1.67% |
Expenses net of fee waivers, if any | 1.25% | 1.12% | 1.19% | 1.36% | 1.50% |
Expenses net of all reductions | 1.23% | 1.10% | 1.17% | 1.36% | 1.49% |
Net investment income (loss) | .03% | (.04)% | (.17)% | (.50)% | (.51)% |
Supplemental Data | | | | | |
Net assets, end of period (000 omitted) | $ 8,440 | $ 13,773 | $ 8,399 | $ 3,919 | $ 3,905 |
Portfolio turnover rate D | 138% | 83% | 89% | 83% | 99% |
A Total returns would have been lower had certain expenses not been reduced during the periods shown.
B Calculated based on average shares outstanding during the period.
C Fees and expenses of the underlying Fidelity Central Funds are not included in the Fund's expense ratio. The Fund indirectly bears its proportionate share of the expenses of any underlying Fidelity Central Funds.
D Amount does not include the portfolio activity of any underlying Fidelity Central Funds.
E Expense ratios reflect operating expenses of the class. Expenses before reductions do not reflect amounts reimbursed by the investment adviser or reductions from brokerage service arrangements or other expense offset arrangements and do not represent the amount paid by the class during periods when reimbursements or reductions occur. Expenses net of fee waivers reflect expenses after reimbursement by the investment adviser but prior to reductions from brokerage service arrangements or other expense offset arrangements. Expenses net of all reductions represent the net expenses paid by the class.
F Amount represents less than $.01 per share.
See accompanying notes which are an integral part of the financial statements.
Annual Report
Notes to Financial Statements
For the period ended October 31, 2007
1. Organization.
Fidelity Advisor Japan Fund (the Fund) is a fund of Fidelity Advisor Series VIII (the trust) and is authorized to issue an unlimited number of shares. The trust is registered under the Investment Company Act of 1940, as amended (the 1940 Act), as an open-end management investment company organized as a Massachusetts business trust. The Fund offers Class A, Class T, Class B, Class C, and Institutional Class shares, each of which has equal rights as to assets and voting privileges. Each class has exclusive voting rights with respect to matters that affect that class. Class B shares will automatically convert to Class A shares after a holding period of seven years from the initial date of purchase. Investment income, realized and unrealized capital gains and losses, the common expenses of the Fund, and certain fund-level expense reductions, if any, are allocated on a pro rata basis to each class based on the relative net assets of each class to the total net assets of the Fund. Each class differs with respect to transfer agent and distribution and service plan fees incurred. Certain expense reductions also differ by class.
2. Investments in Fidelity Central Funds.
The Fund may invest in Fidelity Central Funds, which are open-end investment companies available only to other investment companies and accounts managed by Fidelity Management & Research Company (FMR) and its affiliates. The Fund's Schedule of Investments lists each of the Fidelity Central Funds as an investment of the Fund, but does not include the underlying holdings of each Fidelity Central Fund. As an Investing Fund, the Fund indirectly bears its proportionate share of the expenses of the underlying Fidelity Central Funds.
The Money Market Central Funds seek preservation of capital and current income and are managed by Fidelity Investments Money Management, Inc. (FIMM), an affiliate of FMR.
A complete list of holdings for each Fidelity Central Fund is available upon request or at the SEC's web site at www.sec.gov. In addition, the financial statements of the Fidelity Central Funds, which are not covered by the Fund's Report of Independent Registered Public Accounting Firm, are available on the SEC's web site or upon request.
3. Significant Accounting Policies.
The financial statements have been prepared in conformity with accounting principles generally accepted in the United States of America, which require management to make certain estimates and assumptions at the date of the financial statements. The following summarizes the significant accounting policies of the Fund:
Annual Report
3. Significant Accounting Policies - continued
Security Valuation. Investments are valued and net asset value (NAV) per share is calculated (NAV calculation) as of the close of business of the New York Stock Exchange (NYSE), normally 4:00 p.m. Eastern time. Wherever possible, the Fund uses independent pricing services approved by the Board of Trustees to value its investments.
Equity securities, including restricted securities, for which market quotations are readily available, are valued at the last reported sale price or official closing price as reported by an independent pricing service on the primary market or exchange on which they are traded. In the event there were no sales during the day or closing prices are not available, securities are valued at the last quoted bid price.
Investments in open-end mutual funds, including the Fidelity Central Funds, are valued at their closing net asset value each business day. Short-term securities with remaining maturities of sixty days or less for which quotations are not readily available are valued at amortized cost, which approximates value.
When current market prices or quotations are not readily available or do not accurately reflect fair value, valuations may be determined in accordance with procedures adopted by the Board of Trustees. For example, when developments occur between the close of a market and the close of the NYSE that may materially affect the value of some or all of the securities, or when trading in a security is halted, those securities may be fair valued. Factors used in the determination of fair value may include monitoring news to identify significant market or security specific events such as changes in the value of U.S. securities markets, reviewing developments in foreign markets and evaluating the performance of ADRs, futures contracts and exchange-traded funds. Because the Fund's utilization of fair value pricing depends on market activity, the frequency with which fair value pricing is used cannot be predicted and may be utilized to a significant extent. The value of securities used for NAV calculation under fair value pricing may differ from published prices for the same securities.
Foreign Currency. The Fund uses foreign currency contracts to facilitate transactions in foreign-denominated securities. Losses from these transactions may arise from changes in the value of the foreign currency or if the counterparties do not perform under the contracts' terms.
Foreign-denominated assets, including investment securities, and liabilities are translated into U.S. dollars at the exchange rate at period end. Purchases and sales of investment securities, income and dividends received and expenses denominated in foreign currencies are translated into U.S. dollars at the exchange rate in effect on the transaction date.
Annual Report
Notes to Financial Statements - continued
3. Significant Accounting Policies - continued
Foreign Currency - continued
The effects of exchange rate fluctuations on investments are included with the net realized and unrealized gain (loss) on investment securities. Other foreign currency transactions resulting in realized and unrealized gain (loss) are disclosed separately.
Investment Transactions and Income. For financial reporting purposes, the Fund's investment holdings and NAV include trades executed through the end of the last business day of the period. The NAV for processing shareholder transactions includes trades executed through the end of the prior business day. Gains and losses on securities sold are determined on the basis of identified cost. Dividend income is recorded on the ex-dividend date, except for certain dividends from foreign securities where the ex-dividend date may have passed, which are recorded as soon as the Fund is informed of the ex-dividend date. Non-cash dividends included in dividend income, if any, are recorded at the fair market value of the securities received. Interest income and distributions from the Fidelity Central Funds are accrued as earned. Interest income includes coupon interest and amortization of premium and accretion of discount on debt securities. Investment income is recorded net of foreign taxes withheld where recovery of such taxes is uncertain.
Expenses. Most expenses of the trust can be directly attributed to a fund. Expenses which cannot be directly attributed are apportioned among each Fund in the trust. Expense estimates are accrued in the period to which they relate and adjustments are made when actual amounts are known.
Income Tax Information and Distributions to Shareholders. Each year, the Fund intends to qualify as a regulated investment company by distributing all of its taxable income and realized gains under Subchapter M of the Internal Revenue Code. As a result, no provision for income taxes is required in the accompanying financial statements. Foreign taxes are provided for based on the Fund's understanding of the tax rules and rates that exist in the foreign markets in which it invests.
Distributions are recorded on the ex-dividend date. Income dividends and capital gain distributions are declared separately for each class. Income and capital gain distributions are determined in accordance with income tax regulations, which may differ from generally accepted accounting principles.
Capital accounts within the financial statements are adjusted for permanent book-tax differences. These adjustments have no impact on net assets or the results of operations. Temporary book-tax differences will reverse in a subsequent period.
Annual Report
3. Significant Accounting Policies - continued
Income Tax Information and Distributions to Shareholders - continued
Book-tax differences are primarily due to foreign currency transactions, passive foreign investment companies (PFIC), capital loss carryforwards and losses deferred due to wash sales.
The tax-basis components of distributable earnings and the federal tax cost as of period end were as follows:
Unrealized appreciation | $ 8,750,540 | |
Unrealized depreciation | (3,845,732) | |
Net unrealized appreciation (depreciation) | 4,904,808 | |
Undistributed ordinary income | 177,634 | |
Capital loss carryforward | (12,845,430) | |
| | |
Cost for federal income tax purposes | $ 93,216,598 | |
Short-Term Trading (Redemption) Fees. Shares held in the Fund less than 90 days are subject to a redemption fee equal to 1.50% of the proceeds of the redeemed shares. All redemption fees, including any estimated redemption fees paid by FMR, are retained by the Fund and accounted for as an addition to paid in capital.
New Accounting Pronouncements. In July 2006, Financial Accounting Standards Board Interpretation No. 48, Accounting for Uncertainty in Income Taxes - an interpretation of FASB Statement 109 (FIN 48), was issued and is effective on the last business day of the semiannual reporting period for fiscal years beginning after December 15, 2006. FIN 48 sets forth a threshold for financial statement recognition, measurement and disclosure of a tax position taken or expected to be taken on a tax return. Management has concluded that the adoption of FIN 48 will not result in a material impact on the Fund's net assets, results of operations and financial statement disclosures.
In addition, in September 2006, Statement of Financial Accounting Standards No. 157, Fair Value Measurements (SFAS 157), was issued and is effective for fiscal years beginning after November 15, 2007. SFAS 157 defines fair value, establishes a framework for measuring fair value and expands disclosures about fair value measurements. Management is currently evaluating the impact the adoption of SFAS 157 will have on the Fund's financial statement disclosures.
Annual Report
Notes to Financial Statements - continued
4. Operating Policies.
Repurchase Agreements. FMR has received an Exemptive Order from the Securities and Exchange Commission (the SEC) which permits the Fund and other affiliated entities of FMR to transfer uninvested cash balances into joint trading accounts which are then invested in repurchase agreements. The Fund may also invest directly with institutions in repurchase agreements. Repurchase agreements are collateralized by government or non-government securities. Upon settlement date, collateral is held in segregated accounts with custodian banks and may be obtained in the event of a default of the counterparty. The Fund monitors, on a daily basis, the value of the collateral to ensure it is at least equal to the principal amount of the repurchase agreement (including accrued interest). In the event of a default by the counterparty, realization of the collateral proceeds could be delayed, during which time the value of the collateral may decline.
5. Purchases and Sales of Investments.
Purchases and sales of securities, other than short-term securities, aggregated $168,000,204 and $217,057,072, respectively.
6. Fees and Other Transactions with Affiliates.
Management Fee. FMR and its affiliates provide the Fund with investment management related services for which the Fund pays a monthly management fee. The management fee is the sum of an individual fund fee rate that is based on an annual rate of .45% of the Fund's average net assets and a group fee rate that averaged ..26% during the period. The group fee rate is based upon the average net assets of all the mutual funds advised by FMR. The group fee rate decreases as assets under management increase and increases as assets under management decrease.
In addition, on September 19, 2007, shareholders approved a new management contract which adds a performance adjustment to the management fee (up to a maximum of .20% of the Fund's average net assets over a 36 month performance period). The upward or downward adjustment to the management fee is based on the relative investment performance of the Fund's Institutional Class as compared to an appropriate benchmark index. The Fund's performance period began on October 1, 2007. The performance adjustment will take effect starting with the twelfth month of the performance period (September, 2008). Subsequent months will be added until the performance period includes 36 months. For the period, the total annual management fee rate was .71% of the Fund's average net assets.
Annual Report
6. Fees and Other Transactions with Affiliates - continued
Distribution and Service Plan. In accordance with Rule 12b-1 of the 1940 Act, the Fund has adopted separate Distribution and Service Plans for each class of shares. Certain classes pay Fidelity Distributors Corporation (FDC), an affiliate of FMR, separate Distribution and Service Fees, each of which is based on an annual percentage of each class' average net assets. In addition, FDC may pay financial intermediaries for selling shares of the Fund and providing shareholder support services. For the period, the Distribution and Service Fee rates and the total amounts paid to and retained by FDC were as follows:
| Distribution
Fee | Service
Fee | Paid to
FDC | Retained
by FDC |
Class A | 0% | .25% | $ 93,623 | $ 3,126 |
Class T | .25% | .25% | 89,096 | 210 |
Class B | .75% | .25% | 114,710 | 86,121 |
Class C | .75% | .25% | 436,139 | 98,142 |
| | | $ 733,568 | $ 187,599 |
Sales Load. FDC receives a front-end sales charge of up to 5.75% for selling Class A shares, and 3.50% for selling Class T shares, some of which is paid to financial intermediaries for selling shares of the Fund. FDC receives the proceeds of contingent deferred sales charges levied on Class A, Class T, Class B, and Class C redemptions. These charges depend on the holding period. The deferred sales charges range from 5% to 1% for
Class B, 1% for Class C, 1.00% to .50% for certain purchases of Class A shares and .25% for certain purchases of Class T shares.
For the period, sales charge amounts retained by FDC were as follows:
| Retained
by FDC |
Class A | $ 20,749 |
Class T | 4,721 |
Class B* | 33,265 |
Class C* | 40,977 |
| $ 99,712 |
* When Class B and Class C shares are initially sold, FDC pays commissions from its own resources to financial intermediaries through which the sales are made.
Annual Report
Notes to Financial Statements - continued
6. Fees and Other Transactions with Affiliates - continued
Transfer Agent Fees. Fidelity Investments Institutional Operations Company, Inc. (FIIOC), an affiliate of FMR, is the transfer, dividend disbursing and shareholder servicing agent for each class of the Fund. FIIOC receives account fees and asset-based fees that vary according to the account size and type of account of the shareholders of the respective classes of the Fund. FIIOC pays for typesetting, printing and mailing of shareholder reports, except proxy statements. For the period, the total transfer agent fees paid by each class to FIIOC, were as follows:
| Amount | % of
Average
Net Assets |
Class A | $ 114,107 | .31 |
Class T | 58,264 | .33 |
Class B | 36,531 | .32 |
Class C | 101,580 | .23 |
Institutional Class | 19,346 | .18 |
| $ 329,828 | |
Accounting and Security Lending Fees. Fidelity Service Company, Inc. (FSC), an affiliate of FMR, maintains the Fund's accounting records. The accounting fee is based on the level of average net assets for the month. Under a separate contract, FSC administers the security lending program. The security lending fee is based on the number and duration of lending transactions.
7. Committed Line of Credit.
The Fund participates with other funds managed by FMR in a $4.2 billion credit facility (the "line of credit") to be utilized for temporary or emergency purposes to fund shareholder redemptions or for other short-term liquidity purposes. The Fund has agreed to pay commitment fees on its pro rata portion of the line of credit, which amounted to $271 and is reflected in Miscellaneous Expense on the Statement of Operations. During the period, there were no borrowings on this line of credit.
8. Security Lending.
The Fund lends portfolio securities from time to time in order to earn additional income. On the settlement date of the loan, the Fund receives collateral (in the form of U.S. Treasury obligations, letters of credit and/or cash) against the loaned securities and maintains collateral in an amount not less than 100% of the market value of the loaned securities during the period of the loan. The market value of the loaned securities is determined at the close of business of the Fund and any additional required collateral is delivered to the Fund on the next business day. If the borrower defaults on its obligation to return the securities loaned because of insolvency or other reasons, a fund could experience delays and costs in recovering the securities loaned or in gaining access to
Annual Report
8. Security Lending - continued
the collateral. Any cash collateral received is invested in the Fidelity Securities Lending Cash Central Fund. The value of loaned securities and cash collateral at period end are disclosed on the Fund's Statement of Assets and Liabilities. Security lending income represents the income earned on investing cash collateral, less fees and expenses associated with the loan, plus any premium payments that may be received on the loan of certain types of securities. Security lending income is presented in the Statement of Operations as a component of income from Fidelity Central Funds. Net income from lending portfolio securities during the period amounted to $75,534.
9. Expense Reductions.
FMR voluntarily agreed to reimburse each class to the extent annual operating expenses exceeded certain levels of average net assets as noted in the table below. Some expenses, for example interest expense, including commitment fees, are excluded from this reimbursement.
The following classes were in reimbursement during the period:
| Expense
Limitations | Reimbursement
from adviser |
| | |
Class A | 1.50% | $ 74,193 |
Class T | 1.75% | 37,678 |
Class B | 2.25% | 22,458 |
Class C | 2.25% | 51,884 |
Institutional Class | 1.25% | 6,697 |
| | $ 192,910 |
Many of the brokers with whom FMR places trades on behalf of the Fund provided services to the Fund in addition to trade execution. These services included payments of certain expenses on behalf of the Fund totaling $21,323 for the period.
10. Other.
The Fund's organizational documents provide former and current trustees and officers with a limited indemnification against liabilities arising in connection with the performance of their duties to the Fund. In the normal course of business, the Fund may also enter into contracts that provide general indemnifications. The Fund's maximum exposure under these arrangements is unknown as this would be dependent on future claims that may be made against the Fund. The risk of material loss from such claims is considered remote.
In September 2006, FIIOC, the Fund's transfer agent, notified the Fund that the Fund's books and records did not reflect a conversion of certain Class B to Class A shares upon
Annual Report
Notes to Financial Statements - continued
10. Other - continued
their conversion date. In March 2007, FIIOC converted the relevant Class B shares to Class A shares and recorded the conversion in the books and records of the Fund which did not result in a material impact to the Fund's reported net assets or results of operations in the accompanying financial statements. FIIOC has remediated affected shareholders and reimbursed the Fund for all related audit and legal expenses.
11. Share Transactions.
Transactions for each class of shares were as follows:
| Shares | Dollars |
Years ended October 31, | 2007 | 2006 | 2007 | 2006 |
Class A | | | | |
Shares sold | 880,882 | 2,415,607 | $ 14,621,774 | $ 42,848,178 |
Shares redeemed | (1,378,099) | (1,587,280) | (22,819,285) | (27,666,623) |
Net increase (decrease) | (497,217) | 828,327 | $ (8,197,511) | $ 15,181,555 |
Class T | | | | |
Shares sold | 210,578 | 791,936 | $ 3,439,343 | $ 13,799,281 |
Shares redeemed | (601,386) | (526,692) | (9,800,348) | (8,958,468) |
Net increase (decrease) | (390,808) | 265,244 | $ (6,361,005) | $ 4,840,813 |
Class B | | | | |
Shares sold | 60,581 | 403,589 | $ 947,979 | $ 6,894,896 |
Shares redeemed | (565,912) | (654,386) | (8,855,704) | (10,858,321) |
Net increase (decrease) | (505,331) | (250,797) | $ (7,907,725) | $ (3,963,425) |
Class C | | | | |
Shares sold | 404,623 | 2,456,323 | $ 6,455,208 | $ 42,041,448 |
Shares redeemed | (1,590,835) | (1,361,698) | (25,190,493) | (22,520,719) |
Net increase (decrease) | (1,186,212) | 1,094,625 | $ (18,735,285) | $ 19,520,729 |
Institutional Class | | | | |
Shares sold | 174,093 | 594,833 | $ 2,974,426 | $ 10,866,389 |
Shares redeemed | (477,947) | (317,427) | (8,131,108) | (5,574,088) |
Net increase (decrease) | (303,854) | 277,406 | $ (5,156,682) | $ 5,292,301 |
Annual Report
Report of Independent Registered Public Accounting Firm
To the Trustees of Fidelity Advisor Series VIII and the Shareholders of Fidelity Advisor Japan Fund:
In our opinion, the accompanying statement of assets and liabilities, including the schedule of investments, and the related statements of operations and of changes in net assets and the financial highlights present fairly, in all material respects, the financial position of Fidelity Advisor Japan Fund (a fund of Fidelity Advisor Series VIII) at October 31, 2007, the results of its operations for the year then ended, the changes in its net assets for each of the two years in the period then ended and the financial highlights for each of the five years in the period then ended, in conformity with accounting principles generally accepted in the United States of America. These financial statements and financial highlights (hereafter referred to as "financial statements") are the responsibility of the Fidelity Advisor Japan Fund's management. Our responsibility is to express an opinion on these financial statements based on our audits. We conducted our audits of these financial statements in accordance with the standards of the Public Company Accounting Oversight Board (United States). Those standards require that we plan and perform the audit to obtain reasonable assurance about whether the financial statements are free of material misstatement. An audit includes examining, on a test basis, evidence supporting the amounts and disclosures in the financial statements, assessing the accounting principles used and significant estimates made by management, and evaluating the overall financial statement presentation. We believe that our audits, which included confirmation of securities at October 31, 2007 by correspondence with the custodian and brokers, provide a reasonable basis for our opinion.
/s/ PricewaterhouseCoopers LLP
PricewaterhouseCoopers LLP
Boston, Massachusetts
December 17, 2007
Annual Report
Trustees and Officers
The Trustees, Members of the Advisory Board, and executive officers of the trust and fund, as applicable, are listed below. The Board of Trustees governs the fund and is responsible for protecting the interests of shareholders. The Trustees are experienced executives who meet periodically throughout the year to oversee the fund's activities, review contractual arrangements with companies that provide services to the fund, and review the fund's performance. Each of the Trustees oversees 370 funds advised by FMR or an affiliate. Mr. Curvey oversees 340 funds advised by FMR or an affiliate.
The Trustees hold office without limit in time except that (a) any Trustee may resign; (b) any Trustee may be removed by written instrument, signed by at least two-thirds of the number of Trustees prior to such removal; (c) any Trustee who requests to be retired or who has become incapacitated by illness or injury may be retired by written instrument signed by a majority of the other Trustees; and (d) any Trustee may be removed at any special meeting of shareholders by a two-thirds vote of the outstanding voting securities of the trust. Each Trustee who is not an interested person (as defined in the 1940 Act) (Independent Trustee), shall retire not later than the last day of the calendar year in which his or her 72nd birthday occurs. The Independent Trustees may waive this mandatory retirement age policy with respect to individual Trustees. The executive officers and Advisory Board Members hold office without limit in time, except that any officer and Advisory Board Member may resign or may be removed by a vote of a majority of the Trustees at any regular meeting or any special meeting of the Trustees. Except as indicated, each individual has held the office shown or other offices in the same company for the past five years.
The fund's Statement of Additional Information (SAI) includes more information about the Trustees. To request a free copy, call Fidelity at 1-877-208-0098.
Interested Trustees*:
Correspondence intended for each Trustee who is an interested person may be sent to Fidelity Investments, 82 Devonshire Street, Boston, Massachusetts 02109.
Name, Age; Principal Occupation |
Edward C. Johnson 3d (77) |
| Year of Election or Appointment: 1983 Mr. Johnson is Chairman of the Board of Trustees. Mr. Johnson serves as President (2006-present), Chief Executive Officer, Chairman, and a Director of FMR LLC; Chairman and a Director of FMR; Chairman and a Director of Fidelity Research & Analysis Company (FRAC); Chairman and a Director of Fidelity Investments Money Management, Inc.; and Chairman (2001-present) and a Director of FMR Co., Inc. In addition, Mr. Johnson serves as Chairman and Director of Fidelity International Limited (FIL). |
James C. Curvey (72) |
| Year of Election or Appointment: 2007 Mr. Curvey also serves as Trustee (2007-present) or Member of the Advisory Board (2007-present) of other investment companies advised by FMR. Mr. Curvey is a Director of FMR and FMR Co., Inc. (2007-present). Mr. Curvey is also Vice Chairman (2006-present) and Director of FMR LLC. Mr. Curvey joined Fidelity in 1982 and served in numerous senior management positions, including President and Chief Operating Officer of FMR LLC (1997-2000) and President of Fidelity Strategic Investments (2000-2002). In addition, he serves as a member of the Board of Directors of Geerlings & Wade, Inc. (wine distribution). |
* Trustees have been determined to be "Interested Trustees" by virtue of, among other things, their affiliation with the trust, or various entities under common control with FMR. FMR Corp. merged with FMR LLC on October 1, 2007. Any references to FMR LLC for prior periods are deemed to be references to the prior entity.
Independent Trustees:
Correspondence intended for each Independent Trustee (that is, the Trustees other than the Interested Trustees) may be sent to Fidelity Investments, P.O. Box 55235, Boston, Massachusetts 02205-5235.
Name, Age; Principal Occupation |
Dennis J. Dirks (59) |
| Year of Election or Appointment: 2005 Prior to his retirement in May 2003, Mr. Dirks was Chief Operating Officer and a member of the Board of The Depository Trust & Clearing Corporation (DTCC) (1999-2003). He also served as President, Chief Operating Officer, and Board member of The Depository Trust Company (DTC) (1999-2003) and President and Board member of the National Securities Clearing Corporation (NSCC) (1999-2003). In addition, Mr. Dirks served as Chief Executive Officer and Board member of the Government Securities Clearing Corporation (2001-2003) and Chief Executive Officer and Board member of the Mortgage-Backed Securities Clearing Corporation (2001-2003). Mr. Dirks also serves as a Trustee and a member of the Finance Committee of Manhattan College (2005-present) and a Trustee and a member of the Finance Committee of AHRC of Nassau County (2006-present). |
Albert R. Gamper, Jr. (65) |
| Year of Election or Appointment: 2006 Prior to his retirement in December 2004, Mr. Gamper served as Chairman of the Board of CIT Group Inc. (commercial finance). During his tenure with CIT Group Inc. Mr. Gamper served in numerous senior management positions, including Chairman (1987-1989; 1999-2001; 2002-2004), Chief Executive Officer (1987-2004), and President (1989-2002). He currently serves as a member of the Board of Directors of Public Service Enterprise Group (utilities, 2001-present), Chairman of the Board of Governors, Rutgers University (2004-present), and Chairman of the Board of Saint Barnabas Health Care System. |
George H. Heilmeier (71) |
| Year of Election or Appointment: 2004 Dr. Heilmeier is Chairman Emeritus of Telcordia Technologies (communication software and systems), where prior to his retirement, he served as company Chairman and Chief Executive Officer. He currently serves on the Boards of Directors of The Mitre Corporation (systems engineering and information technology support for the government), and HRL Laboratories (private research and development, 2004-present). He is Chairman of the General Motors Science & Technology Advisory Board and a Life Fellow of the Institute of Electrical and Electronics Engineers (IEEE). Dr. Heilmeier is a member of the Defense Science Board and the National Security Agency Advisory Board. He is also a member of the National Academy of Engineering, the American Academy of Arts and Sciences, and the Board of Overseers of the School of Engineering and Applied Science of the University of Pennsylvania. Previously, Dr. Heilmeier served as a Director of TRW Inc. (automotive, space, defense, and information technology, 1992-2002), Compaq (1994-2002), Automatic Data Processing, Inc. (ADP) (technology-based business outsourcing, 1995-2002), INET Technologies Inc. (telecommunications network surveillance, 2001-2004), and Teletech Holdings (customer management services). He is the recipient of the 2005 Kyoto Prize in Advanced Technology for his invention of the liquid crystal display, and a member of the Consumer Electronics Hall of Fame. |
James H. Keyes (67) |
| Year of Election or Appointment: 2007 Prior to his retirement in 2003, Mr. Keyes was Chairman, President, and Chief Executive Officer of Johnson Controls, Inc. (automotive supplier, 1993-2003). He currently serves as a member of the boards of LSI Logic Corporation (semiconductor technologies), Navistar International Corporation (manufacture and sale of trucks, buses, and diesel engines, 2002-present), and Pitney Bowes, Inc. (integrated mail, messaging, and document management solutions). |
Marie L. Knowles (61) |
| Year of Election or Appointment: 2001 Prior to Ms. Knowles' retirement in June 2000, she served as Executive Vice President and Chief Financial Officer of Atlantic Richfield Company (ARCO) (diversified energy, 1996-2000). From 1993 to 1996, she was a Senior Vice President of ARCO and President of ARCO Transportation Company. She served as a Director of ARCO from 1996 to 1998. She currently serves as a Director of Phelps Dodge Corporation (copper mining and manufacturing) and McKesson Corporation (healthcare service, 2002-present). Ms. Knowles is a Trustee of the Brookings Institution and the Catalina Island Conservancy and also serves as a member of the Advisory Board for the School of Engineering of the University of Southern California. |
Ned C. Lautenbach (63) |
| Year of Election or Appointment: 2000 Mr. Lautenbach is Chairman of the Independent Trustees (2006-present). Mr. Lautenbach has been a partner of Clayton, Dubilier & Rice, Inc. (private equity investment firm) since September 1998. Previously, Mr. Lautenbach was with the International Business Machines Corporation (IBM) from 1968 until his retirement in 1998. Mr. Lautenbach serves as a Director of Sony Corporation (2006-present) and Eaton Corporation (diversified industrial) as well as the Philharmonic Center for the Arts in Naples, Florida. He also is a member of the Board of Trustees of Fairfield University (2005-present), as well as a member of the Council on Foreign Relations. |
Cornelia M. Small (63) |
| Year of Election or Appointment: 2005 Ms. Small is a member (2000-present) and Chairperson (2002-present) of the Investment Committee, and a member (2002-present) of the Board of Trustees of Smith College. Previously, she served as Chief Investment Officer (1999-2000), Director of Global Equity Investments (1996-1999), and a member of the Board of Directors of Scudder, Stevens & Clark (1990-1997) and Scudder Kemper Investments (1997-1999). In addition, Ms. Small served as Co-Chair (2000-2003) of the Annual Fund for the Fletcher School of Law and Diplomacy. |
William S. Stavropoulos (68) |
| Year of Election or Appointment: 2001 Mr. Stavropoulos is Chairman Emeritus of the Board of Directors of The Dow Chemical Company. Since joining The Dow Chemical Company in 1967, Mr. Stavropoulos served in numerous senior management positions, including President (1993-2000; 2002-2003), CEO (1995-2000; 2002-2004), and Chairman of the Executive Committee (2000-2004). Currently, he is a Director of NCR Corporation (data warehousing and technology solutions), Chemical Financial Corporation, Maersk Inc. (industrial conglomerate, 2002-present), Tyco International, Inc. (multinational manufacturing and services, 2007-present), and a member of the Advisory Board for Metalmark Capital (private equity investment firm, 2005-present). He is a special advisor to Clayton, Dubilier & Rice, Inc., a private equity investment firm. He also serves as a member of the Board of Trustees of the American Enterprise Institute for Public Policy Research. In addition, Mr. Stavropoulos is a member of The Business Council, J.P. Morgan International Council and the University of Notre Dame Advisory Council for the College of Science. |
Kenneth L. Wolfe (68) |
| Year of Election or Appointment: 2005 Prior to his retirement in 2001, Mr. Wolfe was Chairman and Chief Executive Officer of Hershey Foods Corporation (1993-2001). He currently serves as a member of the boards of Adelphia Communications Corporation (2003-present), Bausch & Lomb, Inc., and Revlon Inc. (2004-present). |
Advisory Board Members and Executive Officers**:
Correspondence intended for Mr. Mauriello, Mr. Thomas, and Mr. Wiley may be sent to Fidelity Investments, P.O. Box 55235, Boston, Massachusetts 02205-5235. Correspondence intended for each executive officer and Mr. Lynch may be sent to Fidelity Investments, 82 Devonshire Street, Boston, Massachusetts 02109.
Name, Age; Principal Occupation |
Peter S. Lynch (63) |
| Year of Election or Appointment: 2003 Member of the Advisory Board of Fidelity Advisor Series VIII. Mr. Lynch is Vice Chairman and a Director of FMR, and Vice Chairman (2001-present) and a Director of FMR Co., Inc. Previously, Mr. Lynch served as a Trustee of the Fidelity funds (1990-2003). In addition, he serves as a Trustee of Boston College and as the Chairman of the
Inner-City Scholarship Fund. |
Joseph Mauriello (63) |
| Year of Election or Appointment: 2007 Member of the Advisory Board of Fidelity Advisor Series VIII. Prior to his retirement in January 2006, Mr. Mauriello served in numerous senior management positions including Deputy Chairman and Chief Operating Officer (2004-2005), and Vice Chairman of Financial Services (2002-2004) of KPMG LLP US (professional services firm, 1965-2005). Mr. Mauriello currently serves as a member of the Board of Directors of XL Capital Ltd., (global insurance and re-insurance company, 2006-present) and of Arcadia Resources Inc., (health care services and products, 2007-present). He also served as a Director of the Hamilton Funds of the Bank of New York (2006-2007). |
David M. Thomas (58) |
| Year of Election or Appointment: 2007
Member of the Advisory Board of Fidelity Advisor Series VIII. Previously, Mr. Thomas served as Executive Chairman (2005-2006) and Chairman and Chief Executive Officer (2000-2005) of IMS Health, Inc. (pharmaceutical and healthcare information solutions). In addition, Mr. Thomas serves as a member of the Board of Directors of Fortune Brands, Inc. (consumer products holding company), and Interpublic Group of Companies, Inc. (marketing communication, 2004-present). |
Michael E. Wiley (57) |
| Year of Election or Appointment: 2007 Member of the Advisory Board of Fidelity Advisor Series VIII. Mr. Wiley also serves as Sr. Energy Advisor of Katzenbach Partners, LLC (consulting firm, 2006-present) and a member of the Board of Trustees of the University of Tulsa (2000-2006; 2007-present). He serves as a Director of Tesoro Corporation (independent oil refiner and marketer, 2005-present), and a Director of Bill Barrett Corporation (exploration and production company, 2005-present). In addition, he also serves as a Director of Post Oak Bank (privately-held bank, 2004-present), and an Advisory Director of Riverstone Holdings (private investment firm). Previously, Mr. Wiley served as Chairman, President, and CEO of Baker Hughes, Inc. (oilfield services company, 2000-2004), and as Director of Spinnaker Exploration Company (exploration and production company, 2001-2005). |
Kimberley H. Monasterio (43) |
| Year of Election or Appointment: 2007 President and Treasurer of Advisor Japan. Ms. Monasterio also serves as President and Treasurer of other Fidelity funds (2007-present) and is an employee of FMR (2004-present). Previously, Ms. Monasterio served as Deputy Treasurer of the Fidelity funds (2004-2006). Before joining Fidelity Investments, Ms. Monasterio served as Treasurer (2000-2004) and Chief Financial Officer (2002-2004) of the Franklin Templeton Funds and Senior Vice President of Franklin Templeton Services, LLC (2000-2004). |
Walter C. Donovan (45) |
| Year of Election or Appointment: 2007 Vice President of Advisor Japan. Mr. Donovan also serves as Vice President of Fidelity's Equity Funds (2007-present). Mr. Donovan also serves as Executive Vice President of FMR (2005-present) and FMR Co., Inc. (2005-present). Previously, Mr. Donovan served as Vice President of Fidelity's High Income Funds (2005-2007), Fixed-Income Funds (2005-2006), certain Asset Allocation Funds (2005-2006), certain Balanced Funds (2005-2006), and as Vice President and Director of Fidelity's International Equity Trading group (1998-2005). |
Eric M. Wetlaufer (45) |
| Year of Election or Appointment: 2006 Vice President of Advisor Japan. Mr. Wetlaufer also serves as Vice President of certain International Equity Funds (2006-present). Mr. Wetlaufer is Senior Vice President of FMR (2006-present) and FMR Co., Inc. (2006-present), and President and Director of Fidelity Management & Research (U.K.) Inc. (2006-present) and Fidelity Research & Analysis Company (2006-present). Before joining Fidelity Investments in 2005, Mr. Wetlaufer was a partner in Oxhead Capital Management (2004-2005). Previously, Mr. Wetlaufer served as a Chief Investment Officer of Putnam Investments (1997-2003). |
Eric D. Roiter (58) |
| Year of Election or Appointment: 1998 Secretary of Advisor Japan. He also serves as Secretary of other Fidelity funds; Vice President, General Counsel, and Secretary of FMR Co., Inc. (2001-present) and FMR; Assistant Secretary of Fidelity Management & Research (U.K.) Inc. (2001-present), Fidelity Research & Analysis Company (2001-present), and Fidelity Investments Money Management, Inc. (2001-present). Mr. Roiter is an Adjunct Member, Faculty of Law, at Boston College Law School (2003-present). Previously, Mr. Roiter served as Vice President and Secretary of Fidelity Distributors Corporation (FDC) (1998-2005). |
Scott C. Goebel (39) |
| Year of Election or Appointment: 2007 Assistant Secretary of Advisor Japan. Mr. Goebel also serves as Assistant Secretary of other Fidelity funds (2007-present), and is an employee of FMR. |
R. Stephen Ganis (41) |
| Year of Election or Appointment: 2006 Anti-Money Laundering (AML) officer of Advisor Japan. Mr. Ganis also serves as AML officer of other Fidelity funds (2006-present) and FMR LLC (2003-present). Before joining Fidelity Investments, Mr. Ganis practiced law at Goodwin Procter, LLP (2000-2002). |
Joseph B. Hollis (59) |
| Year of Election or Appointment: 2006 Chief Financial Officer of Advisor Japan. Mr. Hollis also serves as Chief Financial Officer of other Fidelity funds. Mr. Hollis is President of Fidelity Pricing and Cash Management Services (FPCMS) (2005-present). Mr. Hollis also serves as President and Director of Fidelity Service Company, Inc. (2006-present). Previously, Mr. Hollis served as Senior Vice President of Cash Management Services (1999-2002) and Investment Management Operations (2002-2005). |
Kenneth A. Rathgeber (60) |
| Year of Election or Appointment: 2004 Chief Compliance Officer of Advisor Japan. Mr. Rathgeber also serves as Chief Compliance Officer of other Fidelity funds (2004-present) and Executive Vice President of Risk Oversight for Fidelity Investments (2002-present). He is Chief Compliance Officer of FMR (2005-present), FMR Co., Inc. (2005-present), Fidelity Management & Research (U.K.) Inc. (2005-present), Fidelity Research & Analysis Company (2005-present), Fidelity Investments Money Management, Inc. (2005-present), and Strategic Advisers, Inc. (2005-present). Previously, Mr. Rathgeber served as Executive Vice President and Chief Operating Officer for Fidelity Investments Institutional Services Company, Inc. (1998-2002). |
Bryan A. Mehrmann (46) |
| Year of Election or Appointment: 2005 Deputy Treasurer of Advisor Japan. Mr. Mehrmann also serves as Deputy Treasurer of other Fidelity funds (2005-present) and is an employee of FMR. Previously, Mr. Mehrmann served as Vice President of Fidelity Investments Institutional Services Group (FIIS)/Fidelity Investments Institutional Operations Corporation, Inc. (FIIOC) Client Services (1998-2004). |
Kenneth B. Robins (38) |
| Year of Election or Appointment: 2005 Deputy Treasurer of Advisor Japan. Mr. Robins also serves as Deputy Treasurer of other Fidelity funds (2005-present) and is an employee of FMR (2004-present). Before joining Fidelity Investments, Mr. Robins worked at KPMG LLP, where he was a partner in KPMG's department of professional practice (2002-2004) and a Senior Manager (1999-2000). In addition, Mr. Robins served as Assistant Chief Accountant, United States Securities and Exchange Commission (2000-2002). |
Robert G. Byrnes (40) |
| Year of Election or Appointment: 2005 Assistant Treasurer of Advisor Japan. Mr. Byrnes also serves as Assistant Treasurer of other Fidelity funds (2005-present) and is an employee of FMR (2005-present). Previously, Mr. Byrnes served as Vice President of FPCMS (2003-2005). Before joining Fidelity Investments, Mr. Byrnes worked at Deutsche Asset Management where he served as Vice President of the Investment Operations Group (2000-2003). |
Peter L. Lydecker (53) |
| Year of Election or Appointment: 2004 Assistant Treasurer of Advisor Japan. Mr. Lydecker also serves as Assistant Treasurer of other Fidelity funds (2004) and is an employee of FMR. |
Paul M. Murphy (60) |
| Year of Election or Appointment: 2007 Assistant Treasurer of Advisor Japan. Mr. Murphy also serves as Assistant Treasurer of other Fidelity funds (2007-present) and is an employee of FMR (2007-present). Previously, Mr. Murphy served as Chief Financial Officer of the Fidelity Funds (2005-2006), Vice President and Associate General Counsel of FMR (2007), and Senior Vice President of Fidelity Pricing and Cash Management Services Group (FPCMS) (1994-2007). |
Gary W. Ryan (49) |
| Year of Election or Appointment: 2005 Assistant Treasurer of Advisor Japan. Mr. Ryan also serves as Assistant Treasurer of other Fidelity funds (2005-present) and is an employee of FMR (2005-present). Previously, Mr. Ryan served as Vice President of Fund Reporting in FPCMS (1999-2005). |
** FMR Corp. merged with FMR LLC on October 1, 2007. Any references to FMR LLC for prior periods are deemed to be references to the prior entity.
Annual Report
Distributions
The Board of Trustees of Advisor Japan Fund voted to pay to shareholders of record at the opening of business on record date, the following distributions per share derived from capital gains realized from sales of portfolio securities, and dividends derived from net investment income:
| Pay Date | Record Date | Dividends | Capital Gains |
Institutional Class | 12/07/07 | 12/10/07 | $.00 | $.104 |
The fund will notify shareholders in January 2008 of amounts for use in preparing 2007 income tax returns.
Annual Report
Proxy Voting Results
A special meeting of the fund's shareholders was held on September 19, 2007. The results of votes taken among shareholders on the proposal before them are reported below. Each vote reported represents one dollar of net asset value held on the record date for the meeting.
PROPOSAL 4 |
To approve an amended management contract that includes adding a performance adjustment component to the management fee for Fidelity Advisor Japan Fund and giving the Trustees the authority to change the fund's performance adjustment index going forward, without shareholder vote, subject to applicable law. |
| # of
Votes | % of
Votes |
Affirmative | 50,946,430.85 | 77.692 |
Against | 11,660,625.85 | 17.782 |
Abstain | 2,967,717.59 | 4.526 |
TOTAL | 65,574,774.29 | 100.000 |
Annual Report
Board Approval of Investment Advisory Contracts and Management Fees
Advisor Japan Fund
Each year, typically in July, the Board of Trustees, including the Independent Trustees (together, the Board), votes on the renewal of the management contract and sub-advisory agreements (together, the Advisory Contracts) for the fund. The Board, assisted by the advice of fund counsel and Independent Trustees' counsel, requests and considers a broad range of information throughout the year.
The Board meets regularly each month except August and takes into account throughout the year matters bearing on Advisory Contracts. The Board, acting directly and through its separate committees, considers at each of its meetings factors that are relevant to the annual renewal of the fund's Advisory Contracts, including the services and support provided to the fund and its shareholders. At the time of the renewal, the Board had 12 standing committees, each composed of Independent Trustees with varying backgrounds, to which the Board has assigned specific subject matter responsibilities in order to enhance effective decision-making by the Board. Each committee has adopted a written charter outlining the structure and purposes of the committee. One such committee, the Equity Contract Committee, meets periodically as needed throughout the year to consider matters specifically related to the annual renewal of Advisory Contracts. The committee requests and receives information on, and makes recommendations to the Independent Trustees concerning, the approval and annual review of the Advisory Contracts.
At its July 2007 meeting, the Board of Trustees, including the Independent Trustees, unanimously determined to renew the Advisory Contracts for the fund. In reaching its determination, the Board considered all factors it believed relevant, including (i) the nature, extent, and quality of the services to be provided to the fund and its shareholders (including the investment performance of the fund); (ii) the competitiveness of the management fee and total expenses of the fund; (iii) the total costs of the services to be provided by and the profits to be realized by the investment adviser and its affiliates from the relationship with the fund; (iv) the extent to which economies of scale would be realized as the fund grows; and (v) whether fee levels reflect these economies of scale, if any, for the benefit of fund shareholders. The Board also approved amendments to the fund's agreements with foreign sub-advisers to clarify that each sub-adviser provides services as an independent contractor.
In determining whether to renew the Advisory Contracts for the fund, the Board ultimately reached a determination, with the assistance of fund counsel and Independent Trustees' counsel, that the renewal of the Advisory Contracts and the compensation to be received by Fidelity under the management contract is consistent with Fidelity's fiduciary duty under applicable law. In addition to evaluating the specific factors noted above, the Board, in reaching its determination, is aware that shareholders in the fund have a broad range of investment choices available to them, including a wide choice among mutual funds offered by competitors to Fidelity, and that the fund's shareholders, with the opportunity to review and weigh the disclosure provided by the fund in its prospectus and other public disclosures, have chosen to invest in this fund, managed by Fidelity.
Annual Report
Board Approval of Investment Advisory Contracts and
Management Fees - continued
Nature, Extent, and Quality of Services Provided. The Board considered staffing within the investment adviser, FMR, and the sub-advisers (together, the Investment Advisers), including the background of the fund's portfolio manager and the fund's investment objective and discipline. The Independent Trustees also had discussions with senior management of Fidelity's investment operations and investment groups. The Board considered the structure of the portfolio manager compensation program and whether this structure provides appropriate incentives.
Resources Dedicated to Investment Management and Support Services. The Board reviewed the size, education, and experience of the Investment Advisers' investment staff, their use of technology, and the Investment Advisers' approach to recruiting, training, and retaining portfolio managers and other research, advisory, and management personnel. The Board considered Fidelity's extensive global research capabilities that enable the Investment Advisers to aggregate data from various sources in an effort to produce positive investment results. The Board noted that Fidelity's analysts have access to a variety of technological tools that enable them to perform both fundamental and quantitative analysis and to specialize in various disciplines. The Board also considered that Fidelity's portfolio managers and analysts have access to daily portfolio attribution that allows for monitoring of a fund's portfolio, as well as an electronic communication system that provides immediate real-time access to research concerning issuers and credit enhancers.
Shareholder and Administrative Services. The Board considered (i) the nature, extent, quality, and cost of advisory, administrative, distribution, and shareholder services performed by the Investment Advisers and their affiliates under the Advisory Contracts and under separate agreements covering transfer agency, pricing and bookkeeping, and securities lending services for the fund; (ii) the nature and extent of the Investment Advisers' supervision of third party service providers, principally custodians and subcustodians; and (iii) the resources devoted to, and the record of compliance with, the fund's compliance policies and procedures. The Board reviewed the allocation of fund brokerage, including allocations to brokers affiliated with the Investment Advisers, the use of brokerage commissions to pay fund expenses, and the use of "soft" commission dollars to pay for research services. The Board also considered that Fidelity voluntarily pays for market data out of its own resources. The Board also considered the agreement reached between the Independent Trustees and Fidelity in December 2006 following an independent review of matters relating to receipt of travel, entertainment, gifts and gratuities in violation of Fidelity policies.
Annual Report
The Board noted that the growth of fund assets across the complex allows Fidelity to reinvest in the development of services designed to enhance the value or convenience of the Fidelity funds as investment vehicles. These services include 24-hour access to account information and market information through phone representatives and over the Internet, and investor education materials and asset allocation tools.
Investment in a Large Fund Family. The Board considered the benefits to shareholders of investing in a Fidelity fund, including the benefits of investing in a fund that is part of a large family of funds offering a variety of investment disciplines and providing for a large variety of mutual fund investor services. For example, fund shareholders are offered the privilege of exchanging shares of the fund for shares of other Fidelity funds, as set forth in the fund's prospectus, without paying a sales charge. The Board noted that, since the last Advisory Contract renewals in July 2006, Fidelity has taken a number of actions that benefited particular funds, including (i) dedicating additional resources to investment research and to restructure the investment research teams; (ii) contractually agreeing to reduce the management fee on Fidelity Advisor Floating Rate High Income Fund; (iii) contractually agreeing to reduce the management fees on Fidelity's California, Massachusetts, New Jersey, and New York AMT Tax-Free Money Market Funds, launching new Institutional Classes and Service Classes of these funds, and contractually agreeing to impose expense limitations on these funds; (iv) eliminating the exchange fee on the Fidelity Select Portfolios and reducing the pricing and bookkeeping fee rates for these funds; (v) reducing the maximum transfer agency fee rates on high income funds and certain equity funds; (vi) proposing amended management contracts that, if approved by shareholders, will add a performance adjustment component to the management fees paid by 18 Fidelity Advisor equity funds; (vii) contractually agreeing to reduce fees for Ultra-Short Central Fund and the money market Central Funds; (viii) waiving the Fidelity Advisor funds' contingent deferred sales charge on certain redemptions made through systematic withdrawal programs; and (ix) amending the management contracts for equity and fixed-income funds whose management contracts incorporate a "group fee" structure by adding four new fee "breakpoints" to the group fee rate schedules.
Investment Performance and Compliance. The Board considered whether the fund has operated within its investment objective, as well as its record of compliance with its investment restrictions. It also reviewed the fund's absolute investment performance for each class, as well as the fund's relative investment performance for each class measured against (i) a broad-based securities market index, and (ii) a peer group of mutual funds deemed appropriate by the Board over multiple periods. The following charts considered by the Board show, over the one-, three-, and five-year periods ended December 31, 2006, the cumulative total returns of Institutional Class (Class I) and Class B of the fund, the cumulative total returns of a broad-based securities market index ("benchmark"), and a range of cumulative total returns of a peer group of mutual funds identified by Lipper Inc. as having an investment objective similar to that of the fund. The returns of Institutional Class (Class I) and Class B show the performance of the highest and lowest performing classes, respectively (based on three-year performance). The box within each chart shows the 25th percentile return (bottom of box) and the 75th percentile return (top of box) of the peer group. Returns shown above the box are in the first quartile and returns shown below the box are in the fourth quartile. The percentage beaten numbers noted below each chart correspond to the percentile box and represent the percentage of funds in the peer group whose performance was equal to or lower than that of the class indicated.
Annual Report
Board Approval of Investment Advisory Contracts and
Management Fees - continued
Advisor Japan Fund

The Board reviewed the fund's relative investment performance against its peer group and stated that the performance of Institutional Class (Class I) of the fund was in the fourth quartile for the one-year period, the third quartile for the three-year period, and the second quartile for the five-year period. The Board also stated that the investment performance of the fund was lower than its benchmark for all the periods shown. The Board considered that the variations in performance among the fund's classes reflect the variations in class expenses, which result in lower performance for higher expense classes. The Board discussed with FMR actions to be taken by FMR to improve the fund's more recent disappointing performance relative to its peer group. The Board will continue to closely monitor the performance of the fund in the coming year.
The Board considered that FMR has taken steps to refocus and strengthen equity research, equity portfolio management, and compliance.
Based on its review, and giving particular weight to the nature and quality of the resources dedicated by the Investment Advisers to maintain and improve relative performance, the Board concluded that the nature, extent, and quality of the services provided to the fund will benefit the fund's shareholders, particularly in light of the Board's view that the fund's shareholders benefit from investing in a fund that is part of a large family of funds offering a variety of investment disciplines and services.
Annual Report
Competitiveness of Management Fee and Total Fund Expenses. The Board considered the fund's management fee and total expenses compared to "mapped groups" of competitive funds and classes. Fidelity creates "mapped groups" by combining similar Lipper investment objective categories that have comparable management fee characteristics. Combining Lipper investment objective categories aids the Board's management fee and total expense comparisons by broadening the competitive group used for comparison and by reducing the number of universes to which various Fidelity funds are compared. The Board also considered supplemental information about how the fund's management fee and total expenses ranked relative to groups based on Lipper classifications, which take into account a fund's market capitalization and style.
The Board considered two proprietary management fee comparisons for the 12-month periods shown in the chart below. The group of Lipper funds used by the Board for management fee comparisons is referred to below as the "Total Mapped Group" and, for the reasons explained above, is broader than the Lipper peer group used by the Board for performance comparisons. The Total Mapped Group comparison focuses on a fund's standing relative to the total universe of comparable funds available to investors, in terms of gross management fees before expense reimbursements or caps. "TMG %" represents the percentage of funds in the Total Mapped Group that had management fees that were lower than the fund's. For example, a TMG % of 15% means that 85% of the funds in the Total Mapped Group had higher management fees than the fund. The "Asset-Size Peer Group" (ASPG) comparison focuses on a fund's standing relative to non-Fidelity funds similar in size to the fund within the Total Mapped Group. The ASPG represents at least 15% of the funds in the Total Mapped Group with comparable asset size and management fee characteristics, subject to a minimum of 50 funds (or all funds in the Total Mapped Group if fewer than 50). Additional information, such as the ASPG quartile in which the fund's management fee ranked, is also included in the chart and considered by the Board.
Annual Report
Board Approval of Investment Advisory Contracts and
Management Fees - continued
Advisor Japan Fund

The Board noted that the fund's management fee ranked below the median of its Total Mapped Group and below the median of its ASPG for 2006.
Furthermore, the Board considered that, on December 14, 2006, it had approved an amended management contract for the fund that, if approved by shareholders, will add a performance adjustment component to the management fee paid by the fund (that is, the fund's management fee will be subject to upward or downward adjustment depending upon whether, and to what extent, the fund's investment performance for the performance period exceeds, or is exceeded by, the record (over the same period) of a Board-approved performance adjustment index).
Based on its review, the Board concluded that the fund's management fee was fair and reasonable in light of the services that the fund receives and the other factors considered.
In its review of each class's total expenses, the Board considered the fund's management fee as well as other fund or class expenses, as applicable, such as transfer agent fees, pricing and bookkeeping fees, fund-paid 12b-1 fees, and custodial, legal, and audit fees. The Board also noted the effects of any waivers and reimbursements on fees and expenses. As part of its review, the Board also considered current and historical total expenses of each class of the fund compared to competitive fund median expenses. Each class of the fund is compared to those funds and classes in the Total Mapped Group (used by the Board for management fee comparisons) that have a similar sales load structure.
The Board noted that the total expenses of each of Class A, Class C, and Institutional Class ranked below its competitive median for 2006, the total expenses of Class B ranked equal to its competitive median for 2006, and the total expenses of Class T ranked above its competitive median for 2006. The Board noted that the fund offers multiple classes, each of which has a different sales load and 12b-1 fee structure, and that the multiple structures are intended to offer a range of pricing options for the intermediary market. The Board also noted that the total expenses of the classes vary primarily by the level of their 12b-1 fees, although differences in transfer agent fees may also cause expenses to vary from class to class.
Annual Report
In its review of total expenses, the Board also considered Fidelity fee structures and other information on clients that FMR and its affiliates service in other competitive markets, such as other mutual funds advised or subadvised by FMR or its affiliates, pension plan clients, and other institutional clients.
Based on its review, the Board concluded that the total expenses of each class of the fund were reasonable, although in one case above the median of the universe presented for comparison, in light of the services that the fund and its shareholders receive and the other factors considered.
Costs of the Services and Profitability. The Board considered the revenues earned and the expenses incurred by Fidelity in conducting the business of developing, marketing, distributing, managing, administering and servicing the fund and its shareholders. The Board also considered the level of Fidelity's profits in respect of all the Fidelity funds.
On an annual basis, FMR presents to the Board Fidelity's profitability for the fund. Fidelity calculates the profitability for each fund, as well as aggregate profitability for groups of Fidelity funds and all Fidelity funds, using a series of detailed revenue and cost allocation methodologies which originate with the audited books and records of Fidelity. The Audit Committee of the Board reviews any significant changes from the prior year's methodologies.
PricewaterhouseCoopers LLP (PwC), independent registered public accounting firm and auditor to Fidelity and certain Fidelity funds, has been engaged annually by the Board as part of the Board's assessment of the results of Fidelity's profitability analysis. PwC's engagement includes the review and assessment of Fidelity's methodologies used in determining the revenues and expenses attributable to Fidelity's mutual fund business, and completion of agreed-upon procedures surrounding the mathematical accuracy of fund profitability and its conformity to allocation methodologies. After considering PwC's reports issued under the engagement and information provided by Fidelity, the Board believes that while other allocation methods may also be reasonable, Fidelity's profitability methodologies are reasonable in all material respects.
The Board has also reviewed Fidelity's non-fund businesses and any fall-out benefits related to the mutual fund business as well as cases where Fidelity's affiliates may benefit from or be related to the fund's business.
Annual Report
Board Approval of Investment Advisory Contracts and
Management Fees - continued
The Board considered the costs of the services provided by and the profits realized by Fidelity in connection with the operation of the fund and determined that the amount of profit is a fair entrepreneurial profit for the management of the fund.
Economies of Scale. The Board considered whether there have been economies of scale in respect of the management of the Fidelity funds, whether the Fidelity funds (including the fund) have appropriately benefited from any such economies of scale, and whether there is potential for realization of any further economies of scale. The Board considered the extent to which the fund will benefit from economies of scale through increased services to the fund, through waivers or reimbursements, or through fee or expense reductions, including reductions that occur through operation of the transfer agent agreement. The transfer agent fee varies in part based on the number of accounts in the fund. If the number of accounts decreases or the average account size increases, the overall transfer agent fee rate decreases.
The Board recognized that the fund's management contract incorporates a "group fee" structure, which provides for lower group fee rates as total fund assets under FMR's management increase, and for higher group fee rates as total fund assets under FMR's management decrease. FMR determines the group fee rates based on a tiered asset "breakpoint" schedule. In connection with the renewal of the fund's management contract, the Board approved amendments to the fund's management contract that added four new fee breakpoints to the group fee rate schedule for assets under FMR's management above $1,386 billion. The Board considered that the group fee rate declines under both the present and amended schedules, but that under the amended schedule, the group fee rate declines faster as assets under FMR's management exceed $1,386 billion. The Board considered that the group fee is designed to deliver the benefits of economies of scale to fund shareholders when total fund assets increase, even if assets of any particular fund are unchanged or have declined, because some portion of Fidelity's costs are attributable to services provided to all Fidelity funds, and all funds benefit if those costs can be allocated among more assets. The Board concluded that, given the group fee structure, fund shareholders will achieve a certain level of economies of scale as assets under FMR's management increase at the fund complex level, regardless of whether Fidelity achieves any such economies of scale.
The Board further concluded that any potential economies of scale are being shared between fund shareholders and Fidelity in an appropriate manner.
Additional Information Requested by the Board. In order to develop fully the factual basis for consideration of the Fidelity funds' Advisory Contracts, the Board requested and received additional information on several topics, including (i) fund performance trends and actions to be taken by FMR to improve certain funds' overall performance; (ii) Fidelity's portfolio manager compensation structure, including its effects on fund profitability and the extent to which portfolio manager compensation is linked to fund performance; (iii) Fidelity's fee structures; (iv) the funds' sub-advisory arrangements; and (v) accounts managed by Fidelity other than the Fidelity funds.
Annual Report
Based on its evaluation of all of the conclusions noted above, and after considering all material factors, the Board ultimately concluded that the advisory fee structures are fair and reasonable, and that the fund's Advisory Contracts should be renewed.
Annual Report
Annual Report
Annual Report
Annual Report
Annual Report
Annual Report
Aannual Report
Investment Adviser
Fidelity Management & Research Company
Boston, MA
Investment Sub-Advisers
FMR Co., Inc.
Fidelity Management & Research
(U.K.) Inc.
Fidelity Research & Analysis Company
Fidelity International
Investment Advisors
Fidelity Investments Japan Limited
Fidelity International Investment Advisors (U.K.) Limited
General Distributor
Fidelity Distributors Corporation
Boston, MA
Transfer and Service Agents
Fidelity Investments Institutional Operations Company, Inc.
Boston, MA
Fidelity Service Company, Inc.
Boston, MA
Custodian
State Street Bank and Trust Company
Quincy, MA
AJAFI-UANN-1207
1.784757.104
(Fidelity Investment logo)(registered trademark)
(Fidelity Investment logo)(registered trademark)
Fidelity® Advisor
Korea
Fund - Class A, Class T, Class B
and Class C
Annual Report
October 31, 2007
(2_fidelity_logos) (Registered_Trademark)
Contents
Chairman's Message | <Click Here> | Ned Johnson's message to shareholders. |
Performance | <Click Here> | How the fund has done over time. |
Management's Discussion | <Click Here> | The manager's review of fund performance, strategy and outlook |
Shareholder Expense Example | <Click Here> | An example of shareholder expenses. |
Investment Changes | <Click Here> | A summary of major shifts in the fund's investments over the past six months. |
Investments | <Click Here> | A complete list of the fund's investments with their market values. |
Financial Statements | <Click Here> | Statements of assets and liabilities, operations, and changes in net assets,
as well as financial highlights. |
Notes | <Click Here> | Notes to the financial statements. |
Report of Independent Registered Public Accounting Firm | <Click Here> | |
Trustees and Officers | <Click Here> | |
Distributions | <Click Here> | |
Proxy Voting Results | <Click Here> | |
Board Approval of Investment Advisory Contracts and Management Fees | <Click Here> | |
To view a fund's proxy voting guidelines and proxy voting record for the 12-month period ended June 30, visit http://www.fidelity.com (search for "proxy voting guidelines") or visit the Securities and Exchange Commission's (SEC) web site at http://www.sec.gov. You may also call 1-877-208-0098 to request a free copy of the proxy voting guidelines.
Standard & Poor's, S&P and S&P 500 are registered service marks of The McGraw-Hill Companies, Inc. and have been licensed for use by Fidelity Distributors Corporation.
Other third party marks appearing herein are the property of their respective owners.
All other marks appearing herein are registered or unregistered trademarks or service marks of FMR LLC or an affiliated company.
Annual Report
This report and the financial statements contained herein are submitted for the general information of the shareholders of the fund. This report is not authorized for distribution to prospective investors in the fund unless preceded or accompanied by an effective prospectus.
A fund files its complete schedule of portfolio holdings with the SEC for the first and third quarters of each fiscal year on Form N-Q. Forms N-Q are available on the SEC's web site at http://www.sec.gov. A fund's Forms N-Q may be reviewed and copied at the SEC's Public Reference Room in Washington, DC. Information regarding the operation of the SEC's Public Reference Room may be obtained by calling 1-800-SEC-0330. For a complete list of a fund's portfolio holdings, view the most recent holdings listing, semiannual report, or annual report on Fidelity's web site at http://www.fidelity.com or http://www.advisor.fidelity.com, as applicable.
NOT FDIC INSURED · MAY LOSE VALUE · NO BANK GUARANTEE
Neither the fund nor Fidelity Distributors Corporation is a bank.
Annual Report
Chairman's Message
(photo_of_Edward_C_Johnson_3d)
Dear Shareholder:
Many stock and bond markets around the world have been unsettled of late; however, volatility can often lead to opportunity for patient investors. Financial markets are always unpredictable, but there are a number of time-tested principles that can put the historical odds in your favor.
One of the basic tenets is to invest for the long term. Over time, riding out the markets' inevitable ups and downs has proven much more effective than selling into panic or chasing the hottest trend. Even missing only a few of the markets' best days can significantly diminish investor returns. Patience also affords the benefits of compounding - of earning interest on additional income or reinvested dividends and capital gains. There are tax advantages and cost benefits to consider as well. The more you sell, the more taxes you pay, and the more you trade, the higher the costs. While staying the course doesn't eliminate risk, it can considerably lessen the effect of short-term declines.
You can further manage your investing risk through diversification. And today, more than ever, geographic diversification should be taken into account. Studies indicate that asset allocation is the single most important determinant of a portfolio's long-term success. The right mix of stocks, bonds and cash - aligned to your particular risk tolerance and investment objective - is very important. Age-appropriate rebalancing is also an essential aspect of asset allocation. For younger investors, an emphasis on equities - which historically have been the best-performing asset class over time - is encouraged. As investors near their specific goal, such as retirement or sending a child to college, consideration may be given to replacing volatile assets (e.g. common stocks) with more-stable fixed investments (bonds or savings plans).
A third investment principle - investing regularly - can help lower the average cost of your purchases. Investing a certain amount of money each month or quarter helps ensure you won't pay for all your shares at market highs. This strategy - known as dollar cost averaging - also reduces unconstructive "emotion" from investing, helping shareholders avoid selling weak performers just prior to an upswing, or chasing a hot performer just before a correction.
We invite you to contact us via the Internet, through our Investor Centers or over the phone. It is our privilege to provide you the information you need to make the investments that are right for you.
Sincerely,
/s/Edward C. Johnson 3d
Edward C. Johnson 3d
Annual Report
Performance: The Bottom Line
Average annual total return reflects the change in the value of an investment, assuming reinvestment of the class' dividend income and capital gains (the profits earned upon the sale of securities that have grown in value) and assuming a constant rate of performance each year. The $10,000 table and the fund's returns do not reflect the deduction of taxes that a shareholder would pay on fund distributions or the redemption of fund shares. During periods of reimbursement by Fidelity, a fund's total return will be greater than it would be had the reimbursement not occurred. How a fund did yesterday is no guarantee of how it will do tomorrow. Returns reflect the conversion of Class B shares to Class A shares after a maximum of seven years.
Average Annual Total Returns
Periods ended October 31, 2007 | | Past 1
year | Past 5
years | Past 10
years |
Class A (incl. 5.75% sales charge) A | | 71.44% | 35.63% | 23.98% |
Class T (incl. 3.50% sales charge) B | | 74.85% | 35.88% | 24.01% |
Class B (incl. contingent deferred sales charge) C | | 75.19% | 36.05% | 24.03% |
Class C (incl. contingent deferred sales charge) D | | 79.21% | 36.15% | 24.00% |
A Class A's 12b-1 fee may have ranged over time between 0.25% and 0.35%, as an equivalent amount of brokerage commissions of up to 0.10% of the class's average net assets may have been used to promote the sale of class shares. This practice has been discontinued and no commissions incurred after June 30, 2003 have been used to pay distribution expenses. Class A's 12b-1 plan currently authorizes a 0.25% 12b-1 fee. The initial offering of Class A shares took place on July 3, 2000. Returns prior to July 3, 2000 are those of Fidelity Advisor Korea Fund, Inc., (the Closed-End Fund). At the close of business on June 30, 2000, the Closed-End Fund reorganized as an open-end fund through a transfer of all its assets and liabilities to Fidelity Advisor Korea Fund (the fund). Shareholders of the Closed-End Fund received Class A shares of the fund in exchange for their shares of the Closed-End Fund. If Class A shares' total expenses, including its 12b-1 fee, had been reflected in the Closed-End Fund's performance, Class A's returns prior to July 3, 2000 may have been lower.
B Class T's 12b-1 fee may have ranged over time between 0.50% and 0.60%, as an equivalent amount of brokerage commissions of up to 0.10% of the class's average net assets may have been used to promote the sale of class shares. This practice has been discontinued and no commissions incurred after June 30, 2003 have been used to pay distribution expenses. Class T's 12b-1 plan currently authorizes a 0.50% 12b-1 fee. The initial offering of Class T shares took place on July 3, 2000. Returns prior to July 3, 2000 are those of Fidelity Advisor Korea Fund, Inc., (the Closed-End Fund). At the close of business on June 30, 2000, the Closed-End Fund reorganized as an open-end fund through a transfer of all of its assets and liabilities to Fidelity Advisor Korea Fund (the fund). Shareholders of the Closed-End Fund received Class A shares of the fund in exchange for their shares of the Closed-End Fund. If Class T shares' total expenses, including its 12b-1 fee, had been reflected in the Closed-End Fund's performance, Class T's returns prior to July 3, 2000 may have been lower.
Annual Report
Performance - continued
C Class B shares bear a 1.00% 12b-1 fee that is reflected in returns after June 30, 2000. The initial offering of Class B shares took place on July 3, 2000. Returns prior to July 3, 2000 are those of Fidelity Advisor Korea Fund, Inc., (the Closed-End Fund). At the close of business on June 30, 2000, the Closed-End Fund reorganized as an open-end fund through a transfer of all of its assets and liabilities to Fidelity Advisor Korea Fund (the fund). Shareholders of the Closed-End Fund received Class A shares of the fund in exchange for their shares of the Closed-End Fund. If Class B shares' total expenses, including its 1.00% 12b-1 fee, had been reflected in the Closed-End Fund's performance, Class B's returns, prior to July 3, 2000 may have been lower. Class B shares' contingent deferred sales charges included in the past one year, past five year, and past ten year total return figures are 5%, 2%, and 0%, respectively.
D Class C shares bear a 1.00% 12b-1 fee that is reflected in returns after June 30, 2000. The initial offering of Class C shares took place on July 3, 2000. Returns prior to July 3, 2000 are those of Fidelity Advisor Korea Fund, Inc., (the Closed-End Fund). At the close of business on June 30, 2000, the Closed-End Fund reorganized as an open-end fund through a transfer of all of its assets and liabilities to Fidelity Advisor Korea Fund (the fund). Shareholders of the Closed-End Fund received Class A shares of the fund in exchange for their shares of the Closed-End Fund. If Class C shares' total expenses, including its 1.00% 12b-1 fee, had been reflected in the Closed-End Fund's performance, Class C's returns, prior to July 3, 2000 may have been lower. Class C shares' contingent deferred sales charge included in the past one year, past five year, and past ten year total return figures are 1%, 0%, and 0%, respectively.
$10,000 Over 10 Years
Let's say hypothetically that $10,000 was invested in Fidelity® Advisor Korea Fund - Class T on October 31, 1997, and the current 3.50% sales charge was paid. The chart shows how the value of your investment would have changed, and also shows how the Korea Composite Stock Price Index (KOSPI) performed over the same period. The initial offering of Class T took place on July 3, 2000. See the previous page for additional information regarding the performance of Class T.
Annual Report
Management's Discussion of Fund Performance
Comments from David Urquhart, Portfolio Manager of Fidelity® Advisor Korea Fund
South Korean stocks were hitting on all cylinders during the 12 months ending October 31, 2007, as reflected in the outsized 58.69% return of the Korea Composite Stock Price Index (KOSPI). The drivers of this run-up were favorable economic fundamentals and robust corporate performance, along with further depreciation of the U.S. dollar versus the Korean won. A brief but sharp sell-off during August was a result of concerns - triggered by the U.S. subprime mortgage meltdown - about a potential U.S. economic slowdown. However, investor sentiment improved after the Federal Reserve Board cut short-term interest rates in September, enabling the Korean market to post fresh highs by period end.
During the past year, the fund's Class A, Class T, Class B and Class C shares posted returns of 81.90%, 81.20%, 80.19% and 80.21%, respectively (excluding sales charges), handily beating the KOSPI. The fund got a powerful boost from the capital goods segment of industrials due to both an overweighting and favorable stock picking. Stock selection also was rewarding in information technology and to a lesser extent in consumer staples. Further aiding our results was an overweighting in the household and personal products segment of consumer staples and underweightings in the consumer discretionary, telecommunication services and utilities sectors, which posted weaker gains than the benchmark. An out-of-index position in Taewoong, a global leader in manufacturing products for shipping, power plants, industrial machinery and wind power turbines, was our top contributor by a wide margin. Other significant contributors were Internet search portal NHN and niche shipbuilder Hyundai Mipo Dockyard. Conversely, underweighting the strong-performing materials sector was detrimental, and overweighting the weak-performing technology sector undercut some of the stock selection benefits there. Meanwhile, unfavorable stock selection in consumer discretionary lessened the positive impact of underweighting that group. Kookmin Bank hurt our returns, as did semiconductor manufacturer PSK.
Notes to shareholders: On November 14, 2007, shareholders of Fidelity Advisor Korea Fund approved the merger of Advisor Korea into Fidelity Advisor Emerging Asia Fund. The merger was completed on December 7, 2007.
Fidelity Advisor Korea Fund may invest up to 35% of its total assets in any industry that represents more than 20% of the Korean market. As of October 31, 2007, the fund did not have more than 25% of its assets invested in any one industry.
The views expressed above reflect those of the portfolio manager(s) only through the end of the period as stated on the cover of this report and do not necessarily represent the views of Fidelity or any other person in the Fidelity organization. Any such views are subject to change at any time based upon market or other conditions and Fidelity disclaims any responsibility to update such views. These views may not be relied on as investment advice and, because investment decisions for a Fidelity fund are based on numerous factors, may not be relied on as an indication of trading intent on behalf of any Fidelity fund.
Annual Report
Shareholder Expense Example
As a shareholder of the Fund, you incur two types of costs: (1) transaction costs, including sales charges (loads) on purchase payments or redemption proceeds, redemption fees, and (2) ongoing costs, including management fees, distribution and/or service (12b-1) fees and other Fund expenses. This Example is intended to help you understand your ongoing costs (in dollars) of investing in the Fund and to compare these costs with the ongoing costs of investing in other mutual funds.
The Example is based on an investment of $1,000 invested at the beginning of the period and held for the entire period (May 1, 2007 to October 31, 2007).
Actual Expenses
The first line of the accompanying table for each class of the Fund provides information about actual account values and actual expenses. You may use the information in this line, together with the amount you invested, to estimate the expenses that you paid over the period. Simply divide your account value by $1,000.00 (for example, an $8,600 account value divided by $1,000.00 = 8.6), then multiply the result by the number in the first line for a class of the Fund under the heading entitled "Expenses Paid During Period" to estimate the expenses you paid on your account during this period. In addition, the Fund, as a shareholder in the underlying Fidelity Central Funds, will indirectly bear its pro rata share of the fees and expenses incurred by the underlying Fidelity Central Funds. These fees and expenses are not included in the Fund's annualized expense ratio used to calculate the expense estimate in the table below.
Hypothetical Example for Comparison Purposes
The second line of the accompanying table for each class of the Fund provides information about hypothetical account values and hypothetical expenses based on a Class' actual expense ratio and an assumed rate of return of 5% per year before expenses, which is not the Class' actual return. The hypothetical account values and expenses may not be used to estimate the actual ending account balance or expenses you paid for the period. You may use this information to compare the ongoing costs of investing in the Fund and other funds. To do so, compare this 5% hypothetical example with the 5% hypothetical examples that appear in the shareholder reports of the other funds. In addition, the Fund, as a shareholder in the underlying Fidelity Central Funds, will indirectly bear its pro rata share of the fees and expenses incurred by the underlying Fidelity Central Funds. These fees and expenses are not included in the Fund's annualized expense ratio used to calculate the expense estimate in the table below.
Annual Report
Please note that the expenses shown in the table are meant to highlight your ongoing costs only and do not reflect any transaction costs. Therefore, the second line of the table is useful in comparing ongoing costs only, and will not help you determine the relative total costs of owning different funds. In addition, if these transactional costs were included, your costs would have been higher.
| Beginning
Account Value
May 1, 2007 | Ending
Account Value
October 31, 2007 | Expenses Paid
During Period*
May 1, 2007 to
October 31, 2007 |
Class A | | | |
Actual | $ 1,000.00 | $ 1,519.90 | $ 10.16 |
Hypothetical A | $ 1,000.00 | $ 1,017.14 | $ 8.13 |
Class T | | | |
Actual | $ 1,000.00 | $ 1,515.70 | $ 11.73 |
Hypothetical A | $ 1,000.00 | $ 1,015.88 | $ 9.40 |
Class B | | | |
Actual | $ 1,000.00 | $ 1,511.60 | $ 14.88 |
Hypothetical A | $ 1,000.00 | $ 1,013.36 | $ 11.93 |
Class C | | | |
Actual | $ 1,000.00 | $ 1,511.40 | $ 14.88 |
Hypothetical A | $ 1,000.00 | $ 1,013.36 | $ 11.93 |
Institutional Class | | | |
Actual | $ 1,000.00 | $ 1,519.40 | $ 8.57 |
Hypothetical A | $ 1,000.00 | $ 1,018.40 | $ 6.87 |
A 5% return per year before expenses
* Expenses are equal to each Class' annualized expense ratio (shown in the table below); multiplied by the average account value over the period, multiplied by 184/365 (to reflect the one-half year period).
| Annualized
Expense Ratio |
Class A | 1.60% |
Class T | 1.85% |
Class B | 2.35% |
Class C | 2.35% |
Institutional Class | 1.35% |
Annual Report
Investment Changes
Top Ten Stocks as of October 31, 2007 |
| % of fund's
net assets | % of fund's net assets
6 months ago |
Samsung Electronics Co. Ltd. | 7.9 | 9.7 |
POSCO | 6.4 | 5.8 |
NHN Corp. | 6.3 | 4.2 |
Hyundai Heavy Industries Co. Ltd. | 5.8 | 2.1 |
Taewoong Co. Ltd. | 5.3 | 2.6 |
LG.Philips LCD Co. Ltd. | 4.6 | 3.1 |
Hyundai Mipo Dockyard Co. Ltd. | 4.2 | 3.7 |
Doosan Infracore Co. Ltd. | 3.8 | 5.0 |
LG Household & Health Care Ltd. | 3.6 | 3.0 |
Kookmin Bank | 3.5 | 5.6 |
| 51.4 | |
Market Sectors as of October 31, 2007 |
| % of fund's
net assets | % of fund's net assets
6 months ago |
Industrials | 41.6 | 31.3 |
Information Technology | 21.9 | 21.0 |
Financials | 11.7 | 19.2 |
Materials | 7.3 | 5.8 |
Consumer Staples | 6.5 | 7.3 |
Consumer Discretionary | 6.4 | 8.3 |
Energy | 2.3 | 2.1 |
Telecommunication Services | 1.8 | 1.9 |
Utilities | 0.0 | 2.0 |
Asset Allocation (% of fund's net assets) |
As of October 31, 2007 | As of April 30, 2007 |
 | Stocks 99.5% | | | Stocks 98.9% | |
 | Short-Term
Investments and
Net Other Assets 0.5% | | | Short-Term
Investments and
Net Other Assets 1.1% | |
| | | | | |

Annual Report
Investments October 31, 2007
Showing Percentage of Net Assets
Common Stocks - 98.7% |
| Shares | | Value |
CONSUMER DISCRETIONARY - 6.4% |
Auto Components - 0.9% |
Hyundai Mobis | 7,640 | | $ 769,019 |
Automobiles - 0.4% |
Hyundai Motor Co. | 3,880 | | 308,366 |
Hotels, Restaurants & Leisure - 0.9% |
Hana Tour Service, Inc. | 8,183 | | 737,986 |
Household Durables - 4.2% |
LG Electronics, Inc. | 16,150 | | 1,698,359 |
Woongjin Coway Co. Ltd. | 44,420 | | 1,702,665 |
| | 3,401,024 |
TOTAL CONSUMER DISCRETIONARY | | 5,216,395 |
CONSUMER STAPLES - 6.5% |
Food & Staples Retailing - 2.9% |
Shinsegae Co. Ltd. | 2,977 | | 2,345,846 |
Household Products - 3.6% |
LG Household & Health Care Ltd. | 13,290 | | 2,963,077 |
TOTAL CONSUMER STAPLES | | 5,308,923 |
ENERGY - 2.3% |
Oil, Gas & Consumable Fuels - 2.3% |
SK Energy Co. Ltd. | 8,008 | | 1,840,613 |
FINANCIALS - 11.7% |
Capital Markets - 1.7% |
Daewoo Securities Co. Ltd. | 15,980 | | 476,209 |
Korea Investment Holdings Co. Ltd. | 9,980 | | 895,318 |
| | 1,371,527 |
Commercial Banks - 6.3% |
Kookmin Bank | 34,920 | | 2,855,896 |
Shinhan Financial Group Co. Ltd. | 34,442 | | 2,255,435 |
| | 5,111,331 |
Insurance - 3.7% |
Meritz Fire & Marine Insurance Co. Ltd. | 98,381 | | 1,438,423 |
Samsung Fire & Marine Insurance Co. Ltd. | 5,750 | | 1,599,824 |
| | 3,038,247 |
TOTAL FINANCIALS | | 9,521,105 |
Common Stocks - continued |
| Shares | | Value |
INDUSTRIALS - 41.6% |
Construction & Engineering - 10.1% |
Doosan Heavy Industries & Construction Co. Ltd. | 14,720 | | $ 2,718,322 |
GS Engineering & Construction Corp. | 9,470 | | 2,006,547 |
Hyundai Engineering & Construction Co. Ltd. (a) | 13,086 | | 1,340,047 |
Samsung Engineering Co. Ltd. | 15,980 | | 2,152,605 |
| | 8,217,521 |
Industrial Conglomerates - 5.5% |
LG Corp. | 15,850 | | 1,450,586 |
Samsung Techwin Co. Ltd. | 36,590 | | 2,245,350 |
SK Holdings Co. Ltd. | 2,553 | | 766,946 |
| | 4,462,882 |
Machinery - 22.9% |
Daewoo Shipbuilding & Marine Engineering Co. Ltd. | 34,720 | | 2,205,608 |
Doosan Infracore Co. Ltd. | 73,110 | | 3,111,570 |
Hyundai Heavy Industries Co. Ltd. | 8,310 | | 4,672,800 |
Hyundai Mipo Dockyard Co. Ltd. | 7,650 | | 3,399,300 |
Hyunjin Materials Co. Ltd. | 13,800 | | 906,758 |
Taewoong Co. Ltd. | 30,209 | | 4,317,460 |
| | 18,613,496 |
Marine - 1.5% |
STX Pan Ocean Co. Ltd. | 465,000 | | 1,196,157 |
Trading Companies & Distributors - 1.6% |
Samsung Corp. | 14,440 | | 1,336,555 |
TOTAL INDUSTRIALS | | 33,826,611 |
INFORMATION TECHNOLOGY - 21.9% |
Electronic Equipment & Instruments - 5.8% |
LG.Philips LCD Co. Ltd. (a) | 67,890 | | 3,750,970 |
SFA Engineering Corp. | 12,266 | | 940,892 |
| | 4,691,862 |
Internet Software & Services - 6.3% |
NHN Corp. (a) | 15,808 | | 5,083,508 |
Semiconductors & Semiconductor Equipment - 9.8% |
Hynix Semiconductor, Inc. (a) | 17,430 | | 488,991 |
PSK, Inc. | 47,854 | | 582,740 |
Common Stocks - continued |
| Shares | | Value |
INFORMATION TECHNOLOGY - continued |
Semiconductors & Semiconductor Equipment - continued |
Samsung Electronics Co. Ltd. | 10,432 | | $ 6,433,065 |
Simm Tech Co. Ltd. | 49,615 | | 491,987 |
| | 7,996,783 |
TOTAL INFORMATION TECHNOLOGY | | 17,772,153 |
MATERIALS - 6.5% |
Chemicals - 0.1% |
MNTECH Co. Ltd. | 3,390 | | 64,179 |
Metals & Mining - 6.4% |
POSCO | 7,090 | | 5,170,843 |
TOTAL MATERIALS | | 5,235,022 |
TELECOMMUNICATION SERVICES - 1.8% |
Diversified Telecommunication Services - 1.8% |
LG Dacom Corp. | 44,180 | | 1,435,355 |
TOTAL COMMON STOCKS (Cost $35,950,716) | 80,156,177 |
Nonconvertible Preferred Stocks - 0.8% |
| | | |
MATERIALS - 0.8% |
Chemicals - 0.8% |
LG Chemical Ltd. | 13,420 | | 671,865 |
TOTAL NONCONVERTIBLE PREFERRED STOCKS (Cost $725,395) | 671,865 |
Money Market Funds - 0.9% |
| | | |
Fidelity Cash Central Fund, 4.97% (b)
(Cost $734,710) | 734,710 | | 734,710 |
TOTAL INVESTMENT PORTFOLIO - 100.4% (Cost $37,410,821) | | 81,562,752 |
NET OTHER ASSETS - (0.4)% | | (299,911) |
NET ASSETS - 100% | $ 81,262,841 |
Legend |
(a) Non-income producing |
(b) Affiliated fund that is available only to investment companies and other accounts managed by Fidelity Investments. The rate quoted is the annualized seven-day yield of the fund at period end. A complete unaudited listing of the fund's holdings as of its most recent quarter end is available upon request. |
Affiliated Central Funds |
Information regarding fiscal year to date income earned by the Fund from investments in Fidelity Central Funds is as follows: |
Fund | Income earned |
Fidelity Cash Central Fund | $ 62,179 |
See accompanying notes which are an integral part of the financial statements.
Annual Report
Financial Statements
Statement of Assets and Liabilities
| October 31, 2007 |
Assets | | |
Investment in securities, at value - See accompanying schedule: Unaffiliated issuers (cost $36,676,111) | $ 80,828,042 | |
Fidelity Central Funds (cost $734,710) | 734,710 | |
Total Investments (cost $37,410,821) | | $ 81,562,752 |
Receivable for fund shares sold | | 38,704 |
Dividends receivable | | 9,121 |
Distributions receivable from Fidelity Central Funds | | 4,405 |
Prepaid expenses | | 315 |
Receivable from investment adviser for expense reductions | | 19,776 |
Other receivables | | 5,598 |
Total assets | | 81,640,671 |
| | |
Liabilities | | |
Payable for fund shares redeemed | $ 163,322 | |
Accrued management fee | 50,772 | |
Distribution fees payable | 31,075 | |
Other affiliated payables | 17,201 | |
Other payables and accrued expenses | 115,460 | |
Total liabilities | | 377,830 |
| | |
Net Assets | | $ 81,262,841 |
Net Assets consist of: | | |
Paid in capital | | $ 30,799,759 |
Accumulated undistributed net realized gain (loss) on investments and foreign currency transactions | | 6,310,948 |
Net unrealized appreciation (depreciation) on investments and assets and liabilities in foreign currencies | | 44,152,134 |
Net Assets | | $ 81,262,841 |
See accompanying notes which are an integral part of the financial statements.
Annual Report
Financial Statements - continued
Statement of Assets and Liabilities - continued
| October 31, 2007 |
Calculation of Maximum Offering Price
Class A:
Net Asset Value and redemption price per share ($42,878,952 ÷ 993,821 shares) | | $ 43.15 |
| | |
Maximum offering price per share (100/94.25 of $43.15) | | $ 45.78 |
Class T:
Net Asset Value and redemption price per share ($8,252,459 ÷ 194,606 shares) | | $ 42.41 |
| | |
Maximum offering price per share (100/96.50 of $42.41) | | $ 43.95 |
Class B:
Net Asset Value and offering price per share ($12,281,054 ÷ 299,215 shares)A | | $ 41.04 |
| | |
Class C:
Net Asset Value and offering price per share ($12,971,028 ÷ 315,502 shares)A | | $ 41.11 |
| | |
| | |
Institutional Class:
Net Asset Value, offering price and redemption price per share ($4,879,348 ÷ 111,421 shares) | | $ 43.79 |
A Redemption price per share is equal to net asset value less any applicable contingent deferred sales charge.
See accompanying notes which are an integral part of the financial statements.
Annual Report
Statement of Operations
| Year ended
October 31,
2007 |
Investment Income | | |
Dividends | | $ 969,536 |
Interest | | 173 |
Income from Fidelity Central Funds | | 62,179 |
| | 1,031,888 |
Less foreign taxes withheld | | (156,742) |
Total income | | 875,146 |
| | |
Expenses | | |
Management fee | $ 512,077 | |
Transfer agent fees | 168,570 | |
Distribution fees | 317,025 | |
Accounting fees and expenses | 33,091 | |
Custodian fees and expenses | 69,465 | |
Independent trustees' compensation | 213 | |
Registration fees | 53,271 | |
Audit | 99,906 | |
Legal | 11,126 | |
Miscellaneous | 19,115 | |
Total expenses before reductions | 1,283,859 | |
Expense reductions | (141,361) | 1,142,498 |
Net investment income (loss) | | (267,352) |
Realized and Unrealized Gain (Loss) Net realized gain (loss) on: | | |
Investment securities: | | |
Unaffiliated issuers | 7,109,352 | |
Foreign currency transactions | (35,411) | |
Total net realized gain (loss) | | 7,073,941 |
Change in net unrealized appreciation (depreciation) on: Investment securities | 31,829,451 | |
Assets and liabilities in foreign currencies | 203 | |
Total change in net unrealized appreciation (depreciation) | | 31,829,654 |
Net gain (loss) | | 38,903,595 |
Net increase (decrease) in net assets resulting from operations | | $ 38,636,243 |
See accompanying notes which are an integral part of the financial statements.
Annual Report
Financial Statements - continued
Statement of Changes in Net Assets
| Year ended
October 31,
2007 | Year ended
October 31,
2006 |
Increase (Decrease) in Net Assets | | |
Operations | | |
Net investment income (loss) | $ (267,352) | $ (365,798) |
Net realized gain (loss) | 7,073,941 | 7,695,286 |
Change in net unrealized appreciation (depreciation) | 31,829,654 | 5,279,885 |
Net increase (decrease) in net assets resulting
from operations | 38,636,243 | 12,609,373 |
Distributions to shareholders from net investment income | (404,953) | (30,239) |
Distributions to shareholders from net realized gain | (600,455) | (35,505) |
Total distributions | (1,005,408) | (65,744) |
Share transactions - net increase (decrease) | (16,257,043) | 19,189,578 |
Redemption fees | 14,679 | 89,251 |
Total increase (decrease) in net assets | 21,388,471 | 31,822,458 |
| | |
Net Assets | | |
Beginning of period | 59,874,370 | 28,051,912 |
End of period | $ 81,262,841 | $ 59,874,370 |
See accompanying notes which are an integral part of the financial statements.
Annual Report
Financial Highlights - Class A
Years ended October 31, | 2007 | 2006 | 2005 | 2004 | 2003 |
Selected Per-Share Data | | | | | |
Net asset value, beginning of period | $ 24.16 | $ 17.40 | $ 11.93 | $ 11.07 | $ 9.05 |
Income from Investment Operations | | | | | |
Net investment income (loss) C | (.05) | (.08) | .04 | (.06) | .01 |
Net realized and unrealized gain (loss) | 19.49 | 6.87 | 5.42 | .91 | 2.01 |
Total from investment operations | 19.44 | 6.79 | 5.46 | .85 | 2.02 |
Distributions from net investment income | (.22) | (.03) | - | - | - |
Distributions from net realized gain | (.24) | (.03) | - | - | - |
Total distributions | (.46) | (.06) | - | - | - |
Redemption fees added to paid in capital C | .01 | .03 | .01 | .01 | - |
Net asset value, end of period | $ 43.15 | $ 24.16 | $ 17.40 | $ 11.93 | $ 11.07 |
Total ReturnA,B | 81.90% | 39.24% | 45.85% | 7.77% | 22.32% |
Ratios to Average Net Assets D,F | | | | | |
Expenses before reductions | 1.76% | 1.82% | 2.25% | 2.76% | 2.85% |
Expenses net of fee waivers, if any | 1.60% | 1.60% | 1.69% | 2.00% | 2.00% |
Expenses net of all reductions | 1.55% | 1.41% | 1.65% | 2.00% | 2.00% |
Net investment income (loss) | (.17)% | (.36)% | .28% | (.50)% | .12% |
Supplemental Data | | | | | |
Net assets, end of period (000 omitted) | $ 42,879 | $ 29,541 | $ 15,566 | $ 12,309 | $ 12,187 |
Portfolio turnover rate E | 33% | 133% | 97% | 77% | 127% |
A Total returns would have been lower had certain expenses not been reduced during the periods shown.
B Total returns do not include the effect of the sales charges.
C Calculated based on average shares outstanding during the period.
D Fees and expenses of the underlying Fidelity Central Funds are not included in the Fund's expense ratio. The Fund indirectly bears its proportionate share of the expenses of any underlying Fidelity Central Funds.
E Amount does not include the portfolio activity of any underlying Fidelity Central Funds.
F Expense ratios reflect operating expenses of the class. Expenses before reductions do not reflect amounts reimbursed by the investment adviser or reductions from brokerage service arrangements or other expense offset arrangements and do not represent the amount paid by the class during periods when reimbursements or reductions occur. Expenses net of fee waivers reflect expenses after reimbursement by the investment adviser but prior to reductions from brokerage service arrangements or other expense offset arrangements. Expenses net of all reductions represent the net expenses paid by the class.
See accompanying notes which are an integral part of the financial statements.
Annual Report
Financial Highlights - Class T
Years ended October 31, | 2007 | 2006 | 2005 | 2004 | 2003 |
Selected Per-Share Data | | | | | |
Net asset value, beginning of period | $ 23.79 | $ 17.15 | $ 11.78 | $ 10.96 | $ 8.99 |
Income from Investment Operations | | | | | |
Net investment income (loss) C | (.12) | (.14) | .01 | (.09) | (.01) |
Net realized and unrealized gain (loss) | 19.14 | 6.77 | 5.35 | .90 | 1.98 |
Total from investment operations | 19.02 | 6.63 | 5.36 | .81 | 1.97 |
Distributions from net investment income | (.17) | - | - | - | - |
Distributions from net realized gain | (.24) | (.02) | - | - | - |
Total distributions | (.41) | (.02) | - | - | - |
Redemption fees added to paid in capital C | .01 | .03 | .01 | .01 | - |
Net asset value, end of period | $ 42.41 | $ 23.79 | $ 17.15 | $ 11.78 | $ 10.96 |
Total Return A,B | 81.20% | 38.87% | 45.59% | 7.48% | 21.91% |
Ratios to Average Net Assets D,F | | | | | |
Expenses before reductions | 2.12% | 2.23% | 2.67% | 3.54% | 3.74% |
Expenses net of fee waivers, if any | 1.85% | 1.85% | 1.91% | 2.25% | 2.25% |
Expenses net of all reductions | 1.80% | 1.66% | 1.87% | 2.25% | 2.25% |
Net investment income (loss) | (.42)% | (.61)% | .06% | (.75)% | (.13)% |
Supplemental Data | | | | | |
Net assets, end of period (000 omitted) | $ 8,252 | $ 5,800 | $ 3,407 | $ 1,383 | $ 1,223 |
Portfolio turnover rate E | 33% | 133% | 97% | 77% | 127% |
A Total returns would have been lower had certain expenses not been reduced during the periods shown.
B Total returns do not include the effect of the sales charges.
C Calculated based on average shares outstanding during the period.
D Fees and expenses of the underlying Fidelity Central Funds are not included in the Fund's expense ratio. The Fund indirectly bears its proportionate share of the expenses of any underlying Fidelity Central Funds.
E Amount does not include the portfolio activity of any underlying Fidelity Central Funds.
F Expense ratios reflect operating expenses of the class. Expenses before reductions do not reflect amounts reimbursed by the investment adviser or reductions from brokerage service arrangements or other expense offset arrangements and do not represent the amount paid by the class during periods when reimbursements or reductions occur. Expenses net of fee waivers reflect expenses after reimbursement by the investment adviser but prior to reductions from brokerage service arrangements or other expense offset arrangements. Expenses net of all reductions represent the net expenses paid by the class.
See accompanying notes which are an integral part of the financial statements.
Annual Report
Financial Highlights - Class B
Years ended October 31, | 2007 | 2006 | 2005 | 2004 | 2003 |
Selected Per-Share Data | | | | | |
Net asset value, beginning of period | $ 23.07 | $ 16.69 | $ 11.53 | $ 10.78 | $ 8.88 |
Income from Investment Operations | | | | | |
Net investment income (loss) C | (.26) | (.24) | (.07) | (.14) | (.06) |
Net realized and unrealized gain (loss) | 18.53 | 6.59 | 5.22 | .88 | 1.96 |
Total from investment operations | 18.27 | 6.35 | 5.15 | .74 | 1.90 |
Distributions from net investment income | (.07) | - | - | - | - |
Distributions from net realized gain | (.24) | - | - | - | - |
Total distributions | (.31) | - | - | - | - |
Redemption fees added to paid in capital C | .01 | .03 | .01 | .01 | - |
Net asset value, end of period | $ 41.04 | $ 23.07 | $ 16.69 | $ 11.53 | $ 10.78 |
Total ReturnA,B | 80.19% | 38.23% | 44.75% | 6.96% | 21.40% |
Ratios to Average Net Assets D,F | | | | | |
Expenses before reductions | 2.54% | 2.64% | 3.06% | 3.63% | 4.08% |
Expenses net of fee waivers, if any | 2.35% | 2.35% | 2.42% | 2.75% | 2.75% |
Expenses net of all reductions | 2.30% | 2.16% | 2.38% | 2.75% | 2.75% |
Net investment income (loss) | (.92)% | (1.11)% | (.45)% | (1.25)% | (.63)% |
Supplemental Data | | | | | |
Net assets, end of period (000 omitted) | $ 12,281 | $ 8,587 | $ 4,384 | $ 2,279 | $ 1,175 |
Portfolio turnover rate E | 33% | 133% | 97% | 77% | 127% |
A Total returns would have been lower had certain expenses not been reduced during the periods shown.
B Total returns do not include the effect of the contingent deferred sales charge.
C Calculated based on average shares outstanding during the period.
D Fees and expenses of the underlying Fidelity Central Funds are not included in the Fund's expense ratio. The Fund indirectly bears its proportionate share of the expenses of any underlying Fidelity Central Funds.
E Amount does not include the portfolio activity of any underlying Fidelity Central Funds.
F Expense ratios reflect operating expenses of the class. Expenses before reductions do not reflect amounts reimbursed by the investment adviser or reductions from brokerage service arrangements or other expense offset arrangements and do not represent the amount paid by the class during periods when reimbursements or reductions occur. Expenses net of fee waivers reflect expenses after reimbursement by the investment adviser but prior to reductions from brokerage service arrangements or other expense offset arrangements. Expenses net of all reductions represent the net expenses paid by the class.
See accompanying notes which are an integral part of the financial statements.
Annual Report
Financial Highlights - Class C
Years ended October 31, | 2007 | 2006 | 2005 | 2004 | 2003 |
Selected Per-Share Data | | | | | |
Net asset value, beginning of period | $ 23.07 | $ 16.71 | $ 11.53 | $ 10.79 | $ 8.89 |
Income from Investment Operations | | | | | |
Net investment income (loss) C | (.26) | (.24) | (.06) | (.14) | (.06) |
Net realized and unrealized gain (loss) | 18.56 | 6.58 | 5.23 | .87 | 1.96 |
Total from investment operations | 18.30 | 6.34 | 5.17 | .73 | 1.90 |
Distributions from net investment income | (.03) | - | - | - | - |
Distributions from net realized gain | (.24) | (.01) | - | - | - |
Total distributions | (.27) | (.01) | - | - | - |
Redemption fees added to paid in capital C | .01 | .03 | .01 | .01 | - |
Net asset value, end of period | $ 41.11 | $ 23.07 | $ 16.71 | $ 11.53 | $ 10.79 |
Total Return A,B | 80.21% | 38.10% | 44.93% | 6.86% | 21.37% |
Ratios to Average Net Assets D,F | | | | | |
Expenses before reductions | 2.52% | 2.56% | 3.00% | 3.63% | 3.82% |
Expenses net of fee waivers, if any | 2.35% | 2.35% | 2.39% | 2.75% | 2.75% |
Expenses net of all reductions | 2.30% | 2.16% | 2.35% | 2.75% | 2.75% |
Net investment income (loss) | (.92)% | (1.11)% | (.42)% | (1.25)% | (.63)% |
Supplemental Data | | | | | |
Net assets, end of period (000 omitted) | $ 12,971 | $ 11,281 | $ 3,994 | $ 759 | $ 531 |
Portfolio turnover rate E | 33% | 133% | 97% | 77% | 127% |
A Total returns would have been lower had certain expenses not been reduced during the periods shown.
B Total returns do not include the effect of the contingent deferred sales charge.
C Calculated based on average shares outstanding during the period.
D Fees and expenses of the underlying Fidelity Central Funds are not included in the Fund's expense ratio. The Fund indirectly bears its proportionate share of the expenses of any underlying Fidelity Central Funds.
E Amount does not include the portfolio activity of any underlying Fidelity Central Funds.
F Expense ratios reflect operating expenses of the class. Expenses before reductions do not reflect amounts reimbursed by the investment adviser or reductions from brokerage service arrangements or other expense offset arrangements and do not represent the amount paid by the class during periods when reimbursements or reductions occur. Expenses net of fee waivers reflect expenses after reimbursement by the investment adviser but prior to reductions from brokerage service arrangements or other expense offset arrangements. Expenses net of all reductions represent the net expenses paid by the class.
See accompanying notes which are an integral part of the financial statements.
Annual Report
Financial Highlights - Institutional Class
Years ended October 31, | 2007 | 2006 | 2005 | 2004 | 2003 |
Selected Per-Share Data | | | | | |
Net asset value, beginning of period | $ 24.55 | $ 17.65 | $ 12.06 | $ 11.16 | $ 9.11 |
Income from Investment Operations | | | | | |
Net investment income (loss) B | .02 | (.03) | .09 | (.03) | .04 |
Net realized and unrealized gain (loss) | 19.74 | 6.97 | 5.49 | .92 | 2.01 |
Total from investment operations | 19.76 | 6.94 | 5.58 | .89 | 2.05 |
Distributions from net investment income | (.29) | (.04) | - | - | - |
Distributions from net realized gain | (.24) | (.03) | - | - | - |
Total distributions | (.53) | (.07) | - | - | - |
Redemption fees added to paid in capital B | .01 | .03 | .01 | .01 | - |
Net asset value, end of period | $ 43.79 | $ 24.55 | $ 17.65 | $ 12.06 | $ 11.16 |
Total ReturnA | 82.07% | 39.53% | 46.35% | 8.06% | 22.50% |
Ratios to Average Net Assets C,E | | | | | |
Expenses before reductions | 1.48% | 1.50% | 1.93% | 2.74% | 3.11% |
Expenses net of fee waivers, if any | 1.35% | 1.35% | 1.42% | 1.75% | 1.75% |
Expenses net of all reductions | 1.30% | 1.16% | 1.37% | 1.75% | 1.75% |
Net investment income (loss) | .08% | (.11)% | .55% | (.25)% | .38% |
Supplemental Data | | | | | |
Net assets, end of period (000 omitted) | $ 4,879 | $ 4,665 | $ 701 | $ 309 | $ 177 |
Portfolio turnover rate D | 33% | 133% | 97% | 77% | 127% |
A Total returns would have been lower had certain expenses not been reduced during the periods shown.
B Calculated based on average shares outstanding during the period.
C Fees and expenses of the underlying Fidelity Central Funds are not included in the Fund's expense ratio. The Fund indirectly bears its proportionate share of the expenses of any underlying Fidelity Central Funds.
D Amount does not include the portfolio activity of any underlying Fidelity Central Funds.
E Expense ratios reflect operating expenses of the class. Expenses before reductions do not reflect amounts reimbursed by the investment adviser or reductions from brokerage service arrangements or other expense offset arrangements and do not represent the amount paid by the class during periods when reimbursements or reductions occur. Expenses net of fee waivers reflect expenses after reimbursement by the investment adviser but prior to reductions from brokerage service arrangements or other expense offset arrangements. Expenses net of all reductions represent the net expenses paid by the class.
See accompanying notes which are an integral part of the financial statements.
Annual Report
Notes to Financial Statements
For the period ended October 31, 2007
1. Organization.
Fidelity Advisor Korea Fund (the Fund) is a non-diversified fund of Fidelity Advisor Series VIII (the trust) and is authorized to issue an unlimited number of shares. Effective the close of business on March 30, 2007, the Fund was closed to most new accounts. The trust is registered under the Investment Company Act of 1940, as amended (the 1940 Act), as an open-end management investment company organized as a Massachusetts business trust. The Fund offers Class A, Class T, Class B, Class C, and Institutional Class shares, each of which has equal rights as to assets and voting privileges. Each class has exclusive voting rights with respect to matters that affect that class. Class B shares will automatically convert to Class A shares after a holding period of seven years from the initial date of purchase. Investment income, realized and unrealized capital gains and losses, the common expenses of the Fund, and certain fund-level expense reductions, if any, are allocated on a pro rata basis to each class based on the relative net assets of each class to the total net assets of the Fund. Each class differs with respect to transfer agent and distribution and service plan fees incurred. Certain expense reductions also differ by class.
2. Investments in Fidelity Central Funds.
The Fund may invest in Fidelity Central Funds, which are open-end investment companies available only to other investment companies and accounts managed by Fidelity Management & Research Company (FMR) and its affiliates. The Fund's Schedule of Investments lists each of the Fidelity Central Funds as an investment of the Fund, but does not include the underlying holdings of each Fidelity Central Fund. As an Investing Fund, the Fund indirectly bears its proportionate share of the expenses of the underlying Fidelity Central Funds.
The Money Market Central Funds seek preservation of capital and current income and are managed by Fidelity Investments Money Management, Inc. (FIMM), an affiliate of FMR.
A complete list of holdings for each Fidelity Central Fund is available upon request or at the SEC's web site at www.sec.gov. In addition, the financial statements of the Fidelity Central Funds, which are not covered by the Fund's Report of Independent Registered Public Accounting Firm, are available on the SEC's web site or upon request.
3. Significant Accounting Policies.
The financial statements have been prepared in conformity with accounting principles generally accepted in the United States of America, which require management to make certain estimates and assumptions at the date of the financial statements. The following summarizes the significant accounting policies of the Fund:
Annual Report
3. Significant Accounting Policies - continued
Security Valuation. Investments are valued and net asset value (NAV) per share is calculated (NAV calculation) as of the close of business of the New York Stock Exchange (NYSE), normally 4:00 p.m. Eastern time. Wherever possible, the Fund uses independent pricing services approved by the Board of Trustees to value its investments.
Equity securities, including restricted securities, for which market quotations are readily available, are valued at the last reported sale price or official closing price as reported by an independent pricing service on the primary market or exchange on which they are traded. In the event there were no sales during the day or closing prices are not available, securities are valued at the last quoted bid price. Investments in open-end mutual funds, including the Fidelity Central Funds, are valued at their closing net asset value each business day. Short-term securities with remaining maturities of sixty days or less for which quotations are not readily available are valued at amortized cost, which approximates value.
When current market prices or quotations are not readily available or do not accurately reflect fair value, valuations may be determined in accordance with procedures adopted by the Board of Trustees. For example, when developments occur between the close of a market and the close of the NYSE that may materially affect the value of some or all of the securities, or when trading in a security is halted, those securities may be fair valued. Factors used in the determination of fair value may include monitoring news to identify significant market or security specific events such as changes in the value of U.S. securities markets, reviewing developments in foreign markets and evaluating the performance of ADRs, futures contracts and exchange-traded funds. Because the Fund's utilization of fair value pricing depends on market activity, the frequency with which fair value pricing is used cannot be predicted and may be utilized to a significant extent. The value of securities used for NAV calculation under fair value pricing may differ from published prices for the same securities.
Foreign Currency. The Fund uses foreign currency contracts to facilitate transactions in foreign-denominated securities. Losses from these transactions may arise from changes in the value of the foreign currency or if the counterparties do not perform under the contracts' terms.
Foreign-denominated assets, including investment securities, and liabilities are translated into U.S. dollars at the exchange rate at period end. Purchases and sales of investment securities, income and dividends received and expenses denominated in foreign currencies are translated into U.S. dollars at the exchange rate in effect on the transaction date.
Annual Report
Notes to Financial Statements - continued
3. Significant Accounting Policies - continued
Foreign Currency - continued
The effects of exchange rate fluctuations on investments are included with the net realized and unrealized gain (loss) on investment securities. Other foreign currency transactions resulting in realized and unrealized gain (loss) are disclosed separately.
Investment Transactions and Income. For financial reporting purposes, the Fund's investment holdings and NAV include trades executed through the end of the last business day of the period. The NAV for processing shareholder transactions includes trades executed through the end of the prior business day. Gains and losses on securities sold are determined on the basis of identified cost. Dividend income is recorded on the ex-dividend date, except for certain dividends from foreign securities where the ex-dividend date may have passed, which are recorded as soon as the Fund is informed of the ex-dividend date. Non-cash dividends included in dividend income, if any, are recorded at the fair market value of the securities received. Interest income and income and capital gain distributions from the Fidelity Central Funds are accrued as earned. Interest income includes coupon interest and amortization of premium and accretion of discount on debt securities. Investment income is recorded net of foreign taxes withheld where recovery of such taxes is uncertain.
Expenses. Most expenses of the trust can be directly attributed to a fund. Expenses which cannot be directly attributed are apportioned among each Fund in the trust. Expense estimates are accrued in the period to which they relate and adjustments are made when actual amounts are known.
Income Tax Information and Distributions to Shareholders. Each year, the Fund intends to qualify as a regulated investment company by distributing all of its taxable income and realized gains under Subchapter M of the Internal Revenue Code. As a result, no provision for income taxes is required in the accompanying financial statements. Foreign taxes are provided for based on the Fund's understanding of the tax rules and rates that exist in the foreign markets in which it invests.
Distributions are recorded on the ex-dividend date. Income dividends and capital gain distributions are declared separately for each class. Income and capital gain distributions are determined in accordance with income tax regulations, which may differ from generally accepted accounting principles.
Capital accounts within the financial statements are adjusted for permanent book-tax differences. These adjustments have no impact on net assets or the results of operations. Temporary book-tax differences will reverse in a subsequent period.
Book-tax differences are primarily due to short-term capital gains, foreign currency transactions and losses deferred due to wash sales.
Annual Report
3. Significant Accounting Policies - continued
Income Tax Information and Distributions to Shareholders - continued
The tax-basis components of distributable earnings and the federal tax cost as of period end were as follows:
Unrealized appreciation | $ 44,739,270 |
Unrealized depreciation | (604,433) |
Net unrealized appreciation (depreciation) | 44,134,837 |
Undistributed ordinary income | 406,803 |
Undistributed long-term capital gain | 5,755,724 |
| |
Cost for federal income tax purposes | $ 37,427,915 |
The tax character of distributions paid was as follows:
| October 31, 2007 | October 31, 2006 |
Ordinary Income | $ 404,953 | $ 65,744 |
Long-term Capital Gains | 600,455 | - |
Total | $ 1,005,408 | $ 65,744 |
Short-Term Trading (Redemption) Fees. Shares held in the Fund less than 90 days are subject to a redemption fee equal to 1.50% of the proceeds of the redeemed shares. All redemption fees, including any estimated redemption fees paid by FMR, are retained by the Fund and accounted for as an addition to paid in capital.
New Accounting Pronouncements. In July 2006, Financial Accounting Standards Board Interpretation No. 48, Accounting for Uncertainty in Income Taxes - an interpretation of FASB Statement 109 (FIN 48), was issued and is effective on the last business day of the semiannual reporting period for fiscal years beginning after December 15, 2006. FIN 48 sets forth a threshold for financial statement recognition, measurement and disclosure of a tax position taken or expected to be taken on a tax return. Management has concluded that the adoption of FIN 48 will not result in a material impact on the Fund's net assets, results of operations and financial statement disclosures.
In addition, in September 2006, Statement of Financial Accounting Standards No. 157, Fair Value Measurements (SFAS 157), was issued and is effective for fiscal years beginning after November 15, 2007. SFAS 157 defines fair value, establishes a framework for measuring fair value and expands disclosures about fair value measurements. Management is currently evaluating the impact the adoption of SFAS 157 will have on the Fund's financial statement disclosures.
Annual Report
Notes to Financial Statements - continued
4. Operating Policies.
Repurchase Agreements. FMR has received an Exemptive Order from the Securities and Exchange Commission (the SEC) which permits the Fund and other affiliated entities of FMR to transfer uninvested cash balances into joint trading accounts which are then invested in repurchase agreements. The Fund may also invest directly with institutions in repurchase agreements. Repurchase agreements are collateralized by government or non-government securities. Upon settlement date, collateral is held in segregated accounts with custodian banks and may be obtained in the event of a default of the counterparty. The Fund monitors, on a daily basis, the value of the collateral to ensure it is at least equal to the principal amount of the repurchase agreement (including accrued interest). In the event of a default by the counterparty, realization of the collateral proceeds could be delayed, during which time the value of the collateral may decline.
5. Purchases and Sales of Investments.
Purchases and sales of securities, other than short-term securities, aggregated $20,989,808 and $37,582,215, respectively.
6. Fees and Other Transactions with Affiliates.
Management Fee. FMR and its affiliates provide the Fund with investment management related services for which the Fund pays a monthly management fee. The management fee is the sum of an individual fund fee rate that is based on an annual rate of .55% of the Fund's average net assets and a group fee rate that averaged ..26% during the period. The group fee rate is based upon the average net assets of all the mutual funds advised by FMR. The group fee rate decreases as assets under management increase and increases as assets under management decrease. For the period, the total annual management fee rate was .81% of the Fund's average net assets.
Annual Report
6. Fees and Other Transactions with Affiliates - continued
Distribution and Service Plan. In accordance with Rule 12b-1 of the 1940 Act, the Fund has adopted separate Distribution and Service Plans for each class of shares. Certain classes pay Fidelity Distributors Corporation (FDC), an affiliate of FMR, separate Distribution and Service Fees, each of which is based on an annual percentage of each class' average net assets. In addition, FDC may pay financial intermediaries for selling shares of the Fund and providing shareholder support services. For the period, the Distribution and Service Fee rates and the total amounts paid to and retained by FDC were as follows:
| Distribution
Fee | Service
Fee | Paid to
FDC | Retained
by FDC |
Class A | -% | .25% | $ 82,093 | $ 6,342 |
Class T | .25% | .25% | 30,330 | 52 |
Class B | .75% | .25% | 94,267 | 71,003 |
Class C | .75% | .25% | 110,335 | 33,378 |
| | | $ 317,025 | $ 110,775 |
Sales Load. FDC receives a front-end sales charge of up to 5.75% for selling Class A shares, and 3.50% for selling Class T shares, some of which is paid to financial intermediaries for selling shares of the Fund. FDC receives the proceeds of contingent deferred sales charges levied on Class A, Class T, Class B, and Class C redemptions. These charges depend on the holding period. The deferred sales charges range from 5% to 1% for Class B, 1% for Class C, 1% to .50% for certain purchases of Class A shares and .25% for certain purchases of Class T shares.
For the period, sales charge amounts retained by FDC were as follows:
| Retained
by FDC |
Class A | $ 14,756 |
Class T | 2,219 |
Class B* | 25,382 |
Class C* | 7,438 |
| $ 49,795 |
* When Class B and Class C shares are initially sold, FDC pays commissions from its own resources to financial intermediaries through which the sales are made.
Transfer Agent Fees. Fidelity Investments Institutional Operations Company, Inc. (FIIOC), an affiliate of FMR, is the transfer, dividend disbursing and shareholder servicing agent for each class of the Fund. FIIOC receives account fees and asset-based fees that vary according to the account size and type of account of the shareholders of the respective classes of the Fund. FIIOC pays for typesetting, printing and mailing of
Annual Report
Notes to Financial Statements - continued
6. Fees and Other Transactions with Affiliates - continued
Transfer Agent Fees - continued
shareholder reports, except proxy statements. For the period, the total transfer agent fees paid by each class to FIIOC, were as follows:
| Amount | % of
Average
Net Assets |
Class A | $ 82,963 | .25 |
Class T | 21,797 | .36 |
Class B | 26,683 | .28 |
Class C | 28,819 | .26 |
Institutional Class | 8,308 | .21 |
| $ 168,570 | |
Accounting Fees. Fidelity Service Company, Inc. (FSC), an affiliate of FMR, maintains the Fund's accounting records. The fee is based on the level of average net assets for the month.
7. Committed Line of Credit.
The Fund participates with other funds managed by FMR in a $4.2 billion credit facility (the "line of credit") to be utilized for temporary or emergency purposes to fund shareholder redemptions or for other short-term liquidity purposes. The Fund has agreed to pay commitment fees on its pro rata portion of the line of credit, which amounted to $130 and is reflected in Miscellaneous Expense on the Statement of Operations. During the period, there were no borrowings on this line of credit.
8. Expense Reductions.
FMR voluntarily agreed to reimburse each class to the extent annual operating expenses exceeded certain levels of average net assets as noted in the table below. Some expenses, for example interest expense, including commitment fees, are excluded from this reimbursement.
Annual Report
8. Expense Reductions - continued
The following classes were in reimbursement during the period:
| Expense
Limitations | Reimbursement
from adviser |
| | |
Class A | 1.60% | $ 53,333 |
Class T | 1.85% | 16,690 |
Class B | 2.35% | 18,169 |
Class C | 2.35% | 18,951 |
Institutional Class | 1.35% | 5,211 |
| | $ 112,354 |
Many of the brokers with whom FMR places trades on behalf of the Fund provided services to the Fund in addition to trade execution. These services included payments of certain expenses on behalf of the Fund totaling $28,895 for the period.
9. Other.
The Fund's organizational documents provide former and current trustees and officers with a limited indemnification against liabilities arising in connection with the performance of their duties to the Fund. In the normal course of business, the Fund may also enter into contracts that provide general indemnifications. The Fund's maximum exposure under these arrangements is unknown as this would be dependent on future claims that may be made against the Fund. The risk of material loss from such claims is considered remote.
In September 2006, FIIOC, the Fund's transfer agent notified the Fund that the Fund's books and records did not reflect a conversion of certain Class B to Class A shares upon their conversion date. In March 2007, FIIOC converted the relevant Class B shares to Class A shares and recorded the conversion in the books and records of the Fund which did not result in a material impact to the Fund's reported net assets or results of operations in the accompanying financial statements. FIIOC has remediated affected shareholders and reimbursed the Fund for all related audit and legal expenses.
Annual Report
Notes to Financial Statements - continued
10. Distributions to Shareholders.
Distributions to shareholders of each class were as follows:
| Years ended October 31, |
| 2007 | 2006 |
From net investment income | | |
Class A | $ 269,157 | $ 27,615 |
Class T | 41,276 | - |
Class B | 26,691 | - |
Class C | 15,164 | - |
Institutional Class | 52,665 | 2,624 |
Total | $ 404,953 | $ 30,239 |
From net realized gain | | |
Class A | $ 290,980 | $ 27,605 |
Class T | 60,038 | 4,672 |
Class B | 91,512 | - |
Class C | 113,730 | 1,500 |
Institutional Class | 44,195 | 1,728 |
Total | $ 600,455 | $ 35,505 |
11. Share Transactions.
Transactions for each class of shares were as follows:
| Shares
Years ended October 31, | Dollars
Years ended October 31, |
| 2007 | 2006 | 2007 | 2006 |
Class A | | | | |
Shares sold | 139,009 | 1,185,931 | $ 3,954,079 | $ 27,173,864 |
Reinvestment of distributions | 15,977 | 1,638 | 399,434 | 34,559 |
Shares redeemed | (383,709) | (859,524) | (10,863,154) | (20,245,636) |
Net increase (decrease) | (228,723) | 328,045 | $ (6,509,641) | $ 6,962,787 |
Class T | | | | |
Shares sold | 58,753 | 207,888 | $ 1,762,515 | $ 4,716,540 |
Reinvestment of distributions | 3,306 | 218 | 81,523 | 4,462 |
Shares redeemed | (111,242) | (162,980) | (2,990,269) | (3,660,914) |
Net increase (decrease) | (49,183) | 45,126 | $ (1,146,231) | $ 1,060,088 |
Class B | | | | |
Shares sold | 52,939 | 278,751 | $ 1,439,617 | $ 6,095,750 |
Reinvestment of distributions | 3,008 | - | 72,142 | - |
Shares redeemed | (129,013) | (169,082) | (3,407,347) | (3,759,331) |
Net increase (decrease) | (73,066) | 109,669 | $ (1,895,588) | $ 2,336,419 |
Annual Report
11. Share Transactions - continued
| Shares
Years ended October 31, | Dollars
Years ended October 31, |
| 2007 | 2006 | 2007 | 2006 |
Class C | | | | |
Shares sold | 105,622 | 597,257 | $ 2,911,198 | $ 13,005,755 |
Reinvestment of distributions | 3,241 | 42 | 77,846 | 846 |
Shares redeemed | (282,349) | (347,404) | (7,625,250) | (7,601,699) |
Net increase (decrease) | (173,486) | 249,895 | $ (4,636,206) | $ 5,404,902 |
Institutional Class | | | | |
Shares sold | 60,656 | 321,017 | $ 1,778,589 | $ 7,443,455 |
Reinvestment of distributions | 2,306 | 106 | 58,462 | 2,296 |
Shares redeemed | (141,540) | (170,833) | (3,906,428) | (4,020,369) |
Net increase (decrease) | (78,578) | 150,290 | $ (2,069,377) | $ 3,425,382 |
12. Subsequent Event
On December 7, 2007, Fidelity Advisor Emerging Markets Fund ("Acquiring Fund") acquired all of the assets and assumed all of the liabilities of the Fund pursuant to an agreement and plan of reorganization approved by Fund shareholders on November 14, 2007. As part of the reorganization, Fund shareholders of Class A, Class T, Class B, Class C and Institutional Class received shares of the corresponding class of the Acquiring Fund equal in value to the shareholder's shares in the Fund on the date of the reorganization. The reorganization qualified as a tax-free transaction for federal income tax purposes with no gain or loss recognized by the Fund or its shareholders.
Annual Report
Report of Independent Registered Public Accounting Firm
To the Trustees of Fidelity Advisor Series VIII and the Shareholders of Fidelity Advisor Korea Fund:
In our opinion, the accompanying statement of assets and liabilities, including the schedule of investments, and the related statements of operations and of changes in net assets and the financial highlights present fairly, in all material respects, the financial position of Fidelity Advisor Korea Fund (a fund of Fidelity Advisor Series VIII) at October 31, 2007, the results of its operations for the year then ended, the changes in its net assets for each of the two years in the period then ended and the financial highlights for each of the five years in the period then ended, in conformity with accounting principles generally accepted in the United States of America. These financial statements and financial highlights (hereafter referred to as "financial statements") are the responsibility of the Fidelity Advisor Korea Fund's management. Our responsibility is to express an opinion on these financial statements based on our audits. We conducted our audits of these financial statements in accordance with the standards of the Public Company Accounting Oversight Board (United States). Those standards require that we plan and perform the audit to obtain reasonable assurance about whether the financial statements are free of material misstatement. An audit includes examining, on a test basis, evidence supporting the amounts and disclosures in the financial statements, assessing the accounting principles used and significant estimates made by management, and evaluating the overall financial statement presentation. We believe that our audits, which included confirmation of securities at October 31, 2007 by correspondence with the custodian and brokers, provide a reasonable basis for our opinion.
As discussed in Note 12 of the financial statements, on December 7, 2007, all assets and liabilities of the Fund were transferred to Fidelity Advisor Emerging Asia Fund and the Fund ceased operations.
/s/ PricewaterhouseCoopers LLP
PricewaterhouseCoopers LLP
Boston, Massachusetts
December 21, 2007
Annual Report
Trustees and Officers
The Trustees, Members of the Advisory Board, and executive officers of the trust and fund, as applicable, are listed below. The Board of Trustees governs the fund and is responsible for protecting the interests of shareholders. The Trustees are experienced executives who meet periodically throughout the year to oversee the fund's activities, review contractual arrangements with companies that provide services to the fund, and review the fund's performance. Except for James C. Curvey, each of the Trustees oversees 370 funds advised by FMR or an affiliate. Mr. Curvey oversees 340 funds advised by FMR or an affiliate.
The Trustees hold office without limit in time except that (a) any Trustee may resign; (b) any Trustee may be removed by written instrument, signed by at least two-thirds of the number of Trustees prior to such removal; (c) any Trustee who requests to be retired or who has become incapacitated by illness or injury may be retired by written instrument signed by a majority of the other Trustees; and (d) any Trustee may be removed at any special meeting of shareholders by a two-thirds vote of the outstanding voting securities of the trust. Each Trustee who is not an interested person (as defined in the 1940 Act) (Independent Trustee), shall retire not later than the last day of the calendar year in which his or her 72nd birthday occurs. The Independent Trustees may waive this mandatory retirement age policy with respect to individual Trustees. The executive officers and Advisory Board Members hold office without limit in time, except that any officer and Advisory Board Member may resign or may be removed by a vote of a majority of the Trustees at any regular meeting or any special meeting of the Trustees. Except as indicated, each individual has held the office shown or other offices in the same company for the past five years.
The fund's Statement of Additional Information (SAI) includes more information about the Trustees. To request a free copy, call Fidelity at 1-800-544-8544.
Interested Trustees*:
Correspondence intended for each Trustee who is an interested person may be sent to Fidelity Investments, 82 Devonshire Street, Boston, Massachusetts 02109.
Name, Age; Principal Occupation |
Edward C. Johnson 3d (77) |
| Year of Election or Appointment: 1983 Mr. Johnson is Chairman of the Board of Trustees. Mr. Johnson serves as President (2006-present), Chief Executive Officer, Chairman, and a Director of FMR LLC; Chairman and a Director of FMR; Chairman and a Director of Fidelity Research & Analysis Company (FRAC); Chairman and a Director of Fidelity Investments Money Management, Inc.; and Chairman (2001-present) and a Director of FMR Co., Inc. In addition, Mr. Johnson serves as Chairman and Director of Fidelity International Limited (FIL). |
James C. Curvey (72) |
| Year of Election or Appointment: 2007 Mr. Curvey also serves as Trustee (2007-present) or Member of the Advisory Board (2007-present) of other investment companies advised by FMR. Mr. Curvey is a Director of FMR and FMR Co., Inc. (2007-
present). Mr. Curvey is also Vice Chairman (2006-present) and Director of FMR LLC. Mr. Curvey joined Fidelity in 1982 and served in numerous senior management positions, including President and Chief Operating Officer of FMR LLC (1997-2000) and President of Fidelity Strategic Investments (2000-2002). In addition, he serves as a member of the Board of Directors of Geerlings & Wade, Inc. (wine distribution). |
* Trustees have been determined to be "Interested Trustees" by virtue of, among other things, their affiliation with the trust or various entities under common control with FMR. FMR Corp. merged with FMR LLC on October 1, 2007. Any references to FMR LLC for prior periods are deemed to be references to the prior entity.
Independent Trustees:
Correspondence intended for each Independent Trustee (that is, the Trustees other than the Interested Trustees) may be sent to Fidelity Investments, P.O. Box 55235, Boston, Massachusetts 02205-5235.
Name, Age; Principal Occupation |
Dennis J. Dirks (59) |
| Year of Election or Appointment: 2005 Prior to his retirement in May 2003, Mr. Dirks was Chief Operating Officer and a member of the Board of The Depository Trust & Clearing Corporation (DTCC) (1999-2003). He also served as President, Chief Operating Officer, and Board member of The Depository Trust Company (DTC) (1999-2003) and President and Board member of the National Securities Clearing Corporation (NSCC) (1999-2003). In addition, Mr. Dirks served as Chief Executive Officer and Board member of the Government Securities Clearing Corporation (2001-2003) and Chief Executive Officer and Board member of the Mortgage-Backed Securities Clearing Corporation (2001-2003). Mr. Dirks also serves as a Trustee and a member of the Finance Committee of Manhattan College (2005-
present) and a Trustee and a member of the Finance Committee of AHRC of Nassau County (2006-present). |
Albert R. Gamper, Jr. (65) |
| Year of Election or Appointment: 2006 Prior to his retirement in December 2004, Mr. Gamper served as Chairman of the Board of CIT Group Inc. (commercial finance). During his tenure with CIT Group Inc. Mr. Gamper served in numerous senior management positions, including Chairman (1987-1989; 1999-2001; 2002-2004), Chief Executive Officer (1987-2004), and President (1989-2002). He currently serves as a member of the Board of Directors of Public Service Enterprise Group (utilities, 2001-present), Chairman of the Board of Governors, Rutgers University (2004-present), and Chairman of the Board of Saint Barnabas Health Care System. |
George H. Heilmeier (71) |
| Year of Election or Appointment: 2004 Dr. Heilmeier is Chairman Emeritus of Telcordia Technologies (communication software and systems), where prior to his retirement, he served as company Chairman and Chief Executive Officer. He currently serves on the Boards of Directors of The Mitre Corporation (systems engineering and information technology support for the government), and HRL Laboratories (private research and development, 2004-present). He is Chairman of the General Motors Science & Technology Advisory Board and a Life Fellow of the Institute of Electrical and Electronics Engineers (IEEE). Dr. Heilmeier is a member of the Defense Science Board and the National Security Agency Advisory Board. He is also a member of the National Academy of Engineering, the American Academy of Arts and Sciences, and the Board of Overseers of the School of Engineering and Applied Science of the University of Pennsylvania. Previously, Dr. Heilmeier served as a Director of TRW Inc. (automotive, space, defense, and information technology, 1992-2002), Compaq (1994-2002), Automatic Data Processing, Inc. (ADP) (technology-based business outsourcing, 1995-2002), INET Technologies Inc. (telecommunications network surveillance, 2001-2004), and Teletech Holdings (customer management services). He is the recipient of the 2005 Kyoto Prize in Advanced Technology for his invention of the liquid crystal display, and a member of the Consumer Electronics Hall of Fame. |
James H. Keyes (67) |
| Year of Election or Appointment: 2007 Prior to his retirement in 2003, Mr. Keyes was Chairman, President, and Chief Executive Officer of Johnson Controls, Inc. (automotive supplier, 1993-2003). He currently serves as a member of the boards of LSI Logic Corporation (semiconductor technologies), Navistar International Corporation (manufacture and sale of trucks, buses, and diesel engines, 2002-present), and Pitney Bowes, Inc. (integrated mail, messaging, and document management solutions). |
Marie L. Knowles (61) |
| Year of Election or Appointment: 2001 Prior to Ms. Knowles' retirement in June 2000, she served as Executive Vice President and Chief Financial Officer of Atlantic Richfield Company (ARCO) (diversified energy, 1996-2000). From 1993 to 1996, she was a Senior Vice President of ARCO and President of ARCO Transportation Company. She served as a Director of ARCO from 1996 to 1998. She currently serves as a Director of Phelps Dodge Corporation (copper mining and manufacturing) and McKesson Corporation (healthcare service, 2002-present). Ms. Knowles is a Trustee of the Brookings Institution and the Catalina Island Conservancy and also serves as a member of the Advisory Board for the School of Engineering of the University of Southern California. |
Ned C. Lautenbach (63) |
| Year of Election or Appointment: 2000 Mr. Lautenbach is Chairman of the Independent Trustees (2006-present). Mr. Lautenbach has been a partner of Clayton, Dubilier & Rice, Inc. (private equity investment firm) since September 1998. Previously, Mr. Lautenbach was with the International Business Machines Corporation (IBM) from 1968 until his retirement in 1998. Mr. Lautenbach serves as a Director of Sony Corporation (2006-present) and Eaton Corporation (diversified industrial) as well as the Philharmonic Center for the Arts in Naples, Florida. He also is a member of the Board of Trustees of Fairfield University (2005-present), as well as a member of the Council on Foreign Relations. |
Cornelia M. Small (63) |
| Year of Election or Appointment: 2005 Ms. Small is a member (2000-present) and Chairperson (2002-present) of the Investment Committee, and a member (2002-present) of the Board of Trustees of Smith College. Previously, she served as Chief Investment Officer (1999-2000), Director of Global Equity Investments (1996-1999), and a member of the Board of Directors of Scudder, Stevens & Clark (1990-1997) and Scudder Kemper Investments (1997-
1999). In addition, Ms. Small served as Co-Chair (2000-2003) of the Annual Fund for the Fletcher School of Law and Diplomacy. |
William S. Stavropoulos (68) |
| Year of Election or Appointment: 2001 Mr. Stavropoulos is Chairman Emeritus of the Board of Directors of The Dow Chemical Company. Since joining The Dow Chemical Company in 1967, Mr. Stavropoulos served in numerous senior management positions, including President (1993-2000; 2002-2003), CEO (1995-2000; 2002-2004), and Chairman of the Executive Committee (2000-2004). Currently, he is a Director of NCR Corporation (data warehousing and technology solutions), Chemical Financial Corporation, Maersk Inc. (industrial conglomerate, 2002-present), Tyco International, Inc. (multinational manufacturing and services, 2007-present), and a member of the Advisory Board for Metalmark Capital (private equity investment firm, 2005-present). He is a special advisor to Clayton, Dubilier & Rice, Inc., a private equity investment firm. He also serves as a member of the Board of Trustees of the American Enterprise Institute for Public Policy Research. In addition, Mr. Stavropoulos is a member of The Business Council, J.P. Morgan International Council and the University of Notre Dame Advisory Council for the College of Science. |
Kenneth L. Wolfe (68) |
| Year of Election or Appointment: 2005 Prior to his retirement in 2001, Mr. Wolfe was Chairman and Chief Executive Officer of Hershey Foods Corporation (1993-2001). He currently serves as a member of the boards of Adelphia Communications Corporation (2003-present), Bausch & Lomb, Inc., and Revlon Inc. (2004-present). |
Advisory Board Members and Executive Officers**:
Correspondence intended for Mr. Mauriello, Mr. Thomas, and Mr. Wiley may be sent to Fidelity Investments, P.O. Box 55235, Boston, Massachusetts 02205-5235. Correspondence intended for each executive officer and Mr. Lynch may be sent to Fidelity Investments, 82 Devonshire Street, Boston, Massachusetts 02109.
Name, Age; Principal Occupation |
Peter S. Lynch (63) |
| Year of Election or Appointment: 2003 Member of the Advisory Board of Fidelity Advisor Series VIII. Mr. Lynch is Vice Chairman and a Director of FMR, and Vice Chairman (2001-
present) and a Director of FMR Co., Inc. Previously, Mr. Lynch served as a Trustee of the Fidelity funds (1990-2003). In addition, he serves as a Trustee of Boston College and as the Chairman of the Inner-City Scholarship Fund. |
Joseph Mauriello (63) |
| Year of Election or Appointment: 2007 Member of the Advisory Board of Fidelity Advisor Series VIII. Prior to his retirement in January 2006, Mr. Mauriello served in numerous senior management positions including Deputy Chairman and Chief Operating Officer (2004-2005), and Vice Chairman of Financial Services (2002-
2004) of KPMG LLP US (professional services firm, 1965-2005). Mr. Mauriello currently serves as a member of the Board of Directors of XL Capital Ltd., (global insurance and re-insurance company, 2006-
present) and of Arcadia Resources Inc., (health care services and products, 2007-present). He also served as a Director of the Hamilton Funds of the Bank of New York (2006-2007). |
David M. Thomas (58) |
| Year of Election or Appointment: 2007 Member of the Advisory Board of Fidelity Advisor Series VIII. Previously, Mr. Thomas served as Executive Chairman (2005-2006) and Chairman and Chief Executive Officer (2000-2005) of IMS Health, Inc. (pharmaceutical and healthcare information solutions). In addition, Mr. Thomas serves as a member of the Board of Directors of Fortune Brands, Inc. (consumer products holding company), and Interpublic Group of Companies, Inc. (marketing communication, 2004-present). |
Michael E. Wiley (57) |
| Year of Election or Appointment: 2007 Member of the Advisory Board of Fidelity Advisor Series VIII. Mr. Wiley also serves as Sr. Energy Advisor of Katzenbach Partners, LLC (consulting firm, 2006-present) and a member of the Board of Trustees of the University of Tulsa (2000-2006; 2007-present). He serves as a Director of Tesoro Corporation (independent oil refiner and marketer, 2005-
present), and a Director of Bill Barrett Corporation (exploration and production company, 2005-present). In addition, he also serves as a Director of Post Oak Bank (privately-held bank, 2004-present), and an Advisory Director of Riverstone Holdings (private investment firm). Previously, Mr. Wiley served as Chairman, President, and CEO of Baker Hughes, Inc. (oilfield services company, 2000-2004), and as Director of Spinnaker Exploration Company (exploration and production company, 2001-2005). |
Kimberley H. Monasterio (43) |
| Year of Election or Appointment: 2007 President and Treasurer of Fidelity Advisor Korea Fund. Ms. Monasterio also serves as President and Treasurer of other Fidelity funds (2007-
present) and is an employee of FMR (2004-present). Previously, Ms. Monasterio served as Deputy Treasurer of the Fidelity funds (2004-
2006). Before joining Fidelity Investments, Ms. Monasterio served as Treasurer (2000-2004) and Chief Financial Officer (2002-2004) of the Franklin Templeton Funds and Senior Vice President of Franklin Templeton Services, LLC (2000-2004). |
Walter C. Donovan (45) |
| Year of Election or Appointment: 2007 Vice President of Fidelity Advisor Korea Fund. Mr. Donovan also serves as Vice President of Fidelity's Equity Funds (2007-present). Mr. Donovan also serves as Executive Vice President of FMR (2005-present) and FMR Co., Inc. (2005-present). Previously, Mr. Donovan served as Vice President of Fidelity's High Income Funds (2005-2007), Fixed-Income Funds (2005-2006), certain Asset Allocation Funds (2005-2006), certain Balanced Funds (2005-2006), and as Vice President and Director of Fidelity's International Equity Trading group (1998-2005). |
Eric M. Wetlaufer (45) |
| Year of Election or Appointment: 2006 Vice President of Fidelity Advisor Korea Fund. Mr. Wetlaufer also serves as Vice President of certain International Equity Funds (2006-present). Mr. Wetlaufer is Senior Vice President of FMR (2006-present) and FMR Co., Inc. (2006-present), and President and Director of Fidelity Management & Research (U.K.) Inc. (2006-present) and Fidelity Research & Analysis Company (2006-present). Before joining Fidelity Investments in 2005, Mr. Wetlaufer was a partner in Oxhead Capital Management (2004-2005). Previously, Mr. Wetlaufer served as a Chief Investment Officer of Putnam Investments (1997-2003). |
Eric D. Roiter (58) |
| Year of Election or Appointment: 1998 Secretary of Fidelity Advisor Korea Fund. He also serves as Secretary of other Fidelity funds; Vice President, General Counsel, and Secretary of FMR Co., Inc. (2001-present) and FMR; Assistant Secretary of Fidelity Management & Research (U.K.) Inc. (2001-present), Fidelity Research & Analysis Company (2001-present), and Fidelity Investments Money Management, Inc. (2001-present). Mr. Roiter is an Adjunct Member, Faculty of Law, at Boston College Law School (2003-present). Previously, Mr. Roiter served as Vice President and Secretary of Fidelity Distributors Corporation (FDC) (1998-2005). |
Scott C. Goebel (39) |
| Year of Election or Appointment: 2007 Assistant Secretary of Fidelity Advisor Korea Fund. Mr. Goebel also serves as Assistant Secretary of other Fidelity funds (2007-present), and is an employee of FMR. |
R. Stephen Ganis (41) |
| Year of Election or Appointment: 2006 Anti-Money Laundering (AML) officer of Fidelity Advisor Korea Fund. Mr. Ganis also serves as AML officer of other Fidelity funds (2006-
present) and FMR LLC (2003-present). Before joining Fidelity Investments, Mr. Ganis practiced law at Goodwin Procter, LLP (2000-2002). |
Joseph B. Hollis (59) |
| Year of Election or Appointment: 2006 Chief Financial Officer of Fidelity Advisor Korea Fund. Mr. Hollis also serves as Chief Financial Officer of other Fidelity funds. Mr. Hollis is President of Fidelity Pricing and Cash Management Services (FPCMS) (2005-present). Mr. Hollis also serves as President and Director of Fidelity Service Company, Inc. (2006-present). Previously, Mr. Hollis served as Senior Vice President of Cash Management Services (1999-
2002) and Investment Management Operations (2002-2005). |
Kenneth A. Rathgeber (60) |
| Year of Election or Appointment: 2004 Chief Compliance Officer of Fidelity Advisor Korea Fund. Mr. Rathgeber also serves as Chief Compliance Officer of other Fidelity funds (2004-
present) and Executive Vice President of Risk Oversight for Fidelity Investments (2002-present). He is Chief Compliance Officer of FMR (2005-present), FMR Co., Inc. (2005-present), Fidelity Management & Research (U.K.) Inc. (2005-present), Fidelity Research & Analysis Company (2005-present), Fidelity Investments Money Management, Inc. (2005-present), and Strategic Advisers, Inc. (2005-present). Previously, Mr. Rathgeber served as Executive Vice President and Chief Operating Officer for Fidelity Investments Institutional Services Company, Inc. (1998-2002). |
Bryan A. Mehrmann (46) |
| Year of Election or Appointment: 2005 Deputy Treasurer of Fidelity Advisor Korea Fund. Mr. Mehrmann also serves as Deputy Treasurer of other Fidelity funds (2005-present) and is an employee of FMR. Previously, Mr. Mehrmann served as Vice President of Fidelity Investments Institutional Services Group (FIIS)/Fidelity Investments Institutional Operations Corporation, Inc. (FIIOC) Client Services (1998-2004). |
Kenneth B. Robins (38) |
| Year of Election or Appointment: 2005 Deputy Treasurer of Fidelity Advisor Korea Fund. Mr. Robins also serves as Deputy Treasurer of other Fidelity funds (2005-present) and is an employee of FMR (2004-present). Before joining Fidelity Investments, Mr. Robins worked at KPMG LLP, where he was a partner in KPMG's department of professional practice (2002-2004) and a Senior Manager (1999-2000). In addition, Mr. Robins served as Assistant Chief Accountant, United States Securities and Exchange Commission (2000-2002). |
Robert G. Byrnes (40) |
| Year of Election or Appointment: 2005 Assistant Treasurer of Fidelity Advisor Korea Fund. Mr. Byrnes also serves as Assistant Treasurer of other Fidelity funds (2005-present) and is an employee of FMR (2005-present). Previously, Mr. Byrnes served as Vice President of FPCMS (2003-2005). Before joining Fidelity Investments, Mr. Byrnes worked at Deutsche Asset Management where he served as Vice President of the Investment Operations Group (2000-2003). |
Peter L. Lydecker (53) |
| Year of Election or Appointment: 2004 Assistant Treasurer of Fidelity Advisor Korea Fund. Mr. Lydecker also serves as Assistant Treasurer of other Fidelity funds (2004) and is an employee of FMR. |
Paul M. Murphy (60) |
| Year of Election or Appointment: 2007 Assistant Treasurer of Fidelity Advisor Korea Fund. Mr. Murphy also serves as Assistant Treasurer of other Fidelity funds (2007-present) and is an employee of FMR (2007-present). Previously, Mr. Murphy served as Chief Financial Officer of the Fidelity Funds (2005-2006), Vice President and Associate General Counsel of FMR (2007), and Senior Vice President of Fidelity Pricing and Cash Management Services Group (FPCMS) (1994-2007). |
Gary W. Ryan (49) |
| Year of Election or Appointment: 2005 Assistant Treasurer of Fidelity Advisor Korea Fund. Mr. Ryan also serves as Assistant Treasurer of other Fidelity funds (2005-present) and is an employee of FMR (2005-present). Previously, Mr. Ryan served as Vice President of Fund Reporting in FPCMS (1999-2005). |
** FMR Corp. merged with FMR LLC on October 1, 2007. Any references to FMR LLC for prior periods are deemed to be references to the prior entity.
Annual Report
Distributions
The Board of Trustees of Fidelity Advisor Korea Fund voted to pay to shareholders of record at the opening of business on record date the following distributions per share derived from capital gains realized from sales of portfolio securities and dividends derived from net investment income:
| Pay Date | Record Date | Dividends | Capital Gains |
Class A | 12/06/07 | 12/05/07 | $0.000 | $16.090 |
Class T | 12/06/07 | 12/05/07 | $0.000 | $16.026 |
Class B | 12/06/07 | 12/05/07 | $0.000 | $15.870 |
Class C | 12/06/07 | 12/05/07 | $0.000 | $15.840 |
The fund designates $5,756,561 as a capital gain dividend with respect to the taxable year ended October 31, 2007, or, if subsequently determined to be different, the net capital gain of such year.
The fund hereby designates as a short-term capital gain dividend with respect to the taxable period beginning November 1, 2007 and ending on December 7, 2007, $5,457,696 or, if subsequently determined to be different, the net short-term capital gain of such period.
The percentage of the dividends distributed during the fiscal year may be taken into account as a dividend for purposes of the maximum rate under section 1(h)(11) of the Internal Revenue Code are as follows:
| December 2006 |
Class A | 100% |
Class T | 100% |
Class B | 100% |
Class C | 100% |
The amounts per share which represent income derived from sources within, and taxes paid to, foreign countries or possessions of the United States are as follows:
| Pay Date | Income | Taxes |
Class A | 12/04/06 | $0.129 | $0.0428 |
Class T | 12/04/06 | $0.101 | $0.0428 |
Class B | 12/04/06 | $0.055 | $0.0428 |
Class C | 12/04/06 | $0.036 | $0.0428 |
The fund will notify shareholders in January 2008 of amounts for use in preparing 2007 income tax returns.
Annual Report
Proxy Voting Results
A special meeting of the fund's shareholders was held on November 14, 2007. The results of votes taken among shareholders on the proposal before them are reported below. Each vote reported represents one dollar of net asset value held on the record date for the meeting.
PROPOSAL 1 |
To approve an Agreement and Plan of Reorganization providing for the transfer of all of the assets of Fidelity Advisor Korea Fund to Fidelity Advisor Emerging Asia Fund in exchange solely for shares of beneficial interest of Fidelity Advisor Emerging Asia Fund and the assumption by Fidelity Advisor Emerging Asia Fund of Fidelity Advisor Korea Fund's liabilities, in complete liquidation of Fidelity Advisor Korea Fund. |
| # of
Votes | % of
Votes |
Affirmative | 23,280,863.84 | 76.388 |
Against | 3,355,512.37 | 11.010 |
Abstain | 3,100,854.39 | 10.174 |
Uninstructed | 739,973.51 | 2.428 |
TOTAL | 30,477,204.11 | 100.000 |
Annual Report
Board Approval of Investment Advisory Contracts and Management Fees
Advisor Korea Fund
Each year, typically in July, the Board of Trustees, including the Independent Trustees (together, the Board), votes on the renewal of the management contract and sub-advisory agreements (together, the Advisory Contracts) for the fund. The Board, assisted by the advice of fund counsel and Independent Trustees' counsel, requests and considers a broad range of information throughout the year.
The Board meets regularly each month except August and takes into account throughout the year matters bearing on Advisory Contracts. The Board, acting directly and through its separate committees, considers at each of its meetings factors that are relevant to the annual renewal of the fund's Advisory Contracts, including the services and support provided to the fund and its shareholders. At the time of the renewal, the Board had 12 standing committees, each composed of Independent Trustees with varying backgrounds, to which the Board has assigned specific subject matter responsibilities in order to enhance effective decision-making by the Board. Each committee has adopted a written charter outlining the structure and purposes of the committee. One such committee, the Equity Contract Committee, meets periodically as needed throughout the year to consider matters specifically related to the annual renewal of Advisory Contracts. The committee requests and receives information on, and makes recommendations to the Independent Trustees concerning, the approval and annual review of the Advisory Contracts.
At its July 2007 meeting, the Board of Trustees, including the Independent Trustees, unanimously determined to renew the Advisory Contracts for the fund. In reaching its determination, the Board considered all factors it believed relevant, including (i) the nature, extent, and quality of the services to be provided to the fund and its shareholders (including the investment performance of the fund); (ii) the competitiveness of the management fee and total expenses of the fund; (iii) the total costs of the services to be provided by and the profits to be realized by the investment adviser and its affiliates from the relationship with the fund; (iv) the extent to which economies of scale would be realized as the fund grows; and (v) whether fee levels reflect these economies of scale, if any, for the benefit of fund shareholders. The Board also approved amendments to the fund's agreements with foreign sub-advisers to clarify that each sub-adviser provides services as an independent contractor.
In determining whether to renew the Advisory Contracts for the fund, the Board ultimately reached a determination, with the assistance of fund counsel and Independent Trustees' counsel, that the renewal of the Advisory Contracts and the compensation to be received by Fidelity under the management contract is consistent with Fidelity's fiduciary duty under applicable law. In addition to evaluating the specific factors noted above, the Board, in reaching its determination, is aware that shareholders in the fund have a broad range of investment choices available to them, including a wide choice among mutual funds offered by competitors to Fidelity, and that the fund's shareholders, with the opportunity to review and weigh the disclosure provided by the fund in its prospectus and other public disclosures, have chosen to invest in this fund, managed by Fidelity.
Annual Report
Nature, Extent, and Quality of Services Provided. The Board considered staffing within the investment adviser, FMR, and the sub-advisers (together, the Investment Advisers), including the background of the fund's portfolio manager and the fund's investment objective and discipline. The Independent Trustees also had discussions with senior management of Fidelity's investment operations and investment groups. The Board considered the structure of the portfolio manager compensation program and whether this structure provides appropriate incentives.
Resources Dedicated to Investment Management and Support Services. The Board reviewed the size, education, and experience of the Investment Advisers' investment staff, their use of technology, and the Investment Advisers' approach to recruiting, training, and retaining portfolio managers and other research, advisory, and management personnel. The Board considered Fidelity's extensive global research capabilities that enable the Investment Advisers to aggregate data from various sources in an effort to produce positive investment results. The Board noted that Fidelity's analysts have access to a variety of technological tools that enable them to perform both fundamental and quantitative analysis and to specialize in various disciplines. The Board also considered that Fidelity's portfolio managers and analysts have access to daily portfolio attribution that allows for monitoring of a fund's portfolio, as well as an electronic communication system that provides immediate real-time access to research concerning issuers and credit enhancers.
Shareholder and Administrative Services. The Board considered (i) the nature, extent, quality, and cost of advisory, administrative, distribution, and shareholder services performed by the Investment Advisers and their affiliates under the Advisory Contracts and under separate agreements covering transfer agency, pricing and bookkeeping, and securities lending services for the fund; (ii) the nature and extent of the Investment Advisers' supervision of third party service providers, principally custodians and subcustodians; and (iii) the resources devoted to, and the record of compliance with, the fund's compliance policies and procedures. The Board reviewed the allocation of fund brokerage, including allocations to brokers affiliated with the Investment Advisers, the use of brokerage commissions to pay fund expenses, and the use of "soft" commission dollars to pay for research services. The Board also considered that Fidelity voluntarily pays for market data out of its own resources. The Board also considered the agreement reached between the Independent Trustees and Fidelity in December 2006 following an independent review of matters relating to receipt of travel, entertainment, gifts and gratuities in violation of Fidelity policies.
Annual Report
Board Approval of Investment Advisory Contracts and
Management Fees - continued
The Board noted that the growth of fund assets across the complex allows Fidelity to reinvest in the development of services designed to enhance the value or convenience of the Fidelity funds as investment vehicles. These services include 24-hour access to account information and market information through phone representatives and over the Internet, and investor education materials and asset allocation tools.
Investment in a Large Fund Family. The Board considered the benefits to shareholders of investing in a Fidelity fund, including the benefits of investing in a fund that is part of a large family of funds offering a variety of investment disciplines and providing for a large variety of mutual fund investor services. For example, fund shareholders are offered the privilege of exchanging shares of the fund for shares of other Fidelity funds, as set forth in the fund's prospectus, without paying a sales charge. The Board noted that, since the last Advisory Contract renewals in July 2006, Fidelity has taken a number of actions that benefited particular funds, including (i) dedicating additional resources to investment research and to restructure the investment research teams; (ii) contractually agreeing to reduce the management fee on Fidelity Advisor Floating Rate High Income Fund; (iii) contractually agreeing to reduce the management fees on Fidelity's California, Massachusetts, New Jersey, and New York AMT Tax-Free Money Market Funds, launching new Institutional Classes and Service Classes of these funds, and contractually agreeing to impose expense limitations on these funds; (iv) eliminating the exchange fee on the Fidelity Select Portfolios and reducing the pricing and bookkeeping fee rates for these funds; (v) reducing the maximum transfer agency fee rates on high income funds and certain equity funds; (vi) proposing amended management contracts that, if approved by shareholders, will add a performance adjustment component to the management fees paid by 18 Fidelity Advisor equity funds; (vii) contractually agreeing to reduce fees for Ultra-Short Central Fund and the money market Central Funds; (viii) waiving the Fidelity Advisor funds' contingent deferred sales charge on certain redemptions made through systematic withdrawal programs; and (ix) amending the management contracts for equity and fixed-income funds whose management contracts incorporate a "group fee" structure by adding four new fee "breakpoints" to the group fee rate schedules.
Furthermore, the Board considered that, on March 15, 2007, it had approved a proposal, subject to shareholder approval, to merge the fund into Fidelity Advisor Emerging Asia Fund. If shareholders approve the merger at a special meeting scheduled to be held in October 2007, it is expected to take place in December 2007.
Investment Performance and Compliance. The Board considered whether the fund has operated within its investment objective, as well as its record of compliance with its investment restrictions. It also reviewed the fund's absolute investment performance for each class, as well as the fund's relative investment performance for each class measured against a broad-based securities market index over multiple periods. The Board noted that FMR does not believe that a meaningful peer group exists against which to compare the fund's performance. The following charts considered by the Board show, over the one-, three-, and five-year periods ended December 31, 2006, the cumulative total returns of Institutional Class (Class I) and Class C of the fund and the cumulative total returns of a broad-based securities market index ("benchmark"). The returns of Institutional Class (Class I) and Class C show the performance of the highest and lowest performing classes, respectively (based on three-year performance).
Annual Report
Advisor Korea Fund
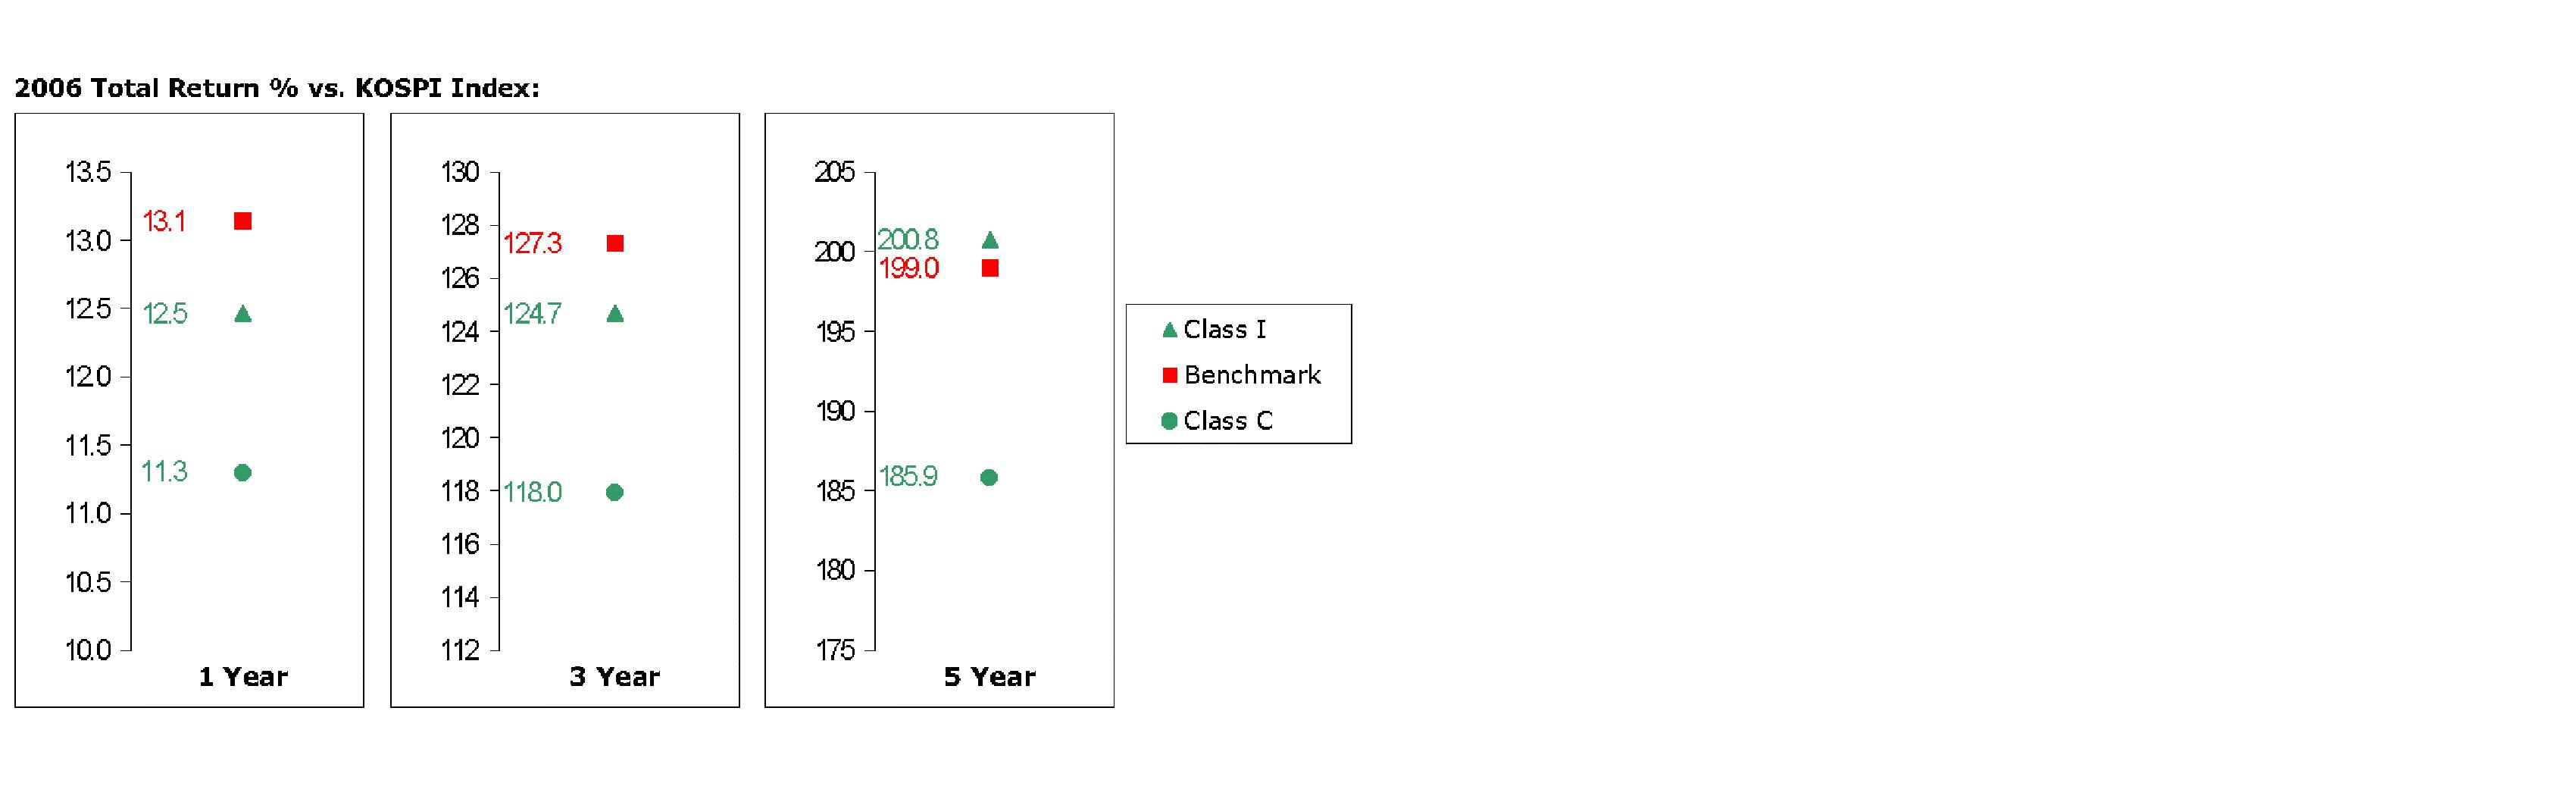
The Board stated that the relative investment performance of the fund was lower than its benchmark for the one- and three-year periods, although the five-year cumulative total return of Institutional Class (Class I) compared favorably to its benchmark. The Board considered that the variations in performance among the fund's classes reflect the variations in class expenses, which result in lower performance for higher expense classes. The Board discussed with FMR actions to be taken by FMR to improve the fund's below-benchmark performance.
The Board considered that FMR has taken steps to refocus and strengthen equity research, equity portfolio management, and compliance.
Based on its review, and giving particular weight to the nature and quality of the resources dedicated by the Investment Advisers to maintain and improve relative performance, the Board concluded that the nature, extent, and quality of the services provided to the fund will benefit the fund's shareholders, particularly in light of the Board's view that the fund's shareholders benefit from investing in a fund that is part of a large family of funds offering a variety of investment disciplines and services.
Annual Report
Board Approval of Investment Advisory Contracts and
Management Fees - continued
Competitiveness of Management Fee and Total Fund Expenses. The Board considered the fund's management fee and total expenses compared to "mapped groups" of competitive funds and classes. Fidelity creates "mapped groups" by combining similar Lipper investment objective categories that have comparable management fee characteristics. Combining Lipper investment objective categories aids the Board's management fee and total expense comparisons by broadening the competitive group used for comparison and by reducing the number of universes to which various Fidelity funds are compared. The Board also considered supplemental information about how the fund's management fee and total expenses ranked relative to groups based on Lipper classifications, which take into account a fund's market capitalization and style.
The Board considered two proprietary management fee comparisons for the 12-month periods shown in the chart below. The group of Lipper funds used by the Board for management fee comparisons is referred to below as the "Total Mapped Group." The Total Mapped Group comparison focuses on a fund's standing relative to the total universe of comparable funds available to investors, in terms of gross management fees before expense reimbursements or caps. "TMG %" represents the percentage of funds in the Total Mapped Group that had management fees that were lower than the fund's. For example, a TMG % of 17% means that 83% of the funds in the Total Mapped Group had higher management fees than the fund. The "Asset-Size Peer Group" (ASPG) comparison focuses on a fund's standing relative to non-Fidelity funds similar in size to the fund within the Total Mapped Group. The ASPG represents at least 15% of the funds in the Total Mapped Group with comparable asset size and management fee characteristics, subject to a minimum of 50 funds (or all funds in the Total Mapped Group if fewer than 50). Additional information, such as the ASPG quartile in which the fund's management fee ranked, is also included in the chart and considered by the Board.
Annual Report
Advisor Korea Fund

The Board noted that the fund's management fee ranked below the median of its Total Mapped Group and below the median of its ASPG for 2006.
Based on its review, the Board concluded that the fund's management fee was fair and reasonable in light of the services that the fund receives and the other factors considered.
In its review of each class's total expenses, the Board considered the fund's management fee as well as other fund or class expenses, as applicable, such as transfer agent fees, pricing and bookkeeping fees, fund-paid 12b-1 fees, and custodial, legal, and audit fees. The Board also noted the effects of any waivers and reimbursements on fees and expenses. As part of its review, the Board also considered current and historical total expenses of each class of the fund compared to competitive fund median expenses. Each class of the fund is compared to those funds and classes in the Total Mapped Group (used by the Board for management fee comparisons) that have a similar sales load structure.
The Board noted that the total expenses of each of Class A, Class B, Class C, and Institutional Class ranked below its competitive median for 2006, and the total expenses of Class T ranked above its competitive median for 2006. The Board noted that the fund offers multiple classes, each of which has a different sales load and 12b-1 fee structure, and that the multiple structures are intended to offer a range of pricing options for the intermediary market. The Board also noted that the total expenses of the classes vary primarily by the level of their 12b-1 fees, although differences in transfer agent fees may also cause expenses to vary from class to class.
Annual Report
Board Approval of Investment Advisory Contracts and
Management Fees - continued
In its review of total expenses, the Board also considered Fidelity fee structures and other information on clients that FMR and its affiliates service in other competitive markets, such as other mutual funds advised or subadvised by FMR or its affiliates, pension plan clients, and other institutional clients.
Based on its review, the Board concluded that the total expenses of each class of the fund were reasonable, although in one case above the median of the universe presented for comparison, in light of the services that the fund and its shareholders receive and the other factors considered.
Costs of the Services and Profitability. The Board considered the revenues earned and the expenses incurred by Fidelity in conducting the business of developing, marketing, distributing, managing, administering and servicing the fund and its shareholders. The Board also considered the level of Fidelity's profits in respect of all the Fidelity funds.
On an annual basis, FMR presents to the Board Fidelity's profitability for the fund. Fidelity calculates the profitability for each fund, as well as aggregate profitability for groups of Fidelity funds and all Fidelity funds, using a series of detailed revenue and cost allocation methodologies which originate with the audited books and records of Fidelity. The Audit Committee of the Board reviews any significant changes from the prior year's methodologies.
PricewaterhouseCoopers LLP (PwC), independent registered public accounting firm and auditor to Fidelity and certain Fidelity funds, has been engaged annually by the Board as part of the Board's assessment of the results of Fidelity's profitability analysis. PwC's engagement includes the review and assessment of Fidelity's methodologies used in determining the revenues and expenses attributable to Fidelity's mutual fund business, and completion of agreed-upon procedures surrounding the mathematical accuracy of fund profitability and its conformity to allocation methodologies. After considering PwC's reports issued under the engagement and information provided by Fidelity, the Board believes that while other allocation methods may also be reasonable, Fidelity's profitability methodologies are reasonable in all material respects.
The Board has also reviewed Fidelity's non-fund businesses and any fall-out benefits related to the mutual fund business as well as cases where Fidelity's affiliates may benefit from or be related to the fund's business.
The Board considered the costs of the services provided by and the profits realized by Fidelity in connection with the operation of the fund and determined that the amount of profit is a fair entrepreneurial profit for the management of the fund.
Economies of Scale. The Board considered whether there have been economies of scale in respect of the management of the Fidelity funds, whether the Fidelity funds (including the fund) have appropriately benefited from any such economies of scale, and whether there is potential for realization of any further economies of scale. The Board considered the extent to which the fund will benefit from economies of scale through increased services to the fund, through waivers or reimbursements, or through fee or expense reductions, including reductions that occur through operation of the transfer agent agreement. The transfer agent fee varies in part based on the number of accounts in the fund. If the number of accounts decreases or the average account size increases, the overall transfer agent fee rate decreases.
Annual Report
The Board recognized that the fund's management contract incorporates a "group fee" structure, which provides for lower group fee rates as total fund assets under FMR's management increase, and for higher group fee rates as total fund assets under FMR's management decrease. FMR determines the group fee rates based on a tiered asset "breakpoint" schedule. In connection with the renewal of the fund's management contract, the Board approved amendments to the fund's management contract that added four new fee breakpoints to the group fee rate schedule for assets under FMR's management above $1,386 billion. The Board considered that the group fee rate declines under both the present and amended schedules, but that under the amended schedule, the group fee rate declines faster as assets under FMR's management exceed $1,386 billion. The Board considered that the group fee is designed to deliver the benefits of economies of scale to fund shareholders when total fund assets increase, even if assets of any particular fund are unchanged or have declined, because some portion of Fidelity's costs are attributable to services provided to all Fidelity funds, and all funds benefit if those costs can be allocated among more assets. The Board also considered that although the fund is partially closed to new investors (to facilitate the fund's proposed merger), it continues to incur investment management expenses, and marketing and distribution expenses related to the retention of existing shareholders and assets. The Board further noted that the fund may continue to realize benefits from the group fee structure, even though assets may not be expected to grow significantly at the fund level. The Board concluded that, given the group fee structure, fund shareholders will achieve a certain level of economies of scale as assets under FMR's management increase at the fund complex level, regardless of whether Fidelity achieves any such economies of scale.
The Board further concluded that any potential economies of scale are being shared between fund shareholders and Fidelity in an appropriate manner.
Additional Information Requested by the Board. In order to develop fully the factual basis for consideration of the Fidelity funds' Advisory Contracts, the Board requested and received additional information on several topics, including (i) fund performance trends and actions to be taken by FMR to improve certain funds' overall performance; (ii) Fidelity's portfolio manager compensation structure, including its effects on fund profitability and the extent to which portfolio manager compensation is linked to fund performance; (iii) Fidelity's fee structures; (iv) the funds' sub-advisory arrangements; and (v) accounts managed by Fidelity other than the Fidelity funds.
Annual Report
Board Approval of Investment Advisory Contracts and
Management Fees - continued
Based on its evaluation of all of the conclusions noted above, and after considering all material factors, the Board ultimately concluded that the advisory fee structures are fair and reasonable, and that the fund's Advisory Contracts should be renewed.
Annual Report
Annual Report
Annual Report
Annual Report
Annual Report
Annual Report
Annual Report
Annual Report
Investment Adviser
Fidelity Management & Research Company
Boston, MA
Investment Sub-Advisers
FMR Co., Inc.
Fidelity Management & Research
(U.K.) Inc.
Fidelity Research & Analysis Company
Fidelity International
Investment Advisors
Fidelity Investments Japan Limited
Fidelity International Investment Advisors (U.K.) Limited
General Distributor
Fidelity Distributors Corporation
Boston, MA
Transfer and Service Agents
Fidelity Investments Institutional Operations Company, Inc.
Boston, MA
Fidelity Service Company, Inc.
Boston, MA
Custodian
JPMorgan Chase Bank
New York, NY
AKOR-UANN-1207
1.784758.104
(Fidelity Investment logo)(registered trademark)
(Fidelity Investment logo)(registered trademark)
Fidelity® Advisor
Korea
Fund - Institutional Class
Annual Report
October 31, 2007
(2_fidelity_logos) (Registered_Trademark)
Contents
Chairman's Message | <Click Here> | Ned Johnson's message to shareholders. |
Performance | <Click Here> | How the fund has done over time. |
Management's Discussion | <Click Here> | The manager's review of fund performance, strategy and outlook |
Shareholder Expense Example | <Click Here> | An example of shareholder expenses. |
Investment Changes | <Click Here> | A summary of major shifts in the fund's investments over the past six months. |
Investments | <Click Here> | A complete list of the fund's investments with their market values. |
Financial Statements | <Click Here> | Statements of assets and liabilities, operations, and changes in net assets,
as well as financial highlights. |
Notes | <Click Here> | Notes to the financial statements. |
Report of Independent Registered Public Accounting Firm | <Click Here> | |
Trustees and Officers | <Click Here> | |
Distributions | <Click Here> | |
Proxy Voting Results | <Click Here> | |
Board Approval of Investment Advisory Contracts and Management Fees | <Click Here> | |
To view a fund's proxy voting guidelines and proxy voting record for the 12-month period ended June 30, visit http://www.fidelity.com (search for "proxy voting guidelines") or visit the Securities and Exchange Commission's (SEC) web site at http://www.sec.gov. You may also call 1-877-208-0098 to request a free copy of the proxy voting guidelines.
Standard & Poor's, S&P and S&P 500 are registered service marks of The McGraw-Hill Companies, Inc. and have been licensed for use by Fidelity Distributors Corporation.
Other third party marks appearing herein are the property of their respective owners.
All other marks appearing herein are registered or unregistered trademarks or service marks of FMR LLC or an affiliated company.
Annual Report
This report and the financial statements contained herein are submitted for the general information of the shareholders of the fund. This report is not authorized for distribution to prospective investors in the fund unless preceded or accompanied by an effective prospectus.
A fund files its complete schedule of portfolio holdings with the SEC for the first and third quarters of each fiscal year on Form N-Q. Forms N-Q are available on the SEC's web site at http://www.sec.gov. A fund's Forms N-Q may be reviewed and copied at the SEC's Public Reference Room in Washington, DC. Information regarding the operation of the SEC's Public Reference Room may be obtained by calling 1-800-SEC-0330. For a complete list of a fund's portfolio holdings, view the most recent holdings listing, semiannual report, or annual report on Fidelity's web site at http://www.fidelity.com or http://www.advisor.fidelity.com, as applicable.
NOT FDIC INSURED · MAY LOSE VALUE · NO BANK GUARANTEE
Neither the fund nor Fidelity Distributors Corporation is a bank.
Annual Report
Chairman's Message
(photo_of_Edward_C_Johnson_3d)
Dear Shareholder:
Many stock and bond markets around the world have been unsettled of late; however, volatility can often lead to opportunity for patient investors. Financial markets are always unpredictable, but there are a number of time-tested principles that can put the historical odds in your favor.
One of the basic tenets is to invest for the long term. Over time, riding out the markets' inevitable ups and downs has proven much more effective than selling into panic or chasing the hottest trend. Even missing only a few of the markets' best days can significantly diminish investor returns. Patience also affords the benefits of compounding - of earning interest on additional income or reinvested dividends and capital gains. There are tax advantages and cost benefits to consider as well. The more you sell, the more taxes you pay, and the more you trade, the higher the costs. While staying the course doesn't eliminate risk, it can considerably lessen the effect of short-term declines.
You can further manage your investing risk through diversification. And today, more than ever, geographic diversification should be taken into account. Studies indicate that asset allocation is the single most important determinant of a portfolio's long-term success. The right mix of stocks, bonds and cash - aligned to your particular risk tolerance and investment objective - is very important. Age-appropriate rebalancing is also an essential aspect of asset allocation. For younger investors, an emphasis on equities - which historically have been the best-performing asset class over time - is encouraged. As investors near their specific goal, such as retirement or sending a child to college, consideration may be given to replacing volatile assets (e.g. common stocks) with more-stable fixed investments (bonds or savings plans).
A third investment principle - investing regularly - can help lower the average cost of your purchases. Investing a certain amount of money each month or quarter helps ensure you won't pay for all your shares at market highs. This strategy - known as dollar cost averaging - also reduces unconstructive "emotion" from investing, helping shareholders avoid selling weak performers just prior to an upswing, or chasing a hot performer just before a correction.
We invite you to contact us via the Internet, through our Investor Centers or over the phone. It is our privilege to provide you the information you need to make the investments that are right for you.
Sincerely,
/s/Edward C. Johnson 3d
Edward C. Johnson 3d
Annual Report
Performance: The Bottom Line
Average annual total return reflects the change in the value of an investment, assuming reinvestment of the class' dividend income and capital gains (the profits earned upon the sale of securities that have grown in value) and assuming a constant rate of performance each year. The $10,000 table and the fund's returns do not reflect the deduction of taxes that a shareholder would pay on fund distributions or the redemption of fund shares. During periods of reimbursement by Fidelity, a fund's total return will be greater than it would be had the reimbursement not occurred. How a fund did yesterday is no guarantee of how it will do tomorrow.
Average Annual Total Returns
Periods ended October 31, 2007 | | Past 1
year | Past 5
years | Past 10
years |
Institutional Class A | | 82.07% | 37.54% | 24.93% |
A Institutional Class shares are sold to eligible investors without a sales load or 12b-1 fee. The initial offering of Institutional Class shares took place on July 3, 2000. Returns prior to July 3, 2000 are those of Fidelity Advisor Korea Fund, Inc., (the Closed-End Fund). At the close of business on June 30, 2000, the Closed-End Fund reorganized as an open-end fund through a transfer of all of its assets and liabilities to Fidelity Advisor Korea Fund (the fund). Shareholders of the Closed-End Fund received Class A shares of the fund in exchange for their shares of the Closed-End fund. If the effect of Institutional Class expenses was reflected, returns may be lower than shown because Institutional Class shares of the fund may have higher total expenses than the Closed-End Fund.
$10,000 Over 10 Years
Let's say hypothetically that $10,000 was invested in Fidelity® Advisor Korea Fund - Institutional Class on October 31, 1997. The chart shows how the value of your investment would have changed, and also shows how the Korea Composite Stock Price Index (KOSPI) performed over the same period. The initial offering of Institutional Class took place on July 3, 2000. See above for additional information regarding the performance of Institutional Class.
Annual Report
Management's Discussion of Fund Performance
Comments from David Urquhart, Portfolio Manager of Fidelity® Advisor Korea Fund
South Korean stocks were hitting on all cylinders during the 12 months ending October 31, 2007, as reflected in the outsized 58.69% return of the Korea Composite Stock Price Index (KOSPI). The drivers of this run-up were favorable economic fundamentals and robust corporate performance, along with further depreciation of the U.S. dollar versus the Korean won. A brief but sharp sell-off during August was a result of concerns - triggered by the U.S. subprime mortgage meltdown - about a potential U.S. economic slowdown. However, investor sentiment improved after the Federal Reserve Board cut short-term interest rates in September, enabling the Korean market to post fresh highs by period end.
During the past year, the fund's Institutional Class shares posted a return of 82.07%, handily beating the KOSPI. The fund got a powerful boost from the capital goods segment of industrials due to both an overweighting and favorable stock picking. Stock selection also was rewarding in information technology and to a lesser extent in consumer staples. Further aiding our results was an overweighting in the household and personal products segment of consumer staples and underweightings in the consumer discretionary, telecommunication services and utilities sectors, which posted weaker gains than the benchmark. An out-of-index position in Taewoong, a global leader in manufacturing products for shipping, power plants, industrial machinery and wind power turbines, was our top contributor by a wide margin. Other significant contributors were Internet search portal NHN and niche shipbuilder Hyundai Mipo Dockyard. Conversely, underweighting the strong-performing materials sector was detrimental, and overweighting the weak-performing technology sector undercut some of the stock selection benefits there. Meanwhile, unfavorable stock selection in consumer discretionary lessened the positive impact of underweighting that group. Kookmin Bank hurt our returns, as did semiconductor manufacturer PSK.
Notes to shareholders: On November 14, 2007, shareholders of Fidelity Advisor Korea Fund approved the merger of Advisor Korea into Fidelity Advisor Emerging Asia Fund. The merger was completed on December 7, 2007.
Fidelity Advisor Korea Fund may invest up to 35% of its total assets in any industry that represents more than 20% of the Korean market. As of October 31, 2007, the fund did not have more than 25% of its total assets invested in any one industry.
The views expressed above reflect those of the portfolio manager(s) only through the end of the period as stated on the cover of this report and do not necessarily represent the views of Fidelity or any other person in the Fidelity organization. Any such views are subject to change at any time based upon market or other conditions and Fidelity disclaims any responsibility to update such views. These views may not be relied on as investment advice and, because investment decisions for a Fidelity fund are based on numerous factors, may not be relied on as an indication of trading intent on behalf of any Fidelity fund.
Annual Report
Shareholder Expense Example
As a shareholder of the Fund, you incur two types of costs: (1) transaction costs, including sales charges (loads) on purchase payments or redemption proceeds, redemption fees, and (2) ongoing costs, including management fees, distribution and/or service (12b-1) fees and other Fund expenses. This Example is intended to help you understand your ongoing costs (in dollars) of investing in the Fund and to compare these costs with the ongoing costs of investing in other mutual funds.
The Example is based on an investment of $1,000 invested at the beginning of the period and held for the entire period (May 1, 2007 to October 31, 2007).
Actual Expenses
The first line of the accompanying table for each class of the Fund provides information about actual account values and actual expenses. You may use the information in this line, together with the amount you invested, to estimate the expenses that you paid over the period. Simply divide your account value by $1,000.00 (for example, an $8,600 account value divided by $1,000.00 = 8.6), then multiply the result by the number in the first line for a class of the Fund under the heading entitled "Expenses Paid During Period" to estimate the expenses you paid on your account during this period. In addition, the Fund, as a shareholder in the underlying Fidelity Central Funds, will indirectly bear its pro rata share of the fees and expenses incurred by the underlying Fidelity Central Funds. These fees and expenses are not included in the Fund's annualized expense ratio used to calculate the expense estimate in the table below.
Hypothetical Example for Comparison Purposes
The second line of the accompanying table for each class of the Fund provides information about hypothetical account values and hypothetical expenses based on a Class' actual expense ratio and an assumed rate of return of 5% per year before expenses, which is not the Class' actual return. The hypothetical account values and expenses may not be used to estimate the actual ending account balance or expenses you paid for the period. You may use this information to compare the ongoing costs of investing in the Fund and other funds. To do so, compare this 5% hypothetical example with the 5% hypothetical examples that appear in the shareholder reports of the other funds. In addition, the Fund, as a shareholder in the underlying Fidelity Central Funds, will indirectly bear its pro rata share of the fees and expenses incurred by the underlying Fidelity Central Funds. These fees and expenses are not included in the Fund's annualized expense ratio used to calculate the expense estimate in the table below.
Annual Report
Shareholder Expense Example - continued
Please note that the expenses shown in the table are meant to highlight your ongoing costs only and do not reflect any transaction costs. Therefore, the second line of the table is useful in comparing ongoing costs only, and will not help you determine the relative total costs of owning different funds. In addition, if these transactional costs were included, your costs would have been higher.
| Beginning
Account Value
May 1, 2007 | Ending
Account Value
October 31, 2007 | Expenses Paid
During Period*
May 1, 2007 to
October 31, 2007 |
Class A | | | |
Actual | $ 1,000.00 | $ 1,519.90 | $ 10.16 |
Hypothetical A | $ 1,000.00 | $ 1,017.14 | $ 8.13 |
Class T | | | |
Actual | $ 1,000.00 | $ 1,515.70 | $ 11.73 |
Hypothetical A | $ 1,000.00 | $ 1,015.88 | $ 9.40 |
Class B | | | |
Actual | $ 1,000.00 | $ 1,511.60 | $ 14.88 |
Hypothetical A | $ 1,000.00 | $ 1,013.36 | $ 11.93 |
Class C | | | |
Actual | $ 1,000.00 | $ 1,511.40 | $ 14.88 |
Hypothetical A | $ 1,000.00 | $ 1,013.36 | $ 11.93 |
Institutional Class | | | |
Actual | $ 1,000.00 | $ 1,519.40 | $ 8.57 |
Hypothetical A | $ 1,000.00 | $ 1,018.40 | $ 6.87 |
A 5% return per year before expenses
* Expenses are equal to each Class' annualized expense ratio (shown in the table below); multiplied by the average account value over the period, multiplied by 184/365 (to reflect the one-half year period).
| Annualized
Expense Ratio |
Class A | 1.60% |
Class T | 1.85% |
Class B | 2.35% |
Class C | 2.35% |
Institutional Class | 1.35% |
Annual Report
Investment Changes
Top Ten Stocks as of October 31, 2007 |
| % of fund's
net assets | % of fund's net assets
6 months ago |
Samsung Electronics Co. Ltd. | 7.9 | 9.7 |
POSCO | 6.4 | 5.8 |
NHN Corp. | 6.3 | 4.2 |
Hyundai Heavy Industries Co. Ltd. | 5.8 | 2.1 |
Taewoong Co. Ltd. | 5.3 | 2.6 |
LG.Philips LCD Co. Ltd. | 4.6 | 3.1 |
Hyundai Mipo Dockyard Co. Ltd. | 4.2 | 3.7 |
Doosan Infracore Co. Ltd. | 3.8 | 5.0 |
LG Household & Health Care Ltd. | 3.6 | 3.0 |
Kookmin Bank | 3.5 | 5.6 |
| 51.4 | |
Market Sectors as of October 31, 2007 |
| % of fund's
net assets | % of fund's net assets
6 months ago |
Industrials | 41.6 | 31.3 |
Information Technology | 21.9 | 21.0 |
Financials | 11.7 | 19.2 |
Materials | 7.3 | 5.8 |
Consumer Staples | 6.5 | 7.3 |
Consumer Discretionary | 6.4 | 8.3 |
Energy | 2.3 | 2.1 |
Telecommunication Services | 1.8 | 1.9 |
Utilities | 0.0 | 2.0 |
Asset Allocation (% of fund's net assets) |
As of October 31, 2007 | As of April 30, 2007 |
| Stocks 99.5% | | | Stocks 98.9% | |
| Short-Term
Investments and
Net Other Assets 0.5% | | | Short-Term
Investments and
Net Other Assets 1.1% | |
| | | | | |

Annual Report
Investments October 31, 2007
Showing Percentage of Net Assets
Common Stocks - 98.7% |
| Shares | | Value |
CONSUMER DISCRETIONARY - 6.4% |
Auto Components - 0.9% |
Hyundai Mobis | 7,640 | | $ 769,019 |
Automobiles - 0.4% |
Hyundai Motor Co. | 3,880 | | 308,366 |
Hotels, Restaurants & Leisure - 0.9% |
Hana Tour Service, Inc. | 8,183 | | 737,986 |
Household Durables - 4.2% |
LG Electronics, Inc. | 16,150 | | 1,698,359 |
Woongjin Coway Co. Ltd. | 44,420 | | 1,702,665 |
| | 3,401,024 |
TOTAL CONSUMER DISCRETIONARY | | 5,216,395 |
CONSUMER STAPLES - 6.5% |
Food & Staples Retailing - 2.9% |
Shinsegae Co. Ltd. | 2,977 | | 2,345,846 |
Household Products - 3.6% |
LG Household & Health Care Ltd. | 13,290 | | 2,963,077 |
TOTAL CONSUMER STAPLES | | 5,308,923 |
ENERGY - 2.3% |
Oil, Gas & Consumable Fuels - 2.3% |
SK Energy Co. Ltd. | 8,008 | | 1,840,613 |
FINANCIALS - 11.7% |
Capital Markets - 1.7% |
Daewoo Securities Co. Ltd. | 15,980 | | 476,209 |
Korea Investment Holdings Co. Ltd. | 9,980 | | 895,318 |
| | 1,371,527 |
Commercial Banks - 6.3% |
Kookmin Bank | 34,920 | | 2,855,896 |
Shinhan Financial Group Co. Ltd. | 34,442 | | 2,255,435 |
| | 5,111,331 |
Insurance - 3.7% |
Meritz Fire & Marine Insurance Co. Ltd. | 98,381 | | 1,438,423 |
Samsung Fire & Marine Insurance Co. Ltd. | 5,750 | | 1,599,824 |
| | 3,038,247 |
TOTAL FINANCIALS | | 9,521,105 |
Common Stocks - continued |
| Shares | | Value |
INDUSTRIALS - 41.6% |
Construction & Engineering - 10.1% |
Doosan Heavy Industries & Construction Co. Ltd. | 14,720 | | $ 2,718,322 |
GS Engineering & Construction Corp. | 9,470 | | 2,006,547 |
Hyundai Engineering & Construction Co. Ltd. (a) | 13,086 | | 1,340,047 |
Samsung Engineering Co. Ltd. | 15,980 | | 2,152,605 |
| | 8,217,521 |
Industrial Conglomerates - 5.5% |
LG Corp. | 15,850 | | 1,450,586 |
Samsung Techwin Co. Ltd. | 36,590 | | 2,245,350 |
SK Holdings Co. Ltd. | 2,553 | | 766,946 |
| | 4,462,882 |
Machinery - 22.9% |
Daewoo Shipbuilding & Marine Engineering Co. Ltd. | 34,720 | | 2,205,608 |
Doosan Infracore Co. Ltd. | 73,110 | | 3,111,570 |
Hyundai Heavy Industries Co. Ltd. | 8,310 | | 4,672,800 |
Hyundai Mipo Dockyard Co. Ltd. | 7,650 | | 3,399,300 |
Hyunjin Materials Co. Ltd. | 13,800 | | 906,758 |
Taewoong Co. Ltd. | 30,209 | | 4,317,460 |
| | 18,613,496 |
Marine - 1.5% |
STX Pan Ocean Co. Ltd. | 465,000 | | 1,196,157 |
Trading Companies & Distributors - 1.6% |
Samsung Corp. | 14,440 | | 1,336,555 |
TOTAL INDUSTRIALS | | 33,826,611 |
INFORMATION TECHNOLOGY - 21.9% |
Electronic Equipment & Instruments - 5.8% |
LG.Philips LCD Co. Ltd. (a) | 67,890 | | 3,750,970 |
SFA Engineering Corp. | 12,266 | | 940,892 |
| | 4,691,862 |
Internet Software & Services - 6.3% |
NHN Corp. (a) | 15,808 | | 5,083,508 |
Semiconductors & Semiconductor Equipment - 9.8% |
Hynix Semiconductor, Inc. (a) | 17,430 | | 488,991 |
PSK, Inc. | 47,854 | | 582,740 |
Common Stocks - continued |
| Shares | | Value |
INFORMATION TECHNOLOGY - continued |
Semiconductors & Semiconductor Equipment - continued |
Samsung Electronics Co. Ltd. | 10,432 | | $ 6,433,065 |
Simm Tech Co. Ltd. | 49,615 | | 491,987 |
| | 7,996,783 |
TOTAL INFORMATION TECHNOLOGY | | 17,772,153 |
MATERIALS - 6.5% |
Chemicals - 0.1% |
MNTECH Co. Ltd. | 3,390 | | 64,179 |
Metals & Mining - 6.4% |
POSCO | 7,090 | | 5,170,843 |
TOTAL MATERIALS | | 5,235,022 |
TELECOMMUNICATION SERVICES - 1.8% |
Diversified Telecommunication Services - 1.8% |
LG Dacom Corp. | 44,180 | | 1,435,355 |
TOTAL COMMON STOCKS (Cost $35,950,716) | 80,156,177 |
Nonconvertible Preferred Stocks - 0.8% |
| | | |
MATERIALS - 0.8% |
Chemicals - 0.8% |
LG Chemical Ltd. | 13,420 | | 671,865 |
TOTAL NONCONVERTIBLE PREFERRED STOCKS (Cost $725,395) | 671,865 |
Money Market Funds - 0.9% |
| | | |
Fidelity Cash Central Fund, 4.97% (b)
(Cost $734,710) | 734,710 | | 734,710 |
TOTAL INVESTMENT PORTFOLIO - 100.4% (Cost $37,410,821) | | 81,562,752 |
NET OTHER ASSETS - (0.4)% | | (299,911) |
NET ASSETS - 100% | $ 81,262,841 |
Legend |
(a) Non-income producing |
(b) Affiliated fund that is available only to investment companies and other accounts managed by Fidelity Investments. The rate quoted is the annualized seven-day yield of the fund at period end. A complete unaudited listing of the fund's holdings as of its most recent quarter end is available upon request. |
Affiliated Central Funds |
Information regarding fiscal year to date income earned by the Fund from investments in Fidelity Central Funds is as follows: |
Fund | Income earned |
Fidelity Cash Central Fund | $ 62,179 |
See accompanying notes which are an integral part of the financial statements.
Annual Report
Financial Statements
Statement of Assets and Liabilities
| October 31, 2007 |
Assets | | |
Investment in securities, at value - See accompanying schedule: Unaffiliated issuers (cost $36,676,111) | $ 80,828,042 | |
Fidelity Central Funds (cost $734,710) | 734,710 | |
Total Investments (cost $37,410,821) | | $ 81,562,752 |
Receivable for fund shares sold | | 38,704 |
Dividends receivable | | 9,121 |
Distributions receivable from Fidelity Central Funds | | 4,405 |
Prepaid expenses | | 315 |
Receivable from investment adviser for expense reductions | | 19,776 |
Other receivables | | 5,598 |
Total assets | | 81,640,671 |
| | |
Liabilities | | |
Payable for fund shares redeemed | $ 163,322 | |
Accrued management fee | 50,772 | |
Distribution fees payable | 31,075 | |
Other affiliated payables | 17,201 | |
Other payables and accrued expenses | 115,460 | |
Total liabilities | | 377,830 |
| | |
Net Assets | | $ 81,262,841 |
Net Assets consist of: | | |
Paid in capital | | $ 30,799,759 |
Accumulated undistributed net realized gain (loss) on investments and foreign currency transactions | | 6,310,948 |
Net unrealized appreciation (depreciation) on investments and assets and liabilities in foreign currencies | | 44,152,134 |
Net Assets | | $ 81,262,841 |
See accompanying notes which are an integral part of the financial statements.
Annual Report
Statement of Assets and Liabilities - continued
| October 31, 2007 |
Calculation of Maximum Offering Price
Class A:
Net Asset Value and redemption price per share ($42,878,952 ÷ 993,821 shares) | | $ 43.15 |
| | |
Maximum offering price per share (100/94.25 of $43.15) | | $ 45.78 |
Class T:
Net Asset Value and redemption price per share ($8,252,459 ÷ 194,606 shares) | | $ 42.41 |
| | |
Maximum offering price per share (100/96.50 of $42.41) | | $ 43.95 |
Class B:
Net Asset Value and offering price per share ($12,281,054 ÷ 299,215 shares)A | | $ 41.04 |
| | |
Class C:
Net Asset Value and offering price per share ($12,971,028 ÷ 315,502 shares)A | | $ 41.11 |
| | |
| | |
Institutional Class:
Net Asset Value, offering price and redemption price per share ($4,879,348 ÷ 111,421 shares) | | $ 43.79 |
A Redemption price per share is equal to net asset value less any applicable contingent deferred sales charge.
See accompanying notes which are an integral part of the financial statements.
Annual Report
Financial Statements - continued
Statement of Operations
| Year ended
October 31,
2007 |
Investment Income | | |
Dividends | | $ 969,536 |
Interest | | 173 |
Income from Fidelity Central Funds | | 62,179 |
| | 1,031,888 |
Less foreign taxes withheld | | (156,742) |
Total income | | 875,146 |
| | |
Expenses | | |
Management fee | $ 512,077 | |
Transfer agent fees | 168,570 | |
Distribution fees | 317,025 | |
Accounting fees and expenses | 33,091 | |
Custodian fees and expenses | 69,465 | |
Independent trustees' compensation | 213 | |
Registration fees | 53,271 | |
Audit | 99,906 | |
Legal | 11,126 | |
Miscellaneous | 19,115 | |
Total expenses before reductions | 1,283,859 | |
Expense reductions | (141,361) | 1,142,498 |
Net investment income (loss) | | (267,352) |
Realized and Unrealized Gain (Loss) Net realized gain (loss) on: | | |
Investment securities: | | |
Unaffiliated issuers | 7,109,352 | |
Foreign currency transactions | (35,411) | |
Total net realized gain (loss) | | 7,073,941 |
Change in net unrealized appreciation (depreciation) on: Investment securities | 31,829,451 | |
Assets and liabilities in foreign currencies | 203 | |
Total change in net unrealized appreciation (depreciation) | | 31,829,654 |
Net gain (loss) | | 38,903,595 |
Net increase (decrease) in net assets resulting from operations | | $ 38,636,243 |
See accompanying notes which are an integral part of the financial statements.
Annual Report
Statement of Changes in Net Assets
| Year ended
October 31,
2007 | Year ended
October 31,
2006 |
Increase (Decrease) in Net Assets | | |
Operations | | |
Net investment income (loss) | $ (267,352) | $ (365,798) |
Net realized gain (loss) | 7,073,941 | 7,695,286 |
Change in net unrealized appreciation (depreciation) | 31,829,654 | 5,279,885 |
Net increase (decrease) in net assets resulting
from operations | 38,636,243 | 12,609,373 |
Distributions to shareholders from net investment income | (404,953) | (30,239) |
Distributions to shareholders from net realized gain | (600,455) | (35,505) |
Total distributions | (1,005,408) | (65,744) |
Share transactions - net increase (decrease) | (16,257,043) | 19,189,578 |
Redemption fees | 14,679 | 89,251 |
Total increase (decrease) in net assets | 21,388,471 | 31,822,458 |
| | |
Net Assets | | |
Beginning of period | 59,874,370 | 28,051,912 |
End of period | $ 81,262,841 | $ 59,874,370 |
See accompanying notes which are an integral part of the financial statements.
Annual Report
Financial Highlights - Class A
Years ended October 31, | 2007 | 2006 | 2005 | 2004 | 2003 |
Selected Per-Share Data | | | | | |
Net asset value, beginning of period | $ 24.16 | $ 17.40 | $ 11.93 | $ 11.07 | $ 9.05 |
Income from Investment Operations | | | | | |
Net investment income (loss) C | (.05) | (.08) | .04 | (.06) | .01 |
Net realized and unrealized gain (loss) | 19.49 | 6.87 | 5.42 | .91 | 2.01 |
Total from investment operations | 19.44 | 6.79 | 5.46 | .85 | 2.02 |
Distributions from net investment income | (.22) | (.03) | - | - | - |
Distributions from net realized gain | (.24) | (.03) | - | - | - |
Total distributions | (.46) | (.06) | - | - | - |
Redemption fees added to paid in capital C | .01 | .03 | .01 | .01 | - |
Net asset value, end of period | $ 43.15 | $ 24.16 | $ 17.40 | $ 11.93 | $ 11.07 |
Total ReturnA,B | 81.90% | 39.24% | 45.85% | 7.77% | 22.32% |
Ratios to Average Net Assets D,F | | | | | |
Expenses before reductions | 1.76% | 1.82% | 2.25% | 2.76% | 2.85% |
Expenses net of fee waivers, if any | 1.60% | 1.60% | 1.69% | 2.00% | 2.00% |
Expenses net of all reductions | 1.55% | 1.41% | 1.65% | 2.00% | 2.00% |
Net investment income (loss) | (.17)% | (.36)% | .28% | (.50)% | .12% |
Supplemental Data | | | | | |
Net assets, end of period (000 omitted) | $ 42,879 | $ 29,541 | $ 15,566 | $ 12,309 | $ 12,187 |
Portfolio turnover rate E | 33% | 133% | 97% | 77% | 127% |
A Total returns would have been lower had certain expenses not been reduced during the periods shown.
B Total returns do not include the effect of the sales charges.
C Calculated based on average shares outstanding during the period.
D Fees and expenses of the underlying Fidelity Central Funds are not included in the Fund's expense ratio. The Fund indirectly bears its proportionate share of the expenses of any underlying Fidelity Central Funds.
E Amount does not include the portfolio activity of any underlying Fidelity Central Funds.
F Expense ratios reflect operating expenses of the class. Expenses before reductions do not reflect amounts reimbursed by the investment adviser or reductions from brokerage service arrangements or other expense offset arrangements and do not represent the amount paid by the class during periods when reimbursements or reductions occur. Expenses net of fee waivers reflect expenses after reimbursement by the investment adviser but prior to reductions from brokerage service arrangements or other expense offset arrangements. Expenses net of all reductions represent the net expenses paid by the class.
See accompanying notes which are an integral part of the financial statements.
Annual Report
Financial Highlights - Class T
Years ended October 31, | 2007 | 2006 | 2005 | 2004 | 2003 |
Selected Per-Share Data | | | | | |
Net asset value, beginning of period | $ 23.79 | $ 17.15 | $ 11.78 | $ 10.96 | $ 8.99 |
Income from Investment Operations | | | | | |
Net investment income (loss) C | (.12) | (.14) | .01 | (.09) | (.01) |
Net realized and unrealized gain (loss) | 19.14 | 6.77 | 5.35 | .90 | 1.98 |
Total from investment operations | 19.02 | 6.63 | 5.36 | .81 | 1.97 |
Distributions from net investment income | (.17) | - | - | - | - |
Distributions from net realized gain | (.24) | (.02) | - | - | - |
Total distributions | (.41) | (.02) | - | - | - |
Redemption fees added to paid in capital C | .01 | .03 | .01 | .01 | - |
Net asset value, end of period | $ 42.41 | $ 23.79 | $ 17.15 | $ 11.78 | $ 10.96 |
Total Return A,B | 81.20% | 38.87% | 45.59% | 7.48% | 21.91% |
Ratios to Average Net Assets D,F | | | | | |
Expenses before reductions | 2.12% | 2.23% | 2.67% | 3.54% | 3.74% |
Expenses net of fee waivers, if any | 1.85% | 1.85% | 1.91% | 2.25% | 2.25% |
Expenses net of all reductions | 1.80% | 1.66% | 1.87% | 2.25% | 2.25% |
Net investment income (loss) | (.42)% | (.61)% | .06% | (.75)% | (.13)% |
Supplemental Data | | | | | |
Net assets, end of period (000 omitted) | $ 8,252 | $ 5,800 | $ 3,407 | $ 1,383 | $ 1,223 |
Portfolio turnover rate E | 33% | 133% | 97% | 77% | 127% |
A Total returns would have been lower had certain expenses not been reduced during the periods shown.
B Total returns do not include the effect of the sales charges.
C Calculated based on average shares outstanding during the period.
D Fees and expenses of the underlying Fidelity Central Funds are not included in the Fund's expense ratio. The Fund indirectly bears its proportionate share of the expenses of any underlying Fidelity Central Funds.
E Amount does not include the portfolio activity of any underlying Fidelity Central Funds.
F Expense ratios reflect operating expenses of the class. Expenses before reductions do not reflect amounts reimbursed by the investment adviser or reductions from brokerage service arrangements or other expense offset arrangements and do not represent the amount paid by the class during periods when reimbursements or reductions occur. Expenses net of fee waivers reflect expenses after reimbursement by the investment adviser but prior to reductions from brokerage service arrangements or other expense offset arrangements. Expenses net of all reductions represent the net expenses paid by the class.
See accompanying notes which are an integral part of the financial statements.
Annual Report
Financial Highlights - Class B
Years ended October 31, | 2007 | 2006 | 2005 | 2004 | 2003 |
Selected Per-Share Data | | | | | |
Net asset value, beginning of period | $ 23.07 | $ 16.69 | $ 11.53 | $ 10.78 | $ 8.88 |
Income from Investment Operations | | | | | |
Net investment income (loss) C | (.26) | (.24) | (.07) | (.14) | (.06) |
Net realized and unrealized gain (loss) | 18.53 | 6.59 | 5.22 | .88 | 1.96 |
Total from investment operations | 18.27 | 6.35 | 5.15 | .74 | 1.90 |
Distributions from net investment income | (.07) | - | - | - | - |
Distributions from net realized gain | (.24) | - | - | - | - |
Total distributions | (.31) | - | - | - | - |
Redemption fees added to paid in capital C | .01 | .03 | .01 | .01 | - |
Net asset value, end of period | $ 41.04 | $ 23.07 | $ 16.69 | $ 11.53 | $ 10.78 |
Total ReturnA,B | 80.19% | 38.23% | 44.75% | 6.96% | 21.40% |
Ratios to Average Net Assets D,F | | | | | |
Expenses before reductions | 2.54% | 2.64% | 3.06% | 3.63% | 4.08% |
Expenses net of fee waivers, if any | 2.35% | 2.35% | 2.42% | 2.75% | 2.75% |
Expenses net of all reductions | 2.30% | 2.16% | 2.38% | 2.75% | 2.75% |
Net investment income (loss) | (.92)% | (1.11)% | (.45)% | (1.25)% | (.63)% |
Supplemental Data | | | | | |
Net assets, end of period (000 omitted) | $ 12,281 | $ 8,587 | $ 4,384 | $ 2,279 | $ 1,175 |
Portfolio turnover rate E | 33% | 133% | 97% | 77% | 127% |
A Total returns would have been lower had certain expenses not been reduced during the periods shown.
B Total returns do not include the effect of the contingent deferred sales charge.
C Calculated based on average shares outstanding during the period.
D Fees and expenses of the underlying Fidelity Central Funds are not included in the Fund's expense ratio. The Fund indirectly bears its proportionate share of the expenses of any underlying Fidelity Central Funds.
E Amount does not include the portfolio activity of any underlying Fidelity Central Funds.
F Expense ratios reflect operating expenses of the class. Expenses before reductions do not reflect amounts reimbursed by the investment adviser or reductions from brokerage service arrangements or other expense offset arrangements and do not represent the amount paid by the class during periods when reimbursements or reductions occur. Expenses net of fee waivers reflect expenses after reimbursement by the investment adviser but prior to reductions from brokerage service arrangements or other expense offset arrangements. Expenses net of all reductions represent the net expenses paid by the class.
See accompanying notes which are an integral part of the financial statements.
Annual Report
Financial Highlights - Class C
Years ended October 31, | 2007 | 2006 | 2005 | 2004 | 2003 |
Selected Per-Share Data | | | | | |
Net asset value, beginning of period | $ 23.07 | $ 16.71 | $ 11.53 | $ 10.79 | $ 8.89 |
Income from Investment Operations | | | | | |
Net investment income (loss) C | (.26) | (.24) | (.06) | (.14) | (.06) |
Net realized and unrealized gain (loss) | 18.56 | 6.58 | 5.23 | .87 | 1.96 |
Total from investment operations | 18.30 | 6.34 | 5.17 | .73 | 1.90 |
Distributions from net investment income | (.03) | - | - | - | - |
Distributions from net realized gain | (.24) | (.01) | - | - | - |
Total distributions | (.27) | (.01) | - | - | - |
Redemption fees added to paid in capital C | .01 | .03 | .01 | .01 | - |
Net asset value, end of period | $ 41.11 | $ 23.07 | $ 16.71 | $ 11.53 | $ 10.79 |
Total Return A,B | 80.21% | 38.10% | 44.93% | 6.86% | 21.37% |
Ratios to Average Net Assets D,F | | | | | |
Expenses before reductions | 2.52% | 2.56% | 3.00% | 3.63% | 3.82% |
Expenses net of fee waivers, if any | 2.35% | 2.35% | 2.39% | 2.75% | 2.75% |
Expenses net of all reductions | 2.30% | 2.16% | 2.35% | 2.75% | 2.75% |
Net investment income (loss) | (.92)% | (1.11)% | (.42)% | (1.25)% | (.63)% |
Supplemental Data | | | | | |
Net assets, end of period (000 omitted) | $ 12,971 | $ 11,281 | $ 3,994 | $ 759 | $ 531 |
Portfolio turnover rate E | 33% | 133% | 97% | 77% | 127% |
A Total returns would have been lower had certain expenses not been reduced during the periods shown.
B Total returns do not include the effect of the contingent deferred sales charge.
C Calculated based on average shares outstanding during the period.
D Fees and expenses of the underlying Fidelity Central Funds are not included in the Fund's expense ratio. The Fund indirectly bears its proportionate share of the expenses of any underlying Fidelity Central Funds.
E Amount does not include the portfolio activity of any underlying Fidelity Central Funds.
F Expense ratios reflect operating expenses of the class. Expenses before reductions do not reflect amounts reimbursed by the investment adviser or reductions from brokerage service arrangements or other expense offset arrangements and do not represent the amount paid by the class during periods when reimbursements or reductions occur. Expenses net of fee waivers reflect expenses after reimbursement by the investment adviser but prior to reductions from brokerage service arrangements or other expense offset arrangements. Expenses net of all reductions represent the net expenses paid by the class.
See accompanying notes which are an integral part of the financial statements.
Annual Report
Financial Highlights - Institutional Class
Years ended October 31, | 2007 | 2006 | 2005 | 2004 | 2003 |
Selected Per-Share Data | | | | | |
Net asset value, beginning of period | $ 24.55 | $ 17.65 | $ 12.06 | $ 11.16 | $ 9.11 |
Income from Investment Operations | | | | | |
Net investment income (loss) B | .02 | (.03) | .09 | (.03) | .04 |
Net realized and unrealized gain (loss) | 19.74 | 6.97 | 5.49 | .92 | 2.01 |
Total from investment operations | 19.76 | 6.94 | 5.58 | .89 | 2.05 |
Distributions from net investment income | (.29) | (.04) | - | - | - |
Distributions from net realized gain | (.24) | (.03) | - | - | - |
Total distributions | (.53) | (.07) | - | - | - |
Redemption fees added to paid in capital B | .01 | .03 | .01 | .01 | - |
Net asset value, end of period | $ 43.79 | $ 24.55 | $ 17.65 | $ 12.06 | $ 11.16 |
Total ReturnA | 82.07% | 39.53% | 46.35% | 8.06% | 22.50% |
Ratios to Average Net Assets C,E | | | | | |
Expenses before reductions | 1.48% | 1.50% | 1.93% | 2.74% | 3.11% |
Expenses net of fee waivers, if any | 1.35% | 1.35% | 1.42% | 1.75% | 1.75% |
Expenses net of all reductions | 1.30% | 1.16% | 1.37% | 1.75% | 1.75% |
Net investment income (loss) | .08% | (.11)% | .55% | (.25)% | .38% |
Supplemental Data | | | | | |
Net assets, end of period (000 omitted) | $ 4,879 | $ 4,665 | $ 701 | $ 309 | $ 177 |
Portfolio turnover rate D | 33% | 133% | 97% | 77% | 127% |
A Total returns would have been lower had certain expenses not been reduced during the periods shown.
B Calculated based on average shares outstanding during the period.
C Fees and expenses of the underlying Fidelity Central Funds are not included in the Fund's expense ratio. The Fund indirectly bears its proportionate share of the expenses of any underlying Fidelity Central Funds.
D Amount does not include the portfolio activity of any underlying Fidelity Central Funds.
E Expense ratios reflect operating expenses of the class. Expenses before reductions do not reflect amounts reimbursed by the investment adviser or reductions from brokerage service arrangements or other expense offset arrangements and do not represent the amount paid by the class during periods when reimbursements or reductions occur. Expenses net of fee waivers reflect expenses after reimbursement by the investment adviser but prior to reductions from brokerage service arrangements or other expense offset arrangements. Expenses net of all reductions represent the net expenses paid by the class.
See accompanying notes which are an integral part of the financial statements.
Annual Report
Notes to Financial Statements
For the period ended October 31, 2007
1. Organization.
Fidelity Advisor Korea Fund (the Fund) is a non-diversified fund of Fidelity Advisor Series VIII (the trust) and is authorized to issue an unlimited number of shares. Effective the close of business on March 30, 2007, the Fund was closed to most new accounts. The trust is registered under the Investment Company Act of 1940, as amended (the 1940 Act), as an open-end management investment company organized as a Massachusetts business trust. The Fund offers Class A, Class T, Class B, Class C, and Institutional Class shares, each of which has equal rights as to assets and voting privileges. Each class has exclusive voting rights with respect to matters that affect that class. Class B shares will automatically convert to Class A shares after a holding period of seven years from the initial date of purchase. Investment income, realized and unrealized capital gains and losses, the common expenses of the Fund, and certain fund-level expense reductions, if any, are allocated on a pro rata basis to each class based on the relative net assets of each class to the total net assets of the Fund. Each class differs with respect to transfer agent and distribution and service plan fees incurred. Certain expense reductions also differ by class.
2. Investments in Fidelity Central Funds.
The Fund may invest in Fidelity Central Funds, which are open-end investment companies available only to other investment companies and accounts managed by Fidelity Management & Research Company (FMR) and its affiliates. The Fund's Schedule of Investments lists each of the Fidelity Central Funds as an investment of the Fund, but does not include the underlying holdings of each Fidelity Central Fund. As an Investing Fund, the Fund indirectly bears its proportionate share of the expenses of the underlying Fidelity Central Funds.
The Money Market Central Funds seek preservation of capital and current income and are managed by Fidelity Investments Money Management, Inc. (FIMM), an affiliate of FMR.
A complete list of holdings for each Fidelity Central Fund is available upon request or at the SEC's web site at www.sec.gov. In addition, the financial statements of the Fidelity Central Funds, which are not covered by the Fund's Report of Independent Registered Public Accounting Firm, are available on the SEC's web site or upon request.
3. Significant Accounting Policies.
The financial statements have been prepared in conformity with accounting principles generally accepted in the United States of America, which require management to make certain estimates and assumptions at the date of the financial statements. The following summarizes the significant accounting policies of the Fund:
Annual Report
Notes to Financial Statements - continued
3. Significant Accounting Policies - continued
Security Valuation. Investments are valued and net asset value (NAV) per share is calculated (NAV calculation) as of the close of business of the New York Stock Exchange (NYSE), normally 4:00 p.m. Eastern time. Wherever possible, the Fund uses independent pricing services approved by the Board of Trustees to value its investments.
Equity securities, including restricted securities, for which market quotations are readily available, are valued at the last reported sale price or official closing price as reported by an independent pricing service on the primary market or exchange on which they are traded. In the event there were no sales during the day or closing prices are not available, securities are valued at the last quoted bid price. Investments in open-end mutual funds, including the Fidelity Central Funds, are valued at their closing net asset value each business day. Short-term securities with remaining maturities of sixty days or less for which quotations are not readily available are valued at amortized cost, which approximates value.
When current market prices or quotations are not readily available or do not accurately reflect fair value, valuations may be determined in accordance with procedures adopted by the Board of Trustees. For example, when developments occur between the close of a market and the close of the NYSE that may materially affect the value of some or all of the securities, or when trading in a security is halted, those securities may be fair valued. Factors used in the determination of fair value may include monitoring news to identify significant market or security specific events such as changes in the value of U.S. securities markets, reviewing developments in foreign markets and evaluating the performance of ADRs, futures contracts and exchange-traded funds. Because the Fund's utilization of fair value pricing depends on market activity, the frequency with which fair value pricing is used cannot be predicted and may be utilized to a significant extent. The value of securities used for NAV calculation under fair value pricing may differ from published prices for the same securities.
Foreign Currency. The Fund uses foreign currency contracts to facilitate transactions in foreign-denominated securities. Losses from these transactions may arise from changes in the value of the foreign currency or if the counterparties do not perform under the contracts' terms.
Foreign-denominated assets, including investment securities, and liabilities are translated into U.S. dollars at the exchange rate at period end. Purchases and sales of investment securities, income and dividends received and expenses denominated in foreign currencies are translated into U.S. dollars at the exchange rate in effect on the transaction date.
Annual Report
3. Significant Accounting Policies - continued
Foreign Currency - continued
The effects of exchange rate fluctuations on investments are included with the net realized and unrealized gain (loss) on investment securities. Other foreign currency transactions resulting in realized and unrealized gain (loss) are disclosed separately.
Investment Transactions and Income. For financial reporting purposes, the Fund's investment holdings and NAV include trades executed through the end of the last business day of the period. The NAV for processing shareholder transactions includes trades executed through the end of the prior business day. Gains and losses on securities sold are determined on the basis of identified cost. Dividend income is recorded on the ex-dividend date, except for certain dividends from foreign securities where the ex-dividend date may have passed, which are recorded as soon as the Fund is informed of the ex-dividend date. Non-cash dividends included in dividend income, if any, are recorded at the fair market value of the securities received. Interest income and income and capital gain distributions from the Fidelity Central Funds are accrued as earned. Interest income includes coupon interest and amortization of premium and accretion of discount on debt securities. Investment income is recorded net of foreign taxes withheld where recovery of such taxes is uncertain.
Expenses. Most expenses of the trust can be directly attributed to a fund. Expenses which cannot be directly attributed are apportioned among each Fund in the trust. Expense estimates are accrued in the period to which they relate and adjustments are made when actual amounts are known.
Income Tax Information and Distributions to Shareholders. Each year, the Fund intends to qualify as a regulated investment company by distributing all of its taxable income and realized gains under Subchapter M of the Internal Revenue Code. As a result, no provision for income taxes is required in the accompanying financial statements. Foreign taxes are provided for based on the Fund's understanding of the tax rules and rates that exist in the foreign markets in which it invests.
Distributions are recorded on the ex-dividend date. Income dividends and capital gain distributions are declared separately for each class. Income and capital gain distributions are determined in accordance with income tax regulations, which may differ from generally accepted accounting principles.
Capital accounts within the financial statements are adjusted for permanent book-tax differences. These adjustments have no impact on net assets or the results of operations. Temporary book-tax differences will reverse in a subsequent period.
Book-tax differences are primarily due to short-term capital gains, foreign currency transactions and losses deferred due to wash sales.
Annual Report
Notes to Financial Statements - continued
3. Significant Accounting Policies - continued
Income Tax Information and Distributions to Shareholders - continued
The tax-basis components of distributable earnings and the federal tax cost as of period end were as follows:
Unrealized appreciation | $ 44,739,270 |
Unrealized depreciation | (604,433) |
Net unrealized appreciation (depreciation) | 44,134,837 |
Undistributed ordinary income | 406,803 |
Undistributed long-term capital gain | 5,755,724 |
| |
Cost for federal income tax purposes | $ 37,427,915 |
The tax character of distributions paid was as follows:
| October 31, 2007 | October 31, 2006 |
Ordinary Income | $ 404,953 | $ 65,744 |
Long-term Capital Gains | 600,455 | - |
Total | $ 1,005,408 | $ 65,744 |
Short-Term Trading (Redemption) Fees. Shares held in the Fund less than 90 days are subject to a redemption fee equal to 1.50% of the proceeds of the redeemed shares. All redemption fees, including any estimated redemption fees paid by FMR, are retained by the Fund and accounted for as an addition to paid in capital.
New Accounting Pronouncements. In July 2006, Financial Accounting Standards Board Interpretation No. 48, Accounting for Uncertainty in Income Taxes - an interpretation of FASB Statement 109 (FIN 48), was issued and is effective on the last business day of the semiannual reporting period for fiscal years beginning after December 15, 2006. FIN 48 sets forth a threshold for financial statement recognition, measurement and disclosure of a tax position taken or expected to be taken on a tax return. Management has concluded that the adoption of FIN 48 will not result in a material impact on the Fund's net assets, results of operations and financial statement disclosures.
In addition, in September 2006, Statement of Financial Accounting Standards No. 157, Fair Value Measurements (SFAS 157), was issued and is effective for fiscal years beginning after November 15, 2007. SFAS 157 defines fair value, establishes a framework for measuring fair value and expands disclosures about fair value measurements. Management is currently evaluating the impact the adoption of SFAS 157 will have on the Fund's financial statement disclosures.
Annual Report
4. Operating Policies.
Repurchase Agreements. FMR has received an Exemptive Order from the Securities and Exchange Commission (the SEC) which permits the Fund and other affiliated entities of FMR to transfer uninvested cash balances into joint trading accounts which are then invested in repurchase agreements. The Fund may also invest directly with institutions in repurchase agreements. Repurchase agreements are collateralized by government or non-government securities. Upon settlement date, collateral is held in segregated accounts with custodian banks and may be obtained in the event of a default of the counterparty. The Fund monitors, on a daily basis, the value of the collateral to ensure it is at least equal to the principal amount of the repurchase agreement (including accrued interest). In the event of a default by the counterparty, realization of the collateral proceeds could be delayed, during which time the value of the collateral may decline.
5. Purchases and Sales of Investments.
Purchases and sales of securities, other than short-term securities, aggregated $20,989,808 and $37,582,215, respectively.
6. Fees and Other Transactions with Affiliates.
Management Fee. FMR and its affiliates provide the Fund with investment management related services for which the Fund pays a monthly management fee. The management fee is the sum of an individual fund fee rate that is based on an annual rate of .55% of the Fund's average net assets and a group fee rate that averaged ..26% during the period. The group fee rate is based upon the average net assets of all the mutual funds advised by FMR. The group fee rate decreases as assets under management increase and increases as assets under management decrease. For the period, the total annual management fee rate was .81% of the Fund's average net assets.
Annual Report
Notes to Financial Statements - continued
6. Fees and Other Transactions with Affiliates - continued
Distribution and Service Plan. In accordance with Rule 12b-1 of the 1940 Act, the Fund has adopted separate Distribution and Service Plans for each class of shares. Certain classes pay Fidelity Distributors Corporation (FDC), an affiliate of FMR, separate Distribution and Service Fees, each of which is based on an annual percentage of each class' average net assets. In addition, FDC may pay financial intermediaries for selling shares of the Fund and providing shareholder support services. For the period, the Distribution and Service Fee rates and the total amounts paid to and retained by FDC were as follows:
| Distribution
Fee | Service
Fee | Paid to
FDC | Retained
by FDC |
Class A | -% | .25% | $ 82,093 | $ 6,342 |
Class T | .25% | .25% | 30,330 | 52 |
Class B | .75% | .25% | 94,267 | 71,003 |
Class C | .75% | .25% | 110,335 | 33,378 |
| | | $ 317,025 | $ 110,775 |
Sales Load. FDC receives a front-end sales charge of up to 5.75% for selling Class A shares, and 3.50% for selling Class T shares, some of which is paid to financial intermediaries for selling shares of the Fund. FDC receives the proceeds of contingent deferred sales charges levied on Class A, Class T, Class B, and Class C redemptions. These charges depend on the holding period. The deferred sales charges range from 5% to 1% for Class B, 1% for Class C, 1% to .50% for certain purchases of Class A shares and .25% for certain purchases of Class T shares.
For the period, sales charge amounts retained by FDC were as follows:
| Retained
by FDC |
Class A | $ 14,756 |
Class T | 2,219 |
Class B* | 25,382 |
Class C* | 7,438 |
| $ 49,795 |
* When Class B and Class C shares are initially sold, FDC pays commissions from its own resources to financial intermediaries through which the sales are made.
Transfer Agent Fees. Fidelity Investments Institutional Operations Company, Inc. (FIIOC), an affiliate of FMR, is the transfer, dividend disbursing and shareholder servicing agent for each class of the Fund. FIIOC receives account fees and asset-based fees that vary according to the account size and type of account of the shareholders of the respective classes of the Fund. FIIOC pays for typesetting, printing and mailing of
Annual Report
6. Fees and Other Transactions with Affiliates - continued
Transfer Agent Fees - continued
shareholder reports, except proxy statements. For the period, the total transfer agent fees paid by each class to FIIOC, were as follows:
| Amount | % of
Average
Net Assets |
Class A | $ 82,963 | .25 |
Class T | 21,797 | .36 |
Class B | 26,683 | .28 |
Class C | 28,819 | .26 |
Institutional Class | 8,308 | .21 |
| $ 168,570 | |
Accounting Fees. Fidelity Service Company, Inc. (FSC), an affiliate of FMR, maintains the Fund's accounting records. The fee is based on the level of average net assets for the month.
7. Committed Line of Credit.
The Fund participates with other funds managed by FMR in a $4.2 billion credit facility (the "line of credit") to be utilized for temporary or emergency purposes to fund shareholder redemptions or for other short-term liquidity purposes. The Fund has agreed to pay commitment fees on its pro rata portion of the line of credit, which amounted to $130 and is reflected in Miscellaneous Expense on the Statement of Operations. During the period, there were no borrowings on this line of credit.
8. Expense Reductions.
FMR voluntarily agreed to reimburse each class to the extent annual operating expenses exceeded certain levels of average net assets as noted in the table below. Some expenses, for example interest expense, including commitment fees, are excluded from this reimbursement.
Annual Report
Notes to Financial Statements - continued
8. Expense Reductions - continued
The following classes were in reimbursement during the period:
| Expense
Limitations | Reimbursement
from adviser |
| | |
Class A | 1.60% | $ 53,333 |
Class T | 1.85% | 16,690 |
Class B | 2.35% | 18,169 |
Class C | 2.35% | 18,951 |
Institutional Class | 1.35% | 5,211 |
| | $ 112,354 |
Many of the brokers with whom FMR places trades on behalf of the Fund provided services to the Fund in addition to trade execution. These services included payments of certain expenses on behalf of the Fund totaling $28,895 for the period.
9. Other.
The Fund's organizational documents provide former and current trustees and officers with a limited indemnification against liabilities arising in connection with the performance of their duties to the Fund. In the normal course of business, the Fund may also enter into contracts that provide general indemnifications. The Fund's maximum exposure under these arrangements is unknown as this would be dependent on future claims that may be made against the Fund. The risk of material loss from such claims is considered remote.
In September 2006, FIIOC, the Fund's transfer agent notified the Fund that the Fund's books and records did not reflect a conversion of certain Class B to Class A shares upon their conversion date. In March 2007, FIIOC converted the relevant Class B shares to Class A shares and recorded the conversion in the books and records of the Fund which did not result in a material impact to the Fund's reported net assets or results of operations in the accompanying financial statements. FIIOC has remediated affected shareholders and reimbursed the Fund for all related audit and legal expenses.
Annual Report
10. Distributions to Shareholders.
Distributions to shareholders of each class were as follows:
| Years ended October 31, |
| 2007 | 2006 |
From net investment income | | |
Class A | $ 269,157 | $ 27,615 |
Class T | 41,276 | - |
Class B | 26,691 | - |
Class C | 15,164 | - |
Institutional Class | 52,665 | 2,624 |
Total | $ 404,953 | $ 30,239 |
From net realized gain | | |
Class A | $ 290,980 | $ 27,605 |
Class T | 60,038 | 4,672 |
Class B | 91,512 | - |
Class C | 113,730 | 1,500 |
Institutional Class | 44,195 | 1,728 |
Total | $ 600,455 | $ 35,505 |
11. Share Transactions.
Transactions for each class of shares were as follows:
| Shares
Years ended October 31, | Dollars
Years ended October 31, |
| 2007 | 2006 | 2007 | 2006 |
Class A | | | | |
Shares sold | 139,009 | 1,185,931 | $ 3,954,079 | $ 27,173,864 |
Reinvestment of distributions | 15,977 | 1,638 | 399,434 | 34,559 |
Shares redeemed | (383,709) | (859,524) | (10,863,154) | (20,245,636) |
Net increase (decrease) | (228,723) | 328,045 | $ (6,509,641) | $ 6,962,787 |
Class T | | | | |
Shares sold | 58,753 | 207,888 | $ 1,762,515 | $ 4,716,540 |
Reinvestment of distributions | 3,306 | 218 | 81,523 | 4,462 |
Shares redeemed | (111,242) | (162,980) | (2,990,269) | (3,660,914) |
Net increase (decrease) | (49,183) | 45,126 | $ (1,146,231) | $ 1,060,088 |
Class B | | | | |
Shares sold | 52,939 | 278,751 | $ 1,439,617 | $ 6,095,750 |
Reinvestment of distributions | 3,008 | - | 72,142 | - |
Shares redeemed | (129,013) | (169,082) | (3,407,347) | (3,759,331) |
Net increase (decrease) | (73,066) | 109,669 | $ (1,895,588) | $ 2,336,419 |
Annual Report
Notes to Financial Statements - continued
11. Share Transactions - continued
| Shares
Years ended October 31, | Dollars
Years ended October 31, |
| 2007 | 2006 | 2007 | 2006 |
Class C | | | | |
Shares sold | 105,622 | 597,257 | $ 2,911,198 | $ 13,005,755 |
Reinvestment of distributions | 3,241 | 42 | 77,846 | 846 |
Shares redeemed | (282,349) | (347,404) | (7,625,250) | (7,601,699) |
Net increase (decrease) | (173,486) | 249,895 | $ (4,636,206) | $ 5,404,902 |
Institutional Class | | | | |
Shares sold | 60,656 | 321,017 | $ 1,778,589 | $ 7,443,455 |
Reinvestment of distributions | 2,306 | 106 | 58,462 | 2,296 |
Shares redeemed | (141,540) | (170,833) | (3,906,428) | (4,020,369) |
Net increase (decrease) | (78,578) | 150,290 | $ (2,069,377) | $ 3,425,382 |
12. Subsequent Event
On December 7, 2007, Fidelity Advisor Emerging Markets Fund ("Acquiring Fund") acquired all of the assets and assumed all of the liabilities of the Fund pursuant to an agreement and plan of reorganization approved by Fund shareholders on November 14, 2007. As part of the reorganization, Fund shareholders of Class A, Class T, Class B, Class C and Institutional Class received shares of the corresponding class of the Acquiring Fund equal in value to the shareholder's shares in the Fund on the date of the reorganization. The reorganization qualified as a tax-free transaction for federal income tax purposes with no gain or loss recognized by the Fund or its shareholders.
Annual Report
Report of Independent Registered Public Accounting Firm
To the Trustees of Fidelity Advisor Series VIII and the Shareholders of Fidelity Advisor Korea Fund:
In our opinion, the accompanying statement of assets and liabilities, including the schedule of investments, and the related statements of operations and of changes in net assets and the financial highlights present fairly, in all material respects, the financial position of Fidelity Advisor Korea Fund (a fund of Fidelity Advisor Series VIII) at October 31, 2007, the results of its operations for the year then ended, the changes in its net assets for each of the two years in the period then ended and the financial highlights for each of the five years in the period then ended, in conformity with accounting principles generally accepted in the United States of America. These financial statements and financial highlights (hereafter referred to as "financial statements") are the responsibility of the Fidelity Advisor Korea Fund's management. Our responsibility is to express an opinion on these financial statements based on our audits. We conducted our audits of these financial statements in accordance with the standards of the Public Company Accounting Oversight Board (United States). Those standards require that we plan and perform the audit to obtain reasonable assurance about whether the financial statements are free of material misstatement. An audit includes examining, on a test basis, evidence supporting the amounts and disclosures in the financial statements, assessing the accounting principles used and significant estimates made by management, and evaluating the overall financial statement presentation. We believe that our audits, which included confirmation of securities at October 31, 2007 by correspondence with the custodian and brokers, provide a reasonable basis for our opinion.
As discussed in Note 12 of the financial statements, on December 7, 2007, all assets and liabilities of the Fund were transferred to Fidelity Advisor Emerging Asia Fund and the Fund ceased operations.
/s/ PricewaterhouseCoopers LLP
PricewaterhouseCoopers LLP
Boston, Massachusetts
December 21, 2007
Annual Report
Trustees and Officers
The Trustees, Members of the Advisory Board, and executive officers of the trust and fund, as applicable, are listed below. The Board of Trustees governs the fund and is responsible for protecting the interests of shareholders. The Trustees are experienced executives who meet periodically throughout the year to oversee the fund's activities, review contractual arrangements with companies that provide services to the fund, and review the fund's performance. Except for James C. Curvey, each of the Trustees oversees 370 funds advised by FMR or an affiliate. Mr. Curvey oversees 340 funds advised by FMR or an affiliate.
The Trustees hold office without limit in time except that (a) any Trustee may resign; (b) any Trustee may be removed by written instrument, signed by at least two-thirds of the number of Trustees prior to such removal; (c) any Trustee who requests to be retired or who has become incapacitated by illness or injury may be retired by written instrument signed by a majority of the other Trustees; and (d) any Trustee may be removed at any special meeting of shareholders by a two-thirds vote of the outstanding voting securities of the trust. Each Trustee who is not an interested person (as defined in the 1940 Act) (Independent Trustee), shall retire not later than the last day of the calendar year in which his or her 72nd birthday occurs. The Independent Trustees may waive this mandatory retirement age policy with respect to individual Trustees. The executive officers and Advisory Board Members hold office without limit in time, except that any officer and Advisory Board Member may resign or may be removed by a vote of a majority of the Trustees at any regular meeting or any special meeting of the Trustees. Except as indicated, each individual has held the office shown or other offices in the same company for the past five years.
The fund's Statement of Additional Information (SAI) includes more information about the Trustees. To request a free copy, call Fidelity at 1-800-544-8544.
Interested Trustees*:
Correspondence intended for each Trustee who is an interested person may be sent to Fidelity Investments, 82 Devonshire Street, Boston, Massachusetts 02109.
Name, Age; Principal Occupation |
Edward C. Johnson 3d (77) |
| Year of Election or Appointment: 1983 Mr. Johnson is Chairman of the Board of Trustees. Mr. Johnson serves as President (2006-present), Chief Executive Officer, Chairman, and a Director of FMR LLC; Chairman and a Director of FMR; Chairman and a Director of Fidelity Research & Analysis Company (FRAC); Chairman and a Director of Fidelity Investments Money Management, Inc.; and Chairman (2001-present) and a Director of FMR Co., Inc. In addition, Mr. Johnson serves as Chairman and Director of Fidelity International Limited (FIL). |
James C. Curvey (72) |
| Year of Election or Appointment: 2007 Mr. Curvey also serves as Trustee (2007-present) or Member of the Advisory Board (2007-present) of other investment companies advised by FMR. Mr. Curvey is a Director of FMR and FMR Co., Inc. (2007-
present). Mr. Curvey is also Vice Chairman (2006-present) and Director of FMR LLC. Mr. Curvey joined Fidelity in 1982 and served in numerous senior management positions, including President and Chief Operating Officer of FMR LLC (1997-2000) and President of Fidelity Strategic Investments (2000-2002). In addition, he serves as a member of the Board of Directors of Geerlings & Wade, Inc. (wine distribution). |
* Trustees have been determined to be "Interested Trustees" by virtue of, among other things, their affiliation with the trust or various entities under common control with FMR. FMR Corp. merged with FMR LLC on October 1, 2007. Any references to FMR LLC for prior periods are deemed to be references to the prior entity.
Independent Trustees:
Correspondence intended for each Independent Trustee (that is, the Trustees other than the Interested Trustees) may be sent to Fidelity Investments, P.O. Box 55235, Boston, Massachusetts 02205-5235.
Name, Age; Principal Occupation |
Dennis J. Dirks (59) |
| Year of Election or Appointment: 2005 Prior to his retirement in May 2003, Mr. Dirks was Chief Operating Officer and a member of the Board of The Depository Trust & Clearing Corporation (DTCC) (1999-2003). He also served as President, Chief Operating Officer, and Board member of The Depository Trust Company (DTC) (1999-2003) and President and Board member of the National Securities Clearing Corporation (NSCC) (1999-2003). In addition, Mr. Dirks served as Chief Executive Officer and Board member of the Government Securities Clearing Corporation (2001-2003) and Chief Executive Officer and Board member of the Mortgage-Backed Securities Clearing Corporation (2001-2003). Mr. Dirks also serves as a Trustee and a member of the Finance Committee of Manhattan College (2005-
present) and a Trustee and a member of the Finance Committee of AHRC of Nassau County (2006-present). |
Albert R. Gamper, Jr. (65) |
| Year of Election or Appointment: 2006 Prior to his retirement in December 2004, Mr. Gamper served as Chairman of the Board of CIT Group Inc. (commercial finance). During his tenure with CIT Group Inc. Mr. Gamper served in numerous senior management positions, including Chairman (1987-1989; 1999-2001; 2002-2004), Chief Executive Officer (1987-2004), and President (1989-2002). He currently serves as a member of the Board of Directors of Public Service Enterprise Group (utilities, 2001-present), Chairman of the Board of Governors, Rutgers University (2004-present), and Chairman of the Board of Saint Barnabas Health Care System. |
George H. Heilmeier (71) |
| Year of Election or Appointment: 2004 Dr. Heilmeier is Chairman Emeritus of Telcordia Technologies (communication software and systems), where prior to his retirement, he served as company Chairman and Chief Executive Officer. He currently serves on the Boards of Directors of The Mitre Corporation (systems engineering and information technology support for the government), and HRL Laboratories (private research and development, 2004-present). He is Chairman of the General Motors Science & Technology Advisory Board and a Life Fellow of the Institute of Electrical and Electronics Engineers (IEEE). Dr. Heilmeier is a member of the Defense Science Board and the National Security Agency Advisory Board. He is also a member of the National Academy of Engineering, the American Academy of Arts and Sciences, and the Board of Overseers of the School of Engineering and Applied Science of the University of Pennsylvania. Previously, Dr. Heilmeier served as a Director of TRW Inc. (automotive, space, defense, and information technology, 1992-2002), Compaq (1994-2002), Automatic Data Processing, Inc. (ADP) (technology-based business outsourcing, 1995-2002), INET Technologies Inc. (telecommunications network surveillance, 2001-2004), and Teletech Holdings (customer management services). He is the recipient of the 2005 Kyoto Prize in Advanced Technology for his invention of the liquid crystal display, and a member of the Consumer Electronics Hall of Fame. |
James H. Keyes (67) |
| Year of Election or Appointment: 2007 Prior to his retirement in 2003, Mr. Keyes was Chairman, President, and Chief Executive Officer of Johnson Controls, Inc. (automotive supplier, 1993-2003). He currently serves as a member of the boards of LSI Logic Corporation (semiconductor technologies), Navistar International Corporation (manufacture and sale of trucks, buses, and diesel engines, 2002-present), and Pitney Bowes, Inc. (integrated mail, messaging, and document management solutions). |
Marie L. Knowles (61) |
| Year of Election or Appointment: 2001 Prior to Ms. Knowles' retirement in June 2000, she served as Executive Vice President and Chief Financial Officer of Atlantic Richfield Company (ARCO) (diversified energy, 1996-2000). From 1993 to 1996, she was a Senior Vice President of ARCO and President of ARCO Transportation Company. She served as a Director of ARCO from 1996 to 1998. She currently serves as a Director of Phelps Dodge Corporation (copper mining and manufacturing) and McKesson Corporation (healthcare service, 2002-present). Ms. Knowles is a Trustee of the Brookings Institution and the Catalina Island Conservancy and also serves as a member of the Advisory Board for the School of Engineering of the University of Southern California. |
Ned C. Lautenbach (63) |
| Year of Election or Appointment: 2000 Mr. Lautenbach is Chairman of the Independent Trustees (2006-present). Mr. Lautenbach has been a partner of Clayton, Dubilier & Rice, Inc. (private equity investment firm) since September 1998. Previously, Mr. Lautenbach was with the International Business Machines Corporation (IBM) from 1968 until his retirement in 1998. Mr. Lautenbach serves as a Director of Sony Corporation (2006-present) and Eaton Corporation (diversified industrial) as well as the Philharmonic Center for the Arts in Naples, Florida. He also is a member of the Board of Trustees of Fairfield University (2005-present), as well as a member of the Council on Foreign Relations. |
Cornelia M. Small (63) |
| Year of Election or Appointment: 2005 Ms. Small is a member (2000-present) and Chairperson (2002-present) of the Investment Committee, and a member (2002-present) of the Board of Trustees of Smith College. Previously, she served as Chief Investment Officer (1999-2000), Director of Global Equity Investments (1996-1999), and a member of the Board of Directors of Scudder, Stevens & Clark (1990-1997) and Scudder Kemper Investments (1997-
1999). In addition, Ms. Small served as Co-Chair (2000-2003) of the Annual Fund for the Fletcher School of Law and Diplomacy. |
William S. Stavropoulos (68) |
| Year of Election or Appointment: 2001 Mr. Stavropoulos is Chairman Emeritus of the Board of Directors of The Dow Chemical Company. Since joining The Dow Chemical Company in 1967, Mr. Stavropoulos served in numerous senior management positions, including President (1993-2000; 2002-2003), CEO (1995-2000; 2002-2004), and Chairman of the Executive Committee (2000-2004). Currently, he is a Director of NCR Corporation (data warehousing and technology solutions), Chemical Financial Corporation, Maersk Inc. (industrial conglomerate, 2002-present), Tyco International, Inc. (multinational manufacturing and services, 2007-present), and a member of the Advisory Board for Metalmark Capital (private equity investment firm, 2005-present). He is a special advisor to Clayton, Dubilier & Rice, Inc., a private equity investment firm. He also serves as a member of the Board of Trustees of the American Enterprise Institute for Public Policy Research. In addition, Mr. Stavropoulos is a member of The Business Council, J.P. Morgan International Council and the University of Notre Dame Advisory Council for the College of Science. |
Kenneth L. Wolfe (68) |
| Year of Election or Appointment: 2005 Prior to his retirement in 2001, Mr. Wolfe was Chairman and Chief Executive Officer of Hershey Foods Corporation (1993-2001). He currently serves as a member of the boards of Adelphia Communications Corporation (2003-present), Bausch & Lomb, Inc., and Revlon Inc. (2004-present). |
Advisory Board Members and Executive Officers**:
Correspondence intended for Mr. Mauriello, Mr. Thomas, and Mr. Wiley may be sent to Fidelity Investments, P.O. Box 55235, Boston, Massachusetts 02205-5235. Correspondence intended for each executive officer and Mr. Lynch may be sent to Fidelity Investments, 82 Devonshire Street, Boston, Massachusetts 02109.
Name, Age; Principal Occupation |
Peter S. Lynch (63) |
| Year of Election or Appointment: 2003 Member of the Advisory Board of Fidelity Advisor Series VIII. Mr. Lynch is Vice Chairman and a Director of FMR, and Vice Chairman (2001-
present) and a Director of FMR Co., Inc. Previously, Mr. Lynch served as a Trustee of the Fidelity funds (1990-2003). In addition, he serves as a Trustee of Boston College and as the Chairman of the Inner-City Scholarship Fund. |
Joseph Mauriello (63) |
| Year of Election or Appointment: 2007 Member of the Advisory Board of Fidelity Advisor Series VIII. Prior to his retirement in January 2006, Mr. Mauriello served in numerous senior management positions including Deputy Chairman and Chief Operating Officer (2004-2005), and Vice Chairman of Financial Services (2002-
2004) of KPMG LLP US (professional services firm, 1965-2005). Mr. Mauriello currently serves as a member of the Board of Directors of XL Capital Ltd., (global insurance and re-insurance company, 2006-
present) and of Arcadia Resources Inc., (health care services and products, 2007-present). He also served as a Director of the Hamilton Funds of the Bank of New York (2006-2007). |
David M. Thomas (58) |
| Year of Election or Appointment: 2007 Member of the Advisory Board of Fidelity Advisor Series VIII. Previously, Mr. Thomas served as Executive Chairman (2005-2006) and Chairman and Chief Executive Officer (2000-2005) of IMS Health, Inc. (pharmaceutical and healthcare information solutions). In addition, Mr. Thomas serves as a member of the Board of Directors of Fortune Brands, Inc. (consumer products holding company), and Interpublic Group of Companies, Inc. (marketing communication, 2004-present). |
Michael E. Wiley (57) |
| Year of Election or Appointment: 2007 Member of the Advisory Board of Fidelity Advisor Series VIII. Mr. Wiley also serves as Sr. Energy Advisor of Katzenbach Partners, LLC (consulting firm, 2006-present) and a member of the Board of Trustees of the University of Tulsa (2000-2006; 2007-present). He serves as a Director of Tesoro Corporation (independent oil refiner and marketer, 2005-
present), and a Director of Bill Barrett Corporation (exploration and production company, 2005-present). In addition, he also serves as a Director of Post Oak Bank (privately-held bank, 2004-present), and an Advisory Director of Riverstone Holdings (private investment firm). Previously, Mr. Wiley served as Chairman, President, and CEO of Baker Hughes, Inc. (oilfield services company, 2000-2004), and as Director of Spinnaker Exploration Company (exploration and production company, 2001-2005). |
Kimberley H. Monasterio (43) |
| Year of Election or Appointment: 2007 President and Treasurer of Fidelity Advisor Korea Fund. Ms. Monasterio also serves as President and Treasurer of other Fidelity funds (2007-
present) and is an employee of FMR (2004-present). Previously, Ms. Monasterio served as Deputy Treasurer of the Fidelity funds (2004-
2006). Before joining Fidelity Investments, Ms. Monasterio served as Treasurer (2000-2004) and Chief Financial Officer (2002-2004) of the Franklin Templeton Funds and Senior Vice President of Franklin Templeton Services, LLC (2000-2004). |
Walter C. Donovan (45) |
| Year of Election or Appointment: 2007 Vice President of Fidelity Advisor Korea Fund. Mr. Donovan also serves as Vice President of Fidelity's Equity Funds (2007-present). Mr. Donovan also serves as Executive Vice President of FMR (2005-present) and FMR Co., Inc. (2005-present). Previously, Mr. Donovan served as Vice President of Fidelity's High Income Funds (2005-2007), Fixed-Income Funds (2005-2006), certain Asset Allocation Funds (2005-2006), certain Balanced Funds (2005-2006), and as Vice President and Director of Fidelity's International Equity Trading group (1998-2005). |
Eric M. Wetlaufer (45) |
| Year of Election or Appointment: 2006 Vice President of Fidelity Advisor Korea Fund. Mr. Wetlaufer also serves as Vice President of certain International Equity Funds (2006-present). Mr. Wetlaufer is Senior Vice President of FMR (2006-present) and FMR Co., Inc. (2006-present), and President and Director of Fidelity Management & Research (U.K.) Inc. (2006-present) and Fidelity Research & Analysis Company (2006-present). Before joining Fidelity Investments in 2005, Mr. Wetlaufer was a partner in Oxhead Capital Management (2004-2005). Previously, Mr. Wetlaufer served as a Chief Investment Officer of Putnam Investments (1997-2003). |
Eric D. Roiter (58) |
| Year of Election or Appointment: 1998 Secretary of Fidelity Advisor Korea Fund. He also serves as Secretary of other Fidelity funds; Vice President, General Counsel, and Secretary of FMR Co., Inc. (2001-present) and FMR; Assistant Secretary of Fidelity Management & Research (U.K.) Inc. (2001-present), Fidelity Research & Analysis Company (2001-present), and Fidelity Investments Money Management, Inc. (2001-present). Mr. Roiter is an Adjunct Member, Faculty of Law, at Boston College Law School (2003-present). Previously, Mr. Roiter served as Vice President and Secretary of Fidelity Distributors Corporation (FDC) (1998-2005). |
Scott C. Goebel (39) |
| Year of Election or Appointment: 2007 Assistant Secretary of Fidelity Advisor Korea Fund. Mr. Goebel also serves as Assistant Secretary of other Fidelity funds (2007-present), and is an employee of FMR. |
R. Stephen Ganis (41) |
| Year of Election or Appointment: 2006 Anti-Money Laundering (AML) officer of Fidelity Advisor Korea Fund. Mr. Ganis also serves as AML officer of other Fidelity funds (2006-
present) and FMR LLC (2003-present). Before joining Fidelity Investments, Mr. Ganis practiced law at Goodwin Procter, LLP (2000-2002). |
Joseph B. Hollis (59) |
| Year of Election or Appointment: 2006 Chief Financial Officer of Fidelity Advisor Korea Fund. Mr. Hollis also serves as Chief Financial Officer of other Fidelity funds. Mr. Hollis is President of Fidelity Pricing and Cash Management Services (FPCMS) (2005-present). Mr. Hollis also serves as President and Director of Fidelity Service Company, Inc. (2006-present). Previously, Mr. Hollis served as Senior Vice President of Cash Management Services (1999-
2002) and Investment Management Operations (2002-2005). |
Kenneth A. Rathgeber (60) |
| Year of Election or Appointment: 2004 Chief Compliance Officer of Fidelity Advisor Korea Fund. Mr. Rathgeber also serves as Chief Compliance Officer of other Fidelity funds (2004-
present) and Executive Vice President of Risk Oversight for Fidelity Investments (2002-present). He is Chief Compliance Officer of FMR (2005-present), FMR Co., Inc. (2005-present), Fidelity Management & Research (U.K.) Inc. (2005-present), Fidelity Research & Analysis Company (2005-present), Fidelity Investments Money Management, Inc. (2005-present), and Strategic Advisers, Inc. (2005-present). Previously, Mr. Rathgeber served as Executive Vice President and Chief Operating Officer for Fidelity Investments Institutional Services Company, Inc. (1998-2002). |
Bryan A. Mehrmann (46) |
| Year of Election or Appointment: 2005 Deputy Treasurer of Fidelity Advisor Korea Fund. Mr. Mehrmann also serves as Deputy Treasurer of other Fidelity funds (2005-present) and is an employee of FMR. Previously, Mr. Mehrmann served as Vice President of Fidelity Investments Institutional Services Group (FIIS)/Fidelity Investments Institutional Operations Corporation, Inc. (FIIOC) Client Services (1998-2004). |
Kenneth B. Robins (38) |
| Year of Election or Appointment: 2005 Deputy Treasurer of Fidelity Advisor Korea Fund. Mr. Robins also serves as Deputy Treasurer of other Fidelity funds (2005-present) and is an employee of FMR (2004-present). Before joining Fidelity Investments, Mr. Robins worked at KPMG LLP, where he was a partner in KPMG's department of professional practice (2002-2004) and a Senior Manager (1999-2000). In addition, Mr. Robins served as Assistant Chief Accountant, United States Securities and Exchange Commission (2000-2002). |
Robert G. Byrnes (40) |
| Year of Election or Appointment: 2005 Assistant Treasurer of Fidelity Advisor Korea Fund. Mr. Byrnes also serves as Assistant Treasurer of other Fidelity funds (2005-present) and is an employee of FMR (2005-present). Previously, Mr. Byrnes served as Vice President of FPCMS (2003-2005). Before joining Fidelity Investments, Mr. Byrnes worked at Deutsche Asset Management where he served as Vice President of the Investment Operations Group (2000-2003). |
Peter L. Lydecker (53) |
| Year of Election or Appointment: 2004 Assistant Treasurer of Fidelity Advisor Korea Fund. Mr. Lydecker also serves as Assistant Treasurer of other Fidelity funds (2004) and is an employee of FMR. |
Paul M. Murphy (60) |
| Year of Election or Appointment: 2007 Assistant Treasurer of Fidelity Advisor Korea Fund. Mr. Murphy also serves as Assistant Treasurer of other Fidelity funds (2007-present) and is an employee of FMR (2007-present). Previously, Mr. Murphy served as Chief Financial Officer of the Fidelity Funds (2005-2006), Vice President and Associate General Counsel of FMR (2007), and Senior Vice President of Fidelity Pricing and Cash Management Services Group (FPCMS) (1994-2007). |
Gary W. Ryan (49) |
| Year of Election or Appointment: 2005 Assistant Treasurer of Fidelity Advisor Korea Fund. Mr. Ryan also serves as Assistant Treasurer of other Fidelity funds (2005-present) and is an employee of FMR (2005-present). Previously, Mr. Ryan served as Vice President of Fund Reporting in FPCMS (1999-2005). |
** FMR Corp. merged with FMR LLC on October 1, 2007. Any references to FMR LLC for prior periods are deemed to be references to the prior entity.
Annual Report
Distributions
The Board of Trustees of Fidelity Advisor Korea Fund voted to pay to shareholders of record at the opening of business on record date the following distributions per share derived from capital gains realized from sales of portfolio securities and dividends derived from net investment income:
| Pay Date | Record Date | Dividends | Capital Gains |
Institutional Class | 12/06/07 | 12/05/07 | $0.000 | $16.175 |
The fund designates $5,756,561 as a capital gain dividend with respect to the taxable year ended October 31, 2007, or, if subsequently determined to be different, the net capital gain of such year.
The fund hereby designates as a short-term capital gain dividend with respect to the taxable period beginning November 1, 2007 and ending on December 7, 2007, $5,457,696 or, if subsequently determined to be different, the net short-term capital gain of such period.
The percentage of the dividends distributed during the fiscal year may be taken into account as a dividend for purposes of the maximum rate under section 1(h)(11) of the Internal Revenue Code is as follows:
| December 2006 |
Institutional Class | 100% |
The amounts per share which represent income derived from sources within, and taxes paid to, foreign countries or possessions of the United States are as follows:
| Pay Date | Income | Taxes |
Institutional Class | 12/04/06 | $0.160 | $0.0428 |
The fund will notify shareholders in January 2008 of amounts for use in preparing 2007 income tax returns.
Annual Report
Proxy Voting Results
A special meeting of the fund's shareholders was held on November 14, 2007. The results of votes taken among shareholders on the proposal before them are reported below. Each vote reported represents one dollar of net asset value held on the record date for the meeting.
PROPOSAL 1 |
To approve an Agreement and Plan of Reorganization providing for the transfer of all of the assets of Fidelity Advisor Korea Fund to Fidelity Advisor Emerging Asia Fund in exchange solely for shares of beneficial interest of Fidelity Advisor Emerging Asia Fund and the assumption by Fidelity Advisor Emerging Asia Fund of Fidelity Advisor Korea Fund's liabilities, in complete liquidation of Fidelity Advisor Korea Fund. |
| # of
Votes | % of
Votes |
Affirmative | 23,280,863.84 | 76.388 |
Against | 3,355,512.37 | 11.010 |
Abstain | 3,100,854.39 | 10.174 |
Uninstructed | 739,973.51 | 2.428 |
TOTAL | 30,477,204.11 | 100.000 |
Annual Report
Board Approval of Investment Advisory Contracts and Management Fees
Advisor Korea Fund
Each year, typically in July, the Board of Trustees, including the Independent Trustees (together, the Board), votes on the renewal of the management contract and sub-advisory agreements (together, the Advisory Contracts) for the fund. The Board, assisted by the advice of fund counsel and Independent Trustees' counsel, requests and considers a broad range of information throughout the year.
The Board meets regularly each month except August and takes into account throughout the year matters bearing on Advisory Contracts. The Board, acting directly and through its separate committees, considers at each of its meetings factors that are relevant to the annual renewal of the fund's Advisory Contracts, including the services and support provided to the fund and its shareholders. At the time of the renewal, the Board had 12 standing committees, each composed of Independent Trustees with varying backgrounds, to which the Board has assigned specific subject matter responsibilities in order to enhance effective decision-making by the Board. Each committee has adopted a written charter outlining the structure and purposes of the committee. One such committee, the Equity Contract Committee, meets periodically as needed throughout the year to consider matters specifically related to the annual renewal of Advisory Contracts. The committee requests and receives information on, and makes recommendations to the Independent Trustees concerning, the approval and annual review of the Advisory Contracts.
At its July 2007 meeting, the Board of Trustees, including the Independent Trustees, unanimously determined to renew the Advisory Contracts for the fund. In reaching its determination, the Board considered all factors it believed relevant, including (i) the nature, extent, and quality of the services to be provided to the fund and its shareholders (including the investment performance of the fund); (ii) the competitiveness of the management fee and total expenses of the fund; (iii) the total costs of the services to be provided by and the profits to be realized by the investment adviser and its affiliates from the relationship with the fund; (iv) the extent to which economies of scale would be realized as the fund grows; and (v) whether fee levels reflect these economies of scale, if any, for the benefit of fund shareholders. The Board also approved amendments to the fund's agreements with foreign sub-advisers to clarify that each sub-adviser provides services as an independent contractor.
In determining whether to renew the Advisory Contracts for the fund, the Board ultimately reached a determination, with the assistance of fund counsel and Independent Trustees' counsel, that the renewal of the Advisory Contracts and the compensation to be received by Fidelity under the management contract is consistent with Fidelity's fiduciary duty under applicable law. In addition to evaluating the specific factors noted above, the Board, in reaching its determination, is aware that shareholders in the fund have a broad range of investment choices available to them, including a wide choice among mutual funds offered by competitors to Fidelity, and that the fund's shareholders, with the opportunity to review and weigh the disclosure provided by the fund in its prospectus and other public disclosures, have chosen to invest in this fund, managed by Fidelity.
Annual Report
Board Approval of Investment Advisory Contracts and
Management Fees - continued
Nature, Extent, and Quality of Services Provided. The Board considered staffing within the investment adviser, FMR, and the sub-advisers (together, the Investment Advisers), including the background of the fund's portfolio manager and the fund's investment objective and discipline. The Independent Trustees also had discussions with senior management of Fidelity's investment operations and investment groups. The Board considered the structure of the portfolio manager compensation program and whether this structure provides appropriate incentives.
Resources Dedicated to Investment Management and Support Services. The Board reviewed the size, education, and experience of the Investment Advisers' investment staff, their use of technology, and the Investment Advisers' approach to recruiting, training, and retaining portfolio managers and other research, advisory, and management personnel. The Board considered Fidelity's extensive global research capabilities that enable the Investment Advisers to aggregate data from various sources in an effort to produce positive investment results. The Board noted that Fidelity's analysts have access to a variety of technological tools that enable them to perform both fundamental and quantitative analysis and to specialize in various disciplines. The Board also considered that Fidelity's portfolio managers and analysts have access to daily portfolio attribution that allows for monitoring of a fund's portfolio, as well as an electronic communication system that provides immediate real-time access to research concerning issuers and credit enhancers.
Shareholder and Administrative Services. The Board considered (i) the nature, extent, quality, and cost of advisory, administrative, distribution, and shareholder services performed by the Investment Advisers and their affiliates under the Advisory Contracts and under separate agreements covering transfer agency, pricing and bookkeeping, and securities lending services for the fund; (ii) the nature and extent of the Investment Advisers' supervision of third party service providers, principally custodians and subcustodians; and (iii) the resources devoted to, and the record of compliance with, the fund's compliance policies and procedures. The Board reviewed the allocation of fund brokerage, including allocations to brokers affiliated with the Investment Advisers, the use of brokerage commissions to pay fund expenses, and the use of "soft" commission dollars to pay for research services. The Board also considered that Fidelity voluntarily pays for market data out of its own resources. The Board also considered the agreement reached between the Independent Trustees and Fidelity in December 2006 following an independent review of matters relating to receipt of travel, entertainment, gifts and gratuities in violation of Fidelity policies.
Annual Report
The Board noted that the growth of fund assets across the complex allows Fidelity to reinvest in the development of services designed to enhance the value or convenience of the Fidelity funds as investment vehicles. These services include 24-hour access to account information and market information through phone representatives and over the Internet, and investor education materials and asset allocation tools.
Investment in a Large Fund Family. The Board considered the benefits to shareholders of investing in a Fidelity fund, including the benefits of investing in a fund that is part of a large family of funds offering a variety of investment disciplines and providing for a large variety of mutual fund investor services. For example, fund shareholders are offered the privilege of exchanging shares of the fund for shares of other Fidelity funds, as set forth in the fund's prospectus, without paying a sales charge. The Board noted that, since the last Advisory Contract renewals in July 2006, Fidelity has taken a number of actions that benefited particular funds, including (i) dedicating additional resources to investment research and to restructure the investment research teams; (ii) contractually agreeing to reduce the management fee on Fidelity Advisor Floating Rate High Income Fund; (iii) contractually agreeing to reduce the management fees on Fidelity's California, Massachusetts, New Jersey, and New York AMT Tax-Free Money Market Funds, launching new Institutional Classes and Service Classes of these funds, and contractually agreeing to impose expense limitations on these funds; (iv) eliminating the exchange fee on the Fidelity Select Portfolios and reducing the pricing and bookkeeping fee rates for these funds; (v) reducing the maximum transfer agency fee rates on high income funds and certain equity funds; (vi) proposing amended management contracts that, if approved by shareholders, will add a performance adjustment component to the management fees paid by 18 Fidelity Advisor equity funds; (vii) contractually agreeing to reduce fees for Ultra-Short Central Fund and the money market Central Funds; (viii) waiving the Fidelity Advisor funds' contingent deferred sales charge on certain redemptions made through systematic withdrawal programs; and (ix) amending the management contracts for equity and fixed-income funds whose management contracts incorporate a "group fee" structure by adding four new fee "breakpoints" to the group fee rate schedules.
Furthermore, the Board considered that, on March 15, 2007, it had approved a proposal, subject to shareholder approval, to merge the fund into Fidelity Advisor Emerging Asia Fund. If shareholders approve the merger at a special meeting scheduled to be held in October 2007, it is expected to take place in December 2007.
Investment Performance and Compliance. The Board considered whether the fund has operated within its investment objective, as well as its record of compliance with its investment restrictions. It also reviewed the fund's absolute investment performance for each class, as well as the fund's relative investment performance for each class measured against a broad-based securities market index over multiple periods. The Board noted that FMR does not believe that a meaningful peer group exists against which to compare the fund's performance. The following charts considered by the Board show, over the one-, three-, and five-year periods ended December 31, 2006, the cumulative total returns of Institutional Class (Class I) and Class C of the fund and the cumulative total returns of a broad-based securities market index ("benchmark"). The returns of Institutional Class (Class I) and Class C show the performance of the highest and lowest performing classes, respectively (based on three-year performance).
Annual Report
Board Approval of Investment Advisory Contracts and
Management Fees - continued
Advisor Korea Fund

The Board stated that the relative investment performance of the fund was lower than its benchmark for the one- and three-year periods, although the five-year cumulative total return of Institutional Class (Class I) compared favorably to its benchmark. The Board considered that the variations in performance among the fund's classes reflect the variations in class expenses, which result in lower performance for higher expense classes. The Board discussed with FMR actions to be taken by FMR to improve the fund's below-benchmark performance.
The Board considered that FMR has taken steps to refocus and strengthen equity research, equity portfolio management, and compliance.
Based on its review, and giving particular weight to the nature and quality of the resources dedicated by the Investment Advisers to maintain and improve relative performance, the Board concluded that the nature, extent, and quality of the services provided to the fund will benefit the fund's shareholders, particularly in light of the Board's view that the fund's shareholders benefit from investing in a fund that is part of a large family of funds offering a variety of investment disciplines and services.
Annual Report
Competitiveness of Management Fee and Total Fund Expenses. The Board considered the fund's management fee and total expenses compared to "mapped groups" of competitive funds and classes. Fidelity creates "mapped groups" by combining similar Lipper investment objective categories that have comparable management fee characteristics. Combining Lipper investment objective categories aids the Board's management fee and total expense comparisons by broadening the competitive group used for comparison and by reducing the number of universes to which various Fidelity funds are compared. The Board also considered supplemental information about how the fund's management fee and total expenses ranked relative to groups based on Lipper classifications, which take into account a fund's market capitalization and style.
The Board considered two proprietary management fee comparisons for the 12-month periods shown in the chart below. The group of Lipper funds used by the Board for management fee comparisons is referred to below as the "Total Mapped Group." The Total Mapped Group comparison focuses on a fund's standing relative to the total universe of comparable funds available to investors, in terms of gross management fees before expense reimbursements or caps. "TMG %" represents the percentage of funds in the Total Mapped Group that had management fees that were lower than the fund's. For example, a TMG % of 17% means that 83% of the funds in the Total Mapped Group had higher management fees than the fund. The "Asset-Size Peer Group" (ASPG) comparison focuses on a fund's standing relative to non-Fidelity funds similar in size to the fund within the Total Mapped Group. The ASPG represents at least 15% of the funds in the Total Mapped Group with comparable asset size and management fee characteristics, subject to a minimum of 50 funds (or all funds in the Total Mapped Group if fewer than 50). Additional information, such as the ASPG quartile in which the fund's management fee ranked, is also included in the chart and considered by the Board.
Annual Report
Board Approval of Investment Advisory Contracts and
Management Fees - continued
Advisor Korea Fund
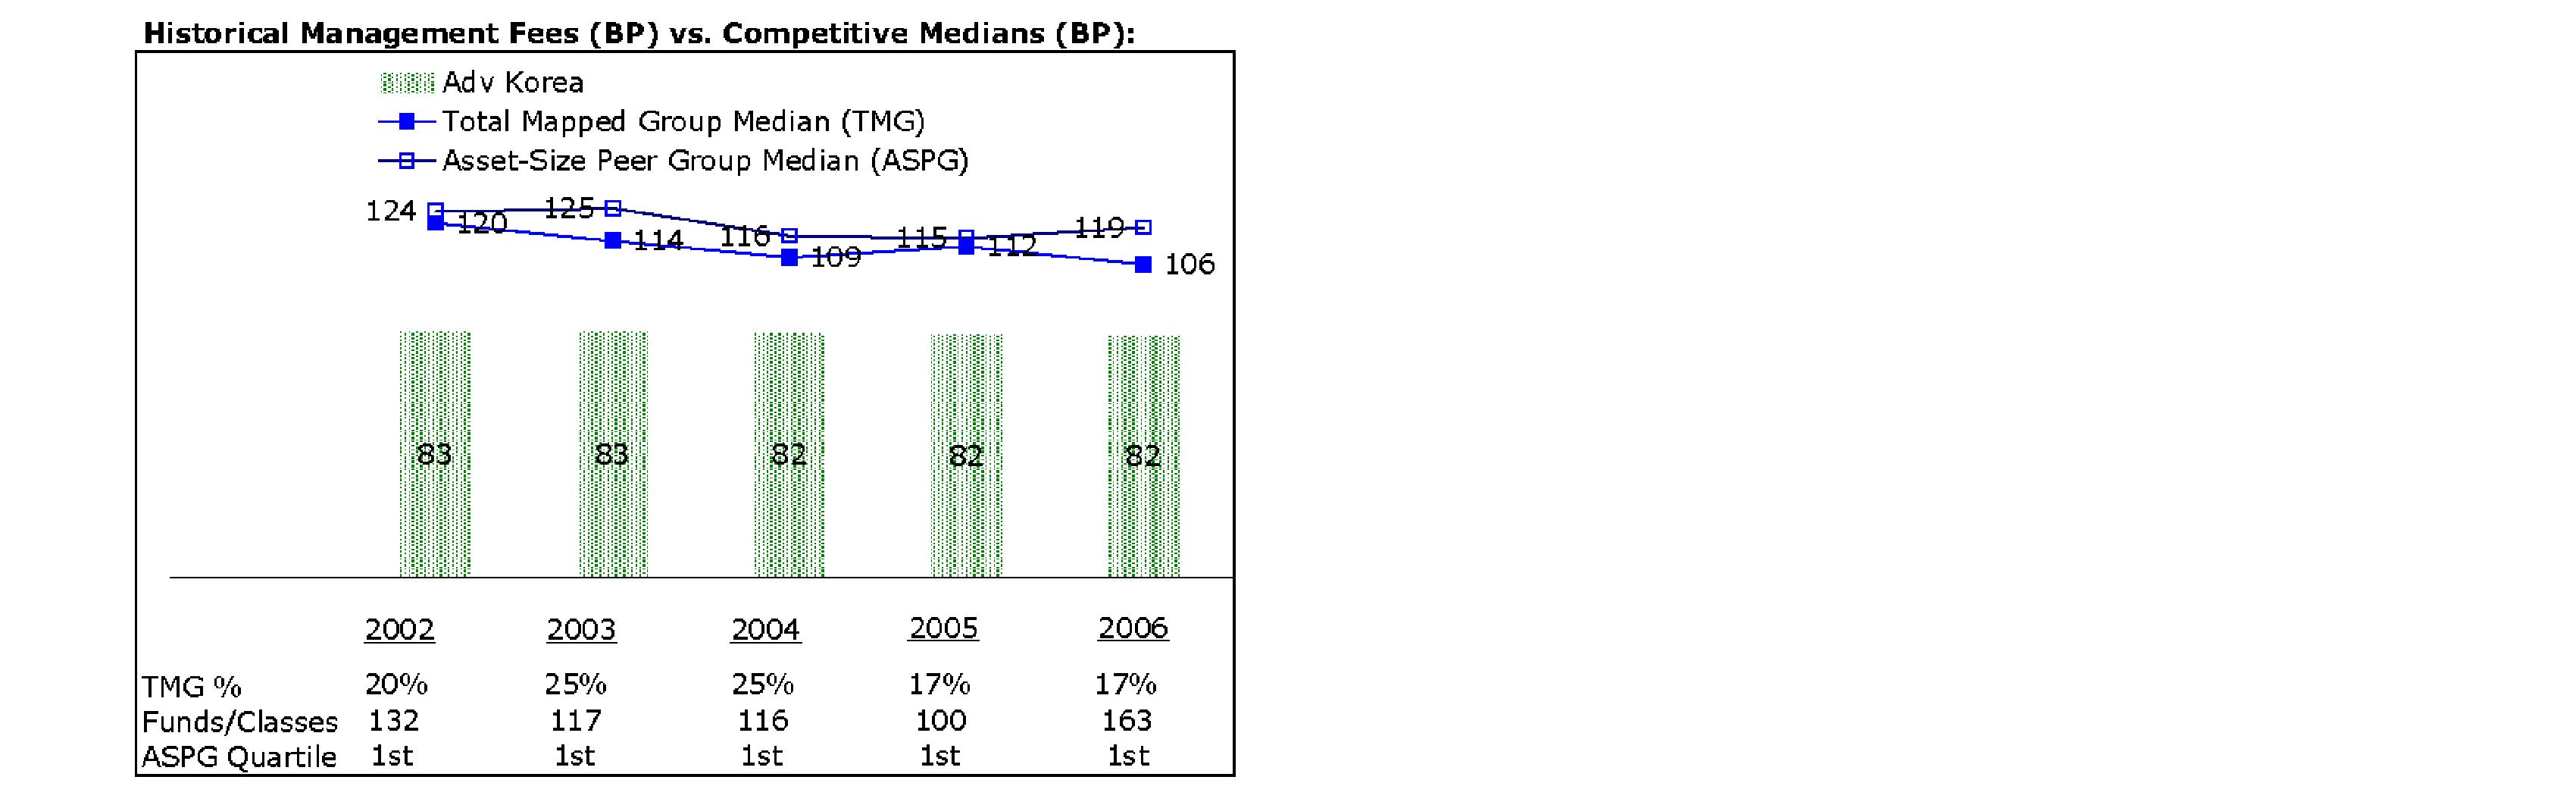
The Board noted that the fund's management fee ranked below the median of its Total Mapped Group and below the median of its ASPG for 2006.
Based on its review, the Board concluded that the fund's management fee was fair and reasonable in light of the services that the fund receives and the other factors considered.
In its review of each class's total expenses, the Board considered the fund's management fee as well as other fund or class expenses, as applicable, such as transfer agent fees, pricing and bookkeeping fees, fund-paid 12b-1 fees, and custodial, legal, and audit fees. The Board also noted the effects of any waivers and reimbursements on fees and expenses. As part of its review, the Board also considered current and historical total expenses of each class of the fund compared to competitive fund median expenses. Each class of the fund is compared to those funds and classes in the Total Mapped Group (used by the Board for management fee comparisons) that have a similar sales load structure.
The Board noted that the total expenses of each of Class A, Class B, Class C, and Institutional Class ranked below its competitive median for 2006, and the total expenses of Class T ranked above its competitive median for 2006. The Board noted that the fund offers multiple classes, each of which has a different sales load and 12b-1 fee structure, and that the multiple structures are intended to offer a range of pricing options for the intermediary market. The Board also noted that the total expenses of the classes vary primarily by the level of their 12b-1 fees, although differences in transfer agent fees may also cause expenses to vary from class to class.
Annual Report
In its review of total expenses, the Board also considered Fidelity fee structures and other information on clients that FMR and its affiliates service in other competitive markets, such as other mutual funds advised or subadvised by FMR or its affiliates, pension plan clients, and other institutional clients.
Based on its review, the Board concluded that the total expenses of each class of the fund were reasonable, although in one case above the median of the universe presented for comparison, in light of the services that the fund and its shareholders receive and the other factors considered.
Costs of the Services and Profitability. The Board considered the revenues earned and the expenses incurred by Fidelity in conducting the business of developing, marketing, distributing, managing, administering and servicing the fund and its shareholders. The Board also considered the level of Fidelity's profits in respect of all the Fidelity funds.
On an annual basis, FMR presents to the Board Fidelity's profitability for the fund. Fidelity calculates the profitability for each fund, as well as aggregate profitability for groups of Fidelity funds and all Fidelity funds, using a series of detailed revenue and cost allocation methodologies which originate with the audited books and records of Fidelity. The Audit Committee of the Board reviews any significant changes from the prior year's methodologies.
PricewaterhouseCoopers LLP (PwC), independent registered public accounting firm and auditor to Fidelity and certain Fidelity funds, has been engaged annually by the Board as part of the Board's assessment of the results of Fidelity's profitability analysis. PwC's engagement includes the review and assessment of Fidelity's methodologies used in determining the revenues and expenses attributable to Fidelity's mutual fund business, and completion of agreed-upon procedures surrounding the mathematical accuracy of fund profitability and its conformity to allocation methodologies. After considering PwC's reports issued under the engagement and information provided by Fidelity, the Board believes that while other allocation methods may also be reasonable, Fidelity's profitability methodologies are reasonable in all material respects.
The Board has also reviewed Fidelity's non-fund businesses and any fall-out benefits related to the mutual fund business as well as cases where Fidelity's affiliates may benefit from or be related to the fund's business.
The Board considered the costs of the services provided by and the profits realized by Fidelity in connection with the operation of the fund and determined that the amount of profit is a fair entrepreneurial profit for the management of the fund.
Economies of Scale. The Board considered whether there have been economies of scale in respect of the management of the Fidelity funds, whether the Fidelity funds (including the fund) have appropriately benefited from any such economies of scale, and whether there is potential for realization of any further economies of scale. The Board considered the extent to which the fund will benefit from economies of scale through increased services to the fund, through waivers or reimbursements, or through fee or expense reductions, including reductions that occur through operation of the transfer agent agreement. The transfer agent fee varies in part based on the number of accounts in the fund. If the number of accounts decreases or the average account size increases, the overall transfer agent fee rate decreases.
Annual Report
Board Approval of Investment Advisory Contracts and
Management Fees - continued
The Board recognized that the fund's management contract incorporates a "group fee" structure, which provides for lower group fee rates as total fund assets under FMR's management increase, and for higher group fee rates as total fund assets under FMR's management decrease. FMR determines the group fee rates based on a tiered asset "breakpoint" schedule. In connection with the renewal of the fund's management contract, the Board approved amendments to the fund's management contract that added four new fee breakpoints to the group fee rate schedule for assets under FMR's management above $1,386 billion. The Board considered that the group fee rate declines under both the present and amended schedules, but that under the amended schedule, the group fee rate declines faster as assets under FMR's management exceed $1,386 billion. The Board considered that the group fee is designed to deliver the benefits of economies of scale to fund shareholders when total fund assets increase, even if assets of any particular fund are unchanged or have declined, because some portion of Fidelity's costs are attributable to services provided to all Fidelity funds, and all funds benefit if those costs can be allocated among more assets. The Board also considered that although the fund is partially closed to new investors (to facilitate the fund's proposed merger), it continues to incur investment management expenses, and marketing and distribution expenses related to the retention of existing shareholders and assets. The Board further noted that the fund may continue to realize benefits from the group fee structure, even though assets may not be expected to grow significantly at the fund level. The Board concluded that, given the group fee structure, fund shareholders will achieve a certain level of economies of scale as assets under FMR's management increase at the fund complex level, regardless of whether Fidelity achieves any such economies of scale.
The Board further concluded that any potential economies of scale are being shared between fund shareholders and Fidelity in an appropriate manner.
Additional Information Requested by the Board. In order to develop fully the factual basis for consideration of the Fidelity funds' Advisory Contracts, the Board requested and received additional information on several topics, including (i) fund performance trends and actions to be taken by FMR to improve certain funds' overall performance; (ii) Fidelity's portfolio manager compensation structure, including its effects on fund profitability and the extent to which portfolio manager compensation is linked to fund performance; (iii) Fidelity's fee structures; (iv) the funds' sub-advisory arrangements; and (v) accounts managed by Fidelity other than the Fidelity funds.
Annual Report
Based on its evaluation of all of the conclusions noted above, and after considering all material factors, the Board ultimately concluded that the advisory fee structures are fair and reasonable, and that the fund's Advisory Contracts should be renewed.
Annual Report
Annual Report
Annual Report
Investment Adviser
Fidelity Management & Research Company
Boston, MA
Investment Sub-Advisers
FMR Co., Inc.
Fidelity Management & Research
(U.K.) Inc.
Fidelity Research & Analysis Company
Fidelity International
Investment Advisors
Fidelity Investments Japan Limited
Fidelity International Investment Advisors (U.K.) Limited
General Distributor
Fidelity Distributors Corporation
Boston, MA
Transfer and Service Agents
Fidelity Investments Institutional Operations Company, Inc.
Boston, MA
Fidelity Service Company, Inc.
Boston, MA
Custodian
JPMorgan Chase Bank
New York, NY
AKORI-UANN-1207
1.784759.104
(Fidelity Investment logo)(registered trademark)
(Fidelity Investment logo)(registered trademark)
Fidelity® Advisor
Latin America
Fund - Class A, Class T, Class B
and Class C
Annual Report
October 31, 2007
(2_fidelity_logos) (Registered_Trademark)
Contents
Chairman's Message | <Click Here> | Ned Johnson's message to shareholders. |
Performance | <Click Here> | How the fund has done over time. |
Management's Discussion | <Click Here> | The manager's review of fund performance, strategy and outlook. |
Shareholder Expense Example | <Click Here> | An example of shareholder expenses. |
Investment Changes | <Click Here> | A summary of major shifts in the fund's investments over the past six months. |
Investments | <Click Here> | A complete list of the fund's investments with their market values. |
Financial Statements | <Click Here> | Statements of assets and liabilities, operations, and changes in net assets,
as well as financial highlights. |
Notes | <Click Here> | Notes to the financial statements. |
Report of Independent Registered Public Accounting Firm | <Click Here> | |
Trustees and Officers | <Click Here> | |
Distributions | <Click Here> | |
Board Approval of Investment Advisory Contracts and Management Fees | <Click Here> | |
To view a fund's proxy voting guidelines and proxy voting record for the 12-month period ended June 30, visit http://www.fidelity.com (search for "proxy voting guidelines") or visit the Securities and Exchange Commission's (SEC) web site at http://www.sec.gov. You may also call 1-877-208-0098 to request a free copy of the proxy voting guidelines.
Standard & Poor's, S&P and S&P 500 are registered service marks of The McGraw-Hill Companies, Inc. and have been licensed for use by Fidelity Distributors Corporation.
Other third party marks appearing herein are the property of their respective owners.
All other marks appearing herein are registered or unregistered trademarks or service marks of FMR LLC or an affiliated company.
Annual Report
This report and the financial statements contained herein are submitted for the general information of the shareholders of the fund. This report is not authorized for distribution to prospective investors in the fund unless preceded or accompanied by an effective prospectus.
A fund files its complete schedule of portfolio holdings with the SEC for the first and third quarters of each fiscal year on Form N-Q. Forms N-Q are available on the SEC's web site at http://www.sec.gov. A fund's Forms N-Q may be reviewed and copied at the SEC's Public Reference Room in Washington, DC. Information regarding the operation of the SEC's Public Reference Room may be obtained by calling 1-800-SEC-0330. For a complete list of a fund's portfolio holdings, view the most recent holdings listing, semiannual report, or annual report on Fidelity's web site at http://www.fidelity.com or http://www.advisor.fidelity.com, as applicable.
NOT FDIC INSURED · MAY LOSE VALUE · NO BANK GUARANTEE
Neither the fund nor Fidelity Distributors Corporation is a bank.
Annual Report
Chairman's Message
(photo_of_Edward_C_Johnson_3d)
Dear Shareholder:
Many stock and bond markets around the world have been unsettled of late; however, volatility can often lead to opportunity for patient investors. Financial markets are always unpredictable, but there are a number of time-tested principles that can put the historical odds in your favor.
One of the basic tenets is to invest for the long term. Over time, riding out the markets' inevitable ups and downs has proven much more effective than selling into panic or chasing the hottest trend. Even missing only a few of the markets' best days can significantly diminish investor returns. Patience also affords the benefits of compounding - of earning interest on additional income or reinvested dividends and capital gains. There are tax advantages and cost benefits to consider as well. The more you sell, the more taxes you pay, and the more you trade, the higher the costs. While staying the course doesn't eliminate risk, it can considerably lessen the effect of short-term declines.
You can further manage your investing risk through diversification. And today, more than ever, geographic diversification should be taken into account. Studies indicate that asset allocation is the single most important determinant of a portfolio's long-term success. The right mix of stocks, bonds and cash - aligned to your particular risk tolerance and investment objective - is very important. Age-appropriate rebalancing is also an essential aspect of asset allocation. For younger investors, an emphasis on equities - which historically have been the best-performing asset class over time - is encouraged. As investors near their specific goal, such as retirement or sending a child to college, consideration may be given to replacing volatile assets (e.g. common stocks) with more-stable fixed investments (bonds or savings plans).
A third investment principle - investing regularly - can help lower the average cost of your purchases. Investing a certain amount of money each month or quarter helps ensure you won't pay for all your shares at market highs. This strategy - known as dollar cost averaging - also reduces unconstructive "emotion" from investing, helping shareholders avoid selling weak performers just prior to an upswing, or chasing a hot performer just before a correction.
We invite you to contact us via the Internet, through our Investor Centers or over the phone. It is our privilege to provide you the information you need to make the investments that are right for you.
Sincerely,
/s/Edward C. Johnson 3d
Edward C. Johnson 3d
Annual Report
Performance: The Bottom Line
Average annual total return reflects the change in the value of an investment, assuming reinvestment of the class' dividend income and capital gains (the profits earned upon the sale of securities that have grown in value) and assuming a constant rate of performance each year. The $10,000 table and the fund's returns do not reflect the deduction of taxes that a shareholder would pay on fund distributions or the redemption of fund shares. During periods of reimbursement by Fidelity, a fund's total return will be greater than it would be had the reimbursement not occurred. How a fund did yesterday is no guarantee of how it will do tomorrow. Returns reflect the conversion of Class B shares to Class A shares after a maximum of seven years.
Average Annual Total Returns
Periods ended October 31, 2007 | Past 1
year | Past 5
years | Life of
fund A |
Class A (incl. 5.75% sales charge) | 58.29% | 50.25% | 23.42% |
Class T (incl. 3.50% sales charge) | 61.64% | 50.59% | 23.46% |
Class B (incl. contingent deferred sales charge) B | 61.68% | 50.84% | 23.56% |
Class C (incl. contingent deferred sales charge) C | 65.66% | 50.92% | 23.34% |
A From December 21, 1998.
B Class B shares' contingent deferred sales charges included in the past one year, past five year, and life of fund total return figures are 5%, 2%, and 0%, respectively.
C Class C shares' contingent deferred sales charge included in the past one year, past five year, and life of fund total return figures are 1%, 0%, and 0%, respectively.
Annual Report
Performance - continued
$10,000 Over Life of Fund
Let's say hypothetically that $10,000 was invested in Fidelity® Advisor Latin America Fund - Class T on December 21, 1998, when the fund started, and the current 3.50% sales charge was paid. The chart shows how the value of your investment would have changed, and also shows how the MSCI® Emerging Markets - Latin America Index performed over the same period.
Annual Report
Management's Discussion of Fund Performance
Comments from Brent Bottamini, Portfolio Manager of Fidelity® Advisor Latin America Fund
Emerging-markets equities continued their sparkling multiyear performance, returning 68.33% as measured by the Morgan Stanley Capital InternationalSM (MSCI®) Emerging Markets Index during the 12-month period ending October 31, 2007. On the whole, developing markets benefited from brisk economic growth, the ongoing build-out of commercial and industrial infrastructure, and rising commodity prices. China led the way with a superlative gain of roughly 168%, reflecting optimism about opportunities within the country's fast-growing economy. Hong Kong surged higher for similar reasons, jumping more than 147%. Brazil, the third-largest component of the MSCI benchmark, rose 111%, fueled largely by its exports of natural resources. However, three of the four largest country weightings in the index trailed its overall return despite very strong absolute performance. South Korea-the index's biggest constituent with a weighting of about 16% on average during the period-was a prime example. It gained almost 57% but still fell about 12 percentage points shy of the MSCI Emerging Markets index. Taiwan and Russia also trailed, despite solid returns of approximately 40% and 33%, respectively.
During the year, the fund's Class A, Class T, Class B and Class C shares returned 67.94%, 67.50%, 66.68% and 66.66%, respectively (excluding sales charges), versus 78.51% for the MSCI Emerging Markets-Latin America Index. Performance relative to the index was held back by unfavorable security selection and an underweighting in materials, by weak stock selection and an overweighting in consumer discretionary stocks, and by a modest cash position. Good stock selection in telecommunication services helped, as did underweighting electric utilities. Geographically, weak stock selection in Brazil and Mexico hurt, but strong security selection in Chile and overweighting Brazil helped. Individual detractors included Brazilian airline TAM, Mexican homebuilder Corporacion Geo and underweighting materials stocks that performed well, including Brazil's Companhia Vale do Rio Doce (CVRD) and Grupo Mexico. Brazilian online retailer Submarino - which merged with Americanas.com to form B2W - Chilean iron ore and steel producer CAP and an underweighting in Mexican cement producer Cemex contributed.
Note to shareholders: Fidelity Advisor Latin America Fund may invest up to 35% of its total assets in any industry that represents more than 20% of the Latin American market. As of October 31, 2007, the fund did not have more than 25% of its total assets invested in any one industry.
The views expressed above reflect those of the portfolio manager(s) only through the end of the period as stated on the cover of this report and do not necessarily represent the views of Fidelity or any other person in the Fidelity organization. Any such views are subject to change at any time based upon market or other conditions and Fidelity disclaims any responsibility to update such views. These views may not be relied on as investment advice and, because investment decisions for a Fidelity fund are based on numerous factors, may not be relied on as an indication of trading intent on behalf of any Fidelity fund.
Annual Report
Shareholder Expense Example
As a shareholder of the Fund, you incur two types of costs: (1) transaction costs, including sales charges (loads) on purchase payments or redemption proceeds, redemption fees, and (2) ongoing costs, including management fees, distribution and/or service (12b-1) fees and other Fund expenses. This Example is intended to help you understand your ongoing costs (in dollars) of investing in the Fund and to compare these costs with the ongoing costs of investing in other mutual funds.
The Example is based on an investment of $1,000 invested at the beginning of the period and held for the entire period (May 1, 2007 to October 31, 2007).
Actual Expenses
The first line of the accompanying table for each class of the Fund provides information about actual account values and actual expenses. You may use the information in this line, together with the amount you invested, to estimate the expenses that you paid over the period. Simply divide your account value by $1,000.00 (for example, an $8,600 account value divided by $1,000.00 = 8.6), then multiply the result by the number in the first line for a class of the Fund under the heading entitled "Expenses Paid During Period" to estimate the expenses you paid on your account during this period. In addition, the Fund, as a shareholder in the underlying Fidelity Central Funds, will indirectly bear its pro rata share of the fees and expenses incurred by the underlying Fidelity Central Funds. These fees and expenses are not included in the Fund's annualized expense ratio used to calculate the expense estimate in the table below.
Hypothetical Example for Comparison Purposes
The second line of the accompanying table for each class of the Fund provides information about hypothetical account values and hypothetical expenses based on a Class' actual expense ratio and an assumed rate of return of 5% per year before expenses, which is not the Class' actual return. The hypothetical account values and expenses may not be used to estimate the actual ending account balance or expenses you paid for the period. You may use this information to compare the ongoing costs of investing in the Fund and other funds. To do so, compare this 5% hypothetical example with the 5% hypothetical examples that appear in the shareholder reports of the other funds. In addition, the Fund, as a shareholder in the underlying Fidelity Central Funds, will indirectly bear its pro rata share of the fees and expenses incurred by the underlying Fidelity Central Funds. These fees and expenses are not included in the Fund's annualized expense ratio used to calculate the expense estimate in the table below.
Annual Report
Please note that the expenses shown in the table are meant to highlight your ongoing costs only and do not reflect any transaction costs. Therefore, the second line of the table is useful in comparing ongoing costs only, and will not help you determine the relative total costs of owning different funds. In addition, if these transactional costs were included, your costs would have been higher.
| Beginning
Account Value
May 1, 2007 | Ending
Account Value
October 31, 2007 | Expenses Paid
During Period*
May 1, 2007
to October 31, 2007 |
Class A | | | |
Actual | $ 1,000.00 | $ 1,382.10 | $ 8.53 |
HypotheticalA | $ 1,000.00 | $ 1,018.05 | $ 7.22 |
Class T | | | |
Actual | $ 1,000.00 | $ 1,379.90 | $ 10.26 |
HypotheticalA | $ 1,000.00 | $ 1,016.59 | $ 8.69 |
Class B | | | |
Actual | $ 1,000.00 | $ 1,376.60 | $ 13.24 |
HypotheticalA | $ 1,000.00 | $ 1,014.06 | $ 11.22 |
Class C | | | |
Actual | $ 1,000.00 | $ 1,377.10 | $ 12.88 |
HypotheticalA | $ 1,000.00 | $ 1,014.37 | $ 10.92 |
Institutional Class | | | |
Actual | $ 1,000.00 | $ 1,384.60 | $ 6.55 |
HypotheticalA | $ 1,000.00 | $ 1,019.71 | $ 5.55 |
A 5% return per year before expenses
* Expenses are equal to each Class' annualized expense ratio (shown in the table below); multiplied by the average account value over the period, multiplied by 184/365 (to reflect the one-half year period).
| Annualized
Expense Ratio |
Class A | 1.42% |
Class T | 1.71% |
Class B | 2.21% |
Class C | 2.15% |
Institutional Class | 1.09% |
Annual Report
Investment Changes
Top Five Stocks as of October 31, 2007 |
| % of fund's
net assets | % of fund's net assets
6 months ago |
Petroleo Brasileiro SA Petrobras | 15.6 | 11.3 |
Companhia Vale do Rio Doce | 15.0 | 11.7 |
America Movil SAB de CV | 8.9 | 11.7 |
Banco Bradesco SA | 4.5 | 4.4 |
Uniao de Bancos Brasileiros SA (Unibanco) | 3.5 | 4.2 |
| 47.5 | |
Top Five Market Sectors as of October 31, 2007 |
| % of fund's
net assets | % of fund's net assets
6 months ago |
Materials | 26.4 | 24.0 |
Energy | 16.6 | 11.8 |
Financials | 16.2 | 15.1 |
Telecommunication Services | 13.0 | 15.4 |
Consumer Discretionary | 7.9 | 8.8 |
Top Five Countries as of October 31, 2007 |
(excluding cash equivalents) | % of fund's
net assets | % of fund's net assets
6 months ago |
Brazil | 64.6 | 58.1 |
Mexico | 21.4 | 29.1 |
Chile | 4.0 | 7.4 |
Bermuda | 1.7 | 0.5 |
United States of America | 1.1 | 0.6 |
Percentages are adjusted for the effect of open futures contracts, if applicable. |
Asset Allocation (% of fund's net assets) |
As of October 31, 2007 | As of April 30, 2007 |
| Stocks 96.1% | | | Stocks 97.7% | |
| Short-Term
Investments and
Net Other Assets 3.9% | | | Short-Term
Investments and
Net Other Assets 2.3% | |

Annual Report
Investments October 31, 2007
Showing Percentage of Net Assets
Common Stocks - 93.4% |
| Shares | | Value |
Argentina - 0.7% |
Banco Patagonia SA unit | 18,400 | | $ 446,679 |
Grupo Clarin SA GDR (a)(f) | 35,700 | | 714,000 |
Telecom Argentina SA Class B sponsored ADR (a) | 39,100 | | 938,791 |
TOTAL ARGENTINA | | 2,099,470 |
Bermuda - 1.7% |
Credicorp Ltd. (NY Shares) | 31,100 | | 2,311,663 |
Dufry South America Ltd. unit | 86,507 | | 2,525,558 |
Laep Investments Ltd. unit (a) | 57,184 | | 234,672 |
TOTAL BERMUDA | | 5,071,893 |
Brazil - 61.9% |
Acucar Guarani SA | 86,300 | | 504,302 |
AES Tiete SA (PN) (non-vtg.) | 25,036,300 | | 878,391 |
All America Latina Logistica SA unit | 156,400 | | 2,476,944 |
Amil Participacoes SA (a) | 48,700 | | 458,823 |
B2W Companhia Global Do Varejo | 48,600 | | 2,623,687 |
Banco ABC Brasil SA | 99,190 | | 888,645 |
Banco Bradesco SA: | | | |
(PN) | 96,756 | | 3,288,395 |
(PN) sponsored ADR | 286,500 | | 9,783,975 |
Banco Daycoval SA (PN) | 96,600 | | 1,139,032 |
Banco do Brasil SA | 79,100 | | 1,432,862 |
Banco do Estado do Rio Grande do Sul SA (a)(f) | 103,053 | | 699,886 |
Banco Indusval SA (f) | 25,160 | | 367,926 |
Banco Itau Holding Financeira SA sponsored ADR (non-vtg.) | 90,800 | | 2,592,340 |
Bovespa Holding SA (a) | 6,000 | | 114,271 |
Brasil Telecom Participacoes SA sponsored ADR | 42,340 | | 3,149,673 |
Companhia Brasileira (a)(f) | 778 | | 413,710 |
Companhia de Bebidas das Americas (AmBev): | | | |
(PN) sponsored ADR | 75,200 | | 6,144,592 |
sponsored ADR | 3,260 | | 260,800 |
Companhia de Saneamento de Minas Gerais | 66,800 | | 1,254,841 |
Companhia Providencia Industria e Comercio | 93,700 | | 720,311 |
Companhia Siderurgica Nacional SA (CSN) sponsored ADR (e) | 46,300 | | 3,699,370 |
Companhia Vale do Rio Doce: | | | |
(PN-A) sponsored ADR | 740,600 | | 23,380,742 |
sponsored ADR | 475,600 | | 17,920,608 |
Construtora Tenda SA | 105,700 | | 531,524 |
Duratex SA (PN) | 107,600 | | 3,600,349 |
Eletropaulo Metropolitana SA (PN-B) | 15,160,000 | | 1,169,794 |
Gafisa SA (a) | 39,600 | | 711,843 |
Common Stocks - continued |
| Shares | | Value |
Brazil - continued |
Gafisa SA ADR (a) | 16,300 | | $ 581,258 |
GVT Holding SA | 135,800 | | 2,982,718 |
Inpar SA | 45,600 | | 545,851 |
Localiza Rent a Car SA | 59,600 | | 705,857 |
MRV Engenharia e Participacoes SA | 50,100 | | 1,042,194 |
Multiplan Empreendimentos Imobiliarios SA | 77,400 | | 1,130,512 |
Net Servicos de Comunicacao SA: | | | |
sponsored ADR (a) | 7,500 | | 120,600 |
(PN) (a) | 160,900 | | 2,583,551 |
Petroleo Brasileiro SA - Petrobras: | | | |
(ON) | 8,500 | | 405,815 |
(PN) (non-vtg.) | 163,200 | | 6,805,896 |
(PN) sponsored ADR (non-vtg.) | 227,400 | | 18,917,406 |
sponsored ADR | 203,000 | | 19,412,890 |
Profarma Distribuidora de Produtos Farmaceuticos SA | 52,100 | | 1,008,815 |
Sao Carlos Empreen E Part SA (a) | 45,800 | | 549,304 |
Satipel Industrial SA | 54,000 | | 405,133 |
SEB - Sistema Educacional Brasileiro SA unit (a) | 14,900 | | 256,127 |
Sul America SA unit | 15,700 | | 283,763 |
TAM SA: | | | |
(PN) (ltd.-vtg.) | 48,500 | | 1,429,406 |
(PN) sponsored ADR (ltd. vtg.) | 18,500 | | 545,750 |
Tegma Gestao Logistica | 89,200 | | 1,531,264 |
Terna Participacoes SA unit | 71,000 | | 1,354,667 |
TIM Participacoes SA | 83,300 | | 388,069 |
TIM Participacoes SA sponsored ADR (non-vtg.) | 25,200 | | 1,169,280 |
Totvs SA | 57,700 | | 2,167,794 |
Tractebel Energia SA | 90,700 | | 1,266,581 |
Uniao de Bancos Brasileiros SA (Unibanco): | | | |
unit | 16,600 | | 262,706 |
GDR | 62,300 | | 9,845,892 |
Usinas Siderurgicas de Minas Gerais SA - Usiminas | 12,000 | | 1,007,109 |
Usinas Siderurgicas de Minas Gerais SA - Usiminas (PN-A) (non-vtg.) | 87,800 | | 6,886,066 |
Votorantim Celulose e Papel SA: | | | |
(PN) (non-vtg.) | 3,980 | | 125,236 |
sponsored ADR (non-vtg.) | 135,650 | | 4,252,628 |
TOTAL BRAZIL | | 180,177,774 |
Chile - 4.0% |
CAP SA | 148,189 | | 4,775,731 |
Inversiones Aguas Metropolitanas SA ADR (f) | 61,350 | | 1,518,965 |
Common Stocks - continued |
| Shares | | Value |
Chile - continued |
Lan Airlines SA sponsored ADR | 240,500 | | $ 4,001,920 |
Masisa SA | 3,017,104 | | 722,513 |
Vina Concha y Toro SA sponsored ADR | 9,085 | | 471,784 |
TOTAL CHILE | | 11,490,913 |
Colombia - 0.9% |
Almacenes Exito SA unit (f) | 137,300 | | 1,060,467 |
BanColombia SA sponsored ADR | 45,000 | | 1,653,750 |
TOTAL COLOMBIA | | 2,714,217 |
Luxembourg - 1.0% |
Tenaris SA sponsored ADR | 54,600 | | 2,937,480 |
Mexico - 21.4% |
Alsea SAB de CV | 990,400 | | 1,475,408 |
America Movil SAB de CV Series L sponsored ADR | 395,600 | | 25,868,279 |
Axtel SAB de CV unit (a) | 829,119 | | 2,100,059 |
Banco Compartamos SA de CV | 248,000 | | 1,279,574 |
Cemex SA de CV sponsored ADR (a) | 148,267 | | 4,547,349 |
Corporacion Geo SA de CV Series B (a) | 704,600 | | 2,597,683 |
Desarrolladora Homex Sab de CV (a) | 35,800 | | 338,293 |
Desarrolladora Homex Sab de CV sponsored ADR (a) | 12,700 | | 717,677 |
Empresas ICA Sociedad Controladora SA de CV (a) | 48,700 | | 342,094 |
Fomento Economico Mexicano SA de CV sponsored ADR | 145,563 | | 5,183,498 |
Grupo Aeroportuario del Pacifico SA de CV sponsored ADR | 37,600 | | 1,972,120 |
Grupo Aeroportuario Norte Sab de CV ADR | 14,253 | | 435,144 |
Grupo Mexico SA de CV Series B | 199,056 | | 1,811,332 |
Grupo Televisa SA de CV | 65,900 | | 328,703 |
Grupo Televisa SA de CV (CPO) sponsored ADR | 233,656 | | 5,806,352 |
Industrias Penoles SA de CV | 99,000 | | 2,349,669 |
Maxcom Telecomunicaciones SA de CV ADR (a) | 15,200 | | 263,872 |
Urbi, Desarrollos Urbanos, SA de CV (a) | 565,100 | | 2,183,575 |
Wal-Mart de Mexico SA de CV Series V | 631,869 | | 2,566,645 |
TOTAL MEXICO | | 62,167,326 |
Panama - 0.7% |
Copa Holdings SA Class A | 26,800 | | 1,013,308 |
Intergroup Financial Services Corp. | 41,129 | | 719,758 |
Intergroup Financial Services Corp. (f) | 11,123 | | 194,653 |
TOTAL PANAMA | | 1,927,719 |
Common Stocks - continued |
| Shares | | Value |
United States of America - 1.1% |
NII Holdings, Inc. (a) | 15,900 | | $ 922,200 |
Southern Copper Corp. | 15,261 | | 2,131,962 |
TOTAL UNITED STATES OF AMERICA | | 3,054,162 |
TOTAL COMMON STOCKS (Cost $147,392,303) | 271,640,954 |
Nonconvertible Preferred Stocks - 2.7% |
| | | |
Brazil - 2.7% |
Banco Itau Holding Financeira SA (PN) (non-vtg.) | 189,980 | | 5,391,606 |
Brasil Telecom Participacoes SA (PN) | 17,000 | | 254,003 |
Companhia Vale do Rio Doce (PN-A) | 74,400 | | 2,347,980 |
TOTAL NONCONVERTIBLE PREFERRED STOCKS (Cost $2,472,951) | 7,993,589 |
Convertible Bonds - 0.0% |
| Principal Amount (d) | | |
Brazil - 0.0% |
Companhia de Saneamento de Minas Gerais 2.3% 6/1/13(g)
(Cost $43,358) | BRL | 691 | | 51,922 |
Money Market Funds - 4.2% |
| Shares | | Value |
Fidelity Cash Central Fund, 4.97% (b) | 9,318,015 | | $ 9,318,015 |
Fidelity Securities Lending Cash Central Fund, 5.02% (b)(c) | 2,758,650 | | 2,758,650 |
TOTAL MONEY MARKET FUNDS (Cost $12,076,665) | 12,076,665 |
TOTAL INVESTMENT PORTFOLIO - 100.3% (Cost $161,985,277) | 291,763,130 |
NET OTHER ASSETS - (0.3)% | | (825,580) |
NET ASSETS - 100% | $ 290,937,550 |
Currency Abbreviation |
BRL | - | Brazilian real |
Legend |
(a) Non-income producing |
(b) Affiliated fund that is available only to investment companies and other accounts managed by Fidelity Investments. The rate quoted is the annualized seven-day yield of the fund at period end. A complete unaudited listing of the fund's holdings as of its most recent quarter end is available upon request. |
(c) Investment made with cash collateral received from securities on loan. |
(d) Principal amount is stated in United States dollars unless otherwise noted. |
(e) Security or a portion of the security is on loan at period end. |
(f) Security exempt from registration under Rule 144A of the Securities Act of 1933. These securities may be resold in transactions exempt from registration, normally to qualified institutional buyers. At the end of the period, the value of these securities amounted to $4,969,607 or 1.7% of net assets. |
(g) Restricted securities - Investment in securities not registered under the Securities Act of 1933 (excluding 144A issues). At the end of the period, the value of restricted securities (excluding 144A issues) amounted to $51,922 or 0.0% of net assets. |
Additional information on each holding is as follows: |
Security | Acquisition Date | Acquisition Cost |
Companhia de Saneamento de Minas Gerais 2.3% 6/1/13 | 8/20/07 | $ 43,358 |
Affiliated Central Funds |
Information regarding fiscal year to date income earned by the Fund from investments in Fidelity Central Funds is as follows: |
Fund | Income earned |
Fidelity Cash Central Fund | $ 256,945 |
Fidelity Securities Lending Cash Central Fund | 35,849 |
Total | $ 292,794 |
See accompanying notes which are an integral part of the financial statements.
Annual Report
Financial Statements
Statement of Assets and Liabilities
| October 31, 2007 |
| | |
Assets | | |
Investment in securities, at value (including securities loaned of $2,772,530) - See accompanying schedule: Unaffiliated issuers (cost $149,908,612) | $ 279,686,465 | |
Fidelity Central Funds (cost $12,076,665) | 12,076,665 | |
Total Investments (cost $161,985,277) | | $ 291,763,130 |
Cash | | 2,621 |
Receivable for investments sold | | 1,266,398 |
Receivable for fund shares sold | | 3,362,362 |
Dividends receivable | | 791,370 |
Interest receivable | | 2 |
Distributions receivable from Fidelity Central Funds | | 36,223 |
Prepaid expenses | | 49 |
Other receivables | | 16,073 |
Total assets | | 297,238,228 |
| | |
Liabilities | | |
Payable for investments purchased | $ 2,327,411 | |
Payable for fund shares redeemed | 806,160 | |
Accrued management fee | 158,304 | |
Distribution fees payable | 114,420 | |
Other affiliated payables | 64,589 | |
Other payables and accrued expenses | 71,144 | |
Collateral on securities loaned, at value | 2,758,650 | |
Total liabilities | | 6,300,678 |
| | |
Net Assets | | $ 290,937,550 |
Net Assets consist of: | | |
Paid in capital | | $ 156,383,577 |
Undistributed net investment income | | 787,106 |
Accumulated undistributed net realized gain (loss) on investments and foreign currency transactions | | 3,990,428 |
Net unrealized appreciation (depreciation) on investments and assets and liabilities in foreign currencies | | 129,776,439 |
Net Assets | | $ 290,937,550 |
See accompanying notes which are an integral part of the financial statements.
Annual Report
Statement of Assets and Liabilities - continued
| October 31, 2007 |
| | |
Calculation of Maximum Offering Price
Class A:
Net Asset Value and redemption price per share ($132,523,503 ÷ 2,151,418 shares) | | $ 61.60 |
| | |
Maximum offering price per share (100/94.25 of $61.60) | | $ 65.36 |
Class T:
Net Asset Value and redemption price per share ($46,959,819 ÷ 768,755 shares) | | $ 61.09 |
| | |
Maximum offering price per share (100/96.50 of $61.09) | | $ 63.31 |
Class B:
Net Asset Value and offering price per share ($32,142,595 ÷ 536,894 shares)A | | $ 59.87 |
| | |
Class C:
Net Asset Value and offering price per share ($60,414,909 ÷ 1,013,201 shares)A | | $ 59.63 |
| | |
Institutional Class:
Net Asset Value, offering price and redemption price per share ($18,896,724 ÷ 300,473 shares) | | $ 62.89 |
A Redemption price per share is equal to net asset value less any applicable contingent deferred sales charge.
See accompanying notes which are an integral part of the financial statements.
Annual Report
Financial Statements - continued
Statement of Operations
| Year ended October 31, 2007 |
| | |
Investment Income | | |
Dividends | | $ 4,685,211 |
Interest | | 2,553 |
Income from Fidelity Central Funds | | 292,794 |
| | 4,980,558 |
Less foreign taxes withheld | | (481,450) |
Total income | | 4,499,108 |
| | |
Expenses | | |
Management fee | $ 1,372,188 | |
Transfer agent fees | 556,109 | |
Distribution fees | 1,010,868 | |
Accounting and security lending fees | 103,601 | |
Custodian fees and expenses | 165,662 | |
Independent trustees' compensation | 619 | |
Registration fees | 75,873 | |
Audit | 50,662 | |
Legal | 2,922 | |
Miscellaneous | 924 | |
Total expenses before reductions | 3,339,428 | |
Expense reductions | (28,885) | 3,310,543 |
Net investment income (loss) | | 1,188,565 |
Realized and Unrealized Gain (Loss) Net realized gain (loss) on: | | |
Investment securities: | | |
Unaffiliated issuers | 5,125,397 | |
Foreign currency transactions | (96,532) | |
Total net realized gain (loss) | | 5,028,865 |
Change in net unrealized appreciation (depreciation) on: Investment securities | 95,316,910 | |
Assets and liabilities in foreign currencies | (2,833) | |
Total change in net unrealized appreciation (depreciation) | | 95,314,077 |
Net gain (loss) | | 100,342,942 |
Net increase (decrease) in net assets resulting from operations | | $ 101,531,507 |
See accompanying notes which are an integral part of the financial statements.
Annual Report
Statement of Changes in Net Assets
| Year ended
October 31,
2007 | Year ended
October 31,
2006 |
Increase (Decrease) in Net Assets | | |
Operations | | |
Net investment income (loss) | $ 1,188,565 | $ 1,379,135 |
Net realized gain (loss) | 5,028,865 | 2,245,672 |
Change in net unrealized appreciation (depreciation) | 95,314,077 | 21,269,289 |
Net increase (decrease) in net assets resulting
from operations | 101,531,507 | 24,894,096 |
Distributions to shareholders from net investment income | (1,338,713) | (538,516) |
Distributions to shareholders from net realized gain | (2,827,380) | (1,061,609) |
Total distributions | (4,166,093) | (1,600,125) |
Share transactions - net increase (decrease) | 60,112,145 | 63,902,874 |
Redemption fees | 149,278 | 173,927 |
Total increase (decrease) in net assets | 157,626,837 | 87,370,772 |
| | |
Net Assets | | |
Beginning of period | 133,310,713 | 45,939,941 |
End of period (including undistributed net investment income of $787,106 and undistributed net investment income of $1,189,745, respectively) | $ 290,937,550 | $ 133,310,713 |
See accompanying notes which are an integral part of the financial statements.
Annual Report
Financial Highlights - Class A
Years Ended October 31, | 2007 | 2006 | 2005 | 2004 | 2003 |
Selected Per-Share Data | | | | | |
Net asset value, beginning of period | $ 37.85 | $ 27.16 | $ 16.72 | $ 12.49 | $ 8.29 |
Income from Investment Operations | | | | | |
Net investment income (loss) C | .42 | .58 | .42 | .24 | .12 |
Net realized and unrealized gain (loss) | 24.52 | 10.94 | 10.14 | 4.09 | 4.17 |
Total from investment operations | 24.94 | 11.52 | 10.56 | 4.33 | 4.29 |
Distributions from net investment income | (.46) | (.34) | (.17) | (.11) | (.09) |
Distributions from net realized gain | (.77) | (.55) | - | - | - |
Total distributions | (1.23) | (.89) | (.17) | (.11) | (.09) |
Redemption fees added to paid in capital C | .04 | .06 | .05 | .01 | - |
Net asset value, end of period | $ 61.60 | $ 37.85 | $ 27.16 | $ 16.72 | $ 12.49 |
Total Return A,B | 67.94% | 43.54% | 63.94% | 34.98% | 52.29% |
Ratios to Average Net Assets D,F | | | | | |
Expenses before reductions | 1.45% | 1.62% | 1.93% | 3.07% | 5.92% |
Expenses net of fee waivers,
if any | 1.45% | 1.50% | 1.56% | 2.02% | 2.02% |
Expenses net of all reductions | 1.43% | 1.47% | 1.50% | 1.98% | 2.02% |
Net investment income (loss) | .88% | 1.70% | 1.88% | 1.63% | 1.22% |
Supplemental Data | | | | | |
Net assets, end of period (000 omitted) | $ 132,524 | $ 56,662 | $ 13,736 | $ 1,954 | $ 918 |
Portfolio turnover rate E | 49% | 50% | 42% | 71% | 67% |
A Total returns would have been lower had certain expenses not been reduced during the periods shown.
B Total returns do not include the effect of the sales charges.
C Calculated based on average shares outstanding during the period.
D Fees and expenses of the underlying Fidelity Central Funds are not included in the Fund's expense ratio. The Fund indirectly bears its proportionate share of the expenses of any underlying Fidelity Central Funds.
E Amount does not include the portfolio activity of any underlying Fidelity Central Funds.
F Expense ratios reflect operating expenses of the class. Expenses before reductions do not reflect amounts reimbursed by the investment adviser or reductions from brokerage service arrangements or other expense offset arrangements and do not represent the amount paid by the class during periods when reimbursements or reductions occur. Expenses net of fee waivers reflect expenses after reimbursement by the investment adviser but prior to reductions from brokerage service arrangements or other expense offset arrangements. Expenses net of all reductions represent the net expenses paid by the class.
See accompanying notes which are an integral part of the financial statements.
Annual Report
Financial Highlights - Class T
Years Ended October 31, | 2007 | 2006 | 2005 | 2004 | 2003 |
Selected Per-Share Data | | | | | |
Net asset value, beginning of period | $ 37.56 | $ 26.98 | $ 16.63 | $ 12.44 | $ 8.24 |
Income from Investment Operations | | | | | |
Net investment income (loss) C | .28 | .49 | .36 | .20 | .10 |
Net realized and unrealized gain (loss) | 24.35 | 10.86 | 10.09 | 4.07 | 4.16 |
Total from investment operations | 24.63 | 11.35 | 10.45 | 4.27 | 4.26 |
Distributions from net investment income | (.37) | (.28) | (.15) | (.09) | (.06) |
Distributions from net realized gain | (.77) | (.55) | - | - | - |
Total distributions | (1.14) | (.83) | (.15) | (.09) | (.06) |
Redemption fees added to paid in capital C | .04 | .06 | .05 | .01 | - |
Net asset value, end of period | $ 61.09 | $ 37.56 | $ 26.98 | $ 16.63 | $ 12.44 |
Total Return A,B | 67.50% | 43.11% | 63.57% | 34.59% | 52.06% |
Ratios to Average Net Assets D,F | | | | | |
Expenses before reductions | 1.72% | 1.89% | 2.26% | 3.47% | 6.58% |
Expenses net of fee waivers,
if any | 1.72% | 1.75% | 1.82% | 2.27% | 2.27% |
Expenses net of all reductions | 1.71% | 1.72% | 1.77% | 2.23% | 2.27% |
Net investment income (loss) | .61% | 1.45% | 1.61% | 1.38% | .97% |
Supplemental Data | | | | | |
Net assets, end of period (000 omitted) | $ 46,960 | $ 23,723 | $ 9,144 | $ 2,585 | $ 1,315 |
Portfolio turnover rate E | 49% | 50% | 42% | 71% | 67% |
A Total returns would have been lower had certain expenses not been reduced during the periods shown.
B Total returns do not include the effect of the sales charges.
C Calculated based on average shares outstanding during the period.
D Fees and expenses of the underlying Fidelity Central Funds are not included in the Fund's expense ratio. The Fund indirectly bears its proportionate share of the expenses of any underlying Fidelity Central Funds.
E Amount does not include the portfolio activity of any underlying Fidelity Central Funds.
F Expense ratios reflect operating expenses of the class. Expenses before reductions do not reflect amounts reimbursed by the investment adviser or reductions from brokerage service arrangements or other expense offset arrangements and do not represent the amount paid by the class during periods when reimbursements or reductions occur. Expenses net of fee waivers reflect expenses after reimbursement by the investment adviser but prior to reductions from brokerage service arrangements or other expense offset arrangements. Expenses net of all reductions represent the net expenses paid by the class.
See accompanying notes which are an integral part of the financial statements.
Annual Report
Financial Highlights - Class B
Years Ended October 31, | 2007 | 2006 | 2005 | 2004 | 2003 |
Selected Per-Share Data | | | | | |
Net asset value, beginning of period | $ 36.87 | $ 26.54 | $ 16.40 | $ 12.29 | $ 8.13 |
Income from Investment Operations | | | | | |
Net investment income (loss) C | .05 | .31 | .24 | .13 | .05 |
Net realized and unrealized gain (loss) | 23.91 | 10.68 | 9.95 | 4.02 | 4.12 |
Total from investment operations | 23.96 | 10.99 | 10.19 | 4.15 | 4.17 |
Distributions from net investment income | (.22) | (.17) | (.10) | (.05) | (.01) |
Distributions from net realized gain | (.77) | (.55) | - | - | - |
Total distributions | (.99) | (.72) | (.10) | (.05) | (.01) |
Redemption fees added to paid in capital C | .03 | .06 | .05 | .01 | - |
Net asset value, end of period | $ 59.87 | $ 36.87 | $ 26.54 | $ 16.40 | $ 12.29 |
Total Return A,B | 66.68% | 42.36% | 62.73% | 33.95% | 51.35% |
Ratios to Average Net Assets D,F | | | | | |
Expenses before reductions | 2.22% | 2.42% | 2.73% | 3.67% | 6.80% |
Expenses net of fee waivers,
if any | 2.22% | 2.25% | 2.34% | 2.77% | 2.77% |
Expenses net of all reductions | 2.20% | 2.22% | 2.28% | 2.73% | 2.77% |
Net investment income (loss) | .11% | .95% | 1.10% | .88% | .47% |
Supplemental Data | | | | | |
Net assets, end of period (000 omitted) | $ 32,143 | $ 17,402 | $ 8,998 | $ 3,222 | $ 1,513 |
Portfolio turnover rate E | 49% | 50% | 42% | 71% | 67% |
A Total returns would have been lower had certain expenses not been reduced during the periods shown.
B Total returns do not include the effect of the contingent deferred sales charge.
C Calculated based on average shares outstanding during the period.
D Fees and expenses of the underlying Fidelity Central Funds are not included in the Fund's expense ratio. The Fund indirectly bears its proportionate share of the expenses of any underlying Fidelity Central Funds.
E Amount does not include the portfolio activity of any underlying Fidelity Central Funds.
F Expense ratios reflect operating expenses of the class. Expenses before reductions do not reflect amounts reimbursed by the investment adviser or reductions from brokerage service arrangements or other expense offset arrangements and do not represent the amount paid by the class during periods when reimbursements or reductions occur. Expenses net of fee waivers reflect expenses after reimbursement by the investment adviser but prior to reductions from brokerage service arrangements or other expense offset arrangements. Expenses net of all reductions represent the net expenses paid by the class.
See accompanying notes which are an integral part of the financial statements.
Annual Report
Financial Highlights - Class C
Years Ended October 31, | 2007 | 2006 | 2005 | 2004 | 2003 |
Selected Per-Share Data | | | | | |
Net asset value, beginning of period | $ 36.74 | $ 26.48 | $ 16.35 | $ 12.25 | $ 8.11 |
Income from Investment Operations | | | | | |
Net investment income (loss) C | .07 | .31 | .24 | .13 | .05 |
Net realized and unrealized gain (loss) | 23.80 | 10.65 | 9.94 | 4.01 | 4.10 |
Total from investment operations | 23.87 | 10.96 | 10.18 | 4.14 | 4.15 |
Distributions from net investment income | (.24) | (.21) | (.10) | (.05) | (.01) |
Distributions from net realized gain | (.77) | (.55) | - | - | - |
Total distributions | (1.01) | (.76) | (.10) | (.05) | (.01) |
Redemption fees added to paid in capital C | .03 | .06 | .05 | .01 | - |
Net asset value, end of period | $ 59.63 | $ 36.74 | $ 26.48 | $ 16.35 | $ 12.25 |
Total Return A,B | 66.66% | 42.38% | 62.86% | 33.98% | 51.23% |
Ratios to Average Net Assets D,F | | | | | |
Expenses before reductions | 2.18% | 2.34% | 2.69% | 3.83% | 6.85% |
Expenses net of fee waivers,
if any | 2.18% | 2.25% | 2.32% | 2.77% | 2.77% |
Expenses net of all reductions | 2.17% | 2.22% | 2.26% | 2.73% | 2.77% |
Net investment income (loss) | .14% | .95% | 1.12% | .88% | .47% |
Supplemental Data | | | | | |
Net assets, end of period (000 omitted) | $ 60,415 | $ 29,189 | $ 9,252 | $ 2,167 | $ 1,114 |
Portfolio turnover rate E | 49% | 50% | 42% | 71% | 67% |
A Total returns would have been lower had certain expenses not been reduced during the periods shown.
B Total returns do not include the effect of the contingent deferred sales charge.
C Calculated based on average shares outstanding during the period.
D Fees and expenses of the underlying Fidelity Central Funds are not included in the Fund's expense ratio. The Fund indirectly bears its proportionate share of the expenses of any underlying Fidelity Central Funds.
E Amount does not include the portfolio activity of any underlying Fidelity Central Funds.
F Expense ratios reflect operating expenses of the class. Expenses before reductions do not reflect amounts reimbursed by the investment adviser or reductions from brokerage service arrangements or other expense offset arrangements and do not represent the amount paid by the class during periods when reimbursements or reductions occur. Expenses net of fee waivers reflect expenses after reimbursement by the investment adviser but prior to reductions from brokerage service arrangements or other expense offset arrangements. Expenses net of all reductions represent the net expenses paid by the class.
See accompanying notes which are an integral part of the financial statements.
Annual Report
Financial Highlights - Institutional Class
Years Ended October 31, | 2007 | 2006 | 2005 | 2004 | 2003 |
Selected Per-Share Data | | | | | |
Net asset value, beginning of period | $ 38.56 | $ 27.64 | $ 16.97 | $ 12.64 | $ 8.35 |
Income from Investment Operations | | | | | |
Net investment income (loss) B | .58 | .66 | .46 | .28 | .14 |
Net realized and unrealized gain (loss) | 25.01 | 11.13 | 10.33 | 4.15 | 4.24 |
Total from investment operations | 25.59 | 11.79 | 10.79 | 4.43 | 4.38 |
Distributions from net investment income | (.53) | (.38) | (.17) | (.11) | (.09) |
Distributions from net realized gain | (.77) | (.55) | - | - | - |
Total distributions | (1.30) | (.93) | (.17) | (.11) | (.09) |
Redemption fees added to paid in capital B | .04 | .06 | .05 | .01 | - |
Net asset value, end of period | $ 62.89 | $ 38.56 | $ 27.64 | $ 16.97 | $ 12.64 |
Total Return A | 68.51% | 43.79% | 64.36% | 35.36% | 52.99% |
Ratios to Average Net Assets C,E | | | | | |
Expenses before reductions | 1.12% | 1.26% | 1.59% | 2.14% | 5.40% |
Expenses net of fee waivers,
if any | 1.12% | 1.25% | 1.36% | 1.77% | 1.77% |
Expenses net of all reductions | 1.11% | 1.23% | 1.30% | 1.73% | 1.77% |
Net investment income (loss) | 1.21% | 1.94% | 2.08% | 1.88% | 1.47% |
Supplemental Data | | | | | |
Net assets, end of period (000 omitted) | $ 18,897 | $ 6,335 | $ 4,810 | $ 3,440 | $ 210 |
Portfolio turnover rate D | 49% | 50% | 42% | 71% | 67% |
A Total returns would have been lower had certain expenses not been reduced during the periods shown.
B Calculated based on average shares outstanding during the period.
C Fees and expenses of the underlying Fidelity Central Funds are not included in the Fund's expense ratio. The Fund indirectly bears its proportionate share of the expenses of any underlying Fidelity Central Funds.
D Amount does not include the portfolio activity of any underlying Fidelity Central Funds.
E Expense ratios reflect operating expenses of the class. Expenses before reductions do not reflect amounts reimbursed by the investment adviser or reductions from brokerage service arrangements or other expense offset arrangements and do not represent the amount paid by the class during periods when reimbursements or reductions occur. Expenses net of fee waivers reflect expenses after reimbursement by the investment adviser but prior to reductions from brokerage service arrangements or other expense offset arrangements. Expenses net of all reductions represent the net expenses paid by the class.
See accompanying notes which are an integral part of the financial statements.
Annual Report
Notes to Financial Statements
For the period ended October 31, 2007
1. Organization.
Fidelity Advisor Latin America Fund (the Fund) is a non-diversified fund of Fidelity Advisor Series VIII (the trust) and is authorized to issue an unlimited number of shares. The trust is registered under the Investment Company Act of 1940, as amended (the 1940 Act), as an open-end management investment company organized as a Massachusetts business trust.
The Fund offers Class A, Class T, Class B, Class C, and Institutional Class shares, each of which has equal rights as to assets and voting privileges. Each class has exclusive voting rights with respect to matters that affect that class. Class B shares will automatically convert to Class A shares after a holding period of seven years from the initial date of purchase. Investment income, realized and unrealized capital gains and losses, the common expenses of the Fund, and certain fund-level expense reductions, if any, are allocated on a pro rata basis to each class based on the relative net assets of each class to the total net assets of the Fund. Each class differs with respect to transfer agent and distribution and service plan fees incurred. Certain expense reductions also differ by class. The Fund's investments in emerging markets can be subject to social, economic, regulatory, and political uncertainties and can be extremely volatile.
2. Investments in Fidelity Central Funds.
The Fund may invest in Fidelity Central Funds, which are open-end investment companies available only to other investment companies and accounts managed by Fidelity Management & Research Company (FMR) and its affiliates. The Fund's Schedule of Investments lists each of the Fidelity Central Funds as an investment of the Fund, but does not include the underlying holdings of each Fidelity Central Fund. As an Investing Fund, the Fund indirectly bears its proportionate share of the expenses of the underlying Fidelity Central Funds.
The Money Market Central Funds seek preservation of capital and current income and are managed by Fidelity Investments Money Management, Inc. (FIMM), an affiliate of FMR.
A complete list of holdings for each Fidelity Central Fund is available upon request or at the SEC's web site at www.sec.gov. In addition, the financial statements of the Fidelity Central Funds, which are not covered by the Fund's Report of Independent Registered Public Accounting Firm, are available on the SEC's web site or upon request.
3. Significant Accounting Policies.
The financial statements have been prepared in conformity with accounting principles generally accepted in the United States of America, which require management to make certain estimates and assumptions at the date of the financial statements. The following summarizes the significant accounting policies of the Fund:
Annual Report
Notes to Financial Statements - continued
3. Significant Accounting Policies - continued
Security Valuation. Investments are valued and net asset value (NAV) per share is calculated (NAV calculation) as of the close of business of the New York Stock Exchange (NYSE), normally 4:00 p.m. Eastern time. Wherever possible, the Fund uses independent pricing services approved by the Board of Trustees to value its investments.
Equity securities, including restricted securities, for which market quotations are readily available, are valued at the last reported sale price or official closing price as reported by an independent pricing service on the primary market or exchange on which they are traded. In the event there were no sales during the day or closing prices are not available, securities are valued at the last quoted bid price. Debt securities, including restricted securities, for which quotations are readily available, are valued by independent pricing services or by dealers who make markets in such securities. Pricing services consider yield or price of bonds of comparable quality, coupon, maturity and type as well as available dealer supplied prices. Investments in open-end mutual funds, including the Fidelity Central Funds, are valued at their closing net asset value each business day. Short-term securities with remaining maturities of sixty days or less for which quotations are not readily available are valued at amortized cost, which approximates value.
When current market prices or quotations are not readily available or do not accurately reflect fair value, valuations may be determined in accordance with procedures adopted by the Board of Trustees. For example, when developments occur between the close of a market and the close of the NYSE that may materially affect the value of some or all of the securities, or when trading in a security is halted, those securities may be fair valued. Factors used in the determination of fair value may include monitoring news to identify significant market or security specific events such as changes in the value of U.S. securities markets, reviewing developments in foreign markets and evaluating the performance of ADRs, futures contracts and exchange-traded funds. Because the Fund's utilization of fair value pricing depends on market activity, the frequency with which fair value pricing is used cannot be predicted and may be utilized to a significant extent. The value of securities used for NAV calculation under fair value pricing may differ from published prices for the same securities.
Foreign Currency. The Fund uses foreign currency contracts to facilitate transactions in foreign-denominated securities. Losses from these transactions may arise from changes in the value of the foreign currency or if the counterparties do not perform under the contracts' terms.
Foreign-denominated assets, including investment securities, and liabilities are translated into U.S. dollars at the exchange rate at period end. Purchases and sales of investment securities, income and dividends received and expenses denominated in foreign currencies are translated into U.S. dollars at the exchange rate in effect on the transaction date.
Annual Report
3. Significant Accounting Policies - continued
Foreign Currency - continued
The effects of exchange rate fluctuations on investments are included with the net realized and unrealized gain (loss) on investment securities. Other foreign currency transactions resulting in realized and unrealized gain (loss) are disclosed separately.
Investment Transactions and Income. For financial reporting purposes, the Fund's investment holdings and NAV include trades executed through the end of the last business day of the period. The NAV for processing shareholder transactions includes trades executed through the end of the prior business day. Gains and losses on securities sold are determined on the basis of identified cost. Dividend income is recorded on the ex-dividend date, except for certain dividends from foreign securities where the ex-dividend date may have passed, which are recorded as soon as the Fund is informed of the ex-dividend date. Non-cash dividends included in dividend income, if any, are recorded at the fair market value of the securities received. Distributions received on securities that represent a return of capital or capital gain are recorded as a reduction of cost of investments and/or as a realized gain. The Fund estimates the components of distributions received that may be considered return of capital distributions or capital gain distributions. Interest income and distributions from the Fidelity Central Funds are accrued as earned. Interest income includes coupon interest and amortization of premium and accretion of discount on debt securities. Investment income is recorded net of foreign taxes withheld where recovery of such taxes is uncertain.
Expenses. Most expenses of the trust can be directly attributed to a fund. Expenses which cannot be directly attributed are apportioned among each Fund in the trust. Expense estimates are accrued in the period to which they relate and adjustments are made when actual amounts are known.
Income Tax Information and Distributions to Shareholders. Each year, the Fund intends to qualify as a regulated investment company by distributing all of its taxable income and realized gains under Subchapter M of the Internal Revenue Code. As a result, no provision for income taxes is required in the accompanying financial statements. Foreign taxes are provided for based on the Fund's understanding of the tax rules and rates that exist in the foreign markets in which it invests.
Distributions are recorded on the ex-dividend date. Income dividends and capital gain distributions are declared separately for each class. Income and capital gain distributions are determined in accordance with income tax regulations, which may differ from generally accepted accounting principles. In addition, the Fund will claim a portion of the payment made to redeeming shareholders as a distribution for income tax purposes.
Annual Report
Notes to Financial Statements - continued
3. Significant Accounting Policies - continued
Income Tax Information and Distributions to Shareholders - continued
Capital accounts within the financial statements are adjusted for permanent book-tax differences. These adjustments have no impact on net assets or the results of operations. Temporary book-tax differences will reverse in a subsequent period.
Book-tax differences are primarily due to foreign currency transactions, passive foreign investment companies (PFIC) and losses deferred due to wash sales.
The tax-basis components of distributable earnings and the federal tax cost as of period end were as follows:
Unrealized appreciation | $ 129,981,523 | |
Unrealized depreciation | (1,801,135) | |
Net unrealized appreciation (depreciation) | 128,180,388 | |
Undistributed ordinary income | 652,731 | |
Undistributed long-term capital gain | 4,632,711 | |
| | |
Cost for federal income tax purposes | $ 163,582,742 | |
The tax character of distributions paid was as follows:
| October 31, 2007 | October 31, 2006 |
Ordinary Income | $ 1,338,713 | $ 538,516 |
Long-term Capital Gains | 2,827,380 | 1,061,609 |
Total | $ 4,166,093 | $ 1,600,125 |
Short-Term Trading (Redemption) Fees. Shares held in the Fund less than 90 days are subject to a redemption fee equal to 1.50% of the proceeds of the redeemed shares. All redemption fees, including any estimated redemption fees paid by FMR, are retained by the Fund and accounted for as an addition to paid in capital.
New Accounting Pronouncements. In July 2006, Financial Accounting Standards Board Interpretation No. 48, Accounting for Uncertainty in Income Taxes - an interpretation of FASB Statement 109 (FIN 48), was issued and is effective on the last business day of the semiannual reporting period for fiscal years beginning after December 15, 2006. FIN 48 sets forth a threshold for financial statement recognition, measurement and disclosure of a tax position taken or expected to be taken on a tax return. Management has concluded that the adoption of FIN 48 will not result in a material impact on the Fund's net assets, results of operations and financial statement disclosures.
Annual Report
3. Significant Accounting Policies - continued
New Accounting Pronouncements - continued
In addition, in September 2006, Statement of Financial Accounting Standards No. 157, Fair Value Measurements (SFAS 157), was issued and is effective for fiscal years beginning after November 15, 2007. SFAS 157 defines fair value, establishes a framework for measuring fair value and expands disclosures about fair value measurements. Management is currently evaluating the impact the adoption of SFAS 157 will have on the Fund's financial statement disclosures.
4. Operating Policies.
Repurchase Agreements. FMR has received an Exemptive Order from the Securities and Exchange Commission (the SEC) which permits the Fund and other affiliated entities of FMR to transfer uninvested cash balances into joint trading accounts which are then invested in repurchase agreements. The Fund may also invest directly with institutions in repurchase agreements. Repurchase agreements are collateralized by government or non-government securities. Upon settlement date, collateral is held in segregated accounts with custodian banks and may be obtained in the event of a default of the counterparty. The Fund monitors, on a daily basis, the value of the collateral to ensure it is at least equal to the principal amount of the repurchase agreement (including accrued interest). In the event of a default by the counterparty, realization of the collateral proceeds could be delayed, during which time the value of the collateral may decline.
Restricted Securities. The Fund may invest in securities that are subject to legal or contractual restrictions on resale. These securities generally may be resold in transactions exempt from registration or to the public if the securities are registered. Disposal of these securities may involve time-consuming negotiations and expense, and prompt sale at an acceptable price may be difficult. Information regarding restricted securities is included at the end of the Fund's Schedule of Investments.
5. Purchases and Sales of Investments.
Purchases and sales of securities, other than short-term securities, aggregated $142,530,464 and $92,943,635, respectively.
6. Fees and Other Transactions with Affiliates.
Management Fee. FMR and its affiliates provide the Fund with investment management related services for which the Fund pays a monthly management fee. The management fee is the sum of an individual fund fee rate that is based on an annual rate of .45% of the Fund's average net assets and a group fee rate that averaged ..26% during the
Annual Report
Notes to Financial Statements - continued
6. Fees and Other Transactions with Affiliates - continued
Management Fee - continued
period. The group fee rate is based upon the average net assets of all the mutual funds advised by FMR. The group fee rate decreases as assets under management increase and increases as assets under management decrease. For the period, the total annual management fee rate was .71% of the Fund's average net assets.
Distribution and Service Plan. In accordance with Rule 12b-1 of the 1940 Act, the Fund has adopted separate Distribution and Service Plans for each class of shares. Certain classes pay Fidelity Distributors Corporation (FDC), an affiliate of FMR, separate Distribution and Service Fees, each of which is based on an annual percentage of each class' average net assets. In addition, FDC may pay financial intermediaries for selling shares of the Fund and providing shareholder support services. For the period, the Distribution and Service Fee rates and the total amounts paid to and retained by FDC were as follows:
| Distribution
Fee | Service
Fee | Paid to
FDC | Retained
by FDC |
Class A | 0% | .25% | $ 214,911 | $ 9,272 |
Class T | .25% | .25% | 167,184 | 132 |
Class B | .75% | .25% | 225,745 | 169,401 |
Class C | .75% | .25% | 403,028 | 164,683 |
| | | $ 1,010,868 | $ 343,488 |
Sales Load. FDC receives a front-end sales charge of up to 5.75% for selling Class A shares, and 3.50% for selling Class T shares, some of which is paid to financial intermediaries for selling shares of the Fund. FDC receives the proceeds of contingent deferred sales charges levied on Class A, Class T, Class B, and Class C redemptions. These charges depend on the holding period. The deferred sales charges range from 5% to 1% for Class B, 1% for Class C, 1.00% to .50% for certain purchases of Class A shares and .25% for certain purchases of Class T shares.
For the period, sales charge amounts retained by FDC were as follows:
| Retained
by FDC |
Class A | $ 215,507 |
Class T | 23,115 |
Class B* | 48,375 |
Class C* | 28,265 |
| $ 315,262 |
* When Class B and Class C shares are initially sold, FDC pays commissions from its own resources to financial intermediaries through which the sales are made.
Annual Report
6. Fees and Other Transactions with Affiliates - continued
Transfer Agent Fees. Fidelity Investments Institutional Operations Company, Inc. (FIIOC), an affiliate of FMR, is the transfer, dividend disbursing and shareholder servicing agent for each class of the Fund. FIIOC receives account fees and asset-based fees that vary according to the account size and type of account of the shareholders of the respective classes of the Fund. FIIOC pays for typesetting, printing and mailing of shareholder reports, except proxy statements. For the period, the total transfer agent fees paid by each class to FIIOC, were as follows:
| Amount | % of
Average
Net Assets |
Class A | $ 246,422 | .29 |
Class T | 104,475 | .31 |
Class B | 69,557 | .31 |
Class C | 112,282 | .28 |
Institutional Class | 23,373 | .21 |
| $ 556,109 | |
Accounting and Security Lending Fees. Fidelity Service Company, Inc. (FSC), an affiliate of FMR, maintains the Fund's accounting records. The accounting fee is based on the level of average net assets for the month. Under a separate contract, FSC administers the security lending program. The security lending fee is based on the number and duration of lending transactions.
Brokerage Commissions. The Fund placed a portion of its portfolio transactions with brokerage firms which are affiliates of the investment adviser. The commissions paid to these affiliated firms were $88 for the period.
7. Committed Line of Credit.
The Fund participates with other funds managed by FMR in a $4.2 billion credit facility (the "line of credit") to be utilized for temporary or emergency purposes to fund shareholder redemptions or for other short-term liquidity purposes. The Fund has agreed to pay commitment fees on its pro rata portion of the line of credit, which amounted to $372 and is reflected in Miscellaneous Expense on the Statement of Operations. During the period, there were no borrowings on this line of credit.
8. Security Lending.
The Fund lends portfolio securities from time to time in order to earn additional income. On the settlement date of the loan, the Fund receives collateral (in the form of U.S. Treasury obligations, letters of credit and/or cash) against the loaned securities and maintains collateral in an amount not less than 100% of the market value of the loaned
Annual Report
Notes to Financial Statements - continued
8. Security Lending - continued
securities during the period of the loan. The market value of the loaned securities is determined at the close of business of the Fund and any additional required collateral is delivered to the Fund on the next business day. If the borrower defaults on its obligation to return the securities loaned because of insolvency or other reasons, a fund could experience delays and costs in recovering the securities loaned or in gaining access to the collateral. Any cash collateral received is invested in the Fidelity Securities Lending Cash Central Fund. The value of loaned securities and cash collateral at period end are disclosed on the Fund's Statement of Assets and Liabilities. Security lending income represents the income earned on investing cash collateral, less fees and expenses associated with the loan, plus any premium payments that may be received on the loan of certain types of securities. Security lending income is presented in the Statement of Operations as a component of income from Fidelity Central Funds. Net income from lending portfolio securities during the period amounted to $35,849.
9. Expense Reductions.
Many of the brokers with whom FMR places trades on behalf of the Fund provided services to the Fund in addition to trade execution. These services included payments of certain expenses on behalf of the Fund totaling $24,840 for the period. In addition, through arrangements with the Fund's custodian, credits realized as a result of uninvested cash balances were used to reduce the Fund's expenses. During the period, these credits reduced the Fund's custody expenses by $2,253.
10. Other.
The Fund's organizational documents provide former and current trustees and officers with a limited indemnification against liabilities arising in connection with the performance of their duties to the Fund. In the normal course of business, the Fund may also enter into contracts that provide general indemnifications. The Fund's maximum exposure under these arrangements is unknown as this would be dependent on future claims that may be made against the Fund. The risk of material loss from such claims is considered remote.
In September 2006, FIIOC, the Fund's transfer agent, notified the Fund that the Fund's books and records did not reflect a conversion of certain Class B to Class A shares upon their conversion date. In March 2007, FIIOC converted the relevant Class B shares to Class A shares and recorded the conversion in the books and records of the Fund which did not result in a material impact to the Fund's reported net assets or results of operations in the accompanying financial statements. FIIOC has remediated affected shareholders and reimbursed the Fund for all related audit and legal expenses.
Annual Report
10. Other - continued
The United States Securities and Exchange Commission ("SEC") is conducting an investigation of FMR (covering the years 2002 to 2004) arising from gifts, gratuities and business entertainment provided by certain brokers to certain individuals who were employed on FMR's domestic equity trading desk during that period. FMR is in discussions with the SEC staff regarding the possible resolution of the matter, but as of period-end no final resolution has been reached.
In December 2006, the Independent Trustees completed their own investigation of the matter with the assistance of independent counsel. The Independent Trustees and FMR agree that, despite the absence of proof that the Fidelity mutual funds experienced diminished execution quality as a result of the improper receipt of gifts and business entertainment, the conduct at issue was serious and is worthy of redress. Accordingly, the Independent Trustees have requested and FMR has agreed to pay $42 million to Fidelity mutual funds, plus interest to be determined at the time that payment is made. A method of allocating this payment among the funds has not yet been determined. The total payment to the Fund is not anticipated to have a material impact on the Fund's net assets. In addition, FMR reimbursed related legal expenses which are recorded in the accompanying Statement of Operations as an expense reduction.
11. Distributions to Shareholders.
Distributions to shareholders of each class were as follows:
Years ended October 31, | 2007 | 2006 |
From net investment income | | |
Class A | $ 709,973 | $ 219,332 |
Class T | 240,940 | 104,207 |
Class B | 107,563 | 62,797 |
Class C | 191,630 | 83,084 |
Institutional Class | 88,607 | 69,096 |
Total | $ 1,338,713 | $ 538,516 |
From net realized gain | | |
Class A | $ 1,198,858 | $ 344,480 |
Class T | 501,417 | 205,956 |
Class B | 369,748 | 198,827 |
Class C | 627,893 | 211,054 |
Institutional Class | 129,464 | 101,292 |
Total | $ 2,827,380 | $ 1,061,609 |
Annual Report
Notes to Financial Statements - continued
12. Share Transactions.
Transactions for each class of shares were as follows:
| Shares | Dollars |
Years ended October 31, | 2007 | 2006 | 2007 | 2006 |
Class A | | | | |
Shares sold | 1,393,391 | 1,595,680 | $ 65,803,104 | $ 53,840,185 |
Reinvestment of distributions | 43,952 | 17,187 | 1,688,203 | 510,999 |
Shares redeemed | (782,832) | (621,628) | (35,128,744) | (20,607,296) |
Net increase (decrease) | 654,511 | 991,239 | $ 32,362,563 | $ 33,743,888 |
Class T | | | | |
Shares sold | 455,916 | 687,146 | $ 21,240,936 | $ 23,305,912 |
Reinvestment of distributions | 18,830 | 10,076 | 718,933 | 298,075 |
Shares redeemed | (337,584) | (404,484) | (15,355,363) | (13,258,659) |
Net increase (decrease) | 137,162 | 292,738 | $ 6,604,506 | $ 10,345,328 |
Class B | | | | |
Shares sold | 237,976 | 327,369 | $ 10,853,846 | $ 10,890,504 |
Reinvestment of distributions | 11,564 | 8,380 | 434,710 | 244,506 |
Shares redeemed | (184,610) | (202,830) | (7,992,057) | (6,575,665) |
Net increase (decrease) | 64,930 | 132,919 | $ 3,296,499 | $ 4,559,345 |
Class C | | | | |
Shares sold | 583,666 | 719,183 | $ 27,131,346 | $ 23,864,225 |
Reinvestment of distributions | 19,005 | 8,714 | 711,556 | 253,286 |
Shares redeemed | (384,050) | (282,654) | (16,675,013) | (9,000,168) |
Net increase (decrease) | 218,621 | 445,243 | $ 11,167,889 | $ 15,117,343 |
Institutional Class | | | | |
Shares sold | 223,683 | 146,138 | $ 11,037,917 | $ 5,053,930 |
Reinvestment of distributions | 3,561 | 3,624 | 139,192 | 109,601 |
Shares redeemed | (91,047) | (159,490) | (4,496,421) | (5,026,561) |
Net increase (decrease) | 136,197 | (9,728) | $ 6,680,688 | $ 136,970 |
Annual Report
Report of Independent Registered Public Accounting Firm
To the Trustees of Fidelity Advisor Series VIII and the Shareholders of Fidelity Advisor Latin America Fund:
In our opinion, the accompanying statement of assets and liabilities, including the schedule of investments, and the related statements of operations and of changes in net assets and the financial highlights present fairly, in all material respects, the financial position of Fidelity Advisor Latin America Fund (a fund of Fidelity Advisor Series VIII) at October 31, 2007, the results of its operations for the year then ended, the changes in its net assets for each of the two years in the period then ended and the financial highlights for each of the five years in the period then ended, in conformity with accounting principles generally accepted in the United States of America. These financial statements and financial highlights (hereafter referred to as "financial statements") are the responsibility of the Fidelity Advisor Latin America Fund's management. Our responsibility is to express an opinion on these financial statements based on our audits. We conducted our audits of these financial statements in accordance with the standards of the Public Company Accounting Oversight Board (United States). Those standards require that we plan and perform the audit to obtain reasonable assurance about whether the financial statements are free of material misstatement. An audit includes examining, on a test basis, evidence supporting the amounts and disclosures in the financial statements, assessing the accounting principles used and significant estimates made by management, and evaluating the overall financial statement presentation. We believe that our audits, which included confirmation of securities at October 31, 2007 by correspondence with the custodian and brokers, provide a reasonable basis for our opinion.
/s/ PricewaterhouseCoopers LLP
PricewaterhouseCoopers LLP
Boston, Massachusetts
December 20, 2007
Annual Report
Trustees and Officers
The Trustees, Members of the Advisory Board, and executive officers of the trust and fund, as applicable, are listed below. The Board of Trustees governs the fund and is responsible for protecting the interests of shareholders. The Trustees are experienced executives who meet periodically throughout the year to oversee the fund's activities, review contractual arrangements with companies that provide services to the fund, and review the fund's performance. Except for James C. Curvey, each of the Trustees oversees 370 funds advised by FMR or an affiliate. Mr. Curvey oversees 340 funds advised by FMR or an affiliate.
The Trustees hold office without limit in time except that (a) any Trustee may resign; (b) any Trustee may be removed by written instrument, signed by at least two-thirds of the number of Trustees prior to such removal; (c) any Trustee who requests to be retired or who has become incapacitated by illness or injury may be retired by written instrument signed by a majority of the other Trustees; and (d) any Trustee may be removed at any special meeting of shareholders by a two-thirds vote of the outstanding voting securities of the trust. Each Trustee who is not an interested person (as defined in the 1940 Act) (Independent Trustee), shall retire not later than the last day of the calendar year in which his or her 72nd birthday occurs. The Independent Trustees may waive this mandatory retirement age policy with respect to individual Trustees. The executive officers and Advisory Board Members hold office without limit in time, except that any officer and Advisory Board Member may resign or may be removed by a vote of a majority of the Trustees at any regular meeting or any special meeting of the Trustees. Except as indicated, each individual has held the office shown or other offices in the same company for the past five years.
The fund's Statement of Additional Information (SAI) includes more information about the Trustees. To request a free copy, call Fidelity at 1-877-208-0098.
Interested Trustees*:
Correspondence intended for each Trustee who is an interested person may be sent to Fidelity Investments, 82 Devonshire Street, Boston, Massachusetts 02109.
Name, Age; Principal Occupation |
Edward C. Johnson 3d (77) |
| Year of Election or Appointment: 1983 Mr. Johnson is Chairman of the Board of Trustees. Mr. Johnson serves as President (2006-present), Chief Executive Officer, Chairman, and a Director of FMR LLC; Chairman and a Director of FMR; Chairman and a Director of Fidelity Research & Analysis Company (FRAC); Chairman and a Director of Fidelity Investments Money Management, Inc.; and Chairman (2001-present) and a Director of FMR Co., Inc. In addition, Mr. Johnson serves as Chairman and Director of Fidelity International Limited (FIL). |
James C. Curvey (72) |
| Year of Election or Appointment: 2007 Mr. Curvey also serves as Trustee (2007-present) or Member of the Advisory Board (2007-present) of other investment companies advised by FMR. Mr. Curvey is a Director of FMR and FMR Co., Inc. (2007-present). Mr. Curvey is also Vice Chairman (2006-present) and Director of FMR LLC. Mr. Curvey joined Fidelity in 1982 and served in numerous senior management positions, including President and Chief Operating Officer of FMR LLC (1997-2000) and President of Fidelity Strategic Investments (2000-2002). In addition, he serves as a member of the Board of Directors of Geerlings & Wade, Inc. (wine distribution). |
* Trustees have been determined to be "Interested Trustees" by virtue of, among other things, their affiliation with the trust or various entities under common control with FMR. FMR Corp. merged with FMR LLC on October 1, 2007. Any references to FMR LLC for prior periods are deemed to be references to the prior entity.
Independent Trustees:
Correspondence intended for each Independent Trustee (that is, the Trustees other than the Interested Trustees) may be sent to Fidelity Investments, P.O. Box 55235, Boston, Massachusetts 02205-5235.
Name, Age; Principal Occupation |
Dennis J. Dirks (59) |
| Year of Election or Appointment: 2005 Prior to his retirement in May 2003, Mr. Dirks was Chief Operating Officer and a member of the Board of The Depository Trust & Clearing Corporation (DTCC) (1999-2003). He also served as President, Chief Operating Officer, and Board member of The Depository Trust Company (DTC) (1999-2003) and President and Board member of the National Securities Clearing Corporation (NSCC) (1999-2003). In addition, Mr. Dirks served as Chief Executive Officer and Board member of the Government Securities Clearing Corporation (2001-2003) and Chief Executive Officer and Board member of the Mortgage-Backed Securities Clearing Corporation (2001-2003). Mr. Dirks also serves as a Trustee and a member of the Finance Committee of Manhattan College (2005-present) and a Trustee and a member of the Finance Committee of AHRC of Nassau County (2006-present). |
Albert R. Gamper, Jr. (65) |
| Year of Election or Appointment: 2006 Prior to his retirement in December 2004, Mr. Gamper served as Chairman of the Board of CIT Group Inc. (commercial finance). During his tenure with CIT Group Inc. Mr. Gamper served in numerous senior management positions, including Chairman (1987-1989; 1999-2001; 2002-2004), Chief Executive Officer (1987-2004), and President (1989-2002). He currently serves as a member of the Board of Directors of Public Service Enterprise Group (utilities, 2001-present), Chairman of the Board of Governors, Rutgers University (2004-present), and Chairman of the Board of Saint Barnabas Health Care System. |
George H. Heilmeier (71) |
| Year of Election or Appointment: 2004 Dr. Heilmeier is Chairman Emeritus of Telcordia Technologies (communication software and systems), where prior to his retirement, he served as company Chairman and Chief Executive Officer. He currently serves on the Boards of Directors of The Mitre Corporation (systems engineering and information technology support for the government), and HRL Laboratories (private research and development, 2004-present). He is Chairman of the General Motors Science & Technology Advisory Board and a Life Fellow of the Institute of Electrical and Electronics Engineers (IEEE). Dr. Heilmeier is a member of the Defense Science Board and the National Security Agency Advisory Board. He is also a member of the National Academy of Engineering, the American Academy of Arts and Sciences, and the Board of Overseers of the School of Engineering and Applied Science of the University of Pennsylvania. Previously, Dr. Heilmeier served as a Director of TRW Inc. (automotive, space, defense, and information technology, 1992-2002), Compaq (1994-2002), Automatic Data Processing, Inc. (ADP) (technology-based business outsourcing, 1995-2002), INET Technologies Inc. (telecommunications network surveillance, 2001-2004), and Teletech Holdings (customer management services). He is the recipient of the 2005 Kyoto Prize in Advanced Technology for his invention of the liquid crystal display, and a member of the Consumer Electronics Hall of Fame. |
James H. Keyes (67) |
| Year of Election or Appointment: 2007 Prior to his retirement in 2003, Mr. Keyes was Chairman, President, and Chief Executive Officer of Johnson Controls, Inc. (automotive supplier, 1993-2003). He currently serves as a member of the boards of LSI Logic Corporation (semiconductor technologies), Navistar International Corporation (manufacture and sale of trucks, buses, and diesel engines, 2002-present), and Pitney Bowes, Inc. (integrated mail, messaging, and document management solutions). |
Marie L. Knowles (61) |
| Year of Election or Appointment: 2001 Prior to Ms. Knowles' retirement in June 2000, she served as Executive Vice President and Chief Financial Officer of Atlantic Richfield Company (ARCO) (diversified energy, 1996-2000). From 1993 to 1996, she was a Senior Vice President of ARCO and President of ARCO Transportation Company. She served as a Director of ARCO from 1996 to 1998. She currently serves as a Director of Phelps Dodge Corporation (copper mining and manufacturing) and McKesson Corporation (healthcare service, 2002-present). Ms. Knowles is a Trustee of the Brookings Institution and the Catalina Island Conservancy and also serves as a member of the Advisory Board for the School of Engineering of the University of Southern California. |
Ned C. Lautenbach (63) |
| Year of Election or Appointment: 2000 Mr. Lautenbach is Chairman of the Independent Trustees (2006-present). Mr. Lautenbach has been a partner of Clayton, Dubilier & Rice, Inc. (private equity investment firm) since September 1998. Previously, Mr. Lautenbach was with the International Business Machines Corporation (IBM) from 1968 until his retirement in 1998. Mr. Lautenbach serves as a Director of Sony Corporation (2006-present) and Eaton Corporation (diversified industrial) as well as the Philharmonic Center for the Arts in Naples, Florida. He also is a member of the Board of Trustees of Fairfield University (2005-present), as well as a member of the Council on Foreign Relations. |
Cornelia M. Small (63) |
| Year of Election or Appointment: 2005 Ms. Small is a member (2000-present) and Chairperson (2002-present) of the Investment Committee, and a member (2002-present) of the Board of Trustees of Smith College. Previously, she served as Chief Investment Officer (1999-2000), Director of Global Equity Investments (1996-1999), and a member of the Board of Directors of Scudder, Stevens & Clark (1990-1997) and Scudder Kemper Investments (1997-1999). In addition, Ms. Small served as Co-Chair (2000-2003) of the Annual Fund for the Fletcher School of Law and Diplomacy. |
William S. Stavropoulos (73) |
| Year of Election or Appointmen: 2001 Mr. Stavropoulos is Chairman Emeritus of the Board of Directors of The Dow Chemical Company. Since joining The Dow Chemical Company in 1967, Mr. Stavropoulos served in numerous senior management positions, including President (1993-2000; 2002-2003), CEO (1995-2000; 2002-2004), and Chairman of the Executive Committee (2000-2004). Currently, he is a Director of NCR Corporation (data warehousing and technology solutions), Chemical Financial Corporation, Maersk Inc. (industrial conglomerate, 2002-present), Tyco International, Inc. (multinational manufacturing and services, 2007-present), and a member of the Advisory Board for Metalmark Capital (private equity investment firm, 2005-present). He is a special advisor to Clayton, Dubilier & Rice, Inc., a private equity investment firm. He also serves as a member of the Board of Trustees of the American Enterprise Institute for Public Policy Research. In addition, Mr. Stavropoulos is a member of The Business Council, J.P. Morgan International Council and the University of Notre Dame Advisory Council for the College of Science. |
Kenneth L. Wolfe (68) |
| Year of Election or Appointment: 2005 Prior to his retirement in 2001, Mr. Wolfe was Chairman and Chief Executive Officer of Hershey Foods Corporation (1993-2001). He currently serves as a member of the boards of Adelphia Communications Corporation (2003-present), Bausch & Lomb, Inc., and Revlon Inc. (2004-present). |
Advisory Board Members and Executive Officers**:
Correspondence intended for Mr. Mauriello, Mr. Thomas, and Mr. Wiley may be sent to Fidelity Investments, P.O. Box 55235, Boston, Massachusetts 02205-5235. Correspondence intended for each executive officer and Mr. Lynch may be sent to Fidelity Investments, 82 Devonshire Street, Boston, Massachusetts 02109.
Name, Age; Principal Occupation |
Peter S. Lynch (63) |
| Year of Election or Appointment: 2003 Member of the Advisory Board of Fidelity Advisor Series VIII. Mr. Lynch is Vice Chairman and a Director of FMR, and Vice Chairman (2001-present) and a Director of FMR Co., Inc. Previously, Mr. Lynch served as a Trustee of the Fidelity funds (1990-2003). In addition, he serves as a Trustee of Boston College and as the Chairman of the Inner-City Scholarship Fund. |
Joseph Mauriello (63) |
| Year of Election or Appointment: 2007 Member of the Advisory Board of Fidelity Advisor Series VIII. Prior to his retirement in January 2006, Mr. Mauriello served in numerous senior management positions including Deputy Chairman and Chief Operating Officer (2004-2005), and Vice Chairman of Financial Services (2002-2004) of KPMG LLP US (professional services firm, 1965-2005). Mr. Mauriello currently serves as a member of the Board of Directors of XL Capital Ltd., (global insurance and re-insurance company, 2006-present) and of Arcadia Resources Inc., (health care services and products, 2007-present). He also served as a Director of the Hamilton Funds of the Bank of New York (2006-2007). |
David M. Thomas (58) |
| Year of Election of Appointment: 2007 Member of the Advisory Board of Fidelity Advisor Series VIII. Previously, Mr. Thomas served as Executive Chairman (2005-2006) and Chairman and Chief Executive Officer (2000-2005) of IMS Health, Inc. (pharmaceutical and healthcare information solutions). In addition, Mr. Thomas serves as a member of the Board of Directors of Fortune Brands, Inc. (consumer products holding company), and Interpublic Group of Companies, Inc. (marketing communication, 2004-present). |
Michael E. Wiley (57) |
| Year of Election or Appointment: 2007 Member of the Advisory Board of Fidelity Advisor Series VIII. Mr. Wiley also serves as Sr. Energy Advisor of Katzenbach Partners, LLC (consulting firm, 2006-present) and a member of the Board of Trustees of the University of Tulsa (2000-2006; 2007-present). He serves as a Director of Tesoro Corporation (independent oil refiner and marketer, 2005-present), and a Director of Bill Barrett Corporation (exploration and production company, 2005-present). In addition, he also serves as a Director of Post Oak Bank (privately-held bank, 2004-present), and an Advisory Director of Riverstone Holdings (private investment firm). Previously, Mr. Wiley served as Chairman, President, and CEO of Baker Hughes, Inc. (oilfield services company, 2000-2004), and as Director of Spinnaker Exploration Company (exploration and production company, 2001-2005). |
Name, Age; Principal Occupation |
Kimberley H. Monasterio (57) |
| Year of Election or Appointment: 2007 President and Treasurer of Advisor Latin America. Ms. Monasterio also serves as President and Treasurer of other Fidelity funds (2007-present) and is an employee of FMR (2004-present). Previously, Ms. Monasterio served as Deputy Treasurer of the Fidelity funds (2004-2006). Before joining Fidelity Investments, Ms. Monasterio served as Treasurer (2000-2004) and Chief Financial Officer (2002-2004) of the Franklin Templeton Funds and Senior Vice President of Franklin Templeton Services, LLC (2000-2004). |
Walter C. Donovan (45) |
| Year of Election or Appointment: 2007 Vice President of Advisor Latin America. Mr. Donovan also serves as Vice President of Fidelity's Equity Funds (2007-present). Mr. Donovan also serves as Executive Vice President of FMR (2005-present) and FMR Co., Inc. (2005-present). Previously, Mr. Donovan served as Vice President of Fidelity's High Income Funds (2005-2007), Fixed-Income Funds (2005-2006), certain Asset Allocation Funds (2005-2006), certain Balanced Funds (2005-2006), and as Vice President and Director of Fidelity's International Equity Trading group (1998-2005). |
Eric M. Wetlaufer (45) |
| Year of Election or Appointment: 2006 Vice President of Advisor Latin America. Mr. Wetlaufer also serves as Vice President of certain International Equity Funds (2006-present). Mr. Wetlaufer is Senior Vice President of FMR (2006-present) and FMR Co., Inc. (2006-present), and President and Director of Fidelity Management & Research (U.K.) Inc. (2006-present) and Fidelity Research & Analysis Company (2006-present). Before joining Fidelity Investments in 2005, Mr. Wetlaufer was a partner in Oxhead Capital Management (2004-2005). Previously, Mr. Wetlaufer served as a Chief Investment Officer of Putnam Investments (1997-2003). |
Eric D. Roiter (58) |
| Year of Election or Appointment: 1998 Secretary of Advisor Latin America. He also serves as Secretary of other Fidelity funds; Vice President, General Counsel, and Secretary of FMR Co., Inc. (2001-present) and FMR; Assistant Secretary of Fidelity Management & Research (U.K.) Inc. (2001-present), Fidelity Research & Analysis Company (2001-present), and Fidelity Investments Money Management, Inc. (2001-present). Mr. Roiter is an Adjunct Member, Faculty of Law, at Boston College Law School (2003-present). Previously, Mr. Roiter served as Vice President and Secretary of Fidelity Distributors Corporation (FDC) (1998-2005). |
Scott C. Goebel (39) |
| Year of Election or Appointment: 2007 Assistant Secretary of Advisor Latin America. Mr. Goebel also serves as Assistant Secretary of other Fidelity funds (2007-present), and is an employee of FMR. |
R. Stephen Ganis (41) |
| Year of Election or Appointment: 2006 Anti-Money Laundering (AML) officer of Advisor Latin America. Mr. Ganis also serves as AML officer of other Fidelity funds (2006-present) and FMR LLC (2003-present). Before joining Fidelity Investments, Mr. Ganis practiced law at Goodwin Procter, LLP (2000-2002). |
Joseph B. Hollis (59) |
| Year of Election or Appointment: 2006 Chief Financial Officer of Advisor Latin America. Mr. Hollis also serves as Chief Financial Officer of other Fidelity funds. Mr. Hollis is President of Fidelity Pricing and Cash Management Services (FPCMS) (2005-present). Mr. Hollis also serves as President and Director of Fidelity Service Company, Inc. (2006-present). Previously, Mr. Hollis served as Senior Vice President of Cash Management Services (1999-2002) and Investment Management Operations (2002-2005). |
Kenneth A. Rathgeber (60) |
| Year of Election or Appointment: 2004 Chief Compliance Officer of Advisor Latin America. Mr. Rathgeber also serves as Chief Compliance Officer of other Fidelity funds (2004-present) and Executive Vice President of Risk Oversight for Fidelity Investments (2002-present). He is Chief Compliance Officer of FMR (2005-present), FMR Co., Inc. (2005-present), Fidelity Management & Research (U.K.) Inc. (2005-present), Fidelity Research & Analysis Company (2005-present), Fidelity Investments Money Management, Inc. (2005-present), and Strategic Advisers, Inc. (2005-present). Previously, Mr. Rathgeber served as Executive Vice President and Chief Operating Officer for Fidelity Investments Institutional Services Company, Inc. (1998-2002). |
Bryan A. Mehrmann (46) |
| Year of Election or Appointment: 2005 Deputy Treasurer of Advisor Latin America. Mr. Mehrmann also serves as Deputy Treasurer of other Fidelity funds (2005-present) and is an employee of FMR. Previously, Mr. Mehrmann served as Vice President of Fidelity Investments Institutional Services Group (FIIS)/Fidelity Investments Institutional Operations Corporation, Inc. (FIIOC) Client Services (1998-2004). |
Kenneth B. Robins (38) |
| Year of Election or Appointment: 2005 Deputy Treasurer of Advisor Latin America. Mr. Robins also serves as Deputy Treasurer of other Fidelity funds (2005-present) and is an employee of FMR (2004-present). Before joining Fidelity Investments, Mr. Robins worked at KPMG LLP, where he was a partner in KPMG's department of professional practice (2002-2004) and a Senior Manager (1999-2000). In addition, Mr. Robins served as Assistant Chief Accountant, United States Securities and Exchange Commission (2000-2002). |
Robert G. Byrnes (40) |
| Year of Election or Appointment: 2005 Assistant Treasurer of Advisor Latin America. Mr. Byrnes also serves as Assistant Treasurer of other Fidelity funds (2005-present) and is an employee of FMR (2005-present). Previously, Mr. Byrnes served as Vice President of FPCMS (2003-2005). Before joining Fidelity Investments, Mr. Byrnes worked at Deutsche Asset Management where he served as Vice President of the Investment Operations Group (2000-2003). |
Peter L. Lydecker (53) |
| Year of Election or Appointment: 2004 Assistant Treasurer of Advisor Latin America. Mr. Lydecker also serves as Assistant Treasurer of other Fidelity funds (2004) and is an employee of FMR. |
Paul M. Murphy (60) |
| Year of Election or Appointment: 2007 Assistant Treasurer of Advisor Latin America. Mr. Murphy also serves as Assistant Treasurer of other Fidelity funds (2007-present) and is an employee of FMR (2007-present). Previously, Mr. Murphy served as Chief Financial Officer of the Fidelity Funds (2005-2006), Vice President and Associate General Counsel of FMR (2007), and Senior Vice President of Fidelity Pricing and Cash Management Services Group (FPCMS) (1994-2007). |
Gary W. Ryan (49) |
| Year of Election or Appointment: 2005 Assistant Treasurer of Advisor Latin America. Mr. Ryan also serves as Assistant Treasurer of other Fidelity funds (2005-present) and is an employee of FMR (2005-present). Previously, Mr. Ryan served as Vice President of Fund Reporting in FPCMS (1999-2005). |
** FMR Corp. merged with FMR LLC on October 1, 2007. Any references to FMR LLC for prior periods are deemed to be references to the prior entity.
Annual Report
Distributions
The Board of Trustees of Advisor Latin America voted to pay to shareholders of record at the opening of business on record date, the following distributions per share derived from capital gains realized from sales of portfolio securities, and dividends derived from net investment income:
| Pay Date | Record Date | Dividends | Capital Gains |
Class A | 12/10/07 | 12/07/07 | $0.390 | $0.950 |
Class T | 12/10/07 | 12/07/07 | $0.240 | $0.950 |
Class B | 12/10/07 | 12/07/07 | $0.000 | $0.950 |
Class C | 12/10/07 | 12/07/07 | $0.031 | $0.950 |
The fund hereby designates as a capital gain dividend with respect to the taxable year ended October 31, 2007, $5,586,468, or, if subsequently determined to be different, the net capital gain of such year.
Class A, Class T, Class B, and Class C designate 100% of the dividends distributed during the fiscal year as amounts which may be taken into account as a dividend for purposes of the maximum rate under section 1(h)(11) of the Internal Revenue Code.
The amounts per share which represent income derived from sources within, and taxes paid to, foreign countries or possessions of the United States are as follows:
| Pay Date | Income | Taxes |
Class A | 12/04/06 | $0.478 | $0.0591 |
Class T | 12/04/06 | $0.398 | $0.0591 |
Class B | 12/04/06 | $0.263 | $0.0591 |
Class C | 12/04/06 | $0.273 | $0.0591 |
The fund will notify shareholders in January 2008 of amounts for use in preparing 2007 income tax returns.
Annual Report
Board Approval of Investment Advisory Contracts and Management Fees
Advisor Latin America Fund
Each year, typically in July, the Board of Trustees, including the Independent Trustees (together, the Board), votes on the renewal of the management contract and sub-advisory agreements (together, the Advisory Contracts) for the fund. The Board, assisted by the advice of fund counsel and Independent Trustees' counsel, requests and considers a broad range of information throughout the year.
The Board meets regularly each month except August and takes into account throughout the year matters bearing on Advisory Contracts. The Board, acting directly and through its separate committees, considers at each of its meetings factors that are relevant to the annual renewal of the fund's Advisory Contracts, including the services and support provided to the fund and its shareholders. At the time of the renewal, the Board had 12 standing committees, each composed of Independent Trustees with varying backgrounds, to which the Board has assigned specific subject matter responsibilities in order to enhance effective decision-making by the Board. Each committee has adopted a written charter outlining the structure and purposes of the committee. One such committee, the Equity Contract Committee, meets periodically as needed throughout the year to consider matters specifically related to the annual renewal of Advisory Contracts. The committee requests and receives information on, and makes recommendations to the Independent Trustees concerning, the approval and annual review of the Advisory Contracts.
At its July 2007 meeting, the Board of Trustees, including the Independent Trustees, unanimously determined to renew the Advisory Contracts for the fund. In reaching its determination, the Board considered all factors it believed relevant, including (i) the nature, extent, and quality of the services to be provided to the fund and its shareholders (including the investment performance of the fund); (ii) the competitiveness of the management fee and total expenses of the fund; (iii) the total costs of the services to be provided by and the profits to be realized by the investment adviser and its affiliates from the relationship with the fund; (iv) the extent to which economies of scale would be realized as the fund grows; and (v) whether fee levels reflect these economies of scale, if any, for the benefit of fund shareholders. The Board also approved amendments to the fund's agreements with foreign sub-advisers to clarify that each sub-adviser provides services as an independent contractor.
In determining whether to renew the Advisory Contracts for the fund, the Board ultimately reached a determination, with the assistance of fund counsel and Independent Trustees' counsel, that the renewal of the Advisory Contracts and the compensation to be received by Fidelity under the management contract is consistent with Fidelity's fiduciary duty under applicable law. In addition to evaluating the specific factors noted above, the Board, in reaching its determination, is aware that shareholders in the fund have a broad range of investment choices available to them, including a wide choice among mutual funds offered by competitors to Fidelity, and that the fund's shareholders, with the opportunity to review and weigh the disclosure provided by the fund in its prospectus and other public disclosures, have chosen to invest in this fund, managed by Fidelity.
Annual Report
Nature, Extent, and Quality of Services Provided. The Board considered staffing within the investment adviser, FMR, and the sub-advisers (together, the Investment Advisers), including the backgrounds of the fund's portfolio managers and the fund's investment objective and discipline. The Independent Trustees also had discussions with senior management of Fidelity's investment operations and investment groups. The Board considered the structure of the portfolio manager compensation program and whether this structure provides appropriate incentives.
Resources Dedicated to Investment Management and Support Services. The Board reviewed the size, education, and experience of the Investment Advisers' investment staff, their use of technology, and the Investment Advisers' approach to recruiting, training, and retaining portfolio managers and other research, advisory, and management personnel. The Board considered Fidelity's extensive global research capabilities that enable the Investment Advisers to aggregate data from various sources in an effort to produce positive investment results. The Board noted that Fidelity's analysts have access to a variety of technological tools that enable them to perform both fundamental and quantitative analysis and to specialize in various disciplines. The Board also considered that Fidelity's portfolio managers and analysts have access to daily portfolio attribution that allows for monitoring of a fund's portfolio, as well as an electronic communication system that provides immediate real-time access to research concerning issuers and credit enhancers.
Shareholder and Administrative Services. The Board considered (i) the nature, extent, quality, and cost of advisory, administrative, distribution, and shareholder services performed by the Investment Advisers and their affiliates under the Advisory Contracts and under separate agreements covering transfer agency, pricing and bookkeeping, and securities lending services for the fund; (ii) the nature and extent of the Investment Advisers' supervision of third party service providers, principally custodians and subcustodians; and (iii) the resources devoted to, and the record of compliance with, the fund's compliance policies and procedures. The Board reviewed the allocation of fund brokerage, including allocations to brokers affiliated with the Investment Advisers, the use of brokerage commissions to pay fund expenses, and the use of "soft" commission dollars to pay for research services. The Board also considered that Fidelity voluntarily pays for market data out of its own resources. The Board also considered the agreement reached between the Independent Trustees and Fidelity in December 2006 following an independent review of matters relating to receipt of travel, entertainment, gifts and gratuities in violation of Fidelity policies.
Annual Report
Board Approval of Investment Advisory Contracts and
Management Fees - continued
The Board noted that the growth of fund assets across the complex allows Fidelity to reinvest in the development of services designed to enhance the value or convenience of the Fidelity funds as investment vehicles. These services include 24-hour access to account information and market information through phone representatives and over the Internet, and investor education materials and asset allocation tools.
Investment in a Large Fund Family. The Board considered the benefits to shareholders of investing in a Fidelity fund, including the benefits of investing in a fund that is part of a large family of funds offering a variety of investment disciplines and providing for a large variety of mutual fund investor services. For example, fund shareholders are offered the privilege of exchanging shares of the fund for shares of other Fidelity funds, as set forth in the fund's prospectus, without paying a sales charge. The Board noted that, since the last Advisory Contract renewals in July 2006, Fidelity has taken a number of actions that benefited particular funds, including (i) dedicating additional resources to investment research and to restructure the investment research teams; (ii) contractually agreeing to reduce the management fee on Fidelity Advisor Floating Rate High Income Fund; (iii) contractually agreeing to reduce the management fees on Fidelity's California, Massachusetts, New Jersey, and New York AMT Tax-Free Money Market Funds, launching new Institutional Classes and Service Classes of these funds, and contractually agreeing to impose expense limitations on these funds; (iv) eliminating the exchange fee on the Fidelity Select Portfolios and reducing the pricing and bookkeeping fee rates for these funds; (v) reducing the maximum transfer agency fee rates on high income funds and certain equity funds; (vi) proposing amended management contracts that, if approved by shareholders, will add a performance adjustment component to the management fees paid by 18 Fidelity Advisor equity funds; (vii) contractually agreeing to reduce fees for Ultra-Short Central Fund and the money market Central Funds; (viii) waiving the Fidelity Advisor funds' contingent deferred sales charge on certain redemptions made through systematic withdrawal programs; and (ix) amending the management contracts for equity and fixed-income funds whose management contracts incorporate a "group fee" structure by adding four new fee "breakpoints" to the group fee rate schedules.
Investment Performance and Compliance. The Board considered whether the fund has operated within its investment objective, as well as its record of compliance with its investment restrictions. It also reviewed the fund's absolute investment performance for each class, as well as the fund's relative investment performance for each class measured against a broad-based securities market index over multiple periods. The Board noted that FMR does not believe that a meaningful peer group exists against which to compare the fund's performance. The following charts considered by the Board show, over the one-, three-, and five-year periods ended December 31, 2006, the cumulative total returns of Institutional Class (Class I) and Class B of the fund and the cumulative total returns of a broad-based securities market index ("benchmark"). The returns of Institutional Class (Class I) and Class B show the performance of the highest and lowest performing classes, respectively (based on three-year performance).
Annual Report
Advisor Latin America Fund
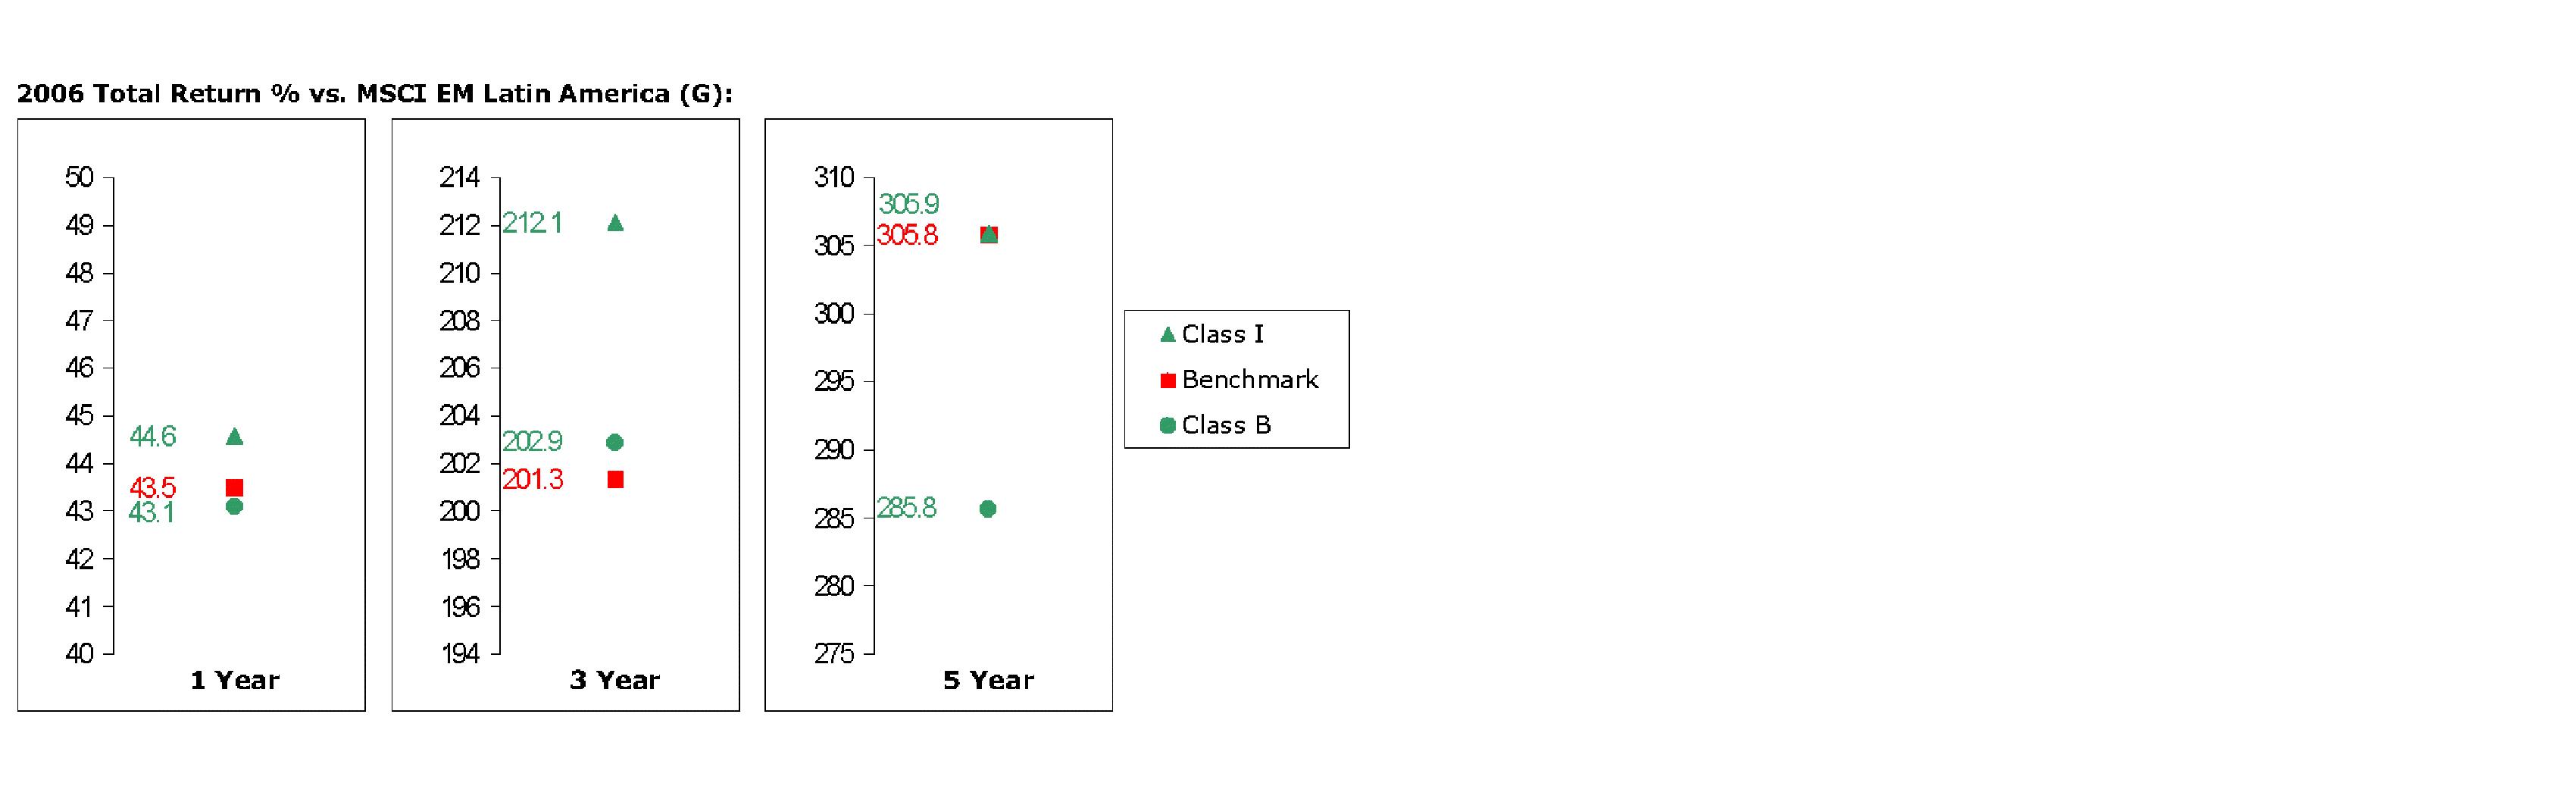
The Board stated that the relative investment performance of Institutional Class (Class I) of the fund compared favorably to its benchmark for all the periods shown. The Board considered that the variations in performance among the fund's classes reflect the variations in class expenses, which result in lower performance for higher expense classes.
The Board considered that FMR has taken steps to refocus and strengthen equity research, equity portfolio management, and compliance.
Based on its review, and giving particular weight to the nature and quality of the resources dedicated by the Investment Advisers to maintain and improve relative performance, the Board concluded that the nature, extent, and quality of the services provided to the fund will benefit the fund's shareholders, particularly in light of the Board's view that the fund's shareholders benefit from investing in a fund that is part of a large family of funds offering a variety of investment disciplines and services.
Competitiveness of Management Fee and Total Fund Expenses. The Board considered the fund's management fee and total expenses compared to "mapped groups" of competitive funds and classes. Fidelity creates "mapped groups" by combining similar Lipper investment objective categories that have comparable management fee characteristics. Combining Lipper investment objective categories aids the Board's management fee and total expense comparisons by broadening the competitive group used for comparison and by reducing the number of universes to which various Fidelity funds are compared. The Board also considered supplemental information about how the fund's management fee and total expenses ranked relative to groups based on Lipper classifications, which take into account a fund's market capitalization and style.
Annual Report
Board Approval of Investment Advisory Contracts and
Management Fees - continued
The Board considered two proprietary management fee comparisons for the 12-month periods shown in the chart below. The group of Lipper funds used by the Board for management fee comparisons is referred to below as the "Total Mapped Group." The Total Mapped Group comparison focuses on a fund's standing relative to the total universe of comparable funds available to investors, in terms of gross management fees before expense reimbursements or caps. "TMG %" represents the percentage of funds in the Total Mapped Group that had management fees that were lower than the fund's. For example, a TMG % of 9% means that 91% of the funds in the Total Mapped Group had higher management fees than the fund. The "Asset-Size Peer Group" (ASPG) comparison focuses on a fund's standing relative to non-Fidelity funds similar in size to the fund within the Total Mapped Group. The ASPG represents at least 15% of the funds in the Total Mapped Group with comparable asset size and management fee characteristics, subject to a minimum of 50 funds (or all funds in the Total Mapped Group if fewer than 50). Additional information, such as the ASPG quartile in which the fund's management fee ranked, is also included in the chart and considered by the Board.
Advisor Latin America Fund

The Board noted that the fund's management fee ranked below the median of its Total Mapped Group and below the median of its ASPG for 2006.
Annual Report
Based on its review, the Board concluded that the fund's management fee was fair and reasonable in light of the services that the fund receives and the other factors considered.
In its review of each class's total expenses, the Board considered the fund's management fee as well as other fund or class expenses, as applicable, such as transfer agent fees, pricing and bookkeeping fees, fund-paid 12b-1 fees, and custodial, legal, and audit fees. The Board also noted the effects of any waivers and reimbursements on fees and expenses. As part of its review, the Board also considered current and historical total expenses of each class of the fund compared to competitive fund median expenses. Each class of the fund is compared to those funds and classes in the Total Mapped Group (used by the Board for management fee comparisons) that have a similar sales load structure.
The Board noted that the total expenses of each class ranked below its competitive median for 2006.
In its review of total expenses, the Board also considered Fidelity fee structures and other information on clients that FMR and its affiliates service in other competitive markets, such as other mutual funds advised or subadvised by FMR or its affiliates, pension plan clients, and other institutional clients.
Based on its review, the Board concluded that the total expenses of each class of the fund were reasonable in light of the services that the fund and its shareholders receive and the other factors considered.
Costs of the Services and Profitability. The Board considered the revenues earned and the expenses incurred by Fidelity in conducting the business of developing, marketing, distributing, managing, administering and servicing the fund and its shareholders. The Board also considered the level of Fidelity's profits in respect of all the Fidelity funds.
On an annual basis, FMR presents to the Board Fidelity's profitability for the fund. Fidelity calculates the profitability for each fund, as well as aggregate profitability for groups of Fidelity funds and all Fidelity funds, using a series of detailed revenue and cost allocation methodologies which originate with the audited books and records of Fidelity. The Audit Committee of the Board reviews any significant changes from the prior year's methodologies.
PricewaterhouseCoopers LLP (PwC), independent registered public accounting firm and auditor to Fidelity and certain Fidelity funds, has been engaged annually by the Board as part of the Board's assessment of the results of Fidelity's profitability analysis. PwC's engagement includes the review and assessment of Fidelity's methodologies used in determining the revenues and expenses attributable to Fidelity's mutual fund business, and completion of agreed-upon procedures surrounding the mathematical accuracy of fund profitability and its conformity to allocation methodologies. After considering PwC's reports issued under the engagement and information provided by Fidelity, the Board believes that while other allocation methods may also be reasonable, Fidelity's profitability methodologies are reasonable in all material respects.
Annual Report
Board Approval of Investment Advisory Contracts and
Management Fees - continued
The Board has also reviewed Fidelity's non-fund businesses and any fall-out benefits related to the mutual fund business as well as cases where Fidelity's affiliates may benefit from or be related to the fund's business.
The Board considered the costs of the services provided by and the profits realized by Fidelity in connection with the operation of the fund and determined that the amount of profit is a fair entrepreneurial profit for the management of the fund.
Economies of Scale. The Board considered whether there have been economies of scale in respect of the management of the Fidelity funds, whether the Fidelity funds (including the fund) have appropriately benefited from any such economies of scale, and whether there is potential for realization of any further economies of scale. The Board considered the extent to which the fund will benefit from economies of scale through increased services to the fund, through waivers or reimbursements, or through fee or expense reductions, including reductions that occur through operation of the transfer agent agreement. The transfer agent fee varies in part based on the number of accounts in the fund. If the number of accounts decreases or the average account size increases, the overall transfer agent fee rate decreases.
The Board recognized that the fund's management contract incorporates a "group fee" structure, which provides for lower group fee rates as total fund assets under FMR's management increase, and for higher group fee rates as total fund assets under FMR's management decrease. FMR determines the group fee rates based on a tiered asset "breakpoint" schedule. In connection with the renewal of the fund's management contract, the Board approved amendments to the fund's management contract that added four new fee breakpoints to the group fee rate schedule for assets under FMR's management above $1,386 billion. The Board considered that the group fee rate declines under both the present and amended schedules, but that under the amended schedule, the group fee rate declines faster as assets under FMR's management exceed $1,386 billion. The Board considered that the group fee is designed to deliver the benefits of economies of scale to fund shareholders when total fund assets increase, even if assets of any particular fund are unchanged or have declined, because some portion of Fidelity's costs are attributable to services provided to all Fidelity funds, and all funds benefit if those costs can be allocated among more assets. The Board concluded that, given the group fee structure, fund shareholders will achieve a certain level of economies of scale as assets under FMR's management increase at the fund complex level, regardless of whether Fidelity achieves any such economies of scale.
The Board further concluded that any potential economies of scale are being shared between fund shareholders and Fidelity in an appropriate manner.
Annual Report
Additional Information Requested by the Board. In order to develop fully the factual basis for consideration of the Fidelity funds' Advisory Contracts, the Board requested and received additional information on several topics, including (i) fund performance trends and actions to be taken by FMR to improve certain funds' overall performance; (ii) Fidelity's portfolio manager compensation structure, including its effects on fund profitability and the extent to which portfolio manager compensation is linked to fund performance; (iii) Fidelity's fee structures; (iv) the funds' sub-advisory arrangements; and (v) accounts managed by Fidelity other than the Fidelity funds.
Based on its evaluation of all of the conclusions noted above, and after considering all material factors, the Board ultimately concluded that the advisory fee structures are fair and reasonable, and that the fund's Advisory Contracts should be renewed.
Annual Report
Investment Adviser
Fidelity Management & Research Company
Boston, MA
Investment Sub-Advisers
FMR Co., Inc.
Fidelity Management & Research
(U.K.) Inc.
Fidelity Research & Analysis Company
Fidelity International
Investment Advisors
Fidelity Investments Japan Limited
Fidelity International Investment Advisors (U.K.) Limited
General Distributor
Fidelity Distributors Corporation
Boston, MA
Transfer and Service Agents
Fidelity Investments Institutional Operations Company, Inc.
Boston, MA
Fidelity Service Company, Inc.
Boston, MA
Custodian
State Street Bank and Trust Company
Quincy, MA
ALAF-UANN-1207
1.784760.104
(Fidelity Investment logo)(registered trademark)
(Fidelity Investment logo)(registered trademark)
Fidelity® Advisor
Latin America
Fund - Institutional Class
Annual Report
October 31, 2007
(2_fidelity_logos) (Registered_Trademark)
Contents
Chairman's Message | <Click Here> | Ned Johnson's message to shareholders. |
Performance | <Click Here> | How the fund has done over time. |
Management's Discussion | 6 | The manager's review of fund performance, strategy and outlook. |
Shareholder Expense Example | <Click Here> | An example of shareholder expenses. |
Investment Changes | <Click Here> | A summary of major shifts in the fund's investments over the past six months. |
Investments | <Click Here> | A complete list of the fund's investments with their market values. |
Financial Statements | <Click Here> | Statements of assets and liabilities, operations, and changes in net assets,
as well as financial highlights. |
Notes | <Click Here> | Notes to the financial statements. |
Report of Independent Registered Public Accounting Firm | <Click Here> | |
Trustees and Officers | <Click Here> | |
Distributions | <Click Here> | |
Board Approval of Investment Advisory Contracts and Management Fees | <Click Here> | |
To view a fund's proxy voting guidelines and proxy voting record for the 12-month period ended June 30, visit http://www.fidelity.com (search for "proxy voting guidelines") or visit the Securities and Exchange Commission's (SEC) web site at http://www.sec.gov. You may also call 1-877-208-0098 to request a free copy of the proxy voting guidelines.
Standard & Poor's, S&P and S&P 500 are registered service marks of The McGraw-Hill Companies, Inc. and have been licensed for use by Fidelity Distributors Corporation.
Other third party marks appearing herein are the property of their respective owners.
All other marks appearing herein are registered or unregistered trademarks or service marks of FMR LLC or an affiliated company.
Annual Report
This report and the financial statements contained herein are submitted for the general information of the shareholders of the fund. This report is not authorized for distribution to prospective investors in the fund unless preceded or accompanied by an effective prospectus.
A fund files its complete schedule of portfolio holdings with the SEC for the first and third quarters of each fiscal year on Form N-Q. Forms N-Q are available on the SEC's web site at http://www.sec.gov. A fund's Forms N-Q may be reviewed and copied at the SEC's Public Reference Room in Washington, DC. Information regarding the operation of the SEC's Public Reference Room may be obtained by calling 1-800-SEC-0330. For a complete list of a fund's portfolio holdings, view the most recent holdings listing, semiannual report, or annual report on Fidelity's web site at http://www.fidelity.com or http://www.advisor.fidelity.com, as applicable.
NOT FDIC INSURED · MAY LOSE VALUE · NO BANK GUARANTEE
Neither the fund nor Fidelity Distributors Corporation is a bank.
Annual Report
Chairman's Message
(photo_of_Edward_C_Johnson_3d)
Dear Shareholder:
Many stock and bond markets around the world have been unsettled of late; however, volatility can often lead to opportunity for patient investors. Financial markets are always unpredictable, but there are a number of time-tested principles that can put the historical odds in your favor.
One of the basic tenets is to invest for the long term. Over time, riding out the markets' inevitable ups and downs has proven much more effective than selling into panic or chasing the hottest trend. Even missing only a few of the markets' best days can significantly diminish investor returns. Patience also affords the benefits of compounding - of earning interest on additional income or reinvested dividends and capital gains. There are tax advantages and cost benefits to consider as well. The more you sell, the more taxes you pay, and the more you trade, the higher the costs. While staying the course doesn't eliminate risk, it can considerably lessen the effect of short-term declines.
You can further manage your investing risk through diversification. And today, more than ever, geographic diversification should be taken into account. Studies indicate that asset allocation is the single most important determinant of a portfolio's long-term success. The right mix of stocks, bonds and cash - aligned to your particular risk tolerance and investment objective - is very important. Age-appropriate rebalancing is also an essential aspect of asset allocation. For younger investors, an emphasis on equities - which historically have been the best-performing asset class over time - is encouraged. As investors near their specific goal, such as retirement or sending a child to college, consideration may be given to replacing volatile assets (e.g. common stocks) with more-stable fixed investments (bonds or savings plans).
A third investment principle - investing regularly - can help lower the average cost of your purchases. Investing a certain amount of money each month or quarter helps ensure you won't pay for all your shares at market highs. This strategy - known as dollar cost averaging - also reduces unconstructive "emotion" from investing, helping shareholders avoid selling weak performers just prior to an upswing, or chasing a hot performer just before a correction.
We invite you to contact us via the Internet, through our Investor Centers or over the phone. It is our privilege to provide you the information you need to make the investments that are right for you.
Sincerely,
/s/Edward C. Johnson 3d
Edward C. Johnson 3d
Annual Report
Performance: The Bottom Line
Average annual total return reflects the change in the value of an investment, assuming reinvestment of the class' dividend income and capital gains (the profits earned upon the sale of securities that have grown in value) and assuming a constant rate of performance each year. The $10,000 table and the fund's returns do not reflect the deduction of taxes that a shareholder would pay on fund distributions or the redemption of fund shares. During periods of reimbursement by Fidelity, a fund's total return will be greater than it would be had the reimbursement not occurred. How a fund did yesterday is no guarantee of how it will do tomorrow.
Average Annual Total Returns
Periods ended October 31, 2007 | Past 1
year | Past 5
years | Life of
fund A |
Institutional Class | 68.51% | 52.50% | 24.60% |
A From December 21, 1998.
$10,000 Over Life of Fund
Let's say hypothetically that $10,000 was invested in Fidelity® Advisor Latin America Fund - Institutional Class on December 21, 1998, when the fund started. The chart shows how the value of your investment would have changed, and also shows how the MSCI® Emerging Markets - Latin America Index performed over the same period.
Annual Report
Management's Discussion of Fund Performance
Comments from Brent Bottamini, Portfolio Manager of Fidelity® Advisor Latin America Fund
Emerging-markets equities continued their sparkling multiyear performance, returning 68.33% as measured by the Morgan Stanley Capital InternationalSM (MSCI®) Emerging Markets Index during the 12-month period ending October 31, 2007. On the whole, developing markets benefited from brisk economic growth, the ongoing build-out of commercial and industrial infrastructure, and rising commodity prices. China led the way with a superlative gain of roughly 168%, reflecting optimism about opportunities within the country's fast-growing economy. Hong Kong surged higher for similar reasons, jumping more than 147%. Brazil, the third-largest component of the MSCI benchmark, rose 111%, fueled largely by its exports of natural resources. However, three of the four largest country weightings in the index trailed its overall return despite very strong absolute performance. South Korea-the index's biggest constituent with a weighting of about 16% on average during the period-was a prime example. It gained almost 57% but still fell about 12 percentage points shy of the MSCI Emerging Markets index. Taiwan and Russia also trailed, despite solid returns of approximately 40% and 33%, respectively.
During the year, the fund's Institutional Class shares returned 68.51%, versus 78.51% for the MSCI Emerging Markets-Latin America Index. Performance relative to the index was held back by unfavorable security selection and an underweighting in materials, by weak stock selection and an overweighting in consumer discretionary stocks, and by a modest cash position. Good stock selection in telecommunication services helped, as did underweighting electric utilities. Geographically, weak stock selection in Brazil and Mexico hurt, but strong security selection in Chile and overweighting Brazil helped. Individual detractors included Brazilian airline TAM, Mexican homebuilder Corporacion Geo and underweighting materials stocks that performed well, including Brazil's Companhia Vale do Rio Doce (CVRD) and Grupo Mexico. Brazilian online retailer Submarino - which merged with Americanas.com to form B2W - Chilean iron ore and steel producer CAP and an underweighting in Mexican cement producer Cemex contributed.
Note to shareholders: Fidelity Advisor Latin America Fund may invest up to 35% of its total assets in any industry that represents more than 20% of the Latin American market. As of October 31, 2007, the fund did not have more than 25% of its total assets invested in any one industry.
The views expressed above reflect those of the portfolio manager(s) only through the end of the period as stated on the cover of this report and do not necessarily represent the views of Fidelity or any other person in the Fidelity organization. Any such views are subject to change at any time based upon market or other conditions and Fidelity disclaims any responsibility to update such views. These views may not be relied on as investment advice and, because investment decisions for a Fidelity fund are based on numerous factors, may not be relied on as an indication of trading intent on behalf of any Fidelity fund.
Annual Report
Shareholder Expense Example
As a shareholder of the Fund, you incur two types of costs: (1) transaction costs, including sales charges (loads) on purchase payments or redemption proceeds, redemption fees, and (2) ongoing costs, including management fees, distribution and/or service (12b-1) fees and other Fund expenses. This Example is intended to help you understand your ongoing costs (in dollars) of investing in the Fund and to compare these costs with the ongoing costs of investing in other mutual funds.
The Example is based on an investment of $1,000 invested at the beginning of the period and held for the entire period (May 1, 2007 to October 31, 2007).
Actual Expenses
The first line of the accompanying table for each class of the Fund provides information about actual account values and actual expenses. You may use the information in this line, together with the amount you invested, to estimate the expenses that you paid over the period. Simply divide your account value by $1,000.00 (for example, an $8,600 account value divided by $1,000.00 = 8.6), then multiply the result by the number in the first line for a class of the Fund under the heading entitled "Expenses Paid During Period" to estimate the expenses you paid on your account during this period. In addition, the Fund, as a shareholder in the underlying Fidelity Central Funds, will indirectly bear its pro rata share of the fees and expenses incurred by the underlying Fidelity Central Funds. These fees and expenses are not included in the Fund's annualized expense ratio used to calculate the expense estimate in the table below.
Hypothetical Example for Comparison Purposes
The second line of the accompanying table for each class of the Fund provides information about hypothetical account values and hypothetical expenses based on a Class' actual expense ratio and an assumed rate of return of 5% per year before expenses, which is not the Class' actual return. The hypothetical account values and expenses may not be used to estimate the actual ending account balance or expenses you paid for the period. You may use this information to compare the ongoing costs of investing in the Fund and other funds. To do so, compare this 5% hypothetical example with the 5% hypothetical examples that appear in the shareholder reports of the other funds. In addition, the Fund, as a shareholder in the underlying Fidelity Central Funds, will indirectly bear its pro rata share of the fees and expenses incurred by the underlying Fidelity Central Funds. These fees and expenses are not included in the Fund's annualized expense ratio used to calculate the expense estimate in the table below.
Annual Report
Shareholder Expense Example - continued
Please note that the expenses shown in the table are meant to highlight your ongoing costs only and do not reflect any transaction costs. Therefore, the second line of the table is useful in comparing ongoing costs only, and will not help you determine the relative total costs of owning different funds. In addition, if these transactional costs were included, your costs would have been higher.
| Beginning
Account Value
May 1, 2007 | Ending
Account Value
October 31, 2007 | Expenses Paid
During Period*
May 1, 2007
to October 31, 2007 |
Class A | | | |
Actual | $ 1,000.00 | $ 1,382.10 | $ 8.53 |
HypotheticalA | $ 1,000.00 | $ 1,018.05 | $ 7.22 |
Class T | | | |
Actual | $ 1,000.00 | $ 1,379.90 | $ 10.26 |
HypotheticalA | $ 1,000.00 | $ 1,016.59 | $ 8.69 |
Class B | | | |
Actual | $ 1,000.00 | $ 1,376.60 | $ 13.24 |
HypotheticalA | $ 1,000.00 | $ 1,014.06 | $ 11.22 |
Class C | | | |
Actual | $ 1,000.00 | $ 1,377.10 | $ 12.88 |
HypotheticalA | $ 1,000.00 | $ 1,014.37 | $ 10.92 |
Institutional Class | | | |
Actual | $ 1,000.00 | $ 1,384.60 | $ 6.55 |
HypotheticalA | $ 1,000.00 | $ 1,019.71 | $ 5.55 |
A 5% return per year before expenses
* Expenses are equal to each Class' annualized expense ratio (shown in the table below); multiplied by the average account value over the period, multiplied by 184/365 (to reflect the one-half year period).
| Annualized
Expense Ratio |
Class A | 1.42% |
Class T | 1.71% |
Class B | 2.21% |
Class C | 2.15% |
Institutional Class | 1.09% |
Annual Report
Investment Changes
Top Five Stocks as of October 31, 2007 |
| % of fund's
net assets | % of fund's net assets
6 months ago |
Petroleo Brasileiro SA Petrobras | 15.6 | 11.3 |
Companhia Vale do Rio Doce | 15.0 | 11.7 |
America Movil SAB de CV | 8.9 | 11.7 |
Banco Bradesco SA | 4.5 | 4.4 |
Uniao de Bancos Brasileiros SA (Unibanco) | 3.5 | 4.2 |
| 47.5 | |
Top Five Market Sectors as of October 31, 2007 |
| % of fund's
net assets | % of fund's net assets
6 months ago |
Materials | 26.4 | 24.0 |
Energy | 16.6 | 11.8 |
Financials | 16.2 | 15.1 |
Telecommunication Services | 13.0 | 15.4 |
Consumer Discretionary | 7.9 | 8.8 |
Top Five Countries as of October 31, 2007 |
(excluding cash equivalents) | % of fund's
net assets | % of fund's net assets
6 months ago |
Brazil | 64.6 | 58.1 |
Mexico | 21.4 | 29.1 |
Chile | 4.0 | 7.4 |
Bermuda | 1.7 | 0.5 |
United States of America | 1.1 | 0.6 |
Percentages are adjusted for the effect of open futures contracts, if applicable. |
Asset Allocation (% of fund's net assets) |
As of October 31, 2007 | As of April 30, 2007 |
| Stocks 96.1% | | | Stocks 97.7% | |
| Short-Term
Investments and
Net Other Assets 3.9% | | | Short-Term
Investments and
Net Other Assets 2.3% | |

Annual Report
Investments October 31, 2007
Showing Percentage of Net Assets
Common Stocks - 93.4% |
| Shares | | Value |
Argentina - 0.7% |
Banco Patagonia SA unit | 18,400 | | $ 446,679 |
Grupo Clarin SA GDR (a)(f) | 35,700 | | 714,000 |
Telecom Argentina SA Class B sponsored ADR (a) | 39,100 | | 938,791 |
TOTAL ARGENTINA | | 2,099,470 |
Bermuda - 1.7% |
Credicorp Ltd. (NY Shares) | 31,100 | | 2,311,663 |
Dufry South America Ltd. unit | 86,507 | | 2,525,558 |
Laep Investments Ltd. unit (a) | 57,184 | | 234,672 |
TOTAL BERMUDA | | 5,071,893 |
Brazil - 61.9% |
Acucar Guarani SA | 86,300 | | 504,302 |
AES Tiete SA (PN) (non-vtg.) | 25,036,300 | | 878,391 |
All America Latina Logistica SA unit | 156,400 | | 2,476,944 |
Amil Participacoes SA (a) | 48,700 | | 458,823 |
B2W Companhia Global Do Varejo | 48,600 | | 2,623,687 |
Banco ABC Brasil SA | 99,190 | | 888,645 |
Banco Bradesco SA: | | | |
(PN) | 96,756 | | 3,288,395 |
(PN) sponsored ADR | 286,500 | | 9,783,975 |
Banco Daycoval SA (PN) | 96,600 | | 1,139,032 |
Banco do Brasil SA | 79,100 | | 1,432,862 |
Banco do Estado do Rio Grande do Sul SA (a)(f) | 103,053 | | 699,886 |
Banco Indusval SA (f) | 25,160 | | 367,926 |
Banco Itau Holding Financeira SA sponsored ADR (non-vtg.) | 90,800 | | 2,592,340 |
Bovespa Holding SA (a) | 6,000 | | 114,271 |
Brasil Telecom Participacoes SA sponsored ADR | 42,340 | | 3,149,673 |
Companhia Brasileira (a)(f) | 778 | | 413,710 |
Companhia de Bebidas das Americas (AmBev): | | | |
(PN) sponsored ADR | 75,200 | | 6,144,592 |
sponsored ADR | 3,260 | | 260,800 |
Companhia de Saneamento de Minas Gerais | 66,800 | | 1,254,841 |
Companhia Providencia Industria e Comercio | 93,700 | | 720,311 |
Companhia Siderurgica Nacional SA (CSN) sponsored ADR (e) | 46,300 | | 3,699,370 |
Companhia Vale do Rio Doce: | | | |
(PN-A) sponsored ADR | 740,600 | | 23,380,742 |
sponsored ADR | 475,600 | | 17,920,608 |
Construtora Tenda SA | 105,700 | | 531,524 |
Duratex SA (PN) | 107,600 | | 3,600,349 |
Eletropaulo Metropolitana SA (PN-B) | 15,160,000 | | 1,169,794 |
Gafisa SA (a) | 39,600 | | 711,843 |
Common Stocks - continued |
| Shares | | Value |
Brazil - continued |
Gafisa SA ADR (a) | 16,300 | | $ 581,258 |
GVT Holding SA | 135,800 | | 2,982,718 |
Inpar SA | 45,600 | | 545,851 |
Localiza Rent a Car SA | 59,600 | | 705,857 |
MRV Engenharia e Participacoes SA | 50,100 | | 1,042,194 |
Multiplan Empreendimentos Imobiliarios SA | 77,400 | | 1,130,512 |
Net Servicos de Comunicacao SA: | | | |
sponsored ADR (a) | 7,500 | | 120,600 |
(PN) (a) | 160,900 | | 2,583,551 |
Petroleo Brasileiro SA - Petrobras: | | | |
(ON) | 8,500 | | 405,815 |
(PN) (non-vtg.) | 163,200 | | 6,805,896 |
(PN) sponsored ADR (non-vtg.) | 227,400 | | 18,917,406 |
sponsored ADR | 203,000 | | 19,412,890 |
Profarma Distribuidora de Produtos Farmaceuticos SA | 52,100 | | 1,008,815 |
Sao Carlos Empreen E Part SA (a) | 45,800 | | 549,304 |
Satipel Industrial SA | 54,000 | | 405,133 |
SEB - Sistema Educacional Brasileiro SA unit (a) | 14,900 | | 256,127 |
Sul America SA unit | 15,700 | | 283,763 |
TAM SA: | | | |
(PN) (ltd.-vtg.) | 48,500 | | 1,429,406 |
(PN) sponsored ADR (ltd. vtg.) | 18,500 | | 545,750 |
Tegma Gestao Logistica | 89,200 | | 1,531,264 |
Terna Participacoes SA unit | 71,000 | | 1,354,667 |
TIM Participacoes SA | 83,300 | | 388,069 |
TIM Participacoes SA sponsored ADR (non-vtg.) | 25,200 | | 1,169,280 |
Totvs SA | 57,700 | | 2,167,794 |
Tractebel Energia SA | 90,700 | | 1,266,581 |
Uniao de Bancos Brasileiros SA (Unibanco): | | | |
unit | 16,600 | | 262,706 |
GDR | 62,300 | | 9,845,892 |
Usinas Siderurgicas de Minas Gerais SA - Usiminas | 12,000 | | 1,007,109 |
Usinas Siderurgicas de Minas Gerais SA - Usiminas (PN-A) (non-vtg.) | 87,800 | | 6,886,066 |
Votorantim Celulose e Papel SA: | | | |
(PN) (non-vtg.) | 3,980 | | 125,236 |
sponsored ADR (non-vtg.) | 135,650 | | 4,252,628 |
TOTAL BRAZIL | | 180,177,774 |
Chile - 4.0% |
CAP SA | 148,189 | | 4,775,731 |
Inversiones Aguas Metropolitanas SA ADR (f) | 61,350 | | 1,518,965 |
Common Stocks - continued |
| Shares | | Value |
Chile - continued |
Lan Airlines SA sponsored ADR | 240,500 | | $ 4,001,920 |
Masisa SA | 3,017,104 | | 722,513 |
Vina Concha y Toro SA sponsored ADR | 9,085 | | 471,784 |
TOTAL CHILE | | 11,490,913 |
Colombia - 0.9% |
Almacenes Exito SA unit (f) | 137,300 | | 1,060,467 |
BanColombia SA sponsored ADR | 45,000 | | 1,653,750 |
TOTAL COLOMBIA | | 2,714,217 |
Luxembourg - 1.0% |
Tenaris SA sponsored ADR | 54,600 | | 2,937,480 |
Mexico - 21.4% |
Alsea SAB de CV | 990,400 | | 1,475,408 |
America Movil SAB de CV Series L sponsored ADR | 395,600 | | 25,868,279 |
Axtel SAB de CV unit (a) | 829,119 | | 2,100,059 |
Banco Compartamos SA de CV | 248,000 | | 1,279,574 |
Cemex SA de CV sponsored ADR (a) | 148,267 | | 4,547,349 |
Corporacion Geo SA de CV Series B (a) | 704,600 | | 2,597,683 |
Desarrolladora Homex Sab de CV (a) | 35,800 | | 338,293 |
Desarrolladora Homex Sab de CV sponsored ADR (a) | 12,700 | | 717,677 |
Empresas ICA Sociedad Controladora SA de CV (a) | 48,700 | | 342,094 |
Fomento Economico Mexicano SA de CV sponsored ADR | 145,563 | | 5,183,498 |
Grupo Aeroportuario del Pacifico SA de CV sponsored ADR | 37,600 | | 1,972,120 |
Grupo Aeroportuario Norte Sab de CV ADR | 14,253 | | 435,144 |
Grupo Mexico SA de CV Series B | 199,056 | | 1,811,332 |
Grupo Televisa SA de CV | 65,900 | | 328,703 |
Grupo Televisa SA de CV (CPO) sponsored ADR | 233,656 | | 5,806,352 |
Industrias Penoles SA de CV | 99,000 | | 2,349,669 |
Maxcom Telecomunicaciones SA de CV ADR (a) | 15,200 | | 263,872 |
Urbi, Desarrollos Urbanos, SA de CV (a) | 565,100 | | 2,183,575 |
Wal-Mart de Mexico SA de CV Series V | 631,869 | | 2,566,645 |
TOTAL MEXICO | | 62,167,326 |
Panama - 0.7% |
Copa Holdings SA Class A | 26,800 | | 1,013,308 |
Intergroup Financial Services Corp. | 41,129 | | 719,758 |
Intergroup Financial Services Corp. (f) | 11,123 | | 194,653 |
TOTAL PANAMA | | 1,927,719 |
Common Stocks - continued |
| Shares | | Value |
United States of America - 1.1% |
NII Holdings, Inc. (a) | 15,900 | | $ 922,200 |
Southern Copper Corp. | 15,261 | | 2,131,962 |
TOTAL UNITED STATES OF AMERICA | | 3,054,162 |
TOTAL COMMON STOCKS (Cost $147,392,303) | 271,640,954 |
Nonconvertible Preferred Stocks - 2.7% |
| | | |
Brazil - 2.7% |
Banco Itau Holding Financeira SA (PN) (non-vtg.) | 189,980 | | 5,391,606 |
Brasil Telecom Participacoes SA (PN) | 17,000 | | 254,003 |
Companhia Vale do Rio Doce (PN-A) | 74,400 | | 2,347,980 |
TOTAL NONCONVERTIBLE PREFERRED STOCKS (Cost $2,472,951) | 7,993,589 |
Convertible Bonds - 0.0% |
| Principal Amount (d) | | |
Brazil - 0.0% |
Companhia de Saneamento de Minas Gerais 2.3% 6/1/13(g)
(Cost $43,358) | BRL | 691 | | 51,922 |
Money Market Funds - 4.2% |
| Shares | | Value |
Fidelity Cash Central Fund, 4.97% (b) | 9,318,015 | | $ 9,318,015 |
Fidelity Securities Lending Cash Central Fund, 5.02% (b)(c) | 2,758,650 | | 2,758,650 |
TOTAL MONEY MARKET FUNDS (Cost $12,076,665) | 12,076,665 |
TOTAL INVESTMENT PORTFOLIO - 100.3% (Cost $161,985,277) | 291,763,130 |
NET OTHER ASSETS - (0.3)% | | (825,580) |
NET ASSETS - 100% | $ 290,937,550 |
Currency Abbreviation |
BRL | - | Brazilian real |
Legend |
(a) Non-income producing |
(b) Affiliated fund that is available only to investment companies and other accounts managed by Fidelity Investments. The rate quoted is the annualized seven-day yield of the fund at period end. A complete unaudited listing of the fund's holdings as of its most recent quarter end is available upon request. |
(c) Investment made with cash collateral received from securities on loan. |
(d) Principal amount is stated in United States dollars unless otherwise noted. |
(e) Security or a portion of the security is on loan at period end. |
(f) Security exempt from registration under Rule 144A of the Securities Act of 1933. These securities may be resold in transactions exempt from registration, normally to qualified institutional buyers. At the end of the period, the value of these securities amounted to $4,969,607 or 1.7% of net assets. |
(g) Restricted securities - Investment in securities not registered under the Securities Act of 1933 (excluding 144A issues). At the end of the period, the value of restricted securities (excluding 144A issues) amounted to $51,922 or 0.0% of net assets. |
Additional information on each holding is as follows: |
Security | Acquisition Date | Acquisition Cost |
Companhia de Saneamento de Minas Gerais 2.3% 6/1/13 | 8/20/07 | $ 43,358 |
Affiliated Central Funds |
Information regarding fiscal year to date income earned by the Fund from investments in Fidelity Central Funds is as follows: |
Fund | Income earned |
Fidelity Cash Central Fund | $ 256,945 |
Fidelity Securities Lending Cash Central Fund | 35,849 |
Total | $ 292,794 |
See accompanying notes which are an integral part of the financial statements.
Annual Report
Financial Statements
Statement of Assets and Liabilities
| October 31, 2007 |
| | |
Assets | | |
Investment in securities, at value (including securities loaned of $2,772,530) - See accompanying schedule: Unaffiliated issuers (cost $149,908,612) | $ 279,686,465 | |
Fidelity Central Funds (cost $12,076,665) | 12,076,665 | |
Total Investments (cost $161,985,277) | | $ 291,763,130 |
Cash | | 2,621 |
Receivable for investments sold | | 1,266,398 |
Receivable for fund shares sold | | 3,362,362 |
Dividends receivable | | 791,370 |
Interest receivable | | 2 |
Distributions receivable from Fidelity Central Funds | | 36,223 |
Prepaid expenses | | 49 |
Other receivables | | 16,073 |
Total assets | | 297,238,228 |
| | |
Liabilities | | |
Payable for investments purchased | $ 2,327,411 | |
Payable for fund shares redeemed | 806,160 | |
Accrued management fee | 158,304 | |
Distribution fees payable | 114,420 | |
Other affiliated payables | 64,589 | |
Other payables and accrued expenses | 71,144 | |
Collateral on securities loaned, at value | 2,758,650 | |
Total liabilities | | 6,300,678 |
| | |
Net Assets | | $ 290,937,550 |
Net Assets consist of: | | |
Paid in capital | | $ 156,383,577 |
Undistributed net investment income | | 787,106 |
Accumulated undistributed net realized gain (loss) on investments and foreign currency transactions | | 3,990,428 |
Net unrealized appreciation (depreciation) on investments and assets and liabilities in foreign currencies | | 129,776,439 |
Net Assets | | $ 290,937,550 |
See accompanying notes which are an integral part of the financial statements.
Annual Report
Financial Statements - continued
Statement of Assets and Liabilities - continued
| October 31, 2007 |
| | |
Calculation of Maximum Offering Price
Class A:
Net Asset Value and redemption price per share ($132,523,503 ÷ 2,151,418 shares) | | $ 61.60 |
| | |
Maximum offering price per share (100/94.25 of $61.60) | | $ 65.36 |
Class T:
Net Asset Value and redemption price per share ($46,959,819 ÷ 768,755 shares) | | $ 61.09 |
| | |
Maximum offering price per share (100/96.50 of $61.09) | | $ 63.31 |
Class B:
Net Asset Value and offering price per share ($32,142,595 ÷ 536,894 shares)A | | $ 59.87 |
| | |
Class C:
Net Asset Value and offering price per share ($60,414,909 ÷ 1,013,201 shares)A | | $ 59.63 |
| | |
Institutional Class:
Net Asset Value, offering price and redemption price per share ($18,896,724 ÷ 300,473 shares) | | $ 62.89 |
A Redemption price per share is equal to net asset value less any applicable contingent deferred sales charge.
See accompanying notes which are an integral part of the financial statements.
Annual Report
Statement of Operations
| Year ended October 31, 2007 |
| | |
Investment Income | | |
Dividends | | $ 4,685,211 |
Interest | | 2,553 |
Income from Fidelity Central Funds | | 292,794 |
| | 4,980,558 |
Less foreign taxes withheld | | (481,450) |
Total income | | 4,499,108 |
| | |
Expenses | | |
Management fee | $ 1,372,188 | |
Transfer agent fees | 556,109 | |
Distribution fees | 1,010,868 | |
Accounting and security lending fees | 103,601 | |
Custodian fees and expenses | 165,662 | |
Independent trustees' compensation | 619 | |
Registration fees | 75,873 | |
Audit | 50,662 | |
Legal | 2,922 | |
Miscellaneous | 924 | |
Total expenses before reductions | 3,339,428 | |
Expense reductions | (28,885) | 3,310,543 |
Net investment income (loss) | | 1,188,565 |
Realized and Unrealized Gain (Loss) Net realized gain (loss) on: | | |
Investment securities: | | |
Unaffiliated issuers | 5,125,397 | |
Foreign currency transactions | (96,532) | |
Total net realized gain (loss) | | 5,028,865 |
Change in net unrealized appreciation (depreciation) on: Investment securities | 95,316,910 | |
Assets and liabilities in foreign currencies | (2,833) | |
Total change in net unrealized appreciation (depreciation) | | 95,314,077 |
Net gain (loss) | | 100,342,942 |
Net increase (decrease) in net assets resulting from operations | | $ 101,531,507 |
See accompanying notes which are an integral part of the financial statements.
Annual Report
Financial Statements - continued
Statement of Changes in Net Assets
| Year ended
October 31,
2007 | Year ended
October 31,
2006 |
Increase (Decrease) in Net Assets | | |
Operations | | |
Net investment income (loss) | $ 1,188,565 | $ 1,379,135 |
Net realized gain (loss) | 5,028,865 | 2,245,672 |
Change in net unrealized appreciation (depreciation) | 95,314,077 | 21,269,289 |
Net increase (decrease) in net assets resulting
from operations | 101,531,507 | 24,894,096 |
Distributions to shareholders from net investment income | (1,338,713) | (538,516) |
Distributions to shareholders from net realized gain | (2,827,380) | (1,061,609) |
Total distributions | (4,166,093) | (1,600,125) |
Share transactions - net increase (decrease) | 60,112,145 | 63,902,874 |
Redemption fees | 149,278 | 173,927 |
Total increase (decrease) in net assets | 157,626,837 | 87,370,772 |
| | |
Net Assets | | |
Beginning of period | 133,310,713 | 45,939,941 |
End of period (including undistributed net investment income of $787,106 and undistributed net investment income of $1,189,745, respectively) | $ 290,937,550 | $ 133,310,713 |
See accompanying notes which are an integral part of the financial statements.
Annual Report
Financial Highlights - Class A
Years Ended October 31, | 2007 | 2006 | 2005 | 2004 | 2003 |
Selected Per-Share Data | | | | | |
Net asset value, beginning of period | $ 37.85 | $ 27.16 | $ 16.72 | $ 12.49 | $ 8.29 |
Income from Investment Operations | | | | | |
Net investment income (loss) C | .42 | .58 | .42 | .24 | .12 |
Net realized and unrealized gain (loss) | 24.52 | 10.94 | 10.14 | 4.09 | 4.17 |
Total from investment operations | 24.94 | 11.52 | 10.56 | 4.33 | 4.29 |
Distributions from net investment income | (.46) | (.34) | (.17) | (.11) | (.09) |
Distributions from net realized gain | (.77) | (.55) | - | - | - |
Total distributions | (1.23) | (.89) | (.17) | (.11) | (.09) |
Redemption fees added to paid in capital C | .04 | .06 | .05 | .01 | - |
Net asset value, end of period | $ 61.60 | $ 37.85 | $ 27.16 | $ 16.72 | $ 12.49 |
Total Return A,B | 67.94% | 43.54% | 63.94% | 34.98% | 52.29% |
Ratios to Average Net Assets D,F | | | | | |
Expenses before reductions | 1.45% | 1.62% | 1.93% | 3.07% | 5.92% |
Expenses net of fee waivers,
if any | 1.45% | 1.50% | 1.56% | 2.02% | 2.02% |
Expenses net of all reductions | 1.43% | 1.47% | 1.50% | 1.98% | 2.02% |
Net investment income (loss) | .88% | 1.70% | 1.88% | 1.63% | 1.22% |
Supplemental Data | | | | | |
Net assets, end of period (000 omitted) | $ 132,524 | $ 56,662 | $ 13,736 | $ 1,954 | $ 918 |
Portfolio turnover rate E | 49% | 50% | 42% | 71% | 67% |
A Total returns would have been lower had certain expenses not been reduced during the periods shown.
B Total returns do not include the effect of the sales charges.
C Calculated based on average shares outstanding during the period.
D Fees and expenses of the underlying Fidelity Central Funds are not included in the Fund's expense ratio. The Fund indirectly bears its proportionate share of the expenses of any underlying Fidelity Central Funds.
E Amount does not include the portfolio activity of any underlying Fidelity Central Funds.
F Expense ratios reflect operating expenses of the class. Expenses before reductions do not reflect amounts reimbursed by the investment adviser or reductions from brokerage service arrangements or other expense offset arrangements and do not represent the amount paid by the class during periods when reimbursements or reductions occur. Expenses net of fee waivers reflect expenses after reimbursement by the investment adviser but prior to reductions from brokerage service arrangements or other expense offset arrangements. Expenses net of all reductions represent the net expenses paid by the class.
See accompanying notes which are an integral part of the financial statements.
Annual Report
Financial Highlights - Class T
Years Ended October 31, | 2007 | 2006 | 2005 | 2004 | 2003 |
Selected Per-Share Data | | | | | |
Net asset value, beginning of period | $ 37.56 | $ 26.98 | $ 16.63 | $ 12.44 | $ 8.24 |
Income from Investment Operations | | | | | |
Net investment income (loss) C | .28 | .49 | .36 | .20 | .10 |
Net realized and unrealized gain (loss) | 24.35 | 10.86 | 10.09 | 4.07 | 4.16 |
Total from investment operations | 24.63 | 11.35 | 10.45 | 4.27 | 4.26 |
Distributions from net investment income | (.37) | (.28) | (.15) | (.09) | (.06) |
Distributions from net realized gain | (.77) | (.55) | - | - | - |
Total distributions | (1.14) | (.83) | (.15) | (.09) | (.06) |
Redemption fees added to paid in capital C | .04 | .06 | .05 | .01 | - |
Net asset value, end of period | $ 61.09 | $ 37.56 | $ 26.98 | $ 16.63 | $ 12.44 |
Total Return A,B | 67.50% | 43.11% | 63.57% | 34.59% | 52.06% |
Ratios to Average Net Assets D,F | | | | | |
Expenses before reductions | 1.72% | 1.89% | 2.26% | 3.47% | 6.58% |
Expenses net of fee waivers,
if any | 1.72% | 1.75% | 1.82% | 2.27% | 2.27% |
Expenses net of all reductions | 1.71% | 1.72% | 1.77% | 2.23% | 2.27% |
Net investment income (loss) | .61% | 1.45% | 1.61% | 1.38% | .97% |
Supplemental Data | | | | | |
Net assets, end of period (000 omitted) | $ 46,960 | $ 23,723 | $ 9,144 | $ 2,585 | $ 1,315 |
Portfolio turnover rate E | 49% | 50% | 42% | 71% | 67% |
A Total returns would have been lower had certain expenses not been reduced during the periods shown.
B Total returns do not include the effect of the sales charges.
C Calculated based on average shares outstanding during the period.
D Fees and expenses of the underlying Fidelity Central Funds are not included in the Fund's expense ratio. The Fund indirectly bears its proportionate share of the expenses of any underlying Fidelity Central Funds.
E Amount does not include the portfolio activity of any underlying Fidelity Central Funds.
F Expense ratios reflect operating expenses of the class. Expenses before reductions do not reflect amounts reimbursed by the investment adviser or reductions from brokerage service arrangements or other expense offset arrangements and do not represent the amount paid by the class during periods when reimbursements or reductions occur. Expenses net of fee waivers reflect expenses after reimbursement by the investment adviser but prior to reductions from brokerage service arrangements or other expense offset arrangements. Expenses net of all reductions represent the net expenses paid by the class.
See accompanying notes which are an integral part of the financial statements.
Annual Report
Financial Highlights - Class B
Years Ended October 31, | 2007 | 2006 | 2005 | 2004 | 2003 |
Selected Per-Share Data | | | | | |
Net asset value, beginning of period | $ 36.87 | $ 26.54 | $ 16.40 | $ 12.29 | $ 8.13 |
Income from Investment Operations | | | | | |
Net investment income (loss) C | .05 | .31 | .24 | .13 | .05 |
Net realized and unrealized gain (loss) | 23.91 | 10.68 | 9.95 | 4.02 | 4.12 |
Total from investment operations | 23.96 | 10.99 | 10.19 | 4.15 | 4.17 |
Distributions from net investment income | (.22) | (.17) | (.10) | (.05) | (.01) |
Distributions from net realized gain | (.77) | (.55) | - | - | - |
Total distributions | (.99) | (.72) | (.10) | (.05) | (.01) |
Redemption fees added to paid in capital C | .03 | .06 | .05 | .01 | - |
Net asset value, end of period | $ 59.87 | $ 36.87 | $ 26.54 | $ 16.40 | $ 12.29 |
Total Return A,B | 66.68% | 42.36% | 62.73% | 33.95% | 51.35% |
Ratios to Average Net Assets D,F | | | | | |
Expenses before reductions | 2.22% | 2.42% | 2.73% | 3.67% | 6.80% |
Expenses net of fee waivers,
if any | 2.22% | 2.25% | 2.34% | 2.77% | 2.77% |
Expenses net of all reductions | 2.20% | 2.22% | 2.28% | 2.73% | 2.77% |
Net investment income (loss) | .11% | .95% | 1.10% | .88% | .47% |
Supplemental Data | | | | | |
Net assets, end of period (000 omitted) | $ 32,143 | $ 17,402 | $ 8,998 | $ 3,222 | $ 1,513 |
Portfolio turnover rate E | 49% | 50% | 42% | 71% | 67% |
A Total returns would have been lower had certain expenses not been reduced during the periods shown.
B Total returns do not include the effect of the contingent deferred sales charge.
C Calculated based on average shares outstanding during the period.
D Fees and expenses of the underlying Fidelity Central Funds are not included in the Fund's expense ratio. The Fund indirectly bears its proportionate share of the expenses of any underlying Fidelity Central Funds.
E Amount does not include the portfolio activity of any underlying Fidelity Central Funds.
F Expense ratios reflect operating expenses of the class. Expenses before reductions do not reflect amounts reimbursed by the investment adviser or reductions from brokerage service arrangements or other expense offset arrangements and do not represent the amount paid by the class during periods when reimbursements or reductions occur. Expenses net of fee waivers reflect expenses after reimbursement by the investment adviser but prior to reductions from brokerage service arrangements or other expense offset arrangements. Expenses net of all reductions represent the net expenses paid by the class.
See accompanying notes which are an integral part of the financial statements.
Annual Report
Financial Highlights - Class C
Years Ended October 31, | 2007 | 2006 | 2005 | 2004 | 2003 |
Selected Per-Share Data | | | | | |
Net asset value, beginning of period | $ 36.74 | $ 26.48 | $ 16.35 | $ 12.25 | $ 8.11 |
Income from Investment Operations | | | | | |
Net investment income (loss) C | .07 | .31 | .24 | .13 | .05 |
Net realized and unrealized gain (loss) | 23.80 | 10.65 | 9.94 | 4.01 | 4.10 |
Total from investment operations | 23.87 | 10.96 | 10.18 | 4.14 | 4.15 |
Distributions from net investment income | (.24) | (.21) | (.10) | (.05) | (.01) |
Distributions from net realized gain | (.77) | (.55) | - | - | - |
Total distributions | (1.01) | (.76) | (.10) | (.05) | (.01) |
Redemption fees added to paid in capital C | .03 | .06 | .05 | .01 | - |
Net asset value, end of period | $ 59.63 | $ 36.74 | $ 26.48 | $ 16.35 | $ 12.25 |
Total Return A,B | 66.66% | 42.38% | 62.86% | 33.98% | 51.23% |
Ratios to Average Net Assets D,F | | | | | |
Expenses before reductions | 2.18% | 2.34% | 2.69% | 3.83% | 6.85% |
Expenses net of fee waivers,
if any | 2.18% | 2.25% | 2.32% | 2.77% | 2.77% |
Expenses net of all reductions | 2.17% | 2.22% | 2.26% | 2.73% | 2.77% |
Net investment income (loss) | .14% | .95% | 1.12% | .88% | .47% |
Supplemental Data | | | | | |
Net assets, end of period (000 omitted) | $ 60,415 | $ 29,189 | $ 9,252 | $ 2,167 | $ 1,114 |
Portfolio turnover rate E | 49% | 50% | 42% | 71% | 67% |
A Total returns would have been lower had certain expenses not been reduced during the periods shown.
B Total returns do not include the effect of the contingent deferred sales charge.
C Calculated based on average shares outstanding during the period.
D Fees and expenses of the underlying Fidelity Central Funds are not included in the Fund's expense ratio. The Fund indirectly bears its proportionate share of the expenses of any underlying Fidelity Central Funds.
E Amount does not include the portfolio activity of any underlying Fidelity Central Funds.
F Expense ratios reflect operating expenses of the class. Expenses before reductions do not reflect amounts reimbursed by the investment adviser or reductions from brokerage service arrangements or other expense offset arrangements and do not represent the amount paid by the class during periods when reimbursements or reductions occur. Expenses net of fee waivers reflect expenses after reimbursement by the investment adviser but prior to reductions from brokerage service arrangements or other expense offset arrangements. Expenses net of all reductions represent the net expenses paid by the class.
See accompanying notes which are an integral part of the financial statements.
Annual Report
Financial Highlights - Institutional Class
Years Ended October 31, | 2007 | 2006 | 2005 | 2004 | 2003 |
Selected Per-Share Data | | | | | |
Net asset value, beginning of period | $ 38.56 | $ 27.64 | $ 16.97 | $ 12.64 | $ 8.35 |
Income from Investment Operations | | | | | |
Net investment income (loss) B | .58 | .66 | .46 | .28 | .14 |
Net realized and unrealized gain (loss) | 25.01 | 11.13 | 10.33 | 4.15 | 4.24 |
Total from investment operations | 25.59 | 11.79 | 10.79 | 4.43 | 4.38 |
Distributions from net investment income | (.53) | (.38) | (.17) | (.11) | (.09) |
Distributions from net realized gain | (.77) | (.55) | - | - | - |
Total distributions | (1.30) | (.93) | (.17) | (.11) | (.09) |
Redemption fees added to paid in capital B | .04 | .06 | .05 | .01 | - |
Net asset value, end of period | $ 62.89 | $ 38.56 | $ 27.64 | $ 16.97 | $ 12.64 |
Total Return A | 68.51% | 43.79% | 64.36% | 35.36% | 52.99% |
Ratios to Average Net Assets C,E | | | | | |
Expenses before reductions | 1.12% | 1.26% | 1.59% | 2.14% | 5.40% |
Expenses net of fee waivers,
if any | 1.12% | 1.25% | 1.36% | 1.77% | 1.77% |
Expenses net of all reductions | 1.11% | 1.23% | 1.30% | 1.73% | 1.77% |
Net investment income (loss) | 1.21% | 1.94% | 2.08% | 1.88% | 1.47% |
Supplemental Data | | | | | |
Net assets, end of period (000 omitted) | $ 18,897 | $ 6,335 | $ 4,810 | $ 3,440 | $ 210 |
Portfolio turnover rate D | 49% | 50% | 42% | 71% | 67% |
A Total returns would have been lower had certain expenses not been reduced during the periods shown.
B Calculated based on average shares outstanding during the period.
C Fees and expenses of the underlying Fidelity Central Funds are not included in the Fund's expense ratio. The Fund indirectly bears its proportionate share of the expenses of any underlying Fidelity Central Funds.
D Amount does not include the portfolio activity of any underlying Fidelity Central Funds.
E Expense ratios reflect operating expenses of the class. Expenses before reductions do not reflect amounts reimbursed by the investment adviser or reductions from brokerage service arrangements or other expense offset arrangements and do not represent the amount paid by the class during periods when reimbursements or reductions occur. Expenses net of fee waivers reflect expenses after reimbursement by the investment adviser but prior to reductions from brokerage service arrangements or other expense offset arrangements. Expenses net of all reductions represent the net expenses paid by the class.
See accompanying notes which are an integral part of the financial statements.
Annual Report
Notes to Financial Statements
For the period ended October 31, 2007
1. Organization.
Fidelity Advisor Latin America Fund (the Fund) is a non-diversified fund of Fidelity Advisor Series VIII (the trust) and is authorized to issue an unlimited number of shares. The trust is registered under the Investment Company Act of 1940, as amended (the 1940 Act), as an open-end management investment company organized as a Massachusetts business trust.
The Fund offers Class A, Class T, Class B, Class C, and Institutional Class shares, each of which has equal rights as to assets and voting privileges. Each class has exclusive voting rights with respect to matters that affect that class. Class B shares will automatically convert to Class A shares after a holding period of seven years from the initial date of purchase. Investment income, realized and unrealized capital gains and losses, the common expenses of the Fund, and certain fund-level expense reductions, if any, are allocated on a pro rata basis to each class based on the relative net assets of each class to the total net assets of the Fund. Each class differs with respect to transfer agent and distribution and service plan fees incurred. Certain expense reductions also differ by class. The Fund's investments in emerging markets can be subject to social, economic, regulatory, and political uncertainties and can be extremely volatile.
2. Investments in Fidelity Central Funds.
The Fund may invest in Fidelity Central Funds, which are open-end investment companies available only to other investment companies and accounts managed by Fidelity Management & Research Company (FMR) and its affiliates. The Fund's Schedule of Investments lists each of the Fidelity Central Funds as an investment of the Fund, but does not include the underlying holdings of each Fidelity Central Fund. As an Investing Fund, the Fund indirectly bears its proportionate share of the expenses of the underlying Fidelity Central Funds.
The Money Market Central Funds seek preservation of capital and current income and are managed by Fidelity Investments Money Management, Inc. (FIMM), an affiliate of FMR.
A complete list of holdings for each Fidelity Central Fund is available upon request or at the SEC's web site at www.sec.gov. In addition, the financial statements of the Fidelity Central Funds, which are not covered by the Fund's Report of Independent Registered Public Accounting Firm, are available on the SEC's web site or upon request.
3. Significant Accounting Policies.
The financial statements have been prepared in conformity with accounting principles generally accepted in the United States of America, which require management to make certain estimates and assumptions at the date of the financial statements. The following summarizes the significant accounting policies of the Fund:
Annual Report
3. Significant Accounting Policies - continued
Security Valuation. Investments are valued and net asset value (NAV) per share is calculated (NAV calculation) as of the close of business of the New York Stock Exchange (NYSE), normally 4:00 p.m. Eastern time. Wherever possible, the Fund uses independent pricing services approved by the Board of Trustees to value its investments.
Equity securities, including restricted securities, for which market quotations are readily available, are valued at the last reported sale price or official closing price as reported by an independent pricing service on the primary market or exchange on which they are traded. In the event there were no sales during the day or closing prices are not available, securities are valued at the last quoted bid price. Debt securities, including restricted securities, for which quotations are readily available, are valued by independent pricing services or by dealers who make markets in such securities. Pricing services consider yield or price of bonds of comparable quality, coupon, maturity and type as well as available dealer supplied prices. Investments in open-end mutual funds, including the Fidelity Central Funds, are valued at their closing net asset value each business day. Short-term securities with remaining maturities of sixty days or less for which quotations are not readily available are valued at amortized cost, which approximates value.
When current market prices or quotations are not readily available or do not accurately reflect fair value, valuations may be determined in accordance with procedures adopted by the Board of Trustees. For example, when developments occur between the close of a market and the close of the NYSE that may materially affect the value of some or all of the securities, or when trading in a security is halted, those securities may be fair valued. Factors used in the determination of fair value may include monitoring news to identify significant market or security specific events such as changes in the value of U.S. securities markets, reviewing developments in foreign markets and evaluating the performance of ADRs, futures contracts and exchange-traded funds. Because the Fund's utilization of fair value pricing depends on market activity, the frequency with which fair value pricing is used cannot be predicted and may be utilized to a significant extent. The value of securities used for NAV calculation under fair value pricing may differ from published prices for the same securities.
Foreign Currency. The Fund uses foreign currency contracts to facilitate transactions in foreign-denominated securities. Losses from these transactions may arise from changes in the value of the foreign currency or if the counterparties do not perform under the contracts' terms.
Foreign-denominated assets, including investment securities, and liabilities are translated into U.S. dollars at the exchange rate at period end. Purchases and sales of investment securities, income and dividends received and expenses denominated in foreign currencies are translated into U.S. dollars at the exchange rate in effect on the transaction date.
Annual Report
Notes to Financial Statements - continued
3. Significant Accounting Policies - continued
Foreign Currency - continued
The effects of exchange rate fluctuations on investments are included with the net realized and unrealized gain (loss) on investment securities. Other foreign currency transactions resulting in realized and unrealized gain (loss) are disclosed separately.
Investment Transactions and Income. For financial reporting purposes, the Fund's investment holdings and NAV include trades executed through the end of the last business day of the period. The NAV for processing shareholder transactions includes trades executed through the end of the prior business day. Gains and losses on securities sold are determined on the basis of identified cost. Dividend income is recorded on the ex-dividend date, except for certain dividends from foreign securities where the ex-dividend date may have passed, which are recorded as soon as the Fund is informed of the ex-dividend date. Non-cash dividends included in dividend income, if any, are recorded at the fair market value of the securities received. Distributions received on securities that represent a return of capital or capital gain are recorded as a reduction of cost of investments and/or as a realized gain. The Fund estimates the components of distributions received that may be considered return of capital distributions or capital gain distributions. Interest income and distributions from the Fidelity Central Funds are accrued as earned. Interest income includes coupon interest and amortization of premium and accretion of discount on debt securities. Investment income is recorded net of foreign taxes withheld where recovery of such taxes is uncertain.
Expenses. Most expenses of the trust can be directly attributed to a fund. Expenses which cannot be directly attributed are apportioned among each Fund in the trust. Expense estimates are accrued in the period to which they relate and adjustments are made when actual amounts are known.
Income Tax Information and Distributions to Shareholders. Each year, the Fund intends to qualify as a regulated investment company by distributing all of its taxable income and realized gains under Subchapter M of the Internal Revenue Code. As a result, no provision for income taxes is required in the accompanying financial statements. Foreign taxes are provided for based on the Fund's understanding of the tax rules and rates that exist in the foreign markets in which it invests.
Distributions are recorded on the ex-dividend date. Income dividends and capital gain distributions are declared separately for each class. Income and capital gain distributions are determined in accordance with income tax regulations, which may differ from generally accepted accounting principles. In addition, the Fund will claim a portion of the payment made to redeeming shareholders as a distribution for income tax purposes.
Annual Report
3. Significant Accounting Policies - continued
Income Tax Information and Distributions to Shareholders - continued
Capital accounts within the financial statements are adjusted for permanent book-tax differences. These adjustments have no impact on net assets or the results of operations. Temporary book-tax differences will reverse in a subsequent period.
Book-tax differences are primarily due to foreign currency transactions, passive foreign investment companies (PFIC) and losses deferred due to wash sales.
The tax-basis components of distributable earnings and the federal tax cost as of period end were as follows:
Unrealized appreciation | $ 129,981,523 | |
Unrealized depreciation | (1,801,135) | |
Net unrealized appreciation (depreciation) | 128,180,388 | |
Undistributed ordinary income | 652,731 | |
Undistributed long-term capital gain | 4,632,711 | |
| | |
Cost for federal income tax purposes | $ 163,582,742 | |
The tax character of distributions paid was as follows:
| October 31, 2007 | October 31, 2006 |
Ordinary Income | $ 1,338,713 | $ 538,516 |
Long-term Capital Gains | 2,827,380 | 1,061,609 |
Total | $ 4,166,093 | $ 1,600,125 |
Short-Term Trading (Redemption) Fees. Shares held in the Fund less than 90 days are subject to a redemption fee equal to 1.50% of the proceeds of the redeemed shares. All redemption fees, including any estimated redemption fees paid by FMR, are retained by the Fund and accounted for as an addition to paid in capital.
New Accounting Pronouncements. In July 2006, Financial Accounting Standards Board Interpretation No. 48, Accounting for Uncertainty in Income Taxes - an interpretation of FASB Statement 109 (FIN 48), was issued and is effective on the last business day of the semiannual reporting period for fiscal years beginning after December 15, 2006. FIN 48 sets forth a threshold for financial statement recognition, measurement and disclosure of a tax position taken or expected to be taken on a tax return. Management has concluded that the adoption of FIN 48 will not result in a material impact on the Fund's net assets, results of operations and financial statement disclosures.
Annual Report
Notes to Financial Statements - continued
3. Significant Accounting Policies - continued
New Accounting Pronouncements - continued
In addition, in September 2006, Statement of Financial Accounting Standards No. 157, Fair Value Measurements (SFAS 157), was issued and is effective for fiscal years beginning after November 15, 2007. SFAS 157 defines fair value, establishes a framework for measuring fair value and expands disclosures about fair value measurements. Management is currently evaluating the impact the adoption of SFAS 157 will have on the Fund's financial statement disclosures.
4. Operating Policies.
Repurchase Agreements. FMR has received an Exemptive Order from the Securities and Exchange Commission (the SEC) which permits the Fund and other affiliated entities of FMR to transfer uninvested cash balances into joint trading accounts which are then invested in repurchase agreements. The Fund may also invest directly with institutions in repurchase agreements. Repurchase agreements are collateralized by government or non-government securities. Upon settlement date, collateral is held in segregated accounts with custodian banks and may be obtained in the event of a default of the counterparty. The Fund monitors, on a daily basis, the value of the collateral to ensure it is at least equal to the principal amount of the repurchase agreement (including accrued interest). In the event of a default by the counterparty, realization of the collateral proceeds could be delayed, during which time the value of the collateral may decline.
Restricted Securities. The Fund may invest in securities that are subject to legal or contractual restrictions on resale. These securities generally may be resold in transactions exempt from registration or to the public if the securities are registered. Disposal of these securities may involve time-consuming negotiations and expense, and prompt sale at an acceptable price may be difficult. Information regarding restricted securities is included at the end of the Fund's Schedule of Investments.
5. Purchases and Sales of Investments.
Purchases and sales of securities, other than short-term securities, aggregated $142,530,464 and $92,943,635, respectively.
6. Fees and Other Transactions with Affiliates.
Management Fee. FMR and its affiliates provide the Fund with investment management related services for which the Fund pays a monthly management fee. The management fee is the sum of an individual fund fee rate that is based on an annual rate of .45% of the Fund's average net assets and a group fee rate that averaged ..26% during the
Annual Report
6. Fees and Other Transactions with Affiliates - continued
Management Fee - continued
period. The group fee rate is based upon the average net assets of all the mutual funds advised by FMR. The group fee rate decreases as assets under management increase and increases as assets under management decrease. For the period, the total annual management fee rate was .71% of the Fund's average net assets.
Distribution and Service Plan. In accordance with Rule 12b-1 of the 1940 Act, the Fund has adopted separate Distribution and Service Plans for each class of shares. Certain classes pay Fidelity Distributors Corporation (FDC), an affiliate of FMR, separate Distribution and Service Fees, each of which is based on an annual percentage of each class' average net assets. In addition, FDC may pay financial intermediaries for selling shares of the Fund and providing shareholder support services. For the period, the Distribution and Service Fee rates and the total amounts paid to and retained by FDC were as follows:
| Distribution
Fee | Service
Fee | Paid to
FDC | Retained
by FDC |
Class A | 0% | .25% | $ 214,911 | $ 9,272 |
Class T | .25% | .25% | 167,184 | 132 |
Class B | .75% | .25% | 225,745 | 169,401 |
Class C | .75% | .25% | 403,028 | 164,683 |
| | | $ 1,010,868 | $ 343,488 |
Sales Load. FDC receives a front-end sales charge of up to 5.75% for selling Class A shares, and 3.50% for selling Class T shares, some of which is paid to financial intermediaries for selling shares of the Fund. FDC receives the proceeds of contingent deferred sales charges levied on Class A, Class T, Class B, and Class C redemptions. These charges depend on the holding period. The deferred sales charges range from 5% to 1% for Class B, 1% for Class C, 1.00% to .50% for certain purchases of Class A shares and .25% for certain purchases of Class T shares.
For the period, sales charge amounts retained by FDC were as follows:
| Retained
by FDC |
Class A | $ 215,507 |
Class T | 23,115 |
Class B* | 48,375 |
Class C* | 28,265 |
| $ 315,262 |
* When Class B and Class C shares are initially sold, FDC pays commissions from its own resources to financial intermediaries through which the sales are made.
Annual Report
Notes to Financial Statements - continued
6. Fees and Other Transactions with Affiliates - continued
Transfer Agent Fees. Fidelity Investments Institutional Operations Company, Inc. (FIIOC), an affiliate of FMR, is the transfer, dividend disbursing and shareholder servicing agent for each class of the Fund. FIIOC receives account fees and asset-based fees that vary according to the account size and type of account of the shareholders of the respective classes of the Fund. FIIOC pays for typesetting, printing and mailing of shareholder reports, except proxy statements. For the period, the total transfer agent fees paid by each class to FIIOC, were as follows:
| Amount | % of
Average
Net Assets |
Class A | $ 246,422 | .29 |
Class T | 104,475 | .31 |
Class B | 69,557 | .31 |
Class C | 112,282 | .28 |
Institutional Class | 23,373 | .21 |
| $ 556,109 | |
Accounting and Security Lending Fees. Fidelity Service Company, Inc. (FSC), an affiliate of FMR, maintains the Fund's accounting records. The accounting fee is based on the level of average net assets for the month. Under a separate contract, FSC administers the security lending program. The security lending fee is based on the number and duration of lending transactions.
Brokerage Commissions. The Fund placed a portion of its portfolio transactions with brokerage firms which are affiliates of the investment adviser. The commissions paid to these affiliated firms were $88 for the period.
7. Committed Line of Credit.
The Fund participates with other funds managed by FMR in a $4.2 billion credit facility (the "line of credit") to be utilized for temporary or emergency purposes to fund shareholder redemptions or for other short-term liquidity purposes. The Fund has agreed to pay commitment fees on its pro rata portion of the line of credit, which amounted to $372 and is reflected in Miscellaneous Expense on the Statement of Operations. During the period, there were no borrowings on this line of credit.
8. Security Lending.
The Fund lends portfolio securities from time to time in order to earn additional income. On the settlement date of the loan, the Fund receives collateral (in the form of U.S. Treasury obligations, letters of credit and/or cash) against the loaned securities and maintains collateral in an amount not less than 100% of the market value of the loaned
Annual Report
8. Security Lending - continued
securities during the period of the loan. The market value of the loaned securities is determined at the close of business of the Fund and any additional required collateral is delivered to the Fund on the next business day. If the borrower defaults on its obligation to return the securities loaned because of insolvency or other reasons, a fund could experience delays and costs in recovering the securities loaned or in gaining access to the collateral. Any cash collateral received is invested in the Fidelity Securities Lending Cash Central Fund. The value of loaned securities and cash collateral at period end are disclosed on the Fund's Statement of Assets and Liabilities. Security lending income represents the income earned on investing cash collateral, less fees and expenses associated with the loan, plus any premium payments that may be received on the loan of certain types of securities. Security lending income is presented in the Statement of Operations as a component of income from Fidelity Central Funds. Net income from lending portfolio securities during the period amounted to $35,849.
9. Expense Reductions.
Many of the brokers with whom FMR places trades on behalf of the Fund provided services to the Fund in addition to trade execution. These services included payments of certain expenses on behalf of the Fund totaling $24,840 for the period. In addition, through arrangements with the Fund's custodian, credits realized as a result of uninvested cash balances were used to reduce the Fund's expenses. During the period, these credits reduced the Fund's custody expenses by $2,253.
10. Other.
The Fund's organizational documents provide former and current trustees and officers with a limited indemnification against liabilities arising in connection with the performance of their duties to the Fund. In the normal course of business, the Fund may also enter into contracts that provide general indemnifications. The Fund's maximum exposure under these arrangements is unknown as this would be dependent on future claims that may be made against the Fund. The risk of material loss from such claims is considered remote.
In September 2006, FIIOC, the Fund's transfer agent, notified the Fund that the Fund's books and records did not reflect a conversion of certain Class B to Class A shares upon their conversion date. In March 2007, FIIOC converted the relevant Class B shares to Class A shares and recorded the conversion in the books and records of the Fund which did not result in a material impact to the Fund's reported net assets or results of operations in the accompanying financial statements. FIIOC has remediated affected shareholders and reimbursed the Fund for all related audit and legal expenses.
Annual Report
Notes to Financial Statements - continued
10. Other - continued
The United States Securities and Exchange Commission ("SEC") is conducting an investigation of FMR (covering the years 2002 to 2004) arising from gifts, gratuities and business entertainment provided by certain brokers to certain individuals who were employed on FMR's domestic equity trading desk during that period. FMR is in discussions with the SEC staff regarding the possible resolution of the matter, but as of period-end no final resolution has been reached.
In December 2006, the Independent Trustees completed their own investigation of the matter with the assistance of independent counsel. The Independent Trustees and FMR agree that, despite the absence of proof that the Fidelity mutual funds experienced diminished execution quality as a result of the improper receipt of gifts and business entertainment, the conduct at issue was serious and is worthy of redress. Accordingly, the Independent Trustees have requested and FMR has agreed to pay $42 million to Fidelity mutual funds, plus interest to be determined at the time that payment is made. A method of allocating this payment among the funds has not yet been determined. The total payment to the Fund is not anticipated to have a material impact on the Fund's net assets. In addition, FMR reimbursed related legal expenses which are recorded in the accompanying Statement of Operations as an expense reduction.
11. Distributions to Shareholders.
Distributions to shareholders of each class were as follows:
Years ended October 31, | 2007 | 2006 |
From net investment income | | |
Class A | $ 709,973 | $ 219,332 |
Class T | 240,940 | 104,207 |
Class B | 107,563 | 62,797 |
Class C | 191,630 | 83,084 |
Institutional Class | 88,607 | 69,096 |
Total | $ 1,338,713 | $ 538,516 |
From net realized gain | | |
Class A | $ 1,198,858 | $ 344,480 |
Class T | 501,417 | 205,956 |
Class B | 369,748 | 198,827 |
Class C | 627,893 | 211,054 |
Institutional Class | 129,464 | 101,292 |
Total | $ 2,827,380 | $ 1,061,609 |
Annual Report
12. Share Transactions.
Transactions for each class of shares were as follows:
| Shares | Dollars |
Years ended October 31, | 2007 | 2006 | 2007 | 2006 |
Class A | | | | |
Shares sold | 1,393,391 | 1,595,680 | $ 65,803,104 | $ 53,840,185 |
Reinvestment of distributions | 43,952 | 17,187 | 1,688,203 | 510,999 |
Shares redeemed | (782,832) | (621,628) | (35,128,744) | (20,607,296) |
Net increase (decrease) | 654,511 | 991,239 | $ 32,362,563 | $ 33,743,888 |
Class T | | | | |
Shares sold | 455,916 | 687,146 | $ 21,240,936 | $ 23,305,912 |
Reinvestment of distributions | 18,830 | 10,076 | 718,933 | 298,075 |
Shares redeemed | (337,584) | (404,484) | (15,355,363) | (13,258,659) |
Net increase (decrease) | 137,162 | 292,738 | $ 6,604,506 | $ 10,345,328 |
Class B | | | | |
Shares sold | 237,976 | 327,369 | $ 10,853,846 | $ 10,890,504 |
Reinvestment of distributions | 11,564 | 8,380 | 434,710 | 244,506 |
Shares redeemed | (184,610) | (202,830) | (7,992,057) | (6,575,665) |
Net increase (decrease) | 64,930 | 132,919 | $ 3,296,499 | $ 4,559,345 |
Class C | | | | |
Shares sold | 583,666 | 719,183 | $ 27,131,346 | $ 23,864,225 |
Reinvestment of distributions | 19,005 | 8,714 | 711,556 | 253,286 |
Shares redeemed | (384,050) | (282,654) | (16,675,013) | (9,000,168) |
Net increase (decrease) | 218,621 | 445,243 | $ 11,167,889 | $ 15,117,343 |
Institutional Class | | | | |
Shares sold | 223,683 | 146,138 | $ 11,037,917 | $ 5,053,930 |
Reinvestment of distributions | 3,561 | 3,624 | 139,192 | 109,601 |
Shares redeemed | (91,047) | (159,490) | (4,496,421) | (5,026,561) |
Net increase (decrease) | 136,197 | (9,728) | $ 6,680,688 | $ 136,970 |
Annual Report
Report of Independent Registered Public Accounting Firm
To the Trustees of Fidelity Advisor Series VIII and the Shareholders of Fidelity Advisor Latin America Fund:
In our opinion, the accompanying statement of assets and liabilities, including the schedule of investments, and the related statements of operations and of changes in net assets and the financial highlights present fairly, in all material respects, the financial position of Fidelity Advisor Latin America Fund (a fund of Fidelity Advisor Series VIII) at October 31, 2007, the results of its operations for the year then ended, the changes in its net assets for each of the two years in the period then ended and the financial highlights for each of the five years in the period then ended, in conformity with accounting principles generally accepted in the United States of America. These financial statements and financial highlights (hereafter referred to as "financial statements") are the responsibility of the Fidelity Advisor Latin America Fund's management. Our responsibility is to express an opinion on these financial statements based on our audits. We conducted our audits of these financial statements in accordance with the standards of the Public Company Accounting Oversight Board (United States). Those standards require that we plan and perform the audit to obtain reasonable assurance about whether the financial statements are free of material misstatement. An audit includes examining, on a test basis, evidence supporting the amounts and disclosures in the financial statements, assessing the accounting principles used and significant estimates made by management, and evaluating the overall financial statement presentation. We believe that our audits, which included confirmation of securities at October 31, 2007 by correspondence with the custodian and brokers, provide a reasonable basis for our opinion.
/s/ PricewaterhouseCoopers LLP
PricewaterhouseCoopers LLP
Boston, Massachusetts
December 20, 2007
Annual Report
Trustees and Officers
The Trustees, Members of the Advisory Board, and executive officers of the trust and fund, as applicable, are listed below. The Board of Trustees governs the fund and is responsible for protecting the interests of shareholders. The Trustees are experienced executives who meet periodically throughout the year to oversee the fund's activities, review contractual arrangements with companies that provide services to the fund, and review the fund's performance. Except for James C. Curvey, each of the Trustees oversees 370 funds advised by FMR or an affiliate. Mr. Curvey oversees 340 funds advised by FMR or an affiliate.
The Trustees hold office without limit in time except that (a) any Trustee may resign; (b) any Trustee may be removed by written instrument, signed by at least two-thirds of the number of Trustees prior to such removal; (c) any Trustee who requests to be retired or who has become incapacitated by illness or injury may be retired by written instrument signed by a majority of the other Trustees; and (d) any Trustee may be removed at any special meeting of shareholders by a two-thirds vote of the outstanding voting securities of the trust. Each Trustee who is not an interested person (as defined in the 1940 Act) (Independent Trustee), shall retire not later than the last day of the calendar year in which his or her 72nd birthday occurs. The Independent Trustees may waive this mandatory retirement age policy with respect to individual Trustees. The executive officers and Advisory Board Members hold office without limit in time, except that any officer and Advisory Board Member may resign or may be removed by a vote of a majority of the Trustees at any regular meeting or any special meeting of the Trustees. Except as indicated, each individual has held the office shown or other offices in the same company for the past five years.
The fund's Statement of Additional Information (SAI) includes more information about the Trustees. To request a free copy, call Fidelity at 1-877-208-0098.
Interested Trustees*:
Correspondence intended for each Trustee who is an interested person may be sent to Fidelity Investments, 82 Devonshire Street, Boston, Massachusetts 02109.
Name, Age; Principal Occupation |
Edward C. Johnson 3d (77) |
| Year of Election or Appointment: 1983 Mr. Johnson is Chairman of the Board of Trustees. Mr. Johnson serves as President (2006-present), Chief Executive Officer, Chairman, and a Director of FMR LLC; Chairman and a Director of FMR; Chairman and a Director of Fidelity Research & Analysis Company (FRAC); Chairman and a Director of Fidelity Investments Money Management, Inc.; and Chairman (2001-present) and a Director of FMR Co., Inc. In addition, Mr. Johnson serves as Chairman and Director of Fidelity International Limited (FIL). |
James C. Curvey (72) |
| Year of Election or Appointment: 2007 Mr. Curvey also serves as Trustee (2007-present) or Member of the Advisory Board (2007-present) of other investment companies advised by FMR. Mr. Curvey is a Director of FMR and FMR Co., Inc. (2007-present). Mr. Curvey is also Vice Chairman (2006-present) and Director of FMR LLC. Mr. Curvey joined Fidelity in 1982 and served in numerous senior management positions, including President and Chief Operating Officer of FMR LLC (1997-2000) and President of Fidelity Strategic Investments (2000-2002). In addition, he serves as a member of the Board of Directors of Geerlings & Wade, Inc. (wine distribution). |
* Trustees have been determined to be "Interested Trustees" by virtue of, among other things, their affiliation with the trust or various entities under common control with FMR. FMR Corp. merged with FMR LLC on October 1, 2007. Any references to FMR LLC for prior periods are deemed to be references to the prior entity.
Independent Trustees:
Correspondence intended for each Independent Trustee (that is, the Trustees other than the Interested Trustees) may be sent to Fidelity Investments, P.O. Box 55235, Boston, Massachusetts 02205-5235.
Name, Age; Principal Occupation |
Dennis J. Dirks (59) |
| Year of Election or Appointment: 2005 Prior to his retirement in May 2003, Mr. Dirks was Chief Operating Officer and a member of the Board of The Depository Trust & Clearing Corporation (DTCC) (1999-2003). He also served as President, Chief Operating Officer, and Board member of The Depository Trust Company (DTC) (1999-2003) and President and Board member of the National Securities Clearing Corporation (NSCC) (1999-2003). In addition, Mr. Dirks served as Chief Executive Officer and Board member of the Government Securities Clearing Corporation (2001-2003) and Chief Executive Officer and Board member of the Mortgage-Backed Securities Clearing Corporation (2001-2003). Mr. Dirks also serves as a Trustee and a member of the Finance Committee of Manhattan College (2005-present) and a Trustee and a member of the Finance Committee of AHRC of Nassau County (2006-present). |
Albert R. Gamper, Jr. (65) |
| Year of Election or Appointment: 2006 Prior to his retirement in December 2004, Mr. Gamper served as Chairman of the Board of CIT Group Inc. (commercial finance). During his tenure with CIT Group Inc. Mr. Gamper served in numerous senior management positions, including Chairman (1987-1989; 1999-2001; 2002-2004), Chief Executive Officer (1987-2004), and President (1989-2002). He currently serves as a member of the Board of Directors of Public Service Enterprise Group (utilities, 2001-present), Chairman of the Board of Governors, Rutgers University (2004-present), and Chairman of the Board of Saint Barnabas Health Care System. |
George H. Heilmeier (71) |
| Year of Election or Appointment: 2004 Dr. Heilmeier is Chairman Emeritus of Telcordia Technologies (communication software and systems), where prior to his retirement, he served as company Chairman and Chief Executive Officer. He currently serves on the Boards of Directors of The Mitre Corporation (systems engineering and information technology support for the government), and HRL Laboratories (private research and development, 2004-present). He is Chairman of the General Motors Science & Technology Advisory Board and a Life Fellow of the Institute of Electrical and Electronics Engineers (IEEE). Dr. Heilmeier is a member of the Defense Science Board and the National Security Agency Advisory Board. He is also a member of the National Academy of Engineering, the American Academy of Arts and Sciences, and the Board of Overseers of the School of Engineering and Applied Science of the University of Pennsylvania. Previously, Dr. Heilmeier served as a Director of TRW Inc. (automotive, space, defense, and information technology, 1992-2002), Compaq (1994-2002), Automatic Data Processing, Inc. (ADP) (technology-based business outsourcing, 1995-2002), INET Technologies Inc. (telecommunications network surveillance, 2001-2004), and Teletech Holdings (customer management services). He is the recipient of the 2005 Kyoto Prize in Advanced Technology for his invention of the liquid crystal display, and a member of the Consumer Electronics Hall of Fame. |
James H. Keyes (67) |
| Year of Election or Appointment: 2007 Prior to his retirement in 2003, Mr. Keyes was Chairman, President, and Chief Executive Officer of Johnson Controls, Inc. (automotive supplier, 1993-2003). He currently serves as a member of the boards of LSI Logic Corporation (semiconductor technologies), Navistar International Corporation (manufacture and sale of trucks, buses, and diesel engines, 2002-present), and Pitney Bowes, Inc. (integrated mail, messaging, and document management solutions). |
Marie L. Knowles (61) |
| Year of Election or Appointment: 2001 Prior to Ms. Knowles' retirement in June 2000, she served as Executive Vice President and Chief Financial Officer of Atlantic Richfield Company (ARCO) (diversified energy, 1996-2000). From 1993 to 1996, she was a Senior Vice President of ARCO and President of ARCO Transportation Company. She served as a Director of ARCO from 1996 to 1998. She currently serves as a Director of Phelps Dodge Corporation (copper mining and manufacturing) and McKesson Corporation (healthcare service, 2002-present). Ms. Knowles is a Trustee of the Brookings Institution and the Catalina Island Conservancy and also serves as a member of the Advisory Board for the School of Engineering of the University of Southern California. |
Ned C. Lautenbach (63) |
| Year of Election or Appointment: 2000 Mr. Lautenbach is Chairman of the Independent Trustees (2006-present). Mr. Lautenbach has been a partner of Clayton, Dubilier & Rice, Inc. (private equity investment firm) since September 1998. Previously, Mr. Lautenbach was with the International Business Machines Corporation (IBM) from 1968 until his retirement in 1998. Mr. Lautenbach serves as a Director of Sony Corporation (2006-present) and Eaton Corporation (diversified industrial) as well as the Philharmonic Center for the Arts in Naples, Florida. He also is a member of the Board of Trustees of Fairfield University (2005-present), as well as a member of the Council on Foreign Relations. |
Cornelia M. Small (63) |
| Year of Election or Appointment: 2005 Ms. Small is a member (2000-present) and Chairperson (2002-present) of the Investment Committee, and a member (2002-present) of the Board of Trustees of Smith College. Previously, she served as Chief Investment Officer (1999-2000), Director of Global Equity Investments (1996-1999), and a member of the Board of Directors of Scudder, Stevens & Clark (1990-1997) and Scudder Kemper Investments (1997-1999). In addition, Ms. Small served as Co-Chair (2000-2003) of the Annual Fund for the Fletcher School of Law and Diplomacy. |
William S. Stavropoulos (73) |
| Year of Election or Appointmen: 2001 Mr. Stavropoulos is Chairman Emeritus of the Board of Directors of The Dow Chemical Company. Since joining The Dow Chemical Company in 1967, Mr. Stavropoulos served in numerous senior management positions, including President (1993-2000; 2002-2003), CEO (1995-2000; 2002-2004), and Chairman of the Executive Committee (2000-2004). Currently, he is a Director of NCR Corporation (data warehousing and technology solutions), Chemical Financial Corporation, Maersk Inc. (industrial conglomerate, 2002-present), Tyco International, Inc. (multinational manufacturing and services, 2007-present), and a member of the Advisory Board for Metalmark Capital (private equity investment firm, 2005-present). He is a special advisor to Clayton, Dubilier & Rice, Inc., a private equity investment firm. He also serves as a member of the Board of Trustees of the American Enterprise Institute for Public Policy Research. In addition, Mr. Stavropoulos is a member of The Business Council, J.P. Morgan International Council and the University of Notre Dame Advisory Council for the College of Science. |
Kenneth L. Wolfe (68) |
| Year of Election or Appointment: 2005 Prior to his retirement in 2001, Mr. Wolfe was Chairman and Chief Executive Officer of Hershey Foods Corporation (1993-2001). He currently serves as a member of the boards of Adelphia Communications Corporation (2003-present), Bausch & Lomb, Inc., and Revlon Inc. (2004-present). |
Advisory Board Members and Executive Officers**:
Correspondence intended for Mr. Mauriello, Mr. Thomas, and Mr. Wiley may be sent to Fidelity Investments, P.O. Box 55235, Boston, Massachusetts 02205-5235. Correspondence intended for each executive officer and Mr. Lynch may be sent to Fidelity Investments, 82 Devonshire Street, Boston, Massachusetts 02109.
Name, Age; Principal Occupation |
Peter S. Lynch (63) |
| Year of Election or Appointment: 2003 Member of the Advisory Board of Fidelity Advisor Series VIII. Mr. Lynch is Vice Chairman and a Director of FMR, and Vice Chairman (2001-present) and a Director of FMR Co., Inc. Previously, Mr. Lynch served as a Trustee of the Fidelity funds (1990-2003). In addition, he serves as a Trustee of Boston College and as the Chairman of the Inner-City Scholarship Fund. |
Joseph Mauriello (63) |
| Year of Election or Appointment: 2007 Member of the Advisory Board of Fidelity Advisor Series VIII. Prior to his retirement in January 2006, Mr. Mauriello served in numerous senior management positions including Deputy Chairman and Chief Operating Officer (2004-2005), and Vice Chairman of Financial Services (2002-2004) of KPMG LLP US (professional services firm, 1965-2005). Mr. Mauriello currently serves as a member of the Board of Directors of XL Capital Ltd., (global insurance and re-insurance company, 2006-present) and of Arcadia Resources Inc., (health care services and products, 2007-present). He also served as a Director of the Hamilton Funds of the Bank of New York (2006-2007). |
David M. Thomas (58) |
| Year of Election of Appointment: 2007 Member of the Advisory Board of Fidelity Advisor Series VIII. Previously, Mr. Thomas served as Executive Chairman (2005-2006) and Chairman and Chief Executive Officer (2000-2005) of IMS Health, Inc. (pharmaceutical and healthcare information solutions). In addition, Mr. Thomas serves as a member of the Board of Directors of Fortune Brands, Inc. (consumer products holding company), and Interpublic Group of Companies, Inc. (marketing communication, 2004-present). |
Michael E. Wiley (57) |
| Year of Election or Appointment: 2007 Member of the Advisory Board of Fidelity Advisor Series VIII. Mr. Wiley also serves as Sr. Energy Advisor of Katzenbach Partners, LLC (consulting firm, 2006-present) and a member of the Board of Trustees of the University of Tulsa (2000-2006; 2007-present). He serves as a Director of Tesoro Corporation (independent oil refiner and marketer, 2005-present), and a Director of Bill Barrett Corporation (exploration and production company, 2005-present). In addition, he also serves as a Director of Post Oak Bank (privately-held bank, 2004-present), and an Advisory Director of Riverstone Holdings (private investment firm). Previously, Mr. Wiley served as Chairman, President, and CEO of Baker Hughes, Inc. (oilfield services company, 2000-2004), and as Director of Spinnaker Exploration Company (exploration and production company, 2001-2005). |
Name, Age; Principal Occupation |
Kimberley H. Monasterio (57) |
| Year of Election or Appointment: 2007 President and Treasurer of Advisor Latin America. Ms. Monasterio also serves as President and Treasurer of other Fidelity funds (2007-present) and is an employee of FMR (2004-present). Previously, Ms. Monasterio served as Deputy Treasurer of the Fidelity funds (2004-2006). Before joining Fidelity Investments, Ms. Monasterio served as Treasurer (2000-2004) and Chief Financial Officer (2002-2004) of the Franklin Templeton Funds and Senior Vice President of Franklin Templeton Services, LLC (2000-2004). |
Walter C. Donovan (45) |
| Year of Election or Appointment: 2007 Vice President of Advisor Latin America. Mr. Donovan also serves as Vice President of Fidelity's Equity Funds (2007-present). Mr. Donovan also serves as Executive Vice President of FMR (2005-present) and FMR Co., Inc. (2005-present). Previously, Mr. Donovan served as Vice President of Fidelity's High Income Funds (2005-2007), Fixed-Income Funds (2005-2006), certain Asset Allocation Funds (2005-2006), certain Balanced Funds (2005-2006), and as Vice President and Director of Fidelity's International Equity Trading group (1998-2005). |
Eric M. Wetlaufer (45) |
| Year of Election or Appointment: 2006 Vice President of Advisor Latin America. Mr. Wetlaufer also serves as Vice President of certain International Equity Funds (2006-present). Mr. Wetlaufer is Senior Vice President of FMR (2006-present) and FMR Co., Inc. (2006-present), and President and Director of Fidelity Management & Research (U.K.) Inc. (2006-present) and Fidelity Research & Analysis Company (2006-present). Before joining Fidelity Investments in 2005, Mr. Wetlaufer was a partner in Oxhead Capital Management (2004-2005). Previously, Mr. Wetlaufer served as a Chief Investment Officer of Putnam Investments (1997-2003). |
Eric D. Roiter (58) |
| Year of Election or Appointment: 1998 Secretary of Advisor Latin America. He also serves as Secretary of other Fidelity funds; Vice President, General Counsel, and Secretary of FMR Co., Inc. (2001-present) and FMR; Assistant Secretary of Fidelity Management & Research (U.K.) Inc. (2001-present), Fidelity Research & Analysis Company (2001-present), and Fidelity Investments Money Management, Inc. (2001-present). Mr. Roiter is an Adjunct Member, Faculty of Law, at Boston College Law School (2003-present). Previously, Mr. Roiter served as Vice President and Secretary of Fidelity Distributors Corporation (FDC) (1998-2005). |
Scott C. Goebel (39) |
| Year of Election or Appointment: 2007 Assistant Secretary of Advisor Latin America. Mr. Goebel also serves as Assistant Secretary of other Fidelity funds (2007-present), and is an employee of FMR. |
R. Stephen Ganis (41) |
| Year of Election or Appointment: 2006 Anti-Money Laundering (AML) officer of Advisor Latin America. Mr. Ganis also serves as AML officer of other Fidelity funds (2006-present) and FMR LLC (2003-present). Before joining Fidelity Investments, Mr. Ganis practiced law at Goodwin Procter, LLP (2000-2002). |
Joseph B. Hollis (59) |
| Year of Election or Appointment: 2006 Chief Financial Officer of Advisor Latin America. Mr. Hollis also serves as Chief Financial Officer of other Fidelity funds. Mr. Hollis is President of Fidelity Pricing and Cash Management Services (FPCMS) (2005-present). Mr. Hollis also serves as President and Director of Fidelity Service Company, Inc. (2006-present). Previously, Mr. Hollis served as Senior Vice President of Cash Management Services (1999-2002) and Investment Management Operations (2002-2005). |
Kenneth A. Rathgeber (60) |
| Year of Election or Appointment: 2004 Chief Compliance Officer of Advisor Latin America. Mr. Rathgeber also serves as Chief Compliance Officer of other Fidelity funds (2004-present) and Executive Vice President of Risk Oversight for Fidelity Investments (2002-present). He is Chief Compliance Officer of FMR (2005-present), FMR Co., Inc. (2005-present), Fidelity Management & Research (U.K.) Inc. (2005-present), Fidelity Research & Analysis Company (2005-present), Fidelity Investments Money Management, Inc. (2005-present), and Strategic Advisers, Inc. (2005-present). Previously, Mr. Rathgeber served as Executive Vice President and Chief Operating Officer for Fidelity Investments Institutional Services Company, Inc. (1998-2002). |
Bryan A. Mehrmann (46) |
| Year of Election or Appointment: 2005 Deputy Treasurer of Advisor Latin America. Mr. Mehrmann also serves as Deputy Treasurer of other Fidelity funds (2005-present) and is an employee of FMR. Previously, Mr. Mehrmann served as Vice President of Fidelity Investments Institutional Services Group (FIIS)/Fidelity Investments Institutional Operations Corporation, Inc. (FIIOC) Client Services (1998-2004). |
Kenneth B. Robins (38) |
| Year of Election or Appointment: 2005 Deputy Treasurer of Advisor Latin America. Mr. Robins also serves as Deputy Treasurer of other Fidelity funds (2005-present) and is an employee of FMR (2004-present). Before joining Fidelity Investments, Mr. Robins worked at KPMG LLP, where he was a partner in KPMG's department of professional practice (2002-2004) and a Senior Manager (1999-2000). In addition, Mr. Robins served as Assistant Chief Accountant, United States Securities and Exchange Commission (2000-2002). |
Robert G. Byrnes (40) |
| Year of Election or Appointment: 2005 Assistant Treasurer of Advisor Latin America. Mr. Byrnes also serves as Assistant Treasurer of other Fidelity funds (2005-present) and is an employee of FMR (2005-present). Previously, Mr. Byrnes served as Vice President of FPCMS (2003-2005). Before joining Fidelity Investments, Mr. Byrnes worked at Deutsche Asset Management where he served as Vice President of the Investment Operations Group (2000-2003). |
Peter L. Lydecker (53) |
| Year of Election or Appointment: 2004 Assistant Treasurer of Advisor Latin America. Mr. Lydecker also serves as Assistant Treasurer of other Fidelity funds (2004) and is an employee of FMR. |
Paul M. Murphy (60) |
| Year of Election or Appointment: 2007 Assistant Treasurer of Advisor Latin America. Mr. Murphy also serves as Assistant Treasurer of other Fidelity funds (2007-present) and is an employee of FMR (2007-present). Previously, Mr. Murphy served as Chief Financial Officer of the Fidelity Funds (2005-2006), Vice President and Associate General Counsel of FMR (2007), and Senior Vice President of Fidelity Pricing and Cash Management Services Group (FPCMS) (1994-2007). |
Gary W. Ryan (49) |
| Year of Election or Appointment: 2005 Assistant Treasurer of Advisor Latin America. Mr. Ryan also serves as Assistant Treasurer of other Fidelity funds (2005-present) and is an employee of FMR (2005-present). Previously, Mr. Ryan served as Vice President of Fund Reporting in FPCMS (1999-2005). |
** FMR Corp. merged with FMR LLC on October 1, 2007. Any references to FMR LLC for prior periods are deemed to be references to the prior entity.
Annual Report
Distributions
The Board of Trustees of Advisor Latin America Fund voted to pay to shareholders of record at the opening of business on record date, the following distributions per share derived from capital gains realized from sales of portfolio securities, and dividends derived from net investment income:
| Pay Date | Record Date | Dividends | Capital Gains |
Institutional Class | 12/10/07 | 12/07/07 | $0.550 | $0.950 |
The fund hereby designates as a capital gain dividend with respect to the taxable year ended October 31,2007, $5,586,468, or, if subsequently determined to be different, the net capital gain of such year.
Institutional class designates 100% of the dividends distributed during the fiscal year as amounts which may be taken into account as a dividend for purposes of the maximum rate under section 1(h)(11) of the Internal Revenue Code.
The fund will notify shareholders in January 2008 of amounts for use in preparing 2007 income tax returns.
The amounts per share which represent income derived from sources within, and taxes paid to, foreign countries or possessions of the United States are as follows:
| Pay Date | Income | Taxes |
Class I | 12/04/06 | $0.544 | $0.0591 |
Annual Report
Board Approval of Investment Advisory Contracts and Management Fees
Advisor Latin America Fund
Each year, typically in July, the Board of Trustees, including the Independent Trustees (together, the Board), votes on the renewal of the management contract and sub-advisory agreements (together, the Advisory Contracts) for the fund. The Board, assisted by the advice of fund counsel and Independent Trustees' counsel, requests and considers a broad range of information throughout the year.
The Board meets regularly each month except August and takes into account throughout the year matters bearing on Advisory Contracts. The Board, acting directly and through its separate committees, considers at each of its meetings factors that are relevant to the annual renewal of the fund's Advisory Contracts, including the services and support provided to the fund and its shareholders. At the time of the renewal, the Board had 12 standing committees, each composed of Independent Trustees with varying backgrounds, to which the Board has assigned specific subject matter responsibilities in order to enhance effective decision-making by the Board. Each committee has adopted a written charter outlining the structure and purposes of the committee. One such committee, the Equity Contract Committee, meets periodically as needed throughout the year to consider matters specifically related to the annual renewal of Advisory Contracts. The committee requests and receives information on, and makes recommendations to the Independent Trustees concerning, the approval and annual review of the Advisory Contracts.
At its July 2007 meeting, the Board of Trustees, including the Independent Trustees, unanimously determined to renew the Advisory Contracts for the fund. In reaching its determination, the Board considered all factors it believed relevant, including (i) the nature, extent, and quality of the services to be provided to the fund and its shareholders (including the investment performance of the fund); (ii) the competitiveness of the management fee and total expenses of the fund; (iii) the total costs of the services to be provided by and the profits to be realized by the investment adviser and its affiliates from the relationship with the fund; (iv) the extent to which economies of scale would be realized as the fund grows; and (v) whether fee levels reflect these economies of scale, if any, for the benefit of fund shareholders. The Board also approved amendments to the fund's agreements with foreign sub-advisers to clarify that each sub-adviser provides services as an independent contractor.
In determining whether to renew the Advisory Contracts for the fund, the Board ultimately reached a determination, with the assistance of fund counsel and Independent Trustees' counsel, that the renewal of the Advisory Contracts and the compensation to be received by Fidelity under the management contract is consistent with Fidelity's fiduciary duty under applicable law. In addition to evaluating the specific factors noted above, the Board, in reaching its determination, is aware that shareholders in the fund have a broad range of investment choices available to them, including a wide choice among mutual funds offered by competitors to Fidelity, and that the fund's shareholders, with the opportunity to review and weigh the disclosure provided by the fund in its prospectus and other public disclosures, have chosen to invest in this fund, managed by Fidelity.
Annual Report
Board Approval of Investment Advisory Contracts and
Management Fees - continued
Nature, Extent, and Quality of Services Provided. The Board considered staffing within the investment adviser, FMR, and the sub-advisers (together, the Investment Advisers), including the backgrounds of the fund's portfolio managers and the fund's investment objective and discipline. The Independent Trustees also had discussions with senior management of Fidelity's investment operations and investment groups. The Board considered the structure of the portfolio manager compensation program and whether this structure provides appropriate incentives.
Resources Dedicated to Investment Management and Support Services. The Board reviewed the size, education, and experience of the Investment Advisers' investment staff, their use of technology, and the Investment Advisers' approach to recruiting, training, and retaining portfolio managers and other research, advisory, and management personnel. The Board considered Fidelity's extensive global research capabilities that enable the Investment Advisers to aggregate data from various sources in an effort to produce positive investment results. The Board noted that Fidelity's analysts have access to a variety of technological tools that enable them to perform both fundamental and quantitative analysis and to specialize in various disciplines. The Board also considered that Fidelity's portfolio managers and analysts have access to daily portfolio attribution that allows for monitoring of a fund's portfolio, as well as an electronic communication system that provides immediate real-time access to research concerning issuers and credit enhancers.
Shareholder and Administrative Services. The Board considered (i) the nature, extent, quality, and cost of advisory, administrative, distribution, and shareholder services performed by the Investment Advisers and their affiliates under the Advisory Contracts and under separate agreements covering transfer agency, pricing and bookkeeping, and securities lending services for the fund; (ii) the nature and extent of the Investment Advisers' supervision of third party service providers, principally custodians and subcustodians; and (iii) the resources devoted to, and the record of compliance with, the fund's compliance policies and procedures. The Board reviewed the allocation of fund brokerage, including allocations to brokers affiliated with the Investment Advisers, the use of brokerage commissions to pay fund expenses, and the use of "soft" commission dollars to pay for research services. The Board also considered that Fidelity voluntarily pays for market data out of its own resources. The Board also considered the agreement reached between the Independent Trustees and Fidelity in December 2006 following an independent review of matters relating to receipt of travel, entertainment, gifts and gratuities in violation of Fidelity policies.
Annual Report
The Board noted that the growth of fund assets across the complex allows Fidelity to reinvest in the development of services designed to enhance the value or convenience of the Fidelity funds as investment vehicles. These services include 24-hour access to account information and market information through phone representatives and over the Internet, and investor education materials and asset allocation tools.
Investment in a Large Fund Family. The Board considered the benefits to shareholders of investing in a Fidelity fund, including the benefits of investing in a fund that is part of a large family of funds offering a variety of investment disciplines and providing for a large variety of mutual fund investor services. For example, fund shareholders are offered the privilege of exchanging shares of the fund for shares of other Fidelity funds, as set forth in the fund's prospectus, without paying a sales charge. The Board noted that, since the last Advisory Contract renewals in July 2006, Fidelity has taken a number of actions that benefited particular funds, including (i) dedicating additional resources to investment research and to restructure the investment research teams; (ii) contractually agreeing to reduce the management fee on Fidelity Advisor Floating Rate High Income Fund; (iii) contractually agreeing to reduce the management fees on Fidelity's California, Massachusetts, New Jersey, and New York AMT Tax-Free Money Market Funds, launching new Institutional Classes and Service Classes of these funds, and contractually agreeing to impose expense limitations on these funds; (iv) eliminating the exchange fee on the Fidelity Select Portfolios and reducing the pricing and bookkeeping fee rates for these funds; (v) reducing the maximum transfer agency fee rates on high income funds and certain equity funds; (vi) proposing amended management contracts that, if approved by shareholders, will add a performance adjustment component to the management fees paid by 18 Fidelity Advisor equity funds; (vii) contractually agreeing to reduce fees for Ultra-Short Central Fund and the money market Central Funds; (viii) waiving the Fidelity Advisor funds' contingent deferred sales charge on certain redemptions made through systematic withdrawal programs; and (ix) amending the management contracts for equity and fixed-income funds whose management contracts incorporate a "group fee" structure by adding four new fee "breakpoints" to the group fee rate schedules.
Investment Performance and Compliance. The Board considered whether the fund has operated within its investment objective, as well as its record of compliance with its investment restrictions. It also reviewed the fund's absolute investment performance for each class, as well as the fund's relative investment performance for each class measured against a broad-based securities market index over multiple periods. The Board noted that FMR does not believe that a meaningful peer group exists against which to compare the fund's performance. The following charts considered by the Board show, over the one-, three-, and five-year periods ended December 31, 2006, the cumulative total returns of Institutional Class (Class I) and Class B of the fund and the cumulative total returns of a broad-based securities market index ("benchmark"). The returns of Institutional Class (Class I) and Class B show the performance of the highest and lowest performing classes, respectively (based on three-year performance).
Annual Report
Board Approval of Investment Advisory Contracts and
Management Fees - continued
Advisor Latin America Fund

The Board stated that the relative investment performance of Institutional Class (Class I) of the fund compared favorably to its benchmark for all the periods shown. The Board considered that the variations in performance among the fund's classes reflect the variations in class expenses, which result in lower performance for higher expense classes.
The Board considered that FMR has taken steps to refocus and strengthen equity research, equity portfolio management, and compliance.
Based on its review, and giving particular weight to the nature and quality of the resources dedicated by the Investment Advisers to maintain and improve relative performance, the Board concluded that the nature, extent, and quality of the services provided to the fund will benefit the fund's shareholders, particularly in light of the Board's view that the fund's shareholders benefit from investing in a fund that is part of a large family of funds offering a variety of investment disciplines and services.
Competitiveness of Management Fee and Total Fund Expenses. The Board considered the fund's management fee and total expenses compared to "mapped groups" of competitive funds and classes. Fidelity creates "mapped groups" by combining similar Lipper investment objective categories that have comparable management fee characteristics. Combining Lipper investment objective categories aids the Board's management fee and total expense comparisons by broadening the competitive group used for comparison and by reducing the number of universes to which various Fidelity funds are compared. The Board also considered supplemental information about how the fund's management fee and total expenses ranked relative to groups based on Lipper classifications, which take into account a fund's market capitalization and style.
Annual Report
The Board considered two proprietary management fee comparisons for the 12-month periods shown in the chart below. The group of Lipper funds used by the Board for management fee comparisons is referred to below as the "Total Mapped Group." The Total Mapped Group comparison focuses on a fund's standing relative to the total universe of comparable funds available to investors, in terms of gross management fees before expense reimbursements or caps. "TMG %" represents the percentage of funds in the Total Mapped Group that had management fees that were lower than the fund's. For example, a TMG % of 9% means that 91% of the funds in the Total Mapped Group had higher management fees than the fund. The "Asset-Size Peer Group" (ASPG) comparison focuses on a fund's standing relative to non-Fidelity funds similar in size to the fund within the Total Mapped Group. The ASPG represents at least 15% of the funds in the Total Mapped Group with comparable asset size and management fee characteristics, subject to a minimum of 50 funds (or all funds in the Total Mapped Group if fewer than 50). Additional information, such as the ASPG quartile in which the fund's management fee ranked, is also included in the chart and considered by the Board.
Advisor Latin America Fund

The Board noted that the fund's management fee ranked below the median of its Total Mapped Group and below the median of its ASPG for 2006.
Annual Report
Board Approval of Investment Advisory Contracts and
Management Fees - continued
Based on its review, the Board concluded that the fund's management fee was fair and reasonable in light of the services that the fund receives and the other factors considered.
In its review of each class's total expenses, the Board considered the fund's management fee as well as other fund or class expenses, as applicable, such as transfer agent fees, pricing and bookkeeping fees, fund-paid 12b-1 fees, and custodial, legal, and audit fees. The Board also noted the effects of any waivers and reimbursements on fees and expenses. As part of its review, the Board also considered current and historical total expenses of each class of the fund compared to competitive fund median expenses. Each class of the fund is compared to those funds and classes in the Total Mapped Group (used by the Board for management fee comparisons) that have a similar sales load structure.
The Board noted that the total expenses of each class ranked below its competitive median for 2006.
In its review of total expenses, the Board also considered Fidelity fee structures and other information on clients that FMR and its affiliates service in other competitive markets, such as other mutual funds advised or subadvised by FMR or its affiliates, pension plan clients, and other institutional clients.
Based on its review, the Board concluded that the total expenses of each class of the fund were reasonable in light of the services that the fund and its shareholders receive and the other factors considered.
Costs of the Services and Profitability. The Board considered the revenues earned and the expenses incurred by Fidelity in conducting the business of developing, marketing, distributing, managing, administering and servicing the fund and its shareholders. The Board also considered the level of Fidelity's profits in respect of all the Fidelity funds.
On an annual basis, FMR presents to the Board Fidelity's profitability for the fund. Fidelity calculates the profitability for each fund, as well as aggregate profitability for groups of Fidelity funds and all Fidelity funds, using a series of detailed revenue and cost allocation methodologies which originate with the audited books and records of Fidelity. The Audit Committee of the Board reviews any significant changes from the prior year's methodologies.
PricewaterhouseCoopers LLP (PwC), independent registered public accounting firm and auditor to Fidelity and certain Fidelity funds, has been engaged annually by the Board as part of the Board's assessment of the results of Fidelity's profitability analysis. PwC's engagement includes the review and assessment of Fidelity's methodologies used in determining the revenues and expenses attributable to Fidelity's mutual fund business, and completion of agreed-upon procedures surrounding the mathematical accuracy of fund profitability and its conformity to allocation methodologies. After considering PwC's reports issued under the engagement and information provided by Fidelity, the Board believes that while other allocation methods may also be reasonable, Fidelity's profitability methodologies are reasonable in all material respects.
Annual Report
The Board has also reviewed Fidelity's non-fund businesses and any fall-out benefits related to the mutual fund business as well as cases where Fidelity's affiliates may benefit from or be related to the fund's business.
The Board considered the costs of the services provided by and the profits realized by Fidelity in connection with the operation of the fund and determined that the amount of profit is a fair entrepreneurial profit for the management of the fund.
Economies of Scale. The Board considered whether there have been economies of scale in respect of the management of the Fidelity funds, whether the Fidelity funds (including the fund) have appropriately benefited from any such economies of scale, and whether there is potential for realization of any further economies of scale. The Board considered the extent to which the fund will benefit from economies of scale through increased services to the fund, through waivers or reimbursements, or through fee or expense reductions, including reductions that occur through operation of the transfer agent agreement. The transfer agent fee varies in part based on the number of accounts in the fund. If the number of accounts decreases or the average account size increases, the overall transfer agent fee rate decreases.
The Board recognized that the fund's management contract incorporates a "group fee" structure, which provides for lower group fee rates as total fund assets under FMR's management increase, and for higher group fee rates as total fund assets under FMR's management decrease. FMR determines the group fee rates based on a tiered asset "breakpoint" schedule. In connection with the renewal of the fund's management contract, the Board approved amendments to the fund's management contract that added four new fee breakpoints to the group fee rate schedule for assets under FMR's management above $1,386 billion. The Board considered that the group fee rate declines under both the present and amended schedules, but that under the amended schedule, the group fee rate declines faster as assets under FMR's management exceed $1,386 billion. The Board considered that the group fee is designed to deliver the benefits of economies of scale to fund shareholders when total fund assets increase, even if assets of any particular fund are unchanged or have declined, because some portion of Fidelity's costs are attributable to services provided to all Fidelity funds, and all funds benefit if those costs can be allocated among more assets. The Board concluded that, given the group fee structure, fund shareholders will achieve a certain level of economies of scale as assets under FMR's management increase at the fund complex level, regardless of whether Fidelity achieves any such economies of scale.
The Board further concluded that any potential economies of scale are being shared between fund shareholders and Fidelity in an appropriate manner.
Annual Report
Board Approval of Investment Advisory Contracts and
Management Fees - continued
Additional Information Requested by the Board. In order to develop fully the factual basis for consideration of the Fidelity funds' Advisory Contracts, the Board requested and received additional information on several topics, including (i) fund performance trends and actions to be taken by FMR to improve certain funds' overall performance; (ii) Fidelity's portfolio manager compensation structure, including its effects on fund profitability and the extent to which portfolio manager compensation is linked to fund performance; (iii) Fidelity's fee structures; (iv) the funds' sub-advisory arrangements; and (v) accounts managed by Fidelity other than the Fidelity funds.
Based on its evaluation of all of the conclusions noted above, and after considering all material factors, the Board ultimately concluded that the advisory fee structures are fair and reasonable, and that the fund's Advisory Contracts should be renewed.
Annual Report
Annual Report
Annual Report
Annual Report
Investment Adviser
Fidelity Management & Research Company
Boston, MA
Investment Sub-Advisers
FMR Co., Inc.
Fidelity Management & Research
(U.K.) Inc.
Fidelity Research & Analysis Company
Fidelity International
Investment Advisors
Fidelity Investments Japan Limited
Fidelity International Investment Advisors (U.K.) Limited
General Distributor
Fidelity Distributors Corporation
Boston, MA
Transfer and Service Agents
Fidelity Investments Institutional Operations Company, Inc.
Boston, MA
Fidelity Service Company, Inc.
Boston, MA
Custodian
State Street Bank and Trust Company
Quincy, MA
ALAFI-UANN-1207
1.784761.104
(Fidelity Investment logo)(registered trademark)
(Fidelity Investment logo)(registered trademark)
Fidelity® Advisor
Overseas
Fund - Class A, Class T, Class B and Class C
Annual Report
October 31, 2007
(2_fidelity_logos) (Registered_Trademark)
Contents
Chairman's Message | <Click Here> | Ned Johnson's message to shareholders. |
Performance | <Click Here> | How the fund has done over time. |
Management's Discussion | <Click Here> | The manager's review of fund performance, strategy and outlook. |
Shareholder Expense Example | <Click Here> | An example of shareholder expenses. |
Investment Changes | <Click Here> | A summary of major shifts in the fund's investments over the past six months. |
Investments | <Click Here> | A complete list of the fund's investments with their market values. |
Financial Statements | <Click Here> | Statements of assets and liabilities, operations, and changes in net assets,
as well as financial highlights. |
Notes | <Click Here> | Notes to the financial statements. |
Report of Independent Registered Public Accounting Firm | <Click Here> | |
Trustees and Officers | <Click Here> | |
Distributions | <Click Here> | |
Board Approval of Investment Advisory Contracts and Management Fees | <Click Here> | |
To view a fund's proxy voting guidelines and proxy voting record for the 12-month period ended June 30, visit http://www.fidelity.com (search for "proxy voting guidelines") or visit the Securities and Exchange Commission's (SEC) web site at http://www.sec.gov. You may also call 1-877-208-0098 to request a free copy of the proxy voting guidelines.
Standard & Poor's, S&P and S&P 500 are registered service marks of The McGraw-Hill Companies, Inc. and have been licensed for use by Fidelity Distributors Corporation.
Other third party marks appearing herein are the property of their respective owners.
All other marks appearing herein are registered or unregistered trademarks or service marks of FMR LLC or an affiliated company.
Annual Report
This report and the financial statements contained herein are submitted for the general information of the shareholders of the fund. This report is not authorized for distribution to prospective investors in the fund unless preceded or accompanied by an effective prospectus.
A fund files its complete schedule of portfolio holdings with the SEC for the first and third quarters of each fiscal year on Form N-Q. Forms N-Q are available on the SEC's web site at http://www.sec.gov. A fund's Forms N-Q may be reviewed and copied at the SEC's Public Reference Room in Washington, DC. Information regarding the operation of the SEC's Public Reference Room may be obtained by calling 1-800-SEC-0330. For a complete list of a fund's portfolio holdings, view the most recent holdings listing, semiannual report, or annual report on Fidelity's web site at http://www.fidelity.com or http://www.advisor.fidelity.com, as applicable.
NOT FDIC INSURED · MAY LOSE VALUE · NO BANK GUARANTEE
Neither the fund nor Fidelity Distributors Corporation is a bank.
Annual Report
Chairman's Message
(photo_of_Edward_C_Johnson_3d)
Dear Shareholder:
Many stock and bond markets around the world have been unsettled of late; however, volatility can often lead to opportunity for patient investors. Financial markets are always unpredictable, but there are a number of time-tested principles that can put the historical odds in your favor.
One of the basic tenets is to invest for the long term. Over time, riding out the markets' inevitable ups and downs has proven much more effective than selling into panic or chasing the hottest trend. Even missing only a few of the markets' best days can significantly diminish investor returns. Patience also affords the benefits of compounding - of earning interest on additional income or reinvested dividends and capital gains. There are tax advantages and cost benefits to consider as well. The more you sell, the more taxes you pay, and the more you trade, the higher the costs. While staying the course doesn't eliminate risk, it can considerably lessen the effect of short-term declines.
You can further manage your investing risk through diversification. And today, more than ever, geographic diversification should be taken into account. Studies indicate that asset allocation is the single most important determinant of a portfolio's long-term success. The right mix of stocks, bonds and cash - aligned to your particular risk tolerance and investment objective - is very important. Age-appropriate rebalancing is also an essential aspect of asset allocation. For younger investors, an emphasis on equities - which historically have been the best-performing asset class over time - is encouraged. As investors near their specific goal, such as retirement or sending a child to college, consideration may be given to replacing volatile assets (e.g. common stocks) with more-stable fixed investments (bonds or savings plans).
A third investment principle - investing regularly - can help lower the average cost of your purchases. Investing a certain amount of money each month or quarter helps ensure you won't pay for all your shares at market highs. This strategy - known as dollar cost averaging - also reduces unconstructive "emotion" from investing, helping shareholders avoid selling weak performers just prior to an upswing, or chasing a hot performer just before a correction.
We invite you to contact us via the Internet, through our Investor Centers or over the phone. It is our privilege to provide you the information you need to make the investments that are right for you.
Sincerely,
/s/Edward C. Johnson 3d
Edward C. Johnson 3d
Annual Report
Performance: The Bottom Line
Average annual total return reflects the change in the value of an investment, assuming reinvestment of the class' dividend income and capital gains (the profits earned upon the sale of securities that have grown in value) and assuming a constant rate of performance each year. The $10,000 table and the fund's returns do not reflect the deduction of taxes that a shareholder would pay on fund distributions or the redemption of fund shares. During periods of reimbursement by Fidelity, a fund's total return will be greater than it would be had the reimbursement not occurred. How a fund did yesterday is no guarantee of how it will do tomorrow. Returns may reflect the conversion of Class B shares to Class A shares after a maximum of seven years.
Average Annual Total Returns
Periods ended October 31, 2007 | | Past 1
year | Past 5
years | Past 10
years |
Class A (incl. 5.75%
sales charge) A | | 23.89% | 20.49% | 7.87% |
Class T (incl. 3.50%
sales charge) | | 26.65% | 20.88% | 7.96% |
Class B (incl. contingent
deferred sales charge) B | | 25.45% | 20.69% | 7.90% |
Class C (incl. contingent
deferred sales charge) C | | 29.48% | 20.98% | 7.70% |
A Class A's 12b-1 fee may have ranged over time between 0.25% and 0.35%, as an equivalent amount of brokerage commissions of up to 0.10% of the class's average net assets may have been used to promote the sale of class shares. This practice has been discontinued and no commissions incurred after June 30, 2003 have been used to pay distribution expenses. Class A's 12b-1 plan currently authorizes a 0.25% 12b-1 fee.
B Class B shares bear a 1.00% 12b-1 fee. Class B shares' contingent deferred sales charges included in the past one year, past 5 year, and past 10 year total return figures are 5%, 2% and 0%, respectively.
C Class C shares bear a 1.00% 12b-1 fee. The initial offering of Class C shares took place on November 3, 1997. Returns prior to November 3, 1997 are those of Class B shares and reflect Class B shares' 1.00% 12b-1 fee. Class C shares' contingent deferred sales charge included in the past one year, past five year, and past 10 year total return figures are 1%, 0%, and 0%, respectively.
Annual Report
Performance - continued
$10,000 Over 10 Years
Let's say hypothetically that $10,000 was invested in Fidelity® Advisor Overseas Fund - Class T on October 31, 1997, and the current 3.50% sales charge was paid. The chart shows how the value of your investment would have changed, and also shows how the Morgan Stanley Capital InternationalSM Europe, Australasia, Far East (MSCI® EAFE®) Index performed over the same period.
Annual Report
Management's Discussion of Fund Performance
Comments from Graeme Rockett, Portfolio Manager of Fidelity® Advisor
Overseas Fund
Foreign stocks, with a large assist from a weak U.S. dollar, generally had higher returns for U.S. investors than domestic equities during the 12-month period ending October 31, 2007. The backdrop for global stocks was solid, with robust economic growth and relatively high corporate profitability worldwide. Developed international equity markets, as measured by the Morgan Stanley Capital InternationalSM Europe, Australasia, and Far East (MSCI® EAFE®) Index - a performance monitor of established markets outside the United States and Canada - rose 25.09%. In comparison, the Standard & Poor's 500SM Index, a gauge of U.S. stocks, was up 14.56%. Among countries making up at least 1% of the EAFE benchmark, Finland had the best showing, soaring nearly 69%, while Hong Kong gained roughly 66%. The United Kingdom and Japan, the two largest components of the index, both underperformed. Fallout from the credit crunch and concerns about export growth tempered UK stocks, while Japan struggled with a slowdown in consumer spending and sluggish domestic growth. Emerging markets were the period's big winners, advancing 68.33% as measured by the MSCI Emerging Markets index.
For the 12 months ending October 31, 2007, the fund's Class A, Class T, Class B and Class C shares returned 31.44%, 31.24%, 30.45% and 30.48%, respectively (excluding sales charges), substantially outpacing the performance of the MSCI EAFE index. Security selection added value in nine out of the 10 economic sectors and in most regions of the globe. We had excellent returns in the capital goods industry, based on our conviction that the market was underestimating the strength of global demand for power transmission and distribution equipment. Alstom (of France) and ABB (of Switzerland) were among the capital goods stocks contributing to performance. In the information technology sector, Nintendo was the standout, as this Japanese video game manufacturer continued to profit from sales of its Wii game console and the related software. Within health care, CSL, an Australian specialty biopharmaceutical company that produces plasma protein therapies, performed especially well. Favorable currency movements also had a positive impact on the fund's absolute returns. Financials was the only sector where stock picking detracted from results. Germany's MLP, a distributor of financial products, lost ground because it had difficulty expanding its team of financial advisors, and Japanese insurer T&D underperformed due to slowing economic momentum in its domestic market.
The views expressed above reflect those of the portfolio manager(s) only through the end of the period as stated on the cover of this report and do not necessarily represent the views of Fidelity or any other person in the Fidelity organization. Any such views are subject to change at any time based upon market or other conditions and Fidelity disclaims any responsibility to update such views. These views may not be relied on as investment advice and, because investment decisions for a Fidelity fund are based on numerous factors, may not be relied on as an indication of trading intent on behalf of any Fidelity fund.
Annual Report
Shareholder Expense Example
As a shareholder of the Fund, you incur two types of costs: (1) transaction costs, including sales charges (loads) on purchase payments or redemption proceeds, redemption fees, and (2) ongoing costs, including management fees, distribution and/or service (12b-1) fees and other Fund expenses. This Example is intended to help you understand your ongoing costs (in dollars) of investing in the Fund and to compare these costs with the ongoing costs of investing in other mutual funds.
The Example is based on an investment of $1,000 invested at the beginning of the period and held for the entire period (May 1, 2007 to October 31, 2007).
Actual Expenses
The first line of the accompanying table for each class of the Fund provides information about actual account values and actual expenses. You may use the information in this line, together with the amount you invested, to estimate the expenses that you paid over the period. Simply divide your account value by $1,000.00 (for example, an $8,600 account value divided by $1,000.00 = 8.6), then multiply the result by the number in the first line for a class of the Fund under the heading entitled "Expenses Paid During Period" to estimate the expenses you paid on your account during this period. In addition, the Fund, as a shareholder in the underlying Fidelity Central Funds, will indirectly bear its pro rata share of the fees and expenses incurred by the underlying Fidelity Central Funds. These fees and expenses are not included in the Fund's annualized expense ratio used to calculate the expense estimate in the table below.
Hypothetical Example for Comparison Purposes
The second line of the accompanying table for each class of the Fund provides information about hypothetical account values and hypothetical expenses based on a Class' actual expense ratio and an assumed rate of return of 5% per year before expenses, which is not the Class' actual return. The hypothetical account values and expenses may not be used to estimate the actual ending account balance or expenses you paid for the period. You may use this information to compare the ongoing costs of investing in the Fund and other funds. To do so, compare this 5% hypothetical example with the 5% hypothetical examples that appear in the shareholder reports of the other funds. In addition, the Fund, as a shareholder in the underlying Fidelity Central Funds, will indirectly bear its pro rata share of the fees and expenses incurred by the underlying Fidelity Central Funds. These fees and expenses are not included in the Fund's annualized expense ratio used to calculate the expense estimate in the table below.
Annual Report
Please note that the expenses shown in the table are meant to highlight your ongoing costs only and do not reflect any transaction costs. Therefore, the second line of the table is useful in comparing ongoing costs only, and will not help you determine the relative total costs of owning different funds. In addition, if these transactional costs were included, your costs would have been higher.
| Beginning
Account Value
May 1, 2007 | Ending
Account Value
October 31, 2007 | Expenses Paid
During Period*
May 1, 2007
to October 31, 2007 |
Class A | | | |
Actual | $ 1,000.00 | $ 1,123.00 | $ 6.37 |
HypotheticalA | $ 1,000.00 | $ 1,019.21 | $ 6.06 |
Class T | | | |
Actual | $ 1,000.00 | $ 1,121.80 | $ 7.22 |
HypotheticalA | $ 1,000.00 | $ 1,018.40 | $ 6.87 |
Class B | | | |
Actual | $ 1,000.00 | $ 1,118.90 | $ 10.36 |
HypotheticalA | $ 1,000.00 | $ 1,015.43 | $ 9.86 |
Class C | | | |
Actual | $ 1,000.00 | $ 1,118.60 | $ 10.25 |
HypotheticalA | $ 1,000.00 | $ 1,015.53 | $ 9.75 |
Institutional Class | | | |
Actual | $ 1,000.00 | $ 1,124.60 | $ 4.61 |
HypotheticalA | $ 1,000.00 | $ 1,020.87 | $ 4.38 |
A 5% return per year before expenses
* Expenses are equal to each Class' annualized expense ratio (shown in the table below); multiplied by the average account value over the period, multiplied by 184/365 (to reflect the one-half year period).
| Annualized
Expense Ratio |
Class A | 1.19% |
Class T | 1.35% |
Class B | 1.94% |
Class C | 1.92% |
Institutional Class | .86% |
Annual Report
Investment Changes
Top Five Stocks as of October 31, 2007 |
| % of fund's
net assets | % of fund's net assets
6 months ago |
Alstom SA (France, Electrical Equipment) | 2.8 | 1.4 |
ABB Ltd. (Switzerland, Electrical Equipment) | 2.7 | 1.9 |
Vodafone Group PLC (United Kingdom, Wireless Telecommunication Services) | 1.6 | 1.2 |
Royal Dutch Shell PLC Class A (United Kingdom, Oil, Gas & Consumable Fuels) | 1.6 | 1.2 |
Siemens AG sponsored ADR (Germany, Industrial Conglomerates) | 1.6 | 1.4 |
| 10.3 | |
Top Five Market Sectors as of October 31, 2007 |
| % of fund's
net assets | % of fund's net assets
6 months ago |
Financials | 21.3 | 28.5 |
Industrials | 18.2 | 12.7 |
Consumer Discretionary | 10.2 | 13.3 |
Consumer Staples | 9.1 | 9.0 |
Materials | 8.0 | 6.2 |
Top Five Countries as of October 31, 2007 |
(excluding cash equivalents) | % of fund's
net assets | % of fund's net assets
6 months ago |
United Kingdom | 20.4 | 20.9 |
France | 15.3 | 11.9 |
Japan | 12.1 | 15.7 |
Germany | 11.5 | 11.9 |
Switzerland | 7.3 | 7.1 |
Percentages are adjusted for the effect of open futures contracts, if applicable. |
Asset Allocation (% of fund's net assets) |
As of October 31, 2007 | As of April 30, 2007 |
| Stocks 96.9% | | | Stocks 98.6% | |
| Short-Term
Investments and
Net Other Assets 3.1% | | | Short-Term
Investments and
Net Other Assets 1.4% | |

Annual Report
Investments October 31, 2007
Showing Percentage of Net Assets
Common Stocks - 96.5% |
| Shares | | Value (000s) |
Argentina - 0.3% |
Cresud S.A.C.I.F. y A. sponsored ADR | 167,700 | | $ 4,139 |
Australia - 6.7% |
AMP Ltd. | 332,700 | | 3,186 |
Australian Wealth Management Ltd. | 953,300 | | 2,465 |
Babcock & Brown Japan Property Trust | 1,065,300 | | 1,668 |
Babcock & Brown Ltd. | 76,700 | | 2,221 |
Babcock & Brown Wind Partners | 1,798,000 | | 3,094 |
BHP Billiton Ltd. | 321,400 | | 14,023 |
Charter Hall Group unit | 912,600 | | 2,604 |
Commonwealth Bank of Australia | 162,800 | | 9,376 |
Computershare Ltd. | 506,320 | | 4,082 |
CSL Ltd. | 702,006 | | 23,865 |
Gunns Ltd. | 587,200 | | 2,070 |
HFA Holdings Ltd. | 1,094,295 | | 2,637 |
Macquarie Bank Ltd. | 83,500 | | 6,669 |
McGuigan Simeon Wines Ltd. (a) | 614,691 | | 782 |
National Australia Bank Ltd. | 341,131 | | 13,801 |
Rio Tinto Ltd. | 30,300 | | 3,145 |
Seek Ltd. | 226,300 | | 1,981 |
WorleyParsons Ltd. | 113,729 | | 5,141 |
TOTAL AUSTRALIA | | 102,810 |
Austria - 0.3% |
Strabag SE (a) | 61,700 | | 4,844 |
Belgium - 1.0% |
Fortis | 90,300 | | 2,886 |
Hamon & Compagnie International SA (a) | 53,700 | | 3,582 |
InBev SA | 76,100 | | 7,184 |
KBC Groupe SA | 10,100 | | 1,415 |
TOTAL BELGIUM | | 15,067 |
Bermuda - 0.2% |
Aquarius Platinum Ltd. (United Kingdom) | 69,900 | | 2,678 |
Brazil - 0.3% |
Bovespa Holding SA (a) | 34,000 | | 648 |
Vivo Participacoes SA (PN) sponsored ADR (a) | 752,100 | | 4,430 |
TOTAL BRAZIL | | 5,078 |
British Virgin Islands - 0.1% |
Indochina Capital Vietnam Holdings Ltd. | 103,200 | | 1,006 |
Canada - 0.4% |
Cameco Corp. | 111,800 | | 5,512 |
Common Stocks - continued |
| Shares | | Value (000s) |
Denmark - 1.1% |
Novozymes AS Series B | 39,600 | | $ 4,310 |
Vestas Wind Systems AS (a) | 144,200 | | 12,865 |
TOTAL DENMARK | | 17,175 |
Finland - 1.1% |
Fortum Oyj | 81,000 | | 3,512 |
Neste Oil Oyj | 75,300 | | 2,707 |
Nokia Corp. | 278,500 | | 11,062 |
TOTAL FINLAND | | 17,281 |
France - 15.3% |
Alstom SA | 182,800 | | 43,142 |
AXA SA | 151,673 | | 6,784 |
BNP Paribas SA | 67,281 | | 7,417 |
Bouygues SA | 75,800 | | 7,277 |
Cap Gemini SA | 133,500 | | 8,510 |
Carrefour SA | 113,700 | | 8,185 |
CNP Assurances | 41,500 | | 5,290 |
Electricite de France | 92,900 | | 11,143 |
France Telecom SA | 58,300 | | 2,157 |
Gaz de France | 58,300 | | 3,311 |
Groupe Danone | 78,800 | | 6,797 |
Ingenico SA (d) | 137,800 | | 4,522 |
L'Air Liquide SA | 59,780 | | 8,250 |
L'Oreal SA | 66,934 | | 8,768 |
Michelin SA (Compagnie Generale des Etablissements)
Series B | 38,000 | | 5,089 |
Neopost SA | 18,900 | | 2,195 |
Pinault Printemps-Redoute SA | 31,300 | | 6,204 |
Remy Cointreau SA | 44,200 | | 3,397 |
Renault SA | 24,000 | | 4,030 |
Seche Environment SA | 7,600 | | 1,395 |
Societe Generale Series A | 53,270 | | 8,976 |
Sodexho Alliance SA | 76,300 | | 5,502 |
Suez SA (France) | 165,000 | | 10,725 |
Total SA: | | | |
Series B | 122,888 | | 9,906 |
sponsored ADR | 63,800 | | 5,143 |
Veolia Environnement | 247,275 | | 22,086 |
Vinci SA | 144,400 | | 11,845 |
Vivendi Universal SA | 166,500 | | 7,497 |
TOTAL FRANCE | | 235,543 |
Common Stocks - continued |
| Shares | | Value (000s) |
Germany - 11.1% |
Allianz AG (Reg.) | 44,700 | | $ 10,102 |
BASF AG | 12,900 | | 1,794 |
Bayer AG | 110,700 | | 9,122 |
Beiersdorf AG | 103,200 | | 8,180 |
Commerzbank AG | 187,700 | | 7,962 |
DaimlerChrysler AG | 56,100 | | 6,179 |
DaimlerChrysler AG (Reg.) | 59,300 | | 6,532 |
Deutsche Boerse AG | 55,700 | | 8,788 |
Deutsche Postbank AG | 35,800 | | 2,617 |
E.ON AG | 114,979 | | 22,455 |
ESCADA AG (a)(d) | 103,388 | | 4,244 |
GFK AG | 62,893 | | 2,539 |
Henkel KGaA | 107,811 | | 4,998 |
Hochtief AG | 51,200 | | 7,070 |
Lanxess AG | 93,000 | | 4,644 |
Metro AG | 46,900 | | 4,256 |
MLP AG (d) | 430,400 | | 5,706 |
MPC Muenchmeyer Petersen Capital AG | 22,800 | | 1,856 |
Muenchener Rueckversicherungs-Gesellschaft AG (Reg.) | 15,700 | | 3,012 |
Q-Cells AG (a) | 43,100 | | 5,489 |
SAP AG sponsored ADR (d) | 80,900 | | 4,391 |
SGL Carbon AG (a) | 171,400 | | 10,000 |
Siemens AG sponsored ADR | 177,200 | | 24,165 |
Wincor Nixdorf AG | 50,100 | | 4,976 |
TOTAL GERMANY | | 171,077 |
Hong Kong - 1.0% |
China Unicom Ltd. | 3,988,000 | | 9,779 |
China Unicom Ltd. sponsored ADR | 191,100 | | 4,686 |
Dynasty Fine Wines Group Ltd. | 714,000 | | 316 |
TOTAL HONG KONG | | 14,781 |
India - 0.1% |
IVRCL Infrastructures & Projects Ltd. | 130,000 | | 1,693 |
Power Finance Corp. Ltd. | 4,320 | | 27 |
TOTAL INDIA | | 1,720 |
Ireland - 0.1% |
Allied Irish Banks PLC | 87,500 | | 2,218 |
Italy - 2.8% |
Alleanza Assicurazioni SpA | 456,700 | | 6,183 |
Antichi Pellettieri SpA | 92,300 | | 1,270 |
Common Stocks - continued |
| Shares | | Value (000s) |
Italy - continued |
Assicurazioni Generali SpA | 145,750 | | $ 6,924 |
Edison SpA (d) | 1,001,700 | | 3,406 |
ENI SpA | 117,991 | | 4,311 |
Intesa Sanpaolo SpA | 574,600 | | 4,543 |
Lottomatica SpA (d) | 56,000 | | 2,002 |
MARR SpA | 122,400 | | 1,401 |
Saipem SpA | 77,300 | | 3,418 |
Unicredito Italiano SpA | 1,062,400 | | 9,081 |
TOTAL ITALY | | 42,539 |
Japan - 12.1% |
Canon, Inc. | 212,200 | | 10,731 |
Daiwa Securities Group, Inc. | 399,700 | | 3,853 |
Fujifilm Holdings Corp. | 112,000 | | 5,369 |
Ibiden Co. Ltd. | 69,500 | | 5,892 |
Japan Steel Works Ltd. | 280,000 | | 4,581 |
Japan Tobacco, Inc. | 1,029 | | 5,999 |
KDDI Corp. | 373 | | 2,818 |
Kinden Corp. | 253,000 | | 2,250 |
Konica Minolta Holdings, Inc. | 276,000 | | 4,833 |
Matsui Securities Co. Ltd. (d) | 251,700 | | 2,000 |
Millea Holdings, Inc. | 127,720 | | 5,014 |
Mitsubishi Corp. | 98,100 | | 3,055 |
Mitsubishi Electric Corp. | 197,000 | | 2,402 |
Mitsubishi Estate Co. Ltd. | 208,000 | | 6,237 |
Mitsui & Co. Ltd. | 145,000 | | 3,762 |
Mitsui Fudosan Co. Ltd. | 139,000 | | 3,846 |
Mizuho Financial Group, Inc. | 320 | | 1,799 |
Murata Manufacturing Co. Ltd. | 46,300 | | 2,818 |
Nafco Co. Ltd. | 61,100 | | 1,275 |
Namco Bandai Holdings, Inc. | 128,500 | | 1,982 |
NGK Insulators Ltd. | 244,000 | | 8,652 |
Nidec Corp. | 58,100 | | 4,366 |
Nintendo Co. Ltd. | 11,300 | | 7,096 |
Nippon Steel Corp. | 494,000 | | 3,284 |
Nomura Holdings, Inc. | 372,200 | | 6,636 |
Nomura Holdings, Inc. sponsored ADR | 37,000 | | 660 |
NSK Ltd. | 570,000 | | 5,055 |
NTT DoCoMo, Inc. | 3,235 | | 4,723 |
ORIX Corp. | 9,210 | | 1,890 |
Point, Inc. (d) | 45,360 | | 2,303 |
SHIMIZU Corp. | 367,000 | | 1,921 |
Common Stocks - continued |
| Shares | | Value (000s) |
Japan - continued |
Sompo Japan Insurance, Inc. | 198,700 | | $ 2,337 |
Sony Corp. | 37,700 | | 1,865 |
Sony Corp. sponsored ADR | 57,900 | | 2,864 |
Stanley Electric Co. Ltd. | 129,100 | | 2,872 |
Sumitomo Forestry Co. Ltd. | 216,000 | | 1,619 |
Sumitomo Metal Industries Ltd. | 688,000 | | 3,406 |
Sumitomo Mitsui Financial Group, Inc. | 1,785 | | 14,625 |
T&D Holdings, Inc. | 131,100 | | 7,892 |
Tokuyama Corp. | 224,000 | | 3,129 |
Toyota Motor Corp. | 271,500 | | 15,535 |
USS Co. Ltd. | 48,180 | | 3,157 |
TOTAL JAPAN | | 186,403 |
Korea (South) - 0.3% |
Doosan Heavy Industries & Construction Co. Ltd. | 29,670 | | 5,479 |
Luxembourg - 1.0% |
ArcelorMittal SA | 77,500 | | 6,220 |
ArcelorMittal SA (NY Shares) Class A | 56,800 | | 4,541 |
SES SA (A Shares) FDR unit | 213,304 | | 5,130 |
TOTAL LUXEMBOURG | | 15,891 |
Malaysia - 0.7% |
DiGi.com Bhd | 512,400 | | 3,859 |
Gamuda Bhd | 4,934,000 | | 6,803 |
TOTAL MALAYSIA | | 10,662 |
Netherlands - 3.5% |
ABN AMRO Holding NV | 98,110 | | 5,303 |
Heineken NV (Bearer) | 76,500 | | 5,340 |
ING Groep NV (Certificaten Van Aandelen) | 48,946 | | 2,202 |
Koninklijke Ahold NV sponsored ADR | 575,200 | | 8,657 |
Koninklijke KPN NV | 246,700 | | 4,654 |
Koninklijke Philips Electronics NV (NY Shares) | 269,000 | | 11,120 |
SBM Offshore NV | 192,900 | | 7,423 |
Unilever NV (NY Shares) | 265,500 | | 8,618 |
TOTAL NETHERLANDS | | 53,317 |
Norway - 1.5% |
Acta Holding ASA (d) | 577,400 | | 2,292 |
Aker Kvaerner ASA | 279,150 | | 9,727 |
Marine Harvest ASA (a) | 3,110,000 | | 3,153 |
Common Stocks - continued |
| Shares | | Value (000s) |
Norway - continued |
Petroleum Geo-Services ASA | 136,100 | | $ 4,007 |
StatoilHydro ASA | 119,200 | | 4,034 |
TOTAL NORWAY | | 23,213 |
Panama - 0.8% |
McDermott International, Inc. (a) | 198,600 | | 12,127 |
Portugal - 0.2% |
Energias de Portugal SA | 513,200 | | 3,301 |
South Africa - 1.2% |
Bell Equipment Ltd. | 197,322 | | 1,579 |
Exxaro Resources Ltd. | 244,600 | | 3,956 |
Impala Platinum Holdings Ltd. | 82,700 | | 3,105 |
JSE Ltd. | 303,700 | | 4,042 |
Murray & Roberts Holdings Ltd. | 348,500 | | 5,336 |
TOTAL SOUTH AFRICA | | 18,018 |
Spain - 1.7% |
Banco Santander Central Hispano SA sponsored ADR | 328,100 | | 7,123 |
Telefonica SA | 495,148 | | 16,414 |
Telefonica SA sponsored ADR | 28,000 | | 2,785 |
TOTAL SPAIN | | 26,322 |
Sweden - 1.8% |
Scania AB (B Shares) | 272,700 | | 7,447 |
Skandinaviska Enskilda Banken AB (A Shares) | 133,000 | | 4,071 |
Svenska Cellulosa AB (SCA) (B Shares) | 254,400 | | 4,484 |
Swedish Match Co. | 400,600 | | 8,953 |
Telefonaktiebolaget LM Ericsson (B Shares) sponsored ADR | 95,200 | | 2,861 |
TOTAL SWEDEN | | 27,816 |
Switzerland - 7.3% |
ABB Ltd.: | | | |
(Reg.) | 851,342 | | 25,607 |
sponsored ADR | 530,400 | | 16,029 |
Compagnie Financiere Richemont unit | 105,445 | | 7,524 |
Credit Suisse Group (Reg.) | 19,410 | | 1,314 |
EFG International | 60,660 | | 2,836 |
Julius Baer Holding AG (Bearer) | 96,693 | | 8,365 |
Nestle SA (Reg.) | 28,324 | | 13,086 |
Roche Holding AG (participation certificate) | 91,397 | | 15,620 |
Schindler Holding AG (Reg.) | 38,456 | | 2,653 |
SGS Societe Generale de Surveillance Holding SA (Reg.) | 8,035 | | 10,530 |
Common Stocks - continued |
| Shares | | Value (000s) |
Switzerland - continued |
Sonova Holding AG | 35,504 | | $ 3,985 |
UBS AG (Reg.) | 53,543 | | 2,875 |
Zurich Financial Services AG (Reg.) | 7,048 | | 2,122 |
TOTAL SWITZERLAND | | 112,546 |
Thailand - 0.2% |
Bangkok Bank Ltd. PCL (For. Reg.) | 281,900 | | 1,063 |
Krung Thai Bank Public Co. Ltd. | 2,697,800 | | 911 |
Siam Commercial Bank PCL (For. Reg.) | 473,200 | | 1,323 |
TOTAL THAILAND | | 3,297 |
United Kingdom - 20.4% |
Aegis Group PLC | 1,076,000 | | 2,819 |
Alfred McAlpine Group PLC | 202,800 | | 2,359 |
Anglo American PLC: | | | |
ADR | 98,046 | | 3,427 |
(United Kingdom) | 113,659 | | 7,831 |
Barclays PLC | 295,600 | | 3,758 |
BG Group PLC | 600,500 | | 11,079 |
BHP Billiton PLC | 278,202 | | 10,590 |
BP PLC | 1,607,708 | | 20,898 |
BP PLC sponsored ADR | 19,700 | | 1,536 |
British American Tobacco PLC | 156,900 | | 6,016 |
BT Group PLC | 103,000 | | 701 |
BT Group PLC sponsored ADR | 36,900 | | 2,513 |
Burberry Group PLC | 222,800 | | 2,849 |
Cadbury Schweppes PLC sponsored ADR | 84,200 | | 4,483 |
Climate Exchange PLC (a) | 42,200 | | 1,052 |
Diageo PLC | 486,900 | | 11,168 |
GlaxoSmithKline PLC | 564,900 | | 14,476 |
Gyrus Group PLC (a) | 567,200 | | 5,041 |
HBOS plc | 272,800 | | 4,951 |
HSBC Holdings PLC: | | | |
(Hong Kong) (Reg.) | 150,400 | | 2,994 |
(United Kingdom) (Reg.) | 343,567 | | 6,838 |
sponsored ADR | 122,700 | | 12,211 |
Imperial Tobacco Group PLC sponsored ADR | 4,300 | | 437 |
Informa PLC | 217,500 | | 2,419 |
InterContinental Hotel Group PLC | 146,573 | | 3,413 |
International Power PLC | 1,006,500 | | 10,233 |
Intertek Group PLC | 233,700 | | 5,000 |
Jardine Lloyd Thompson Group PLC | 795,200 | | 6,332 |
Common Stocks - continued |
| Shares | | Value (000s) |
United Kingdom - continued |
Lloyds TSB Group PLC | 119,000 | | $ 1,350 |
M&C Saatchi | 500,100 | | 1,544 |
Man Group plc | 1,937,182 | | 23,682 |
Misys PLC | 109,500 | | 550 |
Prudential PLC | 656,200 | | 10,669 |
Reed Elsevier PLC | 1,037,700 | | 13,549 |
Reuters Group PLC | 610,100 | | 8,463 |
Rio Tinto PLC (Reg.) | 71,618 | | 6,714 |
Royal Bank of Scotland Group PLC | 554,400 | | 5,953 |
Royal Dutch Shell PLC: | | | |
Class A sponsored ADR | 163,000 | | 14,264 |
Class A (United Kingdom) | 232,600 | | 10,180 |
Class B | 65,800 | | 2,871 |
RPS Group PLC | 410,600 | | 3,325 |
Speymill Group PLC (a) | 309,000 | | 610 |
SSL International PLC | 158,300 | | 1,695 |
Taylor Nelson Sofres PLC | 1,741,300 | | 7,802 |
Tesco PLC | 496,000 | | 5,084 |
Vodafone Group PLC | 5,823,569 | | 22,869 |
Vodafone Group PLC sponsored ADR | 43,400 | | 1,704 |
Xstrata PLC | 50,266 | | 3,602 |
TOTAL UNITED KINGDOM | | 313,904 |
United States of America - 1.9% |
ADA-ES, Inc. (a) | 71,200 | | 797 |
Alexander & Baldwin, Inc. | 59,000 | | 3,090 |
American Superconductor Corp. (a)(d) | 70,000 | | 1,901 |
Calgon Carbon Corp. (a)(d) | 671,000 | | 9,998 |
Fluor Corp. | 20,900 | | 3,302 |
Fuel Tech, Inc. (a)(d) | 106,100 | | 3,137 |
Hypercom Corp. (a) | 258,800 | | 1,400 |
Sunpower Corp. Class A (a) | 48,400 | | 6,121 |
TOTAL UNITED STATES OF AMERICA | | 29,746 |
TOTAL COMMON STOCKS (Cost $1,092,404) | 1,485,510 |
Nonconvertible Preferred Stocks - 0.4% |
| | | |
Germany - 0.4% |
Porsche AG
(Cost $2,858) | 2,549 | | 6,791 |
Money Market Funds - 3.1% |
| Shares | | Value (000s) |
Fidelity Cash Central Fund, 4.97% (b) | 33,119,692 | | $ 33,120 |
Fidelity Securities Lending Cash Central Fund, 5.02% (b)(c) | 14,007,687 | | 14,008 |
TOTAL MONEY MARKET FUNDS (Cost $47,128) | 47,128 |
TOTAL INVESTMENT PORTFOLIO - 100.0% (Cost $1,142,390) | | 1,539,429 |
NET OTHER ASSETS - 0.0% | | (161) |
NET ASSETS - 100% | $ 1,539,268 |
Legend |
(a) Non-income producing |
(b) Affiliated fund that is available only to investment companies and other accounts managed by Fidelity Investments. The rate quoted is the annualized seven-day yield of the fund at period end. A complete unaudited listing of the fund's holdings as of its most recent quarter end is available upon request. |
(c) Investment made with cash collateral received from securities on loan. |
(d) Security or a portion of the security is on loan at period end. |
Affiliated Central Funds |
Information regarding fiscal year to date income earned by the Fund from investments in Fidelity Central Funds is as follows: |
Fund | Income earned
(Amounts in thousands) |
Fidelity Cash Central Fund | $ 1,611 |
Fidelity Securities Lending Cash Central Fund | 1,101 |
Total | $ 2,712 |
See accompanying notes which are an integral part of the financial statements.
Annual Report
Financial Statements
Statement of Assets and Liabilities
Amounts in thousands (except per-share amounts) | October 31, 2007 |
| | |
Assets | | |
Investment in securities, at value (including securities loaned of $13,512) - See accompanying schedule: Unaffiliated issuers (cost $1,095,262) | $ 1,492,301 | |
Fidelity Central Funds (cost $47,128) | 47,128 | |
Total Investments (cost $1,142,390) | | $ 1,539,429 |
Cash | | 1,564 |
Foreign currency held at value (cost $157) | | 158 |
Receivable for investments sold | | 19,052 |
Receivable for fund shares sold | | 1,433 |
Dividends receivable | | 1,901 |
Distributions receivable from Fidelity Central Funds | | 171 |
Other receivables | | 199 |
Total assets | | 1,563,907 |
| | |
Liabilities | | |
Payable for investments purchased | $ 6,336 | |
Payable for fund shares redeemed | 2,685 | |
Accrued management fee | 788 | |
Distribution fees payable | 376 | |
Other affiliated payables | 317 | |
Other payables and accrued expenses | 129 | |
Collateral on securities loaned, at value | 14,008 | |
Total liabilities | | 24,639 |
| | |
Net Assets | | $ 1,539,268 |
Net Assets consist of: | | |
Paid in capital | | $ 1,017,548 |
Undistributed net investment income | | 16,730 |
Accumulated undistributed net realized gain (loss) on investments and foreign currency transactions | | 108,013 |
Net unrealized appreciation (depreciation) on investments and assets and liabilities in foreign currencies | | 396,977 |
Net Assets | | $ 1,539,268 |
See accompanying notes which are an integral part of the financial statements.
Annual Report
Statement of Assets and Liabilities - continued
Amounts in thousands (except per-share amounts) | October 31, 2007 |
| | |
Calculation of Maximum Offering Price
Class A:
Net Asset Value and redemption price per share ($146,636 ÷ 5,460.8 shares) | | $ 26.85 |
| | |
Maximum offering price per share (100/94.25 of $26.85) | | $ 28.49 |
Class T:
Net Asset Value and redemption price per share ($710,179 ÷ 25,963.0 shares) | | $ 27.35 |
| | |
Maximum offering price per share (100/96.50 of $27.35) | | $ 28.34 |
Class B:
Net Asset Value and offering price per share ($27,098 ÷ 1,050.7 shares)A | | $ 25.79 |
| | |
Class C:
Net Asset Value and offering price per share ($45,931 ÷ 1,751.7 shares)A | | $ 26.22 |
| | |
Institutional Class:
Net Asset Value, offering price and redemption price per share ($609,424 ÷ 22,280.6 shares) | | $ 27.35 |
A Redemption price per share is equal to net asset value less any applicable contingent deferred sales charge.
See accompanying notes which are an integral part of the financial statements.
Annual Report
Financial Statements - continued
Statement of Operations
Amounts in thousands | Year ended October 31, 2007 |
| | |
Investment Income | | |
Dividends | | $ 32,277 |
Interest | | 23 |
Income from Fidelity Central Funds | | 2,712 |
| | 35,012 |
Less foreign taxes withheld | | (2,596) |
Total income | | 32,416 |
| | |
Expenses | | |
Management fee
Basic fee | $ 9,302 | |
Performance adjustment | (2,297) | |
Transfer agent fees | 3,010 | |
Distribution fees | 4,312 | |
Accounting and security lending fees | 609 | |
Custodian fees and expenses | 276 | |
Independent trustees' compensation | 5 | |
Registration fees | 88 | |
Audit | 96 | |
Legal | 22 | |
Miscellaneous | 19 | |
Total expenses before reductions | 15,442 | |
Expense reductions | (425) | 15,017 |
Net investment income (loss) | | 17,399 |
Realized and Unrealized Gain (Loss) Net realized gain (loss) on: | | |
Investment securities: | | |
Unaffiliated issuers (net of foreign taxes of $162) | 114,111 | |
Foreign currency transactions | 92 | |
Total net realized gain (loss) | | 114,203 |
Change in net unrealized appreciation (depreciation) on: Investment securities (net of decrease in deferred foreign taxes of $203) | 232,130 | |
Assets and liabilities in foreign currencies | (27) | |
Total change in net unrealized appreciation (depreciation) | | 232,103 |
Net gain (loss) | | 346,306 |
Net increase (decrease) in net assets resulting from operations | | $ 363,705 |
See accompanying notes which are an integral part of the financial statements.
Annual Report
Statement of Changes in Net Assets
Amounts in thousands | Year ended
October 31,
2007 | Year ended
October 31,
2006 |
Increase (Decrease) in Net Assets | | |
Operations | | |
Net investment income (loss) | $ 17,399 | $ 14,401 |
Net realized gain (loss) | 114,203 | 69,279 |
Change in net unrealized appreciation (depreciation) | 232,103 | 140,902 |
Net increase (decrease) in net assets resulting
from operations | 363,705 | 224,582 |
Distributions to shareholders from net investment income | (11,581) | (8,558) |
Distributions to shareholders from net realized gain | (55,423) | (17,171) |
Total distributions | (67,004) | (25,729) |
Share transactions - net increase (decrease) | 96,150 | (138,085) |
Redemption fees | 58 | 72 |
Total increase (decrease) in net assets | 392,909 | 60,840 |
| | |
Net Assets | | |
Beginning of period | 1,146,359 | 1,085,519 |
End of period (including undistributed net investment income of $16,730 and undistributed net investment income of $13,279, respectively) | $ 1,539,268 | $ 1,146,359 |
See accompanying notes which are an integral part of the financial statements.
Annual Report
Financial Highlights - Class A
Years Ended October 31, | 2007 | 2006 | 2005 | 2004 | 2003 |
Selected Per-Share Data | | | | | |
Net asset value, beginning of period | $ 21.67 | $ 18.36 | $ 15.86 | $ 14.41 | $ 11.01 |
Income from Investment Operations | | | | | |
Net investment income (loss) C | .31 | .27 | .13 | .04 F | .05 |
Net realized and unrealized gain (loss) | 6.16 | 3.53 | 2.47 | 1.54 | 3.35 |
Total from investment operations | 6.47 | 3.80 | 2.60 | 1.58 | 3.40 |
Distributions from net investment income | (.23) | (.19) | (.04) | (.13) | - |
Distributions from net realized gain | (1.06) | (.30) | (.06) | - | - |
Total distributions | (1.29) | (.49) | (.10) | (.13) | - |
Redemption fees added to paid in capital C | - H | - H | - H | - H | - |
Net asset value, end of period | $ 26.85 | $ 21.67 | $ 18.36 | $ 15.86 | $ 14.41 |
Total Return A,B | 31.44% | 21.12% | 16.44% | 11.03% | 30.88% |
Ratios to Average Net Assets D,G | | | | | |
Expenses before reductions | 1.17% | 1.24% | 1.24% | 1.36% | 1.34% |
Expenses net of fee waivers,
if any | 1.17% | 1.24% | 1.24% | 1.36% | 1.34% |
Expenses net of all reductions | 1.13% | 1.17% | 1.15% | 1.32% | 1.30% |
Net investment income (loss) | 1.34% | 1.31% | .76% | .24% F | .43% |
Supplemental Data | | | | | |
Net assets, end of period (in millions) | $ 147 | $ 113 | $ 133 | $ 115 | $ 68 |
Portfolio turnover rate E | 66% | 65% | 120% | 85% | 99% |
A Total returns would have been lower had certain expenses not been reduced during the periods shown.
B Total returns do not include the effect of the sales charges.
C Calculated based on average shares outstanding during the period.
D Fees and expenses of the underlying Fidelity Central Funds are not included in the Fund's expense ratio. The Fund indirectly bears its proportionate share of the expenses of any underlying Fidelity Central Funds.
E Amount does not include the portfolio activity of any underlying Fidelity Central Funds.
F Net investment income per share includes approximately $.01 per share received as a result of a reorganization of an issuer that was in bankruptcy. Excluding this non-recurring amount, the ratio of net investment income (loss) to average net assets would have been .21%.
G Expense ratios reflect operating expenses of the class. Expenses before reductions do not reflect amounts reimbursed by the investment adviser or reductions from brokerage service arrangements or other expense offset arrangements and do not represent the amount paid by the class during periods when reimbursements or reductions occur. Expenses net of fee waivers reflect expenses after reimbursement by the investment adviser but prior to reductions from brokerage service arrangements or other expense offset arrangements. Expenses net of all reductions represent the net expenses paid by the class.
H Amount represents less than $.01 per share.
See accompanying notes which are an integral part of the financial statements.
Annual Report
Financial Highlights - Class T
Years Ended October 31, | 2007 | 2006 | 2005 | 2004 | 2003 |
Selected Per-Share Data | | | | | |
Net asset value, beginning of period | $ 22.05 | $ 18.64 | $ 16.09 | $ 14.61 | $ 11.18 |
Income from Investment Operations | | | | | |
Net investment income (loss) C | .28 | .24 | .11 | .02 F | .04 |
Net realized and unrealized gain (loss) | 6.27 | 3.59 | 2.51 | 1.56 | 3.39 |
Total from investment operations | 6.55 | 3.83 | 2.62 | 1.58 | 3.43 |
Distributions from net investment income | (.19) | (.12) | (.01) | (.10) | - |
Distributions from net realized gain | (1.06) | (.30) | (.06) | - | - |
Total distributions | (1.25) | (.42) | (.07) | (.10) | - |
Redemption fees added to paid in capital C | - H | - H | - H | - H | - |
Net asset value, end of period | $ 27.35 | $ 22.05 | $ 18.64 | $ 16.09 | $ 14.61 |
Total Return A,B | 31.24% | 20.92% | 16.31% | 10.86% | 30.68% |
Ratios to Average Net Assets D,G | | | | | |
Expenses before reductions | 1.33% | 1.39% | 1.36% | 1.48% | 1.46% |
Expenses net of fee waivers,
if any | 1.33% | 1.39% | 1.36% | 1.48% | 1.46% |
Expenses net of all reductions | 1.30% | 1.33% | 1.27% | 1.43% | 1.42% |
Net investment income (loss) | 1.17% | 1.15% | .64% | .12% F | .31% |
Supplemental Data | | | | | |
Net assets, end of period (in millions) | $ 710 | $ 602 | $ 582 | $ 1,181 | $ 1,114 |
Portfolio turnover rate E | 66% | 65% | 120% | 85% | 99% |
A Total returns would have been lower had certain expenses not been reduced during the periods shown.
B Total returns do not include the effect of the sales charges.
C Calculated based on average shares outstanding during the period.
D Fees and expenses of the underlying Fidelity Central Funds are not included in the Fund's expense ratio. The Fund indirectly bears its proportionate share of the expenses of any underlying Fidelity Central Funds.
E Amount does not include the portfolio activity of any underlying Fidelity Central Funds.
F Net investment income per share includes approximately $.01 per share received as a result of a reorganization of an issuer that was in bankruptcy. Excluding this non-recurring amount, the ratio of net investment income (loss) to average net assets would have been .09%.
G Expense ratios reflect operating expenses of the class. Expenses before reductions do not reflect amounts reimbursed by the investment adviser or reductions from brokerage service arrangements or other expense offset arrangements and do not represent the amount paid by the class during periods when reimbursements or reductions occur. Expenses net of fee waivers reflect expenses after reimbursement by the investment adviser but prior to reductions from brokerage service arrangements or other expense offset arrangements. Expenses net of all reductions represent the net expenses paid by the class.
H Amount represents less than $.01 per share.
See accompanying notes which are an integral part of the financial statements.
Annual Report
Financial Highlights - Class B
Years Ended October 31, | 2007 | 2006 | 2005 | 2004 | 2003 |
Selected Per-Share Data | | | | | |
Net asset value, beginning of period | $ 20.81 | $ 17.63 | $ 15.26 | $ 13.87 | $ 10.71 |
Income from Investment Operations | | | | | |
Net investment income (loss) C | .12 | .10 | (.01) | (.10) F | (.06) |
Net realized and unrealized gain (loss) | 5.94 | 3.40 | 2.38 | 1.50 | 3.22 |
Total from investment operations | 6.06 | 3.50 | 2.37 | 1.40 | 3.16 |
Distributions from net investment income | (.02) | (.02) | - | (.01) | - |
Distributions from net realized gain | (1.06) | (.30) | - | - | - |
Total distributions | (1.08) | (.32) | - | (.01) | - |
Redemption fees added to paid in capital C | - H | - H | - H | - H | - |
Net asset value, end of period | $ 25.79 | $ 20.81 | $ 17.63 | $ 15.26 | $ 13.87 |
Total Return A,B | 30.45% | 20.12% | 15.53% | 10.10% | 29.51% |
Ratios to Average Net Assets D,G | | | | | |
Expenses before reductions | 1.94% | 2.05% | 2.04% | 2.25% | 2.27% |
Expenses net of fee waivers,
if any | 1.94% | 2.05% | 2.04% | 2.25% | 2.27% |
Expenses net of all reductions | 1.91% | 1.99% | 1.95% | 2.21% | 2.22% |
Net investment income (loss) | .56% | .49% | (.04)% | (.65)% F | (.49)% |
Supplemental Data | | | | | |
Net assets, end of period (in millions) | $ 27 | $ 37 | $ 47 | $ 57 | $ 59 |
Portfolio turnover rate E | 66% | 65% | 120% | 85% | 99% |
A Total returns would have been lower had certain expenses not been reduced during the periods shown.
B Total returns do not include the effect of the contingent deferred sales charge.
C Calculated based on average shares outstanding during the period.
D Fees and expenses of the underlying Fidelity Central Funds are not included in the Fund's expense ratio. The Fund indirectly bears its proportionate share of the expenses of any underlying Fidelity Central Funds.
E Amount does not include the portfolio activity of any underlying Fidelity Central Funds.
F Net investment income per share includes approximately $.01 per share received as a result of a reorganization of an issuer that was in bankruptcy. Excluding this non-recurring amount, the ratio of net investment income (loss) to average net assets would have been (.68)%.
G Expense ratios reflect operating expenses of the class. Expenses before reductions do not reflect amounts reimbursed by the investment adviser or reductions from brokerage service arrangements or other expense offset arrangements and do not represent the amount paid by the class during periods when reimbursements or reductions occur. Expenses net of fee waivers reflect expenses after reimbursement by the investment adviser but prior to reductions from brokerage service arrangements or other expense offset arrangements. Expenses net of all reductions represent the net expenses paid by the class.
H Amount represents less than $.01 per share.
See accompanying notes which are an integral part of the financial statements.
Annual Report
Financial Highlights - Class C
Years Ended October 31, | 2007 | 2006 | 2005 | 2004 | 2003 |
Selected Per-Share Data | | | | | |
Net asset value, beginning of period | $ 21.19 | $ 17.95 | $ 15.53 | $ 14.11 | $ 10.88 |
Income from Investment Operations | | | | | |
Net investment income (loss) C | .14 | .11 | - H | (.08) F | (.05) |
Net realized and unrealized gain (loss) | 6.02 | 3.47 | 2.42 | 1.52 | 3.28 |
Total from investment operations | 6.16 | 3.58 | 2.42 | 1.44 | 3.23 |
Distributions from net investment income | (.07) | (.04) | - | (.02) | - |
Distributions from net realized gain | (1.06) | (.30) | - | - | - |
Total distributions | (1.13) | (.34) | - | (.02) | - |
Redemption fees added to paid in capital C | - H | - H | - H | - H | - |
Net asset value, end of period | $ 26.22 | $ 21.19 | $ 17.95 | $ 15.53 | $ 14.11 |
Total Return A,B | 30.48% | 20.22% | 15.58% | 10.21% | 29.69% |
Ratios to Average Net Assets D,G | | | | | |
Expenses before reductions | 1.91% | 1.98% | 2.00% | 2.14% | 2.17% |
Expenses net of fee waivers,
if any | 1.91% | 1.98% | 2.00% | 2.14% | 2.17% |
Expenses net of all reductions | 1.87% | 1.92% | 1.90% | 2.10% | 2.13% |
Net investment income (loss) | .60% | .56% | .01% | (.54)% F | (.40)% |
Supplemental Data | | | | | |
Net assets, end of period (in millions) | $ 46 | $ 41 | $ 38 | $ 40 | $ 41 |
Portfolio turnover rate E | 66% | 65% | 120% | 85% | 99% |
A Total returns would have been lower had certain expenses not been reduced during the periods shown.
B Total returns do not include the effect of the contingent deferred sales charge.
C Calculated based on average shares outstanding during the period.
D Fees and expenses of the underlying Fidelity Central Funds are not included in the Fund's expense ratio. The Fund indirectly bears its proportionate share of the expenses of any underlying Fidelity Central Funds.
E Amount does not include the portfolio activity of any underlying Fidelity Central Funds.
F Net investment income per share includes approximately $.01 per share received as a result of a reorganization of an issuer that was in bankruptcy. Excluding this non-recurring amount, the ratio of net investment income (loss) to average net assets would have been (.57)%.
G Expense ratios reflect operating expenses of the class. Expenses before reductions do not reflect amounts reimbursed by the investment adviser or reductions from brokerage service arrangements or other expense offset arrangements and do not represent the amount paid by the class during periods when reimbursements or reductions occur. Expenses net of fee waivers reflect expenses after reimbursement by the investment adviser but prior to reductions from brokerage service arrangements or other expense offset arrangements. Expenses net of all reductions represent the net expenses paid by the class.
H Amount represents less than $.01 per share.
See accompanying notes which are an integral part of the financial statements.
Annual Report
Financial Highlights - Institutional Class
Years Ended October 31, | 2007 | 2006 | 2005 | 2004 | 2003 |
Selected Per-Share Data | | | | | |
Net asset value, beginning of period | $ 22.06 | $ 18.64 | $ 16.09 | $ 14.60 | $ 11.11 |
Income from Investment Operations | | | | | |
Net investment income (loss) B | .40 | .35 | .21 | .10 E | .10 |
Net realized and unrealized gain (loss) | 6.26 | 3.58 | 2.50 | 1.56 | 3.39 |
Total from investment operations | 6.66 | 3.93 | 2.71 | 1.66 | 3.49 |
Distributions from net investment income | (.31) | (.21) | (.10) | (.17) | - |
Distributions from net realized gain | (1.06) | (.30) | (.06) | - | - |
Total distributions | (1.37) | (.51) | (.16) | (.17) | - |
Redemption fees added to paid in capital B | - G | - G | - G | - G | - |
Net asset value, end of period | $ 27.35 | $ 22.06 | $ 18.64 | $ 16.09 | $ 14.60 |
Total Return A | 31.88% | 21.55% | 16.91% | 11.46% | 31.41% |
Ratios to Average Net Assets C,F | | | | | |
Expenses before reductions | .84% | .87% | .83% | .98% | .93% |
Expenses net of fee waivers, if any | .84% | .87% | .83% | .98% | .93% |
Expenses net of all reductions | .81% | .81% | .73% | .93% | .89% |
Net investment income (loss) | 1.66% | 1.67% | 1.18% | .62% E | .84% |
Supplemental Data | | | | | |
Net assets, end of period (in millions) | $ 609 | $ 354 | $ 287 | $ 194 | $ 69 |
Portfolio turnover rate D | 66% | 65% | 120% | 85% | 99% |
A Total returns would have been lower had certain expenses not been reduced during the periods shown.
B Calculated based on average shares outstanding during the period.
C Fees and expenses of the underlying Fidelity Central Funds are not included in the Fund's expense ratio. The Fund indirectly bears its proportionate share of the expenses of any underlying Fidelity Central Funds.
D Amount does not include the portfolio activity of any underlying Fidelity Central Funds.
E Net investment income per share includes approximately $.01 per share received as a result of a reorganization of an issuer that was in bankruptcy. Excluding this non-recurring amount, the ratio of net investment income (loss) to average net assets would have been .59%.
F Expense ratios reflect operating expenses of the class. Expenses before reductions do not reflect amounts reimbursed by the investment adviser or reductions from brokerage service arrangements or other expense offset arrangements and do not represent the amount paid by the class during periods when reimbursements or reductions occur. Expenses net of fee waivers reflect expenses after reimbursement by the investment adviser but prior to reductions from brokerage service arrangements or other expense offset arrangements. Expenses net of all reductions represent the net expenses paid by the class.
G Amount represents less than $.01 per share.
See accompanying notes which are an integral part of the financial statements.
Annual Report
Notes to Financial Statements
For the period ended October 31, 2007
(Amounts in thousands except ratios)
1. Organization.
Fidelity Advisor Overseas Fund (the Fund) is a fund of Fidelity Advisor Series VIII (the trust) and is authorized to issue an unlimited number of shares. The trust is registered under the Investment Company Act of 1940, as amended (the 1940 Act), as an open-end management investment company organized as a Massachusetts business trust.
The Fund offers Class A, Class T, Class B, Class C, and Institutional Class shares, each of which has equal rights as to assets and voting privileges. Each class has exclusive voting rights with respect to matters that affect that class. Class B shares will automatically convert to Class A shares after a holding period of seven years from the initial date of purchase. Investment income, realized and unrealized capital gains and losses, the common expenses of the Fund, and certain fund-level expense reductions, if any, are allocated on a pro rata basis to each class based on the relative net assets of each class to the total net assets of the Fund. Each class differs with respect to transfer agent and distribution and service plan fees incurred. Certain expense reductions also differ by class. The Fund's investments in emerging markets can be subject to social, economic, regulatory, and political uncertainties and can be extremely volatile.
2. Investments in Fidelity Central Funds.
The Fund may invest in Fidelity Central Funds, which are open-end investment companies available only to other investment companies and accounts managed by Fidelity Management & Research Company (FMR) and its affiliates. The Fund's Schedule of Investments lists each of the Fidelity Central Funds as an investment of the Fund, but does not include the underlying holdings of each Fidelity Central Fund. As an Investing Fund, the Fund indirectly bears its proportionate share of the expenses of the underlying Fidelity Central Funds.
The Money Market Central Funds seek preservation of capital and current income and are managed by Fidelity Investments Money Management, Inc. (FIMM), an affiliate of FMR.
A complete list of holdings for each Fidelity Central Fund is available upon request or at the SEC's web site at www.sec.gov. In addition, the financial statements of the Fidelity Central Funds, which are not covered by the Fund's Report of Independent Registered Public Accounting Firm, are available on the SEC's web site or upon request.
3. Significant Accounting Policies.
The financial statements have been prepared in conformity with accounting principles generally accepted in the United States of America, which require management to make certain estimates and assumptions at the date of the financial statements. The following summarizes the significant accounting policies of the Fund:
Annual Report
Notes to Financial Statements - continued
(Amounts in thousands except ratios)
3. Significant Accounting Policies - continued
Security Valuation. Investments are valued and net asset value (NAV) per share is calculated (NAV calculation) as of the close of business of the New York Stock Exchange (NYSE), normally 4:00 p.m. Eastern time. Wherever possible, the Fund uses independent pricing services approved by the Board of Trustees to value its investments.
Equity securities, including restricted securities, for which market quotations are readily available, are valued at the last reported sale price or official closing price as reported by an independent pricing service on the primary market or exchange on which they are traded. In the event there were no sales during the day or closing prices are not available, securities are valued at the last quoted bid price. Investments in open-end mutual funds, including the Fidelity Central Funds, are valued at their closing net asset value each business day. Short-term securities with remaining maturities of sixty days or less for which quotations are not readily available are valued at amortized cost, which approximates value.
When current market prices or quotations are not readily available or do not accurately reflect fair value, valuations may be determined in accordance with procedures adopted by the Board of Trustees. For example, when developments occur between the close of a market and the close of the NYSE that may materially affect the value of some or all of the securities, or when trading in a security is halted, those securities may be fair valued. Factors used in the determination of fair value may include monitoring news to identify significant market or security specific events such as changes in the value of U.S. securities markets, reviewing developments in foreign markets and evaluating the performance of ADRs, futures contracts and exchange-traded funds. Because the Fund's utilization of fair value pricing depends on market activity, the frequency with which fair value pricing is used cannot be predicted and may be utilized to a significant extent. The value of securities used for NAV calculation under fair value pricing may differ from published prices for the same securities.
Foreign Currency. The Fund uses foreign currency contracts to facilitate transactions in foreign-denominated securities. Losses from these transactions may arise from changes in the value of the foreign currency or if the counterparties do not perform under the contracts' terms.
Foreign-denominated assets, including investment securities, and liabilities are translated into U.S. dollars at the exchange rate at period end. Purchases and sales of investment securities, income and dividends received and expenses denominated in foreign currencies are translated into U.S. dollars at the exchange rate in effect on the transaction date.
Annual Report
3. Significant Accounting Policies - continued
Foreign Currency - continued
The effects of exchange rate fluctuations on investments are included with the net realized and unrealized gain (loss) on investment securities. Other foreign currency transactions resulting in realized and unrealized gain (loss) are disclosed separately.
Investment Transactions and Income. For financial reporting purposes, the Fund's investment holdings and NAV include trades executed through the end of the last business day of the period. The NAV for processing shareholder transactions includes trades executed through the end of the prior business day. Gains and losses on securities sold are determined on the basis of identified cost and may include proceeds received from litigation. Dividend income is recorded on the ex-dividend date, except for certain dividends from foreign securities where the ex-dividend date may have passed, which are recorded as soon as the Fund is informed of the ex-dividend date. Non-cash dividends included in dividend income, if any, are recorded at the fair market value of the securities received. Interest income and distributions from the Fidelity Central Funds are accrued as earned. Interest income includes coupon interest and amortization of premium and accretion of discount on debt securities. Investment income is recorded net of foreign taxes withheld where recovery of such taxes is uncertain.
Expenses. Most expenses of the trust can be directly attributed to a fund. Expenses which cannot be directly attributed are apportioned among each Fund in the trust. Expense estimates are accrued in the period to which they relate and adjustments are made when actual amounts are known.
Income Tax Information and Distributions to Shareholders. Each year, the Fund intends to qualify as a regulated investment company by distributing all of its taxable income and realized gains under Subchapter M of the Internal Revenue Code. As a result, no provision for income taxes is required in the accompanying financial statements. Foreign taxes are provided for based on the Fund's understanding of the tax rules and rates that exist in the foreign markets in which it invests.
Distributions are recorded on the ex-dividend date. Income dividends and capital gain distributions are declared separately for each class. Income and capital gain distributions are determined in accordance with income tax regulations, which may differ from generally accepted accounting principles. In addition, the Fund will claim a portion of the payment made to redeeming shareholders as a distribution for income tax purposes.
Annual Report
Notes to Financial Statements - continued
(Amounts in thousands except ratios)
3. Significant Accounting Policies - continued
Income Tax Information and Distributions to Shareholders - continued
Capital accounts within the financial statements are adjusted for permanent book-tax differences. These adjustments have no impact on net assets or the results of operations. Temporary book-tax differences will reverse in a subsequent period.
Book-tax differences are primarily due to foreign currency transactions, certain foreign taxes, passive foreign investment companies (PFIC), deferred trustees compensation and losses deferred due to wash sales.
The tax-basis components of distributable earnings and the federal tax cost as of period end were as follows:
Unrealized appreciation | $ 416,168 | |
Unrealized depreciation | (24,449) | |
Net unrealized appreciation (depreciation) | 391,719 | |
Undistributed ordinary income | 23,976 | |
Undistributed long-term capital gain | 91,136 | |
| | |
Cost for federal income tax purposes | $ 1,147,710 | |
The tax character of distributions paid was as follows:
| October 31, 2007 | October 31, 2006 |
Ordinary Income | $ 40,861 | $ 17,144 |
Long-term Capital Gains | 26,143 | 8,585 |
Total | $ 67,004 | $ 25,729 |
Short-Term Trading (Redemption) Fees. Shares held in the Fund less than 30 days are subject to a redemption fee equal to 1.00% of the proceeds of the redeemed shares. All redemption fees, including any estimated redemption fees paid by FMR, are retained by the Fund and accounted for as an addition to paid in capital.
New Accounting Pronouncements. In July 2006, Financial Accounting Standards Board Interpretation No. 48, Accounting for Uncertainty in Income Taxes - an interpretation of FASB Statement 109 (FIN 48), was issued and is effective on the last business day of the semiannual reporting period for fiscal years beginning after December 15, 2006. FIN 48 sets forth a threshold for financial statement recognition, measurement and disclosure of a tax position taken or expected to be taken on a tax return. Management has concluded that the adoption of FIN 48 will not result in a material impact on the Fund's net assets, results of operations and financial statement disclosures.
In addition, in September 2006, Statement of Financial Accounting Standards No. 157, Fair Value Measurements (SFAS 157), was issued and is effective for fiscal years beginning after November 15, 2007. SFAS 157 defines fair value, establishes a framework for
Annual Report
3. Significant Accounting Policies - continued
New Accounting Pronouncements - continued
measuring fair value and expands disclosures about fair value measurements. Management is currently evaluating the impact the adoption of SFAS 157 will have on the Fund's financial statement disclosures.
4. Operating Policies.
Repurchase Agreements. FMR has received an Exemptive Order from the Securities and Exchange Commission (the SEC) which permits the Fund and other affiliated entities of FMR to transfer uninvested cash balances into joint trading accounts which are then invested in repurchase agreements. The Fund may also invest directly with institutions in repurchase agreements. Repurchase agreements are collateralized by government or non-government securities. Upon settlement date, collateral is held in segregated accounts with custodian banks and may be obtained in the event of a default of the counterparty. The Fund monitors, on a daily basis, the value of the collateral to ensure it is at least equal to the principal amount of the repurchase agreement (including accrued interest). In the event of a default by the counterparty, realization of the collateral proceeds could be delayed, during which time the value of the collateral may decline.
5. Purchases and Sales of Investments.
Purchases and sales of securities, other than short-term securities, aggregated $906,445 and $840,758, respectively.
6. Fees and Other Transactions with Affiliates.
Management Fee. FMR and its affiliates provide the Fund with investment management related services for which the Fund pays a monthly management fee. The management fee is the sum of an individual fund fee rate that is based on an annual rate of .45% of the Fund's average net assets and a group fee rate that averaged ..26% during the period. The group fee rate is based upon the average net assets of all the mutual funds advised by FMR. The group fee rate decreases as assets under management increase and increases as assets under management decrease. In addition, the management fee is subject to a performance adjustment (up to a maximum of ± .20% of the Fund's average net assets over a 36 month performance period). The upward or downward adjustment to the management fee is based on the investment performance of the asset-weighted return of all classes as compared to an appropriate benchmark index. For the period, the total annual management fee rate, including the performance adjustment, was .53% of the Fund's average net assets.
Annual Report
Notes to Financial Statements - continued
(Amounts in thousands except ratios)
6. Fees and Other Transactions with Affiliates - continued
Distribution and Service Plan. In accordance with Rule 12b-1 of the 1940 Act, the Fund has adopted separate Distribution and Service Plans for each class of shares. Certain classes pay Fidelity Distributors Corporation (FDC), an affiliate of FMR, separate Distribution and Service Fees, each of which is based on an annual percentage of each class' average net assets. In addition, FDC may pay financial intermediaries for selling shares of the Fund and providing shareholder support services. For the period, the Distribution and Service Fee rates and the total amounts paid to and retained by FDC were as follows:
| Distribution
Fee | Service
Fee | Paid to
FDC | Retained
by FDC |
Class A | 0% | .25% | $ 316 | $ 19 |
Class T | .25% | .25% | 3,252 | 43 |
Class B | .75% | .25% | 316 | 238 |
Class C | .75% | .25% | 428 | 19 |
| | | $ 4,312 | $ 319 |
Sales Load. FDC receives a front-end sales charge of up to 5.75% for selling Class A shares, and 3.50% for selling Class T shares, some of which is paid to financial intermediaries for selling shares of the Fund. FDC receives the proceeds of contingent deferred sales charges levied on Class A, Class T, Class B, and Class C redemptions. These charges depend on the holding period. The deferred sales charges range from 5% to 1% for Class B, 1% for Class C, 1.00% to .50% for certain purchases of Class A shares and .25% for certain purchases of Class T shares.
For the period, sales charge amounts retained by FDC were as follows:
| Retained
by FDC |
Class A | $ 20 |
Class T | 15 |
Class B* | 31 |
Class C* | 3 |
| $ 69 |
* When Class B and Class C shares are initially sold, FDC pays commissions from its own resources to financial intermediaries through which the sales are made.
Transfer Agent Fees. Fidelity Investments Institutional Operations Company, Inc. (FIIOC), an affiliate of FMR, is the transfer, dividend disbursing and shareholder servicing agent for each class of the Fund. FIIOC receives account fees and asset-based fees that vary according to the account size and type of account of the shareholders of the respective classes of the Fund. FIIOC pays for typesetting, printing and mailing of
Annual Report
6. Fees and Other Transactions with Affiliates - continued
Transfer Agent Fees - continued
shareholder reports, except proxy statements. For the period, the total transfer agent fees paid by each class to FIIOC, were as follows:
| Amount | % of
Average
Net Assets |
Class A | $ 381 | .30 |
Class T | 1,379 | .21 |
Class B | 101 | .32 |
Class C | 123 | .29 |
Institutional Class | 1,026 | .22 |
| $ 3,010 | |
Accounting and Security Lending Fees. Fidelity Service Company, Inc. (FSC), an affiliate of FMR, maintains the Fund's accounting records. The accounting fee is based on the level of average net assets for the month. Under a separate contract, FSC administers the security lending program. The security lending fee is based on the number and duration of lending transactions.
7. Committed Line of Credit.
The Fund participates with other funds managed by FMR in a $4.2 billion credit facility (the "line of credit") to be utilized for temporary or emergency purposes to fund shareholder redemptions or for other short-term liquidity purposes. The Fund has agreed to pay commitment fees on its pro rata portion of the line of credit, which amounted to $3 and is reflected in Miscellaneous Expense on the Statement of Operations. During the period, there were no borrowings on this line of credit.
8. Security Lending.
The Fund lends portfolio securities from time to time in order to earn additional income. On the settlement date of the loan, the Fund receives collateral (in the form of U.S. Treasury obligations, letters of credit and/or cash) against the loaned securities and maintains collateral in an amount not less than 100% of the market value of the loaned securities during the period of the loan. The market value of the loaned securities is determined at the close of business of the Fund and any additional required collateral is delivered to the Fund on the next business day. If the borrower defaults on its obligation to return the securities loaned because of insolvency or other reasons, a fund could experience delays and costs in recovering the securities loaned or in gaining access to the collateral. Any cash collateral received is invested in the Fidelity Securities Lending Cash Central Fund. The value of loaned securities and cash collateral at period end are disclosed on the Fund's Statement of Assets and Liabilities. Security lending income represents the income earned on investing cash collateral, less fees and expenses
Annual Report
Notes to Financial Statements - continued
(Amounts in thousands except ratios)
8. Security Lending - continued
associated with the loan, plus any premium payments that may be received on the loan of certain types of securities. Security lending income is presented in the Statement of Operations as a component of income from Fidelity Central Funds. Net income from lending portfolio securities during the period amounted to $1,101.
9. Expense Reductions.
Many of the brokers with whom FMR places trades on behalf of the Fund provided services to the Fund in addition to trade execution. These services included payments of certain expenses on behalf of the Fund totaling $369 for the period. In addition, through arrangements with the each class' transfer agent, credits realized as a result of uninvested cash balances were used to reduce the Fund's expenses. During the period, credits reduced each class' transfer agent expense as noted in the table below.
| Transfer Agent
expense reduction | |
Class A | $ 12 | |
Class T | 4 | |
Class C | 1 | |
Institutional Class | 19 | |
| $ 36 | |
10. Other.
The Fund's organizational documents provide former and current trustees and officers with a limited indemnification against liabilities arising in connection with the performance of their duties to the Fund. In the normal course of business, the Fund may also enter into contracts that provide general indemnifications. The Fund's maximum exposure under these arrangements is unknown as this would be dependent on future claims that may be made against the Fund. The risk of material loss from such claims is considered remote.
At the end of the period, the Fidelity Advisor Freedom Funds were the owners of record, in the aggregate of approximately 30% of the total outstanding shares of the Fund.
In September 2006, FIIOC, the Fund's transfer agent, notified the Fund that the Fund's books and records did not reflect a conversion of certain Class B to Class A shares upon their conversion date. In March 2007, FIIOC converted the relevant Class B shares to Class A shares and recorded the conversion in the books and records of the Fund which did not result in a material impact to the Fund's reported net assets or results of operations in the accompanying financial statements. FIIOC has remediated affected shareholders and reimbursed the Fund for all related audit and legal expenses.
Annual Report
10. Other - continued
The United States Securities and Exchange Commission ("SEC") is conducting an investigation of FMR (covering the years 2002 to 2004) arising from gifts, gratuities and business entertainment provided by certain brokers to certain individuals who were employed on FMR's domestic equity trading desk during that period. FMR is in discussions with the SEC staff regarding the possible resolution of the matter, but as of period-end no final resolution has been reached.
In December 2006, the Independent Trustees completed their own investigation of the matter with the assistance of independent counsel. The Independent Trustees and FMR agree that, despite the absence of proof that the Fidelity mutual funds experienced diminished execution quality as a result of the improper receipt of gifts and business entertainment, the conduct at issue was serious and is worthy of redress. Accordingly, the Independent Trustees have requested and FMR has agreed to pay $42 million to Fidelity mutual funds, plus interest to be determined at the time that payment is made. A method of allocating this payment among the funds has not yet been determined. The total payment to the Fund is not anticipated to have a material impact on the Fund's net assets. In addition, FMR reimbursed related legal expenses which are recorded in the accompanying Statement of Operations as an expense reduction.
11. Distributions to Shareholders.
Distributions to shareholders of each class were as follows:
Years ended October 31, | 2007 | 2006 |
From net investment income | | |
Class A | $ 1,166 | $ 1,383 |
Class T | 5,197 | 3,667 |
Class B | 26 | 49 |
Class C | 137 | 78 |
Institutional Class | 5,055 | 3,381 |
Total | $ 11,581 | $ 8,558 |
From net realized gain | | |
Class A | $ 5,467 | $ 2,173 |
Class T | 28,690 | 8,871 |
Class B | 1,858 | 773 |
Class C | 2,010 | 614 |
Institutional Class | 17,398 | 4,740 |
Total | $ 55,423 | $ 17,171 |
Annual Report
Notes to Financial Statements - continued
(Amounts in thousands except ratios)
12. Share Transactions.
Transactions for each class of shares were as follows:
| Shares | Dollars |
Years ended October 31, | 2007 | 2006 | 2007 | 2006 |
Class A | | | | |
Shares sold | 2,109 | 2,132 | $ 49,321 | $ 43,538 |
Reinvestment of distributions | 268 | 166 | 5,668 | 3,105 |
Shares redeemed | (2,108) | (4,335) | (48,883) | (88,388) |
Net increase (decrease) | 269 | (2,037) | $ 6,106 | $ (41,745) |
Class T | | | | |
Shares sold | 6,427 | 7,282 | $ 152,753 | $ 152,243 |
Reinvestment of distributions | 1,529 | 640 | 32,968 | 12,202 |
Shares redeemed | (9,269) | (11,860) | (220,331) | (244,457) |
Net increase (decrease) | (1,313) | (3,938) | $ (34,610) | $ (80,012) |
Class B | | | | |
Shares sold | 108 | 153 | $ 2,422 | $ 3,030 |
Reinvestment of distributions | 84 | 41 | 1,716 | 736 |
Shares redeemed | (936) | (1,046) | (20,830) | (20,618) |
Net increase (decrease) | (744) | (852) | $ (16,692) | $ (16,852) |
Class C | | | | |
Shares sold | 248 | 276 | $ 5,644 | $ 5,541 |
Reinvestment of distributions | 92 | 33 | 1,908 | 617 |
Shares redeemed | (512) | (477) | (11,719) | (9,538) |
Net increase (decrease) | (172) | (168) | $ (4,167) | $ (3,380) |
Institutional Class | | | | |
Shares sold | 6,884 | 8,789 | $ 164,033 | $ 181,221 |
Reinvestment of distributions | 1,020 | 258 | 21,884 | 4,909 |
Shares redeemed | (1,676) | (8,381) | (40,404) | (182,226) |
Net increase (decrease) | 6,228 | 666 | $ 145,513 | $ 3,904 |
Annual Report
Report of Independent Registered Public Accounting Firm
To the Trustees of Fidelity Advisor Series VIII and the Shareholders of Fidelity Advisor Overseas Fund:
In our opinion, the accompanying statement of assets and liabilities, including the schedule of investments, and the related statements of operations and of changes in net assets and the financial highlights present fairly, in all material respects, the financial position of Fidelity Advisor Overseas Fund (a fund of Fidelity Advisor Series VIII) at October 31, 2007, the results of its operations for the year then ended, the changes in its net assets for each of the two years in the period then ended and the financial highlights for each of the five years in the period then ended, in conformity with accounting principles generally accepted in the United States of America. These financial statements and financial highlights (hereafter referred to as "financial statements") are the responsibility of the Fidelity Advisor Overseas Fund's management. Our responsibility is to express an opinion on these financial statements based on our audits. We conducted our audits of these financial statements in accordance with the standards of the Public Company Accounting Oversight Board (United States). Those standards require that we plan and perform the audit to obtain reasonable assurance about whether the financial statements are free of material misstatement. An audit includes examining, on a test basis, evidence supporting the amounts and disclosures in the financial statements, assessing the accounting principles used and significant estimates made by management, and evaluating the overall financial statement presentation. We believe that our audits, which included confirmation of securities at October 31, 2007 by correspondence with the custodian and brokers, provide a reasonable basis for our opinion.
/s/ PricewaterhouseCoopers LLP
PricewaterhouseCoopers LLP
Boston, Massachusetts
December 18, 2007
Annual Report
Trustees and Officers
The Trustees, Members of the Advisory Board, and executive officers of the trust and fund, as applicable, are listed below. The Board of Trustees governs the fund and is responsible for protecting the interests of shareholders. The Trustees are experienced executives who meet periodically throughout the year to oversee the fund's activities, review contractual arrangements with companies that provide services to the fund, and review the fund's performance. Except for James C. Curvey, each of the Trustees oversees 370 funds advised by FMR or an affiliate. Mr. Curvey oversees 340 funds advised by FMR or an affiliate.
The Trustees hold office without limit in time except that (a) any Trustee may resign; (b) any Trustee may be removed by written instrument, signed by at least two-thirds of the number of Trustees prior to such removal; (c) any Trustee who requests to be retired or who has become incapacitated by illness or injury may be retired by written instrument signed by a majority of the other Trustees; and (d) any Trustee may be removed at any special meeting of shareholders by a two-thirds vote of the outstanding voting securities of the trust. Each Trustee who is not an interested person (as defined in the 1940 Act) (Independent Trustee), shall retire not later than the last day of the calendar year in which his or her 72nd birthday occurs. The Independent Trustees may waive this mandatory retirement age policy with respect to individual Trustees. The executive officers and Advisory Board Members hold office without limit in time, except that any officer and Advisory Board Member may resign or may be removed by a vote of a majority of the Trustees at any regular meeting or any special meeting of the Trustees. Except as indicated, each individual has held the office shown or other offices in the same company for the past five years.
The fund's Statement of Additional Information (SAI) includes more information about the Trustees. To request a free copy, call Fidelity at 1-877-208-0098.
Interested Trustees*:
Correspondence intended for each Trustee who is an interested person may be sent to Fidelity Investments, 82 Devonshire Street, Boston, Massachusetts 02109.
Name, Age; Principal Occupation |
Edward C. Johnson 3d (77) |
| Year of Election or Appointment: 1983 Mr. Johnson is Chairman of the Board of Trustees. Mr. Johnson serves as President (2006-present), Chief Executive Officer, Chairman, and a Director of FMR LLC; Chairman and a Director of FMR; Chairman and a Director of Fidelity Research & Analysis Company (FRAC); Chairman and a Director of Fidelity Investments Money Management, Inc.; and Chairman (2001-present) and a Director of FMR Co., Inc. In addition, Mr. Johnson serves as Chairman and Director of Fidelity International Limited (FIL). |
James C. Curvey (72) |
| Year of Election or Appointment: 2007 Mr. Curvey also serves as Trustee (2007-present) or Member of the Advisory Board (2007-present) of other investment companies advised by FMR. Mr. Curvey is a Director of FMR and FMR Co., Inc. (2007-present). Mr. Curvey is also Vice Chairman (2006-present) and Director of FMR LLC. Mr. Curvey joined Fidelity in 1982 and served in numerous senior management positions, including President and Chief Operating Officer of FMR LLC (1997-2000) and President of Fidelity Strategic Investments (2000-2002). In addition, he serves as a member of the Board of Directors of Geerlings & Wade, Inc. (wine distribution). |
* Trustees have been determined to be "Interested Trustees" by virtue of, among other things, their affiliation with the trust or various entities under common control with FMR. FMR Corp. merged with FMR LLC on October 1, 2007. Any references to FMR LLC for prior periods are deemed to be references to the prior entity.
Independent Trustees:
Correspondence intended for each Independent Trustee (that is, the Trustees other than the Interested Trustees) may be sent to Fidelity Investments, P.O. Box 55235, Boston, Massachusetts 02205-5235.
Name, Age; Principal Occupation |
Dennis J. Dirks (59) |
| Year of Election or Appointment: 2005 Prior to his retirement in May 2003, Mr. Dirks was Chief Operating Officer and a member of the Board of The Depository Trust & Clearing Corporation (DTCC) (1999-2003). He also served as President, Chief Operating Officer, and Board member of The Depository Trust Company (DTC) (1999-2003) and President and Board member of the National Securities Clearing Corporation (NSCC) (1999-2003). In addition, Mr. Dirks served as Chief Executive Officer and Board member of the Government Securities Clearing Corporation (2001-2003) and Chief Executive Officer and Board member of the Mortgage-Backed Securities Clearing Corporation (2001-2003). Mr. Dirks also serves as a Trustee and a member of the Finance Committee of Manhattan College (2005-present) and a Trustee and a member of the Finance Committee of AHRC of Nassau County (2006-present). |
Albert R. Gamper, Jr. (65) |
| Year of Election or Appointment: 2006 Prior to his retirement in December 2004, Mr. Gamper served as Chairman of the Board of CIT Group Inc. (commercial finance). During his tenure with CIT Group Inc. Mr. Gamper served in numerous senior management positions, including Chairman (1987-1989; 1999-2001; 2002-2004), Chief Executive Officer (1987-2004), and President (1989-2002). He currently serves as a member of the Board of Directors of Public Service Enterprise Group (utilities, 2001-present), Chairman of the Board of Governors, Rutgers University (2004-present), and Chairman of the Board of Saint Barnabas Health Care System. |
George H. Heilmeier (71) |
| Year of Election or Appointment: 2004 Dr. Heilmeier is Chairman Emeritus of Telcordia Technologies (communication software and systems), where prior to his retirement, he served as company Chairman and Chief Executive Officer. He currently serves on the Boards of Directors of The Mitre Corporation (systems engineering and information technology support for the government), and HRL Laboratories (private research and development, 2004-present). He is Chairman of the General Motors Science & Technology Advisory Board and a Life Fellow of the Institute of Electrical and Electronics Engineers (IEEE). Dr. Heilmeier is a member of the Defense Science Board and the National Security Agency Advisory Board. He is also a member of the National Academy of Engineering, the American Academy of Arts and Sciences, and the Board of Overseers of the School of Engineering and Applied Science of the University of Pennsylvania. Previously, Dr. Heilmeier served as a Director of TRW Inc. (automotive, space, defense, and information technology, 1992-2002), Compaq (1994-2002), Automatic Data Processing, Inc. (ADP) (technology-based business outsourcing, 1995-2002), INET Technologies Inc. (telecommunications network surveillance, 2001-2004), and Teletech Holdings (customer management services). He is the recipient of the 2005 Kyoto Prize in Advanced Technology for his invention of the liquid crystal display, and a member of the Consumer Electronics Hall of Fame. |
James H. Keyes (67) |
| Year of Election or Appointment: 2007 Prior to his retirement in 2003, Mr. Keyes was Chairman, President, and Chief Executive Officer of Johnson Controls, Inc. (automotive supplier, 1993-2003). He currently serves as a member of the boards of LSI Logic Corporation (semiconductor technologies), Navistar International Corporation (manufacture and sale of trucks, buses, and diesel engines, 2002-present), and Pitney Bowes, Inc. (integrated mail, messaging, and document management solutions). |
Marie L. Knowles (61) |
| Year of Election or Appointment: 2001 Prior to Ms. Knowles' retirement in June 2000, she served as Executive Vice President and Chief Financial Officer of Atlantic Richfield Company (ARCO) (diversified energy, 1996-2000). From 1993 to 1996, she was a Senior Vice President of ARCO and President of ARCO Transportation Company. She served as a Director of ARCO from 1996 to 1998. She currently serves as a Director of Phelps Dodge Corporation (copper mining and manufacturing) and McKesson Corporation (healthcare service, 2002-present). Ms. Knowles is a Trustee of the Brookings Institution and the Catalina Island Conservancy and also serves as a member of the Advisory Board for the School of Engineering of the University of Southern California. |
Ned C. Lautenbach (63) |
| Year of Election or Appointment: 2000 Mr. Lautenbach is Chairman of the Independent Trustees (2006-present). Mr. Lautenbach has been a partner of Clayton, Dubilier & Rice, Inc. (private equity investment firm) since September 1998. Previously, Mr. Lautenbach was with the International Business Machines Corporation (IBM) from 1968 until his retirement in 1998. Mr. Lautenbach serves as a Director of Sony Corporation (2006-present) and Eaton Corporation (diversified industrial) as well as the Philharmonic Center for the Arts in Naples, Florida. He also is a member of the Board of Trustees of Fairfield University (2005-present), as well as a member of the Council on Foreign Relations. |
Cornelia M. Small (63) |
| Year of Election or Appointment: 2005 Ms. Small is a member (2000-present) and Chairperson (2002-present) of the Investment Committee, and a member (2002-present) of the Board of Trustees of Smith College. Previously, she served as Chief Investment Officer (1999-2000), Director of Global Equity Investments (1996-1999), and a member of the Board of Directors of Scudder, Stevens & Clark (1990-1997) and Scudder Kemper Investments (1997-1999). In addition, Ms. Small served as Co-Chair (2000-2003) of the Annual Fund for the Fletcher School of Law and Diplomacy. |
William S. Stavropoulos (68) |
| Year of Election or Appointment: 2001 Mr. Stavropoulos is Chairman Emeritus of the Board of Directors of The Dow Chemical Company. Since joining The Dow Chemical Company in 1967, Mr. Stavropoulos served in numerous senior management positions, including President (1993-2000; 2002-2003), CEO (1995-2000; 2002-2004), and Chairman of the Executive Committee (2000-2004). Currently, he is a Director of NCR Corporation (data warehousing and technology solutions), Chemical Financial Corporation, Maersk Inc. (industrial conglomerate, 2002-present), Tyco International, Inc. (multinational manufacturing and services, 2007-present), and a member of the Advisory Board for Metalmark Capital (private equity investment firm, 2005-present). He is a special advisor to Clayton, Dubilier & Rice, Inc., a private equity investment firm. He also serves as a member of the Board of Trustees of the American Enterprise Institute for Public Policy Research. In addition, Mr. Stavropoulos is a member of The Business Council, J.P. Morgan International Council and the University of Notre Dame Advisory Council for the College of Science. |
Kenneth L. Wolfe (68) |
| Year of Election or Appointment: 2005 Prior to his retirement in 2001, Mr. Wolfe was Chairman and Chief Executive Officer of Hershey Foods Corporation (1993-2001). He currently serves as a member of the boards of Adelphia Communications Corporation (2003-present), Bausch & Lomb, Inc., and Revlon Inc. (2004-present). |
Advisory Board Members and Executive Officers**:
Correspondence intended for Mr. Mauriello, Mr. Thomas, and Mr. Wiley may be sent to Fidelity Investments, P.O. Box 55235, Boston, Massachusetts 02205-5235. Correspondence intended for each executive officer and Mr. Lynch may be sent to Fidelity Investments, 82 Devonshire Street, Boston, Massachusetts 02109.
Name, Age; Principal Occupation |
Peter S. Lynch (63) |
| Year of Election or Appointment: 2003 Member of the Advisory Board of Fidelity Advisor Series VIII. Mr. Lynch is Vice Chairman and a Director of FMR, and Vice Chairman (2001-present) and a Director of FMR Co., Inc. Previously, Mr. Lynch served as a Trustee of the Fidelity funds (1990-2003). In addition, he serves as a Trustee of Boston College and as the Chairman of the Inner-City Scholarship Fund. |
Joseph Mauriello (63) |
| Year of Election or Appointment: 2007 Member of the Advisory Board of Fidelity Advisor Series VIII. Prior to his retirement in January 2006, Mr. Mauriello served in numerous senior management positions including Deputy Chairman and Chief Operating Officer (2004-2005), and Vice Chairman of Financial Services (2002-2004) of KPMG LLP US (professional services firm, 1965-2005). Mr. Mauriello currently serves as a member of the Board of Directors of XL Capital Ltd., (global insurance and re-insurance company, 2006-present) and of Arcadia Resources Inc., (health care services and products, 2007-present). He also served as a Director of the Hamilton Funds of the Bank of New York (2006-2007). |
David M. Thomas (58) |
| Year of Election or Appointment: 2007 Member of the Advisory Board of Fidelity Advisor Series VIII. Previously, Mr. Thomas served as Executive Chairman (2005-2006) and Chairman and Chief Executive Officer (2000-2005) of IMS Heath, Inc. (pharmaceutical and healthcare information solutions). In addition, Mr. Thomas serves as a member of the Board of Directors of Fortune Brands, Inc. (consumer products holding company), and Interpublic Group of Companies, Inc. (marketing communication, 2004-present). |
Michael E. Wiley (57) |
| Year of Election or Appointment: 2007 Member of the Advisory Board of Fidelity Advisor Series VIII. Mr. Wiley also serves as Sr. Energy Advisor of Katzenbach Partners, LLC (consulting firm, 2006-present) and a member of the Board of Trustees of the University of Tulsa (2000-2006; 2007-present). He serves as a Director of Tesoro Corporation (independent oil refiner and marketer, 2005-present), and a Director of Bill Barrett Corporation (exploration and production company, 2005-present). In addition, he also serves as a Director of Post Oak Bank (privately-held bank, 2004-present), and an Advisory Director of Riverstone Holdings (private investment firm). Previously, Mr. Wiley served as Chairman, President, and CEO of Baker Hughes, Inc. (oilfield services company, 2000-2004), and as Director of Spinnaker Exploration Company (exploration and production company, 2001-2005). |
Kimberley H. Monasterio (43) |
| Year of Election or Appointment: 2007 President and Treasurer of Advisor Overseas. Ms. Monasterio also serves as President and Treasurer of other Fidelity funds (2007-present) and is an employee of FMR (2004-present). Previously, Ms. Monasterio served as Deputy Treasurer of the Fidelity funds (2004-2006). Before joining Fidelity Investments, Ms. Monasterio served as Treasurer (2000-2004) and Chief Financial Officer (2002-2004) of the Franklin Templeton Funds and Senior Vice President of Franklin Templeton Services, LLC (2000-2004). |
Walter C. Donovan (45) |
| Year of Election or Appointment: 2007 Vice President of Advisor Overseas. Mr. Donovan also serves as Vice President of Fidelity's Equity Funds (2007-present). Mr. Donovan also serves as Executive Vice President of FMR (2005-present) and FMR Co., Inc. (2005-present). Previously, Mr. Donovan served as Vice President of Fidelity's High Income Funds (2005-2007), Fixed-Income Funds (2005-2006), certain Asset Allocation Funds (2005-2006), certain Balanced Funds (2005-2006), and as Vice President and Director of Fidelity's International Equity Trading group (1998-2005). |
Eric M. Wetlaufer (45) |
| Year of Election or Appointment: 2006 Vice President of Advisor Overseas. Mr. Wetlaufer also serves as Vice President of certain International Equity Funds (2006-present). Mr. Wetlaufer is Senior Vice President of FMR (2006-present) and FMR Co., Inc. (2006-present), and President and Director of Fidelity Management & Research (U.K.) Inc. (2006-present) and Fidelity Research & Analysis Company (2006-present). Before joining Fidelity Investments in 2005, Mr. Wetlaufer was a partner in Oxhead Capital Management (2004-2005). Previously, Mr. Wetlaufer served as a Chief Investment Officer of Putnam Investments (1997-2003). |
Eric D. Roiter (58) |
| Year of Election or Appointment: 1998 Secretary of Advisor Overseas. He also serves as Secretary of Fidelity funds; Vice President, General Counsel, and Secretary of FMR Co., Inc. (2001-present) and FMR; Assistant Secretary of Fidelity Management & Research (U.K.) Inc. (2001-present), Fidelity Research & Analysis Company (2001-present), and Fidelity Investments Money Management, Inc. (2001-present). Mr. Roiter is an Adjunct Member, Faculty of Law, at Boston College Law School (2003-present). Previously, Mr. Roiter served as Vice President and Secretary of Fidelity Distributors Corporation (FDC) (1998-2005). |
Scott C. Goebel (39) |
| Year of Election or Appointment: 2007 Assistant Secretary of Advisor Overseas. Mr. Goebel also serves as Assistant Secretary of other Fidelity funds (2007-present), and is an employee of FMR. |
R. Stephen Ganis (41) |
| Year of Election or Appointment: 2006 Anti-Money Laundering (AML) officer of Advisor Overseas. Mr. Ganis also serves as AML officer of Fidelity funds (2006-present) and FMR LLC (2003-present). Before joining Fidelity Investments, Mr. Ganis practiced law at Goodwin Procter, LLP (2000-2002). |
Joseph B. Hollis (59) |
| Year of Election or Appointment: 2006 Chief Financial Officer of Advisor Overseas. Mr. Hollis also serves as Chief Financial Officer of other Fidelity funds. Mr. Hollis is President of Fidelity Pricing and Cash Management Services (FPCMS) (2005-present). Mr. Hollis also serves as President and Director of Fidelity Service Company, Inc. (2006-present). Previously, Mr. Hollis served as Senior Vice President of Cash Management Services (1999-2002) and Investment Management Operations (2002-2005). |
Kenneth A. Rathgeber (60) |
| Year of Election or Appointment: 2004 Chief Compliance Officer of Advisor Overseas. Mr. Rathgeber also serves as Chief Compliance Officer of other Fidelity funds (2004-present) and Executive Vice President of Risk Oversight for Fidelity Investments (2002-present). He is Chief Compliance Officer of FMR (2005-present), FMR Co., Inc. (2005-present), Fidelity Management & Research (U.K.) Inc. (2005-present), Fidelity Research & Analysis Company (2005-present), Fidelity Investments Money Management, Inc. (2005-present), and Strategic Advisers, Inc. (2005-present). Previously, Mr. Rathgeber served as Executive Vice President and Chief Operating Officer for Fidelity Investments Institutional Services Company, Inc. (1998-2002). |
Bryan A. Mehrmann (46) |
| Year of Election or Appointment: 2005 Deputy Treasurer of Advisor Overseas. Mr. Mehrmann also serves as Deputy Treasurer of other Fidelity funds (2005-present) and is an employee of FMR. Previously, Mr. Mehrmann served as Vice President of Fidelity Investments Institutional Services Group (FIIS)/Fidelity Investments Institutional Operations Corporation, Inc. (FIIOC) Client Services (1998-2004). |
Kenneth B. Robins (38) |
| Year of Election or Appointment: 2005 Deputy Treasurer of Advisor Overseas. Mr. Robins also serves as Deputy Treasurer of other Fidelity funds (2005-present) and is an employee of FMR (2004-present). Before joining Fidelity Investments, Mr. Robins worked at KPMG LLP, where he was a partner in KPMG's department of professional practice (2002-2004) and a Senior Manager (1999-2000). In addition, Mr. Robins served as Assistant Chief Accountant, United States Securities and Exchange Commission (2000-2002). |
Robert G. Byrnes (40) |
| Year of Election or Appointment: 2005 Assistant Treasurer of Advisor Overseas. Mr. Byrnes also serves as Assistant Treasurer of Fidelity funds (2005-present) and is an employee of FMR (2005-present). Previously, Mr. Byrnes served as Vice President of FPCMS (2003-2005). Before joining Fidelity Investments, Mr. Byrnes worked at Deutsche Asset Management where he served as Vice President of the Investment Operations Group (2000-2003). |
Peter L. Lydecker (53) |
| Year of Election or Appointment: 2004 Assistant Treasurer of Advisor Overseas. Mr. Lydecker also serves as Assistant Treasurer of other Fidelity funds (2004) and is an employee of FMR. |
Paul M. Murphy (60) |
| Year of Election or Appointment: 2007 Assistant Treasurer of Advisor Overseas. Mr. Murphy also serves as Assistant Treasurer of other Fidelity funds (2007-present) and is an employee of FMR (2007-present). Previously, Mr. Murphy served as Chief Financial Officer of the Fidelity Funds (2005-2006), Vice President and Associate General Counsel of FMR (2007), and Senior Vice President of Fidelity Pricing and Cash Management Services Group (FPCMS) (1994-2007). |
Gary W. Ryan (49) |
| Year of Election or Appointment: 2005 Assistant Treasurer of Advisor Overseas. Mr. Ryan also serves as Assistant Treasurer of other Fidelity funds (2005-present) and is an employee of FMR (2005-present). Previously, Mr. Ryan served as Vice President of Fund Reporting in FPCMS (1999-2005). |
** FMR Corp. merged with FMR LLC on October 1, 2007. Any references to FMR LLC for prior periods are deemed to be references to the prior entity.
Annual Report
Distributions
The Board of Trustees of Advisor Overseas Fund voted to pay to shareholders of record at the opening of business on record date, the following distributions per share derived from capital gains realized from sales of portfolio securities, and dividends derived from net investment income:
| Pay Date | Record Date | Dividends | Capital Gains |
Class A | 12/10/07 | 12/07/07 | $0.325 | $1.78 |
Class T | 12/10/07 | 12/07/07 | $0.271 | $1.78 |
Class B | 12/10/07 | 12/07/07 | $0.072 | $1.78 |
Class C | 12/10/07 | 12/07/07 | $0.133 | $1.78 |
The fund hereby designates as a capital gain dividend with respect to the taxable year ended October 31, 2007, $91,151,838, or, if subsequently determined to be different, the net capital gain of such year.
Class A designates 43%, Class T designates 45%, Class B designates 58%, and Class C designates 53% of dividends distributed during the fiscal year as amounts which may be taken into account as a dividend for purposes of the maximum rate under section 1(h)(11) of the Internal Revenue Code.
The amounts per share which represent income derived from sources within, and taxes paid to, foreign countries or possessions of the United States are as follows:
| Pay Date | Income | Taxes |
Class A | 12/04/06 | $0.337 | $0.0223 |
Class T | 12/04/06 | $0.323 | $0.0223 |
Class B | 12/04/06 | $0.249 | $0.0223 |
Class C | 12/04/06 | $0.273 | $0.0223 |
The fund will notify shareholders in January 2008 of amounts for use in preparing 2007 income tax returns.
Annual Report
Board Approval of Investment Advisory Contracts and Management Fees
Advisor Overseas Fund
Each year, typically in July, the Board of Trustees, including the Independent Trustees (together, the Board), votes on the renewal of the management contract and sub-advisory agreements (together, the Advisory Contracts) for the fund. The Board, assisted by the advice of fund counsel and Independent Trustees' counsel, requests and considers a broad range of information throughout the year.
The Board meets regularly each month except August and takes into account throughout the year matters bearing on Advisory Contracts. The Board, acting directly and through its separate committees, considers at each of its meetings factors that are relevant to the annual renewal of the fund's Advisory Contracts, including the services and support provided to the fund and its shareholders. At the time of the renewal, the Board had 12 standing committees, each composed of Independent Trustees with varying backgrounds, to which the Board has assigned specific subject matter responsibilities in order to enhance effective decision-making by the Board. Each committee has adopted a written charter outlining the structure and purposes of the committee. One such committee, the Equity Contract Committee, meets periodically as needed throughout the year to consider matters specifically related to the annual renewal of Advisory Contracts. The committee requests and receives information on, and makes recommendations to the Independent Trustees concerning, the approval and annual review of the Advisory Contracts.
At its July 2007 meeting, the Board of Trustees, including the Independent Trustees, unanimously determined to renew the Advisory Contracts for the fund. In reaching its determination, the Board considered all factors it believed relevant, including (i) the nature, extent, and quality of the services to be provided to the fund and its shareholders (including the investment performance of the fund); (ii) the competitiveness of the management fee and total expenses of the fund; (iii) the total costs of the services to be provided by and the profits to be realized by the investment adviser and its affiliates from the relationship with the fund; (iv) the extent to which economies of scale would be realized as the fund grows; and (v) whether fee levels reflect these economies of scale, if any, for the benefit of fund shareholders. The Board also approved amendments to the fund's agreements with foreign sub-advisers to clarify that each sub-adviser provides services as an independent contractor.
In determining whether to renew the Advisory Contracts for the fund, the Board ultimately reached a determination, with the assistance of fund counsel and Independent Trustees' counsel, that the renewal of the Advisory Contracts and the compensation to be received by Fidelity under the management contract is consistent with Fidelity's fiduciary duty under applicable law. In addition to evaluating the specific factors noted above, the Board, in reaching its determination, is aware that shareholders in the fund have a broad range of investment choices available to them, including a wide choice among mutual funds offered by competitors to Fidelity, and that the fund's shareholders, with the opportunity to review and weigh the disclosure provided by the fund in its prospectus and other public disclosures, have chosen to invest in this fund, managed by Fidelity.
Annual Report
Nature, Extent, and Quality of Services Provided. The Board considered staffing within the investment adviser, FMR, and the sub-advisers (together, the Investment Advisers), including the background of the fund's portfolio manager and the fund's investment objective and discipline. The Independent Trustees also had discussions with senior management of Fidelity's investment operations and investment groups. The Board considered the structure of the portfolio manager compensation program and whether this structure provides appropriate incentives.
Resources Dedicated to Investment Management and Support Services. The Board reviewed the size, education, and experience of the Investment Advisers' investment staff, their use of technology, and the Investment Advisers' approach to recruiting, training, and retaining portfolio managers and other research, advisory, and management personnel. The Board considered Fidelity's extensive global research capabilities that enable the Investment Advisers to aggregate data from various sources in an effort to produce positive investment results. The Board noted that Fidelity's analysts have access to a variety of technological tools that enable them to perform both fundamental and quantitative analysis and to specialize in various disciplines. The Board also considered that Fidelity's portfolio managers and analysts have access to daily portfolio attribution that allows for monitoring of a fund's portfolio, as well as an electronic communication system that provides immediate real-time access to research concerning issuers and credit enhancers.
Shareholder and Administrative Services. The Board considered (i) the nature, extent, quality, and cost of advisory, administrative, distribution, and shareholder services performed by the Investment Advisers and their affiliates under the Advisory Contracts and under separate agreements covering transfer agency, pricing and bookkeeping, and securities lending services for the fund; (ii) the nature and extent of the Investment Advisers' supervision of third party service providers, principally custodians and subcustodians; and (iii) the resources devoted to, and the record of compliance with, the fund's compliance policies and procedures. The Board reviewed the allocation of fund brokerage, including allocations to brokers affiliated with the Investment Advisers, the use of brokerage commissions to pay fund expenses, and the use of "soft" commission dollars to pay for research services. The Board also considered that Fidelity voluntarily pays for market data out of its own resources. The Board also considered the agreement reached between the Independent Trustees and Fidelity in December 2006 following an independent review of matters relating to receipt of travel, entertainment, gifts and gratuities in violation of Fidelity policies.
Annual Report
Board Approval of Investment Advisory Contracts and
Management Fees - continued
The Board noted that the growth of fund assets across the complex allows Fidelity to reinvest in the development of services designed to enhance the value or convenience of the Fidelity funds as investment vehicles. These services include 24-hour access to account information and market information through phone representatives and over the Internet, and investor education materials and asset allocation tools.
Investment in a Large Fund Family. The Board considered the benefits to shareholders of investing in a Fidelity fund, including the benefits of investing in a fund that is part of a large family of funds offering a variety of investment disciplines and providing for a large variety of mutual fund investor services. For example, fund shareholders are offered the privilege of exchanging shares of the fund for shares of other Fidelity funds, as set forth in the fund's prospectus, without paying a sales charge. The Board noted that, since the last Advisory Contract renewals in July 2006, Fidelity has taken a number of actions that benefited particular funds, including (i) dedicating additional resources to investment research and to restructure the investment research teams; (ii) contractually agreeing to reduce the management fee on Fidelity Advisor Floating Rate High Income Fund; (iii) contractually agreeing to reduce the management fees on Fidelity's California, Massachusetts, New Jersey, and New York AMT Tax-Free Money Market Funds, launching new Institutional Classes and Service Classes of these funds, and contractually agreeing to impose expense limitations on these funds; (iv) eliminating the exchange fee on the Fidelity Select Portfolios and reducing the pricing and bookkeeping fee rates for these funds; (v) reducing the maximum transfer agency fee rates on high income funds and certain equity funds; (vi) proposing amended management contracts that, if approved by shareholders, will add a performance adjustment component to the management fees paid by 18 Fidelity Advisor equity funds; (vii) contractually agreeing to reduce fees for Ultra-Short Central Fund and the money market Central Funds; (viii) waiving the Fidelity Advisor funds' contingent deferred sales charge on certain redemptions made through systematic withdrawal programs; and (ix) amending the management contracts for equity and fixed-income funds whose management contracts incorporate a "group fee" structure by adding four new fee "breakpoints" to the group fee rate schedules.
Investment Performance and Compliance. The Board considered whether the fund has operated within its investment objective, as well as its record of compliance with its investment restrictions. It also reviewed the fund's absolute investment performance for each class, as well as the fund's relative investment performance for each class measured against (i) a broad-based securities market index, and (ii) a peer group of mutual funds deemed appropriate by the Board over multiple periods. The following charts considered by the Board show, over the one-, three-, and five-year periods ended December 31, 2006, the cumulative total returns of Institutional Class (Class I) and Class B of the fund, the cumulative total returns of a broad-based securities market index ("benchmark"), and a range of cumulative total returns of a peer group of mutual funds identified by Morningstar, Inc. as having an investment style similar to that of the fund based on underlying portfolio holdings. The returns of Institutional Class (Class I) and Class B show the performance of the highest and lowest performing classes, respectively (based on three-year performance). The box within each chart shows the 25th percentile return (bottom of box) and the 75th percentile return (top of box) of the peer group. Returns shown above the box are in the first quartile and returns shown below the box are in the fourth quartile. The percentage beaten numbers noted below each chart correspond to the percentile box and represent the percentage of funds in the peer group whose performance was equal to or lower than that of the class indicated.
Annual Report
Advisor Overseas Fund
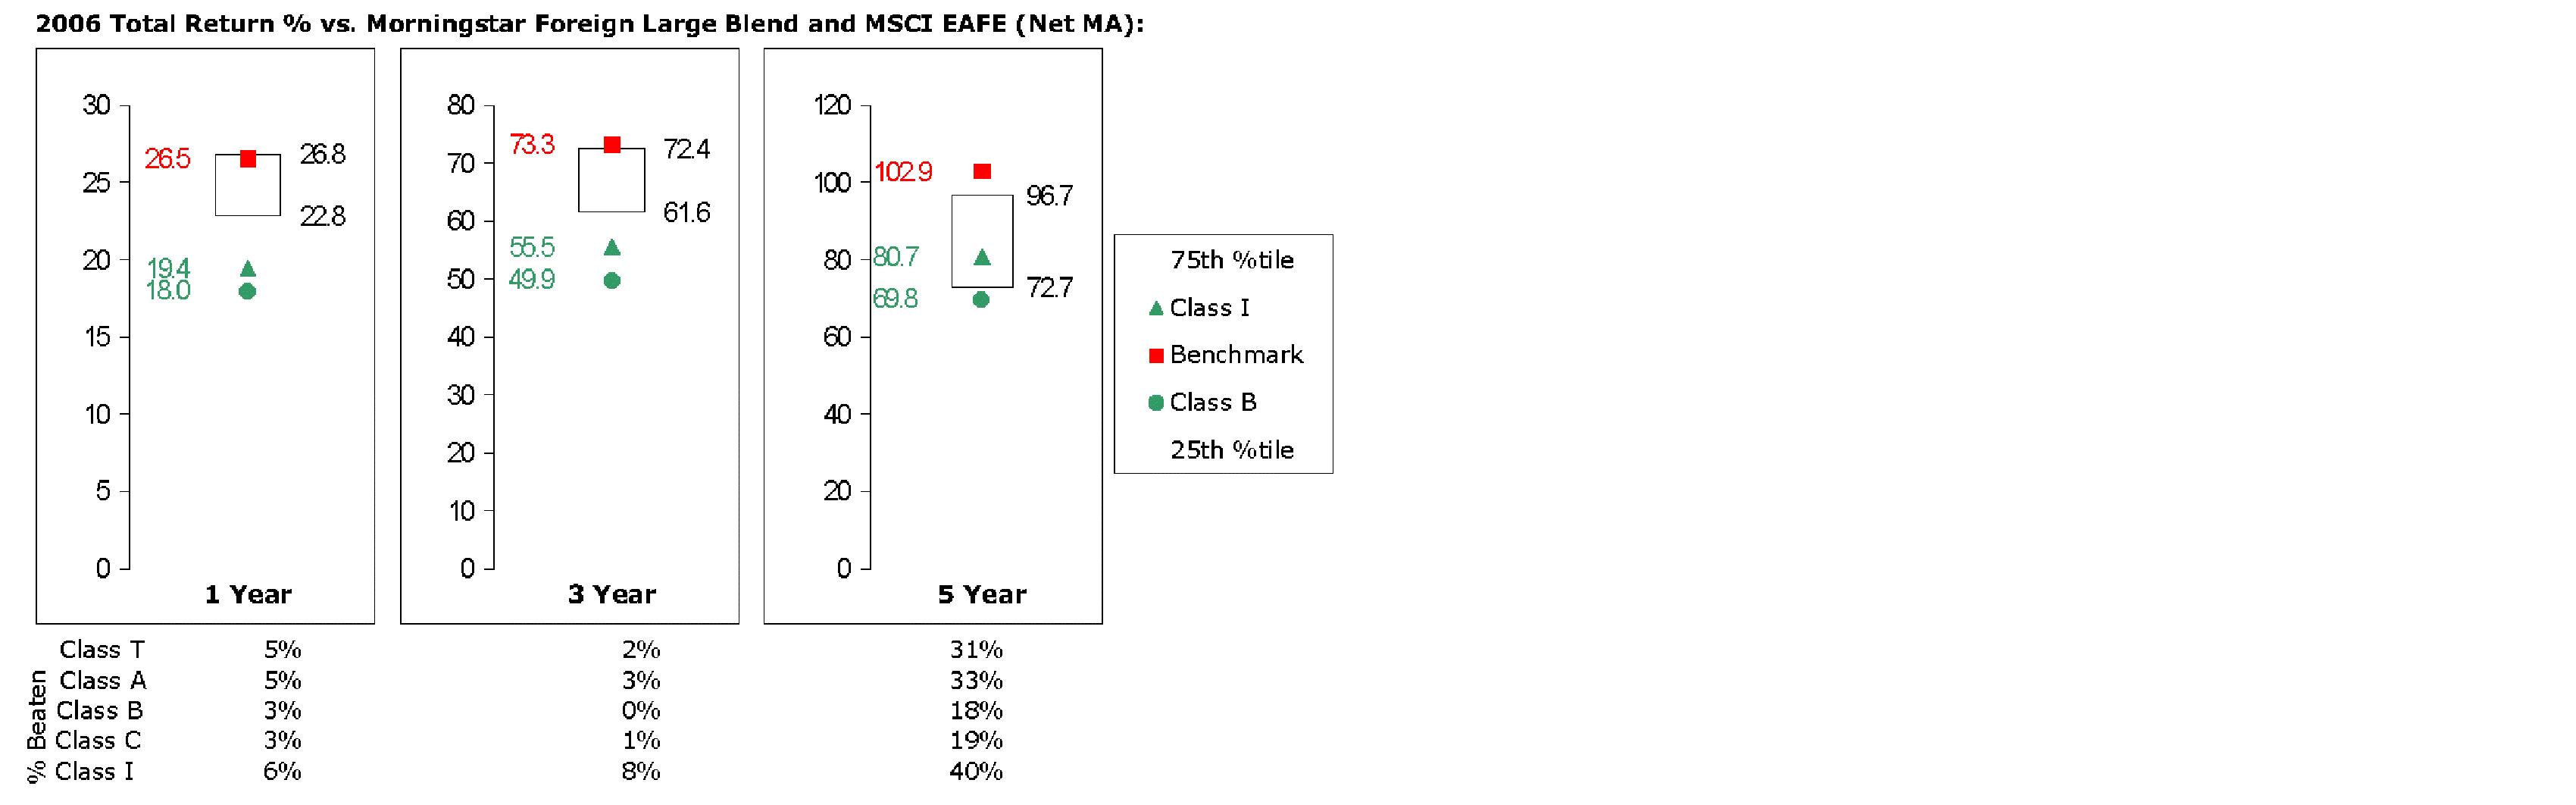
The Board reviewed the fund's relative investment performance against its peer group and stated that the performance of Institutional Class (Class I) of the fund was in the fourth quartile for the one-and three-year periods and the third quartile for the five-year period. The Board also stated that the investment performance of the fund was lower than its benchmark for all the periods shown. The Board considered that the variations in performance among the fund's classes reflect the variations in class expenses, which result in lower performance for higher expense classes. The Board discussed with FMR actions to be taken by FMR to improve the fund's disappointing performance relative to its peer group. The Board will continue to closely monitor the performance of the fund in the coming year and discuss with FMR other appropriate actions to address the performance of the fund.
The Board also considered that the fund's management fee is subject to upward or downward adjustment depending upon whether, and to what extent, the fund's investment performance for the performance period exceeds, or is exceeded by, the record (over the same period) of a Board-approved performance adjustment index. The Board realizes that the performance adjustment provides FMR with a strong economic incentive to seek to achieve superior performance for the fund's shareholders and helps to more closely align the interests of FMR and the fund's shareholders.
Annual Report
Board Approval of Investment Advisory Contracts and
Management Fees - continued
The Board considered that FMR has taken steps to refocus and strengthen equity research, equity portfolio management, and compliance.
Based on its review, and giving particular weight to the nature and quality of the resources dedicated by the Investment Advisers to maintain and improve relative performance, the Board concluded that the nature, extent, and quality of the services provided to the fund will benefit the fund's shareholders, particularly in light of the Board's view that the fund's shareholders benefit from investing in a fund that is part of a large family of funds offering a variety of investment disciplines and services.
Competitiveness of Management Fee and Total Fund Expenses. The Board considered the fund's management fee and total expenses compared to "mapped groups" of competitive funds and classes. Fidelity creates "mapped groups" by combining similar Lipper investment objective categories that have comparable management fee characteristics. Combining Lipper investment objective categories aids the Board's management fee and total expense comparisons by broadening the competitive group used for comparison and by reducing the number of universes to which various Fidelity funds are compared. The Board also considered supplemental information about how the fund's management fee and total expenses ranked relative to groups based on Lipper classifications, which take into account a fund's market capitalization and style.
The Board considered two proprietary management fee comparisons for the 12-month periods shown in the chart below. The group of Lipper funds used by the Board for management fee comparisons is referred to below as the "Total Mapped Group." The Total Mapped Group comparison focuses on a fund's standing relative to the total universe of comparable funds available to investors, in terms of gross management fees before expense reimbursements or caps, and without giving effect to the fund's performance adjustment. "TMG %" represents the percentage of funds in the Total Mapped Group that had management fees that were lower than the fund's. For example, a TMG % of 15% means that 85% of the funds in the Total Mapped Group had higher management fees than the fund. The "Asset-Size Peer Group" (ASPG) comparison focuses on a fund's standing relative to non-Fidelity funds similar in size to the fund within the Total Mapped Group. The ASPG represents at least 15% of the funds in the Total Mapped Group with comparable asset size and management fee characteristics, subject to a minimum of 50 funds (or all funds in the Total Mapped Group if fewer than 50). Additional information, such as the ASPG quartile in which the fund's management fee ranked and the impact of the fund's performance adjustment, is also included in the chart and considered by the Board.
Annual Report
Advisor Overseas Fund

The Board noted that the fund's management fee ranked below the median of its Total Mapped Group and below the median of its ASPG for 2006. The Board also noted the effect of the fund's negative performance adjustment on the fund's management fee ranking. The Board noted that the performance adjustment for each year represents calculations for performance periods that differ from the periods shown in the performance charts above.
Based on its review, the Board concluded that the fund's management fee was fair and reasonable in light of the services that the fund receives and the other factors considered.
In its review of each class's total expenses, the Board considered the fund's management fee as well as other fund or class expenses, as applicable, such as transfer agent fees, pricing and bookkeeping fees, fund-paid 12b-1 fees, and custodial, legal, and audit fees. The Board also noted the effects of any waivers and reimbursements on fees and expenses, as well as the fund's negative performance adjustment. As part of its review, the Board also considered current and historical total expenses of each class of the fund compared to competitive fund median expenses. Each class of the fund is compared to those funds and classes in the Total Mapped Group (used by the Board for management fee comparisons) that have a similar sales load structure.
The Board noted that the total expenses of each class ranked below its competitive median for 2006.
In its review of total expenses, the Board also considered Fidelity fee structures and other information on clients that FMR and its affiliates service in other competitive markets, such as other mutual funds advised or subadvised by FMR or its affiliates, pension plan clients, and other institutional clients.
Annual Report
Board Approval of Investment Advisory Contracts and
Management Fees - continued
Based on its review, the Board concluded that the total expenses of each class of the fund were reasonable in light of the services that the fund and its shareholders receive and the other factors considered.
Costs of the Services and Profitability. The Board considered the revenues earned and the expenses incurred by Fidelity in conducting the business of developing, marketing, distributing, managing, administering and servicing the fund and its shareholders. The Board also considered the level of Fidelity's profits in respect of all the Fidelity funds.
On an annual basis, FMR presents to the Board Fidelity's profitability for the fund. Fidelity calculates the profitability for each fund, as well as aggregate profitability for groups of Fidelity funds and all Fidelity funds, using a series of detailed revenue and cost allocation methodologies which originate with the audited books and records of Fidelity. The Audit Committee of the Board reviews any significant changes from the prior year's methodologies.
PricewaterhouseCoopers LLP (PwC), independent registered public accounting firm and auditor to Fidelity and certain Fidelity funds, has been engaged annually by the Board as part of the Board's assessment of the results of Fidelity's profitability analysis. PwC's engagement includes the review and assessment of Fidelity's methodologies used in determining the revenues and expenses attributable to Fidelity's mutual fund business, and completion of agreed-upon procedures surrounding the mathematical accuracy of fund profitability and its conformity to allocation methodologies. After considering PwC's reports issued under the engagement and information provided by Fidelity, the Board believes that while other allocation methods may also be reasonable, Fidelity's profitability methodologies are reasonable in all material respects.
The Board has also reviewed Fidelity's non-fund businesses and any fall-out benefits related to the mutual fund business as well as cases where Fidelity's affiliates may benefit from or be related to the fund's business.
The Board considered the costs of the services provided by and the profits realized by Fidelity in connection with the operation of the fund and determined that the amount of profit is a fair entrepreneurial profit for the management of the fund.
Economies of Scale. The Board considered whether there have been economies of scale in respect of the management of the Fidelity funds, whether the Fidelity funds (including the fund) have appropriately benefited from any such economies of scale, and whether there is potential for realization of any further economies of scale. The Board considered the extent to which the fund will benefit from economies of scale through increased services to the fund, through waivers or reimbursements, or through fee or expense reductions, including reductions that occur through operation of the transfer agent agreement. The transfer agent fee varies in part based on the number of accounts in the fund. If the number of accounts decreases or the average account size increases, the overall transfer agent fee rate decreases.
Annual Report
The Board recognized that the fund's management contract incorporates a "group fee" structure, which provides for lower group fee rates as total fund assets under FMR's management increase, and for higher group fee rates as total fund assets under FMR's management decrease. FMR determines the group fee rates based on a tiered asset "breakpoint" schedule. In connection with the renewal of the fund's management contract, the Board approved amendments to the fund's management contract that added four new fee breakpoints to the group fee rate schedule for assets under FMR's management above $1,386 billion. The Board considered that the group fee rate declines under both the present and amended schedules, but that under the amended schedule, the group fee rate declines faster as assets under FMR's management exceed $1,386 billion. The Board considered that the group fee is designed to deliver the benefits of economies of scale to fund shareholders when total fund assets increase, even if assets of any particular fund are unchanged or have declined, because some portion of Fidelity's costs are attributable to services provided to all Fidelity funds, and all funds benefit if those costs can be allocated among more assets. The Board concluded that, given the group fee structure, fund shareholders will achieve a certain level of economies of scale as assets under FMR's management increase at the fund complex level, regardless of whether Fidelity achieves any such economies of scale.
The Board further concluded that any potential economies of scale are being shared between fund shareholders and Fidelity in an appropriate manner.
Additional Information Requested by the Board. In order to develop fully the factual basis for consideration of the Fidelity funds' Advisory Contracts, the Board requested and received additional information on several topics, including (i) fund performance trends and actions to be taken by FMR to improve certain funds' overall performance; (ii) Fidelity's portfolio manager compensation structure, including its effects on fund profitability and the extent to which portfolio manager compensation is linked to fund performance; (iii) Fidelity's fee structures; (iv) the funds' sub-advisory arrangements; and (v) accounts managed by Fidelity other than the Fidelity funds.
Based on its evaluation of all of the conclusions noted above, and after considering all material factors, the Board ultimately concluded that the advisory fee structures are fair and reasonable, and that the fund's Advisory Contracts should be renewed.
Annual Report
Annual Report
Annual Report
Annual Report
Annual Report
Investment Adviser
Fidelity Management & Research Company
Boston, MA
Investment Sub-Advisers
FMR Co., Inc.
Fidelity Management & Research
(U.K.) Inc.
Fidelity Research & Analysis Company
Fidelity International
Investment Advisors
Fidelity Investments Japan Limited
Fidelity International Investment
Advisors (U.K.) Limited
General Distributor
Fidelity Distributors Corporation
Boston, MA
Transfer and Service Agents
Fidelity Investments Institutional
Operations Company, Inc.
Boston, MA
Fidelity Service Company, Inc.
Boston, MA
Custodian
The Northern Trust Company
Chicago, IL
OS-UANN-1207
1.784767.104
(Fidelity Investment logo)(registered trademark)
(Fidelity Investment logo)(registered trademark)
Fidelity® Advisor
Overseas
Fund - Institutional Class
Annual Report
October 31, 2007
(2_fidelity_logos) (Registered_Trademark)
Contents
Chairman's Message | <Click Here> | Ned Johnson's message to shareholders. |
Performance | <Click Here> | How the fund has done over time. |
Management's Discussion | <Click Here> | The manager's review of fund performance, strategy and outlook. |
Shareholder Expense Example | <Click Here> | An example of shareholder expenses. |
Investment Changes | <Click Here> | A summary of major shifts in the fund's investments over the past six months. |
Investments | <Click Here> | A complete list of the fund's investments with their market values. |
Financial Statements | <Click Here> | Statements of assets and liabilities, operations, and changes in net assets,
as well as financial highlights. |
Notes | <Click Here> | Notes to the financial statements. |
Report of Independent Registered Public Accounting Firm | <Click Here> | |
Trustees and Officers | <Click Here> | |
Distributions | <Click Here> | |
Board Approval of Investment Advisory Contracts and Management Fees | <Click Here> | |
To view a fund's proxy voting guidelines and proxy voting record for the 12-month period ended June 30, visit http://www.fidelity.com (search for "proxy voting guidelines") or visit the Securities and Exchange Commission's (SEC) web site at http://www.sec.gov. You may also call 1-877-208-0098 to request a free copy of the proxy voting guidelines.
Standard & Poor's, S&P and S&P 500 are registered service marks of The McGraw-Hill Companies, Inc. and have been licensed for use by Fidelity Distributors Corporation.
Other third party marks appearing herein are the property of their respective owners.
All other marks appearing herein are registered or unregistered trademarks or service marks of FMR LLC or an affiliated company.
Annual Report
This report and the financial statements contained herein are submitted for the general information of the shareholders of the fund. This report is not authorized for distribution to prospective investors in the fund unless preceded or accompanied by an effective prospectus.
A fund files its complete schedule of portfolio holdings with the SEC for the first and third quarters of each fiscal year on Form N-Q. Forms N-Q are available on the SEC's web site at http://www.sec.gov. A fund's Forms N-Q may be reviewed and copied at the SEC's Public Reference Room in Washington, DC. Information regarding the operation of the SEC's Public Reference Room may be obtained by calling 1-800-SEC-0330. For a complete list of a fund's portfolio holdings, view the most recent holdings listing, semiannual report, or annual report on Fidelity's web site at http://www.fidelity.com or http://www.advisor.fidelity.com, as applicable.
NOT FDIC INSURED · MAY LOSE VALUE · NO BANK GUARANTEE
Neither the fund nor Fidelity Distributors Corporation is a bank.
Annual Report
Chairman's Message
(photo_of_Edward_C_Johnson_3d)
Dear Shareholder:
Many stock and bond markets around the world have been unsettled of late; however, volatility can often lead to opportunity for patient investors. Financial markets are always unpredictable, but there are a number of time-tested principles that can put the historical odds in your favor.
One of the basic tenets is to invest for the long term. Over time, riding out the markets' inevitable ups and downs has proven much more effective than selling into panic or chasing the hottest trend. Even missing only a few of the markets' best days can significantly diminish investor returns. Patience also affords the benefits of compounding - of earning interest on additional income or reinvested dividends and capital gains. There are tax advantages and cost benefits to consider as well. The more you sell, the more taxes you pay, and the more you trade, the higher the costs. While staying the course doesn't eliminate risk, it can considerably lessen the effect of short-term declines.
You can further manage your investing risk through diversification. And today, more than ever, geographic diversification should be taken into account. Studies indicate that asset allocation is the single most important determinant of a portfolio's long-term success. The right mix of stocks, bonds and cash - aligned to your particular risk tolerance and investment objective - is very important. Age-appropriate rebalancing is also an essential aspect of asset allocation. For younger investors, an emphasis on equities - which historically have been the best-performing asset class over time - is encouraged. As investors near their specific goal, such as retirement or sending a child to college, consideration may be given to replacing volatile assets (e.g. common stocks) with more-stable fixed investments (bonds or savings plans).
A third investment principle - investing regularly - can help lower the average cost of your purchases. Investing a certain amount of money each month or quarter helps ensure you won't pay for all your shares at market highs. This strategy - known as dollar cost averaging - also reduces unconstructive "emotion" from investing, helping shareholders avoid selling weak performers just prior to an upswing, or chasing a hot performer just before a correction.
We invite you to contact us via the Internet, through our Investor Centers or over the phone. It is our privilege to provide you the information you need to make the investments that are right for you.
Sincerely,
/s/Edward C. Johnson 3d
Edward C. Johnson 3d
Annual Report
Performance: The Bottom Line
Average annual total return reflects the change in the value of an investment, assuming reinvestment of the class' dividend income and capital gains (the profits earned upon the sale of securities that have grown in value) and assuming a constant rate of performance each year. The $10,000 table and the fund's returns do not reflect the deduction of taxes that a shareholder would pay on fund distributions or the redemption of fund shares. During periods of reimbursement by Fidelity, a fund's total return will be greater than it would be had the reimbursement not occurred. How a fund did yesterday is no guarantee of how it will do tomorrow.
Average Annual Total Returns
Periods ended October 31, 2007 | | Past 1
year | Past 5
years | Past 10
years |
Institutional Class | | 31.88% | 22.38% | 8.90% |
$10,000 Over 10 Years
Let's say hypothetically that $10,000 was invested in Fidelity® Advisor Overseas Fund - Institutional Class on October 31, 1997. The chart shows how the value of your investment would have changed, and also shows how the Morgan Stanley Capital InternationalSM Europe, Australasia, Far East (MSCI® EAFE®) Index performed over the same period.
Annual Report
Management's Discussion of Fund Performance
Comments from Graeme Rockett, Portfolio Manager of Fidelity® Advisor Overseas Fund
Foreign stocks, with a large assist from a weak U.S. dollar, generally had higher returns for U.S. investors than domestic equities during the 12-month period ending October 31, 2007. The backdrop for global stocks was solid, with robust economic growth and relatively high corporate profitability worldwide. Developed international equity markets, as measured by the Morgan Stanley Capital InternationalSM Europe, Australasia, and Far East (MSCI® EAFE®) Index - a performance monitor of established markets outside the United States and Canada - rose 25.09%. In comparison, the Standard & Poor's 500SM Index, a gauge of U.S. stocks, was up 14.56%. Among countries making up at least 1% of the EAFE benchmark, Finland had the best showing, soaring nearly 69%, while Hong Kong gained roughly 66%. The United Kingdom and Japan, the two largest components of the index, both underperformed. Fallout from the credit crunch and concerns about export growth tempered UK stocks, while Japan struggled with a slowdown in consumer spending and sluggish domestic growth. Emerging markets were the period's big winners, advancing 68.33% as measured by the MSCI Emerging Markets index.
For the 12 months ending October 31, 2007, the fund's Institutional Class shares returned 31.88%, substantially outpacing the performance of the MSCI EAFE index. Security selection added value in nine out of the 10 economic sectors and in most regions of the globe. We had excellent returns in the capital goods industry, based on our conviction that the market was underestimating the strength of global demand for power transmission and distribution equipment. Alstom (of France) and ABB (of Switzerland) were among the capital goods stocks contributing to performance. In the information technology sector, Nintendo was the standout, as this Japanese video game manufacturer continued to profit from sales of its Wii game console and the related software. Within health care, CSL, an Australian specialty biopharmaceutical company that produces plasma protein therapies, performed especially well. Favorable currency movements also had a positive impact on the fund's absolute returns. Financials was the only sector where stock picking detracted from results. Germany's MLP, a distributor of financial products, lost ground because it had difficulty expanding its team of financial advisors, and Japanese insurer T&D underperformed due to slowing economic momentum in its domestic market.
The views expressed above reflect those of the portfolio manager(s) only through the end of the period as stated on the cover of this report and do not necessarily represent the views of Fidelity or any other person in the Fidelity organization. Any such views are subject to change at any time based upon market or other conditions and Fidelity disclaims any responsibility to update such views. These views may not be relied on as investment advice and, because investment decisions for a Fidelity fund are based on numerous factors, may not be relied on as an indication of trading intent on behalf of any Fidelity fund.
Annual Report
Shareholder Expense Example
As a shareholder of the Fund, you incur two types of costs: (1) transaction costs, including sales charges (loads) on purchase payments or redemption proceeds, redemption fees, and (2) ongoing costs, including management fees, distribution and/or service (12b-1) fees and other Fund expenses. This Example is intended to help you understand your ongoing costs (in dollars) of investing in the Fund and to compare these costs with the ongoing costs of investing in other mutual funds.
The Example is based on an investment of $1,000 invested at the beginning of the period and held for the entire period (May 1, 2007 to October 31, 2007).
Actual Expenses
The first line of the accompanying table for each class of the Fund provides information about actual account values and actual expenses. You may use the information in this line, together with the amount you invested, to estimate the expenses that you paid over the period. Simply divide your account value by $1,000.00 (for example, an $8,600 account value divided by $1,000.00 = 8.6), then multiply the result by the number in the first line for a class of the Fund under the heading entitled "Expenses Paid During Period" to estimate the expenses you paid on your account during this period. In addition, the Fund, as a shareholder in the underlying Fidelity Central Funds, will indirectly bear its pro rata share of the fees and expenses incurred by the underlying Fidelity Central Funds. These fees and expenses are not included in the Fund's annualized expense ratio used to calculate the expense estimate in the table below.
Hypothetical Example for Comparison Purposes
The second line of the accompanying table for each class of the Fund provides information about hypothetical account values and hypothetical expenses based on a Class' actual expense ratio and an assumed rate of return of 5% per year before expenses, which is not the Class' actual return. The hypothetical account values and expenses may not be used to estimate the actual ending account balance or expenses you paid for the period. You may use this information to compare the ongoing costs of investing in the Fund and other funds. To do so, compare this 5% hypothetical example with the 5% hypothetical examples that appear in the shareholder reports of the other funds. In addition, the Fund, as a shareholder in the underlying Fidelity Central Funds, will indirectly bear its pro rata share of the fees and expenses incurred by the underlying Fidelity Central Funds. These fees and expenses are not included in the Fund's annualized expense ratio used to calculate the expense estimate in the table below.
Annual Report
Shareholder Expense Example - continued
Please note that the expenses shown in the table are meant to highlight your ongoing costs only and do not reflect any transaction costs. Therefore, the second line of the table is useful in comparing ongoing costs only, and will not help you determine the relative total costs of owning different funds. In addition, if these transactional costs were included, your costs would have been higher.
| Beginning
Account Value
May 1, 2007 | Ending
Account Value
October 31, 2007 | Expenses Paid
During Period*
May 1, 2007
to October 31, 2007 |
Class A | | | |
Actual | $ 1,000.00 | $ 1,123.00 | $ 6.37 |
HypotheticalA | $ 1,000.00 | $ 1,019.21 | $ 6.06 |
Class T | | | |
Actual | $ 1,000.00 | $ 1,121.80 | $ 7.22 |
HypotheticalA | $ 1,000.00 | $ 1,018.40 | $ 6.87 |
Class B | | | |
Actual | $ 1,000.00 | $ 1,118.90 | $ 10.36 |
HypotheticalA | $ 1,000.00 | $ 1,015.43 | $ 9.86 |
Class C | | | |
Actual | $ 1,000.00 | $ 1,118.60 | $ 10.25 |
HypotheticalA | $ 1,000.00 | $ 1,015.53 | $ 9.75 |
Institutional Class | | | |
Actual | $ 1,000.00 | $ 1,124.60 | $ 4.61 |
HypotheticalA | $ 1,000.00 | $ 1,020.87 | $ 4.38 |
A 5% return per year before expenses
* Expenses are equal to each Class' annualized expense ratio (shown in the table below); multiplied by the average account value over the period, multiplied by 184/365 (to reflect the one-half year period).
| Annualized
Expense Ratio |
Class A | 1.19% |
Class T | 1.35% |
Class B | 1.94% |
Class C | 1.92% |
Institutional Class | .86% |
Annual Report
Investment Changes
Top Five Stocks as of October 31, 2007 |
| % of fund's
net assets | % of fund's net assets
6 months ago |
Alstom SA (France, Electrical Equipment) | 2.8 | 1.4 |
ABB Ltd. (Switzerland, Electrical Equipment) | 2.7 | 1.9 |
Vodafone Group PLC (United Kingdom, Wireless Telecommunication Services) | 1.6 | 1.2 |
Royal Dutch Shell PLC Class A (United Kingdom, Oil, Gas & Consumable Fuels) | 1.6 | 1.2 |
Siemens AG sponsored ADR (Germany, Industrial Conglomerates) | 1.6 | 1.4 |
| 10.3 | |
Top Five Market Sectors as of October 31, 2007 |
| % of fund's
net assets | % of fund's net assets
6 months ago |
Financials | 21.3 | 28.5 |
Industrials | 18.2 | 12.7 |
Consumer Discretionary | 10.2 | 13.3 |
Consumer Staples | 9.1 | 9.0 |
Materials | 8.0 | 6.2 |
Top Five Countries as of October 31, 2007 |
(excluding cash equivalents) | % of fund's
net assets | % of fund's net assets
6 months ago |
United Kingdom | 20.4 | 20.9 |
France | 15.3 | 11.9 |
Japan | 12.1 | 15.7 |
Germany | 11.5 | 11.9 |
Switzerland | 7.3 | 7.1 |
Percentages are adjusted for the effect of open futures contracts, if applicable. |
Asset Allocation (% of fund's net assets) |
As of October 31, 2007 | As of April 30, 2007 |
| Stocks 96.9% | | | Stocks 98.6% | |
| Short-Term
Investments and
Net Other Assets 3.1% | | | Short-Term
Investments and
Net Other Assets 1.4% | |

Annual Report
Investments October 31, 2007
Showing Percentage of Net Assets
Common Stocks - 96.5% |
| Shares | | Value (000s) |
Argentina - 0.3% |
Cresud S.A.C.I.F. y A. sponsored ADR | 167,700 | | $ 4,139 |
Australia - 6.7% |
AMP Ltd. | 332,700 | | 3,186 |
Australian Wealth Management Ltd. | 953,300 | | 2,465 |
Babcock & Brown Japan Property Trust | 1,065,300 | | 1,668 |
Babcock & Brown Ltd. | 76,700 | | 2,221 |
Babcock & Brown Wind Partners | 1,798,000 | | 3,094 |
BHP Billiton Ltd. | 321,400 | | 14,023 |
Charter Hall Group unit | 912,600 | | 2,604 |
Commonwealth Bank of Australia | 162,800 | | 9,376 |
Computershare Ltd. | 506,320 | | 4,082 |
CSL Ltd. | 702,006 | | 23,865 |
Gunns Ltd. | 587,200 | | 2,070 |
HFA Holdings Ltd. | 1,094,295 | | 2,637 |
Macquarie Bank Ltd. | 83,500 | | 6,669 |
McGuigan Simeon Wines Ltd. (a) | 614,691 | | 782 |
National Australia Bank Ltd. | 341,131 | | 13,801 |
Rio Tinto Ltd. | 30,300 | | 3,145 |
Seek Ltd. | 226,300 | | 1,981 |
WorleyParsons Ltd. | 113,729 | | 5,141 |
TOTAL AUSTRALIA | | 102,810 |
Austria - 0.3% |
Strabag SE (a) | 61,700 | | 4,844 |
Belgium - 1.0% |
Fortis | 90,300 | | 2,886 |
Hamon & Compagnie International SA (a) | 53,700 | | 3,582 |
InBev SA | 76,100 | | 7,184 |
KBC Groupe SA | 10,100 | | 1,415 |
TOTAL BELGIUM | | 15,067 |
Bermuda - 0.2% |
Aquarius Platinum Ltd. (United Kingdom) | 69,900 | | 2,678 |
Brazil - 0.3% |
Bovespa Holding SA (a) | 34,000 | | 648 |
Vivo Participacoes SA (PN) sponsored ADR (a) | 752,100 | | 4,430 |
TOTAL BRAZIL | | 5,078 |
British Virgin Islands - 0.1% |
Indochina Capital Vietnam Holdings Ltd. | 103,200 | | 1,006 |
Canada - 0.4% |
Cameco Corp. | 111,800 | | 5,512 |
Common Stocks - continued |
| Shares | | Value (000s) |
Denmark - 1.1% |
Novozymes AS Series B | 39,600 | | $ 4,310 |
Vestas Wind Systems AS (a) | 144,200 | | 12,865 |
TOTAL DENMARK | | 17,175 |
Finland - 1.1% |
Fortum Oyj | 81,000 | | 3,512 |
Neste Oil Oyj | 75,300 | | 2,707 |
Nokia Corp. | 278,500 | | 11,062 |
TOTAL FINLAND | | 17,281 |
France - 15.3% |
Alstom SA | 182,800 | | 43,142 |
AXA SA | 151,673 | | 6,784 |
BNP Paribas SA | 67,281 | | 7,417 |
Bouygues SA | 75,800 | | 7,277 |
Cap Gemini SA | 133,500 | | 8,510 |
Carrefour SA | 113,700 | | 8,185 |
CNP Assurances | 41,500 | | 5,290 |
Electricite de France | 92,900 | | 11,143 |
France Telecom SA | 58,300 | | 2,157 |
Gaz de France | 58,300 | | 3,311 |
Groupe Danone | 78,800 | | 6,797 |
Ingenico SA (d) | 137,800 | | 4,522 |
L'Air Liquide SA | 59,780 | | 8,250 |
L'Oreal SA | 66,934 | | 8,768 |
Michelin SA (Compagnie Generale des Etablissements)
Series B | 38,000 | | 5,089 |
Neopost SA | 18,900 | | 2,195 |
Pinault Printemps-Redoute SA | 31,300 | | 6,204 |
Remy Cointreau SA | 44,200 | | 3,397 |
Renault SA | 24,000 | | 4,030 |
Seche Environment SA | 7,600 | | 1,395 |
Societe Generale Series A | 53,270 | | 8,976 |
Sodexho Alliance SA | 76,300 | | 5,502 |
Suez SA (France) | 165,000 | | 10,725 |
Total SA: | | | |
Series B | 122,888 | | 9,906 |
sponsored ADR | 63,800 | | 5,143 |
Veolia Environnement | 247,275 | | 22,086 |
Vinci SA | 144,400 | | 11,845 |
Vivendi Universal SA | 166,500 | | 7,497 |
TOTAL FRANCE | | 235,543 |
Common Stocks - continued |
| Shares | | Value (000s) |
Germany - 11.1% |
Allianz AG (Reg.) | 44,700 | | $ 10,102 |
BASF AG | 12,900 | | 1,794 |
Bayer AG | 110,700 | | 9,122 |
Beiersdorf AG | 103,200 | | 8,180 |
Commerzbank AG | 187,700 | | 7,962 |
DaimlerChrysler AG | 56,100 | | 6,179 |
DaimlerChrysler AG (Reg.) | 59,300 | | 6,532 |
Deutsche Boerse AG | 55,700 | | 8,788 |
Deutsche Postbank AG | 35,800 | | 2,617 |
E.ON AG | 114,979 | | 22,455 |
ESCADA AG (a)(d) | 103,388 | | 4,244 |
GFK AG | 62,893 | | 2,539 |
Henkel KGaA | 107,811 | | 4,998 |
Hochtief AG | 51,200 | | 7,070 |
Lanxess AG | 93,000 | | 4,644 |
Metro AG | 46,900 | | 4,256 |
MLP AG (d) | 430,400 | | 5,706 |
MPC Muenchmeyer Petersen Capital AG | 22,800 | | 1,856 |
Muenchener Rueckversicherungs-Gesellschaft AG (Reg.) | 15,700 | | 3,012 |
Q-Cells AG (a) | 43,100 | | 5,489 |
SAP AG sponsored ADR (d) | 80,900 | | 4,391 |
SGL Carbon AG (a) | 171,400 | | 10,000 |
Siemens AG sponsored ADR | 177,200 | | 24,165 |
Wincor Nixdorf AG | 50,100 | | 4,976 |
TOTAL GERMANY | | 171,077 |
Hong Kong - 1.0% |
China Unicom Ltd. | 3,988,000 | | 9,779 |
China Unicom Ltd. sponsored ADR | 191,100 | | 4,686 |
Dynasty Fine Wines Group Ltd. | 714,000 | | 316 |
TOTAL HONG KONG | | 14,781 |
India - 0.1% |
IVRCL Infrastructures & Projects Ltd. | 130,000 | | 1,693 |
Power Finance Corp. Ltd. | 4,320 | | 27 |
TOTAL INDIA | | 1,720 |
Ireland - 0.1% |
Allied Irish Banks PLC | 87,500 | | 2,218 |
Italy - 2.8% |
Alleanza Assicurazioni SpA | 456,700 | | 6,183 |
Antichi Pellettieri SpA | 92,300 | | 1,270 |
Common Stocks - continued |
| Shares | | Value (000s) |
Italy - continued |
Assicurazioni Generali SpA | 145,750 | | $ 6,924 |
Edison SpA (d) | 1,001,700 | | 3,406 |
ENI SpA | 117,991 | | 4,311 |
Intesa Sanpaolo SpA | 574,600 | | 4,543 |
Lottomatica SpA (d) | 56,000 | | 2,002 |
MARR SpA | 122,400 | | 1,401 |
Saipem SpA | 77,300 | | 3,418 |
Unicredito Italiano SpA | 1,062,400 | | 9,081 |
TOTAL ITALY | | 42,539 |
Japan - 12.1% |
Canon, Inc. | 212,200 | | 10,731 |
Daiwa Securities Group, Inc. | 399,700 | | 3,853 |
Fujifilm Holdings Corp. | 112,000 | | 5,369 |
Ibiden Co. Ltd. | 69,500 | | 5,892 |
Japan Steel Works Ltd. | 280,000 | | 4,581 |
Japan Tobacco, Inc. | 1,029 | | 5,999 |
KDDI Corp. | 373 | | 2,818 |
Kinden Corp. | 253,000 | | 2,250 |
Konica Minolta Holdings, Inc. | 276,000 | | 4,833 |
Matsui Securities Co. Ltd. (d) | 251,700 | | 2,000 |
Millea Holdings, Inc. | 127,720 | | 5,014 |
Mitsubishi Corp. | 98,100 | | 3,055 |
Mitsubishi Electric Corp. | 197,000 | | 2,402 |
Mitsubishi Estate Co. Ltd. | 208,000 | | 6,237 |
Mitsui & Co. Ltd. | 145,000 | | 3,762 |
Mitsui Fudosan Co. Ltd. | 139,000 | | 3,846 |
Mizuho Financial Group, Inc. | 320 | | 1,799 |
Murata Manufacturing Co. Ltd. | 46,300 | | 2,818 |
Nafco Co. Ltd. | 61,100 | | 1,275 |
Namco Bandai Holdings, Inc. | 128,500 | | 1,982 |
NGK Insulators Ltd. | 244,000 | | 8,652 |
Nidec Corp. | 58,100 | | 4,366 |
Nintendo Co. Ltd. | 11,300 | | 7,096 |
Nippon Steel Corp. | 494,000 | | 3,284 |
Nomura Holdings, Inc. | 372,200 | | 6,636 |
Nomura Holdings, Inc. sponsored ADR | 37,000 | | 660 |
NSK Ltd. | 570,000 | | 5,055 |
NTT DoCoMo, Inc. | 3,235 | | 4,723 |
ORIX Corp. | 9,210 | | 1,890 |
Point, Inc. (d) | 45,360 | | 2,303 |
SHIMIZU Corp. | 367,000 | | 1,921 |
Common Stocks - continued |
| Shares | | Value (000s) |
Japan - continued |
Sompo Japan Insurance, Inc. | 198,700 | | $ 2,337 |
Sony Corp. | 37,700 | | 1,865 |
Sony Corp. sponsored ADR | 57,900 | | 2,864 |
Stanley Electric Co. Ltd. | 129,100 | | 2,872 |
Sumitomo Forestry Co. Ltd. | 216,000 | | 1,619 |
Sumitomo Metal Industries Ltd. | 688,000 | | 3,406 |
Sumitomo Mitsui Financial Group, Inc. | 1,785 | | 14,625 |
T&D Holdings, Inc. | 131,100 | | 7,892 |
Tokuyama Corp. | 224,000 | | 3,129 |
Toyota Motor Corp. | 271,500 | | 15,535 |
USS Co. Ltd. | 48,180 | | 3,157 |
TOTAL JAPAN | | 186,403 |
Korea (South) - 0.3% |
Doosan Heavy Industries & Construction Co. Ltd. | 29,670 | | 5,479 |
Luxembourg - 1.0% |
ArcelorMittal SA | 77,500 | | 6,220 |
ArcelorMittal SA (NY Shares) Class A | 56,800 | | 4,541 |
SES SA (A Shares) FDR unit | 213,304 | | 5,130 |
TOTAL LUXEMBOURG | | 15,891 |
Malaysia - 0.7% |
DiGi.com Bhd | 512,400 | | 3,859 |
Gamuda Bhd | 4,934,000 | | 6,803 |
TOTAL MALAYSIA | | 10,662 |
Netherlands - 3.5% |
ABN AMRO Holding NV | 98,110 | | 5,303 |
Heineken NV (Bearer) | 76,500 | | 5,340 |
ING Groep NV (Certificaten Van Aandelen) | 48,946 | | 2,202 |
Koninklijke Ahold NV sponsored ADR | 575,200 | | 8,657 |
Koninklijke KPN NV | 246,700 | | 4,654 |
Koninklijke Philips Electronics NV (NY Shares) | 269,000 | | 11,120 |
SBM Offshore NV | 192,900 | | 7,423 |
Unilever NV (NY Shares) | 265,500 | | 8,618 |
TOTAL NETHERLANDS | | 53,317 |
Norway - 1.5% |
Acta Holding ASA (d) | 577,400 | | 2,292 |
Aker Kvaerner ASA | 279,150 | | 9,727 |
Marine Harvest ASA (a) | 3,110,000 | | 3,153 |
Common Stocks - continued |
| Shares | | Value (000s) |
Norway - continued |
Petroleum Geo-Services ASA | 136,100 | | $ 4,007 |
StatoilHydro ASA | 119,200 | | 4,034 |
TOTAL NORWAY | | 23,213 |
Panama - 0.8% |
McDermott International, Inc. (a) | 198,600 | | 12,127 |
Portugal - 0.2% |
Energias de Portugal SA | 513,200 | | 3,301 |
South Africa - 1.2% |
Bell Equipment Ltd. | 197,322 | | 1,579 |
Exxaro Resources Ltd. | 244,600 | | 3,956 |
Impala Platinum Holdings Ltd. | 82,700 | | 3,105 |
JSE Ltd. | 303,700 | | 4,042 |
Murray & Roberts Holdings Ltd. | 348,500 | | 5,336 |
TOTAL SOUTH AFRICA | | 18,018 |
Spain - 1.7% |
Banco Santander Central Hispano SA sponsored ADR | 328,100 | | 7,123 |
Telefonica SA | 495,148 | | 16,414 |
Telefonica SA sponsored ADR | 28,000 | | 2,785 |
TOTAL SPAIN | | 26,322 |
Sweden - 1.8% |
Scania AB (B Shares) | 272,700 | | 7,447 |
Skandinaviska Enskilda Banken AB (A Shares) | 133,000 | | 4,071 |
Svenska Cellulosa AB (SCA) (B Shares) | 254,400 | | 4,484 |
Swedish Match Co. | 400,600 | | 8,953 |
Telefonaktiebolaget LM Ericsson (B Shares) sponsored ADR | 95,200 | | 2,861 |
TOTAL SWEDEN | | 27,816 |
Switzerland - 7.3% |
ABB Ltd.: | | | |
(Reg.) | 851,342 | | 25,607 |
sponsored ADR | 530,400 | | 16,029 |
Compagnie Financiere Richemont unit | 105,445 | | 7,524 |
Credit Suisse Group (Reg.) | 19,410 | | 1,314 |
EFG International | 60,660 | | 2,836 |
Julius Baer Holding AG (Bearer) | 96,693 | | 8,365 |
Nestle SA (Reg.) | 28,324 | | 13,086 |
Roche Holding AG (participation certificate) | 91,397 | | 15,620 |
Schindler Holding AG (Reg.) | 38,456 | | 2,653 |
SGS Societe Generale de Surveillance Holding SA (Reg.) | 8,035 | | 10,530 |
Common Stocks - continued |
| Shares | | Value (000s) |
Switzerland - continued |
Sonova Holding AG | 35,504 | | $ 3,985 |
UBS AG (Reg.) | 53,543 | | 2,875 |
Zurich Financial Services AG (Reg.) | 7,048 | | 2,122 |
TOTAL SWITZERLAND | | 112,546 |
Thailand - 0.2% |
Bangkok Bank Ltd. PCL (For. Reg.) | 281,900 | | 1,063 |
Krung Thai Bank Public Co. Ltd. | 2,697,800 | | 911 |
Siam Commercial Bank PCL (For. Reg.) | 473,200 | | 1,323 |
TOTAL THAILAND | | 3,297 |
United Kingdom - 20.4% |
Aegis Group PLC | 1,076,000 | | 2,819 |
Alfred McAlpine Group PLC | 202,800 | | 2,359 |
Anglo American PLC: | | | |
ADR | 98,046 | | 3,427 |
(United Kingdom) | 113,659 | | 7,831 |
Barclays PLC | 295,600 | | 3,758 |
BG Group PLC | 600,500 | | 11,079 |
BHP Billiton PLC | 278,202 | | 10,590 |
BP PLC | 1,607,708 | | 20,898 |
BP PLC sponsored ADR | 19,700 | | 1,536 |
British American Tobacco PLC | 156,900 | | 6,016 |
BT Group PLC | 103,000 | | 701 |
BT Group PLC sponsored ADR | 36,900 | | 2,513 |
Burberry Group PLC | 222,800 | | 2,849 |
Cadbury Schweppes PLC sponsored ADR | 84,200 | | 4,483 |
Climate Exchange PLC (a) | 42,200 | | 1,052 |
Diageo PLC | 486,900 | | 11,168 |
GlaxoSmithKline PLC | 564,900 | | 14,476 |
Gyrus Group PLC (a) | 567,200 | | 5,041 |
HBOS plc | 272,800 | | 4,951 |
HSBC Holdings PLC: | | | |
(Hong Kong) (Reg.) | 150,400 | | 2,994 |
(United Kingdom) (Reg.) | 343,567 | | 6,838 |
sponsored ADR | 122,700 | | 12,211 |
Imperial Tobacco Group PLC sponsored ADR | 4,300 | | 437 |
Informa PLC | 217,500 | | 2,419 |
InterContinental Hotel Group PLC | 146,573 | | 3,413 |
International Power PLC | 1,006,500 | | 10,233 |
Intertek Group PLC | 233,700 | | 5,000 |
Jardine Lloyd Thompson Group PLC | 795,200 | | 6,332 |
Common Stocks - continued |
| Shares | | Value (000s) |
United Kingdom - continued |
Lloyds TSB Group PLC | 119,000 | | $ 1,350 |
M&C Saatchi | 500,100 | | 1,544 |
Man Group plc | 1,937,182 | | 23,682 |
Misys PLC | 109,500 | | 550 |
Prudential PLC | 656,200 | | 10,669 |
Reed Elsevier PLC | 1,037,700 | | 13,549 |
Reuters Group PLC | 610,100 | | 8,463 |
Rio Tinto PLC (Reg.) | 71,618 | | 6,714 |
Royal Bank of Scotland Group PLC | 554,400 | | 5,953 |
Royal Dutch Shell PLC: | | | |
Class A sponsored ADR | 163,000 | | 14,264 |
Class A (United Kingdom) | 232,600 | | 10,180 |
Class B | 65,800 | | 2,871 |
RPS Group PLC | 410,600 | | 3,325 |
Speymill Group PLC (a) | 309,000 | | 610 |
SSL International PLC | 158,300 | | 1,695 |
Taylor Nelson Sofres PLC | 1,741,300 | | 7,802 |
Tesco PLC | 496,000 | | 5,084 |
Vodafone Group PLC | 5,823,569 | | 22,869 |
Vodafone Group PLC sponsored ADR | 43,400 | | 1,704 |
Xstrata PLC | 50,266 | | 3,602 |
TOTAL UNITED KINGDOM | | 313,904 |
United States of America - 1.9% |
ADA-ES, Inc. (a) | 71,200 | | 797 |
Alexander & Baldwin, Inc. | 59,000 | | 3,090 |
American Superconductor Corp. (a)(d) | 70,000 | | 1,901 |
Calgon Carbon Corp. (a)(d) | 671,000 | | 9,998 |
Fluor Corp. | 20,900 | | 3,302 |
Fuel Tech, Inc. (a)(d) | 106,100 | | 3,137 |
Hypercom Corp. (a) | 258,800 | | 1,400 |
Sunpower Corp. Class A (a) | 48,400 | | 6,121 |
TOTAL UNITED STATES OF AMERICA | | 29,746 |
TOTAL COMMON STOCKS (Cost $1,092,404) | 1,485,510 |
Nonconvertible Preferred Stocks - 0.4% |
| | | |
Germany - 0.4% |
Porsche AG
(Cost $2,858) | 2,549 | | 6,791 |
Money Market Funds - 3.1% |
| Shares | | Value (000s) |
Fidelity Cash Central Fund, 4.97% (b) | 33,119,692 | | $ 33,120 |
Fidelity Securities Lending Cash Central Fund, 5.02% (b)(c) | 14,007,687 | | 14,008 |
TOTAL MONEY MARKET FUNDS (Cost $47,128) | 47,128 |
TOTAL INVESTMENT PORTFOLIO - 100.0% (Cost $1,142,390) | | 1,539,429 |
NET OTHER ASSETS - 0.0% | | (161) |
NET ASSETS - 100% | $ 1,539,268 |
Legend |
(a) Non-income producing |
(b) Affiliated fund that is available only to investment companies and other accounts managed by Fidelity Investments. The rate quoted is the annualized seven-day yield of the fund at period end. A complete unaudited listing of the fund's holdings as of its most recent quarter end is available upon request. |
(c) Investment made with cash collateral received from securities on loan. |
(d) Security or a portion of the security is on loan at period end. |
Affiliated Central Funds |
Information regarding fiscal year to date income earned by the Fund from investments in Fidelity Central Funds is as follows: |
Fund | Income earned
(Amounts in thousands) |
Fidelity Cash Central Fund | $ 1,611 |
Fidelity Securities Lending Cash Central Fund | 1,101 |
Total | $ 2,712 |
See accompanying notes which are an integral part of the financial statements.
Annual Report
Financial Statements
Statement of Assets and Liabilities
Amounts in thousands (except per-share amounts) | October 31, 2007 |
| | |
Assets | | |
Investment in securities, at value (including securities loaned of $13,512) - See accompanying schedule: Unaffiliated issuers (cost $1,095,262) | $ 1,492,301 | |
Fidelity Central Funds (cost $47,128) | 47,128 | |
Total Investments (cost $1,142,390) | | $ 1,539,429 |
Cash | | 1,564 |
Foreign currency held at value (cost $157) | | 158 |
Receivable for investments sold | | 19,052 |
Receivable for fund shares sold | | 1,433 |
Dividends receivable | | 1,901 |
Distributions receivable from Fidelity Central Funds | | 171 |
Other receivables | | 199 |
Total assets | | 1,563,907 |
| | |
Liabilities | | |
Payable for investments purchased | $ 6,336 | |
Payable for fund shares redeemed | 2,685 | |
Accrued management fee | 788 | |
Distribution fees payable | 376 | |
Other affiliated payables | 317 | |
Other payables and accrued expenses | 129 | |
Collateral on securities loaned, at value | 14,008 | |
Total liabilities | | 24,639 |
| | |
Net Assets | | $ 1,539,268 |
Net Assets consist of: | | |
Paid in capital | | $ 1,017,548 |
Undistributed net investment income | | 16,730 |
Accumulated undistributed net realized gain (loss) on investments and foreign currency transactions | | 108,013 |
Net unrealized appreciation (depreciation) on investments and assets and liabilities in foreign currencies | | 396,977 |
Net Assets | | $ 1,539,268 |
See accompanying notes which are an integral part of the financial statements.
Annual Report
Financial Statements - continued
Statement of Assets and Liabilities - continued
Amounts in thousands (except per-share amounts) | October 31, 2007 |
| | |
Calculation of Maximum Offering Price
Class A:
Net Asset Value and redemption price per share ($146,636 ÷ 5,460.8 shares) | | $ 26.85 |
| | |
Maximum offering price per share (100/94.25 of $26.85) | | $ 28.49 |
Class T:
Net Asset Value and redemption price per share ($710,179 ÷ 25,963.0 shares) | | $ 27.35 |
| | |
Maximum offering price per share (100/96.50 of $27.35) | | $ 28.34 |
Class B:
Net Asset Value and offering price per share ($27,098 ÷ 1,050.7 shares)A | | $ 25.79 |
| | |
Class C:
Net Asset Value and offering price per share ($45,931 ÷ 1,751.7 shares)A | | $ 26.22 |
| | |
Institutional Class:
Net Asset Value, offering price and redemption price per share ($609,424 ÷ 22,280.6 shares) | | $ 27.35 |
A Redemption price per share is equal to net asset value less any applicable contingent deferred sales charge.
See accompanying notes which are an integral part of the financial statements.
Annual Report
Statement of Operations
Amounts in thousands | Year ended October 31, 2007 |
| | |
Investment Income | | |
Dividends | | $ 32,277 |
Interest | | 23 |
Income from Fidelity Central Funds | | 2,712 |
| | 35,012 |
Less foreign taxes withheld | | (2,596) |
Total income | | 32,416 |
| | |
Expenses | | |
Management fee
Basic fee | $ 9,302 | |
Performance adjustment | (2,297) | |
Transfer agent fees | 3,010 | |
Distribution fees | 4,312 | |
Accounting and security lending fees | 609 | |
Custodian fees and expenses | 276 | |
Independent trustees' compensation | 5 | |
Registration fees | 88 | |
Audit | 96 | |
Legal | 22 | |
Miscellaneous | 19 | |
Total expenses before reductions | 15,442 | |
Expense reductions | (425) | 15,017 |
Net investment income (loss) | | 17,399 |
Realized and Unrealized Gain (Loss) Net realized gain (loss) on: | | |
Investment securities: | | |
Unaffiliated issuers (net of foreign taxes of $162) | 114,111 | |
Foreign currency transactions | 92 | |
Total net realized gain (loss) | | 114,203 |
Change in net unrealized appreciation (depreciation) on: Investment securities (net of decrease in deferred foreign taxes of $203) | 232,130 | |
Assets and liabilities in foreign currencies | (27) | |
Total change in net unrealized appreciation (depreciation) | | 232,103 |
Net gain (loss) | | 346,306 |
Net increase (decrease) in net assets resulting from operations | | $ 363,705 |
See accompanying notes which are an integral part of the financial statements.
Annual Report
Financial Statements - continued
Statement of Changes in Net Assets
Amounts in thousands | Year ended
October 31,
2007 | Year ended
October 31,
2006 |
Increase (Decrease) in Net Assets | | |
Operations | | |
Net investment income (loss) | $ 17,399 | $ 14,401 |
Net realized gain (loss) | 114,203 | 69,279 |
Change in net unrealized appreciation (depreciation) | 232,103 | 140,902 |
Net increase (decrease) in net assets resulting
from operations | 363,705 | 224,582 |
Distributions to shareholders from net investment income | (11,581) | (8,558) |
Distributions to shareholders from net realized gain | (55,423) | (17,171) |
Total distributions | (67,004) | (25,729) |
Share transactions - net increase (decrease) | 96,150 | (138,085) |
Redemption fees | 58 | 72 |
Total increase (decrease) in net assets | 392,909 | 60,840 |
| | |
Net Assets | | |
Beginning of period | 1,146,359 | 1,085,519 |
End of period (including undistributed net investment income of $16,730 and undistributed net investment income of $13,279, respectively) | $ 1,539,268 | $ 1,146,359 |
See accompanying notes which are an integral part of the financial statements.
Annual Report
Financial Highlights - Class A
Years Ended October 31, | 2007 | 2006 | 2005 | 2004 | 2003 |
Selected Per-Share Data | | | | | |
Net asset value, beginning of period | $ 21.67 | $ 18.36 | $ 15.86 | $ 14.41 | $ 11.01 |
Income from Investment Operations | | | | | |
Net investment income (loss) C | .31 | .27 | .13 | .04 F | .05 |
Net realized and unrealized gain (loss) | 6.16 | 3.53 | 2.47 | 1.54 | 3.35 |
Total from investment operations | 6.47 | 3.80 | 2.60 | 1.58 | 3.40 |
Distributions from net investment income | (.23) | (.19) | (.04) | (.13) | - |
Distributions from net realized gain | (1.06) | (.30) | (.06) | - | - |
Total distributions | (1.29) | (.49) | (.10) | (.13) | - |
Redemption fees added to paid in capital C | - H | - H | - H | - H | - |
Net asset value, end of period | $ 26.85 | $ 21.67 | $ 18.36 | $ 15.86 | $ 14.41 |
Total Return A,B | 31.44% | 21.12% | 16.44% | 11.03% | 30.88% |
Ratios to Average Net Assets D,G | | | | | |
Expenses before reductions | 1.17% | 1.24% | 1.24% | 1.36% | 1.34% |
Expenses net of fee waivers,
if any | 1.17% | 1.24% | 1.24% | 1.36% | 1.34% |
Expenses net of all reductions | 1.13% | 1.17% | 1.15% | 1.32% | 1.30% |
Net investment income (loss) | 1.34% | 1.31% | .76% | .24% F | .43% |
Supplemental Data | | | | | |
Net assets, end of period (in millions) | $ 147 | $ 113 | $ 133 | $ 115 | $ 68 |
Portfolio turnover rate E | 66% | 65% | 120% | 85% | 99% |
A Total returns would have been lower had certain expenses not been reduced during the periods shown.
B Total returns do not include the effect of the sales charges.
C Calculated based on average shares outstanding during the period.
D Fees and expenses of the underlying Fidelity Central Funds are not included in the Fund's expense ratio. The Fund indirectly bears its proportionate share of the expenses of any underlying Fidelity Central Funds.
E Amount does not include the portfolio activity of any underlying Fidelity Central Funds.
F Net investment income per share includes approximately $.01 per share received as a result of a reorganization of an issuer that was in bankruptcy. Excluding this non-recurring amount, the ratio of net investment income (loss) to average net assets would have been .21%.
G Expense ratios reflect operating expenses of the class. Expenses before reductions do not reflect amounts reimbursed by the investment adviser or reductions from brokerage service arrangements or other expense offset arrangements and do not represent the amount paid by the class during periods when reimbursements or reductions occur. Expenses net of fee waivers reflect expenses after reimbursement by the investment adviser but prior to reductions from brokerage service arrangements or other expense offset arrangements. Expenses net of all reductions represent the net expenses paid by the class.
H Amount represents less than $.01 per share.
See accompanying notes which are an integral part of the financial statements.
Annual Report
Financial Highlights - Class T
Years Ended October 31, | 2007 | 2006 | 2005 | 2004 | 2003 |
Selected Per-Share Data | | | | | |
Net asset value, beginning of period | $ 22.05 | $ 18.64 | $ 16.09 | $ 14.61 | $ 11.18 |
Income from Investment Operations | | | | | |
Net investment income (loss) C | .28 | .24 | .11 | .02 F | .04 |
Net realized and unrealized gain (loss) | 6.27 | 3.59 | 2.51 | 1.56 | 3.39 |
Total from investment operations | 6.55 | 3.83 | 2.62 | 1.58 | 3.43 |
Distributions from net investment income | (.19) | (.12) | (.01) | (.10) | - |
Distributions from net realized gain | (1.06) | (.30) | (.06) | - | - |
Total distributions | (1.25) | (.42) | (.07) | (.10) | - |
Redemption fees added to paid in capital C | - H | - H | - H | - H | - |
Net asset value, end of period | $ 27.35 | $ 22.05 | $ 18.64 | $ 16.09 | $ 14.61 |
Total Return A,B | 31.24% | 20.92% | 16.31% | 10.86% | 30.68% |
Ratios to Average Net Assets D,G | | | | | |
Expenses before reductions | 1.33% | 1.39% | 1.36% | 1.48% | 1.46% |
Expenses net of fee waivers,
if any | 1.33% | 1.39% | 1.36% | 1.48% | 1.46% |
Expenses net of all reductions | 1.30% | 1.33% | 1.27% | 1.43% | 1.42% |
Net investment income (loss) | 1.17% | 1.15% | .64% | .12% F | .31% |
Supplemental Data | | | | | |
Net assets, end of period (in millions) | $ 710 | $ 602 | $ 582 | $ 1,181 | $ 1,114 |
Portfolio turnover rate E | 66% | 65% | 120% | 85% | 99% |
A Total returns would have been lower had certain expenses not been reduced during the periods shown.
B Total returns do not include the effect of the sales charges.
C Calculated based on average shares outstanding during the period.
D Fees and expenses of the underlying Fidelity Central Funds are not included in the Fund's expense ratio. The Fund indirectly bears its proportionate share of the expenses of any underlying Fidelity Central Funds.
E Amount does not include the portfolio activity of any underlying Fidelity Central Funds.
F Net investment income per share includes approximately $.01 per share received as a result of a reorganization of an issuer that was in bankruptcy. Excluding this non-recurring amount, the ratio of net investment income (loss) to average net assets would have been .09%.
G Expense ratios reflect operating expenses of the class. Expenses before reductions do not reflect amounts reimbursed by the investment adviser or reductions from brokerage service arrangements or other expense offset arrangements and do not represent the amount paid by the class during periods when reimbursements or reductions occur. Expenses net of fee waivers reflect expenses after reimbursement by the investment adviser but prior to reductions from brokerage service arrangements or other expense offset arrangements. Expenses net of all reductions represent the net expenses paid by the class.
H Amount represents less than $.01 per share.
See accompanying notes which are an integral part of the financial statements.
Annual Report
Financial Highlights - Class B
Years Ended October 31, | 2007 | 2006 | 2005 | 2004 | 2003 |
Selected Per-Share Data | | | | | |
Net asset value, beginning of period | $ 20.81 | $ 17.63 | $ 15.26 | $ 13.87 | $ 10.71 |
Income from Investment Operations | | | | | |
Net investment income (loss) C | .12 | .10 | (.01) | (.10) F | (.06) |
Net realized and unrealized gain (loss) | 5.94 | 3.40 | 2.38 | 1.50 | 3.22 |
Total from investment operations | 6.06 | 3.50 | 2.37 | 1.40 | 3.16 |
Distributions from net investment income | (.02) | (.02) | - | (.01) | - |
Distributions from net realized gain | (1.06) | (.30) | - | - | - |
Total distributions | (1.08) | (.32) | - | (.01) | - |
Redemption fees added to paid in capital C | - H | - H | - H | - H | - |
Net asset value, end of period | $ 25.79 | $ 20.81 | $ 17.63 | $ 15.26 | $ 13.87 |
Total Return A,B | 30.45% | 20.12% | 15.53% | 10.10% | 29.51% |
Ratios to Average Net Assets D,G | | | | | |
Expenses before reductions | 1.94% | 2.05% | 2.04% | 2.25% | 2.27% |
Expenses net of fee waivers,
if any | 1.94% | 2.05% | 2.04% | 2.25% | 2.27% |
Expenses net of all reductions | 1.91% | 1.99% | 1.95% | 2.21% | 2.22% |
Net investment income (loss) | .56% | .49% | (.04)% | (.65)% F | (.49)% |
Supplemental Data | | | | | |
Net assets, end of period (in millions) | $ 27 | $ 37 | $ 47 | $ 57 | $ 59 |
Portfolio turnover rate E | 66% | 65% | 120% | 85% | 99% |
A Total returns would have been lower had certain expenses not been reduced during the periods shown.
B Total returns do not include the effect of the contingent deferred sales charge.
C Calculated based on average shares outstanding during the period.
D Fees and expenses of the underlying Fidelity Central Funds are not included in the Fund's expense ratio. The Fund indirectly bears its proportionate share of the expenses of any underlying Fidelity Central Funds.
E Amount does not include the portfolio activity of any underlying Fidelity Central Funds.
F Net investment income per share includes approximately $.01 per share received as a result of a reorganization of an issuer that was in bankruptcy. Excluding this non-recurring amount, the ratio of net investment income (loss) to average net assets would have been (.68)%.
G Expense ratios reflect operating expenses of the class. Expenses before reductions do not reflect amounts reimbursed by the investment adviser or reductions from brokerage service arrangements or other expense offset arrangements and do not represent the amount paid by the class during periods when reimbursements or reductions occur. Expenses net of fee waivers reflect expenses after reimbursement by the investment adviser but prior to reductions from brokerage service arrangements or other expense offset arrangements. Expenses net of all reductions represent the net expenses paid by the class.
H Amount represents less than $.01 per share.
See accompanying notes which are an integral part of the financial statements.
Annual Report
Financial Highlights - Class C
Years Ended October 31, | 2007 | 2006 | 2005 | 2004 | 2003 |
Selected Per-Share Data | | | | | |
Net asset value, beginning of period | $ 21.19 | $ 17.95 | $ 15.53 | $ 14.11 | $ 10.88 |
Income from Investment Operations | | | | | |
Net investment income (loss) C | .14 | .11 | - H | (.08) F | (.05) |
Net realized and unrealized gain (loss) | 6.02 | 3.47 | 2.42 | 1.52 | 3.28 |
Total from investment operations | 6.16 | 3.58 | 2.42 | 1.44 | 3.23 |
Distributions from net investment income | (.07) | (.04) | - | (.02) | - |
Distributions from net realized gain | (1.06) | (.30) | - | - | - |
Total distributions | (1.13) | (.34) | - | (.02) | - |
Redemption fees added to paid in capital C | - H | - H | - H | - H | - |
Net asset value, end of period | $ 26.22 | $ 21.19 | $ 17.95 | $ 15.53 | $ 14.11 |
Total Return A,B | 30.48% | 20.22% | 15.58% | 10.21% | 29.69% |
Ratios to Average Net Assets D,G | | | | | |
Expenses before reductions | 1.91% | 1.98% | 2.00% | 2.14% | 2.17% |
Expenses net of fee waivers,
if any | 1.91% | 1.98% | 2.00% | 2.14% | 2.17% |
Expenses net of all reductions | 1.87% | 1.92% | 1.90% | 2.10% | 2.13% |
Net investment income (loss) | .60% | .56% | .01% | (.54)% F | (.40)% |
Supplemental Data | | | | | |
Net assets, end of period (in millions) | $ 46 | $ 41 | $ 38 | $ 40 | $ 41 |
Portfolio turnover rate E | 66% | 65% | 120% | 85% | 99% |
A Total returns would have been lower had certain expenses not been reduced during the periods shown.
B Total returns do not include the effect of the contingent deferred sales charge.
C Calculated based on average shares outstanding during the period.
D Fees and expenses of the underlying Fidelity Central Funds are not included in the Fund's expense ratio. The Fund indirectly bears its proportionate share of the expenses of any underlying Fidelity Central Funds.
E Amount does not include the portfolio activity of any underlying Fidelity Central Funds.
F Net investment income per share includes approximately $.01 per share received as a result of a reorganization of an issuer that was in bankruptcy. Excluding this non-recurring amount, the ratio of net investment income (loss) to average net assets would have been (.57)%.
G Expense ratios reflect operating expenses of the class. Expenses before reductions do not reflect amounts reimbursed by the investment adviser or reductions from brokerage service arrangements or other expense offset arrangements and do not represent the amount paid by the class during periods when reimbursements or reductions occur. Expenses net of fee waivers reflect expenses after reimbursement by the investment adviser but prior to reductions from brokerage service arrangements or other expense offset arrangements. Expenses net of all reductions represent the net expenses paid by the class.
H Amount represents less than $.01 per share.
See accompanying notes which are an integral part of the financial statements.
Annual Report
Financial Highlights - Institutional Class
Years Ended October 31, | 2007 | 2006 | 2005 | 2004 | 2003 |
Selected Per-Share Data | | | | | |
Net asset value, beginning of period | $ 22.06 | $ 18.64 | $ 16.09 | $ 14.60 | $ 11.11 |
Income from Investment Operations | | | | | |
Net investment income (loss) B | .40 | .35 | .21 | .10 E | .10 |
Net realized and unrealized gain (loss) | 6.26 | 3.58 | 2.50 | 1.56 | 3.39 |
Total from investment operations | 6.66 | 3.93 | 2.71 | 1.66 | 3.49 |
Distributions from net investment income | (.31) | (.21) | (.10) | (.17) | - |
Distributions from net realized gain | (1.06) | (.30) | (.06) | - | - |
Total distributions | (1.37) | (.51) | (.16) | (.17) | - |
Redemption fees added to paid in capital B | - G | - G | - G | - G | - |
Net asset value, end of period | $ 27.35 | $ 22.06 | $ 18.64 | $ 16.09 | $ 14.60 |
Total Return A | 31.88% | 21.55% | 16.91% | 11.46% | 31.41% |
Ratios to Average Net Assets C,F | | | | | |
Expenses before reductions | .84% | .87% | .83% | .98% | .93% |
Expenses net of fee waivers, if any | .84% | .87% | .83% | .98% | .93% |
Expenses net of all reductions | .81% | .81% | .73% | .93% | .89% |
Net investment income (loss) | 1.66% | 1.67% | 1.18% | .62% E | .84% |
Supplemental Data | | | | | |
Net assets, end of period (in millions) | $ 609 | $ 354 | $ 287 | $ 194 | $ 69 |
Portfolio turnover rate D | 66% | 65% | 120% | 85% | 99% |
A Total returns would have been lower had certain expenses not been reduced during the periods shown.
B Calculated based on average shares outstanding during the period.
C Fees and expenses of the underlying Fidelity Central Funds are not included in the Fund's expense ratio. The Fund indirectly bears its proportionate share of the expenses of any underlying Fidelity Central Funds.
D Amount does not include the portfolio activity of any underlying Fidelity Central Funds.
E Net investment income per share includes approximately $.01 per share received as a result of a reorganization of an issuer that was in bankruptcy. Excluding this non-recurring amount, the ratio of net investment income (loss) to average net assets would have been .59%.
F Expense ratios reflect operating expenses of the class. Expenses before reductions do not reflect amounts reimbursed by the investment adviser or reductions from brokerage service arrangements or other expense offset arrangements and do not represent the amount paid by the class during periods when reimbursements or reductions occur. Expenses net of fee waivers reflect expenses after reimbursement by the investment adviser but prior to reductions from brokerage service arrangements or other expense offset arrangements. Expenses net of all reductions represent the net expenses paid by the class.
G Amount represents less than $.01 per share.
See accompanying notes which are an integral part of the financial statements.
Annual Report
Notes to Financial Statements
For the period ended October 31, 2007
(Amounts in thousands except ratios)
1. Organization.
Fidelity Advisor Overseas Fund (the Fund) is a fund of Fidelity Advisor Series VIII (the trust) and is authorized to issue an unlimited number of shares. The trust is registered under the Investment Company Act of 1940, as amended (the 1940 Act), as an open-end management investment company organized as a Massachusetts business trust.
The Fund offers Class A, Class T, Class B, Class C, and Institutional Class shares, each of which has equal rights as to assets and voting privileges. Each class has exclusive voting rights with respect to matters that affect that class. Class B shares will automatically convert to Class A shares after a holding period of seven years from the initial date of purchase. Investment income, realized and unrealized capital gains and losses, the common expenses of the Fund, and certain fund-level expense reductions, if any, are allocated on a pro rata basis to each class based on the relative net assets of each class to the total net assets of the Fund. Each class differs with respect to transfer agent and distribution and service plan fees incurred. Certain expense reductions also differ by class. The Fund's investments in emerging markets can be subject to social, economic, regulatory, and political uncertainties and can be extremely volatile.
2. Investments in Fidelity Central Funds.
The Fund may invest in Fidelity Central Funds, which are open-end investment companies available only to other investment companies and accounts managed by Fidelity Management & Research Company (FMR) and its affiliates. The Fund's Schedule of Investments lists each of the Fidelity Central Funds as an investment of the Fund, but does not include the underlying holdings of each Fidelity Central Fund. As an Investing Fund, the Fund indirectly bears its proportionate share of the expenses of the underlying Fidelity Central Funds.
The Money Market Central Funds seek preservation of capital and current income and are managed by Fidelity Investments Money Management, Inc. (FIMM), an affiliate of FMR.
A complete list of holdings for each Fidelity Central Fund is available upon request or at the SEC's web site at www.sec.gov. In addition, the financial statements of the Fidelity Central Funds, which are not covered by the Fund's Report of Independent Registered Public Accounting Firm, are available on the SEC's web site or upon request.
3. Significant Accounting Policies.
The financial statements have been prepared in conformity with accounting principles generally accepted in the United States of America, which require management to make certain estimates and assumptions at the date of the financial statements. The following summarizes the significant accounting policies of the Fund:
Annual Report
3. Significant Accounting Policies - continued
Security Valuation. Investments are valued and net asset value (NAV) per share is calculated (NAV calculation) as of the close of business of the New York Stock Exchange (NYSE), normally 4:00 p.m. Eastern time. Wherever possible, the Fund uses independent pricing services approved by the Board of Trustees to value its investments.
Equity securities, including restricted securities, for which market quotations are readily available, are valued at the last reported sale price or official closing price as reported by an independent pricing service on the primary market or exchange on which they are traded. In the event there were no sales during the day or closing prices are not available, securities are valued at the last quoted bid price. Investments in open-end mutual funds, including the Fidelity Central Funds, are valued at their closing net asset value each business day. Short-term securities with remaining maturities of sixty days or less for which quotations are not readily available are valued at amortized cost, which approximates value.
When current market prices or quotations are not readily available or do not accurately reflect fair value, valuations may be determined in accordance with procedures adopted by the Board of Trustees. For example, when developments occur between the close of a market and the close of the NYSE that may materially affect the value of some or all of the securities, or when trading in a security is halted, those securities may be fair valued. Factors used in the determination of fair value may include monitoring news to identify significant market or security specific events such as changes in the value of U.S. securities markets, reviewing developments in foreign markets and evaluating the performance of ADRs, futures contracts and exchange-traded funds. Because the Fund's utilization of fair value pricing depends on market activity, the frequency with which fair value pricing is used cannot be predicted and may be utilized to a significant extent. The value of securities used for NAV calculation under fair value pricing may differ from published prices for the same securities.
Foreign Currency. The Fund uses foreign currency contracts to facilitate transactions in foreign-denominated securities. Losses from these transactions may arise from changes in the value of the foreign currency or if the counterparties do not perform under the contracts' terms.
Foreign-denominated assets, including investment securities, and liabilities are translated into U.S. dollars at the exchange rate at period end. Purchases and sales of investment securities, income and dividends received and expenses denominated in foreign currencies are translated into U.S. dollars at the exchange rate in effect on the transaction date.
Annual Report
Notes to Financial Statements - continued
(Amounts in thousands except ratios)
3. Significant Accounting Policies - continued
Foreign Currency - continued
The effects of exchange rate fluctuations on investments are included with the net realized and unrealized gain (loss) on investment securities. Other foreign currency transactions resulting in realized and unrealized gain (loss) are disclosed separately.
Investment Transactions and Income. For financial reporting purposes, the Fund's investment holdings and NAV include trades executed through the end of the last business day of the period. The NAV for processing shareholder transactions includes trades executed through the end of the prior business day. Gains and losses on securities sold are determined on the basis of identified cost and may include proceeds received from litigation. Dividend income is recorded on the ex-dividend date, except for certain dividends from foreign securities where the ex-dividend date may have passed, which are recorded as soon as the Fund is informed of the ex-dividend date. Non-cash dividends included in dividend income, if any, are recorded at the fair market value of the securities received. Interest income and distributions from the Fidelity Central Funds are accrued as earned. Interest income includes coupon interest and amortization of premium and accretion of discount on debt securities. Investment income is recorded net of foreign taxes withheld where recovery of such taxes is uncertain.
Expenses. Most expenses of the trust can be directly attributed to a fund. Expenses which cannot be directly attributed are apportioned among each Fund in the trust. Expense estimates are accrued in the period to which they relate and adjustments are made when actual amounts are known.
Income Tax Information and Distributions to Shareholders. Each year, the Fund intends to qualify as a regulated investment company by distributing all of its taxable income and realized gains under Subchapter M of the Internal Revenue Code. As a result, no provision for income taxes is required in the accompanying financial statements. Foreign taxes are provided for based on the Fund's understanding of the tax rules and rates that exist in the foreign markets in which it invests.
Distributions are recorded on the ex-dividend date. Income dividends and capital gain distributions are declared separately for each class. Income and capital gain distributions are determined in accordance with income tax regulations, which may differ from generally accepted accounting principles. In addition, the Fund will claim a portion of the payment made to redeeming shareholders as a distribution for income tax purposes.
Annual Report
3. Significant Accounting Policies - continued
Income Tax Information and Distributions to Shareholders - continued
Capital accounts within the financial statements are adjusted for permanent book-tax differences. These adjustments have no impact on net assets or the results of operations. Temporary book-tax differences will reverse in a subsequent period.
Book-tax differences are primarily due to foreign currency transactions, certain foreign taxes, passive foreign investment companies (PFIC), deferred trustees compensation and losses deferred due to wash sales.
The tax-basis components of distributable earnings and the federal tax cost as of period end were as follows:
Unrealized appreciation | $ 416,168 | |
Unrealized depreciation | (24,449) | |
Net unrealized appreciation (depreciation) | 391,719 | |
Undistributed ordinary income | 23,976 | |
Undistributed long-term capital gain | 91,136 | |
| | |
Cost for federal income tax purposes | $ 1,147,710 | |
The tax character of distributions paid was as follows:
| October 31, 2007 | October 31, 2006 |
Ordinary Income | $ 40,861 | $ 17,144 |
Long-term Capital Gains | 26,143 | 8,585 |
Total | $ 67,004 | $ 25,729 |
Short-Term Trading (Redemption) Fees. Shares held in the Fund less than 30 days are subject to a redemption fee equal to 1.00% of the proceeds of the redeemed shares. All redemption fees, including any estimated redemption fees paid by FMR, are retained by the Fund and accounted for as an addition to paid in capital.
New Accounting Pronouncements. In July 2006, Financial Accounting Standards Board Interpretation No. 48, Accounting for Uncertainty in Income Taxes - an interpretation of FASB Statement 109 (FIN 48), was issued and is effective on the last business day of the semiannual reporting period for fiscal years beginning after December 15, 2006. FIN 48 sets forth a threshold for financial statement recognition, measurement and disclosure of a tax position taken or expected to be taken on a tax return. Management has concluded that the adoption of FIN 48 will not result in a material impact on the Fund's net assets, results of operations and financial statement disclosures.
In addition, in September 2006, Statement of Financial Accounting Standards No. 157, Fair Value Measurements (SFAS 157), was issued and is effective for fiscal years beginning after November 15, 2007. SFAS 157 defines fair value, establishes a framework for
Annual Report
Notes to Financial Statements - continued
(Amounts in thousands except ratios)
3. Significant Accounting Policies - continued
New Accounting Pronouncements - continued
measuring fair value and expands disclosures about fair value measurements. Management is currently evaluating the impact the adoption of SFAS 157 will have on the Fund's financial statement disclosures.
4. Operating Policies.
Repurchase Agreements. FMR has received an Exemptive Order from the Securities and Exchange Commission (the SEC) which permits the Fund and other affiliated entities of FMR to transfer uninvested cash balances into joint trading accounts which are then invested in repurchase agreements. The Fund may also invest directly with institutions in repurchase agreements. Repurchase agreements are collateralized by government or non-government securities. Upon settlement date, collateral is held in segregated accounts with custodian banks and may be obtained in the event of a default of the counterparty. The Fund monitors, on a daily basis, the value of the collateral to ensure it is at least equal to the principal amount of the repurchase agreement (including accrued interest). In the event of a default by the counterparty, realization of the collateral proceeds could be delayed, during which time the value of the collateral may decline.
5. Purchases and Sales of Investments.
Purchases and sales of securities, other than short-term securities, aggregated $906,445 and $840,758, respectively.
6. Fees and Other Transactions with Affiliates.
Management Fee. FMR and its affiliates provide the Fund with investment management related services for which the Fund pays a monthly management fee. The management fee is the sum of an individual fund fee rate that is based on an annual rate of .45% of the Fund's average net assets and a group fee rate that averaged ..26% during the period. The group fee rate is based upon the average net assets of all the mutual funds advised by FMR. The group fee rate decreases as assets under management increase and increases as assets under management decrease. In addition, the management fee is subject to a performance adjustment (up to a maximum of ± .20% of the Fund's average net assets over a 36 month performance period). The upward or downward adjustment to the management fee is based on the investment performance of the asset-weighted return of all classes as compared to an appropriate benchmark index. For the period, the total annual management fee rate, including the performance adjustment, was .53% of the Fund's average net assets.
Annual Report
6. Fees and Other Transactions with Affiliates - continued
Distribution and Service Plan. In accordance with Rule 12b-1 of the 1940 Act, the Fund has adopted separate Distribution and Service Plans for each class of shares. Certain classes pay Fidelity Distributors Corporation (FDC), an affiliate of FMR, separate Distribution and Service Fees, each of which is based on an annual percentage of each class' average net assets. In addition, FDC may pay financial intermediaries for selling shares of the Fund and providing shareholder support services. For the period, the Distribution and Service Fee rates and the total amounts paid to and retained by FDC were as follows:
| Distribution
Fee | Service
Fee | Paid to
FDC | Retained
by FDC |
Class A | 0% | .25% | $ 316 | $ 19 |
Class T | .25% | .25% | 3,252 | 43 |
Class B | .75% | .25% | 316 | 238 |
Class C | .75% | .25% | 428 | 19 |
| | | $ 4,312 | $ 319 |
Sales Load. FDC receives a front-end sales charge of up to 5.75% for selling Class A shares, and 3.50% for selling Class T shares, some of which is paid to financial intermediaries for selling shares of the Fund. FDC receives the proceeds of contingent deferred sales charges levied on Class A, Class T, Class B, and Class C redemptions. These charges depend on the holding period. The deferred sales charges range from 5% to 1% for Class B, 1% for Class C, 1.00% to .50% for certain purchases of Class A shares and .25% for certain purchases of Class T shares.
For the period, sales charge amounts retained by FDC were as follows:
| Retained
by FDC |
Class A | $ 20 |
Class T | 15 |
Class B* | 31 |
Class C* | 3 |
| $ 69 |
* When Class B and Class C shares are initially sold, FDC pays commissions from its own resources to financial intermediaries through which the sales are made.
Transfer Agent Fees. Fidelity Investments Institutional Operations Company, Inc. (FIIOC), an affiliate of FMR, is the transfer, dividend disbursing and shareholder servicing agent for each class of the Fund. FIIOC receives account fees and asset-based fees that vary according to the account size and type of account of the shareholders of the respective classes of the Fund. FIIOC pays for typesetting, printing and mailing of
Annual Report
Notes to Financial Statements - continued
(Amounts in thousands except ratios)
6. Fees and Other Transactions with Affiliates - continued
Transfer Agent Fees - continued
shareholder reports, except proxy statements. For the period, the total transfer agent fees paid by each class to FIIOC, were as follows:
| Amount | % of
Average
Net Assets |
Class A | $ 381 | .30 |
Class T | 1,379 | .21 |
Class B | 101 | .32 |
Class C | 123 | .29 |
Institutional Class | 1,026 | .22 |
| $ 3,010 | |
Accounting and Security Lending Fees. Fidelity Service Company, Inc. (FSC), an affiliate of FMR, maintains the Fund's accounting records. The accounting fee is based on the level of average net assets for the month. Under a separate contract, FSC administers the security lending program. The security lending fee is based on the number and duration of lending transactions.
7. Committed Line of Credit.
The Fund participates with other funds managed by FMR in a $4.2 billion credit facility (the "line of credit") to be utilized for temporary or emergency purposes to fund shareholder redemptions or for other short-term liquidity purposes. The Fund has agreed to pay commitment fees on its pro rata portion of the line of credit, which amounted to $3 and is reflected in Miscellaneous Expense on the Statement of Operations. During the period, there were no borrowings on this line of credit.
8. Security Lending.
The Fund lends portfolio securities from time to time in order to earn additional income. On the settlement date of the loan, the Fund receives collateral (in the form of U.S. Treasury obligations, letters of credit and/or cash) against the loaned securities and maintains collateral in an amount not less than 100% of the market value of the loaned securities during the period of the loan. The market value of the loaned securities is determined at the close of business of the Fund and any additional required collateral is delivered to the Fund on the next business day. If the borrower defaults on its obligation to return the securities loaned because of insolvency or other reasons, a fund could experience delays and costs in recovering the securities loaned or in gaining access to the collateral. Any cash collateral received is invested in the Fidelity Securities Lending Cash Central Fund. The value of loaned securities and cash collateral at period end are disclosed on the Fund's Statement of Assets and Liabilities. Security lending income represents the income earned on investing cash collateral, less fees and expenses
Annual Report
8. Security Lending - continued
associated with the loan, plus any premium payments that may be received on the loan of certain types of securities. Security lending income is presented in the Statement of Operations as a component of income from Fidelity Central Funds. Net income from lending portfolio securities during the period amounted to $1,101.
9. Expense Reductions.
Many of the brokers with whom FMR places trades on behalf of the Fund provided services to the Fund in addition to trade execution. These services included payments of certain expenses on behalf of the Fund totaling $369 for the period. In addition, through arrangements with the each class' transfer agent, credits realized as a result of uninvested cash balances were used to reduce the Fund's expenses. During the period, credits reduced each class' transfer agent expense as noted in the table below.
| Transfer Agent
expense reduction | |
Class A | $ 12 | |
Class T | 4 | |
Class C | 1 | |
Institutional Class | 19 | |
| $ 36 | |
10. Other.
The Fund's organizational documents provide former and current trustees and officers with a limited indemnification against liabilities arising in connection with the performance of their duties to the Fund. In the normal course of business, the Fund may also enter into contracts that provide general indemnifications. The Fund's maximum exposure under these arrangements is unknown as this would be dependent on future claims that may be made against the Fund. The risk of material loss from such claims is considered remote.
At the end of the period, the Fidelity Advisor Freedom Funds were the owners of record, in the aggregate of approximately 30% of the total outstanding shares of the Fund.
In September 2006, FIIOC, the Fund's transfer agent, notified the Fund that the Fund's books and records did not reflect a conversion of certain Class B to Class A shares upon their conversion date. In March 2007, FIIOC converted the relevant Class B shares to Class A shares and recorded the conversion in the books and records of the Fund which did not result in a material impact to the Fund's reported net assets or results of operations in the accompanying financial statements. FIIOC has remediated affected shareholders and reimbursed the Fund for all related audit and legal expenses.
Annual Report
Notes to Financial Statements - continued
(Amounts in thousands except ratios)
10. Other - continued
The United States Securities and Exchange Commission ("SEC") is conducting an investigation of FMR (covering the years 2002 to 2004) arising from gifts, gratuities and business entertainment provided by certain brokers to certain individuals who were employed on FMR's domestic equity trading desk during that period. FMR is in discussions with the SEC staff regarding the possible resolution of the matter, but as of period-end no final resolution has been reached.
In December 2006, the Independent Trustees completed their own investigation of the matter with the assistance of independent counsel. The Independent Trustees and FMR agree that, despite the absence of proof that the Fidelity mutual funds experienced diminished execution quality as a result of the improper receipt of gifts and business entertainment, the conduct at issue was serious and is worthy of redress. Accordingly, the Independent Trustees have requested and FMR has agreed to pay $42 million to Fidelity mutual funds, plus interest to be determined at the time that payment is made. A method of allocating this payment among the funds has not yet been determined. The total payment to the Fund is not anticipated to have a material impact on the Fund's net assets. In addition, FMR reimbursed related legal expenses which are recorded in the accompanying Statement of Operations as an expense reduction.
11. Distributions to Shareholders.
Distributions to shareholders of each class were as follows:
Years ended October 31, | 2007 | 2006 |
From net investment income | | |
Class A | $ 1,166 | $ 1,383 |
Class T | 5,197 | 3,667 |
Class B | 26 | 49 |
Class C | 137 | 78 |
Institutional Class | 5,055 | 3,381 |
Total | $ 11,581 | $ 8,558 |
From net realized gain | | |
Class A | $ 5,467 | $ 2,173 |
Class T | 28,690 | 8,871 |
Class B | 1,858 | 773 |
Class C | 2,010 | 614 |
Institutional Class | 17,398 | 4,740 |
Total | $ 55,423 | $ 17,171 |
Annual Report
12. Share Transactions.
Transactions for each class of shares were as follows:
| Shares | Dollars |
Years ended October 31, | 2007 | 2006 | 2007 | 2006 |
Class A | | | | |
Shares sold | 2,109 | 2,132 | $ 49,321 | $ 43,538 |
Reinvestment of distributions | 268 | 166 | 5,668 | 3,105 |
Shares redeemed | (2,108) | (4,335) | (48,883) | (88,388) |
Net increase (decrease) | 269 | (2,037) | $ 6,106 | $ (41,745) |
Class T | | | | |
Shares sold | 6,427 | 7,282 | $ 152,753 | $ 152,243 |
Reinvestment of distributions | 1,529 | 640 | 32,968 | 12,202 |
Shares redeemed | (9,269) | (11,860) | (220,331) | (244,457) |
Net increase (decrease) | (1,313) | (3,938) | $ (34,610) | $ (80,012) |
Class B | | | | |
Shares sold | 108 | 153 | $ 2,422 | $ 3,030 |
Reinvestment of distributions | 84 | 41 | 1,716 | 736 |
Shares redeemed | (936) | (1,046) | (20,830) | (20,618) |
Net increase (decrease) | (744) | (852) | $ (16,692) | $ (16,852) |
Class C | | | | |
Shares sold | 248 | 276 | $ 5,644 | $ 5,541 |
Reinvestment of distributions | 92 | 33 | 1,908 | 617 |
Shares redeemed | (512) | (477) | (11,719) | (9,538) |
Net increase (decrease) | (172) | (168) | $ (4,167) | $ (3,380) |
Institutional Class | | | | |
Shares sold | 6,884 | 8,789 | $ 164,033 | $ 181,221 |
Reinvestment of distributions | 1,020 | 258 | 21,884 | 4,909 |
Shares redeemed | (1,676) | (8,381) | (40,404) | (182,226) |
Net increase (decrease) | 6,228 | 666 | $ 145,513 | $ 3,904 |
Annual Report
Report of Independent Registered Public Accounting Firm
To the Trustees of Fidelity Advisor Series VIII and the Shareholders of Fidelity Advisor Overseas Fund:
In our opinion, the accompanying statement of assets and liabilities, including the schedule of investments, and the related statements of operations and of changes in net assets and the financial highlights present fairly, in all material respects, the financial position of Fidelity Advisor Overseas Fund (a fund of Fidelity Advisor Series VIII) at October 31, 2007, the results of its operations for the year then ended, the changes in its net assets for each of the two years in the period then ended and the financial highlights for each of the five years in the period then ended, in conformity with accounting principles generally accepted in the United States of America. These financial statements and financial highlights (hereafter referred to as "financial statements") are the responsibility of the Fidelity Advisor Overseas Fund's management. Our responsibility is to express an opinion on these financial statements based on our audits. We conducted our audits of these financial statements in accordance with the standards of the Public Company Accounting Oversight Board (United States). Those standards require that we plan and perform the audit to obtain reasonable assurance about whether the financial statements are free of material misstatement. An audit includes examining, on a test basis, evidence supporting the amounts and disclosures in the financial statements, assessing the accounting principles used and significant estimates made by management, and evaluating the overall financial statement presentation. We believe that our audits, which included confirmation of securities at October 31, 2007 by correspondence with the custodian and brokers, provide a reasonable basis for our opinion.
/s/ PricewaterhouseCoopers LLP
PricewaterhouseCoopers LLP
Boston, Massachusetts
December 18, 2007
Annual Report
Trustees and Officers
The Trustees, Members of the Advisory Board, and executive officers of the trust and fund, as applicable, are listed below. The Board of Trustees governs the fund and is responsible for protecting the interests of shareholders. The Trustees are experienced executives who meet periodically throughout the year to oversee the fund's activities, review contractual arrangements with companies that provide services to the fund, and review the fund's performance. Except for James C. Curvey, each of the Trustees oversees 370 funds advised by FMR or an affiliate. Mr. Curvey oversees 340 funds advised by FMR or an affiliate.
The Trustees hold office without limit in time except that (a) any Trustee may resign; (b) any Trustee may be removed by written instrument, signed by at least two-thirds of the number of Trustees prior to such removal; (c) any Trustee who requests to be retired or who has become incapacitated by illness or injury may be retired by written instrument signed by a majority of the other Trustees; and (d) any Trustee may be removed at any special meeting of shareholders by a two-thirds vote of the outstanding voting securities of the trust. Each Trustee who is not an interested person (as defined in the 1940 Act) (Independent Trustee), shall retire not later than the last day of the calendar year in which his or her 72nd birthday occurs. The Independent Trustees may waive this mandatory retirement age policy with respect to individual Trustees. The executive officers and Advisory Board Members hold office without limit in time, except that any officer and Advisory Board Member may resign or may be removed by a vote of a majority of the Trustees at any regular meeting or any special meeting of the Trustees. Except as indicated, each individual has held the office shown or other offices in the same company for the past five years.
The fund's Statement of Additional Information (SAI) includes more information about the Trustees. To request a free copy, call Fidelity at 1-877-208-0098.
Interested Trustees*:
Correspondence intended for each Trustee who is an interested person may be sent to Fidelity Investments, 82 Devonshire Street, Boston, Massachusetts 02109.
Name, Age; Principal Occupation |
Edward C. Johnson 3d (77) |
| Year of Election or Appointment: 1983 Mr. Johnson is Chairman of the Board of Trustees. Mr. Johnson serves as President (2006-present), Chief Executive Officer, Chairman, and a Director of FMR LLC; Chairman and a Director of FMR; Chairman and a Director of Fidelity Research & Analysis Company (FRAC); Chairman and a Director of Fidelity Investments Money Management, Inc.; and Chairman (2001-present) and a Director of FMR Co., Inc. In addition, Mr. Johnson serves as Chairman and Director of Fidelity International Limited (FIL). |
James C. Curvey (72) |
| Year of Election or Appointment: 2007 Mr. Curvey also serves as Trustee (2007-present) or Member of the Advisory Board (2007-present) of other investment companies advised by FMR. Mr. Curvey is a Director of FMR and FMR Co., Inc. (2007-present). Mr. Curvey is also Vice Chairman (2006-present) and Director of FMR LLC. Mr. Curvey joined Fidelity in 1982 and served in numerous senior management positions, including President and Chief Operating Officer of FMR LLC (1997-2000) and President of Fidelity Strategic Investments (2000-2002). In addition, he serves as a member of the Board of Directors of Geerlings & Wade, Inc. (wine distribution). |
* Trustees have been determined to be "Interested Trustees" by virtue of, among other things, their affiliation with the trust or various entities under common control with FMR. FMR Corp. merged with FMR LLC on October 1, 2007. Any references to FMR LLC for prior periods are deemed to be references to the prior entity.
Independent Trustees:
Correspondence intended for each Independent Trustee (that is, the Trustees other than the Interested Trustees) may be sent to Fidelity Investments, P.O. Box 55235, Boston, Massachusetts 02205-5235.
Name, Age; Principal Occupation |
Dennis J. Dirks (59) |
| Year of Election or Appointment: 2005 Prior to his retirement in May 2003, Mr. Dirks was Chief Operating Officer and a member of the Board of The Depository Trust & Clearing Corporation (DTCC) (1999-2003). He also served as President, Chief Operating Officer, and Board member of The Depository Trust Company (DTC) (1999-2003) and President and Board member of the National Securities Clearing Corporation (NSCC) (1999-2003). In addition, Mr. Dirks served as Chief Executive Officer and Board member of the Government Securities Clearing Corporation (2001-2003) and Chief Executive Officer and Board member of the Mortgage-Backed Securities Clearing Corporation (2001-2003). Mr. Dirks also serves as a Trustee and a member of the Finance Committee of Manhattan College (2005-present) and a Trustee and a member of the Finance Committee of AHRC of Nassau County (2006-present). |
Albert R. Gamper, Jr. (65) |
| Year of Election or Appointment: 2006 Prior to his retirement in December 2004, Mr. Gamper served as Chairman of the Board of CIT Group Inc. (commercial finance). During his tenure with CIT Group Inc. Mr. Gamper served in numerous senior management positions, including Chairman (1987-1989; 1999-2001; 2002-2004), Chief Executive Officer (1987-2004), and President (1989-2002). He currently serves as a member of the Board of Directors of Public Service Enterprise Group (utilities, 2001-present), Chairman of the Board of Governors, Rutgers University (2004-present), and Chairman of the Board of Saint Barnabas Health Care System. |
George H. Heilmeier (71) |
| Year of Election or Appointment: 2004 Dr. Heilmeier is Chairman Emeritus of Telcordia Technologies (communication software and systems), where prior to his retirement, he served as company Chairman and Chief Executive Officer. He currently serves on the Boards of Directors of The Mitre Corporation (systems engineering and information technology support for the government), and HRL Laboratories (private research and development, 2004-present). He is Chairman of the General Motors Science & Technology Advisory Board and a Life Fellow of the Institute of Electrical and Electronics Engineers (IEEE). Dr. Heilmeier is a member of the Defense Science Board and the National Security Agency Advisory Board. He is also a member of the National Academy of Engineering, the American Academy of Arts and Sciences, and the Board of Overseers of the School of Engineering and Applied Science of the University of Pennsylvania. Previously, Dr. Heilmeier served as a Director of TRW Inc. (automotive, space, defense, and information technology, 1992-2002), Compaq (1994-2002), Automatic Data Processing, Inc. (ADP) (technology-based business outsourcing, 1995-2002), INET Technologies Inc. (telecommunications network surveillance, 2001-2004), and Teletech Holdings (customer management services). He is the recipient of the 2005 Kyoto Prize in Advanced Technology for his invention of the liquid crystal display, and a member of the Consumer Electronics Hall of Fame. |
James H. Keyes (67) |
| Year of Election or Appointment: 2007 Prior to his retirement in 2003, Mr. Keyes was Chairman, President, and Chief Executive Officer of Johnson Controls, Inc. (automotive supplier, 1993-2003). He currently serves as a member of the boards of LSI Logic Corporation (semiconductor technologies), Navistar International Corporation (manufacture and sale of trucks, buses, and diesel engines, 2002-present), and Pitney Bowes, Inc. (integrated mail, messaging, and document management solutions). |
Marie L. Knowles (61) |
| Year of Election or Appointment: 2001 Prior to Ms. Knowles' retirement in June 2000, she served as Executive Vice President and Chief Financial Officer of Atlantic Richfield Company (ARCO) (diversified energy, 1996-2000). From 1993 to 1996, she was a Senior Vice President of ARCO and President of ARCO Transportation Company. She served as a Director of ARCO from 1996 to 1998. She currently serves as a Director of Phelps Dodge Corporation (copper mining and manufacturing) and McKesson Corporation (healthcare service, 2002-present). Ms. Knowles is a Trustee of the Brookings Institution and the Catalina Island Conservancy and also serves as a member of the Advisory Board for the School of Engineering of the University of Southern California. |
Ned C. Lautenbach (63) |
| Year of Election or Appointment: 2000 Mr. Lautenbach is Chairman of the Independent Trustees (2006-present). Mr. Lautenbach has been a partner of Clayton, Dubilier & Rice, Inc. (private equity investment firm) since September 1998. Previously, Mr. Lautenbach was with the International Business Machines Corporation (IBM) from 1968 until his retirement in 1998. Mr. Lautenbach serves as a Director of Sony Corporation (2006-present) and Eaton Corporation (diversified industrial) as well as the Philharmonic Center for the Arts in Naples, Florida. He also is a member of the Board of Trustees of Fairfield University (2005-present), as well as a member of the Council on Foreign Relations. |
Cornelia M. Small (63) |
| Year of Election or Appointment: 2005 Ms. Small is a member (2000-present) and Chairperson (2002-present) of the Investment Committee, and a member (2002-present) of the Board of Trustees of Smith College. Previously, she served as Chief Investment Officer (1999-2000), Director of Global Equity Investments (1996-1999), and a member of the Board of Directors of Scudder, Stevens & Clark (1990-1997) and Scudder Kemper Investments (1997-1999). In addition, Ms. Small served as Co-Chair (2000-2003) of the Annual Fund for the Fletcher School of Law and Diplomacy. |
William S. Stavropoulos (68) |
| Year of Election or Appointment: 2001 Mr. Stavropoulos is Chairman Emeritus of the Board of Directors of The Dow Chemical Company. Since joining The Dow Chemical Company in 1967, Mr. Stavropoulos served in numerous senior management positions, including President (1993-2000; 2002-2003), CEO (1995-2000; 2002-2004), and Chairman of the Executive Committee (2000-2004). Currently, he is a Director of NCR Corporation (data warehousing and technology solutions), Chemical Financial Corporation, Maersk Inc. (industrial conglomerate, 2002-present), Tyco International, Inc. (multinational manufacturing and services, 2007-present), and a member of the Advisory Board for Metalmark Capital (private equity investment firm, 2005-present). He is a special advisor to Clayton, Dubilier & Rice, Inc., a private equity investment firm. He also serves as a member of the Board of Trustees of the American Enterprise Institute for Public Policy Research. In addition, Mr. Stavropoulos is a member of The Business Council, J.P. Morgan International Council and the University of Notre Dame Advisory Council for the College of Science. |
Kenneth L. Wolfe (68) |
| Year of Election or Appointment: 2005 Prior to his retirement in 2001, Mr. Wolfe was Chairman and Chief Executive Officer of Hershey Foods Corporation (1993-2001). He currently serves as a member of the boards of Adelphia Communications Corporation (2003-present), Bausch & Lomb, Inc., and Revlon Inc. (2004-present). |
Advisory Board Members and Executive Officers**:
Correspondence intended for Mr. Mauriello, Mr. Thomas, and Mr. Wiley may be sent to Fidelity Investments, P.O. Box 55235, Boston, Massachusetts 02205-5235. Correspondence intended for each executive officer and Mr. Lynch may be sent to Fidelity Investments, 82 Devonshire Street, Boston, Massachusetts 02109.
Name, Age; Principal Occupation |
Peter S. Lynch (63) |
| Year of Election or Appointment: 2003 Member of the Advisory Board of Fidelity Advisor Series VIII. Mr. Lynch is Vice Chairman and a Director of FMR, and Vice Chairman (2001-present) and a Director of FMR Co., Inc. Previously, Mr. Lynch served as a Trustee of the Fidelity funds (1990-2003). In addition, he serves as a Trustee of Boston College and as the Chairman of the Inner-City Scholarship Fund. |
Joseph Mauriello (63) |
| Year of Election or Appointment: 2007 Member of the Advisory Board of Fidelity Advisor Series VIII. Prior to his retirement in January 2006, Mr. Mauriello served in numerous senior management positions including Deputy Chairman and Chief Operating Officer (2004-2005), and Vice Chairman of Financial Services (2002-2004) of KPMG LLP US (professional services firm, 1965-2005). Mr. Mauriello currently serves as a member of the Board of Directors of XL Capital Ltd., (global insurance and re-insurance company, 2006-present) and of Arcadia Resources Inc., (health care services and products, 2007-present). He also served as a Director of the Hamilton Funds of the Bank of New York (2006-2007). |
David M. Thomas (58) |
| Year of Election or Appointment: 2007 Member of the Advisory Board of Fidelity Advisor Series VIII. Previously, Mr. Thomas served as Executive Chairman (2005-2006) and Chairman and Chief Executive Officer (2000-2005) of IMS Heath, Inc. (pharmaceutical and healthcare information solutions). In addition, Mr. Thomas serves as a member of the Board of Directors of Fortune Brands, Inc. (consumer products holding company), and Interpublic Group of Companies, Inc. (marketing communication, 2004-present). |
Michael E. Wiley (57) |
| Year of Election or Appointment: 2007 Member of the Advisory Board of Fidelity Advisor Series VIII. Mr. Wiley also serves as Sr. Energy Advisor of Katzenbach Partners, LLC (consulting firm, 2006-present) and a member of the Board of Trustees of the University of Tulsa (2000-2006; 2007-present). He serves as a Director of Tesoro Corporation (independent oil refiner and marketer, 2005-present), and a Director of Bill Barrett Corporation (exploration and production company, 2005-present). In addition, he also serves as a Director of Post Oak Bank (privately-held bank, 2004-present), and an Advisory Director of Riverstone Holdings (private investment firm). Previously, Mr. Wiley served as Chairman, President, and CEO of Baker Hughes, Inc. (oilfield services company, 2000-2004), and as Director of Spinnaker Exploration Company (exploration and production company, 2001-2005). |
Kimberley H. Monasterio (43) |
| Year of Election or Appointment: 2007 President and Treasurer of Advisor Overseas. Ms. Monasterio also serves as President and Treasurer of other Fidelity funds (2007-present) and is an employee of FMR (2004-present). Previously, Ms. Monasterio served as Deputy Treasurer of the Fidelity funds (2004-2006). Before joining Fidelity Investments, Ms. Monasterio served as Treasurer (2000-2004) and Chief Financial Officer (2002-2004) of the Franklin Templeton Funds and Senior Vice President of Franklin Templeton Services, LLC (2000-2004). |
Walter C. Donovan (45) |
| Year of Election or Appointment: 2007 Vice President of Advisor Overseas. Mr. Donovan also serves as Vice President of Fidelity's Equity Funds (2007-present). Mr. Donovan also serves as Executive Vice President of FMR (2005-present) and FMR Co., Inc. (2005-present). Previously, Mr. Donovan served as Vice President of Fidelity's High Income Funds (2005-2007), Fixed-Income Funds (2005-2006), certain Asset Allocation Funds (2005-2006), certain Balanced Funds (2005-2006), and as Vice President and Director of Fidelity's International Equity Trading group (1998-2005). |
Eric M. Wetlaufer (45) |
| Year of Election or Appointment: 2006 Vice President of Advisor Overseas. Mr. Wetlaufer also serves as Vice President of certain International Equity Funds (2006-present). Mr. Wetlaufer is Senior Vice President of FMR (2006-present) and FMR Co., Inc. (2006-present), and President and Director of Fidelity Management & Research (U.K.) Inc. (2006-present) and Fidelity Research & Analysis Company (2006-present). Before joining Fidelity Investments in 2005, Mr. Wetlaufer was a partner in Oxhead Capital Management (2004-2005). Previously, Mr. Wetlaufer served as a Chief Investment Officer of Putnam Investments (1997-2003). |
Eric D. Roiter (58) |
| Year of Election or Appointment: 1998 Secretary of Advisor Overseas. He also serves as Secretary of Fidelity funds; Vice President, General Counsel, and Secretary of FMR Co., Inc. (2001-present) and FMR; Assistant Secretary of Fidelity Management & Research (U.K.) Inc. (2001-present), Fidelity Research & Analysis Company (2001-present), and Fidelity Investments Money Management, Inc. (2001-present). Mr. Roiter is an Adjunct Member, Faculty of Law, at Boston College Law School (2003-present). Previously, Mr. Roiter served as Vice President and Secretary of Fidelity Distributors Corporation (FDC) (1998-2005). |
Scott C. Goebel (39) |
| Year of Election or Appointment: 2007 Assistant Secretary of Advisor Overseas. Mr. Goebel also serves as Assistant Secretary of other Fidelity funds (2007-present), and is an employee of FMR. |
R. Stephen Ganis (41) |
| Year of Election or Appointment: 2006 Anti-Money Laundering (AML) officer of Advisor Overseas. Mr. Ganis also serves as AML officer of Fidelity funds (2006-present) and FMR LLC (2003-present). Before joining Fidelity Investments, Mr. Ganis practiced law at Goodwin Procter, LLP (2000-2002). |
Joseph B. Hollis (59) |
| Year of Election or Appointment: 2006 Chief Financial Officer of Advisor Overseas. Mr. Hollis also serves as Chief Financial Officer of other Fidelity funds. Mr. Hollis is President of Fidelity Pricing and Cash Management Services (FPCMS) (2005-present). Mr. Hollis also serves as President and Director of Fidelity Service Company, Inc. (2006-present). Previously, Mr. Hollis served as Senior Vice President of Cash Management Services (1999-2002) and Investment Management Operations (2002-2005). |
Kenneth A. Rathgeber (60) |
| Year of Election or Appointment: 2004 Chief Compliance Officer of Advisor Overseas. Mr. Rathgeber also serves as Chief Compliance Officer of other Fidelity funds (2004-present) and Executive Vice President of Risk Oversight for Fidelity Investments (2002-present). He is Chief Compliance Officer of FMR (2005-present), FMR Co., Inc. (2005-present), Fidelity Management & Research (U.K.) Inc. (2005-present), Fidelity Research & Analysis Company (2005-present), Fidelity Investments Money Management, Inc. (2005-present), and Strategic Advisers, Inc. (2005-present). Previously, Mr. Rathgeber served as Executive Vice President and Chief Operating Officer for Fidelity Investments Institutional Services Company, Inc. (1998-2002). |
Bryan A. Mehrmann (46) |
| Year of Election or Appointment: 2005 Deputy Treasurer of Advisor Overseas. Mr. Mehrmann also serves as Deputy Treasurer of other Fidelity funds (2005-present) and is an employee of FMR. Previously, Mr. Mehrmann served as Vice President of Fidelity Investments Institutional Services Group (FIIS)/Fidelity Investments Institutional Operations Corporation, Inc. (FIIOC) Client Services (1998-2004). |
Kenneth B. Robins (38) |
| Year of Election or Appointment: 2005 Deputy Treasurer of Advisor Overseas. Mr. Robins also serves as Deputy Treasurer of other Fidelity funds (2005-present) and is an employee of FMR (2004-present). Before joining Fidelity Investments, Mr. Robins worked at KPMG LLP, where he was a partner in KPMG's department of professional practice (2002-2004) and a Senior Manager (1999-2000). In addition, Mr. Robins served as Assistant Chief Accountant, United States Securities and Exchange Commission (2000-2002). |
Robert G. Byrnes (40) |
| Year of Election or Appointment: 2005 Assistant Treasurer of Advisor Overseas. Mr. Byrnes also serves as Assistant Treasurer of Fidelity funds (2005-present) and is an employee of FMR (2005-present). Previously, Mr. Byrnes served as Vice President of FPCMS (2003-2005). Before joining Fidelity Investments, Mr. Byrnes worked at Deutsche Asset Management where he served as Vice President of the Investment Operations Group (2000-2003). |
Peter L. Lydecker (53) |
| Year of Election or Appointment: 2004 Assistant Treasurer of Advisor Overseas. Mr. Lydecker also serves as Assistant Treasurer of other Fidelity funds (2004) and is an employee of FMR. |
Paul M. Murphy (60) |
| Year of Election or Appointment: 2007 Assistant Treasurer of Advisor Overseas. Mr. Murphy also serves as Assistant Treasurer of other Fidelity funds (2007-present) and is an employee of FMR (2007-present). Previously, Mr. Murphy served as Chief Financial Officer of the Fidelity Funds (2005-2006), Vice President and Associate General Counsel of FMR (2007), and Senior Vice President of Fidelity Pricing and Cash Management Services Group (FPCMS) (1994-2007). |
Gary W. Ryan (49) |
| Year of Election or Appointment: 2005 Assistant Treasurer of Advisor Overseas. Mr. Ryan also serves as Assistant Treasurer of other Fidelity funds (2005-present) and is an employee of FMR (2005-present). Previously, Mr. Ryan served as Vice President of Fund Reporting in FPCMS (1999-2005). |
** FMR Corp. merged with FMR LLC on October 1, 2007. Any references to FMR LLC for prior periods are deemed to be references to the prior entity.
Annual Report
Distributions
The Board of Trustees of Advisor Overseas Fund voted to pay to shareholders of record at the opening of business on record date, the following distributions per share derived from capital gains realized from sales of portfolio securities, and dividends derived from net investment income:
| Pay Date | Record Date | Dividends | Capital Gains |
Institutional Class | 12/10/07 | 12/07/07 | $0.406 | $1.78 |
The fund hereby designates as a capital gain dividend with respect to the taxable year ended October 31, 2007, $91,151,838, or, if subsequently determined to be different, the net capital gain of such year.
Institutional Class designates 39% of dividends distributed during the fiscal year as amounts which may be taken into account as a dividend for purposes of the maximum rate under section 1(h)(11) of the Internal Revenue Code.
The amounts per share which represent income derived from sources within, and taxes paid to, foreign countries or possessions of the United States are as follows:
| Pay Date | Income | Taxes |
Institutional Class | 12/04/06 | $0.371 | $0.0223 |
The fund will notify shareholders in January 2008 of amounts for use in preparing 2007 income tax returns.
Annual Report
Board Approval of Investment Advisory Contracts and Management Fees
Advisor Overseas Fund
Each year, typically in July, the Board of Trustees, including the Independent Trustees (together, the Board), votes on the renewal of the management contract and sub-advisory agreements (together, the Advisory Contracts) for the fund. The Board, assisted by the advice of fund counsel and Independent Trustees' counsel, requests and considers a broad range of information throughout the year.
The Board meets regularly each month except August and takes into account throughout the year matters bearing on Advisory Contracts. The Board, acting directly and through its separate committees, considers at each of its meetings factors that are relevant to the annual renewal of the fund's Advisory Contracts, including the services and support provided to the fund and its shareholders. At the time of the renewal, the Board had 12 standing committees, each composed of Independent Trustees with varying backgrounds, to which the Board has assigned specific subject matter responsibilities in order to enhance effective decision-making by the Board. Each committee has adopted a written charter outlining the structure and purposes of the committee. One such committee, the Equity Contract Committee, meets periodically as needed throughout the year to consider matters specifically related to the annual renewal of Advisory Contracts. The committee requests and receives information on, and makes recommendations to the Independent Trustees concerning, the approval and annual review of the Advisory Contracts.
At its July 2007 meeting, the Board of Trustees, including the Independent Trustees, unanimously determined to renew the Advisory Contracts for the fund. In reaching its determination, the Board considered all factors it believed relevant, including (i) the nature, extent, and quality of the services to be provided to the fund and its shareholders (including the investment performance of the fund); (ii) the competitiveness of the management fee and total expenses of the fund; (iii) the total costs of the services to be provided by and the profits to be realized by the investment adviser and its affiliates from the relationship with the fund; (iv) the extent to which economies of scale would be realized as the fund grows; and (v) whether fee levels reflect these economies of scale, if any, for the benefit of fund shareholders. The Board also approved amendments to the fund's agreements with foreign sub-advisers to clarify that each sub-adviser provides services as an independent contractor.
In determining whether to renew the Advisory Contracts for the fund, the Board ultimately reached a determination, with the assistance of fund counsel and Independent Trustees' counsel, that the renewal of the Advisory Contracts and the compensation to be received by Fidelity under the management contract is consistent with Fidelity's fiduciary duty under applicable law. In addition to evaluating the specific factors noted above, the Board, in reaching its determination, is aware that shareholders in the fund have a broad range of investment choices available to them, including a wide choice among mutual funds offered by competitors to Fidelity, and that the fund's shareholders, with the opportunity to review and weigh the disclosure provided by the fund in its prospectus and other public disclosures, have chosen to invest in this fund, managed by Fidelity.
Annual Report
Board Approval of Investment Advisory Contracts and
Management Fees - continued
Nature, Extent, and Quality of Services Provided. The Board considered staffing within the investment adviser, FMR, and the sub-advisers (together, the Investment Advisers), including the background of the fund's portfolio manager and the fund's investment objective and discipline. The Independent Trustees also had discussions with senior management of Fidelity's investment operations and investment groups. The Board considered the structure of the portfolio manager compensation program and whether this structure provides appropriate incentives.
Resources Dedicated to Investment Management and Support Services. The Board reviewed the size, education, and experience of the Investment Advisers' investment staff, their use of technology, and the Investment Advisers' approach to recruiting, training, and retaining portfolio managers and other research, advisory, and management personnel. The Board considered Fidelity's extensive global research capabilities that enable the Investment Advisers to aggregate data from various sources in an effort to produce positive investment results. The Board noted that Fidelity's analysts have access to a variety of technological tools that enable them to perform both fundamental and quantitative analysis and to specialize in various disciplines. The Board also considered that Fidelity's portfolio managers and analysts have access to daily portfolio attribution that allows for monitoring of a fund's portfolio, as well as an electronic communication system that provides immediate real-time access to research concerning issuers and credit enhancers.
Shareholder and Administrative Services. The Board considered (i) the nature, extent, quality, and cost of advisory, administrative, distribution, and shareholder services performed by the Investment Advisers and their affiliates under the Advisory Contracts and under separate agreements covering transfer agency, pricing and bookkeeping, and securities lending services for the fund; (ii) the nature and extent of the Investment Advisers' supervision of third party service providers, principally custodians and subcustodians; and (iii) the resources devoted to, and the record of compliance with, the fund's compliance policies and procedures. The Board reviewed the allocation of fund brokerage, including allocations to brokers affiliated with the Investment Advisers, the use of brokerage commissions to pay fund expenses, and the use of "soft" commission dollars to pay for research services. The Board also considered that Fidelity voluntarily pays for market data out of its own resources. The Board also considered the agreement reached between the Independent Trustees and Fidelity in December 2006 following an independent review of matters relating to receipt of travel, entertainment, gifts and gratuities in violation of Fidelity policies.
Annual Report
The Board noted that the growth of fund assets across the complex allows Fidelity to reinvest in the development of services designed to enhance the value or convenience of the Fidelity funds as investment vehicles. These services include 24-hour access to account information and market information through phone representatives and over the Internet, and investor education materials and asset allocation tools.
Investment in a Large Fund Family. The Board considered the benefits to shareholders of investing in a Fidelity fund, including the benefits of investing in a fund that is part of a large family of funds offering a variety of investment disciplines and providing for a large variety of mutual fund investor services. For example, fund shareholders are offered the privilege of exchanging shares of the fund for shares of other Fidelity funds, as set forth in the fund's prospectus, without paying a sales charge. The Board noted that, since the last Advisory Contract renewals in July 2006, Fidelity has taken a number of actions that benefited particular funds, including (i) dedicating additional resources to investment research and to restructure the investment research teams; (ii) contractually agreeing to reduce the management fee on Fidelity Advisor Floating Rate High Income Fund; (iii) contractually agreeing to reduce the management fees on Fidelity's California, Massachusetts, New Jersey, and New York AMT Tax-Free Money Market Funds, launching new Institutional Classes and Service Classes of these funds, and contractually agreeing to impose expense limitations on these funds; (iv) eliminating the exchange fee on the Fidelity Select Portfolios and reducing the pricing and bookkeeping fee rates for these funds; (v) reducing the maximum transfer agency fee rates on high income funds and certain equity funds; (vi) proposing amended management contracts that, if approved by shareholders, will add a performance adjustment component to the management fees paid by 18 Fidelity Advisor equity funds; (vii) contractually agreeing to reduce fees for Ultra-Short Central Fund and the money market Central Funds; (viii) waiving the Fidelity Advisor funds' contingent deferred sales charge on certain redemptions made through systematic withdrawal programs; and (ix) amending the management contracts for equity and fixed-income funds whose management contracts incorporate a "group fee" structure by adding four new fee "breakpoints" to the group fee rate schedules.
Investment Performance and Compliance. The Board considered whether the fund has operated within its investment objective, as well as its record of compliance with its investment restrictions. It also reviewed the fund's absolute investment performance for each class, as well as the fund's relative investment performance for each class measured against (i) a broad-based securities market index, and (ii) a peer group of mutual funds deemed appropriate by the Board over multiple periods. The following charts considered by the Board show, over the one-, three-, and five-year periods ended December 31, 2006, the cumulative total returns of Institutional Class (Class I) and Class B of the fund, the cumulative total returns of a broad-based securities market index ("benchmark"), and a range of cumulative total returns of a peer group of mutual funds identified by Morningstar, Inc. as having an investment style similar to that of the fund based on underlying portfolio holdings. The returns of Institutional Class (Class I) and Class B show the performance of the highest and lowest performing classes, respectively (based on three-year performance). The box within each chart shows the 25th percentile return (bottom of box) and the 75th percentile return (top of box) of the peer group. Returns shown above the box are in the first quartile and returns shown below the box are in the fourth quartile. The percentage beaten numbers noted below each chart correspond to the percentile box and represent the percentage of funds in the peer group whose performance was equal to or lower than that of the class indicated.
Annual Report
Board Approval of Investment Advisory Contracts and
Management Fees - continued
Advisor Overseas Fund

The Board reviewed the fund's relative investment performance against its peer group and stated that the performance of Institutional Class (Class I) of the fund was in the fourth quartile for the one-and three-year periods and the third quartile for the five-year period. The Board also stated that the investment performance of the fund was lower than its benchmark for all the periods shown. The Board considered that the variations in performance among the fund's classes reflect the variations in class expenses, which result in lower performance for higher expense classes. The Board discussed with FMR actions to be taken by FMR to improve the fund's disappointing performance relative to its peer group. The Board will continue to closely monitor the performance of the fund in the coming year and discuss with FMR other appropriate actions to address the performance of the fund.
The Board also considered that the fund's management fee is subject to upward or downward adjustment depending upon whether, and to what extent, the fund's investment performance for the performance period exceeds, or is exceeded by, the record (over the same period) of a Board-approved performance adjustment index. The Board realizes that the performance adjustment provides FMR with a strong economic incentive to seek to achieve superior performance for the fund's shareholders and helps to more closely align the interests of FMR and the fund's shareholders.
Annual Report
The Board considered that FMR has taken steps to refocus and strengthen equity research, equity portfolio management, and compliance.
Based on its review, and giving particular weight to the nature and quality of the resources dedicated by the Investment Advisers to maintain and improve relative performance, the Board concluded that the nature, extent, and quality of the services provided to the fund will benefit the fund's shareholders, particularly in light of the Board's view that the fund's shareholders benefit from investing in a fund that is part of a large family of funds offering a variety of investment disciplines and services.
Competitiveness of Management Fee and Total Fund Expenses. The Board considered the fund's management fee and total expenses compared to "mapped groups" of competitive funds and classes. Fidelity creates "mapped groups" by combining similar Lipper investment objective categories that have comparable management fee characteristics. Combining Lipper investment objective categories aids the Board's management fee and total expense comparisons by broadening the competitive group used for comparison and by reducing the number of universes to which various Fidelity funds are compared. The Board also considered supplemental information about how the fund's management fee and total expenses ranked relative to groups based on Lipper classifications, which take into account a fund's market capitalization and style.
The Board considered two proprietary management fee comparisons for the 12-month periods shown in the chart below. The group of Lipper funds used by the Board for management fee comparisons is referred to below as the "Total Mapped Group." The Total Mapped Group comparison focuses on a fund's standing relative to the total universe of comparable funds available to investors, in terms of gross management fees before expense reimbursements or caps, and without giving effect to the fund's performance adjustment. "TMG %" represents the percentage of funds in the Total Mapped Group that had management fees that were lower than the fund's. For example, a TMG % of 15% means that 85% of the funds in the Total Mapped Group had higher management fees than the fund. The "Asset-Size Peer Group" (ASPG) comparison focuses on a fund's standing relative to non-Fidelity funds similar in size to the fund within the Total Mapped Group. The ASPG represents at least 15% of the funds in the Total Mapped Group with comparable asset size and management fee characteristics, subject to a minimum of 50 funds (or all funds in the Total Mapped Group if fewer than 50). Additional information, such as the ASPG quartile in which the fund's management fee ranked and the impact of the fund's performance adjustment, is also included in the chart and considered by the Board.
Annual Report
Board Approval of Investment Advisory Contracts and
Management Fees - continued
Advisor Overseas Fund
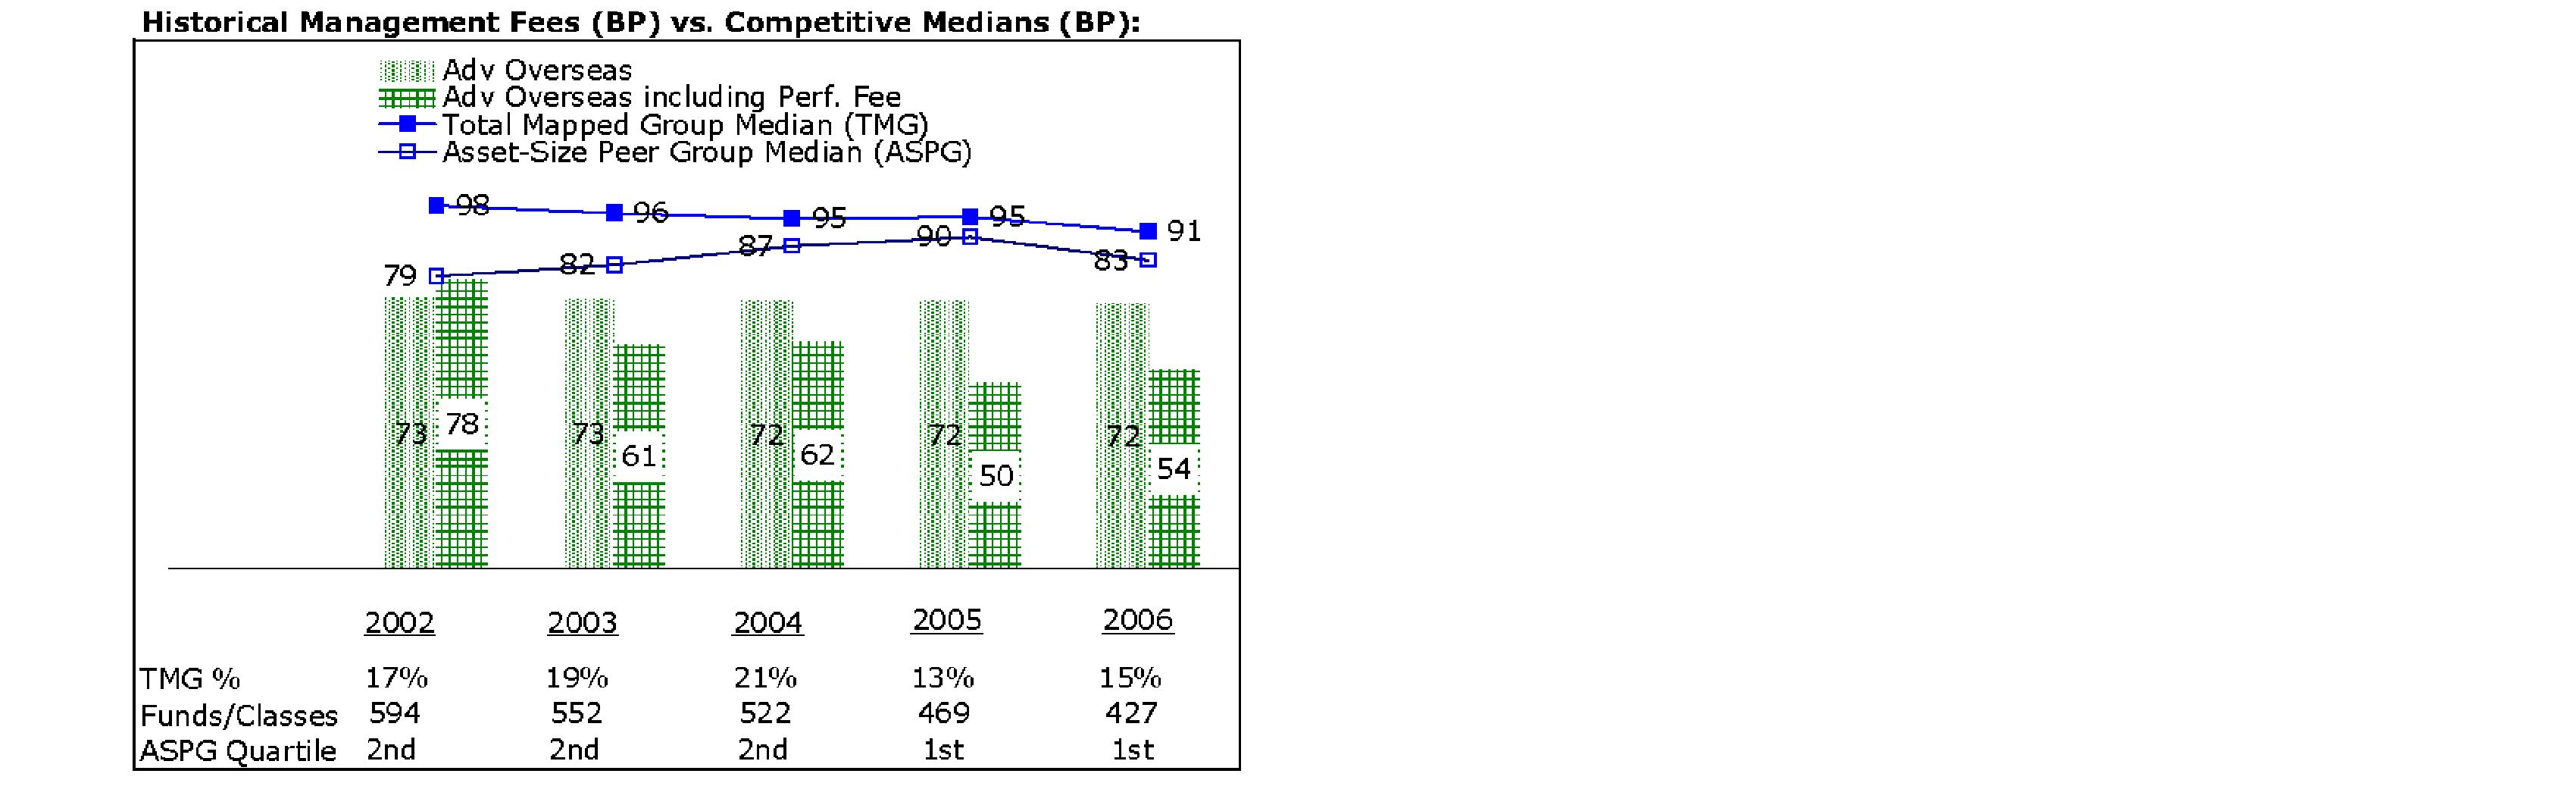
The Board noted that the fund's management fee ranked below the median of its Total Mapped Group and below the median of its ASPG for 2006. The Board also noted the effect of the fund's negative performance adjustment on the fund's management fee ranking. The Board noted that the performance adjustment for each year represents calculations for performance periods that differ from the periods shown in the performance charts above.
Based on its review, the Board concluded that the fund's management fee was fair and reasonable in light of the services that the fund receives and the other factors considered.
In its review of each class's total expenses, the Board considered the fund's management fee as well as other fund or class expenses, as applicable, such as transfer agent fees, pricing and bookkeeping fees, fund-paid 12b-1 fees, and custodial, legal, and audit fees. The Board also noted the effects of any waivers and reimbursements on fees and expenses, as well as the fund's negative performance adjustment. As part of its review, the Board also considered current and historical total expenses of each class of the fund compared to competitive fund median expenses. Each class of the fund is compared to those funds and classes in the Total Mapped Group (used by the Board for management fee comparisons) that have a similar sales load structure.
The Board noted that the total expenses of each class ranked below its competitive median for 2006.
In its review of total expenses, the Board also considered Fidelity fee structures and other information on clients that FMR and its affiliates service in other competitive markets, such as other mutual funds advised or subadvised by FMR or its affiliates, pension plan clients, and other institutional clients.
Annual Report
Based on its review, the Board concluded that the total expenses of each class of the fund were reasonable in light of the services that the fund and its shareholders receive and the other factors considered.
Costs of the Services and Profitability. The Board considered the revenues earned and the expenses incurred by Fidelity in conducting the business of developing, marketing, distributing, managing, administering and servicing the fund and its shareholders. The Board also considered the level of Fidelity's profits in respect of all the Fidelity funds.
On an annual basis, FMR presents to the Board Fidelity's profitability for the fund. Fidelity calculates the profitability for each fund, as well as aggregate profitability for groups of Fidelity funds and all Fidelity funds, using a series of detailed revenue and cost allocation methodologies which originate with the audited books and records of Fidelity. The Audit Committee of the Board reviews any significant changes from the prior year's methodologies.
PricewaterhouseCoopers LLP (PwC), independent registered public accounting firm and auditor to Fidelity and certain Fidelity funds, has been engaged annually by the Board as part of the Board's assessment of the results of Fidelity's profitability analysis. PwC's engagement includes the review and assessment of Fidelity's methodologies used in determining the revenues and expenses attributable to Fidelity's mutual fund business, and completion of agreed-upon procedures surrounding the mathematical accuracy of fund profitability and its conformity to allocation methodologies. After considering PwC's reports issued under the engagement and information provided by Fidelity, the Board believes that while other allocation methods may also be reasonable, Fidelity's profitability methodologies are reasonable in all material respects.
The Board has also reviewed Fidelity's non-fund businesses and any fall-out benefits related to the mutual fund business as well as cases where Fidelity's affiliates may benefit from or be related to the fund's business.
The Board considered the costs of the services provided by and the profits realized by Fidelity in connection with the operation of the fund and determined that the amount of profit is a fair entrepreneurial profit for the management of the fund.
Economies of Scale. The Board considered whether there have been economies of scale in respect of the management of the Fidelity funds, whether the Fidelity funds (including the fund) have appropriately benefited from any such economies of scale, and whether there is potential for realization of any further economies of scale. The Board considered the extent to which the fund will benefit from economies of scale through increased services to the fund, through waivers or reimbursements, or through fee or expense reductions, including reductions that occur through operation of the transfer agent agreement. The transfer agent fee varies in part based on the number of accounts in the fund. If the number of accounts decreases or the average account size increases, the overall transfer agent fee rate decreases.
Annual Report
Board Approval of Investment Advisory Contracts and
Management Fees - continued
The Board recognized that the fund's management contract incorporates a "group fee" structure, which provides for lower group fee rates as total fund assets under FMR's management increase, and for higher group fee rates as total fund assets under FMR's management decrease. FMR determines the group fee rates based on a tiered asset "breakpoint" schedule. In connection with the renewal of the fund's management contract, the Board approved amendments to the fund's management contract that added four new fee breakpoints to the group fee rate schedule for assets under FMR's management above $1,386 billion. The Board considered that the group fee rate declines under both the present and amended schedules, but that under the amended schedule, the group fee rate declines faster as assets under FMR's management exceed $1,386 billion. The Board considered that the group fee is designed to deliver the benefits of economies of scale to fund shareholders when total fund assets increase, even if assets of any particular fund are unchanged or have declined, because some portion of Fidelity's costs are attributable to services provided to all Fidelity funds, and all funds benefit if those costs can be allocated among more assets. The Board concluded that, given the group fee structure, fund shareholders will achieve a certain level of economies of scale as assets under FMR's management increase at the fund complex level, regardless of whether Fidelity achieves any such economies of scale.
The Board further concluded that any potential economies of scale are being shared between fund shareholders and Fidelity in an appropriate manner.
Additional Information Requested by the Board. In order to develop fully the factual basis for consideration of the Fidelity funds' Advisory Contracts, the Board requested and received additional information on several topics, including (i) fund performance trends and actions to be taken by FMR to improve certain funds' overall performance; (ii) Fidelity's portfolio manager compensation structure, including its effects on fund profitability and the extent to which portfolio manager compensation is linked to fund performance; (iii) Fidelity's fee structures; (iv) the funds' sub-advisory arrangements; and (v) accounts managed by Fidelity other than the Fidelity funds.
Based on its evaluation of all of the conclusions noted above, and after considering all material factors, the Board ultimately concluded that the advisory fee structures are fair and reasonable, and that the fund's Advisory Contracts should be renewed.
Annual Report
Annual Report
Annual Report
Annual Report
Annual Report
Annual Report
Annual Report
Annual Report
Investment Adviser
Fidelity Management & Research Company
Boston, MA
Investment Sub-Advisers
FMR Co., Inc.
Fidelity Management & Research
(U.K.) Inc.
Fidelity Research & Analysis Company
Fidelity International
Investment Advisors
Fidelity Investments Japan Limited
Fidelity International Investment Advisors (U.K.) Limited
General Distributor
Fidelity Distributors Corporation
Boston, MA
Transfer and Service Agents
Fidelity Investments Institutional Operations Company, Inc.
Boston, MA
Fidelity Service Company, Inc.
Boston, MA
Custodian
The Northern Trust Company
Chicago, IL
OSI-UANN-1207
1.784768.104
(Fidelity Investment logo)(registered trademark)
(Fidelity Investment logo)(registered trademark)
Fidelity® Advisor
Value Leaders
Fund - Class A, Class T, Class B
and Class C
Annual Report
October 31, 2007
(2_fidelity_logos) (Registered_Trademark)
Contents
Chairman's Message | <Click Here> | Ned Johnson's message to shareholders. |
Note to Shareholders | <Click Here> | An explanation of the changes to the fund. |
Performance | <Click Here> | How the fund has done over time. |
Management's Discussion | <Click Here> | The manager's review of fund performance, strategy and outlook |
Shareholder Expense Example | <Click Here> | An example of shareholder expenses. |
Investment Changes | <Click Here> | A summary of major shifts in the fund's investments over the past six months. |
Investments | <Click Here> | A complete list of the fund's investments with their market values. |
Financial Statements | <Click Here> | Statements of assets and liabilities, operations, and changes in net assets, as well as financial highlights. |
Notes | <Click Here> | Notes to the financial statements. |
Report of Independent Registered Public Accounting Firm | <Click Here> | |
Trustees and Officers | <Click Here> | |
Distributions | <Click Here> | |
Proxy Voting Results | <Click Here> | |
Board Approval of Investment Advisory Contracts and Management Fees | <Click Here> | |
To view a fund's proxy voting guidelines and proxy voting record for the 12-month period ended June 30, visit http://www.fidelity.com (search for "proxy voting guidelines") or visit the Securities and Exchange Commission's (SEC) web site at http://www.sec.gov. You may also call 1-877-208-0098 to request a free copy of the proxy voting guidelines.
Standard & Poor's, S&P and S&P 500 are registered service marks of The McGraw-Hill Companies, Inc. and have been licensed for use by Fidelity Distributors Corporation.
Other third party marks appearing herein are the property of their respective owners.
All other marks appearing herein are registered or unregistered trademarks or service marks of FMR LLC or an affiliated company.
Annual Report
This report and the financial statements contained herein are submitted for the general information of the shareholders of the fund. This report is not authorized for distribution to prospective investors in the fund unless preceded or accompanied by an effective prospectus.
A fund files its complete schedule of portfolio holdings with the SEC for the first and third quarters of each fiscal year on Form N-Q. Forms N-Q are available on the SEC's web site at http://www.sec.gov. A fund's Forms N-Q may be reviewed and copied at the SEC's Public Reference Room in Washington, DC. Information regarding the operation of the SEC's Public Reference Room may be obtained by calling 1-800-SEC-0330. For a complete list of a fund's portfolio holdings, view the most recent holdings listing, semiannual report, or annual report on Fidelity's web site at http://www.fidelity.com or http://www.advisor.fidelity.com, as applicable.
NOT FDIC INSURED · MAY LOSE VALUE · NO BANK GUARANTEE
Neither the fund nor Fidelity Distributors Corporation is a bank.
Annual Report
Chairman's Message
(photo_of_Edward_C_Johnson_3d)
Dear Shareholder:
Many stock and bond markets around the world have been unsettled of late; however, volatility can often lead to opportunity for patient investors. Financial markets are always unpredictable, but there are a number of time-tested principles that can put the historical odds in your favor.
One of the basic tenets is to invest for the long term. Over time, riding out the markets' inevitable ups and downs has proven much more effective than selling into panic or chasing the hottest trend. Even missing only a few of the markets' best days can significantly diminish investor returns. Patience also affords the benefits of compounding - of earning interest on additional income or reinvested dividends and capital gains. There are tax advantages and cost benefits to consider as well. The more you sell, the more taxes you pay, and the more you trade, the higher the costs. While staying the course doesn't eliminate risk, it can considerably lessen the effect of short-term declines.
You can further manage your investing risk through diversification. And today, more than ever, geographic diversification should be taken into account. Studies indicate that asset allocation is the single most important determinant of a portfolio's long-term success. The right mix of stocks, bonds and cash - aligned to your particular risk tolerance and investment objective - is very important. Age-appropriate rebalancing is also an essential aspect of asset allocation. For younger investors, an emphasis on equities - which historically have been the best-performing asset class over time - is encouraged. As investors near their specific goal, such as retirement or sending a child to college, consideration may be given to replacing volatile assets (e.g. common stocks) with more-stable fixed investments (bonds or savings plans).
A third investment principle - investing regularly - can help lower the average cost of your purchases. Investing a certain amount of money each month or quarter helps ensure you won't pay for all your shares at market highs. This strategy - known as dollar cost averaging - also reduces unconstructive "emotion" from investing, helping shareholders avoid selling weak performers just prior to an upswing, or chasing a hot performer just before a correction.
We invite you to contact us via the Internet, through our Investor Centers or over the phone. It is our privilege to provide you the information you need to make the investments that are right for you.
Sincerely,
/s/Edward C. Johnson 3d
Edward C. Johnson 3d
Annual Report
Note to Shareholders:
On May 16, 2007, shareholders of Fidelity® Advisor Value Leaders Fund approved a new management contract for the fund, effective June 1, 2007, which adds a performance adjustment component to the management fee based on the fund's performance versus the Russell 1000® Value Index. The new contract also allows the Board of Trustees to designate an alternate performance adjustment index in the future, without a shareholder vote, when permitted by applicable law.
Annual Report
Performance: The Bottom Line
Average annual total return reflects the change in the value of an investment, assuming reinvestment of the class' dividend income and capital gains (the profits earned upon the sale of securities that have grown in value) and assuming a constant rate of performance each year. The $10,000 table and the fund's returns do not reflect the deduction of taxes that a shareholder would pay on fund distributions or the redemption of fund shares. During periods of reimbursement by Fidelity, a fund's total return will be greater than it would be had the reimbursement not occurred. How a fund did yesterday is no guarantee of how it will do tomorrow.
Average Annual Total Returns
Periods ended October 31, 2007 | Past 1
year | Life of
fund A |
Class A (incl. 5.75% sales charge) | 8.05% | 12.59% |
Class T (incl. 3.50% sales charge) | 10.31% | 12.90% |
Class B (incl. contingent deferred sales charge) B | 8.74% | 12.95% |
Class C (incl. contingent deferred sales charge) C | 12.69% | 13.24% |
A From June 17, 2003.
B Class B shares' contingent deferred sales charge included in the past one year and life of fund total return figures are 5% and 3%, respectively.
C Class C shares' contingent deferred sales charge included in the past one year and life of fund total return figures are 1% and 0%, respectively.
Annual Report
$10,000 Over Life of Fund
Let's say hypothetically that $10,000 was invested in Fidelity® Advisor Value Leaders Fund - Class T on June 17, 2003, when the fund started, and the current 3.50% sales charge was paid. The chart shows how the value of your investment would have changed, and also shows how the Russell 1000® Value Index performed over the same period.
Annual Report
Management's Discussion of Fund Performance
Comments from Charles Hebard, Portfolio Manager of Fidelity® Advisor Value Leaders Fund
Despite a slowing housing market, the subprime mortgage loan crisis, a credit crunch and sharply higher energy prices, U.S. stock markets performed very well during the 12-month period ending October 31, 2007. Upbeat corporate earnings and persistently solid economic data drove much of the positive momentum for equities. There were only three notably bad months during the period: February, when equities fell on the first whispers of the subprime woes and a brief slump in Asian stocks; and June and July, as crude oil prices spiked, the dollar fell to new lows and subprime mortgage concerns accelerated. The Federal Reserve Board helped spark a late-period rally, first in August by lowering its discount rate to inject liquidity into the financial system, then with reductions in the federal funds target rate in September and October. For the 12 months overall, the Dow Jones Industrial AverageSM rose 17.94%, the Standard & Poor's 500SM Index returned 14.56% and the NASDAQ Composite® Index shot up 21.75%.
For the 12-month period ending October 31, 2007, the fund's Class A, Class T, Class B and Class C shares returned 14.64%, 14.31%, 13.74% and 13.69%, respectively (excluding sales charges), solidly outperforming the 10.83% rise in the Russell 1000® Value Index. Energy and financials were, respectively, the strongest- and weakest-performing areas of the benchmark during the period, and my positioning in both sectors aided relative results. In the energy area, performance benefited from an emphasis on oilfield services companies and exploration and production (E&P) companies leveraged to North American natural gas. Oilfield services firms National Oilwell Varco and Smith International continued to beat Wall Street analysts' earnings expectations, as they had for several quarters. Their stocks benefited from increasing confidence among investors that oil prices would remain high. Honeywell International's stock rose after the firm beat earnings expectations. I invested in Procter & Gamble when its share price pulled back in the spring of 2007, and the stock subsequently performed well. E&P firms EOG Resources and Ultra Petroleum rallied on rising natural gas prices. Ultra Petroleum and Smith International were not index components. On the negative side, underweighting Exxon Mobil and avoiding Chevron detracted from results as these two major oil producers and index components rose sharply. Elsewhere, I underestimated the severity of the housing crisis, and the fund was hurt by investments in homebuilders Standard Pacific and KB Home.
The views expressed above reflect those of the portfolio manager(s) only through the end of the period as stated on the cover of this report and do not necessarily represent the views of Fidelity or any other person in the Fidelity organization. Any such views are subject to change at any time based upon market or other conditions and Fidelity disclaims any responsibility to update such views. These views may not be relied on as investment advice and, because investment decisions for a Fidelity fund are based on numerous factors, may not be relied on as an indication of trading intent on behalf of any Fidelity fund.
Annual Report
Shareholder Expense Example
As a shareholder of the Fund, you incur two types of costs: (1) transaction costs, including sales charges (loads) on purchase payments or redemption proceeds, and (2) ongoing costs, including management fees, distribution and/or service (12b-1) fees and other Fund expenses. This Example is intended to help you understand your ongoing costs (in dollars) of investing in the Fund and to compare these costs with the ongoing costs of investing in other mutual funds.
The Example is based on an investment of $1,000 invested at the beginning of the period and held for the entire period (May 1, 2007 to October 31, 2007).
Actual Expenses
The first line of the accompanying table for each class of the Fund provides information about actual account values and actual expenses. You may use the information in this line, together with the amount you invested, to estimate the expenses that you paid over the period. Simply divide your account value by $1,000.00 (for example, an $8,600 account value divided by $1,000.00 = 8.6), then multiply the result by the number in the first line for a class of the Fund under the heading entitled "Expenses Paid During Period" to estimate the expenses you paid on your account during this period. In addition, the Fund, as a shareholder in the underlying Fidelity Central Funds, will indirectly bear its pro rata share of the fees and expenses incurred by the underlying Fidelity Central Funds. These fees and expenses are not included in the Fund's annualized expense ratio used to calculate the expense estimate in the table below.
Hypothetical Example for Comparison Purposes
The second line of the accompanying table for each class of the Fund provides information about hypothetical account values and hypothetical expenses based on a Class' actual expense ratio and an assumed rate of return of 5% per year before expenses, which is not the Class' actual return. The hypothetical account values and expenses may not be used to estimate the actual ending account balance or expenses you paid for the period. You may use this information to compare the ongoing costs of investing in the Fund and other funds. To do so, compare this 5% hypothetical example with the 5% hypothetical examples that appear in the shareholder reports of the other funds. In addition, the Fund, as a shareholder in the underlying Fidelity Central Funds, will indirectly bear its pro rata share of the fees and expenses incurred by the underlying Fidelity Central Funds. These fees and expenses are not included in the Fund's annualized expense ratio used to calculate the expense estimate in the table below.
Please note that the expenses shown in the table are meant to highlight your ongoing costs only and do not reflect any transaction costs. Therefore, the second line of the table is useful in comparing ongoing costs only, and will not help you determine the relative total costs of owning different funds. In addition, if these transactional costs were included, your costs would have been higher.
Annual Report
Shareholder Expense Example - continued
| Beginning
Account Value
May 1, 2007 | Ending
Account Value
October 31, 2007 | Expenses Paid
During Period*
May 1, 2007
to October 31, 2007 |
Class A | | | |
Actual | $ 1,000.00 | $ 1,033.40 | $ 6.41 |
HypotheticalA | $ 1,000.00 | $ 1,018.90 | $ 6.36 |
Class T | | | |
Actual | $ 1,000.00 | $ 1,032.30 | $ 7.68 |
HypotheticalA | $ 1,000.00 | $ 1,017.64 | $ 7.63 |
Class B | | | |
Actual | $ 1,000.00 | $ 1,029.50 | $ 10.23 |
HypotheticalA | $ 1,000.00 | $ 1,015.12 | $ 10.16 |
Class C | | | |
Actual | $ 1,000.00 | $ 1,029.50 | $ 10.23 |
HypotheticalA | $ 1,000.00 | $ 1,015.12 | $ 10.16 |
Institutional Class | | | |
Actual | $ 1,000.00 | $ 1,035.10 | $ 5.13 |
HypotheticalA | $ 1,000.00 | $ 1,020.16 | $ 5.09 |
A 5% return per year before expenses
* Expenses are equal to each Class' annualized expense ratio (shown in the table below); multiplied by the average account value over the period, multiplied by 184/365 (to reflect the one-half year period).
| Annualized
Expense Ratio |
Class A | 1.25% |
Class T | 1.50% |
Class B | 2.00% |
Class C | 2.00% |
Institutional Class | 1.00% |
Annual Report
Investment Changes
Top Ten Stocks as of October 31, 2007 |
| % of fund's
net assets | % of fund's net assets
6 months ago |
AT&T, Inc. | 5.0 | 4.5 |
Bank of America Corp. | 4.3 | 4.3 |
ConocoPhillips | 4.3 | 1.9 |
Citigroup, Inc. | 4.0 | 3.9 |
American International Group, Inc. | 3.5 | 3.5 |
General Electric Co. | 3.3 | 2.9 |
Exxon Mobil Corp. | 2.6 | 1.9 |
JPMorgan Chase & Co. | 2.6 | 2.6 |
Procter & Gamble Co. | 2.3 | 0.0 |
Merck & Co., Inc. | 1.5 | 1.8 |
| 33.4 | |
Top Five Market Sectors as of October 31, 2007 |
| % of fund's
net assets | % of fund's net assets
6 months ago |
Financials | 29.8 | 32.8 |
Energy | 15.9 | 15.6 |
Industrials | 10.5 | 9.8 |
Telecommunication Services | 6.9 | 6.1 |
Consumer Discretionary | 6.8 | 8.8 |
Asset Allocation (% of fund's net assets) |
As of October 31, 2007 * | As of April 30, 2007 ** |
| Stocks 98.3% | | | Stocks 99.5% | |
| Short-Term
Investments and
Net Other Assets 1.7% | | | Short-Term
Investments and
Net Other Assets 0.5% | |
* Foreign investments | 13.4% | | ** Foreign investments | 15.5% | |

Annual Report
Investments October 31, 2007
Showing Percentage of Net Assets
Common Stocks - 98.3% |
| Shares | | Value |
CONSUMER DISCRETIONARY - 6.8% |
Automobiles - 0.5% |
General Motors Corp. | 8,800 | | $ 344,872 |
Renault SA | 2,400 | | 402,998 |
| | 747,870 |
Hotels, Restaurants & Leisure - 0.4% |
McDonald's Corp. | 9,400 | | 561,180 |
Household Durables - 1.4% |
Bassett Furniture Industries, Inc. | 7,339 | | 77,867 |
Beazer Homes USA, Inc. | 11,000 | | 123,530 |
KB Home | 46,500 | | 1,285,260 |
Standard Pacific Corp. (d) | 41,100 | | 197,280 |
Whirlpool Corp. | 2,900 | | 229,622 |
| | 1,913,559 |
Leisure Equipment & Products - 0.7% |
Brunswick Corp. | 9,600 | | 214,176 |
Eastman Kodak Co. | 13,600 | | 389,776 |
Mattel, Inc. | 15,300 | | 319,617 |
| | 923,569 |
Media - 1.5% |
News Corp. Class A | 24,500 | | 530,915 |
Regal Entertainment Group Class A | 16,800 | | 379,176 |
Time Warner, Inc. | 66,500 | | 1,214,290 |
| | 2,124,381 |
Multiline Retail - 0.5% |
Retail Ventures, Inc. (a) | 11,800 | | 102,306 |
Sears Holdings Corp. (a) | 4,500 | | 606,555 |
Tuesday Morning Corp. | 5,600 | | 42,672 |
| | 751,533 |
Specialty Retail - 1.6% |
Advance Auto Parts, Inc. | 9,000 | | 307,080 |
Home Depot, Inc. | 9,550 | | 300,921 |
PetSmart, Inc. | 11,300 | | 338,435 |
Ross Stores, Inc. | 17,400 | | 470,148 |
Staples, Inc. | 20,600 | | 480,804 |
Williams-Sonoma, Inc. | 11,400 | | 358,416 |
| | 2,255,804 |
Common Stocks - continued |
| Shares | | Value |
CONSUMER DISCRETIONARY - continued |
Textiles, Apparel & Luxury Goods - 0.2% |
Liz Claiborne, Inc. | 10,400 | | $ 296,088 |
TOTAL CONSUMER DISCRETIONARY | | 9,573,984 |
CONSUMER STAPLES - 6.4% |
Food & Staples Retailing - 0.7% |
Rite Aid Corp. (a) | 71,900 | | 281,129 |
SUPERVALU, Inc. | 9,600 | | 372,000 |
Winn-Dixie Stores, Inc. (a) | 18,000 | | 425,520 |
| | 1,078,649 |
Food Products - 1.7% |
Cermaq ASA | 17,500 | | 268,215 |
Chiquita Brands International, Inc. (a) | 16,300 | | 305,625 |
Marine Harvest ASA (a) | 387,000 | | 392,300 |
Nestle SA (Reg.) | 3,073 | | 1,419,726 |
| | 2,385,866 |
Household Products - 2.4% |
Central Garden & Pet Co. Class A (non-vtg.) (a) | 26,200 | | 217,984 |
Procter & Gamble Co. | 46,200 | | 3,211,824 |
| | 3,429,808 |
Tobacco - 1.6% |
Altria Group, Inc. | 15,300 | | 1,115,829 |
British American Tobacco PLC sponsored ADR | 14,400 | | 1,104,192 |
| | 2,220,021 |
TOTAL CONSUMER STAPLES | | 9,114,344 |
ENERGY - 15.9% |
Energy Equipment & Services - 2.2% |
Expro International Group PLC | 13,500 | | 343,262 |
Exterran Holdings, Inc. (a) | 3,082 | | 259,504 |
National Oilwell Varco, Inc. (a) | 16,164 | | 1,183,851 |
Smith International, Inc. | 8,700 | | 574,635 |
Transocean, Inc. (a) | 6,800 | | 811,716 |
| | 3,172,968 |
Oil, Gas & Consumable Fuels - 13.7% |
Chesapeake Energy Corp. | 11,000 | | 434,280 |
ConocoPhillips (d) | 71,000 | | 6,032,160 |
CONSOL Energy, Inc. | 13,300 | | 751,450 |
Common Stocks - continued |
| Shares | | Value |
ENERGY - continued |
Oil, Gas & Consumable Fuels - continued |
EnCana Corp. | 5,300 | | $ 371,034 |
EOG Resources, Inc. | 18,200 | | 1,612,520 |
EXCO Resources, Inc. (a) | 15,600 | | 263,328 |
Exxon Mobil Corp. | 40,470 | | 3,722,835 |
Occidental Petroleum Corp. | 26,000 | | 1,795,300 |
Quicksilver Resources, Inc. (a) | 10,050 | | 572,850 |
Suncor Energy, Inc. | 5,700 | | 624,513 |
Ultra Petroleum Corp. (a) | 18,400 | | 1,303,824 |
Uranium One, Inc. (a) | 16,100 | | 178,870 |
Valero Energy Corp. | 24,000 | | 1,690,320 |
| | 19,353,284 |
TOTAL ENERGY | | 22,526,252 |
FINANCIALS - 29.8% |
Capital Markets - 4.4% |
Ares Capital Corp. | 16,100 | | 267,904 |
Bear Stearns Companies, Inc. | 6,400 | | 727,040 |
Charles Schwab Corp. | 13,200 | | 306,768 |
Franklin Resources, Inc. | 3,300 | | 427,944 |
Goldman Sachs Group, Inc. | 2,900 | | 718,968 |
Julius Baer Holding AG (Bearer) | 5,093 | | 440,575 |
KKR Private Equity Investors, LP | 21,583 | | 427,343 |
KKR Private Equity Investors, LP Restricted Depositary Units (e) | 1,300 | | 25,740 |
Legg Mason, Inc. | 4,600 | | 381,524 |
Lehman Brothers Holdings, Inc. | 20,900 | | 1,323,806 |
State Street Corp. | 15,246 | | 1,216,173 |
| | 6,263,785 |
Commercial Banks - 2.5% |
Associated Banc-Corp. | 9,505 | | 274,314 |
DnB Nor ASA | 23,000 | | 379,297 |
HSBC Holdings PLC sponsored ADR | 6,300 | | 626,976 |
Mizuho Financial Group, Inc. | 32 | | 179,893 |
Siam City Bank PCL NVDR | 427,100 | | 222,554 |
Sterling Financial Corp., Washington | 10,200 | | 229,500 |
Unicredito Italiano SpA | 40,700 | | 347,900 |
Wachovia Corp. | 29,854 | | 1,365,223 |
| | 3,625,657 |
Consumer Finance - 0.2% |
Discover Financial Services | 12,675 | | 244,628 |
Common Stocks - continued |
| Shares | | Value |
FINANCIALS - continued |
Diversified Financial Services - 10.9% |
Bank of America Corp. | 127,692 | | $ 6,164,970 |
Citigroup, Inc. | 133,800 | | 5,606,220 |
JPMorgan Chase & Co. | 78,440 | | 3,686,680 |
| | 15,457,870 |
Insurance - 8.0% |
ACE Ltd. | 18,100 | | 1,097,041 |
Admiral Group PLC | 10,600 | | 227,211 |
AMBAC Financial Group, Inc. | 13,400 | | 493,522 |
American International Group, Inc. | 77,790 | | 4,910,105 |
Argo Group International Holdings, Ltd. (a) | 7,991 | | 340,497 |
Assurant, Inc. | 7,300 | | 426,612 |
Hartford Financial Services Group, Inc. | 9,850 | | 955,746 |
IPC Holdings Ltd. | 25,300 | | 756,723 |
Max Capital Group Ltd. | 16,500 | | 466,785 |
Montpelier Re Holdings Ltd. | 22,300 | | 399,170 |
Platinum Underwriters Holdings Ltd. | 19,000 | | 684,000 |
Principal Financial Group, Inc. | 8,500 | | 575,195 |
| | 11,332,607 |
Real Estate Investment Trusts - 1.1% |
Alexandria Real Estate Equities, Inc. | 4,300 | | 443,502 |
Annaly Capital Management, Inc. | 29,900 | | 510,991 |
General Growth Properties, Inc. | 5,450 | | 296,262 |
Home Properties, Inc. | 5,900 | | 303,378 |
| | 1,554,133 |
Real Estate Management & Development - 0.2% |
CB Richard Ellis Group, Inc. Class A (a) | 10,200 | | 248,676 |
Thrifts & Mortgage Finance - 2.5% |
BankUnited Financial Corp. Class A (d) | 22,900 | | 197,627 |
Countrywide Financial Corp. | 29,600 | | 459,392 |
Fannie Mae | 32,560 | | 1,857,222 |
FirstFed Financial Corp. (a)(d) | 6,300 | | 269,514 |
New York Community Bancorp, Inc. | 20,900 | | 388,949 |
Washington Federal, Inc. | 16,064 | | 388,106 |
| | 3,560,810 |
TOTAL FINANCIALS | | 42,288,166 |
Common Stocks - continued |
| Shares | | Value |
HEALTH CARE - 6.4% |
Biotechnology - 1.7% |
Amgen, Inc. (a) | 27,700 | | $ 1,609,647 |
Biogen Idec, Inc. (a) | 4,400 | | 327,536 |
Cephalon, Inc. (a) | 3,900 | | 287,586 |
PDL BioPharma, Inc. (a) | 8,400 | | 178,080 |
| | 2,402,849 |
Health Care Equipment & Supplies - 1.6% |
Becton, Dickinson & Co. | 6,500 | | 542,490 |
C.R. Bard, Inc. | 5,300 | | 443,133 |
Covidien Ltd. | 11,075 | | 460,720 |
Medtronic, Inc. | 16,200 | | 768,528 |
| | 2,214,871 |
Health Care Providers & Services - 0.2% |
Brookdale Senior Living, Inc. | 9,000 | | 332,010 |
Life Sciences Tools & Services - 0.2% |
Thermo Fisher Scientific, Inc. (a) | 5,550 | | 326,396 |
Pharmaceuticals - 2.7% |
Johnson & Johnson | 20,300 | | 1,322,951 |
Merck & Co., Inc. | 36,700 | | 2,138,142 |
Wyeth | 5,750 | | 279,623 |
| | 3,740,716 |
TOTAL HEALTH CARE | | 9,016,842 |
INDUSTRIALS - 10.5% |
Aerospace & Defense - 3.5% |
General Dynamics Corp. | 17,700 | | 1,609,992 |
Honeywell International, Inc. | 20,840 | | 1,258,944 |
Raytheon Co. | 7,300 | | 464,353 |
United Technologies Corp. | 20,300 | | 1,554,777 |
| | 4,888,066 |
Air Freight & Logistics - 0.3% |
United Parcel Service, Inc. Class B | 6,200 | | 465,620 |
Airlines - 0.2% |
Delta Air Lines, Inc. (a) | 10,400 | | 216,320 |
US Airways Group, Inc. (a) | 4,500 | | 124,470 |
| | 340,790 |
Building Products - 0.1% |
Masco Corp. | 8,150 | | 196,252 |
Common Stocks - continued |
| Shares | | Value |
INDUSTRIALS - continued |
Commercial Services & Supplies - 0.9% |
Allied Waste Industries, Inc. (a) | 38,100 | | $ 481,584 |
Robert Half International, Inc. | 8,200 | | 246,738 |
The Brink's Co. | 7,550 | | 473,008 |
| | 1,201,330 |
Construction & Engineering - 0.2% |
Fluor Corp. | 2,163 | | 341,754 |
Industrial Conglomerates - 3.9% |
General Electric Co. | 112,580 | | 4,633,793 |
Siemens AG sponsored ADR | 6,100 | | 831,857 |
| | 5,465,650 |
Machinery - 0.9% |
Bucyrus International, Inc. Class A | 5,900 | | 486,750 |
Oshkosh Truck Co. | 7,100 | | 384,820 |
Sulzer AG (Reg.) | 226 | | 362,521 |
| | 1,234,091 |
Road & Rail - 0.5% |
Knight Transportation, Inc. | 21,000 | | 335,370 |
Ryder System, Inc. | 8,300 | | 397,155 |
| | 732,525 |
TOTAL INDUSTRIALS | | 14,866,078 |
INFORMATION TECHNOLOGY - 6.2% |
Communications Equipment - 1.0% |
Alcatel-Lucent SA sponsored ADR | 27,400 | | 265,506 |
Comverse Technology, Inc. (a) | 12,700 | | 244,094 |
Motorola, Inc. | 47,400 | | 890,646 |
| | 1,400,246 |
Computers & Peripherals - 2.6% |
Hewlett-Packard Co. | 35,550 | | 1,837,224 |
International Business Machines Corp. | 8,500 | | 987,020 |
NCR Corp. (a) | 13,700 | | 377,983 |
Sun Microsystems, Inc. (a) | 81,100 | | 463,081 |
| | 3,665,308 |
Electronic Equipment & Instruments - 1.1% |
Agilent Technologies, Inc. (a) | 10,100 | | 372,185 |
Amphenol Corp. Class A | 1,600 | | 70,832 |
Flextronics International Ltd. (a) | 25,100 | | 308,981 |
Common Stocks - continued |
| Shares | | Value |
INFORMATION TECHNOLOGY - continued |
Electronic Equipment & Instruments - continued |
Motech Industries, Inc. | 36,675 | | $ 384,920 |
Tyco Electronics Ltd. | 11,075 | | 395,045 |
| | 1,531,963 |
Internet Software & Services - 0.2% |
VeriSign, Inc. (a) | 9,300 | | 317,037 |
IT Services - 0.4% |
The Western Union Co. | 16,600 | | 365,864 |
Unisys Corp. (a) | 47,798 | | 290,612 |
| | 656,476 |
Semiconductors & Semiconductor Equipment - 0.9% |
Analog Devices, Inc. | 6,200 | | 207,452 |
Applied Materials, Inc. | 13,200 | | 256,344 |
Maxim Integrated Products, Inc. | 11,400 | | 308,940 |
Novellus Systems, Inc. (a) | 10,400 | | 295,464 |
ON Semiconductor Corp. (a) | 4,500 | | 45,900 |
Volterra Semiconductor Corp. (a) | 10,400 | | 127,816 |
| | 1,241,916 |
TOTAL INFORMATION TECHNOLOGY | | 8,812,946 |
MATERIALS - 4.2% |
Chemicals - 1.2% |
Agrium, Inc. | 12,000 | | 762,550 |
Albemarle Corp. | 8,600 | | 410,736 |
Chemtura Corp. | 18,400 | | 171,488 |
Ecolab, Inc. | 6,900 | | 325,473 |
| | 1,670,247 |
Metals & Mining - 3.0% |
Alcoa, Inc. | 21,900 | | 867,021 |
Allegheny Technologies, Inc. | 2,200 | | 224,774 |
ArcelorMittal SA (NY Shares) Class A | 7,100 | | 567,645 |
Carpenter Technology Corp. | 3,000 | | 434,730 |
Freeport-McMoRan Copper & Gold, Inc. Class B | 5,900 | | 694,312 |
Goldcorp, Inc. | 6,700 | | 235,799 |
Lihir Gold Ltd. (a) | 88,116 | | 349,831 |
Newcrest Mining Ltd. | 11,553 | | 352,175 |
Common Stocks - continued |
| Shares | | Value |
MATERIALS - continued |
Metals & Mining - continued |
Randgold Resources Ltd. sponsored ADR | 5,700 | | $ 204,858 |
Reliance Steel & Aluminum Co. | 5,300 | | 309,255 |
| | 4,240,400 |
TOTAL MATERIALS | | 5,910,647 |
TELECOMMUNICATION SERVICES - 6.9% |
Diversified Telecommunication Services - 6.5% |
AT&T, Inc. | 169,037 | | 7,064,056 |
Cincinnati Bell, Inc. (a) | 58,300 | | 315,986 |
Verizon Communications, Inc. | 39,750 | | 1,831,283 |
| | 9,211,325 |
Wireless Telecommunication Services - 0.4% |
American Tower Corp. Class A (a) | 6,600 | | 291,588 |
Sprint Nextel Corp. | 15,300 | | 261,630 |
| | 553,218 |
TOTAL TELECOMMUNICATION SERVICES | | 9,764,543 |
UTILITIES - 5.2% |
Electric Utilities - 2.1% |
E.ON AG sponsored ADR | 6,000 | | 390,600 |
Entergy Corp. | 10,000 | | 1,198,700 |
PPL Corp. | 15,700 | | 811,690 |
Reliant Energy, Inc. (a) | 21,400 | | 588,928 |
| | 2,989,918 |
Independent Power Producers & Energy Traders - 1.7% |
AES Corp. (a) | 19,300 | | 413,213 |
Constellation Energy Group, Inc. | 15,100 | | 1,429,970 |
NRG Energy, Inc. (a) | 13,600 | | 620,976 |
| | 2,464,159 |
Multi-Utilities - 1.4% |
CMS Energy Corp. | 11,600 | | 196,852 |
Common Stocks - continued |
| Shares | | Value |
UTILITIES - continued |
Multi-Utilities - continued |
Public Service Enterprise Group, Inc. | 13,400 | | $ 1,281,040 |
Sempra Energy | 7,000 | | 430,570 |
| | 1,908,462 |
TOTAL UTILITIES | | 7,362,539 |
TOTAL COMMON STOCKS (Cost $126,680,391) | 139,236,341 |
Money Market Funds - 5.2% |
| | | |
Fidelity Cash Central Fund, 4.97% (b) | 921,828 | | 921,828 |
Fidelity Securities Lending Cash Central Fund, 5.02% (b)(c) | 6,493,800 | | 6,493,800 |
TOTAL MONEY MARKET FUNDS (Cost $7,415,628) | 7,415,628 |
TOTAL INVESTMENT PORTFOLIO - 103.5% (Cost $134,096,019) | 146,651,969 |
NET OTHER ASSETS - (3.5)% | | (4,935,054) |
NET ASSETS - 100% | $ 141,716,915 |
Legend |
(a) Non-income producing |
(b) Affiliated fund that is available only to investment companies and other accounts managed by Fidelity Investments. The rate quoted is the annualized seven-day yield of the fund at period end. A complete unaudited listing of the fund's holdings as of its most recent quarter end is available upon request. |
(c) Investment made with cash collateral received from securities on loan. |
(d) Security or a portion of the security is on loan at period end. |
(e) Security exempt from registration under Rule 144A of the Securities Act of 1933. These securities may be resold in transactions exempt from registration, normally to qualified institutional buyers. At the end of the period, the value of these securities amounted to $25,740 or 0.0% of net assets. |
Affiliated Central Funds |
Information regarding fiscal year to date income earned by the Fund from investments in Fidelity Central Funds is as follows: |
Fund | Income earned |
Fidelity Cash Central Fund | $ 67,551 |
Fidelity Securities Lending Cash Central Fund | 5,679 |
Total | $ 73,230 |
Other Information |
Distribution of investments by country of issue, as a percentage of total net assets, is as follows: |
United States of America | 86.6% |
Canada | 2.6% |
Bermuda | 2.4% |
United Kingdom | 2.0% |
Switzerland | 1.6% |
Others (individually less than 1%) | 4.8% |
| 100.0% |
See accompanying notes which are an integral part of the financial statements.
Annual Report
Financial Statements
Statement of Assets and Liabilities
| October 31, 2007 |
| | |
Assets | | |
Investment in securities, at value (including securities loaned of $6,485,131) - See accompanying schedule: Unaffiliated issuers (cost $126,680,391) | $ 139,236,341 | |
Fidelity Central Funds (cost $7,415,628) | 7,415,628 | |
Total Investments (cost $134,096,019) | | $ 146,651,969 |
Receivable for investments sold | | 970,269 |
Receivable for fund shares sold | | 907,774 |
Dividends receivable | | 171,409 |
Distributions receivable from Fidelity Central Funds | | 6,877 |
Prepaid expenses | | 22 |
Receivable from investment adviser for expense reductions | | 9,755 |
Other receivables | | 894 |
Total assets | | 148,718,969 |
| | |
Liabilities | | |
Payable for investments purchased | $ 172,085 | |
Payable for fund shares redeemed | 113,614 | |
Accrued management fee | 65,390 | |
Distribution fees payable | 48,978 | |
Other affiliated payables | 34,694 | |
Other payables and accrued expenses | 73,493 | |
Collateral on securities loaned, at value | 6,493,800 | |
Total liabilities | | 7,002,054 |
| | |
Net Assets | | $ 141,716,915 |
Net Assets consist of: | | |
Paid in capital | | $ 121,669,772 |
Undistributed net investment income | | 592,692 |
Accumulated undistributed net realized gain (loss) on investments and foreign currency transactions | | 6,898,362 |
Net unrealized appreciation (depreciation) on investments and assets and liabilities in foreign currencies | | 12,556,089 |
Net Assets | | $ 141,716,915 |
See accompanying notes which are an integral part of the financial statements.
Annual Report
Statement of Assets and Liabilities - continued
| October 31, 2007 |
| | |
Calculation of Maximum Offering Price
Class A:
Net Asset Value and redemption price per share ($67,434,086 ÷ 4,112,098 shares) | | $ 16.40 |
| | |
Maximum offering price per share (100/94.25 of $16.40) | | $ 17.40 |
Class T:
Net Asset Value and redemption price per share ($50,997,932 ÷ 3,128,899 shares) | | $ 16.30 |
| | |
Maximum offering price per share (100/96.50 of $16.30) | | $ 16.89 |
Class B:
Net Asset Value and offering price per share ($6,733,539 ÷ 418,894 shares) A | | $ 16.07 |
| | |
Class C:
Net Asset Value and offering price per share ($9,718,016 ÷ 605,694 shares) A | | $ 16.04 |
| | |
| | |
Institutional Class:
Net Asset Value, offering price and redemption price per share ($6,833,342 ÷ 413,889 shares) | | $ 16.51 |
A Redemption price per share is equal to net asset value less any applicable contingent deferred sales charge.
See accompanying notes which are an integral part of the financial statements.
Annual Report
Financial Statements - continued
Statement of Operations
| Year ended October 31, 2007 |
| | |
Investment Income | | |
Dividends | | $ 2,196,432 |
Interest | | 374 |
Income from Fidelity Central Funds | | 73,230 |
Total income | | 2,270,036 |
| | |
Expenses | | |
Management fee | $ 604,137 | |
Transfer agent fees | 289,401 | |
Distribution fees | 483,563 | |
Accounting and security lending fees | 42,478 | |
Custodian fees and expenses | 39,286 | |
Independent trustees' compensation | 343 | |
Registration fees | 70,088 | |
Audit | 48,434 | |
Legal | 824 | |
Miscellaneous | 34,121 | |
Total expenses before reductions | 1,612,675 | |
Expense reductions | (50,830) | 1,561,845 |
Net investment income (loss) | | 708,191 |
Realized and Unrealized Gain (Loss) Net realized gain (loss) on: | | |
Investment securities: | | |
Unaffiliated issuers | 7,002,404 | |
Foreign currency transactions | 17,408 | |
Total net realized gain (loss) | | 7,019,812 |
Change in net unrealized appreciation (depreciation) on: Investment securities | 5,194,341 | |
Assets and liabilities in foreign currencies | 96 | |
Total change in net unrealized appreciation (depreciation) | | 5,194,437 |
Net gain (loss) | | 12,214,249 |
Net increase (decrease) in net assets resulting from operations | | $ 12,922,440 |
See accompanying notes which are an integral part of the financial statements.
Annual Report
Statement of Changes in Net Assets
| Year ended
October 31,
2007 | Year ended
October 31,
2006 |
Increase (Decrease) in Net Assets | | |
Operations | | |
Net investment income (loss) | $ 708,191 | $ 122,196 |
Net realized gain (loss) | 7,019,812 | 3,362,048 |
Change in net unrealized appreciation (depreciation) | 5,194,437 | 3,767,996 |
Net increase (decrease) in net assets resulting
from operations | 12,922,440 | 7,252,240 |
Distributions to shareholders from net investment income | (203,521) | (41,743) |
Distributions to shareholders from net realized gain | (3,080,270) | (968,807) |
Total distributions | (3,283,791) | (1,010,550) |
Share transactions - net increase (decrease) | 71,133,838 | 16,012,456 |
Total increase (decrease) in net assets | 80,772,487 | 22,254,146 |
| | |
Net Assets | | |
Beginning of period | 60,944,428 | 38,690,282 |
End of period (including undistributed net investment income of $592,692 and undistributed net investment income of $86,603, respectively) | $ 141,716,915 | $ 60,944,428 |
See accompanying notes which are an integral part of the financial statements.
Annual Report
Financial Highlights - Class A
Years ended October 31, | 2007 | 2006 | 2005 | 2004 | 2003 H |
Selected Per-Share Data | | | | | |
Net asset value, beginning of period | $ 15.08 | $ 13.22 | $ 11.70 | $ 10.37 | $ 10.00 |
Income from Investment Operations | | | | | |
Net investment income (loss) E | .13 | .08 | .06 | .01 | - J |
Net realized and unrealized gain (loss) | 1.99 | 2.15 | 1.51 | 1.32 | .37 |
Total from investment operations | 2.12 | 2.23 | 1.57 | 1.33 | .37 |
Distributions from net investment income | (.09) | (.04) | (.04) | - | - |
Distributions from net realized gain | (.71) | (.33) | (.01) | - | - |
Total distributions | (.80) | (.37) | (.05) | - | - |
Net asset value, end of period | $ 16.40 | $ 15.08 | $ 13.22 | $ 11.70 | $ 10.37 |
Total Return B, C, D | 14.64% | 17.20% | 13.40% | 12.83% | 3.70% |
Ratios to Average Net Assets F, I | | | | | |
Expenses before reductions | 1.28% | 1.41% | 1.50% | 3.39% | 5.52% A |
Expenses net of fee waivers,
if any | 1.25% | 1.25% | 1.30% | 1.50% | 1.75% A |
Expenses net of all reductions | 1.24% | 1.24% | 1.26% | 1.47% | 1.73% A |
Net investment income (loss) | .85% | .54% | .48% | .11% | (.05)% A |
Supplemental Data | | | | | |
Net assets, end of period
(000 omitted) | $ 67,434 | $ 15,398 | $ 7,121 | $ 4,000 | $ 1,123 |
Portfolio turnover rate G | 76% | 91% | 86% | 111% | 108% A |
A Annualized
B Total returns for periods of less than one year are not annualized.
C Total returns would have been lower had certain expenses not been reduced during the periods shown.
D Total returns do not include the effect of the sales charges.
E Calculated based on average shares outstanding during the period.
F Fees and expenses of the underlying Fidelity Central Funds are not included in the Fund's expense ratio. The Fund indirectly bears its proportionate share of the expenses of any underlying Fidelity Central Funds.
G Amount does not include the portfolio activity of any underlying Fidelity Central Funds.
H For the period June 17, 2003 (commencement of operations) to October 31, 2003.
I Expense ratios reflect operating expenses of the class. Expenses before reductions do not reflect amounts reimbursed by the investment adviser or reductions from brokerage service arrangements or other expense offset arrangements and do not represent the amount paid by the class during periods when reimbursements or reductions occur. Expense ratios before reductions for start-up periods may not be representative of longer-term operating periods. Expenses net of fee waivers reflect expenses after reimbursement by the investment adviser but prior to reductions from brokerage service arrangements or other expense offset arrangements. Expenses net of all reductions represent the net expenses paid by the class.
J Amount represents less than $.01 per share.
See accompanying notes which are an integral part of the financial statements.
Annual Report
Financial Highlights - Class T
Years ended October 31, | 2007 | 2006 | 2005 | 2004 | 2003 H |
Selected Per-Share Data | | | | | |
Net asset value, beginning of period | $ 14.99 | $ 13.14 | $ 11.67 | $ 10.36 | $ 10.00 |
Income from Investment Operations | | | | | |
Net investment income (loss) E | .09 | .04 | .03 | (.02) | (.01) |
Net realized and unrealized gain (loss) | 1.97 | 2.15 | 1.48 | 1.33 | .37 |
Total from investment operations | 2.06 | 2.19 | 1.51 | 1.31 | .36 |
Distributions from net investment income | (.04) | (.01) | (.03) | - | - |
Distributions from net realized gain | (.71) | (.33) | (.01) | - | - |
Total distributions | (.75) | (.34) | (.04) | - | - |
Net asset value, end of period | $ 16.30 | $ 14.99 | $ 13.14 | $ 11.67 | $ 10.36 |
Total Return B, C, D | 14.31% | 16.93% | 12.96% | 12.64% | 3.60% |
Ratios to Average Net Assets F, I | | | | | |
Expenses before reductions | 1.53% | 1.65% | 1.72% | 3.30% | 5.77% A |
Expenses net of fee waivers,
if any | 1.50% | 1.50% | 1.55% | 1.75% | 2.00% A |
Expenses net of all reductions | 1.49% | 1.49% | 1.51% | 1.72% | 1.98% A |
Net investment income (loss) | .60% | .29% | .23% | (.14)% | (.30)% A |
Supplemental Data | | | | | |
Net assets, end of period
(000 omitted) | $ 50,998 | $ 30,607 | $ 21,580 | $ 13,340 | $ 1,546 |
Portfolio turnover rate G | 76% | 91% | 86% | 111% | 108% A |
A Annualized
B Total returns for periods of less than one year are not annualized.
C Total returns would have been lower had certain expenses not been reduced during the periods shown.
D Total returns do not include the effect of the sales charges.
E Calculated based on average shares outstanding during the period.
F Fees and expenses of the underlying Fidelity Central Funds are not included in the Fund's expense ratio. The Fund indirectly bears its proportionate share of the expenses of any underlying Fidelity Central Funds.
G Amount does not include the portfolio activity of any underlying Fidelity Central Funds.
H For the period June 17, 2003 (commencement of operations) to October 31, 2003.
I Expense ratios reflect operating expenses of the class. Expenses before reductions do not reflect amounts reimbursed by the investment adviser or reductions from brokerage service arrangements or other expense offset arrangements and do not represent the amount paid by the class during periods when reimbursements or reductions occur. Expense ratios before reductions for start-up periods may not be representative of longer-term operating periods. Expenses net of fee waivers reflect expenses after reimbursement by the investment adviser but prior to reductions from brokerage service arrangements or other expense offset arrangements. Expenses net of all reductions represent the net expenses paid by the class.
See accompanying notes which are an integral part of the financial statements.
Annual Report
Financial Highlights - Class B
Years ended October 31, | 2007 | 2006 | 2005 | 2004 | 2003 H |
Selected Per-Share Data | | | | | |
Net asset value, beginning of period | $ 14.81 | $ 12.99 | $ 11.59 | $ 10.34 | $ 10.00 |
Income from Investment Operations | | | | | |
Net investment income (loss) E | .01 | (.03) | (.03) | (.07) | (.03) |
Net realized and unrealized gain (loss) | 1.95 | 2.13 | 1.46 | 1.32 | .37 |
Total from investment operations | 1.96 | 2.10 | 1.43 | 1.25 | .34 |
Distributions from net investment income | - | - | (.02) | - | - |
Distributions from net realized gain | (.70) | (.28) | (.01) | - | - |
Total distributions | (.70) | (.28) | (.03) | - | - |
Net asset value, end of period | $ 16.07 | $ 14.81 | $ 12.99 | $ 11.59 | $ 10.34 |
Total Return B, C, D | 13.74% | 16.38% | 12.35% | 12.09% | 3.40% |
Ratios to Average Net Assets F, I | | | | | |
Expenses before reductions | 2.10% | 2.23% | 2.31% | 4.33% | 6.24% A |
Expenses net of fee waivers,
if any | 2.00% | 2.00% | 2.05% | 2.25% | 2.50% A |
Expenses net of all reductions | 1.99% | 1.99% | 2.01% | 2.22% | 2.48% A |
Net investment income (loss) | .10% | (.21)% | (.27)% | (.64)% | (.80)% A |
Supplemental Data | | | | | |
Net assets, end of period
(000 omitted) | $ 6,734 | $ 5,734 | $ 4,240 | $ 2,560 | $ 1,125 |
Portfolio turnover rate G | 76% | 91% | 86% | 111% | 108% A |
A Annualized
B Total returns for periods of less than one year are not annualized.
C Total returns would have been lower had certain expenses not been reduced during the periods shown.
D Total returns do not include the effect of the contingent deferred sales charge.
E Calculated based on average shares outstanding during the period.
F Fees and expenses of the underlying Fidelity Central Funds are not included in the Fund's expense ratio. The Fund indirectly bears its proportionate share of the expenses of any underlying Fidelity Central Funds.
G Amount does not include the portfolio activity of any underlying Fidelity Central Funds.
H For the period June 17, 2003 (commencement of operations) to October 31, 2003.
I Expense ratios reflect operating expenses of the class. Expenses before reductions do not reflect amounts reimbursed by the investment adviser or reductions from brokerage service arrangements or other expense offset arrangements and do not represent the amount paid by the class during periods when reimbursements or reductions occur. Expense ratios before reductions for start-up periods may not be representative of longer-term operating periods. Expenses net of fee waivers reflect expenses after reimbursement by the investment adviser but prior to reductions from brokerage service arrangements or other expense offset arrangements. Expenses net of all reductions represent the net expenses paid by the class.
See accompanying notes which are an integral part of the financial statements.
Annual Report
Financial Highlights - Class C
Years ended October 31, | 2007 | 2006 | 2005 | 2004 | 2003 H |
Selected Per-Share Data | | | | | |
Net asset value, beginning of period | $ 14.80 | $ 12.99 | $ 11.58 | $ 10.34 | $ 10.00 |
Income from Investment Operations | | | | | |
Net investment income (loss) E | .02 | (.03) | (.03) | (.07) | (.03) |
Net realized and unrealized gain (loss) | 1.93 | 2.13 | 1.47 | 1.31 | .37 |
Total from investment operations | 1.95 | 2.10 | 1.44 | 1.24 | .34 |
Distributions from net investment income | - | - | (.02) | - | - |
Distributions from net realized gain | (.71) | (.29) | (.01) | - | - |
Total distributions | (.71) | (.29) | (.03) | - | - |
Net asset value, end of period | $ 16.04 | $ 14.80 | $ 12.99 | $ 11.58 | $ 10.34 |
Total Return B, C, D | 13.69% | 16.38% | 12.45% | 11.99% | 3.40% |
Ratios to Average Net Assets F, I | | | | | |
Expenses before reductions | 2.09% | 2.22% | 2.30% | 4.39% | 6.24% A |
Expenses net of fee waivers,
if any | 2.00% | 2.00% | 2.05% | 2.25% | 2.50% A |
Expenses net of all reductions | 1.99% | 1.99% | 2.01% | 2.22% | 2.48% A |
Net investment income (loss) | .10% | (.21)% | (.27)% | (.64)% | (.80)% A |
Supplemental Data | | | | | |
Net assets, end of period
(000 omitted) | $ 9,718 | $ 7,004 | $ 3,892 | $ 1,815 | $ 1,069 |
Portfolio turnover rate G | 76% | 91% | 86% | 111% | 108% A |
A Annualized
B Total returns for periods of less than one year are not annualized.
C Total returns would have been lower had certain expenses not been reduced during the periods shown.
D Total returns do not include the effect of the contingent deferred sales charge.
E Calculated based on average shares outstanding during the period.
F Fees and expenses of the underlying Fidelity Central Funds are not included in the Fund's expense ratio. The Fund indirectly bears its proportionate share of the expenses of any underlying Fidelity Central Funds.
G Amount does not include the portfolio activity of any underlying Fidelity Central Funds.
H For the period June 17, 2003 (commencement of operations) to October 31, 2003.
I Expense ratios reflect operating expenses of the class. Expenses before reductions do not reflect amounts reimbursed by the investment adviser or reductions from brokerage service arrangements or other expense offset arrangements and do not represent the amount paid by the class during periods when reimbursements or reductions occur. Expense ratios before reductions for start-up periods may not be representative of longer-term operating periods. Expenses net of fee waivers reflect expenses after reimbursement by the investment adviser but prior to reductions from brokerage service arrangements or other expense offset arrangements. Expenses net of all reductions represent the net expenses paid by the class.
See accompanying notes which are an integral part of the financial statements.
Annual Report
Financial Highlights - Institutional Class
Years ended October 31, | 2007 | 2006 | 2005 | 2004 | 2003 G |
Selected Per-Share Data | | | | | |
Net asset value, beginning of period | $ 15.17 | $ 13.28 | $ 11.75 | $ 10.38 | $ 10.00 |
Income from Investment Operations | | | | | |
Net investment income (loss) D | .17 | .11 | .09 | .04 | .01 |
Net realized and unrealized gain (loss) | 1.99 | 2.18 | 1.49 | 1.33 | .37 |
Total from investment operations | 2.16 | 2.29 | 1.58 | 1.37 | .38 |
Distributions from net investment income | (.11) | (.07) | (.04) | - | - |
Distributions from net realized gain | (.71) | (.33) | (.01) | - | - |
Total distributions | (.82) | (.40) | (.05) | - | - |
Net asset value, end of period | $ 16.51 | $ 15.17 | $ 13.28 | $ 11.75 | $ 10.38 |
Total Return B, C | 14.89% | 17.58% | 13.47% | 13.20% | 3.80% |
Ratios to Average Net Assets E, H | | | | | |
Expenses before reductions | 1.00% | 1.04% | 1.14% | 3.41% | 5.27% A |
Expenses net of fee waivers,
if any | 1.00% | 1.00% | 1.06% | 1.25% | 1.50% A |
Expenses net of all reductions | .99% | .99% | 1.02% | 1.22% | 1.48% A |
Net investment income (loss) | 1.10% | .79% | .72% | .36% | .20% A |
Supplemental Data | | | | | |
Net assets, end of period
(000 omitted) | $ 6,833 | $ 2,201 | $ 1,857 | $ 1,282 | $ 1,038 |
Portfolio turnover rate F | 76% | 91% | 86% | 111% | 108% A |
A Annualized
B Total returns for periods of less than one year are not annualized.
C Total returns would have been lower had certain expenses not been reduced during the periods shown.
D Calculated based on average shares outstanding during the period.
E Fees and expenses of the underlying Fidelity Central Funds are not included in the Fund's expense ratio. The Fund indirectly bears its proportionate share of the expenses of any underlying Fidelity Central Funds.
F Amount does not include the portfolio activity of any underlying Fidelity Central Funds.
G For the period June 17, 2003 (commencement of operations) to October 31, 2003.
H Expense ratios reflect operating expenses of the class. Expenses before reductions do not reflect amounts reimbursed by the investment adviser or reductions from brokerage service arrangements or other expense offset arrangements and do not represent the amount paid by the class during periods when reimbursements or reductions occur. Expense ratios before reductions for start-up periods may not be representative of longer-term operating periods. Expenses net of fee waivers reflect expenses after reimbursement by the investment adviser but prior to reductions from brokerage service arrangements or other expense offset arrangements. Expenses net of all reductions represent the net expenses paid by the class.
See accompanying notes which are an integral part of the financial statements.
Annual Report
Notes to Financial Statements
For the period ended October 31, 2007
1. Organization.
Fidelity Advisor Value Leaders Fund (the Fund) is a fund of Fidelity Advisor Series VIII (the trust) and is authorized to issue an unlimited number of shares. The trust is registered under the Investment Company Act of 1940, as amended (the 1940 Act), as an open-end management investment company organized as a Massachusetts business trust.
The Fund offers Class A, Class T, Class B, Class C, and Institutional Class shares, each of which has equal rights as to assets and voting privileges. Each class has exclusive voting rights with respect to matters that affect that class. Class B shares will automatically convert to Class A shares after a holding period of seven years from the initial date of purchase. Investment income, realized and unrealized capital gains and losses, the common expenses of the Fund, and certain fund-level expense reductions, if any, are allocated on a pro rata basis to each class based on the relative net assets of each class to the total net assets of the Fund. Each class differs with respect to transfer agent and distribution and service plan fees incurred. Certain expense reductions also differ by class.
2. Investments in Fidelity Central Funds.
The Fund may invest in Fidelity Central Funds, which are open-end investment companies available only to other investment companies and accounts managed by Fidelity Management & Research Company (FMR) and its affiliates. The Fund's Schedule of Investments lists each of the Fidelity Central Funds as an investment of the Fund, but does not include the underlying holdings of each Fidelity Central Fund. As an Investing Fund, the Fund indirectly bears its proportionate share of the expenses of the underlying Fidelity Central Funds.
The Money Market Central Funds seek preservation of capital and current income and are managed by Fidelity Investments Money Management, Inc. (FIMM), an affiliate of FMR.
A complete list of holdings for each Fidelity Central Fund is available upon request or at the SEC's web site at www.sec.gov. In addition, the financial statements of the Fidelity Central Funds, which are not covered by the Fund's Report of Independent Registered Public Accounting Firm, are available on the SEC's web site or upon request.
3. Significant Accounting Policies.
The financial statements have been prepared in conformity with accounting principles generally accepted in the United States of America, which require management to make certain estimates and assumptions at the date of the financial statements. The following summarizes the significant accounting policies of the Fund:
Annual Report
Notes to Financial Statements - continued
3. Significant Accounting Policies - continued
Security Valuation. Investments are valued and net asset value (NAV) per share is calculated (NAV calculation) as of the close of business of the New York Stock Exchange (NYSE), normally 4:00 p.m. Eastern time. Wherever possible, the Fund uses independent pricing services approved by the Board of Trustees to value its investments.
Equity securities, including restricted securities, for which market quotations are readily available, are valued at the last reported sale price or official closing price as reported by an independent pricing service on the primary market or exchange on which they are traded. In the event there were no sales during the day or closing prices are not available, securities are valued at the last quoted bid price. Investments in open-end mutual funds, including the Fidelity Central Funds, are valued at their closing net asset value each business day. Short-term securities with remaining maturities of sixty days or less for which quotations are not readily available are valued at amortized cost, which approximates value.
When current market prices or quotations are not readily available or do not accurately reflect fair value, valuations may be determined in accordance with procedures adopted by the Board of Trustees. For example, when developments occur between the close of a market and the close of the NYSE that may materially affect the value of some or all of the securities, or when trading in a security is halted, those securities may be fair valued. Factors used in the determination of fair value may include monitoring news to identify significant market or security specific events such as changes in the value of U.S. securities markets, reviewing developments in foreign markets and evaluating the performance of ADRs, futures contracts and exchange-traded funds. Because the Fund's utilization of fair value pricing depends on market activity, the frequency with which fair value pricing is used cannot be predicted and may be utilized to a significant extent. The value of securities used for NAV calculation under fair value pricing may differ from published prices for the same securities.
Foreign Currency. The Fund uses foreign currency contracts to facilitate transactions in foreign-denominated securities. Losses from these transactions may arise from changes in the value of the foreign currency or if the counterparties do not perform under the contracts' terms.
Foreign-denominated assets, including investment securities, and liabilities are translated into U.S. dollars at the exchange rate at period end. Purchases and sales of investment securities, income and dividends received and expenses denominated in foreign currencies are translated into U.S. dollars at the exchange rate in effect on the transaction date.
Annual Report
3. Significant Accounting Policies - continued
Foreign Currency - continued
The effects of exchange rate fluctuations on investments are included with the net realized and unrealized gain (loss) on investment securities. Other foreign currency transactions resulting in realized and unrealized gain (loss) are disclosed separately.
Investment Transactions and Income. For financial reporting purposes, the Fund's investment holdings and NAV include trades executed through the end of the last business day of the period. The NAV for processing shareholder transactions includes trades executed through the end of the prior business day. Gains and losses on securities sold are determined on the basis of identified cost and may include proceeds received from litigation. Dividend income is recorded on the ex-dividend date. Non-cash dividends included in dividend income, if any, are recorded at the fair market value of the securities received. Distributions received on securities that represent a return of capital or capital gain are recorded as a reduction of cost of investments and/or as a realized gain. The Fund estimates the components of distributions received that may be considered return of capital distributions or capital gain distributions. Interest income and distributions from the Fidelity Central Funds are accrued as earned. Interest income includes coupon interest and amortization of premium and accretion of discount on debt securities. Investment income is recorded net of foreign taxes withheld where recovery of such taxes is uncertain.
Expenses. Most expenses of the trust can be directly attributed to a fund. Expenses which cannot be directly attributed are apportioned among each Fund in the trust. Expense estimates are accrued in the period to which they relate and adjustments are made when actual amounts are known.
Income Tax Information and Distributions to Shareholders. Each year, the Fund intends to qualify as a regulated investment company by distributing all of its taxable income and realized gains under Subchapter M of the Internal Revenue Code. As a result, no provision for income taxes is required in the accompanying financial statements. Foreign taxes are provided for based on the Fund's understanding of the tax rules and rates that exist in the foreign markets in which it invests.
Distributions are recorded on the ex-dividend date. Income dividends and capital gain distributions are declared separately for each class. Income and capital gain distributions are determined in accordance with income tax regulations, which may differ from generally accepted accounting principles. In addition, the Fund will claim a portion of the payment made to redeeming shareholders as a distribution for income tax purposes.
Capital accounts within the financial statements are adjusted for permanent book-tax differences. Certain adjustments have been made to the accounts relating to prior
Annual Report
Notes to Financial Statements - continued
3. Significant Accounting Policies - continued
Income Tax Information and Distributions to Shareholders - continued
periods. Collectively, these adjustments have no impact on net assets or the results of operations. Temporary book-tax differences will reverse in a subsequent period.
Book-tax differences are primarily due to foreign currency transactions, passive foreign investment companies (PFIC) and losses deferred due to wash sales.
The tax-basis components of distributable earnings and the federal tax cost as of period end were as follows:
Unrealized appreciation | $ 20,028,233 | |
Unrealized depreciation | (7,689,398) | |
Net unrealized appreciation (depreciation) | 12,338,835 | |
Undistributed ordinary income | 2,582,182 | |
Undistributed long-term capital gain | 4,225,352 | |
| | |
Cost for federal income tax purposes | $ 134,313,134 | |
The tax character of distributions paid was as follows:
| October 31, 2007 | October 31, 2006 |
Ordinary Income | $ 546,132 | $ 291,983 |
Long-term Capital Gains | 2,737,659 | 718,567 |
Total | $ 3,283,791 | $ 1,010,550 |
New Accounting Pronouncements. In July 2006, Financial Accounting Standards Board Interpretation No. 48, Accounting for Uncertainty in Income Taxes - an interpretation of FASB Statement 109 (FIN 48), was issued and is effective on the last business day of the semiannual reporting period for fiscal years beginning after December 15, 2006. FIN 48 sets forth a threshold for financial statement recognition, measurement and disclosure of a tax position taken or expected to be taken on a tax return. Management has concluded that the adoption of FIN 48 will not result in a material impact on the Fund's net assets, results of operations and financial statement disclosures.
In addition, in September 2006, Statement of Financial Accounting Standards No. 157, Fair Value Measurements (SFAS 157), was issued and is effective for fiscal years beginning after November 15, 2007. SFAS 157 defines fair value, establishes a framework for measuring fair value and expands disclosures about fair value measurements. Management is currently evaluating the impact the adoption of SFAS 157 will have on the Fund's financial statement disclosures.
Annual Report
4. Operating Policies.
Repurchase Agreements. FMR has received an Exemptive Order from the Securities and Exchange Commission (the SEC) which permits the Fund and other affiliated entities of FMR to transfer uninvested cash balances into joint trading accounts which are then invested in repurchase agreements. The Fund may also invest directly with institutions in repurchase agreements. Repurchase agreements are collateralized by government or non-government securities. Upon settlement date, collateral is held in segregated accounts with custodian banks and may be obtained in the event of a default of the counterparty. The Fund monitors, on a daily basis, the value of the collateral to ensure it is at least equal to the principal amount of the repurchase agreement (including accrued interest). In the event of a default by the counterparty, realization of the collateral proceeds could be delayed, during which time the value of the collateral may decline.
Restricted Securities. The Fund may invest in securities that are subject to legal or contractual restrictions on resale. These securities generally may be resold in transactions exempt from registration or to the public if the securities are registered. Disposal of these securities may involve time-consuming negotiations and expense, and prompt sale at an acceptable price may be difficult. Information regarding restricted securities is included at the end of the Fund's Schedule of Investments.
5. Purchases and Sales of Investments.
Purchases and sales of securities, other than short-term securities, aggregated $147,664,629 and $80,688,670, respectively.
6. Fees and Other Transactions with Affiliates.
Management Fee. FMR and its affiliates provide the Fund with investment management related services for which the Fund pays a monthly management fee. The management fee is the sum of an individual fund fee rate that is based on an annual rate of .30% of the Fund's average net assets and a group fee rate that averaged ..26% during the period. The group fee rate is based upon the average net assets of all the mutual funds advised by FMR. The group fee rate decreases as assets under management increase and increases as assets under management decrease.
In addition, on May 16, 2007, shareholders approved a new management contract which adds a performance adjustment to the management fee (up to a maximum of .20% of the Fund's average net assets over a 36 month performance period). The upward or downward adjustment to the management fee is based on the relative investment performance of the Fund's Institutional Class as compared to an appropriate benchmark index. The Fund's performance period began on June 1, 2007. The performance adjustment
Annual Report
Notes to Financial Statements - continued
6. Fees and Other Transactions with Affiliates - continued
Management Fee - continued
will take effect starting with the twelfth month of the performance period (May, 2008). Subsequent months will be added until the performance period includes 36 months. For the period, the total annual management fee rate was .56% of the Fund's average net assets.
Distribution and Service Plan. In accordance with Rule 12b-1 of the 1940 Act, the Fund has adopted separate Distribution and Service Plans for each class of shares. Certain classes pay Fidelity Distributors Corporation (FDC), an affiliate of FMR, separate Distribution and Service Fees, each of which is based on an annual percentage of each class' average net assets. In addition, FDC may pay financial intermediaries for selling shares of the Fund and providing shareholder support services. For the period, the Distribution and Service Fee rates and the total amounts paid to and retained by FDC were as follows:
| Distribution
Fee | Service
Fee | Paid to
FDC | Retained
by FDC |
Class A | 0% | .25% | $ 108,401 | $ 52,690 |
Class T | .25% | .25% | 218,808 | 2,200 |
Class B | .75% | .25% | 67,794 | 52,303 |
Class C | .75% | .25% | 88,560 | 35,190 |
| | | $ 483,563 | $ 142,383 |
Sales Load. FDC receives a front-end sales charge of up to 5.75% for selling Class A shares, and 3.50% for selling Class T shares, some of which is paid to financial intermediaries for selling shares of the Fund. FDC receives the proceeds of contingent deferred sales charges levied on Class A, Class T, Class B, and Class C redemptions. These charges depend on the holding period. The deferred sales charges range from 5% to 1% for Class B, 1% for Class C, 1.00% to .50% for certain purchases of Class A shares and .25% for certain purchases of Class T shares.
For the period, sales charge amounts retained by FDC were as follows:
| Retained
by FDC |
Class A | $ 47,235 |
Class T | 12,611 |
Class B* | 7,599 |
Class C* | 3,310 |
| $ 70,755 |
* When Class B and Class C shares are initially sold, FDC pays commissions from its own resources to financial intermediaries through which the sales are made.
Annual Report
6. Fees and Other Transactions with Affiliates - continued
Transfer Agent Fees. Fidelity Investments Institutional Operations Company, Inc. (FIIOC), an affiliate of FMR, is the transfer, dividend disbursing and shareholder servicing agent for each class of the Fund. FIIOC receives account fees and asset-based fees that vary according to the account size and type of account of the shareholders of the respective classes of the Fund. FIIOC pays for typesetting, printing and mailing of shareholder reports, except proxy statements. For the period, the total transfer agent fees paid by each class to FIIOC, were as follows:
| Amount | % of
Average
Net Assets |
Class A | $ 116,641 | .27 |
Class T | 111,364 | .25 |
Class B | 21,226 | .31 |
Class C | 27,477 | .31 |
Institutional Class | 12,693 | .24 |
| $ 289,401 | |
Accounting and Security Lending Fees. Fidelity Service Company, Inc. (FSC), an affiliate of FMR, maintains the Fund's accounting records. The accounting fee is based on the level of average net assets for the month. Under a separate contract, FSC administers the security lending program. The security lending fee is based on the number and duration of lending transactions.
Brokerage Commissions. The Fund placed a portion of its portfolio transactions with brokerage firms which are affiliates of the investment adviser. The commissions paid to these affiliated firms were $1,626 for the period.
7. Committed Line of Credit.
The Fund participates with other funds managed by FMR in a $4.2 billion credit facility (the "line of credit") to be utilized for temporary or emergency purposes to fund shareholder redemptions or for other short-term liquidity purposes. The Fund has agreed to pay commitment fees on its pro rata portion of the line of credit, which amounted to $203 and is reflected in Miscellaneous Expense on the Statement of Operations. During the period, there were no borrowings on this line of credit.
Annual Report
Notes to Financial Statements - continued
8. Security Lending.
The Fund lends portfolio securities from time to time in order to earn additional income. On the settlement date of the loan, the Fund receives collateral (in the form of U.S. Treasury obligations, letters of credit and/or cash) against the loaned securities and maintains collateral in an amount not less than 100% of the market value of the loaned securities during the period of the loan. The market value of the loaned securities is determined at the close of business of the Fund and any additional required collateral is delivered to the Fund on the next business day. If the borrower defaults on its obligation to return the securities loaned because of insolvency or other reasons, a fund could experience delays and costs in recovering the securities loaned or in gaining access to the collateral. Any cash collateral received is invested in the Fidelity Securities Lending Cash Central Fund. The value of loaned securities and cash collateral at period end are disclosed on the Fund's Statement of Assets and Liabilities. Security lending income represents the income earned on investing cash collateral, less fees and expenses associated with the loan, plus any premium payments that may be received on the loan of certain types of securities. Security lending income is presented in the Statement of Operations as a component of income from Fidelity Central Funds. Net income from lending portfolio securities during the period amounted to $5,679.
9. Expense Reductions.
FMR voluntarily agreed to reimburse each class to the extent annual operating expenses exceeded certain levels of average net assets as noted in the table below. Some expenses, for example interest expense, including commitment fees, are excluded from this reimbursement.
The following classes were in reimbursement during the period:
| Expense
Limitations | Reimbursement
from adviser |
| | |
Class A | 1.25% | $ 14,802 |
Class T | 1.50% | 13,695 |
Class B | 2.00% | 6,877 |
Class C | 2.00% | 7,954 |
| | $ 43,328 |
Many of the brokers with whom FMR places trades on behalf of the Fund provided services to the Fund in addition to trade execution. These services included payments of certain expenses on behalf of the Fund totaling $3,169 for the period. In addition, through arrangements with the Fund's custodian and each class' transfer agent, credits realized as a result of uninvested cash balances were used to reduce the Fund's expenses.
Annual Report
9. Expense Reductions - continued
During the period, these credits reduced the Fund's custody expenses by $1,761. During the period, credits reduced each class' transfer agent expense as noted in the table below.
| Transfer Agent
expense reduction | |
Class A | $ 1,684 | |
Institutional Class | 18 | |
| $ 1,702 | |
10. Other.
The Fund's organizational documents provide former and current trustees and officers with a limited indemnification against liabilities arising in connection with the performance of their duties to the Fund. In the normal course of business, the Fund may also enter into contracts that provide general indemnifications. The Fund's maximum exposure under these arrangements is unknown as this would be dependent on future claims that may be made against the Fund. The risk of material loss from such claims is considered remote.
In September 2006, FIIOC, the Fund's transfer agent, notified the Fund that the Fund's books and records did not reflect a conversion of certain Class B to Class A shares upon their conversion date. In March 2007, FIIOC converted the relevant Class B shares to Class A shares and recorded the conversion in the books and records of the Fund which did not result in a material impact to the Fund's reported net assets or results of operations in the accompanying financial statements. FIIOC has remediated affected shareholders and reimbursed the Fund for all related audit and legal expenses.
The United States Securities and Exchange Commission ("SEC") is conducting an investigation of FMR (covering the years 2002 to 2004) arising from gifts, gratuities and business entertainment provided by certain brokers to certain individuals who were employed on FMR's domestic equity trading desk during that period. FMR is in discussions with the SEC staff regarding the possible resolution of the matter, but as of period-end no final resolution has been reached.
In December 2006, the Independent Trustees completed their own investigation of the matter with the assistance of independent counsel. The Independent Trustees and FMR agree that, despite the absence of proof that the Fidelity mutual funds experienced diminished execution quality as a result of the improper receipt of gifts and business entertainment, the conduct at issue was serious and is worthy of redress. Accordingly, the Independent Trustees have requested and FMR has agreed to pay $42 million to Fidelity mutual funds, plus interest to be determined at the time that payment is made. A method
Annual Report
Notes to Financial Statements - continued
10. Other - continued
of allocating this payment among the funds has not yet been determined. The total payment to the Fund is not anticipated to have a material impact on the Fund's net assets. In addition, FMR reimbursed related legal expenses which are recorded in the accompanying Statement of Operations as an expense reduction.
11. Distributions to Shareholders.
Distributions to shareholders of each class were as follows:
| Years ended October 31, |
| 2007 | 2006 |
From net investment income | | |
Class A | $ 95,578 | $ 22,293 |
Class T | 84,209 | 9,977 |
Institutional Class | 23,734 | 9,473 |
Total | $ 203,521 | $ 41,743 |
From net realized gain | | |
Class A | $ 798,354 | $ 186,144 |
Class T | 1,494,717 | 555,326 |
Class B | 288,272 | 92,178 |
Class C | 347,113 | 88,629 |
Institutional Class | 151,814 | 46,530 |
Total | $ 3,080,270 | $ 968,807 |
12. Share Transactions.
Transactions for each class of shares were as follows:
| Shares | Dollars |
| Years ended October 31, | Years ended October 31, |
| 2007 | 2006 | 2007 | 2006 |
Class A | | | | |
Shares sold | 3,695,755 | 659,673 | $ 57,509,722 | $ 9,418,722 |
Reinvestment of distributions | 58,930 | 14,943 | 865,688 | 203,973 |
Shares redeemed | (663,449) | (192,331) | (10,352,319) | (2,708,463) |
Net increase (decrease) | 3,091,236 | 482,285 | $ 48,023,091 | $ 6,914,232 |
Class T | | | | |
Shares sold | 1,421,685 | 787,206 | $ 21,932,526 | $ 11,194,933 |
Reinvestment of distributions | 102,412 | 39,036 | 1,498,284 | 530,894 |
Shares redeemed | (437,693) | (426,412) | (6,887,915) | (5,998,651) |
Net increase (decrease) | 1,086,404 | 399,830 | $ 16,542,895 | $ 5,727,176 |
Annual Report
12. Share Transactions - continued
| Shares | Dollars |
| Years ended October 31, | Years ended October 31, |
| 2007 | 2006 | 2007 | 2006 |
Class B | | | | |
Shares sold | 214,346 | 203,112 | $ 3,232,327 | $ 2,847,587 |
Reinvestment of distributions | 18,230 | 6,282 | 264,152 | 84,800 |
Shares redeemed | (200,858) | (148,531) | (3,047,563) | (2,076,164) |
Net increase (decrease) | 31,718 | 60,863 | $ 448,916 | $ 856,223 |
Class C | | | | |
Shares sold | 300,918 | 243,177 | $ 4,603,445 | $ 3,406,535 |
Reinvestment of distributions | 22,867 | 6,465 | 330,886 | 87,218 |
Shares redeemed | (191,479) | (75,797) | (2,915,876) | (1,054,786) |
Net increase (decrease) | 132,306 | 173,845 | $ 2,018,455 | $ 2,438,967 |
Institutional Class | | | | |
Shares sold | 592,099 | 34,102 | $ 9,392,137 | $ 488,410 |
Reinvestment of distributions | 11,218 | 3,384 | 165,468 | 46,355 |
Shares redeemed | (334,584) | (32,226) | (5,457,124) | (458,907) |
Net increase (decrease) | 268,733 | 5,260 | $ 4,100,481 | $ 75,858 |
Annual Report
Report of Independent Registered Public Accounting Firm
To the Trustees of Fidelity Advisor Series VIII and the Shareholders of Fidelity Advisor Value Leaders Fund:
In our opinion, the accompanying statement of assets and liabilities, including the schedule of investments, and the related statements of operations and of changes in net assets and the financial highlights present fairly, in all material respects, the financial position of Fidelity Advisor Value Leaders Fund (a fund of Fidelity Advisor Series VIII) at October 31, 2007, the results of its operations for the year then ended, the changes in its net assets for each of the two years in the period then ended and the financial highlights for each of the periods indicated, in conformity with accounting principles generally accepted in the United States of America. These financial statements and financial highlights (hereafter referred to as "financial statements") are the responsibility of the Fidelity Advisor Value Leaders Fund's management. Our responsibility is to express an opinion on these financial statements based on our audits. We conducted our audits of these financial statements in accordance with the standards of the Public Company Accounting Oversight Board (United States). Those standards require that we plan and perform the audit to obtain reasonable assurance about whether the financial statements are free of material misstatement. An audit includes examining, on a test basis, evidence supporting the amounts and disclosures in the financial statements, assessing the accounting principles used and significant estimates made by management, and evaluating the overall financial statement presentation. We believe that our audits, which included confirmation of securities at October 31, 2007 by correspondence with the custodian and brokers, provide a reasonable basis for our opinion.
/s/ PricewaterhouseCoopers LLP
PricewaterhouseCoopers LLP
Boston, Massachusetts
December 20, 2007
Annual Report
Trustees and Officers
The Trustees, Members of the Advisory Board, and executive officers of the trust and fund, as applicable, are listed below. The Board of Trustees governs the fund and is responsible for protecting the interests of shareholders. The Trustees are experienced executives who meet periodically throughout the year to oversee the fund's activities, review contractual arrangements with companies that provide services to the fund, and review the fund's performance. Except for James C. Curvey, each of the Trustees oversees 370 funds advised by FMR or an affiliate. Mr. Curvey oversees 340 funds advised by FMR or an affiliate.
The Trustees hold office without limit in time except that (a) any Trustee may resign; (b) any Trustee may be removed by written instrument, signed by at least two-thirds of the number of Trustees prior to such removal; (c) any Trustee who requests to be retired or who has become incapacitated by illness or injury may be retired by written instrument signed by a majority of the other Trustees; and (d) any Trustee may be removed at any special meeting of shareholders by a two-thirds vote of the outstanding voting securities of the trust. Each Trustee who is not an interested person (as defined in the 1940 Act) (Independent Trustee), shall retire not later than the last day of the calendar year in which his or her 72nd birthday occurs. The Independent Trustees may waive this mandatory retirement age policy with respect to individual Trustees. The executive officers and Advisory Board Members hold office without limit in time, except that any officer and Advisory Board Member may resign or may be removed by a vote of a majority of the Trustees at any regular meeting or any special meeting of the Trustees. Except as indicated, each individual has held the office shown or other offices in the same company for the past five years.
The fund's Statement of Additional Information (SAI) includes more information about the Trustees. To request a free copy, call Fidelity at 1-877-208-0098.
Interested Trustees*:
Correspondence intended for each Trustee who is an interested person may be sent to Fidelity Investments, 82 Devonshire Street, Boston, Massachusetts 02109.
Name, Age; Principal Occupation |
Edward C. Johnson 3d (77) |
| Year of Election or Appointment: 1983 Mr. Johnson is Chairman of the Board of Trustees. Mr. Johnson serves as President (2006-present), Chief Executive Officer, Chairman, and a Director of FMR LLC; Chairman and a Director of FMR; Chairman and a Director of Fidelity Research & Analysis Company (FRAC); Chairman and a Director of Fidelity Investments Money Management, Inc.; and Chairman (2001-present) and a Director of FMR Co., Inc. In addition, Mr. Johnson serves as Chairman and Director of Fidelity International Limited (FIL). |
James C. Curvey (72) |
| Year of Election or Appointment: 2007 Mr. Curvey also serves as Trustee (2007-present) or Member of the Advisory Board (2007-present) of other investment companies advised by FMR. Mr. Curvey is a Director of FMR and FMR Co., Inc. (2007-
present). Mr. Curvey is also Vice Chairman (2006-present) and Director of FMR LLC. Mr. Curvey joined Fidelity in 1982 and served in numerous senior management positions, including President and Chief Operating Officer of FMR LLC (1997-2000) and President of Fidelity Strategic Investments (2000-2002). In addition, he serves as a member of the Board of Directors of Geerlings & Wade, Inc. (wine distribution). |
* Trustees have been determined to be "Interested Trustees" by virtue of, among other things, their affiliation with the trust or various entities under common control with FMR. FMR Corp. merged with FMR LLC on October 1, 2007. Any references to FMR LLC for prior periods are deemed to be references to the prior entity.
Independent Trustees:
Correspondence intended for each Independent Trustee (that is, the Trustees other than the Interested Trustees) may be sent to Fidelity Investments, P.O. Box 55235, Boston, Massachusetts 02205-5235.
Name, Age; Principal Occupation |
Dennis J. Dirks (59) |
| Year of Election or Appointment: 2005 Prior to his retirement in May 2003, Mr. Dirks was Chief Operating Officer and a member of the Board of The Depository Trust & Clearing Corporation (DTCC) (1999-2003). He also served as President, Chief Operating Officer, and Board member of The Depository Trust Company (DTC) (1999-2003) and President and Board member of the National Securities Clearing Corporation (NSCC) (1999-2003). In addition, Mr. Dirks served as Chief Executive Officer and Board member of the Government Securities Clearing Corporation (2001-2003) and Chief Executive Officer and Board member of the Mortgage-Backed Securities Clearing Corporation (2001-2003). Mr. Dirks also serves as a Trustee and a member of the Finance Committee of Manhattan College (2005-present) and a Trustee and a member of the Finance Committee of AHRC of Nassau County (2006-present). |
Albert R. Gamper, Jr. (65) |
| Year of Election or Appointment: 2006 Prior to his retirement in December 2004, Mr. Gamper served as Chairman of the Board of CIT Group Inc. (commercial finance). During his tenure with CIT Group Inc. Mr. Gamper served in numerous senior management positions, including Chairman (1987-1989; 1999-2001; 2002-2004), Chief Executive Officer (1987-2004), and President (1989-2002). He currently serves as a member of the Board of Directors of Public Service Enterprise Group (utilities, 2001-present), Chairman of the Board of Governors, Rutgers University (2004-present), and Chairman of the Board of Saint Barnabas Health Care System. |
George H. Heilmeier (71) |
| Year of Election or Appointment: 2004 Dr. Heilmeier is Chairman Emeritus of Telcordia Technologies (communication software and systems), where prior to his retirement, he served as company Chairman and Chief Executive Officer. He currently serves on the Boards of Directors of The Mitre Corporation (systems engineering and information technology support for the government), and HRL Laboratories (private research and development, 2004-present). He is Chairman of the General Motors Science & Technology Advisory Board and a Life Fellow of the Institute of Electrical and Electronics Engineers (IEEE). Dr. Heilmeier is a member of the Defense Science Board and the National Security Agency Advisory Board. He is also a member of the National Academy of Engineering, the American Academy of Arts and Sciences, and the Board of Overseers of the School of Engineering and Applied Science of the University of Pennsylvania. Previously, Dr. Heilmeier served as a Director of TRW Inc. (automotive, space, defense, and information technology, 1992-2002), Compaq (1994-2002), Automatic Data Processing, Inc. (ADP) (technology-based business outsourcing, 1995-2002), INET Technologies Inc. (telecommunications network surveillance, 2001-2004), and Teletech Holdings (customer management services). He is the recipient of the 2005 Kyoto Prize in Advanced Technology for his invention of the liquid crystal display, and a member of the Consumer Electronics Hall of Fame. |
James H. Keyes (67) |
| Year of Election or Appointment: 2007 Prior to his retirement in 2003, Mr. Keyes was Chairman, President, and Chief Executive Officer of Johnson Controls, Inc. (automotive supplier, 1993-2003). He currently serves as a member of the boards of LSI Logic Corporation (semiconductor technologies), Navistar International Corporation (manufacture and sale of trucks, buses, and diesel engines, 2002-present), and Pitney Bowes, Inc. (integrated mail, messaging, and document management solutions). |
Marie L. Knowles (61) |
| Year of Election or Appointment: 2001 Prior to Ms. Knowles' retirement in June 2000, she served as Executive Vice President and Chief Financial Officer of Atlantic Richfield Company (ARCO) (diversified energy, 1996-2000). From 1993 to 1996, she was a Senior Vice President of ARCO and President of ARCO Transportation Company. She served as a Director of ARCO from 1996 to 1998. She currently serves as a Director of Phelps Dodge Corporation (copper mining and manufacturing) and McKesson Corporation (healthcare service, 2002-present). Ms. Knowles is a Trustee of the Brookings Institution and the Catalina Island Conservancy and also serves as a member of the Advisory Board for the School of Engineering of the University of Southern California. |
Ned C. Lautenbach (63) |
| Year of Election or Appointment: 2000 Mr. Lautenbach is Chairman of the Independent Trustees (2006-present). Mr. Lautenbach has been a partner of Clayton, Dubilier & Rice, Inc. (private equity investment firm) since September 1998. Previously, Mr. Lautenbach was with the International Business Machines Corporation (IBM) from 1968 until his retirement in 1998. Mr. Lautenbach serves as a Director of Sony Corporation (2006-present) and Eaton Corporation (diversified industrial) as well as the Philharmonic Center for the Arts in Naples, Florida. He also is a member of the Board of Trustees of Fairfield University (2005-present), as well as a member of the Council on Foreign Relations. |
Cornelia M. Small (63) |
| Year of Election or Appointment: 2005 Ms. Small is a member (2000-present) and Chairperson (2002-present) of the Investment Committee, and a member (2002-present) of the Board of Trustees of Smith College. Previously, she served as Chief Investment Officer (1999-2000), Director of Global Equity Investments (1996-1999), and a member of the Board of Directors of Scudder, Stevens & Clark (1990-1997) and Scudder Kemper Investments (1997-1999). In addition, Ms. Small served as Co-Chair (2000-2003) of the Annual Fund for the Fletcher School of Law and Diplomacy. |
William S. Stavropoulos (68) |
| Year of Election or Appointment: 2001 Mr. Stavropoulos is Chairman Emeritus of the Board of Directors of The Dow Chemical Company. Since joining The Dow Chemical Company in 1967, Mr. Stavropoulos served in numerous senior management positions, including President (1993-2000; 2002-2003), CEO (1995-2000; 2002-2004), and Chairman of the Executive Committee (2000-2004). Currently, he is a Director of NCR Corporation (data warehousing and technology solutions), Chemical Financial Corporation, Maersk Inc. (industrial conglomerate, 2002-present), Tyco International, Inc. (multinational manufacturing and services, 2007-present), and a member of the Advisory Board for Metalmark Capital (private equity investment firm, 2005-present). He is a special advisor to Clayton, Dubilier & Rice, Inc., a private equity investment firm. He also serves as a member of the Board of Trustees of the American Enterprise Institute for Public Policy Research. In addition, Mr. Stavropoulos is a member of The Business Council, J.P. Morgan International Council and the University of Notre Dame Advisory Council for the College of Science. |
Kenneth L. Wolfe (68) |
| Year of Election or Appointment: 2005 Prior to his retirement in 2001, Mr. Wolfe was Chairman and Chief Executive Officer of Hershey Foods Corporation (1993-2001). He currently serves as a member of the boards of Adelphia Communications Corporation (2003-present), Bausch & Lomb, Inc., and Revlon Inc. (2004-present). |
Advisory Board Members and Executive Officers**:
Correspondence intended for Mr. Mauriello, Mr. Thomas, and Mr. Wiley may be sent to Fidelity Investments, P.O. Box 55235, Boston, Massachusetts 02205-5235. Correspondence intended for each executive officer and Mr. Lynch may be sent to Fidelity Investments, 82 Devonshire Street, Boston, Massachusetts 02109.
Name, Age; Principal Occupation |
Peter S. Lynch (63) |
| Year of Election or Appointment: 2003 Member of the Advisory Board of Fidelity Advisor Series VIII. Mr. Lynch is Vice Chairman and a Director of FMR, and Vice Chairman (2001-present) and a Director of FMR Co., Inc. Previously, Mr. Lynch served as a Trustee of the Fidelity funds (1990-2003). In addition, he serves as a Trustee of Boston College and as the Chairman of the Inner-City Scholarship Fund. |
Joseph Mauriello (63) |
| Year of Election or Appointment: 2007 Member of the Advisory Board of Fidelity Advisor Series VIII. Prior to his retirement in January 2006, Mr. Mauriello served in numerous senior management positions including Deputy Chairman and Chief Operating Officer (2004-2005), and Vice Chairman of Financial Services (2002-2004) of KPMG LLP US (professional services firm, 1965-2005). Mr. Mauriello currently serves as a member of the Board of Directors of XL Capital Ltd., (global insurance and re-insurance company, 2006-present) and of Arcadia Resources Inc., (health care services and products, 2007-present). He also served as a Director of the Hamilton Funds of the Bank of New York (2006-2007). |
David M. Thomas (58) |
| Year of Election or Appointment: 2007 Member of the Advisory Board of Fidelity Advisor Series VIII. Previously, Mr. Thomas served as Executive Chairman (2005-2006) and Chairman and Chief Executive Officer (2000-2005) of IMS Health, Inc. (pharmaceutical and healthcare information solutions). In addition, Mr. Thomas serves as a member of the Board of Directors of Fortune Brands, Inc. (consumer products holding company), and Interpublic Group of Companies, Inc. (marketing communication, 2004-present). |
Michael E. Wiley (57) |
| Year of Election or Appointment: 2007 Member of the Advisory Board of Fidelity Advisor Series VIII. Mr. Wiley also serves as Sr. Energy Advisor of Katzenbach Partners, LLC (consulting firm, 2006-present) and a member of the Board of Trustees of the University of Tulsa (2000-2006; 2007-present). He serves as a Director of Tesoro Corporation (independent oil refiner and marketer, 2005-
present), and a Director of Bill Barrett Corporation (exploration and production company, 2005-present). In addition, he also serves as a Director of Post Oak Bank (privately-held bank, 2004-present), and an Advisory Director of Riverstone Holdings (private investment firm). Previously, Mr. Wiley served as Chairman, President, and CEO of Baker Hughes, Inc. (oilfield services company, 2000-2004), and as Director of Spinnaker Exploration Company (exploration and production company, 2001-2005). |
Kimberley H. Monasterio (43) |
| Year of Election or Appointment: 2007 President and Treasurer of Advisor Value Leaders. Ms. Monasterio also serves as President and Treasurer of other Fidelity funds (2007-present) and is an employee of FMR (2004-present). Previously, Ms. Monasterio served as Deputy Treasurer of the Fidelity funds (2004-2006). Before joining Fidelity Investments, Ms. Monasterio served as Treasurer (2000-2004) and Chief Financial Officer (2002-2004) of the Franklin Templeton Funds and Senior Vice President of Franklin Templeton Services, LLC (2000-2004). |
Walter C. Donovan (45) |
| Year of Election or Appointment: 2007 Vice President of Advisor Value Leaders. Mr. Donovan also serves as Vice President of Fidelity's Equity Funds (2007-present). Mr. Donovan also serves as Executive Vice President of FMR (2005-present) and FMR Co., Inc. (2005-present). Previously, Mr. Donovan served as Vice President of Fidelity's High Income Funds (2005-2007), Fixed-Income Funds (2005-2006), certain Asset Allocation Funds (2005-2006), certain Balanced Funds (2005-2006), and as Vice President and Director of Fidelity's International Equity Trading group (1998-2005). |
Bruce T. Herring (42) |
| Year of Election or Appointment: 2006 Vice President of Advisor Value Leaders. Mr. Herring also serves as Vice President of certain Equity Funds (2006-present). Mr. Herring is Senior Vice President of FMR (2006-present) and Vice President of FMR Co., Inc. (2001-present). Previously, Mr. Herring served as a portfolio manager for Fidelity U.S. Equity Funds (2001-2005). |
Eric D. Roiter (58) |
| Year of Election or Appointment: 2003 Secretary of Advisor Value Leaders. He also serves as Secretary of other Fidelity funds; Vice President, General Counsel, and Secretary of FMR Co., Inc. (2001-present) and FMR; Assistant Secretary of Fidelity Management & Research (U.K.) Inc. (2001-present), Fidelity Research & Analysis Company (2001-present), and Fidelity Investments Money Management, Inc. (2001-present). Mr. Roiter is an Adjunct Member, Faculty of Law, at Boston College Law School (2003-present). Previously, Mr. Roiter served as Vice President and Secretary of Fidelity Distributors Corporation (FDC) (1998-2005). |
Scott C. Goebel (39) |
| Year of Election or Appointment: 2007 Assistant Secretary of Advisor Value Leaders. Mr. Goebel also serves as Assistant Secretary of other Fidelity funds (2007-present), and is an employee of FMR. |
R. Stephen Ganis (41) |
| Year of Election or Appointment: 2006 Anti-Money Laundering (AML) officer of Advisor Value Leaders. Mr. Ganis also serves as AML officer of other Fidelity funds (2006-present) and FMR LLC (2003-present). Before joining Fidelity Investments, Mr. Ganis practiced law at Goodwin Procter, LLP (2000-2002). |
Joseph B. Hollis (59) |
| Year of Election or Appointment: 2006 Chief Financial Officer of Advisor Value Leaders. Mr. Hollis also serves as Chief Financial Officer of other Fidelity funds. Mr. Hollis is President of Fidelity Pricing and Cash Management Services (FPCMS) (2005-
present). Mr. Hollis also serves as President and Director of Fidelity Service Company, Inc. (2006-present). Previously, Mr. Hollis served as Senior Vice President of Cash Management Services (1999-2002) and Investment Management Operations (2002-2005). |
Kenneth A. Rathgeber (60) |
| Year of Election or Appointment: 2004 Chief Compliance Officer of Advisor Value Leaders. Mr. Rathgeber also serves as Chief Compliance Officer of other Fidelity funds (2004-
present) and Executive Vice President of Risk Oversight for Fidelity Investments (2002-present). He is Chief Compliance Officer of FMR (2005-present), FMR Co., Inc. (2005-present), Fidelity Management & Research (U.K.) Inc. (2005-present), Fidelity Research & Analysis Company (2005-present), Fidelity Investments Money Management, Inc. (2005-present), and Strategic Advisers, Inc. (2005-present). Previously, Mr. Rathgeber served as Executive Vice President and Chief Operating Officer for Fidelity Investments Institutional Services Company, Inc. (1998-2002). |
Bryan A. Mehrmann (46) |
| Year of Election or Appointment: 2005 Deputy Treasurer of Advisor Value Leaders. Mr. Mehrmann also serves as Deputy Treasurer of other Fidelity funds (2005-present) and is an employee of FMR. Previously, Mr. Mehrmann served as Vice President of Fidelity Investments Institutional Services Group (FIIS)/Fidelity Investments Institutional Operations Corporation, Inc. (FIIOC) Client Services (1998-2004). |
Kenneth B. Robins (38) |
| Year of Election or Appointment: 2005 Deputy Treasurer of Advisor Value Leaders. Mr. Robins also serves as Deputy Treasurer of other Fidelity funds (2005-present) and is an employee of FMR (2004-present). Before joining Fidelity Investments, Mr. Robins worked at KPMG LLP, where he was a partner in KPMG's department of professional practice (2002-2004) and a Senior Manager (1999-2000). In addition, Mr. Robins served as Assistant Chief Accountant, United States Securities and Exchange Commission (2000-2002). |
Robert G. Byrnes (40) |
| Year of Election or Appointment: 2005 Assistant Treasurer of Advisor Value Leaders. Mr. Byrnes also serves as Assistant Treasurer of other Fidelity funds (2005-present) and is an employee of FMR (2005-present). Previously, Mr. Byrnes served as Vice President of FPCMS (2003-2005). Before joining Fidelity Investments, Mr. Byrnes worked at Deutsche Asset Management where he served as Vice President of the Investment Operations Group (2000-2003). |
Peter L. Lydecker (53) |
| Year of Election or Appointment: 2004 Assistant Treasurer of Advisor Value Leaders. Mr. Lydecker also serves as Assistant Treasurer of other Fidelity funds (2004) and is an employee of FMR. |
Paul M. Murphy (60) |
| Year of Election or Appointment: 2007 Assistant Treasurer of Advisor Value Leaders. Mr. Murphy also serves as Assistant Treasurer of other Fidelity funds (2007-present) and is an employee of FMR (2007-present). Previously, Mr. Murphy served as Chief Financial Officer of the Fidelity Funds (2005-2006), Vice President and Associate General Counsel of FMR (2007), and Senior Vice President of Fidelity Pricing and Cash Management Services Group (FPCMS) (1994-2007). |
Gary W. Ryan (49) |
| Year of Election or Appointment: 2005 Assistant Treasurer of Advisor Value Leaders. Mr. Ryan also serves as Assistant Treasurer of other Fidelity funds (2005-present) and is an employee of FMR (2005-present). Previously, Mr. Ryan served as Vice President of Fund Reporting in FPCMS (1999-2005). |
** FMR Corp. merged with FMR LLC on October 1, 2007. Any references to FMR LLC for prior periods are deemed to be references to the prior entity.
Annual Report
Distributions
The Board of Trustees of Advisor Value Leaders voted to pay to shareholders of record at the opening of business on record date, the following distributions per share derived from capital gains realized from sales of portfolio securities, and dividends derived from net investment income:
| Pay Date | Record Date | Dividends | Capital Gains |
Class A | 12/10/07 | 12/07/07 | $.117 | $.722 |
Class T | 12/10/07 | 12/07/07 | $.068 | $.722 |
Class B | 12/10/07 | 12/07/07 | | $.698 |
Class C | 12/10/07 | 12/07/07 | | $.712 |
The fund hereby designates as a capital gain dividend with respect to the taxable year ended October 31, 2007 $4,228,830, or, if subsequently determined to be different, the net capital gain of such year.
Class A, Class T, Class B, and Class C designates 100% of the dividends distributed in December 2006 as indicated in the Corporate Qualifying memo distributed by the Tax department, during the fiscal year as qualifying for the dividends-received deduction for corporate shareholders.
Class A, Class T, Class B, and Class C designates 100% of the dividends distributed during the fiscal year as amounts which may be taken into account as a dividend for purposes of the maximum rate under section 1(h)(11) of the Internal Revenue Code.
The fund will notify shareholders in January 2008 of amounts for use in preparing 2007 income tax returns.
Annual Report
Proxy Voting Results
A special meeting of the fund's shareholders was held on May 16, 2007. The results of votes taken among shareholders on the proposal before them are reported below. Each vote reported represents one dollar of net asset value held on the record date for the meeting.
PROPOSAL 5 |
To approve an amended management contract that includes adding a performance adjustment component to the management fee for Fidelity Advisor Value Leaders Fund and giving the Trustees the authority to change the fund's performance adjustment index going forward, without shareholder vote, subject to applicable law. |
| # of
Votes | % of
Votes |
Affirmative | 38,960,236.61 | 76.714 |
Against | 9,114,994.43 | 17.947 |
Abstain | 2,711,252.32 | 5.339 |
TOTAL | 50,786,483.36 | 100.000 |
Annual Report
Board Approval of Investment Advisory Contracts and Management Fees
Advisor Value Leaders Fund
Each year, typically in July, the Board of Trustees, including the Independent Trustees (together, the Board), votes on the renewal of the management contract and sub-advisory agreements (together, the Advisory Contracts) for the fund. The Board, assisted by the advice of fund counsel and Independent Trustees' counsel, requests and considers a broad range of information throughout the year.
The Board meets regularly each month except August and takes into account throughout the year matters bearing on Advisory Contracts. The Board, acting directly and through its separate committees, considers at each of its meetings factors that are relevant to the annual renewal of the fund's Advisory Contracts, including the services and support provided to the fund and its shareholders. At the time of the renewal, the Board had 12 standing committees, each composed of Independent Trustees with varying backgrounds, to which the Board has assigned specific subject matter responsibilities in order to enhance effective decision-making by the Board. Each committee has adopted a written charter outlining the structure and purposes of the committee. One such committee, the Equity Contract Committee, meets periodically as needed throughout the year to consider matters specifically related to the annual renewal of Advisory Contracts. The committee requests and receives information on, and makes recommendations to the Independent Trustees concerning, the approval and annual review of the Advisory Contracts.
At its July 2007 meeting, the Board of Trustees, including the Independent Trustees, unanimously determined to renew the Advisory Contracts for the fund. In reaching its determination, the Board considered all factors it believed relevant, including (i) the nature, extent, and quality of the services to be provided to the fund and its shareholders (including the investment performance of the fund); (ii) the competitiveness of the management fee and total expenses of the fund; (iii) the total costs of the services to be provided by and the profits to be realized by the investment adviser and its affiliates from the relationship with the fund; (iv) the extent to which economies of scale would be realized as the fund grows; and (v) whether fee levels reflect these economies of scale, if any, for the benefit of fund shareholders. The Board also approved amendments to the fund's agreements with foreign sub-advisers to clarify that each sub-adviser provides services as an independent contractor.
In determining whether to renew the Advisory Contracts for the fund, the Board ultimately reached a determination, with the assistance of fund counsel and Independent Trustees' counsel, that the renewal of the Advisory Contracts and the compensation to be received by Fidelity under the management contract is consistent with Fidelity's fiduciary duty under applicable law. In addition to evaluating the specific factors noted above, the Board, in reaching its determination, is aware that shareholders in the fund have a broad range of investment choices available to them, including a wide choice among mutual funds offered by competitors to Fidelity, and that the fund's shareholders, with the opportunity to review and weigh the disclosure provided by the fund in its prospectus and other public disclosures, have chosen to invest in this fund, managed by Fidelity.
Annual Report
Nature, Extent, and Quality of Services Provided. The Board considered staffing within the investment adviser, FMR, and the sub-advisers (together, the Investment Advisers), including the background of the fund's portfolio manager and the fund's investment objective and discipline. The Independent Trustees also had discussions with senior management of Fidelity's investment operations and investment groups. The Board considered the structure of the portfolio manager compensation program and whether this structure provides appropriate incentives.
Resources Dedicated to Investment Management and Support Services. The Board reviewed the size, education, and experience of the Investment Advisers' investment staff, their use of technology, and the Investment Advisers' approach to recruiting, training, and retaining portfolio managers and other research, advisory, and management personnel. The Board considered Fidelity's extensive global research capabilities that enable the Investment Advisers to aggregate data from various sources in an effort to produce positive investment results. The Board noted that Fidelity's analysts have access to a variety of technological tools that enable them to perform both fundamental and quantitative analysis and to specialize in various disciplines. The Board also considered that Fidelity's portfolio managers and analysts have access to daily portfolio attribution that allows for monitoring of a fund's portfolio, as well as an electronic communication system that provides immediate real-time access to research concerning issuers and credit enhancers.
Shareholder and Administrative Services. The Board considered (i) the nature, extent, quality, and cost of advisory administrative, distribution, and shareholder services performed by the Investment Advisers and their affiliates under the Advisory Contracts and under separate agreements covering transfer agency, pricing and bookkeeping, and securities lending services for the fund; (ii) the nature and extent of the Investment Advisers' supervision of third party service providers, principally custodians and subcustodians; and (iii) the resources devoted to, and the record of compliance with, the fund's compliance policies and procedures. The Board reviewed the allocation of fund brokerage, including allocations to brokers affiliated with the Investment Advisers, the use of brokerage commissions to pay fund expenses, and the use of "soft" commission dollars to pay for research services. The Board also considered that Fidelity voluntarily pays for market data out of its own resources. The Board also considered the agreement reached between the Independent Trustees and Fidelity in December 2006 following an independent review of matters relating to receipt of travel, entertainment, gifts and gratuities in violation of Fidelity policies.
Annual Report
Board Approval of Investment Advisory Contracts and
Management Fees - continued
The Board noted that the growth of fund assets across the complex allows Fidelity to reinvest in the development of services designed to enhance the value or convenience of the Fidelity funds as investment vehicles. These services include 24-hour access to account information and market information through phone representatives and over the Internet, and investor education materials and asset allocation tools.
Investment in a Large Fund Family. The Board considered the benefits to shareholders of investing in a Fidelity fund, including the benefits of investing in a fund that is part of a large family of funds offering a variety of investment disciplines and providing for a large variety of mutual fund investor services. For example, fund shareholders are offered the privilege of exchanging shares of the fund for shares of other Fidelity funds, as set forth in the fund's prospectus, without paying a sales charge. The Board noted that, since the last Advisory Contract renewals in July 2006, Fidelity has taken a number of actions that benefited particular funds, including (i) dedicating additional resources to investment research and to restructure the investment research teams; (ii) contractually agreeing to reduce the management fee on Fidelity Advisor Floating Rate High Income Fund; (iii) contractually agreeing to reduce the management fees on Fidelity's California, Massachusetts, New Jersey, and New York AMT Tax-Free Money Market Funds, launching new Institutional Classes and Service Classes of these funds, and contractually agreeing to impose expense limitations on these funds; (iv) eliminating the exchange fee on the Fidelity Select Portfolios and reducing the pricing and bookkeeping fee rates for these funds; (v) reducing the maximum transfer agency fee rates on high income funds and certain equity funds; (vi) proposing amended management contracts that, if approved by shareholders, will add a performance adjustment component to the management fees paid by 18 Fidelity Advisor equity funds; (vii) contractually agreeing to reduce fees for Ultra-Short Central Fund and the money market Central Funds; (viii) waiving the Fidelity Advisor funds' contingent deferred sales charge on certain redemptions made through systematic withdrawal programs; and (ix) amending the management contracts for equity and fixed-income funds whose management contracts incorporate a "group fee" structure by adding four new fee "breakpoints" to the group fee rate schedules.
Investment Performance and Compliance. The Board considered whether the fund has operated within its investment objective, as well as its record of compliance with its investment restrictions. It also reviewed the fund's absolute investment performance for each class, as well as the fund's relative investment performance for each class measured against (i) a broad-based securities market index, and (ii) a peer group of mutual funds deemed appropriate by the Board over multiple periods. Because the fund had been in existence less than five calendar years, the following charts considered by the Board show, over the one- and three-year periods ended December 31, 2006, the cumulative total returns of Institutional Class (Class I) and Class B of the fund, the cumulative total returns of a broad-based securities market index ("benchmark"), and a range of cumulative total returns of a peer group of mutual funds identified by Morningstar, Inc. as having an investment style similar to that of the fund based on underlying portfolio holdings. The returns of Institutional Class (Class I) and Class B show the performance of the highest and lowest performing classes, respectively (based on three-year performance). The box within each chart shows the 25th percentile return (bottom of box) and the 75th percentile return (top of box) of the peer group. Returns shown above the box are in the first quartile and returns shown below the box are in the fourth quartile. The percentage beaten numbers noted below each chart correspond to the percentile box and represent the percentage of funds in the peer group whose performance was equal to or lower than that of the class indicated.
Annual Report
Advisor Value Leaders Fund
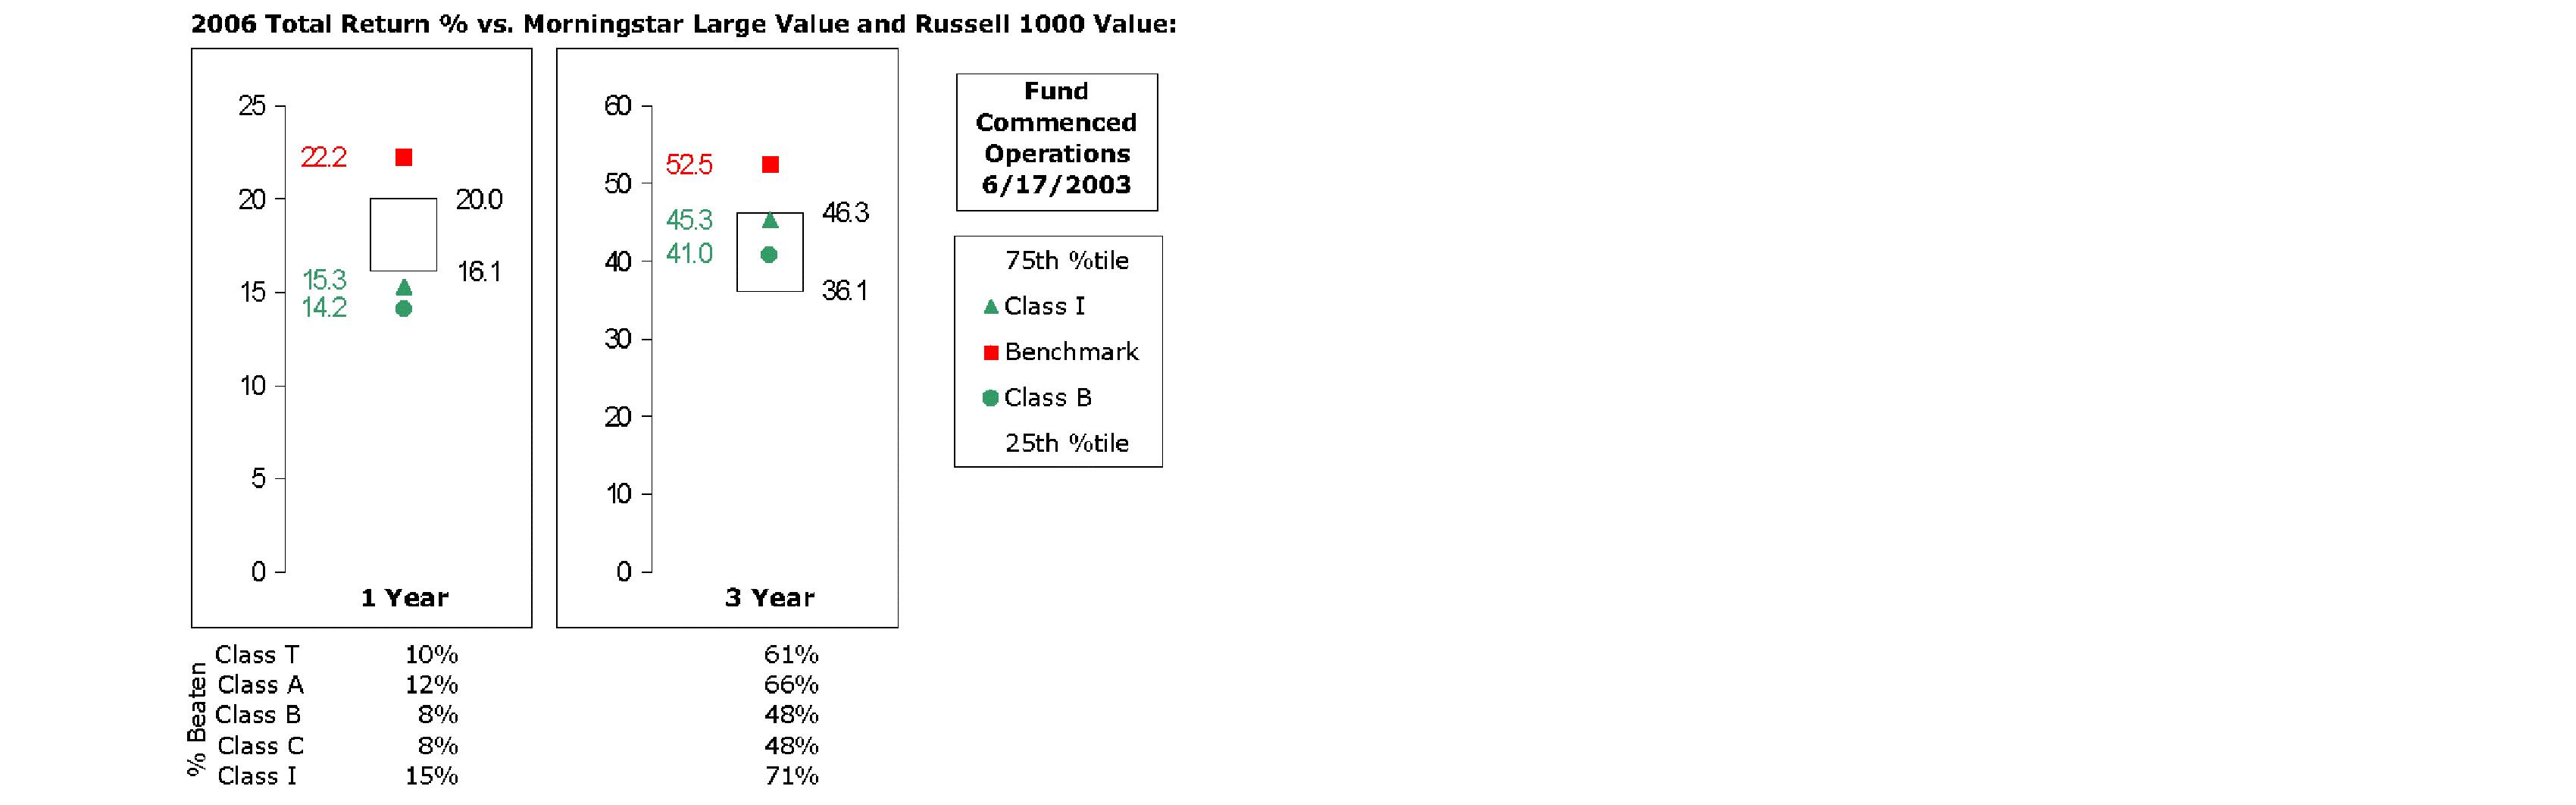
The Board reviewed the fund's relative investment performance against its peer group and stated that the performance of Institutional Class (Class I) of the fund was in the fourth quartile for the one-year period and the second quartile for the three-year period. The Board also stated that the investment performance of the fund was lower than its benchmark for all the periods shown. The Board considered that the variations in performance among the fund's classes reflect the variations in class expenses, which result in lower performance for higher expense classes.
The Board considered that FMR has taken steps to refocus and strengthen equity research, equity portfolio management, and compliance.
Based on its review, and giving particular weight to the nature and quality of the resources dedicated by the Investment Advisers to maintain and improve relative performance, the Board concluded that the nature, extent, and quality of the services provided to the fund will benefit the fund's shareholders, particularly in light of the Board's view that the fund's shareholders benefit from investing in a fund that is part of a large family of funds offering a variety of investment disciplines and services.
Annual Report
Board Approval of Investment Advisory Contracts and
Management Fees - continued
Competitiveness of Management Fee and Total Fund Expenses. The Board considered the fund's management fee and total expenses compared to "mapped groups" of competitive funds and classes. Fidelity creates "mapped groups" by combining similar Lipper investment objective categories that have comparable management fee characteristics. Combining Lipper investment objective categories aids the Board's management fee and total expense comparisons by broadening the competitive group used for comparison and by reducing the number of universes to which various Fidelity funds are compared. The Board also considered supplemental information about how the fund's management fee and total expenses ranked relative to groups based on Lipper classifications, which take into account a fund's market capitalization and style.
The Board considered two proprietary management fee comparisons for the 12-month (or shorter) periods shown in the chart below. The group of Lipper funds used by the Board for management fee comparisons is referred to below as the "Total Mapped Group." The Total Mapped Group comparison focuses on a fund's standing relative to the total universe of comparable funds available to investors, in terms of gross management fees before expense reimbursements or caps. "TMG %" represents the percentage of funds in the Total Mapped Group that had management fees that were lower than the fund's. For example, a TMG % of 9% means that 91% of the funds in the Total Mapped Group had higher management fees than the fund. The "Asset-Size Peer Group" (ASPG) comparison focuses on a fund's standing relative to non-Fidelity funds similar in size to the fund within the Total Mapped Group. The ASPG represents at least 15% of the funds in the Total Mapped Group with comparable asset size and management fee characteristics, subject to a minimum of 50 funds (or all funds in the Total Mapped Group if fewer than 50). Additional information, such as the ASPG quartile in which the fund's management fee ranked, is also included in the chart and considered by the Board.
Annual Report
Advisor Value Leaders Fund

The Board noted that the fund's management fee ranked below the median of its Total Mapped Group and below the median of its ASPG for 2006.
Furthermore, the Board considered that, on May 16, 2007, after the periods shown in the chart above, shareholders approved an amended management contract for the fund that will add a performance adjustment component to the management fee paid by the fund (that is, the fund's management fee will be subject to upward or downward adjustment depending upon whether, and to what extent, the fund's investment performance for the performance period exceeds, or is exceeded by, the record (over the same period) of a Board-approved performance adjustment index). The performance period for the fund commenced on June 1, 2007. Starting with the twelfth month, the performance adjustment takes effect.
Based on its review, the Board concluded that the fund's management fee was fair and reasonable in light of the services that the fund receives and the other factors considered.
In its review of each class's total expenses, the Board considered the fund's management fee as well as other fund or class expenses, as applicable, such as transfer agent fees, pricing and bookkeeping fees, fund-paid 12b-1 fees, and custodial, legal, and audit fees. The Board also noted the effects of any waivers and reimbursements on fees and expenses. As part of its review, the Board also considered current and historical total expenses of each class of the fund compared to competitive fund median expenses. Each class of the fund is compared to those funds and classes in the Total Mapped Group (used by the Board for management fee comparisons) that have a similar sales load structure.
Annual Report
Board Approval of Investment Advisory Contracts and
Management Fees - continued
The Board noted that the total expenses of each of Class A, Class B, Class C, and Institutional Class ranked below its competitive median for 2006, and the total expenses of Class T ranked above its competitive median for 2006. The Board noted that the fund offers multiple classes, each of which has a different sales load and 12b-1 fee structure, and that the multiple structures are intended to offer a range of pricing options for the intermediary market. The Board also noted that the total expenses of the classes vary primarily by the level of their 12b-1 fees, although differences in transfer agent fees may also cause expenses to vary from class to class.
In its review of total expenses, the Board also considered Fidelity fee structures and other information on clients that FMR and its affiliates service in other competitive markets, such as other mutual funds advised or subadvised by FMR or its affiliates, pension plan clients, and other institutional clients.
Based on its review, the Board concluded that the total expenses of each class of the fund were reasonable, although in one case above the median of the universe presented for comparison, in light of the services that the fund and its shareholders receive and the other factors considered.
Costs of the Services and Profitability. The Board considered the revenues earned and the expenses incurred by Fidelity in conducting the business of developing, marketing, distributing, managing, administering and servicing the fund and its shareholders. The Board also considered the level of Fidelity's profits in respect of all the Fidelity funds.
On an annual basis, FMR presents to the Board Fidelity's profitability for the fund. Fidelity calculates the profitability for each fund, as well as aggregate profitability for groups of Fidelity funds and all Fidelity funds, using a series of detailed revenue and cost allocation methodologies which originate with the audited books and records of Fidelity. The Audit Committee of the Board reviews any significant changes from the prior year's methodologies.
PricewaterhouseCoopers LLP (PwC), independent registered public accounting firm and auditor to Fidelity and certain Fidelity funds, has been engaged annually by the Board as part of the Board's assessment of the results of Fidelity's profitability analysis. PwC's engagement includes the review and assessment of Fidelity's methodologies used in determining the revenues and expenses attributable to Fidelity's mutual fund business, and completion of agreed-upon procedures surrounding the mathematical accuracy of fund profitability and its conformity to allocation methodologies. After considering PwC's reports issued under the engagement and information provided by Fidelity, the Board believes that while other allocation methods may also be reasonable, Fidelity's profitability methodologies are reasonable in all material respects.
Annual Report
The Board has also reviewed Fidelity's non-fund businesses and any fall-out benefits related to the mutual fund business as well as cases where Fidelity's affiliates may benefit from or be related to the fund's business.
The Board considered the costs of the services provided by and the profits realized by Fidelity in connection with the operation of the fund and determined that the amount of profit is a fair entrepreneurial profit for the management of the fund.
Economies of Scale. The Board considered whether there have been economies of scale in respect of the management of the Fidelity funds, whether the Fidelity funds (including the fund) have appropriately benefited from any such economies of scale, and whether there is potential for realization of any further economies of scale. The Board considered the extent to which the fund will benefit from economies of scale through increased services to the fund, through waivers or reimbursements, or through fee or expense reductions, including reductions that occur through operation of the transfer agent agreement. The transfer agent fee varies in part based on the number of accounts in the fund. If the number of accounts decreases or the average account size increases, the overall transfer agent fee rate decreases.
The Board recognized that the fund's management contract incorporates a "group fee" structure, which provides for lower group fee rates as total fund assets under FMR's management increase, and for higher group fee rates as total fund assets under FMR's management decrease. FMR determines the group fee rates based on a tiered asset "breakpoint" schedule. In connection with the renewal of the fund's management contract, the Board approved amendments to the fund's management contract that added four new fee breakpoints to the group fee rate schedule for assets under FMR's management above $1,386 billion. The Board considered that the group fee rate declines under both the present and amended schedules, but that under the amended schedule, the group fee rate declines faster as assets under FMR's management exceed $1,386 billion. The Board considered that the group fee is designed to deliver the benefits of economies of scale to fund shareholders when total fund assets increase, even if assets of any particular fund are unchanged or have declined, because some portion of Fidelity's costs are attributable to services provided to all Fidelity funds, and all funds benefit if those costs can be allocated among more assets. The Board concluded that, given the group fee structure, fund shareholders will achieve a certain level of economies of scale as assets under FMR's management increase at the fund complex level, regardless of whether Fidelity achieves any such economies of scale.
The Board further concluded that any potential economies of scale are being shared between fund shareholders and Fidelity in an appropriate manner.
Additional Information Requested by the Board. In order to develop fully the factual basis for consideration of the Fidelity funds' Advisory Contracts, the Board requested and received additional information on several topics, including (i) fund performance trends and actions to be taken by FMR to improve certain funds' overall performance; (ii) Fidelity's portfolio manager compensation structure, including its effects on fund profitability and the extent to which portfolio manager compensation is linked to fund performance; (iii) Fidelity's fee structures; (iv) the funds' sub-advisory arrangements; and (v) accounts managed by Fidelity other than the Fidelity funds.
Annual Report
Board Approval of Investment Advisory Contracts and
Management Fees - continued
Based on its evaluation of all of the conclusions noted above, and after considering all material factors, the Board ultimately concluded that the advisory fee structures are fair and reasonable, and that the fund's Advisory Contracts should be renewed.
Annual Report
Annual Report
Annual Report
Annual Report
Annual Report
Annual Report
Investment Adviser
Fidelity Management & Research Company
Boston, MA
Investment Sub-Advisers
FMR Co., Inc.
Fidelity Management & Research
(U.K.) Inc.
Fidelity Research & Analysis Company
Fidelity International
Investment Advisors
Fidelity Investments Japan Limited
Fidelity International Investment Advisors (U.K.) Limited
General Distributor
Fidelity Distributors Corporation
Boston, MA
Transfer and Service Agents
Fidelity Investments Institutional Operations Company, Inc.
Boston, MA
Fidelity Service Company, Inc.
Boston, MA
Custodian
Brown Brothers Harriman & Company
Boston, MA
AVLF-UANN-1207
1.793576.104
(Fidelity Investment logo)(registered trademark)
(Fidelity Investment logo)(registered trademark)
Fidelity® Advisor
Value Leaders
Fund - Institutional Class
Annual Report
October 31, 2007
(2_fidelity_logos) (Registered_Trademark)
Contents
Chairman's Message | <Click Here> | Ned Johnson's message to shareholders. |
Note to Shareholders | <Click Here> | An explanation of the changes to the fund. |
Performance | <Click Here> | How the fund has done over time. |
Management's Discussion | <Click Here> | The manager's review of fund performance, strategy and outlook |
Shareholder Expense Example | <Click Here> | An example of shareholder expenses. |
Investment Changes | <Click Here> | A summary of major shifts in the fund's investments over the past six months. |
Investments | <Click Here> | A complete list of the fund's investments with their market values. |
Financial Statements | <Click Here> | Statements of assets and liabilities, operations, and changes in net assets, as well as financial highlights. |
Notes | <Click Here> | Notes to the financial statements. |
Report of Independent Registered Public Accounting Firm | <Click Here> | |
Trustees and Officers | <Click Here> | |
Distributions | <Click Here> | |
Proxy Voting Results | <Click Here> | |
Board Approval of Investment Advisory Contracts and Management Fees | <Click Here> | |
To view a fund's proxy voting guidelines and proxy voting record for the 12-month period ended June 30, visit http://www.fidelity.com (search for "proxy voting guidelines") or visit the Securities and Exchange Commission's (SEC) web site at http://www.sec.gov. You may also call 1-877-208-0098 to request a free copy of the proxy voting guidelines.
Standard & Poor's, S&P and S&P 500 are registered service marks of The McGraw-Hill Companies, Inc. and have been licensed for use by Fidelity Distributors Corporation.
Other third party marks appearing herein are the property of their respective owners.
All other marks appearing herein are registered or unregistered trademarks or service marks of FMR LLC or an affiliated company.
Annual Report
This report and the financial statements contained herein are submitted for the general information of the shareholders of the fund. This report is not authorized for distribution to prospective investors in the fund unless preceded or accompanied by an effective prospectus.
A fund files its complete schedule of portfolio holdings with the SEC for the first and third quarters of each fiscal year on Form N-Q. Forms N-Q are available on the SEC's web site at http://www.sec.gov. A fund's Forms N-Q may be reviewed and copied at the SEC's Public Reference Room in Washington, DC. Information regarding the operation of the SEC's Public Reference Room may be obtained by calling 1-800-SEC-0330. For a complete list of a fund's portfolio holdings, view the most recent holdings listing, semiannual report, or annual report on Fidelity's web site at http://www.fidelity.com or http://www.advisor.fidelity.com, as applicable.
NOT FDIC INSURED · MAY LOSE VALUE · NO BANK GUARANTEE
Neither the fund nor Fidelity Distributors Corporation is a bank.
Annual Report
Chairman's Message
(photo_of_Edward_C_Johnson_3d)
Dear Shareholder:
Many stock and bond markets around the world have been unsettled of late; however, volatility can often lead to opportunity for patient investors. Financial markets are always unpredictable, but there are a number of time-tested principles that can put the historical odds in your favor.
One of the basic tenets is to invest for the long term. Over time, riding out the markets' inevitable ups and downs has proven much more effective than selling into panic or chasing the hottest trend. Even missing only a few of the markets' best days can significantly diminish investor returns. Patience also affords the benefits of compounding - of earning interest on additional income or reinvested dividends and capital gains. There are tax advantages and cost benefits to consider as well. The more you sell, the more taxes you pay, and the more you trade, the higher the costs. While staying the course doesn't eliminate risk, it can considerably lessen the effect of short-term declines.
You can further manage your investing risk through diversification. And today, more than ever, geographic diversification should be taken into account. Studies indicate that asset allocation is the single most important determinant of a portfolio's long-term success. The right mix of stocks, bonds and cash - aligned to your particular risk tolerance and investment objective - is very important. Age-appropriate rebalancing is also an essential aspect of asset allocation. For younger investors, an emphasis on equities - which historically have been the best-performing asset class over time - is encouraged. As investors near their specific goal, such as retirement or sending a child to college, consideration may be given to replacing volatile assets (e.g. common stocks) with more-stable fixed investments (bonds or savings plans).
A third investment principle - investing regularly - can help lower the average cost of your purchases. Investing a certain amount of money each month or quarter helps ensure you won't pay for all your shares at market highs. This strategy - known as dollar cost averaging - also reduces unconstructive "emotion" from investing, helping shareholders avoid selling weak performers just prior to an upswing, or chasing a hot performer just before a correction.
We invite you to contact us via the Internet, through our Investor Centers or over the phone. It is our privilege to provide you the information you need to make the investments that are right for you.
Sincerely,
/s/Edward C. Johnson 3d
Edward C. Johnson 3d
Annual Report
Note to Shareholders:
On May 16, 2007, shareholders of Fidelity® Advisor Value Leaders Fund approved a new management contract for the fund, effective June 1, 2007, which adds a performance adjustment component to the management fee based on the fund's performance versus the Russell 1000® Value Index. The new contract also allows the Board of Trustees to designate an alternate performance adjustment index in the future, without a shareholder vote, when permitted by applicable law.
Annual Report
Performance: The Bottom Line
Average annual total return reflects the change in the value of an investment, assuming reinvestment of the class' dividend income and capital gains (the profits earned upon the sale of securities that have grown in value) and assuming a constant rate of performance each year. The $10,000 table and the fund's returns do not reflect the deduction of taxes that a shareholder would pay on fund distributions or the redemption of fund shares. During periods of reimbursement by Fidelity, a fund's total return will be greater than it would be had the reimbursement not occurred. How a fund did yesterday is no guarantee of how it will do tomorrow.
Average Annual Total Returns
Periods ended October 31, 2007 | Past 1
year | Life of
fund A |
Institutional Class | 14.89% | 14.40% |
A From June 17, 2003.
$10,000 Over Life of Fund
Let's say hypothetically that $10,000 was invested in Fidelity® Advisor Value Leaders Fund - Institutional Class on June 17, 2003, when the fund started. The chart shows how the value of your investment would have changed, and also shows how the Russell 1000® Value Index performed over the same period.
Annual Report
Management's Discussion of Fund Performance
Comments from Charles Hebard, Portfolio Manager of Fidelity® Advisor Value Leaders Fund
Despite a slowing housing market, the subprime mortgage loan crisis, a credit crunch and sharply higher energy prices, U.S. stock markets performed very well during the 12-month period ending October 31, 2007. Upbeat corporate earnings and persistently solid economic data drove much of the positive momentum for equities. There were only three notably bad months during the period: February, when equities fell on the first whispers of the subprime woes and a brief slump in Asian stocks; and June and July, as crude oil prices spiked, the dollar fell to new lows and subprime mortgage concerns accelerated. The Federal Reserve Board helped spark a late-period rally, first in August by lowering its discount rate to inject liquidity into the financial system, then with reductions in the federal funds target rate in September and October. For the 12 months overall, the Dow Jones Industrial AverageSM rose 17.94%, the Standard & Poor's 500SM Index returned 14.56% and the NASDAQ Composite® Index shot up 21.75%.
For the 12-month period ending October 31, 2007, the fund's Institutional Class shares returned 14.89%, solidly outperforming the 10.83% rise in the Russell 1000® Value Index. Energy and financials were, respectively, the strongest- and weakest-performing areas of the benchmark during the period, and my positioning in both sectors aided relative results. In the energy area, performance benefited from an emphasis on oilfield services companies and exploration and production (E&P) companies leveraged to North American natural gas. Oilfield services firms National Oilwell Varco and Smith International continued to beat Wall Street analysts' earnings expectations, as they had for several quarters. Their stocks benefited from increasing confidence among investors that oil prices would remain high. Honeywell International's stock rose after the firm beat earnings expectations. I invested in Procter & Gamble when its share price pulled back in the spring of 2007, and the stock subsequently performed well. E&P firms EOG Resources and Ultra Petroleum rallied on rising natural gas prices. Ultra Petroleum and Smith International were not index components. On the negative side, underweighting Exxon Mobil and avoiding Chevron detracted from results as these two major oil producers and index components rose sharply. Elsewhere, I underestimated the severity of the housing crisis, and the fund was hurt by investments in homebuilders Standard Pacific and KB Home.
The views expressed above reflect those of the portfolio manager(s) only through the end of the period as stated on the cover of this report and do not necessarily represent the views of Fidelity or any other person in the Fidelity organization. Any such views are subject to change at any time based upon market or other conditions and Fidelity disclaims any responsibility to update such views. These views may not be relied on as investment advice and, because investment decisions for a Fidelity fund are based on numerous factors, may not be relied on as an indication of trading intent on behalf of any Fidelity fund.
Annual Report
Shareholder Expense Example
As a shareholder of the Fund, you incur two types of costs: (1) transaction costs, including sales charges (loads) on purchase payments or redemption proceeds, and (2) ongoing costs, including management fees, distribution and/or service (12b-1) fees and other Fund expenses. This Example is intended to help you understand your ongoing costs (in dollars) of investing in the Fund and to compare these costs with the ongoing costs of investing in other mutual funds.
The Example is based on an investment of $1,000 invested at the beginning of the period and held for the entire period (May 1, 2007 to October 31, 2007).
Actual Expenses
The first line of the accompanying table for each class of the Fund provides information about actual account values and actual expenses. You may use the information in this line, together with the amount you invested, to estimate the expenses that you paid over the period. Simply divide your account value by $1,000.00 (for example, an $8,600 account value divided by $1,000.00 = 8.6), then multiply the result by the number in the first line for a class of the Fund under the heading entitled "Expenses Paid During Period" to estimate the expenses you paid on your account during this period. In addition, the Fund, as a shareholder in the underlying Fidelity Central Funds, will indirectly bear its pro rata share of the fees and expenses incurred by the underlying Fidelity Central Funds. These fees and expenses are not included in the Fund's annualized expense ratio used to calculate the expense estimate in the table below.
Hypothetical Example for Comparison Purposes
The second line of the accompanying table for each class of the Fund provides information about hypothetical account values and hypothetical expenses based on a Class' actual expense ratio and an assumed rate of return of 5% per year before expenses, which is not the Class' actual return. The hypothetical account values and expenses may not be used to estimate the actual ending account balance or expenses you paid for the period. You may use this information to compare the ongoing costs of investing in the Fund and other funds. To do so, compare this 5% hypothetical example with the 5% hypothetical examples that appear in the shareholder reports of the other funds. In addition, the Fund, as a shareholder in the underlying Fidelity Central Funds, will indirectly bear its pro rata share of the fees and expenses incurred by the underlying Fidelity Central Funds. These fees and expenses are not included in the Fund's annualized expense ratio used to calculate the expense estimate in the table below.
Please note that the expenses shown in the table are meant to highlight your ongoing costs only and do not reflect any transaction costs. Therefore, the second line of the table is useful in comparing ongoing costs only, and will not help you determine the relative total costs of owning different funds. In addition, if these transactional costs were included, your costs would have been higher.
Annual Report
| Beginning
Account Value
May 1, 2007 | Ending
Account Value
October 31, 2007 | Expenses Paid
During Period*
May 1, 2007
to October 31, 2007 |
Class A | | | |
Actual | $ 1,000.00 | $ 1,033.40 | $ 6.41 |
HypotheticalA | $ 1,000.00 | $ 1,018.90 | $ 6.36 |
Class T | | | |
Actual | $ 1,000.00 | $ 1,032.30 | $ 7.68 |
HypotheticalA | $ 1,000.00 | $ 1,017.64 | $ 7.63 |
Class B | | | |
Actual | $ 1,000.00 | $ 1,029.50 | $ 10.23 |
HypotheticalA | $ 1,000.00 | $ 1,015.12 | $ 10.16 |
Class C | | | |
Actual | $ 1,000.00 | $ 1,029.50 | $ 10.23 |
HypotheticalA | $ 1,000.00 | $ 1,015.12 | $ 10.16 |
Institutional Class | | | |
Actual | $ 1,000.00 | $ 1,035.10 | $ 5.13 |
HypotheticalA | $ 1,000.00 | $ 1,020.16 | $ 5.09 |
A 5% return per year before expenses
* Expenses are equal to each Class' annualized expense ratio (shown in the table below); multiplied by the average account value over the period, multiplied by 184/365 (to reflect the one-half year period).
| Annualized
Expense Ratio |
Class A | 1.25% |
Class T | 1.50% |
Class B | 2.00% |
Class C | 2.00% |
Institutional Class | 1.00% |
Annual Report
Investment Changes
Top Ten Stocks as of October 31, 2007 |
| % of fund's
net assets | % of fund's net assets
6 months ago |
AT&T, Inc. | 5.0 | 4.5 |
Bank of America Corp. | 4.3 | 4.3 |
ConocoPhillips | 4.3 | 1.9 |
Citigroup, Inc. | 4.0 | 3.9 |
American International Group, Inc. | 3.5 | 3.5 |
General Electric Co. | 3.3 | 2.9 |
Exxon Mobil Corp. | 2.6 | 1.9 |
JPMorgan Chase & Co. | 2.6 | 2.6 |
Procter & Gamble Co. | 2.3 | 0.0 |
Merck & Co., Inc. | 1.5 | 1.8 |
| 33.4 | |
Top Five Market Sectors as of October 31, 2007 |
| % of fund's
net assets | % of fund's net assets
6 months ago |
Financials | 29.8 | 32.8 |
Energy | 15.9 | 15.6 |
Industrials | 10.5 | 9.8 |
Telecommunication Services | 6.9 | 6.1 |
Consumer Discretionary | 6.8 | 8.8 |
Asset Allocation (% of fund's net assets) |
As of October 31, 2007 * | As of April 30, 2007 ** |
| Stocks 98.3% | | | Stocks 99.5% | |
| Short-Term
Investments and
Net Other Assets 1.7% | | | Short-Term
Investments and
Net Other Assets 0.5% | |
* Foreign investments | 13.4% | | ** Foreign investments | 15.5% | |

Annual Report
Investments October 31, 2007
Showing Percentage of Net Assets
Common Stocks - 98.3% |
| Shares | | Value |
CONSUMER DISCRETIONARY - 6.8% |
Automobiles - 0.5% |
General Motors Corp. | 8,800 | | $ 344,872 |
Renault SA | 2,400 | | 402,998 |
| | 747,870 |
Hotels, Restaurants & Leisure - 0.4% |
McDonald's Corp. | 9,400 | | 561,180 |
Household Durables - 1.4% |
Bassett Furniture Industries, Inc. | 7,339 | | 77,867 |
Beazer Homes USA, Inc. | 11,000 | | 123,530 |
KB Home | 46,500 | | 1,285,260 |
Standard Pacific Corp. (d) | 41,100 | | 197,280 |
Whirlpool Corp. | 2,900 | | 229,622 |
| | 1,913,559 |
Leisure Equipment & Products - 0.7% |
Brunswick Corp. | 9,600 | | 214,176 |
Eastman Kodak Co. | 13,600 | | 389,776 |
Mattel, Inc. | 15,300 | | 319,617 |
| | 923,569 |
Media - 1.5% |
News Corp. Class A | 24,500 | | 530,915 |
Regal Entertainment Group Class A | 16,800 | | 379,176 |
Time Warner, Inc. | 66,500 | | 1,214,290 |
| | 2,124,381 |
Multiline Retail - 0.5% |
Retail Ventures, Inc. (a) | 11,800 | | 102,306 |
Sears Holdings Corp. (a) | 4,500 | | 606,555 |
Tuesday Morning Corp. | 5,600 | | 42,672 |
| | 751,533 |
Specialty Retail - 1.6% |
Advance Auto Parts, Inc. | 9,000 | | 307,080 |
Home Depot, Inc. | 9,550 | | 300,921 |
PetSmart, Inc. | 11,300 | | 338,435 |
Ross Stores, Inc. | 17,400 | | 470,148 |
Staples, Inc. | 20,600 | | 480,804 |
Williams-Sonoma, Inc. | 11,400 | | 358,416 |
| | 2,255,804 |
Common Stocks - continued |
| Shares | | Value |
CONSUMER DISCRETIONARY - continued |
Textiles, Apparel & Luxury Goods - 0.2% |
Liz Claiborne, Inc. | 10,400 | | $ 296,088 |
TOTAL CONSUMER DISCRETIONARY | | 9,573,984 |
CONSUMER STAPLES - 6.4% |
Food & Staples Retailing - 0.7% |
Rite Aid Corp. (a) | 71,900 | | 281,129 |
SUPERVALU, Inc. | 9,600 | | 372,000 |
Winn-Dixie Stores, Inc. (a) | 18,000 | | 425,520 |
| | 1,078,649 |
Food Products - 1.7% |
Cermaq ASA | 17,500 | | 268,215 |
Chiquita Brands International, Inc. (a) | 16,300 | | 305,625 |
Marine Harvest ASA (a) | 387,000 | | 392,300 |
Nestle SA (Reg.) | 3,073 | | 1,419,726 |
| | 2,385,866 |
Household Products - 2.4% |
Central Garden & Pet Co. Class A (non-vtg.) (a) | 26,200 | | 217,984 |
Procter & Gamble Co. | 46,200 | | 3,211,824 |
| | 3,429,808 |
Tobacco - 1.6% |
Altria Group, Inc. | 15,300 | | 1,115,829 |
British American Tobacco PLC sponsored ADR | 14,400 | | 1,104,192 |
| | 2,220,021 |
TOTAL CONSUMER STAPLES | | 9,114,344 |
ENERGY - 15.9% |
Energy Equipment & Services - 2.2% |
Expro International Group PLC | 13,500 | | 343,262 |
Exterran Holdings, Inc. (a) | 3,082 | | 259,504 |
National Oilwell Varco, Inc. (a) | 16,164 | | 1,183,851 |
Smith International, Inc. | 8,700 | | 574,635 |
Transocean, Inc. (a) | 6,800 | | 811,716 |
| | 3,172,968 |
Oil, Gas & Consumable Fuels - 13.7% |
Chesapeake Energy Corp. | 11,000 | | 434,280 |
ConocoPhillips (d) | 71,000 | | 6,032,160 |
CONSOL Energy, Inc. | 13,300 | | 751,450 |
Common Stocks - continued |
| Shares | | Value |
ENERGY - continued |
Oil, Gas & Consumable Fuels - continued |
EnCana Corp. | 5,300 | | $ 371,034 |
EOG Resources, Inc. | 18,200 | | 1,612,520 |
EXCO Resources, Inc. (a) | 15,600 | | 263,328 |
Exxon Mobil Corp. | 40,470 | | 3,722,835 |
Occidental Petroleum Corp. | 26,000 | | 1,795,300 |
Quicksilver Resources, Inc. (a) | 10,050 | | 572,850 |
Suncor Energy, Inc. | 5,700 | | 624,513 |
Ultra Petroleum Corp. (a) | 18,400 | | 1,303,824 |
Uranium One, Inc. (a) | 16,100 | | 178,870 |
Valero Energy Corp. | 24,000 | | 1,690,320 |
| | 19,353,284 |
TOTAL ENERGY | | 22,526,252 |
FINANCIALS - 29.8% |
Capital Markets - 4.4% |
Ares Capital Corp. | 16,100 | | 267,904 |
Bear Stearns Companies, Inc. | 6,400 | | 727,040 |
Charles Schwab Corp. | 13,200 | | 306,768 |
Franklin Resources, Inc. | 3,300 | | 427,944 |
Goldman Sachs Group, Inc. | 2,900 | | 718,968 |
Julius Baer Holding AG (Bearer) | 5,093 | | 440,575 |
KKR Private Equity Investors, LP | 21,583 | | 427,343 |
KKR Private Equity Investors, LP Restricted Depositary Units (e) | 1,300 | | 25,740 |
Legg Mason, Inc. | 4,600 | | 381,524 |
Lehman Brothers Holdings, Inc. | 20,900 | | 1,323,806 |
State Street Corp. | 15,246 | | 1,216,173 |
| | 6,263,785 |
Commercial Banks - 2.5% |
Associated Banc-Corp. | 9,505 | | 274,314 |
DnB Nor ASA | 23,000 | | 379,297 |
HSBC Holdings PLC sponsored ADR | 6,300 | | 626,976 |
Mizuho Financial Group, Inc. | 32 | | 179,893 |
Siam City Bank PCL NVDR | 427,100 | | 222,554 |
Sterling Financial Corp., Washington | 10,200 | | 229,500 |
Unicredito Italiano SpA | 40,700 | | 347,900 |
Wachovia Corp. | 29,854 | | 1,365,223 |
| | 3,625,657 |
Consumer Finance - 0.2% |
Discover Financial Services | 12,675 | | 244,628 |
Common Stocks - continued |
| Shares | | Value |
FINANCIALS - continued |
Diversified Financial Services - 10.9% |
Bank of America Corp. | 127,692 | | $ 6,164,970 |
Citigroup, Inc. | 133,800 | | 5,606,220 |
JPMorgan Chase & Co. | 78,440 | | 3,686,680 |
| | 15,457,870 |
Insurance - 8.0% |
ACE Ltd. | 18,100 | | 1,097,041 |
Admiral Group PLC | 10,600 | | 227,211 |
AMBAC Financial Group, Inc. | 13,400 | | 493,522 |
American International Group, Inc. | 77,790 | | 4,910,105 |
Argo Group International Holdings, Ltd. (a) | 7,991 | | 340,497 |
Assurant, Inc. | 7,300 | | 426,612 |
Hartford Financial Services Group, Inc. | 9,850 | | 955,746 |
IPC Holdings Ltd. | 25,300 | | 756,723 |
Max Capital Group Ltd. | 16,500 | | 466,785 |
Montpelier Re Holdings Ltd. | 22,300 | | 399,170 |
Platinum Underwriters Holdings Ltd. | 19,000 | | 684,000 |
Principal Financial Group, Inc. | 8,500 | | 575,195 |
| | 11,332,607 |
Real Estate Investment Trusts - 1.1% |
Alexandria Real Estate Equities, Inc. | 4,300 | | 443,502 |
Annaly Capital Management, Inc. | 29,900 | | 510,991 |
General Growth Properties, Inc. | 5,450 | | 296,262 |
Home Properties, Inc. | 5,900 | | 303,378 |
| | 1,554,133 |
Real Estate Management & Development - 0.2% |
CB Richard Ellis Group, Inc. Class A (a) | 10,200 | | 248,676 |
Thrifts & Mortgage Finance - 2.5% |
BankUnited Financial Corp. Class A (d) | 22,900 | | 197,627 |
Countrywide Financial Corp. | 29,600 | | 459,392 |
Fannie Mae | 32,560 | | 1,857,222 |
FirstFed Financial Corp. (a)(d) | 6,300 | | 269,514 |
New York Community Bancorp, Inc. | 20,900 | | 388,949 |
Washington Federal, Inc. | 16,064 | | 388,106 |
| | 3,560,810 |
TOTAL FINANCIALS | | 42,288,166 |
Common Stocks - continued |
| Shares | | Value |
HEALTH CARE - 6.4% |
Biotechnology - 1.7% |
Amgen, Inc. (a) | 27,700 | | $ 1,609,647 |
Biogen Idec, Inc. (a) | 4,400 | | 327,536 |
Cephalon, Inc. (a) | 3,900 | | 287,586 |
PDL BioPharma, Inc. (a) | 8,400 | | 178,080 |
| | 2,402,849 |
Health Care Equipment & Supplies - 1.6% |
Becton, Dickinson & Co. | 6,500 | | 542,490 |
C.R. Bard, Inc. | 5,300 | | 443,133 |
Covidien Ltd. | 11,075 | | 460,720 |
Medtronic, Inc. | 16,200 | | 768,528 |
| | 2,214,871 |
Health Care Providers & Services - 0.2% |
Brookdale Senior Living, Inc. | 9,000 | | 332,010 |
Life Sciences Tools & Services - 0.2% |
Thermo Fisher Scientific, Inc. (a) | 5,550 | | 326,396 |
Pharmaceuticals - 2.7% |
Johnson & Johnson | 20,300 | | 1,322,951 |
Merck & Co., Inc. | 36,700 | | 2,138,142 |
Wyeth | 5,750 | | 279,623 |
| | 3,740,716 |
TOTAL HEALTH CARE | | 9,016,842 |
INDUSTRIALS - 10.5% |
Aerospace & Defense - 3.5% |
General Dynamics Corp. | 17,700 | | 1,609,992 |
Honeywell International, Inc. | 20,840 | | 1,258,944 |
Raytheon Co. | 7,300 | | 464,353 |
United Technologies Corp. | 20,300 | | 1,554,777 |
| | 4,888,066 |
Air Freight & Logistics - 0.3% |
United Parcel Service, Inc. Class B | 6,200 | | 465,620 |
Airlines - 0.2% |
Delta Air Lines, Inc. (a) | 10,400 | | 216,320 |
US Airways Group, Inc. (a) | 4,500 | | 124,470 |
| | 340,790 |
Building Products - 0.1% |
Masco Corp. | 8,150 | | 196,252 |
Common Stocks - continued |
| Shares | | Value |
INDUSTRIALS - continued |
Commercial Services & Supplies - 0.9% |
Allied Waste Industries, Inc. (a) | 38,100 | | $ 481,584 |
Robert Half International, Inc. | 8,200 | | 246,738 |
The Brink's Co. | 7,550 | | 473,008 |
| | 1,201,330 |
Construction & Engineering - 0.2% |
Fluor Corp. | 2,163 | | 341,754 |
Industrial Conglomerates - 3.9% |
General Electric Co. | 112,580 | | 4,633,793 |
Siemens AG sponsored ADR | 6,100 | | 831,857 |
| | 5,465,650 |
Machinery - 0.9% |
Bucyrus International, Inc. Class A | 5,900 | | 486,750 |
Oshkosh Truck Co. | 7,100 | | 384,820 |
Sulzer AG (Reg.) | 226 | | 362,521 |
| | 1,234,091 |
Road & Rail - 0.5% |
Knight Transportation, Inc. | 21,000 | | 335,370 |
Ryder System, Inc. | 8,300 | | 397,155 |
| | 732,525 |
TOTAL INDUSTRIALS | | 14,866,078 |
INFORMATION TECHNOLOGY - 6.2% |
Communications Equipment - 1.0% |
Alcatel-Lucent SA sponsored ADR | 27,400 | | 265,506 |
Comverse Technology, Inc. (a) | 12,700 | | 244,094 |
Motorola, Inc. | 47,400 | | 890,646 |
| | 1,400,246 |
Computers & Peripherals - 2.6% |
Hewlett-Packard Co. | 35,550 | | 1,837,224 |
International Business Machines Corp. | 8,500 | | 987,020 |
NCR Corp. (a) | 13,700 | | 377,983 |
Sun Microsystems, Inc. (a) | 81,100 | | 463,081 |
| | 3,665,308 |
Electronic Equipment & Instruments - 1.1% |
Agilent Technologies, Inc. (a) | 10,100 | | 372,185 |
Amphenol Corp. Class A | 1,600 | | 70,832 |
Flextronics International Ltd. (a) | 25,100 | | 308,981 |
Common Stocks - continued |
| Shares | | Value |
INFORMATION TECHNOLOGY - continued |
Electronic Equipment & Instruments - continued |
Motech Industries, Inc. | 36,675 | | $ 384,920 |
Tyco Electronics Ltd. | 11,075 | | 395,045 |
| | 1,531,963 |
Internet Software & Services - 0.2% |
VeriSign, Inc. (a) | 9,300 | | 317,037 |
IT Services - 0.4% |
The Western Union Co. | 16,600 | | 365,864 |
Unisys Corp. (a) | 47,798 | | 290,612 |
| | 656,476 |
Semiconductors & Semiconductor Equipment - 0.9% |
Analog Devices, Inc. | 6,200 | | 207,452 |
Applied Materials, Inc. | 13,200 | | 256,344 |
Maxim Integrated Products, Inc. | 11,400 | | 308,940 |
Novellus Systems, Inc. (a) | 10,400 | | 295,464 |
ON Semiconductor Corp. (a) | 4,500 | | 45,900 |
Volterra Semiconductor Corp. (a) | 10,400 | | 127,816 |
| | 1,241,916 |
TOTAL INFORMATION TECHNOLOGY | | 8,812,946 |
MATERIALS - 4.2% |
Chemicals - 1.2% |
Agrium, Inc. | 12,000 | | 762,550 |
Albemarle Corp. | 8,600 | | 410,736 |
Chemtura Corp. | 18,400 | | 171,488 |
Ecolab, Inc. | 6,900 | | 325,473 |
| | 1,670,247 |
Metals & Mining - 3.0% |
Alcoa, Inc. | 21,900 | | 867,021 |
Allegheny Technologies, Inc. | 2,200 | | 224,774 |
ArcelorMittal SA (NY Shares) Class A | 7,100 | | 567,645 |
Carpenter Technology Corp. | 3,000 | | 434,730 |
Freeport-McMoRan Copper & Gold, Inc. Class B | 5,900 | | 694,312 |
Goldcorp, Inc. | 6,700 | | 235,799 |
Lihir Gold Ltd. (a) | 88,116 | | 349,831 |
Newcrest Mining Ltd. | 11,553 | | 352,175 |
Common Stocks - continued |
| Shares | | Value |
MATERIALS - continued |
Metals & Mining - continued |
Randgold Resources Ltd. sponsored ADR | 5,700 | | $ 204,858 |
Reliance Steel & Aluminum Co. | 5,300 | | 309,255 |
| | 4,240,400 |
TOTAL MATERIALS | | 5,910,647 |
TELECOMMUNICATION SERVICES - 6.9% |
Diversified Telecommunication Services - 6.5% |
AT&T, Inc. | 169,037 | | 7,064,056 |
Cincinnati Bell, Inc. (a) | 58,300 | | 315,986 |
Verizon Communications, Inc. | 39,750 | | 1,831,283 |
| | 9,211,325 |
Wireless Telecommunication Services - 0.4% |
American Tower Corp. Class A (a) | 6,600 | | 291,588 |
Sprint Nextel Corp. | 15,300 | | 261,630 |
| | 553,218 |
TOTAL TELECOMMUNICATION SERVICES | | 9,764,543 |
UTILITIES - 5.2% |
Electric Utilities - 2.1% |
E.ON AG sponsored ADR | 6,000 | | 390,600 |
Entergy Corp. | 10,000 | | 1,198,700 |
PPL Corp. | 15,700 | | 811,690 |
Reliant Energy, Inc. (a) | 21,400 | | 588,928 |
| | 2,989,918 |
Independent Power Producers & Energy Traders - 1.7% |
AES Corp. (a) | 19,300 | | 413,213 |
Constellation Energy Group, Inc. | 15,100 | | 1,429,970 |
NRG Energy, Inc. (a) | 13,600 | | 620,976 |
| | 2,464,159 |
Multi-Utilities - 1.4% |
CMS Energy Corp. | 11,600 | | 196,852 |
Common Stocks - continued |
| Shares | | Value |
UTILITIES - continued |
Multi-Utilities - continued |
Public Service Enterprise Group, Inc. | 13,400 | | $ 1,281,040 |
Sempra Energy | 7,000 | | 430,570 |
| | 1,908,462 |
TOTAL UTILITIES | | 7,362,539 |
TOTAL COMMON STOCKS (Cost $126,680,391) | 139,236,341 |
Money Market Funds - 5.2% |
| | | |
Fidelity Cash Central Fund, 4.97% (b) | 921,828 | | 921,828 |
Fidelity Securities Lending Cash Central Fund, 5.02% (b)(c) | 6,493,800 | | 6,493,800 |
TOTAL MONEY MARKET FUNDS (Cost $7,415,628) | 7,415,628 |
TOTAL INVESTMENT PORTFOLIO - 103.5% (Cost $134,096,019) | 146,651,969 |
NET OTHER ASSETS - (3.5)% | | (4,935,054) |
NET ASSETS - 100% | $ 141,716,915 |
Legend |
(a) Non-income producing |
(b) Affiliated fund that is available only to investment companies and other accounts managed by Fidelity Investments. The rate quoted is the annualized seven-day yield of the fund at period end. A complete unaudited listing of the fund's holdings as of its most recent quarter end is available upon request. |
(c) Investment made with cash collateral received from securities on loan. |
(d) Security or a portion of the security is on loan at period end. |
(e) Security exempt from registration under Rule 144A of the Securities Act of 1933. These securities may be resold in transactions exempt from registration, normally to qualified institutional buyers. At the end of the period, the value of these securities amounted to $25,740 or 0.0% of net assets. |
Affiliated Central Funds |
Information regarding fiscal year to date income earned by the Fund from investments in Fidelity Central Funds is as follows: |
Fund | Income earned |
Fidelity Cash Central Fund | $ 67,551 |
Fidelity Securities Lending Cash Central Fund | 5,679 |
Total | $ 73,230 |
Other Information |
Distribution of investments by country of issue, as a percentage of total net assets, is as follows: |
United States of America | 86.6% |
Canada | 2.6% |
Bermuda | 2.4% |
United Kingdom | 2.0% |
Switzerland | 1.6% |
Others (individually less than 1%) | 4.8% |
| 100.0% |
See accompanying notes which are an integral part of the financial statements.
Annual Report
Financial Statements
Statement of Assets and Liabilities
| October 31, 2007 |
| | |
Assets | | |
Investment in securities, at value (including securities loaned of $6,485,131) - See accompanying schedule: Unaffiliated issuers (cost $126,680,391) | $ 139,236,341 | |
Fidelity Central Funds (cost $7,415,628) | 7,415,628 | |
Total Investments (cost $134,096,019) | | $ 146,651,969 |
Receivable for investments sold | | 970,269 |
Receivable for fund shares sold | | 907,774 |
Dividends receivable | | 171,409 |
Distributions receivable from Fidelity Central Funds | | 6,877 |
Prepaid expenses | | 22 |
Receivable from investment adviser for expense reductions | | 9,755 |
Other receivables | | 894 |
Total assets | | 148,718,969 |
| | |
Liabilities | | |
Payable for investments purchased | $ 172,085 | |
Payable for fund shares redeemed | 113,614 | |
Accrued management fee | 65,390 | |
Distribution fees payable | 48,978 | |
Other affiliated payables | 34,694 | |
Other payables and accrued expenses | 73,493 | |
Collateral on securities loaned, at value | 6,493,800 | |
Total liabilities | | 7,002,054 |
| | |
Net Assets | | $ 141,716,915 |
Net Assets consist of: | | |
Paid in capital | | $ 121,669,772 |
Undistributed net investment income | | 592,692 |
Accumulated undistributed net realized gain (loss) on investments and foreign currency transactions | | 6,898,362 |
Net unrealized appreciation (depreciation) on investments and assets and liabilities in foreign currencies | | 12,556,089 |
Net Assets | | $ 141,716,915 |
See accompanying notes which are an integral part of the financial statements.
Annual Report
Financial Statements - continued
Statement of Assets and Liabilities - continued
| October 31, 2007 |
| | |
Calculation of Maximum Offering Price
Class A:
Net Asset Value and redemption price per share ($67,434,086 ÷ 4,112,098 shares) | | $ 16.40 |
| | |
Maximum offering price per share (100/94.25 of $16.40) | | $ 17.40 |
Class T:
Net Asset Value and redemption price per share ($50,997,932 ÷ 3,128,899 shares) | | $ 16.30 |
| | |
Maximum offering price per share (100/96.50 of $16.30) | | $ 16.89 |
Class B:
Net Asset Value and offering price per share ($6,733,539 ÷ 418,894 shares) A | | $ 16.07 |
| | |
Class C:
Net Asset Value and offering price per share ($9,718,016 ÷ 605,694 shares) A | | $ 16.04 |
| | |
| | |
Institutional Class:
Net Asset Value, offering price and redemption price per share ($6,833,342 ÷ 413,889 shares) | | $ 16.51 |
A Redemption price per share is equal to net asset value less any applicable contingent deferred sales charge.
See accompanying notes which are an integral part of the financial statements.
Annual Report
Statement of Operations
| Year ended October 31, 2007 |
| | |
Investment Income | | |
Dividends | | $ 2,196,432 |
Interest | | 374 |
Income from Fidelity Central Funds | | 73,230 |
Total income | | 2,270,036 |
| | |
Expenses | | |
Management fee | $ 604,137 | |
Transfer agent fees | 289,401 | |
Distribution fees | 483,563 | |
Accounting and security lending fees | 42,478 | |
Custodian fees and expenses | 39,286 | |
Independent trustees' compensation | 343 | |
Registration fees | 70,088 | |
Audit | 48,434 | |
Legal | 824 | |
Miscellaneous | 34,121 | |
Total expenses before reductions | 1,612,675 | |
Expense reductions | (50,830) | 1,561,845 |
Net investment income (loss) | | 708,191 |
Realized and Unrealized Gain (Loss) Net realized gain (loss) on: | | |
Investment securities: | | |
Unaffiliated issuers | 7,002,404 | |
Foreign currency transactions | 17,408 | |
Total net realized gain (loss) | | 7,019,812 |
Change in net unrealized appreciation (depreciation) on: Investment securities | 5,194,341 | |
Assets and liabilities in foreign currencies | 96 | |
Total change in net unrealized appreciation (depreciation) | | 5,194,437 |
Net gain (loss) | | 12,214,249 |
Net increase (decrease) in net assets resulting from operations | | $ 12,922,440 |
See accompanying notes which are an integral part of the financial statements.
Annual Report
Financial Statements - continued
Statement of Changes in Net Assets
| Year ended
October 31,
2007 | Year ended
October 31,
2006 |
Increase (Decrease) in Net Assets | | |
Operations | | |
Net investment income (loss) | $ 708,191 | $ 122,196 |
Net realized gain (loss) | 7,019,812 | 3,362,048 |
Change in net unrealized appreciation (depreciation) | 5,194,437 | 3,767,996 |
Net increase (decrease) in net assets resulting
from operations | 12,922,440 | 7,252,240 |
Distributions to shareholders from net investment income | (203,521) | (41,743) |
Distributions to shareholders from net realized gain | (3,080,270) | (968,807) |
Total distributions | (3,283,791) | (1,010,550) |
Share transactions - net increase (decrease) | 71,133,838 | 16,012,456 |
Total increase (decrease) in net assets | 80,772,487 | 22,254,146 |
| | |
Net Assets | | |
Beginning of period | 60,944,428 | 38,690,282 |
End of period (including undistributed net investment income of $592,692 and undistributed net investment income of $86,603, respectively) | $ 141,716,915 | $ 60,944,428 |
See accompanying notes which are an integral part of the financial statements.
Annual Report
Financial Highlights - Class A
Years ended October 31, | 2007 | 2006 | 2005 | 2004 | 2003 H |
Selected Per-Share Data | | | | | |
Net asset value, beginning of period | $ 15.08 | $ 13.22 | $ 11.70 | $ 10.37 | $ 10.00 |
Income from Investment Operations | | | | | |
Net investment income (loss) E | .13 | .08 | .06 | .01 | - J |
Net realized and unrealized gain (loss) | 1.99 | 2.15 | 1.51 | 1.32 | .37 |
Total from investment operations | 2.12 | 2.23 | 1.57 | 1.33 | .37 |
Distributions from net investment income | (.09) | (.04) | (.04) | - | - |
Distributions from net realized gain | (.71) | (.33) | (.01) | - | - |
Total distributions | (.80) | (.37) | (.05) | - | - |
Net asset value, end of period | $ 16.40 | $ 15.08 | $ 13.22 | $ 11.70 | $ 10.37 |
Total Return B, C, D | 14.64% | 17.20% | 13.40% | 12.83% | 3.70% |
Ratios to Average Net Assets F, I | | | | | |
Expenses before reductions | 1.28% | 1.41% | 1.50% | 3.39% | 5.52% A |
Expenses net of fee waivers,
if any | 1.25% | 1.25% | 1.30% | 1.50% | 1.75% A |
Expenses net of all reductions | 1.24% | 1.24% | 1.26% | 1.47% | 1.73% A |
Net investment income (loss) | .85% | .54% | .48% | .11% | (.05)% A |
Supplemental Data | | | | | |
Net assets, end of period
(000 omitted) | $ 67,434 | $ 15,398 | $ 7,121 | $ 4,000 | $ 1,123 |
Portfolio turnover rate G | 76% | 91% | 86% | 111% | 108% A |
A Annualized
B Total returns for periods of less than one year are not annualized.
C Total returns would have been lower had certain expenses not been reduced during the periods shown.
D Total returns do not include the effect of the sales charges.
E Calculated based on average shares outstanding during the period.
F Fees and expenses of the underlying Fidelity Central Funds are not included in the Fund's expense ratio. The Fund indirectly bears its proportionate share of the expenses of any underlying Fidelity Central Funds.
G Amount does not include the portfolio activity of any underlying Fidelity Central Funds.
H For the period June 17, 2003 (commencement of operations) to October 31, 2003.
I Expense ratios reflect operating expenses of the class. Expenses before reductions do not reflect amounts reimbursed by the investment adviser or reductions from brokerage service arrangements or other expense offset arrangements and do not represent the amount paid by the class during periods when reimbursements or reductions occur. Expense ratios before reductions for start-up periods may not be representative of longer-term operating periods. Expenses net of fee waivers reflect expenses after reimbursement by the investment adviser but prior to reductions from brokerage service arrangements or other expense offset arrangements. Expenses net of all reductions represent the net expenses paid by the class.
J Amount represents less than $.01 per share.
See accompanying notes which are an integral part of the financial statements.
Annual Report
Financial Highlights - Class T
Years ended October 31, | 2007 | 2006 | 2005 | 2004 | 2003 H |
Selected Per-Share Data | | | | | |
Net asset value, beginning of period | $ 14.99 | $ 13.14 | $ 11.67 | $ 10.36 | $ 10.00 |
Income from Investment Operations | | | | | |
Net investment income (loss) E | .09 | .04 | .03 | (.02) | (.01) |
Net realized and unrealized gain (loss) | 1.97 | 2.15 | 1.48 | 1.33 | .37 |
Total from investment operations | 2.06 | 2.19 | 1.51 | 1.31 | .36 |
Distributions from net investment income | (.04) | (.01) | (.03) | - | - |
Distributions from net realized gain | (.71) | (.33) | (.01) | - | - |
Total distributions | (.75) | (.34) | (.04) | - | - |
Net asset value, end of period | $ 16.30 | $ 14.99 | $ 13.14 | $ 11.67 | $ 10.36 |
Total Return B, C, D | 14.31% | 16.93% | 12.96% | 12.64% | 3.60% |
Ratios to Average Net Assets F, I | | | | | |
Expenses before reductions | 1.53% | 1.65% | 1.72% | 3.30% | 5.77% A |
Expenses net of fee waivers,
if any | 1.50% | 1.50% | 1.55% | 1.75% | 2.00% A |
Expenses net of all reductions | 1.49% | 1.49% | 1.51% | 1.72% | 1.98% A |
Net investment income (loss) | .60% | .29% | .23% | (.14)% | (.30)% A |
Supplemental Data | | | | | |
Net assets, end of period
(000 omitted) | $ 50,998 | $ 30,607 | $ 21,580 | $ 13,340 | $ 1,546 |
Portfolio turnover rate G | 76% | 91% | 86% | 111% | 108% A |
A Annualized
B Total returns for periods of less than one year are not annualized.
C Total returns would have been lower had certain expenses not been reduced during the periods shown.
D Total returns do not include the effect of the sales charges.
E Calculated based on average shares outstanding during the period.
F Fees and expenses of the underlying Fidelity Central Funds are not included in the Fund's expense ratio. The Fund indirectly bears its proportionate share of the expenses of any underlying Fidelity Central Funds.
G Amount does not include the portfolio activity of any underlying Fidelity Central Funds.
H For the period June 17, 2003 (commencement of operations) to October 31, 2003.
I Expense ratios reflect operating expenses of the class. Expenses before reductions do not reflect amounts reimbursed by the investment adviser or reductions from brokerage service arrangements or other expense offset arrangements and do not represent the amount paid by the class during periods when reimbursements or reductions occur. Expense ratios before reductions for start-up periods may not be representative of longer-term operating periods. Expenses net of fee waivers reflect expenses after reimbursement by the investment adviser but prior to reductions from brokerage service arrangements or other expense offset arrangements. Expenses net of all reductions represent the net expenses paid by the class.
See accompanying notes which are an integral part of the financial statements.
Annual Report
Financial Highlights - Class B
Years ended October 31, | 2007 | 2006 | 2005 | 2004 | 2003 H |
Selected Per-Share Data | | | | | |
Net asset value, beginning of period | $ 14.81 | $ 12.99 | $ 11.59 | $ 10.34 | $ 10.00 |
Income from Investment Operations | | | | | |
Net investment income (loss) E | .01 | (.03) | (.03) | (.07) | (.03) |
Net realized and unrealized gain (loss) | 1.95 | 2.13 | 1.46 | 1.32 | .37 |
Total from investment operations | 1.96 | 2.10 | 1.43 | 1.25 | .34 |
Distributions from net investment income | - | - | (.02) | - | - |
Distributions from net realized gain | (.70) | (.28) | (.01) | - | - |
Total distributions | (.70) | (.28) | (.03) | - | - |
Net asset value, end of period | $ 16.07 | $ 14.81 | $ 12.99 | $ 11.59 | $ 10.34 |
Total Return B, C, D | 13.74% | 16.38% | 12.35% | 12.09% | 3.40% |
Ratios to Average Net Assets F, I | | | | | |
Expenses before reductions | 2.10% | 2.23% | 2.31% | 4.33% | 6.24% A |
Expenses net of fee waivers,
if any | 2.00% | 2.00% | 2.05% | 2.25% | 2.50% A |
Expenses net of all reductions | 1.99% | 1.99% | 2.01% | 2.22% | 2.48% A |
Net investment income (loss) | .10% | (.21)% | (.27)% | (.64)% | (.80)% A |
Supplemental Data | | | | | |
Net assets, end of period
(000 omitted) | $ 6,734 | $ 5,734 | $ 4,240 | $ 2,560 | $ 1,125 |
Portfolio turnover rate G | 76% | 91% | 86% | 111% | 108% A |
A Annualized
B Total returns for periods of less than one year are not annualized.
C Total returns would have been lower had certain expenses not been reduced during the periods shown.
D Total returns do not include the effect of the contingent deferred sales charge.
E Calculated based on average shares outstanding during the period.
F Fees and expenses of the underlying Fidelity Central Funds are not included in the Fund's expense ratio. The Fund indirectly bears its proportionate share of the expenses of any underlying Fidelity Central Funds.
G Amount does not include the portfolio activity of any underlying Fidelity Central Funds.
H For the period June 17, 2003 (commencement of operations) to October 31, 2003.
I Expense ratios reflect operating expenses of the class. Expenses before reductions do not reflect amounts reimbursed by the investment adviser or reductions from brokerage service arrangements or other expense offset arrangements and do not represent the amount paid by the class during periods when reimbursements or reductions occur. Expense ratios before reductions for start-up periods may not be representative of longer-term operating periods. Expenses net of fee waivers reflect expenses after reimbursement by the investment adviser but prior to reductions from brokerage service arrangements or other expense offset arrangements. Expenses net of all reductions represent the net expenses paid by the class.
See accompanying notes which are an integral part of the financial statements.
Annual Report
Financial Highlights - Class C
Years ended October 31, | 2007 | 2006 | 2005 | 2004 | 2003 H |
Selected Per-Share Data | | | | | |
Net asset value, beginning of period | $ 14.80 | $ 12.99 | $ 11.58 | $ 10.34 | $ 10.00 |
Income from Investment Operations | | | | | |
Net investment income (loss) E | .02 | (.03) | (.03) | (.07) | (.03) |
Net realized and unrealized gain (loss) | 1.93 | 2.13 | 1.47 | 1.31 | .37 |
Total from investment operations | 1.95 | 2.10 | 1.44 | 1.24 | .34 |
Distributions from net investment income | - | - | (.02) | - | - |
Distributions from net realized gain | (.71) | (.29) | (.01) | - | - |
Total distributions | (.71) | (.29) | (.03) | - | - |
Net asset value, end of period | $ 16.04 | $ 14.80 | $ 12.99 | $ 11.58 | $ 10.34 |
Total Return B, C, D | 13.69% | 16.38% | 12.45% | 11.99% | 3.40% |
Ratios to Average Net Assets F, I | | | | | |
Expenses before reductions | 2.09% | 2.22% | 2.30% | 4.39% | 6.24% A |
Expenses net of fee waivers,
if any | 2.00% | 2.00% | 2.05% | 2.25% | 2.50% A |
Expenses net of all reductions | 1.99% | 1.99% | 2.01% | 2.22% | 2.48% A |
Net investment income (loss) | .10% | (.21)% | (.27)% | (.64)% | (.80)% A |
Supplemental Data | | | | | |
Net assets, end of period
(000 omitted) | $ 9,718 | $ 7,004 | $ 3,892 | $ 1,815 | $ 1,069 |
Portfolio turnover rate G | 76% | 91% | 86% | 111% | 108% A |
A Annualized
B Total returns for periods of less than one year are not annualized.
C Total returns would have been lower had certain expenses not been reduced during the periods shown.
D Total returns do not include the effect of the contingent deferred sales charge.
E Calculated based on average shares outstanding during the period.
F Fees and expenses of the underlying Fidelity Central Funds are not included in the Fund's expense ratio. The Fund indirectly bears its proportionate share of the expenses of any underlying Fidelity Central Funds.
G Amount does not include the portfolio activity of any underlying Fidelity Central Funds.
H For the period June 17, 2003 (commencement of operations) to October 31, 2003.
I Expense ratios reflect operating expenses of the class. Expenses before reductions do not reflect amounts reimbursed by the investment adviser or reductions from brokerage service arrangements or other expense offset arrangements and do not represent the amount paid by the class during periods when reimbursements or reductions occur. Expense ratios before reductions for start-up periods may not be representative of longer-term operating periods. Expenses net of fee waivers reflect expenses after reimbursement by the investment adviser but prior to reductions from brokerage service arrangements or other expense offset arrangements. Expenses net of all reductions represent the net expenses paid by the class.
See accompanying notes which are an integral part of the financial statements.
Annual Report
Financial Highlights - Institutional Class
Years ended October 31, | 2007 | 2006 | 2005 | 2004 | 2003 G |
Selected Per-Share Data | | | | | |
Net asset value, beginning of period | $ 15.17 | $ 13.28 | $ 11.75 | $ 10.38 | $ 10.00 |
Income from Investment Operations | | | | | |
Net investment income (loss) D | .17 | .11 | .09 | .04 | .01 |
Net realized and unrealized gain (loss) | 1.99 | 2.18 | 1.49 | 1.33 | .37 |
Total from investment operations | 2.16 | 2.29 | 1.58 | 1.37 | .38 |
Distributions from net investment income | (.11) | (.07) | (.04) | - | - |
Distributions from net realized gain | (.71) | (.33) | (.01) | - | - |
Total distributions | (.82) | (.40) | (.05) | - | - |
Net asset value, end of period | $ 16.51 | $ 15.17 | $ 13.28 | $ 11.75 | $ 10.38 |
Total Return B, C | 14.89% | 17.58% | 13.47% | 13.20% | 3.80% |
Ratios to Average Net Assets E, H | | | | | |
Expenses before reductions | 1.00% | 1.04% | 1.14% | 3.41% | 5.27% A |
Expenses net of fee waivers,
if any | 1.00% | 1.00% | 1.06% | 1.25% | 1.50% A |
Expenses net of all reductions | .99% | .99% | 1.02% | 1.22% | 1.48% A |
Net investment income (loss) | 1.10% | .79% | .72% | .36% | .20% A |
Supplemental Data | | | | | |
Net assets, end of period
(000 omitted) | $ 6,833 | $ 2,201 | $ 1,857 | $ 1,282 | $ 1,038 |
Portfolio turnover rate F | 76% | 91% | 86% | 111% | 108% A |
A Annualized
B Total returns for periods of less than one year are not annualized.
C Total returns would have been lower had certain expenses not been reduced during the periods shown.
D Calculated based on average shares outstanding during the period.
E Fees and expenses of the underlying Fidelity Central Funds are not included in the Fund's expense ratio. The Fund indirectly bears its proportionate share of the expenses of any underlying Fidelity Central Funds.
F Amount does not include the portfolio activity of any underlying Fidelity Central Funds.
G For the period June 17, 2003 (commencement of operations) to October 31, 2003.
H Expense ratios reflect operating expenses of the class. Expenses before reductions do not reflect amounts reimbursed by the investment adviser or reductions from brokerage service arrangements or other expense offset arrangements and do not represent the amount paid by the class during periods when reimbursements or reductions occur. Expense ratios before reductions for start-up periods may not be representative of longer-term operating periods. Expenses net of fee waivers reflect expenses after reimbursement by the investment adviser but prior to reductions from brokerage service arrangements or other expense offset arrangements. Expenses net of all reductions represent the net expenses paid by the class.
See accompanying notes which are an integral part of the financial statements.
Annual Report
Notes to Financial Statements
For the period ended October 31, 2007
1. Organization.
Fidelity Advisor Value Leaders Fund (the Fund) is a fund of Fidelity Advisor Series VIII (the trust) and is authorized to issue an unlimited number of shares. The trust is registered under the Investment Company Act of 1940, as amended (the 1940 Act), as an open-end management investment company organized as a Massachusetts business trust.
The Fund offers Class A, Class T, Class B, Class C, and Institutional Class shares, each of which has equal rights as to assets and voting privileges. Each class has exclusive voting rights with respect to matters that affect that class. Class B shares will automatically convert to Class A shares after a holding period of seven years from the initial date of purchase. Investment income, realized and unrealized capital gains and losses, the common expenses of the Fund, and certain fund-level expense reductions, if any, are allocated on a pro rata basis to each class based on the relative net assets of each class to the total net assets of the Fund. Each class differs with respect to transfer agent and distribution and service plan fees incurred. Certain expense reductions also differ by class.
2. Investments in Fidelity Central Funds.
The Fund may invest in Fidelity Central Funds, which are open-end investment companies available only to other investment companies and accounts managed by Fidelity Management & Research Company (FMR) and its affiliates. The Fund's Schedule of Investments lists each of the Fidelity Central Funds as an investment of the Fund, but does not include the underlying holdings of each Fidelity Central Fund. As an Investing Fund, the Fund indirectly bears its proportionate share of the expenses of the underlying Fidelity Central Funds.
The Money Market Central Funds seek preservation of capital and current income and are managed by Fidelity Investments Money Management, Inc. (FIMM), an affiliate of FMR.
A complete list of holdings for each Fidelity Central Fund is available upon request or at the SEC's web site at www.sec.gov. In addition, the financial statements of the Fidelity Central Funds, which are not covered by the Fund's Report of Independent Registered Public Accounting Firm, are available on the SEC's web site or upon request.
3. Significant Accounting Policies.
The financial statements have been prepared in conformity with accounting principles generally accepted in the United States of America, which require management to make certain estimates and assumptions at the date of the financial statements. The following summarizes the significant accounting policies of the Fund:
Annual Report
3. Significant Accounting Policies - continued
Security Valuation. Investments are valued and net asset value (NAV) per share is calculated (NAV calculation) as of the close of business of the New York Stock Exchange (NYSE), normally 4:00 p.m. Eastern time. Wherever possible, the Fund uses independent pricing services approved by the Board of Trustees to value its investments.
Equity securities, including restricted securities, for which market quotations are readily available, are valued at the last reported sale price or official closing price as reported by an independent pricing service on the primary market or exchange on which they are traded. In the event there were no sales during the day or closing prices are not available, securities are valued at the last quoted bid price. Investments in open-end mutual funds, including the Fidelity Central Funds, are valued at their closing net asset value each business day. Short-term securities with remaining maturities of sixty days or less for which quotations are not readily available are valued at amortized cost, which approximates value.
When current market prices or quotations are not readily available or do not accurately reflect fair value, valuations may be determined in accordance with procedures adopted by the Board of Trustees. For example, when developments occur between the close of a market and the close of the NYSE that may materially affect the value of some or all of the securities, or when trading in a security is halted, those securities may be fair valued. Factors used in the determination of fair value may include monitoring news to identify significant market or security specific events such as changes in the value of U.S. securities markets, reviewing developments in foreign markets and evaluating the performance of ADRs, futures contracts and exchange-traded funds. Because the Fund's utilization of fair value pricing depends on market activity, the frequency with which fair value pricing is used cannot be predicted and may be utilized to a significant extent. The value of securities used for NAV calculation under fair value pricing may differ from published prices for the same securities.
Foreign Currency. The Fund uses foreign currency contracts to facilitate transactions in foreign-denominated securities. Losses from these transactions may arise from changes in the value of the foreign currency or if the counterparties do not perform under the contracts' terms.
Foreign-denominated assets, including investment securities, and liabilities are translated into U.S. dollars at the exchange rate at period end. Purchases and sales of investment securities, income and dividends received and expenses denominated in foreign currencies are translated into U.S. dollars at the exchange rate in effect on the transaction date.
Annual Report
Notes to Financial Statements - continued
3. Significant Accounting Policies - continued
Foreign Currency - continued
The effects of exchange rate fluctuations on investments are included with the net realized and unrealized gain (loss) on investment securities. Other foreign currency transactions resulting in realized and unrealized gain (loss) are disclosed separately.
Investment Transactions and Income. For financial reporting purposes, the Fund's investment holdings and NAV include trades executed through the end of the last business day of the period. The NAV for processing shareholder transactions includes trades executed through the end of the prior business day. Gains and losses on securities sold are determined on the basis of identified cost and may include proceeds received from litigation. Dividend income is recorded on the ex-dividend date. Non-cash dividends included in dividend income, if any, are recorded at the fair market value of the securities received. Distributions received on securities that represent a return of capital or capital gain are recorded as a reduction of cost of investments and/or as a realized gain. The Fund estimates the components of distributions received that may be considered return of capital distributions or capital gain distributions. Interest income and distributions from the Fidelity Central Funds are accrued as earned. Interest income includes coupon interest and amortization of premium and accretion of discount on debt securities. Investment income is recorded net of foreign taxes withheld where recovery of such taxes is uncertain.
Expenses. Most expenses of the trust can be directly attributed to a fund. Expenses which cannot be directly attributed are apportioned among each Fund in the trust. Expense estimates are accrued in the period to which they relate and adjustments are made when actual amounts are known.
Income Tax Information and Distributions to Shareholders. Each year, the Fund intends to qualify as a regulated investment company by distributing all of its taxable income and realized gains under Subchapter M of the Internal Revenue Code. As a result, no provision for income taxes is required in the accompanying financial statements. Foreign taxes are provided for based on the Fund's understanding of the tax rules and rates that exist in the foreign markets in which it invests.
Distributions are recorded on the ex-dividend date. Income dividends and capital gain distributions are declared separately for each class. Income and capital gain distributions are determined in accordance with income tax regulations, which may differ from generally accepted accounting principles. In addition, the Fund will claim a portion of the payment made to redeeming shareholders as a distribution for income tax purposes.
Capital accounts within the financial statements are adjusted for permanent book-tax differences. Certain adjustments have been made to the accounts relating to prior
Annual Report
3. Significant Accounting Policies - continued
Income Tax Information and Distributions to Shareholders - continued
periods. Collectively, these adjustments have no impact on net assets or the results of operations. Temporary book-tax differences will reverse in a subsequent period.
Book-tax differences are primarily due to foreign currency transactions, passive foreign investment companies (PFIC) and losses deferred due to wash sales.
The tax-basis components of distributable earnings and the federal tax cost as of period end were as follows:
Unrealized appreciation | $ 20,028,233 | |
Unrealized depreciation | (7,689,398) | |
Net unrealized appreciation (depreciation) | 12,338,835 | |
Undistributed ordinary income | 2,582,182 | |
Undistributed long-term capital gain | 4,225,352 | |
| | |
Cost for federal income tax purposes | $ 134,313,134 | |
The tax character of distributions paid was as follows:
| October 31, 2007 | October 31, 2006 |
Ordinary Income | $ 546,132 | $ 291,983 |
Long-term Capital Gains | 2,737,659 | 718,567 |
Total | $ 3,283,791 | $ 1,010,550 |
New Accounting Pronouncements. In July 2006, Financial Accounting Standards Board Interpretation No. 48, Accounting for Uncertainty in Income Taxes - an interpretation of FASB Statement 109 (FIN 48), was issued and is effective on the last business day of the semiannual reporting period for fiscal years beginning after December 15, 2006. FIN 48 sets forth a threshold for financial statement recognition, measurement and disclosure of a tax position taken or expected to be taken on a tax return. Management has concluded that the adoption of FIN 48 will not result in a material impact on the Fund's net assets, results of operations and financial statement disclosures.
In addition, in September 2006, Statement of Financial Accounting Standards No. 157, Fair Value Measurements (SFAS 157), was issued and is effective for fiscal years beginning after November 15, 2007. SFAS 157 defines fair value, establishes a framework for measuring fair value and expands disclosures about fair value measurements. Management is currently evaluating the impact the adoption of SFAS 157 will have on the Fund's financial statement disclosures.
Annual Report
Notes to Financial Statements - continued
4. Operating Policies.
Repurchase Agreements. FMR has received an Exemptive Order from the Securities and Exchange Commission (the SEC) which permits the Fund and other affiliated entities of FMR to transfer uninvested cash balances into joint trading accounts which are then invested in repurchase agreements. The Fund may also invest directly with institutions in repurchase agreements. Repurchase agreements are collateralized by government or non-government securities. Upon settlement date, collateral is held in segregated accounts with custodian banks and may be obtained in the event of a default of the counterparty. The Fund monitors, on a daily basis, the value of the collateral to ensure it is at least equal to the principal amount of the repurchase agreement (including accrued interest). In the event of a default by the counterparty, realization of the collateral proceeds could be delayed, during which time the value of the collateral may decline.
Restricted Securities. The Fund may invest in securities that are subject to legal or contractual restrictions on resale. These securities generally may be resold in transactions exempt from registration or to the public if the securities are registered. Disposal of these securities may involve time-consuming negotiations and expense, and prompt sale at an acceptable price may be difficult. Information regarding restricted securities is included at the end of the Fund's Schedule of Investments.
5. Purchases and Sales of Investments.
Purchases and sales of securities, other than short-term securities, aggregated $147,664,629 and $80,688,670, respectively.
6. Fees and Other Transactions with Affiliates.
Management Fee. FMR and its affiliates provide the Fund with investment management related services for which the Fund pays a monthly management fee. The management fee is the sum of an individual fund fee rate that is based on an annual rate of .30% of the Fund's average net assets and a group fee rate that averaged ..26% during the period. The group fee rate is based upon the average net assets of all the mutual funds advised by FMR. The group fee rate decreases as assets under management increase and increases as assets under management decrease.
In addition, on May 16, 2007, shareholders approved a new management contract which adds a performance adjustment to the management fee (up to a maximum of .20% of the Fund's average net assets over a 36 month performance period). The upward or downward adjustment to the management fee is based on the relative investment performance of the Fund's Institutional Class as compared to an appropriate benchmark index. The Fund's performance period began on June 1, 2007. The performance adjustment
Annual Report
6. Fees and Other Transactions with Affiliates - continued
Management Fee - continued
will take effect starting with the twelfth month of the performance period (May, 2008). Subsequent months will be added until the performance period includes 36 months. For the period, the total annual management fee rate was .56% of the Fund's average net assets.
Distribution and Service Plan. In accordance with Rule 12b-1 of the 1940 Act, the Fund has adopted separate Distribution and Service Plans for each class of shares. Certain classes pay Fidelity Distributors Corporation (FDC), an affiliate of FMR, separate Distribution and Service Fees, each of which is based on an annual percentage of each class' average net assets. In addition, FDC may pay financial intermediaries for selling shares of the Fund and providing shareholder support services. For the period, the Distribution and Service Fee rates and the total amounts paid to and retained by FDC were as follows:
| Distribution
Fee | Service
Fee | Paid to
FDC | Retained
by FDC |
Class A | 0% | .25% | $ 108,401 | $ 52,690 |
Class T | .25% | .25% | 218,808 | 2,200 |
Class B | .75% | .25% | 67,794 | 52,303 |
Class C | .75% | .25% | 88,560 | 35,190 |
| | | $ 483,563 | $ 142,383 |
Sales Load. FDC receives a front-end sales charge of up to 5.75% for selling Class A shares, and 3.50% for selling Class T shares, some of which is paid to financial intermediaries for selling shares of the Fund. FDC receives the proceeds of contingent deferred sales charges levied on Class A, Class T, Class B, and Class C redemptions. These charges depend on the holding period. The deferred sales charges range from 5% to 1% for Class B, 1% for Class C, 1.00% to .50% for certain purchases of Class A shares and .25% for certain purchases of Class T shares.
For the period, sales charge amounts retained by FDC were as follows:
| Retained
by FDC |
Class A | $ 47,235 |
Class T | 12,611 |
Class B* | 7,599 |
Class C* | 3,310 |
| $ 70,755 |
* When Class B and Class C shares are initially sold, FDC pays commissions from its own resources to financial intermediaries through which the sales are made.
Annual Report
Notes to Financial Statements - continued
6. Fees and Other Transactions with Affiliates - continued
Transfer Agent Fees. Fidelity Investments Institutional Operations Company, Inc. (FIIOC), an affiliate of FMR, is the transfer, dividend disbursing and shareholder servicing agent for each class of the Fund. FIIOC receives account fees and asset-based fees that vary according to the account size and type of account of the shareholders of the respective classes of the Fund. FIIOC pays for typesetting, printing and mailing of shareholder reports, except proxy statements. For the period, the total transfer agent fees paid by each class to FIIOC, were as follows:
| Amount | % of
Average
Net Assets |
Class A | $ 116,641 | .27 |
Class T | 111,364 | .25 |
Class B | 21,226 | .31 |
Class C | 27,477 | .31 |
Institutional Class | 12,693 | .24 |
| $ 289,401 | |
Accounting and Security Lending Fees. Fidelity Service Company, Inc. (FSC), an affiliate of FMR, maintains the Fund's accounting records. The accounting fee is based on the level of average net assets for the month. Under a separate contract, FSC administers the security lending program. The security lending fee is based on the number and duration of lending transactions.
Brokerage Commissions. The Fund placed a portion of its portfolio transactions with brokerage firms which are affiliates of the investment adviser. The commissions paid to these affiliated firms were $1,626 for the period.
7. Committed Line of Credit.
The Fund participates with other funds managed by FMR in a $4.2 billion credit facility (the "line of credit") to be utilized for temporary or emergency purposes to fund shareholder redemptions or for other short-term liquidity purposes. The Fund has agreed to pay commitment fees on its pro rata portion of the line of credit, which amounted to $203 and is reflected in Miscellaneous Expense on the Statement of Operations. During the period, there were no borrowings on this line of credit.
Annual Report
8. Security Lending.
The Fund lends portfolio securities from time to time in order to earn additional income. On the settlement date of the loan, the Fund receives collateral (in the form of U.S. Treasury obligations, letters of credit and/or cash) against the loaned securities and maintains collateral in an amount not less than 100% of the market value of the loaned securities during the period of the loan. The market value of the loaned securities is determined at the close of business of the Fund and any additional required collateral is delivered to the Fund on the next business day. If the borrower defaults on its obligation to return the securities loaned because of insolvency or other reasons, a fund could experience delays and costs in recovering the securities loaned or in gaining access to the collateral. Any cash collateral received is invested in the Fidelity Securities Lending Cash Central Fund. The value of loaned securities and cash collateral at period end are disclosed on the Fund's Statement of Assets and Liabilities. Security lending income represents the income earned on investing cash collateral, less fees and expenses associated with the loan, plus any premium payments that may be received on the loan of certain types of securities. Security lending income is presented in the Statement of Operations as a component of income from Fidelity Central Funds. Net income from lending portfolio securities during the period amounted to $5,679.
9. Expense Reductions.
FMR voluntarily agreed to reimburse each class to the extent annual operating expenses exceeded certain levels of average net assets as noted in the table below. Some expenses, for example interest expense, including commitment fees, are excluded from this reimbursement.
The following classes were in reimbursement during the period:
| Expense
Limitations | Reimbursement
from adviser |
| | |
Class A | 1.25% | $ 14,802 |
Class T | 1.50% | 13,695 |
Class B | 2.00% | 6,877 |
Class C | 2.00% | 7,954 |
| | $ 43,328 |
Many of the brokers with whom FMR places trades on behalf of the Fund provided services to the Fund in addition to trade execution. These services included payments of certain expenses on behalf of the Fund totaling $3,169 for the period. In addition, through arrangements with the Fund's custodian and each class' transfer agent, credits realized as a result of uninvested cash balances were used to reduce the Fund's expenses.
Annual Report
Notes to Financial Statements - continued
9. Expense Reductions - continued
During the period, these credits reduced the Fund's custody expenses by $1,761. During the period, credits reduced each class' transfer agent expense as noted in the table below.
| Transfer Agent
expense reduction | |
Class A | $ 1,684 | |
Institutional Class | 18 | |
| $ 1,702 | |
10. Other.
The Fund's organizational documents provide former and current trustees and officers with a limited indemnification against liabilities arising in connection with the performance of their duties to the Fund. In the normal course of business, the Fund may also enter into contracts that provide general indemnifications. The Fund's maximum exposure under these arrangements is unknown as this would be dependent on future claims that may be made against the Fund. The risk of material loss from such claims is considered remote.
In September 2006, FIIOC, the Fund's transfer agent, notified the Fund that the Fund's books and records did not reflect a conversion of certain Class B to Class A shares upon their conversion date. In March 2007, FIIOC converted the relevant Class B shares to Class A shares and recorded the conversion in the books and records of the Fund which did not result in a material impact to the Fund's reported net assets or results of operations in the accompanying financial statements. FIIOC has remediated affected shareholders and reimbursed the Fund for all related audit and legal expenses.
The United States Securities and Exchange Commission ("SEC") is conducting an investigation of FMR (covering the years 2002 to 2004) arising from gifts, gratuities and business entertainment provided by certain brokers to certain individuals who were employed on FMR's domestic equity trading desk during that period. FMR is in discussions with the SEC staff regarding the possible resolution of the matter, but as of period-end no final resolution has been reached.
In December 2006, the Independent Trustees completed their own investigation of the matter with the assistance of independent counsel. The Independent Trustees and FMR agree that, despite the absence of proof that the Fidelity mutual funds experienced diminished execution quality as a result of the improper receipt of gifts and business entertainment, the conduct at issue was serious and is worthy of redress. Accordingly, the Independent Trustees have requested and FMR has agreed to pay $42 million to Fidelity mutual funds, plus interest to be determined at the time that payment is made. A method
Annual Report
10. Other - continued
of allocating this payment among the funds has not yet been determined. The total payment to the Fund is not anticipated to have a material impact on the Fund's net assets. In addition, FMR reimbursed related legal expenses which are recorded in the accompanying Statement of Operations as an expense reduction.
11. Distributions to Shareholders.
Distributions to shareholders of each class were as follows:
| Years ended October 31, |
| 2007 | 2006 |
From net investment income | | |
Class A | $ 95,578 | $ 22,293 |
Class T | 84,209 | 9,977 |
Institutional Class | 23,734 | 9,473 |
Total | $ 203,521 | $ 41,743 |
From net realized gain | | |
Class A | $ 798,354 | $ 186,144 |
Class T | 1,494,717 | 555,326 |
Class B | 288,272 | 92,178 |
Class C | 347,113 | 88,629 |
Institutional Class | 151,814 | 46,530 |
Total | $ 3,080,270 | $ 968,807 |
12. Share Transactions.
Transactions for each class of shares were as follows:
| Shares | Dollars |
| Years ended October 31, | Years ended October 31, |
| 2007 | 2006 | 2007 | 2006 |
Class A | | | | |
Shares sold | 3,695,755 | 659,673 | $ 57,509,722 | $ 9,418,722 |
Reinvestment of distributions | 58,930 | 14,943 | 865,688 | 203,973 |
Shares redeemed | (663,449) | (192,331) | (10,352,319) | (2,708,463) |
Net increase (decrease) | 3,091,236 | 482,285 | $ 48,023,091 | $ 6,914,232 |
Class T | | | | |
Shares sold | 1,421,685 | 787,206 | $ 21,932,526 | $ 11,194,933 |
Reinvestment of distributions | 102,412 | 39,036 | 1,498,284 | 530,894 |
Shares redeemed | (437,693) | (426,412) | (6,887,915) | (5,998,651) |
Net increase (decrease) | 1,086,404 | 399,830 | $ 16,542,895 | $ 5,727,176 |
Annual Report
Notes to Financial Statements - continued
12. Share Transactions - continued
| Shares | Dollars |
| Years ended October 31, | Years ended October 31, |
| 2007 | 2006 | 2007 | 2006 |
Class B | | | | |
Shares sold | 214,346 | 203,112 | $ 3,232,327 | $ 2,847,587 |
Reinvestment of distributions | 18,230 | 6,282 | 264,152 | 84,800 |
Shares redeemed | (200,858) | (148,531) | (3,047,563) | (2,076,164) |
Net increase (decrease) | 31,718 | 60,863 | $ 448,916 | $ 856,223 |
Class C | | | | |
Shares sold | 300,918 | 243,177 | $ 4,603,445 | $ 3,406,535 |
Reinvestment of distributions | 22,867 | 6,465 | 330,886 | 87,218 |
Shares redeemed | (191,479) | (75,797) | (2,915,876) | (1,054,786) |
Net increase (decrease) | 132,306 | 173,845 | $ 2,018,455 | $ 2,438,967 |
Institutional Class | | | | |
Shares sold | 592,099 | 34,102 | $ 9,392,137 | $ 488,410 |
Reinvestment of distributions | 11,218 | 3,384 | 165,468 | 46,355 |
Shares redeemed | (334,584) | (32,226) | (5,457,124) | (458,907) |
Net increase (decrease) | 268,733 | 5,260 | $ 4,100,481 | $ 75,858 |
Annual Report
Report of Independent Registered Public Accounting Firm
To the Trustees of Fidelity Advisor Series VIII and the Shareholders of Fidelity Advisor Value Leaders Fund:
In our opinion, the accompanying statement of assets and liabilities, including the schedule of investments, and the related statements of operations and of changes in net assets and the financial highlights present fairly, in all material respects, the financial position of Fidelity Advisor Value Leaders Fund (a fund of Fidelity Advisor Series VIII) at October 31, 2007, the results of its operations for the year then ended, the changes in its net assets for each of the two years in the period then ended and the financial highlights for each of the periods indicated, in conformity with accounting principles generally accepted in the United States of America. These financial statements and financial highlights (hereafter referred to as "financial statements") are the responsibility of the Fidelity Advisor Value Leaders Fund's management. Our responsibility is to express an opinion on these financial statements based on our audits. We conducted our audits of these financial statements in accordance with the standards of the Public Company Accounting Oversight Board (United States). Those standards require that we plan and perform the audit to obtain reasonable assurance about whether the financial statements are free of material misstatement. An audit includes examining, on a test basis, evidence supporting the amounts and disclosures in the financial statements, assessing the accounting principles used and significant estimates made by management, and evaluating the overall financial statement presentation. We believe that our audits, which included confirmation of securities at October 31, 2007 by correspondence with the custodian and brokers, provide a reasonable basis for our opinion.
/s/ PricewaterhouseCoopers LLP
PricewaterhouseCoopers LLP
Boston, Massachusetts
December 20, 2007
Annual Report
Trustees and Officers
The Trustees, Members of the Advisory Board, and executive officers of the trust and fund, as applicable, are listed below. The Board of Trustees governs the fund and is responsible for protecting the interests of shareholders. The Trustees are experienced executives who meet periodically throughout the year to oversee the fund's activities, review contractual arrangements with companies that provide services to the fund, and review the fund's performance. Except for James C. Curvey, each of the Trustees oversees 370 funds advised by FMR or an affiliate. Mr. Curvey oversees 340 funds advised by FMR or an affiliate.
The Trustees hold office without limit in time except that (a) any Trustee may resign; (b) any Trustee may be removed by written instrument, signed by at least two-thirds of the number of Trustees prior to such removal; (c) any Trustee who requests to be retired or who has become incapacitated by illness or injury may be retired by written instrument signed by a majority of the other Trustees; and (d) any Trustee may be removed at any special meeting of shareholders by a two-thirds vote of the outstanding voting securities of the trust. Each Trustee who is not an interested person (as defined in the 1940 Act) (Independent Trustee), shall retire not later than the last day of the calendar year in which his or her 72nd birthday occurs. The Independent Trustees may waive this mandatory retirement age policy with respect to individual Trustees. The executive officers and Advisory Board Members hold office without limit in time, except that any officer and Advisory Board Member may resign or may be removed by a vote of a majority of the Trustees at any regular meeting or any special meeting of the Trustees. Except as indicated, each individual has held the office shown or other offices in the same company for the past five years.
The fund's Statement of Additional Information (SAI) includes more information about the Trustees. To request a free copy, call Fidelity at 1-877-208-0098.
Interested Trustees*:
Correspondence intended for each Trustee who is an interested person may be sent to Fidelity Investments, 82 Devonshire Street, Boston, Massachusetts 02109.
Name, Age; Principal Occupation |
Edward C. Johnson 3d (77) |
| Year of Election or Appointment: 1983 Mr. Johnson is Chairman of the Board of Trustees. Mr. Johnson serves as President (2006-present), Chief Executive Officer, Chairman, and a Director of FMR LLC; Chairman and a Director of FMR; Chairman and a Director of Fidelity Research & Analysis Company (FRAC); Chairman and a Director of Fidelity Investments Money Management, Inc.; and Chairman (2001-present) and a Director of FMR Co., Inc. In addition, Mr. Johnson serves as Chairman and Director of Fidelity International Limited (FIL). |
James C. Curvey (72) |
| Year of Election or Appointment: 2007 Mr. Curvey also serves as Trustee (2007-present) or Member of the Advisory Board (2007-present) of other investment companies advised by FMR. Mr. Curvey is a Director of FMR and FMR Co., Inc. (2007-
present). Mr. Curvey is also Vice Chairman (2006-present) and Director of FMR LLC. Mr. Curvey joined Fidelity in 1982 and served in numerous senior management positions, including President and Chief Operating Officer of FMR LLC (1997-2000) and President of Fidelity Strategic Investments (2000-2002). In addition, he serves as a member of the Board of Directors of Geerlings & Wade, Inc. (wine distribution). |
* Trustees have been determined to be "Interested Trustees" by virtue of, among other things, their affiliation with the trust or various entities under common control with FMR. FMR Corp. merged with FMR LLC on October 1, 2007. Any references to FMR LLC for prior periods are deemed to be references to the prior entity.
Independent Trustees:
Correspondence intended for each Independent Trustee (that is, the Trustees other than the Interested Trustees) may be sent to Fidelity Investments, P.O. Box 55235, Boston, Massachusetts 02205-5235.
Name, Age; Principal Occupation |
Dennis J. Dirks (59) |
| Year of Election or Appointment: 2005 Prior to his retirement in May 2003, Mr. Dirks was Chief Operating Officer and a member of the Board of The Depository Trust & Clearing Corporation (DTCC) (1999-2003). He also served as President, Chief Operating Officer, and Board member of The Depository Trust Company (DTC) (1999-2003) and President and Board member of the National Securities Clearing Corporation (NSCC) (1999-2003). In addition, Mr. Dirks served as Chief Executive Officer and Board member of the Government Securities Clearing Corporation (2001-2003) and Chief Executive Officer and Board member of the Mortgage-Backed Securities Clearing Corporation (2001-2003). Mr. Dirks also serves as a Trustee and a member of the Finance Committee of Manhattan College (2005-present) and a Trustee and a member of the Finance Committee of AHRC of Nassau County (2006-present). |
Albert R. Gamper, Jr. (65) |
| Year of Election or Appointment: 2006 Prior to his retirement in December 2004, Mr. Gamper served as Chairman of the Board of CIT Group Inc. (commercial finance). During his tenure with CIT Group Inc. Mr. Gamper served in numerous senior management positions, including Chairman (1987-1989; 1999-2001; 2002-2004), Chief Executive Officer (1987-2004), and President (1989-2002). He currently serves as a member of the Board of Directors of Public Service Enterprise Group (utilities, 2001-present), Chairman of the Board of Governors, Rutgers University (2004-present), and Chairman of the Board of Saint Barnabas Health Care System. |
George H. Heilmeier (71) |
| Year of Election or Appointment: 2004 Dr. Heilmeier is Chairman Emeritus of Telcordia Technologies (communication software and systems), where prior to his retirement, he served as company Chairman and Chief Executive Officer. He currently serves on the Boards of Directors of The Mitre Corporation (systems engineering and information technology support for the government), and HRL Laboratories (private research and development, 2004-present). He is Chairman of the General Motors Science & Technology Advisory Board and a Life Fellow of the Institute of Electrical and Electronics Engineers (IEEE). Dr. Heilmeier is a member of the Defense Science Board and the National Security Agency Advisory Board. He is also a member of the National Academy of Engineering, the American Academy of Arts and Sciences, and the Board of Overseers of the School of Engineering and Applied Science of the University of Pennsylvania. Previously, Dr. Heilmeier served as a Director of TRW Inc. (automotive, space, defense, and information technology, 1992-2002), Compaq (1994-2002), Automatic Data Processing, Inc. (ADP) (technology-based business outsourcing, 1995-2002), INET Technologies Inc. (telecommunications network surveillance, 2001-2004), and Teletech Holdings (customer management services). He is the recipient of the 2005 Kyoto Prize in Advanced Technology for his invention of the liquid crystal display, and a member of the Consumer Electronics Hall of Fame. |
James H. Keyes (67) |
| Year of Election or Appointment: 2007 Prior to his retirement in 2003, Mr. Keyes was Chairman, President, and Chief Executive Officer of Johnson Controls, Inc. (automotive supplier, 1993-2003). He currently serves as a member of the boards of LSI Logic Corporation (semiconductor technologies), Navistar International Corporation (manufacture and sale of trucks, buses, and diesel engines, 2002-present), and Pitney Bowes, Inc. (integrated mail, messaging, and document management solutions). |
Marie L. Knowles (61) |
| Year of Election or Appointment: 2001 Prior to Ms. Knowles' retirement in June 2000, she served as Executive Vice President and Chief Financial Officer of Atlantic Richfield Company (ARCO) (diversified energy, 1996-2000). From 1993 to 1996, she was a Senior Vice President of ARCO and President of ARCO Transportation Company. She served as a Director of ARCO from 1996 to 1998. She currently serves as a Director of Phelps Dodge Corporation (copper mining and manufacturing) and McKesson Corporation (healthcare service, 2002-present). Ms. Knowles is a Trustee of the Brookings Institution and the Catalina Island Conservancy and also serves as a member of the Advisory Board for the School of Engineering of the University of Southern California. |
Ned C. Lautenbach (63) |
| Year of Election or Appointment: 2000 Mr. Lautenbach is Chairman of the Independent Trustees (2006-present). Mr. Lautenbach has been a partner of Clayton, Dubilier & Rice, Inc. (private equity investment firm) since September 1998. Previously, Mr. Lautenbach was with the International Business Machines Corporation (IBM) from 1968 until his retirement in 1998. Mr. Lautenbach serves as a Director of Sony Corporation (2006-present) and Eaton Corporation (diversified industrial) as well as the Philharmonic Center for the Arts in Naples, Florida. He also is a member of the Board of Trustees of Fairfield University (2005-present), as well as a member of the Council on Foreign Relations. |
Cornelia M. Small (63) |
| Year of Election or Appointment: 2005 Ms. Small is a member (2000-present) and Chairperson (2002-present) of the Investment Committee, and a member (2002-present) of the Board of Trustees of Smith College. Previously, she served as Chief Investment Officer (1999-2000), Director of Global Equity Investments (1996-1999), and a member of the Board of Directors of Scudder, Stevens & Clark (1990-1997) and Scudder Kemper Investments (1997-1999). In addition, Ms. Small served as Co-Chair (2000-2003) of the Annual Fund for the Fletcher School of Law and Diplomacy. |
William S. Stavropoulos (68) |
| Year of Election or Appointment: 2001 Mr. Stavropoulos is Chairman Emeritus of the Board of Directors of The Dow Chemical Company. Since joining The Dow Chemical Company in 1967, Mr. Stavropoulos served in numerous senior management positions, including President (1993-2000; 2002-2003), CEO (1995-2000; 2002-2004), and Chairman of the Executive Committee (2000-2004). Currently, he is a Director of NCR Corporation (data warehousing and technology solutions), Chemical Financial Corporation, Maersk Inc. (industrial conglomerate, 2002-present), Tyco International, Inc. (multinational manufacturing and services, 2007-present), and a member of the Advisory Board for Metalmark Capital (private equity investment firm, 2005-present). He is a special advisor to Clayton, Dubilier & Rice, Inc., a private equity investment firm. He also serves as a member of the Board of Trustees of the American Enterprise Institute for Public Policy Research. In addition, Mr. Stavropoulos is a member of The Business Council, J.P. Morgan International Council and the University of Notre Dame Advisory Council for the College of Science. |
Kenneth L. Wolfe (68) |
| Year of Election or Appointment: 2005 Prior to his retirement in 2001, Mr. Wolfe was Chairman and Chief Executive Officer of Hershey Foods Corporation (1993-2001). He currently serves as a member of the boards of Adelphia Communications Corporation (2003-present), Bausch & Lomb, Inc., and Revlon Inc. (2004-present). |
Advisory Board Members and Executive Officers**:
Correspondence intended for Mr. Mauriello, Mr. Thomas, and Mr. Wiley may be sent to Fidelity Investments, P.O. Box 55235, Boston, Massachusetts 02205-5235. Correspondence intended for each executive officer and Mr. Lynch may be sent to Fidelity Investments, 82 Devonshire Street, Boston, Massachusetts 02109.
Name, Age; Principal Occupation |
Peter S. Lynch (63) |
| Year of Election or Appointment: 2003 Member of the Advisory Board of Fidelity Advisor Series VIII. Mr. Lynch is Vice Chairman and a Director of FMR, and Vice Chairman (2001-present) and a Director of FMR Co., Inc. Previously, Mr. Lynch served as a Trustee of the Fidelity funds (1990-2003). In addition, he serves as a Trustee of Boston College and as the Chairman of the Inner-City Scholarship Fund. |
Joseph Mauriello (63) |
| Year of Election or Appointment: 2007 Member of the Advisory Board of Fidelity Advisor Series VIII. Prior to his retirement in January 2006, Mr. Mauriello served in numerous senior management positions including Deputy Chairman and Chief Operating Officer (2004-2005), and Vice Chairman of Financial Services (2002-2004) of KPMG LLP US (professional services firm, 1965-2005). Mr. Mauriello currently serves as a member of the Board of Directors of XL Capital Ltd., (global insurance and re-insurance company, 2006-present) and of Arcadia Resources Inc., (health care services and products, 2007-present). He also served as a Director of the Hamilton Funds of the Bank of New York (2006-2007). |
David M. Thomas (58) |
| Year of Election or Appointment: 2007 Member of the Advisory Board of Fidelity Advisor Series VIII. Previously, Mr. Thomas served as Executive Chairman (2005-2006) and Chairman and Chief Executive Officer (2000-2005) of IMS Health, Inc. (pharmaceutical and healthcare information solutions). In addition, Mr. Thomas serves as a member of the Board of Directors of Fortune Brands, Inc. (consumer products holding company), and Interpublic Group of Companies, Inc. (marketing communication, 2004-present). |
Michael E. Wiley (57) |
| Year of Election or Appointment: 2007 Member of the Advisory Board of Fidelity Advisor Series VIII. Mr. Wiley also serves as Sr. Energy Advisor of Katzenbach Partners, LLC (consulting firm, 2006-present) and a member of the Board of Trustees of the University of Tulsa (2000-2006; 2007-present). He serves as a Director of Tesoro Corporation (independent oil refiner and marketer, 2005-
present), and a Director of Bill Barrett Corporation (exploration and production company, 2005-present). In addition, he also serves as a Director of Post Oak Bank (privately-held bank, 2004-present), and an Advisory Director of Riverstone Holdings (private investment firm). Previously, Mr. Wiley served as Chairman, President, and CEO of Baker Hughes, Inc. (oilfield services company, 2000-2004), and as Director of Spinnaker Exploration Company (exploration and production company, 2001-2005). |
Kimberley H. Monasterio (43) |
| Year of Election or Appointment: 2007 President and Treasurer of Advisor Value Leaders. Ms. Monasterio also serves as President and Treasurer of other Fidelity funds (2007-present) and is an employee of FMR (2004-present). Previously, Ms. Monasterio served as Deputy Treasurer of the Fidelity funds (2004-2006). Before joining Fidelity Investments, Ms. Monasterio served as Treasurer (2000-2004) and Chief Financial Officer (2002-2004) of the Franklin Templeton Funds and Senior Vice President of Franklin Templeton Services, LLC (2000-2004). |
Walter C. Donovan (45) |
| Year of Election or Appointment: 2007 Vice President of Advisor Value Leaders. Mr. Donovan also serves as Vice President of Fidelity's Equity Funds (2007-present). Mr. Donovan also serves as Executive Vice President of FMR (2005-present) and FMR Co., Inc. (2005-present). Previously, Mr. Donovan served as Vice President of Fidelity's High Income Funds (2005-2007), Fixed-Income Funds (2005-2006), certain Asset Allocation Funds (2005-2006), certain Balanced Funds (2005-2006), and as Vice President and Director of Fidelity's International Equity Trading group (1998-2005). |
Bruce T. Herring (42) |
| Year of Election or Appointment: 2006 Vice President of Advisor Value Leaders. Mr. Herring also serves as Vice President of certain Equity Funds (2006-present). Mr. Herring is Senior Vice President of FMR (2006-present) and Vice President of FMR Co., Inc. (2001-present). Previously, Mr. Herring served as a portfolio manager for Fidelity U.S. Equity Funds (2001-2005). |
Eric D. Roiter (58) |
| Year of Election or Appointment: 2003 Secretary of Advisor Value Leaders. He also serves as Secretary of other Fidelity funds; Vice President, General Counsel, and Secretary of FMR Co., Inc. (2001-present) and FMR; Assistant Secretary of Fidelity Management & Research (U.K.) Inc. (2001-present), Fidelity Research & Analysis Company (2001-present), and Fidelity Investments Money Management, Inc. (2001-present). Mr. Roiter is an Adjunct Member, Faculty of Law, at Boston College Law School (2003-present). Previously, Mr. Roiter served as Vice President and Secretary of Fidelity Distributors Corporation (FDC) (1998-2005). |
Scott C. Goebel (39) |
| Year of Election or Appointment: 2007 Assistant Secretary of Advisor Value Leaders. Mr. Goebel also serves as Assistant Secretary of other Fidelity funds (2007-present), and is an employee of FMR. |
R. Stephen Ganis (41) |
| Year of Election or Appointment: 2006 Anti-Money Laundering (AML) officer of Advisor Value Leaders. Mr. Ganis also serves as AML officer of other Fidelity funds (2006-present) and FMR LLC (2003-present). Before joining Fidelity Investments, Mr. Ganis practiced law at Goodwin Procter, LLP (2000-2002). |
Joseph B. Hollis (59) |
| Year of Election or Appointment: 2006 Chief Financial Officer of Advisor Value Leaders. Mr. Hollis also serves as Chief Financial Officer of other Fidelity funds. Mr. Hollis is President of Fidelity Pricing and Cash Management Services (FPCMS) (2005-
present). Mr. Hollis also serves as President and Director of Fidelity Service Company, Inc. (2006-present). Previously, Mr. Hollis served as Senior Vice President of Cash Management Services (1999-2002) and Investment Management Operations (2002-2005). |
Kenneth A. Rathgeber (60) |
| Year of Election or Appointment: 2004 Chief Compliance Officer of Advisor Value Leaders. Mr. Rathgeber also serves as Chief Compliance Officer of other Fidelity funds (2004-
present) and Executive Vice President of Risk Oversight for Fidelity Investments (2002-present). He is Chief Compliance Officer of FMR (2005-present), FMR Co., Inc. (2005-present), Fidelity Management & Research (U.K.) Inc. (2005-present), Fidelity Research & Analysis Company (2005-present), Fidelity Investments Money Management, Inc. (2005-present), and Strategic Advisers, Inc. (2005-present). Previously, Mr. Rathgeber served as Executive Vice President and Chief Operating Officer for Fidelity Investments Institutional Services Company, Inc. (1998-2002). |
Bryan A. Mehrmann (46) |
| Year of Election or Appointment: 2005 Deputy Treasurer of Advisor Value Leaders. Mr. Mehrmann also serves as Deputy Treasurer of other Fidelity funds (2005-present) and is an employee of FMR. Previously, Mr. Mehrmann served as Vice President of Fidelity Investments Institutional Services Group (FIIS)/Fidelity Investments Institutional Operations Corporation, Inc. (FIIOC) Client Services (1998-2004). |
Kenneth B. Robins (38) |
| Year of Election or Appointment: 2005 Deputy Treasurer of Advisor Value Leaders. Mr. Robins also serves as Deputy Treasurer of other Fidelity funds (2005-present) and is an employee of FMR (2004-present). Before joining Fidelity Investments, Mr. Robins worked at KPMG LLP, where he was a partner in KPMG's department of professional practice (2002-2004) and a Senior Manager (1999-2000). In addition, Mr. Robins served as Assistant Chief Accountant, United States Securities and Exchange Commission (2000-2002). |
Robert G. Byrnes (40) |
| Year of Election or Appointment: 2005 Assistant Treasurer of Advisor Value Leaders. Mr. Byrnes also serves as Assistant Treasurer of other Fidelity funds (2005-present) and is an employee of FMR (2005-present). Previously, Mr. Byrnes served as Vice President of FPCMS (2003-2005). Before joining Fidelity Investments, Mr. Byrnes worked at Deutsche Asset Management where he served as Vice President of the Investment Operations Group (2000-2003). |
Peter L. Lydecker (53) |
| Year of Election or Appointment: 2004 Assistant Treasurer of Advisor Value Leaders. Mr. Lydecker also serves as Assistant Treasurer of other Fidelity funds (2004) and is an employee of FMR. |
Paul M. Murphy (60) |
| Year of Election or Appointment: 2007 Assistant Treasurer of Advisor Value Leaders. Mr. Murphy also serves as Assistant Treasurer of other Fidelity funds (2007-present) and is an employee of FMR (2007-present). Previously, Mr. Murphy served as Chief Financial Officer of the Fidelity Funds (2005-2006), Vice President and Associate General Counsel of FMR (2007), and Senior Vice President of Fidelity Pricing and Cash Management Services Group (FPCMS) (1994-2007). |
Gary W. Ryan (49) |
| Year of Election or Appointment: 2005 Assistant Treasurer of Advisor Value Leaders. Mr. Ryan also serves as Assistant Treasurer of other Fidelity funds (2005-present) and is an employee of FMR (2005-present). Previously, Mr. Ryan served as Vice President of Fund Reporting in FPCMS (1999-2005). |
** FMR Corp. merged with FMR LLC on October 1, 2007. Any references to FMR LLC for prior periods are deemed to be references to the prior entity.
Annual Report
Distributions
The Board of Trustees of Advisor Value Leaders Fund voted to pay to shareholders of record at the opening of business on record date, the following distributions per share derived from capital gains realized from sales of portfolio securities, and dividends derived from net investment income:
| Pay Date | Record Date | Dividends | Capital Gains |
Institutional Class | 12/10/07 | 12/07/07 | $.154 | $.722 |
The fund hereby designates as a capital gain dividend with respect to the taxable year ended October 31, 2007 $4,228,830, or, if subsequently determined to be different, the net capital gain of such year.
Institutional Class designates 100% of the dividends distributed in December 2006 as indicated in the Corporate Qualifying memo distributed by the Tax department during the fiscal year as qualifying for the dividends-received deduction for corporate shareholders.
Institutional Class designates 100% of the dividends distributed during the fiscal year as amounts which may be taken into account as a dividend for purposes of the maximum rate under section 1(h)(11) of the Internal Revenue Code.
The fund will notify shareholders in January 2008 of amounts for use in preparing 2007 income tax returns.
Annual Report
Proxy Voting Results
A special meeting of the fund's shareholders was held on May 16, 2007. The results of votes taken among shareholders on the proposal before them are reported below. Each vote reported represents one dollar of net asset value held on the record date for the meeting.
PROPOSAL 5 |
To approve an amended management contract that includes adding a performance adjustment component to the management fee for Fidelity Advisor Value Leaders Fund and giving the Trustees the authority to change the fund's performance adjustment index going forward, without shareholder vote, subject to applicable law. |
| # of
Votes | % of
Votes |
Affirmative | 38,960,236.61 | 76.714 |
Against | 9,114,994.43 | 17.947 |
Abstain | 2,711,252.32 | 5.339 |
TOTAL | 50,786,483.36 | 100.000 |
Annual Report
Board Approval of Investment Advisory Contracts and Management Fees
Advisor Value Leaders Fund
Each year, typically in July, the Board of Trustees, including the Independent Trustees (together, the Board), votes on the renewal of the management contract and sub-advisory agreements (together, the Advisory Contracts) for the fund. The Board, assisted by the advice of fund counsel and Independent Trustees' counsel, requests and considers a broad range of information throughout the year.
The Board meets regularly each month except August and takes into account throughout the year matters bearing on Advisory Contracts. The Board, acting directly and through its separate committees, considers at each of its meetings factors that are relevant to the annual renewal of the fund's Advisory Contracts, including the services and support provided to the fund and its shareholders. At the time of the renewal, the Board had 12 standing committees, each composed of Independent Trustees with varying backgrounds, to which the Board has assigned specific subject matter responsibilities in order to enhance effective decision-making by the Board. Each committee has adopted a written charter outlining the structure and purposes of the committee. One such committee, the Equity Contract Committee, meets periodically as needed throughout the year to consider matters specifically related to the annual renewal of Advisory Contracts. The committee requests and receives information on, and makes recommendations to the Independent Trustees concerning, the approval and annual review of the Advisory Contracts.
At its July 2007 meeting, the Board of Trustees, including the Independent Trustees, unanimously determined to renew the Advisory Contracts for the fund. In reaching its determination, the Board considered all factors it believed relevant, including (i) the nature, extent, and quality of the services to be provided to the fund and its shareholders (including the investment performance of the fund); (ii) the competitiveness of the management fee and total expenses of the fund; (iii) the total costs of the services to be provided by and the profits to be realized by the investment adviser and its affiliates from the relationship with the fund; (iv) the extent to which economies of scale would be realized as the fund grows; and (v) whether fee levels reflect these economies of scale, if any, for the benefit of fund shareholders. The Board also approved amendments to the fund's agreements with foreign sub-advisers to clarify that each sub-adviser provides services as an independent contractor.
In determining whether to renew the Advisory Contracts for the fund, the Board ultimately reached a determination, with the assistance of fund counsel and Independent Trustees' counsel, that the renewal of the Advisory Contracts and the compensation to be received by Fidelity under the management contract is consistent with Fidelity's fiduciary duty under applicable law. In addition to evaluating the specific factors noted above, the Board, in reaching its determination, is aware that shareholders in the fund have a broad range of investment choices available to them, including a wide choice among mutual funds offered by competitors to Fidelity, and that the fund's shareholders, with the opportunity to review and weigh the disclosure provided by the fund in its prospectus and other public disclosures, have chosen to invest in this fund, managed by Fidelity.
Annual Report
Board Approval of Investment Advisory Contracts and
Management Fees - continued
Nature, Extent, and Quality of Services Provided. The Board considered staffing within the investment adviser, FMR, and the sub-advisers (together, the Investment Advisers), including the background of the fund's portfolio manager and the fund's investment objective and discipline. The Independent Trustees also had discussions with senior management of Fidelity's investment operations and investment groups. The Board considered the structure of the portfolio manager compensation program and whether this structure provides appropriate incentives.
Resources Dedicated to Investment Management and Support Services. The Board reviewed the size, education, and experience of the Investment Advisers' investment staff, their use of technology, and the Investment Advisers' approach to recruiting, training, and retaining portfolio managers and other research, advisory, and management personnel. The Board considered Fidelity's extensive global research capabilities that enable the Investment Advisers to aggregate data from various sources in an effort to produce positive investment results. The Board noted that Fidelity's analysts have access to a variety of technological tools that enable them to perform both fundamental and quantitative analysis and to specialize in various disciplines. The Board also considered that Fidelity's portfolio managers and analysts have access to daily portfolio attribution that allows for monitoring of a fund's portfolio, as well as an electronic communication system that provides immediate real-time access to research concerning issuers and credit enhancers.
Shareholder and Administrative Services. The Board considered (i) the nature, extent, quality, and cost of advisory administrative, distribution, and shareholder services performed by the Investment Advisers and their affiliates under the Advisory Contracts and under separate agreements covering transfer agency, pricing and bookkeeping, and securities lending services for the fund; (ii) the nature and extent of the Investment Advisers' supervision of third party service providers, principally custodians and subcustodians; and (iii) the resources devoted to, and the record of compliance with, the fund's compliance policies and procedures. The Board reviewed the allocation of fund brokerage, including allocations to brokers affiliated with the Investment Advisers, the use of brokerage commissions to pay fund expenses, and the use of "soft" commission dollars to pay for research services. The Board also considered that Fidelity voluntarily pays for market data out of its own resources. The Board also considered the agreement reached between the Independent Trustees and Fidelity in December 2006 following an independent review of matters relating to receipt of travel, entertainment, gifts and gratuities in violation of Fidelity policies.
Annual Report
The Board noted that the growth of fund assets across the complex allows Fidelity to reinvest in the development of services designed to enhance the value or convenience of the Fidelity funds as investment vehicles. These services include 24-hour access to account information and market information through phone representatives and over the Internet, and investor education materials and asset allocation tools.
Investment in a Large Fund Family. The Board considered the benefits to shareholders of investing in a Fidelity fund, including the benefits of investing in a fund that is part of a large family of funds offering a variety of investment disciplines and providing for a large variety of mutual fund investor services. For example, fund shareholders are offered the privilege of exchanging shares of the fund for shares of other Fidelity funds, as set forth in the fund's prospectus, without paying a sales charge. The Board noted that, since the last Advisory Contract renewals in July 2006, Fidelity has taken a number of actions that benefited particular funds, including (i) dedicating additional resources to investment research and to restructure the investment research teams; (ii) contractually agreeing to reduce the management fee on Fidelity Advisor Floating Rate High Income Fund; (iii) contractually agreeing to reduce the management fees on Fidelity's California, Massachusetts, New Jersey, and New York AMT Tax-Free Money Market Funds, launching new Institutional Classes and Service Classes of these funds, and contractually agreeing to impose expense limitations on these funds; (iv) eliminating the exchange fee on the Fidelity Select Portfolios and reducing the pricing and bookkeeping fee rates for these funds; (v) reducing the maximum transfer agency fee rates on high income funds and certain equity funds; (vi) proposing amended management contracts that, if approved by shareholders, will add a performance adjustment component to the management fees paid by 18 Fidelity Advisor equity funds; (vii) contractually agreeing to reduce fees for Ultra-Short Central Fund and the money market Central Funds; (viii) waiving the Fidelity Advisor funds' contingent deferred sales charge on certain redemptions made through systematic withdrawal programs; and (ix) amending the management contracts for equity and fixed-income funds whose management contracts incorporate a "group fee" structure by adding four new fee "breakpoints" to the group fee rate schedules.
Investment Performance and Compliance. The Board considered whether the fund has operated within its investment objective, as well as its record of compliance with its investment restrictions. It also reviewed the fund's absolute investment performance for each class, as well as the fund's relative investment performance for each class measured against (i) a broad-based securities market index, and (ii) a peer group of mutual funds deemed appropriate by the Board over multiple periods. Because the fund had been in existence less than five calendar years, the following charts considered by the Board show, over the one- and three-year periods ended December 31, 2006, the cumulative total returns of Institutional Class (Class I) and Class B of the fund, the cumulative total returns of a broad-based securities market index ("benchmark"), and a range of cumulative total returns of a peer group of mutual funds identified by Morningstar, Inc. as having an investment style similar to that of the fund based on underlying portfolio holdings. The returns of Institutional Class (Class I) and Class B show the performance of the highest and lowest performing classes, respectively (based on three-year performance). The box within each chart shows the 25th percentile return (bottom of box) and the 75th percentile return (top of box) of the peer group. Returns shown above the box are in the first quartile and returns shown below the box are in the fourth quartile. The percentage beaten numbers noted below each chart correspond to the percentile box and represent the percentage of funds in the peer group whose performance was equal to or lower than that of the class indicated.
Annual Report
Board Approval of Investment Advisory Contracts and
Management Fees - continued
Advisor Value Leaders Fund

The Board reviewed the fund's relative investment performance against its peer group and stated that the performance of Institutional Class (Class I) of the fund was in the fourth quartile for the one-year period and the second quartile for the three-year period. The Board also stated that the investment performance of the fund was lower than its benchmark for all the periods shown. The Board considered that the variations in performance among the fund's classes reflect the variations in class expenses, which result in lower performance for higher expense classes.
The Board considered that FMR has taken steps to refocus and strengthen equity research, equity portfolio management, and compliance.
Based on its review, and giving particular weight to the nature and quality of the resources dedicated by the Investment Advisers to maintain and improve relative performance, the Board concluded that the nature, extent, and quality of the services provided to the fund will benefit the fund's shareholders, particularly in light of the Board's view that the fund's shareholders benefit from investing in a fund that is part of a large family of funds offering a variety of investment disciplines and services.
Annual Report
Competitiveness of Management Fee and Total Fund Expenses. The Board considered the fund's management fee and total expenses compared to "mapped groups" of competitive funds and classes. Fidelity creates "mapped groups" by combining similar Lipper investment objective categories that have comparable management fee characteristics. Combining Lipper investment objective categories aids the Board's management fee and total expense comparisons by broadening the competitive group used for comparison and by reducing the number of universes to which various Fidelity funds are compared. The Board also considered supplemental information about how the fund's management fee and total expenses ranked relative to groups based on Lipper classifications, which take into account a fund's market capitalization and style.
The Board considered two proprietary management fee comparisons for the 12-month (or shorter) periods shown in the chart below. The group of Lipper funds used by the Board for management fee comparisons is referred to below as the "Total Mapped Group." The Total Mapped Group comparison focuses on a fund's standing relative to the total universe of comparable funds available to investors, in terms of gross management fees before expense reimbursements or caps. "TMG %" represents the percentage of funds in the Total Mapped Group that had management fees that were lower than the fund's. For example, a TMG % of 9% means that 91% of the funds in the Total Mapped Group had higher management fees than the fund. The "Asset-Size Peer Group" (ASPG) comparison focuses on a fund's standing relative to non-Fidelity funds similar in size to the fund within the Total Mapped Group. The ASPG represents at least 15% of the funds in the Total Mapped Group with comparable asset size and management fee characteristics, subject to a minimum of 50 funds (or all funds in the Total Mapped Group if fewer than 50). Additional information, such as the ASPG quartile in which the fund's management fee ranked, is also included in the chart and considered by the Board.
Annual Report
Board Approval of Investment Advisory Contracts and
Management Fees - continued
Advisor Value Leaders Fund
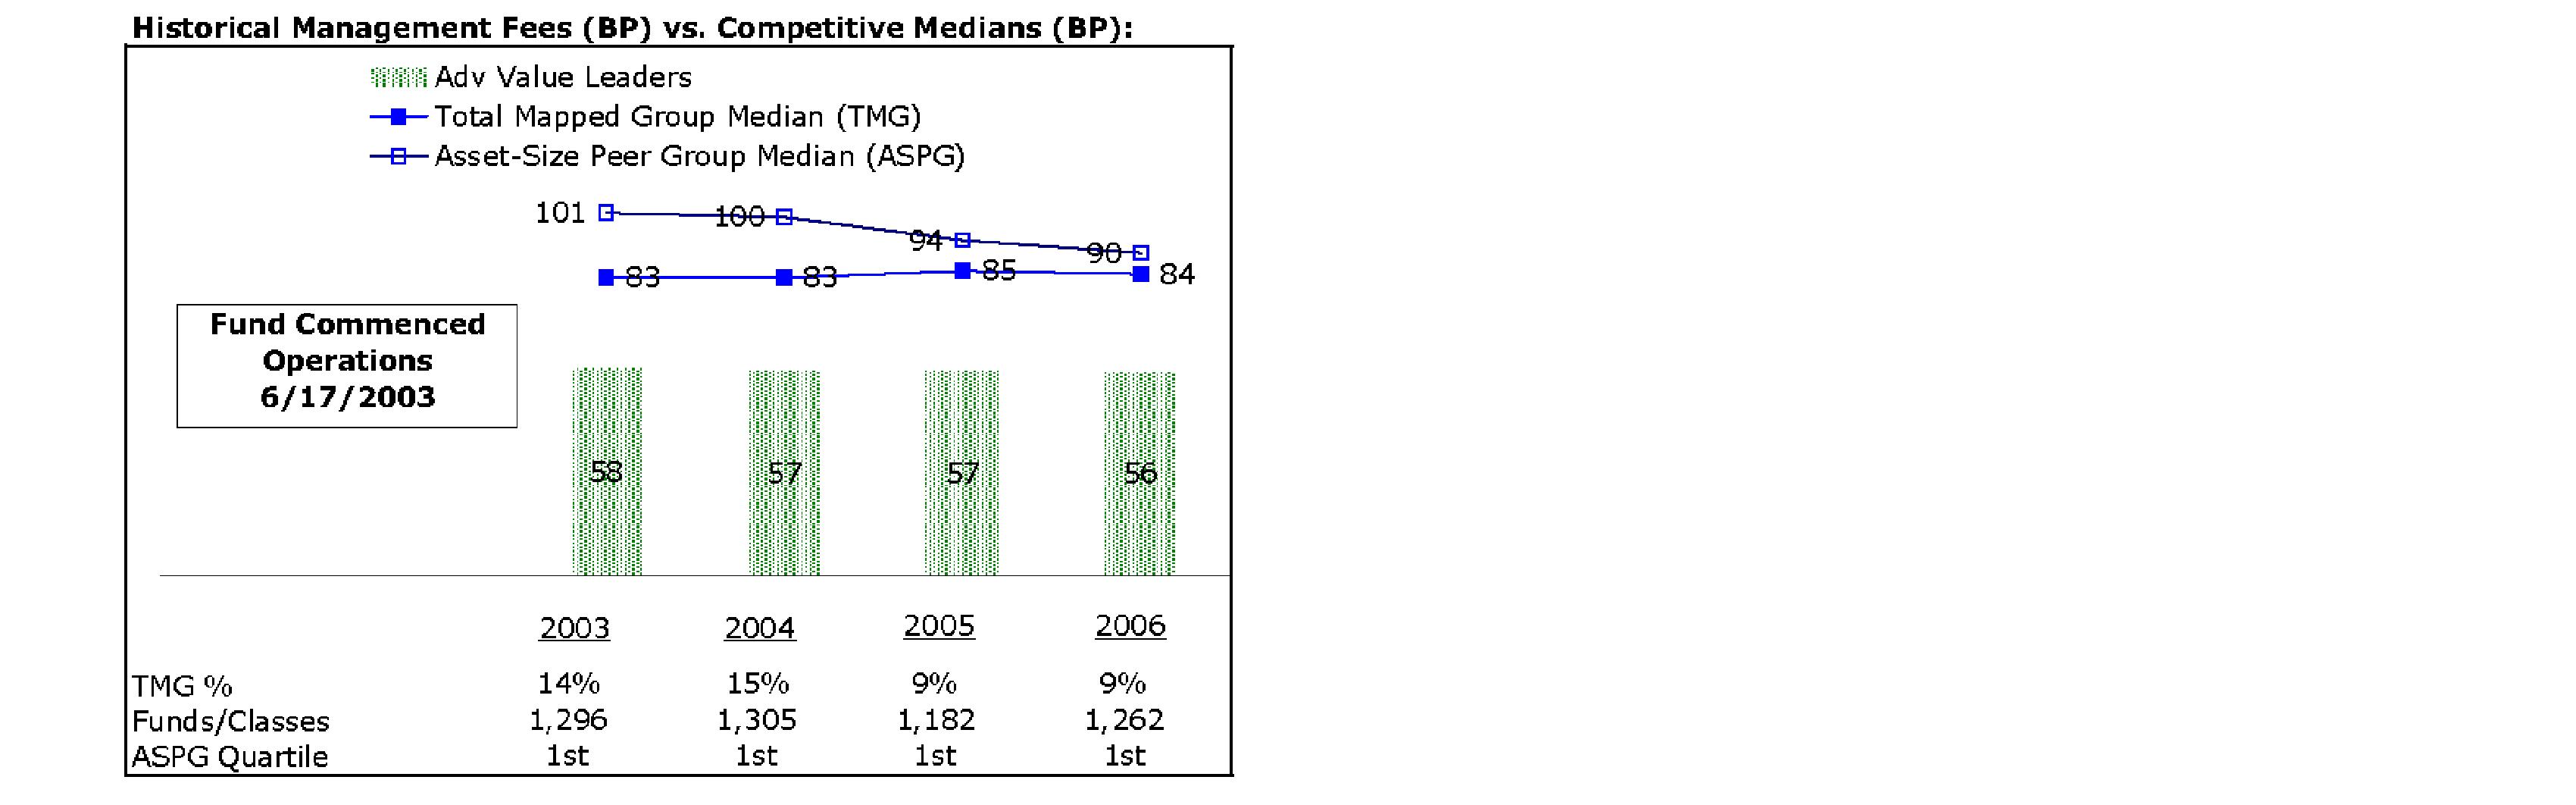
The Board noted that the fund's management fee ranked below the median of its Total Mapped Group and below the median of its ASPG for 2006.
Furthermore, the Board considered that, on May 16, 2007, after the periods shown in the chart above, shareholders approved an amended management contract for the fund that will add a performance adjustment component to the management fee paid by the fund (that is, the fund's management fee will be subject to upward or downward adjustment depending upon whether, and to what extent, the fund's investment performance for the performance period exceeds, or is exceeded by, the record (over the same period) of a Board-approved performance adjustment index). The performance period for the fund commenced on June 1, 2007. Starting with the twelfth month, the performance adjustment takes effect.
Based on its review, the Board concluded that the fund's management fee was fair and reasonable in light of the services that the fund receives and the other factors considered.
In its review of each class's total expenses, the Board considered the fund's management fee as well as other fund or class expenses, as applicable, such as transfer agent fees, pricing and bookkeeping fees, fund-paid 12b-1 fees, and custodial, legal, and audit fees. The Board also noted the effects of any waivers and reimbursements on fees and expenses. As part of its review, the Board also considered current and historical total expenses of each class of the fund compared to competitive fund median expenses. Each class of the fund is compared to those funds and classes in the Total Mapped Group (used by the Board for management fee comparisons) that have a similar sales load structure.
Annual Report
The Board noted that the total expenses of each of Class A, Class B, Class C, and Institutional Class ranked below its competitive median for 2006, and the total expenses of Class T ranked above its competitive median for 2006. The Board noted that the fund offers multiple classes, each of which has a different sales load and 12b-1 fee structure, and that the multiple structures are intended to offer a range of pricing options for the intermediary market. The Board also noted that the total expenses of the classes vary primarily by the level of their 12b-1 fees, although differences in transfer agent fees may also cause expenses to vary from class to class.
In its review of total expenses, the Board also considered Fidelity fee structures and other information on clients that FMR and its affiliates service in other competitive markets, such as other mutual funds advised or subadvised by FMR or its affiliates, pension plan clients, and other institutional clients.
Based on its review, the Board concluded that the total expenses of each class of the fund were reasonable, although in one case above the median of the universe presented for comparison, in light of the services that the fund and its shareholders receive and the other factors considered.
Costs of the Services and Profitability. The Board considered the revenues earned and the expenses incurred by Fidelity in conducting the business of developing, marketing, distributing, managing, administering and servicing the fund and its shareholders. The Board also considered the level of Fidelity's profits in respect of all the Fidelity funds.
On an annual basis, FMR presents to the Board Fidelity's profitability for the fund. Fidelity calculates the profitability for each fund, as well as aggregate profitability for groups of Fidelity funds and all Fidelity funds, using a series of detailed revenue and cost allocation methodologies which originate with the audited books and records of Fidelity. The Audit Committee of the Board reviews any significant changes from the prior year's methodologies.
PricewaterhouseCoopers LLP (PwC), independent registered public accounting firm and auditor to Fidelity and certain Fidelity funds, has been engaged annually by the Board as part of the Board's assessment of the results of Fidelity's profitability analysis. PwC's engagement includes the review and assessment of Fidelity's methodologies used in determining the revenues and expenses attributable to Fidelity's mutual fund business, and completion of agreed-upon procedures surrounding the mathematical accuracy of fund profitability and its conformity to allocation methodologies. After considering PwC's reports issued under the engagement and information provided by Fidelity, the Board believes that while other allocation methods may also be reasonable, Fidelity's profitability methodologies are reasonable in all material respects.
Annual Report
Board Approval of Investment Advisory Contracts and
Management Fees - continued
The Board has also reviewed Fidelity's non-fund businesses and any fall-out benefits related to the mutual fund business as well as cases where Fidelity's affiliates may benefit from or be related to the fund's business.
The Board considered the costs of the services provided by and the profits realized by Fidelity in connection with the operation of the fund and determined that the amount of profit is a fair entrepreneurial profit for the management of the fund.
Economies of Scale. The Board considered whether there have been economies of scale in respect of the management of the Fidelity funds, whether the Fidelity funds (including the fund) have appropriately benefited from any such economies of scale, and whether there is potential for realization of any further economies of scale. The Board considered the extent to which the fund will benefit from economies of scale through increased services to the fund, through waivers or reimbursements, or through fee or expense reductions, including reductions that occur through operation of the transfer agent agreement. The transfer agent fee varies in part based on the number of accounts in the fund. If the number of accounts decreases or the average account size increases, the overall transfer agent fee rate decreases.
The Board recognized that the fund's management contract incorporates a "group fee" structure, which provides for lower group fee rates as total fund assets under FMR's management increase, and for higher group fee rates as total fund assets under FMR's management decrease. FMR determines the group fee rates based on a tiered asset "breakpoint" schedule. In connection with the renewal of the fund's management contract, the Board approved amendments to the fund's management contract that added four new fee breakpoints to the group fee rate schedule for assets under FMR's management above $1,386 billion. The Board considered that the group fee rate declines under both the present and amended schedules, but that under the amended schedule, the group fee rate declines faster as assets under FMR's management exceed $1,386 billion. The Board considered that the group fee is designed to deliver the benefits of economies of scale to fund shareholders when total fund assets increase, even if assets of any particular fund are unchanged or have declined, because some portion of Fidelity's costs are attributable to services provided to all Fidelity funds, and all funds benefit if those costs can be allocated among more assets. The Board concluded that, given the group fee structure, fund shareholders will achieve a certain level of economies of scale as assets under FMR's management increase at the fund complex level, regardless of whether Fidelity achieves any such economies of scale.
The Board further concluded that any potential economies of scale are being shared between fund shareholders and Fidelity in an appropriate manner.
Additional Information Requested by the Board. In order to develop fully the factual basis for consideration of the Fidelity funds' Advisory Contracts, the Board requested and received additional information on several topics, including (i) fund performance trends and actions to be taken by FMR to improve certain funds' overall performance; (ii) Fidelity's portfolio manager compensation structure, including its effects on fund profitability and the extent to which portfolio manager compensation is linked to fund performance; (iii) Fidelity's fee structures; (iv) the funds' sub-advisory arrangements; and (v) accounts managed by Fidelity other than the Fidelity funds.
Annual Report
Based on its evaluation of all of the conclusions noted above, and after considering all material factors, the Board ultimately concluded that the advisory fee structures are fair and reasonable, and that the fund's Advisory Contracts should be renewed.
Annual Report
Investment Adviser
Fidelity Management & Research Company
Boston, MA
Investment Sub-Advisers
FMR Co., Inc.
Fidelity Management & Research
(U.K.) Inc.
Fidelity Research & Analysis Company
Fidelity International
Investment Advisors
Fidelity Investments Japan Limited
Fidelity International Investment Advisors (U.K.) Limited
General Distributor
Fidelity Distributors Corporation
Boston, MA
Transfer and Service Agents
Fidelity Investments Institutional Operations Company, Inc.
Boston, MA
Fidelity Service Company, Inc.
Boston, MA
Custodian
Brown Brothers Harriman & Company
Boston, MA
AVLFI-UANN-1207
1.793580.104
(Fidelity Investment logo)(registered trademark)
Item 2. Code of Ethics
As of the end of the period, October 31, 2007, Fidelity Advisor Series VIII (the trust) has adopted a code of ethics, as defined in Item 2 of Form N-CSR, that applies to its President and Treasurer and its Chief Financial Officer. A copy of the code of ethics is filed as an exhibit to this Form N-CSR.
Item 3. Audit Committee Financial Expert
The Board of Trustees of the trust has determined that Marie L. Knowles is an audit committee financial expert, as defined in Item 3 of Form N-CSR. Ms. Knowles is independent for purposes of Item 3 of Form N-CSR.
Item 4. Principal Accountant Fees and Services
(a) Audit Fees.
For the fiscal years ended October 31, 2007 and October 31, 2006, the aggregate Audit Fees billed by PricewaterhouseCoopers LLP (PwC) for professional services rendered for the audits of the financial statements, or services that are normally provided in connection with statutory and regulatory filings or engagements for those fiscal years, for Fidelity Advisor Diversified International Fund, Fidelity Advisor Emerging Asia Fund, Fidelity Advisor Global Capital Appreciation Fund, Fidelity Advisor Japan Fund, Fidelity Advisor Korea Fund, Fidelity Advisor Latin America Fund, Fidelity Advisor Overseas Fund and Fidelity Advisor Value Leaders Fund (the funds) and for all funds in the Fidelity Group of Funds are shown in the table below.
Fund | 2007A | 2006A |
Fidelity Advisor Diversified International Fund | $98,000 | $80,000 |
Fidelity Advisor Emerging Asia Fund | $86,000 | $82,000 |
Fidelity Advisor Global Capital Appreciation Fund | $42,000 | $40,000 |
Fidelity Advisor Japan Fund | $45,000 | $43,000 |
Fidelity Advisor Korea Fund | $92,000 | $84,000 |
Fidelity Advisor Latin America Fund | $45,000 | $43,000 |
Fidelity Advisor Overseas Fund | $69,000 | $66,000 |
Fidelity Advisor Value Leaders Fund | $39,000 | $38,000 |
All funds in the Fidelity Group of Funds audited by PwC | $14,400,000 | $13,400,000 |
A | Aggregate amounts may reflect rounding. |
For the fiscal years ended October 31, 2007 and October 31, 2006, the aggregate Audit Fees billed by Deloitte & Touche LLP, the member firms of Deloitte Touche Tohmatsu, and their respective affiliates (collectively, "Deloitte Entities") for professional services rendered for the audits of the financial statements, or services that are normally provided in connection with statutory and regulatory filings or engagements for those fiscal years, for Fidelity Advisor Emerging Markets Fund, Fidelity Advisor Europe Capital Appreciation Fund and Fidelity Advisor International Capital Appreciation Fund (the funds) and for all funds in the Fidelity Group of Funds are shown in the table below.
Fund | 2007A | 2006A |
Fidelity Advisor Emerging Markets Fund | $43,000 | $38,000 |
Fidelity Advisor Europe Capital Appreciation Fund | $39,000 | $35,000 |
Fidelity Advisor International Capital Appreciation Fund | $51,000 | $35,000 |
All funds in the Fidelity Group of Funds audited by Deloitte Entities | $7,300,000 | $6,500,000 |
A | Aggregate amounts may reflect rounding. |
(b) Audit-Related Fees.
In each of the fiscal years ended October 31, 2007 and October 31, 2006, the aggregate Audit-Related Fees billed by PwC for services rendered for assurance and related services to each fund that are reasonably related to the performance of the audit or review of the fund's financial statements, but not reported as Audit Fees, are shown in the table below.
Fund | 2007A | 2006 A |
Fidelity Advisor Diversified International Fund | $0 | $0 |
Fidelity Advisor Emerging Asia Fund | $0 | $0 |
Fidelity Advisor Global Capital Appreciation Fund | $0 | $0 |
Fidelity Advisor Japan Fund | $0 | $0 |
Fidelity Advisor Korea Fund | $0 | $0 |
Fidelity Advisor Latin America Fund | $0 | $0 |
Fidelity Advisor Overseas Fund | $0 | $0 |
Fidelity Advisor Value Leaders Fund | $0 | $0 |
A | Aggregate amounts may reflect rounding. |
In each of the fiscal years ended October 31, 2007 and October 31, 2006, the aggregate Audit-Related Fees billed by Deloitte Entities for services rendered for assurance and related services to each fund that are reasonably related to the performance of the audit or review of the fund's financial statements, but not reported as Audit Fees, are shown in the table below.
Fund | 2007A | 2006 A |
Fidelity Advisor Emerging Markets Fund | $0 | $0 |
Fidelity Advisor Europe Capital Appreciation Fund | $0 | $0 |
Fidelity Advisor International Capital Appreciation Fund | $0 | $0 |
A | Aggregate amounts may reflect rounding. |
In each of the fiscal years ended October 31, 2007 and October 31, 2006, the aggregate Audit-Related Fees that were billed by PwC and Deloitte Entities that were required to be approved by the Audit Committee for services rendered on behalf of Fidelity Management & Research Company (FMR) and entities controlling, controlled by, or under common control with FMR (not including any sub-adviser whose role is primarily portfolio management and is subcontracted with or overseen by another investment adviser) that provide ongoing services to the funds ("Fund Service Providers") for assurance and related services that relate directly to the operations and financial reporting of each fund that are reasonably related to the performance of the audit or review of the fund's financial statements, but not reported as Audit Fees, are shown in the table below.
Billed By | 2007 A | 2006A |
PwC | $0 | $0 |
Deloitte Entities | $0 | $0 |
A | Aggregate amounts may reflect rounding. |
Fees included in the audit-related category comprise assurance and related services (e.g., due diligence services) that are traditionally performed by the independent registered public accounting firm. These audit-related services include due diligence related to mergers and acquisitions, accounting consultations and audits in connection with acquisitions, internal control reviews, attest services that are not required by statute or regulation and consultation concerning financial accounting and reporting standards.
(c) Tax Fees.
In each of the fiscal years ended October 31, 2007 and October 31, 2006, the aggregate Tax Fees billed by PwC for professional services rendered for tax compliance, tax advice, and tax planning for each fund is shown in the table below.
Fund | 2007A | 2006A |
Fidelity Advisor Diversified International Fund | $22,900 | $28,900 |
Fidelity Advisor Emerging Asia Fund | $29,000 | $22,700 |
Fidelity Advisor Global Capital Appreciation Fund | $14,100 | $2,800 |
Fidelity Advisor Japan Fund | $2,700 | $2,600 |
Fidelity Advisor Korea Fund | $4,800 | $4,600 |
Fidelity Advisor Latin America Fund | $2,700 | $2,600 |
Fidelity Advisor Overseas Fund | $4,800 | $4,600 |
Fidelity Advisor Value Leaders Fund | $2,900 | $2,700 |
A | Aggregate amounts may reflect rounding. |
In each of the fiscal years ended October 31, 2007 and October 31, 2006, the aggregate Tax Fees billed by Deloitte Entities for professional services rendered for tax compliance, tax advice, and tax planning for each fund is shown in the table below.
Fund | 2007A | 2006A |
Fidelity Advisor Emerging Markets Fund | $6,200 | $4,200 |
Fidelity Advisor Europe Capital Appreciation Fund | $5,200 | $4,200 |
Fidelity Advisor International Capital Appreciation Fund | $6,200 | $4,200 |
A | Aggregate amounts may reflect rounding. |
In each of the fiscal years ended October 31, 2007 and October 31, 2006, the aggregate Tax Fees billed by PwC and Deloitte Entities that were required to be approved by the Audit Committee for professional services rendered on behalf of the Fund Service Providers for tax compliance, tax advice, and tax planning that relate directly to the operations and financial reporting of each fund is shown in the table below.
Billed By | 2007A | 2006A |
PwC | $0 | $0 |
Deloitte Entities | $0 | $0 |
A | Aggregate amounts may reflect rounding. |
Fees included in the Tax Fees category comprise all services performed by professional staff in the independent registered public accounting firm's tax division except those services related to the audit. Typically, this category would include fees for tax compliance, tax planning, and tax advice. Tax compliance, tax advice, and tax planning services include preparation of original and amended tax returns, claims for refund and tax payment-planning services, assistance with tax audits and appeals, tax advice related to mergers and acquisitions and requests for rulings or technical advice from taxing authorities.
(d) All Other Fees.
In each of the fiscal years ended October 31, 2007 and October 31, 2006, the aggregate Other Fees billed by PwC for all other non-audit services rendered to the funds is shown in the table below.
Fund | 2007A | 2006A |
Fidelity Advisor Diversified International Fund | $11,500 | $9,600 |
Fidelity Advisor Emerging Asia Fund | $1,300 | $1,300 |
Fidelity Advisor Global Capital Appreciation Fund | $1,200 | $1,200 |
Fidelity Advisor Japan Fund | $1,300 | $1,300 |
Fidelity Advisor Korea Fund | $1,200 | $1,200 |
Fidelity Advisor Latin America Fund | $1,300 | $1,200 |
Fidelity Advisor Overseas Fund | $2,100 | $2,000 |
Fidelity Advisor Value Leaders Fund | $1,300 | $1,200 |
A | Aggregate amounts may reflect rounding. |
In each of the fiscal years ended October 31, 2007 and October 31, 2006, the aggregate Other Fees billed by Deloitte Entities for all other non-audit services rendered to the funds is shown in the table below.
Fund | 2007A | 2006A |
Fidelity Advisor Emerging Markets Fund | $0 | $0 |
Fidelity Advisor Europe Capital Appreciation Fund | $0 | $0 |
Fidelity Advisor International Capital Appreciation Fund | $0 | $0 |
A | Aggregate amounts may reflect rounding. |
In each of the fiscal years ended October 31, 2007 and October 31, 2006, the aggregate Other Fees billed by PwC and Deloitte Entities that were required to be approved by the Audit Committee for all other non-audit services rendered on behalf of the Fund Service Providers that relate directly to the operations and financial reporting of each fund is shown in the table below.
Billed By | 2007A | 2006A |
PwC | $275,000 | $20,000 |
Deloitte Entities | $260,000 | $255,000 |
A | Aggregate amounts may reflect rounding. |
Fees included in the All Other Fees category include services related to internal control reviews, strategy and other consulting, financial information systems design and implementation, consulting on other information systems, and other tax services unrelated to the fund.
(e) (1) | Audit Committee Pre-Approval Policies and Procedures: |
The trust's Audit Committee must pre-approve all audit and non-audit services provided by the independent registered public accounting firm relating to the operations or financial reporting of the funds. Prior to the commencement of any audit or non-audit services to a fund, the Audit Committee reviews the services to determine whether they are appropriate and permissible under applicable law.
The trust's Audit Committee has adopted policies and procedures to, among other purposes, provide a framework for the Committee's consideration of non-audit services by the audit firms that audit the Fidelity funds. The policies and procedures require that any non-audit service provided by a fund audit firm to a Fidelity Fund and any non-audit service provided by a fund auditor to a Fund Service Provider that relates directly to the operations and financial reporting of a Fidelity fund (Covered Service) are subject to approval by the Audit Committee before such service is provided. Non-audit services provided by a fund audit firm for a Fund Service Provider that do not relate directly to the operations and financial reporting of a Fidelity fund (Non-Covered Service) but that are expected to exceed $50,000 are also subject to pre-approval by the Audit Committee.
All Covered Services, as well as Non-Covered Services that are expected to exceed $50,000, must be approved in advance of provision of the service either: (i) by formal resolution of the Audit Committee, or (ii) by oral or written approval of the service by the Chair of the Audit Committee (or if the Chair is unavailable, such other member of the Audit Committee as may be designated by the Chair to act in the Chair's absence). The approval contemplated by (ii) above is permitted where the Treasurer determines that action on such an engagement is necessary before the next meeting of the Audit Committee. Neither pre-approval nor advance notice of Non-Covered Service engagements for which fees are not expected to exceed $50,000 is required; such engagements are to be reported to the Audit Committee monthly.
(e) (2) | Services approved pursuant to paragraph (c)(7)(i)(C) of Rule 2-01 of Regulation S-X: |
Audit-Related Fees:
There were no amounts that were approved by the Audit Committee pursuant to the de minimis exception for the fiscal years ended October 31, 2007 and October 31, 2006 on behalf of each fund.
There were no amounts that were required to be approved by the Audit Committee pursuant to the de minimis exception for the fiscal years ended October 31, 2007 and October 31, 2006 on behalf of the Fund Service Providers that relate directly to the operations and financial reporting of each fund.
Tax Fees:
There were no amounts that were approved by the Audit Committee pursuant to the de minimis exception for the fiscal years ended October 31, 2007 and October 31, 2006 on behalf of each fund.
There were no amounts that were required to be approved by the Audit Committee pursuant to the de minimis exception for the fiscal years ended October 31, 2007 and October 31, 2006 on behalf of the Fund Service Providers that relate directly to the operations and financial reporting of each fund.
All Other Fees:
There were no amounts that were approved by the Audit Committee pursuant to the de minimis exception for the fiscal years ended October 31, 2007 and October 31, 2006 on behalf of each fund.
There were no amounts that were required to be approved by the Audit Committee pursuant to the de minimis exception for the fiscal years ended October 31, 2007 and October 31, 2006 on behalf of the Fund Service Providers that relate directly to the operations and financial reporting of each fund.
(f) Not applicable.
(g) For the fiscal years ended October 31, 2007 and October 31, 2006, the aggregate fees billed by PwC of $2,105,000A and $810,000A for non-audit services rendered on behalf of the funds, FMR (not including any sub-adviser whose role is primarily portfolio management and is subcontracted with or overseen by another investment adviser) and Fund Service Providers relating to Covered Services and Non-Covered Services are shown in the table below.
| 2007A | 2006A |
Covered Services | $380,000 | $110,000 |
Non-Covered Services | $1,725,000 | $700,000 |
A | Aggregate amounts may reflect rounding. |
For the fiscal years ended October 31, 2007 and October 31, 2006, the aggregate fees billed by Deloitte Entities of $685,000A and $800,000A for non-audit services rendered on behalf of the fund, FMR (not including any sub-adviser whose role is primarily portfolio management and is subcontracted with or overseen by another investment adviser) and Fund Service Providers relating to Covered Services and Non-Covered Services are shown in the table below.
| 2007A | 2006A |
Covered Services | $280,000 | $270,000 |
Non-Covered Services | $405,000 | $530,000 |
A | Aggregate amounts may reflect rounding. |
(h) The trust's Audit Committee has considered Non-Covered Services that were not pre-approved that were provided by PwC and Deloitte Entities to Fund Service Providers to be compatible with maintaining the independence of PwC and Deloitte Entities in their audit of the funds, taking into account representations from PwC and Deloitte Entities, in accordance with Independence Standards Board Standard No.1, regarding their independence from the funds and their related entities.
Item 5. Audit Committee of Listed Registrants
Not applicable.
Item 6. Schedule of Investments
Not applicable.
Item 7. Disclosure of Proxy Voting Policies and Procedures for Closed-End Management Investment Companies
Not applicable.
Item 8. Portfolio Managers of Closed-End Management Investment Companies
Not applicable.
Item 9. Purchase of Equity Securities by Closed-End Management Investment Company and Affiliated Purchasers
Not applicable.
Item 10. Submission of Matters to a Vote of Security Holders
There were no material changes to the procedures by which shareholders may recommend nominees to the trust's Board of Trustees.
Item 11. Controls and Procedures
(a)(i) The President and Treasurer and the Chief Financial Officer have concluded that the trust's disclosure controls and procedures (as defined in Rule 30a-3(c) under the Investment Company Act) provide reasonable assurances that material information relating to the trust is made known to them by the appropriate persons, based on their evaluation of these controls and procedures as of a date within 90 days of the filing date of this report.
(a)(ii) There was no change in the trust's internal control over financial reporting (as defined in Rule 30a-3(d) under the Investment Company Act) that occurred during the second fiscal quarter of the period covered by this report that has materially affected, or is reasonably likely to materially affect, the trust's internal control over financial reporting.
Item 12. Exhibits
(a) | (1) | Code of Ethics pursuant to Item 2 of Form N-CSR is filed and attached hereto as EX-99.CODE ETH. |
(a) | (2) | Certification pursuant to Rule 30a-2(a) under the Investment Company Act of 1940 (17 CFR 270.30a-2(a)) is filed and attached hereto as Exhibit 99.CERT. |
(a) | (3) | Not applicable. |
(b) | | Certification pursuant to Rule 30a-2(b) under the Investment Company Act of 1940 (17 CFR 270.30a-2(b)) is furnished and attached hereto as Exhibit 99.906CERT. |
SIGNATURES
Pursuant to the requirements of the Securities Exchange Act of 1934 and the Investment Company Act of 1940, the registrant has duly caused this report to be signed on its behalf by the undersigned, thereunto duly authorized.
Fidelity Advisor Series VIII
By: | /s/Kimberley Monasterio |
| Kimberley Monasterio |
| President and Treasurer |
| |
Date: | December 28, 2007 |
Pursuant to the requirements of the Securities Exchange Act of 1934 and the Investment Company Act of 1940, this report has been signed below by the following persons on behalf of the registrant and in the capacities and on the dates indicated.
By: | /s/Kimberley Monasterio |
| Kimberley Monasterio |
| President and Treasurer |
| |
Date: | December 28, 2007 |
By: | /s/Joseph B. Hollis |
| Joseph B. Hollis |
| Chief Financial Officer |
| |
Date: | December 28, 2007 |