UNITED STATES
SECURITIES AND EXCHANGE COMMISSION
Washington, D.C. 20549
FORM N-CSR
CERTIFIED SHAREHOLDER REPORT OF REGISTERED
MANAGEMENT INVESTMENT COMPANIES
Investment Company Act file number 811-3855
Fidelity Advisor Series VIII
(Exact name of registrant as specified in charter)
82 Devonshire St., Boston, Massachusetts 02109
(Address of principal executive offices) (Zip code)
Eric D. Roiter, Secretary
82 Devonshire St.
Boston, Massachusetts 02109
(Name and address of agent for service)
Registrant's telephone number, including area code: 617-563-7000
Date of fiscal year end: | December 31 |
| |
Date of reporting period: | December 31, 2005 |
Item 1. Reports to Stockholders

Fidelity® Advisor
Emerging Markets Income
Fund Class A, Class T, Class B
and Class C
|
| | Annual Report
December 31, 2005
|

| Contents | | | | |
| |
| Chairman’s Message | | 3 | | Ned Johnson’s message to shareholders. |
| Performance | | 4 | | How the fund has done over time. |
| Management’s Discussion | | 6 | | The manager’s review of fund |
| | | | | performance, strategy and outlook. |
| Shareholder Expense | | 7 | | An example of shareholder expenses. |
| Example | | | | |
| Investment Changes | | 9 | | A summary of major shifts in the fund’s |
| | | | | investments over the past six months. |
| Investments | | 10 | | A complete list of the fund’s investments |
| | | | | with their market values. |
| Financial Statements | | 20 | | Statements of assets and liabilities, |
| | | | | operations, and changes in net assets, |
| | | | | as well as financial highlights. |
| Notes | | 29 | | Notes to the financial statements. |
| Report of Independent | | 38 | | |
| Registered Public | | | | |
| Accounting Firm | | | | |
| Trustees and Officers | | 39 | | |
| Distributions | | 49 | | |
| | To view a fund’s proxy voting guidelines and proxy voting record for the 12 month period
ended June 30, visit www.fidelity.com/proxyvotingresults or visit the Securities and Exchange
Commission’s (SEC) web site at www.sec.gov. You may also call 1-877-208-0098 to request a free
copy of the proxy voting guidelines.
Standard & Poor’s, S&P and S&P 500 are registered service marks of The McGraw Hill Companies,
Inc. and have been licensed for use by Fidelity Distributors Corporation.
Other third party marks appearing herein are the property of their respective owners.
All other marks appearing herein are registered or unregistered trademarks or service marks
of FMR Corp. or an affiliated company.
This report and the financial statements contained herein are submitted for the general information
of the shareholders of the fund. This report is not authorized for distribution to prospective investors
in the fund unless preceded or accompanied by an effective prospectus.
A fund files its complete schedule of portfolio holdings with the SEC for the first and third
quarters of each fiscal year on Form N Q. Forms N Q are available on the SEC’s web site at
http://www.sec.gov. A fund’s Forms N Q may be reviewed and copied at the SEC’s Public Reference
Room in Washington, DC. Information regarding the operation of the SEC’s Public Reference
Room may be obtained by calling 1-800-SEC-0330. For a complete list of a fund’s portfolio hold
ings, view the most recent quarterly holdings report, semiannual report, or annual report on
Fidelity’s web site at http://www.advisor.fidelity.com.
NOT FDIC INSURED · MAY LOSE VALUE · NO BANK GUARANTEE
Neither the fund nor Fidelity Distributors Corporation is a bank.
|
Annual Report 2
Chairman’s Message
(photograph of Edward C. Johnson 3d)
Dear Shareholder:
During the past year or so, much has been reported about the mutual fund industry, and much of it has been more critical than I believe is warranted. Allegations that some companies have been less than forthright with their shareholders have cast a shadow on the entire industry. I continue to find these reports disturbing, and assert that they do not create an accurate picture of the industry overall. Therefore, I would like to remind every one where Fidelity stands on these issues. I will say two things specifically regarding allegations that some mutual fund companies were in violation of the Securities and Exchange Commission’s forward pricing rules or were involved in so called “market timing” activities.
First, Fidelity has no agreements that permit customers who buy fund shares after 4 p.m. to obtain the 4 p.m. price. This is not a new policy. This is not to say that some one could not deceive the company through fraudulent acts. However, we are extremely diligent in preventing fraud from occurring in this manner and in every other. But I underscore again that Fidelity has no so called “agreements” that sanction illegal practices.
Second, Fidelity continues to stand on record, as we have for years, in opposition to predatory short term trading that adversely affects shareholders in a mutual fund. Back in the 1980s, we initiated a fee which is returned to the fund and, therefore, to investors to discourage this activity. Further, we took the lead several years ago in developing a Fair Value Pricing Policy to prevent market timing on foreign securities in our funds. I am confident we will find other ways to make it more difficult for predatory traders to operate. However, this will only be achieved through close cooperation among regulators, legislators and the industry.
Yes, there have been unfortunate instances of unethical and illegal activity within the mutual fund industry from time to time. That is true of any industry. When this occurs, confessed or convicted offenders should be dealt with appropriately. But we are still concerned about the risk of over regulation and the quick application of simplistic solutions to intricate problems. Every system can be improved, and we support and applaud well thought out improvements by regulators, legislators and industry representatives that achieve the common goal of building and protecting the value of investors’ holdings.
For nearly 60 years, Fidelity has worked very hard to improve its products and service to justify your trust. When our family founded this company in 1946, we had only a few hundred customers. Today, we serve more than 18 million customers including individual investors and participants in retirement plans across America.
Let me close by saying that we do not take your trust in us for granted, and we realize that we must always work to improve all aspects of our service to you. In turn, we urge you to continue your active participation with your financial matters, so that your interests can be well served.
Best regards,
/s/ Edward C. Johnson 3d
Edward C. Johnson 3d
3 Annual Report
Performance: The Bottom Line
Average annual total return reflects the change in the value of an investment, assuming reinvestment of the class’ dividend income and capital gains (the profits earned upon the sale of securities that have grown in value) and assuming a constant rate of performance each year. The $10,000 table and the fund’s returns do not reflect the deduction of taxes that a shareholder would pay on fund distribu tions or the redemption of fund shares. During periods of reimbursement by Fidelity, a fund’s total return will be greater than it would be had the reimburse ment not occurred. How a fund did yesterday is no guarantee of how it will do tomorrow. Returns may reflect the conversion of Class B shares to Class A shares after a maximum of seven years.
| Average Annual Total Returns | | | | | | |
| Periods ended December 31, 2005 | | Past 1 | | Past 5 | | Past 10 |
| | | year | | years | | years |
| Class A (incl. 4.75% sales | | | | | | |
| charge)A | | 5.87% | | 13.05% | | 13.85% |
| Class T (incl. 3.50% sales charge) | | 7.10% | | 13.21% | | 13.89% |
| Class B (incl. contingent deferred | | | | | | |
| sales charge)B | | 5.35% | | 13.05% | | 13.83% |
| Class C (incl. contingent deferred | | | | | | |
| sales charge)C | | 9.17% | | 13.16% | | 13.49% |
A Class A shares bear a 0.15% 12b 1 fee. The initial offering of Class A shares took place on September 3,
1996. Returns prior to September 3, 1996 are those of Class T and reflect a 0.25% 12b 1 fee.
B Class B shares’ contingent deferred sales charges included in the past one year, past five year
and past 10 year total return figures are 5%, 2% and 0%, respectively.
C Class C shares bear a 1.00% 12b 1 fee. The initial offering of Class C shares took place on Novem
ber 3, 1997. Returns prior to November 3, 1997 are those of Class B and reflect a 0.90% 12b 1 fee. Had
Class C shares’ 12b 1 fee been reflected, returns from January 1, 1996 through November 3, 1997
would have been lower. Class C shares’ contingent deferred sales charge included in the past one
year, past five year and past 10 year total return figures are 1%, 0% and 0%, respectively.
|
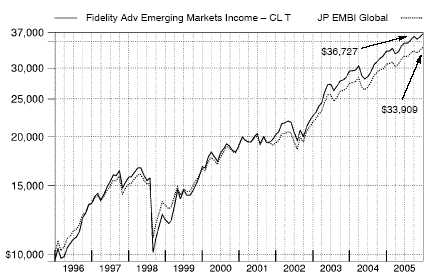
| | $10,000 Over Life of Fund
|
Let’s say hypothetically that $10,000 was invested in Fidelity® Advisor Emerging Markets Income Fund — Class T on December 31, 1995, and the current 3.50% sales charge was paid. The chart shows how the value of your investment would have changed, and also shows how the J.P. Morgan Emerging Markets Bond Index Global (EMBI Global) performed over the same period.
Management’s Discussion of Fund Performance
Comments from John Carlson, Portfolio Manager of Fidelity® Advisor Emerging Markets Income Fund
Emerging markets debt ran its streak of double digit returns to four consecutive years during the 12 month period ending December 31, 2005. In that time, the J.P. Morgan Emerging Markets Bond Index (EMBI) Global gained 10.73% . The asset class stumbled in early 2005, falling 1.28% in the first quarter. It recovered well, however, spurred by several factors. Many emerging markets economies improved; oil exporting countries benefited from record high prices for the commodity; many emerging markets nations received credit upgrades; global concerns about rising inflation and interest rates eased; and the debt category was attractive to investors seeking higher yields than U.S. Treasuries. The bonds continued their strong performance through the remainder of ’05, particularly the oil exporting Latin American nations. On an individual country level, the Dominican Republic one of the index’s smallest components was up 24.10%, while the Philippines rose 20.60% . Brazil and Russia, the largest and third largest country weightings, respectively, both gained slightly more than 13%, but Mexico, the second largest component, tempered the benchmark’s overall result with just an 8.08% increase.
For the 12 months that ended December 31, 2005, the fund’s Class A, Class T, Class B and Class C shares rose 11.15%, 10.98%, 10.34% and 10.17%, respectively (excluding sales charges), roughly in line with the EMBI Global. The LipperSM Emerging Markets Debt Funds Average returned 11.76% during the same time period. Security selection in Egypt made the largest contribution to performance versus the index. The Egyptian currency the pound strengthened slightly but steadily throughout 2005. In this environment, the fund benefited from owning the country’s locally denominated debt. Investment grade Mexican debt posted a below benchmark return for the year. However, my security selec tion made a strong contribution to performance. The fund’s positioning in Brazilian debt, approximately 19% of the portfolio on average during the year, was the largest detractor, as underweighting longer maturity Brazilian bonds hurt relative performance. The fund’s position in Ecuador also detracted, albeit to a much smaller extent. Political upheaval in the second quarter had ramifications for Ecuadoran debt.
The views expressed in this statement reflect those of the portfolio manager only through the end of the period of the report as stated on the cover and do not necessarily represent the views of Fidelity or any other person in the Fidelity organization. Any such views are subject to change at any time based upon market or other conditions and Fidelity disclaims any responsibility to update such views. These views may not be relied on as investment advice and, because investment decisions for a Fidelity fund are based on numerous factors, may not be relied on as an indication of trading intent on behalf of any Fidelity fund.
Shareholder Expense Example
As a shareholder of the Fund, you incur two types of costs: (1) transaction costs, including sales charges (loads) on purchase payments or redemption proceeds, redemption fees, and (2) ongoing costs, including management fees, distribution and/or service (12b 1) fees and other Fund expenses. This Example is intended to help you understand your ongoing costs (in dollars) of investing in the Fund and to compare these costs with the ongoing costs of investing in other mutual funds.
The Example is based on an investment of $1,000 invested at the beginning of the period and held for the entire period (July 1, 2005 to December 31, 2005).
The first line of the table below for each class of the Fund provides information about actual account values and actual expenses. You may use the information in this line, together with the amount you invested, to estimate the expenses that you paid over the period. Simply divide your account value by $1,000.00 (for example, an $8,600 account value divided by $1,000.00 = 8.6), then multiply the result by the number in the first line for a class of the Fund under the heading entitled “Expenses Paid During Period” to estimate the expenses you paid on your account during this period.
Hypothetical Example for Comparison Purposes
The second line of the table below for each class of the Fund provides information about hypothetical account values and hypothetical expenses based on a Class’ actual expense ratio and an assumed rate of return of 5% per year before expenses, which is not the Class’ actual return. The hypothetical account values and expenses may not be used to estimate the actual ending account balance or expenses you paid for the period. You may use this informa tion to compare the ongoing costs of investing in the Fund and other funds. To do so, compare this 5% hypothetical example with the 5% hypothetical examples that appear in the shareholder reports of the other funds.
Please note that the expenses shown in the table are meant to highlight your ongoing costs only and do not reflect any transaction costs. Therefore, the second line of the table is useful in comparing ongoing costs only, and will not help you determine the relative total costs of owning different funds. In addition, if these transactional costs were included, your costs would have been higher.
| | | | | | | | | | | Expenses Paid |
| | | | | Beginning | | Ending | | During Period* |
| | | | | Account Value | | Account Value | | July 1, 2005 to |
| | | | | July 1, 2005 | | December 31, 2005 | | December 31, 2005 |
| Class A | | | | | | | | | | | | |
| Actual | | | $ | 1,000.00 | | $ | | 1,057.50 | | $ | | 5.70 |
| HypotheticalA | | | $ | 1,000.00 | | $ | | 1,019.66 | | $ | | 5.60 |
| Class T | | | | | | | | | | | | |
| Actual | | | $ | 1,000.00 | | $ | | 1,057.10 | | $ | | 6.22 |
| HypotheticalA | | | $ | 1,000.00 | | $ | | 1,019.16 | | $ | | 6.11 |
| Class B | | | | | | | | | | | | |
| Actual | | | $ | 1,000.00 | | $ | | 1,053.90 | | $ | | 9.58 |
| HypotheticalA | | | $ | 1,000.00 | | $ | | 1,015.88 | | $ | | 9.40 |
| |
| |
| |
| | | | | 7 | | | | | | | | Annual Report |
| Shareholder Expense Example continued | | | | |
| |
| |
| | | | | | | | | | | Expenses Paid |
| | | | | Beginning | | Ending | | During Period* |
| | | | | Account Value | | Account Value | | July 1, 2005 to |
| | | | | July 1, 2005 | | December 31, 2005 | | December 31, 2005 |
| Class C | | | | | | | | | | | | |
| Actual | | | $ | 1,000.00 | | $ | | 1,052.70 | | $ | | 10.09 |
| HypotheticalA | | | $ | 1,000.00 | | $ | | 1,015.38 | | $ | | 9.91 |
| Institutional Class | | | | | | | | | | | | |
| Actual | | | $ | 1,000.00 | | $ | | 1,058.90 | | $ | | 4.93 |
| HypotheticalA | | | $ | 1,000.00 | | $ | | 1,020.42 | | $ | | 4.84 |
| |
| A 5% return per year before expenses | | | | | | | | |
* Expenses are equal to each Class’ annualized expense ratio (shown in the table below); multiplied by the average account value over the period, multiplied by 184/365 (to reflect the one half year period).
| | | Annualized |
| | | Expense Ratio |
| Class A | | 1.10% |
| Class T | | 1.20% |
| Class B | | 1.85% |
| Class C | | 1.95% |
| Institutional Class | | 95% |
| Investment Changes | | | | |
| |
| |
| Top Five Countries as of December 31, 2005 | | |
| (excluding cash equivalents) | | % of fund’s | | % of fund’s net assets |
| | | net assets | | 6 months ago |
| Brazil | | 18.2 | | 17.7 |
| Mexico | | 8.4 | | 10.1 |
| Turkey | | 7.1 | | 7.2 |
| United States of America | | 6.9 | | 2.4 |
| Venezuela | | 6.7 | | 6.7 |
Percentages are adjusted for the effect of open futures contracts, if applicable. | | |
Top Five Holdings as of December 31, 2005 | | |
| (by issuer, excluding cash equivalents) | | % of fund’s | | % of fund’s net assets |
| | | net assets | | 6 months ago |
| Brazilian Federative Republic | | 17.6 | | 17.5 |
| United Mexican States | | 8.1 | | 10.1 |
| Turkish Republic | | 7.1 | | 7.2 |
| Venezuelan Republic | | 6.7 | | 6.7 |
| Philippine Republic | | 6.2 | | 5.6 |
| | | 45.7 | | |
9 Annual Report
| Investments December 31, 2005 | | | | |
| Showing Percentage of Net Assets | | | | | | | | |
| |
| Nonconvertible Bonds 13.1% | | | | | | | | |
| | | | | Principal | | | | Value |
| | | | | Amount (c) | | | | (Note 1) |
| |
| Argentina – 0.2% | | | | | | | | |
| Telecom Personal SA 9.25% 12/22/10 (e) | | | $ | 460,000 | | | $ | 461,150 |
| Bahamas (Nassau) – 0.5% | | | | | | | | |
| Odebrecht Overseas Ltd. 11.5% 2/25/09 (e) | | | | 835,000 | | | | 951,900 |
| Brazil – 0.6% | | | | | | | | |
| Braskem SA: | | | | | | | | |
| 11.75% 1/22/14 (e) | | | | 390,000 | | | | 481,650 |
| 12.5% 11/5/08 (e) | | | | 395,000 | | | | 461,163 |
| Globo Comunicacoes e Participacoes SA (Reg. S) | | | | | | | | |
| 7.375% 10/20/11 (d) | | | | 339,543 | | | | 337,845 |
| TOTAL BRAZIL | | | | | | | | 1,280,658 |
| |
| Cayman Islands – 0.3% | | | | | | | | |
| CSN Islands VIII Corp. 9.75% 12/16/13 (e) | | | | 515,000 | | | | 571,650 |
| Egypt – 0.3% | | | | | | | | |
| Telecom Egypt SAE: | | | | | | | | |
| 10.7% 2/4/10 (f) | | EGP | | 1,823,100 | | | | 327,848 |
| 10.95% 2/4/10 | | EGP | | 1,828,100 | | | | 331,933 |
| TOTAL EGYPT | | | | | | | | 659,781 |
| |
| Germany – 1.5% | | | | | | | | |
| Citigroup Global Markets Deutschland AG 9.25% | | | | | | | | |
| 4/19/14 (e) | | | | 630,000 | | | | 679,613 |
| Dresdner Bank AG 10.375% 8/17/09 (e) | | | | 660,000 | | | | 732,666 |
| Gazstream SA 5.625% 7/22/13 (e) | | | | 910,000 | | | | 905,450 |
| Kyivstar GSM 7.75% 4/27/12 (Issued by Dresdner Bank | | | | | | | | |
| AG for Kyivstar GSM) (e) | | | | 650,000 | | | | 659,750 |
| TOTAL GERMANY | | | | | | | | 2,977,479 |
| |
| Indonesia – 0.0% | | | | | | | | |
| APP International Finance (Mauritius) Ltd.: | | | | | | | | |
| 0% 7/5/01 (b)(e) | | | | 1,235,000 | | | | 49,400 |
| 0% 7/5/01 (Reg. S) (b) | | | | 445,000 | | | | 17,800 |
| TOTAL INDONESIA | | | | | | | | 67,200 |
| |
| Korea (South) 0.2% | | | | | | | | |
| Hanarotelecom, Inc. 7% 2/1/12 (e) | | | | 450,000 | | | | 442,125 |
| Luxembourg 0.4% | | | | | | | | |
| Millicom International Cellular SA 10% 12/1/13 | | | | 705,000 | | | | 726,150 |
| Malaysia – 1.7% | | | | | | | | |
| Petroliam Nasional BHD (Petronas): | | | | | | | | |
| 7.625% 10/15/26 (Reg. S) | | | | 330,000 | | | | 411,015 |
See accompanying notes which are an integral part of the financial statements.
| Nonconvertible Bonds continued | | | | | | |
| | | | | Principal | | Value |
| | | | | Amount (c) | | (Note 1) |
| |
| Malaysia – continued | | | | | | |
| Petroliam Nasional BHD (Petronas): – continued | | | | | | |
| 7.75% 8/15/15 (Reg. S) | | | $ | 425,000 | | $ 507,875 |
| Petronas Capital Ltd.: | | | | | | |
| 7% 5/22/12 | | | | 1,265,000 | | 1,396,244 |
| 7.875% 5/22/22 (Reg. S) | | | | 620,000 | | 772,572 |
| TM Global, Inc. 5.25% 9/22/14 | | | | 480,000 | | 479,088 |
| TOTAL MALAYSIA | | | | | | 3,566,794 |
| |
| Mexico – 0.3% | | | | | | |
| Innova S. de R.L. 9.375% 9/19/13 | | | | 465,000 | | 517,313 |
| Netherlands – 0.5% | | | | | | |
| PT Indosat International Finance Co. BV 7.125% | | | | | | |
| 6/22/12 (e) | | | | 1,025,000 | | 1,028,844 |
| Russia – 1.2% | | | | | | |
| Mobile Telesystems Finance SA 9.75% 1/30/08 (Reg. S) | | | | 1,385,000 | | 1,468,100 |
| OAO Gazprom 9.625% 3/1/13 | | | | 870,000 | | 1,054,875 |
| TOTAL RUSSIA | | | | | | 2,522,975 |
| |
| Tunisia – 0.2% | | | | | | |
| Banque Centrale de Tunisie 7.375% 4/25/12 | | | | 445,000 | | 494,395 |
| United Kingdom – 0.4% | | | | | | |
| Credit Suisse First Boston International 8% 11/6/15 (e) . | | | | 650,000 | | 670,833 |
| Standard Bank London Ltd. 8.125% 9/30/09 | | | | 200,000 | | 207,580 |
| TOTAL UNITED KINGDOM | | | | | | 878,413 |
| |
| United States of America – 4.8% | | | | | | |
| Pemex Project Funding Master Trust: | | | | | | |
| 7.375% 12/15/14 | | | | 1,300,000 | | 1,444,300 |
| 7.75% 9/28/49 | | | | 1,948,000 | | 2,011,310 |
| 7.875% 2/1/09 (f) | | | | 915,000 | | 978,593 |
| 8.625% 2/1/22 | | | | 835,000 | | 1,026,006 |
| 9.125% 10/13/10 | | | | 3,820,000 | | 4,383,450 |
| TOTAL UNITED STATES OF AMERICA | | | | | | 9,843,659 |
| |
| TOTAL NONCONVERTIBLE BONDS | | | | | | |
| (Cost $27,847,998) | | | | | | 26,990,486 |
See accompanying notes which are an integral part of the financial statements.
11 Annual Report
| Investments continued | | | | | | |
| |
| |
| Government Obligations 77.2% | | | | | | |
| | | Principal | | | | Value |
| | | Amount (c) | | | | (Note 1) |
| |
| Argentina – 3.1% | | | | | | |
| Argentine Republic: | | | | | | |
| discount (with partial capitalization through | | | | | | |
| 12/31/13) 8.28% 12/31/33 | | $ 2,920,320 | | | $ | 2,453,069 |
| par 1.33% 12/31/38 (f) | | 4,325,000 | | | | 1,427,250 |
| 4.005% 8/3/12 (f) | | 650,000 | | | | 497,966 |
| Gross Domestic Product Linked Security 12/15/35 (g) | | 36,697,623 | | | | 1,926,625 |
| TOTAL ARGENTINA | | | | | | 6,304,910 |
| |
| Brazil – 17.6% | | | | | | |
| Brazilian Federative Republic: | | | | | | |
| Brady debt conversion bond 5.25% 4/15/12 (f) | | 2,110,627 | | | | 2,084,244 |
| 8% 1/15/18 | | 1,940,000 | | | | 2,089,380 |
| 8.25% 1/20/34 | | 1,970,000 | | | | 2,088,200 |
| 8.75% 2/4/25 | | 925,000 | | | | 1,022,125 |
| 8.875% 10/14/19 | | 1,055,000 | | | | 1,181,600 |
| 8.875% 4/15/24 | | 2,070,000 | | | | 2,313,225 |
| 9.25% 10/22/10 | | 1,440,000 | | | | 1,611,360 |
| 10% 8/7/11 | | 830,000 | | | | 964,875 |
| 10.5% 7/14/14 | | 2,220,000 | | | | 2,719,500 |
| 11% 1/11/12 | | 800,000 | | | | 976,000 |
| 11% 8/17/40 | | 9,695,000 | | | | 12,506,538 |
| 12% 4/15/10 | | 2,450,000 | | | | 2,985,325 |
| 12.75% 1/15/20 | | 1,425,000 | | | | 2,052,000 |
| 14.5% 10/15/09 | | 1,385,000 | | | | 1,779,725 |
| TOTAL BRAZIL | | | | | | 36,374,097 |
| |
| Colombia – 3.4% | | | | | | |
| Colombian Republic: | | | | | | |
| 6.1422% 11/16/15 (f) | | 490,000 | | | | 499,800 |
| 8.125% 5/21/24 | | 780,000 | | | | 844,350 |
| 8.25% 12/22/14 | | 450,000 | | | | 501,750 |
| 10% 1/23/12 | | 730,000 | | | | 868,700 |
| 10.375% 1/28/33 | | 415,000 | | | | 546,763 |
| 10.5% 7/9/10 | | 655,000 | | | | 773,555 |
| 10.75% 1/15/13 | | 435,000 | | | | 540,488 |
| 10.75% 1/15/13 | | 590,000 | | | | 733,075 |
| 11.75% 2/25/20 | | 1,153,000 | | | | 1,608,435 |
| 12% 10/22/15 | COP | 291,000,000 | | | | 150,442 |
| TOTAL COLOMBIA | | | | | | 7,067,358 |
See accompanying notes which are an integral part of the financial statements.
| Government Obligations continued | | | | | | |
| | | Principal | | | | Value |
| | | Amount (c) | | | | (Note 1) |
| |
| Dominican Republic – 0.7% | | | | | | |
| Dominican Republic: | | | | | | |
| 9.04% 1/23/18 (e) | | $ 877,968 | | | $ | 922,964 |
| 9.5% 9/27/11 | | 487,088 | | | | 514,486 |
| TOTAL DOMINICAN REPUBLIC | | | | | | 1,437,450 |
| |
| Ecuador 2.6% | | | | | | |
| Ecuador Republic: | | | | | | |
| 9% 8/15/30 (Reg. S) (d) | | 4,110,000 | | | | 3,740,100 |
| 9.375% 12/15/15 (e) | | 655,000 | | | | 610,788 |
| 12% 11/15/12 (e) | | 250,000 | | | | 252,500 |
| 12% 11/15/12 (Reg. S) | | 860,000 | | | | 868,600 |
| TOTAL ECUADOR | | | | | | 5,471,988 |
| |
| El Salvador – 0.2% | | | | | | |
| El Salvador Republic 8.5% 7/25/11 (Reg. S) | | 465,000 | | | | 520,800 |
| Hungary – 0.8% | | | | | | |
| Republic of Hungary 6.5% 8/24/06 | HUF | 350,060,000 | | | | 1,639,060 |
| Indonesia – 1.6% | | | | | | |
| Indonesian Republic: | | | | | | |
| 6.75% 3/10/14 | | 665,000 | | | | 664,169 |
| 7.25% 4/20/15 (e) | | 310,000 | | | | 318,138 |
| 7.5% 1/15/16 (e) | | 1,155,000 | | | | 1,201,200 |
| 8.5% 10/12/35 (e) | | 1,120,000 | | | | 1,218,000 |
| TOTAL INDONESIA | | | | | | 3,401,507 |
| |
| Ivory Coast – 0.3% | | | | | | |
| Ivory Coast: | | | | | | |
| Brady past due interest 2% 3/29/18 (Reg. S) (b)(f) | | 1,097,250 | | | | 235,909 |
| FLIRB 2.5% 3/29/18 (Reg. S) (b)(f) | | 1,525,000 | | | | 320,250 |
| TOTAL IVORY COAST | | | | | | 556,159 |
| |
| Lebanon 3.0% | | | | | | |
| Lebanese Republic: | | | | | | |
| 7.83% 11/30/09 (e)(f) | | 1,550,000 | | | | 1,612,000 |
| 7.83% 11/30/09 (f) | | 185,000 | | | | 192,400 |
| 8.5% 1/19/16 (e) | | 650,000 | | | | 676,813 |
| 10.125% 8/6/08 | | 470,000 | | | | 507,600 |
| 10.25% 10/6/09 (Reg. S) | | 820,000 | | | | 910,200 |
| 11.625% 5/11/16 (Reg. S) | | 1,765,000 | | | | 2,197,425 |
| TOTAL LEBANON | | | | | | 6,096,438 |
See accompanying notes which are an integral part of the financial statements.
13 Annual Report
| Investments continued | | | | | | | | | | |
| |
| |
| Government Obligations continued | | | | | | | | |
| | | | | | | Principal | | | | Value |
| | | | | | | Amount (c) | | | | (Note 1) |
| |
| Mexico – 8.1% | | | | | | | | | | |
| United Mexican States: | | | | | | | | | | |
| 5.875% 1/15/14 | | | | | $ | 1,420,000 | | | $ | 1,469,700 |
| 6.375% 1/16/13 | | | | | | 440,000 | | | | 467,500 |
| 6.625% 3/3/15 | | | | | | 1,395,000 | | | | 1,527,525 |
| 6.75% 9/27/34 | | | | | | 2,200,000 | | | | 2,406,250 |
| 7.5% 1/14/12 | | | | | | 1,435,000 | | | | 1,600,025 |
| 7.5% 4/8/33 | | | | | | 2,125,000 | | | | 2,516,000 |
| 8% 9/24/22 | | | | | | 830,000 | | | | 1,024,013 |
| 8.125% 12/30/19 | | | | | | 1,615,000 | | | | 1,982,413 |
| 8.3% 8/15/31 | | | | | | 655,000 | | | | 841,675 |
| 11.375% 9/15/16 | | | | | | 999,000 | | | | 1,468,530 |
| 11.5% 5/15/26 | | | | | | 690,000 | | | | 1,128,702 |
| warrants: | | | | | | | | | | |
| 9/1/06 (h)(i) | | | | | | 1,340 | | | | 87,100 |
| 10/10/06 (h)(i) | | | | | | 2,680 | | | | 107,200 |
| 11/9/06 (h)(i) | | | | | | 1,675 | | | | 53,600 |
| TOTAL MEXICO | | | | | | | | | | 16,680,233 |
| |
| Nigeria – 0.5% | | | | | | | | | | |
| Central Bank of Nigeria: | | | | | | | | | | |
| promissory note 5.092% 1/5/10 | | | | | | 974,508 | | | | 954,043 |
| warrants 11/15/20 (h) | | | | | | 750 | | | | 48,750 |
| TOTAL NIGERIA | | | | | | | | | | 1,002,793 |
| |
| Pakistan 0.2% | | | | | | | | | | |
| Pakistani Republic 6.75% 2/19/09 | | | | | | 425,000 | | | | 429,250 |
| Panama – 1.7% | | | | | | | | | | |
| Panamanian Republic: | | | | | | | | | | |
| 7.125% 1/29/26 | | | | | | 655,000 | | | | 666,463 |
| 7.25% 3/15/15 | | | | | | 570,000 | | | | 606,195 |
| 8.875% 9/30/27 | | | | | | 375,000 | | | | 447,000 |
| 9.375% 1/16/23 | | | | | | 475,000 | | | | 594,938 |
| 9.375% 4/1/29 | | | | | | 190,000 | | | | 238,925 |
| 9.625% 2/8/11 | | | | | | 774,000 | | | | 903,645 |
| TOTAL PANAMA | | | | | | | | | | 3,457,166 |
| |
| Peru 2.8% | | | | | | | | | | |
| Peruvian Republic: | | | | | | | | | | |
| 7.35% 7/21/25 | | | | | | 575,000 | | | | 566,375 |
| 8.375% 5/3/16 | | | | | | 570,000 | | | | 627,713 |
| 8.75% 11/21/33 | | | | | | 805,000 | | | | 907,235 |
| 9.125% 2/21/12 | | | | | | 1,175,000 | | | | 1,345,375 |
See accompanying notes which are an integral part of the financial statements.
| Government Obligations continued | | | | | | | | |
| | | | | Principal | | | | Value |
| | | | | Amount (c) | | | | (Note 1) |
| |
| Peru – continued | | | | | | | | |
| Peruvian Republic: – continued | | | | | | | | |
| 9.875% 2/6/15 | | | $ | 525,000 | | | $ | 630,000 |
| euro Brady past due interest 5% 3/7/17 (f) | | | | 1,783,500 | | | | 1,680,949 |
| TOTAL PERU | | | | | | | | 5,757,647 |
| |
| Philippines – 6.2% | | | | | | | | |
| Philippine Republic: | | | | | | | | |
| 8.375% 3/12/09 | | | | 575,000 | | | | 613,094 |
| 8.375% 2/15/11 | | | | 1,575,000 | | | | 1,695,094 |
| 8.875% 3/17/15 | | | | 1,040,000 | | | | 1,150,552 |
| 9% 2/15/13 | | | | 1,815,000 | | | | 2,005,575 |
| 9.375% 1/18/17 | | | | 330,000 | | | | 379,088 |
| 9.5% 2/2/30 | | | | 1,690,000 | | | | 2,000,538 |
| 9.875% 3/16/10 | | | | 550,000 | | | | 622,188 |
| 9.875% 1/15/19 | | | | 2,155,000 | | | | 2,564,450 |
| 10.625% 3/16/25 | | | | 1,315,000 | | | | 1,676,625 |
| TOTAL PHILIPPINES | | | | | | | | 12,707,204 |
| |
| Poland – 0.9% | | | | | | | | |
| Polish Government: | | | | | | | | |
| 0% 8/12/06 | | PLN | | 3,240,000 | | | | 970,753 |
| 8.5% 5/12/06 | | PLN | | 3,015,000 | | | | 942,042 |
| TOTAL POLAND | | | | | | | | 1,912,795 |
| |
| Russia – 4.6% | | | | | | | | |
| Russian Federation: | | | | | | | | |
| 5% 3/31/30 (Reg. S) (d) | | | | 550,000 | | | | 620,125 |
| 11% 7/24/18 (Reg. S) | | | | 2,457,000 | | | | 3,636,360 |
| 12.75% 6/24/28 (Reg. S) | | | | 2,134,000 | | | | 3,915,890 |
| Russian Federation Ministry of Finance Series VII, 3% | | | | | | | | |
| 5/14/11 | | | | 1,480,000 | | | | 1,320,900 |
| TOTAL RUSSIA | | | | | | | | 9,493,275 |
| |
| Serbia & Montenegro – 0.3% | | | | | | | | |
| Republic of Serbia 3.75% 11/1/24 (d)(e) | | | | 635,000 | | | | 564,452 |
| South Africa 1.5% | | | | | | | | |
| South African Republic: | | | | | | | | |
| 7.375% 4/25/12 | | | | 1,455,000 | | | | 1,615,050 |
| 8.5% 6/23/17 | | | | 315,000 | | | | 396,900 |
See accompanying notes which are an integral part of the financial statements.
15 Annual Report
| Investments continued | | | | | | | | | | |
| |
| |
| Government Obligations continued | | | | | | | | |
| | | | | | | Principal | | | | Value |
| | | | | | | Amount (c) | | | | (Note 1) |
| |
| South Africa – continued | | | | | | | | | | |
| South African Republic: – continued | | | | | | | | | | |
| 9.125% 5/19/09 | | | | | $ | 395,000 | | | $ | 442,894 |
| 13% 8/31/10 | | | | ZAR | | 3,270,000 | | | | 631,020 |
| TOTAL SOUTH AFRICA | | | | | | | | | | 3,085,864 |
| |
| Turkey 7.1% | | | | | | | | | | |
| Turkish Republic: | | | | | | | | | | |
| 7% 6/5/20 | | | | | | 1,955,000 | | | | 1,976,994 |
| 8% 2/14/34 | | | | | | 910,000 | | | | 1,002,138 |
| 11% 1/14/13 | | | | | | 3,190,000 | | | | 4,047,313 |
| 11.5% 1/23/12 | | | | | | 1,515,000 | | | | 1,922,156 |
| 11.75% 6/15/10 | | | | | | 1,115,000 | | | | 1,365,875 |
| 11.875% 1/15/30 | | | | | | 1,445,000 | | | | 2,221,688 |
| 13.7495% to 13.9006% 7/5/06 | | | | TRY | | 2,950,000 | | | | 2,037,608 |
| TOTAL TURKEY | | | | | | | | | | 14,573,772 |
| |
| Ukraine – 0.3% | | | | | | | | | | |
| City of Kiev 8.75% 8/8/08 | | | | | | 675,000 | | | | 707,063 |
| United States of America – 2.1% | | | | | | | | | | |
| U.S. Treasury Notes 4.5% 11/15/15 | | | | | | 4,260,000 | | | | 4,294,945 |
| Uruguay – 0.5% | | | | | | | | | | |
| Uruguay Republic: | | | | | | | | | | |
| 7.25% 2/15/11 | | | | | | 370,000 | | | | 376,475 |
| 7.5% 3/15/15 | | | | | | 735,000 | | | | 755,213 |
| TOTAL URUGUAY | | | | | | | | | | 1,131,688 |
| |
| Venezuela – 6.7% | | | | | | | | | | |
| Venezuelan Republic: | | | | | | | | | | |
| oil recovery rights 4/15/20 (h) | | | | | | 21,255 | | | | 616,395 |
| 5.1938% 4/20/11 (f) | | | | | | 1,875,000 | | | | 1,837,500 |
| 5.375% 8/7/10 | | | | | | 1,505,000 | | | | 1,441,038 |
| 7% 12/1/18 (Reg. S) | | | | | | 735,000 | | | | 709,275 |
| 7.65% 4/21/25 | | | | | | 1,475,000 | | | | 1,512,613 |
| 9.25% 9/15/27 | | | | | | 2,595,000 | | | | 3,081,563 |
| 9.375% 1/13/34 | | | | | | 855,000 | | | | 1,014,030 |
| 10.75% 9/19/13 | | | | | | 1,280,000 | | | | 1,580,160 |
| 13.625% 8/15/18 | | | | | | 75,000 | | | | 109,125 |
| 13.625% 8/15/18 | | | | | | 1,275,000 | | | | 1,855,125 |
| TOTAL VENEZUELA | | | | | | | | | | 13,756,824 |
See accompanying notes which are an integral part of the financial statements.
| Government Obligations continued | | | | | | |
| | | | | | | Principal | | Value |
| | | | | | | Amount (c) | | (Note 1) |
| Vietnam – 0.4% | | | | | | | | |
| Vietnamese Socialist Republic 6.875% 1/15/16 (e) | | | $ | 865,000 | | $ 900,681 |
| TOTAL GOVERNMENT OBLIGATIONS | | | | | | |
| (Cost $148,958,386) | | | | | | | | 159,325,419 |
| Common Stocks 0.3% | | | | | | | | |
| | | | | | | Shares | | |
| Bermuda – 0.3% | | | | | | | | |
| APP China Group Ltd. | | | | | | | | |
| (Cost $519,724) | | | | | | 11,376 | | 591,552 |
| Sovereign Loan Participations 0.2% | | | | | | |
| | | | | | | Principal | | |
| | | | | | | Amount (c) | | |
| Morocco – 0.2% | | | | | | | | |
| Moroccan Kingdom loan participation – JP Morgan | | | | | | |
| 4.7188% 1/2/09 (f) | | | | | | | | |
| (Cost $504,597) | | | | | $ | 508,750 | | 506,842 |
| Money Market Funds 7.3% | | | | | | |
| | | | | | | Shares | | |
| Fidelity Cash Central Fund, 4.28% (a) | | | | | | |
| (Cost $14,960,039) | | | | 14,960,039 | | 14,960,039 |
| |
| |
| |
| |
| See accompanying notes which are an integral part of the financial statements. | | |
| | | 17 | | | | | | Annual Report |
| Investments continued | | | | | | |
| |
| |
| Purchased Options 0.1% | | | | | | |
| | | Expiration | | Underlying | | Value |
| | | Date/Strike Price | | Face Amount | | (Note 1) |
| |
| Russia – 0.1% | | | | | | |
| Lehman Brothers Holdings, Inc. Call | | | | | | |
| Option on $10,785,000 notional | | | | | | |
| amount of Russian Federation 5% | | | | | | |
| 3/31/30 (Reg. S) | | January 2006/ | | | | |
| (Cost $95,987) | | $111.38 | | $12,160,088 | | $ 163,932 |
| |
| TOTAL INVESTMENT PORTFOLIO 98.2% | | | | |
| (Cost $192,886,731) | | | | | | 202,538,270 |
| |
| NET OTHER ASSETS – 1.8% | | | | | | 3,699,464 |
| NET ASSETS 100% | | | | | | $ 206,237,734 |
| Security Type Abbreviations |
| FLIRB | — | Front Loaded Interest |
| | Reduction Bonds | | |
| Currency Abbreviations |
| COP | | — | | Colombian peso |
| EGP | | — | | Egyptian pound |
| HUF | | — | | Hungarian forint |
| PLN | | — | | Polish zloty (new) |
| TRY | | — | | New Turkish Lira |
| ZAR | | — | | South African rand |
Legend
(a) Affiliated fund that is available only to
investment companies and other
accounts managed by Fidelity
Investments. The rate quoted is the
annualized seven-day yield of the fund
at period end. A complete unaudited
listing of the fund’s holdings as of its
most recent quarter end is available
upon request.
(b) Non-income producing – Issuer is in
default.
|
(c) Principal amount is stated in United
States dollars unless otherwise noted.
(d) Debt obligation initially issued at one
coupon which converts to a higher
coupon at a specified date. The rate
shown is the rate at period end.
(e) Security exempt from registration under
Rule 144A of the Securities Act of 1933.
These securities may be resold in
transactions exempt from registration,
normally to qualified institutional buyers.
At the period end, the value of these
securities amounted to $16,373,730 or
7.9% of net assets.
(f) The coupon rate shown on floating or
adjustable rate securities represents the
rate at period end.
(g) Security is linked to Argentine Republic
Gross Domestic Product (GDP). Security
does not pay principal over life of
security or at expiration. Payments are
based on growth of Argentine GDP,
subject to certain conditions.
(h) Quantity represents share amount.
(i) Non-income producing.
|
See accompanying notes which are an integral part of the financial statements.
Annual Report 18
Affiliated Central Funds
Information regarding income received by the fund from the affiliated Central funds during the period is as follows:
| Fund | | | | Income received |
| Fidelity Cash Central Fund | | | $ | 242,938 |
Other Information
The composition of credit quality ratings as a percentage of net assets is as follows (ratings are unaudited):
| U.S.Government and | | |
| U.S.Government Agency | | |
| Obligations | | 2.1% |
| AAA, AA, A | | 3.7% |
| BBB | | 19.5% |
| BB | | 34.8% |
| B | | 21.2% |
| CCC, CC, C | | 2.6% |
| Not Rated | | 4.3% |
| Equities | | 1.6% |
| Other Investments | | 0.1% |
| Short Term Investments and Net | | |
| Other Assets | | 10.1% |
| | | 100.0% |
We have used ratings from Moody’s® Investors Services, Inc. Where Moody’s ratings are not available, we have used S&P® ratings. Percentages are adjusted for the effect of futures contracts, if applicable.
See accompanying notes which are an integral part of the financial statements.
19 Annual Report
| Financial Statements | | | | | | | | |
| |
| |
| Statement of Assets and Liabilities | | | | | | | | |
| | | | | | | December 31, 2005 |
| |
| Assets | | | | | | | | |
| Investment in securities, at value See accompanying | | | | | | | | |
| schedule: | | | | | | | | |
| Unaffiliated issuers (cost $177,926,692) | | $ | | 187,578,231 | | | | |
| Affiliated Central Funds (cost $14,960,039) | | | | 14,960,039 | | | | |
| Total Investments (cost $192,886,731) | | | | | | $ | | 202,538,270 |
| Receivable for investments sold | | | | | | | | 54,600 |
| Receivable for fund shares sold | | | | | | | | 434,087 |
| Interest receivable | | | | | | | | 4,249,458 |
| Prepaid expenses | | | | | | | | 898 |
| Receivable from investment adviser for expense | | | | | | | | |
| reductions | | | | | | | | 43,563 |
| Other affiliated receivables | | | | | | | | 52 |
| Other receivables | | | | | | | | 46,605 |
| Total assets | | | | | | | | 207,367,533 |
| |
| Liabilities | | | | | | | | |
| Payable for investments purchased | | $ | | 61,604 | | | | |
| Payable for fund shares redeemed | | | | 397,911 | | | | |
| Distributions payable | | | | 366,670 | | | | |
| Accrued management fee | | | | 114,553 | | | | |
| Distribution fees payable | | | | 60,632 | | | | |
| Other affiliated payables | | | | 53,889 | | | | |
| Other payables and accrued expenses | | | | 74,540 | | | | |
| Total liabilities | | | | | | | | 1,129,799 |
| |
| Net Assets | | | | | | $ | | 206,237,734 |
| Net Assets consist of: | | | | | | | | |
| Paid in capital | | | | | | $ | | 194,110,553 |
| Undistributed net investment income | | | | | | | | 893,378 |
| Accumulated undistributed net realized gain (loss) on | | | | | | | | |
| investments and foreign currency transactions | | | | | | | | 1,602,542 |
| Net unrealized appreciation (depreciation) on | | | | | | | | |
| investments and assets and liabilities in foreign | | | | | | | | |
| currencies | | | | | | | | 9,631,261 |
| Net Assets | | | | | | $ | | 206,237,734 |
See accompanying notes which are an integral part of the financial statements.
| Statement of Assets and Liabilities continued | | | | |
| | | December 31, 2005 |
| |
| Calculation of Maximum Offering Price | | | | |
| Class A: | | | | |
| Net Asset Value and redemption price per share | | | | |
| ($42,835,866 ÷ 3,537,191 shares) | | $ | | 12.11 |
| |
| Maximum offering price per share (100/95.25 of $12.11) | | $ | | 12.71 |
| Class T: | | | | |
| Net Asset Value and redemption price per share | | | | |
| ($95,101,946 ÷ 7,872,953 shares) | | $ | | 12.08 |
| |
| Maximum offering price per share (100/96.50 of $12.08) | | $ | | 12.52 |
| Class B: | | | | |
| Net Asset Value and offering price per share | | | | |
| ($27,302,887 ÷ 2,238,709 shares)A | | $ | | 12.20 |
| |
| Class C: | | | | |
| Net Asset Value and offering price per share | | | | |
| ($18,862,557 ÷ 1,551,145 shares)A | | $ | | 12.16 |
| |
| Institutional Class: | | | | |
| Net Asset Value, offering price and redemption price per | | | | |
| share ($22,134,478 ÷ 1,848,028 shares) | | $ | | 11.98 |
| |
| A Redemption price per share is equal to net asset value less any applicable contingent deferred sales charge. | | | | |
See accompanying notes which are an integral part of the financial statements.
21 Annual Report
| Financial Statements continued | | | | |
| |
| |
| Statement of Operations | | | | | | |
| | | | | Year ended December 31, 2005 |
| |
| Investment Income | | | | | | |
| Dividends | | | | $ | | 136,813 |
| Interest | | | | | | 12,816,704 |
| Income from affiliated Central Funds | | | | | | 242,938 |
| Total income | | | | | | 13,196,455 |
| |
| Expenses | | | | | | |
| Management fee | | $ | | 1,243,893 | | |
| Transfer agent fees | | | | 511,562 | | |
| Distribution fees | | | | 682,500 | | |
| Accounting fees and expenses | | | | 101,603 | | |
| Independent trustees’ compensation | | | | 813 | | |
| Custodian fees and expenses | | | | 74,930 | | |
| Registration fees | | | | 72,709 | | |
| Audit | | | | 70,959 | | |
| Legal | | | | 46,151 | | |
| Miscellaneous | | | | 775 | | |
| Total expenses before reductions | | | | 2,805,895 | | |
| Expense reductions | | | | (357,006) | | 2,448,889 |
| |
| Net investment income | | | | | | 10,747,566 |
| Realized and Unrealized Gain (Loss) | | | | |
| Net realized gain (loss) on: | | | | | | |
| Investment securities: | | | | | | |
| Unaffiliated issuers | | | | 6,964,179 | | |
| Foreign currency transactions | | | | (77,039) | | |
| Total net realized gain (loss) | | | | | | 6,887,140 |
| Change in net unrealized appreciation (depreciation) on: | | | | |
| Investment securities | | | | 1,636,150 | | |
| Assets and liabilities in foreign currencies | | (23,654) | | |
| Total change in net unrealized appreciation | | | | |
| (depreciation) | | | | | | 1,612,496 |
| Net gain (loss) | | | | | | 8,499,636 |
| Net increase (decrease) in net assets resulting from | | | | |
| operations | | | | $ | | 19,247,202 |
See accompanying notes which are an integral part of the financial statements.
| Statement of Changes in Net Assets | | | | | | | | |
| | | | | Year ended | | | | Year ended |
| | | | | December 31, | | | | December 31, |
| | | | | 2005 | | | | 2004 |
| Increase (Decrease) in Net Assets | | | | | | | | |
| Operations | | | | | | | | |
| Net investment income | | $ | | 10,747,566 | | $ | | 9,178,608 |
| Net realized gain (loss) | | | | 6,887,140 | | | | 9,171,398 |
| Change in net unrealized appreciation (depreciation) . | | | | 1,612,496 | | | | (568,612) |
| Net increase (decrease) in net assets resulting | | | | | | | | |
| from operations | | | | 19,247,202 | | | | 17,781,394 |
| Distributions to shareholders from net investment income . | | | | (11,113,855) | | | | (9,584,714) |
| Distributions to shareholders from net realized gain | | | | (9,174,599) | | | | (3,077,366) |
| Total distributions | | | | (20,288,454) | | | | (12,662,080) |
| Share transactions - net increase (decrease) | | | | 33,854,076 | | | | 5,067,659 |
| Redemption fees | | | | 19,860 | | | | 22,324 |
| Total increase (decrease) in net assets | | | | 32,832,684 | | | | 10,209,297 |
| |
| Net Assets | | | | | | | | |
| Beginning of period | | | | 173,405,050 | | | | 163,195,753 |
| End of period (including undistributed net investment | | | | | | | | |
| income of $893,378 and undistributed net invest- | | | | | | | | |
| ment income of $1,636,710, respectively) | | $ | | 206,237,734 | | $ | | 173,405,050 |
See accompanying notes which are an integral part of the financial statements.
23 Annual Report
| Financial Highlights Class A | | | | | | | | | | | | |
| Years ended December 31, | | 2005 | | 2004 | | 2003 | | | | 2002 | | | | 2001 |
| Selected Per Share Data | | | | | | | | | | | | | | |
| Net asset value, beginning of | | | | | | | | | | | | | | |
| period | | $ 12.16 | | $ 11.70 | | $ 9.67 | | | | $9.37 | | | | $ 9.81 |
| Income from Investment | | | | | | | | | | | | | | |
| Operations | | | | | | | | | | | | | | |
| Net investment incomeC | | 727 | | .683 | | .802 | | | | .714F | | | | 1.030E,F |
| Net realized and | | | | | | | | | | | | | | |
| unrealized gain (loss) | | 556 | | .707 | | 2.064 | | | | .348F | | | | (.431)E,F |
| Total from investment | | | | | | | | | | | | | | |
| operations | | 1.283 | | 1.390 | | 2.866 | | | | 1.062 | | | | .599 |
| Distributions from net | | | | | | | | | | | | | | |
| investment income | | (.744) | | (.712) | | (.836) | | | | (.762) | | | | (1.039) |
| Distributions from net | | | | | | | | | | | | | | |
| realized gain | | (.590) | | (.220) | | — | | | | — | | | | — |
| Total distributions | | (1.334) | | (.932) | | (.836) | | | | (.762) | | | | (1.039) |
| Redemption fees added to | | | | | | | | | | | | | | |
| paid in capitalC | | 001 | | .002 | | — | | | | — | | | | — |
| Net asset value, end of | | | | | | | | | | | | | | |
| period | | $ 12.11 | | $ 12.16 | | $ 11.70 | | | | $ 9.67 | | | | $ 9.37 |
| Total ReturnA,B | | 11.15% | | 12.44% | | 30.43% | | | | 11.80% | | | | 6.35% |
| Ratios to Average Net AssetsD | | | | | | | | | | | | | | |
| Expenses before | | | | | | | | | | | | | | |
| reductions | | 1.31% | | 1.34% | | 1.32% | | | | 1.36% | | | | 1.45% |
| Expenses net of fee | | | | | | | | | | | | | | |
| waivers, if any | | 1.11% | | 1.34% | | 1.32% | | | | 1.36% | | | | 1.40% |
| Expenses net of all | | | | | | | | | | | | | | |
| reductions | | 1.11% | | 1.34% | | 1.32% | | | | 1.35% | | | | 1.40% |
| Net investment income | | 6.04% | | 5.86% | | 7.31% | | | | 7.56%F | | | | 10.66%E,F |
| Supplemental Data | | | | | | | | | | | | | | |
| Net assets, end of period | | | | | | | | | | | | | | |
| (000 omitted) | | $42,836 | | $28,854 | | $26,787 | | $13,920 | | | | $ 7,601 |
| Portfolio turnover rate | | 202% | | 238% | | 260% | | | | 222% | | | | 271% |
A Total returns would have been lower had certain expenses not been reduced during the periods shown.
B Total returns do not include the effect of the sales charges.
C Calculated based on average shares outstanding during the period.
D Expense ratios reflect operating expenses of the class. Expenses before reductions do not reflect amounts reimbursed by the investment adviser or
reductions from brokerage service arrangements or other expense offset arrangements and do not represent the amount paid by the class during
periods when reimbursements or reductions occur. Expenses net of fee waivers reflect expenses after reimbursement by the investment adviser but
prior to reductions from brokerage service arrangements or other expense offset arrangements. Expenses net of all reductions represent the net
expenses paid by the class.
E Effective January 1, 2001, the fund adopted the provisions of the AICPA Audit and Accounting Guide for Investment Companies and began
amortizing premium and discount on all debt securities. Per share data and ratios for periods prior to adoption have not been restated to reflect
this change.
F As a result of a revision to reflect accretion of market discount using the interest method, certain amounts for the years ended December 31,
2002 and December 31, 2001 have been reclassified from what was previously reported. The impact of this change for the years ended Decem
ber 31, 2002 and December 31, 2001 was a decrease to net investment income of $.057 and $.070 per share with a corresponding increase
to net realized and unrealized gain (loss) per share, respectively. The ratio of net investment income to average net assets decreased from 8.17%
and 11.39% to 7.56% and 10.66%, respectively. The reclassification has no impact on the net assets of the fund.
|
See accompanying notes which are an integral part of the financial statements.
Annual Report 24
| Financial Highlights Class T | | | | | | | | | | | | |
| Years ended December 31, | | 2005 | | 2004 | | 2003 | | | | 2002 | | | | 2001 |
| Selected Per Share Data | | | | | | | | | | | | | | |
| Net asset value, beginning of | | | | | | | | | | | | | | |
| period | | $ 12.14 | | $ 11.68 | | $ 9.66 | | | | $ 9.36 | | | | $ 9.80 |
| Income from Investment | | | | | | | | | | | | | | |
| Operations | | | | | | | | | | | | | | |
| Net investment incomeC | | 713 | | .670 | | .787 | | | | .706F | | | | 1.024E,F |
| Net realized and | | | | | | | | | | | | | | |
| unrealized gain (loss) | | 549 | | .708 | | 2.057 | | | | .346F | | | | (.435)E,F |
| Total from investment | | | | | | | | | | | | | | |
| operations | | 1.262 | | 1.378 | | 2.844 | | | | 1.052 | | | | .589 |
| Distributions from net | | | | | | | | | | | | | | |
| investment income | | (.733) | | (.700) | | (.824) | | | | (.752) | | | | (1.029) |
| Distributions from net | | | | | | | | | | | | | | |
| realized gain | | (.590) | | (.220) | | — | | | | — | | | | — |
| Total distributions | | (1.323) | | (.920) | | (.824) | | | | (.752) | | | | (1.029) |
| Redemption fees added to | | | | | | | | | | | | | | |
| paid in capitalC | | 001 | | .002 | | — | | | | — | | | | — |
| Net asset value, end of | | | | | | | | | | | | | | |
| period | | $ 12.08 | | $ 12.14 | | $ 11.68 | | | | $ 9.66 | | | | $ 9.36 |
| Total ReturnA,B | | 10.98% | | 12.35% | | 30.22% | | | | 11.70% | | | | 6.25% |
| Ratios to Average Net AssetsD | | | | | | | | | | | | | | |
| Expenses before | | | | | | | | | | | | | | |
| reductions | | 1.40% | | 1.44% | | 1.43% | | | | 1.47% | | | | 1.53% |
| Expenses net of fee | | | | | | | | | | | | | | |
| waivers, if any | | 1.21% | | 1.44% | | 1.43% | | | | 1.47% | | | | 1.50% |
| Expenses net of all | | | | | | | | | | | | | | |
| reductions | | 1.21% | | 1.44% | | 1.43% | | | | 1.46% | | | | 1.50% |
| Net investment income | | 5.94% | | 5.76% | | 7.20% | | | | 7.46%F | | | | 10.56%E,F |
| Supplemental Data | | | | | | | | | | | | | | |
| Net assets, end of period | | | | | | | | | | | | | | |
| (000 omitted) | | $95,102 | | $89,784 | | $82,811 | | $57,154 | | $46,740 |
| Portfolio turnover rate | | 202% | | 238% | | 260% | | | | 222% | | | | 271% |
A Total returns would have been lower had certain expenses not been reduced during the periods shown.
B Total returns do not include the effect of the sales charges.
C Calculated based on average shares outstanding during the period.
D Expense ratios reflect operating expenses of the class. Expenses before reductions do not reflect amounts reimbursed by the investment adviser or
reductions from brokerage service arrangements or other expense offset arrangements and do not represent the amount paid by the class during
periods when reimbursements or reductions occur. Expenses net of fee waivers reflect expenses after reimbursement by the investment adviser but
prior to reductions from brokerage service arrangements or other expense offset arrangements. Expenses net of all reductions represent the net
expenses paid by the class.
E Effective January 1, 2001, the fund adopted the provisions of the AICPA Audit and Accounting Guide for Investment Companies and began
amortizing premium and discount on all debt securities. Per share data and ratios for periods prior to adoption have not been restated to reflect
this change.
F As a result of a revision to reflect accretion of market discount using the interest method, certain amounts for the years ended December 31,
2002 and December 31, 2001 have been reclassified from what was previously reported. The impact of this change for the years ended Decem
ber 31, 2002 and December 31, 2001 was a decrease to net investment income of $.057 and $.071 per share with a corresponding increase
to net realized and unrealized gain (loss) per share, respectively. The ratio of net investment income to average net assets decreased from 8.06%
and 11.29% to 7.46% and 10.56%, respectively. The reclassification has no impact on the net assets of the fund.
|
See accompanying notes which are an integral part of the financial statements.
25 Annual Report
| Financial Highlights Class B | | | | | | | | | | | | |
| Years ended December 31, | | 2005 | | 2004 | | 2003 | | | | 2002 | | | | 2001 |
| Selected Per Share Data | | | | | | | | | | | | | | |
| Net asset value, beginning of | | | | | | | | | | | | | | |
| period | | $ 12.24 | | $ 11.77 | | $ 9.73 | | | | $ 9.42 | | | | $ 9.85 |
| Income from Investment | | | | | | | | | | | | | | |
| Operations | | | | | | | | | | | | | | |
| Net investment incomeC | | 640 | | .595 | | .719 | | | | .646F | | | | .968E,F |
| Net realized and | | | | | | | | | | | | | | |
| unrealized gain (loss) | | 562 | | .712 | | 2.071 | | | | .352F | | | | (.433)E,F |
| Total from investment | | | | | | | | | | | | | | |
| operations | | 1.202 | | 1.307 | | 2.790 | | | | .998 | | | | .535 |
| Distributions from net | | | | | | | | | | | | | | |
| investment income | | (.653) | | (.619) | | (.750) | | | | (.688) | | | | (.965) |
| Distributions from net | | | | | | | | | | | | | | |
| realized gain | | (.590) | | (.220) | | — | | | | — | | | | — |
| Total distributions | | (1.243) | | (.839) | | (.750) | | | | (.688) | | | | (.965) |
| Redemption fees added to | | | | | | | | | | | | | | |
| paid in capitalC | | 001 | | .002 | | — | | | | — | | | | — |
| Net asset value, end of | | | | | | | | | | | | | | |
| period | | $ 12.20 | | $ 12.24 | | $ 11.77 | | | | $ 9.73 | | | | $ 9.42 |
| Total ReturnA,B | | 10.34% | | 11.56% | | 29.34% | | | | 10.99% | | | | 5.62% |
| Ratios to Average Net AssetsD | | | | | | | | | | | | | | |
| Expenses before | | | | | | | | | | | | | | |
| reductions | | 2.12% | | 2.13% | | 2.09% | | | | 2.13% | | | | 2.22% |
| Expenses net of fee | | | | | | | | | | | | | | |
| waivers, if any | | 1.86% | | 2.13% | | 2.09% | | | | 2.13% | | | | 2.15% |
| Expenses net of all | | | | | | | | | | | | | | |
| reductions | | 1.86% | | 2.13% | | 2.09% | | | | 2.12% | | | | 2.15% |
| Net investment income | | 5.28% | | 5.07% | | 6.53% | | | | 6.79%F | | | | 9.91%E,F |
| Supplemental Data | | | | | | | | | | | | | | |
| Net assets, end of period | | | | | | | | | | | | | | |
| (000 omitted) | | $27,303 | | $27,238 | | $30,088 | | $20,903 | | $15,736 |
| Portfolio turnover rate | | 202% | | 238% | | 260% | | | | 222% | | | | 271% |
A Total returns would have been lower had certain expenses not been reduced during the periods shown.
B Total returns do not include the effect of the contingent deferred sales charge.
C Calculated based on average shares outstanding during the period.
D Expense ratios reflect operating expenses of the class. Expenses before reductions do not reflect amounts reimbursed by the investment adviser or
reductions from brokerage service arrangements or other expense offset arrangements and do not represent the amount paid by the class during
periods when reimbursements or reductions occur. Expenses net of fee waivers reflect expenses after reimbursement by the investment adviser but
prior to reductions from brokerage service arrangements or other expense offset arrangements. Expenses net of all reductions represent the net
expenses paid by the class.
E Effective January 1, 2001, the fund adopted the provisions of the AICPA Audit and Accounting Guide for Investment Companies and began
amortizing premium and discount on all debt securities. Per share data and ratios for periods prior to adoption have not been restated to reflect
this change.
F As a result of a revision to reflect accretion of market discount using the interest method, certain amounts for the years ended December 31,
2002 and December 31, 2001 have been reclassified from what was previously reported. The impact of this change for the years ended Decem
ber 31, 2002 and December 31, 2001 was a decrease to net investment income of $.057 and $.071 per share with a corresponding increase
to net realized and unrealized gain (loss) per share, respectively. The ratio of net investment income to average net assets decreased from 7.39%
and 10.64% to 6.79% and 9.91%, respectively. The reclassification has no impact on the net assets of the fund.
|
See accompanying notes which are an integral part of the financial statements.
Annual Report 26
| Financial Highlights Class C | | | | | | | | | | | | |
| Years ended December 31, | | 2005 | | 2004 | | 2003 | | | | 2002 | | | | 2001 |
| Selected Per Share Data | | | | | | | | | | | | | | |
| Net asset value, beginning of | | | | | | | | | | | | | | |
| period | | $ 12.21 | | $ 11.74 | | $ 9.71 | | | | $ 9.40 | | | | $ 9.84 |
| Income from Investment | | | | | | | | | | | | | | |
| Operations | | | | | | | | | | | | | | |
| Net investment incomeC | | 627 | | .585 | | .709 | | | | .633F | | | | .954E,F |
| Net realized and | | | | | | | | | | | | | | |
| unrealized gain (loss) | | 553 | | .715 | | 2.060 | | | | .355F | | | | (.438)E,F |
| Total from investment | | | | | | | | | | | | | | |
| operations | | 1.180 | | 1.300 | | 2.769 | | | | .988 | | | | .516 |
| Distributions from net | | | | | | | | | | | | | | |
| investment income | | (.641) | | (.612) | | (.739) | | | | (.678) | | | | (.956) |
| Distributions from net | | | | | | | | | | | | | | |
| realized gain | | (.590) | | (.220) | | — | | | | — | | | | — |
| Total distributions | | (1.231) | | (.832) | | (.739) | | | | (.678) | | | | (.956) |
| Redemption fees added to | | | | | | | | | | | | | | |
| paid in capitalC | | 001 | | .002 | | — | | | | — | | | | — |
| Net asset value, end of | | | | | | | | | | | | | | |
| period | | $ 12.16 | | $ 12.21 | | $ 11.74 | | | | $ 9.71 | | | | $ 9.40 |
| Total ReturnA,B | | 10.17% | | 11.53% | | 29.18% | | | | 10.90% | | | | 5.43% |
| Ratios to Average Net AssetsD | | | | | | | | | | | | | | |
| Expenses before | | | | | | | | | | | | | | |
| reductions | | 2.16% | | 2.19% | | 2.19% | | | | 2.24% | | | | 2.32% |
| Expenses net of fee | | | | | | | | | | | | | | |
| waivers, if any | | 1.96% | | 2.19% | | 2.19% | | | | 2.24% | | | | 2.25% |
| Expenses net of all | | | | | | | | | | | | | | |
| reductions | | 1.96% | | 2.19% | | 2.19% | | | | 2.23% | | | | 2.25% |
| Net investment income | | 5.19% | | 5.01% | | 6.43% | | | | 6.69%F | | | | 9.81%E,F |
| Supplemental Data | | | | | | | | | | | | | | |
| Net assets, end of period | | | | | | | | | | | | | | |
| (000 omitted) | | $18,863 | | $14,606 | | $12,516 | | | | $ 6,641 | | $ 3,411 |
| Portfolio turnover rate | | 202% | | 238% | | 260% | | | | 222% | | | | 271% |
A Total returns would have been lower had certain expenses not been reduced during the periods shown.
B Total returns do not include the effect of the contingent deferred sales charge.
C Calculated based on average shares outstanding during the period.
D Expense ratios reflect operating expenses of the class. Expenses before reductions do not reflect amounts reimbursed by the investment adviser or
reductions from brokerage service arrangements or other expense offset arrangements and do not represent the amount paid by the class during
periods when reimbursements or reductions occur. Expenses net of fee waivers reflect expenses after reimbursement by the investment adviser but
prior to reductions from brokerage service arrangements or other expense offset arrangements. Expenses net of all reductions represent the net
expenses paid by the class.
E Effective January 1, 2001, the fund adopted the provisions of the AICPA Audit and Accounting Guide for Investment Companies and began
amortizing premium and discount on all debt securities. Per share data and ratios for periods prior to adoption have not been restated to reflect
this change.
F As a result of a revision to reflect accretion of market discount using the interest method, certain amounts for the years ended December 31,
2002 and December 31, 2001 have been reclassified from what was previously reported. The impact of this change for the years ended Decem
ber 31, 2002 and December 31, 2001 was a decrease to net investment income of $.057 and $.071 per share with a corresponding increase
to net realized and unrealized gain (loss) per share, respectively. The ratio of net investment income to average net assets decreased from 7.29%
and 10.54% to 6.69% and 9.81%, respectively. The reclassification has no impact on the net assets of the fund.
|
See accompanying notes which are an integral part of the financial statements.
27 Annual Report
| Financial Highlights Institutional Class | | | | | | | | |
| Years ended December 31, | | 2005 | | 2004 | | 2003 | | | | 2002 | | | | 2001 |
| Selected Per Share Data | | | | | | | | | | | | | | |
| Net asset value, beginning of | | | | | | | | | | | | | | |
| period | | $ 12.04 | | $ 11.60 | | $ 9.60 | | | | $ 9.30 | | | | $ 9.75 |
| Income from Investment | | | | | | | | | | | | | | |
| Operations | | | | | | | | | | | | | | |
| Net investment incomeB | | 739 | | .712 | | .820 | | | | .736E | | | | 1.048D,E |
| Net realized and | | | | | | | | | | | | | | |
| unrealized gain (loss) | | 554 | | .694 | | 2.045 | | | | .352E | | | | (.437)D,E |
| Total from investment | | | | | | | | | | | | | | |
| operations | | 1.293 | | 1.406 | | 2.865 | | | | 1.088 | | | | .611 |
| Distributions from net | | | | | | | | | | | | | | |
| investment income | | (.764) | | (.748) | | (.865) | | | | (.788) | | | | (1.061) |
| Distributions from net | | | | | | | | | | | | | | |
| realized gain | | (.590) | | (.220) | | — | | | | — | | | | — |
| Total distributions | | (1.354) | | (.968) | | (.865) | | | | (.788) | | | | (1.061) |
| Redemption fees added to | | | | | | | | | | | | | | |
| paid in capitalB | | 001 | | .002 | | — | | | | — | | | | — |
| Net asset value, end of | | | | | | | | | | | | | | |
| period | | $ 11.98 | | $ 12.04 | | $ 11.60 | | | | $ 9.60 | | | | $ 9.30 |
| Total ReturnA | | 11.37% | | 12.72% | | 30.69% | | | | 12.21% | | | | 6.53% |
| Ratios to Average Net AssetsC | | | | | | | | | | | | |
| Expenses before | | | | | | | | | | | | | | |
| reductions | | 1.01% | | 1.03% | | 1.06% | | | | 1.09% | | | | 1.17% |
| Expenses net of fee | | | | | | | | | | | | | | |
| waivers, if any | | 95% | | 1.03% | | 1.06% | | | | 1.09% | | | | 1.17% |
| Expenses net of all | | | | | | | | | | | | | | |
| reductions | | 95% | | 1.03% | | 1.06% | | | | 1.08% | | | | 1.17% |
| Net investment income | | 6.20% | | 6.17% | | 7.56% | | | | 7.83%E | | | | 10.89%D,E |
| Supplemental Data | | | | | | | | | | | | | | |
| Net assets, end of period | | | | | | | | | | | | | | |
| (000 omitted) | | $22,134 | | $12,924 | | $10,993 | | | | $ 8,386 | | | | $ 7,028 |
| Portfolio turnover rate | | 202% | | 238% | | 260% | | | | 222% | | | | 271% |
A Total returns would have been lower had certain expenses not been reduced during the periods shown.
B Calculated based on average shares outstanding during the period.
C Expense ratios reflect operating expenses of the class. Expenses before reductions do not reflect amounts reimbursed by the investment adviser or
reductions from brokerage service arrangements or other expense offset arrangements and do not represent the amount paid by the class during
periods when reimbursements or reductions occur. Expenses net of fee waivers reflect expenses after reimbursement by the investment adviser but
prior to reductions from brokerage service arrangements or other expense offset arrangements. Expenses net of all reductions represent the net
expenses paid by the class.
D Effective January 1, 2001, the fund adopted the provisions of the AICPA Audit and Accounting Guide for Investment Companies and began
amortizing premium and discount on all debt securities. Per share data and ratios for periods prior to adoption have not been restated to reflect
this change.
E As a result of a revision to reflect accretion of market discount using the interest method, certain amounts for the years ended December 31,
2002 and December 31, 2001 have been reclassified from what was previously reported. The impact of this change for the years ended Decem
ber 31, 2002 and December 31, 2001 was a decrease to net investment income of $.057 and $.070 per share with a corresponding increase
to net realized and unrealized gain (loss) per share, respectively. The ratio of net investment income to average net assets decreased from 8.44%
and 11.62% to 7.83% and 10.89%, respectively. The reclassification has no impact on the net assets of the fund.
|
See accompanying notes which are an integral part of the financial statements.
Annual Report 28
Notes to Financial Statements
For the period ended December 31, 2005
|
1. Significant Accounting Policies.
Fidelity Advisor Emerging Markets Income Fund (the fund) is a non diversified fund of Fidelity Advisor Series VIII (the trust) and is authorized to issue an unlimited number of shares. The trust is registered under the Investment Company Act of 1940, as amended (the 1940 Act), as an open end management investment company organized as a Massa chusetts business trust.
The fund offers Class A, Class T, Class B, Class C, and Institutional Class shares, each of which has equal rights as to assets and voting privileges. Each class has exclusive voting rights with respect to matters that affect that class. Class B shares will automatically convert to Class A shares after a holding period of seven years from the initial date of purchase. Investment income, realized and unrealized capital gains and losses, the common expenses of the fund, and certain fund level expense reductions, if any, are allocated on a pro rata basis to each class based on the relative net assets of each class to the total net assets of the fund. Each class differs with respect to transfer agent and distribution and service plan fees incurred. Certain expense reductions also differ by class.
The fund may invest in affiliated money market central funds (Money Market Central Funds), which are open end investment companies available to investment companies and other accounts managed by Fidelity Management & Research Company (FMR) and its affiliates. The financial statements have been prepared in conformity with accounting principles generally accepted in the United States of America, which require manage ment to make certain estimates and assumptions at the date of the financial statements. The following summarizes the significant accounting policies of the fund:
Security Valuation. Investments are valued and net asset value per share is calculated (NAV calculation) as of the close of business of the New York Stock Exchange, normally 4:00 p.m. Eastern time. Wherever possible, the fund uses independent pricing services approved by the Board of Trustees to value its investments. Debt securities, including restricted securities, for which quotations are readily available, are valued by indepen dent pricing services or by dealers who make markets in such securities. Pricing services consider yield or price of bonds of comparable quality, coupon, maturity and type as well as dealer supplied prices. Equity securities, including restricted securities, for which market quotations are readily available, are valued at the last reported sale price or official closing price as reported by an independent pricing service on the primary market or exchange on which they are traded. In the event there were no sales during the day or closing prices are not available, securities are valued at the last quoted bid price.
29 Annual Report
| Notes to Financial Statements continued |
| |
| 1. Significant Accounting Policies continued |
Security Valuation continued |
When current market prices or quotations are not readily available or do not accurately reflect fair value, valuations may be determined in accordance with procedures adopted by the Board of Trustees. The frequency of when fair value pricing is used is unpredict able. The value of securities used for NAV calculation under fair value pricing may differ from published prices for the same securities. Investments in open end mutual funds are valued at their closing net asset value each business day. Short term securities with remaining maturities of sixty days or less for which quotations are not readily available are valued at amortized cost, which approximates value.
Foreign Currency. The fund uses foreign currency contracts to facilitate transactions in foreign denominated securities. Losses from these transactions may arise from changes in the value of the foreign currency or if the counterparties do not perform under the contracts’ terms.
Foreign denominated assets, including investment securities, and liabilities are trans lated into U.S. dollars at the exchange rate at period end. Purchases and sales of invest ment securities, income and dividends received and expenses denominated in foreign currencies are translated into U.S. dollars at the exchange rate in effect on the transac tion date.
The effects of exchange rate fluctuations on investments are included with the net realized and unrealized gain (loss) on investment securities. Other foreign currency transactions resulting in realized and unrealized gain (loss) are disclosed separately.
Investment Transactions and Income. Security transactions are accounted for as of trade date. Gains and losses on securities sold are determined on the basis of identified cost and may include proceeds received from litigation. Dividend income is recorded on the ex dividend date, except for certain dividends from foreign securities where the ex dividend date may have passed, which are recorded as soon as the fund is informed of the ex dividend date. Non cash dividends included in dividend income, if any, are recorded at the fair market value of the securities received. Interest income is accrued as earned. Interest income includes coupon interest and amortization of premium and accretion of discount on debt securities. Investment income is recorded net of foreign taxes withheld where recovery of such taxes is uncertain. Debt obligations may be placed on non accrual status and related interest income may be reduced by ceasing current accruals and writing off interest receivables when the collection of all or a portion of interest has become doubtful based on consistently applied procedures. A debt obligation is removed from non accrual status when the issuer resumes interest payments or when collectibility of interest is reasonably assured.
1. Significant Accounting Policies continued
Expenses. Most expenses of the trust can be directly attributed to a fund. Expenses which cannot be directly attributed are apportioned among each fund in the trust.
Income Tax Information and Distributions to Shareholders. Each year, the fund intends to qualify as a regulated investment company by distributing all of its taxable income and realized gains under Subchapter M of the Internal Revenue Code. As a result, no provision for income taxes is required in the accompanying financial statements. Foreign taxes are provided for based on the fund’s understanding of the tax rules and rates that exist in the foreign markets in which it invests.
Dividends are declared daily and paid monthly from net investment income. Distribu tions from realized gains, if any, are recorded on the ex dividend date. Income dividends and capital gain distributions are declared separately for each class. Income and capital gain distributions are determined in accordance with income tax regulations, which may differ from generally accepted accounting principles. In addition, the fund will claim a portion of the payment made to redeeming shareholders as a distribution for income tax purposes.
Capital accounts within the financial statements are adjusted for permanent book tax differences. These adjustments have no impact on net assets or the results of operations. Temporary book tax differences will reverse in a subsequent period.
Book tax differences are primarily due to foreign currency transactions, defaulted bonds, market discount, deferred trustees compensation and losses deferred due to wash sales.
The tax basis components of distributable earnings and the federal tax cost as of period end were as follows:
| Unrealized appreciation | | $ | | 11,717,349 | | | | |
| Unrealized depreciation | | | | (1,615,885) | | | | |
| Net unrealized appreciation (depreciation) . | | | | 10,101,464 | | | | |
| Undistributed ordinary income | | | | 630,686 | | | | |
| Undistributed long term capital gain | | | | 521,796 | | | | |
| |
| Cost for federal income tax purposes | | $ | | 192,436,806 | | | | |
| |
The tax character of distributions paid was as follows:
| | | | |
| | | | | December 31, 2005 | | | | December 31, 2004 |
| Ordinary Income | | $ | | 16,433,265 | | $ | | 10,423,995 |
| Long term Capital Gains | | | | 3,855,189 | | | | 2,238,085 |
| Total | | $ | | 20,288,454 | | $ | | 12,662,080 |
31 Annual Report
| Notes to Financial Statements continued |
1. Significant Accounting Policies continued |
Short Term Trading (Redemption) Fees. Shares held in the fund less than 90 days are subject to a redemption fee equal to 1.00% of the proceeds of the redeemed shares. All redemption fees, including any estimated redemption fees paid by FMR, are retained by the fund and accounted for as an addition to paid in capital.
Repurchase Agreements. FMR has received an Exemptive Order from the Securities and Exchange Commission (the SEC) which permits the fund and other affiliated entities of FMR to transfer uninvested cash balances into joint trading accounts which are then invested in repurchase agreements. The fund may also invest directly with institutions in repurchase agreements. Repurchase agreements are collateralized by government or non government securities. Collateral is held in segregated accounts with custodian banks and may be obtained in the event of a default of the counterparty. The fund monitors, on a daily basis, the value of the collateral to ensure it is at least equal to the principal amount of the repurchase agreement (including accrued interest). In the event of a default by the counterparty, realization of the collateral proceeds could be delayed, during which time the value of the collateral may decline.
Options. The fund may use options to manage its exposure to the bond market and to fluctuations in interest rates. Writing puts and buying calls tend to increase a fund’s exposure to the underlying instrument. Buying puts and writing calls tend to decrease a fund’s exposure to the underlying instrument, or hedge other fund investments. The underlying face amount at value of any open options at period end is shown in the Schedule of Investments under the caption “Purchased Options.” This amount reflects each contract’s exposure to the underlying instrument at period end. Losses may arise from changes in the value of the underlying instruments, if there is an illiquid secondary market for the contracts, or if the counterparties do not perform under the contracts’ terms. Gains and losses are realized upon the expiration or closing of the options. Realized gains (losses) on purchased options are included in realized gains (losses) on investment securities.
Exchange traded options are valued using the last sale price or, in the absence of a sale, the last offering price. Options traded over the counter are valued using dealer supplied valuations.
Restricted Securities. The fund may invest in securities that are subject to legal or contractual restrictions on resale. These securities generally may be resold in transac tions exempt from registration or to the public if the securities are registered. Disposal of these securities may involve time consuming negotiations and expense, and prompt sale
2. Operating Policies continued
Restricted Securities continued
at an acceptable price may be difficult. Information regarding restricted securities is included at the end of the fund’s Schedule of Investments.
Loans and Other Direct Debt Instruments. The fund may invest in loans and loan participations, trade claims or other receivables. These investments may include standby financing commitments, including revolving credit facilities, that obligate the fund to supply additional cash to the borrower on demand. Loan participations involve a risk of insolvency of the lending bank or other financial intermediary.
3. Purchases and Sales of Investments.
Purchases and sales of securities, other than short term securities and U.S. government securities, aggregated $362,967,524 and $338,996,893, respectively.
4. Fees and Other Transactions with Affiliates.
Management Fee. FMR and its affiliates provide the fund with investment manage ment related services for which the fund pays a monthly management fee. The manage ment fee is the sum of an individual fund fee rate that is based on an annual rate of .55% of the fund’s average net assets and a group fee rate that averaged .12% during the period. The group fee rate is based upon the average net assets of all the mutual funds advised by FMR. The group fee rate decreases as assets under management increase and increases as assets under management decrease. For the period, the total annual man agement fee rate was ..67% of the fund’s average net assets.
Distribution and Service Plan. In accordance with Rule 12b 1 of the 1940 Act, the fund has adopted separate Distribution and Service Plans for each class of shares. Certain classes pay Fidelity Distributors Corporation (FDC), an affiliate of FMR, separate Distribution and Service Fees, each of which is based on an annual percentage of each class’ average net assets. In addition, FDC may pay financial intermediaries for selling shares of the fund and providing shareholder support services. For the period, the Distribution and Service Fee rates and the total amounts paid to and retained by FDC were as follows:
| | | Distribution | | Service | | | | Paid to | | | | Retained |
| | | Fee | | Fee | | | | FDC | | | | by FDC |
| Class A | | 0% | | .15% | | $ | | 53,608 | | $ | | — |
| Class T | | 0% | | .25% | | | | 220,409 | | | | 1,166 |
| Class B | | 65% | | .25% | | | | 242,404 | | | | 175,264 |
| Class C | | 75% | | .25% | | | | 166,079 | | | | 41,597 |
| | | | | | | $ | | 682,500 | | $ | | 218,027 |
| |
| |
| |
| | | | | 33 | | | | | | | | Annual Report |
Notes to Financial Statements continued
| | |
| 4. Fees and Other Transactions with Affiliates continued |
Sales Load. FDC receives a front end sales charge of up to 4.75% for selling Class A shares, and 3.50% for selling Class T shares, some of which is paid to financial intermedi aries for selling shares of the fund. FDC receives the proceeds of contingent deferred sales charges levied on Class A, Class T, Class B, and Class C redemptions. These charges depend on the holding period. The deferred sales charges range from 5% to 1% for Class B, 1% for Class C, and ..25% for certain purchases of Class A and Class T shares.
For the period, sales charge amounts retained by FDC were as follows:
| | | | |
| | | | | Retained |
| | | | | by FDC |
| Class A | | | $ | 36,836 |
| Class T | | | | 17,986 |
| Class B* | | | | 47,343 |
| Class C* | | | | 3,266 |
| | | | $ | 105,431 |
* When Class B and Class C shares are initially sold, FDC pays commissions from its own resources to financial intermediaries through which the sales are made.
Transfer Agent Fees. Fidelity Investments Institutional Operations Company, Inc. (FIIOC), an affiliate of FMR, is the transfer, dividend disbursing and shareholder servic ing agent for each class of the fund. FIIOC receives account fees and asset based fees that vary according to the account size and type of account of the shareholders of the respective classes of the fund. FIIOC pays for typesetting, printing and mailing of share holder reports, except proxy statements. For the period the total transfer agent fees paid by each class to FIIOC, were as follows:
| | | | | | | % of |
| | | | | | | Average |
| | | | | Amount | | Net Assets |
| Class A | | | $ | 103,832 | | .29 |
| Class T | | | | 241,331 | | .27 |
| Class B | | | | 92,953 | | .35 |
| Class C | | | | 48,268 | | .29 |
| Institutional Class | | | | 25,178 | | .15 |
| | | | $ | 511,562 | | |
Accounting Fees. Fidelity Service Company, Inc. (FSC), an affiliate of FMR, maintains the fund’s accounting records. The fee is based on the level of average net assets for the month.
4. Fees and Other Transactions with Affiliates continued
Affiliated Central Funds. The fund may invest in Money Market Central Funds which seek preservation of capital and current income and are managed by Fidelity Invest ments Money Management, Inc. (FIMM), an affiliate of FMR.
The Money Market Central Funds do not pay a management fee.
5. Committed Line of Credit.
|
The fund participates with other funds managed by FMR in a $4.2 billion credit facility (the “line of credit”) to be utilized for temporary or emergency purposes to fund share holder redemptions or for other short term liquidity purposes. The fund has agreed to pay commitment fees on its pro rata portion of the line of credit. During the period, there were no borrowings on this line of credit.
FMR voluntarily agreed to reimburse each class to the extent annual operating expenses exceeded certain levels of average net assets as noted in the table below. Some expenses, for example interest expense, are excluded from this reimbursement.
The following classes were in reimbursement during the period:
| | | | |
| | | Expense | | | | Reimbursement |
| | | Limitations | | | | from adviser |
| Class A | | 1.40% - 1.10%* | | | $ | 71,608 |
| Class T | | 1.50% - 1.20%* | | | | 164,437 |
| Class B | | 2.15% - 1.85%* | | | | 68,633 |
| Class C | | 2.25% - 1.95%* | | | | 33,707 |
| Institutional Class | | 1.25% - .95%* | | | | 11,296 |
| | | | | | | | | | $ | 349,681 |
| |
| * Expense limitation in effect at period end. | | | | | | | | | | |
Many of the brokers with whom FMR places trades on behalf of the fund provided services to the fund in addition to trade execution. These services included payments of certain expenses on behalf of the fund totaling $1,487 for the period. In addition, through arrangements with the fund’s custodian, credits realized as a result of uninvested cash balances were used to reduce the fund’s expenses. During the period, these credits reduced the fund’s custody expenses by $5,838.
35 Annual Report
| Notes to Financial Statements continued |
7. Credit Risk. | | |
The fund’s relatively large investment in countries with limited or developing capital markets may involve greater risks than investments in more developed markets and the prices of such investments may be volatile. The yields of emerging market debt obliga tions reflect, among other things, perceived credit risk. The consequences of political, social or economic changes in these markets may have disruptive effects on the market prices of the fund’s investments and the income they generate, as well as the fund’s ability to repatriate such amounts.
The fund’s organizational documents provide former and current trustees and officers with a limited indemnification against liabilities arising in connection with the perfor mance of their duties to the fund. In the normal course of business, the fund may also enter into contracts that provide general indemnifications. The fund’s maximum expo sure under these arrangements is unknown as this would be dependent on future claims that may be made against the fund. The risk of material loss from such claims is considered remote.
| 9. Distributions to Shareholders. | | | | | | |
| |
Distributions to shareholders of each class were as follows:
| | | | |
| Years ended December 31, | | | | 2005 | | | | 2004 |
| From net investment income | | | | | | | | |
| Class A | | | $ | 2,239,106 | | | $ | 1,636,004 |
| Class T | | | | 5,403,868 | | | | 5,018,131 |
| Class B | | | | 1,451,279 | | | | 1,468,758 |
| Class C | | | | 891,722 | | | | 713,748 |
| Institutional Class | | | | 1,127,880 | | | | 748,073 |
| Total | | | $ | 11,113,855 | | | $ | 9,584,714 |
| From net realized gain | | | | | | | | |
| Class A | | | $ | 1,740,895 | | | $ | 515,470 |
| Class T | | | | 4,435,816 | | | | 1,592,837 |
| Class B | | | | 1,301,890 | | | | 480,548 |
| Class C | | | | 809,962 | | | | 258,210 |
| Institutional Class | | | | 886,036 | | | | 230,301 |
| Total | | | $ | 9,174,599 | | | $ | 3,077,366 |
| 10. Share Transactions. | | | | | | | | | | |
| |
Transactions for each class of shares were as follows:
| | | | | | | | |
| | | Shares | | | | Dollars |
| Years ended December 31, | | 2005 | | 2004 | | | | 2005 | | | | 2004 |
| Class A | | | | | | | | | | | | |
| Shares sold | | 1,580,185 | | 1,510,764 | | $ 19,087,388 | | $ 17,725,953 |
| Reinvestment of | | | | | | | | | | | | |
| distributions | | 282,049 | | 154,955 | | | | 3,406,044 | | | | 1,830,565 |
| Shares redeemed | | (697,498) | | (1,582,478) | | | | (8,439,651) | | (18,254,610) |
| Net increase (decrease) . | | 1,164,736 | | 83,241 | | $ 14,053,781 | | | | $ 1,301,908 |
| Class T | | | | | | | | | | | | |
| Shares sold | | 2,244,555 | | 2,875,509 | | $ 26,968,052 | | $ 33,458,189 |
| Reinvestment of | | | | | | | | | | | | |
| distributions | | 757,460 | | 514,849 | | | | 9,115,277 | | | | 6,065,232 |
| Shares redeemed | | (2,527,298) | | (3,081,142) | | (30,073,867) | | (35,341,114) |
| Net increase (decrease) . | | 474,717 | | 309,216 | | | | $ 6,009,462 | | | | $ 4,182,307 |
| Class B | | | | | | | | | | | | |
| Shares sold | | 495,665 | | 502,500 | | | | $ 6,012,880 | | | | $ 5,929,589 |
| Reinvestment of | | | | | | | | | | | | |
| distributions | | 183,667 | | 130,399 | | | | 2,229,627 | | | | 1,548,779 |
| Shares redeemed | | (666,010) | | (962,985) | | | | (8,048,875) | | (11,071,134) |
| Net increase (decrease) . | | 13,322 | | (330,086) | | | | $ 193,632 | | | | $ (3,592,766) |
| Class C | | | | | | | | | | | | |
| Shares sold | | 616,150 | | 546,717 | | | | $ 7,468,299 | | | | $ 6,424,102 |
| Reinvestment of | | | | | | | | | | | | |
| distributions | | 110,693 | | 61,717 | | | | 1,341,300 | | | | 732,776 |
| Shares redeemed | | (372,083) | | (477,712) | | | | (4,495,615) | | | | (5,473,363) |
| Net increase (decrease) . | | 354,760 | | 130,722 | | | | $ 4,313,984 | | | | $ 1,683,515 |
| Institutional Class | | | | | | | | | | | | |
| Shares sold | | 868,350 | | 244,377 | | $ 10,393,080 | | | | 2,843,978 |
| Reinvestment of | | | | | | | | | | | | |
| distributions | | 99,843 | | 62,861 | | | | 1,192,164 | | | | 734,483 |
| Shares redeemed | | (193,316) | | (181,844) | | | | (2,302,027) | | | | (2,085,766) |
| Net increase (decrease) . | | 774,877 | | 125,394 | | | | $ 9,283,217 | | | | $ 1,492,695 |
37 Annual Report
Report of Independent Registered Public Accounting Firm
To the Trustees of Fidelity Advisor Series VIII and the Shareholders of Fidelity Advisor Emerging Markets Income Fund:
In our opinion, the accompanying statement of assets and liabilities, including the sched ule of investments, and the related statements of operations and of changes in net assets and the financial highlights present fairly, in all material respects, the financial position of Fidelity Advisor Emerging Markets Income Fund (a fund of Fidelity Advisor Series VIII) at December 31, 2005 and the results of its operations, the changes in its net assets and the financial highlights for the periods indicated, in conformity with accounting principles generally accepted in the United States of America. These financial statements and financial highlights (hereafter referred to as “financial statements”) are the responsibility of the Fidelity Advisor Emerging Markets Income Fund’s management; our responsibility is to express an opinion on these financial statements based on our audits. We conducted our audits of these financial statements in accordance with the standards of the Public Company Accounting Oversight Board (United States). Those standards require that we plan and perform the audit to obtain reasonable assurance about whether the financial statements are free of material misstatement. An audit includes examining, on a test basis, evidence supporting the amounts and disclosures in the financial statements, assessing the accounting principles used and significant estimates made by management, and evaluating the overall financial statement presentation. We believe that our audits, which included confirmation of securities at December 31, 2005 by correspondence with the custodian and brokers, provide a reasonable basis for our opinion.
/s/ PricewaterhouseCoopers LLP
PricewaterhouseCoopers LLP
Boston, Massachusetts
February 9, 2006
|
Trustees and Officers
The Trustees, Member of the Advisory Board, and executive officers of the trust and fund, as applicable, are listed below. The Board of Trustees governs the fund and is responsible for protecting the interests of shareholders. The Trustees are experienced executives who meet periodically throughout the year to oversee the fund’s activities, review contractual arrangements with companies that provide services to the fund, and review the fund’s performance. Except for William O. McCoy and Albert R. Gamper, Jr., each of the Trustees oversees 326 funds advised by FMR or an affiliate. Mr. McCoy oversees 328 funds advised by FMR or an affiliate. Mr. Gamper oversees 235 funds advised by FMR or an affiliate.
The Trustees hold office without limit in time except that (a) any Trustee may resign; (b) any Trustee may be removed by written instrument, signed by at least two thirds of the number of Trustees prior to such removal; (c) any Trustee who requests to be retired or who has become incapacitated by illness or injury may be retired by written instru ment signed by a majority of the other Trustees; and (d) any Trustee may be removed at any special meeting of shareholders by a two thirds vote of the outstanding voting securities of the trust. Each Trustee who is not an interested person (as defined in the 1940 Act) (Independent Trustee), shall retire not later than the last day of the calendar year in which his or her 72nd birthday occurs. The Independent Trustees may waive this mandatory retirement age policy with respect to individual Trustees. The executive officers and Advisory Board Member hold office without limit in time, except that any officer and Advisory Board Member may resign or may be removed by a vote of a majority of the Trustees at any regular meeting or any special meeting of the Trustees. Except as indicated, each individual has held the office shown or other offices in the same company for the past five years.
The fund’s Statement of Additional Information (SAI) includes more information about the Trustees. To request a free copy, call Fidelity at 1-877-208-0098.
Correspondence intended for each Trustee who is an interested person may be sent to Fidelity Investments, 82 Devonshire Street, Boston, Massachusetts 02109.
| | Name, Age; Principal Occupation
Edward C. Johnson 3d (75)
|
Year of Election or Appointment: 1983
Mr. Johnson is Chairman of the Board of Trustees. Mr. Johnson serves as Chief Executive Officer, Chairman, and a Director of FMR Corp.; a Di rector and Chairman of the Board and of the Executive Committee of FMR; Chairman and a Director of Fidelity Management & Research (Far East) Inc.; Chairman and a Director of Fidelity Investments Money Man agement, Inc.; and Chairman (2001 present) and a Director (2000 present) of FMR Co., Inc.
39 Annual Report
Trustees and Officers - continued
| | Name, Age; Principal Occupation
Stephen P. Jonas (52)
|
Year of Election or Appointment: 2005
Mr. Jonas is Senior Vice President of Advisor Emerging Markets Income (2005 present). He also serves as Senior Vice President of other Fidelity funds (2005 present). Mr. Jonas is Executive Director of FMR
(2005 present). Previously, Mr. Jonas served as President of Fidelity En terprise Operations and Risk Services (2004 2005), Chief Administra tive Officer (2002 2004), and Chief Financial Officer of FMR Co. (1998 2000). Mr. Jonas has been with Fidelity Investments since 1987 and has held various financial and management positions including Chief Financial Officer of FMR. In addition, he serves on the Boards of Boston Ballet (2003 present) and Simmons College (2003 present).
Year of Election or Appointment: 2003
Mr. Reynolds is a Director (2003 present) and Chief Operating Officer (2002 present) of FMR Corp. He also serves on the Board at Fidelity Investments Canada, Ltd. (2000 present). Previously, Mr. Reynolds served as President of Fidelity Investments Institutional Retirement Group (1996 2000).
* Trustees have been determined to be “Interested Trustees” by virtue of, among other things, their affiliation with the trust or various entities under common control with FMR.
Correspondence intended for each Independent Trustee (that is, the Trustees other than the Interested Trustees) may be sent to Fidelity Investments, P.O. Box 55235, Boston, Massachusetts 02205 5235.
| | Name, Age; Principal Occupation
Dennis J. Dirks (57)
|
Year of Election or Appointment: 2005
Prior to his retirement in May 2003, Mr. Dirks was Chief Operating Officer and a member of the Board of The Depository Trust & Clearing Corporation (DTCC) (1999 2003). He also served as President, Chief Operating Officer, and Board member of The Depository Trust Com pany (DTC) (1999 2003) and President and Board member of the National Securities Clearing Corporation (NSCC) (1999 2003). In addi tion, Mr. Dirks served as Chief Executive Officer and Board member of the Government Securities Clearing Corporation (2001 2003) and Chief Executive Officer and Board member of the Mortgage Backed Securities Clearing Corporation (2001 2003). Mr. Dirks also serves as a Trustee of Manhattan College (2005 present).
Name, Age; Principal Occupation
Albert R. Gamper, Jr. (63)
|
Year of Election or Appointment: 2006
Mr. Gamper also serves as a Trustee (2006 present) or Member of the Advisory Board (2005 present) of other investment companies advised by FMR. Prior to his retirement in December 2004, Mr. Gamper served as Chairman of the Board of CIT Group Inc. (commercial finance). Dur ing his tenure with CIT Group Inc. Mr. Gamper served in numerous se nior management positions, including Chairman (1987 1989; 1999 2001; 2002 2004), Chief Executive Officer (1987 2004), and President (1989 2002). He currently serves as a member of the Board of Directors of Public Service Enterprise Group (utilities, 2001 present), Chairman of the Board of Governors, Rutgers University (2004 present), and Chairman of the Board of Saint Barnabas Health Care System.
Year of Election or Appointment: 1997
Dr. Gates is Chairman of the Independent Trustees (2006 present). Dr. Gates is President of Texas A&M University (2002 present). He was Director of the Central Intelligence Agency (CIA) from 1991 to 1993. From 1989 to 1991, Dr. Gates served as Assistant to the President of the United States and Deputy National Security Advisor. Dr. Gates is a Director of NACCO Industries, Inc. (mining and manufacturing), Parker Drilling Co., Inc. (drilling and rental tools for the energy industry, 2001 present), and Brinker International (restaurant management, 2003 present). Previously, Dr. Gates served as a Director of LucasVarity PLC (automotive components and diesel engines), a Director of TRW Inc. (automotive, space, defense, and information technology), and Dean of the George Bush School of Government and Public Service at Texas A&M University (1999 2001). Dr. Gates also is a Trustee of the Forum for International Policy.
41 Annual Report
Trustees and Officers - continued
| | Name, Age; Principal Occupation
George H. Heilmeier (69)
|
Year of Election or Appointment: 2004
Dr. Heilmeier is Chairman Emeritus of Telcordia Technologies (commu nication software and systems), where prior to his retirement, he served as company Chairman and Chief Executive Officer. He currently serves on the Boards of Directors of The Mitre Corporation (systems engineer ing and information technology support for the government), and HRL Laboratories (private research and development, 2004 present). He is Chairman of the General Motors Science & Technology Advisory Board and a Life Fellow of the Institute of Electrical and Electronics Engineers (IEEE) (2000 present). Dr. Heilmeier is a member of the Defense Science Board and the National Security Agency Advisory Board. He is also a member of the National Academy of Engineering, the American Acad emy of Arts and Sciences, and the Board of Overseers of the School of Engineering and Applied Science of the University of Pennsylvania. Pre viously, Dr. Heilmeier served as a Director of TRW Inc. (automotive, space, defense, and information technology, 1992 2002), Compaq (1994 2002), Automatic Data Processing, Inc. (ADP) (technology based business outsourcing, 1995 2002), INET Technologies Inc. (telecommu nications network surveillance, 2001 2004), and Teletech Holdings (cus tomer management services). He is the recipient of the 2005 Kyoto Prize in Advanced Technology for his invention of the liquid display.
Year of Election or Appointment: 2001
Prior to Ms. Knowles’ retirement in June 2000, she served as Executive Vice President and Chief Financial Officer of Atlantic Richfield Company (ARCO) (diversified energy, 1996 2000). From 1993 to 1996, she was a Senior Vice President of ARCO and President of ARCO Transportation Company. She served as a Director of ARCO from 1996 to 1998. She currently serves as a Director of Phelps Dodge Corporation (copper mining and manufacturing) and McKesson Corporation (healthcare ser vice, 2002 present). Ms. Knowles is a Trustee of the Brookings Institution and the Catalina Island Conservancy and also serves as a member of the Advisory Board for the School of Engineering of the University of Southern California.
Name, Age; Principal Occupation
Ned C. Lautenbach (61)
|
Year of Election or Appointment: 2000
Mr. Lautenbach has been a partner of Clayton, Dubilier & Rice, Inc. (private equity investment firm) since September 1998. Previously, Mr. Lautenbach was with the International Business Machines Corporation (IBM) from 1968 until his retirement in 1998. Mr. Lautenbach serves as a Director of Italtel Holding S.p.A. (telecommunications (Milan, Italy), 2004 present) and Eaton Corporation (diversified industrial) as well as the Philharmonic Center for the Arts in Naples, Florida. He also is a member of the Board of Trustees of Fairfield University (2005 present), as well as a member of the Council on Foreign Relations.
Year of Election or Appointment: 1997
Prior to his retirement in December 1994, Mr. McCoy was Vice Chair man of the Board of BellSouth Corporation (telecommunications) and President of BellSouth Enterprises. He is currently a Director of Liberty Corporation (holding company), Duke Realty Corporation (real estate), and Progress Energy, Inc. (electric utility). He is also a partner of Frank lin Street Partners (private investment management firm) and a member of the Research Triangle Foundation Board. In addition, Mr. McCoy served as the Interim Chancellor (1999 2000) and a member of the Board of Visitors for the University of North Carolina at Chapel Hill and currently serves on the Board of Directors of the University of North Carolina Health Care System and the Board of Visitors of the Kenan Flagler Business School (University of North Carolina at Chapel Hill). He also served as Vice President of Finance for the University of North Car olina (16 school system).
Year of Election or Appointment: 2005
Ms. Small is a member (2000 present) and Chairperson (2002 present) of the Investment Committee, and a member (2002 present) of the Board of Trustees of Smith College. Previously, she served as Chief In vestment Officer (1999 2000), Director of Global Equity Investments (1996 1999), and a member of the Board of Directors of Scudder, Ste vens & Clark (1990 1997) and Scudder Kemper Investments (1997 1998). In addition, Ms. Small served as Co Chair (2000 2003) of the Annual Fund for the Fletcher School of Law and Diplomacy.
43 Annual Report
Trustees and Officers - continued
| | Name, Age; Principal Occupation
William S. Stavropoulos (66)
|
Year of Election or Appointment: 2002
Mr. Stavropoulos is Chairman of the Board (2000 present) and a Mem ber of the Board of Directors of The Dow Chemical Company. Since joining The Dow Chemical Company in 1967, Mr. Stavropoulos served in numerous senior management positions, including President (1993 2000; 2002 2003), CEO (1995 2000; 2002 2004), and Chair man of the Executive Committee (2000 2004). Currently, he is a Direc tor of NCR Corporation (data warehousing and technology solutions), BellSouth Corporation (telecommunications), Chemical Financial Corpo ration, Maersk Inc. (industrial conglomerate, 2002 present), and Metal mark Capital (private equity investment firm, 2005 present). He also serves as a member of the Board of Trustees of the American Enterprise Institute for Public Policy Research. In addition, Mr. Stavropoulos is a member of The Business Council, J.P. Morgan International Council and the University of Notre Dame Advisory Council for the College of Science.
Year of Election or Appointment: 2005
Prior to his retirement in 2001, Mr. Wolfe was Chairman and Chief Executive Officer of Hershey Foods Corporation (1993 2001). He cur rently serves as a member of the boards of Adelphia Communications Corporation (2003 present), Bausch & Lomb, Inc., and Revlon Inc. (2004 present).
Advisory Board Member and Executive Officers:
Correspondence intended for each executive officer and Mr. Lynch may be sent to Fidelity Investments, 82 Devonshire Street, Boston, Massachusetts 02109.
| | Name, Age; Principal Occupation
Peter S. Lynch (61)
|
Year of Election or Appointment: 2003
Member of the Advisory Board of Fidelity Advisor Series VIII. Vice Chairman and a Director of FMR, and Vice Chairman (2001 present) and a Director (2000 present) of FMR Co., Inc. Previously, Mr. Lynch served as a Trustee of the Fidelity funds (1990 2003). In addition, he serves as a Trustee of Boston College, Massachusetts Eye & Ear Infir mary, Historic Deerfield, John F. Kennedy Library, and the Museum of Fine Arts of Boston.
Name, Age; Principal Occupation
Dwight D. Churchill (51)
|
Year of Election or Appointment: 2005
Vice President of Advisor Emerging Markets Income. Mr. Churchill also serves as Vice President of certain Equity Funds (2005 present) and certain High Income Funds (2005 present). Previously, he served as Head of Fidelity’s Fixed Income Division (2000 2005), Vice President of Fidelity’s Money Market Funds (2000 2005), Vice President of Fidelity’s Bond Funds, and Senior Vice President of FIMM (2000) and FMR. Mr. Churchill joined Fidelity in 1993 as Vice President and Group Leader of Taxable Fixed Income Investments.
Year of Election or Appointment: 1996
Vice President of Advisor Emerging Markets Income. Mr. Carlson serves as Vice President of another fund advised by FMR. Mr. Carlson also serves as Senior Vice President of FMR (2003) and FMR Co., Inc. (2003).
Year of Election or Appointment: 1998
Secretary of Advisor Emerging Markets Income. He also serves as Sec retary of other Fidelity funds; Vice President, General Counsel, and Sec retary of FMR Co., Inc. (2001 present) and FMR; Assistant Secretary of Fidelity Management & Research (U.K.) Inc. (2001 present), Fidelity Management & Research (Far East) Inc. (2001 present), and Fidelity Investments Money Management, Inc. (2001 present). Mr. Roiter is an Adjunct Member, Faculty of Law, at Boston College Law School (2003 present). Previously, Mr. Roiter served as Vice President and Sec retary of Fidelity Distributors Corporation (FDC) (1998 2005).
Year of Election or Appointment: 2003
Assistant Secretary of Advisor Emerging Markets Income. Mr. Fross also serves as Assistant Secretary of other Fidelity funds (2003 present), Vice President and Secretary of FDC (2005 present), and is an employee of FMR.
Year of Election or Appointment: 2004
President, Treasurer, and Anti Money Laundering (AML) officer of Advi sor Emerging Markets Income. Ms. Reynolds also serves as President, Treasurer, and AML officer of other Fidelity funds (2004) and is a Vice President (2003) and an employee (2002) of FMR. Before joining Fidelity Investments, Ms. Reynolds worked at PricewaterhouseCoopers LLP (PwC) (1980 2002), where she was most recently an audit partner with PwC’s investment management practice.
45 Annual Report
Trustees and Officers - continued
| | Name, Age; Principal Occupation
Paul M. Murphy (58)
|
Year of Election or Appointment: 2005
Chief Financial Officer of Advisor Emerging Markets Income. Mr. Murphy also serves as Chief Financial Officer of other Fidelity funds (2005 present). He also serves as Senior Vice President of Fidelity Pric ing and Cash Management Services Group (FPCMS).
| | Kenneth A. Rathgeber (58)
|
Year of Election or Appointment: 2004
Chief Compliance Officer of Advisor Emerging Markets Income. Mr. Rathgeber also serves as Chief Compliance Officer of other Fidelity funds (2004) and Executive Vice President of Risk Oversight for Fidelity Investments (2002). Previously, he served as Executive Vice President and Chief Operating Officer for Fidelity Investments Institutional Services Company, Inc. (1998 2002).
Year of Election or Appointment: 2003
Deputy Treasurer of Advisor Emerging Markets Income. Mr. Hebble also serves as Deputy Treasurer of other Fidelity funds (2003), and is an employee of FMR. Before joining Fidelity Investments, Mr. Hebble worked at Deutsche Asset Management where he served as Director of Fund Accounting (2002 2003) and Assistant Treasurer of the Scudder Funds (1998 2003).
Year of Election or Appointment: 2005
Deputy Treasurer of Advisor Emerging Markets Income. Mr. Mehrmann also serves as Deputy Treasurer of other Fidelity funds (2005 present) and is an employee of FMR. Previously, Mr. Mehrmann served as Vice President of Fidelity Investments Institutional Services Group (FIIS)/Fidelity Investments Institutional Operations Corporation, Inc. (FIIOC) Client Services (1998 2004).
| | Kimberley H. Monasterio (41)
|
Year of Election or Appointment: 2004
Deputy Treasurer of Advisor Emerging Markets Income. Ms. Monasterio also serves as Deputy Treasurer of other Fidelity funds (2004) and is an employee of FMR (2004). Before joining Fidelity Investments, Ms. Monasterio served as Treasurer (2000 2004) and Chief Financial Offi cer (2002 2004) of the Franklin Templeton Funds and Senior Vice Presi dent of Franklin Templeton Services, LLC (2000 2004).
Name, Age; Principal Occupation
Kenneth B. Robins (36)
|
Year of Election or Appointment: 2005
Deputy Treasurer of Advisor Emerging Markets Income. Mr. Robins also serves as Deputy Treasurer of other Fidelity funds (2005 present) and is an employee of FMR (2004 present). Before joining Fidelity Investments, Mr. Robins worked at KPMG LLP, where he was a partner in KPMG’s department of professional practice (2002 2004) and a Senior Man ager (1999 2000). In addition, Mr. Robins served as Assistant Chief Accountant, United States Securities and Exchange Commission (2000 2002).
Year of Election or Appointment: 2005
Assistant Treasurer of Advisor Emerging Markets Income. Mr. Byrnes also serves as Assistant Treasurer of other Fidelity funds (2005 present) and is an employee of FMR (2005 present). Previously, Mr. Byrnes served as Vice President of FPCMS (2003 2005). Before joining Fidelity Investments, Mr. Byrnes worked at Deutsche Asset Management where he served as Vice President of the Investment Operations Group (2000 2003).
Year of Election or Appointment: 1995
Assistant Treasurer of Advisor Emerging Markets Income. Mr. Costello also serves as Assistant Treasurer of other Fidelity funds and is an em ployee of FMR.
Year of Election or Appointment: 2004
Assistant Treasurer of Advisor Emerging Markets Income. Mr. Lydecker also serves as Assistant Treasurer of other Fidelity funds (2004) and is an employee of FMR.
Year of Election or Appointment: 2003
Assistant Treasurer of Advisor Emerging Markets Income. Mr. Osterheld also serves as Assistant Treasurer of other Fidelity funds (2002) and is an employee of FMR.
Year of Election or Appointment: 2005
Assistant Treasurer of Advisor Emerging Markets Income. Mr. Ryan also serves as Assistant Treasurer of other Fidelity funds (2005 present) and is an employee of FMR (2005 present). Previously, Mr. Ryan served as Vice President of Fund Reporting in FPCMS (1999 2005).
47 Annual Report
Trustees and Officers - continued
| | Name, Age; Principal Occupation
Salvatore Schiavone (40)
|
Year of Election or Appointment: 2005
Assistant Treasurer of Advisor Emerging Markets Income. Mr. Schiavone also serves as Assistant Treasurer of other Fidelity funds (2005 present) and is an employee of FMR (2005 present). Before joining Fidelity In vestments, Mr. Schiavone worked at Deutsche Asset Management, where he most recently served as Assistant Treasurer (2003 2005) of the Scudder Funds and Vice President and Head of Fund Reporting (1996 2003).
The Board of Trustees of Fidelity Advisor Emerging Markets Income voted to pay to shareholders of record at the opening of business on record date, the following distributions per share derived from capital gains realized from sales of portfolio securities:
| | | Pay Date | | Record Date | | Capital Gains |
| Class A | | 2/06/06 | | 2/03/06 | | $.067 |
| Class T | | 2/06/06 | | 2/03/06 | | $.067 |
| Class B | | 2/06/06 | | 2/03/06 | | $.067 |
| Class C | | 2/06/06 | | 2/03/06 | | $.067 |
The fund hereby designates as capital gain dividends with respect to the taxable year ended December 31, 2005, $2,334,344 or, if subsequently determined to be different, the net capital gain of such year.
The percentage of dividends distributed during the fiscal year representing income derived from sources within, and taxes paid to, foreign countries or possessions of the United States are as follows:
| | | Income | | Taxes |
| Class A | | 100% | | —% |
| Class T | | 100% | | —% |
| Class B | | 100% | | —% |
| Class C | | 100% | | —% |
The fund designates $4,444,699 of distributions paid during the fiscal year as qualify ing to be taxed as short term capital gain dividends for nonresident alien shareholders.
The fund will notify shareholders in January 2006 of amounts for use in preparing 2005 income tax returns.
49 Annual Report
51 Annual Report
53 Annual Report
Investment Adviser
Fidelity Management & Research Company
Boston, MA
Investment Sub Adviser
FMR Co., Inc.
Fidelity Management & Research
(U.K.) Inc.
Fidelity Management & Research
(Far East) Inc.
Fidelity Investments Japan Limited
Fidelity International Investment Advisors
Fidelity International Investment
Advisors (U.K.) Limited
General Distributor
Fidelity Distributors Corporation
Boston, MA
Transfer and Service Agents
Fidelity Investments Institutional
Operations Company, Inc.
Boston, MA
Fidelity Service Company, Inc.
Boston, MA
Custodian
JPMorgan Chase Bank
New York, NY
|
EMI-UANN-0206
1.787725.102
|


| | Fidelity® Advisor
Emerging Markets Income
Fund Institutional Class
|
| | Annual Report
Decemeber 31, 2005
|

| Contents | | | | |
| |
| Chairman’s Message | | 3 | | Ned Johnson’s message to shareholders. |
| Performance | | 4 | | How the fund has done over time. |
| Management’s Discussion | | 5 | | The manager’s review of fund |
| | | | | performance, strategy and outlook. |
| Shareholder Expense | | 6 | | An example of shareholder expenses. |
| Example | | | | |
| Investment Changes | | 8 | | A summary of major shifts in the fund’s |
| | | | | investments over the past six months. |
| Investments | | 9 | | A complete list of the fund’s investments |
| | | | | with their market values. |
| Financial Statements | | 19 | | Statements of assets and liabilities, |
| | | | | operations, and changes in net assets, |
| | | | | as well as financial highlights. |
| Notes | | 28 | | Notes to the financial statements. |
| Report of Independent | | 37 | | |
| Registered Public | | | | |
| Accounting Firm | | | | |
| Trustees and Officers | | 38 | | |
| Distributions | | 48 | | |
| | To view a fund’s proxy voting guidelines and proxy voting record for the 12 month period
ended June 30, visit www.fidelity.com/proxyvotingresults or visit the Securities and Exchange
Commission’s (SEC) web site at www.sec.gov. You may also call 1-877-208-0098 to request a free
copy of the proxy voting guidelines.
Standard & Poor’s, S&P and S&P 500 are registered service marks of The McGraw Hill Companies,
Inc. and have been licensed for use by Fidelity Distributors Corporation.
Other third party marks appearing herein are the property of their respective owners.
All other marks appearing herein are registered or unregistered trademarks or service marks
of FMR Corp. or an affiliated company.
This report and the financial statements contained herein are submitted for the general information
of the shareholders of the fund. This report is not authorized for distribution to prospective investors
in the fund unless preceded or accompanied by an effective prospectus.
A fund files its complete schedule of portfolio holdings with the SEC for the first and third
quarters of each fiscal year on Form N Q. Forms N Q are available on the SEC’s web site at
http://www.sec.gov. A fund’s Forms N Q may be reviewed and copied at the SEC’s Public Reference
Room in Washington, DC. Information regarding the operation of the SEC’s Public Reference
Room may be obtained by calling 1-800-SEC-0330. For a complete list of a fund’s portfolio hold
ings, view the most recent quarterly holdings report, semiannual report, or annual report on
Fidelity’s web site at http://www.advisor.fidelity.com.
NOT FDIC INSURED · MAY LOSE VALUE · NO BANK GUARANTEE
Neither the fund nor Fidelity Distributors Corporation is a bank.
|
Annual Report 2
Chairman’s Message
(photograph of Edward C. Johnson 3d)
Dear Shareholder:
During the past year or so, much has been reported about the mutual fund industry, and much of it has been more critical than I believe is warranted. Allegations that some companies have been less than forthright with their shareholders have cast a shadow on the entire industry. I continue to find these reports disturbing, and assert that they do not create an accurate picture of the industry overall. Therefore, I would like to remind every one where Fidelity stands on these issues. I will say two things specifically regarding allegations that some mutual fund companies were in violation of the Securities and Exchange Commission’s forward pricing rules or were involved in so called “market timing” activities.
First, Fidelity has no agreements that permit customers who buy fund shares after 4 p.m. to obtain the 4 p.m. price. This is not a new policy. This is not to say that some one could not deceive the company through fraudulent acts. However, we are extremely diligent in preventing fraud from occurring in this manner and in every other. But I underscore again that Fidelity has no so called “agreements” that sanction illegal practices.
Second, Fidelity continues to stand on record, as we have for years, in opposition to predatory short term trading that adversely affects shareholders in a mutual fund. Back in the 1980s, we initiated a fee which is returned to the fund and, therefore, to investors to discourage this activity. Further, we took the lead several years ago in developing a Fair Value Pricing Policy to prevent market timing on foreign securities in our funds. I am confident we will find other ways to make it more difficult for predatory traders to operate. However, this will only be achieved through close cooperation among regulators, legislators and the industry.
Yes, there have been unfortunate instances of unethical and illegal activity within the mutual fund industry from time to time. That is true of any industry. When this occurs, confessed or convicted offenders should be dealt with appropriately. But we are still concerned about the risk of over regulation and the quick application of simplistic solutions to intricate problems. Every system can be improved, and we support and applaud well thought out improvements by regulators, legislators and industry representatives that achieve the common goal of building and protecting the value of investors’ holdings.
For nearly 60 years, Fidelity has worked very hard to improve its products and service to justify your trust. When our family founded this company in 1946, we had only a few hundred customers. Today, we serve more than 18 million customers including individual investors and participants in retirement plans across America.
Let me close by saying that we do not take your trust in us for granted, and we realize that we must always work to improve all aspects of our service to you. In turn, we urge you to continue your active participation with your financial matters, so that your interests can be well served.
Best regards,
/s/ Edward C. Johnson 3d
Edward C. Johnson 3d
3 Annual Report
Performance: The Bottom Line
Average annual total return reflects the change in the value of an investment, assuming reinvestment of the class’ dividend income and capital gains (the profits earned upon the sale of securities that have grown in value) and assuming a constant rate of performance each year. The $10,000 table and the fund’s returns do not reflect the deduction of taxes that a shareholder would pay on fund distribu tions or the redemption of fund shares. During periods of reimbursement by Fidelity, a fund’s total return will be greater than it would be had the reimbursement not occurred. How a fund did yesterday is no guarantee of how it will do tomorrow.
| Average Annual Total Returns | | | | | | |
| Periods ended December 31, 2005 | | Past 1 | | Past 5 | | Past 10 |
| | | year | | years | | years |
| Institutional Class | | 11.37% | | 14.42% | | 14.63% |
| |
| $10,000 Over Life of Fund | | | | | | |
Let’s say hypothetically that $10,000 was invested in Fidelity® Advisor Emerging Markets Income Fund Institutional Class on December 31, 1995. The chart shows how the value of your investment would have changed, and also shows how the J.P. Morgan Emerging Markets Bond Index Global (EMBI Global) performed over the same period.
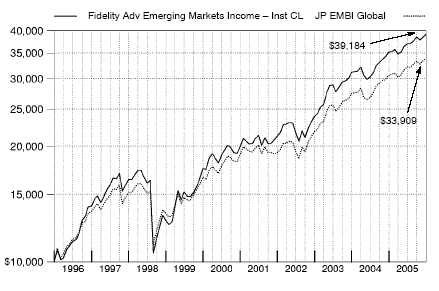
Annual Report 4
Management’s Discussion of Fund Performance
Comments from John Carlson, Portfolio Manager of Fidelity® Advisor Emerging Markets Income Fund
Emerging markets debt ran its streak of double digit returns to four consecutive years during the 12 month period ending December 31, 2005. In that time, the J.P. Morgan Emerging Markets Bond Index (EMBI) Global gained 10.73% . The asset class stumbled in early 2005, falling 1.28% in the first quarter. It recovered well, however, spurred by several factors. Many emerging markets economies improved; oil exporting countries benefited from record high prices for the commodity; many emerging markets nations received credit upgrades; global concerns about rising inflation and interest rates eased; and the debt category was attractive to investors seeking higher yields than U.S. Treasuries. The bonds continued their strong performance through the remainder of ’05, particularly the oil exporting Latin American nations. On an individual country level, the Dominican Republic one of the index’s smallest components was up 24.10%, while the Philippines rose 20.60% . Brazil and Russia, the largest and third largest country weightings, respectively, both gained slightly more than 13%, but Mexico, the second largest component, tempered the benchmark’s overall result with just an 8.08% increase.
For the 12 months that ended December 31, 2005, the fund’s Institutional Class shares rose 11.37%, outperforming the 10.73% return of the EMBI Global but marginally lagging the 11.76% return of the LipperSM Emerging Markets Debt Funds Average. Security selection in Egypt made the largest contribution to performance versus the index. The Egyptian currency the pound strengthened slightly but steadily throughout 2005. In this environment, the fund benefited from owning the country’s locally denominated debt. Investment grade Mexican debt posted a below benchmark return for the year. However, my security selection made a strong contribution to performance. The fund’s positioning in Brazilian debt, approximately 19% of the portfolio on average during the year, was the largest detractor, as underweighting longer maturity Brazilian bonds hurt relative perfor mance. The fund’s position in Ecuador also detracted, albeit to a much smaller extent. Political upheaval in the second quarter had ramifications for Ecuadoran debt.
The views expressed in this statement reflect those of the portfolio manager only through the end of the period of the report as stated on the cover and do not necessarily represent the views of Fidelity or any other person in the Fidelity organization. Any such views are subject to change at any time based upon market or other conditions and Fidelity disclaims any responsibility to update such views. These views may not be relied on as investment advice and, because investment decisions for a Fidelity fund are based on numerous factors, may not be relied on as an indication of trading intent on behalf of any Fidelity fund.
Shareholder Expense Example
As a shareholder of the Fund, you incur two types of costs: (1) transaction costs, including sales charges (loads) on purchase payments or redemption proceeds, redemption fees, and (2) ongoing costs, including management fees, distribution and/or service (12b 1) fees and other Fund expenses. This Example is intended to help you understand your ongoing costs (in dollars) of investing in the Fund and to compare these costs with the ongoing costs of investing in other mutual funds.
The Example is based on an investment of $1,000 invested at the beginning of the period and held for the entire period (July 1, 2005 to December 31, 2005).
The first line of the table below for each class of the Fund provides information about actual account values and actual expenses. You may use the information in this line, together with the amount you invested, to estimate the expenses that you paid over the period. Simply divide your account value by $1,000.00 (for example, an $8,600 account value divided by $1,000.00 = 8.6), then multiply the result by the number in the first line for a class of the Fund under the heading entitled “Expenses Paid During Period” to estimate the expenses you paid on your account during this period.
Hypothetical Example for Comparison Purposes
The second line of the table below for each class of the Fund provides information about hypothetical account values and hypothetical expenses based on a Class’ actual expense ratio and an assumed rate of return of 5% per year before expenses, which is not the Class’ actual return. The hypothetical account values and expenses may not be used to estimate the actual ending account balance or expenses you paid for the period. You may use this informa tion to compare the ongoing costs of investing in the Fund and other funds. To do so, compare this 5% hypothetical example with the 5% hypothetical examples that appear in the shareholder reports of the other funds.
Please note that the expenses shown in the table are meant to highlight your ongoing costs only and do not reflect any transaction costs. Therefore, the second line of the table is useful in comparing ongoing costs only, and will not help you determine the relative total costs of owning different funds. In addition, if these transactional costs were included, your costs would have been higher.
| | | | | | | | | | | Expenses Paid |
| | | | | Beginning | | Ending | | During Period* |
| | | | | Account Value | | Account Value | | July 1, 2005 to |
| | | | | July 1, 2005 | | December 31, 2005 | | December 31, 2005 |
| Class A | | | | | | | | | | | | |
| Actual | | | $ | 1,000.00 | | $ | | 1,057.50 | | $ | | 5.70 |
| HypotheticalA | | | $ | 1,000.00 | | $ | | 1,019.66 | | $ | | 5.60 |
| Class T | | | | | | | | | | | | |
| Actual | | | $ | 1,000.00 | | $ | | 1,057.10 | | $ | | 6.22 |
| HypotheticalA | | | $ | 1,000.00 | | $ | | 1,019.16 | | $ | | 6.11 |
| Class B | | | | | | | | | | | | |
| Actual | | | $ | 1,000.00 | | $ | | 1,053.90 | | $ | | 9.58 |
| HypotheticalA | | | $ | 1,000.00 | | $ | | 1,015.88 | | $ | | 9.40 |
| |
| |
| |
| Annual Report | | | | 6 | | | | | | | | |
| | | | | | | | | | | Expenses Paid |
| | | | | Beginning | | Ending | | During Period* |
| | | | | Account Value | | Account Value | | July 1, 2005 to |
| | | | | July 1, 2005 | | December 31, 2005 | | December 31, 2005 |
| Class C | | | | | | | | | | | | |
| Actual | | | $ | 1,000.00 | | $ | | 1,052.70 | | $ | | 10.09 |
| HypotheticalA | | | $ | 1,000.00 | | $ | | 1,015.38 | | $ | | 9.91 |
| Institutional Class | | | | | | | | | | | | |
| Actual | | | $ | 1,000.00 | | $ | | 1,058.90 | | $ | | 4.93 |
| HypotheticalA | | | $ | 1,000.00 | | $ | | 1,020.42 | | $ | | 4.84 |
| |
| A 5% return per year before expenses | | | | | | | | |
* Expenses are equal to each Class’ annualized expense ratio (shown in the table below); multiplied by the average account value over the period, multiplied by 184/365 (to reflect the one half year period).
| | | Annualized |
| | | Expense Ratio |
| Class A | | 1.10% |
| Class T | | 1.20% |
| Class B | | 1.85% |
| Class C | | 1.95% |
| Institutional Class | | 95% |
7 Annual Report
| Investment Changes | | | | |
| |
| |
| Top Five Countries as of December 31, 2005 | | |
| (excluding cash equivalents) | | % of fund’s | | % of fund’s net assets |
| | | net assets | | 6 months ago |
| Brazil | | 18.2 | | 17.7 |
| Mexico | | 8.4 | | 10.1 |
| Turkey | | 7.1 | | 7.2 |
| United States of America | | 6.9 | | 2.4 |
| Venezuela | | 6.7 | | 6.7 |
Percentages are adjusted for the effect of open futures contracts, if applicable. | | |
Top Five Holdings as of December 31, 2005 | | |
| (by issuer, excluding cash equivalents) | | % of fund’s | | % of fund’s net assets |
| | | net assets | | 6 months ago |
| Brazilian Federative Republic | | 17.6 | | 17.5 |
| United Mexican States | | 8.1 | | 10.1 |
| Turkish Republic | | 7.1 | | 7.2 |
| Venezuelan Republic | | 6.7 | | 6.7 |
| Philippine Republic | | 6.2 | | 5.6 |
| | | 45.7 | | |
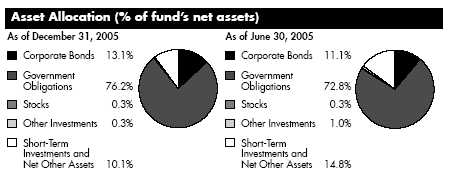
Annual Report 8
| Investments December 31, 2005 | | | | |
| Showing Percentage of Net Assets | | | | | | | | |
| |
| Nonconvertible Bonds 13.1% | | | | | | | | |
| | | | | Principal | | | | Value |
| | | | | Amount (c) | | | | (Note 1) |
| |
| Argentina – 0.2% | | | | | | | | |
| Telecom Personal SA 9.25% 12/22/10 (e) | | | $ | 460,000 | | $ | | 461,150 |
| Bahamas (Nassau) – 0.5% | | | | | | | | |
| Odebrecht Overseas Ltd. 11.5% 2/25/09 (e) | | | | 835,000 | | | | 951,900 |
| Brazil – 0.6% | | | | | | | | |
| Braskem SA: | | | | | | | | |
| 11.75% 1/22/14 (e) | | | | 390,000 | | | | 481,650 |
| 12.5% 11/5/08 (e) | | | | 395,000 | | | | 461,163 |
| Globo Comunicacoes e Participacoes SA (Reg. S) | | | | | | | | |
| 7.375% 10/20/11 (d) | | | | 339,543 | | | | 337,845 |
| TOTAL BRAZIL | | | | | | | | 1,280,658 |
| |
| Cayman Islands – 0.3% | | | | | | | | |
| CSN Islands VIII Corp. 9.75% 12/16/13 (e) | | | | 515,000 | | | | 571,650 |
| Egypt – 0.3% | | | | | | | | |
| Telecom Egypt SAE: | | | | | | | | |
| 10.7% 2/4/10 (f) | | EGP | | 1,823,100 | | | | 327,848 |
| 10.95% 2/4/10 | | EGP | | 1,828,100 | | | | 331,933 |
| TOTAL EGYPT | | | | | | | | 659,781 |
| |
| Germany – 1.5% | | | | | | | | |
| Citigroup Global Markets Deutschland AG 9.25% | | | | | | | | |
| 4/19/14 (e) | | | | 630,000 | | | | 679,613 |
| Dresdner Bank AG 10.375% 8/17/09 (e) | | | | 660,000 | | | | 732,666 |
| Gazstream SA 5.625% 7/22/13 (e) | | | | 910,000 | | | | 905,450 |
| Kyivstar GSM 7.75% 4/27/12 (Issued by Dresdner Bank | | | | | | | | |
| AG for Kyivstar GSM) (e) | | | | 650,000 | | | | 659,750 |
| TOTAL GERMANY | | | | | | | | 2,977,479 |
| |
| Indonesia – 0.0% | | | | | | | | |
| APP International Finance (Mauritius) Ltd.: | | | | | | | | |
| 0% 7/5/01 (b)(e) | | | | 1,235,000 | | | | 49,400 |
| 0% 7/5/01 (Reg. S) (b) | | | | 445,000 | | | | 17,800 |
| TOTAL INDONESIA | | | | | | | | 67,200 |
| |
| Korea (South) 0.2% | | | | | | | | |
| Hanarotelecom, Inc. 7% 2/1/12 (e) | | | | 450,000 | | | | 442,125 |
| Luxembourg 0.4% | | | | | | | | |
| Millicom International Cellular SA 10% 12/1/13 | | | | 705,000 | | | | 726,150 |
| Malaysia – 1.7% | | | | | | | | |
| Petroliam Nasional BHD (Petronas): | | | | | | | | |
| 7.625% 10/15/26 (Reg. S) | | | | 330,000 | | | | 411,015 |
See accompanying notes which are an integral part of the financial statements.
9 Annual Report
| Investments continued | | | | | | |
| |
| |
| Nonconvertible Bonds continued | | | | | | |
| | | | | Principal | | Value |
| | | | | Amount (c) | | (Note 1) |
| |
| Malaysia – continued | | | | | | |
| Petroliam Nasional BHD (Petronas): – continued | | | | | | |
| 7.75% 8/15/15 (Reg. S) | | | $ | 425,000 | | $ 507,875 |
| Petronas Capital Ltd.: | | | | | | |
| 7% 5/22/12 | | | | 1,265,000 | | 1,396,244 |
| 7.875% 5/22/22 (Reg. S) | | | | 620,000 | | 772,572 |
| TM Global, Inc. 5.25% 9/22/14 | | | | 480,000 | | 479,088 |
| TOTAL MALAYSIA | | | | | | 3,566,794 |
| |
| Mexico – 0.3% | | | | | | |
| Innova S. de R.L. 9.375% 9/19/13 | | | | 465,000 | | 517,313 |
| Netherlands – 0.5% | | | | | | |
| PT Indosat International Finance Co. BV 7.125% | | | | | | |
| 6/22/12 (e) | | | | 1,025,000 | | 1,028,844 |
| Russia – 1.2% | | | | | | |
| Mobile Telesystems Finance SA 9.75% 1/30/08 (Reg. S) | | | | 1,385,000 | | 1,468,100 |
| OAO Gazprom 9.625% 3/1/13 | | | | 870,000 | | 1,054,875 |
| TOTAL RUSSIA | | | | | | 2,522,975 |
| |
| Tunisia – 0.2% | | | | | | |
| Banque Centrale de Tunisie 7.375% 4/25/12 | | | | 445,000 | | 494,395 |
| United Kingdom – 0.4% | | | | | | |
| Credit Suisse First Boston International 8% 11/6/15 (e) . | | | | 650,000 | | 670,833 |
| Standard Bank London Ltd. 8.125% 9/30/09 | | | | 200,000 | | 207,580 |
| TOTAL UNITED KINGDOM | | | | | | 878,413 |
| |
| United States of America – 4.8% | | | | | | |
| Pemex Project Funding Master Trust: | | | | | | |
| 7.375% 12/15/14 | | | | 1,300,000 | | 1,444,300 |
| 7.75% 9/28/49 | | | | 1,948,000 | | 2,011,310 |
| 7.875% 2/1/09 (f) | | | | 915,000 | | 978,593 |
| 8.625% 2/1/22 | | | | 835,000 | | 1,026,006 |
| 9.125% 10/13/10 | | | | 3,820,000 | | 4,383,450 |
| TOTAL UNITED STATES OF AMERICA | | | | | | 9,843,659 |
| |
| TOTAL NONCONVERTIBLE BONDS | | | | | | |
| (Cost $27,847,998) | | | | | | 26,990,486 |
See accompanying notes which are an integral part of the financial statements.
| Government Obligations 77.2% | | | | | | |
| | | | | Principal | | | | Value |
| | | | | Amount (c) | | | | (Note 1) |
| |
| Argentina – 3.1% | | | | | | | | |
| Argentine Republic: | | | | | | | | |
| discount (with partial capitalization through | | | | | | |
| 12/31/13) 8.28% 12/31/33 | | | | $ 2,920,320 | | | $ | 2,453,069 |
| par 1.33% 12/31/38 (f) | | | | 4,325,000 | | | | 1,427,250 |
| 4.005% 8/3/12 (f) | | | | 650,000 | | | | 497,966 |
| Gross Domestic Product Linked Security 12/15/35 (g) | | 36,697,623 | | | | 1,926,625 |
| TOTAL ARGENTINA | | | | | | | | 6,304,910 |
| |
| Brazil – 17.6% | | | | | | | | |
| Brazilian Federative Republic: | | | | | | | | |
| Brady debt conversion bond 5.25% 4/15/12 (f) | | 2,110,627 | | | | 2,084,244 |
| 8% 1/15/18 | | | | 1,940,000 | | | | 2,089,380 |
| 8.25% 1/20/34 | | | | 1,970,000 | | | | 2,088,200 |
| 8.75% 2/4/25 | | | | 925,000 | | | | 1,022,125 |
| 8.875% 10/14/19 | | | | 1,055,000 | | | | 1,181,600 |
| 8.875% 4/15/24 | | | | 2,070,000 | | | | 2,313,225 |
| 9.25% 10/22/10 | | | | 1,440,000 | | | | 1,611,360 |
| 10% 8/7/11 | | | | 830,000 | | | | 964,875 |
| 10.5% 7/14/14 | | | | 2,220,000 | | | | 2,719,500 |
| 11% 1/11/12 | | | | 800,000 | | | | 976,000 |
| 11% 8/17/40 | | | | 9,695,000 | | | | 12,506,538 |
| 12% 4/15/10 | | | | 2,450,000 | | | | 2,985,325 |
| 12.75% 1/15/20 | | | | 1,425,000 | | | | 2,052,000 |
| 14.5% 10/15/09 | | | | 1,385,000 | | | | 1,779,725 |
| TOTAL BRAZIL | | | | | | | | 36,374,097 |
| |
| Colombia – 3.4% | | | | | | | | |
| Colombian Republic: | | | | | | | | |
| 6.1422% 11/16/15 (f) | | | | 490,000 | | | | 499,800 |
| 8.125% 5/21/24 | | | | 780,000 | | | | 844,350 |
| 8.25% 12/22/14 | | | | 450,000 | | | | 501,750 |
| 10% 1/23/12 | | | | 730,000 | | | | 868,700 |
| 10.375% 1/28/33 | | | | 415,000 | | | | 546,763 |
| 10.5% 7/9/10 | | | | 655,000 | | | | 773,555 |
| 10.75% 1/15/13 | | | | 435,000 | | | | 540,488 |
| 10.75% 1/15/13 | | | | 590,000 | | | | 733,075 |
| 11.75% 2/25/20 | | | | 1,153,000 | | | | 1,608,435 |
| 12% 10/22/15 | | | COP | 291,000,000 | | | | 150,442 |
| TOTAL COLOMBIA | | | | | | | | 7,067,358 |
See accompanying notes which are an integral part of the financial statements.
11 Annual Report
| Investments continued | | | | | | |
| |
| |
| Government Obligations continued | | | | | | |
| | | Principal | | | | Value |
| | | Amount (c) | | | | (Note 1) |
| |
| Dominican Republic – 0.7% | | | | | | |
| Dominican Republic: | | | | | | |
| 9.04% 1/23/18 (e) | | $ 877,968 | | | $ | 922,964 |
| 9.5% 9/27/11 | | 487,088 | | | | 514,486 |
| TOTAL DOMINICAN REPUBLIC | | | | | | 1,437,450 |
| |
| Ecuador 2.6% | | | | | | |
| Ecuador Republic: | | | | | | |
| 9% 8/15/30 (Reg. S) (d) | | 4,110,000 | | | | 3,740,100 |
| 9.375% 12/15/15 (e) | | 655,000 | | | | 610,788 |
| 12% 11/15/12 (e) | | 250,000 | | | | 252,500 |
| 12% 11/15/12 (Reg. S) | | 860,000 | | | | 868,600 |
| TOTAL ECUADOR | | | | | | 5,471,988 |
| |
| El Salvador – 0.2% | | | | | | |
| El Salvador Republic 8.5% 7/25/11 (Reg. S) | | 465,000 | | | | 520,800 |
| Hungary – 0.8% | | | | | | |
| Republic of Hungary 6.5% 8/24/06 | HUF | 350,060,000 | | | | 1,639,060 |
| Indonesia – 1.6% | | | | | | |
| Indonesian Republic: | | | | | | |
| 6.75% 3/10/14 | | 665,000 | | | | 664,169 |
| 7.25% 4/20/15 (e) | | 310,000 | | | | 318,138 |
| 7.5% 1/15/16 (e) | | 1,155,000 | | | | 1,201,200 |
| 8.5% 10/12/35 (e) | | 1,120,000 | | | | 1,218,000 |
| TOTAL INDONESIA | | | | | | 3,401,507 |
| |
| Ivory Coast – 0.3% | | | | | | |
| Ivory Coast: | | | | | | |
| Brady past due interest 2% 3/29/18 (Reg. S) (b)(f) | | 1,097,250 | | | | 235,909 |
| FLIRB 2.5% 3/29/18 (Reg. S) (b)(f) | | 1,525,000 | | | | 320,250 |
| TOTAL IVORY COAST | | | | | | 556,159 |
| |
| Lebanon 3.0% | | | | | | |
| Lebanese Republic: | | | | | | |
| 7.83% 11/30/09 (e)(f) | | 1,550,000 | | | | 1,612,000 |
| 7.83% 11/30/09 (f) | | 185,000 | | | | 192,400 |
| 8.5% 1/19/16 (e) | | 650,000 | | | | 676,813 |
| 10.125% 8/6/08 | | 470,000 | | | | 507,600 |
| 10.25% 10/6/09 (Reg. S) | | 820,000 | | | | 910,200 |
| 11.625% 5/11/16 (Reg. S) | | 1,765,000 | | | | 2,197,425 |
| TOTAL LEBANON | | | | | | 6,096,438 |
See accompanying notes which are an integral part of the financial statements.
| Government Obligations continued | | | | | | | | |
| | | | | | | Principal | | | | Value |
| | | | | | | Amount (c) | | | | (Note 1) |
| |
| Mexico – 8.1% | | | | | | | | | | |
| United Mexican States: | | | | | | | | | | |
| 5.875% 1/15/14 | | | | | $ | 1,420,000 | | | $ | 1,469,700 |
| 6.375% 1/16/13 | | | | | | 440,000 | | | | 467,500 |
| 6.625% 3/3/15 | | | | | | 1,395,000 | | | | 1,527,525 |
| 6.75% 9/27/34 | | | | | | 2,200,000 | | | | 2,406,250 |
| 7.5% 1/14/12 | | | | | | 1,435,000 | | | | 1,600,025 |
| 7.5% 4/8/33 | | | | | | 2,125,000 | | | | 2,516,000 |
| 8% 9/24/22 | | | | | | 830,000 | | | | 1,024,013 |
| 8.125% 12/30/19 | | | | | | 1,615,000 | | | | 1,982,413 |
| 8.3% 8/15/31 | | | | | | 655,000 | | | | 841,675 |
| 11.375% 9/15/16 | | | | | | 999,000 | | | | 1,468,530 |
| 11.5% 5/15/26 | | | | | | 690,000 | | | | 1,128,702 |
| warrants: | | | | | | | | | | |
| 9/1/06 (h)(i) | | | | | | 1,340 | | | | 87,100 |
| 10/10/06 (h)(i) | | | | | | 2,680 | | | | 107,200 |
| 11/9/06 (h)(i) | | | | | | 1,675 | | | | 53,600 |
| TOTAL MEXICO | | | | | | | | | | 16,680,233 |
| |
| Nigeria – 0.5% | | | | | | | | | | |
| Central Bank of Nigeria: | | | | | | | | | | |
| promissory note 5.092% 1/5/10 | | | | | | 974,508 | | | | 954,043 |
| warrants 11/15/20 (h) | | | | | | 750 | | | | 48,750 |
| TOTAL NIGERIA | | | | | | | | | | 1,002,793 |
| |
| Pakistan 0.2% | | | | | | | | | | |
| Pakistani Republic 6.75% 2/19/09 | | | | | | 425,000 | | | | 429,250 |
| Panama – 1.7% | | | | | | | | | | |
| Panamanian Republic: | | | | | | | | | | |
| 7.125% 1/29/26 | | | | | | 655,000 | | | | 666,463 |
| 7.25% 3/15/15 | | | | | | 570,000 | | | | 606,195 |
| 8.875% 9/30/27 | | | | | | 375,000 | | | | 447,000 |
| 9.375% 1/16/23 | | | | | | 475,000 | | | | 594,938 |
| 9.375% 4/1/29 | | | | | | 190,000 | | | | 238,925 |
| 9.625% 2/8/11 | | | | | | 774,000 | | | | 903,645 |
| TOTAL PANAMA | | | | | | | | | | 3,457,166 |
| |
| Peru 2.8% | | | | | | | | | | |
| Peruvian Republic: | | | | | | | | | | |
| 7.35% 7/21/25 | | | | | | 575,000 | | | | 566,375 |
| 8.375% 5/3/16 | | | | | | 570,000 | | | | 627,713 |
| 8.75% 11/21/33 | | | | | | 805,000 | | | | 907,235 |
| 9.125% 2/21/12 | | | | | | 1,175,000 | | | | 1,345,375 |
See accompanying notes which are an integral part of the financial statements.
13 Annual Report
| Investments continued | | | | | | | | |
| |
| |
| Government Obligations continued | | | | | | | | |
| | | | | Principal | | | | Value |
| | | | | Amount (c) | | | | (Note 1) |
| |
| Peru – continued | | | | | | | | |
| Peruvian Republic: – continued | | | | | | | | |
| 9.875% 2/6/15 | | | $ | 525,000 | | | $ | 630,000 |
| euro Brady past due interest 5% 3/7/17 (f) | | | | 1,783,500 | | | | 1,680,949 |
| TOTAL PERU | | | | | | | | 5,757,647 |
| |
| Philippines – 6.2% | | | | | | | | |
| Philippine Republic: | | | | | | | | |
| 8.375% 3/12/09 | | | | 575,000 | | | | 613,094 |
| 8.375% 2/15/11 | | | | 1,575,000 | | | | 1,695,094 |
| 8.875% 3/17/15 | | | | 1,040,000 | | | | 1,150,552 |
| 9% 2/15/13 | | | | 1,815,000 | | | | 2,005,575 |
| 9.375% 1/18/17 | | | | 330,000 | | | | 379,088 |
| 9.5% 2/2/30 | | | | 1,690,000 | | | | 2,000,538 |
| 9.875% 3/16/10 | | | | 550,000 | | | | 622,188 |
| 9.875% 1/15/19 | | | | 2,155,000 | | | | 2,564,450 |
| 10.625% 3/16/25 | | | | 1,315,000 | | | | 1,676,625 |
| TOTAL PHILIPPINES | | | | | | | | 12,707,204 |
| |
| Poland – 0.9% | | | | | | | | |
| Polish Government: | | | | | | | | |
| 0% 8/12/06 | | PLN | | 3,240,000 | | | | 970,753 |
| 8.5% 5/12/06 | | PLN | | 3,015,000 | | | | 942,042 |
| TOTAL POLAND | | | | | | | | 1,912,795 |
| |
| Russia – 4.6% | | | | | | | | |
| Russian Federation: | | | | | | | | |
| 5% 3/31/30 (Reg. S) (d) | | | | 550,000 | | | | 620,125 |
| 11% 7/24/18 (Reg. S) | | | | 2,457,000 | | | | 3,636,360 |
| 12.75% 6/24/28 (Reg. S) | | | | 2,134,000 | | | | 3,915,890 |
| Russian Federation Ministry of Finance Series VII, 3% | | | | | | | | |
| 5/14/11 | | | | 1,480,000 | | | | 1,320,900 |
| TOTAL RUSSIA | | | | | | | | 9,493,275 |
| |
| Serbia & Montenegro – 0.3% | | | | | | | | |
| Republic of Serbia 3.75% 11/1/24 (d)(e) | | | | 635,000 | | | | 564,452 |
| South Africa 1.5% | | | | | | | | |
| South African Republic: | | | | | | | | |
| 7.375% 4/25/12 | | | | 1,455,000 | | | | 1,615,050 |
| 8.5% 6/23/17 | | | | 315,000 | | | | 396,900 |
See accompanying notes which are an integral part of the financial statements.
| Government Obligations continued | | | | | | | | |
| | | | | | | Principal | | | | Value |
| | | | | | | Amount (c) | | | | (Note 1) |
| |
| South Africa – continued | | | | | | | | | | |
| South African Republic: – continued | | | | | | | | | | |
| 9.125% 5/19/09 | | | | | $ | 395,000 | | | $ | 442,894 |
| 13% 8/31/10 | | | | ZAR | | 3,270,000 | | | | 631,020 |
| TOTAL SOUTH AFRICA | | | | | | | | | | 3,085,864 |
| |
| Turkey 7.1% | | | | | | | | | | |
| Turkish Republic: | | | | | | | | | | |
| 7% 6/5/20 | | | | | | 1,955,000 | | | | 1,976,994 |
| 8% 2/14/34 | | | | | | 910,000 | | | | 1,002,138 |
| 11% 1/14/13 | | | | | | 3,190,000 | | | | 4,047,313 |
| 11.5% 1/23/12 | | | | | | 1,515,000 | | | | 1,922,156 |
| 11.75% 6/15/10 | | | | | | 1,115,000 | | | | 1,365,875 |
| 11.875% 1/15/30 | | | | | | 1,445,000 | | | | 2,221,688 |
| 13.7495% to 13.9006% 7/5/06 | | | | TRY | | 2,950,000 | | | | 2,037,608 |
| TOTAL TURKEY | | | | | | | | | | 14,573,772 |
| |
| Ukraine – 0.3% | | | | | | | | | | |
| City of Kiev 8.75% 8/8/08 | | | | | | 675,000 | | | | 707,063 |
| United States of America – 2.1% | | | | | | | | | | |
| U.S. Treasury Notes 4.5% 11/15/15 | | | | | | 4,260,000 | | | | 4,294,945 |
| Uruguay – 0.5% | | | | | | | | | | |
| Uruguay Republic: | | | | | | | | | | |
| 7.25% 2/15/11 | | | | | | 370,000 | | | | 376,475 |
| 7.5% 3/15/15 | | | | | | 735,000 | | | | 755,213 |
| TOTAL URUGUAY | | | | | | | | | | 1,131,688 |
| |
| Venezuela – 6.7% | | | | | | | | | | |
| Venezuelan Republic: | | | | | | | | | | |
| oil recovery rights 4/15/20 (h) | | | | | | 21,255 | | | | 616,395 |
| 5.1938% 4/20/11 (f) | | | | | | 1,875,000 | | | | 1,837,500 |
| 5.375% 8/7/10 | | | | | | 1,505,000 | | | | 1,441,038 |
| 7% 12/1/18 (Reg. S) | | | | | | 735,000 | | | | 709,275 |
| 7.65% 4/21/25 | | | | | | 1,475,000 | | | | 1,512,613 |
| 9.25% 9/15/27 | | | | | | 2,595,000 | | | | 3,081,563 |
| 9.375% 1/13/34 | | | | | | 855,000 | | | | 1,014,030 |
| 10.75% 9/19/13 | | | | | | 1,280,000 | | | | 1,580,160 |
| 13.625% 8/15/18 | | | | | | 75,000 | | | | 109,125 |
| 13.625% 8/15/18 | | | | | | 1,275,000 | | | | 1,855,125 |
| TOTAL VENEZUELA | | | | | | | | | | 13,756,824 |
See accompanying notes which are an integral part of the financial statements.
15 Annual Report
| Investments continued | | | | | | |
| |
| |
| Government Obligations continued | | | | | | |
| | | | | | | Principal | | Value |
| | | | | | | Amount (c) | | (Note 1) |
| Vietnam – 0.4% | | | | | | | | |
| Vietnamese Socialist Republic 6.875% 1/15/16 (e) | | | $ | 865,000 | | $ 900,681 |
| TOTAL GOVERNMENT OBLIGATIONS | | | | | | |
| (Cost $148,958,386) | | | | | | | | 159,325,419 |
| Common Stocks 0.3% | | | | | | | | |
| | | | | | | Shares | | |
| Bermuda – 0.3% | | | | | | | | |
| APP China Group Ltd. | | | | | | | | |
| (Cost $519,724) | | | | | | 11,376 | | 591,552 |
| Sovereign Loan Participations 0.2% | | | | | | |
| | | | | | | Principal | | |
| | | | | | | Amount (c) | | |
| Morocco – 0.2% | | | | | | | | |
| Moroccan Kingdom loan participation – JP Morgan | | | | | | |
| 4.7188% 1/2/09 (f) | | | | | | | | |
| (Cost $504,597) | | | | | $ | 508,750 | | 506,842 |
| Money Market Funds 7.3% | | | | | | |
| | | | | | | Shares | | |
| Fidelity Cash Central Fund, 4.28% (a) | | | | | | |
| (Cost $14,960,039) | | | | 14,960,039 | | 14,960,039 |
| |
| |
| |
| |
| See accompanying notes which are an integral part of the financial statements. | | |
| |
| Annual Report | | 16 | | | | | | |
| Purchased Options 0.1% | | | | | | |
| | | Expiration | | Underlying | | Value |
| | | Date/Strike Price | | Face Amount | | (Note 1) |
| |
| Russia – 0.1% | | | | | | |
| Lehman Brothers Holdings, Inc. Call | | | | | | |
| Option on $10,785,000 notional | | | | | | |
| amount of Russian Federation 5% | | | | | | |
| 3/31/30 (Reg. S) | | January 2006/ | | | | |
| (Cost $95,987) | | $111.38 | | $12,160,088 | | $ 163,932 |
| |
| TOTAL INVESTMENT PORTFOLIO 98.2% | | | | |
| (Cost $192,886,731) | | | | | | 202,538,270 |
| |
| NET OTHER ASSETS – 1.8% | | | | | | 3,699,464 |
| |
| NET ASSETS 100% | | | | | | $ 206,237,734 |
| Security Type Abbreviations |
| FLIRB | — | Front Loaded Interest |
| | Reduction Bonds | | |
| Currency Abbreviations |
| COP | | — | | Colombian peso |
| EGP | | — | | Egyptian pound |
| HUF | | — | | Hungarian forint |
| PLN | | — | | Polish zloty (new) |
| TRY | | — | | New Turkish Lira |
| ZAR | | — | | South African rand |
Legend
(a) Affiliated fund that is available only to
investment companies and other
accounts managed by Fidelity
Investments. The rate quoted is the
annualized seven-day yield of the fund
at period end. A complete unaudited
listing of the fund’s holdings as of its
most recent quarter end is available
upon request.
(b) Non-income producing – Issuer is in
default.
|
(c) Principal amount is stated in United
States dollars unless otherwise noted.
(d) Debt obligation initially issued at one
coupon which converts to a higher
coupon at a specified date. The rate
shown is the rate at period end.
(e) Security exempt from registration under
Rule 144A of the Securities Act of 1933.
These securities may be resold in
transactions exempt from registration,
normally to qualified institutional buyers.
At the period end, the value of these
securities amounted to $16,373,730 or
7.9% of net assets.
(f) The coupon rate shown on floating or
adjustable rate securities represents the
rate at period end.
(g) Security is linked to Argentine Republic
Gross Domestic Product (GDP). Security
does not pay principal over life of
security or at expiration. Payments are
based on growth of Argentine GDP,
subject to certain conditions.
(h) Quantity represents share amount.
(i) Non-income producing.
|
See accompanying notes which are an integral part of the financial statements.
17 Annual Report
Investments continued
Affiliated Central Funds
Information regarding income received by the fund from the affiliated Central funds during the period is as follows:
| Fund | | | | Income received |
| Fidelity Cash Central Fund | | | $ | 242,938 |
Other Information
The composition of credit quality ratings as a percentage of net assets is as follows (ratings are unaudited):
| U.S.Government and | | |
| U.S.Government Agency | | |
| Obligations | | 2.1% |
| AAA, AA, A | | 3.7% |
| BBB | | 19.5% |
| BB | | 34.8% |
| B | | 21.2% |
| CCC, CC, C | | 2.6% |
| Not Rated | | 4.3% |
| Equities | | 1.6% |
| Other Investments | | 0.1% |
| Short Term Investments and Net | | |
| Other Assets | | 10.1% |
| | | 100.0% |
We have used ratings from Moody’s® Investors Services, Inc. Where Moody’s ratings are not available, we have used S&P® ratings. Percentages are adjusted for the effect of futures contracts, if applicable.
See accompanying notes which are an integral part of the financial statements.
Annual Report 18
| Financial Statements | | | | | | | | |
| |
| |
| Statement of Assets and Liabilities | | | | | | | | |
| | | | | | | December 31, 2005 |
| |
| Assets | | | | | | | | |
| Investment in securities, at value See accompanying | | | | | | | | |
| schedule: | | | | | | | | |
| Unaffiliated issuers (cost $177,926,692) | | $ | | 187,578,231 | | | | |
| Affiliated Central Funds (cost $14,960,039) | | | | 14,960,039 | | | | |
| Total Investments (cost $192,886,731) | | | | | | $ | | 202,538,270 |
| Receivable for investments sold | | | | | | | | 54,600 |
| Receivable for fund shares sold | | | | | | | | 434,087 |
| Interest receivable | | | | | | | | 4,249,458 |
| Prepaid expenses | | | | | | | | 898 |
| Receivable from investment adviser for expense | | | | | | | | |
| reductions | | | | | | | | 43,563 |
| Other affiliated receivables | | | | | | | | 52 |
| Other receivables | | | | | | | | 46,605 |
| Total assets | | | | | | | | 207,367,533 |
| |
| Liabilities | | | | | | | | |
| Payable for investments purchased | | $ | | 61,604 | | | | |
| Payable for fund shares redeemed | | | | 397,911 | | | | |
| Distributions payable | | | | 366,670 | | | | |
| Accrued management fee | | | | 114,553 | | | | |
| Distribution fees payable | | | | 60,632 | | | | |
| Other affiliated payables | | | | 53,889 | | | | |
| Other payables and accrued expenses | | | | 74,540 | | | | |
| Total liabilities | | | | | | | | 1,129,799 |
| |
| Net Assets | | | | | | $ | | 206,237,734 |
| Net Assets consist of: | | | | | | | | |
| Paid in capital | | | | | | $ | | 194,110,553 |
| Undistributed net investment income | | | | | | | | 893,378 |
| Accumulated undistributed net realized gain (loss) on | | | | | | | | |
| investments and foreign currency transactions | | | | | | | | 1,602,542 |
| Net unrealized appreciation (depreciation) on | | | | | | | | |
| investments and assets and liabilities in foreign | | | | | | | | |
| currencies | | | | | | | | 9,631,261 |
| Net Assets | | | | | | $ | | 206,237,734 |
See accompanying notes which are an integral part of the financial statements.
19 Annual Report
| Financial Statements continued | | | | |
| |
| |
| |
| Statement of Assets and Liabilities continued | | | | |
| | | December 31, 2005 |
| |
| Calculation of Maximum Offering Price | | | | |
| Class A: | | | | |
| Net Asset Value and redemption price per share | | | | |
| ($42,835,866 ÷ 3,537,191 shares) | | $ | | 12.11 |
| Maximum offering price per share (100/95.25 of $12.11) | | $ | | 12.71 |
| Class T: | | | | |
| Net Asset Value and redemption price per share | | | | |
| ($95,101,946 ÷ 7,872,953 shares) | | $ | | 12.08 |
| Maximum offering price per share (100/96.50 of $12.08) | | $ | | 12.52 |
| Class B: | | | | |
| Net Asset Value and offering price per share | | | | |
| ($27,302,887 ÷ 2,238,709 shares)A | | $ | | 12.20 |
| Class C: | | | | |
| Net Asset Value and offering price per share | | | | |
| ($18,862,557 ÷ 1,551,145 shares)A | | $ | | 12.16 |
| Institutional Class: | | | | |
| Net Asset Value, offering price and redemption price per | | | | |
| share ($22,134,478 ÷ 1,848,028 shares) | | $ | | 11.98 |
| |
| A Redemption price per share is equal to net asset value less any applicable contingent deferred sales charge. | | | | |
See accompanying notes which are an integral part of the financial statements.
Annual Report 20
| Statement of Operations | | | | | | |
| | | | | Year ended December 31, 2005 |
| |
| Investment Income | | | | | | |
| Dividends | | | | $ | | 136,813 |
| Interest | | | | | | 12,816,704 |
| Income from affiliated Central Funds | | | | | | 242,938 |
| Total income | | | | | | 13,196,455 |
| |
| Expenses | | | | | | |
| Management fee | | $ | | 1,243,893 | | |
| Transfer agent fees | | | | 511,562 | | |
| Distribution fees | | | | 682,500 | | |
| Accounting fees and expenses | | | | 101,603 | | |
| Independent trustees’ compensation | | | | 813 | | |
| Custodian fees and expenses | | | | 74,930 | | |
| Registration fees | | | | 72,709 | | |
| Audit | | | | 70,959 | | |
| Legal | | | | 46,151 | | |
| Miscellaneous | | | | 775 | | |
| Total expenses before reductions | | | | 2,805,895 | | |
| Expense reductions | | | | (357,006) | | 2,448,889 |
| |
| Net investment income | | | | | | 10,747,566 |
| Realized and Unrealized Gain (Loss) | | | | | | |
| Net realized gain (loss) on: | | | | | | |
| Investment securities: | | | | | | |
| Unaffiliated issuers | | | | 6,964,179 | | |
| Foreign currency transactions | | | | (77,039) | | |
| Total net realized gain (loss) | | | | | | 6,887,140 |
| Change in net unrealized appreciation (depreciation) on: | | | | |
| Investment securities | | | | 1,636,150 | | |
| Assets and liabilities in foreign currencies | | | | (23,654) | | |
| Total change in net unrealized appreciation | | | | | | |
| (depreciation) | | | | | | 1,612,496 |
| Net gain (loss) | | | | | | 8,499,636 |
| Net increase (decrease) in net assets resulting from | | | | | | |
| operations | | | | $ | | 19,247,202 |
See accompanying notes which are an integral part of the financial statements.
21 Annual Report
| Financial Statements continued | | | | | | | | |
| |
| |
| Statement of Changes in Net Assets | | | | | | | | |
| | | | | Year ended | | | | Year ended |
| | | | | December 31, | | | | December 31, |
| | | | | 2005 | | | | 2004 |
| Increase (Decrease) in Net Assets | | | | | | | | |
| Operations | | | | | | | | |
| Net investment income | | $ | | 10,747,566 | | $ | | 9,178,608 |
| Net realized gain (loss) | | | | 6,887,140 | | | | 9,171,398 |
| Change in net unrealized appreciation (depreciation) . | | | | 1,612,496 | | | | (568,612) |
| Net increase (decrease) in net assets resulting | | | | | | | | |
| from operations | | | | 19,247,202 | | | | 17,781,394 |
| Distributions to shareholders from net investment income . | | | | (11,113,855) | | | | (9,584,714) |
| Distributions to shareholders from net realized gain | | | | (9,174,599) | | | | (3,077,366) |
| Total distributions | | | | (20,288,454) | | | | (12,662,080) |
| Share transactions - net increase (decrease) | | | | 33,854,076 | | | | 5,067,659 |
| Redemption fees | | | | 19,860 | | | | 22,324 |
| Total increase (decrease) in net assets | | | | 32,832,684 | | | | 10,209,297 |
| |
| Net Assets | | | | | | | | |
| Beginning of period | | | | 173,405,050 | | | | 163,195,753 |
| End of period (including undistributed net investment | | | | | | | | |
| income of $893,378 and undistributed net invest- | | | | | | | | |
| ment income of $1,636,710, respectively) | | $ | | 206,237,734 | | $ | | 173,405,050 |
See accompanying notes which are an integral part of the financial statements.
| Financial Highlights Class A | | | | | | | | | | | | |
| Years ended December 31, | | 2005 | | 2004 | | 2003 | | | | 2002 | | | | 2001 |
| Selected Per Share Data | | | | | | | | | | | | | | |
| Net asset value, beginning of | | | | | | | | | | | | | | |
| period | | $ 12.16 | | $ 11.70 | | $ 9.67 | | | | $ 9.37 | | | | $ 9.81 |
| Income from Investment | | | | | | | | | | | | | | |
| Operations | | | | | | | | | | | | | | |
| Net investment incomeC | | 727 | | .683 | | .802 | | | | .714F | | | | 1.030E,F |
| Net realized and | | | | | | | | | | | | | | |
| unrealized gain (loss) | | 556 | | .707 | | 2.064 | | | | .348F | | | | (.431)E,F |
| Total from investment | | | | | | | | | | | | | | |
| operations | | 1.283 | | 1.390 | | 2.866 | | | | 1.062 | | | | .599 |
| Distributions from net | | | | | | | | | | | | | | |
| investment income | | (.744) | | (.712) | | (.836) | | | | (.762) | | | | (1.039) |
| Distributions from net | | | | | | | | | | | | | | |
| realized gain | | (.590) | | (.220) | | — | | | | — | | | | — |
| Total distributions | | (1.334) | | (.932) | | (.836) | | | | (.762) | | | | (1.039) |
| Redemption fees added to | | | | | | | | | | | | | | |
| paid in capitalC | | 001 | | .002 | | — | | | | — | | | | — |
| Net asset value, end of | | | | | | | | | | | | | | |
| period | | $ 12.11 | | $ 12.16 | | $ 11.70 | | | | $ 9.67 | | | | $ 9.37 |
| Total ReturnA,B | | 11.15% | | 12.44% | | 30.43% | | | | 11.80% | | | | 6.35% |
| Ratios to Average Net AssetsD | | | | | | | | | | | | | | |
| Expenses before | | | | | | | | | | | | | | |
| reductions | | 1.31% | | 1.34% | | 1.32% | | | | 1.36% | | | | 1.45% |
| Expenses net of fee | | | | | | | | | | | | | | |
| waivers, if any | | 1.11% | | 1.34% | | 1.32% | | | | 1.36% | | | | 1.40% |
| Expenses net of all | | | | | | | | | | | | | | |
| reductions | | 1.11% | | 1.34% | | 1.32% | | | | 1.35% | | | | 1.40% |
| Net investment income | | 6.04% | | 5.86% | | 7.31% | | | | 7.56%F | | | | 10.66%E,F |
| Supplemental Data | | | | | | | | | | | | | | |
| Net assets, end of period | | | | | | | | | | | | | | |
| (000 omitted) | | $42,836 | | $28,854 | | $26,787 | | $13,920 | | | | $ 7,601 |
| Portfolio turnover rate | | 202% | | 238% | | 260% | | | | 222% | | | | 271% |
A Total returns would have been lower had certain expenses not been reduced during the periods shown.
B Total returns do not include the effect of the sales charges.
C Calculated based on average shares outstanding during the period.
D Expense ratios reflect operating expenses of the class. Expenses before reductions do not reflect amounts reimbursed by the investment adviser or
reductions from brokerage service arrangements or other expense offset arrangements and do not represent the amount paid by the class during
periods when reimbursements or reductions occur. Expenses net of fee waivers reflect expenses after reimbursement by the investment adviser but
prior to reductions from brokerage service arrangements or other expense offset arrangements. Expenses net of all reductions represent the net
expenses paid by the class.
E Effective January 1, 2001, the fund adopted the provisions of the AICPA Audit and Accounting Guide for Investment Companies and began
amortizing premium and discount on all debt securities. Per share data and ratios for periods prior to adoption have not been restated to reflect
this change.
F As a result of a revision to reflect accretion of market discount using the interest method, certain amounts for the years ended December 31,
2002 and December 31, 2001 have been reclassified from what was previously reported. The impact of this change for the years ended Decem
ber 31, 2002 and December 31, 2001 was a decrease to net investment income of $.057 and $.070 per share with a corresponding increase
to net realized and unrealized gain (loss) per share, respectively. The ratio of net investment income to average net assets decreased from 8.17%
and 11.39% to 7.56% and 10.66%, respectively. The reclassification has no impact on the net assets of the fund.
|
See accompanying notes which are an integral part of the financial statements.
23 Annual Report
| Financial Highlights Class T | | | | | | | | | | | | |
| Years ended December 31, | | 2005 | | 2004 | | 2003 | | | | 2002 | | | | 2001 |
| Selected Per Share Data | | | | | | | | | | | | | | |
| Net asset value, beginning of | | | | | | | | | | | | | | |
| period | | $ 12.14 | | $ 11.68 | | $ 9.66 | | | | $ 9.36 | | | | $ 9.80 |
| Income from Investment | | | | | | | | | | | | | | |
| Operations | | | | | | | | | | | | | | |
| Net investment incomeC | | 713 | | .670 | | .787 | | | | .706F | | | | 1.024E,F |
| Net realized and | | | | | | | | | | | | | | |
| unrealized gain (loss) | | 549 | | .708 | | 2.057 | | | | .346F | | | | (.435)E,F |
| Total from investment | | | | | | | | | | | | | | |
| operations | | 1.262 | | 1.378 | | 2.844 | | | | 1.052 | | | | .589 |
| Distributions from net | | | | | | | | | | | | | | |
| investment income | | (.733) | | (.700) | | (.824) | | | | (.752) | | | | (1.029) |
| Distributions from net | | | | | | | | | | | | | | |
| realized gain | | (.590) | | (.220) | | — | | | | — | | | | — |
| Total distributions | | (1.323) | | (.920) | | (.824) | | | | (.752) | | | | (1.029) |
| Redemption fees added to | | | | | | | | | | | | | | |
| paid in capitalC | | 001 | | .002 | | — | | | | — | | | | — |
| Net asset value, end of | | | | | | | | | | | | | | |
| period | | $ 12.08 | | $ 12.14 | | $ 11.68 | | | | $ 9.66 | | | | $ 9.36 |
| Total ReturnA,B | | 10.98% | | 12.35% | | 30.22% | | | | 11.70% | | | | 6.25% |
| Ratios to Average Net AssetsD | | | | | | | | | | | | | | |
| Expenses before | | | | | | | | | | | | | | |
| reductions | | 1.40% | | 1.44% | | 1.43% | | | | 1.47% | | | | 1.53% |
| Expenses net of fee | | | | | | | | | | | | | | |
| waivers, if any | | 1.21% | | 1.44% | | 1.43% | | | | 1.47% | | | | 1.50% |
| Expenses net of all | | | | | | | | | | | | | | |
| reductions | | 1.21% | | 1.44% | | 1.43% | | | | 1.46% | | | | 1.50% |
| Net investment income | | 5.94% | | 5.76% | | 7.20% | | | | 7.46%F | | | | 10.56%E,F |
| Supplemental Data | | | | | | | | | | | | | | |
| Net assets, end of period | | | | | | | | | | | | | | |
| (000 omitted) | | $95,102 | | $89,784 | | $82,811 | | $57,154 | | $46,740 |
| Portfolio turnover rate | | 202% | | 238% | | 260% | | | | 222% | | | | 271% |
A Total returns would have been lower had certain expenses not been reduced during the periods shown.
B Total returns do not include the effect of the sales charges.
C Calculated based on average shares outstanding during the period.
D Expense ratios reflect operating expenses of the class. Expenses before reductions do not reflect amounts reimbursed by the investment adviser or
reductions from brokerage service arrangements or other expense offset arrangements and do not represent the amount paid by the class during
periods when reimbursements or reductions occur. Expenses net of fee waivers reflect expenses after reimbursement by the investment adviser but
prior to reductions from brokerage service arrangements or other expense offset arrangements. Expenses net of all reductions represent the net
expenses paid by the class.
E Effective January 1, 2001, the fund adopted the provisions of the AICPA Audit and Accounting Guide for Investment Companies and began
amortizing premium and discount on all debt securities. Per share data and ratios for periods prior to adoption have not been restated to reflect
this change.
F As a result of a revision to reflect accretion of market discount using the interest method, certain amounts for the years ended December 31,
2002 and December 31, 2001 have been reclassified from what was previously reported. The impact of this change for the years ended Decem
ber 31, 2002 and December 31, 2001 was a decrease to net investment income of $.057 and $.071 per share with a corresponding increase
to net realized and unrealized gain (loss) per share, respectively. The ratio of net investment income to average net assets decreased from 8.06%
and 11.29% to 7.46% and 10.56%, respectively. The reclassification has no impact on the net assets of the fund.
|
See accompanying notes which are an integral part of the financial statements.
Annual Report 24
| Financial Highlights Class B | | | | | | | | | | | | |
| Years ended December 31, | | 2005 | | 2004 | | 2003 | | | | 2002 | | | | 2001 |
| Selected Per Share Data | | | | | | | | | | | | | | |
| Net asset value, beginning of | | | | | | | | | | | | | | |
| period | | $ 12.24 | | $ 11.77 | | $ 9.73 | | | | $ 9.42 | | | | $ 9.85 |
| Income from Investment | | | | | | | | | | | | | | |
| Operations | | | | | | | | | | | | | | |
| Net investment incomeC | | 640 | | .595 | | .719 | | | | .646F | | | | .968E,F |
| Net realized and | | | | | | | | | | | | | | |
| unrealized gain (loss) | | 562 | | .712 | | 2.071 | | | | .352F | | | | (.433)E,F |
| Total from investment | | | | | | | | | | | | | | |
| operations | | 1.202 | | 1.307 | | 2.790 | | | | .998 | | | | .535 |
| Distributions from net | | | | | | | | | | | | | | |
| investment income | | (.653) | | (.619) | | (.750) | | | | (.688) | | | | (.965) |
| Distributions from net | | | | | | | | | | | | | | |
| realized gain | | (.590) | | (.220) | | — | | | | — | | | | — |
| Total distributions | | (1.243) | | (.839) | | (.750) | | | | (.688) | | | | (.965) |
| Redemption fees added to | | | | | | | | | | | | | | |
| paid in capitalC | | 001 | | .002 | | — | | | | — | | | | — |
| Net asset value, end of | | | | | | | | | | | | | | |
| period | | $ 12.20 | | $ 12.24 | | $ 11.77 | | | | $ 9.73 | | | | $ 9.42 |
| Total ReturnA,B | | 10.34% | | 11.56% | | 29.34% | | | | 10.99% | | | | 5.62% |
| Ratios to Average Net AssetsD | | | | | | | | | | | | | | |
| Expenses before | | | | | | | | | | | | | | |
| reductions | | 2.12% | | 2.13% | | 2.09% | | | | 2.13% | | | | 2.22% |
| Expenses net of fee | | | | | | | | | | | | | | |
| waivers, if any | | 1.86% | | 2.13% | | 2.09% | | | | 2.13% | | | | 2.15% |
| Expenses net of all | | | | | | | | | | | | | | |
| reductions | | 1.86% | | 2.13% | | 2.09% | | | | 2.12% | | | | 2.15% |
| Net investment income | | 5.28% | | 5.07% | | 6.53% | | | | 6.79%F | | | | 9.91%E,F |
| Supplemental Data | | | | | | | | | | | | | | |
| Net assets, end of period | | | | | | | | | | | | | | |
| (000 omitted) | | $27,303 | | $27,238 | | $30,088 | | $20,903 | | $15,736 |
| Portfolio turnover rate | | 202% | | 238% | | 260% | | | | 222% | | | | 271% |
A Total returns would have been lower had certain expenses not been reduced during the periods shown.
B Total returns do not include the effect of the contingent deferred sales charge.
C Calculated based on average shares outstanding during the period.
D Expense ratios reflect operating expenses of the class. Expenses before reductions do not reflect amounts reimbursed by the investment adviser or
reductions from brokerage service arrangements or other expense offset arrangements and do not represent the amount paid by the class during
periods when reimbursements or reductions occur. Expenses net of fee waivers reflect expenses after reimbursement by the investment adviser but
prior to reductions from brokerage service arrangements or other expense offset arrangements. Expenses net of all reductions represent the net
expenses paid by the class.
E Effective January 1, 2001, the fund adopted the provisions of the AICPA Audit and Accounting Guide for Investment Companies and began
amortizing premium and discount on all debt securities. Per share data and ratios for periods prior to adoption have not been restated to reflect
this change.
F As a result of a revision to reflect accretion of market discount using the interest method, certain amounts for the years ended December 31,
2002 and December 31, 2001 have been reclassified from what was previously reported. The impact of this change for the years ended Decem
ber 31, 2002 and December 31, 2001 was a decrease to net investment income of $.057 and $.071 per share with a corresponding increase
to net realized and unrealized gain (loss) per share, respectively. The ratio of net investment income to average net assets decreased from 7.39%
and 10.64% to 6.79% and 9.91%, respectively. The reclassification has no impact on the net assets of the fund.
|
See accompanying notes which are an integral part of the financial statements.
25 Annual Report
| Financial Highlights Class C | | | | | | | | | | | | |
| Years ended December 31, | | 2005 | | 2004 | | 2003 | | | | 2002 | | | | 2001 |
| Selected Per Share Data | | | | | | | | | | | | | | |
| Net asset value, beginning of | | | | | | | | | | | | | | |
| period | | $ 12.21 | | $ 11.74 | | $ 9.71 | | | | $ 9.40 | | | | $9.84 |
| Income from Investment | | | | | | | | | | | | | | |
| Operations | | | | | | | | | | | | | | |
| Net investment incomeC | | 627 | | .585 | | .709 | | | | .633F | | | | .954E,F |
| Net realized and | | | | | | | | | | | | | | |
| unrealized gain (loss) | | 553 | | .715 | | 2.060 | | | | .355F | | | | (.438)E,F |
| Total from investment | | | | | | | | | | | | | | |
| operations | | 1.180 | | 1.300 | | 2.769 | | | | .988 | | | | .516 |
| Distributions from net | | | | | | | | | | | | | | |
| investment income | | (.641) | | (.612) | | (.739) | | | | (.678) | | | | (.956) |
| Distributions from net | | | | | | | | | | | | | | |
| realized gain | | (.590) | | (.220) | | — | | | | — | | | | — |
| Total distributions | | (1.231) | | (.832) | | (.739) | | | | (.678) | | | | (.956) |
| Redemption fees added to | | | | | | | | | | | | | | |
| paid in capitalC | | 001 | | .002 | | — | | | | — | | | | — |
| Net asset value, end of | | | | | | | | | | | | | | |
| period | | $ 12.16 | | $ 12.21 | | $ 11.74 | | | | $ 9.71 | | | | $ 9.40 |
| Total ReturnA,B | | 10.17% | | 11.53% | | 29.18% | | | | 10.90% | | | | 5.43% |
| Ratios to Average Net AssetsD | | | | | | | | | | | | | | |
| Expenses before | | | | | | | | | | | | | | |
| reductions | | 2.16% | | 2.19% | | 2.19% | | | | 2.24% | | | | 2.32% |
| Expenses net of fee | | | | | | | | | | | | | | |
| waivers, if any | | 1.96% | | 2.19% | | 2.19% | | | | 2.24% | | | | 2.25% |
| Expenses net of all | | | | | | | | | | | | | | |
| reductions | | 1.96% | | 2.19% | | 2.19% | | | | 2.23% | | | | 2.25% |
| Net investment income | | 5.19% | | 5.01% | | 6.43% | | | | 6.69%F | | | | 9.81%E,F |
| Supplemental Data | | | | | | | | | | | | | | |
| Net assets, end of period | | | | | | | | | | | | | | |
| (000 omitted) | | $18,863 | | $14,606 | | $12,516 | | | | $ 6,641 | | $ 3,411 |
| Portfolio turnover rate | | 202% | | 238% | | 260% | | | | 222% | | | | 271% |
A Total returns would have been lower had certain expenses not been reduced during the periods shown.
B Total returns do not include the effect of the contingent deferred sales charge.
C Calculated based on average shares outstanding during the period.
D Expense ratios reflect operating expenses of the class. Expenses before reductions do not reflect amounts reimbursed by the investment adviser or
reductions from brokerage service arrangements or other expense offset arrangements and do not represent the amount paid by the class during
periods when reimbursements or reductions occur. Expenses net of fee waivers reflect expenses after reimbursement by the investment adviser but
prior to reductions from brokerage service arrangements or other expense offset arrangements. Expenses net of all reductions represent the net
expenses paid by the class.
E Effective January 1, 2001, the fund adopted the provisions of the AICPA Audit and Accounting Guide for Investment Companies and began
amortizing premium and discount on all debt securities. Per share data and ratios for periods prior to adoption have not been restated to reflect
this change.
F As a result of a revision to reflect accretion of market discount using the interest method, certain amounts for the years ended December 31,
2002 and December 31, 2001 have been reclassified from what was previously reported. The impact of this change for the years ended Decem
ber 31, 2002 and December 31, 2001 was a decrease to net investment income of $.057 and $.071 per share with a corresponding increase
to net realized and unrealized gain (loss) per share, respectively. The ratio of net investment income to average net assets decreased from 7.29%
and 10.54% to 6.69% and 9.81%, respectively. The reclassification has no impact on the net assets of the fund.
|
See accompanying notes which are an integral part of the financial statements.
Annual Report 26
| Financial Highlights Institutional Class | | | | | | | | |
| Years ended December 31, | | 2005 | | 2004 | | 2003 | | | | 2002 | | | | 2001 |
| Selected Per Share Data | | | | | | | | | | | | | | |
| Net asset value, beginning of | | | | | | | | | | | | | | |
| period | | $ 12.04 | | $ 11.60 | | $ 9.60 | | | | $ 9.30 | | | | $ 9.75 |
| Income from Investment | | | | | | | | | | | | | | |
| Operations | | | | | | | | | | | | | | |
| Net investment incomeB | | 739 | | .712 | | .820 | | | | .736E | | | | 1.048D,E |
| Net realized and | | | | | | | | | | | | | | |
| unrealized gain (loss) | | 554 | | .694 | | 2.045 | | | | .352E | | | | (.437)D,E |
| Total from investment | | | | | | | | | | | | | | |
| operations | | 1.293 | | 1.406 | | 2.865 | | | | 1.088 | | | | .611 |
| Distributions from net | | | | | | | | | | | | | | |
| investment income | | (.764) | | (.748) | | (.865) | | | | (.788) | | | | (1.061) |
| Distributions from net | | | | | | | | | | | | | | |
| realized gain | | (.590) | | (.220) | | — | | | | — | | | | — |
| Total distributions | | (1.354) | | (.968) | | (.865) | | | | (.788) | | | | (1.061) |
| Redemption fees added to | | | | | | | | | | | | | | |
| paid in capitalB | | 001 | | .002 | | — | | | | — | | | | — |
| Net asset value, end of | | | | | | | | | | | | | | |
| period | | $ 11.98 | | $ 12.04 | | $ 11.60 | �� | | | $ 9.60 | | | | $ 9.30 |
| Total ReturnA | | 11.37% | | 12.72% | | 30.69% | | | | 12.21% | | | | 6.53% |
| Ratios to Average Net AssetsC | | | | | | | | | | | | |
| Expenses before | | | | | | | | | | | | | | |
| reductions | | 1.01% | | 1.03% | | 1.06% | | | | 1.09% | | | | 1.17% |
| Expenses net of fee | | | | | | | | | | | | | | |
| waivers, if any | | 95% | | 1.03% | | 1.06% | | | | 1.09% | | | | 1.17% |
| Expenses net of all | | | | | | | | | | | | | | |
| reductions | | 95% | | 1.03% | | 1.06% | | | | 1.08% | | | | 1.17% |
| Net investment income | | 6.20% | | 6.17% | | 7.56% | | | | 7.83%E | | | | 10.89%D,E |
| Supplemental Data | | | | | | | | | | | | | | |
| Net assets, end of period | | | | | | | | | | | | | | |
| (000 omitted) | | $22,134 | | $12,924 | | $10,993 | | | | $ 8,386 | | | | $ 7,028 |
| Portfolio turnover rate | | 202% | | 238% | | 260% | | | | 222% | | | | 271% |
A Total returns would have been lower had certain expenses not been reduced during the periods shown.
B Calculated based on average shares outstanding during the period.
C Expense ratios reflect operating expenses of the class. Expenses before reductions do not reflect amounts reimbursed by the investment adviser or
reductions from brokerage service arrangements or other expense offset arrangements and do not represent the amount paid by the class during
periods when reimbursements or reductions occur. Expenses net of fee waivers reflect expenses after reimbursement by the investment adviser but
prior to reductions from brokerage service arrangements or other expense offset arrangements. Expenses net of all reductions represent the net
expenses paid by the class.
D Effective January 1, 2001, the fund adopted the provisions of the AICPA Audit and Accounting Guide for Investment Companies and began
amortizing premium and discount on all debt securities. Per share data and ratios for periods prior to adoption have not been restated to reflect
this change.
E As a result of a revision to reflect accretion of market discount using the interest method, certain amounts for the years ended December 31,
2002 and December 31, 2001 have been reclassified from what was previously reported. The impact of this change for the years ended Decem
ber 31, 2002 and December 31, 2001 was a decrease to net investment income of $.057 and $.070 per share with a corresponding increase
to net realized and unrealized gain (loss) per share, respectively. The ratio of net investment income to average net assets decreased from 8.44%
and 11.62% to 7.83% and 10.89%, respectively. The reclassification has no impact on the net assets of the fund.
|
See accompanying notes which are an integral part of the financial statements.
27 Annual Report
Notes to Financial Statements
For the period ended December 31, 2005
|
1. Significant Accounting Policies.
Fidelity Advisor Emerging Markets Income Fund (the fund) is a non diversified fund of Fidelity Advisor Series VIII (the trust) and is authorized to issue an unlimited number of shares. The trust is registered under the Investment Company Act of 1940, as amended (the 1940 Act), as an open end management investment company organized as a Massachusetts business trust.
The fund offers Class A, Class T, Class B, Class C, and Institutional Class shares, each of which has equal rights as to assets and voting privileges. Each class has exclusive voting rights with respect to matters that affect that class. Class B shares will automatically convert to Class A shares after a holding period of seven years from the initial date of purchase. Investment income, realized and unrealized capital gains and losses, the common expenses of the fund, and certain fund level expense reductions, if any, are allocated on a pro rata basis to each class based on the relative net assets of each class to the total net assets of the fund. Each class differs with respect to transfer agent and distribution and service plan fees incurred. Certain expense reductions also differ by class.
The fund may invest in affiliated money market central funds (Money Market Central Funds), which are open end investment companies available to investment companies and other accounts managed by Fidelity Management & Research Company (FMR) and its affiliates. The financial statements have been prepared in conformity with accounting principles generally accepted in the United States of America, which require manage ment to make certain estimates and assumptions at the date of the financial statements. The following summarizes the significant accounting policies of the fund:
Security Valuation. Investments are valued and net asset value per share is calculated (NAV calculation) as of the close of business of the New York Stock Exchange, normally 4:00 p.m. Eastern time. Wherever possible, the fund uses independent pricing services approved by the Board of Trustees to value its investments. Debt securities, including restricted securities, for which quotations are readily available, are valued by indepen dent pricing services or by dealers who make markets in such securities. Pricing services consider yield or price of bonds of comparable quality, coupon, maturity and type as well as dealer supplied prices. Equity securities, including restricted securities, for which market quotations are readily available, are valued at the last reported sale price or official closing price as reported by an independent pricing service on the primary market or exchange on which they are traded. In the event there were no sales during the day or closing prices are not available, securities are valued at the last quoted bid price.
| 1. Significant Accounting Policies continued |
Security Valuation continued | | |
When current market prices or quotations are not readily available or do not accurately reflect fair value, valuations may be determined in accordance with procedures adopted by the Board of Trustees. The frequency of when fair value pricing is used is unpredict able. The value of securities used for NAV calculation under fair value pricing may differ from published prices for the same securities. Investments in open end mutual funds are valued at their closing net asset value each business day. Short term securities with remaining maturities of sixty days or less for which quotations are not readily available are valued at amortized cost, which approximates value.
Foreign Currency. The fund uses foreign currency contracts to facilitate transactions in foreign denominated securities. Losses from these transactions may arise from changes in the value of the foreign currency or if the counterparties do not perform under the contracts’ terms.
Foreign denominated assets, including investment securities, and liabilities are trans lated into U.S. dollars at the exchange rate at period end. Purchases and sales of invest ment securities, income and dividends received and expenses denominated in foreign currencies are translated into U.S. dollars at the exchange rate in effect on the transac tion date.
The effects of exchange rate fluctuations on investments are included with the net realized and unrealized gain (loss) on investment securities. Other foreign currency transactions resulting in realized and unrealized gain (loss) are disclosed separately.
Investment Transactions and Income. Security transactions are accounted for as of trade date. Gains and losses on securities sold are determined on the basis of identified cost and may include proceeds received from litigation. Dividend income is recorded on the ex dividend date, except for certain dividends from foreign securities where the ex dividend date may have passed, which are recorded as soon as the fund is informed of the ex dividend date. Non cash dividends included in dividend income, if any, are recorded at the fair market value of the securities received. Interest income is accrued as earned. Interest income includes coupon interest and amortization of premium and accretion of discount on debt securities. Investment income is recorded net of foreign taxes withheld where recovery of such taxes is uncertain. Debt obligations may be placed on non accrual status and related interest income may be reduced by ceasing current accruals and writing off interest receivables when the collection of all or a portion of interest has become doubtful based on consistently applied procedures. A debt obligation is removed from non accrual status when the issuer resumes interest payments or when collectibility of interest is reasonably assured.
29 Annual Report
| Notes to Financial Statements continued |
1. Significant Accounting Policies continued |
Expenses. Most expenses of the trust can be directly attributed to a fund. Expenses which cannot be directly attributed are apportioned among each fund in the trust.
Income Tax Information and Distributions to Shareholders. Each year, the fund intends to qualify as a regulated investment company by distributing all of its taxable income and realized gains under Subchapter M of the Internal Revenue Code. As a result, no provision for income taxes is required in the accompanying financial statements. Foreign taxes are provided for based on the fund’s understanding of the tax rules and rates that exist in the foreign markets in which it invests.
Dividends are declared daily and paid monthly from net investment income. Distribu tions from realized gains, if any, are recorded on the ex dividend date. Income dividends and capital gain distributions are declared separately for each class. Income and capital gain distributions are determined in accordance with income tax regulations, which may differ from generally accepted accounting principles. In addition, the fund will claim a portion of the payment made to redeeming shareholders as a distribution for income tax purposes.
Capital accounts within the financial statements are adjusted for permanent book tax differences. These adjustments have no impact on net assets or the results of operations. Temporary book tax differences will reverse in a subsequent period.
Book tax differences are primarily due to foreign currency transactions, defaulted bonds, market discount, deferred trustees compensation and losses deferred due to wash sales.
The tax basis components of distributable earnings and the federal tax cost as of period end were as follows:
| Unrealized appreciation | | $ | | 11,717,349 | | | | |
| Unrealized depreciation | | | | (1,615,885) | | | | |
| Net unrealized appreciation (depreciation) . | | | | 10,101,464 | | | | |
| Undistributed ordinary income | | | | 630,686 | | | | |
| Undistributed long term capital gain | | | | 521,796 | | | | |
| |
| Cost for federal income tax purposes | | $ | | 192,436,806 | | | | |
| |
The tax character of distributions paid was as follows:
| | | | |
| | | | | December 31, 2005 | | | | December 31, 2004 |
| Ordinary Income | | $ | | 16,433,265 | | $ | | 10,423,995 |
| Long term Capital Gains | | | | 3,855,189 | | | | 2,238,085 |
| Total | | $ | | 20,288,454 | | $ | | 12,662,080 |
1. Significant Accounting Policies continued
Short Term Trading (Redemption) Fees. Shares held in the fund less than 90 days are subject to a redemption fee equal to 1.00% of the proceeds of the redeemed shares. All redemption fees, including any estimated redemption fees paid by FMR, are retained by the fund and accounted for as an addition to paid in capital.
Repurchase Agreements. FMR has received an Exemptive Order from the Securities and Exchange Commission (the SEC) which permits the fund and other affiliated entities of FMR to transfer uninvested cash balances into joint trading accounts which are then invested in repurchase agreements. The fund may also invest directly with institutions in repurchase agreements. Repurchase agreements are collateralized by government or non government securities. Collateral is held in segregated accounts with custodian banks and may be obtained in the event of a default of the counterparty. The fund monitors, on a daily basis, the value of the collateral to ensure it is at least equal to the principal amount of the repurchase agreement (including accrued interest). In the event of a default by the counterparty, realization of the collateral proceeds could be delayed, during which time the value of the collateral may decline.
Options. The fund may use options to manage its exposure to the bond market and to fluctuations in interest rates. Writing puts and buying calls tend to increase a fund’s exposure to the underlying instrument. Buying puts and writing calls tend to decrease a fund’s exposure to the underlying instrument, or hedge other fund investments. The underlying face amount at value of any open options at period end is shown in the Schedule of Investments under the caption “Purchased Options.” This amount reflects each contract’s exposure to the underlying instrument at period end. Losses may arise from changes in the value of the underlying instruments, if there is an illiquid secondary market for the contracts, or if the counterparties do not perform under the contracts’ terms. Gains and losses are realized upon the expiration or closing of the options. Realized gains (losses) on purchased options are included in realized gains (losses) on investment securities.
Exchange traded options are valued using the last sale price or, in the absence of a sale, the last offering price. Options traded over the counter are valued using dealer supplied valuations.
Restricted Securities. The fund may invest in securities that are subject to legal or contractual restrictions on resale. These securities generally may be resold in transac tions exempt from registration or to the public if the securities are registered. Disposal of these securities may involve time consuming negotiations and expense, and prompt sale
31 Annual Report
| Notes to Financial Statements continued |
| |
| 2. Operating Policies continued |
Restricted Securities continued |
at an acceptable price may be difficult. Information regarding restricted securities is included at the end of the fund’s Schedule of Investments.
Loans and Other Direct Debt Instruments. The fund may invest in loans and loan participations, trade claims or other receivables. These investments may include standby financing commitments, including revolving credit facilities, that obligate the fund to supply additional cash to the borrower on demand. Loan participations involve a risk of insolvency of the lending bank or other financial intermediary.
3. Purchases and Sales of Investments.
Purchases and sales of securities, other than short term securities and U.S. government securities, aggregated $362,967,524 and $338,996,893, respectively.
4. Fees and Other Transactions with Affiliates.
Management Fee. FMR and its affiliates provide the fund with investment manage ment related services for which the fund pays a monthly management fee. The manage ment fee is the sum of an individual fund fee rate that is based on an annual rate of .55% of the fund’s average net assets and a group fee rate that averaged .12% during the period. The group fee rate is based upon the average net assets of all the mutual funds advised by FMR. The group fee rate decreases as assets under management increase and increases as assets under management decrease. For the period, the total annual man agement fee rate was ..67% of the fund’s average net assets.
Distribution and Service Plan. In accordance with Rule 12b 1 of the 1940 Act, the fund has adopted separate Distribution and Service Plans for each class of shares. Certain classes pay Fidelity Distributors Corporation (FDC), an affiliate of FMR, separate Distribution and Service Fees, each of which is based on an annual percentage of each class’ average net assets. In addition, FDC may pay financial intermediaries for selling shares of the fund and providing shareholder support services. For the period, the Distribution and Service Fee rates and the total amounts paid to and retained by FDC were as follows:
| | | Distribution | | Service | | | | Paid to | | | | Retained |
| | | Fee | | Fee | | | | FDC | | | | by FDC |
| Class A | | 0% | | .15% | | $ | | 53,608 | | $ | | — |
| Class T | | 0% | | .25% | | | | 220,409 | | | | 1,166 |
| Class B | | 65% | | .25% | | | | 242,404 | | | | 175,264 |
| Class C | | 75% | | .25% | | | | 166,079 | | | | 41,597 |
| | | | | | | $ | | 682,500 | | $ | | 218,027 |
| |
| |
| |
| Annual Report | | | | 32 | | | | | | | | |
4. Fees and Other Transactions with Affiliates continued
Sales Load. FDC receives a front end sales charge of up to 4.75% for selling Class A shares, and 3.50% for selling Class T shares, some of which is paid to financial intermedi aries for selling shares of the fund. FDC receives the proceeds of contingent deferred sales charges levied on Class A, Class T, Class B, and Class C redemptions. These charges depend on the holding period. The deferred sales charges range from 5% to 1% for Class B, 1% for Class C, and ..25% for certain purchases of Class A and Class T shares.
For the period, sales charge amounts retained by FDC were as follows:
| | | | |
| | | | | Retained |
| | | | | by FDC |
| Class A | | | $ | 36,836 |
| Class T | | | | 17,986 |
| Class B* | | | | 47,343 |
| Class C* | | | | 3,266 |
| | | | $ | 105,431 |
* When Class B and Class C shares are initially sold, FDC pays commissions from its own resources to financial intermediaries through which the sales are made.
Transfer Agent Fees. Fidelity Investments Institutional Operations Company, Inc. (FIIOC), an affiliate of FMR, is the transfer, dividend disbursing and shareholder servic ing agent for each class of the fund. FIIOC receives account fees and asset based fees that vary according to the account size and type of account of the shareholders of the respective classes of the fund. FIIOC pays for typesetting, printing and mailing of share holder reports, except proxy statements. For the period the total transfer agent fees paid by each class to FIIOC, were as follows:
| | | | | | | % of |
| | | | | | | Average |
| | | | | Amount | | Net Assets |
| Class A | | | $ | 103,832 | | .29 |
| Class T | | | | 241,331 | | .27 |
| Class B | | | | 92,953 | | .35 |
| Class C | | | | 48,268 | | .29 |
| Institutional Class | | | | 25,178 | | .15 |
| | | | $ | 511,562 | | |
Accounting Fees. Fidelity Service Company, Inc. (FSC), an affiliate of FMR, maintains the fund’s accounting records. The fee is based on the level of average net assets for the month.
33 Annual Report
Notes to Financial Statements continued
| | |
| 4. Fees and Other Transactions with Affiliates continued |
Affiliated Central Funds. The fund may invest in Money Market Central Funds which seek preservation of capital and current income and are managed by Fidelity Invest ments Money Management, Inc. (FIMM), an affiliate of FMR.
The Money Market Central Funds do not pay a management fee.
5. Committed Line of Credit.
|
The fund participates with other funds managed by FMR in a $4.2 billion credit facility (the “line of credit”) to be utilized for temporary or emergency purposes to fund share holder redemptions or for other short term liquidity purposes. The fund has agreed to pay commitment fees on its pro rata portion of the line of credit. During the period, there were no borrowings on this line of credit.
FMR voluntarily agreed to reimburse each class to the extent annual operating expenses exceeded certain levels of average net assets as noted in the table below. Some expenses, for example interest expense, are excluded from this reimbursement.
The following classes were in reimbursement during the period:
| | | | |
| | | Expense | | | | Reimbursement |
| | | Limitations | | | | from adviser |
| Class A | | 1.40% - 1.10%* | | | $ | 71,608 |
| Class T | | 1.50% - 1.20%* | | | | 164,437 |
| Class B | | 2.15% - 1.85%* | | | | 68,633 |
| Class C | | 2.25% - 1.95%* | | | | 33,707 |
| Institutional Class | | 1.25% - .95%* | | | | 11,296 |
| | | | | | | | | | $ | 349,681 |
| |
| * Expense limitation in effect at period end. | | | | | | | | | | |
Many of the brokers with whom FMR places trades on behalf of the fund provided services to the fund in addition to trade execution. These services included payments of certain expenses on behalf of the fund totaling $1,487 for the period. In addition, through arrangements with the fund’s custodian, credits realized as a result of uninvested cash balances were used to reduce the fund’s expenses. During the period, these credits reduced the fund’s custody expenses by $5,838.
The fund’s relatively large investment in countries with limited or developing capital markets may involve greater risks than investments in more developed markets and the prices of such investments may be volatile. The yields of emerging market debt obliga tions reflect, among other things, perceived credit risk. The consequences of political, social or economic changes in these markets may have disruptive effects on the market prices of the fund’s investments and the income they generate, as well as the fund’s ability to repatriate such amounts.
The fund’s organizational documents provide former and current trustees and officers with a limited indemnification against liabilities arising in connection with the perfor mance of their duties to the fund. In the normal course of business, the fund may also enter into contracts that provide general indemnifications. The fund’s maximum expo sure under these arrangements is unknown as this would be dependent on future claims that may be made against the fund. The risk of material loss from such claims is considered remote.
| 9. Distributions to Shareholders. | | | | | | |
| |
Distributions to shareholders of each class were as follows:
| | | | |
| Years ended December 31, | | | | 2005 | | | | 2004 |
| From net investment income | | | | | | | | |
| Class A | | | $ | 2,239,106 | | | $ | 1,636,004 |
| Class T | | | | 5,403,868 | | | | 5,018,131 |
| Class B | | | | 1,451,279 | | | | 1,468,758 |
| Class C | | | | 891,722 | | | | 713,748 |
| Institutional Class | | | | 1,127,880 | | | | 748,073 |
| Total | | | $ | 11,113,855 | | | $ | 9,584,714 |
| From net realized gain | | | | | | | | |
| Class A | | | $ | 1,740,895 | | | $ | 515,470 |
| Class T | | | | 4,435,816 | | | | 1,592,837 |
| Class B | | | | 1,301,890 | | | | 480,548 |
| Class C | | | | 809,962 | | | | 258,210 |
| Institutional Class | | | | 886,036 | | | | 230,301 |
| Total | | | $ | 9,174,599 | | | $ | 3,077,366 |
35 Annual Report
| Notes to Financial Statements continued | | | | | | |
| |
| |
| 10. Share Transactions. | | | | | | | | | | |
| |
Transactions for each class of shares were as follows:
| | | | | | | | |
| | | Shares | | | | Dollars |
| Years ended December 31, | | 2005 | | 2004 | | | | 2005 | | | | 2004 |
| Class A | | | | | | | | | | | | |
| Shares sold | | 1,580,185 | | 1,510,764 | | $ 19,087,388 | | $ 17,725,953 |
| Reinvestment of | | | | | | | | | | | | |
| distributions | | 282,049 | | 154,955 | | | | 3,406,044 | | | | 1,830,565 |
| Shares redeemed | | (697,498) | | (1,582,478) | | | | (8,439,651) | | (18,254,610) |
| Net increase (decrease) . | | 1,164,736 | | 83,241 | | $ 14,053,781 | | | | $ 1,301,908 |
| Class T | | | | | | | | | | | | |
| Shares sold | | 2,244,555 | | 2,875,509 | | $ 26,968,052 | | $ 33,458,189 |
| Reinvestment of | | | | | | | | | | | | |
| distributions | | 757,460 | | 514,849 | | | | 9,115,277 | | | | 6,065,232 |
| Shares redeemed | | (2,527,298) | | (3,081,142) | | (30,073,867) | | (35,341,114) |
| Net increase (decrease) . | | 474,717 | | 309,216 | | | | $ 6,009,462 | | | | $ 4,182,307 |
| Class B | | | | | | | | | | | | |
| Shares sold | | 495,665 | | 502,500 | | | | $ 6,012,880 | | | | $ 5,929,589 |
| Reinvestment of | | | | | | | | | | | | |
| distributions | | 183,667 | | 130,399 | | | | 2,229,627 | | | | 1,548,779 |
| Shares redeemed | | (666,010) | | (962,985) | | | | (8,048,875) | | (11,071,134) |
| Net increase (decrease) . | | 13,322 | | (330,086) | | | | 193,632 | | | | (3,592,766) |
| Class C | | | | | | | | | | | | |
| Shares sold | | 616,150 | | 546,717 | | | | $ 7,468,299 | | | | $ 6,424,102 |
| Reinvestment of | | | | | | | | | | | | |
| distributions | | 110,693 | | 61,717 | | | | 1,341,300 | | | | 732,776 |
| Shares redeemed | | (372,083) | | (477,712) | | | | (4,495,615) | | | | (5,473,363) |
| Net increase (decrease) . | | 354,760 | | 130,722 | | | | $ 4,313,984 | | | | $ 1,683,515 |
| Institutional Class | | | | | | | | | | | | |
| Shares sold | | 868,350 | | 244,377 | | $ 10,393,080 | | | | $ 2,843,978 |
| Reinvestment of | | | | | | | | | | | | |
| distributions | | 99,843 | | 62,861 | | | | 1,192,164 | | | | 734,483 |
| Shares redeemed | | (193,316) | | (181,844) | | | | (2,302,027) | | | | (2,085,766) |
| Net increase (decrease) . | | 774,877 | | 125,394 | | | | $ 9,283,217 | | | | $ 1,492,695 |
Report of Independent Registered Public Accounting Firm
To the Trustees of Fidelity Advisor Series VIII and the Shareholders of Fidelity Advisor Emerging Markets Income Fund:
In our opinion, the accompanying statement of assets and liabilities, including the sched ule of investments, and the related statements of operations and of changes in net assets and the financial highlights present fairly, in all material respects, the financial position of Fidelity Advisor Emerging Markets Income Fund (a fund of Fidelity Advisor Series VIII) at December 31, 2005 and the results of its operations, the changes in its net assets and the financial highlights for the periods indicated, in conformity with accounting principles generally accepted in the United States of America. These financial statements and financial highlights (hereafter referred to as “financial statements”) are the responsibility of the Fidelity Advisor Emerging Markets Income Fund’s management; our responsibility is to express an opinion on these financial statements based on our audits. We conducted our audits of these financial statements in accordance with the standards of the Public Company Accounting Oversight Board (United States). Those standards require that we plan and perform the audit to obtain reasonable assurance about whether the financial statements are free of material misstatement. An audit includes examining, on a test basis, evidence supporting the amounts and disclosures in the financial statements, assessing the accounting principles used and significant estimates made by management, and evaluating the overall financial statement presentation. We believe that our audits, which included confirmation of securities at December 31, 2005 by correspondence with the custodian and brokers, provide a reasonable basis for our opinion.
/s/ PricewaterhouseCoopers LLP
PricewaterhouseCoopers LLP
Boston, Massachusetts
February 9, 2006
|
37 Annual Report
Trustees and Officers
The Trustees, Member of the Advisory Board, and executive officers of the trust and fund, as applicable, are listed below. The Board of Trustees governs the fund and is responsible for protecting the interests of shareholders. The Trustees are experienced executives who meet periodically throughout the year to oversee the fund’s activities, review contractual arrangements with companies that provide services to the fund, and review the fund’s performance. Except for William O. McCoy and Albert R. Gamper, Jr., each of the Trustees oversees 326 funds advised by FMR or an affiliate. Mr. McCoy oversees 328 funds advised by FMR or an affiliate. Mr. Gamper oversees 235 funds advised by FMR or an affiliate.
The Trustees hold office without limit in time except that (a) any Trustee may resign; (b) any Trustee may be removed by written instrument, signed by at least two thirds of the number of Trustees prior to such removal; (c) any Trustee who requests to be retired or who has become incapacitated by illness or injury may be retired by written instru ment signed by a majority of the other Trustees; and (d) any Trustee may be removed at any special meeting of shareholders by a two thirds vote of the outstanding voting securities of the trust. Each Trustee who is not an interested person (as defined in the 1940 Act) (Independent Trustee), shall retire not later than the last day of the calendar year in which his or her 72nd birthday occurs. The Independent Trustees may waive this mandatory retirement age policy with respect to individual Trustees. The executive officers and Advisory Board Member hold office without limit in time, except that any officer and Advisory Board Member may resign or may be removed by a vote of a majority of the Trustees at any regular meeting or any special meeting of the Trustees. Except as indicated, each individual has held the office shown or other offices in the same company for the past five years.
The fund’s Statement of Additional Information (SAI) includes more information about the Trustees. To request a free copy, call Fidelity at 1-877-208-0098.
Correspondence intended for each Trustee who is an interested person may be sent to Fidelity Investments, 82 Devonshire Street, Boston, Massachusetts 02109.
| | Name, Age; Principal Occupation
Edward C. Johnson 3d (75)
|
Year of Election or Appointment: 1983
Mr. Johnson is Chairman of the Board of Trustees. Mr. Johnson serves as Chief Executive Officer, Chairman, and a Director of FMR Corp.; a Di rector and Chairman of the Board and of the Executive Committee of FMR; Chairman and a Director of Fidelity Management & Research (Far East) Inc.; Chairman and a Director of Fidelity Investments Money Man agement, Inc.; and Chairman (2001 present) and a Director (2000 present) of FMR Co., Inc.
| | Name, Age; Principal Occupation
Stephen P. Jonas (52)
|
Year of Election or Appointment: 2005
Mr. Jonas is Senior Vice President of Advisor Emerging Markets Income (2005 present). He also serves as Senior Vice President of other Fidelity funds (2005 present). Mr. Jonas is Executive Director of FMR
(2005 present). Previously, Mr. Jonas served as President of Fidelity En terprise Operations and Risk Services (2004 2005), Chief Administra tive Officer (2002 2004), and Chief Financial Officer of FMR Co. (1998 2000). Mr. Jonas has been with Fidelity Investments since 1987 and has held various financial and management positions including Chief Financial Officer of FMR. In addition, he serves on the Boards of Boston Ballet (2003 present) and Simmons College (2003 present).
Year of Election or Appointment: 2003
Mr. Reynolds is a Director (2003 present) and Chief Operating Officer (2002 present) of FMR Corp. He also serves on the Board at Fidelity Investments Canada, Ltd. (2000 present). Previously, Mr. Reynolds served as President of Fidelity Investments Institutional Retirement Group (1996 2000).
* Trustees have been determined to be “Interested Trustees” by virtue of, among other things, their affiliation with the trust or various entities under common control with FMR.
Correspondence intended for each Independent Trustee (that is, the Trustees other than the Interested Trustees) may be sent to Fidelity Investments, P.O. Box 55235, Boston, Massachusetts 02205 5235.
| | Name, Age; Principal Occupation
Dennis J. Dirks (57)
|
Year of Election or Appointment: 2005
Prior to his retirement in May 2003, Mr. Dirks was Chief Operating Officer and a member of the Board of The Depository Trust & Clearing Corporation (DTCC) (1999 2003). He also served as President, Chief Operating Officer, and Board member of The Depository Trust Com pany (DTC) (1999 2003) and President and Board member of the National Securities Clearing Corporation (NSCC) (1999 2003). In addi tion, Mr. Dirks served as Chief Executive Officer and Board member of the Government Securities Clearing Corporation (2001 2003) and Chief Executive Officer and Board member of the Mortgage Backed Securities Clearing Corporation (2001 2003). Mr. Dirks also serves as a Trustee of Manhattan College (2005 present).
39 Annual Report
Trustees and Officers - continued
| | Name, Age; Principal Occupation
Albert R. Gamper, Jr. (63)
|
Year of Election or Appointment: 2006
Mr. Gamper also serves as a Trustee (2006 present) or Member of the Advisory Board (2005 present) of other investment companies advised by FMR. Prior to his retirement in December 2004, Mr. Gamper served as Chairman of the Board of CIT Group Inc. (commercial finance). Dur ing his tenure with CIT Group Inc. Mr. Gamper served in numerous se nior management positions, including Chairman (1987 1989; 1999 2001; 2002 2004), Chief Executive Officer (1987 2004), and President (1989 2002). He currently serves as a member of the Board of Directors of Public Service Enterprise Group (utilities, 2001 present), Chairman of the Board of Governors, Rutgers University (2004 present), and Chairman of the Board of Saint Barnabas Health Care System.
Year of Election or Appointment: 1997
Dr. Gates is Chairman of the Independent Trustees (2006 present). Dr. Gates is President of Texas A&M University (2002 present). He was Director of the Central Intelligence Agency (CIA) from 1991 to 1993. From 1989 to 1991, Dr. Gates served as Assistant to the President of the United States and Deputy National Security Advisor. Dr. Gates is a Director of NACCO Industries, Inc. (mining and manufacturing), Parker Drilling Co., Inc. (drilling and rental tools for the energy industry, 2001 present), and Brinker International (restaurant management, 2003 present). Previously, Dr. Gates served as a Director of LucasVarity PLC (automotive components and diesel engines), a Director of TRW Inc. (automotive, space, defense, and information technology), and Dean of the George Bush School of Government and Public Service at Texas A&M University (1999 2001). Dr. Gates also is a Trustee of the Forum for International Policy.
Name, Age; Principal Occupation
George H. Heilmeier (69)
|
Year of Election or Appointment: 2004
Dr. Heilmeier is Chairman Emeritus of Telcordia Technologies (commu nication software and systems), where prior to his retirement, he served as company Chairman and Chief Executive Officer. He currently serves on the Boards of Directors of The Mitre Corporation (systems engineer ing and information technology support for the government), and HRL Laboratories (private research and development, 2004 present). He is Chairman of the General Motors Science & Technology Advisory Board and a Life Fellow of the Institute of Electrical and Electronics Engineers (IEEE) (2000 present). Dr. Heilmeier is a member of the Defense Science Board and the National Security Agency Advisory Board. He is also a member of the National Academy of Engineering, the American Acad emy of Arts and Sciences, and the Board of Overseers of the School of Engineering and Applied Science of the University of Pennsylvania. Pre viously, Dr. Heilmeier served as a Director of TRW Inc. (automotive, space, defense, and information technology, 1992 2002), Compaq (1994 2002), Automatic Data Processing, Inc. (ADP) (technology based business outsourcing, 1995 2002), INET Technologies Inc. (telecommu nications network surveillance, 2001 2004), and Teletech Holdings (cus tomer management services). He is the recipient of the 2005 Kyoto Prize in Advanced Technology for his invention of the liquid display.
Year of Election or Appointment: 2001
Prior to Ms. Knowles’ retirement in June 2000, she served as Executive Vice President and Chief Financial Officer of Atlantic Richfield Company (ARCO) (diversified energy, 1996 2000). From 1993 to 1996, she was a Senior Vice President of ARCO and President of ARCO Transportation Company. She served as a Director of ARCO from 1996 to 1998. She currently serves as a Director of Phelps Dodge Corporation (copper mining and manufacturing) and McKesson Corporation (healthcare ser vice, 2002 present). Ms. Knowles is a Trustee of the Brookings Institution and the Catalina Island Conservancy and also serves as a member of the Advisory Board for the School of Engineering of the University of Southern California.
41 Annual Report
Trustees and Officers - continued
| | Name, Age; Principal Occupation
Ned C. Lautenbach (61)
|
Year of Election or Appointment: 2000
Mr. Lautenbach has been a partner of Clayton, Dubilier & Rice, Inc. (private equity investment firm) since September 1998. Previously, Mr. Lautenbach was with the International Business Machines Corporation (IBM) from 1968 until his retirement in 1998. Mr. Lautenbach serves as a Director of Italtel Holding S.p.A. (telecommunications (Milan, Italy), 2004 present) and Eaton Corporation (diversified industrial) as well as the Philharmonic Center for the Arts in Naples, Florida. He also is a member of the Board of Trustees of Fairfield University (2005 present), as well as a member of the Council on Foreign Relations.
Year of Election or Appointment: 1997
Prior to his retirement in December 1994, Mr. McCoy was Vice Chair man of the Board of BellSouth Corporation (telecommunications) and President of BellSouth Enterprises. He is currently a Director of Liberty Corporation (holding company), Duke Realty Corporation (real estate), and Progress Energy, Inc. (electric utility). He is also a partner of Frank lin Street Partners (private investment management firm) and a member of the Research Triangle Foundation Board. In addition, Mr. McCoy served as the Interim Chancellor (1999 2000) and a member of the Board of Visitors for the University of North Carolina at Chapel Hill and currently serves on the Board of Directors of the University of North Carolina Health Care System and the Board of Visitors of the Kenan Flagler Business School (University of North Carolina at Chapel Hill). He also served as Vice President of Finance for the University of North Car olina (16 school system).
Year of Election or Appointment: 2005
Ms. Small is a member (2000 present) and Chairperson (2002 present) of the Investment Committee, and a member (2002 present) of the Board of Trustees of Smith College. Previously, she served as Chief In vestment Officer (1999 2000), Director of Global Equity Investments (1996 1999), and a member of the Board of Directors of Scudder, Ste vens & Clark (1990 1997) and Scudder Kemper Investments (1997 1998). In addition, Ms. Small served as Co Chair (2000 2003) of the Annual Fund for the Fletcher School of Law and Diplomacy.
| | Name, Age; Principal Occupation
William S. Stavropoulos (66)
|
Year of Election or Appointment: 2002
Mr. Stavropoulos is Chairman of the Board (2000 present) and a Mem ber of the Board of Directors of The Dow Chemical Company. Since joining The Dow Chemical Company in 1967, Mr. Stavropoulos served in numerous senior management positions, including President (1993 2000; 2002 2003), CEO (1995 2000; 2002 2004), and Chair man of the Executive Committee (2000 2004). Currently, he is a Direc tor of NCR Corporation (data warehousing and technology solutions), BellSouth Corporation (telecommunications), Chemical Financial Corpo ration, Maersk Inc. (industrial conglomerate, 2002 present), and Metal mark Capital (private equity investment firm, 2005 present). He also serves as a member of the Board of Trustees of the American Enterprise Institute for Public Policy Research. In addition, Mr. Stavropoulos is a member of The Business Council, J.P. Morgan International Council and the University of Notre Dame Advisory Council for the College of Science.
Year of Election or Appointment: 2005
Prior to his retirement in 2001, Mr. Wolfe was Chairman and Chief Executive Officer of Hershey Foods Corporation (1993 2001). He cur rently serves as a member of the boards of Adelphia Communications Corporation (2003 present), Bausch & Lomb, Inc., and Revlon Inc. (2004 present).
Advisory Board Member and Executive Officers:
Correspondence intended for each executive officer and Mr. Lynch may be sent to Fidelity Investments, 82 Devonshire Street, Boston, Massachusetts 02109.
| | Name, Age; Principal Occupation
Peter S. Lynch (61)
|
Year of Election or Appointment: 2003
Member of the Advisory Board of Fidelity Advisor Series VIII. Vice Chairman and a Director of FMR, and Vice Chairman (2001 present) and a Director (2000 present) of FMR Co., Inc. Previously, Mr. Lynch served as a Trustee of the Fidelity funds (1990 2003). In addition, he serves as a Trustee of Boston College, Massachusetts Eye & Ear Infir mary, Historic Deerfield, John F. Kennedy Library, and the Museum of Fine Arts of Boston.
43 Annual Report
Trustees and Officers - continued
| | Name, Age; Principal Occupation
Dwight D. Churchill (51)
|
Year of Election or Appointment: 2005
Vice President of Advisor Emerging Markets Income. Mr. Churchill also serves as Vice President of certain Equity Funds (2005 present) and certain High Income Funds (2005 present). Previously, he served as Head of Fidelity’s Fixed Income Division (2000 2005), Vice President of Fidelity’s Money Market Funds (2000 2005), Vice President of Fidelity’s Bond Funds, and Senior Vice President of FIMM (2000) and FMR. Mr. Churchill joined Fidelity in 1993 as Vice President and Group Leader of Taxable Fixed Income Investments.
Year of Election or Appointment: 1996
Vice President of Advisor Emerging Markets Income. Mr. Carlson serves as Vice President of another fund advised by FMR. Mr. Carlson also serves as Senior Vice President of FMR (2003) and FMR Co., Inc. (2003).
Year of Election or Appointment: 1998
Secretary of Advisor Emerging Markets Income. He also serves as Sec retary of other Fidelity funds; Vice President, General Counsel, and Sec retary of FMR Co., Inc. (2001 present) and FMR; Assistant Secretary of Fidelity Management & Research (U.K.) Inc. (2001 present), Fidelity Management & Research (Far East) Inc. (2001 present), and Fidelity Investments Money Management, Inc. (2001 present). Mr. Roiter is an Adjunct Member, Faculty of Law, at Boston College Law School (2003 present). Previously, Mr. Roiter served as Vice President and Sec retary of Fidelity Distributors Corporation (FDC) (1998 2005).
Year of Election or Appointment: 2003
Assistant Secretary of Advisor Emerging Markets Income. Mr. Fross also serves as Assistant Secretary of other Fidelity funds (2003 present), Vice President and Secretary of FDC (2005 present), and is an employee of FMR.
Year of Election or Appointment: 2004
President, Treasurer, and Anti Money Laundering (AML) officer of Advi sor Emerging Markets Income. Ms. Reynolds also serves as President, Treasurer, and AML officer of other Fidelity funds (2004) and is a Vice President (2003) and an employee (2002) of FMR. Before joining Fidelity Investments, Ms. Reynolds worked at PricewaterhouseCoopers LLP (PwC) (1980 2002), where she was most recently an audit partner with PwC’s investment management practice.
Name, Age; Principal Occupation
Paul M. Murphy (58)
|
Year of Election or Appointment: 2005
Chief Financial Officer of Advisor Emerging Markets Income. Mr. Murphy also serves as Chief Financial Officer of other Fidelity funds (2005 present). He also serves as Senior Vice President of Fidelity Pric ing and Cash Management Services Group (FPCMS).
Kenneth A. Rathgeber (58)
|
Year of Election or Appointment: 2004
Chief Compliance Officer of Advisor Emerging Markets Income. Mr. Rathgeber also serves as Chief Compliance Officer of other Fidelity funds (2004) and Executive Vice President of Risk Oversight for Fidelity Investments (2002). Previously, he served as Executive Vice President and Chief Operating Officer for Fidelity Investments Institutional Services Company, Inc. (1998 2002).
Year of Election or Appointment: 2003
Deputy Treasurer of Advisor Emerging Markets Income. Mr. Hebble also serves as Deputy Treasurer of other Fidelity funds (2003), and is an employee of FMR. Before joining Fidelity Investments, Mr. Hebble worked at Deutsche Asset Management where he served as Director of Fund Accounting (2002 2003) and Assistant Treasurer of the Scudder Funds (1998 2003).
Year of Election or Appointment: 2005
Deputy Treasurer of Advisor Emerging Markets Income. Mr. Mehrmann also serves as Deputy Treasurer of other Fidelity funds (2005 present) and is an employee of FMR. Previously, Mr. Mehrmann served as Vice President of Fidelity Investments Institutional Services Group (FIIS)/Fidelity Investments Institutional Operations Corporation, Inc. (FIIOC) Client Services (1998 2004).
Kimberley H. Monasterio (41)
|
Year of Election or Appointment: 2004
Deputy Treasurer of Advisor Emerging Markets Income. Ms. Monasterio also serves as Deputy Treasurer of other Fidelity funds (2004) and is an employee of FMR (2004). Before joining Fidelity Investments, Ms. Monasterio served as Treasurer (2000 2004) and Chief Financial Offi cer (2002 2004) of the Franklin Templeton Funds and Senior Vice Presi dent of Franklin Templeton Services, LLC (2000 2004).
45 Annual Report
Trustees and Officers - continued
| | Name, Age; Principal Occupation
Kenneth B. Robins (36)
|
Year of Election or Appointment: 2005
Deputy Treasurer of Advisor Emerging Markets Income. Mr. Robins also serves as Deputy Treasurer of other Fidelity funds (2005 present) and is an employee of FMR (2004 present). Before joining Fidelity Investments, Mr. Robins worked at KPMG LLP, where he was a partner in KPMG’s department of professional practice (2002 2004) and a Senior Man ager (1999 2000). In addition, Mr. Robins served as Assistant Chief Accountant, United States Securities and Exchange Commission (2000 2002).
Year of Election or Appointment: 2005
Assistant Treasurer of Advisor Emerging Markets Income. Mr. Byrnes also serves as Assistant Treasurer of other Fidelity funds (2005 present) and is an employee of FMR (2005 present). Previously, Mr. Byrnes served as Vice President of FPCMS (2003 2005). Before joining Fidelity Investments, Mr. Byrnes worked at Deutsche Asset Management where he served as Vice President of the Investment Operations Group (2000 2003).
Year of Election or Appointment: 1995
Assistant Treasurer of Advisor Emerging Markets Income. Mr. Costello also serves as Assistant Treasurer of other Fidelity funds and is an em ployee of FMR.
Year of Election or Appointment: 2004
Assistant Treasurer of Advisor Emerging Markets Income. Mr. Lydecker also serves as Assistant Treasurer of other Fidelity funds (2004) and is an employee of FMR.
Year of Election or Appointment: 2003
Assistant Treasurer of Advisor Emerging Markets Income. Mr. Osterheld also serves as Assistant Treasurer of other Fidelity funds (2002) and is an employee of FMR.
Year of Election or Appointment: 2005
Assistant Treasurer of Advisor Emerging Markets Income. Mr. Ryan also serves as Assistant Treasurer of other Fidelity funds (2005 present) and is an employee of FMR (2005 present). Previously, Mr. Ryan served as Vice President of Fund Reporting in FPCMS (1999 2005).
Name, Age; Principal Occupation
Salvatore Schiavone (40)
|
Year of Election or Appointment: 2005
Assistant Treasurer of Advisor Emerging Markets Income. Mr. Schiavone also serves as Assistant Treasurer of other Fidelity funds (2005 present) and is an employee of FMR (2005 present). Before joining Fidelity In vestments, Mr. Schiavone worked at Deutsche Asset Management, where he most recently served as Assistant Treasurer (2003 2005) of the Scudder Funds and Vice President and Head of Fund Reporting (1996 2003).
47 Annual Report
The Board of Trustees of Fidelity Advisor Emerging Markets Income voted to pay to shareholders of record at the opening of business on record date, the following distributions per share derived from capital gains realized from sales of portfolio securities:
| | | Pay Date | | Record Date | | Capital Gains |
| Institutional Class | | 2/06/06 | | 2/03/06 | | $.067 |
The fund hereby designates as capital gain dividends with respect to the taxable year ended December 31, 2005, $2,334,344 or, if subsequently determined to be different, the net capital gain of such year.
The percentage of dividends distributed during the fiscal year representing income derived from sources within, and taxes paid to, foreign countries or possessions of the United States are as follows:
| | | Income | | Taxes |
| Institutional Class | | 100% | | —% |
The fund designates $4,444,699 of distributions paid during the fiscal year as qualify ing to be taxed as short term capital gain dividends for nonresident alien shareholders.
The fund will notify shareholders in January 2006 of amounts for use in preparing 2005 income tax returns.
49 Annual Report
51 Annual Report
53 Annual Report
55 Annual Report
Investment Adviser
Fidelity Management & Research Company
Boston, MA
Investment Sub Adviser
FMR Co., Inc.
Fidelity Management & Research
(U.K.) Inc.
Fidelity Management & Research
(Far East) Inc.
Fidelity Investments Japan Limited
Fidelity International Investment
Advisors
Fidelity International Investment
Advisors (U.K.) Limited
General Distributor
Fidelity Distributors Corporation
Boston, MA
Transfer and Service Agents
Fidelity Investments Institutional
Operations Company, Inc.
Boston, MA
Fidelity Service Company, Inc.
Boston, MA
Custodian
JPMorgan Chase Bank
New York, NY
|
EMII-UANN-0206
1.787726.102
|

Item 2. Code of Ethics
As of the end of the period, December 31, 2005, Fidelity Advisor Series VIII (the trust) has adopted a code of ethics, as defined in Item 2 of Form N-CSR, that applies to its President and Treasurer and its Chief Financial Officer. A copy of the code of ethics is filed as an exhibit to this Form N-CSR.
Item 3. Audit Committee Financial Expert
The Board of Trustees of the trust has determined that Marie L. Knowles is an audit committee financial expert, as defined in Item 3 of Form N-CSR. Ms. Knowles is independent for purposes of Item 3 of Form N-CSR.
Item 4. Principal Accountant Fees and Services
(a) Audit Fees.
For the fiscal years ended December 31, 2005 and December 31, 2004, the aggregate Audit Fees billed by PricewaterhouseCoopers LLP (PwC) for professional services rendered for the audits of the financial statements, or services that are normally provided in connection with statutory and regulatory filings or engagements for those fiscal years, for the Fidelity Advisor Emerging Markets Income Fund (the fund) and for all funds in the Fidelity Group of Funds are shown in the table below.
Fund | 2005A | 2004A |
Fidelity Advisor Emerging Markets Income Fund | $63,000 | $58,000 |
All funds in the Fidelity Group of Funds audited by PwC | $12,300,000 | $10,800,000 |
A | Aggregate amounts may reflect rounding. |
(b) Audit-Related Fees.
In each of the fiscal years ended December 31, 2005 and December 31, 2004 the aggregate Audit-Related Fees billed by PwC for services rendered for assurance and related services to the fund that are reasonably related to the performance of the audit or review of the fund's financial statements, but not reported as Audit Fees, are shown in the table below.
Fund | 2005A | 2004A |
Fidelity Advisor Emerging Markets Income Fund | $0 | $0 |
A | Aggregate amounts may reflect rounding. |
In each of the fiscal years ended December 31, 2005 and December 31, 2004, the aggregate Audit-Related Fees that were billed by PwC that were required to be approved by the Audit Committee for services rendered on behalf of Fidelity Management & Research Company (FMR) and entities controlling, controlled by, or under common control with FMR (not including any sub-adviser whose role is primarily portfolio management and is subcontracted with or overseen by another investment adviser) that provide ongoing services to the fund ("Fund Service Providers") for assurance and related services that relate directly to the operations and financial reporting of the fund that are reasonably related to the performance of the audit or review of the fund's financial statements, but not reported as Audit Fees, are shown in the table below.
Billed By | 2005A | 2004A |
PwC | $0 | $0 |
A | Aggregate amounts may reflect rounding. |
Fees included in the audit-related category comprise assurance and related services (e.g., due diligence services) that are traditionally performed by the independent registered public accounting firm. These audit-related services include due diligence related to mergers and acquisitions, accounting consultations and audits in connection with acquisitions, internal control reviews, attest services that are not required by statute or regulation and consultation concerning financial accounting and reporting standards.
(c) Tax Fees.
In each of the fiscal years ended December 31, 2005 and December 31, 2004, the aggregate Tax Fees billed by PwC for professional services rendered for tax compliance, tax advice, and tax planning for the fund is shown in the table below.
Fund | 2005A | 2004A |
Fidelity Advisor Emerging Markets Income Fund | $2,900 | $2,800 |
A | Aggregate amounts may reflect rounding. |
In each of the fiscal years ended December 31, 2005 and December 31, 2004, the aggregate Tax Fees billed by PwC that were required to be approved by the Audit Committee for professional services rendered on behalf of the Fund Service Providers for tax compliance, tax advice, and tax planning that relate directly to the operations and financial reporting of the fund is shown in the table below.
Billed By | 2005A | 2004A |
PwC | $0 | $0 |
A | Aggregate amounts may reflect rounding. |
Fees included in the Tax Fees category comprise all services performed by professional staff in the independent registered public accounting firm's tax division except those services related to the audit. Typically, this category would include fees for tax compliance, tax planning, and tax advice. Tax compliance, tax advice, and tax planning services include preparation of original and amended tax returns, claims for refund and tax payment-planning services, assistance with tax audits and appeals, tax advice related to mergers and acquisitions and requests for rulings or technical advice from taxing authorities.
(d) All Other Fees.
In each of the fiscal years ended December 31, 2005 and December 31, 2004, the aggregate Other Fees billed by PwC for all other non-audit services rendered to the fund is shown in the table below.
Fund | 2005A | 2004A |
Fidelity Advisor Emerging Markets Income Fund | $1,500 | $1,400 |
A | Aggregate amounts may reflect rounding. |
In each of the fiscal years ended December 31, 2005 and December 31, 2004, the aggregate Other Fees billed by PwC that were required to be approved by the Audit Committee for all other non-audit services rendered on behalf of the Fund Service Providers that relate directly to the operations and financial reporting of the fund is shown in the table below.
Billed By | 2005A | 2004A |
PwC | $190,000 | $490,000 |
A | Aggregate amounts may reflect rounding. |
Fees included in the All Other Fees category include services related to internal control reviews, strategy and other consulting, financial information systems design and implementation, consulting on other information systems, and other tax services unrelated to the fund.
(e) (1) | Audit Committee Pre-Approval Policies and Procedures: |
The trust's Audit Committee must pre-approve all audit and non-audit services provided by the independent registered public accounting firm relating to the operations or financial reporting of the fund. Prior to the commencement of any audit or non-audit services to a fund, the Audit Committee reviews the services to determine whether they are appropriate and permissible under applicable law.
The trust's Audit Committee has adopted policies and procedures to, among other purposes, provide a framework for the Committee's consideration of non-audit services by the audit firms that audit the Fidelity funds. The policies and procedures require that any non-audit service provided by a fund audit firm to a Fidelity Fund and any non-audit service provided by a fund auditor to a Fund Service Provider that relates directly to the operations and financial reporting of a Fidelity fund (Covered Service) are subject to approval by the Audit Committee before such service is provided. Non-audit services provided by a fund audit firm for a Fund Service Provider that do not relate directly to the operations and financial reporting of a Fidelity fund (Non-Covered Service) but that are expected to exceed $50,000 are also subject to pre-approval by the Audit Committee.
All Covered Services, as well as Non-Covered Services that are expected to exceed $50,000, must be approved in advance of provision of the service either: (i) by formal resolution of the Audit Committee, or (ii) by oral or written approval of the service by the Chair of the Audit Committee (or if the Chair is unavailable, such other member of the Audit Committee as may be designated by the Chair to act in the Chair's absence). The approval contemplated by (ii) above is permitted where the Treasurer determines that action on such an engagement is necessary before the next meeting of the Audit Committee. Neither pre-approval nor advance notice of Non-Covered Service engagements for which fees are not expected to exceed $50,000 is required; such engagements are to be reported to the Audit Committee monthly.
(e) (2) | Services approved pursuant to paragraph (c)(7)(i)(C) of Rule 2-01 of Regulation S-X: |
Audit-Related Fees:
There were no amounts that were approved by the Audit Committee pursuant to the de minimis exception for the fiscal years ended December 31, 2005 and December 31, 2004 on behalf of the fund.
There were no amounts that were required to be approved by the Audit Committee pursuant to the de minimis exception for the fiscal years ended December 31, 2005 and December 31, 2004 on behalf of the Fund Service Providers that relate directly to the operations and financial reporting of the fund.
Tax Fees:
There were no amounts that were approved by the Audit Committee pursuant to the de minimis exception for the fiscal years ended December 31, 2005 and December 31, 2004 on behalf of the fund.
There were no amounts that were required to be approved by the Audit Committee pursuant to the de minimis exception for the fiscal years ended December 31, 2005 and December 31, 2004 on behalf of the Fund Service Providers that relate directly to the operations and financial reporting of the fund.
All Other Fees:
There were no amounts that were approved by the Audit Committee pursuant to the de minimis exception for the fiscal years ended December 31, 2005 and December 31, 2004 on behalf of the fund.
There were no amounts that were required to be approved by the Audit Committee pursuant to the de minimis exception for the fiscal years ended December 31, 2005 and December 31, 2004 on behalf of the Fund Service Providers that relate directly to the operations and financial reporting of the fund.
(f) Not applicable.
(g) For the fiscal years ended December 31, 2005 and December 31, 2004, the aggregate fees billed by PwC of $3,550,000A and $2,650,000A for non-audit services rendered on behalf of the fund, FMR (not including any sub-adviser whose role is primarily portfolio management and is subcontracted with or overseen by another investment adviser) and Fund Service Providers relating to Covered Services and Non-Covered Services are shown in the table below.
| 2005A | 2004A |
Covered Services | $200,000 | $500,000 |
Non-Covered Services | $3,350,000 | $2,150,000 |
A | Aggregate amounts may reflect rounding. |
(h) The trust's Audit Committee has considered Non-Covered Services that were not pre-approved that were provided by PwC to Fund Service Providers to be compatible with maintaining the independence of PwC in its audit of the fund, taking into account representations from PwC, in accordance with Independence Standards Board Standard No.1, regarding its independence from the fund and its related entities.
Item 5. Audit Committee of Listed Registrants
Not applicable.
Item 6. Schedule of Investments
Not applicable.
Item 7. Disclosure of Proxy Voting Policies and Procedures for Closed-End Management Investment Companies
Not applicable.
Item 8. Portfolio Managers of Closed-End Management Investment Companies
Not applicable.
Item 9. Purchase of Equity Securities by Closed-End Management Investment Company and Affiliated Purchasers
Not applicable.
Item 10. Submission of Matters to a Vote of Security Holders
There were no material changes to the procedures by which shareholders may recommend nominees to the trust's Board of Trustees.
Item 11. Controls and Procedures
(a)(i) The President and Treasurer and the Chief Financial Officer have concluded that the trust's disclosure controls and procedures (as defined in Rule 30a-3(c) under the Investment Company Act) provide reasonable assurances that material information relating to the trust is made known to them by the appropriate persons, based on their evaluation of these controls and procedures as of a date within 90 days of the filing date of this report.
(a)(ii) There was no change in the trust's internal control over financial reporting (as defined in Rule 30a-3(d) under the Investment Company Act) that occurred during the second fiscal quarter of the period covered by this report that has materially affected, or is reasonably likely to materially affect, the trust's internal control over financial reporting.
Item 12. Exhibits
(a) | (1) | Code of Ethics pursuant to Item 2 of Form N-CSR is filed and attached hereto as EX-99.CODE ETH. |
(a) | (2) | Certification pursuant to Rule 30a-2(a) under the Investment Company Act of 1940 (17 CFR 270.30a-2(a)) is filed and attached hereto as Exhibit 99.CERT. |
(a) | (3) | Not applicable. |
(b) | | Certification pursuant to Rule 30a-2(b) under the Investment Company Act of 1940 (17 CFR 270.30a-2(b)) is furnished and attached hereto as Exhibit 99.906CERT. |
SIGNATURES
Pursuant to the requirements of the Securities Exchange Act of 1934 and the Investment Company Act of 1940, the registrant has duly caused this report to be signed on its behalf by the undersigned, thereunto duly authorized.
Fidelity Advisor Series VIII
By: | /s/Christine Reynolds |
| Christine Reynolds |
| President and Treasurer |
| |
Date: | February 17, 2006 |
Pursuant to the requirements of the Securities Exchange Act of 1934 and the Investment Company Act of 1940, this report has been signed below by the following persons on behalf of the registrant and in the capacities and on the dates indicated.
By: | /s/Christine Reynolds |
| Christine Reynolds |
| President and Treasurer |
| |
Date: | February 17, 2006 |
By: | /s/Paul M. Murphy |
| Paul M. Murphy |
| Chief Financial Officer |
| |
Date: | February 17, 2006 |